Homer, MI Map & Demographics
Homer Map
Homer Overview
$20,344
PER CAPITA INCOME
$46,838
AVG FAMILY INCOME
$45,257
AVG HOUSEHOLD INCOME
45.4%
WAGE / INCOME GAP [ % ]
54.6¢/ $1
WAGE / INCOME GAP [ $ ]
0.41
INEQUALITY / GINI INDEX
1,663
TOTAL POPULATION
760
MALE POPULATION
903
FEMALE POPULATION
84.16
MALES / 100 FEMALES
118.82
FEMALES / 100 MALES
27.4
MEDIAN AGE
3.3
AVG FAMILY SIZE
2.9
AVG HOUSEHOLD SIZE
695
LABOR FORCE [ PEOPLE ]
61.8%
PERCENT IN LABOR FORCE
6.9%
UNEMPLOYMENT RATE
Homer Zip Codes
Homer Area Codes
Income in Homer
Income Overview in Homer
Per Capita Income in Homer is $20,344, while median incomes of families and households are $46,838 and $45,257 respectively.
| Characteristic | Number | Measure |
| Per Capita Income | 1,663 | $20,344 |
| Median Family Income | 408 | $46,838 |
| Mean Family Income | 408 | $61,287 |
| Median Household Income | 581 | $45,257 |
| Mean Household Income | 581 | $56,982 |
| Income Deficit | 408 | $0 |
| Wage / Income Gap (%) | 1,663 | 45.38% |
| Wage / Income Gap ($) | 1,663 | 54.62¢ per $1 |
| Gini / Inequality Index | 1,663 | 0.41 |
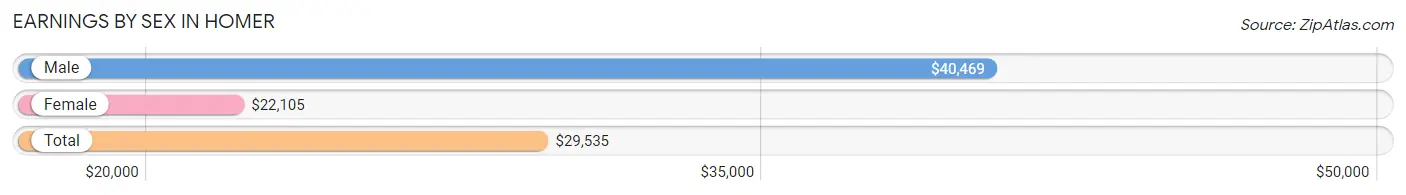
Earnings by Sex in Homer
Average Earnings in Homer are $29,535, $40,469 for men and $22,105 for women, a difference of 45.4%.
| Sex | Number | Average Earnings |
| Male | 389 (52.8%) | $40,469 |
| Female | 348 (47.2%) | $22,105 |
| Total | 737 (100.0%) | $29,535 |
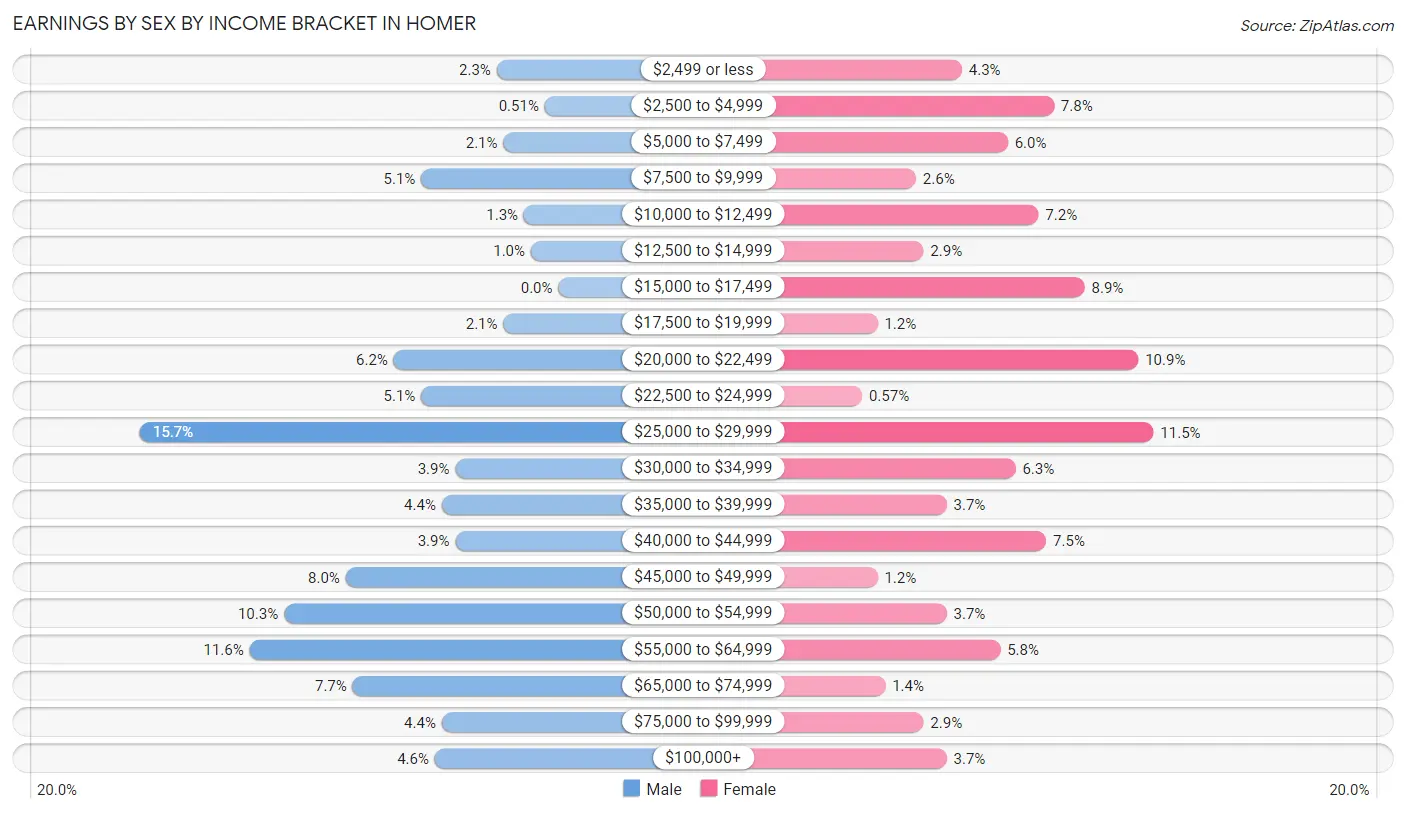
Earnings by Sex by Income Bracket in Homer
The most common earnings brackets in Homer are $25,000 to $29,999 for men (61 | 15.7%) and $25,000 to $29,999 for women (40 | 11.5%).
| Income | Male | Female |
| $2,499 or less | 9 (2.3%) | 15 (4.3%) |
| $2,500 to $4,999 | 2 (0.5%) | 27 (7.8%) |
| $5,000 to $7,499 | 8 (2.1%) | 21 (6.0%) |
| $7,500 to $9,999 | 20 (5.1%) | 9 (2.6%) |
| $10,000 to $12,499 | 5 (1.3%) | 25 (7.2%) |
| $12,500 to $14,999 | 4 (1.0%) | 10 (2.9%) |
| $15,000 to $17,499 | 0 (0.0%) | 31 (8.9%) |
| $17,500 to $19,999 | 8 (2.1%) | 4 (1.1%) |
| $20,000 to $22,499 | 24 (6.2%) | 38 (10.9%) |
| $22,500 to $24,999 | 20 (5.1%) | 2 (0.6%) |
| $25,000 to $29,999 | 61 (15.7%) | 40 (11.5%) |
| $30,000 to $34,999 | 15 (3.9%) | 22 (6.3%) |
| $35,000 to $39,999 | 17 (4.4%) | 13 (3.7%) |
| $40,000 to $44,999 | 15 (3.9%) | 26 (7.5%) |
| $45,000 to $49,999 | 31 (8.0%) | 4 (1.1%) |
| $50,000 to $54,999 | 40 (10.3%) | 13 (3.7%) |
| $55,000 to $64,999 | 45 (11.6%) | 20 (5.8%) |
| $65,000 to $74,999 | 30 (7.7%) | 5 (1.4%) |
| $75,000 to $99,999 | 17 (4.4%) | 10 (2.9%) |
| $100,000+ | 18 (4.6%) | 13 (3.7%) |
| Total | 389 (100.0%) | 348 (100.0%) |
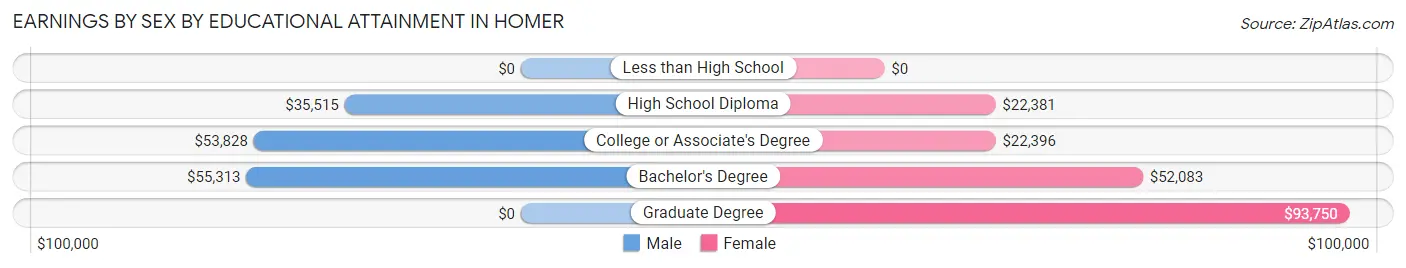
Earnings by Sex by Educational Attainment in Homer
Average earnings in Homer are $46,488 for men and $28,419 for women, a difference of 38.9%. Men with an educational attainment of bachelor's degree enjoy the highest average annual earnings of $55,313, while those with high school diploma education earn the least with $35,515. Women with an educational attainment of graduate degree earn the most with the average annual earnings of $93,750, while those with high school diploma education have the smallest earnings of $22,381.
| Educational Attainment | Male Income | Female Income |
| Less than High School | - | - |
| High School Diploma | $35,515 | $22,381 |
| College or Associate's Degree | $53,828 | $22,396 |
| Bachelor's Degree | $55,313 | $52,083 |
| Graduate Degree | - | - |
| Total | $46,488 | $28,419 |
Family Income in Homer
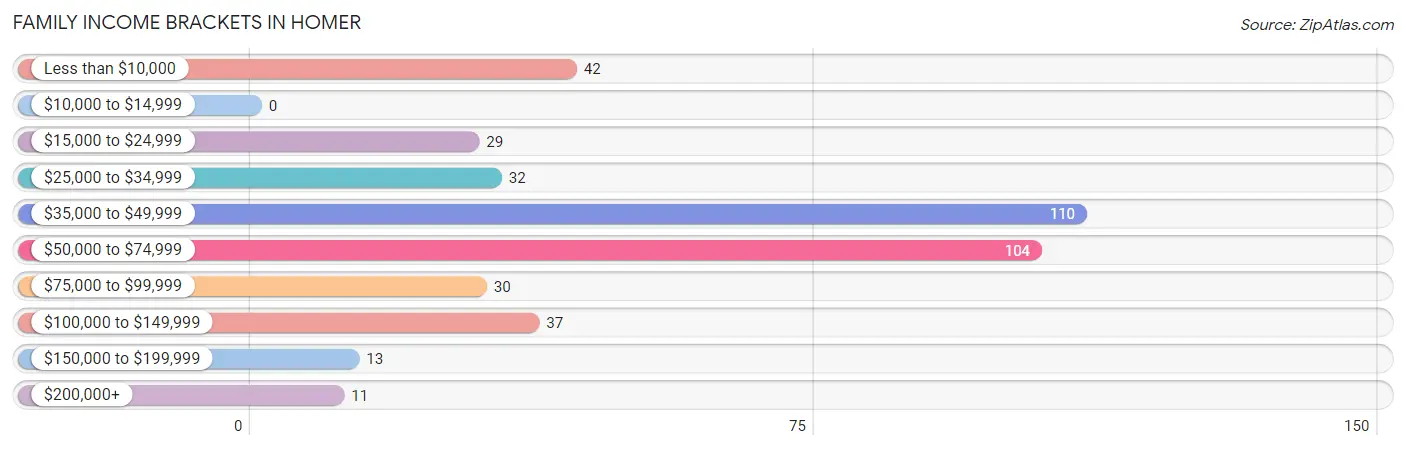
Family Income Brackets in Homer
According to the Homer family income data, there are 110 families falling into the $35,000 to $49,999 income range, which is the most common income bracket and makes up 27.0% of all families.
| Income Bracket | # Families | % Families |
| Less than $10,000 | 42 | 10.3% |
| $10,000 to $14,999 | 0 | 0.0% |
| $15,000 to $24,999 | 29 | 7.1% |
| $25,000 to $34,999 | 32 | 7.8% |
| $35,000 to $49,999 | 110 | 27.0% |
| $50,000 to $74,999 | 104 | 25.5% |
| $75,000 to $99,999 | 30 | 7.4% |
| $100,000 to $149,999 | 37 | 9.1% |
| $150,000 to $199,999 | 13 | 3.2% |
| $200,000+ | 11 | 2.7% |
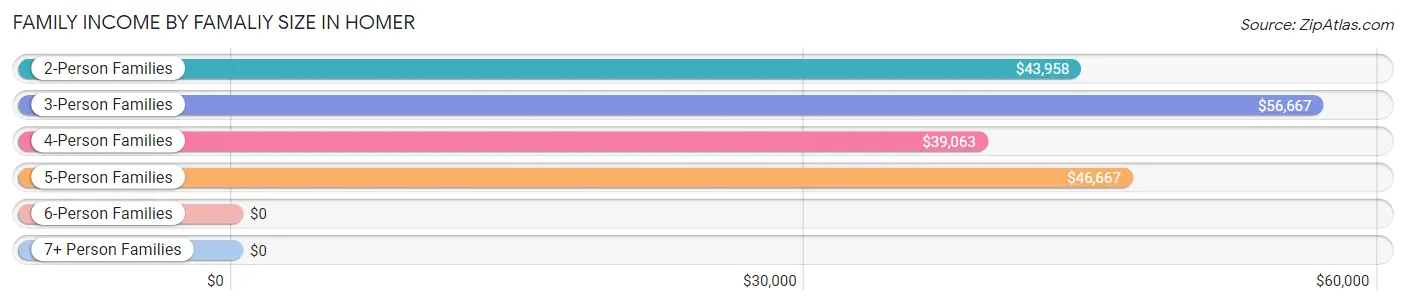
Family Income by Famaliy Size in Homer
3-person families (84 | 20.6%) account for the highest median family income in Homer with $56,667 per family, while 2-person families (166 | 40.7%) have the highest median income of $21,979 per family member.
| Income Bracket | # Families | Median Income |
| 2-Person Families | 166 (40.7%) | $43,958 |
| 3-Person Families | 84 (20.6%) | $56,667 |
| 4-Person Families | 108 (26.5%) | $39,063 |
| 5-Person Families | 38 (9.3%) | $46,667 |
| 6-Person Families | 7 (1.7%) | $0 |
| 7+ Person Families | 5 (1.2%) | $0 |
| Total | 408 (100.0%) | $46,838 |
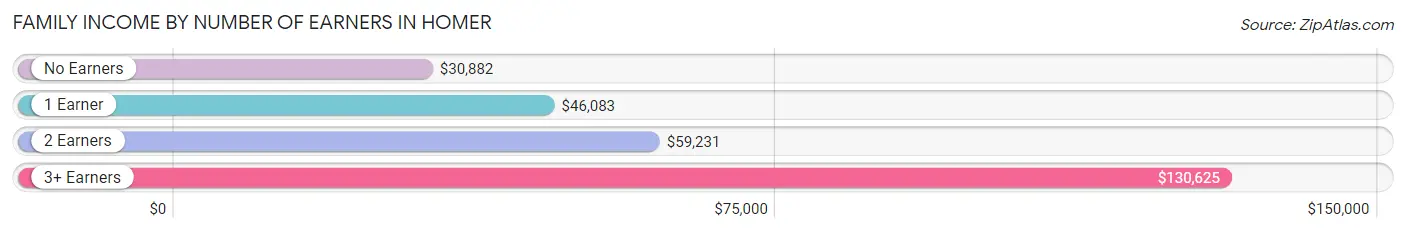
Family Income by Number of Earners in Homer
The median family income in Homer is $46,838, with families comprising 3+ earners (33) having the highest median family income of $130,625, while families with no earners (78) have the lowest median family income of $30,882, accounting for 8.1% and 19.1% of families, respectively.
| Number of Earners | # Families | Median Income |
| No Earners | 78 (19.1%) | $30,882 |
| 1 Earner | 179 (43.9%) | $46,083 |
| 2 Earners | 118 (28.9%) | $59,231 |
| 3+ Earners | 33 (8.1%) | $130,625 |
| Total | 408 (100.0%) | $46,838 |
Household Income in Homer
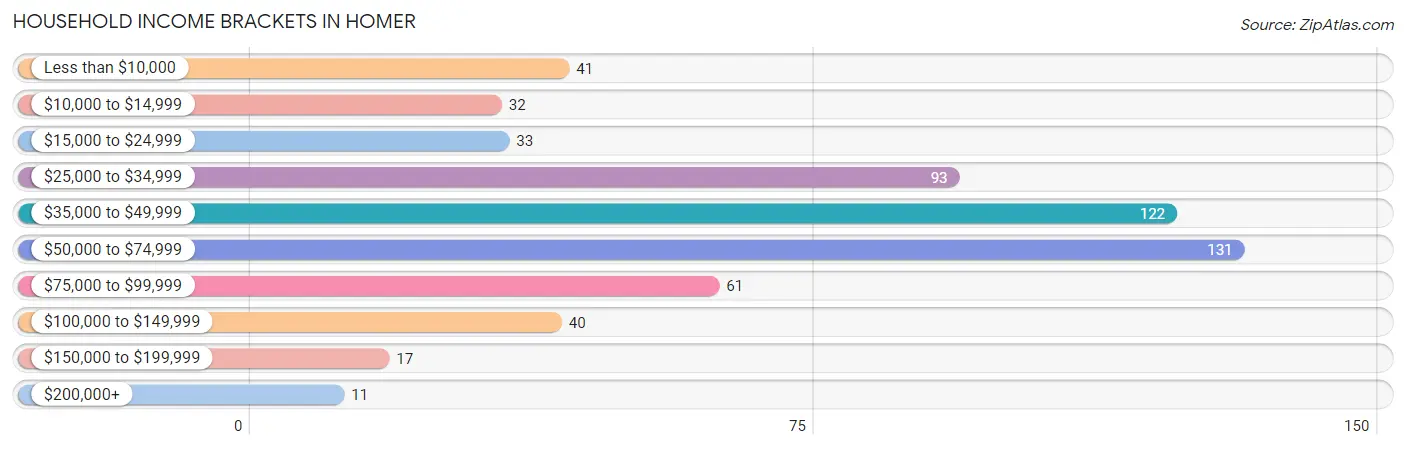
Household Income Brackets in Homer
With 131 households falling in the category, the $50,000 to $74,999 income range is the most frequent in Homer, accounting for 22.6% of all households. In contrast, only 11 households (1.9%) fall into the $200,000+ income bracket, making it the least populous group.
| Income Bracket | # Households | % Households |
| Less than $10,000 | 41 | 7.1% |
| $10,000 to $14,999 | 32 | 5.5% |
| $15,000 to $24,999 | 33 | 5.7% |
| $25,000 to $34,999 | 93 | 16.0% |
| $35,000 to $49,999 | 122 | 21.0% |
| $50,000 to $74,999 | 131 | 22.5% |
| $75,000 to $99,999 | 61 | 10.5% |
| $100,000 to $149,999 | 40 | 6.9% |
| $150,000 to $199,999 | 17 | 2.9% |
| $200,000+ | 11 | 1.9% |
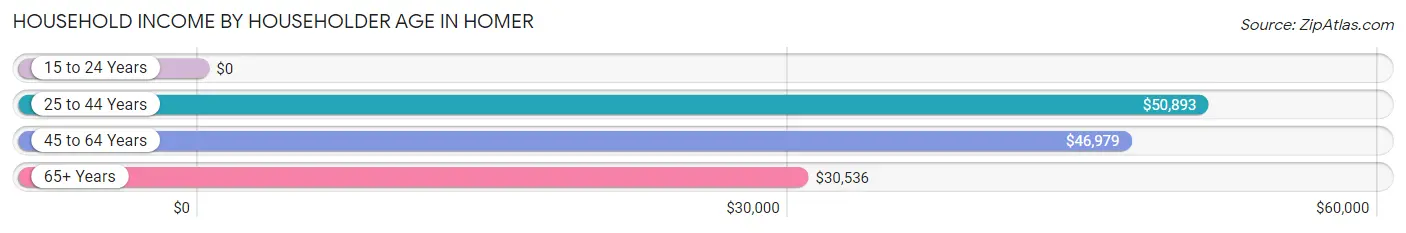
Household Income by Householder Age in Homer
The median household income in Homer is $45,257, with the highest median household income of $50,893 found in the 25 to 44 years age bracket for the primary householder. A total of 229 households (39.4%) fall into this category. Meanwhile, the 15 to 24 years age bracket for the primary householder has the lowest median household income of $0, with 22 households (3.8%) in this group.
| Income Bracket | # Households | Median Income |
| 15 to 24 Years | 22 (3.8%) | $0 |
| 25 to 44 Years | 229 (39.4%) | $50,893 |
| 45 to 64 Years | 213 (36.7%) | $46,979 |
| 65+ Years | 117 (20.1%) | $30,536 |
| Total | 581 (100.0%) | $45,257 |
Poverty in Homer
Income Below Poverty by Sex and Age in Homer
With 16.4% poverty level for males and 23.7% for females among the residents of Homer, 12 to 14 year old males and 5 year old females are the most vulnerable to poverty, with 43 males (70.5%) and 9 females (75.0%) in their respective age groups living below the poverty level.
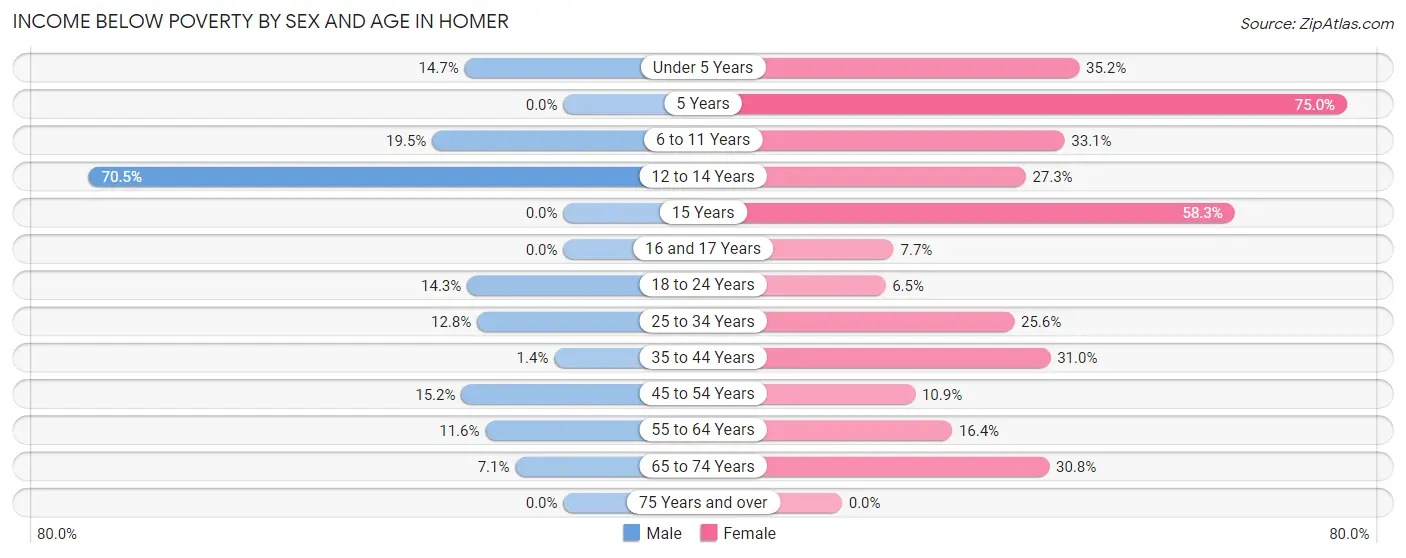
| Age Bracket | Male | Female |
| Under 5 Years | 11 (14.7%) | 31 (35.2%) |
| 5 Years | 0 (0.0%) | 9 (75.0%) |
| 6 to 11 Years | 15 (19.5%) | 39 (33.1%) |
| 12 to 14 Years | 43 (70.5%) | 18 (27.3%) |
| 15 Years | 0 (0.0%) | 7 (58.3%) |
| 16 and 17 Years | 0 (0.0%) | 2 (7.7%) |
| 18 to 24 Years | 12 (14.3%) | 4 (6.5%) |
| 25 to 34 Years | 15 (12.8%) | 33 (25.6%) |
| 35 to 44 Years | 1 (1.3%) | 26 (30.9%) |
| 45 to 54 Years | 15 (15.1%) | 15 (10.9%) |
| 55 to 64 Years | 8 (11.6%) | 9 (16.4%) |
| 65 to 74 Years | 3 (7.1%) | 20 (30.8%) |
| 75 Years and over | 0 (0.0%) | 0 (0.0%) |
| Total | 123 (16.4%) | 213 (23.7%) |
Income Above Poverty by Sex and Age in Homer
According to the poverty statistics in Homer, males aged 5 years and females aged 75 years and over are the age groups that are most secure financially, with 100.0% of males and 100.0% of females in these age groups living above the poverty line.

| Age Bracket | Male | Female |
| Under 5 Years | 64 (85.3%) | 57 (64.8%) |
| 5 Years | 4 (100.0%) | 3 (25.0%) |
| 6 to 11 Years | 62 (80.5%) | 79 (66.9%) |
| 12 to 14 Years | 18 (29.5%) | 48 (72.7%) |
| 15 Years | 13 (100.0%) | 5 (41.7%) |
| 16 and 17 Years | 5 (100.0%) | 24 (92.3%) |
| 18 to 24 Years | 72 (85.7%) | 58 (93.5%) |
| 25 to 34 Years | 102 (87.2%) | 96 (74.4%) |
| 35 to 44 Years | 73 (98.7%) | 58 (69.1%) |
| 45 to 54 Years | 84 (84.9%) | 123 (89.1%) |
| 55 to 64 Years | 61 (88.4%) | 46 (83.6%) |
| 65 to 74 Years | 39 (92.9%) | 45 (69.2%) |
| 75 Years and over | 31 (100.0%) | 44 (100.0%) |
| Total | 628 (83.6%) | 686 (76.3%) |
Income Below Poverty Among Married-Couple Families in Homer
The poverty statistics for married-couple families in Homer show that 1.3% or 3 of the total 224 families live below the poverty line. Families with no children have the highest poverty rate of 3.0%, comprising of 3 families. On the other hand, families with 1 or 2 children have the lowest poverty rate of 0.0%, which includes 0 families.
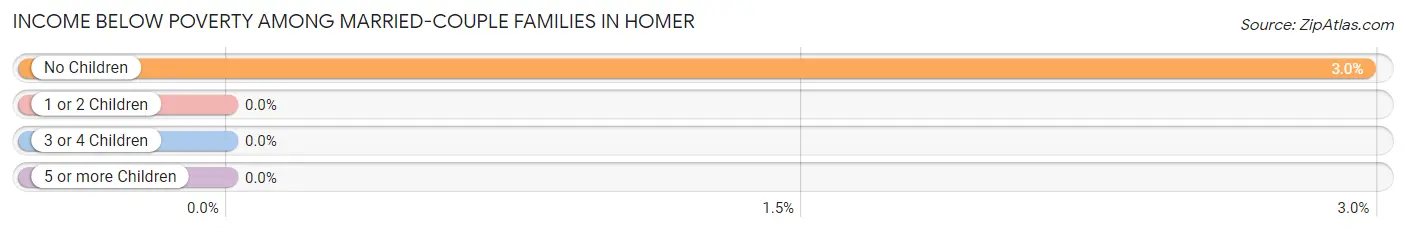
| Children | Above Poverty | Below Poverty |
| No Children | 98 (97.0%) | 3 (3.0%) |
| 1 or 2 Children | 85 (100.0%) | 0 (0.0%) |
| 3 or 4 Children | 33 (100.0%) | 0 (0.0%) |
| 5 or more Children | 5 (100.0%) | 0 (0.0%) |
| Total | 221 (98.7%) | 3 (1.3%) |
Income Below Poverty Among Single-Parent Households in Homer
According to the poverty data in Homer, 28.8% or 15 single-father households and 40.2% or 53 single-mother households are living below the poverty line. Among single-father households, those with 3 or 4 children have the highest poverty rate, with 11 households (100.0%) experiencing poverty. Likewise, among single-mother households, those with 3 or 4 children have the highest poverty rate, with 33 households (82.5%) falling below the poverty line.
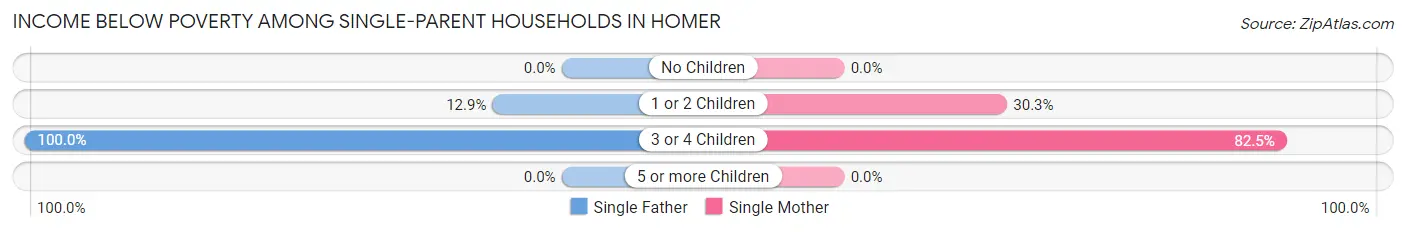
| Children | Single Father | Single Mother |
| No Children | 0 (0.0%) | 0 (0.0%) |
| 1 or 2 Children | 4 (12.9%) | 20 (30.3%) |
| 3 or 4 Children | 11 (100.0%) | 33 (82.5%) |
| 5 or more Children | 0 (0.0%) | 0 (0.0%) |
| Total | 15 (28.8%) | 53 (40.2%) |
Income Below Poverty Among Married-Couple vs Single-Parent Households in Homer
The poverty data for Homer shows that 3 of the married-couple family households (1.3%) and 68 of the single-parent households (37.0%) are living below the poverty level. Within the married-couple family households, those with no children have the highest poverty rate, with 3 households (3.0%) falling below the poverty line. Among the single-parent households, those with 3 or 4 children have the highest poverty rate, with 44 household (86.3%) living below poverty.
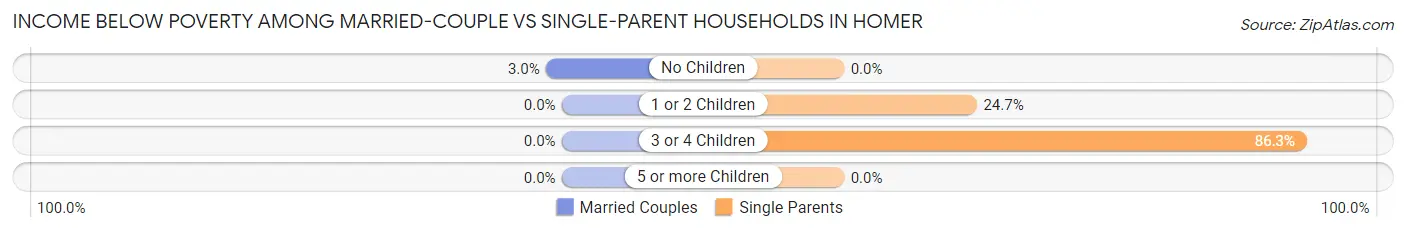
| Children | Married-Couple Families | Single-Parent Households |
| No Children | 3 (3.0%) | 0 (0.0%) |
| 1 or 2 Children | 0 (0.0%) | 24 (24.7%) |
| 3 or 4 Children | 0 (0.0%) | 44 (86.3%) |
| 5 or more Children | 0 (0.0%) | 0 (0.0%) |
| Total | 3 (1.3%) | 68 (37.0%) |
Race in Homer
The most populous races in Homer are White / Caucasian (1,509 | 90.7%), Two or more Races (125 | 7.5%), and Hispanic or Latino (24 | 1.4%).
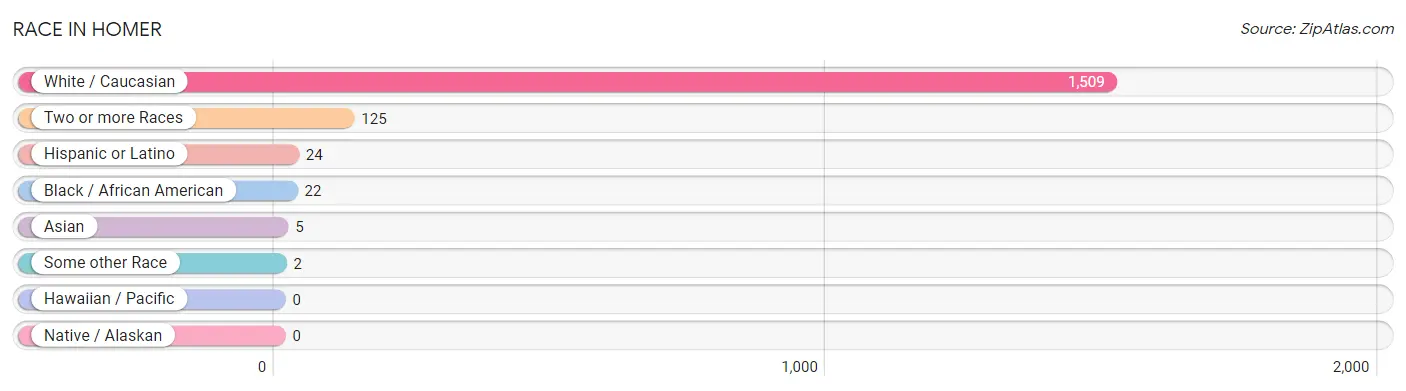
| Race | # Population | % Population |
| Asian | 5 | 0.3% |
| Black / African American | 22 | 1.3% |
| Hawaiian / Pacific | 0 | 0.0% |
| Hispanic or Latino | 24 | 1.4% |
| Native / Alaskan | 0 | 0.0% |
| White / Caucasian | 1,509 | 90.7% |
| Two or more Races | 125 | 7.5% |
| Some other Race | 2 | 0.1% |
| Total | 1,663 | 100.0% |
Ancestry in Homer
The most populous ancestries reported in Homer are German (342 | 20.6%), Irish (111 | 6.7%), English (110 | 6.6%), Polish (108 | 6.5%), and American (81 | 4.9%), together accounting for 45.2% of all Homer residents.
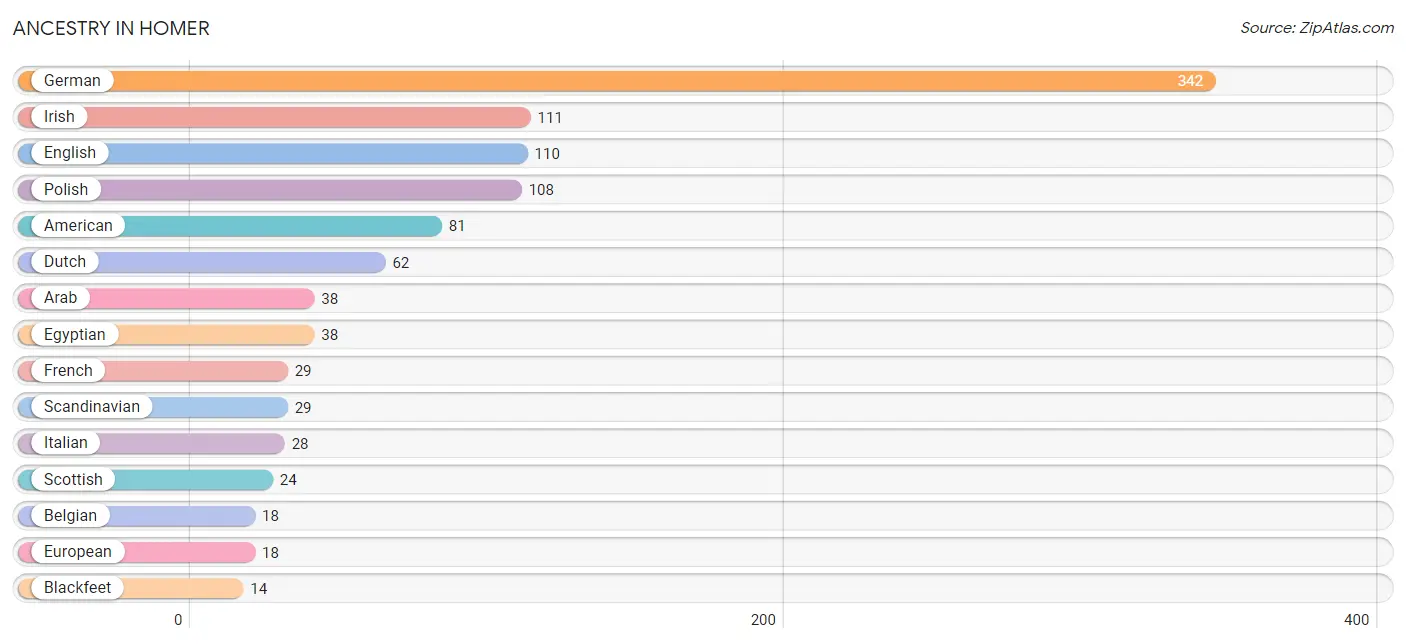
| Ancestry | # Population | % Population |
| American | 81 | 4.9% |
| Arab | 38 | 2.3% |
| Belgian | 18 | 1.1% |
| Blackfeet | 14 | 0.8% |
| British | 7 | 0.4% |
| Canadian | 10 | 0.6% |
| Cherokee | 2 | 0.1% |
| Croatian | 6 | 0.4% |
| Cuban | 6 | 0.4% |
| Dutch | 62 | 3.7% |
| Eastern European | 6 | 0.4% |
| Egyptian | 38 | 2.3% |
| English | 110 | 6.6% |
| European | 18 | 1.1% |
| Finnish | 3 | 0.2% |
| French | 29 | 1.7% |
| German | 342 | 20.6% |
| Greek | 11 | 0.7% |
| Indian (Asian) | 7 | 0.4% |
| Irish | 111 | 6.7% |
| Italian | 28 | 1.7% |
| Korean | 7 | 0.4% |
| Malaysian | 5 | 0.3% |
| Mexican | 12 | 0.7% |
| Norwegian | 13 | 0.8% |
| Ottawa | 2 | 0.1% |
| Pennsylvania German | 2 | 0.1% |
| Polish | 108 | 6.5% |
| Puerto Rican | 2 | 0.1% |
| Russian | 5 | 0.3% |
| Scandinavian | 29 | 1.7% |
| Scotch-Irish | 3 | 0.2% |
| Scottish | 24 | 1.4% |
| Sioux | 5 | 0.3% |
| Swedish | 8 | 0.5% | View All 35 Rows |
Immigrants in Homer
The most numerous immigrant groups reported in Homer came from Africa (13 | 0.8%), Egypt (13 | 0.8%), and Northern Africa (13 | 0.8%), together accounting for 2.3% of all Homer residents.
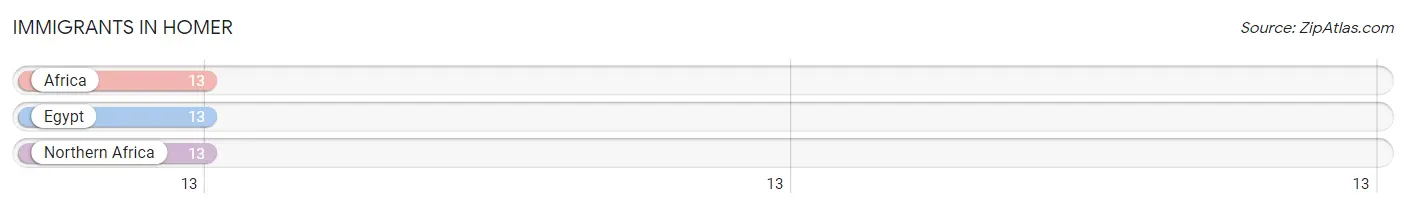
| Immigration Origin | # Population | % Population |
| Africa | 13 | 0.8% |
| Egypt | 13 | 0.8% |
| Northern Africa | 13 | 0.8% | View All 3 Rows |
Sex and Age in Homer
Sex and Age in Homer
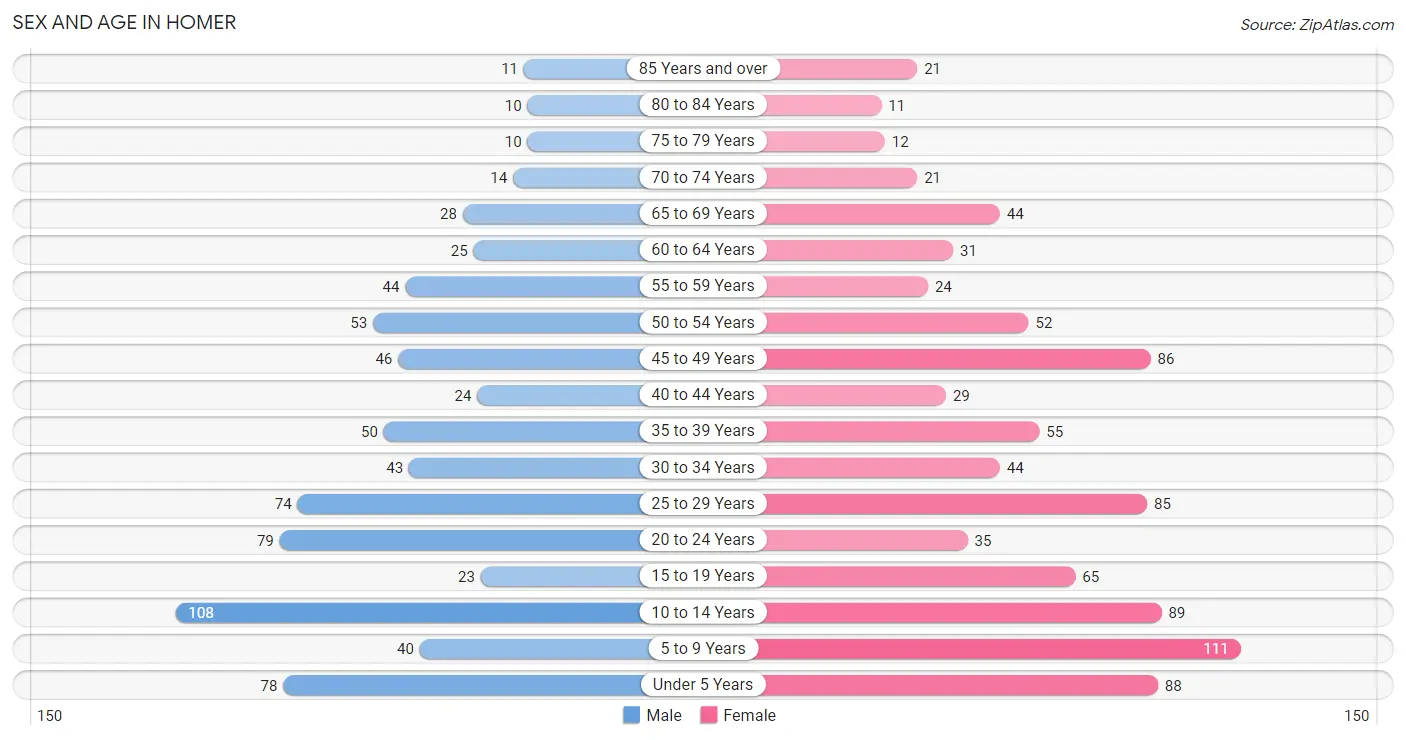
The most populous age groups in Homer are 10 to 14 Years (108 | 14.2%) for men and 5 to 9 Years (111 | 12.3%) for women.
| Age Bracket | Male | Female |
| Under 5 Years | 78 (10.3%) | 88 (9.8%) |
| 5 to 9 Years | 40 (5.3%) | 111 (12.3%) |
| 10 to 14 Years | 108 (14.2%) | 89 (9.9%) |
| 15 to 19 Years | 23 (3.0%) | 65 (7.2%) |
| 20 to 24 Years | 79 (10.4%) | 35 (3.9%) |
| 25 to 29 Years | 74 (9.7%) | 85 (9.4%) |
| 30 to 34 Years | 43 (5.7%) | 44 (4.9%) |
| 35 to 39 Years | 50 (6.6%) | 55 (6.1%) |
| 40 to 44 Years | 24 (3.2%) | 29 (3.2%) |
| 45 to 49 Years | 46 (6.0%) | 86 (9.5%) |
| 50 to 54 Years | 53 (7.0%) | 52 (5.8%) |
| 55 to 59 Years | 44 (5.8%) | 24 (2.7%) |
| 60 to 64 Years | 25 (3.3%) | 31 (3.4%) |
| 65 to 69 Years | 28 (3.7%) | 44 (4.9%) |
| 70 to 74 Years | 14 (1.8%) | 21 (2.3%) |
| 75 to 79 Years | 10 (1.3%) | 12 (1.3%) |
| 80 to 84 Years | 10 (1.3%) | 11 (1.2%) |
| 85 Years and over | 11 (1.5%) | 21 (2.3%) |
| Total | 760 (100.0%) | 903 (100.0%) |
Families and Households in Homer
Median Family Size in Homer
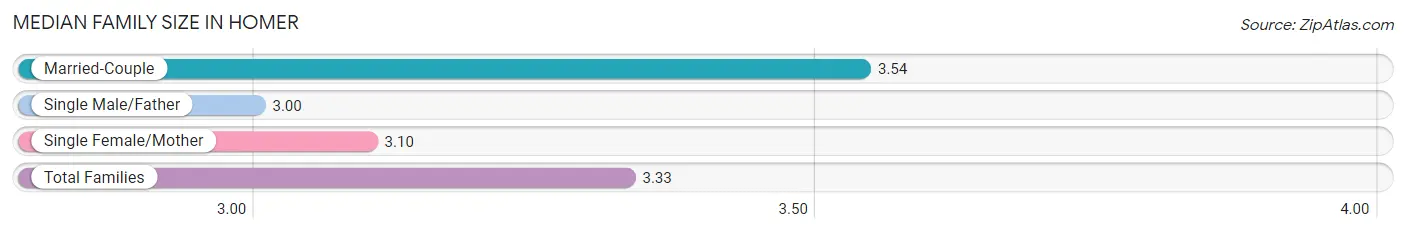
The median family size in Homer is 3.33 persons per family, with married-couple families (224 | 54.9%) accounting for the largest median family size of 3.54 persons per family. On the other hand, single male/father families (52 | 12.8%) represent the smallest median family size with 3.00 persons per family.
| Family Type | # Families | Family Size |
| Married-Couple | 224 (54.9%) | 3.54 |
| Single Male/Father | 52 (12.8%) | 3.00 |
| Single Female/Mother | 132 (32.4%) | 3.10 |
| Total Families | 408 (100.0%) | 3.33 |
Median Household Size in Homer
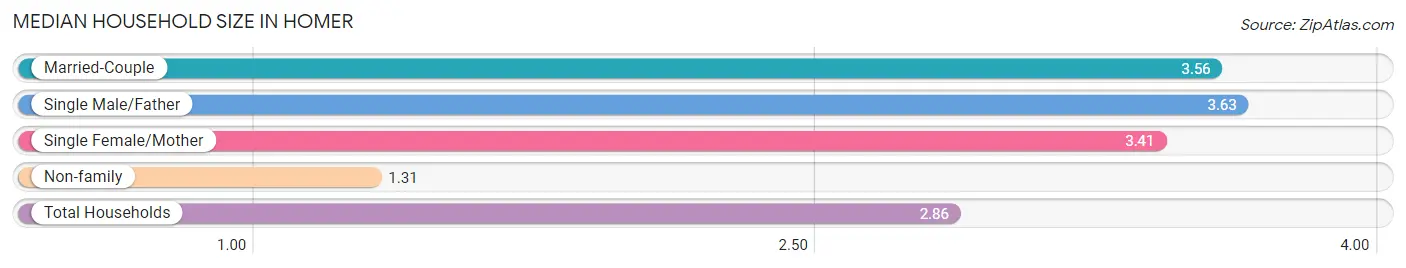
The median household size in Homer is 2.86 persons per household, with single male/father households (52 | 8.9%) accounting for the largest median household size of 3.63 persons per household. non-family households (173 | 29.8%) represent the smallest median household size with 1.31 persons per household.
| Household Type | # Households | Household Size |
| Married-Couple | 224 (38.6%) | 3.56 |
| Single Male/Father | 52 (8.9%) | 3.63 |
| Single Female/Mother | 132 (22.7%) | 3.41 |
| Non-family | 173 (29.8%) | 1.31 |
| Total Households | 581 (100.0%) | 2.86 |
Household Size by Marriage Status in Homer
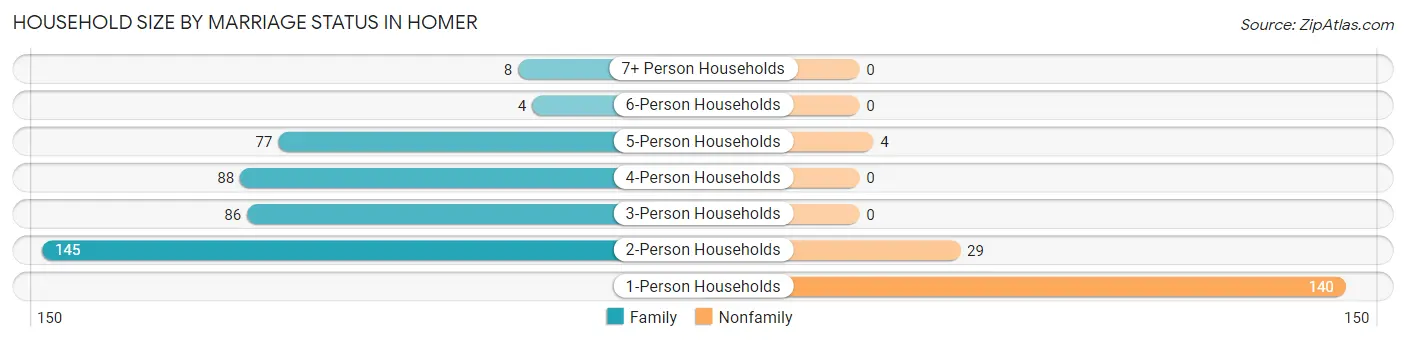
Out of a total of 581 households in Homer, 408 (70.2%) are family households, while 173 (29.8%) are nonfamily households. The most numerous type of family households are 2-person households, comprising 145, and the most common type of nonfamily households are 1-person households, comprising 140.
| Household Size | Family Households | Nonfamily Households |
| 1-Person Households | - | 140 (24.1%) |
| 2-Person Households | 145 (25.0%) | 29 (5.0%) |
| 3-Person Households | 86 (14.8%) | 0 (0.0%) |
| 4-Person Households | 88 (15.1%) | 0 (0.0%) |
| 5-Person Households | 77 (13.3%) | 4 (0.7%) |
| 6-Person Households | 4 (0.7%) | 0 (0.0%) |
| 7+ Person Households | 8 (1.4%) | 0 (0.0%) |
| Total | 408 (70.2%) | 173 (29.8%) |
Female Fertility in Homer
Fertility by Age in Homer
Average fertility rate in Homer is 71.0 births per 1,000 women. Women in the age bracket of 20 to 34 years have the highest fertility rate with 91.0 births per 1,000 women. Women in the age bracket of 20 to 34 years acount for 51.7% of all women with births.
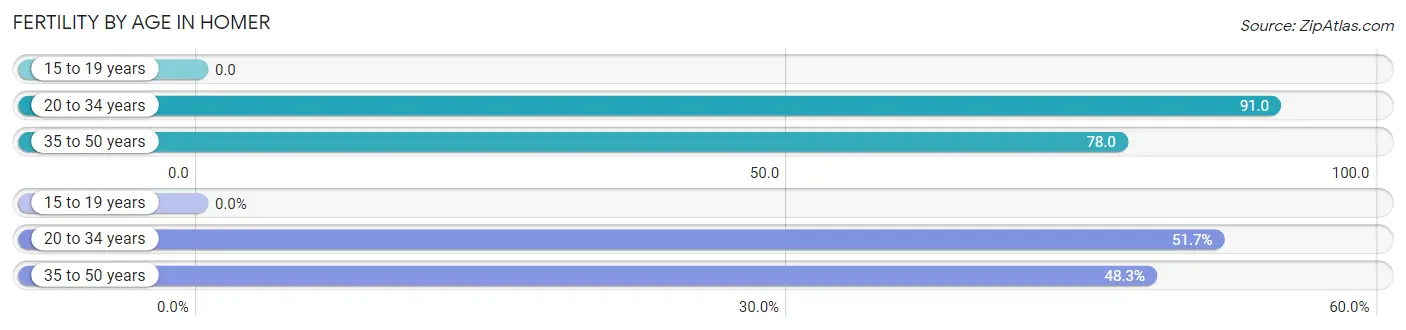
| Age Bracket | Women with Births | Births / 1,000 Women |
| 15 to 19 years | 0 (0.0%) | 0.0 |
| 20 to 34 years | 15 (51.7%) | 91.0 |
| 35 to 50 years | 14 (48.3%) | 78.0 |
| Total | 29 (100.0%) | 71.0 |
Fertility by Age by Marriage Status in Homer
86.2% of women with births (29) in Homer are married. The highest percentage of unmarried women with births falls into 20 to 34 years age bracket with 26.7% of them unmarried at the time of birth, while the lowest percentage of unmarried women with births belong to 35 to 50 years age bracket with 0.0% of them unmarried.
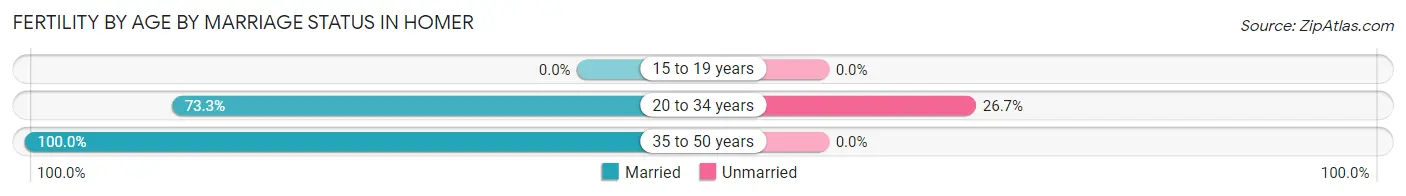
| Age Bracket | Married | Unmarried |
| 15 to 19 years | 0 (0.0%) | 0 (0.0%) |
| 20 to 34 years | 11 (73.3%) | 4 (26.7%) |
| 35 to 50 years | 14 (100.0%) | 0 (0.0%) |
| Total | 25 (86.2%) | 4 (13.8%) |
Fertility by Education in Homer
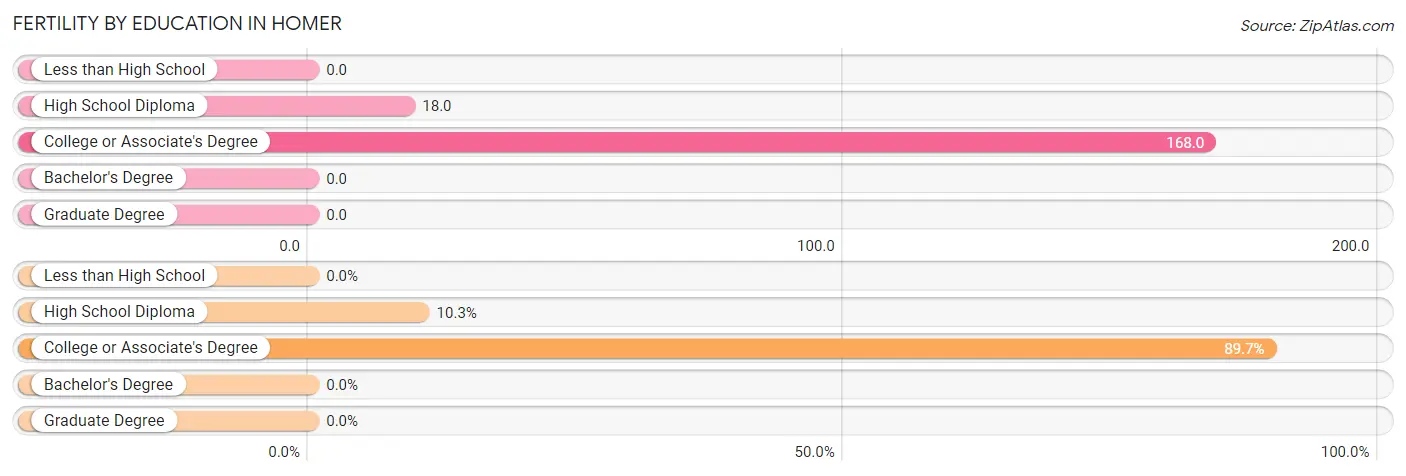
| Educational Attainment | Women with Births | Births / 1,000 Women |
| Less than High School | 0 (0.0%) | 0.0 |
| High School Diploma | 3 (10.3%) | 18.0 |
| College or Associate's Degree | 26 (89.7%) | 168.0 |
| Bachelor's Degree | 0 (0.0%) | 0.0 |
| Graduate Degree | 0 (0.0%) | 0.0 |
| Total | 29 (100.0%) | 71.0 |
Fertility by Education by Marriage Status in Homer
13.8% of women with births in Homer are unmarried. Women with the educational attainment of high school diploma are most likely to be married with 100.0% of them married at childbirth, while women with the educational attainment of college or associate's degree are least likely to be married with 15.4% of them unmarried at childbirth.
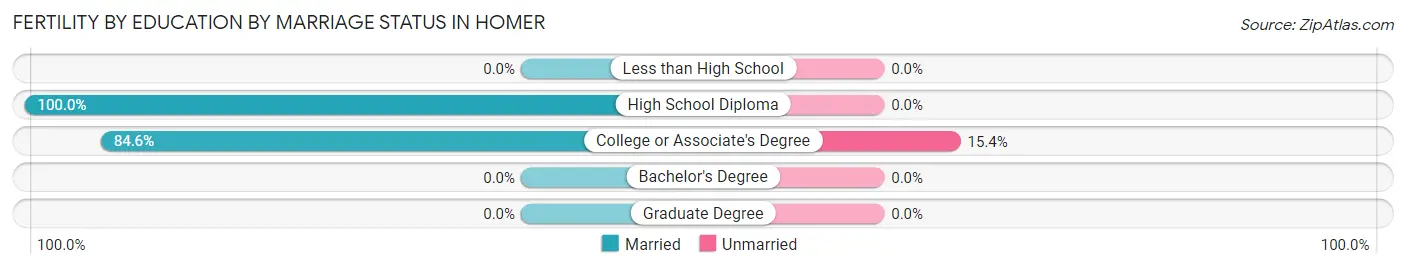
| Educational Attainment | Married | Unmarried |
| Less than High School | 0 (0.0%) | 0 (0.0%) |
| High School Diploma | 3 (100.0%) | 0 (0.0%) |
| College or Associate's Degree | 22 (84.6%) | 4 (15.4%) |
| Bachelor's Degree | 0 (0.0%) | 0 (0.0%) |
| Graduate Degree | 0 (0.0%) | 0 (0.0%) |
| Total | 25 (86.2%) | 4 (13.8%) |
Employment Characteristics in Homer
Employment by Class of Employer in Homer
Among the 641 employed individuals in Homer, private company employees (510 | 79.6%), not-for-profit organizations (35 | 5.5%), and self-employed (not incorporated) (26 | 4.1%) make up the most common classes of employment.
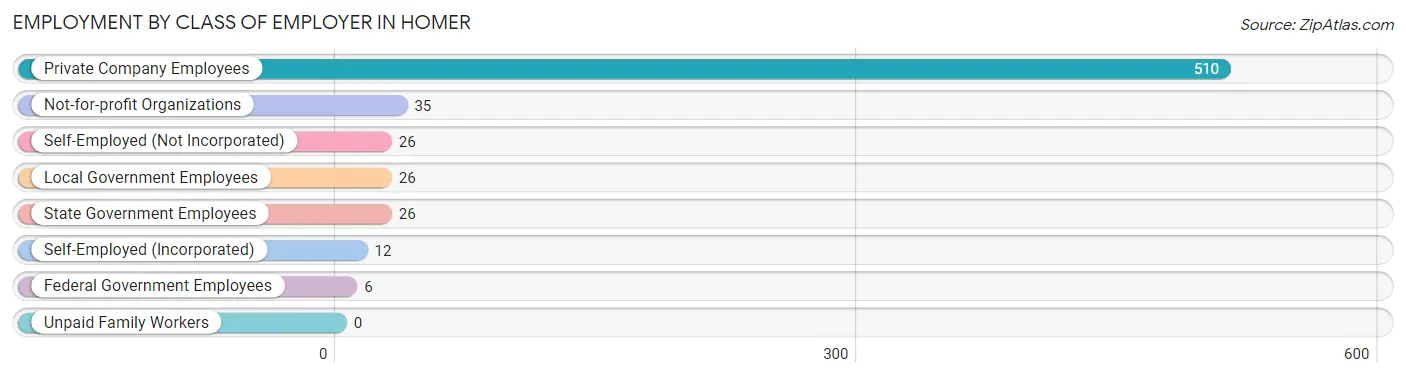
| Employer Class | # Employees | % Employees |
| Private Company Employees | 510 | 79.6% |
| Self-Employed (Incorporated) | 12 | 1.9% |
| Self-Employed (Not Incorporated) | 26 | 4.1% |
| Not-for-profit Organizations | 35 | 5.5% |
| Local Government Employees | 26 | 4.1% |
| State Government Employees | 26 | 4.1% |
| Federal Government Employees | 6 | 0.9% |
| Unpaid Family Workers | 0 | 0.0% |
| Total | 641 | 100.0% |
Employment Status by Age in Homer
According to the labor force statistics for Homer, out of the total population over 16 years of age (1,124), 61.8% or 695 individuals are in the labor force, with 6.9% or 48 of them unemployed. The age group with the highest labor force participation rate is 30 to 34 years, with 82.8% or 72 individuals in the labor force. Within the labor force, the 25 to 29 years age range has the highest percentage of unemployed individuals, with 17.1% or 19 of them being unemployed.
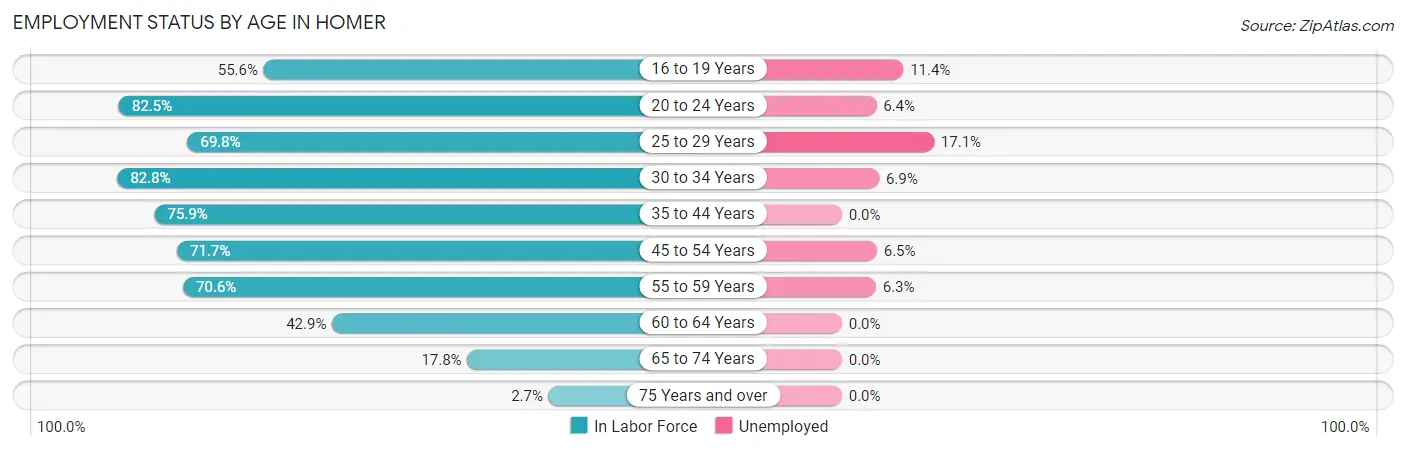
| Age Bracket | In Labor Force | Unemployed |
| 16 to 19 Years | 35 (55.6%) | 4 (11.4%) |
| 20 to 24 Years | 94 (82.5%) | 6 (6.4%) |
| 25 to 29 Years | 111 (69.8%) | 19 (17.1%) |
| 30 to 34 Years | 72 (82.8%) | 5 (6.9%) |
| 35 to 44 Years | 120 (75.9%) | 0 (0.0%) |
| 45 to 54 Years | 170 (71.7%) | 11 (6.5%) |
| 55 to 59 Years | 48 (70.6%) | 3 (6.3%) |
| 60 to 64 Years | 24 (42.9%) | 0 (0.0%) |
| 65 to 74 Years | 19 (17.8%) | 0 (0.0%) |
| 75 Years and over | 2 (2.7%) | 0 (0.0%) |
| Total | 695 (61.8%) | 48 (6.9%) |
Employment Status by Educational Attainment in Homer
According to labor force statistics for Homer, 71.2% of individuals (545) out of the total population between 25 and 64 years of age (765) are in the labor force, with 7.0% or 38 of them being unemployed. The group with the highest labor force participation rate are those with the educational attainment of bachelor's degree or higher, with 100.0% or 90 individuals in the labor force. Within the labor force, individuals with less than high school education have the highest percentage of unemployment, with 70.6% or 12 of them being unemployed.
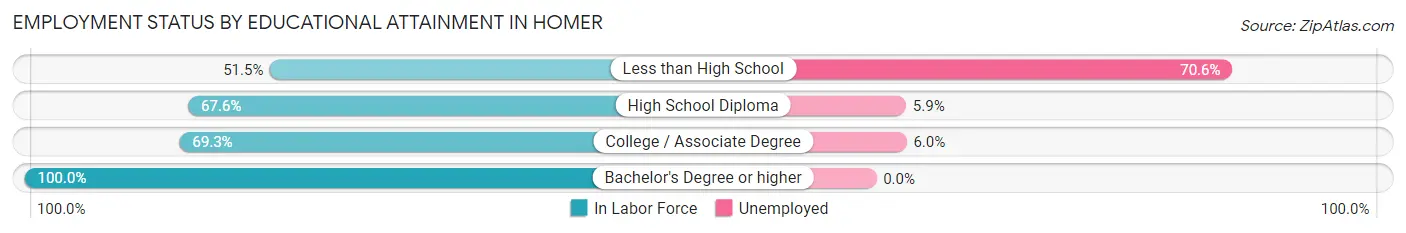
| Educational Attainment | In Labor Force | Unemployed |
| Less than High School | 17 (51.5%) | 23 (70.6%) |
| High School Diploma | 271 (67.6%) | 24 (5.9%) |
| College / Associate Degree | 167 (69.3%) | 14 (6.0%) |
| Bachelor's Degree or higher | 90 (100.0%) | 0 (0.0%) |
| Total | 545 (71.2%) | 54 (7.0%) |
Employment Occupations by Sex in Homer
Management, Business, Science and Arts Occupations
The most common Management, Business, Science and Arts occupations in Homer are Community & Social Service (47 | 7.3%), Education Instruction & Library (41 | 6.3%), Management (31 | 4.8%), Health Diagnosing & Treating (23 | 3.5%), and Computers, Engineering & Science (17 | 2.6%).
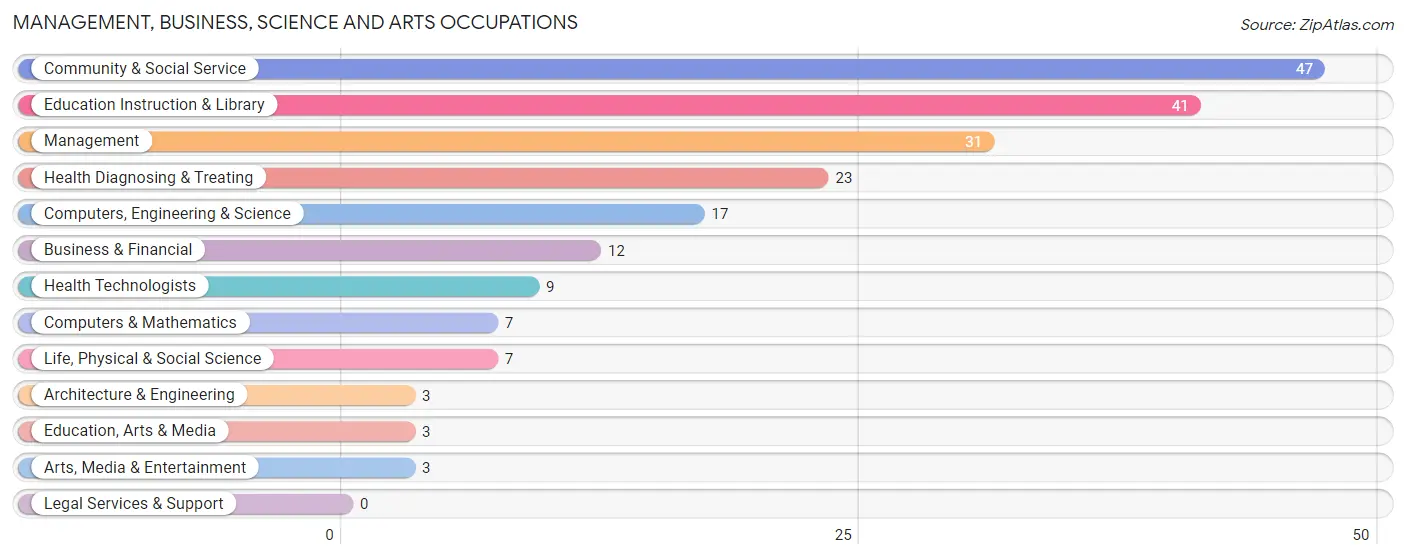
Management, Business, Science and Arts Occupations by Sex
Within the Management, Business, Science and Arts occupations in Homer, the most male-oriented occupations are Architecture & Engineering (100.0%), Education, Arts & Media (100.0%), and Computers & Mathematics (85.7%), while the most female-oriented occupations are Arts, Media & Entertainment (100.0%), Education Instruction & Library (90.2%), and Management (87.1%).
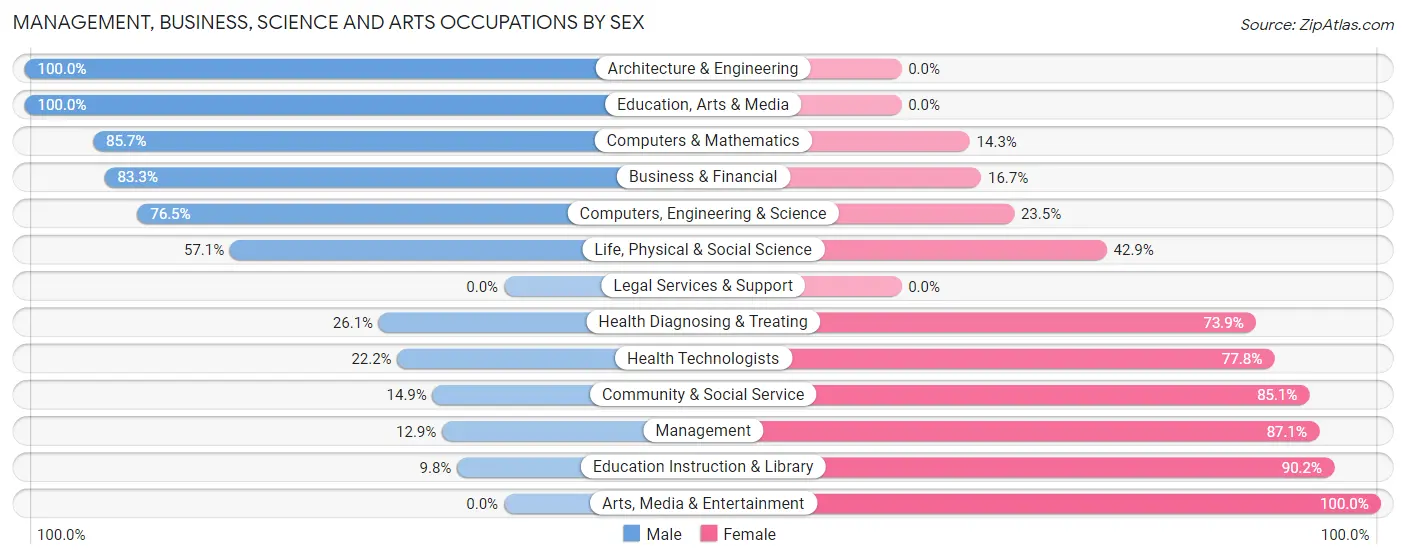
| Occupation | Male | Female |
| Management | 4 (12.9%) | 27 (87.1%) |
| Business & Financial | 10 (83.3%) | 2 (16.7%) |
| Computers, Engineering & Science | 13 (76.5%) | 4 (23.5%) |
| Computers & Mathematics | 6 (85.7%) | 1 (14.3%) |
| Architecture & Engineering | 3 (100.0%) | 0 (0.0%) |
| Life, Physical & Social Science | 4 (57.1%) | 3 (42.9%) |
| Community & Social Service | 7 (14.9%) | 40 (85.1%) |
| Education, Arts & Media | 3 (100.0%) | 0 (0.0%) |
| Legal Services & Support | 0 (0.0%) | 0 (0.0%) |
| Education Instruction & Library | 4 (9.8%) | 37 (90.2%) |
| Arts, Media & Entertainment | 0 (0.0%) | 3 (100.0%) |
| Health Diagnosing & Treating | 6 (26.1%) | 17 (73.9%) |
| Health Technologists | 2 (22.2%) | 7 (77.8%) |
| Total (Category) | 40 (30.8%) | 90 (69.2%) |
| Total (Overall) | 347 (53.6%) | 300 (46.4%) |
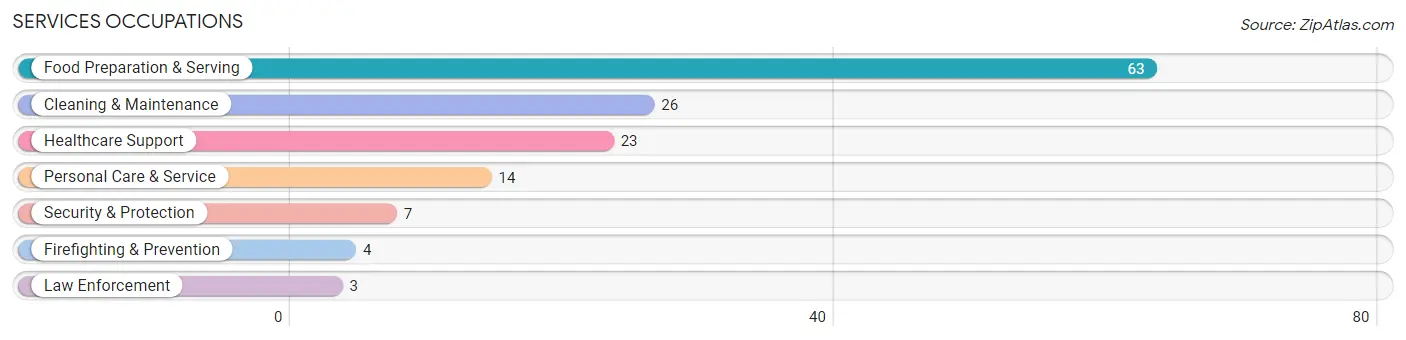
Services Occupations
The most common Services occupations in Homer are Food Preparation & Serving (63 | 9.7%), Cleaning & Maintenance (26 | 4.0%), Healthcare Support (23 | 3.5%), Personal Care & Service (14 | 2.2%), and Security & Protection (7 | 1.1%).
Services Occupations by Sex
Within the Services occupations in Homer, the most male-oriented occupations are Security & Protection (100.0%), Firefighting & Prevention (100.0%), and Law Enforcement (100.0%), while the most female-oriented occupations are Healthcare Support (100.0%), Personal Care & Service (100.0%), and Food Preparation & Serving (63.5%).
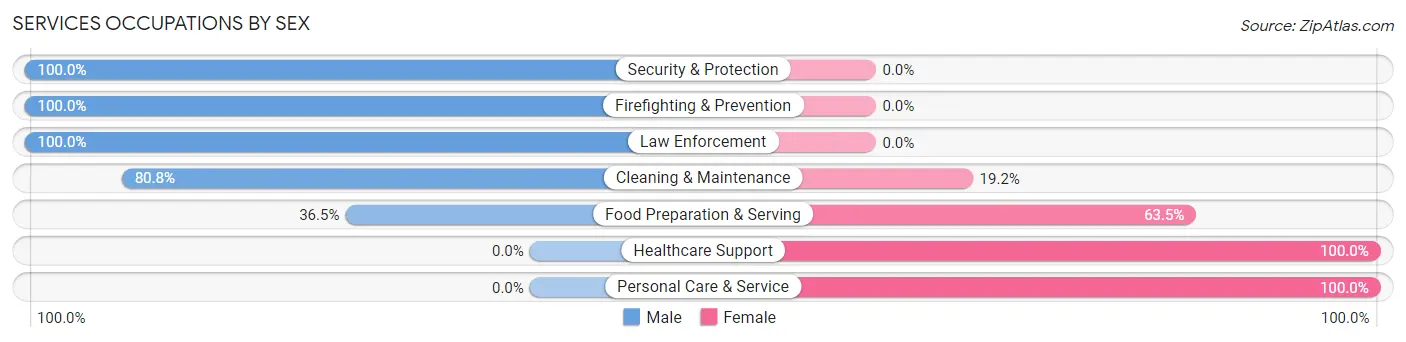
| Occupation | Male | Female |
| Healthcare Support | 0 (0.0%) | 23 (100.0%) |
| Security & Protection | 7 (100.0%) | 0 (0.0%) |
| Firefighting & Prevention | 4 (100.0%) | 0 (0.0%) |
| Law Enforcement | 3 (100.0%) | 0 (0.0%) |
| Food Preparation & Serving | 23 (36.5%) | 40 (63.5%) |
| Cleaning & Maintenance | 21 (80.8%) | 5 (19.2%) |
| Personal Care & Service | 0 (0.0%) | 14 (100.0%) |
| Total (Category) | 51 (38.4%) | 82 (61.7%) |
| Total (Overall) | 347 (53.6%) | 300 (46.4%) |
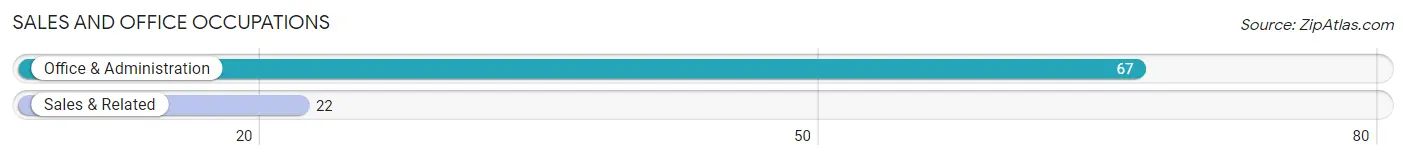
Sales and Office Occupations
The most common Sales and Office occupations in Homer are Office & Administration (67 | 10.4%), and Sales & Related (22 | 3.4%).
Sales and Office Occupations by Sex
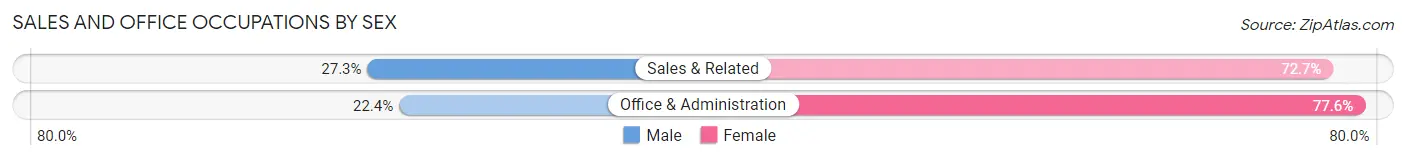
| Occupation | Male | Female |
| Sales & Related | 6 (27.3%) | 16 (72.7%) |
| Office & Administration | 15 (22.4%) | 52 (77.6%) |
| Total (Category) | 21 (23.6%) | 68 (76.4%) |
| Total (Overall) | 347 (53.6%) | 300 (46.4%) |
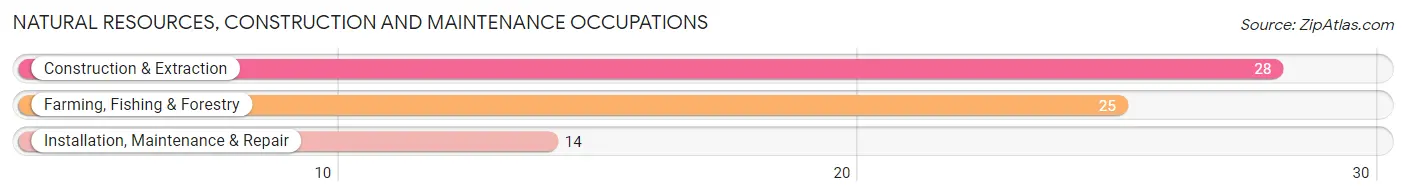
Natural Resources, Construction and Maintenance Occupations
The most common Natural Resources, Construction and Maintenance occupations in Homer are Construction & Extraction (28 | 4.3%), Farming, Fishing & Forestry (25 | 3.9%), and Installation, Maintenance & Repair (14 | 2.2%).
Natural Resources, Construction and Maintenance Occupations by Sex
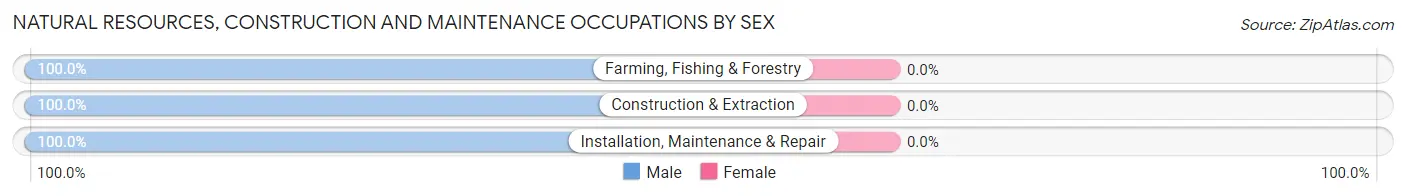
| Occupation | Male | Female |
| Farming, Fishing & Forestry | 25 (100.0%) | 0 (0.0%) |
| Construction & Extraction | 28 (100.0%) | 0 (0.0%) |
| Installation, Maintenance & Repair | 14 (100.0%) | 0 (0.0%) |
| Total (Category) | 67 (100.0%) | 0 (0.0%) |
| Total (Overall) | 347 (53.6%) | 300 (46.4%) |
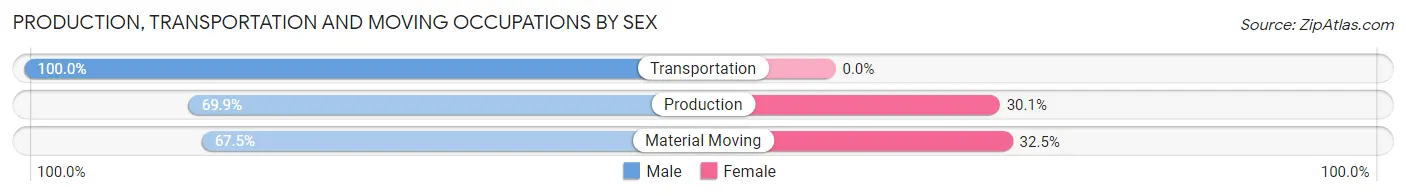
Production, Transportation and Moving Occupations
The most common Production, Transportation and Moving occupations in Homer are Production (156 | 24.1%), Material Moving (40 | 6.2%), and Transportation (32 | 5.0%).
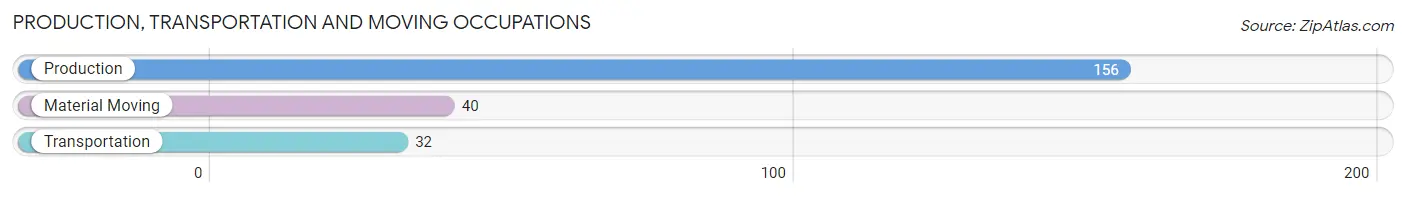
Production, Transportation and Moving Occupations by Sex
| Occupation | Male | Female |
| Production | 109 (69.9%) | 47 (30.1%) |
| Transportation | 32 (100.0%) | 0 (0.0%) |
| Material Moving | 27 (67.5%) | 13 (32.5%) |
| Total (Category) | 168 (73.7%) | 60 (26.3%) |
| Total (Overall) | 347 (53.6%) | 300 (46.4%) |
Employment Industries by Sex in Homer
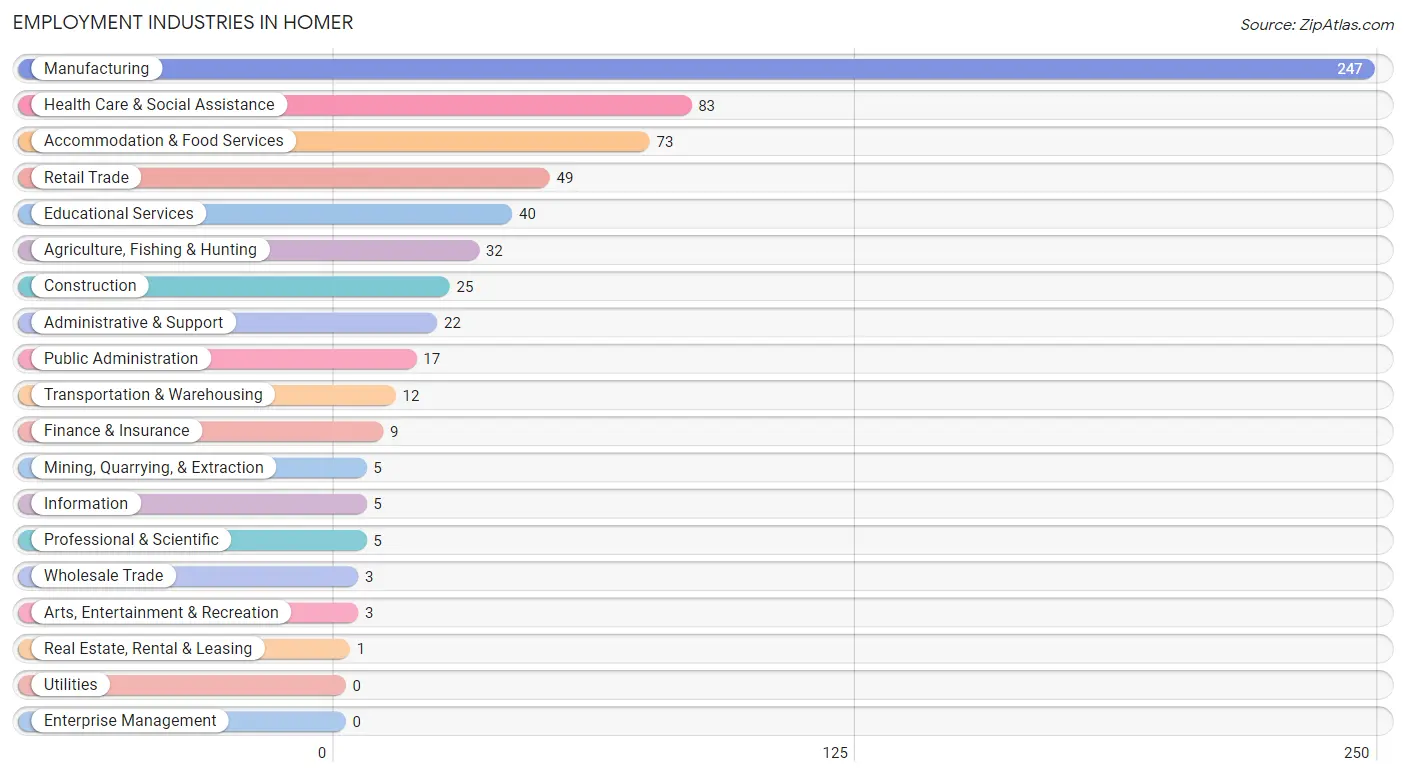
Employment Industries in Homer
The major employment industries in Homer include Manufacturing (247 | 38.2%), Health Care & Social Assistance (83 | 12.8%), Accommodation & Food Services (73 | 11.3%), Retail Trade (49 | 7.6%), and Educational Services (40 | 6.2%).
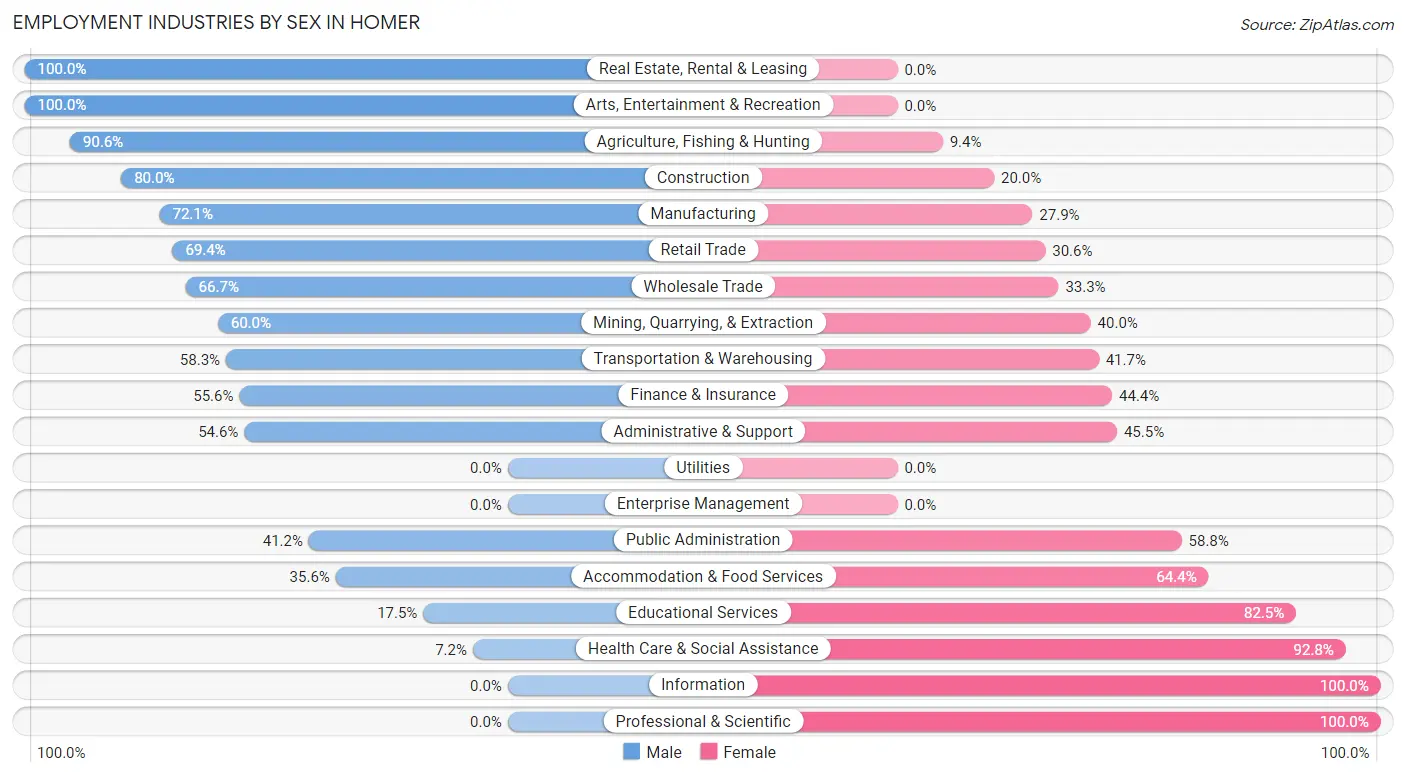
Employment Industries by Sex in Homer
The Homer industries that see more men than women are Real Estate, Rental & Leasing (100.0%), Arts, Entertainment & Recreation (100.0%), and Agriculture, Fishing & Hunting (90.6%), whereas the industries that tend to have a higher number of women are Information (100.0%), Professional & Scientific (100.0%), and Health Care & Social Assistance (92.8%).
| Industry | Male | Female |
| Agriculture, Fishing & Hunting | 29 (90.6%) | 3 (9.4%) |
| Mining, Quarrying, & Extraction | 3 (60.0%) | 2 (40.0%) |
| Construction | 20 (80.0%) | 5 (20.0%) |
| Manufacturing | 178 (72.1%) | 69 (27.9%) |
| Wholesale Trade | 2 (66.7%) | 1 (33.3%) |
| Retail Trade | 34 (69.4%) | 15 (30.6%) |
| Transportation & Warehousing | 7 (58.3%) | 5 (41.7%) |
| Utilities | 0 (0.0%) | 0 (0.0%) |
| Information | 0 (0.0%) | 5 (100.0%) |
| Finance & Insurance | 5 (55.6%) | 4 (44.4%) |
| Real Estate, Rental & Leasing | 1 (100.0%) | 0 (0.0%) |
| Professional & Scientific | 0 (0.0%) | 5 (100.0%) |
| Enterprise Management | 0 (0.0%) | 0 (0.0%) |
| Administrative & Support | 12 (54.5%) | 10 (45.5%) |
| Educational Services | 7 (17.5%) | 33 (82.5%) |
| Health Care & Social Assistance | 6 (7.2%) | 77 (92.8%) |
| Arts, Entertainment & Recreation | 3 (100.0%) | 0 (0.0%) |
| Accommodation & Food Services | 26 (35.6%) | 47 (64.4%) |
| Public Administration | 7 (41.2%) | 10 (58.8%) |
| Total | 347 (53.6%) | 300 (46.4%) |
Education in Homer
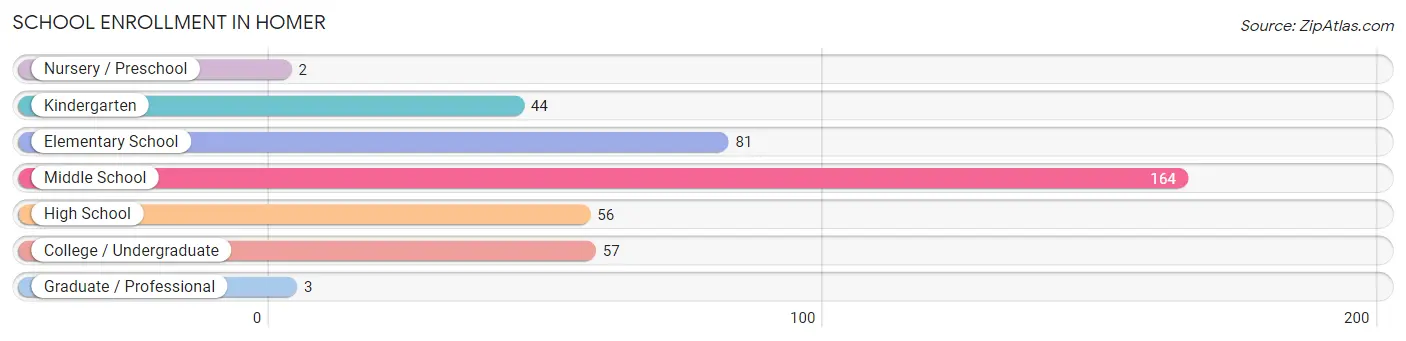
School Enrollment in Homer
The most common levels of schooling among the 407 students in Homer are middle school (164 | 40.3%), elementary school (81 | 19.9%), and college / undergraduate (57 | 14.0%).
| School Level | # Students | % Students |
| Nursery / Preschool | 2 | 0.5% |
| Kindergarten | 44 | 10.8% |
| Elementary School | 81 | 19.9% |
| Middle School | 164 | 40.3% |
| High School | 56 | 13.8% |
| College / Undergraduate | 57 | 14.0% |
| Graduate / Professional | 3 | 0.7% |
| Total | 407 | 100.0% |
School Enrollment by Age by Funding Source in Homer
Out of a total of 407 students who are enrolled in schools in Homer, 35 (8.6%) attend a private institution, while the remaining 372 (91.4%) are enrolled in public schools. The age group of 3 to 4 year olds has the highest likelihood of being enrolled in private schools, with 2 (66.7% in the age bracket) enrolled. Conversely, the age group of 25 to 34 year olds has the lowest likelihood of being enrolled in a private school, with 4 (100.0% in the age bracket) attending a public institution.
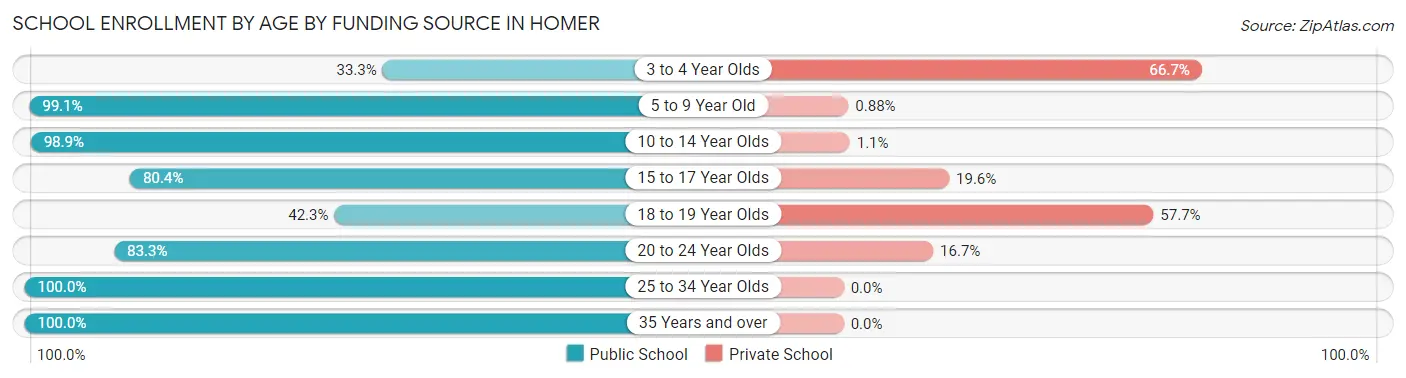
| Age Bracket | Public School | Private School |
| 3 to 4 Year Olds | 1 (33.3%) | 2 (66.7%) |
| 5 to 9 Year Old | 112 (99.1%) | 1 (0.9%) |
| 10 to 14 Year Olds | 173 (98.9%) | 2 (1.1%) |
| 15 to 17 Year Olds | 45 (80.4%) | 11 (19.6%) |
| 18 to 19 Year Olds | 11 (42.3%) | 15 (57.7%) |
| 20 to 24 Year Olds | 20 (83.3%) | 4 (16.7%) |
| 25 to 34 Year Olds | 4 (100.0%) | 0 (0.0%) |
| 35 Years and over | 6 (100.0%) | 0 (0.0%) |
| Total | 372 (91.4%) | 35 (8.6%) |
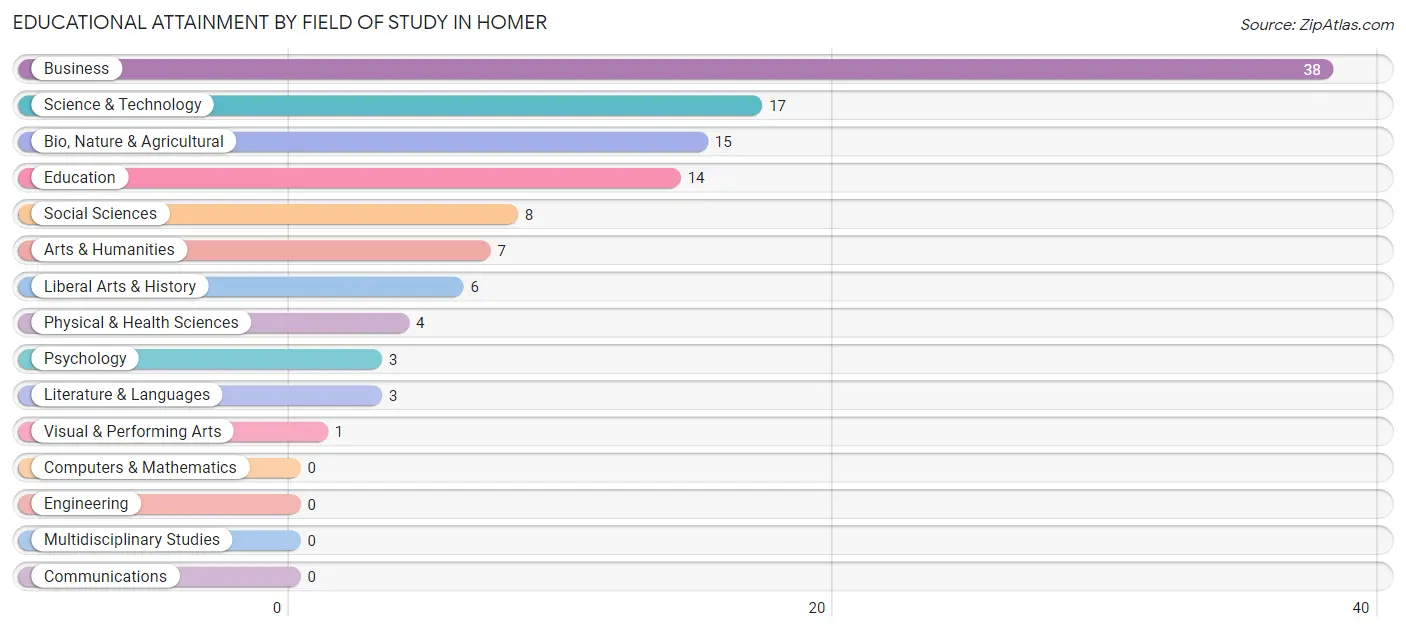
Educational Attainment by Field of Study in Homer
Business (38 | 32.8%), science & technology (17 | 14.7%), bio, nature & agricultural (15 | 12.9%), education (14 | 12.1%), and social sciences (8 | 6.9%) are the most common fields of study among 116 individuals in Homer who have obtained a bachelor's degree or higher.
| Field of Study | # Graduates | % Graduates |
| Computers & Mathematics | 0 | 0.0% |
| Bio, Nature & Agricultural | 15 | 12.9% |
| Physical & Health Sciences | 4 | 3.5% |
| Psychology | 3 | 2.6% |
| Social Sciences | 8 | 6.9% |
| Engineering | 0 | 0.0% |
| Multidisciplinary Studies | 0 | 0.0% |
| Science & Technology | 17 | 14.7% |
| Business | 38 | 32.8% |
| Education | 14 | 12.1% |
| Literature & Languages | 3 | 2.6% |
| Liberal Arts & History | 6 | 5.2% |
| Visual & Performing Arts | 1 | 0.9% |
| Communications | 0 | 0.0% |
| Arts & Humanities | 7 | 6.0% |
| Total | 116 | 100.0% |
Transportation & Commute in Homer
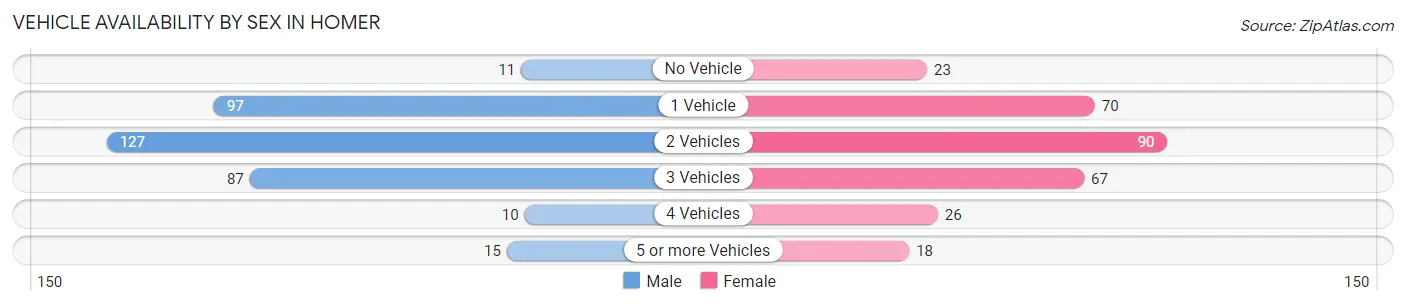
Vehicle Availability by Sex in Homer
The most prevalent vehicle ownership categories in Homer are males with 2 vehicles (127, accounting for 36.6%) and females with 2 vehicles (90, making up 43.2%).
| Vehicles Available | Male | Female |
| No Vehicle | 11 (3.2%) | 23 (7.8%) |
| 1 Vehicle | 97 (28.0%) | 70 (23.8%) |
| 2 Vehicles | 127 (36.6%) | 90 (30.6%) |
| 3 Vehicles | 87 (25.1%) | 67 (22.8%) |
| 4 Vehicles | 10 (2.9%) | 26 (8.8%) |
| 5 or more Vehicles | 15 (4.3%) | 18 (6.1%) |
| Total | 347 (100.0%) | 294 (100.0%) |
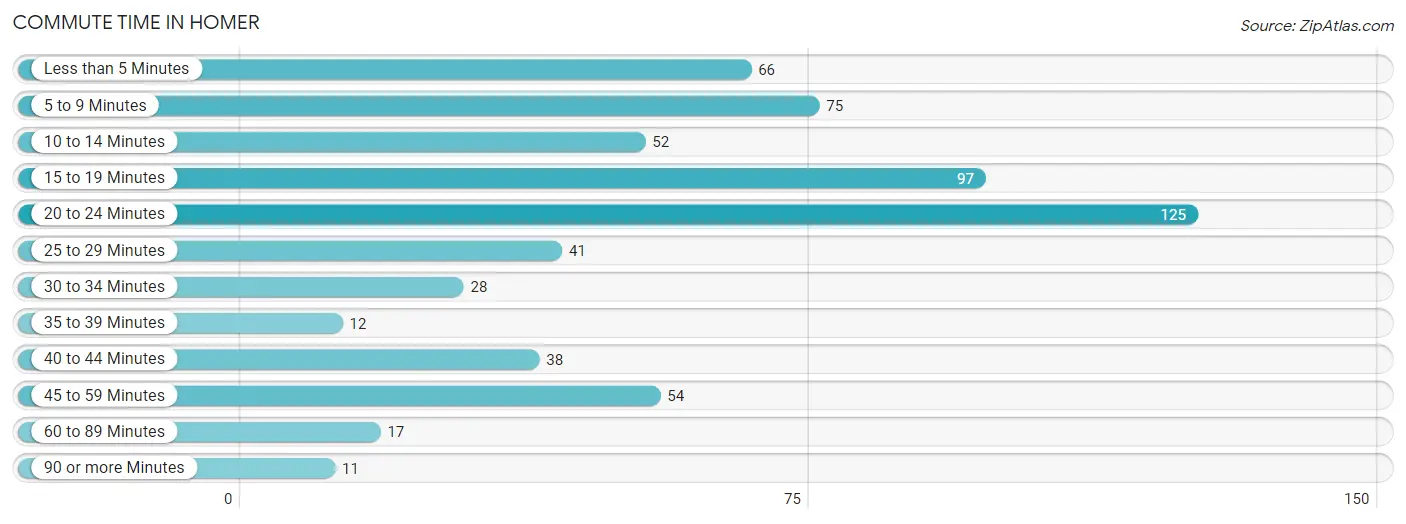
Commute Time in Homer
The most frequently occuring commute durations in Homer are 20 to 24 minutes (125 commuters, 20.3%), 15 to 19 minutes (97 commuters, 15.8%), and 5 to 9 minutes (75 commuters, 12.2%).
| Commute Time | # Commuters | % Commuters |
| Less than 5 Minutes | 66 | 10.7% |
| 5 to 9 Minutes | 75 | 12.2% |
| 10 to 14 Minutes | 52 | 8.4% |
| 15 to 19 Minutes | 97 | 15.8% |
| 20 to 24 Minutes | 125 | 20.3% |
| 25 to 29 Minutes | 41 | 6.7% |
| 30 to 34 Minutes | 28 | 4.5% |
| 35 to 39 Minutes | 12 | 1.9% |
| 40 to 44 Minutes | 38 | 6.2% |
| 45 to 59 Minutes | 54 | 8.8% |
| 60 to 89 Minutes | 17 | 2.8% |
| 90 or more Minutes | 11 | 1.8% |
Commute Time by Sex in Homer
The most common commute times in Homer are 20 to 24 minutes (63 commuters, 18.5%) for males and 20 to 24 minutes (62 commuters, 22.5%) for females.
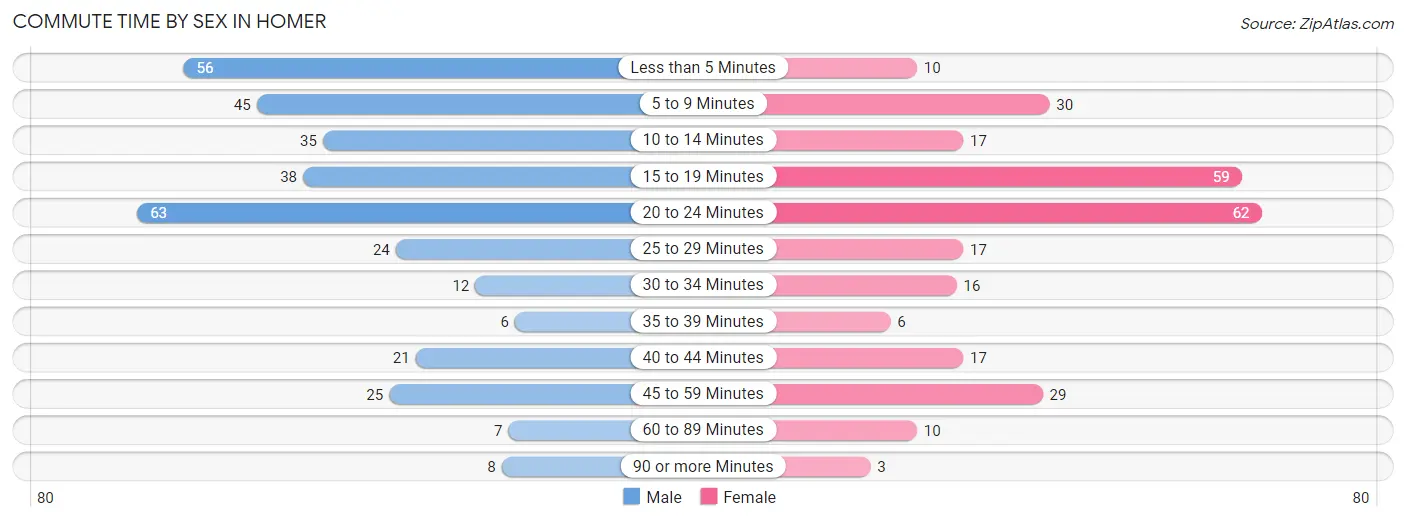
| Commute Time | Male | Female |
| Less than 5 Minutes | 56 (16.5%) | 10 (3.6%) |
| 5 to 9 Minutes | 45 (13.2%) | 30 (10.9%) |
| 10 to 14 Minutes | 35 (10.3%) | 17 (6.2%) |
| 15 to 19 Minutes | 38 (11.2%) | 59 (21.4%) |
| 20 to 24 Minutes | 63 (18.5%) | 62 (22.5%) |
| 25 to 29 Minutes | 24 (7.1%) | 17 (6.2%) |
| 30 to 34 Minutes | 12 (3.5%) | 16 (5.8%) |
| 35 to 39 Minutes | 6 (1.8%) | 6 (2.2%) |
| 40 to 44 Minutes | 21 (6.2%) | 17 (6.2%) |
| 45 to 59 Minutes | 25 (7.3%) | 29 (10.5%) |
| 60 to 89 Minutes | 7 (2.1%) | 10 (3.6%) |
| 90 or more Minutes | 8 (2.4%) | 3 (1.1%) |
Time of Departure to Work by Sex in Homer
The most frequent times of departure to work in Homer are 12:00 AM to 4:59 AM (91, 26.8%) for males and 7:30 AM to 7:59 AM (74, 26.8%) for females.
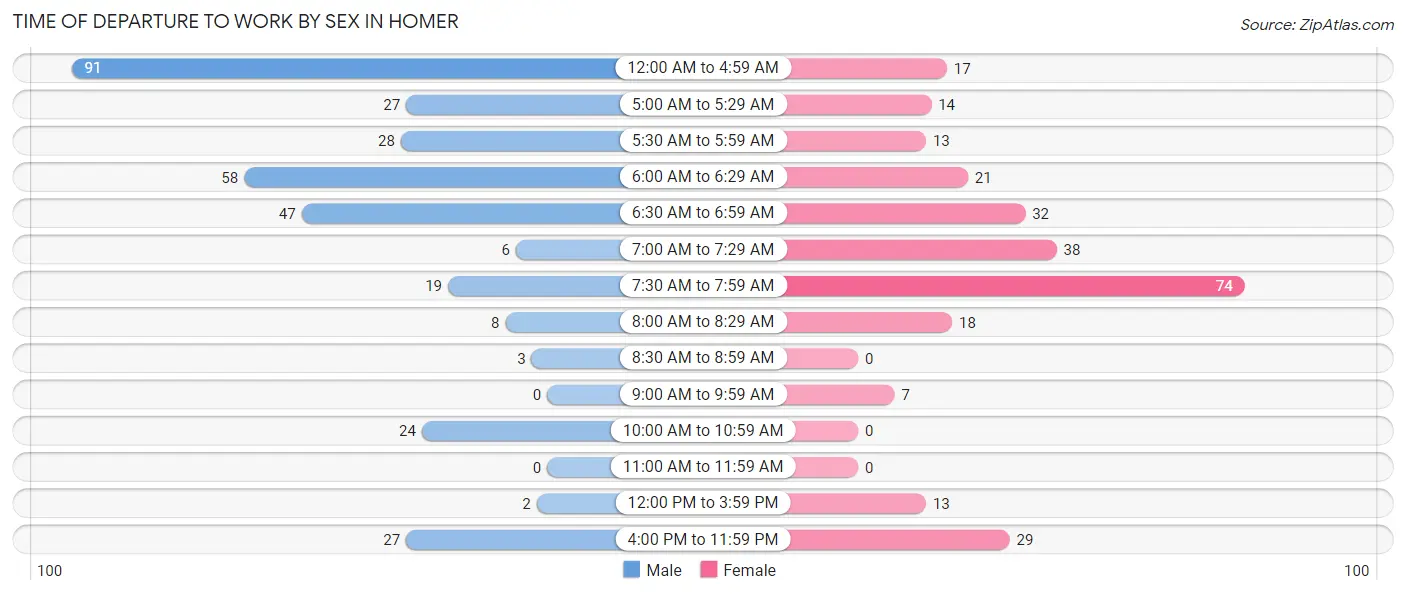
| Time of Departure | Male | Female |
| 12:00 AM to 4:59 AM | 91 (26.8%) | 17 (6.2%) |
| 5:00 AM to 5:29 AM | 27 (7.9%) | 14 (5.1%) |
| 5:30 AM to 5:59 AM | 28 (8.2%) | 13 (4.7%) |
| 6:00 AM to 6:29 AM | 58 (17.1%) | 21 (7.6%) |
| 6:30 AM to 6:59 AM | 47 (13.8%) | 32 (11.6%) |
| 7:00 AM to 7:29 AM | 6 (1.8%) | 38 (13.8%) |
| 7:30 AM to 7:59 AM | 19 (5.6%) | 74 (26.8%) |
| 8:00 AM to 8:29 AM | 8 (2.4%) | 18 (6.5%) |
| 8:30 AM to 8:59 AM | 3 (0.9%) | 0 (0.0%) |
| 9:00 AM to 9:59 AM | 0 (0.0%) | 7 (2.5%) |
| 10:00 AM to 10:59 AM | 24 (7.1%) | 0 (0.0%) |
| 11:00 AM to 11:59 AM | 0 (0.0%) | 0 (0.0%) |
| 12:00 PM to 3:59 PM | 2 (0.6%) | 13 (4.7%) |
| 4:00 PM to 11:59 PM | 27 (7.9%) | 29 (10.5%) |
| Total | 340 (100.0%) | 276 (100.0%) |
Housing Occupancy in Homer
Occupancy by Ownership in Homer
Of the total 581 dwellings in Homer, owner-occupied units account for 360 (62.0%), while renter-occupied units make up 221 (38.0%).
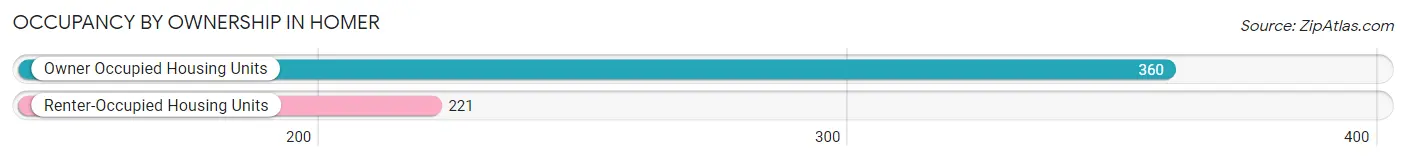
| Occupancy | # Housing Units | % Housing Units |
| Owner Occupied Housing Units | 360 | 62.0% |
| Renter-Occupied Housing Units | 221 | 38.0% |
| Total Occupied Housing Units | 581 | 100.0% |
Occupancy by Household Size in Homer
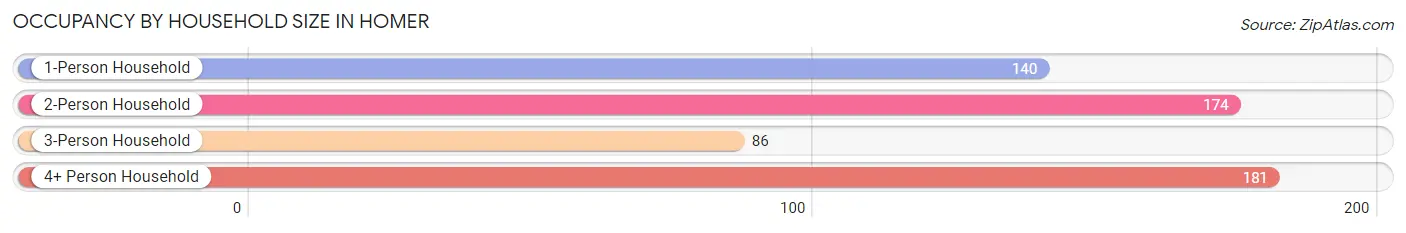
| Household Size | # Housing Units | % Housing Units |
| 1-Person Household | 140 | 24.1% |
| 2-Person Household | 174 | 29.9% |
| 3-Person Household | 86 | 14.8% |
| 4+ Person Household | 181 | 31.1% |
| Total Housing Units | 581 | 100.0% |
Occupancy by Ownership by Household Size in Homer
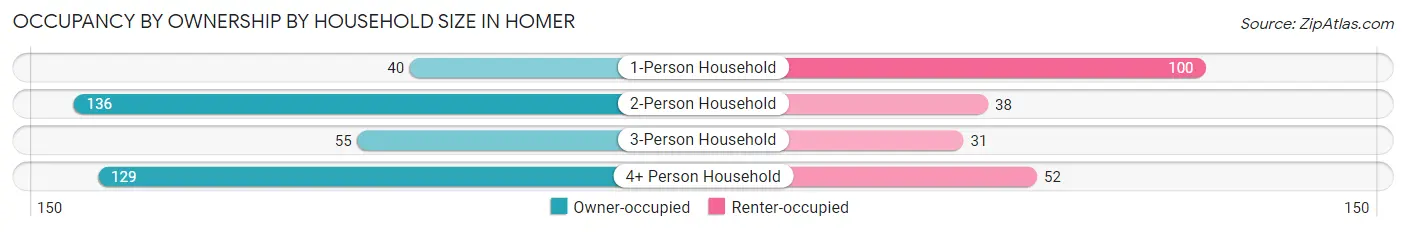
| Household Size | Owner-occupied | Renter-occupied |
| 1-Person Household | 40 (28.6%) | 100 (71.4%) |
| 2-Person Household | 136 (78.2%) | 38 (21.8%) |
| 3-Person Household | 55 (63.9%) | 31 (36.0%) |
| 4+ Person Household | 129 (71.3%) | 52 (28.7%) |
| Total Housing Units | 360 (62.0%) | 221 (38.0%) |
Occupancy by Educational Attainment in Homer
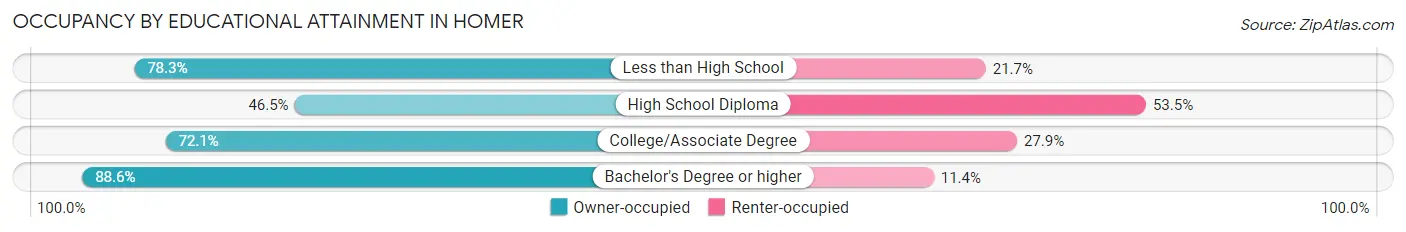
| Household Size | Owner-occupied | Renter-occupied |
| Less than High School | 36 (78.3%) | 10 (21.7%) |
| High School Diploma | 133 (46.5%) | 153 (53.5%) |
| College/Associate Degree | 129 (72.1%) | 50 (27.9%) |
| Bachelor's Degree or higher | 62 (88.6%) | 8 (11.4%) |
Occupancy by Age of Householder in Homer
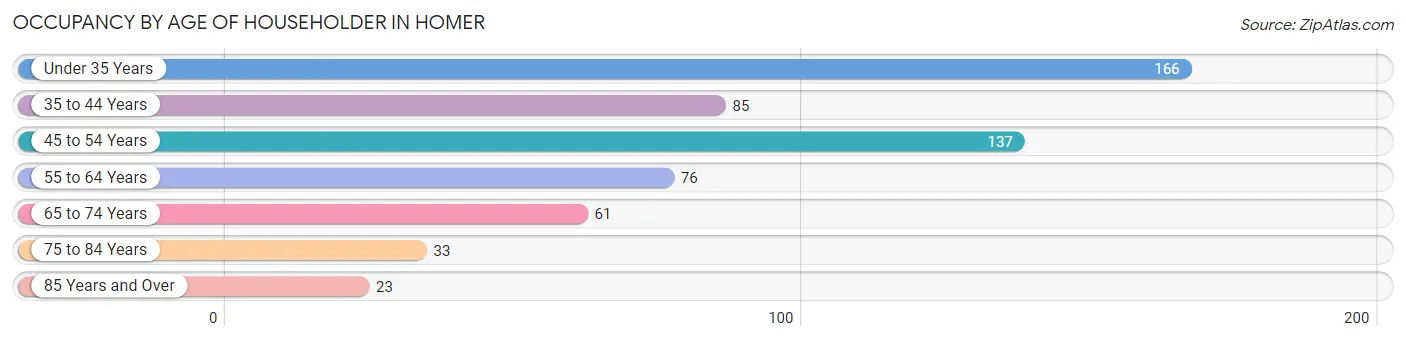
| Age Bracket | # Households | % Households |
| Under 35 Years | 166 | 28.6% |
| 35 to 44 Years | 85 | 14.6% |
| 45 to 54 Years | 137 | 23.6% |
| 55 to 64 Years | 76 | 13.1% |
| 65 to 74 Years | 61 | 10.5% |
| 75 to 84 Years | 33 | 5.7% |
| 85 Years and Over | 23 | 4.0% |
| Total | 581 | 100.0% |
Housing Finances in Homer
Median Income by Occupancy in Homer
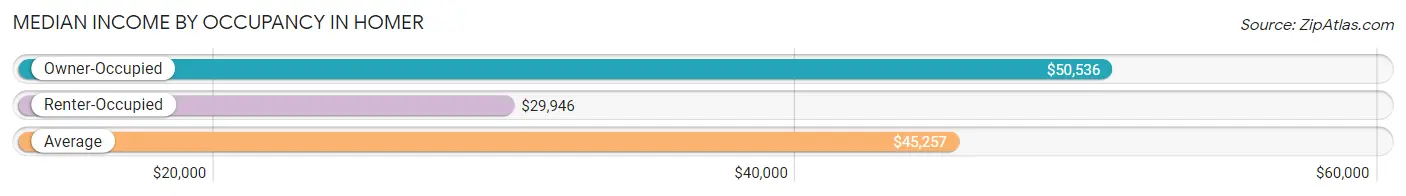
| Occupancy Type | # Households | Median Income |
| Owner-Occupied | 360 (62.0%) | $50,536 |
| Renter-Occupied | 221 (38.0%) | $29,946 |
| Average | 581 (100.0%) | $45,257 |
Occupancy by Householder Income Bracket in Homer
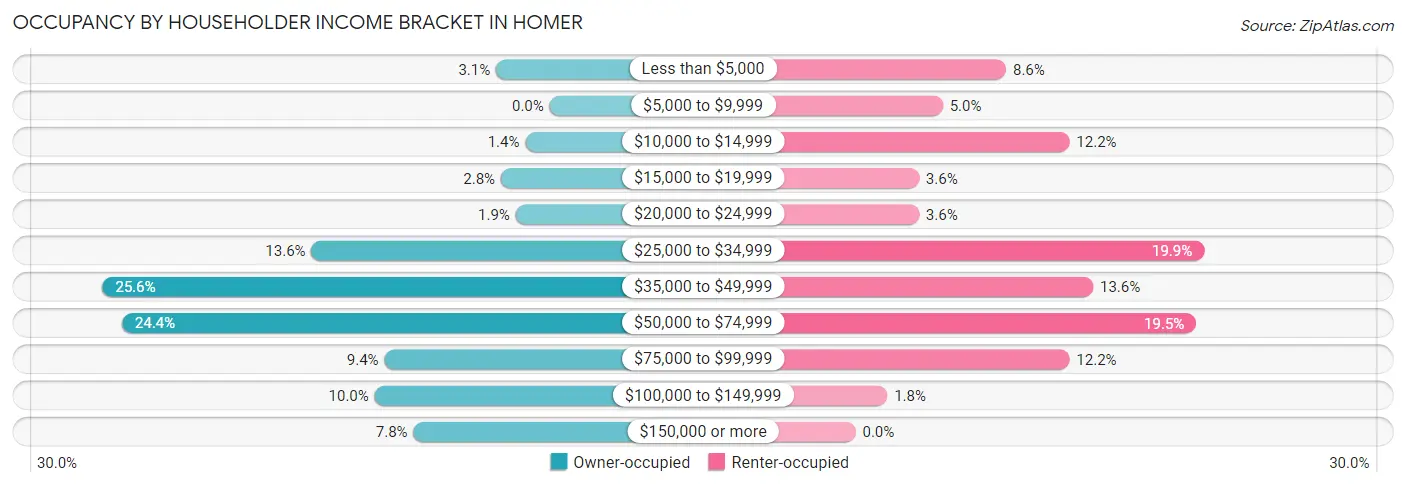
| Income Bracket | Owner-occupied | Renter-occupied |
| Less than $5,000 | 11 (3.1%) | 19 (8.6%) |
| $5,000 to $9,999 | 0 (0.0%) | 11 (5.0%) |
| $10,000 to $14,999 | 5 (1.4%) | 27 (12.2%) |
| $15,000 to $19,999 | 10 (2.8%) | 8 (3.6%) |
| $20,000 to $24,999 | 7 (1.9%) | 8 (3.6%) |
| $25,000 to $34,999 | 49 (13.6%) | 44 (19.9%) |
| $35,000 to $49,999 | 92 (25.6%) | 30 (13.6%) |
| $50,000 to $74,999 | 88 (24.4%) | 43 (19.5%) |
| $75,000 to $99,999 | 34 (9.4%) | 27 (12.2%) |
| $100,000 to $149,999 | 36 (10.0%) | 4 (1.8%) |
| $150,000 or more | 28 (7.8%) | 0 (0.0%) |
| Total | 360 (100.0%) | 221 (100.0%) |
Monthly Housing Cost Tiers in Homer
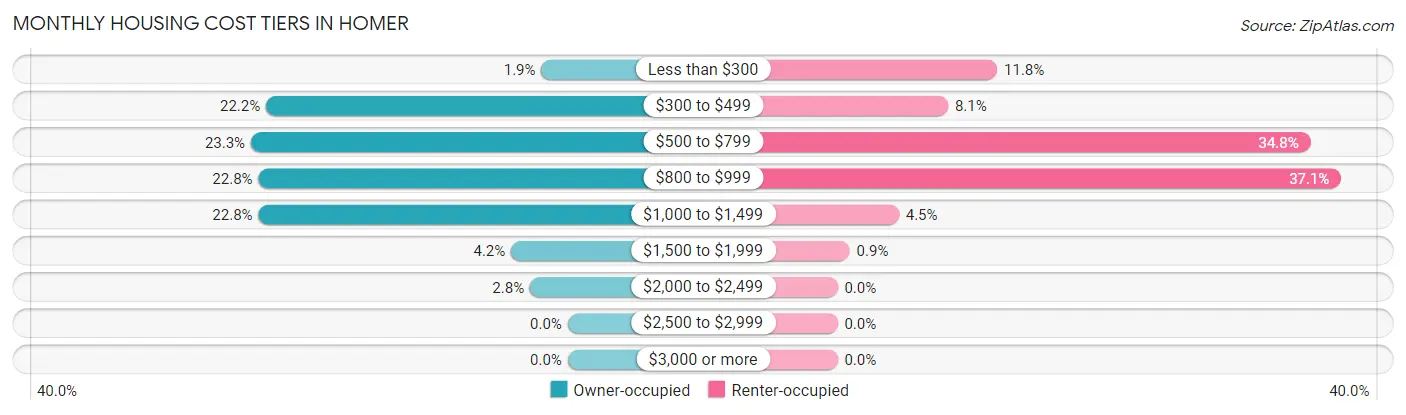
| Monthly Cost | Owner-occupied | Renter-occupied |
| Less than $300 | 7 (1.9%) | 26 (11.8%) |
| $300 to $499 | 80 (22.2%) | 18 (8.1%) |
| $500 to $799 | 84 (23.3%) | 77 (34.8%) |
| $800 to $999 | 82 (22.8%) | 82 (37.1%) |
| $1,000 to $1,499 | 82 (22.8%) | 10 (4.5%) |
| $1,500 to $1,999 | 15 (4.2%) | 2 (0.9%) |
| $2,000 to $2,499 | 10 (2.8%) | 0 (0.0%) |
| $2,500 to $2,999 | 0 (0.0%) | 0 (0.0%) |
| $3,000 or more | 0 (0.0%) | 0 (0.0%) |
| Total | 360 (100.0%) | 221 (100.0%) |
Physical Housing Characteristics in Homer
Housing Structures in Homer
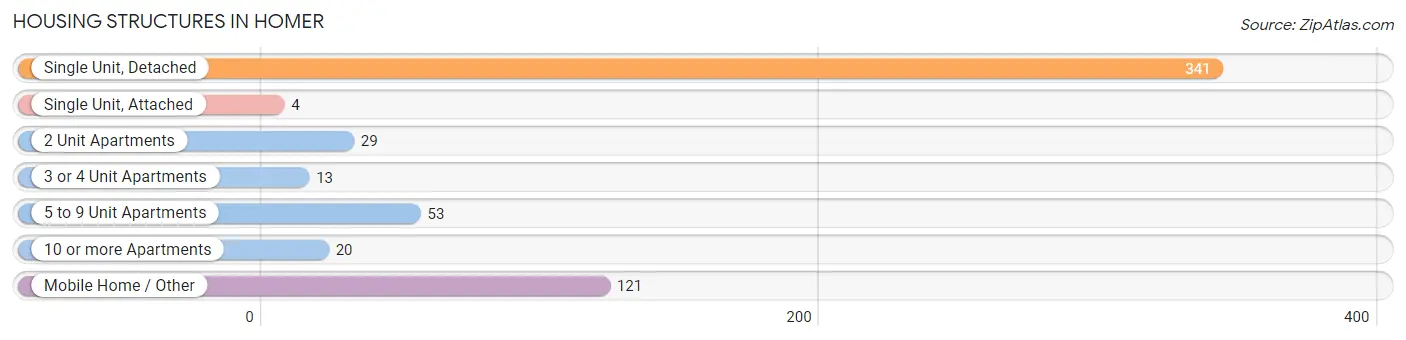
| Structure Type | # Housing Units | % Housing Units |
| Single Unit, Detached | 341 | 58.7% |
| Single Unit, Attached | 4 | 0.7% |
| 2 Unit Apartments | 29 | 5.0% |
| 3 or 4 Unit Apartments | 13 | 2.2% |
| 5 to 9 Unit Apartments | 53 | 9.1% |
| 10 or more Apartments | 20 | 3.4% |
| Mobile Home / Other | 121 | 20.8% |
| Total | 581 | 100.0% |
Housing Structures by Occupancy in Homer
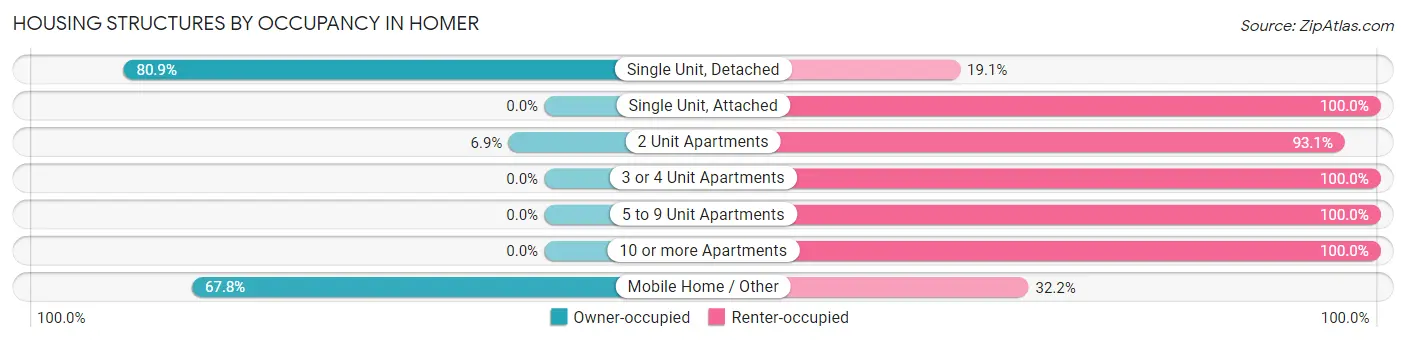
| Structure Type | Owner-occupied | Renter-occupied |
| Single Unit, Detached | 276 (80.9%) | 65 (19.1%) |
| Single Unit, Attached | 0 (0.0%) | 4 (100.0%) |
| 2 Unit Apartments | 2 (6.9%) | 27 (93.1%) |
| 3 or 4 Unit Apartments | 0 (0.0%) | 13 (100.0%) |
| 5 to 9 Unit Apartments | 0 (0.0%) | 53 (100.0%) |
| 10 or more Apartments | 0 (0.0%) | 20 (100.0%) |
| Mobile Home / Other | 82 (67.8%) | 39 (32.2%) |
| Total | 360 (62.0%) | 221 (38.0%) |
Housing Structures by Number of Rooms in Homer
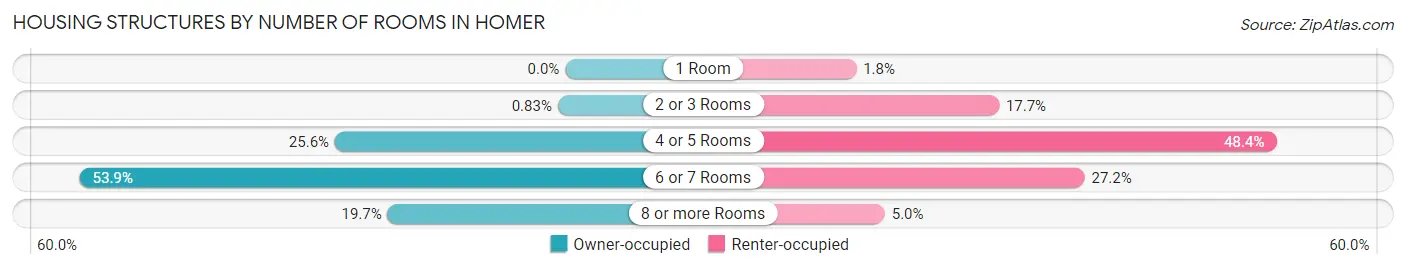
| Number of Rooms | Owner-occupied | Renter-occupied |
| 1 Room | 0 (0.0%) | 4 (1.8%) |
| 2 or 3 Rooms | 3 (0.8%) | 39 (17.6%) |
| 4 or 5 Rooms | 92 (25.6%) | 107 (48.4%) |
| 6 or 7 Rooms | 194 (53.9%) | 60 (27.2%) |
| 8 or more Rooms | 71 (19.7%) | 11 (5.0%) |
| Total | 360 (100.0%) | 221 (100.0%) |
Housing Structure by Heating Type in Homer
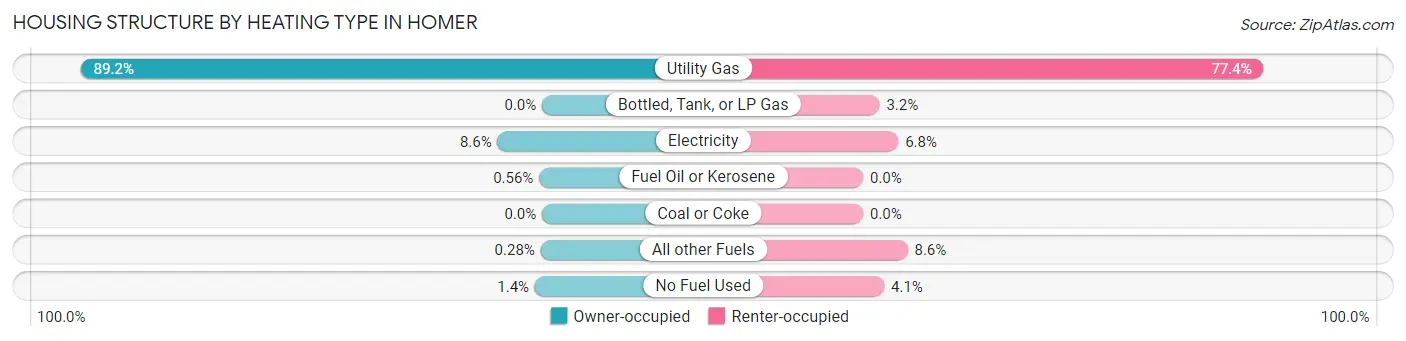
| Heating Type | Owner-occupied | Renter-occupied |
| Utility Gas | 321 (89.2%) | 171 (77.4%) |
| Bottled, Tank, or LP Gas | 0 (0.0%) | 7 (3.2%) |
| Electricity | 31 (8.6%) | 15 (6.8%) |
| Fuel Oil or Kerosene | 2 (0.6%) | 0 (0.0%) |
| Coal or Coke | 0 (0.0%) | 0 (0.0%) |
| All other Fuels | 1 (0.3%) | 19 (8.6%) |
| No Fuel Used | 5 (1.4%) | 9 (4.1%) |
| Total | 360 (100.0%) | 221 (100.0%) |
Household Vehicle Usage in Homer
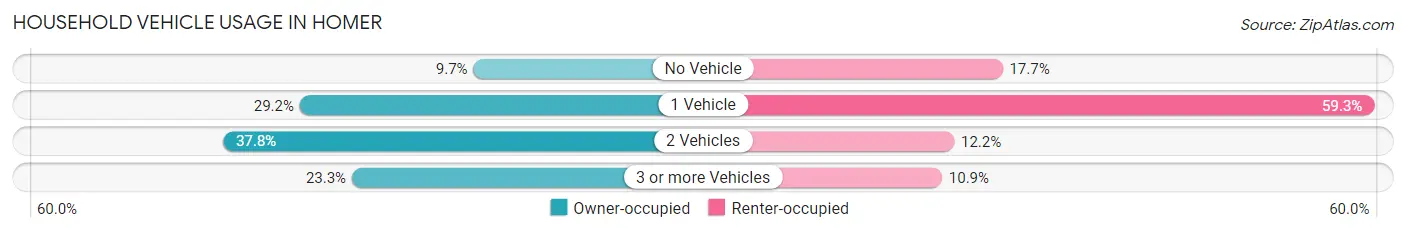
| Vehicles per Household | Owner-occupied | Renter-occupied |
| No Vehicle | 35 (9.7%) | 39 (17.6%) |
| 1 Vehicle | 105 (29.2%) | 131 (59.3%) |
| 2 Vehicles | 136 (37.8%) | 27 (12.2%) |
| 3 or more Vehicles | 84 (23.3%) | 24 (10.9%) |
| Total | 360 (100.0%) | 221 (100.0%) |
Real Estate & Mortgages in Homer
Real Estate and Mortgage Overview in Homer
| Characteristic | Without Mortgage | With Mortgage |
| Housing Units | 173 | 187 |
| Median Property Value | $94,600 | $125,300 |
| Median Household Income | $39,539 | $22 |
| Monthly Housing Costs | $514 | $0 |
| Real Estate Taxes | $1,250 | $6 |
Property Value by Mortgage Status in Homer
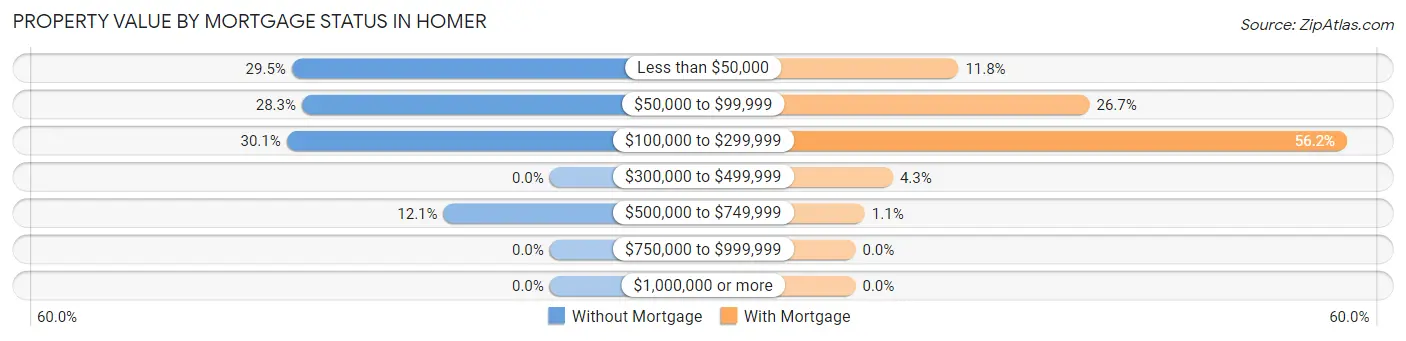
| Property Value | Without Mortgage | With Mortgage |
| Less than $50,000 | 51 (29.5%) | 22 (11.8%) |
| $50,000 to $99,999 | 49 (28.3%) | 50 (26.7%) |
| $100,000 to $299,999 | 52 (30.1%) | 105 (56.1%) |
| $300,000 to $499,999 | 0 (0.0%) | 8 (4.3%) |
| $500,000 to $749,999 | 21 (12.1%) | 2 (1.1%) |
| $750,000 to $999,999 | 0 (0.0%) | 0 (0.0%) |
| $1,000,000 or more | 0 (0.0%) | 0 (0.0%) |
| Total | 173 (100.0%) | 187 (100.0%) |
Household Income by Mortgage Status in Homer
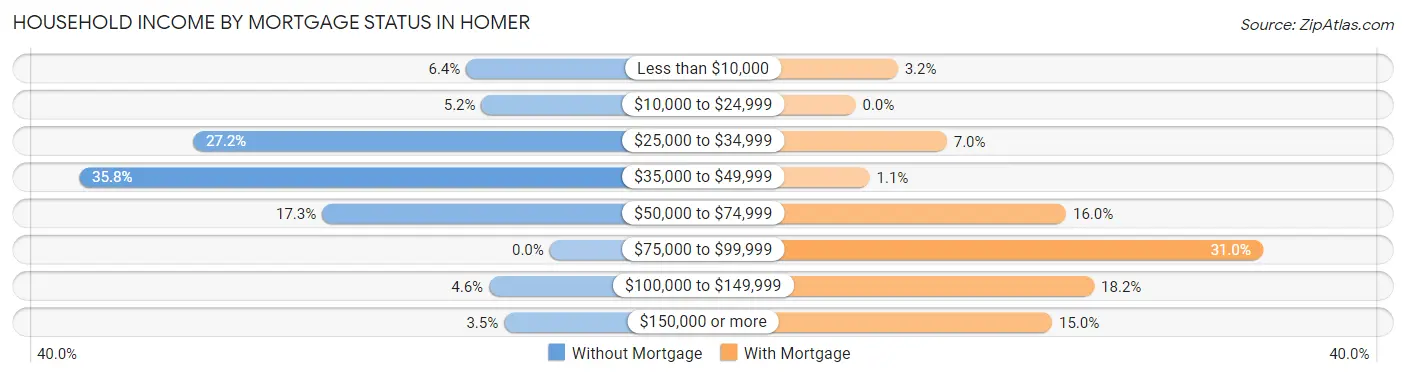
| Household Income | Without Mortgage | With Mortgage |
| Less than $10,000 | 11 (6.4%) | 6 (3.2%) |
| $10,000 to $24,999 | 9 (5.2%) | 0 (0.0%) |
| $25,000 to $34,999 | 47 (27.2%) | 13 (7.0%) |
| $35,000 to $49,999 | 62 (35.8%) | 2 (1.1%) |
| $50,000 to $74,999 | 30 (17.3%) | 30 (16.0%) |
| $75,000 to $99,999 | 0 (0.0%) | 58 (31.0%) |
| $100,000 to $149,999 | 8 (4.6%) | 34 (18.2%) |
| $150,000 or more | 6 (3.5%) | 28 (15.0%) |
| Total | 173 (100.0%) | 187 (100.0%) |
Property Value to Household Income Ratio in Homer
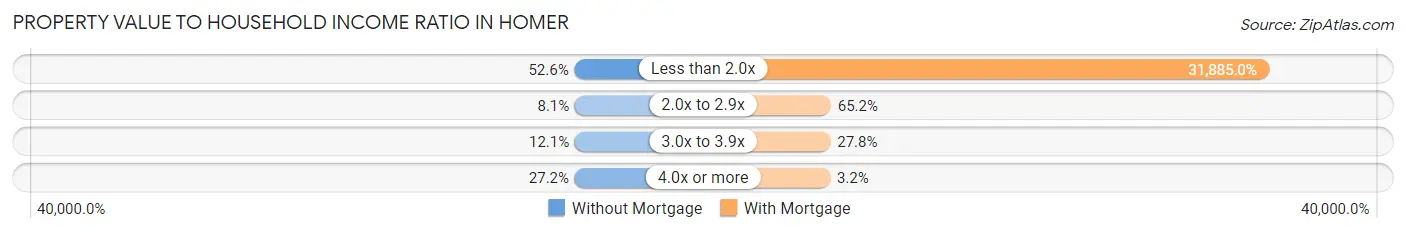
| Value-to-Income Ratio | Without Mortgage | With Mortgage |
| Less than 2.0x | 91 (52.6%) | 59,625 (31,885.0%) |
| 2.0x to 2.9x | 14 (8.1%) | 122 (65.2%) |
| 3.0x to 3.9x | 21 (12.1%) | 52 (27.8%) |
| 4.0x or more | 47 (27.2%) | 6 (3.2%) |
| Total | 173 (100.0%) | 187 (100.0%) |
Real Estate Taxes by Mortgage Status in Homer
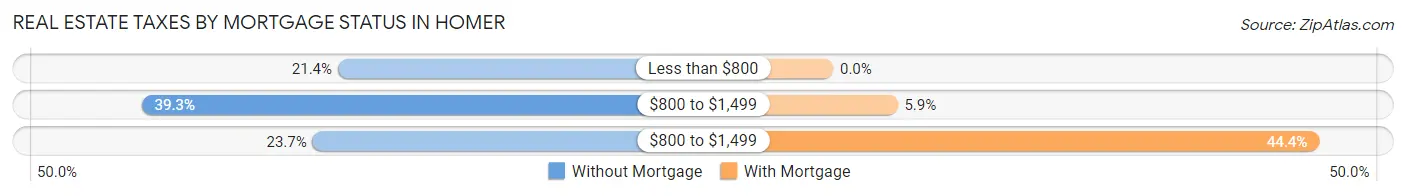
| Property Taxes | Without Mortgage | With Mortgage |
| Less than $800 | 37 (21.4%) | 0 (0.0%) |
| $800 to $1,499 | 68 (39.3%) | 11 (5.9%) |
| $800 to $1,499 | 41 (23.7%) | 83 (44.4%) |
| Total | 173 (100.0%) | 187 (100.0%) |
Health & Disability in Homer
Health Insurance Coverage by Age in Homer
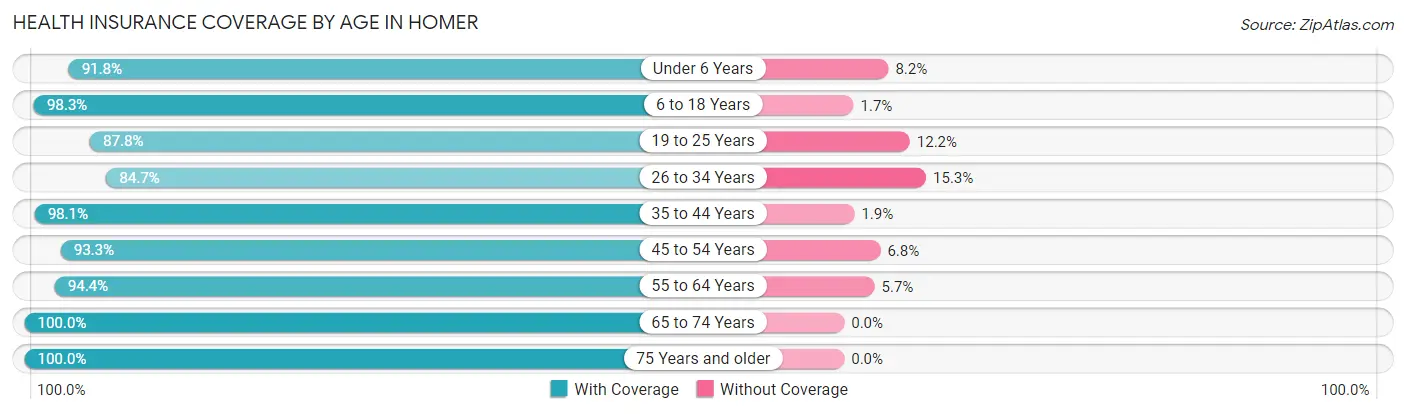
| Age Bracket | With Coverage | Without Coverage |
| Under 6 Years | 167 (91.8%) | 15 (8.2%) |
| 6 to 18 Years | 395 (98.3%) | 7 (1.7%) |
| 19 to 25 Years | 165 (87.8%) | 23 (12.2%) |
| 26 to 34 Years | 161 (84.7%) | 29 (15.3%) |
| 35 to 44 Years | 155 (98.1%) | 3 (1.9%) |
| 45 to 54 Years | 221 (93.2%) | 16 (6.8%) |
| 55 to 64 Years | 117 (94.4%) | 7 (5.7%) |
| 65 to 74 Years | 107 (100.0%) | 0 (0.0%) |
| 75 Years and older | 75 (100.0%) | 0 (0.0%) |
| Total | 1,563 (94.0%) | 100 (6.0%) |
Health Insurance Coverage by Citizenship Status in Homer
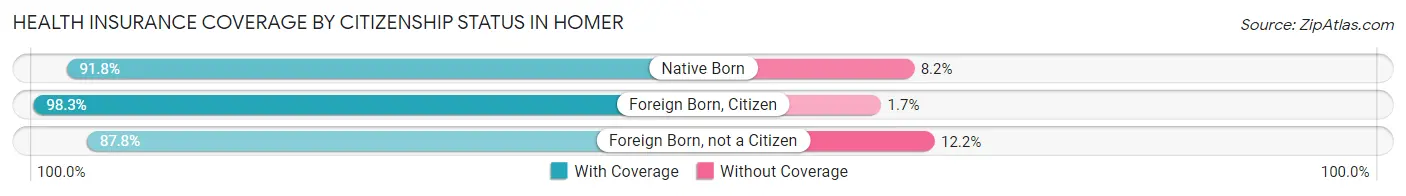
| Citizenship Status | With Coverage | Without Coverage |
| Native Born | 167 (91.8%) | 15 (8.2%) |
| Foreign Born, Citizen | 395 (98.3%) | 7 (1.7%) |
| Foreign Born, not a Citizen | 165 (87.8%) | 23 (12.2%) |
Health Insurance Coverage by Household Income in Homer
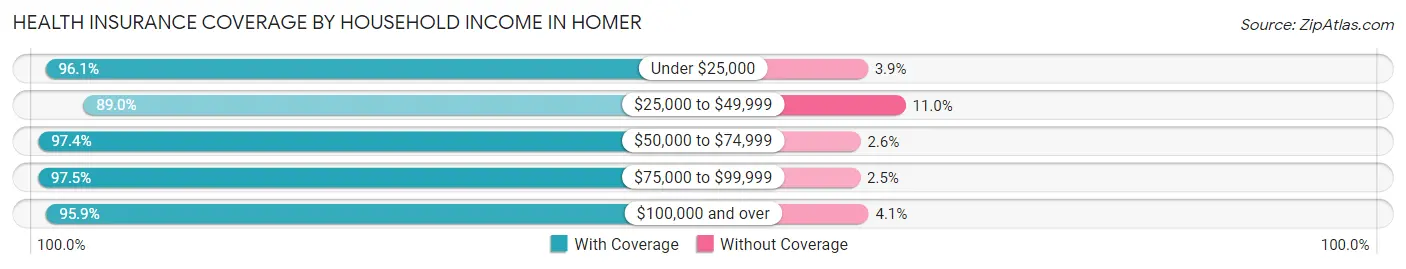
| Household Income | With Coverage | Without Coverage |
| Under $25,000 | 147 (96.1%) | 6 (3.9%) |
| $25,000 to $49,999 | 542 (89.0%) | 67 (11.0%) |
| $50,000 to $74,999 | 419 (97.4%) | 11 (2.6%) |
| $75,000 to $99,999 | 196 (97.5%) | 5 (2.5%) |
| $100,000 and over | 259 (95.9%) | 11 (4.1%) |
Public vs Private Health Insurance Coverage by Age in Homer
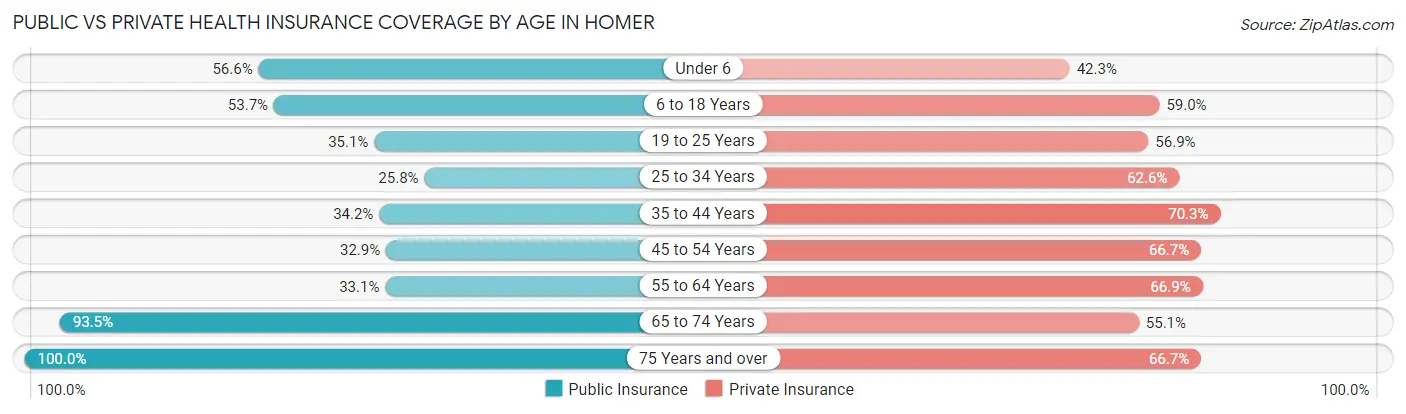
| Age Bracket | Public Insurance | Private Insurance |
| Under 6 | 103 (56.6%) | 77 (42.3%) |
| 6 to 18 Years | 216 (53.7%) | 237 (59.0%) |
| 19 to 25 Years | 66 (35.1%) | 107 (56.9%) |
| 25 to 34 Years | 49 (25.8%) | 119 (62.6%) |
| 35 to 44 Years | 54 (34.2%) | 111 (70.3%) |
| 45 to 54 Years | 78 (32.9%) | 158 (66.7%) |
| 55 to 64 Years | 41 (33.1%) | 83 (66.9%) |
| 65 to 74 Years | 100 (93.5%) | 59 (55.1%) |
| 75 Years and over | 75 (100.0%) | 50 (66.7%) |
| Total | 782 (47.0%) | 1,001 (60.2%) |
Disability Status by Sex by Age in Homer
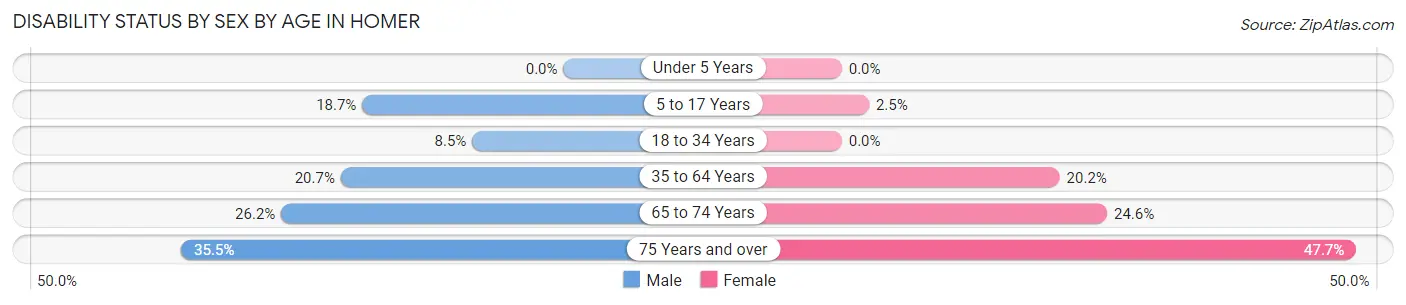
| Age Bracket | Male | Female |
| Under 5 Years | 0 (0.0%) | 0 (0.0%) |
| 5 to 17 Years | 31 (18.7%) | 6 (2.5%) |
| 18 to 34 Years | 17 (8.5%) | 0 (0.0%) |
| 35 to 64 Years | 50 (20.7%) | 56 (20.2%) |
| 65 to 74 Years | 11 (26.2%) | 16 (24.6%) |
| 75 Years and over | 11 (35.5%) | 21 (47.7%) |
Disability Class by Sex by Age in Homer
Disability Class: Hearing Difficulty
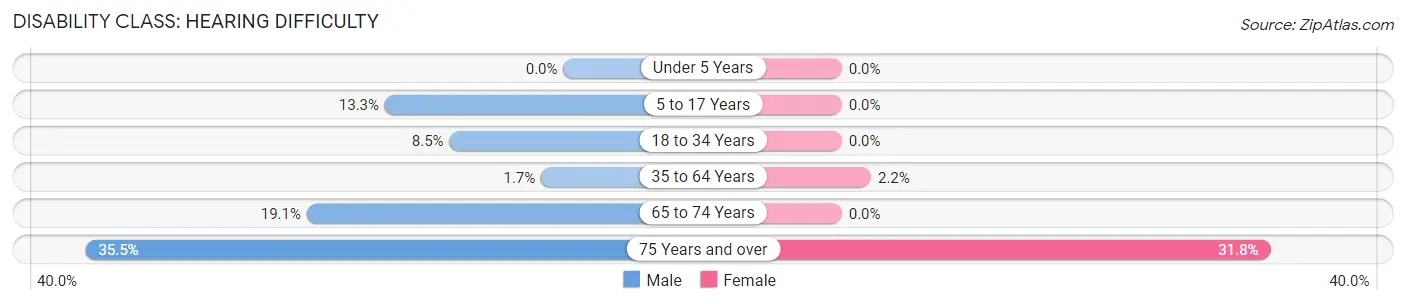
| Age Bracket | Male | Female |
| Under 5 Years | 0 (0.0%) | 0 (0.0%) |
| 5 to 17 Years | 22 (13.3%) | 0 (0.0%) |
| 18 to 34 Years | 17 (8.5%) | 0 (0.0%) |
| 35 to 64 Years | 4 (1.7%) | 6 (2.2%) |
| 65 to 74 Years | 8 (19.1%) | 0 (0.0%) |
| 75 Years and over | 11 (35.5%) | 14 (31.8%) |
Disability Class: Vision Difficulty
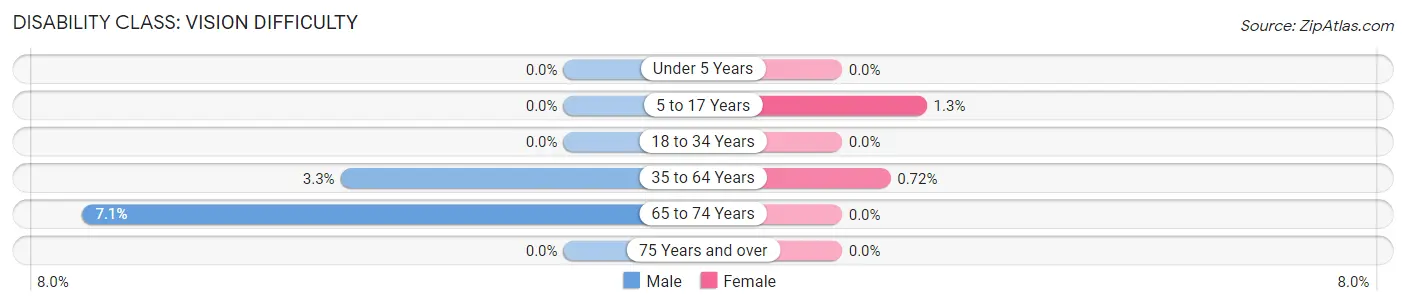
| Age Bracket | Male | Female |
| Under 5 Years | 0 (0.0%) | 0 (0.0%) |
| 5 to 17 Years | 0 (0.0%) | 3 (1.3%) |
| 18 to 34 Years | 0 (0.0%) | 0 (0.0%) |
| 35 to 64 Years | 8 (3.3%) | 2 (0.7%) |
| 65 to 74 Years | 3 (7.1%) | 0 (0.0%) |
| 75 Years and over | 0 (0.0%) | 0 (0.0%) |
Disability Class: Cognitive Difficulty
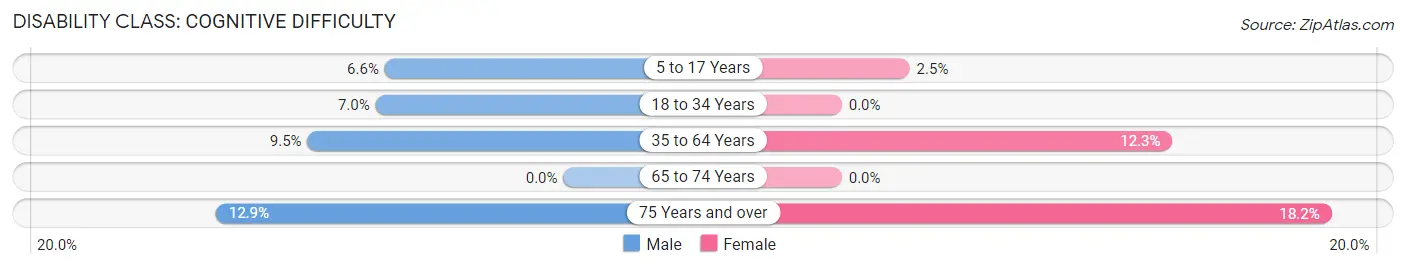
| Age Bracket | Male | Female |
| 5 to 17 Years | 11 (6.6%) | 6 (2.5%) |
| 18 to 34 Years | 14 (7.0%) | 0 (0.0%) |
| 35 to 64 Years | 23 (9.5%) | 34 (12.3%) |
| 65 to 74 Years | 0 (0.0%) | 0 (0.0%) |
| 75 Years and over | 4 (12.9%) | 8 (18.2%) |
Disability Class: Ambulatory Difficulty
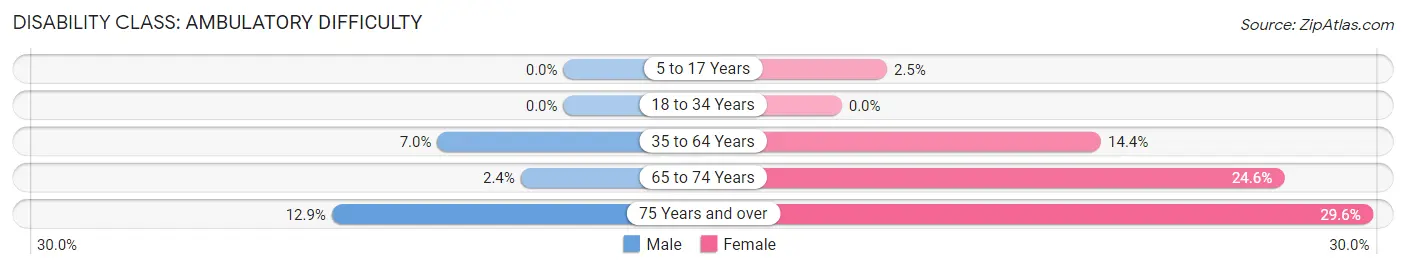
| Age Bracket | Male | Female |
| 5 to 17 Years | 0 (0.0%) | 6 (2.5%) |
| 18 to 34 Years | 0 (0.0%) | 0 (0.0%) |
| 35 to 64 Years | 17 (7.0%) | 40 (14.4%) |
| 65 to 74 Years | 1 (2.4%) | 16 (24.6%) |
| 75 Years and over | 4 (12.9%) | 13 (29.5%) |
Disability Class: Self-Care Difficulty
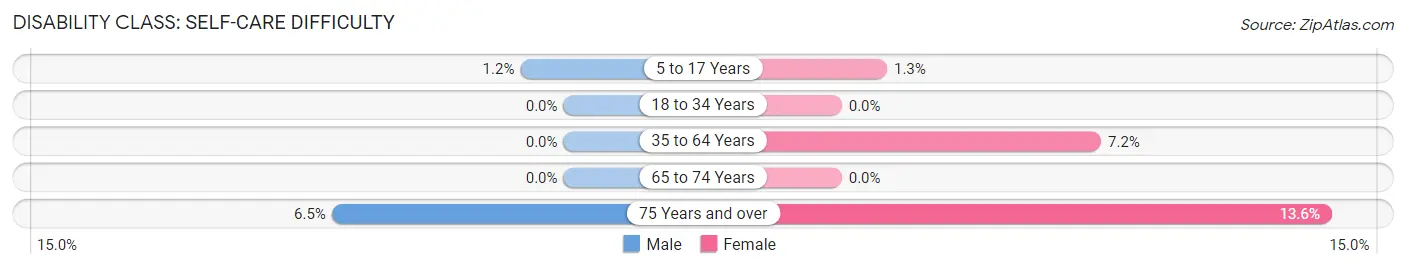
| Age Bracket | Male | Female |
| 5 to 17 Years | 2 (1.2%) | 3 (1.3%) |
| 18 to 34 Years | 0 (0.0%) | 0 (0.0%) |
| 35 to 64 Years | 0 (0.0%) | 20 (7.2%) |
| 65 to 74 Years | 0 (0.0%) | 0 (0.0%) |
| 75 Years and over | 2 (6.5%) | 6 (13.6%) |
Technology Access in Homer
Computing Device Access in Homer
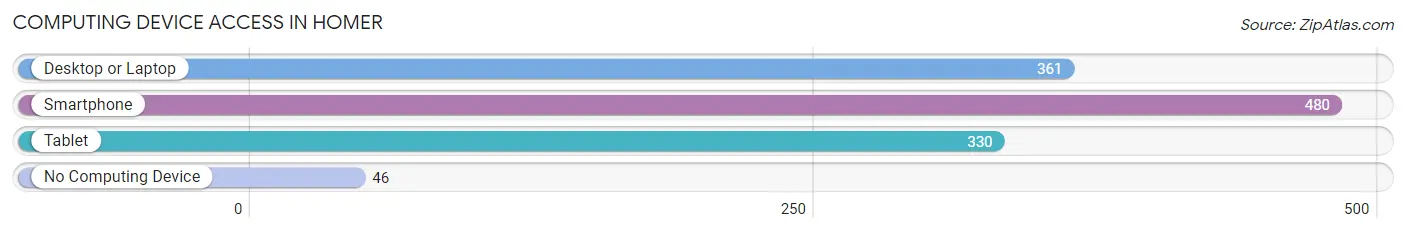
| Device Type | # Households | % Households |
| Desktop or Laptop | 361 | 62.1% |
| Smartphone | 480 | 82.6% |
| Tablet | 330 | 56.8% |
| No Computing Device | 46 | 7.9% |
| Total | 581 | 100.0% |
Internet Access in Homer
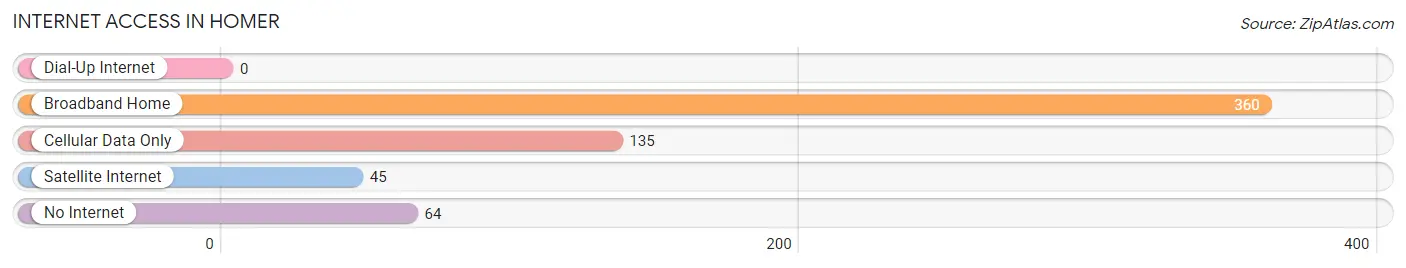
| Internet Type | # Households | % Households |
| Dial-Up Internet | 0 | 0.0% |
| Broadband Home | 360 | 62.0% |
| Cellular Data Only | 135 | 23.2% |
| Satellite Internet | 45 | 7.7% |
| No Internet | 64 | 11.0% |
| Total | 581 | 100.0% |
Homer Summary
Homer, Michigan is a small village located in Calhoun County, in the south-central region of the state. It is situated on the banks of the Kalamazoo River, approximately 10 miles east of Battle Creek. The village has a population of approximately 1,400 people, and is part of the Battle Creek Metropolitan Statistical Area.
History
Homer was first settled in 1831 by a group of settlers from New York. The village was named after Homer, New York, the hometown of the settlers. The village was incorporated in 1867, and the first post office was established in 1868.
In the late 19th century, Homer was a thriving agricultural community, with a variety of crops being grown in the area. The village was also home to several mills, including a grist mill, a saw mill, and a woolen mill.
In the early 20th century, the village began to experience a decline in population, as many of the residents moved away in search of better economic opportunities. The decline continued until the 1950s, when the village began to experience a resurgence in population.
Geography
Homer is located in Calhoun County, in the south-central region of Michigan. It is situated on the banks of the Kalamazoo River, approximately 10 miles east of Battle Creek. The village has a total area of 1.2 square miles, all of which is land.
The village is located in a rural area, with the nearest major city being Battle Creek, which is approximately 10 miles to the west. The nearest major highway is Interstate 94, which is approximately 15 miles to the north.
Economy
Homer’s economy is largely based on agriculture and tourism. The village is home to several farms, which produce a variety of crops, including corn, soybeans, wheat, and hay. The village is also home to several wineries, which produce a variety of wines.
The village is also home to several small businesses, including restaurants, retail stores, and service providers. The village is also home to several manufacturing companies, which produce a variety of products, including furniture, clothing, and automotive parts.
Demographics
As of the 2010 census, Homer had a population of 1,400 people. The racial makeup of the village was 95.6% White, 0.6% African American, 0.4% Native American, 0.4% Asian, 0.1% Pacific Islander, 0.9% from other races, and 1.9% from two or more races. Hispanic or Latino of any race were 2.4% of the population.
The median household income in Homer was $41,250, and the median family income was $50,000. The per capita income for the village was $20,845. About 8.3% of families and 10.2% of the population were below the poverty line, including 14.3% of those under age 18 and 5.3% of those age 65 or over.
Common Questions
What is Per Capita Income in Homer?
Per Capita income in Homer is $20,344.
What is the Median Family Income in Homer?
Median Family Income in Homer is $46,838.
What is the Median Household income in Homer?
Median Household Income in Homer is $45,257.
What is Income or Wage Gap in Homer?
Income or Wage Gap in Homer is 45.4%.
Women in Homer earn 54.6 cents for every dollar earned by a man.
What is Inequality or Gini Index in Homer?
Inequality or Gini Index in Homer is 0.41.
What is the Total Population of Homer?
Total Population of Homer is 1,663.
What is the Total Male Population of Homer?
Total Male Population of Homer is 760.
What is the Total Female Population of Homer?
Total Female Population of Homer is 903.
What is the Ratio of Males per 100 Females in Homer?
There are 84.16 Males per 100 Females in Homer.
What is the Ratio of Females per 100 Males in Homer?
There are 118.82 Females per 100 Males in Homer.
What is the Median Population Age in Homer?
Median Population Age in Homer is 27.4 Years.
What is the Average Family Size in Homer
Average Family Size in Homer is 3.3 People.
What is the Average Household Size in Homer
Average Household Size in Homer is 2.9 People.
How Large is the Labor Force in Homer?
There are 695 People in the Labor Forcein in Homer.
What is the Percentage of People in the Labor Force in Homer?
61.8% of People are in the Labor Force in Homer.
What is the Unemployment Rate in Homer?
Unemployment Rate in Homer is 6.9%.