Mesick, MI Map & Demographics
Mesick Map
Mesick Overview
$14,111
PER CAPITA INCOME
$43,571
AVG FAMILY INCOME
$22,308
AVG HOUSEHOLD INCOME
56.9%
WAGE / INCOME GAP [ % ]
43.1¢/ $1
WAGE / INCOME GAP [ $ ]
0.47
INEQUALITY / GINI INDEX
390
TOTAL POPULATION
173
MALE POPULATION
217
FEMALE POPULATION
79.72
MALES / 100 FEMALES
125.43
FEMALES / 100 MALES
41.0
MEDIAN AGE
3.5
AVG FAMILY SIZE
2.6
AVG HOUSEHOLD SIZE
147
LABOR FORCE [ PEOPLE ]
51.8%
PERCENT IN LABOR FORCE
9.5%
UNEMPLOYMENT RATE
Mesick Zip Codes
Mesick Area Codes
Income in Mesick
Income Overview in Mesick
Per Capita Income in Mesick is $14,111, while median incomes of families and households are $43,571 and $22,308 respectively.
| Characteristic | Number | Measure |
| Per Capita Income | 390 | $14,111 |
| Median Family Income | 92 | $43,571 |
| Mean Family Income | 92 | $43,553 |
| Median Household Income | 150 | $22,308 |
| Mean Household Income | 150 | $36,157 |
| Income Deficit | 92 | $0 |
| Wage / Income Gap (%) | 390 | 56.88% |
| Wage / Income Gap ($) | 390 | 43.12¢ per $1 |
| Gini / Inequality Index | 390 | 0.47 |
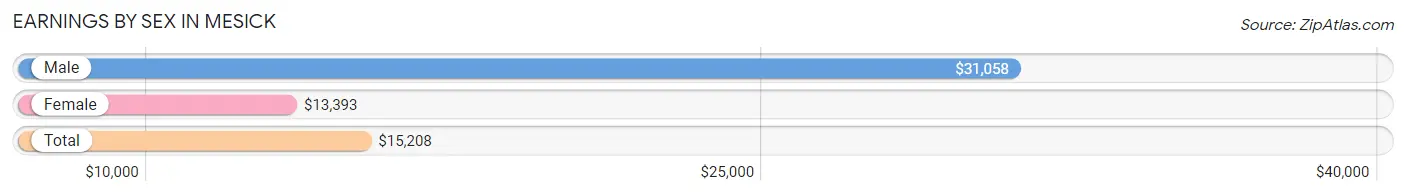
Earnings by Sex in Mesick
Average Earnings in Mesick are $15,208, $31,058 for men and $13,393 for women, a difference of 56.9%.
| Sex | Number | Average Earnings |
| Male | 65 (36.9%) | $31,058 |
| Female | 111 (63.1%) | $13,393 |
| Total | 176 (100.0%) | $15,208 |
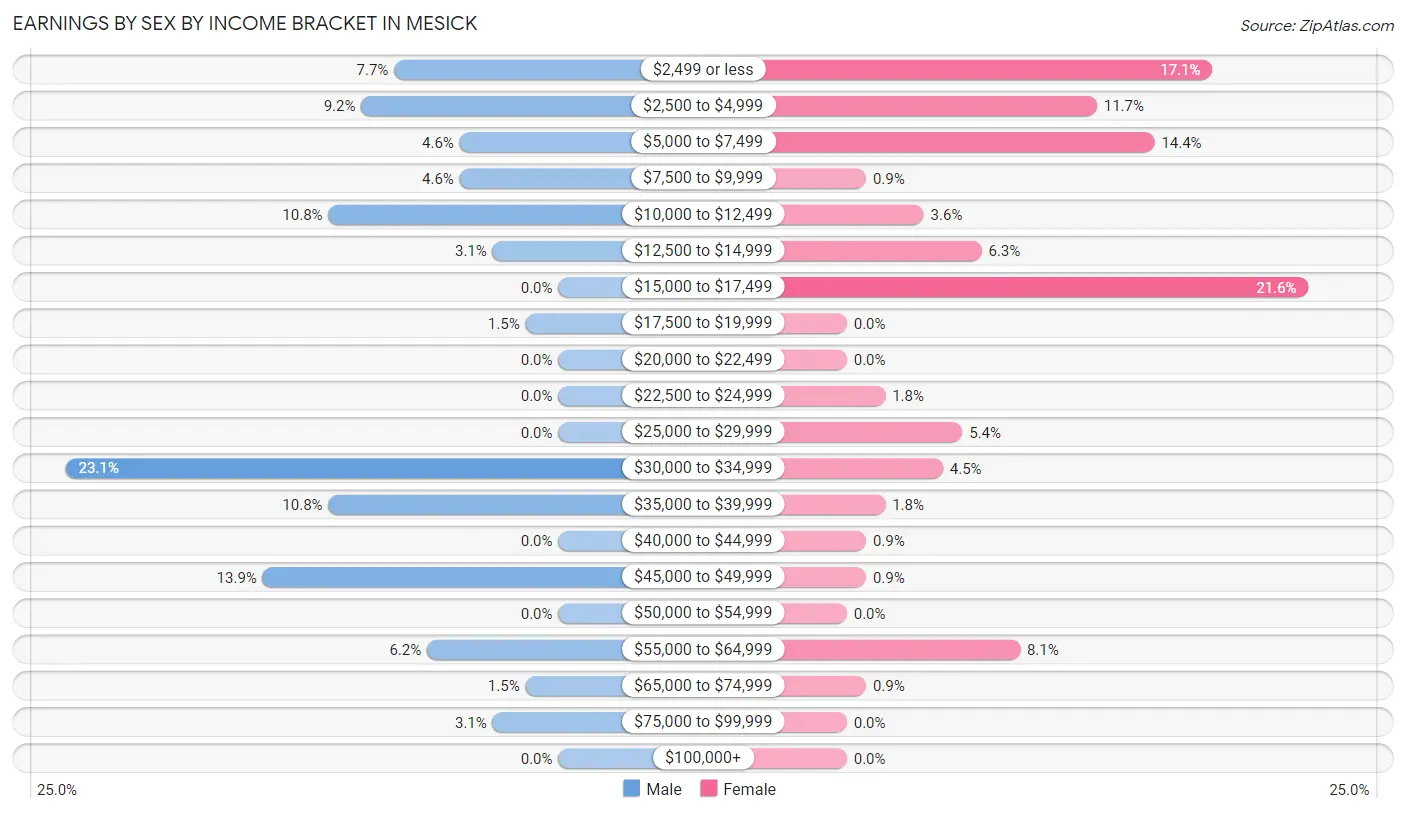
Earnings by Sex by Income Bracket in Mesick
The most common earnings brackets in Mesick are $30,000 to $34,999 for men (15 | 23.1%) and $15,000 to $17,499 for women (24 | 21.6%).
| Income | Male | Female |
| $2,499 or less | 5 (7.7%) | 19 (17.1%) |
| $2,500 to $4,999 | 6 (9.2%) | 13 (11.7%) |
| $5,000 to $7,499 | 3 (4.6%) | 16 (14.4%) |
| $7,500 to $9,999 | 3 (4.6%) | 1 (0.9%) |
| $10,000 to $12,499 | 7 (10.8%) | 4 (3.6%) |
| $12,500 to $14,999 | 2 (3.1%) | 7 (6.3%) |
| $15,000 to $17,499 | 0 (0.0%) | 24 (21.6%) |
| $17,500 to $19,999 | 1 (1.5%) | 0 (0.0%) |
| $20,000 to $22,499 | 0 (0.0%) | 0 (0.0%) |
| $22,500 to $24,999 | 0 (0.0%) | 2 (1.8%) |
| $25,000 to $29,999 | 0 (0.0%) | 6 (5.4%) |
| $30,000 to $34,999 | 15 (23.1%) | 5 (4.5%) |
| $35,000 to $39,999 | 7 (10.8%) | 2 (1.8%) |
| $40,000 to $44,999 | 0 (0.0%) | 1 (0.9%) |
| $45,000 to $49,999 | 9 (13.9%) | 1 (0.9%) |
| $50,000 to $54,999 | 0 (0.0%) | 0 (0.0%) |
| $55,000 to $64,999 | 4 (6.1%) | 9 (8.1%) |
| $65,000 to $74,999 | 1 (1.5%) | 1 (0.9%) |
| $75,000 to $99,999 | 2 (3.1%) | 0 (0.0%) |
| $100,000+ | 0 (0.0%) | 0 (0.0%) |
| Total | 65 (100.0%) | 111 (100.0%) |
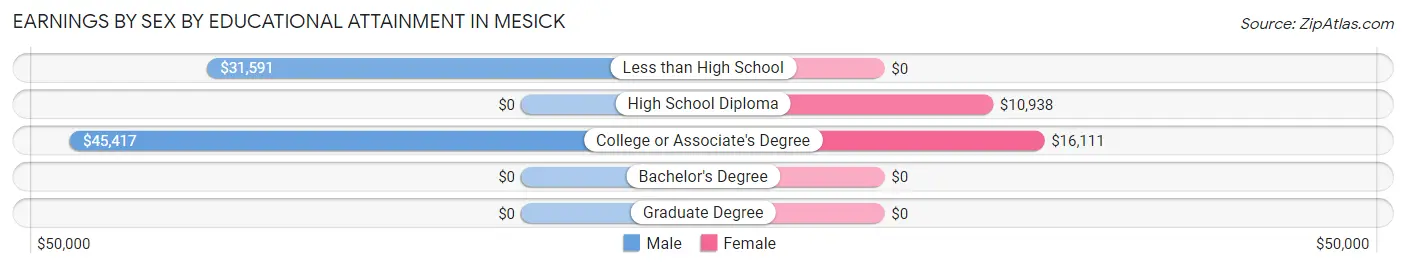
Earnings by Sex by Educational Attainment in Mesick
Average earnings in Mesick are $30,962 for men and $15,139 for women, a difference of 51.1%. Men with an educational attainment of college or associate's degree enjoy the highest average annual earnings of $45,417, while those with less than high school education earn the least with $31,591. Women with an educational attainment of college or associate's degree earn the most with the average annual earnings of $16,111, while those with high school diploma education have the smallest earnings of $10,938.
| Educational Attainment | Male Income | Female Income |
| Less than High School | $31,591 | $0 |
| High School Diploma | - | - |
| College or Associate's Degree | $45,417 | $16,111 |
| Bachelor's Degree | - | - |
| Graduate Degree | - | - |
| Total | $30,962 | $15,139 |
Family Income in Mesick
Family Income Brackets in Mesick
According to the Mesick family income data, there are 23 families falling into the $50,000 to $74,999 income range, which is the most common income bracket and makes up 25.0% of all families.
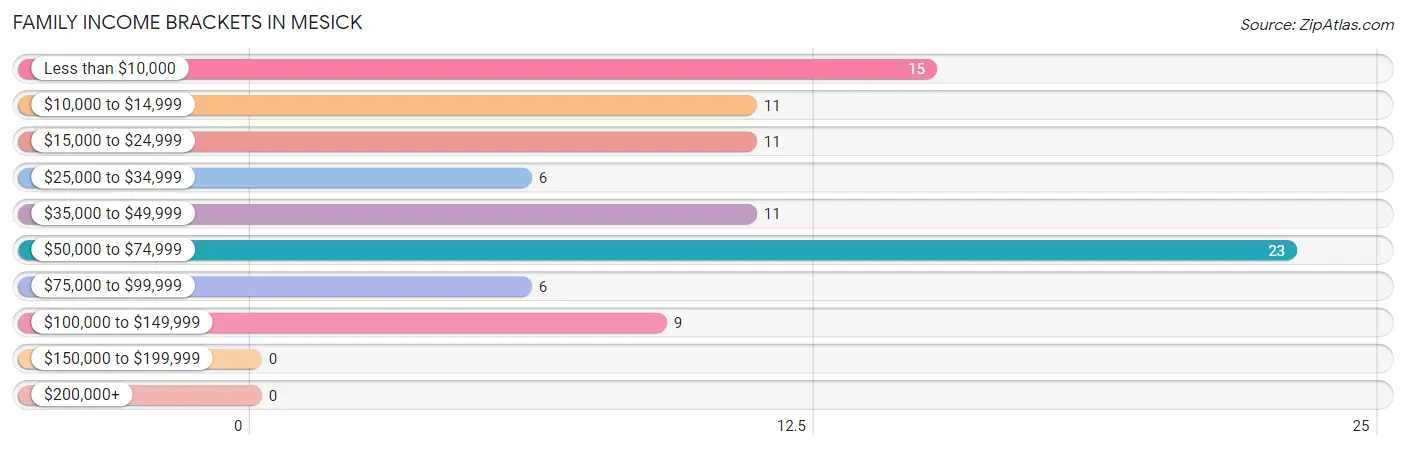
| Income Bracket | # Families | % Families |
| Less than $10,000 | 15 | 16.3% |
| $10,000 to $14,999 | 11 | 12.0% |
| $15,000 to $24,999 | 11 | 12.0% |
| $25,000 to $34,999 | 6 | 6.5% |
| $35,000 to $49,999 | 11 | 12.0% |
| $50,000 to $74,999 | 23 | 25.0% |
| $75,000 to $99,999 | 6 | 6.5% |
| $100,000 to $149,999 | 9 | 9.8% |
| $150,000 to $199,999 | 0 | 0.0% |
| $200,000+ | 0 | 0.0% |
Family Income by Famaliy Size in Mesick
7+ person families (13 | 14.1%) account for the highest median family income in Mesick with $66,250 per family, while 3-person families (16 | 17.4%) have the highest median income of $17,500 per family member.
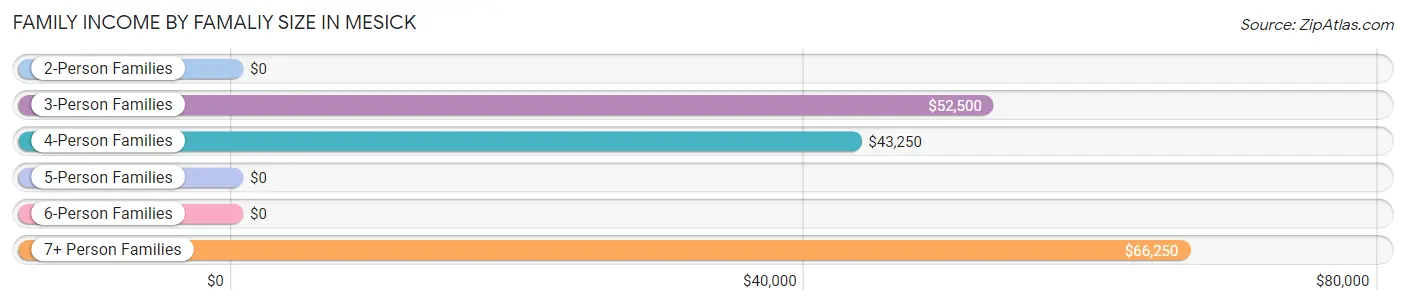
| Income Bracket | # Families | Median Income |
| 2-Person Families | 44 (47.8%) | $0 |
| 3-Person Families | 16 (17.4%) | $52,500 |
| 4-Person Families | 11 (12.0%) | $43,250 |
| 5-Person Families | 6 (6.5%) | $0 |
| 6-Person Families | 2 (2.2%) | $0 |
| 7+ Person Families | 13 (14.1%) | $66,250 |
| Total | 92 (100.0%) | $43,571 |
Family Income by Number of Earners in Mesick
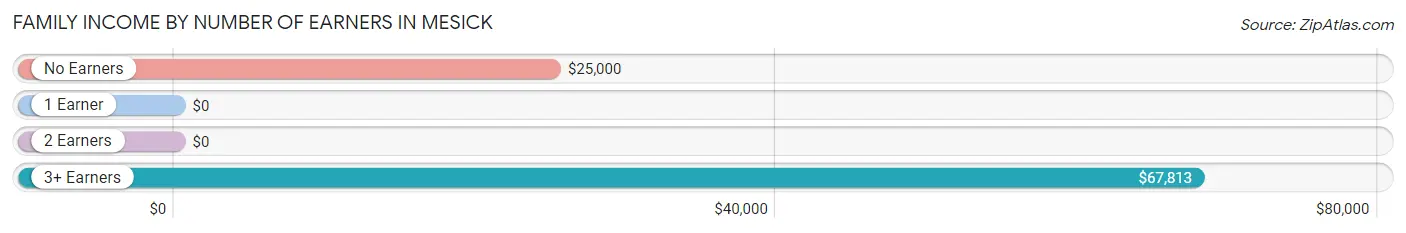
| Number of Earners | # Families | Median Income |
| No Earners | 14 (15.2%) | $25,000 |
| 1 Earner | 41 (44.6%) | $0 |
| 2 Earners | 26 (28.3%) | $0 |
| 3+ Earners | 11 (12.0%) | $67,813 |
| Total | 92 (100.0%) | $43,571 |
Household Income in Mesick
Household Income Brackets in Mesick
With 35 households falling in the category, the $15,000 to $24,999 income range is the most frequent in Mesick, accounting for 23.3% of all households.
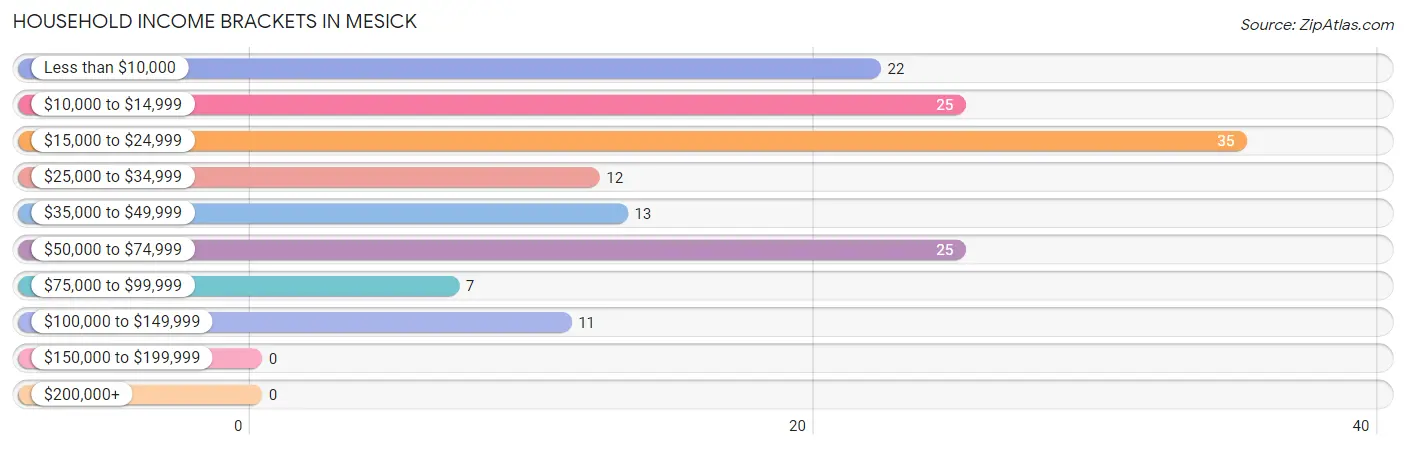
| Income Bracket | # Households | % Households |
| Less than $10,000 | 22 | 14.7% |
| $10,000 to $14,999 | 25 | 16.7% |
| $15,000 to $24,999 | 35 | 23.3% |
| $25,000 to $34,999 | 12 | 8.0% |
| $35,000 to $49,999 | 13 | 8.7% |
| $50,000 to $74,999 | 25 | 16.7% |
| $75,000 to $99,999 | 7 | 4.7% |
| $100,000 to $149,999 | 11 | 7.3% |
| $150,000 to $199,999 | 0 | 0.0% |
| $200,000+ | 0 | 0.0% |
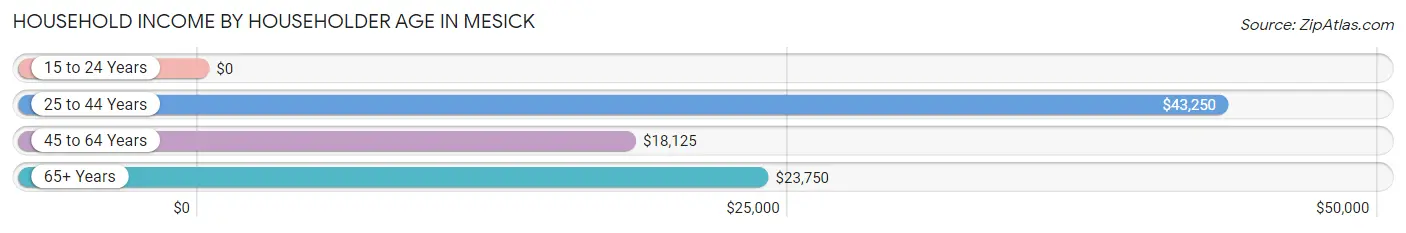
Household Income by Householder Age in Mesick
The median household income in Mesick is $22,308, with the highest median household income of $43,250 found in the 25 to 44 years age bracket for the primary householder. A total of 41 households (27.3%) fall into this category. Meanwhile, the 15 to 24 years age bracket for the primary householder has the lowest median household income of $0, with 2 households (1.3%) in this group.
| Income Bracket | # Households | Median Income |
| 15 to 24 Years | 2 (1.3%) | $0 |
| 25 to 44 Years | 41 (27.3%) | $43,250 |
| 45 to 64 Years | 53 (35.3%) | $18,125 |
| 65+ Years | 54 (36.0%) | $23,750 |
| Total | 150 (100.0%) | $22,308 |
Poverty in Mesick
Income Below Poverty by Sex and Age in Mesick
With 39.3% poverty level for males and 35.5% for females among the residents of Mesick, 5 year old males and under 5 year old females are the most vulnerable to poverty, with 5 males (100.0%) and 18 females (90.0%) in their respective age groups living below the poverty level.
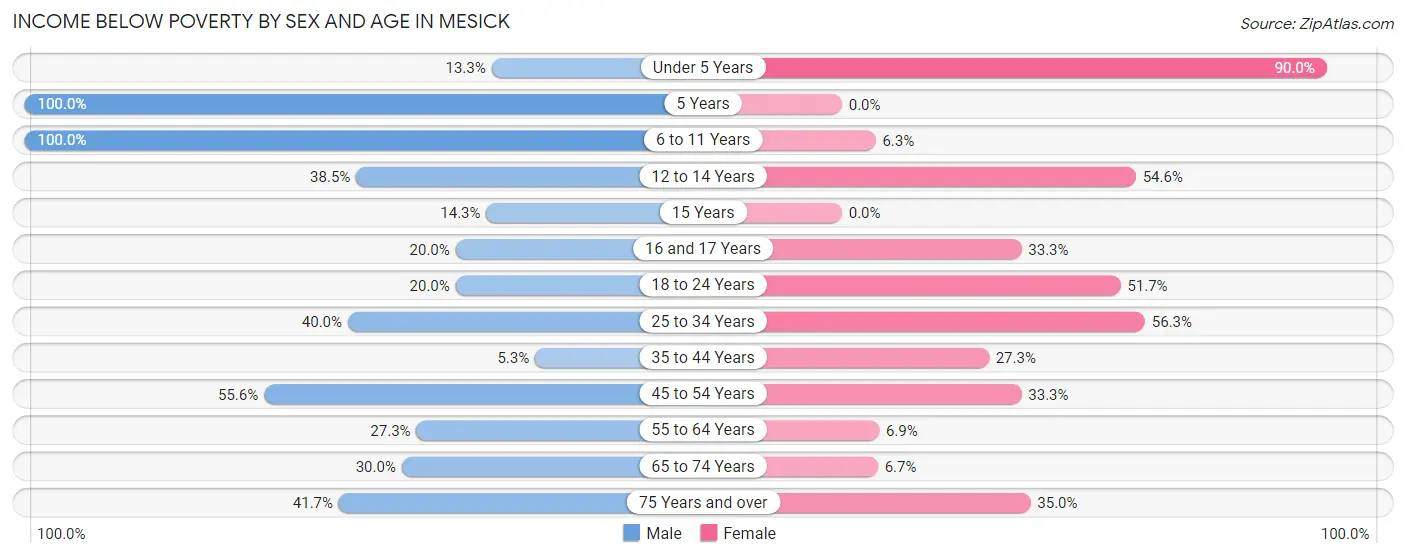
| Age Bracket | Male | Female |
| Under 5 Years | 2 (13.3%) | 18 (90.0%) |
| 5 Years | 5 (100.0%) | 0 (0.0%) |
| 6 to 11 Years | 18 (100.0%) | 1 (6.2%) |
| 12 to 14 Years | 5 (38.5%) | 6 (54.5%) |
| 15 Years | 1 (14.3%) | 0 (0.0%) |
| 16 and 17 Years | 1 (20.0%) | 3 (33.3%) |
| 18 to 24 Years | 1 (20.0%) | 15 (51.7%) |
| 25 to 34 Years | 2 (40.0%) | 9 (56.2%) |
| 35 to 44 Years | 1 (5.3%) | 9 (27.3%) |
| 45 to 54 Years | 15 (55.6%) | 6 (33.3%) |
| 55 to 64 Years | 6 (27.3%) | 2 (6.9%) |
| 65 to 74 Years | 6 (30.0%) | 1 (6.7%) |
| 75 Years and over | 5 (41.7%) | 7 (35.0%) |
| Total | 68 (39.3%) | 77 (35.5%) |
Income Above Poverty by Sex and Age in Mesick
According to the poverty statistics in Mesick, males aged 35 to 44 years and females aged 5 years are the age groups that are most secure financially, with 94.7% of males and 100.0% of females in these age groups living above the poverty line.
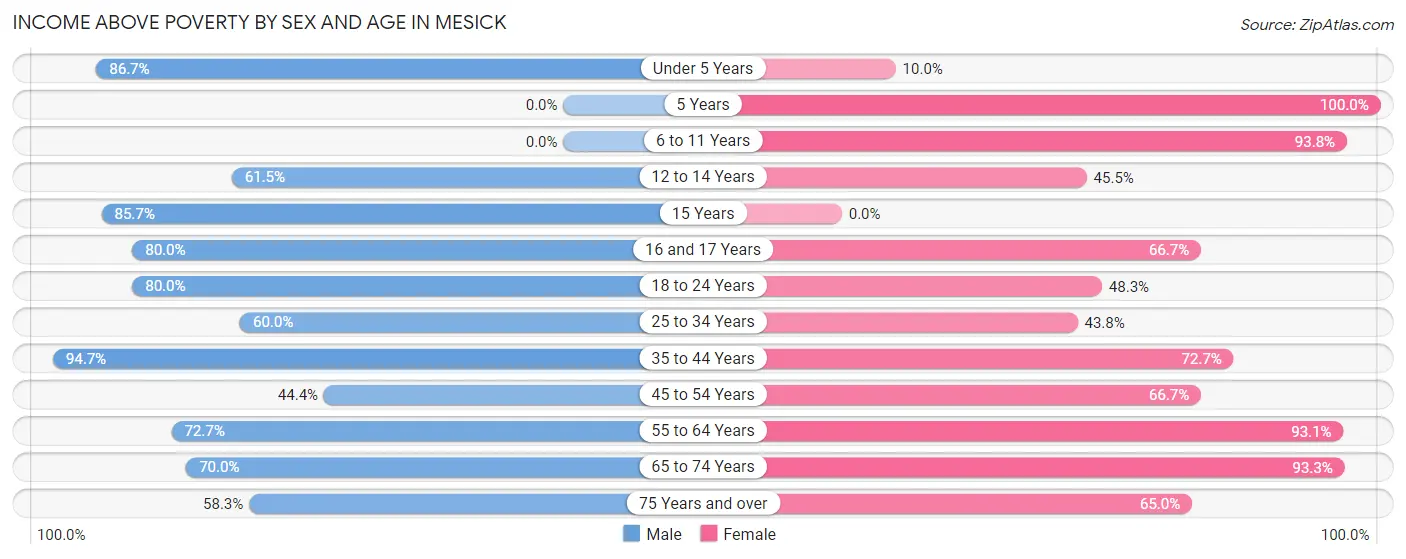
| Age Bracket | Male | Female |
| Under 5 Years | 13 (86.7%) | 2 (10.0%) |
| 5 Years | 0 (0.0%) | 1 (100.0%) |
| 6 to 11 Years | 0 (0.0%) | 15 (93.8%) |
| 12 to 14 Years | 8 (61.5%) | 5 (45.5%) |
| 15 Years | 6 (85.7%) | 0 (0.0%) |
| 16 and 17 Years | 4 (80.0%) | 6 (66.7%) |
| 18 to 24 Years | 4 (80.0%) | 14 (48.3%) |
| 25 to 34 Years | 3 (60.0%) | 7 (43.8%) |
| 35 to 44 Years | 18 (94.7%) | 24 (72.7%) |
| 45 to 54 Years | 12 (44.4%) | 12 (66.7%) |
| 55 to 64 Years | 16 (72.7%) | 27 (93.1%) |
| 65 to 74 Years | 14 (70.0%) | 14 (93.3%) |
| 75 Years and over | 7 (58.3%) | 13 (65.0%) |
| Total | 105 (60.7%) | 140 (64.5%) |
Income Below Poverty Among Married-Couple Families in Mesick
The poverty statistics for married-couple families in Mesick show that 20.4% or 9 of the total 44 families live below the poverty line. Families with 3 or 4 children have the highest poverty rate of 85.7%, comprising of 6 families. On the other hand, families with 5 or more children have the lowest poverty rate of 0.0%, which includes 0 families.
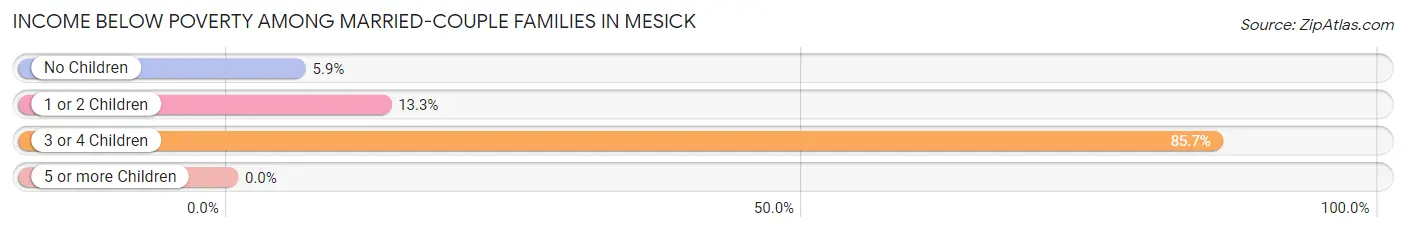
| Children | Above Poverty | Below Poverty |
| No Children | 16 (94.1%) | 1 (5.9%) |
| 1 or 2 Children | 13 (86.7%) | 2 (13.3%) |
| 3 or 4 Children | 1 (14.3%) | 6 (85.7%) |
| 5 or more Children | 5 (100.0%) | 0 (0.0%) |
| Total | 35 (79.5%) | 9 (20.4%) |
Income Below Poverty Among Single-Parent Households in Mesick
According to the poverty data in Mesick, 71.4% or 10 single-father households and 52.9% or 18 single-mother households are living below the poverty line. Among single-father households, those with no children have the highest poverty rate, with 10 households (71.4%) experiencing poverty. Likewise, among single-mother households, those with 3 or 4 children have the highest poverty rate, with 6 households (100.0%) falling below the poverty line.
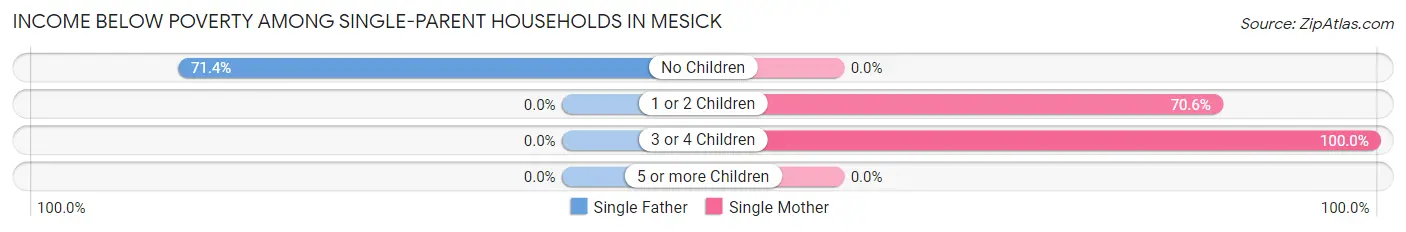
| Children | Single Father | Single Mother |
| No Children | 10 (71.4%) | 0 (0.0%) |
| 1 or 2 Children | 0 (0.0%) | 12 (70.6%) |
| 3 or 4 Children | 0 (0.0%) | 6 (100.0%) |
| 5 or more Children | 0 (0.0%) | 0 (0.0%) |
| Total | 10 (71.4%) | 18 (52.9%) |
Income Below Poverty Among Married-Couple vs Single-Parent Households in Mesick
The poverty data for Mesick shows that 9 of the married-couple family households (20.4%) and 28 of the single-parent households (58.3%) are living below the poverty level. Within the married-couple family households, those with 3 or 4 children have the highest poverty rate, with 6 households (85.7%) falling below the poverty line. Among the single-parent households, those with 3 or 4 children have the highest poverty rate, with 6 household (100.0%) living below poverty.
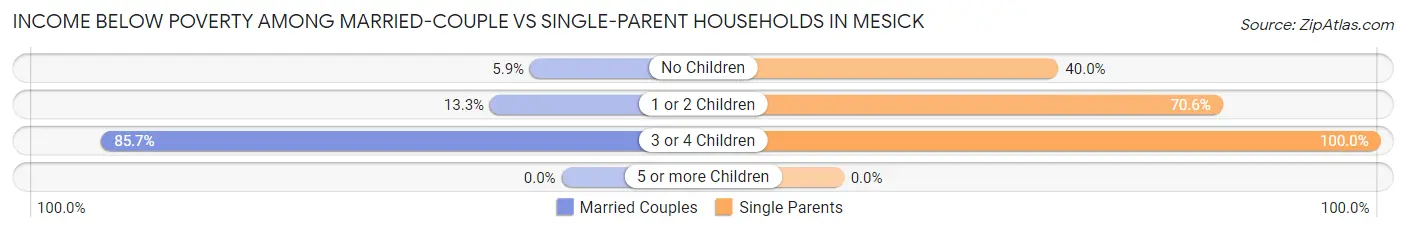
| Children | Married-Couple Families | Single-Parent Households |
| No Children | 1 (5.9%) | 10 (40.0%) |
| 1 or 2 Children | 2 (13.3%) | 12 (70.6%) |
| 3 or 4 Children | 6 (85.7%) | 6 (100.0%) |
| 5 or more Children | 0 (0.0%) | 0 (0.0%) |
| Total | 9 (20.4%) | 28 (58.3%) |
Race in Mesick
The most populous races in Mesick are White / Caucasian (359 | 92.0%), Two or more Races (24 | 6.1%), and Hispanic or Latino (23 | 5.9%).
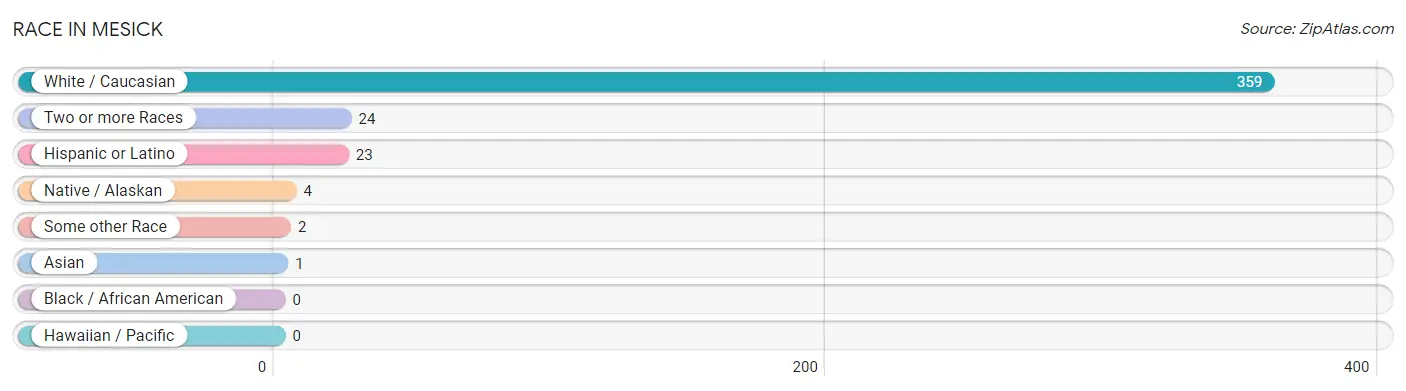
| Race | # Population | % Population |
| Asian | 1 | 0.3% |
| Black / African American | 0 | 0.0% |
| Hawaiian / Pacific | 0 | 0.0% |
| Hispanic or Latino | 23 | 5.9% |
| Native / Alaskan | 4 | 1.0% |
| White / Caucasian | 359 | 92.0% |
| Two or more Races | 24 | 6.1% |
| Some other Race | 2 | 0.5% |
| Total | 390 | 100.0% |
Ancestry in Mesick
The most populous ancestries reported in Mesick are German (41 | 10.5%), Irish (37 | 9.5%), English (32 | 8.2%), Mexican (23 | 5.9%), and Italian (10 | 2.6%), together accounting for 36.7% of all Mesick residents.
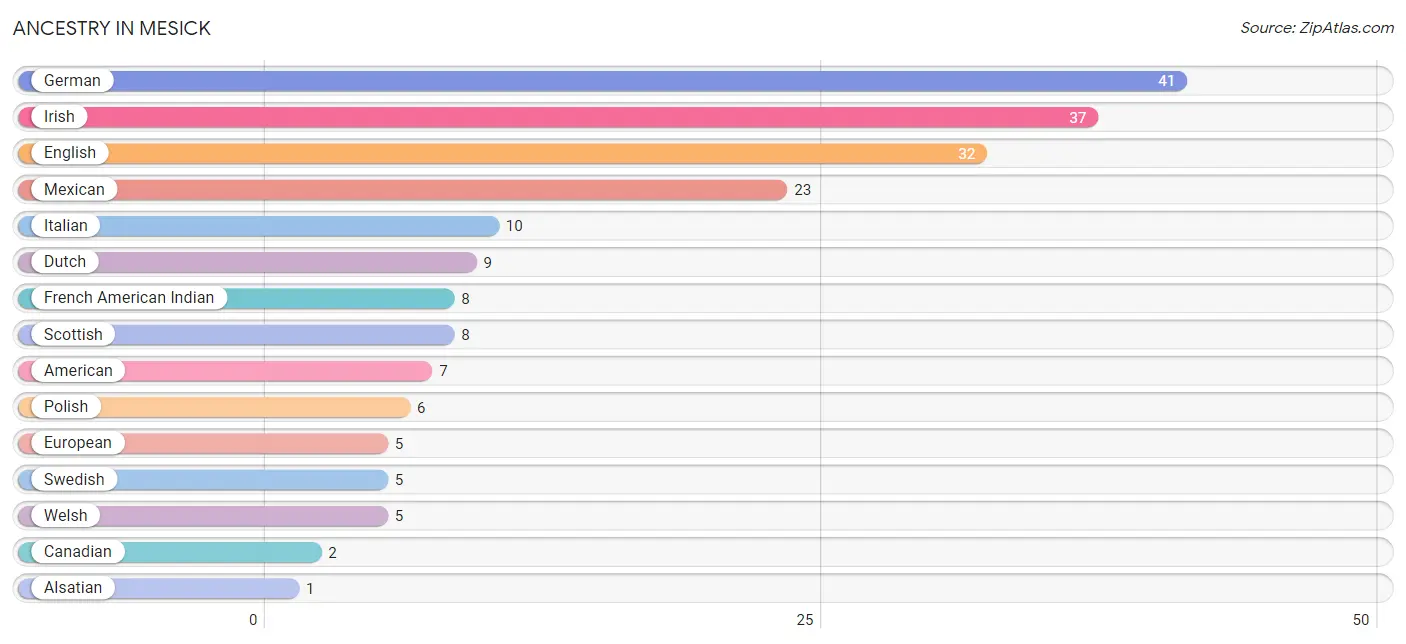
| Ancestry | # Population | % Population |
| Alsatian | 1 | 0.3% |
| American | 7 | 1.8% |
| Canadian | 2 | 0.5% |
| Czech | 1 | 0.3% |
| Dutch | 9 | 2.3% |
| English | 32 | 8.2% |
| European | 5 | 1.3% |
| French | 1 | 0.3% |
| French American Indian | 8 | 2.1% |
| German | 41 | 10.5% |
| Irish | 37 | 9.5% |
| Italian | 10 | 2.6% |
| Korean | 1 | 0.3% |
| Mexican | 23 | 5.9% |
| Polish | 6 | 1.5% |
| Scottish | 8 | 2.1% |
| Slovak | 1 | 0.3% |
| Swedish | 5 | 1.3% |
| Welsh | 5 | 1.3% | View All 19 Rows |
Immigrants in Mesick
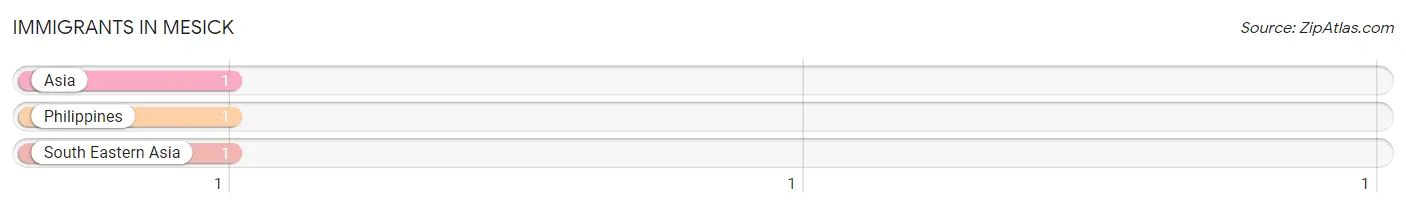
The most numerous immigrant groups reported in Mesick came from Asia (1 | 0.3%), Philippines (1 | 0.3%), and South Eastern Asia (1 | 0.3%), together accounting for 0.8% of all Mesick residents.
| Immigration Origin | # Population | % Population |
| Asia | 1 | 0.3% |
| Philippines | 1 | 0.3% |
| South Eastern Asia | 1 | 0.3% | View All 3 Rows |
Sex and Age in Mesick
Sex and Age in Mesick
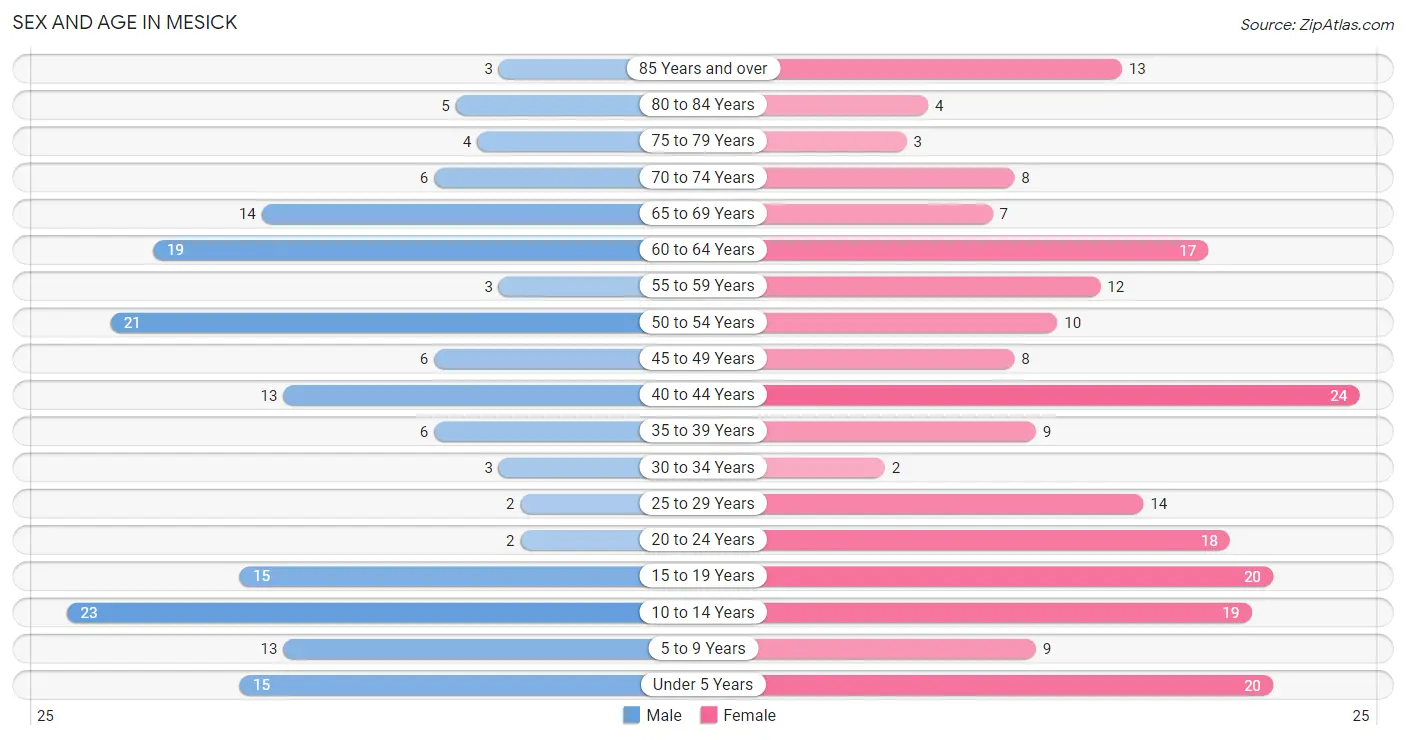
The most populous age groups in Mesick are 10 to 14 Years (23 | 13.3%) for men and 40 to 44 Years (24 | 11.1%) for women.
| Age Bracket | Male | Female |
| Under 5 Years | 15 (8.7%) | 20 (9.2%) |
| 5 to 9 Years | 13 (7.5%) | 9 (4.2%) |
| 10 to 14 Years | 23 (13.3%) | 19 (8.8%) |
| 15 to 19 Years | 15 (8.7%) | 20 (9.2%) |
| 20 to 24 Years | 2 (1.2%) | 18 (8.3%) |
| 25 to 29 Years | 2 (1.2%) | 14 (6.5%) |
| 30 to 34 Years | 3 (1.7%) | 2 (0.9%) |
| 35 to 39 Years | 6 (3.5%) | 9 (4.2%) |
| 40 to 44 Years | 13 (7.5%) | 24 (11.1%) |
| 45 to 49 Years | 6 (3.5%) | 8 (3.7%) |
| 50 to 54 Years | 21 (12.1%) | 10 (4.6%) |
| 55 to 59 Years | 3 (1.7%) | 12 (5.5%) |
| 60 to 64 Years | 19 (11.0%) | 17 (7.8%) |
| 65 to 69 Years | 14 (8.1%) | 7 (3.2%) |
| 70 to 74 Years | 6 (3.5%) | 8 (3.7%) |
| 75 to 79 Years | 4 (2.3%) | 3 (1.4%) |
| 80 to 84 Years | 5 (2.9%) | 4 (1.8%) |
| 85 Years and over | 3 (1.7%) | 13 (6.0%) |
| Total | 173 (100.0%) | 217 (100.0%) |
Families and Households in Mesick
Median Family Size in Mesick
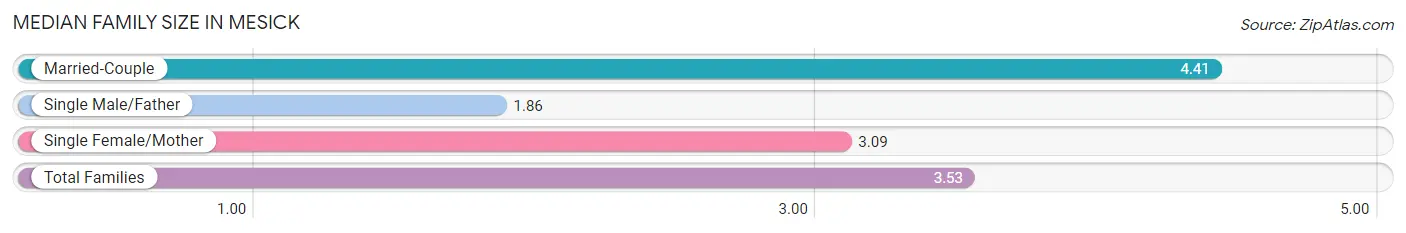
The median family size in Mesick is 3.53 persons per family, with married-couple families (44 | 47.8%) accounting for the largest median family size of 4.41 persons per family. On the other hand, single male/father families (14 | 15.2%) represent the smallest median family size with 1.86 persons per family.
| Family Type | # Families | Family Size |
| Married-Couple | 44 (47.8%) | 4.41 |
| Single Male/Father | 14 (15.2%) | 1.86 |
| Single Female/Mother | 34 (37.0%) | 3.09 |
| Total Families | 92 (100.0%) | 3.53 |
Median Household Size in Mesick
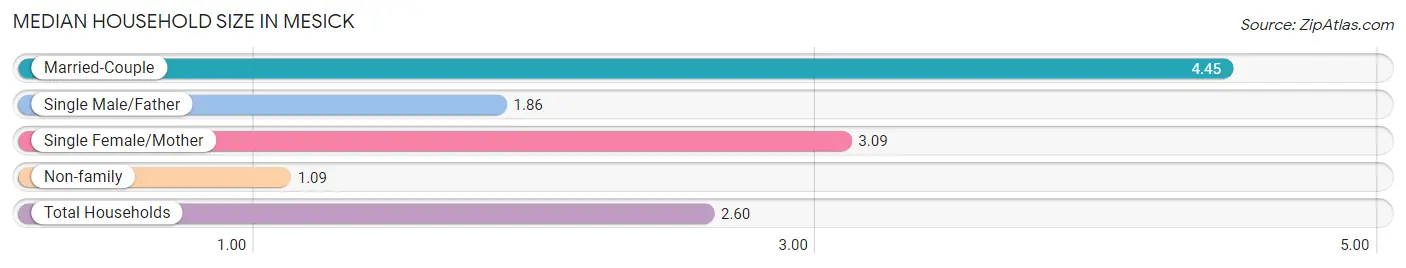
The median household size in Mesick is 2.60 persons per household, with married-couple households (44 | 29.3%) accounting for the largest median household size of 4.45 persons per household. non-family households (58 | 38.7%) represent the smallest median household size with 1.09 persons per household.
| Household Type | # Households | Household Size |
| Married-Couple | 44 (29.3%) | 4.45 |
| Single Male/Father | 14 (9.3%) | 1.86 |
| Single Female/Mother | 34 (22.7%) | 3.09 |
| Non-family | 58 (38.7%) | 1.09 |
| Total Households | 150 (100.0%) | 2.60 |
Household Size by Marriage Status in Mesick
Out of a total of 150 households in Mesick, 92 (61.3%) are family households, while 58 (38.7%) are nonfamily households. The most numerous type of family households are 2-person households, comprising 44, and the most common type of nonfamily households are 1-person households, comprising 52.
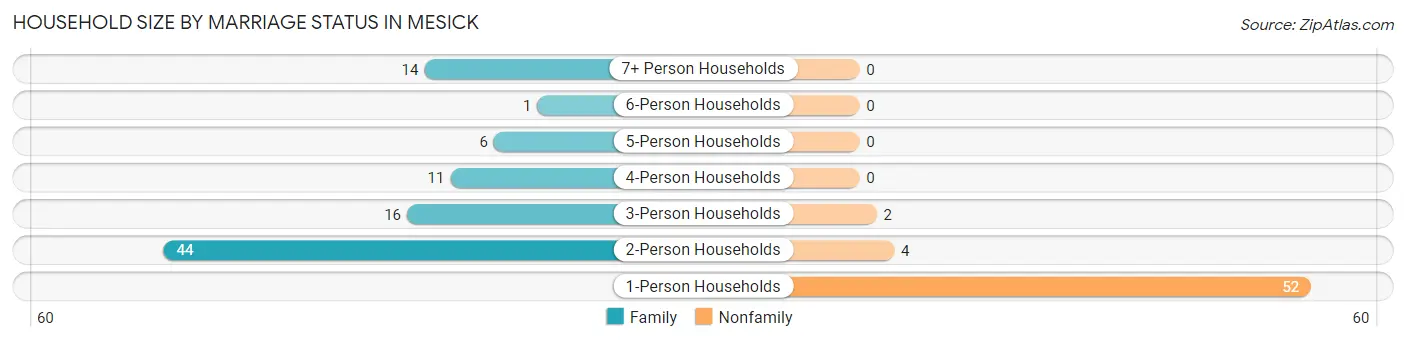
| Household Size | Family Households | Nonfamily Households |
| 1-Person Households | - | 52 (34.7%) |
| 2-Person Households | 44 (29.3%) | 4 (2.7%) |
| 3-Person Households | 16 (10.7%) | 2 (1.3%) |
| 4-Person Households | 11 (7.3%) | 0 (0.0%) |
| 5-Person Households | 6 (4.0%) | 0 (0.0%) |
| 6-Person Households | 1 (0.7%) | 0 (0.0%) |
| 7+ Person Households | 14 (9.3%) | 0 (0.0%) |
| Total | 92 (61.3%) | 58 (38.7%) |
Female Fertility in Mesick
Fertility by Age in Mesick
Average fertility rate in Mesick is 84.0 births per 1,000 women. Women in the age bracket of 20 to 34 years have the highest fertility rate with 235.0 births per 1,000 women. Women in the age bracket of 20 to 34 years acount for 100.0% of all women with births.
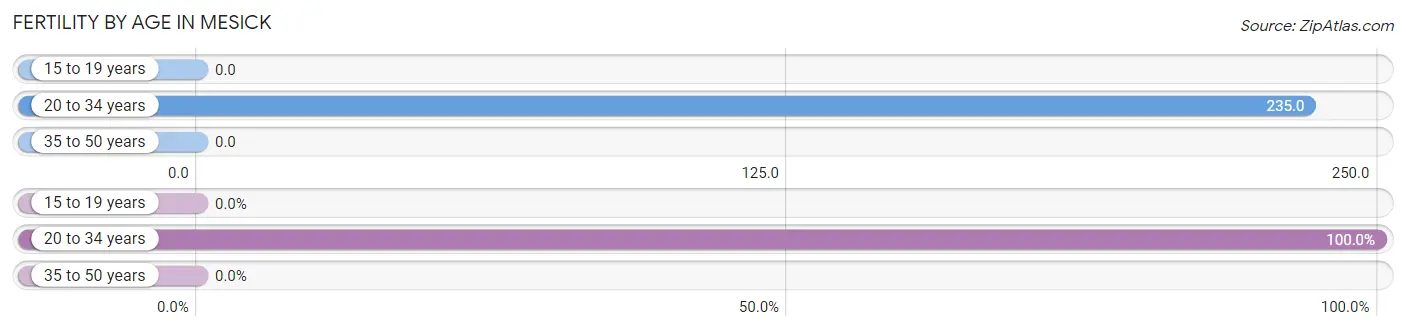
| Age Bracket | Women with Births | Births / 1,000 Women |
| 15 to 19 years | 0 (0.0%) | 0.0 |
| 20 to 34 years | 8 (100.0%) | 235.0 |
| 35 to 50 years | 0 (0.0%) | 0.0 |
| Total | 8 (100.0%) | 84.0 |
Fertility by Age by Marriage Status in Mesick
62.5% of women with births (8) in Mesick are married. The highest percentage of unmarried women with births falls into 20 to 34 years age bracket with 37.5% of them unmarried at the time of birth, while the lowest percentage of unmarried women with births belong to 20 to 34 years age bracket with 37.5% of them unmarried.
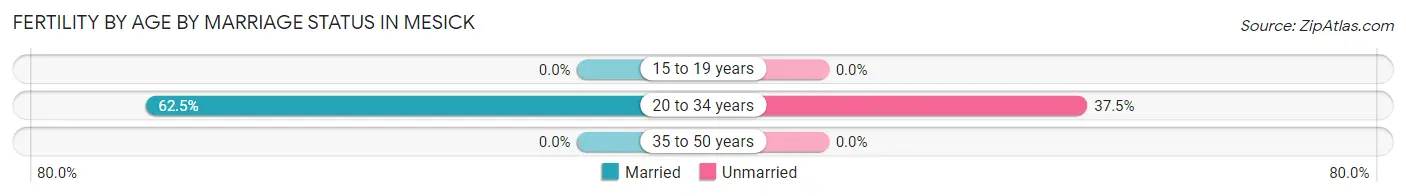
| Age Bracket | Married | Unmarried |
| 15 to 19 years | 0 (0.0%) | 0 (0.0%) |
| 20 to 34 years | 5 (62.5%) | 3 (37.5%) |
| 35 to 50 years | 0 (0.0%) | 0 (0.0%) |
| Total | 5 (62.5%) | 3 (37.5%) |
Fertility by Education in Mesick
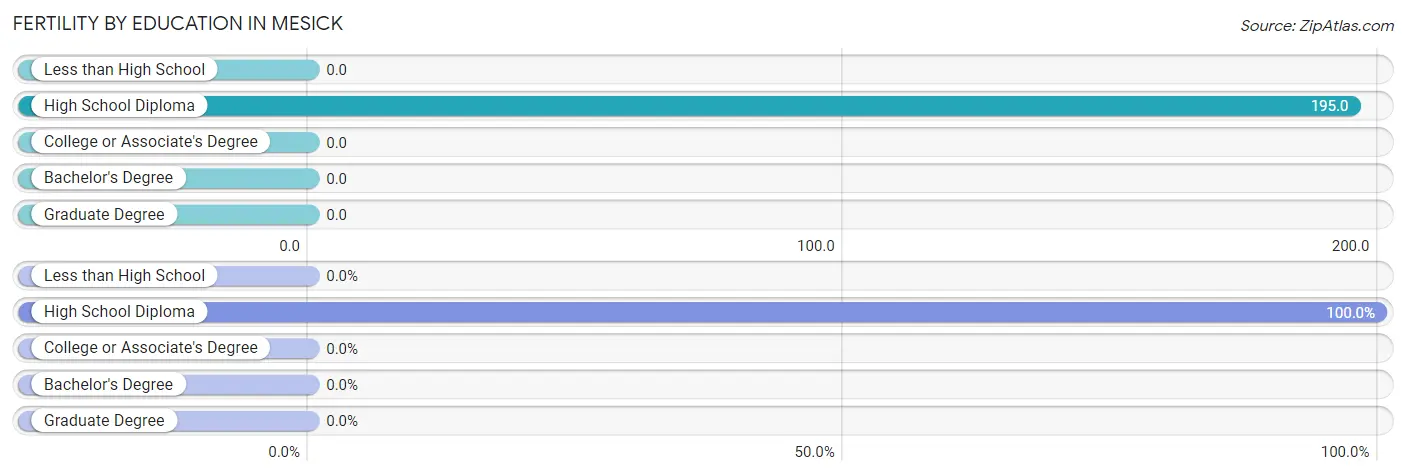
| Educational Attainment | Women with Births | Births / 1,000 Women |
| Less than High School | 0 (0.0%) | 0.0 |
| High School Diploma | 8 (100.0%) | 195.0 |
| College or Associate's Degree | 0 (0.0%) | 0.0 |
| Bachelor's Degree | 0 (0.0%) | 0.0 |
| Graduate Degree | 0 (0.0%) | 0.0 |
| Total | 8 (100.0%) | 84.0 |
Fertility by Education by Marriage Status in Mesick
37.5% of women with births in Mesick are unmarried. Women with the educational attainment of high school diploma are most likely to be married with 62.5% of them married at childbirth, while women with the educational attainment of high school diploma are least likely to be married with 37.5% of them unmarried at childbirth.
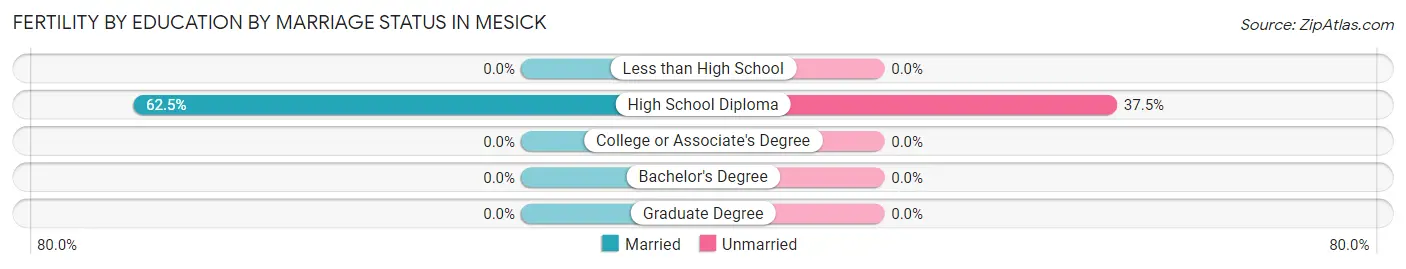
| Educational Attainment | Married | Unmarried |
| Less than High School | 0 (0.0%) | 0 (0.0%) |
| High School Diploma | 5 (62.5%) | 3 (37.5%) |
| College or Associate's Degree | 0 (0.0%) | 0 (0.0%) |
| Bachelor's Degree | 0 (0.0%) | 0 (0.0%) |
| Graduate Degree | 0 (0.0%) | 0 (0.0%) |
| Total | 5 (62.5%) | 3 (37.5%) |
Employment Characteristics in Mesick
Employment by Class of Employer in Mesick
Among the 133 employed individuals in Mesick, private company employees (91 | 68.4%), self-employed (not incorporated) (16 | 12.0%), and not-for-profit organizations (10 | 7.5%) make up the most common classes of employment.
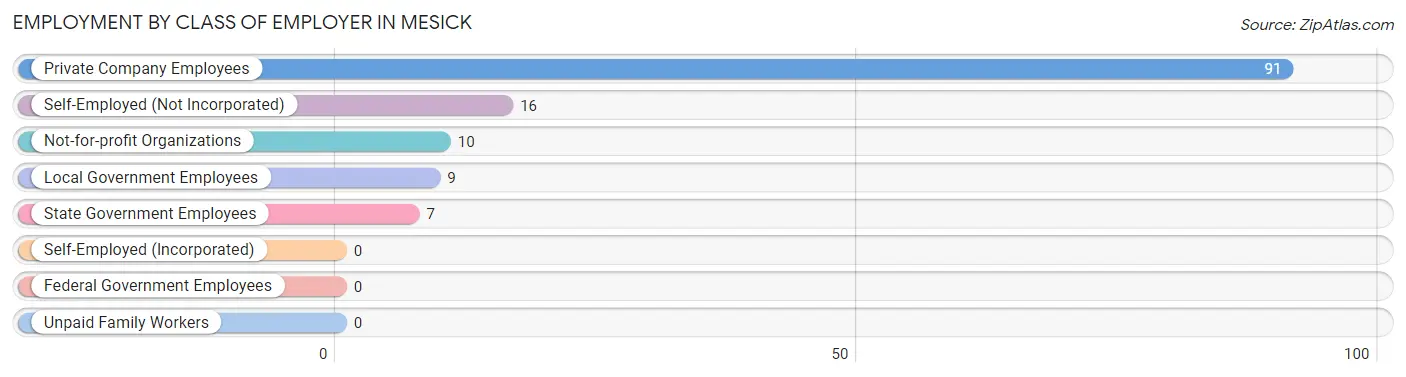
| Employer Class | # Employees | % Employees |
| Private Company Employees | 91 | 68.4% |
| Self-Employed (Incorporated) | 0 | 0.0% |
| Self-Employed (Not Incorporated) | 16 | 12.0% |
| Not-for-profit Organizations | 10 | 7.5% |
| Local Government Employees | 9 | 6.8% |
| State Government Employees | 7 | 5.3% |
| Federal Government Employees | 0 | 0.0% |
| Unpaid Family Workers | 0 | 0.0% |
| Total | 133 | 100.0% |
Employment Status by Age in Mesick
According to the labor force statistics for Mesick, out of the total population over 16 years of age (284), 51.8% or 147 individuals are in the labor force, with 9.5% or 14 of them unemployed. The age group with the highest labor force participation rate is 30 to 34 years, with 100.0% or 5 individuals in the labor force. Within the labor force, the 25 to 29 years age range has the highest percentage of unemployed individuals, with 35.7% or 5 of them being unemployed.
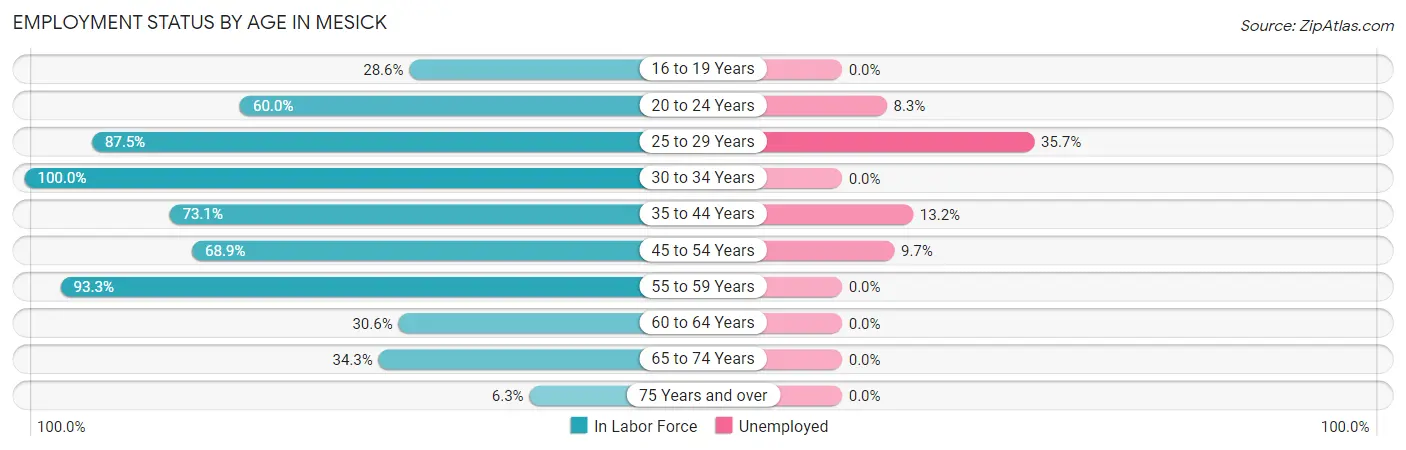
| Age Bracket | In Labor Force | Unemployed |
| 16 to 19 Years | 8 (28.6%) | 0 (0.0%) |
| 20 to 24 Years | 12 (60.0%) | 1 (8.3%) |
| 25 to 29 Years | 14 (87.5%) | 5 (35.7%) |
| 30 to 34 Years | 5 (100.0%) | 0 (0.0%) |
| 35 to 44 Years | 38 (73.1%) | 5 (13.2%) |
| 45 to 54 Years | 31 (68.9%) | 3 (9.7%) |
| 55 to 59 Years | 14 (93.3%) | 0 (0.0%) |
| 60 to 64 Years | 11 (30.6%) | 0 (0.0%) |
| 65 to 74 Years | 12 (34.3%) | 0 (0.0%) |
| 75 Years and over | 2 (6.3%) | 0 (0.0%) |
| Total | 147 (51.8%) | 14 (9.5%) |
Employment Status by Educational Attainment in Mesick
According to labor force statistics for Mesick, 66.9% of individuals (113) out of the total population between 25 and 64 years of age (169) are in the labor force, with 11.5% or 13 of them being unemployed. The group with the highest labor force participation rate are those with the educational attainment of college / associate degree, with 86.7% or 39 individuals in the labor force. Within the labor force, individuals with less than high school education have the highest percentage of unemployment, with 22.7% or 5 of them being unemployed.
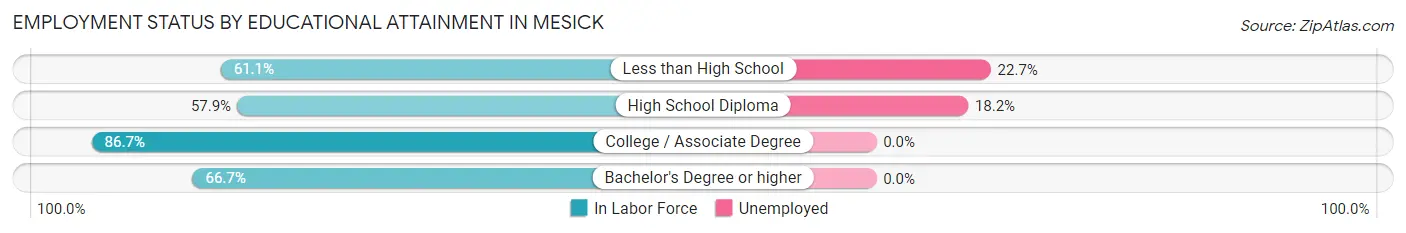
| Educational Attainment | In Labor Force | Unemployed |
| Less than High School | 22 (61.1%) | 8 (22.7%) |
| High School Diploma | 44 (57.9%) | 14 (18.2%) |
| College / Associate Degree | 39 (86.7%) | 0 (0.0%) |
| Bachelor's Degree or higher | 8 (66.7%) | 0 (0.0%) |
| Total | 113 (66.9%) | 19 (11.5%) |
Employment Occupations by Sex in Mesick
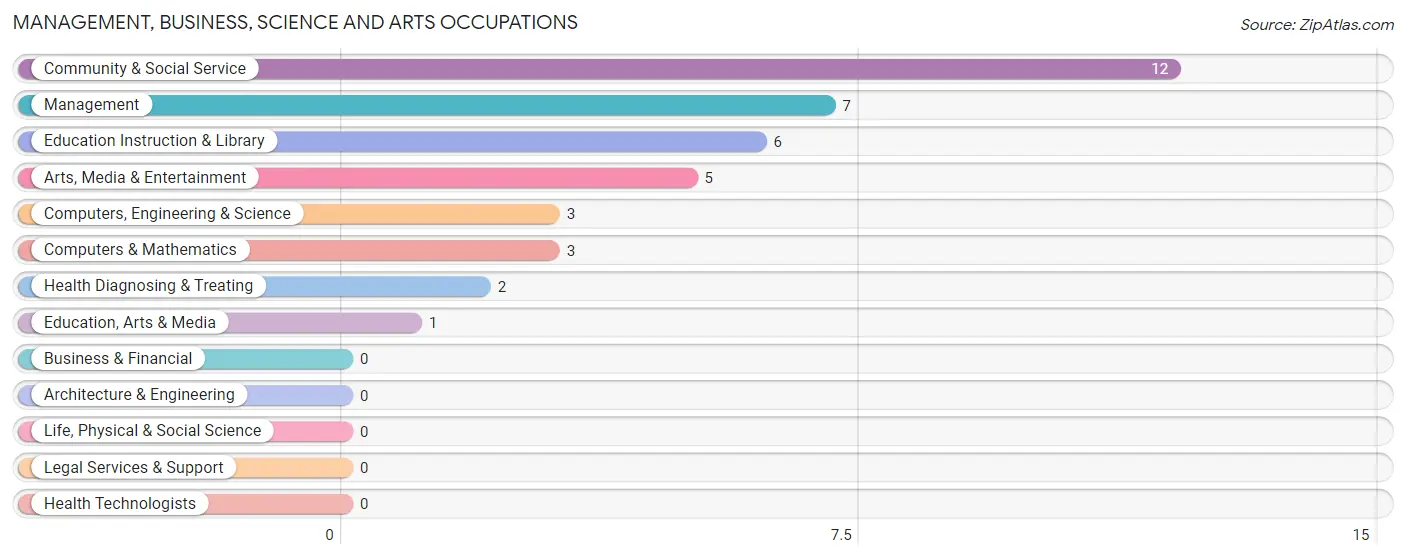
Management, Business, Science and Arts Occupations
The most common Management, Business, Science and Arts occupations in Mesick are Community & Social Service (12 | 9.0%), Management (7 | 5.3%), Education Instruction & Library (6 | 4.5%), Arts, Media & Entertainment (5 | 3.8%), and Computers, Engineering & Science (3 | 2.3%).
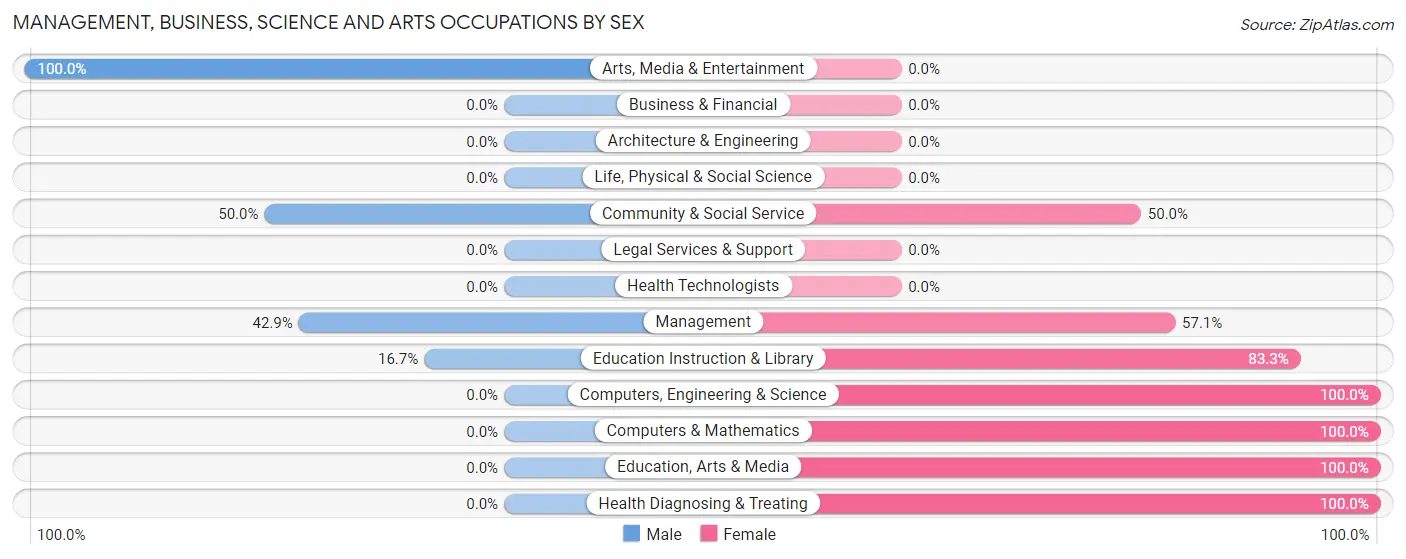
Management, Business, Science and Arts Occupations by Sex
Within the Management, Business, Science and Arts occupations in Mesick, the most male-oriented occupations are Arts, Media & Entertainment (100.0%), Community & Social Service (50.0%), and Management (42.9%), while the most female-oriented occupations are Computers, Engineering & Science (100.0%), Computers & Mathematics (100.0%), and Education, Arts & Media (100.0%).
| Occupation | Male | Female |
| Management | 3 (42.9%) | 4 (57.1%) |
| Business & Financial | 0 (0.0%) | 0 (0.0%) |
| Computers, Engineering & Science | 0 (0.0%) | 3 (100.0%) |
| Computers & Mathematics | 0 (0.0%) | 3 (100.0%) |
| Architecture & Engineering | 0 (0.0%) | 0 (0.0%) |
| Life, Physical & Social Science | 0 (0.0%) | 0 (0.0%) |
| Community & Social Service | 6 (50.0%) | 6 (50.0%) |
| Education, Arts & Media | 0 (0.0%) | 1 (100.0%) |
| Legal Services & Support | 0 (0.0%) | 0 (0.0%) |
| Education Instruction & Library | 1 (16.7%) | 5 (83.3%) |
| Arts, Media & Entertainment | 5 (100.0%) | 0 (0.0%) |
| Health Diagnosing & Treating | 0 (0.0%) | 2 (100.0%) |
| Health Technologists | 0 (0.0%) | 0 (0.0%) |
| Total (Category) | 9 (37.5%) | 15 (62.5%) |
| Total (Overall) | 55 (41.3%) | 78 (58.7%) |
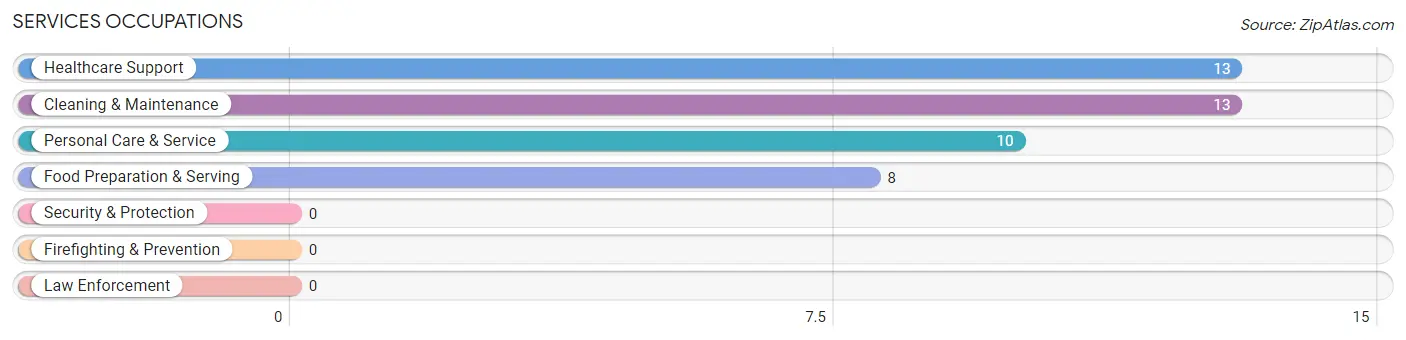
Services Occupations
The most common Services occupations in Mesick are Healthcare Support (13 | 9.8%), Cleaning & Maintenance (13 | 9.8%), Personal Care & Service (10 | 7.5%), and Food Preparation & Serving (8 | 6.0%).
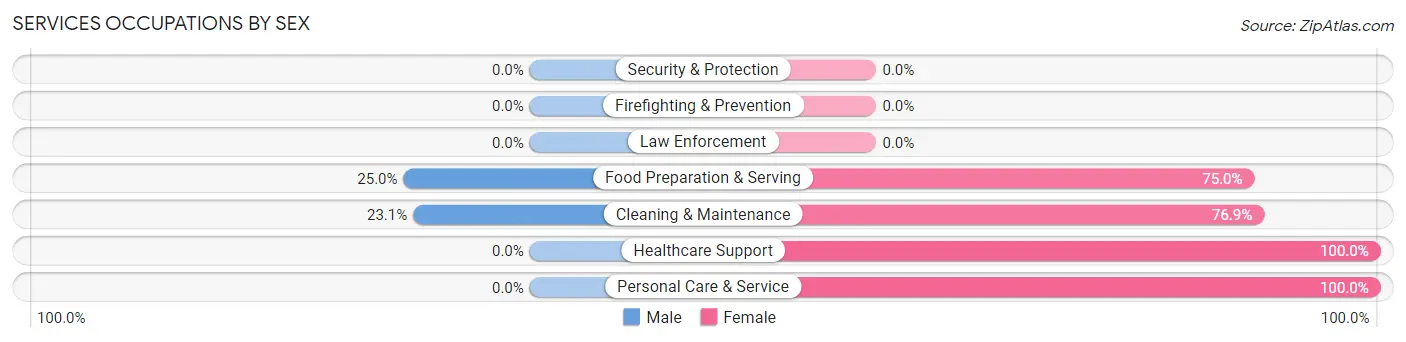
Services Occupations by Sex
Within the Services occupations in Mesick, the most male-oriented occupations are Food Preparation & Serving (25.0%), and Cleaning & Maintenance (23.1%), while the most female-oriented occupations are Healthcare Support (100.0%), Personal Care & Service (100.0%), and Cleaning & Maintenance (76.9%).
| Occupation | Male | Female |
| Healthcare Support | 0 (0.0%) | 13 (100.0%) |
| Security & Protection | 0 (0.0%) | 0 (0.0%) |
| Firefighting & Prevention | 0 (0.0%) | 0 (0.0%) |
| Law Enforcement | 0 (0.0%) | 0 (0.0%) |
| Food Preparation & Serving | 2 (25.0%) | 6 (75.0%) |
| Cleaning & Maintenance | 3 (23.1%) | 10 (76.9%) |
| Personal Care & Service | 0 (0.0%) | 10 (100.0%) |
| Total (Category) | 5 (11.4%) | 39 (88.6%) |
| Total (Overall) | 55 (41.3%) | 78 (58.7%) |
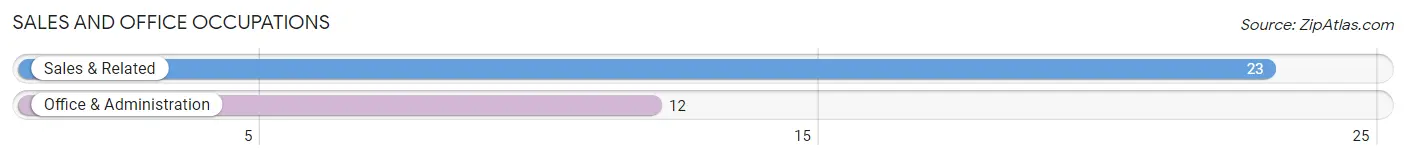
Sales and Office Occupations
The most common Sales and Office occupations in Mesick are Sales & Related (23 | 17.3%), and Office & Administration (12 | 9.0%).
Sales and Office Occupations by Sex
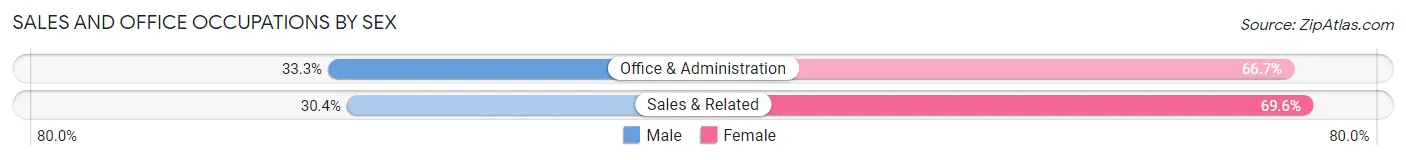
| Occupation | Male | Female |
| Sales & Related | 7 (30.4%) | 16 (69.6%) |
| Office & Administration | 4 (33.3%) | 8 (66.7%) |
| Total (Category) | 11 (31.4%) | 24 (68.6%) |
| Total (Overall) | 55 (41.3%) | 78 (58.7%) |
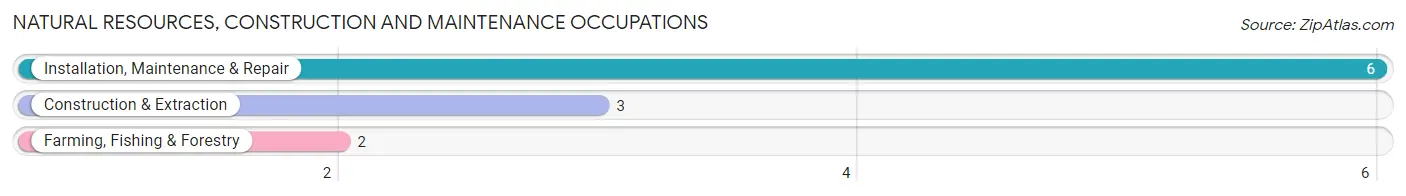
Natural Resources, Construction and Maintenance Occupations
The most common Natural Resources, Construction and Maintenance occupations in Mesick are Installation, Maintenance & Repair (6 | 4.5%), Construction & Extraction (3 | 2.3%), and Farming, Fishing & Forestry (2 | 1.5%).
Natural Resources, Construction and Maintenance Occupations by Sex
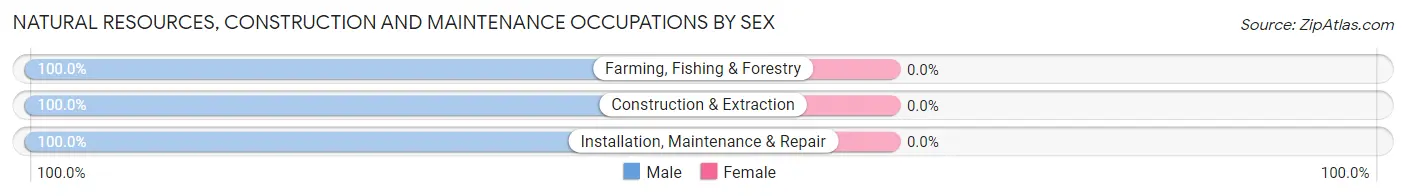
| Occupation | Male | Female |
| Farming, Fishing & Forestry | 2 (100.0%) | 0 (0.0%) |
| Construction & Extraction | 3 (100.0%) | 0 (0.0%) |
| Installation, Maintenance & Repair | 6 (100.0%) | 0 (0.0%) |
| Total (Category) | 11 (100.0%) | 0 (0.0%) |
| Total (Overall) | 55 (41.3%) | 78 (58.7%) |
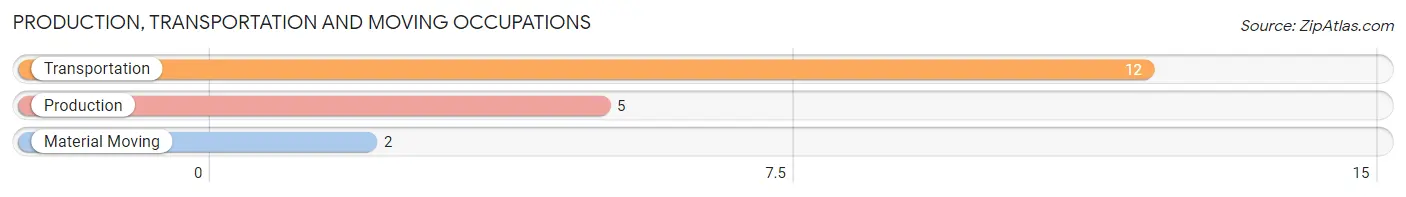
Production, Transportation and Moving Occupations
The most common Production, Transportation and Moving occupations in Mesick are Transportation (12 | 9.0%), Production (5 | 3.8%), and Material Moving (2 | 1.5%).
Production, Transportation and Moving Occupations by Sex
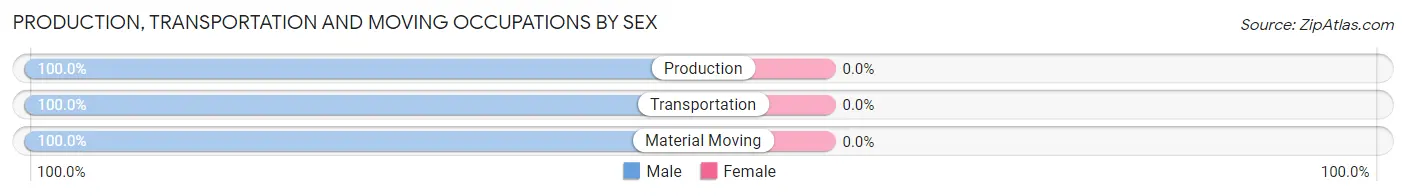
| Occupation | Male | Female |
| Production | 5 (100.0%) | 0 (0.0%) |
| Transportation | 12 (100.0%) | 0 (0.0%) |
| Material Moving | 2 (100.0%) | 0 (0.0%) |
| Total (Category) | 19 (100.0%) | 0 (0.0%) |
| Total (Overall) | 55 (41.3%) | 78 (58.7%) |
Employment Industries by Sex in Mesick
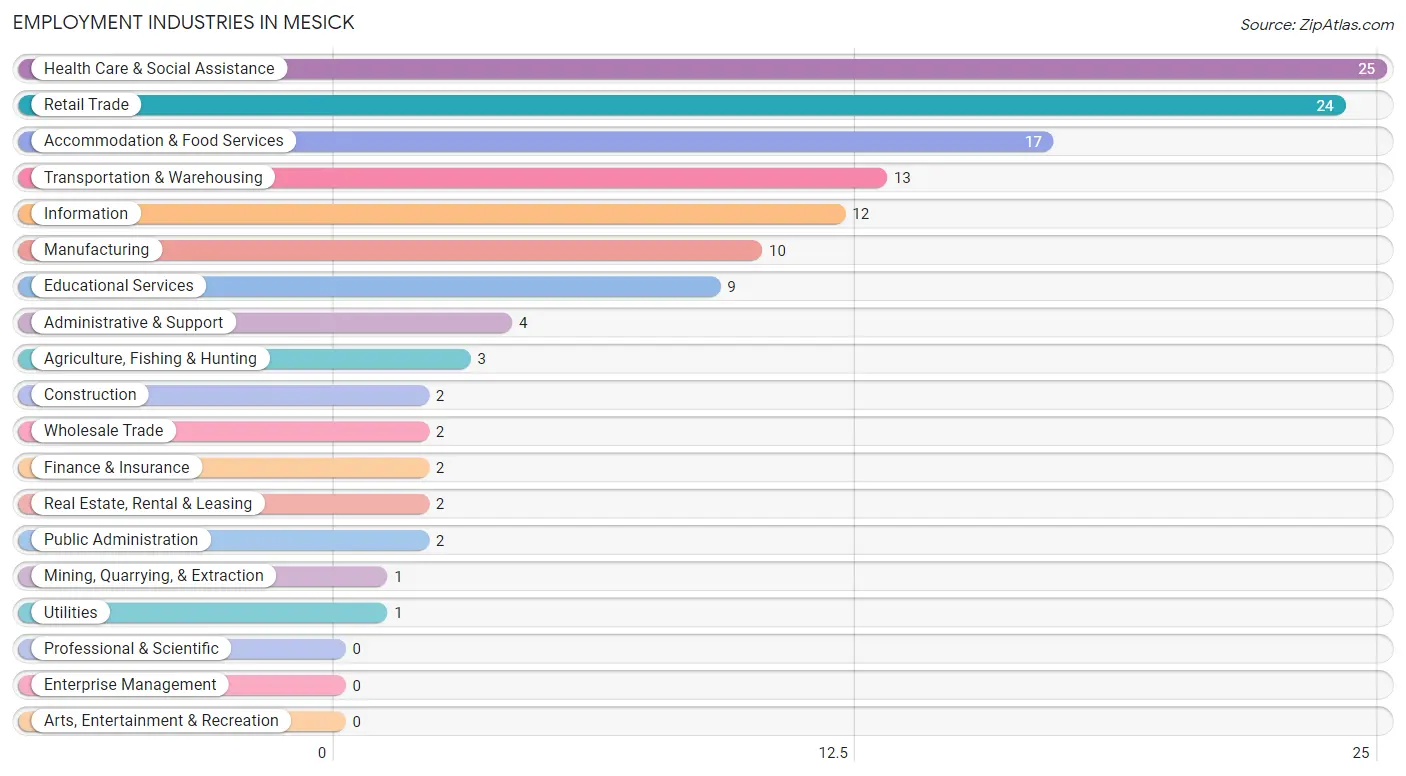
Employment Industries in Mesick
The major employment industries in Mesick include Health Care & Social Assistance (25 | 18.8%), Retail Trade (24 | 18.0%), Accommodation & Food Services (17 | 12.8%), Transportation & Warehousing (13 | 9.8%), and Information (12 | 9.0%).
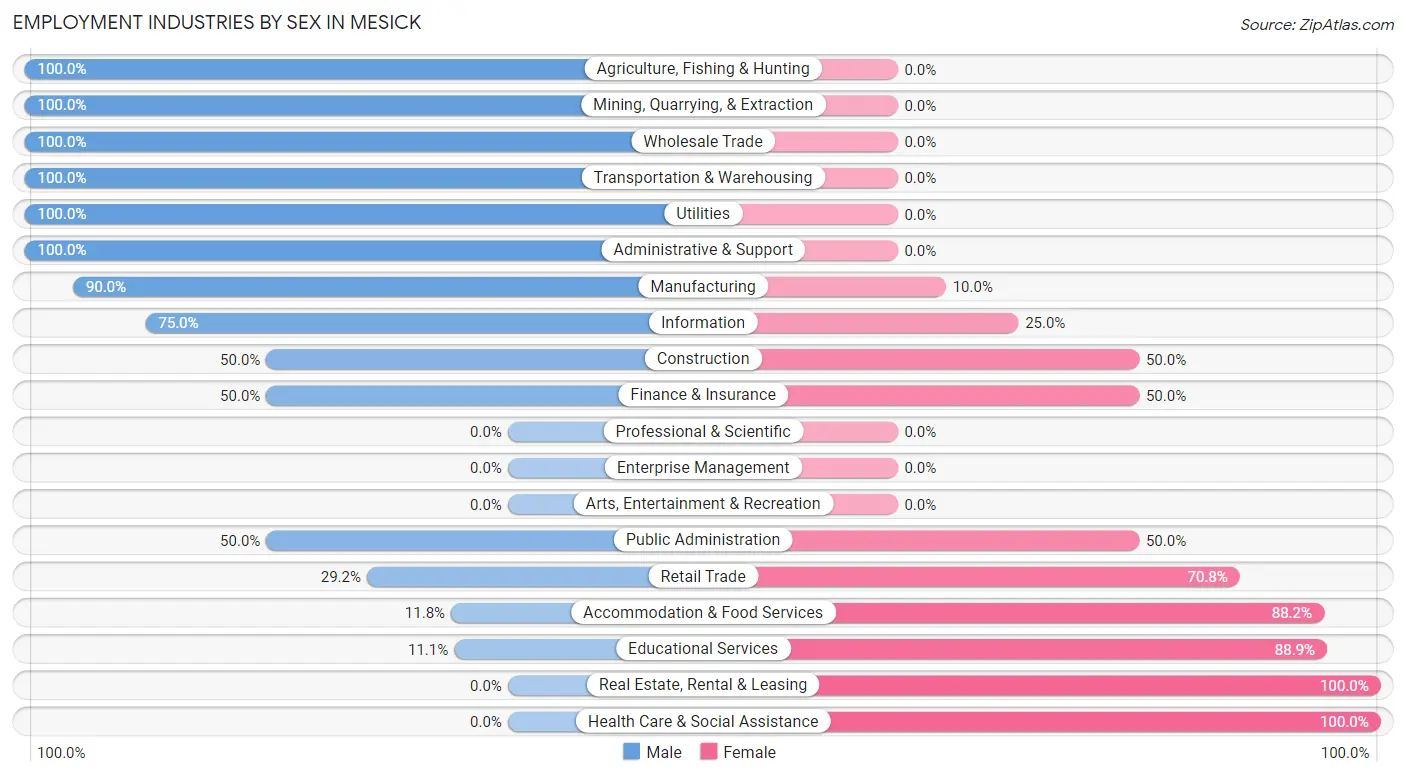
Employment Industries by Sex in Mesick
The Mesick industries that see more men than women are Agriculture, Fishing & Hunting (100.0%), Mining, Quarrying, & Extraction (100.0%), and Wholesale Trade (100.0%), whereas the industries that tend to have a higher number of women are Real Estate, Rental & Leasing (100.0%), Health Care & Social Assistance (100.0%), and Educational Services (88.9%).
| Industry | Male | Female |
| Agriculture, Fishing & Hunting | 3 (100.0%) | 0 (0.0%) |
| Mining, Quarrying, & Extraction | 1 (100.0%) | 0 (0.0%) |
| Construction | 1 (50.0%) | 1 (50.0%) |
| Manufacturing | 9 (90.0%) | 1 (10.0%) |
| Wholesale Trade | 2 (100.0%) | 0 (0.0%) |
| Retail Trade | 7 (29.2%) | 17 (70.8%) |
| Transportation & Warehousing | 13 (100.0%) | 0 (0.0%) |
| Utilities | 1 (100.0%) | 0 (0.0%) |
| Information | 9 (75.0%) | 3 (25.0%) |
| Finance & Insurance | 1 (50.0%) | 1 (50.0%) |
| Real Estate, Rental & Leasing | 0 (0.0%) | 2 (100.0%) |
| Professional & Scientific | 0 (0.0%) | 0 (0.0%) |
| Enterprise Management | 0 (0.0%) | 0 (0.0%) |
| Administrative & Support | 4 (100.0%) | 0 (0.0%) |
| Educational Services | 1 (11.1%) | 8 (88.9%) |
| Health Care & Social Assistance | 0 (0.0%) | 25 (100.0%) |
| Arts, Entertainment & Recreation | 0 (0.0%) | 0 (0.0%) |
| Accommodation & Food Services | 2 (11.8%) | 15 (88.2%) |
| Public Administration | 1 (50.0%) | 1 (50.0%) |
| Total | 55 (41.3%) | 78 (58.7%) |
Education in Mesick
School Enrollment in Mesick
The most common levels of schooling among the 95 students in Mesick are middle school (31 | 32.6%), elementary school (23 | 24.2%), and high school (23 | 24.2%).
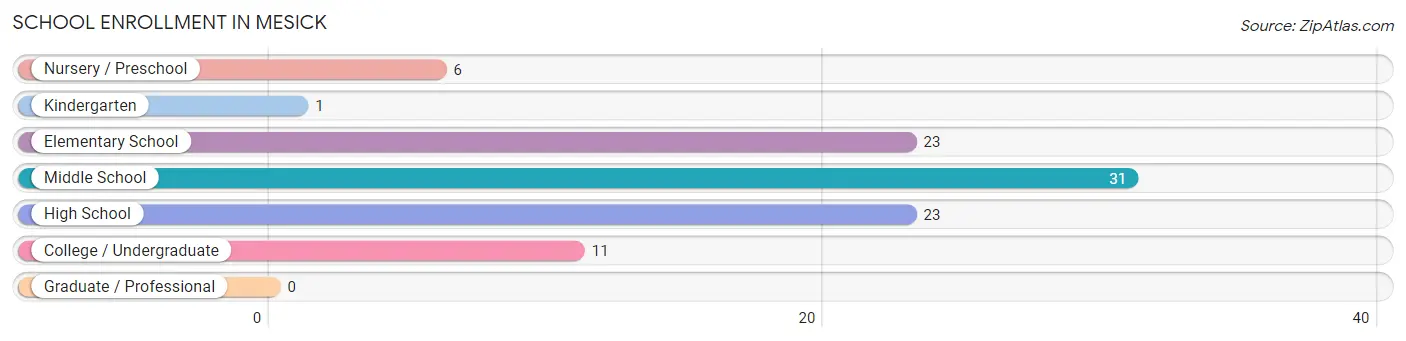
| School Level | # Students | % Students |
| Nursery / Preschool | 6 | 6.3% |
| Kindergarten | 1 | 1.1% |
| Elementary School | 23 | 24.2% |
| Middle School | 31 | 32.6% |
| High School | 23 | 24.2% |
| College / Undergraduate | 11 | 11.6% |
| Graduate / Professional | 0 | 0.0% |
| Total | 95 | 100.0% |
School Enrollment by Age by Funding Source in Mesick
Out of a total of 95 students who are enrolled in schools in Mesick, 31 (32.6%) attend a private institution, while the remaining 64 (67.4%) are enrolled in public schools. The age group of 20 to 24 year olds has the highest likelihood of being enrolled in private schools, with 6 (75.0% in the age bracket) enrolled. Conversely, the age group of 18 to 19 year olds has the lowest likelihood of being enrolled in a private school, with 1 (100.0% in the age bracket) attending a public institution.
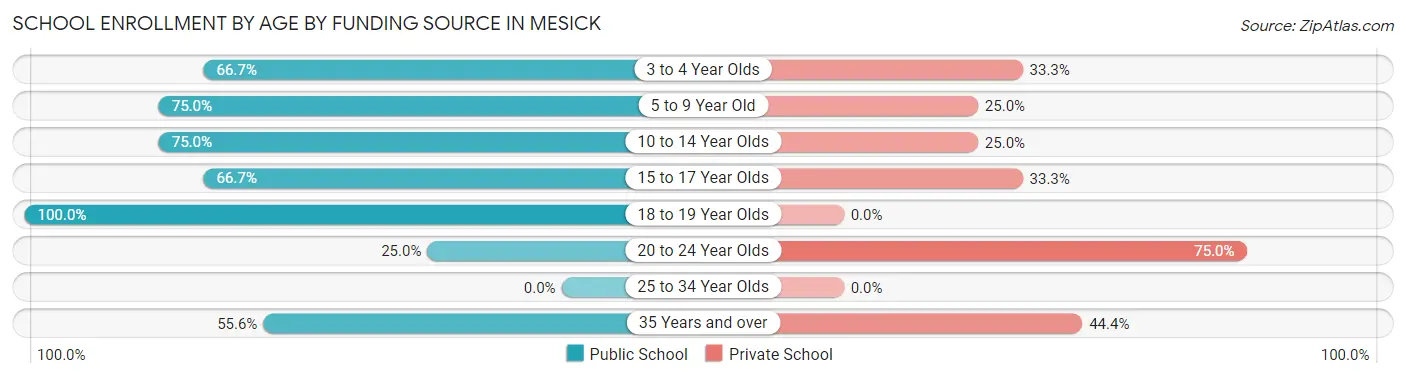
| Age Bracket | Public School | Private School |
| 3 to 4 Year Olds | 4 (66.7%) | 2 (33.3%) |
| 5 to 9 Year Old | 12 (75.0%) | 4 (25.0%) |
| 10 to 14 Year Olds | 30 (75.0%) | 10 (25.0%) |
| 15 to 17 Year Olds | 10 (66.7%) | 5 (33.3%) |
| 18 to 19 Year Olds | 1 (100.0%) | 0 (0.0%) |
| 20 to 24 Year Olds | 2 (25.0%) | 6 (75.0%) |
| 25 to 34 Year Olds | 0 (0.0%) | 0 (0.0%) |
| 35 Years and over | 5 (55.6%) | 4 (44.4%) |
| Total | 64 (67.4%) | 31 (32.6%) |
Educational Attainment by Field of Study in Mesick
Education (9 | 34.6%), science & technology (5 | 19.2%), social sciences (4 | 15.4%), arts & humanities (3 | 11.5%), and business (2 | 7.7%) are the most common fields of study among 26 individuals in Mesick who have obtained a bachelor's degree or higher.
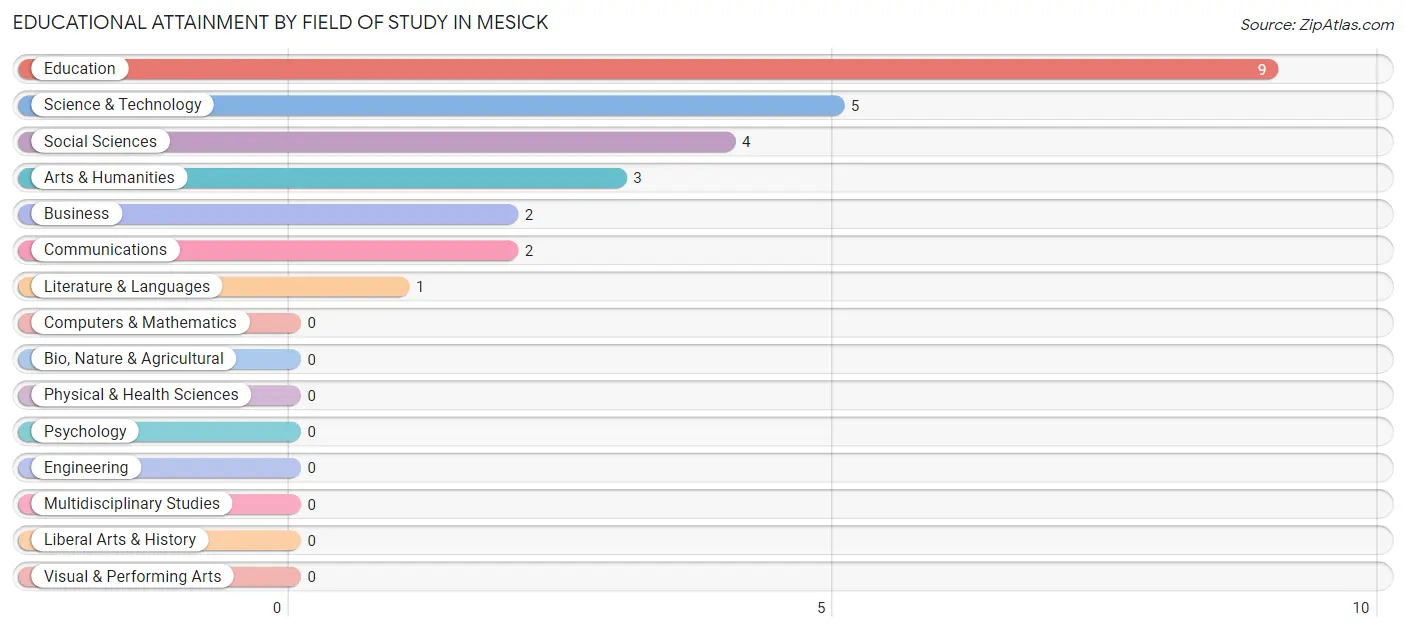
| Field of Study | # Graduates | % Graduates |
| Computers & Mathematics | 0 | 0.0% |
| Bio, Nature & Agricultural | 0 | 0.0% |
| Physical & Health Sciences | 0 | 0.0% |
| Psychology | 0 | 0.0% |
| Social Sciences | 4 | 15.4% |
| Engineering | 0 | 0.0% |
| Multidisciplinary Studies | 0 | 0.0% |
| Science & Technology | 5 | 19.2% |
| Business | 2 | 7.7% |
| Education | 9 | 34.6% |
| Literature & Languages | 1 | 3.8% |
| Liberal Arts & History | 0 | 0.0% |
| Visual & Performing Arts | 0 | 0.0% |
| Communications | 2 | 7.7% |
| Arts & Humanities | 3 | 11.5% |
| Total | 26 | 100.0% |
Transportation & Commute in Mesick
Vehicle Availability by Sex in Mesick
The most prevalent vehicle ownership categories in Mesick are males with 3 vehicles (21, accounting for 38.2%) and females with 3 vehicles (12, making up 26.9%).
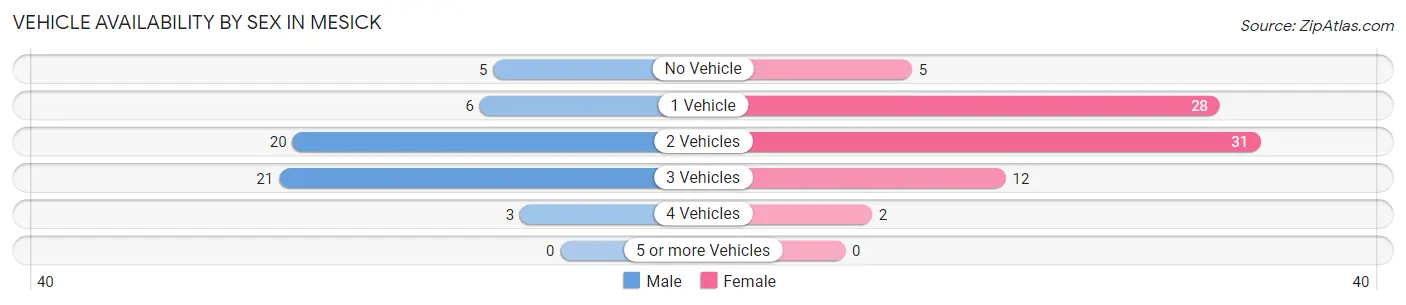
| Vehicles Available | Male | Female |
| No Vehicle | 5 (9.1%) | 5 (6.4%) |
| 1 Vehicle | 6 (10.9%) | 28 (35.9%) |
| 2 Vehicles | 20 (36.4%) | 31 (39.7%) |
| 3 Vehicles | 21 (38.2%) | 12 (15.4%) |
| 4 Vehicles | 3 (5.4%) | 2 (2.6%) |
| 5 or more Vehicles | 0 (0.0%) | 0 (0.0%) |
| Total | 55 (100.0%) | 78 (100.0%) |
Commute Time in Mesick
The most frequently occuring commute durations in Mesick are 5 to 9 minutes (35 commuters, 28.7%), 30 to 34 minutes (22 commuters, 18.0%), and less than 5 minutes (20 commuters, 16.4%).
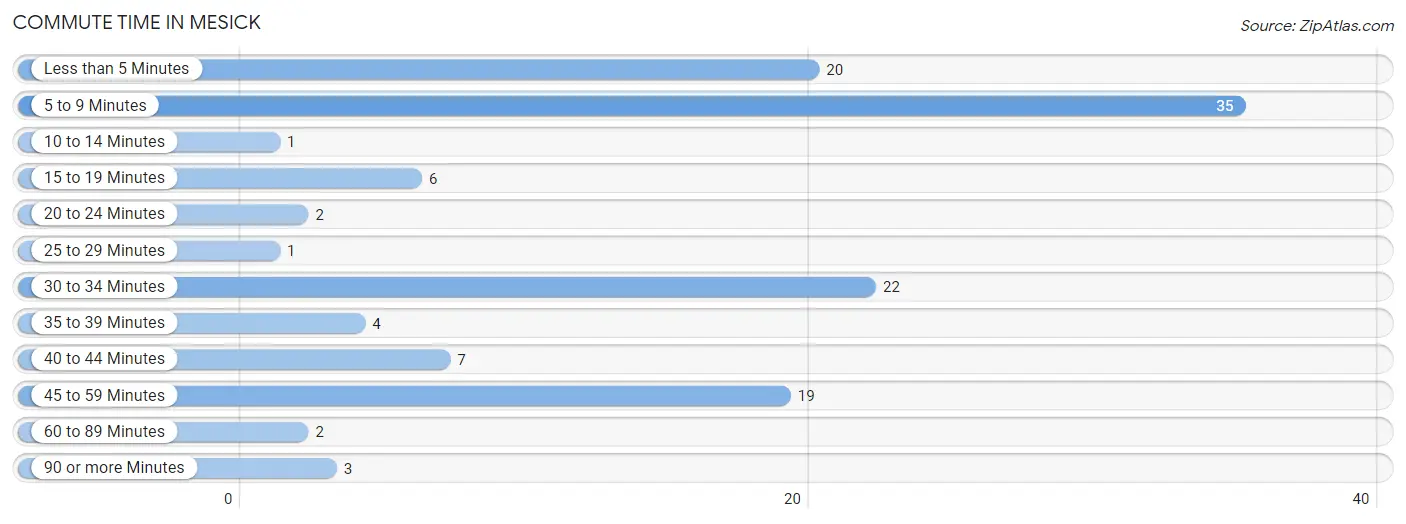
| Commute Time | # Commuters | % Commuters |
| Less than 5 Minutes | 20 | 16.4% |
| 5 to 9 Minutes | 35 | 28.7% |
| 10 to 14 Minutes | 1 | 0.8% |
| 15 to 19 Minutes | 6 | 4.9% |
| 20 to 24 Minutes | 2 | 1.6% |
| 25 to 29 Minutes | 1 | 0.8% |
| 30 to 34 Minutes | 22 | 18.0% |
| 35 to 39 Minutes | 4 | 3.3% |
| 40 to 44 Minutes | 7 | 5.7% |
| 45 to 59 Minutes | 19 | 15.6% |
| 60 to 89 Minutes | 2 | 1.6% |
| 90 or more Minutes | 3 | 2.5% |
Commute Time by Sex in Mesick
The most common commute times in Mesick are 5 to 9 minutes (18 commuters, 34.6%) for males and less than 5 minutes (18 commuters, 25.7%) for females.
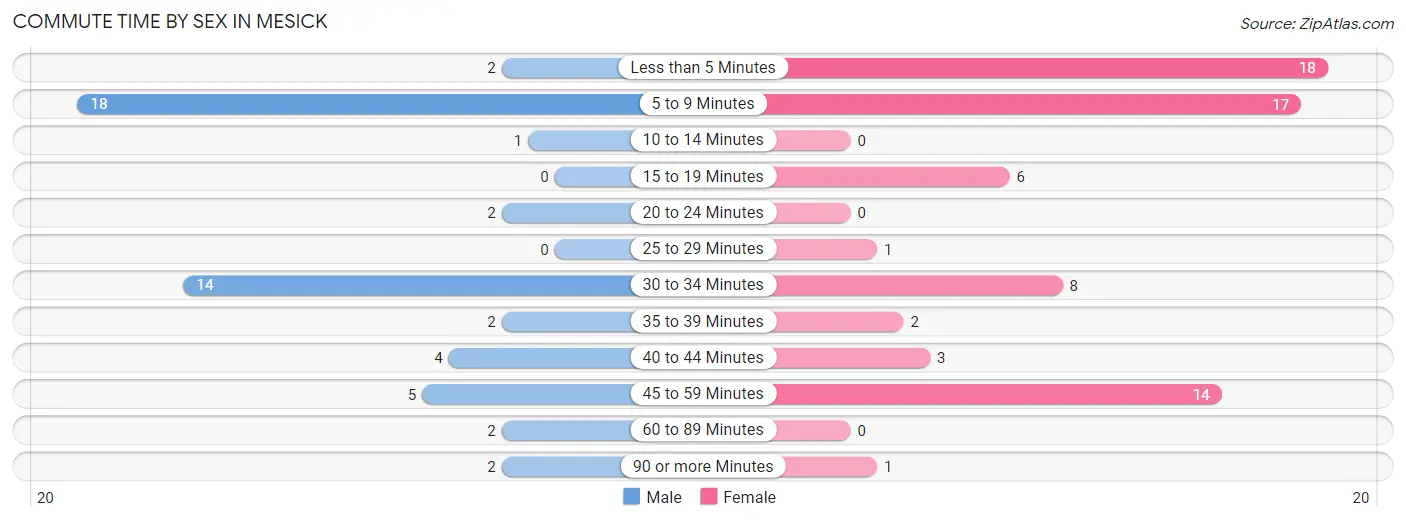
| Commute Time | Male | Female |
| Less than 5 Minutes | 2 (3.8%) | 18 (25.7%) |
| 5 to 9 Minutes | 18 (34.6%) | 17 (24.3%) |
| 10 to 14 Minutes | 1 (1.9%) | 0 (0.0%) |
| 15 to 19 Minutes | 0 (0.0%) | 6 (8.6%) |
| 20 to 24 Minutes | 2 (3.8%) | 0 (0.0%) |
| 25 to 29 Minutes | 0 (0.0%) | 1 (1.4%) |
| 30 to 34 Minutes | 14 (26.9%) | 8 (11.4%) |
| 35 to 39 Minutes | 2 (3.8%) | 2 (2.9%) |
| 40 to 44 Minutes | 4 (7.7%) | 3 (4.3%) |
| 45 to 59 Minutes | 5 (9.6%) | 14 (20.0%) |
| 60 to 89 Minutes | 2 (3.8%) | 0 (0.0%) |
| 90 or more Minutes | 2 (3.8%) | 1 (1.4%) |
Time of Departure to Work by Sex in Mesick
The most frequent times of departure to work in Mesick are 7:30 AM to 7:59 AM (17, 32.7%) for males and 7:30 AM to 7:59 AM (14, 20.0%) for females.
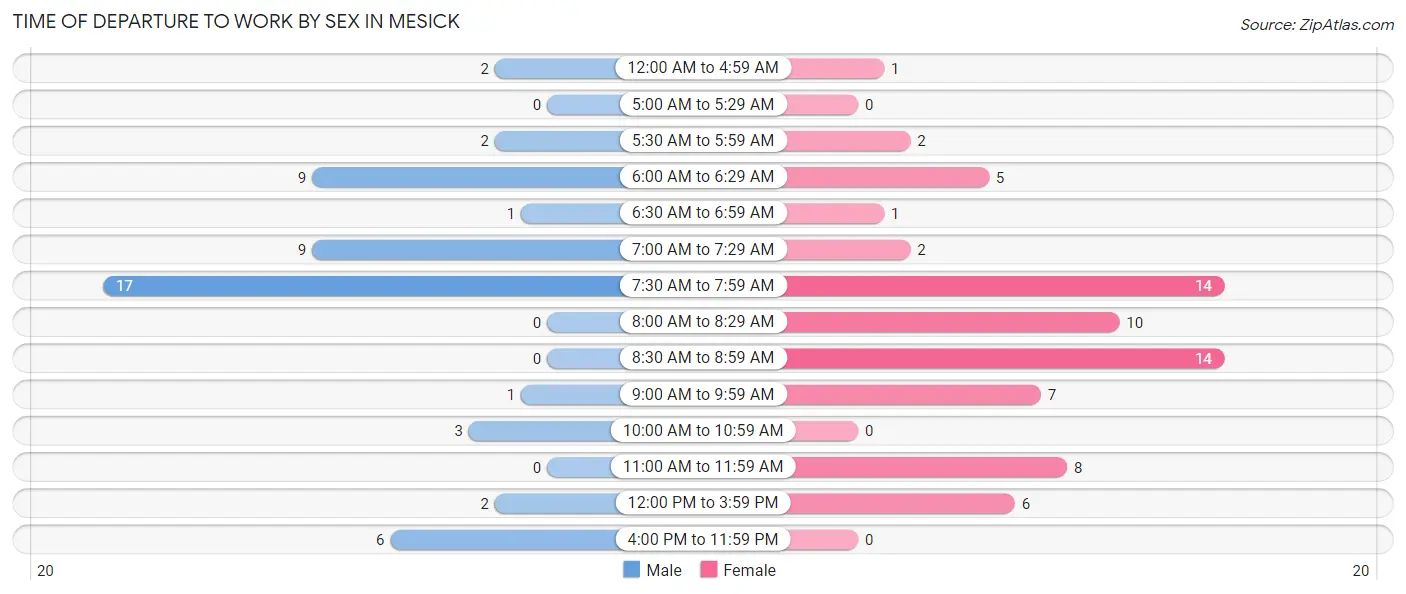
| Time of Departure | Male | Female |
| 12:00 AM to 4:59 AM | 2 (3.8%) | 1 (1.4%) |
| 5:00 AM to 5:29 AM | 0 (0.0%) | 0 (0.0%) |
| 5:30 AM to 5:59 AM | 2 (3.8%) | 2 (2.9%) |
| 6:00 AM to 6:29 AM | 9 (17.3%) | 5 (7.1%) |
| 6:30 AM to 6:59 AM | 1 (1.9%) | 1 (1.4%) |
| 7:00 AM to 7:29 AM | 9 (17.3%) | 2 (2.9%) |
| 7:30 AM to 7:59 AM | 17 (32.7%) | 14 (20.0%) |
| 8:00 AM to 8:29 AM | 0 (0.0%) | 10 (14.3%) |
| 8:30 AM to 8:59 AM | 0 (0.0%) | 14 (20.0%) |
| 9:00 AM to 9:59 AM | 1 (1.9%) | 7 (10.0%) |
| 10:00 AM to 10:59 AM | 3 (5.8%) | 0 (0.0%) |
| 11:00 AM to 11:59 AM | 0 (0.0%) | 8 (11.4%) |
| 12:00 PM to 3:59 PM | 2 (3.8%) | 6 (8.6%) |
| 4:00 PM to 11:59 PM | 6 (11.5%) | 0 (0.0%) |
| Total | 52 (100.0%) | 70 (100.0%) |
Housing Occupancy in Mesick
Occupancy by Ownership in Mesick
Of the total 150 dwellings in Mesick, owner-occupied units account for 100 (66.7%), while renter-occupied units make up 50 (33.3%).
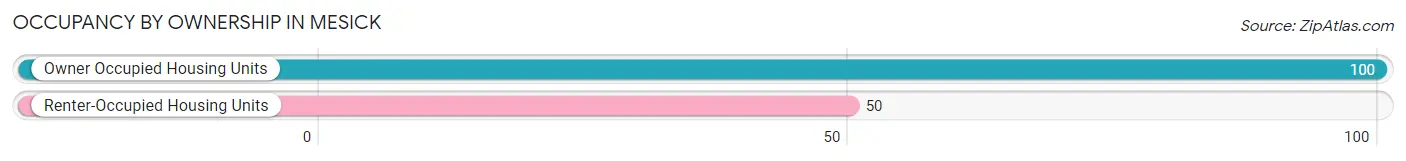
| Occupancy | # Housing Units | % Housing Units |
| Owner Occupied Housing Units | 100 | 66.7% |
| Renter-Occupied Housing Units | 50 | 33.3% |
| Total Occupied Housing Units | 150 | 100.0% |
Occupancy by Household Size in Mesick
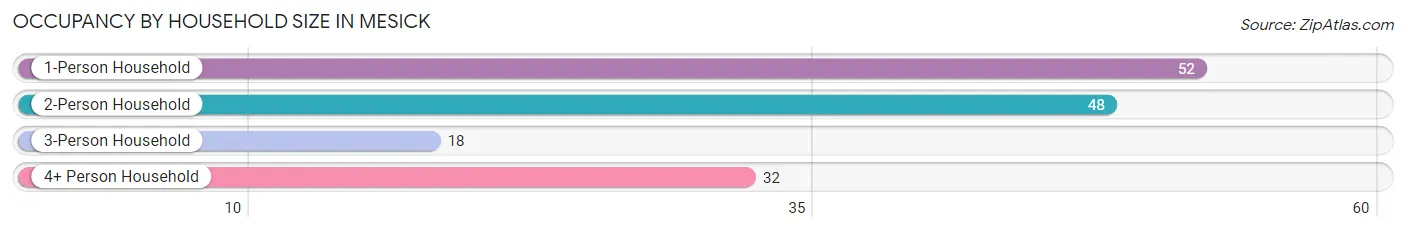
| Household Size | # Housing Units | % Housing Units |
| 1-Person Household | 52 | 34.7% |
| 2-Person Household | 48 | 32.0% |
| 3-Person Household | 18 | 12.0% |
| 4+ Person Household | 32 | 21.3% |
| Total Housing Units | 150 | 100.0% |
Occupancy by Ownership by Household Size in Mesick
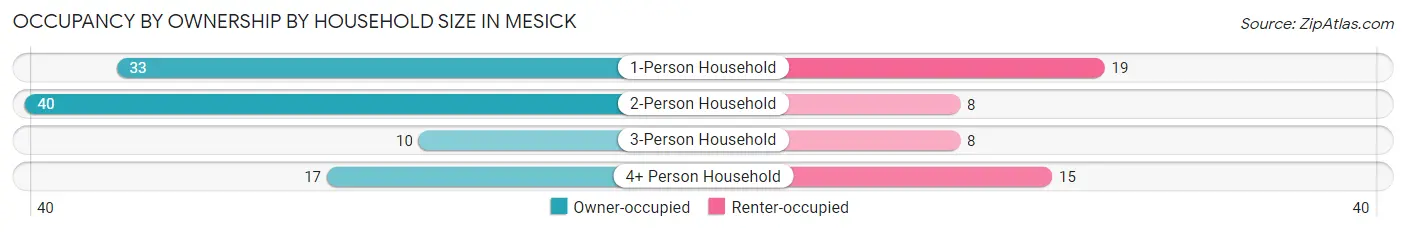
| Household Size | Owner-occupied | Renter-occupied |
| 1-Person Household | 33 (63.5%) | 19 (36.5%) |
| 2-Person Household | 40 (83.3%) | 8 (16.7%) |
| 3-Person Household | 10 (55.6%) | 8 (44.4%) |
| 4+ Person Household | 17 (53.1%) | 15 (46.9%) |
| Total Housing Units | 100 (66.7%) | 50 (33.3%) |
Occupancy by Educational Attainment in Mesick
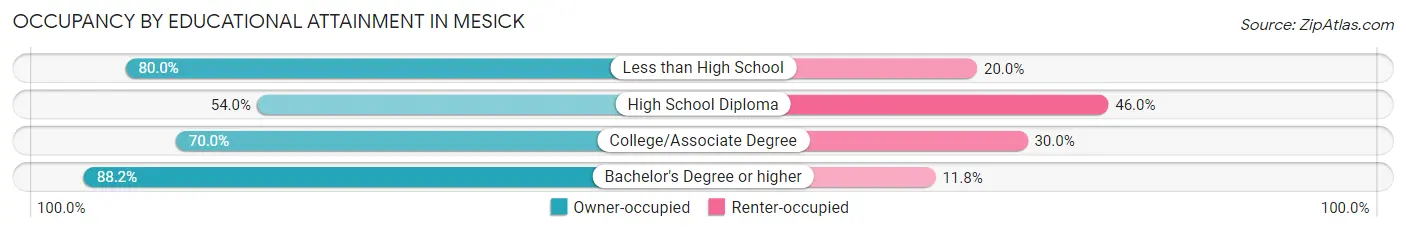
| Household Size | Owner-occupied | Renter-occupied |
| Less than High School | 16 (80.0%) | 4 (20.0%) |
| High School Diploma | 34 (54.0%) | 29 (46.0%) |
| College/Associate Degree | 35 (70.0%) | 15 (30.0%) |
| Bachelor's Degree or higher | 15 (88.2%) | 2 (11.8%) |
Occupancy by Age of Householder in Mesick
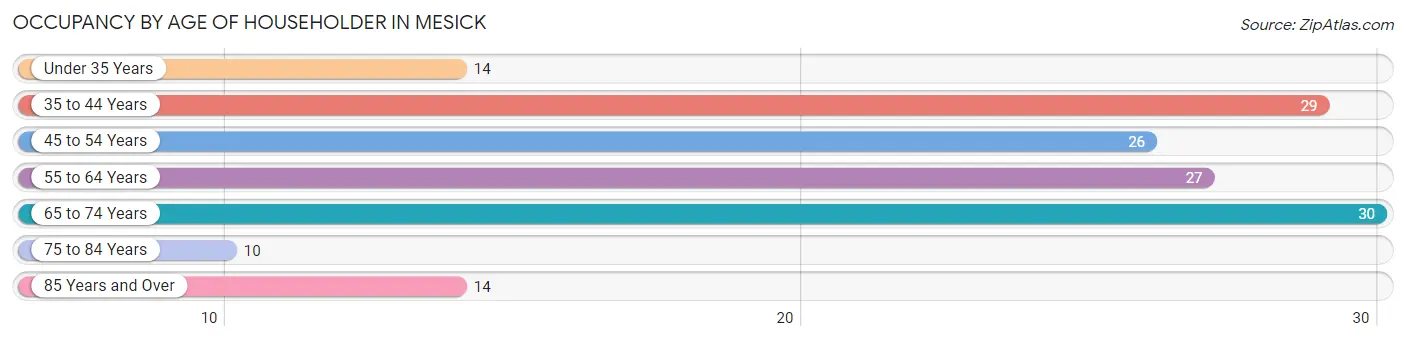
| Age Bracket | # Households | % Households |
| Under 35 Years | 14 | 9.3% |
| 35 to 44 Years | 29 | 19.3% |
| 45 to 54 Years | 26 | 17.3% |
| 55 to 64 Years | 27 | 18.0% |
| 65 to 74 Years | 30 | 20.0% |
| 75 to 84 Years | 10 | 6.7% |
| 85 Years and Over | 14 | 9.3% |
| Total | 150 | 100.0% |
Housing Finances in Mesick
Median Income by Occupancy in Mesick
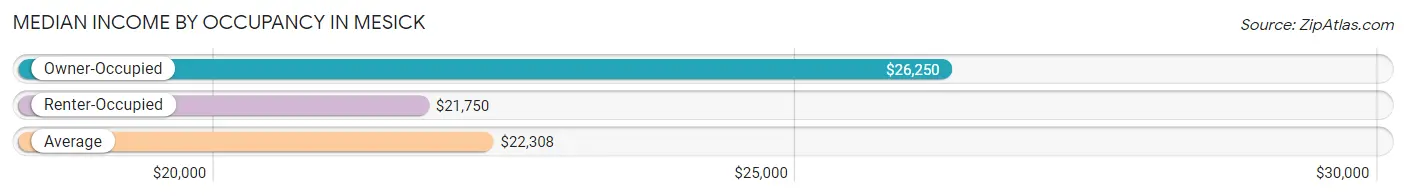
| Occupancy Type | # Households | Median Income |
| Owner-Occupied | 100 (66.7%) | $26,250 |
| Renter-Occupied | 50 (33.3%) | $21,750 |
| Average | 150 (100.0%) | $22,308 |
Occupancy by Householder Income Bracket in Mesick
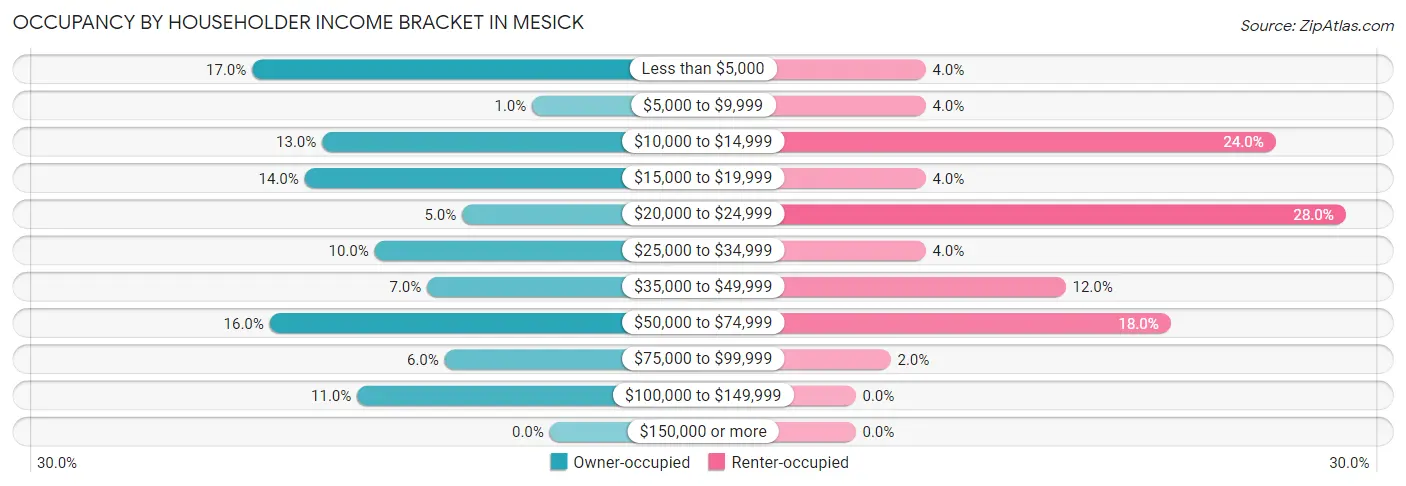
| Income Bracket | Owner-occupied | Renter-occupied |
| Less than $5,000 | 17 (17.0%) | 2 (4.0%) |
| $5,000 to $9,999 | 1 (1.0%) | 2 (4.0%) |
| $10,000 to $14,999 | 13 (13.0%) | 12 (24.0%) |
| $15,000 to $19,999 | 14 (14.0%) | 2 (4.0%) |
| $20,000 to $24,999 | 5 (5.0%) | 14 (28.0%) |
| $25,000 to $34,999 | 10 (10.0%) | 2 (4.0%) |
| $35,000 to $49,999 | 7 (7.0%) | 6 (12.0%) |
| $50,000 to $74,999 | 16 (16.0%) | 9 (18.0%) |
| $75,000 to $99,999 | 6 (6.0%) | 1 (2.0%) |
| $100,000 to $149,999 | 11 (11.0%) | 0 (0.0%) |
| $150,000 or more | 0 (0.0%) | 0 (0.0%) |
| Total | 100 (100.0%) | 50 (100.0%) |
Monthly Housing Cost Tiers in Mesick
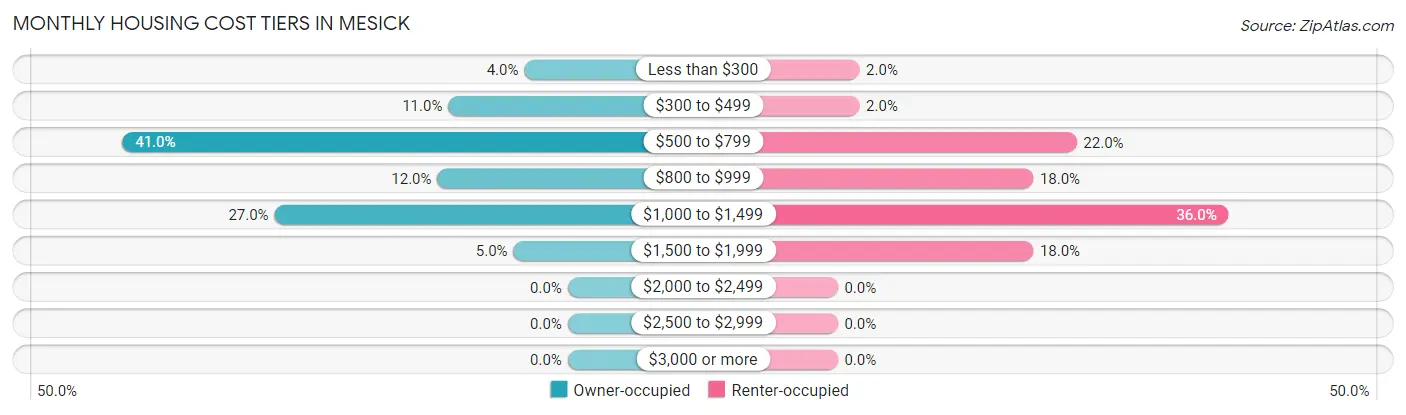
| Monthly Cost | Owner-occupied | Renter-occupied |
| Less than $300 | 4 (4.0%) | 1 (2.0%) |
| $300 to $499 | 11 (11.0%) | 1 (2.0%) |
| $500 to $799 | 41 (41.0%) | 11 (22.0%) |
| $800 to $999 | 12 (12.0%) | 9 (18.0%) |
| $1,000 to $1,499 | 27 (27.0%) | 18 (36.0%) |
| $1,500 to $1,999 | 5 (5.0%) | 9 (18.0%) |
| $2,000 to $2,499 | 0 (0.0%) | 0 (0.0%) |
| $2,500 to $2,999 | 0 (0.0%) | 0 (0.0%) |
| $3,000 or more | 0 (0.0%) | 0 (0.0%) |
| Total | 100 (100.0%) | 50 (100.0%) |
Physical Housing Characteristics in Mesick
Housing Structures in Mesick
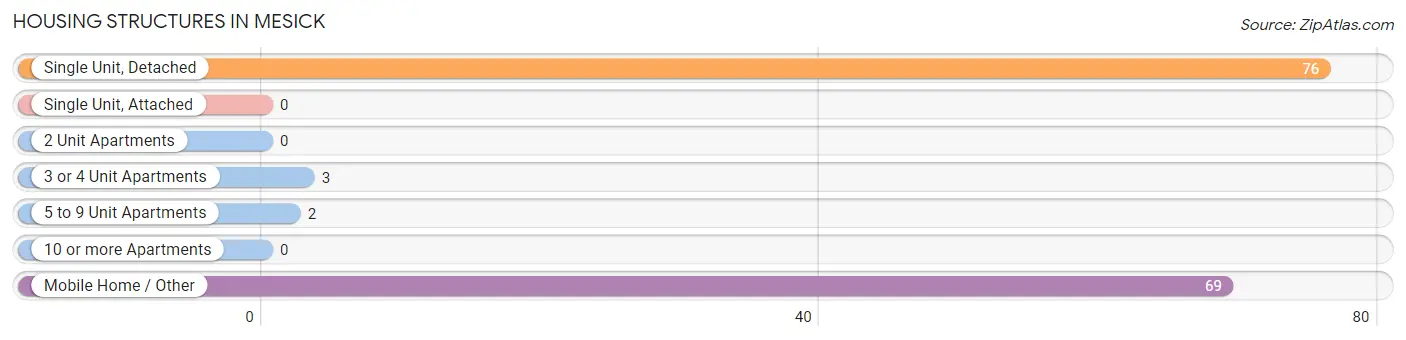
| Structure Type | # Housing Units | % Housing Units |
| Single Unit, Detached | 76 | 50.7% |
| Single Unit, Attached | 0 | 0.0% |
| 2 Unit Apartments | 0 | 0.0% |
| 3 or 4 Unit Apartments | 3 | 2.0% |
| 5 to 9 Unit Apartments | 2 | 1.3% |
| 10 or more Apartments | 0 | 0.0% |
| Mobile Home / Other | 69 | 46.0% |
| Total | 150 | 100.0% |
Housing Structures by Occupancy in Mesick
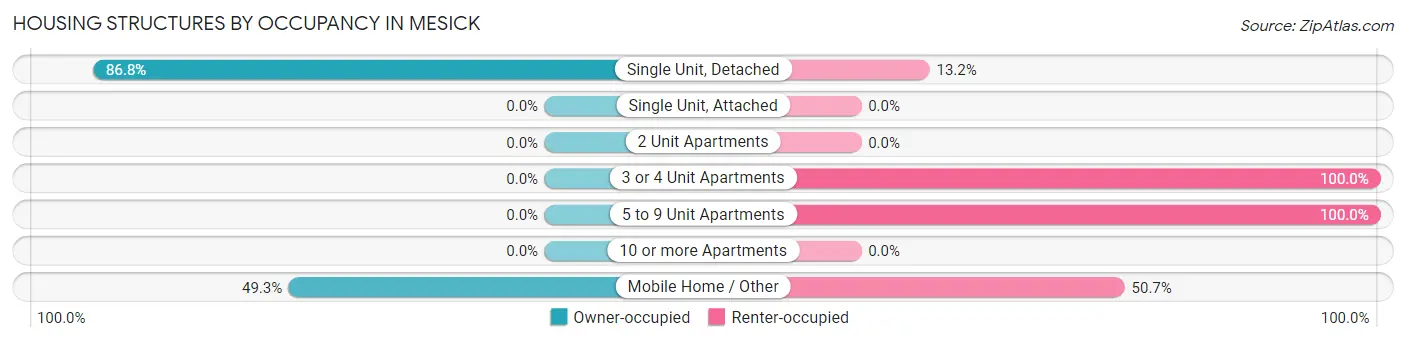
| Structure Type | Owner-occupied | Renter-occupied |
| Single Unit, Detached | 66 (86.8%) | 10 (13.2%) |
| Single Unit, Attached | 0 (0.0%) | 0 (0.0%) |
| 2 Unit Apartments | 0 (0.0%) | 0 (0.0%) |
| 3 or 4 Unit Apartments | 0 (0.0%) | 3 (100.0%) |
| 5 to 9 Unit Apartments | 0 (0.0%) | 2 (100.0%) |
| 10 or more Apartments | 0 (0.0%) | 0 (0.0%) |
| Mobile Home / Other | 34 (49.3%) | 35 (50.7%) |
| Total | 100 (66.7%) | 50 (33.3%) |
Housing Structures by Number of Rooms in Mesick
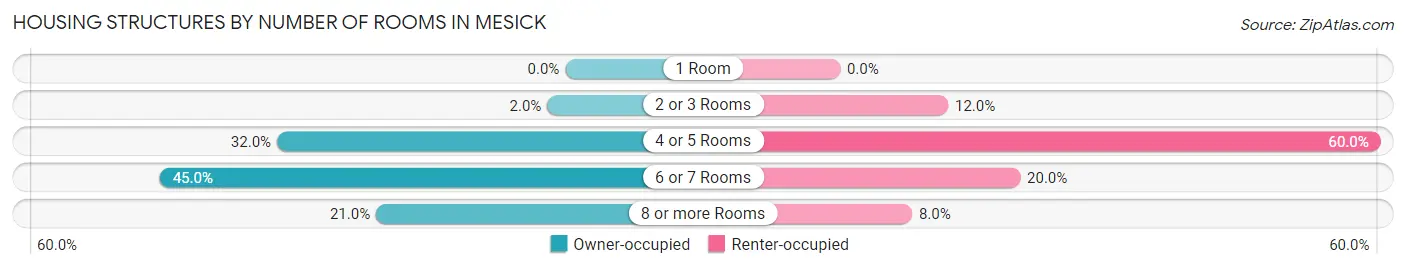
| Number of Rooms | Owner-occupied | Renter-occupied |
| 1 Room | 0 (0.0%) | 0 (0.0%) |
| 2 or 3 Rooms | 2 (2.0%) | 6 (12.0%) |
| 4 or 5 Rooms | 32 (32.0%) | 30 (60.0%) |
| 6 or 7 Rooms | 45 (45.0%) | 10 (20.0%) |
| 8 or more Rooms | 21 (21.0%) | 4 (8.0%) |
| Total | 100 (100.0%) | 50 (100.0%) |
Housing Structure by Heating Type in Mesick
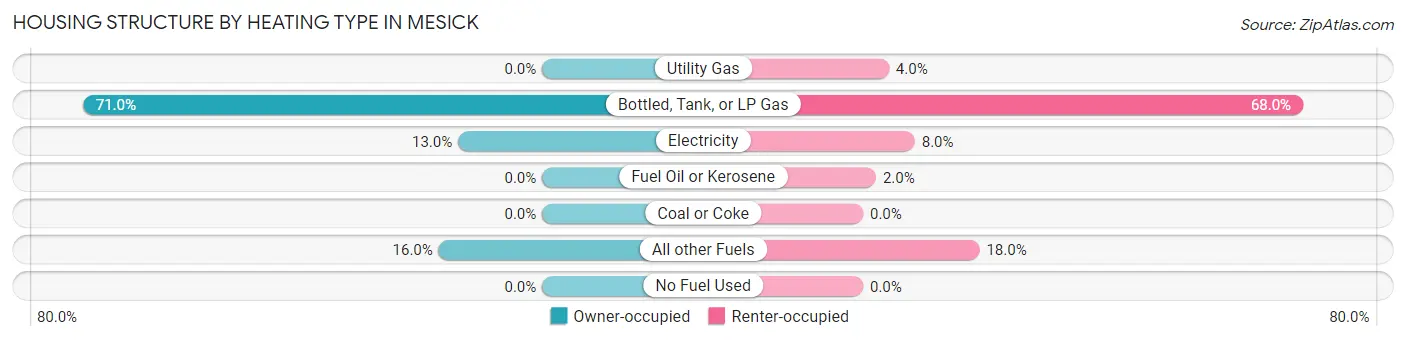
| Heating Type | Owner-occupied | Renter-occupied |
| Utility Gas | 0 (0.0%) | 2 (4.0%) |
| Bottled, Tank, or LP Gas | 71 (71.0%) | 34 (68.0%) |
| Electricity | 13 (13.0%) | 4 (8.0%) |
| Fuel Oil or Kerosene | 0 (0.0%) | 1 (2.0%) |
| Coal or Coke | 0 (0.0%) | 0 (0.0%) |
| All other Fuels | 16 (16.0%) | 9 (18.0%) |
| No Fuel Used | 0 (0.0%) | 0 (0.0%) |
| Total | 100 (100.0%) | 50 (100.0%) |
Household Vehicle Usage in Mesick
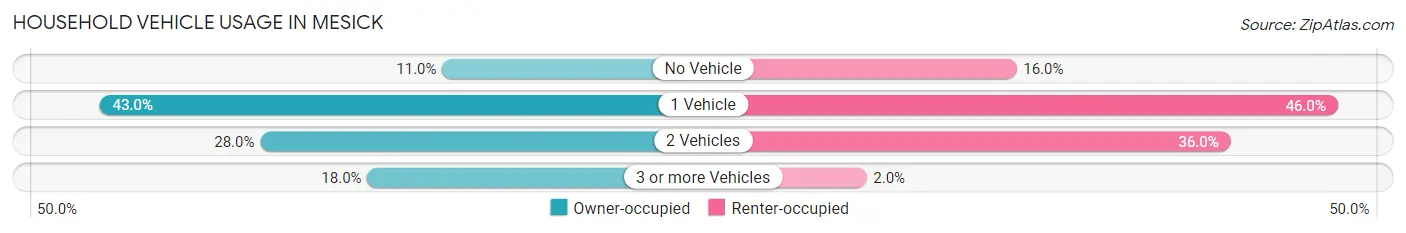
| Vehicles per Household | Owner-occupied | Renter-occupied |
| No Vehicle | 11 (11.0%) | 8 (16.0%) |
| 1 Vehicle | 43 (43.0%) | 23 (46.0%) |
| 2 Vehicles | 28 (28.0%) | 18 (36.0%) |
| 3 or more Vehicles | 18 (18.0%) | 1 (2.0%) |
| Total | 100 (100.0%) | 50 (100.0%) |
Real Estate & Mortgages in Mesick
Real Estate and Mortgage Overview in Mesick
| Characteristic | Without Mortgage | With Mortgage |
| Housing Units | 44 | 56 |
| Median Property Value | $58,000 | $100,000 |
| Median Household Income | $14,375 | $0 |
| Monthly Housing Costs | $650 | $0 |
| Real Estate Taxes | $950 | $2 |
Property Value by Mortgage Status in Mesick
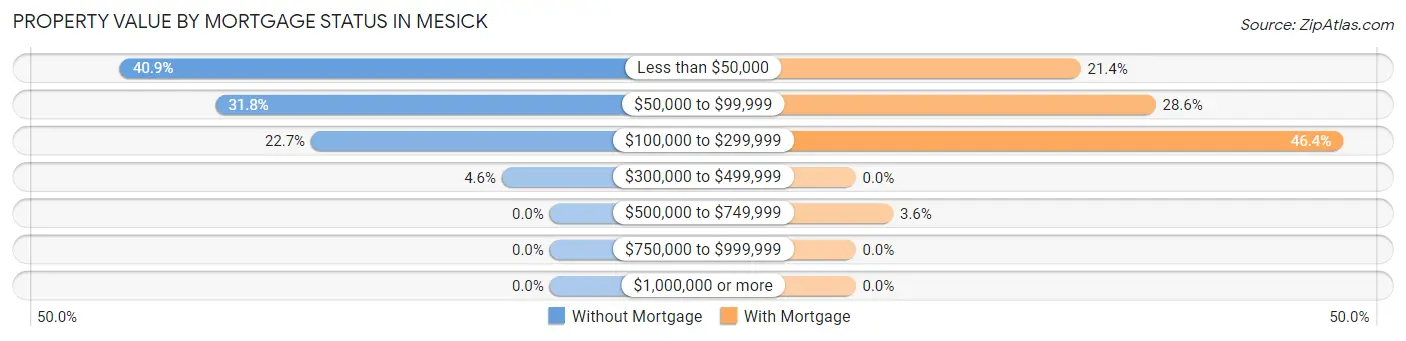
| Property Value | Without Mortgage | With Mortgage |
| Less than $50,000 | 18 (40.9%) | 12 (21.4%) |
| $50,000 to $99,999 | 14 (31.8%) | 16 (28.6%) |
| $100,000 to $299,999 | 10 (22.7%) | 26 (46.4%) |
| $300,000 to $499,999 | 2 (4.5%) | 0 (0.0%) |
| $500,000 to $749,999 | 0 (0.0%) | 2 (3.6%) |
| $750,000 to $999,999 | 0 (0.0%) | 0 (0.0%) |
| $1,000,000 or more | 0 (0.0%) | 0 (0.0%) |
| Total | 44 (100.0%) | 56 (100.0%) |
Household Income by Mortgage Status in Mesick
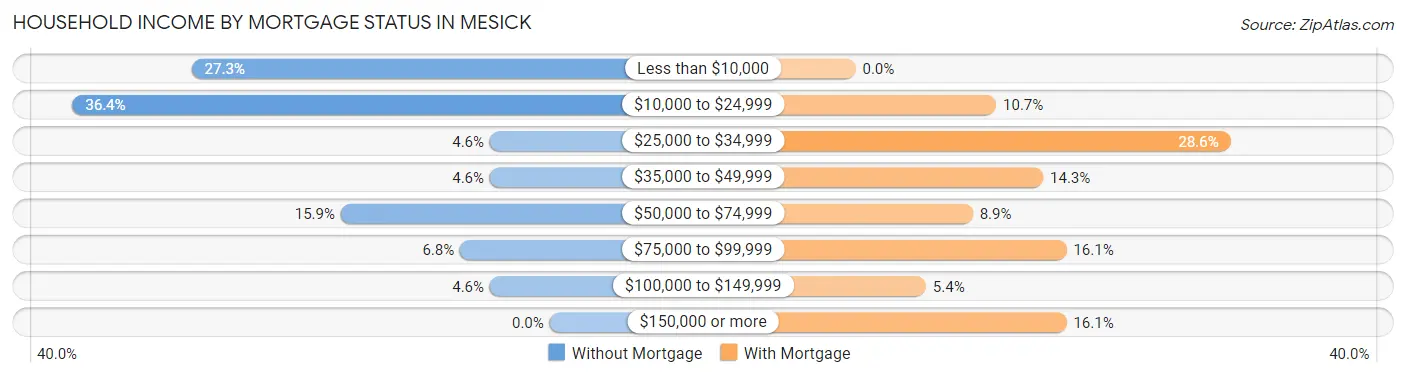
| Household Income | Without Mortgage | With Mortgage |
| Less than $10,000 | 12 (27.3%) | 0 (0.0%) |
| $10,000 to $24,999 | 16 (36.4%) | 6 (10.7%) |
| $25,000 to $34,999 | 2 (4.5%) | 16 (28.6%) |
| $35,000 to $49,999 | 2 (4.5%) | 8 (14.3%) |
| $50,000 to $74,999 | 7 (15.9%) | 5 (8.9%) |
| $75,000 to $99,999 | 3 (6.8%) | 9 (16.1%) |
| $100,000 to $149,999 | 2 (4.5%) | 3 (5.4%) |
| $150,000 or more | 0 (0.0%) | 9 (16.1%) |
| Total | 44 (100.0%) | 56 (100.0%) |
Property Value to Household Income Ratio in Mesick
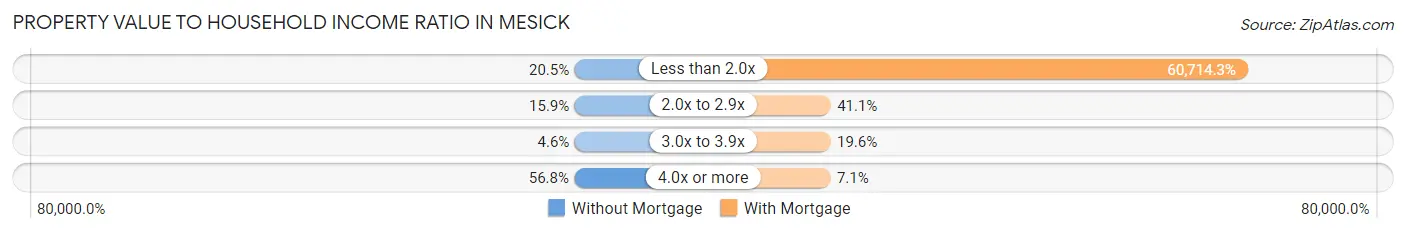
| Value-to-Income Ratio | Without Mortgage | With Mortgage |
| Less than 2.0x | 9 (20.4%) | 34,000 (60,714.3%) |
| 2.0x to 2.9x | 7 (15.9%) | 23 (41.1%) |
| 3.0x to 3.9x | 2 (4.5%) | 11 (19.6%) |
| 4.0x or more | 25 (56.8%) | 4 (7.1%) |
| Total | 44 (100.0%) | 56 (100.0%) |
Real Estate Taxes by Mortgage Status in Mesick
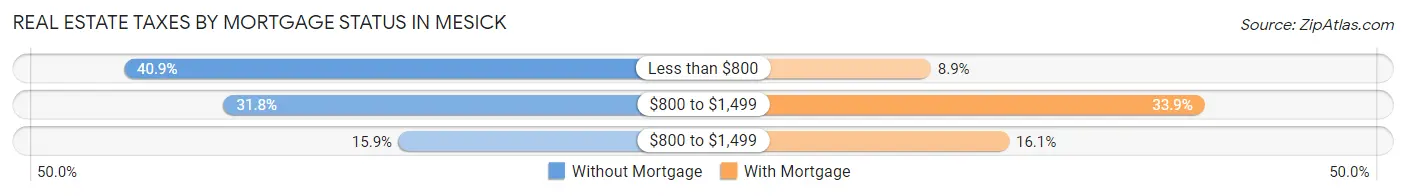
| Property Taxes | Without Mortgage | With Mortgage |
| Less than $800 | 18 (40.9%) | 5 (8.9%) |
| $800 to $1,499 | 14 (31.8%) | 19 (33.9%) |
| $800 to $1,499 | 7 (15.9%) | 9 (16.1%) |
| Total | 44 (100.0%) | 56 (100.0%) |
Health & Disability in Mesick
Health Insurance Coverage by Age in Mesick
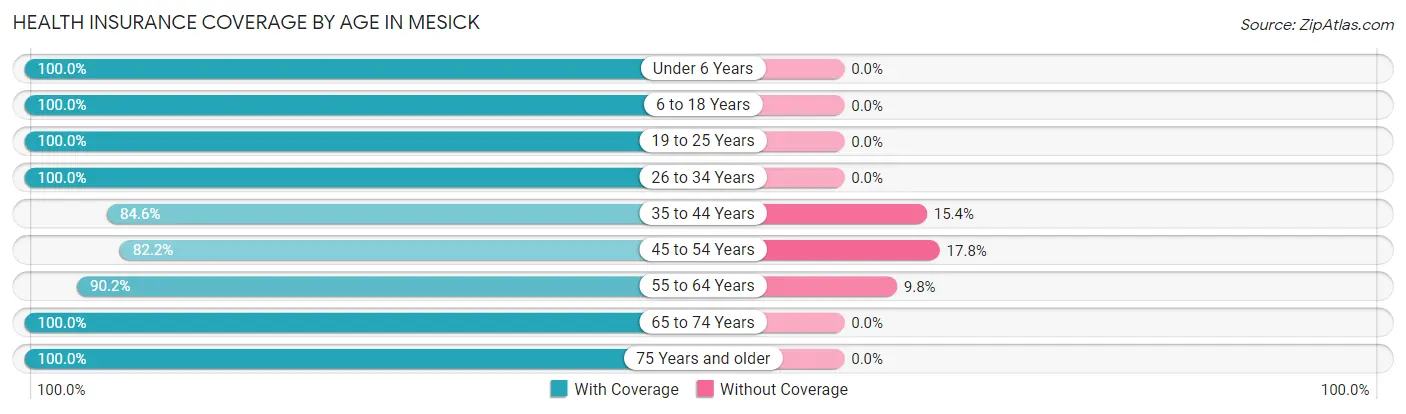
| Age Bracket | With Coverage | Without Coverage |
| Under 6 Years | 41 (100.0%) | 0 (0.0%) |
| 6 to 18 Years | 80 (100.0%) | 0 (0.0%) |
| 19 to 25 Years | 37 (100.0%) | 0 (0.0%) |
| 26 to 34 Years | 17 (100.0%) | 0 (0.0%) |
| 35 to 44 Years | 44 (84.6%) | 8 (15.4%) |
| 45 to 54 Years | 37 (82.2%) | 8 (17.8%) |
| 55 to 64 Years | 46 (90.2%) | 5 (9.8%) |
| 65 to 74 Years | 35 (100.0%) | 0 (0.0%) |
| 75 Years and older | 32 (100.0%) | 0 (0.0%) |
| Total | 369 (94.6%) | 21 (5.4%) |
Health Insurance Coverage by Citizenship Status in Mesick
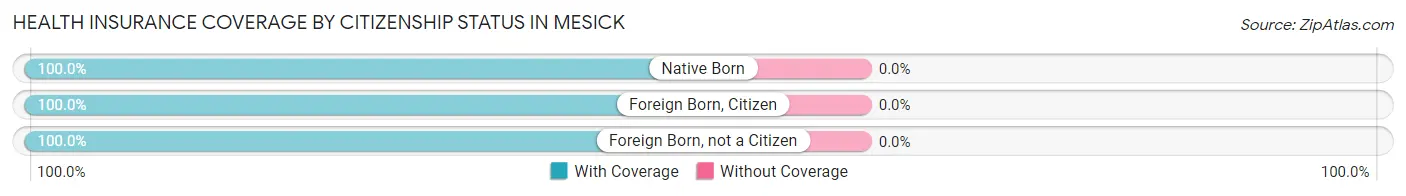
| Citizenship Status | With Coverage | Without Coverage |
| Native Born | 41 (100.0%) | 0 (0.0%) |
| Foreign Born, Citizen | 80 (100.0%) | 0 (0.0%) |
| Foreign Born, not a Citizen | 37 (100.0%) | 0 (0.0%) |
Health Insurance Coverage by Household Income in Mesick
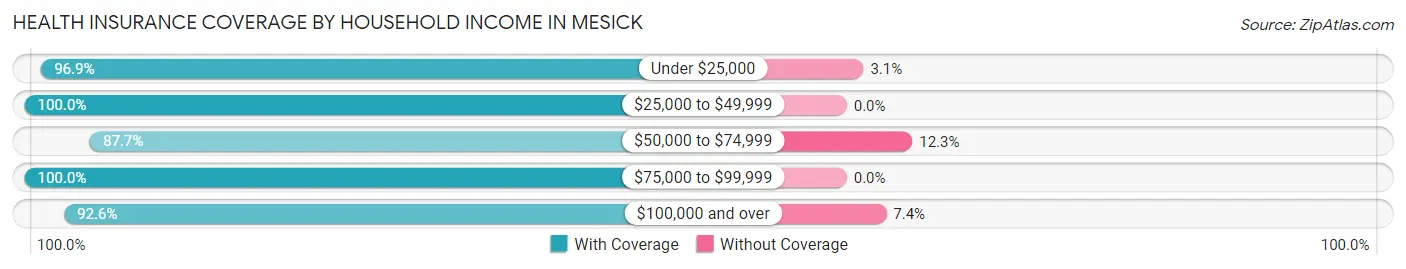
| Household Income | With Coverage | Without Coverage |
| Under $25,000 | 155 (96.9%) | 5 (3.1%) |
| $25,000 to $49,999 | 65 (100.0%) | 0 (0.0%) |
| $50,000 to $74,999 | 100 (87.7%) | 14 (12.3%) |
| $75,000 to $99,999 | 24 (100.0%) | 0 (0.0%) |
| $100,000 and over | 25 (92.6%) | 2 (7.4%) |
Public vs Private Health Insurance Coverage by Age in Mesick
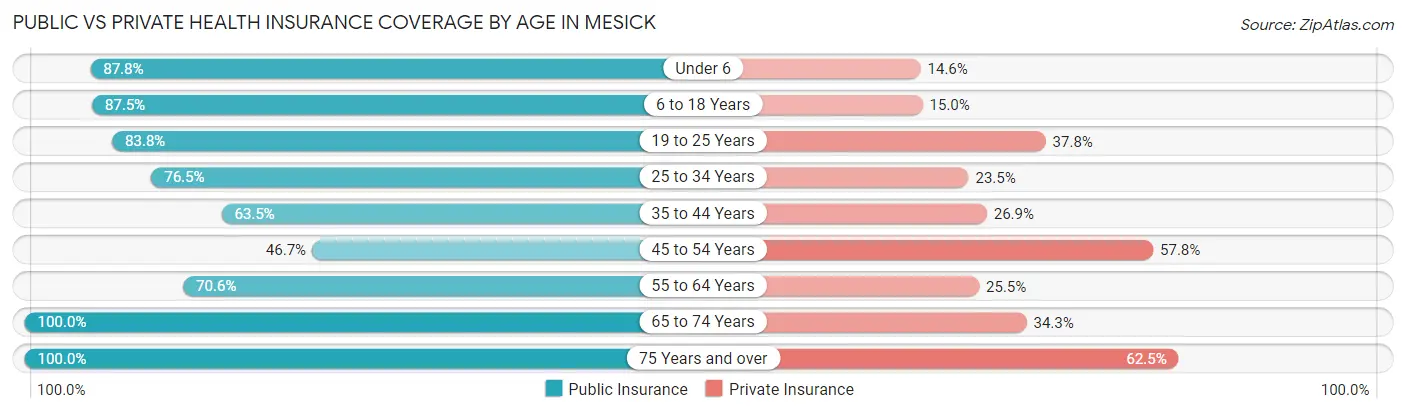
| Age Bracket | Public Insurance | Private Insurance |
| Under 6 | 36 (87.8%) | 6 (14.6%) |
| 6 to 18 Years | 70 (87.5%) | 12 (15.0%) |
| 19 to 25 Years | 31 (83.8%) | 14 (37.8%) |
| 25 to 34 Years | 13 (76.5%) | 4 (23.5%) |
| 35 to 44 Years | 33 (63.5%) | 14 (26.9%) |
| 45 to 54 Years | 21 (46.7%) | 26 (57.8%) |
| 55 to 64 Years | 36 (70.6%) | 13 (25.5%) |
| 65 to 74 Years | 35 (100.0%) | 12 (34.3%) |
| 75 Years and over | 32 (100.0%) | 20 (62.5%) |
| Total | 307 (78.7%) | 121 (31.0%) |
Disability Status by Sex by Age in Mesick
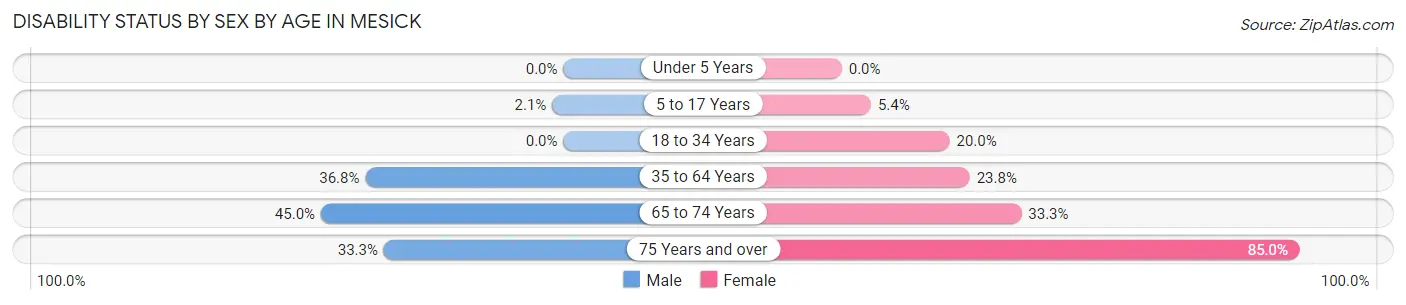
| Age Bracket | Male | Female |
| Under 5 Years | 0 (0.0%) | 0 (0.0%) |
| 5 to 17 Years | 1 (2.1%) | 2 (5.4%) |
| 18 to 34 Years | 0 (0.0%) | 9 (20.0%) |
| 35 to 64 Years | 25 (36.8%) | 19 (23.7%) |
| 65 to 74 Years | 9 (45.0%) | 5 (33.3%) |
| 75 Years and over | 4 (33.3%) | 17 (85.0%) |
Disability Class by Sex by Age in Mesick
Disability Class: Hearing Difficulty
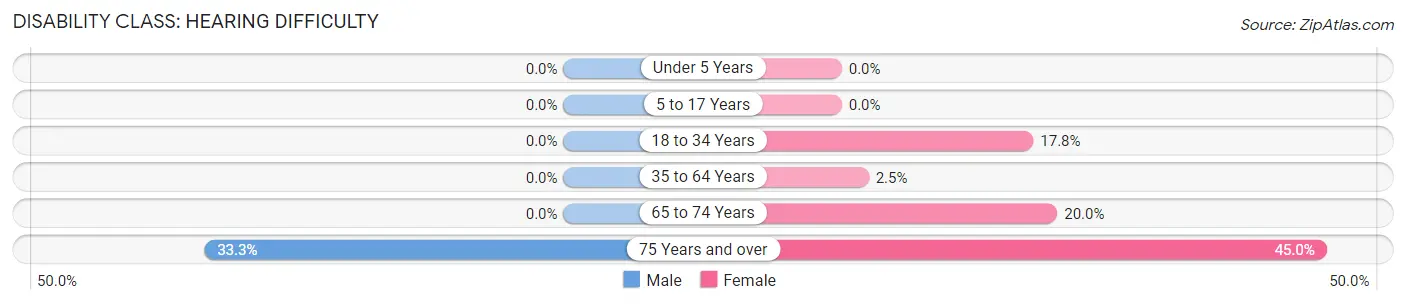
| Age Bracket | Male | Female |
| Under 5 Years | 0 (0.0%) | 0 (0.0%) |
| 5 to 17 Years | 0 (0.0%) | 0 (0.0%) |
| 18 to 34 Years | 0 (0.0%) | 8 (17.8%) |
| 35 to 64 Years | 0 (0.0%) | 2 (2.5%) |
| 65 to 74 Years | 0 (0.0%) | 3 (20.0%) |
| 75 Years and over | 4 (33.3%) | 9 (45.0%) |
Disability Class: Vision Difficulty
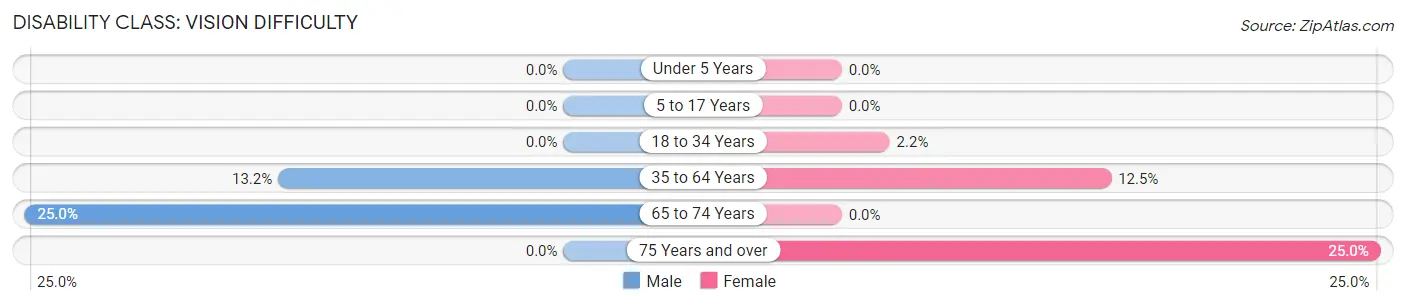
| Age Bracket | Male | Female |
| Under 5 Years | 0 (0.0%) | 0 (0.0%) |
| 5 to 17 Years | 0 (0.0%) | 0 (0.0%) |
| 18 to 34 Years | 0 (0.0%) | 1 (2.2%) |
| 35 to 64 Years | 9 (13.2%) | 10 (12.5%) |
| 65 to 74 Years | 5 (25.0%) | 0 (0.0%) |
| 75 Years and over | 0 (0.0%) | 5 (25.0%) |
Disability Class: Cognitive Difficulty
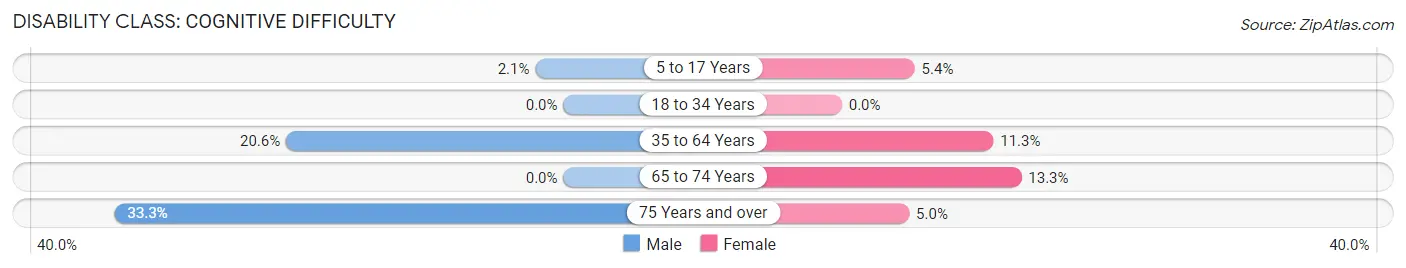
| Age Bracket | Male | Female |
| 5 to 17 Years | 1 (2.1%) | 2 (5.4%) |
| 18 to 34 Years | 0 (0.0%) | 0 (0.0%) |
| 35 to 64 Years | 14 (20.6%) | 9 (11.3%) |
| 65 to 74 Years | 0 (0.0%) | 2 (13.3%) |
| 75 Years and over | 4 (33.3%) | 1 (5.0%) |
Disability Class: Ambulatory Difficulty
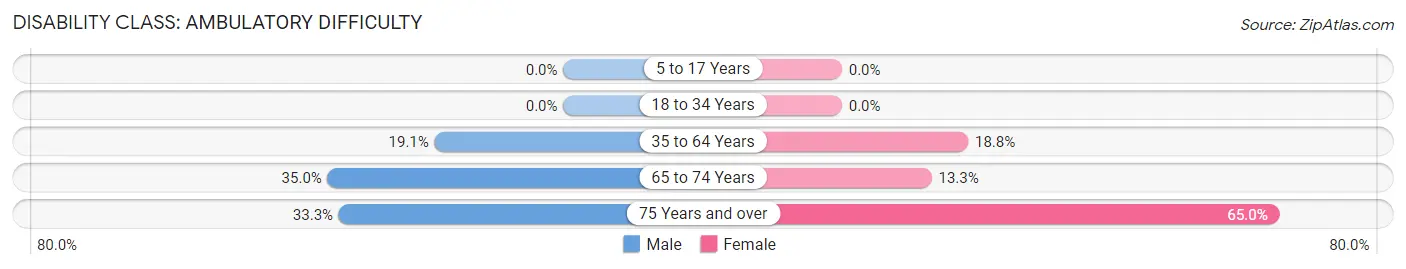
| Age Bracket | Male | Female |
| 5 to 17 Years | 0 (0.0%) | 0 (0.0%) |
| 18 to 34 Years | 0 (0.0%) | 0 (0.0%) |
| 35 to 64 Years | 13 (19.1%) | 15 (18.8%) |
| 65 to 74 Years | 7 (35.0%) | 2 (13.3%) |
| 75 Years and over | 4 (33.3%) | 13 (65.0%) |
Disability Class: Self-Care Difficulty
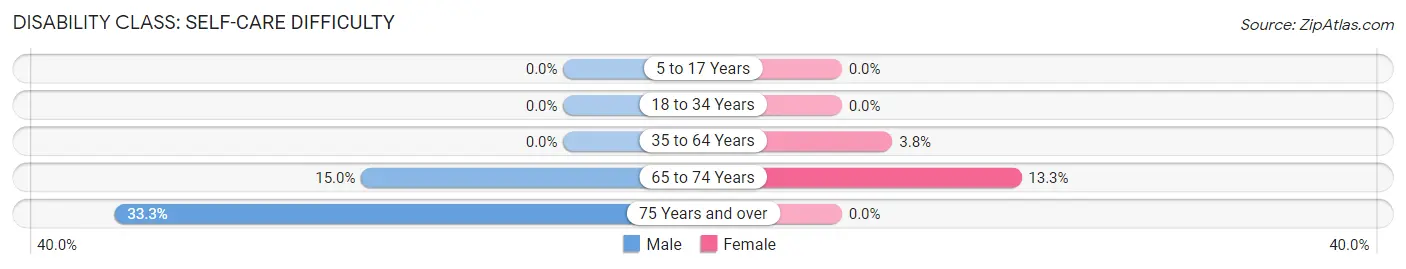
| Age Bracket | Male | Female |
| 5 to 17 Years | 0 (0.0%) | 0 (0.0%) |
| 18 to 34 Years | 0 (0.0%) | 0 (0.0%) |
| 35 to 64 Years | 0 (0.0%) | 3 (3.7%) |
| 65 to 74 Years | 3 (15.0%) | 2 (13.3%) |
| 75 Years and over | 4 (33.3%) | 0 (0.0%) |
Technology Access in Mesick
Computing Device Access in Mesick
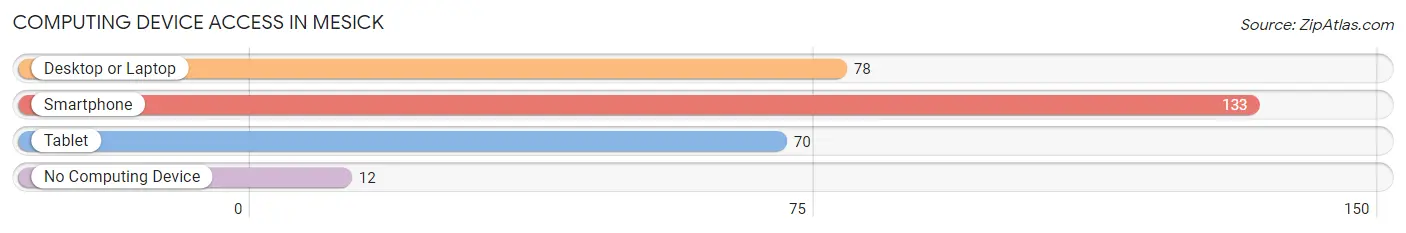
| Device Type | # Households | % Households |
| Desktop or Laptop | 78 | 52.0% |
| Smartphone | 133 | 88.7% |
| Tablet | 70 | 46.7% |
| No Computing Device | 12 | 8.0% |
| Total | 150 | 100.0% |
Internet Access in Mesick
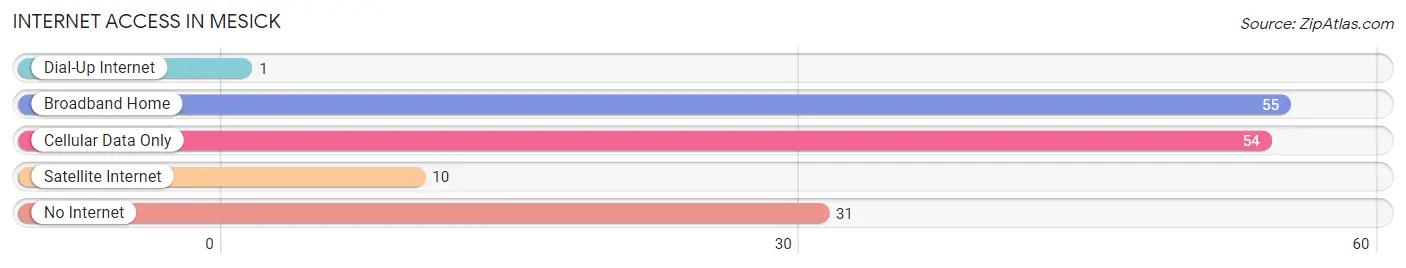
| Internet Type | # Households | % Households |
| Dial-Up Internet | 1 | 0.7% |
| Broadband Home | 55 | 36.7% |
| Cellular Data Only | 54 | 36.0% |
| Satellite Internet | 10 | 6.7% |
| No Internet | 31 | 20.7% |
| Total | 150 | 100.0% |
Mesick Summary
Mesick is a small village located in Wexford County, Michigan. It is situated in the northwest corner of the state, near the border of Lake Michigan. The village has a population of approximately 1,000 people and is part of the Cadillac Metropolitan Statistical Area.
History
Mesick was first settled in 1871 by a group of settlers from New York. The village was named after the Mesick family, who were among the first settlers. The village was incorporated in 1887 and has remained a small, rural community ever since.
Geography
Mesick is located in the northwest corner of Michigan, near the border of Lake Michigan. The village is situated in a rural area, surrounded by forests and rolling hills. The nearby Manistee National Forest provides a variety of outdoor activities, including camping, fishing, hunting, and hiking. The village is also close to several lakes, including Lake Cadillac, Lake Mitchell, and Lake Manistee.
Economy
Mesick’s economy is largely based on agriculture and tourism. The village is home to several farms, which produce a variety of crops, including corn, soybeans, and wheat. The village also has several small businesses, including restaurants, shops, and a grocery store. Tourism is also an important part of the local economy, as the village is close to several popular attractions, including the Manistee National Forest and the nearby lakes.
Demographics
As of the 2010 census, Mesick had a population of 1,000 people. The racial makeup of the village was 97.2% White, 0.7% African American, 0.3% Native American, 0.2% Asian, 0.1% Pacific Islander, and 1.5% from other races. The median household income was $35,000, and the median family income was $41,000. The per capita income was $17,000.
Mesick is a small, rural village with a rich history and a strong sense of community. The village is home to a variety of businesses and attractions, and its economy is largely based on agriculture and tourism. The village is also close to several popular outdoor activities, making it a great place to live and visit.
Common Questions
What is Per Capita Income in Mesick?
Per Capita income in Mesick is $14,111.
What is the Median Family Income in Mesick?
Median Family Income in Mesick is $43,571.
What is the Median Household income in Mesick?
Median Household Income in Mesick is $22,308.
What is Income or Wage Gap in Mesick?
Income or Wage Gap in Mesick is 56.9%.
Women in Mesick earn 43.1 cents for every dollar earned by a man.
What is Inequality or Gini Index in Mesick?
Inequality or Gini Index in Mesick is 0.47.
What is the Total Population of Mesick?
Total Population of Mesick is 390.
What is the Total Male Population of Mesick?
Total Male Population of Mesick is 173.
What is the Total Female Population of Mesick?
Total Female Population of Mesick is 217.
What is the Ratio of Males per 100 Females in Mesick?
There are 79.72 Males per 100 Females in Mesick.
What is the Ratio of Females per 100 Males in Mesick?
There are 125.43 Females per 100 Males in Mesick.
What is the Median Population Age in Mesick?
Median Population Age in Mesick is 41.0 Years.
What is the Average Family Size in Mesick
Average Family Size in Mesick is 3.5 People.
What is the Average Household Size in Mesick
Average Household Size in Mesick is 2.6 People.
How Large is the Labor Force in Mesick?
There are 147 People in the Labor Forcein in Mesick.
What is the Percentage of People in the Labor Force in Mesick?
51.8% of People are in the Labor Force in Mesick.
What is the Unemployment Rate in Mesick?
Unemployment Rate in Mesick is 9.5%.