New Lothrop, MI Map & Demographics
New Lothrop Map
New Lothrop Overview
$37,254
PER CAPITA INCOME
$81,023
AVG FAMILY INCOME
$67,404
AVG HOUSEHOLD INCOME
33.3%
WAGE / INCOME GAP [ % ]
66.7¢/ $1
WAGE / INCOME GAP [ $ ]
0.47
INEQUALITY / GINI INDEX
621
TOTAL POPULATION
307
MALE POPULATION
314
FEMALE POPULATION
97.77
MALES / 100 FEMALES
102.28
FEMALES / 100 MALES
36.1
MEDIAN AGE
2.9
AVG FAMILY SIZE
2.4
AVG HOUSEHOLD SIZE
310
LABOR FORCE [ PEOPLE ]
61.8%
PERCENT IN LABOR FORCE
5.8%
UNEMPLOYMENT RATE
New Lothrop Zip Codes
New Lothrop Area Codes
Income in New Lothrop
Income Overview in New Lothrop
Per Capita Income in New Lothrop is $37,254, while median incomes of families and households are $81,023 and $67,404 respectively.
| Characteristic | Number | Measure |
| Per Capita Income | 621 | $37,254 |
| Median Family Income | 163 | $81,023 |
| Mean Family Income | 163 | $107,025 |
| Median Household Income | 261 | $67,404 |
| Mean Household Income | 261 | $86,220 |
| Income Deficit | 163 | $0 |
| Wage / Income Gap (%) | 621 | 33.25% |
| Wage / Income Gap ($) | 621 | 66.75¢ per $1 |
| Gini / Inequality Index | 621 | 0.47 |
Earnings by Sex in New Lothrop
Average Earnings in New Lothrop are $38,875, $52,500 for men and $35,043 for women, a difference of 33.3%.
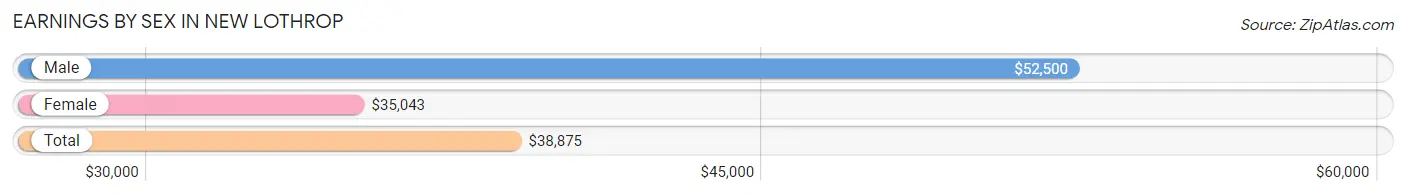
| Sex | Number | Average Earnings |
| Male | 168 (53.3%) | $52,500 |
| Female | 147 (46.7%) | $35,043 |
| Total | 315 (100.0%) | $38,875 |
Earnings by Sex by Income Bracket in New Lothrop
The most common earnings brackets in New Lothrop are $55,000 to $64,999 for men (24 | 14.3%) and $35,000 to $39,999 for women (32 | 21.8%).
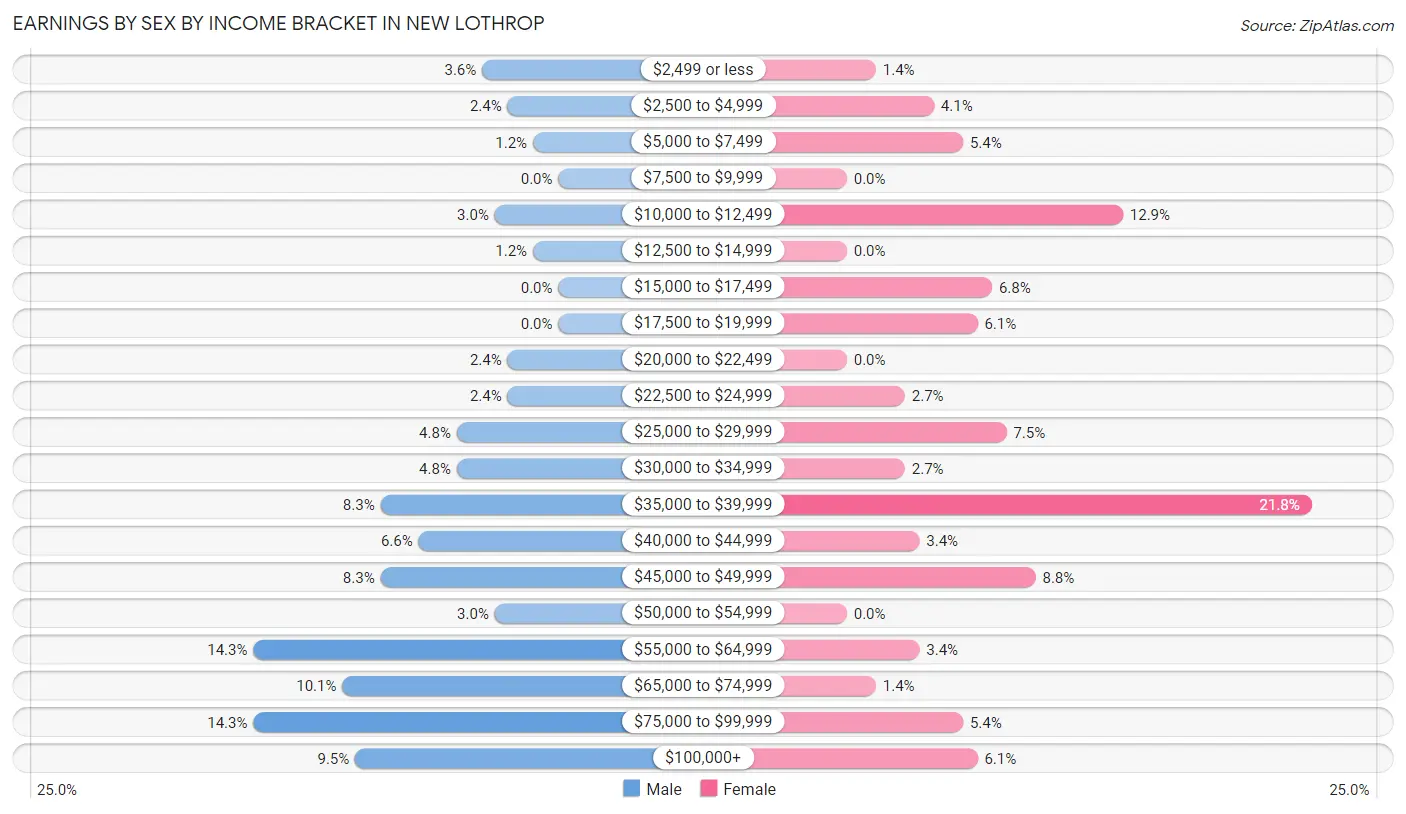
| Income | Male | Female |
| $2,499 or less | 6 (3.6%) | 2 (1.4%) |
| $2,500 to $4,999 | 4 (2.4%) | 6 (4.1%) |
| $5,000 to $7,499 | 2 (1.2%) | 8 (5.4%) |
| $7,500 to $9,999 | 0 (0.0%) | 0 (0.0%) |
| $10,000 to $12,499 | 5 (3.0%) | 19 (12.9%) |
| $12,500 to $14,999 | 2 (1.2%) | 0 (0.0%) |
| $15,000 to $17,499 | 0 (0.0%) | 10 (6.8%) |
| $17,500 to $19,999 | 0 (0.0%) | 9 (6.1%) |
| $20,000 to $22,499 | 4 (2.4%) | 0 (0.0%) |
| $22,500 to $24,999 | 4 (2.4%) | 4 (2.7%) |
| $25,000 to $29,999 | 8 (4.8%) | 11 (7.5%) |
| $30,000 to $34,999 | 8 (4.8%) | 4 (2.7%) |
| $35,000 to $39,999 | 14 (8.3%) | 32 (21.8%) |
| $40,000 to $44,999 | 11 (6.6%) | 5 (3.4%) |
| $45,000 to $49,999 | 14 (8.3%) | 13 (8.8%) |
| $50,000 to $54,999 | 5 (3.0%) | 0 (0.0%) |
| $55,000 to $64,999 | 24 (14.3%) | 5 (3.4%) |
| $65,000 to $74,999 | 17 (10.1%) | 2 (1.4%) |
| $75,000 to $99,999 | 24 (14.3%) | 8 (5.4%) |
| $100,000+ | 16 (9.5%) | 9 (6.1%) |
| Total | 168 (100.0%) | 147 (100.0%) |
Earnings by Sex by Educational Attainment in New Lothrop
Average earnings in New Lothrop are $56,389 for men and $35,441 for women, a difference of 37.1%. Men with an educational attainment of bachelor's degree enjoy the highest average annual earnings of $81,250, while those with college or associate's degree education earn the least with $45,179. Women with an educational attainment of bachelor's degree earn the most with the average annual earnings of $61,667, while those with high school diploma education have the smallest earnings of $12,045.
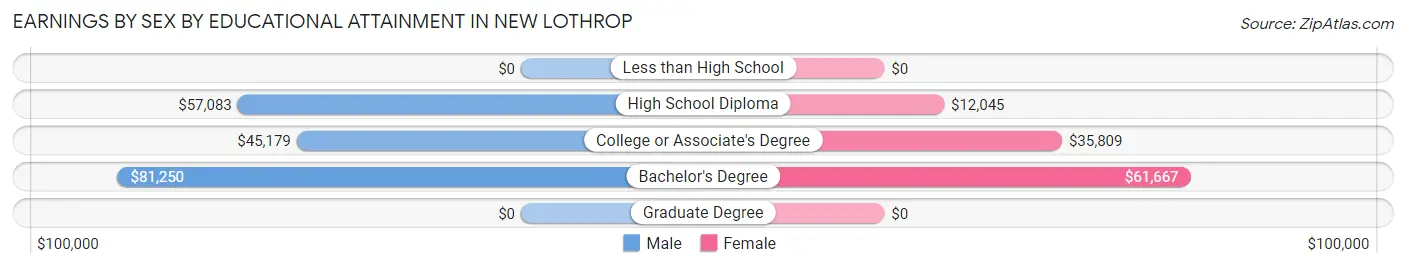
| Educational Attainment | Male Income | Female Income |
| Less than High School | - | - |
| High School Diploma | $57,083 | $12,045 |
| College or Associate's Degree | $45,179 | $35,809 |
| Bachelor's Degree | $81,250 | $61,667 |
| Graduate Degree | - | - |
| Total | $56,389 | $35,441 |
Family Income in New Lothrop
Family Income Brackets in New Lothrop
According to the New Lothrop family income data, there are 53 families falling into the $75,000 to $99,999 income range, which is the most common income bracket and makes up 32.5% of all families.
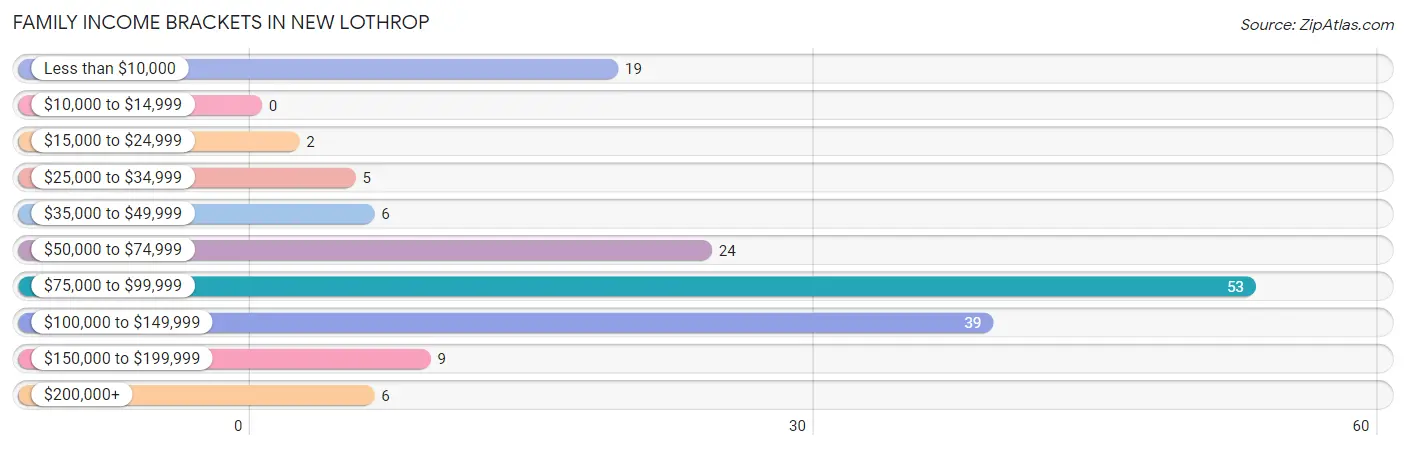
| Income Bracket | # Families | % Families |
| Less than $10,000 | 19 | 11.7% |
| $10,000 to $14,999 | 0 | 0.0% |
| $15,000 to $24,999 | 2 | 1.2% |
| $25,000 to $34,999 | 5 | 3.1% |
| $35,000 to $49,999 | 6 | 3.7% |
| $50,000 to $74,999 | 24 | 14.7% |
| $75,000 to $99,999 | 53 | 32.5% |
| $100,000 to $149,999 | 39 | 23.9% |
| $150,000 to $199,999 | 9 | 5.5% |
| $200,000+ | 6 | 3.7% |
Family Income by Famaliy Size in New Lothrop
3-person families (39 | 23.9%) account for the highest median family income in New Lothrop with $115,750 per family, while 2-person families (85 | 52.1%) have the highest median income of $39,958 per family member.
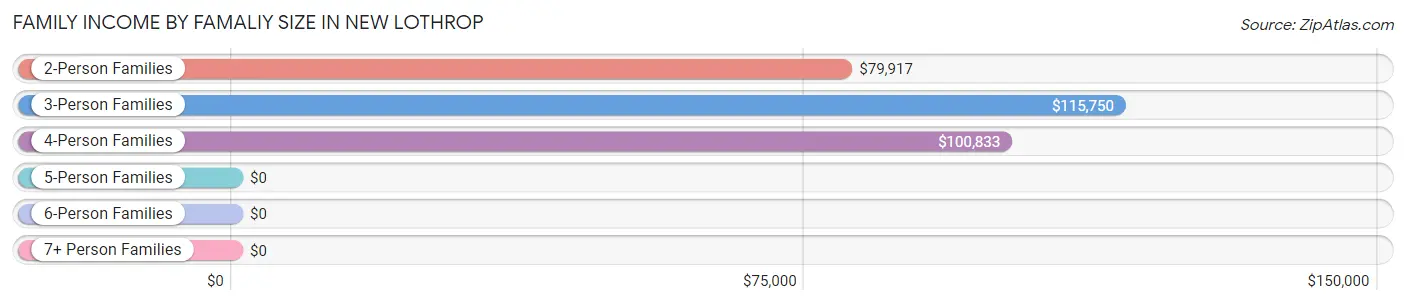
| Income Bracket | # Families | Median Income |
| 2-Person Families | 85 (52.1%) | $79,917 |
| 3-Person Families | 39 (23.9%) | $115,750 |
| 4-Person Families | 20 (12.3%) | $100,833 |
| 5-Person Families | 2 (1.2%) | $0 |
| 6-Person Families | 14 (8.6%) | $0 |
| 7+ Person Families | 3 (1.8%) | $0 |
| Total | 163 (100.0%) | $81,023 |
Family Income by Number of Earners in New Lothrop
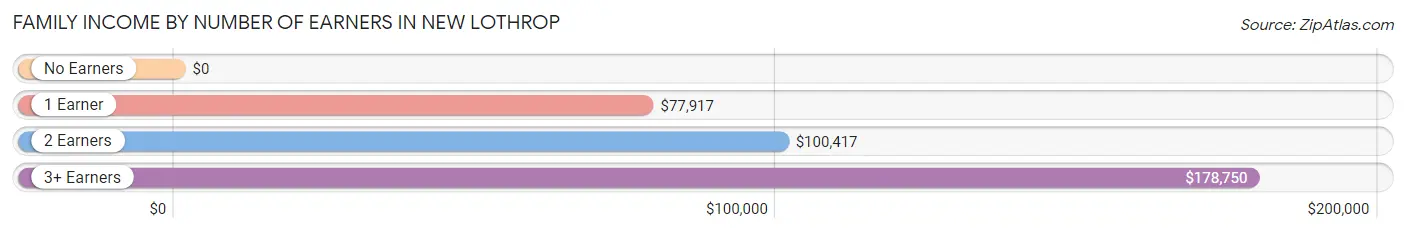
| Number of Earners | # Families | Median Income |
| No Earners | 32 (19.6%) | $0 |
| 1 Earner | 60 (36.8%) | $77,917 |
| 2 Earners | 55 (33.7%) | $100,417 |
| 3+ Earners | 16 (9.8%) | $178,750 |
| Total | 163 (100.0%) | $81,023 |
Household Income in New Lothrop
Household Income Brackets in New Lothrop
With 63 households falling in the category, the $75,000 to $99,999 income range is the most frequent in New Lothrop, accounting for 24.1% of all households. In contrast, only 6 households (2.3%) fall into the $10,000 to $14,999 income bracket, making it the least populous group.
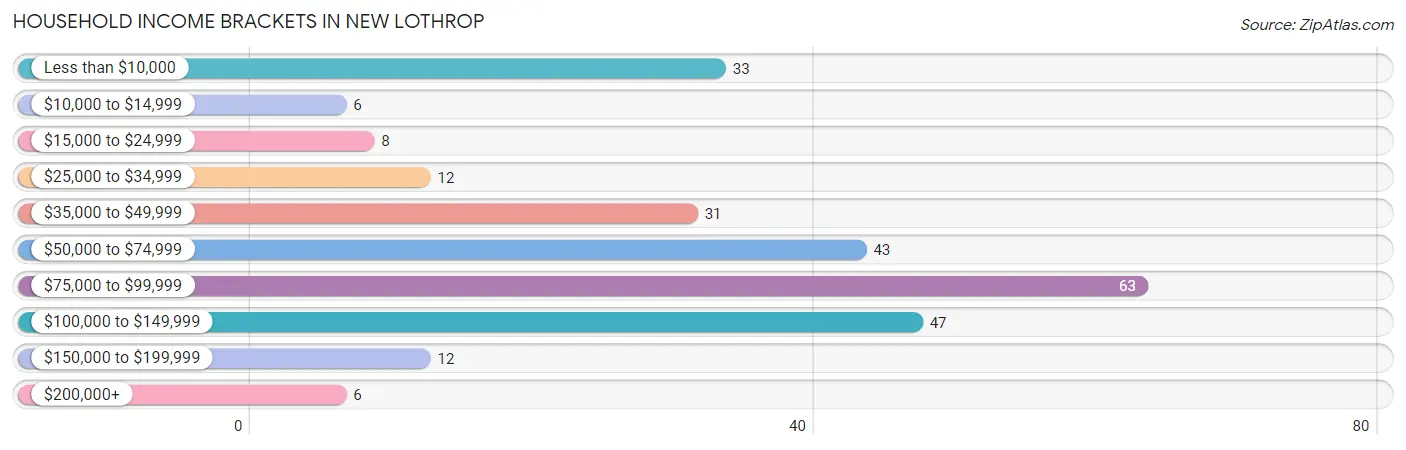
| Income Bracket | # Households | % Households |
| Less than $10,000 | 33 | 12.6% |
| $10,000 to $14,999 | 6 | 2.3% |
| $15,000 to $24,999 | 8 | 3.1% |
| $25,000 to $34,999 | 12 | 4.6% |
| $35,000 to $49,999 | 31 | 11.9% |
| $50,000 to $74,999 | 43 | 16.5% |
| $75,000 to $99,999 | 63 | 24.1% |
| $100,000 to $149,999 | 47 | 18.0% |
| $150,000 to $199,999 | 12 | 4.6% |
| $200,000+ | 6 | 2.3% |
Household Income by Householder Age in New Lothrop
The median household income in New Lothrop is $67,404, with the highest median household income of $78,667 found in the 45 to 64 years age bracket for the primary householder. A total of 110 households (42.1%) fall into this category.
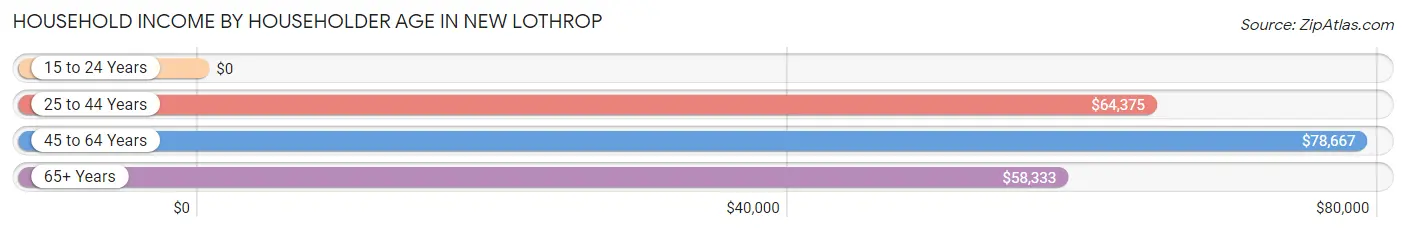
| Income Bracket | # Households | Median Income |
| 15 to 24 Years | 0 (0.0%) | $0 |
| 25 to 44 Years | 95 (36.4%) | $64,375 |
| 45 to 64 Years | 110 (42.1%) | $78,667 |
| 65+ Years | 56 (21.5%) | $58,333 |
| Total | 261 (100.0%) | $67,404 |
Poverty in New Lothrop
Income Below Poverty by Sex and Age in New Lothrop
With 15.6% poverty level for males and 22.0% for females among the residents of New Lothrop, 6 to 11 year old males and 6 to 11 year old females are the most vulnerable to poverty, with 22 males (84.6%) and 20 females (83.3%) in their respective age groups living below the poverty level.
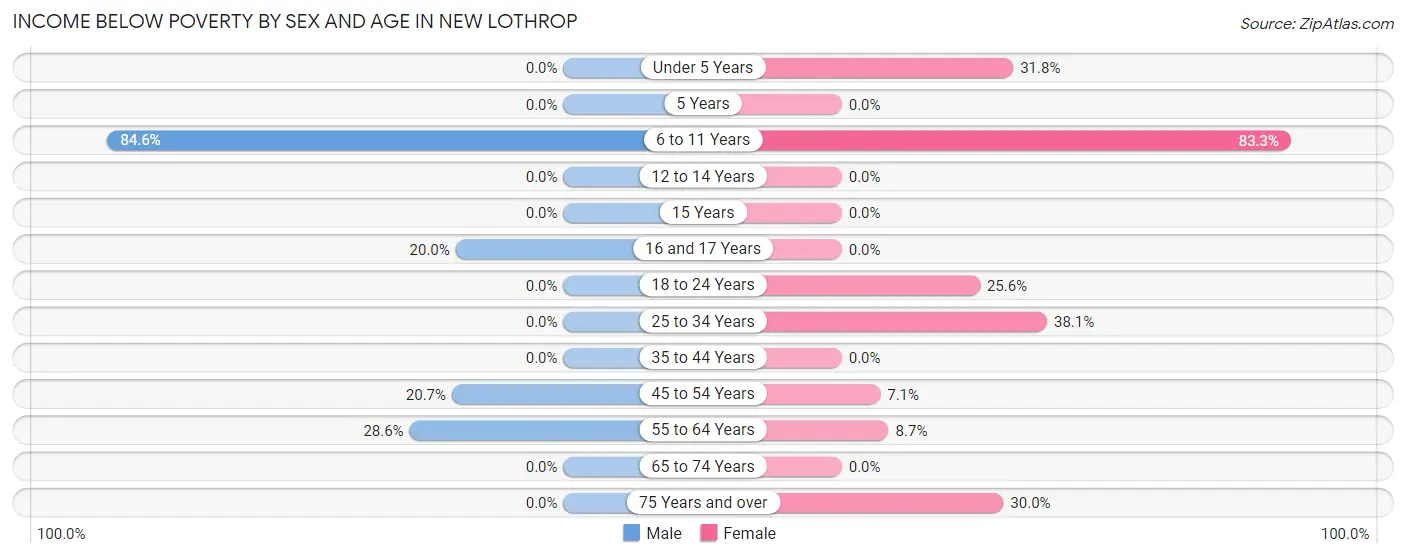
| Age Bracket | Male | Female |
| Under 5 Years | 0 (0.0%) | 7 (31.8%) |
| 5 Years | 0 (0.0%) | 0 (0.0%) |
| 6 to 11 Years | 22 (84.6%) | 20 (83.3%) |
| 12 to 14 Years | 0 (0.0%) | 0 (0.0%) |
| 15 Years | 0 (0.0%) | 0 (0.0%) |
| 16 and 17 Years | 4 (20.0%) | 0 (0.0%) |
| 18 to 24 Years | 0 (0.0%) | 10 (25.6%) |
| 25 to 34 Years | 0 (0.0%) | 16 (38.1%) |
| 35 to 44 Years | 0 (0.0%) | 0 (0.0%) |
| 45 to 54 Years | 12 (20.7%) | 2 (7.1%) |
| 55 to 64 Years | 10 (28.6%) | 4 (8.7%) |
| 65 to 74 Years | 0 (0.0%) | 0 (0.0%) |
| 75 Years and over | 0 (0.0%) | 9 (30.0%) |
| Total | 48 (15.6%) | 68 (22.0%) |
Income Above Poverty by Sex and Age in New Lothrop
According to the poverty statistics in New Lothrop, males aged under 5 years and females aged 12 to 14 years are the age groups that are most secure financially, with 100.0% of males and 100.0% of females in these age groups living above the poverty line.
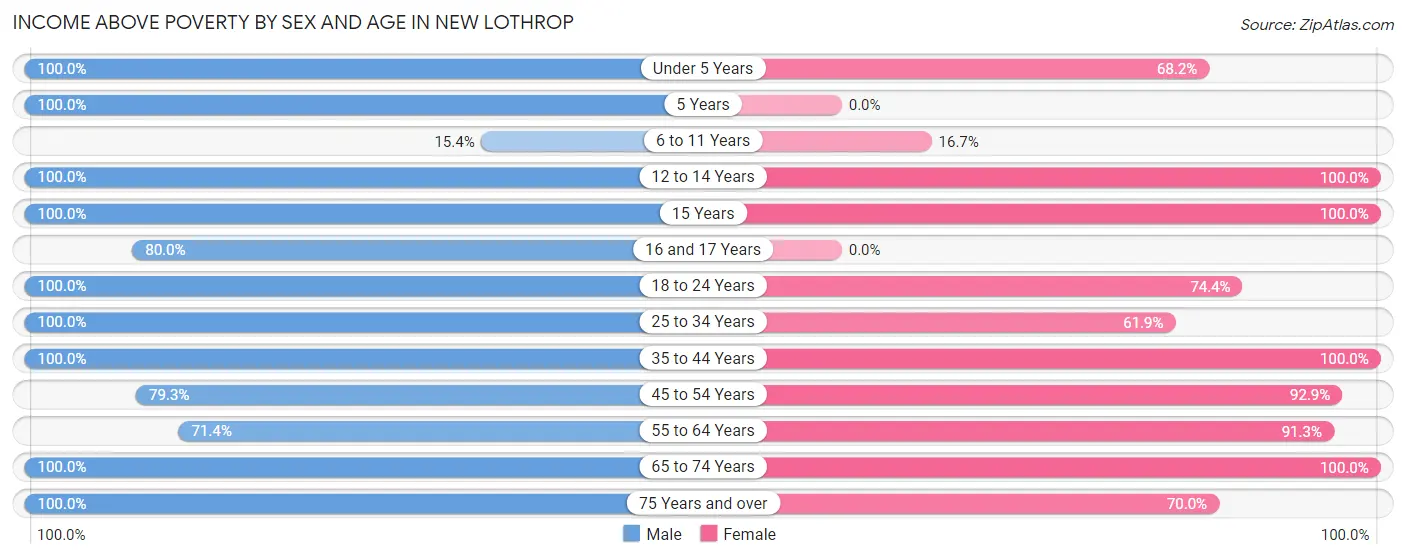
| Age Bracket | Male | Female |
| Under 5 Years | 16 (100.0%) | 15 (68.2%) |
| 5 Years | 4 (100.0%) | 0 (0.0%) |
| 6 to 11 Years | 4 (15.4%) | 4 (16.7%) |
| 12 to 14 Years | 8 (100.0%) | 5 (100.0%) |
| 15 Years | 6 (100.0%) | 3 (100.0%) |
| 16 and 17 Years | 16 (80.0%) | 0 (0.0%) |
| 18 to 24 Years | 16 (100.0%) | 29 (74.4%) |
| 25 to 34 Years | 53 (100.0%) | 26 (61.9%) |
| 35 to 44 Years | 30 (100.0%) | 40 (100.0%) |
| 45 to 54 Years | 46 (79.3%) | 26 (92.9%) |
| 55 to 64 Years | 25 (71.4%) | 42 (91.3%) |
| 65 to 74 Years | 24 (100.0%) | 30 (100.0%) |
| 75 Years and over | 11 (100.0%) | 21 (70.0%) |
| Total | 259 (84.4%) | 241 (78.0%) |
Income Below Poverty Among Married-Couple Families in New Lothrop
The poverty statistics for married-couple families in New Lothrop show that 4.3% or 5 of the total 115 families live below the poverty line. Families with 1 or 2 children have the highest poverty rate of 5.1%, comprising of 2 families. On the other hand, families with 3 or 4 children have the lowest poverty rate of 0.0%, which includes 0 families.
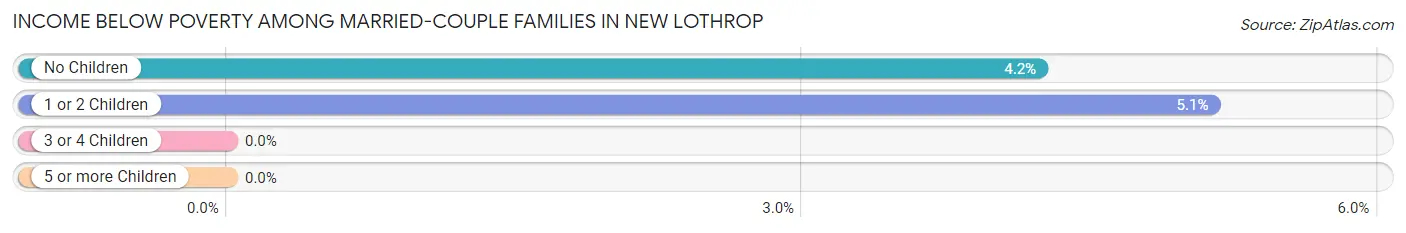
| Children | Above Poverty | Below Poverty |
| No Children | 68 (95.8%) | 3 (4.2%) |
| 1 or 2 Children | 37 (94.9%) | 2 (5.1%) |
| 3 or 4 Children | 5 (100.0%) | 0 (0.0%) |
| 5 or more Children | 0 (0.0%) | 0 (0.0%) |
| Total | 110 (95.7%) | 5 (4.3%) |
Income Below Poverty Among Single-Parent Households in New Lothrop
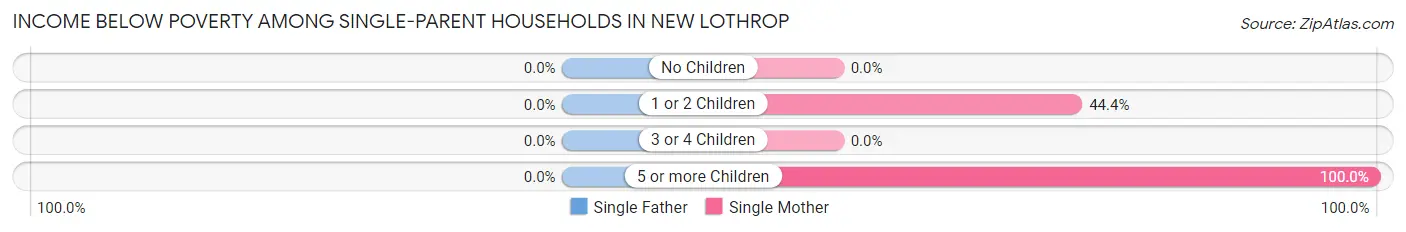
| Children | Single Father | Single Mother |
| No Children | 0 (0.0%) | 0 (0.0%) |
| 1 or 2 Children | 0 (0.0%) | 4 (44.4%) |
| 3 or 4 Children | 0 (0.0%) | 0 (0.0%) |
| 5 or more Children | 0 (0.0%) | 12 (100.0%) |
| Total | 0 (0.0%) | 16 (59.3%) |
Income Below Poverty Among Married-Couple vs Single-Parent Households in New Lothrop
The poverty data for New Lothrop shows that 5 of the married-couple family households (4.3%) and 16 of the single-parent households (33.3%) are living below the poverty level. Within the married-couple family households, those with 1 or 2 children have the highest poverty rate, with 2 households (5.1%) falling below the poverty line. Among the single-parent households, those with 5 or more children have the highest poverty rate, with 12 household (100.0%) living below poverty.
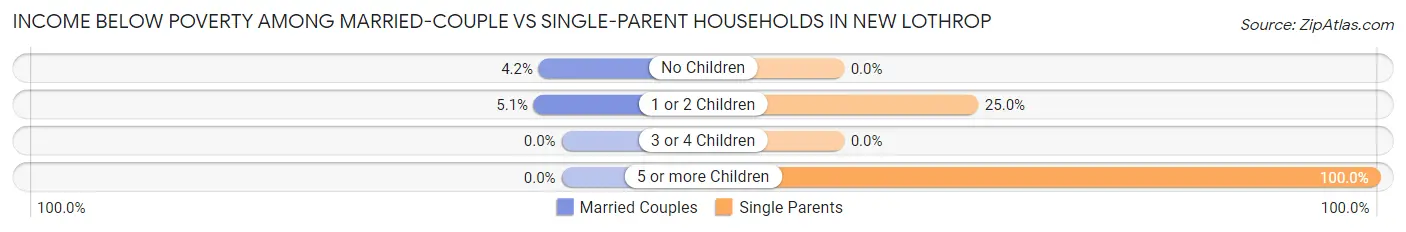
| Children | Married-Couple Families | Single-Parent Households |
| No Children | 3 (4.2%) | 0 (0.0%) |
| 1 or 2 Children | 2 (5.1%) | 4 (25.0%) |
| 3 or 4 Children | 0 (0.0%) | 0 (0.0%) |
| 5 or more Children | 0 (0.0%) | 12 (100.0%) |
| Total | 5 (4.3%) | 16 (33.3%) |
Race in New Lothrop
The most populous races in New Lothrop are White / Caucasian (602 | 96.9%), Two or more Races (14 | 2.2%), and Asian (5 | 0.8%).
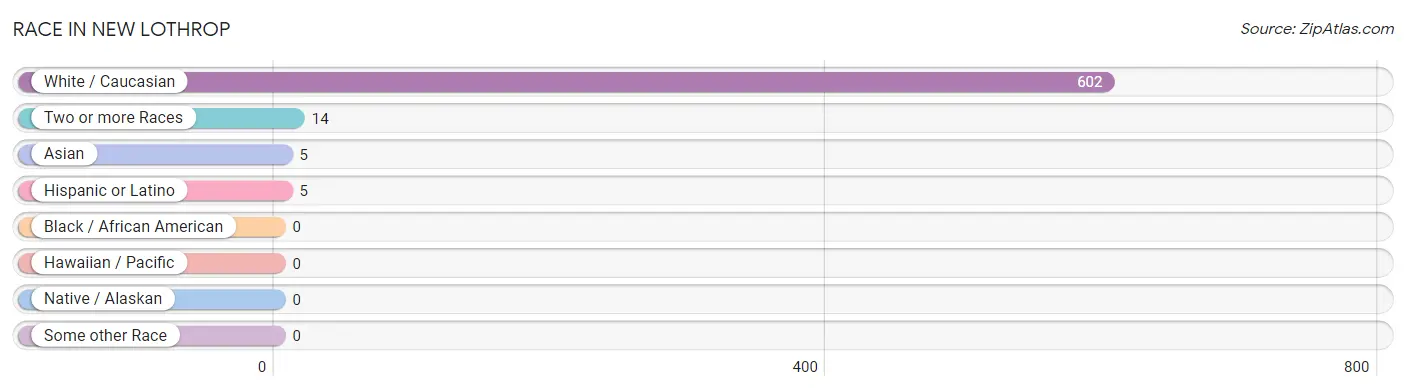
| Race | # Population | % Population |
| Asian | 5 | 0.8% |
| Black / African American | 0 | 0.0% |
| Hawaiian / Pacific | 0 | 0.0% |
| Hispanic or Latino | 5 | 0.8% |
| Native / Alaskan | 0 | 0.0% |
| White / Caucasian | 602 | 96.9% |
| Two or more Races | 14 | 2.2% |
| Some other Race | 0 | 0.0% |
| Total | 621 | 100.0% |
Ancestry in New Lothrop
The most populous ancestries reported in New Lothrop are German (198 | 31.9%), Irish (90 | 14.5%), English (79 | 12.7%), French (41 | 6.6%), and American (21 | 3.4%), together accounting for 69.1% of all New Lothrop residents.
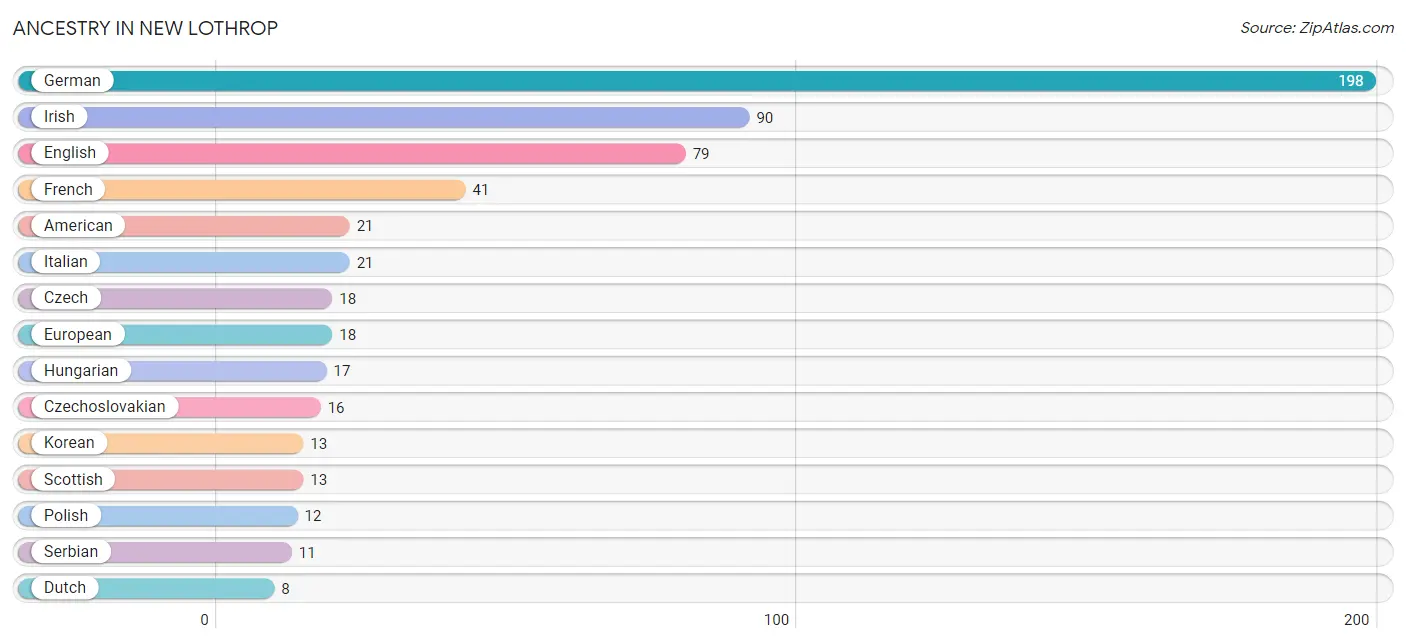
| Ancestry | # Population | % Population |
| American | 21 | 3.4% |
| Austrian | 3 | 0.5% |
| Chippewa | 3 | 0.5% |
| Czech | 18 | 2.9% |
| Czechoslovakian | 16 | 2.6% |
| Dutch | 8 | 1.3% |
| Eastern European | 5 | 0.8% |
| English | 79 | 12.7% |
| European | 18 | 2.9% |
| French | 41 | 6.6% |
| French Canadian | 5 | 0.8% |
| German | 198 | 31.9% |
| Hungarian | 17 | 2.7% |
| Irish | 90 | 14.5% |
| Italian | 21 | 3.4% |
| Korean | 13 | 2.1% |
| Lithuanian | 3 | 0.5% |
| Mexican | 5 | 0.8% |
| Polish | 12 | 1.9% |
| Scandinavian | 4 | 0.6% |
| Scotch-Irish | 2 | 0.3% |
| Scottish | 13 | 2.1% |
| Serbian | 11 | 1.8% |
| Slovak | 3 | 0.5% |
| Swedish | 2 | 0.3% |
| Swiss | 2 | 0.3% |
| Ukrainian | 3 | 0.5% | View All 27 Rows |
Immigrants in New Lothrop
The most numerous immigrant groups reported in New Lothrop came from Asia (4 | 0.6%), Philippines (4 | 0.6%), and South Eastern Asia (4 | 0.6%), together accounting for 1.9% of all New Lothrop residents.
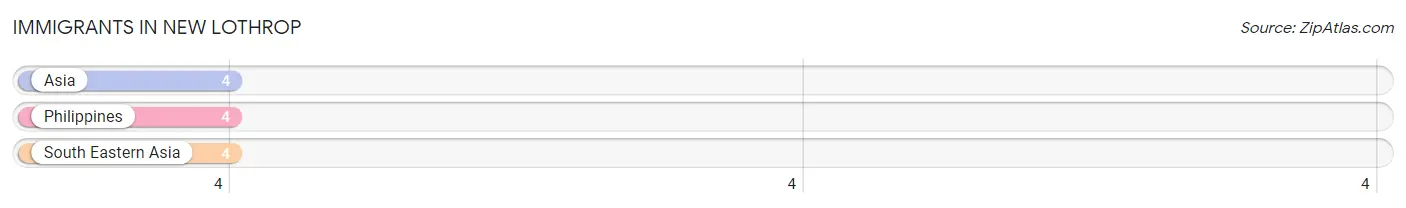
| Immigration Origin | # Population | % Population |
| Asia | 4 | 0.6% |
| Philippines | 4 | 0.6% |
| South Eastern Asia | 4 | 0.6% | View All 3 Rows |
Sex and Age in New Lothrop
Sex and Age in New Lothrop
The most populous age groups in New Lothrop are 50 to 54 Years (44 | 14.3%) for men and 20 to 24 Years (31 | 9.9%) for women.
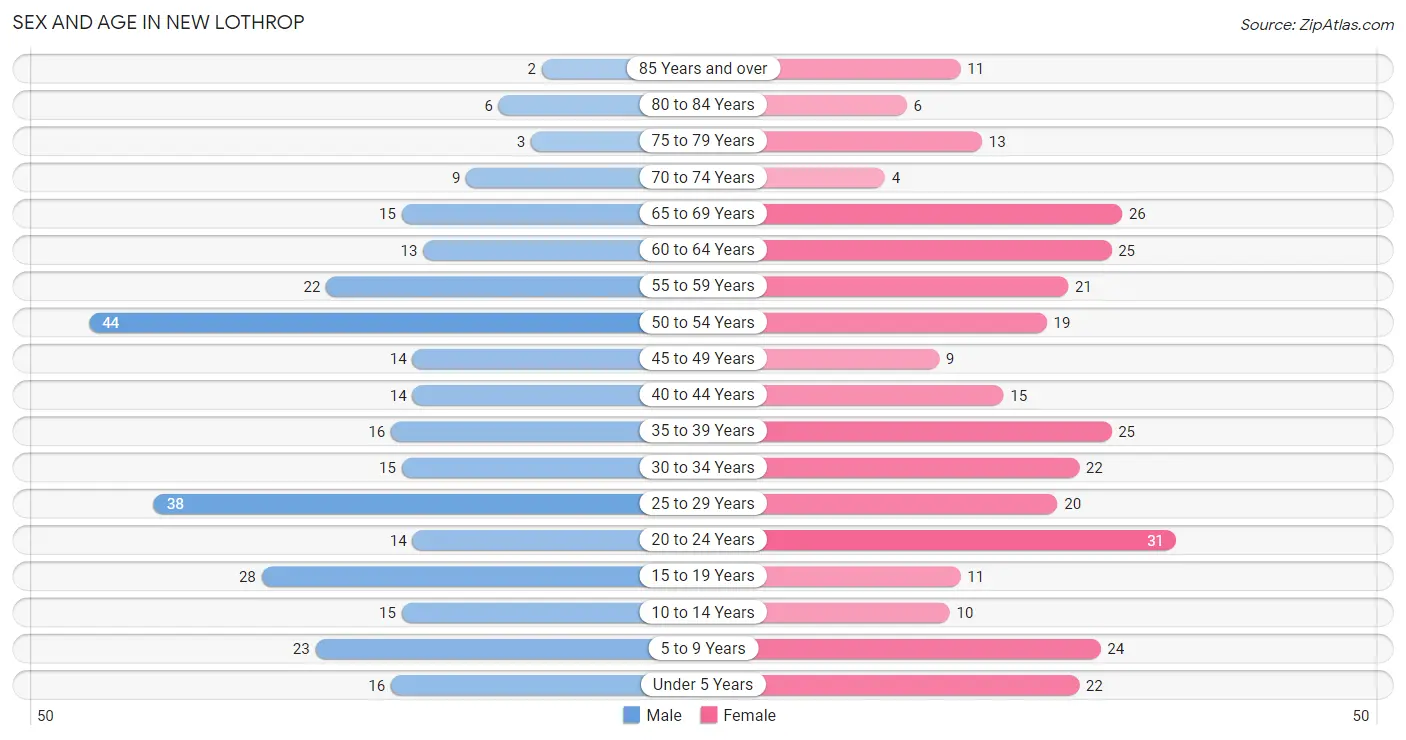
| Age Bracket | Male | Female |
| Under 5 Years | 16 (5.2%) | 22 (7.0%) |
| 5 to 9 Years | 23 (7.5%) | 24 (7.6%) |
| 10 to 14 Years | 15 (4.9%) | 10 (3.2%) |
| 15 to 19 Years | 28 (9.1%) | 11 (3.5%) |
| 20 to 24 Years | 14 (4.6%) | 31 (9.9%) |
| 25 to 29 Years | 38 (12.4%) | 20 (6.4%) |
| 30 to 34 Years | 15 (4.9%) | 22 (7.0%) |
| 35 to 39 Years | 16 (5.2%) | 25 (8.0%) |
| 40 to 44 Years | 14 (4.6%) | 15 (4.8%) |
| 45 to 49 Years | 14 (4.6%) | 9 (2.9%) |
| 50 to 54 Years | 44 (14.3%) | 19 (6.0%) |
| 55 to 59 Years | 22 (7.2%) | 21 (6.7%) |
| 60 to 64 Years | 13 (4.2%) | 25 (8.0%) |
| 65 to 69 Years | 15 (4.9%) | 26 (8.3%) |
| 70 to 74 Years | 9 (2.9%) | 4 (1.3%) |
| 75 to 79 Years | 3 (1.0%) | 13 (4.1%) |
| 80 to 84 Years | 6 (1.9%) | 6 (1.9%) |
| 85 Years and over | 2 (0.6%) | 11 (3.5%) |
| Total | 307 (100.0%) | 314 (100.0%) |
Families and Households in New Lothrop
Median Family Size in New Lothrop
The median family size in New Lothrop is 2.93 persons per family, with single female/mother families (27 | 16.6%) accounting for the largest median family size of 3.41 persons per family. On the other hand, single male/father families (21 | 12.9%) represent the smallest median family size with 1.57 persons per family.
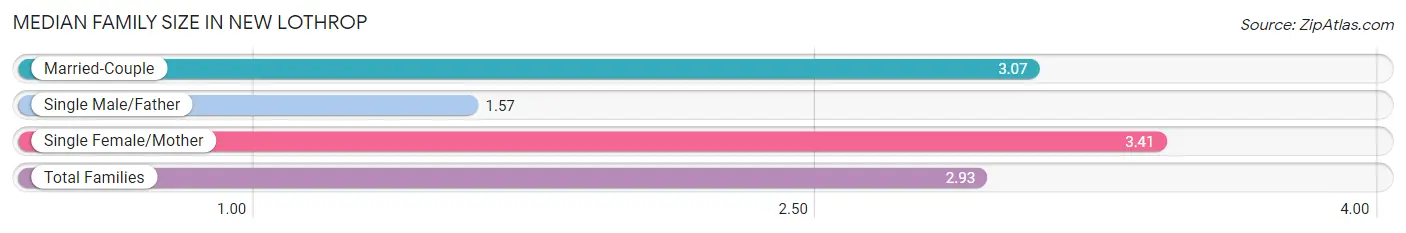
| Family Type | # Families | Family Size |
| Married-Couple | 115 (70.6%) | 3.07 |
| Single Male/Father | 21 (12.9%) | 1.57 |
| Single Female/Mother | 27 (16.6%) | 3.41 |
| Total Families | 163 (100.0%) | 2.93 |
Median Household Size in New Lothrop
The median household size in New Lothrop is 2.38 persons per household, with single female/mother households (27 | 10.3%) accounting for the largest median household size of 3.85 persons per household. non-family households (98 | 37.6%) represent the smallest median household size with 1.26 persons per household.
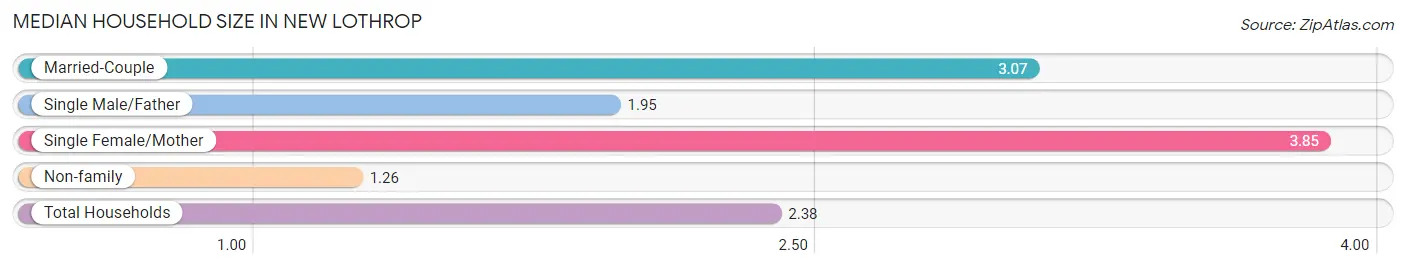
| Household Type | # Households | Household Size |
| Married-Couple | 115 (44.1%) | 3.07 |
| Single Male/Father | 21 (8.1%) | 1.95 |
| Single Female/Mother | 27 (10.3%) | 3.85 |
| Non-family | 98 (37.6%) | 1.26 |
| Total Households | 261 (100.0%) | 2.38 |
Household Size by Marriage Status in New Lothrop
Out of a total of 261 households in New Lothrop, 163 (62.5%) are family households, while 98 (37.6%) are nonfamily households. The most numerous type of family households are 2-person households, comprising 75, and the most common type of nonfamily households are 1-person households, comprising 88.
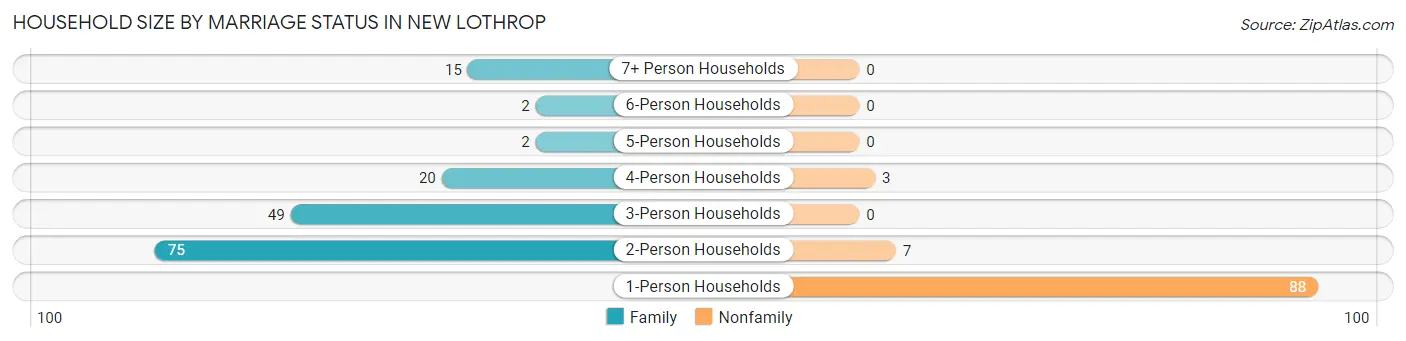
| Household Size | Family Households | Nonfamily Households |
| 1-Person Households | - | 88 (33.7%) |
| 2-Person Households | 75 (28.7%) | 7 (2.7%) |
| 3-Person Households | 49 (18.8%) | 0 (0.0%) |
| 4-Person Households | 20 (7.7%) | 3 (1.1%) |
| 5-Person Households | 2 (0.8%) | 0 (0.0%) |
| 6-Person Households | 2 (0.8%) | 0 (0.0%) |
| 7+ Person Households | 15 (5.8%) | 0 (0.0%) |
| Total | 163 (62.5%) | 98 (37.6%) |
Female Fertility in New Lothrop
Fertility by Age in New Lothrop
Average fertility rate in New Lothrop is 15.0 births per 1,000 women. Women in the age bracket of 20 to 34 years have the highest fertility rate with 27.0 births per 1,000 women. Women in the age bracket of 20 to 34 years acount for 100.0% of all women with births.
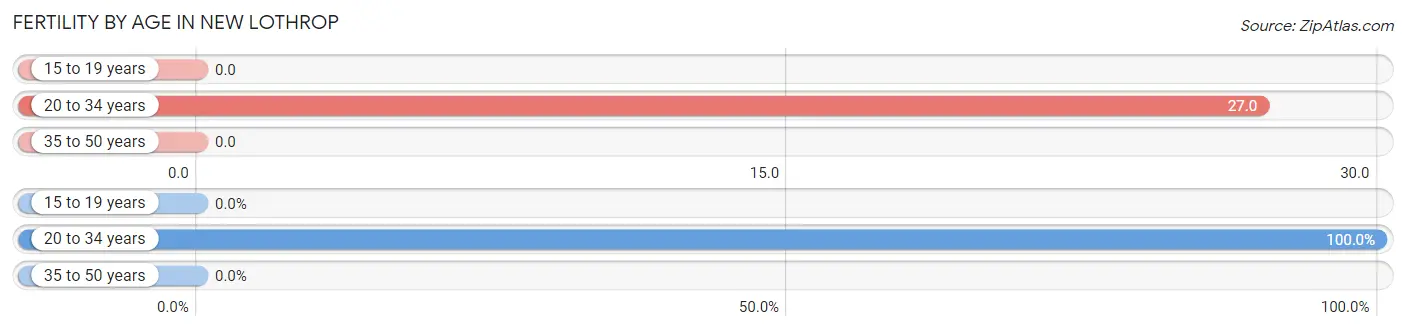
| Age Bracket | Women with Births | Births / 1,000 Women |
| 15 to 19 years | 0 (0.0%) | 0.0 |
| 20 to 34 years | 2 (100.0%) | 27.0 |
| 35 to 50 years | 0 (0.0%) | 0.0 |
| Total | 2 (100.0%) | 15.0 |
Fertility by Age by Marriage Status in New Lothrop
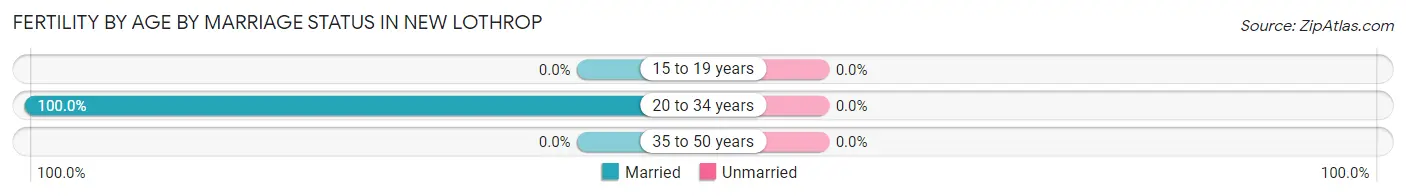
| Age Bracket | Married | Unmarried |
| 15 to 19 years | 0 (0.0%) | 0 (0.0%) |
| 20 to 34 years | 2 (100.0%) | 0 (0.0%) |
| 35 to 50 years | 0 (0.0%) | 0 (0.0%) |
| Total | 2 (100.0%) | 0 (0.0%) |
Fertility by Education in New Lothrop
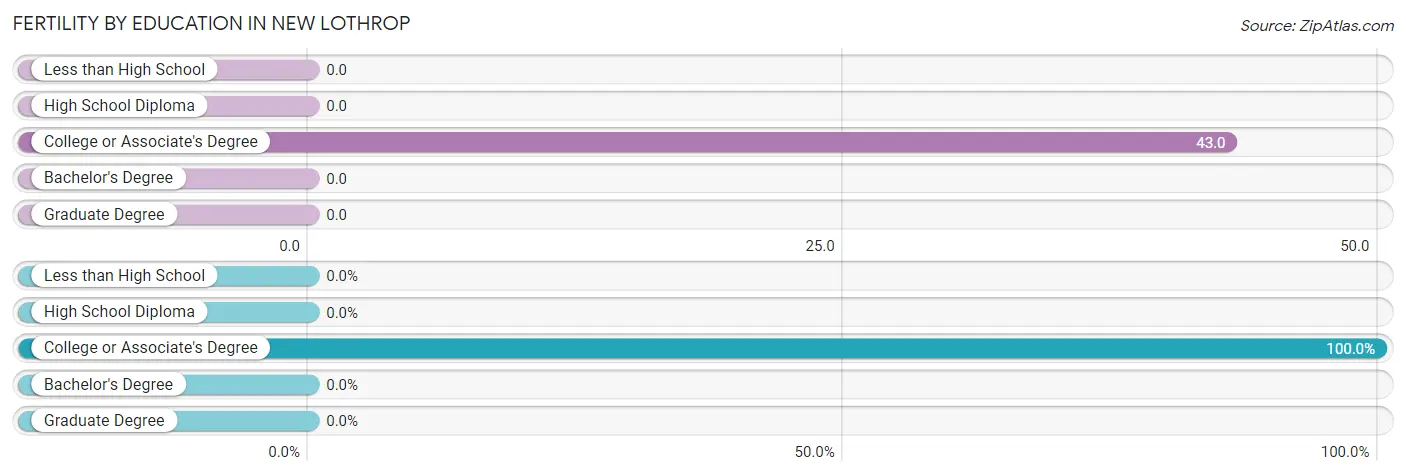
| Educational Attainment | Women with Births | Births / 1,000 Women |
| Less than High School | 0 (0.0%) | 0.0 |
| High School Diploma | 0 (0.0%) | 0.0 |
| College or Associate's Degree | 2 (100.0%) | 43.0 |
| Bachelor's Degree | 0 (0.0%) | 0.0 |
| Graduate Degree | 0 (0.0%) | 0.0 |
| Total | 2 (100.0%) | 15.0 |
Fertility by Education by Marriage Status in New Lothrop
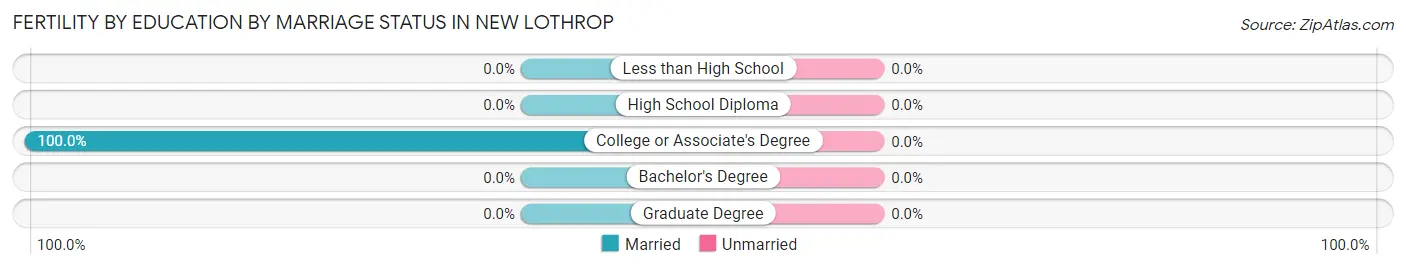
| Educational Attainment | Married | Unmarried |
| Less than High School | 0 (0.0%) | 0 (0.0%) |
| High School Diploma | 0 (0.0%) | 0 (0.0%) |
| College or Associate's Degree | 2 (100.0%) | 0 (0.0%) |
| Bachelor's Degree | 0 (0.0%) | 0 (0.0%) |
| Graduate Degree | 0 (0.0%) | 0 (0.0%) |
| Total | 2 (100.0%) | 0 (0.0%) |
Employment Characteristics in New Lothrop
Employment by Class of Employer in New Lothrop
Among the 289 employed individuals in New Lothrop, private company employees (206 | 71.3%), state government employees (23 | 8.0%), and not-for-profit organizations (18 | 6.2%) make up the most common classes of employment.
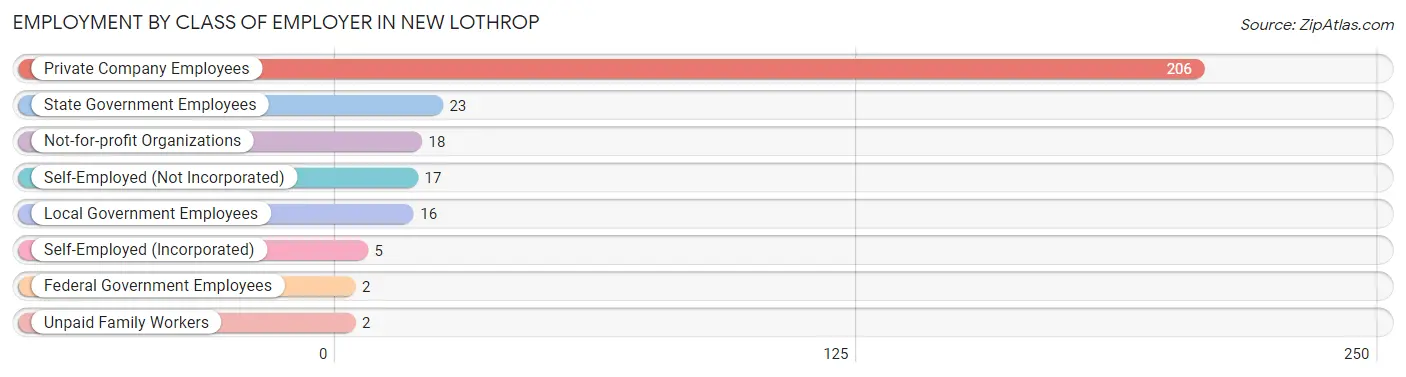
| Employer Class | # Employees | % Employees |
| Private Company Employees | 206 | 71.3% |
| Self-Employed (Incorporated) | 5 | 1.7% |
| Self-Employed (Not Incorporated) | 17 | 5.9% |
| Not-for-profit Organizations | 18 | 6.2% |
| Local Government Employees | 16 | 5.5% |
| State Government Employees | 23 | 8.0% |
| Federal Government Employees | 2 | 0.7% |
| Unpaid Family Workers | 2 | 0.7% |
| Total | 289 | 100.0% |
Employment Status by Age in New Lothrop
According to the labor force statistics for New Lothrop, out of the total population over 16 years of age (502), 61.8% or 310 individuals are in the labor force, with 5.8% or 18 of them unemployed. The age group with the highest labor force participation rate is 45 to 54 years, with 100.0% or 86 individuals in the labor force. Within the labor force, the 45 to 54 years age range has the highest percentage of unemployed individuals, with 14.0% or 12 of them being unemployed.
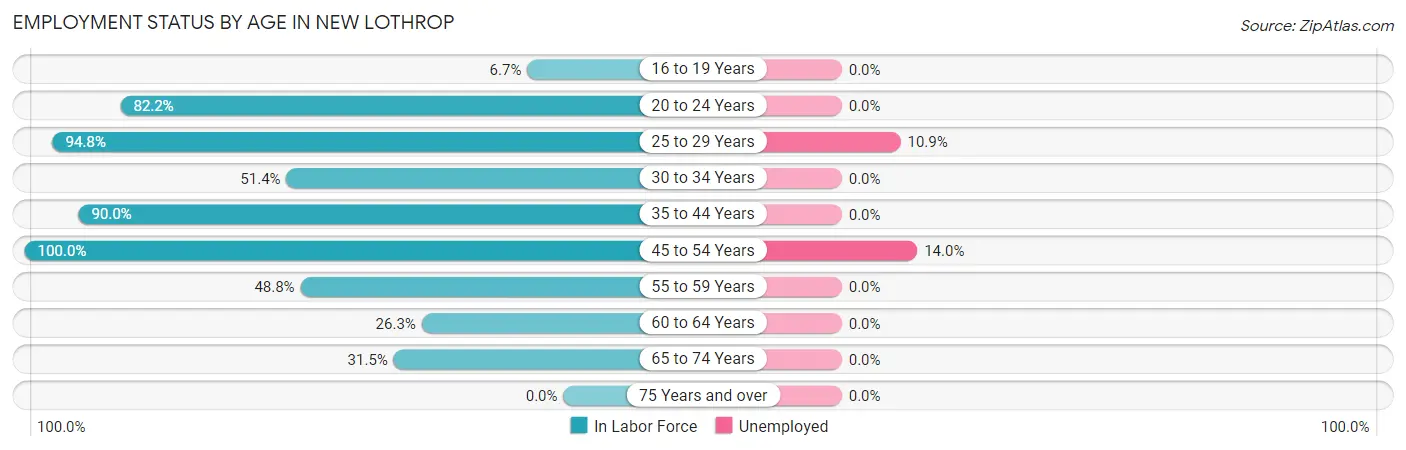
| Age Bracket | In Labor Force | Unemployed |
| 16 to 19 Years | 2 (6.7%) | 0 (0.0%) |
| 20 to 24 Years | 37 (82.2%) | 0 (0.0%) |
| 25 to 29 Years | 55 (94.8%) | 6 (10.9%) |
| 30 to 34 Years | 19 (51.4%) | 0 (0.0%) |
| 35 to 44 Years | 63 (90.0%) | 0 (0.0%) |
| 45 to 54 Years | 86 (100.0%) | 12 (14.0%) |
| 55 to 59 Years | 21 (48.8%) | 0 (0.0%) |
| 60 to 64 Years | 10 (26.3%) | 0 (0.0%) |
| 65 to 74 Years | 17 (31.5%) | 0 (0.0%) |
| 75 Years and over | 0 (0.0%) | 0 (0.0%) |
| Total | 310 (61.8%) | 18 (5.8%) |
Employment Status by Educational Attainment in New Lothrop
According to labor force statistics for New Lothrop, 76.5% of individuals (254) out of the total population between 25 and 64 years of age (332) are in the labor force, with 7.1% or 18 of them being unemployed. The group with the highest labor force participation rate are those with the educational attainment of bachelor's degree or higher, with 89.3% or 50 individuals in the labor force. Within the labor force, individuals with college / associate degree education have the highest percentage of unemployment, with 14.8% or 18 of them being unemployed.
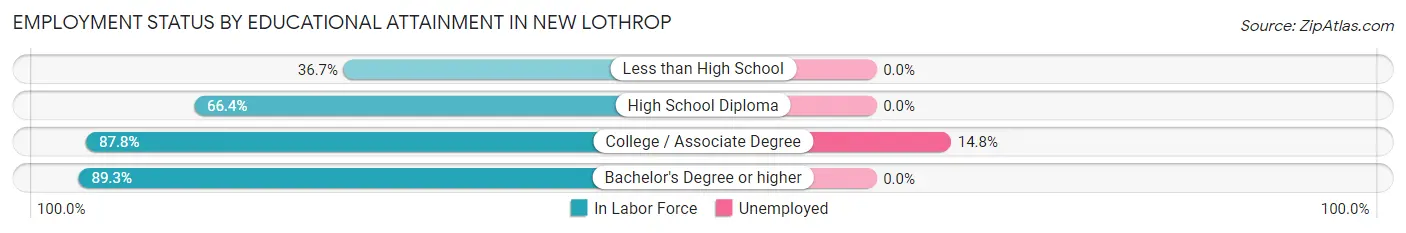
| Educational Attainment | In Labor Force | Unemployed |
| Less than High School | 11 (36.7%) | 0 (0.0%) |
| High School Diploma | 71 (66.4%) | 0 (0.0%) |
| College / Associate Degree | 122 (87.8%) | 21 (14.8%) |
| Bachelor's Degree or higher | 50 (89.3%) | 0 (0.0%) |
| Total | 254 (76.5%) | 24 (7.1%) |
Employment Occupations by Sex in New Lothrop
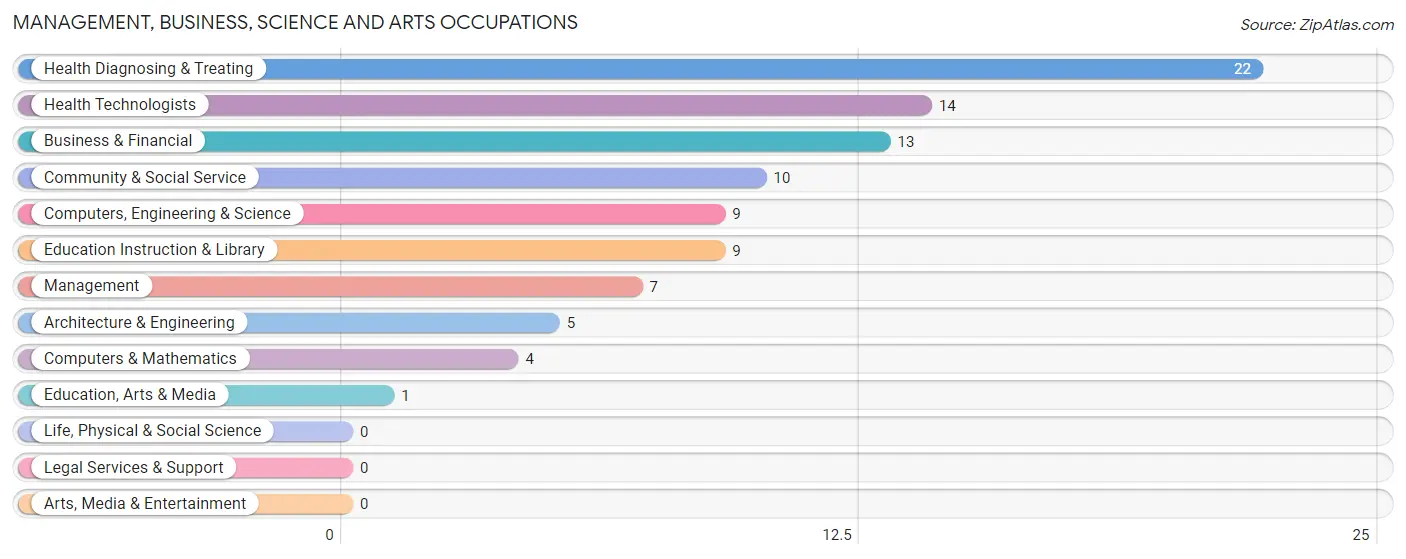
Management, Business, Science and Arts Occupations
The most common Management, Business, Science and Arts occupations in New Lothrop are Health Diagnosing & Treating (22 | 7.5%), Health Technologists (14 | 4.8%), Business & Financial (13 | 4.4%), Community & Social Service (10 | 3.4%), and Computers, Engineering & Science (9 | 3.1%).
Management, Business, Science and Arts Occupations by Sex
Within the Management, Business, Science and Arts occupations in New Lothrop, the most male-oriented occupations are Computers, Engineering & Science (100.0%), Computers & Mathematics (100.0%), and Architecture & Engineering (100.0%), while the most female-oriented occupations are Health Technologists (78.6%), Education Instruction & Library (77.8%), and Community & Social Service (70.0%).
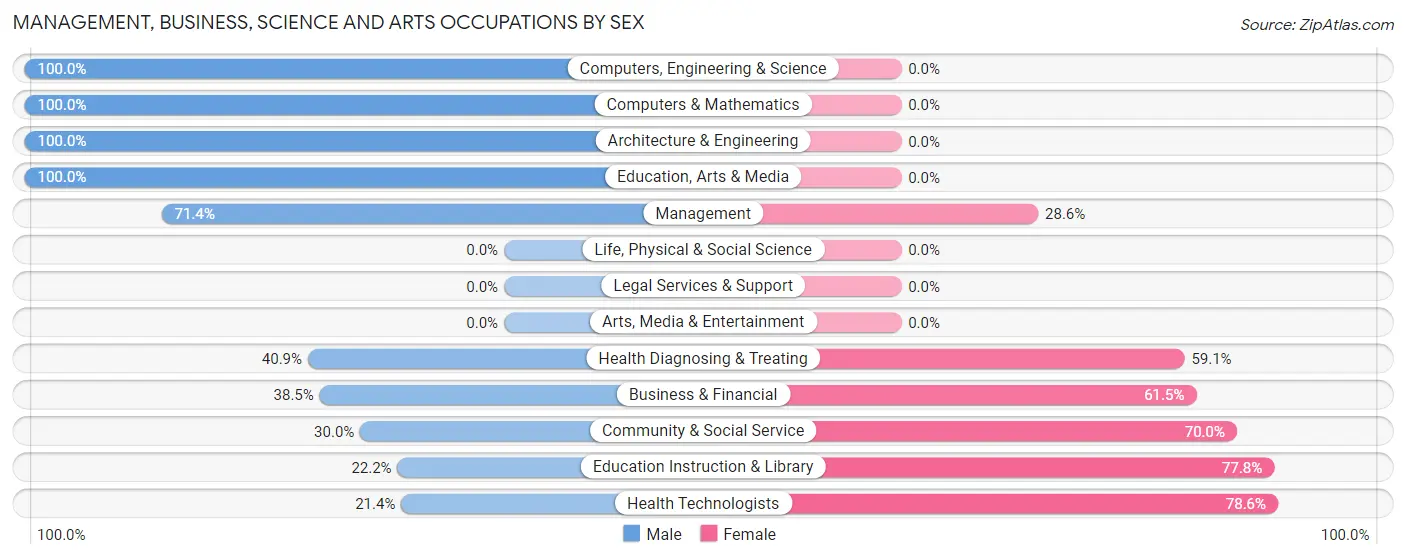
| Occupation | Male | Female |
| Management | 5 (71.4%) | 2 (28.6%) |
| Business & Financial | 5 (38.5%) | 8 (61.5%) |
| Computers, Engineering & Science | 9 (100.0%) | 0 (0.0%) |
| Computers & Mathematics | 4 (100.0%) | 0 (0.0%) |
| Architecture & Engineering | 5 (100.0%) | 0 (0.0%) |
| Life, Physical & Social Science | 0 (0.0%) | 0 (0.0%) |
| Community & Social Service | 3 (30.0%) | 7 (70.0%) |
| Education, Arts & Media | 1 (100.0%) | 0 (0.0%) |
| Legal Services & Support | 0 (0.0%) | 0 (0.0%) |
| Education Instruction & Library | 2 (22.2%) | 7 (77.8%) |
| Arts, Media & Entertainment | 0 (0.0%) | 0 (0.0%) |
| Health Diagnosing & Treating | 9 (40.9%) | 13 (59.1%) |
| Health Technologists | 3 (21.4%) | 11 (78.6%) |
| Total (Category) | 31 (50.8%) | 30 (49.2%) |
| Total (Overall) | 154 (52.7%) | 138 (47.3%) |
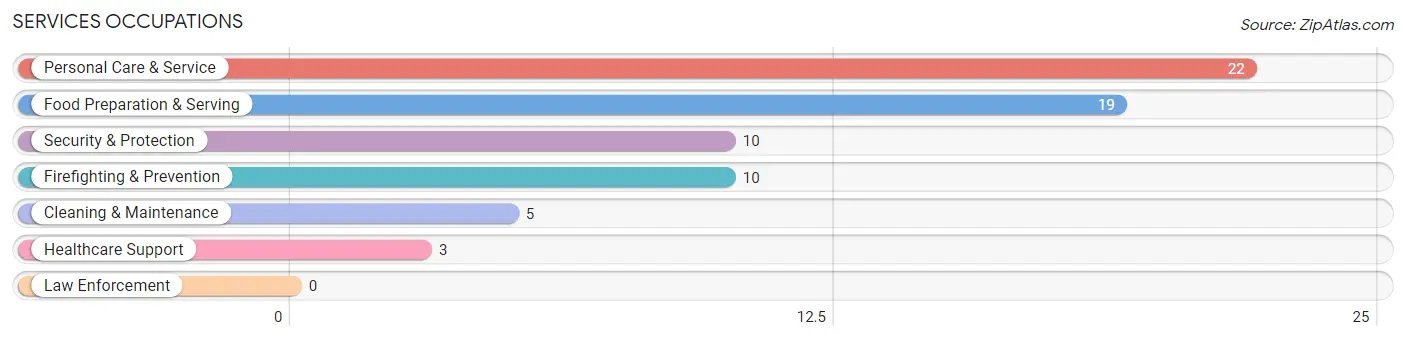
Services Occupations
The most common Services occupations in New Lothrop are Personal Care & Service (22 | 7.5%), Food Preparation & Serving (19 | 6.5%), Security & Protection (10 | 3.4%), Firefighting & Prevention (10 | 3.4%), and Cleaning & Maintenance (5 | 1.7%).
Services Occupations by Sex
Within the Services occupations in New Lothrop, the most male-oriented occupations are Security & Protection (100.0%), Firefighting & Prevention (100.0%), and Cleaning & Maintenance (40.0%), while the most female-oriented occupations are Healthcare Support (100.0%), Personal Care & Service (100.0%), and Food Preparation & Serving (63.2%).
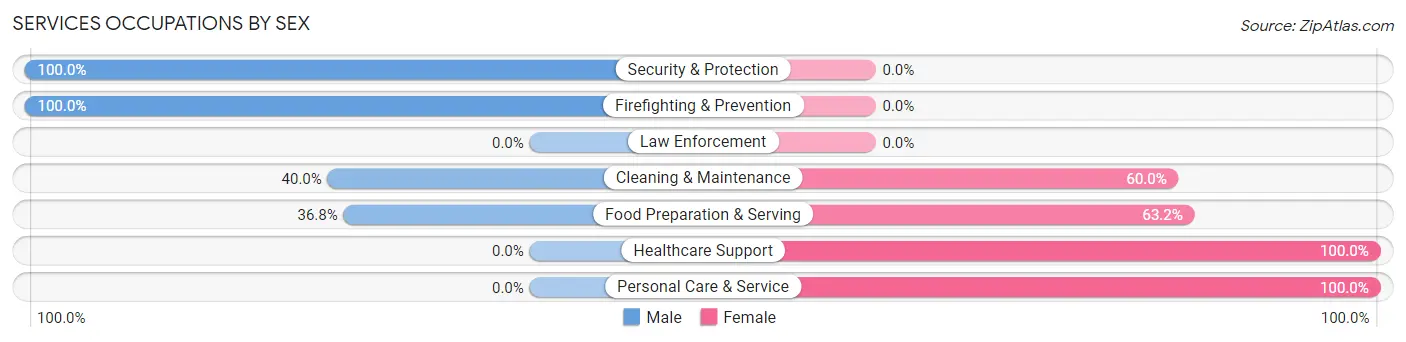
| Occupation | Male | Female |
| Healthcare Support | 0 (0.0%) | 3 (100.0%) |
| Security & Protection | 10 (100.0%) | 0 (0.0%) |
| Firefighting & Prevention | 10 (100.0%) | 0 (0.0%) |
| Law Enforcement | 0 (0.0%) | 0 (0.0%) |
| Food Preparation & Serving | 7 (36.8%) | 12 (63.2%) |
| Cleaning & Maintenance | 2 (40.0%) | 3 (60.0%) |
| Personal Care & Service | 0 (0.0%) | 22 (100.0%) |
| Total (Category) | 19 (32.2%) | 40 (67.8%) |
| Total (Overall) | 154 (52.7%) | 138 (47.3%) |
Sales and Office Occupations
The most common Sales and Office occupations in New Lothrop are Office & Administration (52 | 17.8%), and Sales & Related (18 | 6.2%).

Sales and Office Occupations by Sex

| Occupation | Male | Female |
| Sales & Related | 13 (72.2%) | 5 (27.8%) |
| Office & Administration | 5 (9.6%) | 47 (90.4%) |
| Total (Category) | 18 (25.7%) | 52 (74.3%) |
| Total (Overall) | 154 (52.7%) | 138 (47.3%) |
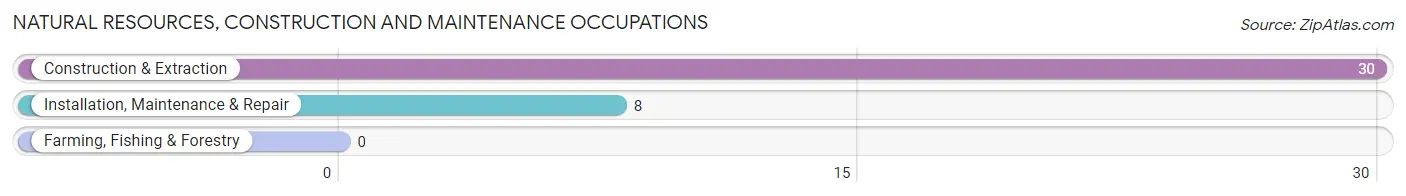
Natural Resources, Construction and Maintenance Occupations
The most common Natural Resources, Construction and Maintenance occupations in New Lothrop are Construction & Extraction (30 | 10.3%), and Installation, Maintenance & Repair (8 | 2.7%).
Natural Resources, Construction and Maintenance Occupations by Sex
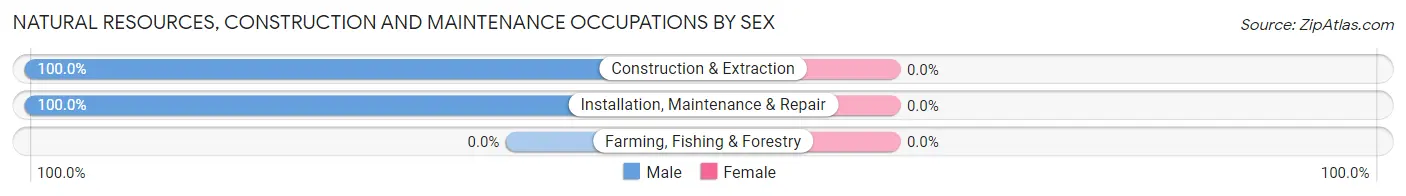
| Occupation | Male | Female |
| Farming, Fishing & Forestry | 0 (0.0%) | 0 (0.0%) |
| Construction & Extraction | 30 (100.0%) | 0 (0.0%) |
| Installation, Maintenance & Repair | 8 (100.0%) | 0 (0.0%) |
| Total (Category) | 38 (100.0%) | 0 (0.0%) |
| Total (Overall) | 154 (52.7%) | 138 (47.3%) |
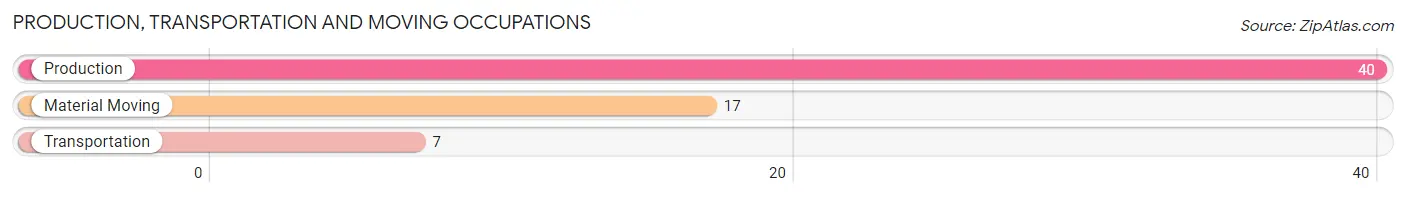
Production, Transportation and Moving Occupations
The most common Production, Transportation and Moving occupations in New Lothrop are Production (40 | 13.7%), Material Moving (17 | 5.8%), and Transportation (7 | 2.4%).
Production, Transportation and Moving Occupations by Sex
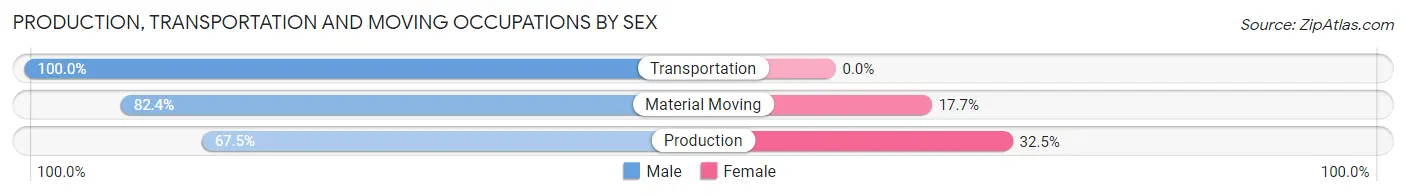
| Occupation | Male | Female |
| Production | 27 (67.5%) | 13 (32.5%) |
| Transportation | 7 (100.0%) | 0 (0.0%) |
| Material Moving | 14 (82.4%) | 3 (17.6%) |
| Total (Category) | 48 (75.0%) | 16 (25.0%) |
| Total (Overall) | 154 (52.7%) | 138 (47.3%) |
Employment Industries by Sex in New Lothrop
Employment Industries in New Lothrop
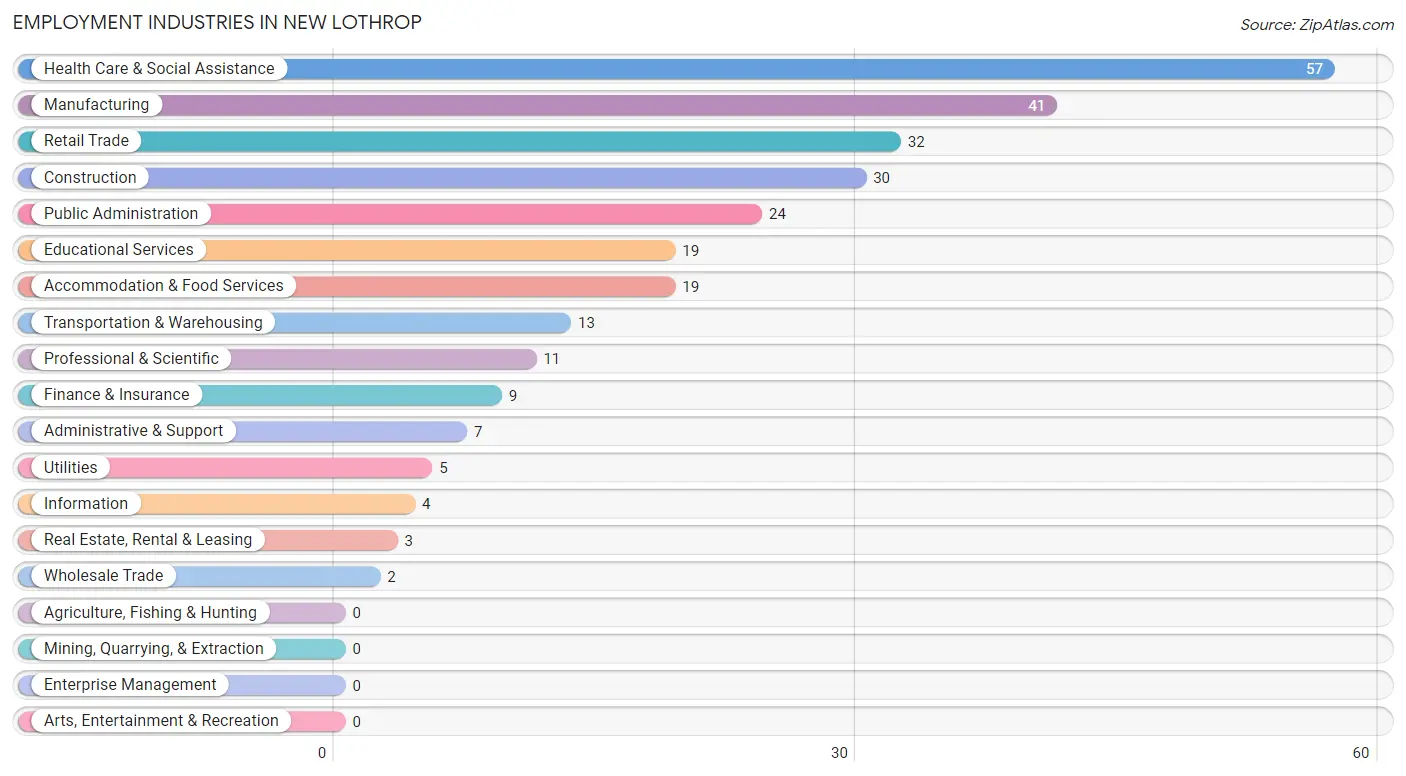
The major employment industries in New Lothrop include Health Care & Social Assistance (57 | 19.5%), Manufacturing (41 | 14.0%), Retail Trade (32 | 11.0%), Construction (30 | 10.3%), and Public Administration (24 | 8.2%).
Employment Industries by Sex in New Lothrop
The New Lothrop industries that see more men than women are Construction (100.0%), Wholesale Trade (100.0%), and Utilities (100.0%), whereas the industries that tend to have a higher number of women are Information (100.0%), Educational Services (89.5%), and Finance & Insurance (77.8%).
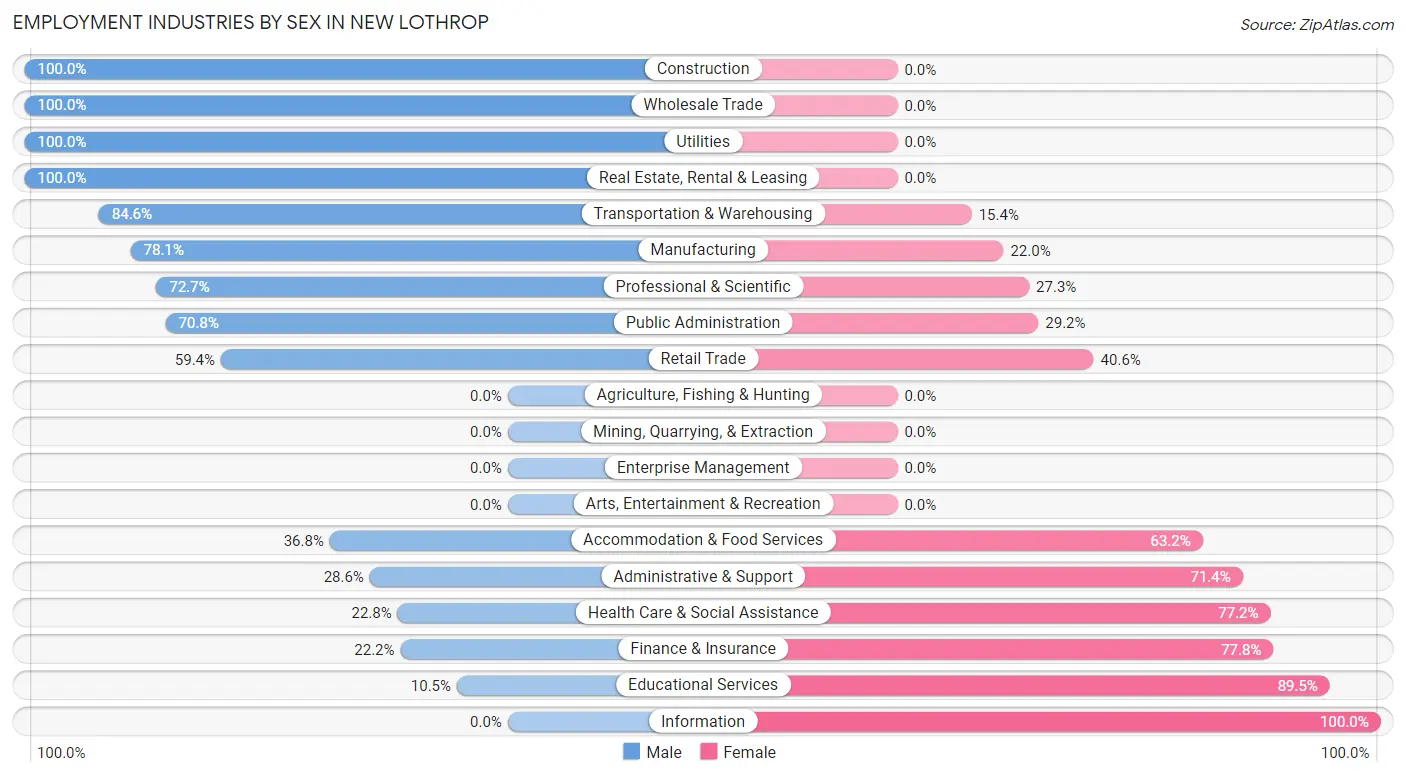
| Industry | Male | Female |
| Agriculture, Fishing & Hunting | 0 (0.0%) | 0 (0.0%) |
| Mining, Quarrying, & Extraction | 0 (0.0%) | 0 (0.0%) |
| Construction | 30 (100.0%) | 0 (0.0%) |
| Manufacturing | 32 (78.0%) | 9 (22.0%) |
| Wholesale Trade | 2 (100.0%) | 0 (0.0%) |
| Retail Trade | 19 (59.4%) | 13 (40.6%) |
| Transportation & Warehousing | 11 (84.6%) | 2 (15.4%) |
| Utilities | 5 (100.0%) | 0 (0.0%) |
| Information | 0 (0.0%) | 4 (100.0%) |
| Finance & Insurance | 2 (22.2%) | 7 (77.8%) |
| Real Estate, Rental & Leasing | 3 (100.0%) | 0 (0.0%) |
| Professional & Scientific | 8 (72.7%) | 3 (27.3%) |
| Enterprise Management | 0 (0.0%) | 0 (0.0%) |
| Administrative & Support | 2 (28.6%) | 5 (71.4%) |
| Educational Services | 2 (10.5%) | 17 (89.5%) |
| Health Care & Social Assistance | 13 (22.8%) | 44 (77.2%) |
| Arts, Entertainment & Recreation | 0 (0.0%) | 0 (0.0%) |
| Accommodation & Food Services | 7 (36.8%) | 12 (63.2%) |
| Public Administration | 17 (70.8%) | 7 (29.2%) |
| Total | 154 (52.7%) | 138 (47.3%) |
Education in New Lothrop
School Enrollment in New Lothrop
The most common levels of schooling among the 136 students in New Lothrop are elementary school (43 | 31.6%), high school (36 | 26.5%), and college / undergraduate (27 | 19.9%).
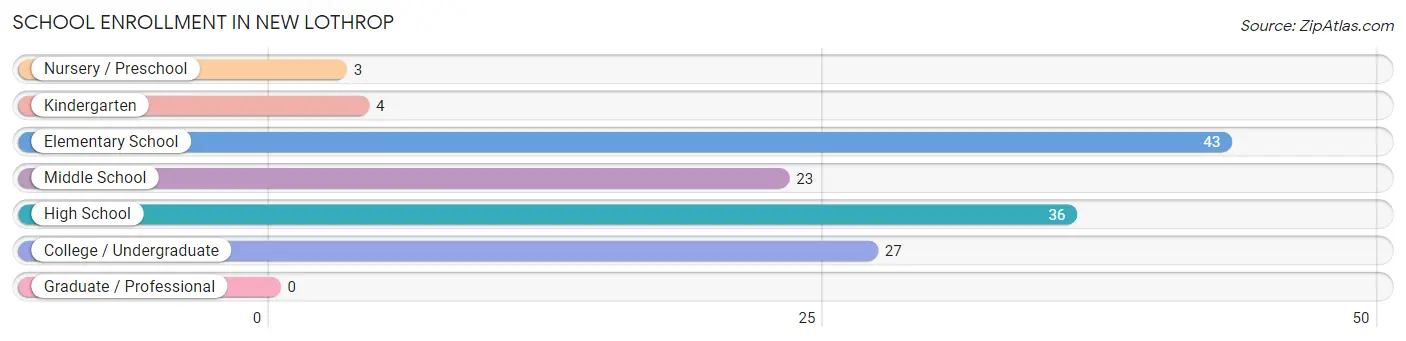
| School Level | # Students | % Students |
| Nursery / Preschool | 3 | 2.2% |
| Kindergarten | 4 | 2.9% |
| Elementary School | 43 | 31.6% |
| Middle School | 23 | 16.9% |
| High School | 36 | 26.5% |
| College / Undergraduate | 27 | 19.9% |
| Graduate / Professional | 0 | 0.0% |
| Total | 136 | 100.0% |
School Enrollment by Age by Funding Source in New Lothrop
Out of a total of 136 students who are enrolled in schools in New Lothrop, 16 (11.8%) attend a private institution, while the remaining 120 (88.2%) are enrolled in public schools. The age group of 25 to 34 year olds has the highest likelihood of being enrolled in private schools, with 2 (100.0% in the age bracket) enrolled. Conversely, the age group of 3 to 4 year olds has the lowest likelihood of being enrolled in a private school, with 3 (100.0% in the age bracket) attending a public institution.
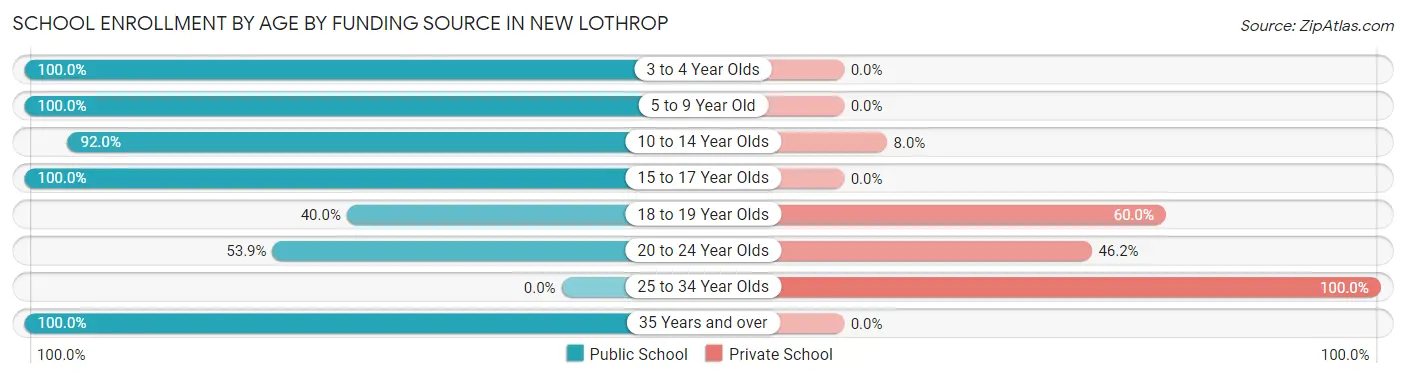
| Age Bracket | Public School | Private School |
| 3 to 4 Year Olds | 3 (100.0%) | 0 (0.0%) |
| 5 to 9 Year Old | 47 (100.0%) | 0 (0.0%) |
| 10 to 14 Year Olds | 23 (92.0%) | 2 (8.0%) |
| 15 to 17 Year Olds | 29 (100.0%) | 0 (0.0%) |
| 18 to 19 Year Olds | 4 (40.0%) | 6 (60.0%) |
| 20 to 24 Year Olds | 7 (53.8%) | 6 (46.2%) |
| 25 to 34 Year Olds | 0 (0.0%) | 2 (100.0%) |
| 35 Years and over | 7 (100.0%) | 0 (0.0%) |
| Total | 120 (88.2%) | 16 (11.8%) |
Educational Attainment by Field of Study in New Lothrop
Business (29 | 34.1%), education (13 | 15.3%), bio, nature & agricultural (7 | 8.2%), social sciences (7 | 8.2%), and science & technology (7 | 8.2%) are the most common fields of study among 85 individuals in New Lothrop who have obtained a bachelor's degree or higher.
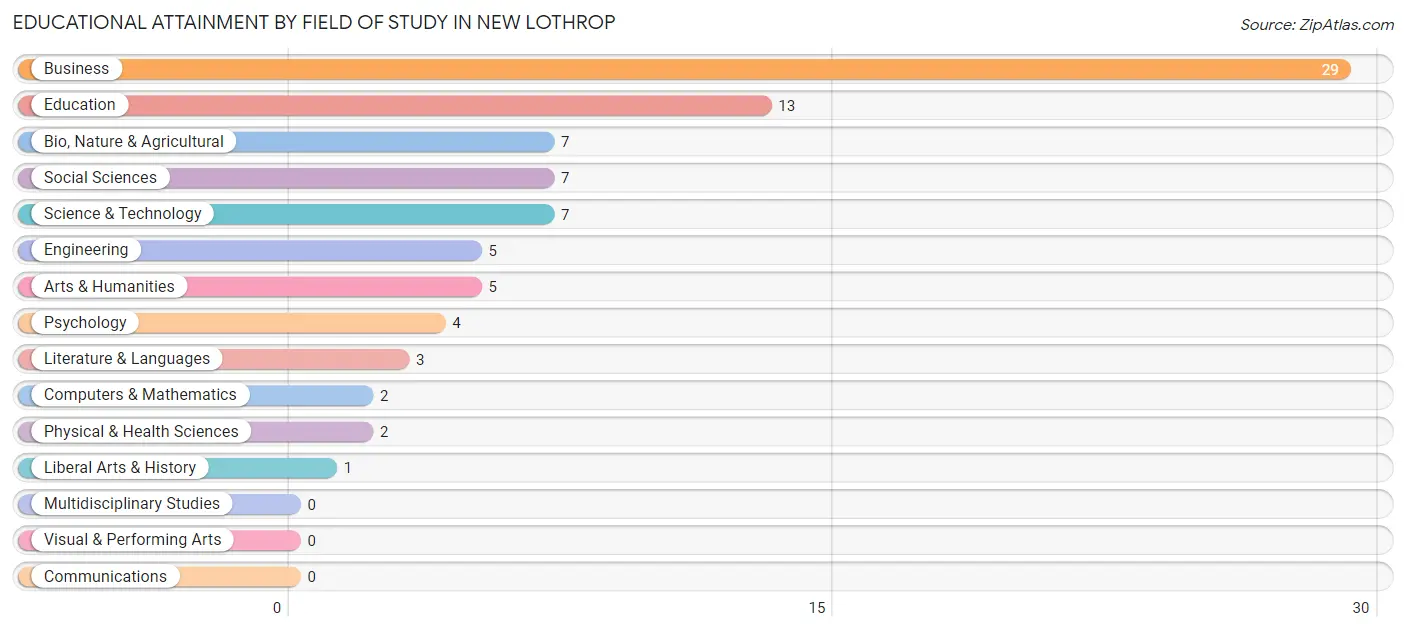
| Field of Study | # Graduates | % Graduates |
| Computers & Mathematics | 2 | 2.4% |
| Bio, Nature & Agricultural | 7 | 8.2% |
| Physical & Health Sciences | 2 | 2.4% |
| Psychology | 4 | 4.7% |
| Social Sciences | 7 | 8.2% |
| Engineering | 5 | 5.9% |
| Multidisciplinary Studies | 0 | 0.0% |
| Science & Technology | 7 | 8.2% |
| Business | 29 | 34.1% |
| Education | 13 | 15.3% |
| Literature & Languages | 3 | 3.5% |
| Liberal Arts & History | 1 | 1.2% |
| Visual & Performing Arts | 0 | 0.0% |
| Communications | 0 | 0.0% |
| Arts & Humanities | 5 | 5.9% |
| Total | 85 | 100.0% |
Transportation & Commute in New Lothrop
Vehicle Availability by Sex in New Lothrop
The most prevalent vehicle ownership categories in New Lothrop are males with 2 vehicles (69, accounting for 45.7%) and females with 2 vehicles (46, making up 50.0%).
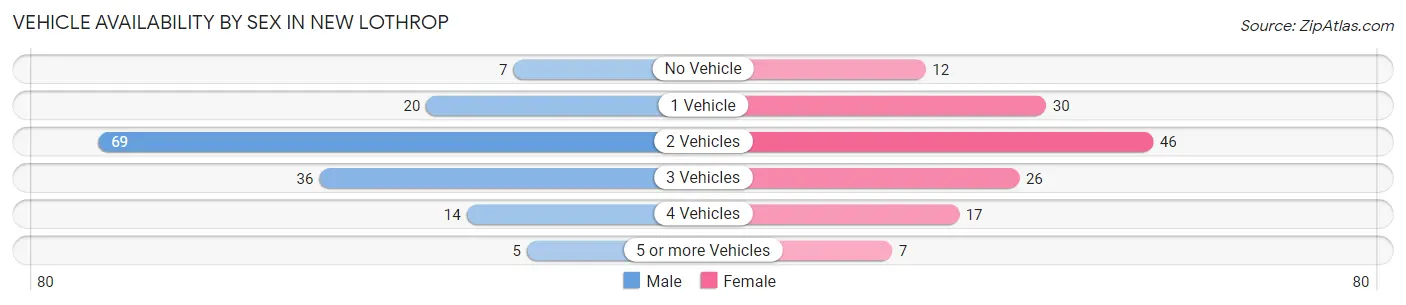
| Vehicles Available | Male | Female |
| No Vehicle | 7 (4.6%) | 12 (8.7%) |
| 1 Vehicle | 20 (13.3%) | 30 (21.7%) |
| 2 Vehicles | 69 (45.7%) | 46 (33.3%) |
| 3 Vehicles | 36 (23.8%) | 26 (18.8%) |
| 4 Vehicles | 14 (9.3%) | 17 (12.3%) |
| 5 or more Vehicles | 5 (3.3%) | 7 (5.1%) |
| Total | 151 (100.0%) | 138 (100.0%) |
Commute Time in New Lothrop
The most frequently occuring commute durations in New Lothrop are 60 to 89 minutes (54 commuters, 20.8%), 20 to 24 minutes (44 commuters, 16.9%), and 5 to 9 minutes (38 commuters, 14.6%).
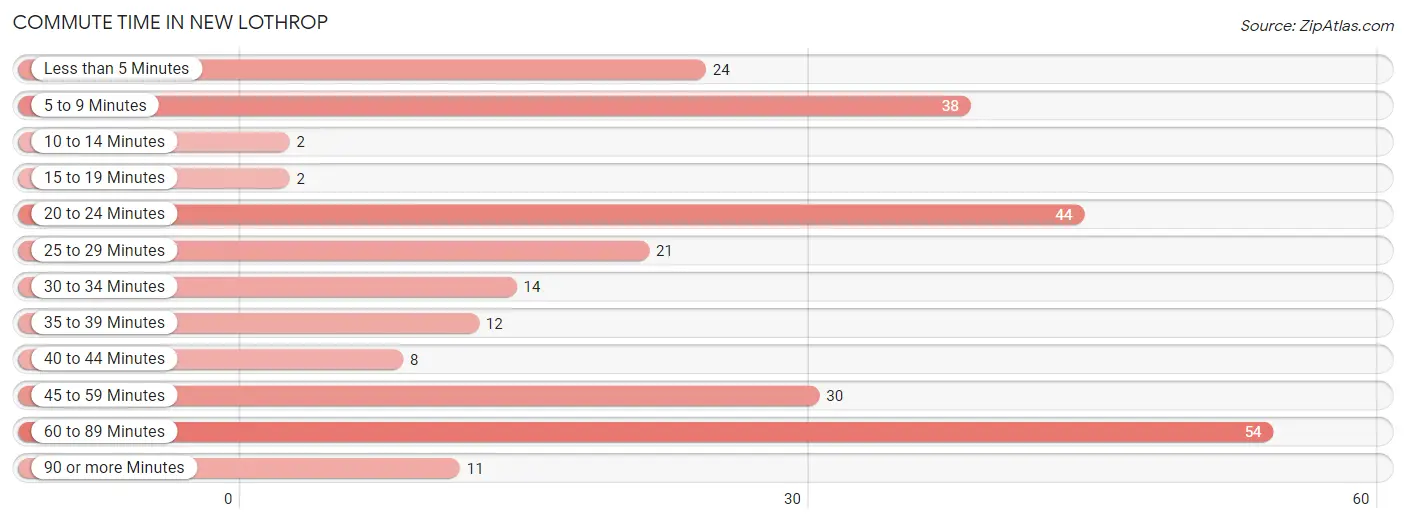
| Commute Time | # Commuters | % Commuters |
| Less than 5 Minutes | 24 | 9.2% |
| 5 to 9 Minutes | 38 | 14.6% |
| 10 to 14 Minutes | 2 | 0.8% |
| 15 to 19 Minutes | 2 | 0.8% |
| 20 to 24 Minutes | 44 | 16.9% |
| 25 to 29 Minutes | 21 | 8.1% |
| 30 to 34 Minutes | 14 | 5.4% |
| 35 to 39 Minutes | 12 | 4.6% |
| 40 to 44 Minutes | 8 | 3.1% |
| 45 to 59 Minutes | 30 | 11.5% |
| 60 to 89 Minutes | 54 | 20.8% |
| 90 or more Minutes | 11 | 4.2% |
Commute Time by Sex in New Lothrop
The most common commute times in New Lothrop are 45 to 59 minutes (26 commuters, 18.6%) for males and 60 to 89 minutes (40 commuters, 33.3%) for females.
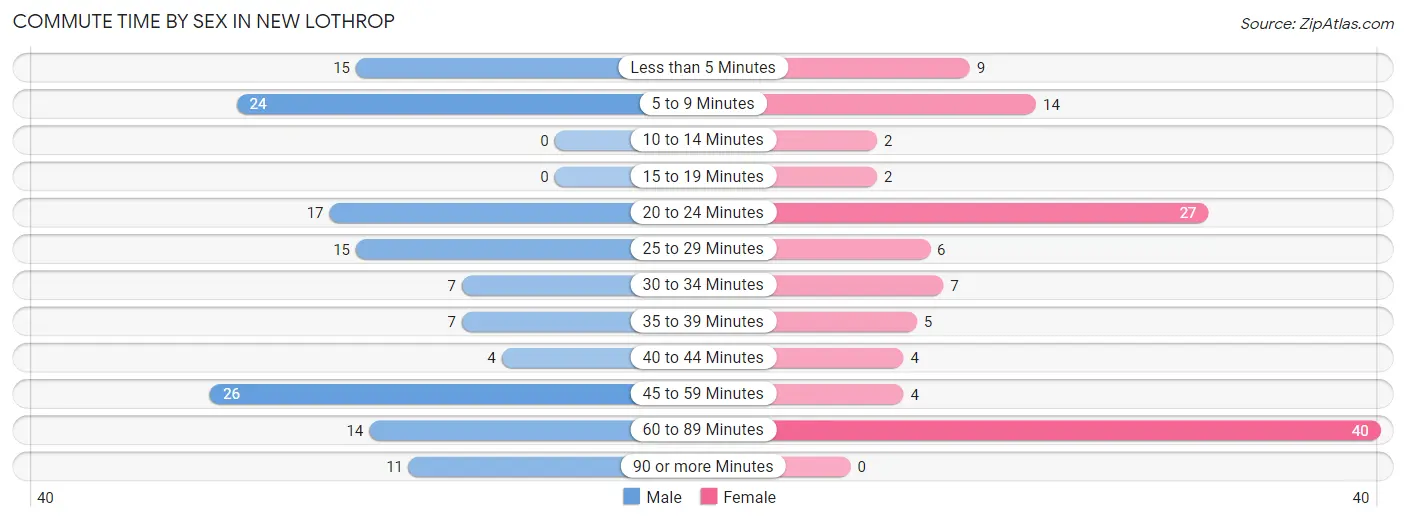
| Commute Time | Male | Female |
| Less than 5 Minutes | 15 (10.7%) | 9 (7.5%) |
| 5 to 9 Minutes | 24 (17.1%) | 14 (11.7%) |
| 10 to 14 Minutes | 0 (0.0%) | 2 (1.7%) |
| 15 to 19 Minutes | 0 (0.0%) | 2 (1.7%) |
| 20 to 24 Minutes | 17 (12.1%) | 27 (22.5%) |
| 25 to 29 Minutes | 15 (10.7%) | 6 (5.0%) |
| 30 to 34 Minutes | 7 (5.0%) | 7 (5.8%) |
| 35 to 39 Minutes | 7 (5.0%) | 5 (4.2%) |
| 40 to 44 Minutes | 4 (2.9%) | 4 (3.3%) |
| 45 to 59 Minutes | 26 (18.6%) | 4 (3.3%) |
| 60 to 89 Minutes | 14 (10.0%) | 40 (33.3%) |
| 90 or more Minutes | 11 (7.9%) | 0 (0.0%) |
Time of Departure to Work by Sex in New Lothrop
The most frequent times of departure to work in New Lothrop are 12:00 AM to 4:59 AM (29, 20.7%) for males and 12:00 PM to 3:59 PM (22, 18.3%) for females.
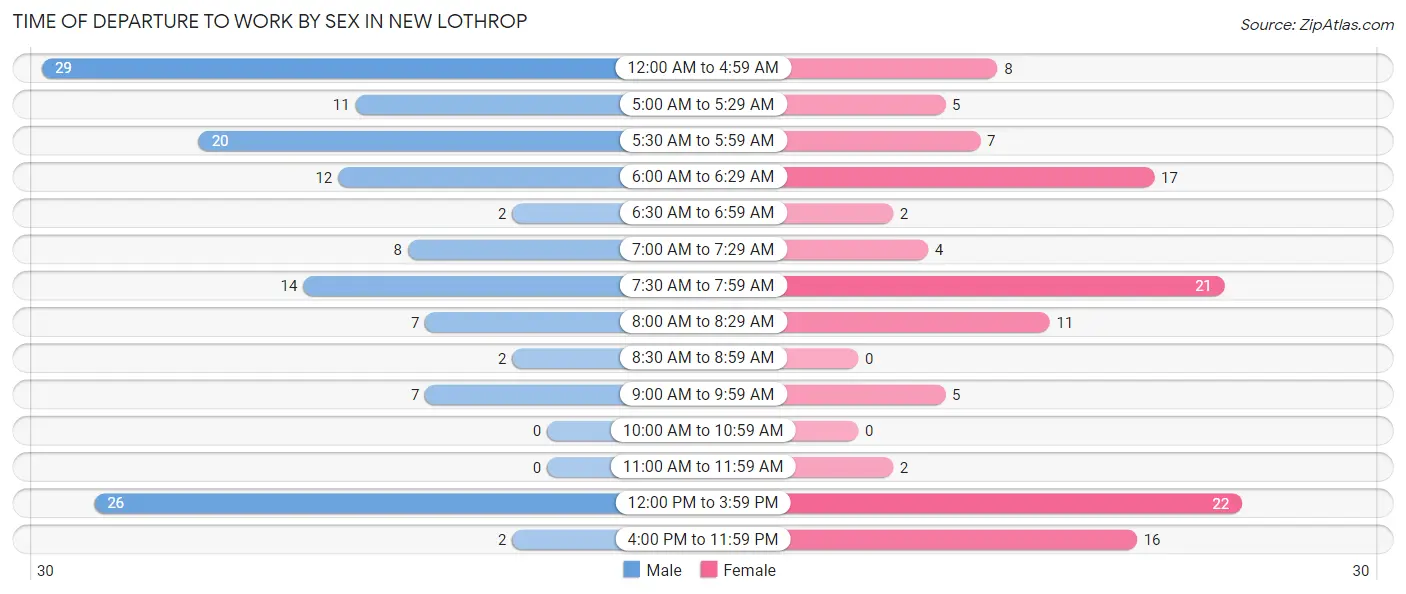
| Time of Departure | Male | Female |
| 12:00 AM to 4:59 AM | 29 (20.7%) | 8 (6.7%) |
| 5:00 AM to 5:29 AM | 11 (7.9%) | 5 (4.2%) |
| 5:30 AM to 5:59 AM | 20 (14.3%) | 7 (5.8%) |
| 6:00 AM to 6:29 AM | 12 (8.6%) | 17 (14.2%) |
| 6:30 AM to 6:59 AM | 2 (1.4%) | 2 (1.7%) |
| 7:00 AM to 7:29 AM | 8 (5.7%) | 4 (3.3%) |
| 7:30 AM to 7:59 AM | 14 (10.0%) | 21 (17.5%) |
| 8:00 AM to 8:29 AM | 7 (5.0%) | 11 (9.2%) |
| 8:30 AM to 8:59 AM | 2 (1.4%) | 0 (0.0%) |
| 9:00 AM to 9:59 AM | 7 (5.0%) | 5 (4.2%) |
| 10:00 AM to 10:59 AM | 0 (0.0%) | 0 (0.0%) |
| 11:00 AM to 11:59 AM | 0 (0.0%) | 2 (1.7%) |
| 12:00 PM to 3:59 PM | 26 (18.6%) | 22 (18.3%) |
| 4:00 PM to 11:59 PM | 2 (1.4%) | 16 (13.3%) |
| Total | 140 (100.0%) | 120 (100.0%) |
Housing Occupancy in New Lothrop
Occupancy by Ownership in New Lothrop
Of the total 261 dwellings in New Lothrop, owner-occupied units account for 158 (60.5%), while renter-occupied units make up 103 (39.5%).
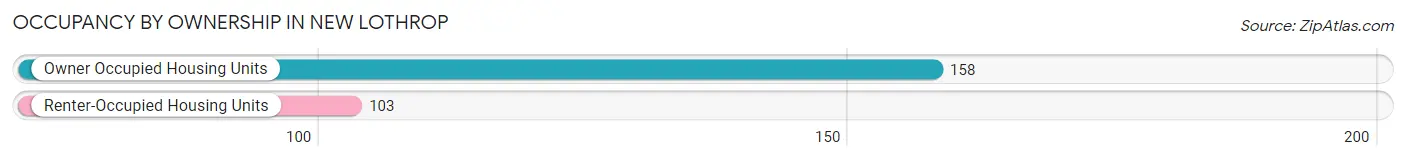
| Occupancy | # Housing Units | % Housing Units |
| Owner Occupied Housing Units | 158 | 60.5% |
| Renter-Occupied Housing Units | 103 | 39.5% |
| Total Occupied Housing Units | 261 | 100.0% |
Occupancy by Household Size in New Lothrop
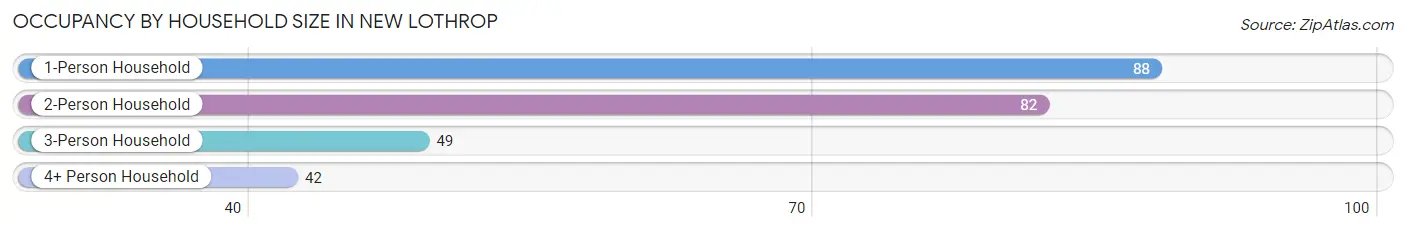
| Household Size | # Housing Units | % Housing Units |
| 1-Person Household | 88 | 33.7% |
| 2-Person Household | 82 | 31.4% |
| 3-Person Household | 49 | 18.8% |
| 4+ Person Household | 42 | 16.1% |
| Total Housing Units | 261 | 100.0% |
Occupancy by Ownership by Household Size in New Lothrop
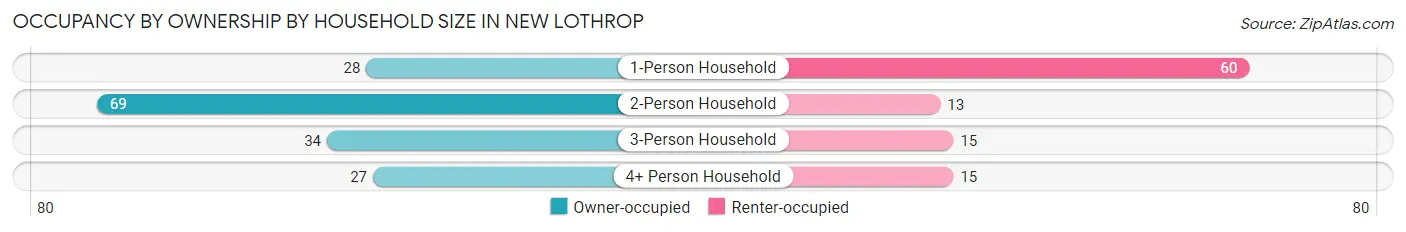
| Household Size | Owner-occupied | Renter-occupied |
| 1-Person Household | 28 (31.8%) | 60 (68.2%) |
| 2-Person Household | 69 (84.2%) | 13 (15.9%) |
| 3-Person Household | 34 (69.4%) | 15 (30.6%) |
| 4+ Person Household | 27 (64.3%) | 15 (35.7%) |
| Total Housing Units | 158 (60.5%) | 103 (39.5%) |
Occupancy by Educational Attainment in New Lothrop
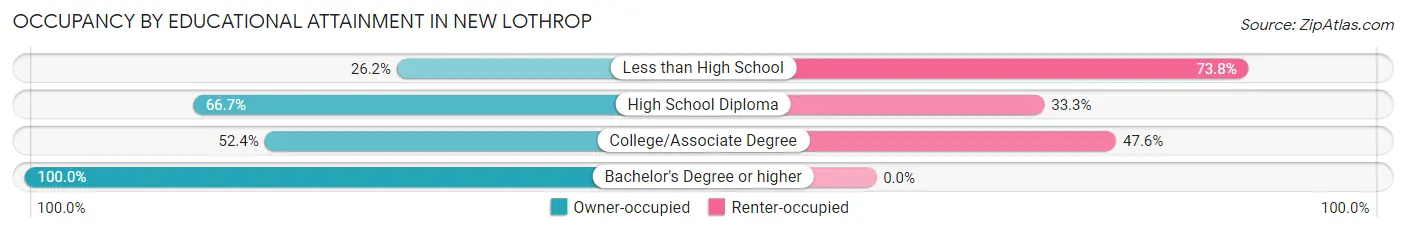
| Household Size | Owner-occupied | Renter-occupied |
| Less than High School | 11 (26.2%) | 31 (73.8%) |
| High School Diploma | 46 (66.7%) | 23 (33.3%) |
| College/Associate Degree | 54 (52.4%) | 49 (47.6%) |
| Bachelor's Degree or higher | 47 (100.0%) | 0 (0.0%) |
Occupancy by Age of Householder in New Lothrop
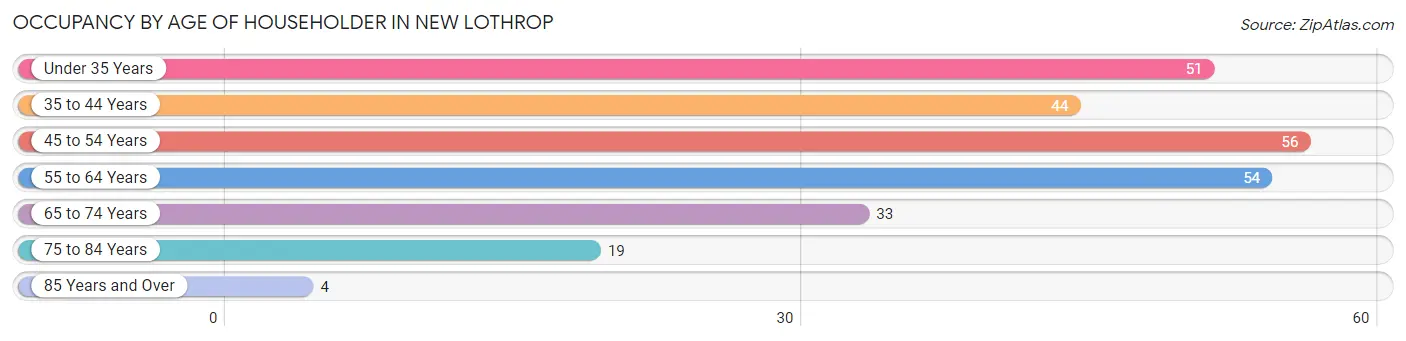
| Age Bracket | # Households | % Households |
| Under 35 Years | 51 | 19.5% |
| 35 to 44 Years | 44 | 16.9% |
| 45 to 54 Years | 56 | 21.5% |
| 55 to 64 Years | 54 | 20.7% |
| 65 to 74 Years | 33 | 12.6% |
| 75 to 84 Years | 19 | 7.3% |
| 85 Years and Over | 4 | 1.5% |
| Total | 261 | 100.0% |
Housing Finances in New Lothrop
Median Income by Occupancy in New Lothrop
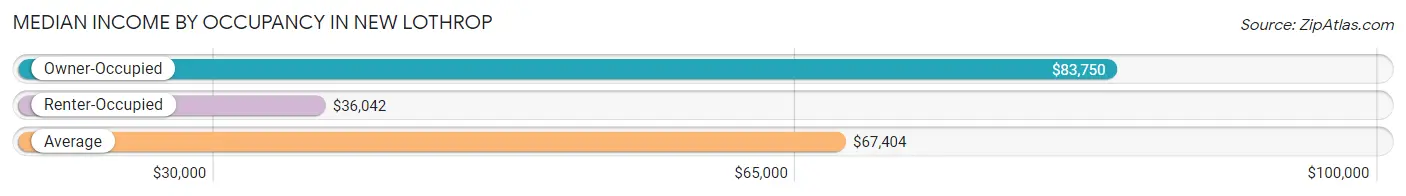
| Occupancy Type | # Households | Median Income |
| Owner-Occupied | 158 (60.5%) | $83,750 |
| Renter-Occupied | 103 (39.5%) | $36,042 |
| Average | 261 (100.0%) | $67,404 |
Occupancy by Householder Income Bracket in New Lothrop
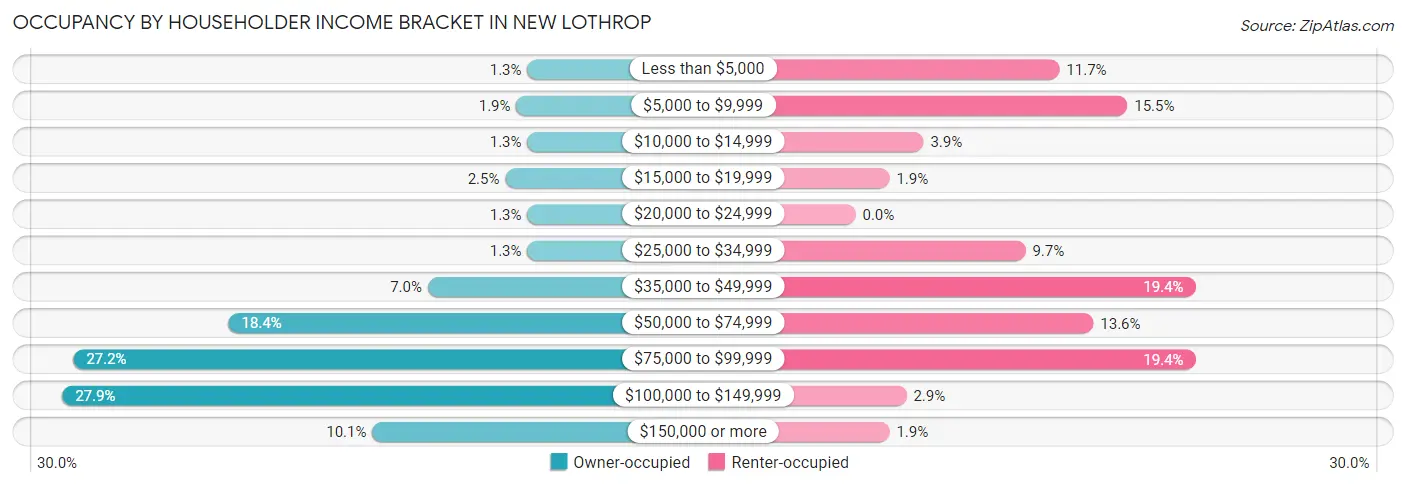
| Income Bracket | Owner-occupied | Renter-occupied |
| Less than $5,000 | 2 (1.3%) | 12 (11.7%) |
| $5,000 to $9,999 | 3 (1.9%) | 16 (15.5%) |
| $10,000 to $14,999 | 2 (1.3%) | 4 (3.9%) |
| $15,000 to $19,999 | 4 (2.5%) | 2 (1.9%) |
| $20,000 to $24,999 | 2 (1.3%) | 0 (0.0%) |
| $25,000 to $34,999 | 2 (1.3%) | 10 (9.7%) |
| $35,000 to $49,999 | 11 (7.0%) | 20 (19.4%) |
| $50,000 to $74,999 | 29 (18.3%) | 14 (13.6%) |
| $75,000 to $99,999 | 43 (27.2%) | 20 (19.4%) |
| $100,000 to $149,999 | 44 (27.9%) | 3 (2.9%) |
| $150,000 or more | 16 (10.1%) | 2 (1.9%) |
| Total | 158 (100.0%) | 103 (100.0%) |
Monthly Housing Cost Tiers in New Lothrop
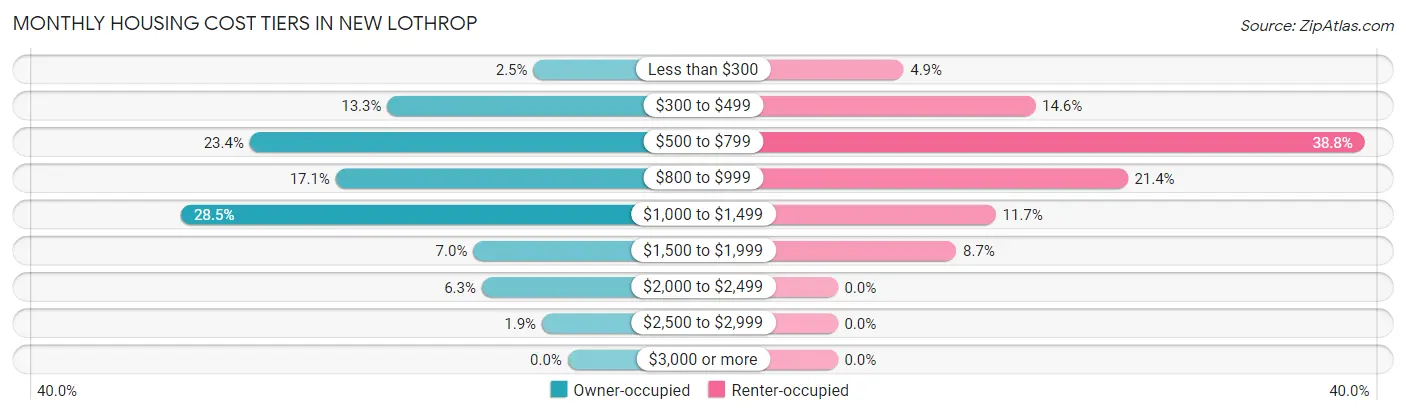
| Monthly Cost | Owner-occupied | Renter-occupied |
| Less than $300 | 4 (2.5%) | 5 (4.9%) |
| $300 to $499 | 21 (13.3%) | 15 (14.6%) |
| $500 to $799 | 37 (23.4%) | 40 (38.8%) |
| $800 to $999 | 27 (17.1%) | 22 (21.4%) |
| $1,000 to $1,499 | 45 (28.5%) | 12 (11.7%) |
| $1,500 to $1,999 | 11 (7.0%) | 9 (8.7%) |
| $2,000 to $2,499 | 10 (6.3%) | 0 (0.0%) |
| $2,500 to $2,999 | 3 (1.9%) | 0 (0.0%) |
| $3,000 or more | 0 (0.0%) | 0 (0.0%) |
| Total | 158 (100.0%) | 103 (100.0%) |
Physical Housing Characteristics in New Lothrop
Housing Structures in New Lothrop
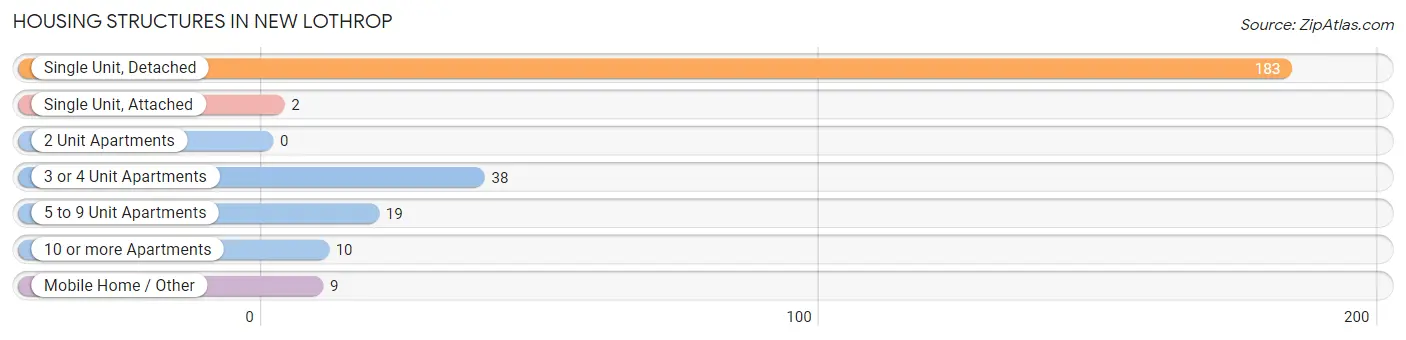
| Structure Type | # Housing Units | % Housing Units |
| Single Unit, Detached | 183 | 70.1% |
| Single Unit, Attached | 2 | 0.8% |
| 2 Unit Apartments | 0 | 0.0% |
| 3 or 4 Unit Apartments | 38 | 14.6% |
| 5 to 9 Unit Apartments | 19 | 7.3% |
| 10 or more Apartments | 10 | 3.8% |
| Mobile Home / Other | 9 | 3.5% |
| Total | 261 | 100.0% |
Housing Structures by Occupancy in New Lothrop
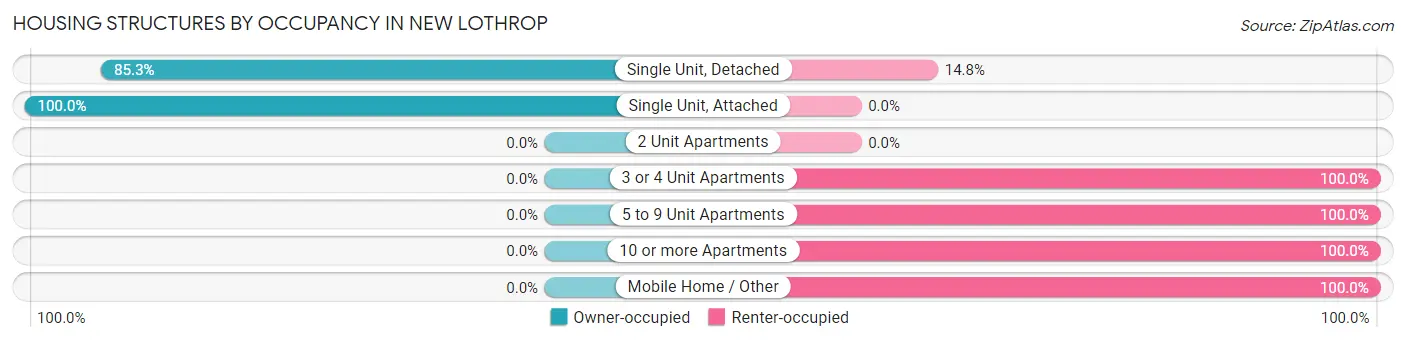
| Structure Type | Owner-occupied | Renter-occupied |
| Single Unit, Detached | 156 (85.3%) | 27 (14.7%) |
| Single Unit, Attached | 2 (100.0%) | 0 (0.0%) |
| 2 Unit Apartments | 0 (0.0%) | 0 (0.0%) |
| 3 or 4 Unit Apartments | 0 (0.0%) | 38 (100.0%) |
| 5 to 9 Unit Apartments | 0 (0.0%) | 19 (100.0%) |
| 10 or more Apartments | 0 (0.0%) | 10 (100.0%) |
| Mobile Home / Other | 0 (0.0%) | 9 (100.0%) |
| Total | 158 (60.5%) | 103 (39.5%) |
Housing Structures by Number of Rooms in New Lothrop
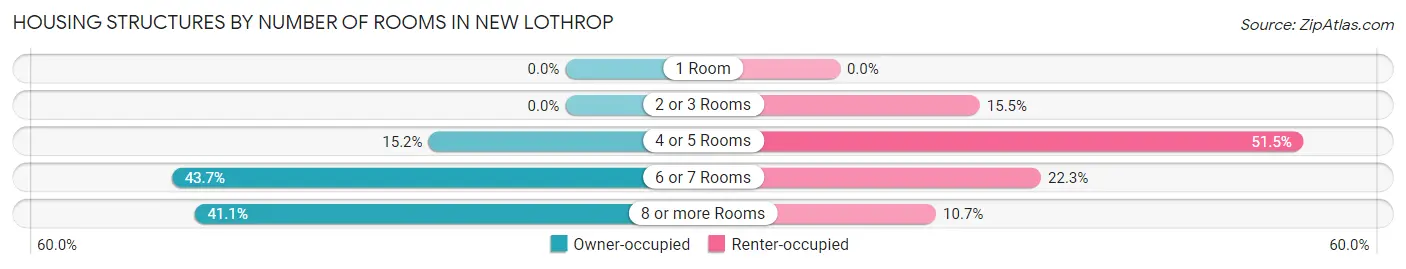
| Number of Rooms | Owner-occupied | Renter-occupied |
| 1 Room | 0 (0.0%) | 0 (0.0%) |
| 2 or 3 Rooms | 0 (0.0%) | 16 (15.5%) |
| 4 or 5 Rooms | 24 (15.2%) | 53 (51.5%) |
| 6 or 7 Rooms | 69 (43.7%) | 23 (22.3%) |
| 8 or more Rooms | 65 (41.1%) | 11 (10.7%) |
| Total | 158 (100.0%) | 103 (100.0%) |
Housing Structure by Heating Type in New Lothrop
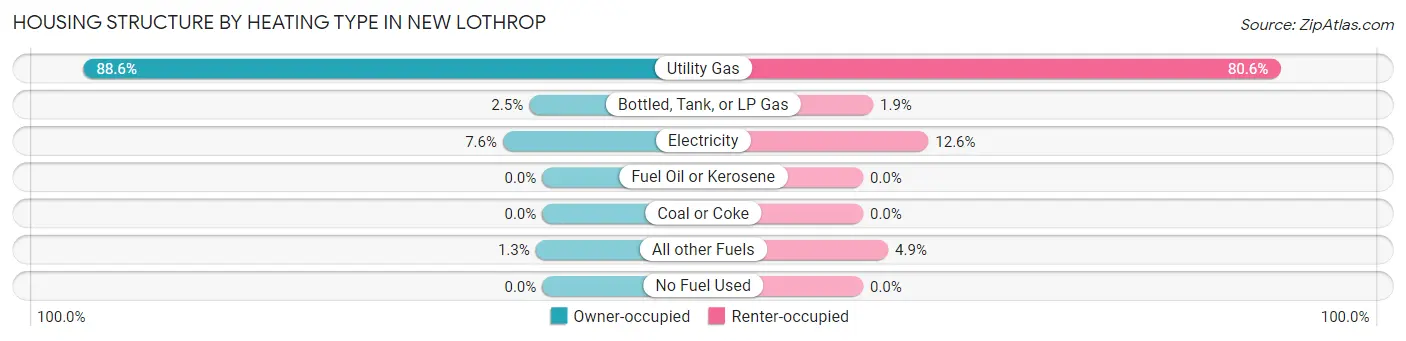
| Heating Type | Owner-occupied | Renter-occupied |
| Utility Gas | 140 (88.6%) | 83 (80.6%) |
| Bottled, Tank, or LP Gas | 4 (2.5%) | 2 (1.9%) |
| Electricity | 12 (7.6%) | 13 (12.6%) |
| Fuel Oil or Kerosene | 0 (0.0%) | 0 (0.0%) |
| Coal or Coke | 0 (0.0%) | 0 (0.0%) |
| All other Fuels | 2 (1.3%) | 5 (4.9%) |
| No Fuel Used | 0 (0.0%) | 0 (0.0%) |
| Total | 158 (100.0%) | 103 (100.0%) |
Household Vehicle Usage in New Lothrop
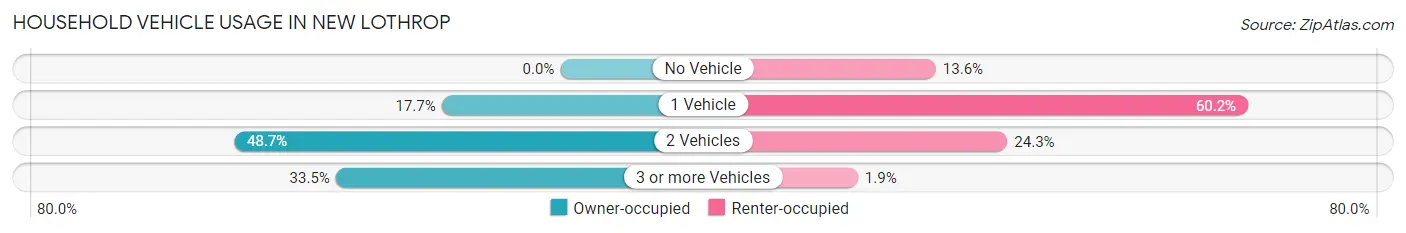
| Vehicles per Household | Owner-occupied | Renter-occupied |
| No Vehicle | 0 (0.0%) | 14 (13.6%) |
| 1 Vehicle | 28 (17.7%) | 62 (60.2%) |
| 2 Vehicles | 77 (48.7%) | 25 (24.3%) |
| 3 or more Vehicles | 53 (33.5%) | 2 (1.9%) |
| Total | 158 (100.0%) | 103 (100.0%) |
Real Estate & Mortgages in New Lothrop
Real Estate and Mortgage Overview in New Lothrop
| Characteristic | Without Mortgage | With Mortgage |
| Housing Units | 60 | 98 |
| Median Property Value | $182,100 | $138,500 |
| Median Household Income | $78,542 | $11 |
| Monthly Housing Costs | $571 | $0 |
| Real Estate Taxes | $2,909 | $12 |
Property Value by Mortgage Status in New Lothrop
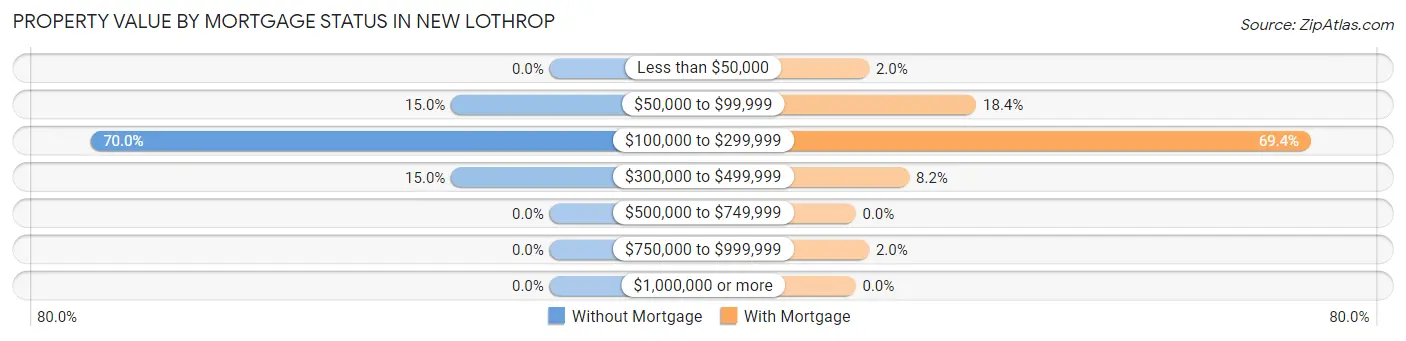
| Property Value | Without Mortgage | With Mortgage |
| Less than $50,000 | 0 (0.0%) | 2 (2.0%) |
| $50,000 to $99,999 | 9 (15.0%) | 18 (18.4%) |
| $100,000 to $299,999 | 42 (70.0%) | 68 (69.4%) |
| $300,000 to $499,999 | 9 (15.0%) | 8 (8.2%) |
| $500,000 to $749,999 | 0 (0.0%) | 0 (0.0%) |
| $750,000 to $999,999 | 0 (0.0%) | 2 (2.0%) |
| $1,000,000 or more | 0 (0.0%) | 0 (0.0%) |
| Total | 60 (100.0%) | 98 (100.0%) |
Household Income by Mortgage Status in New Lothrop
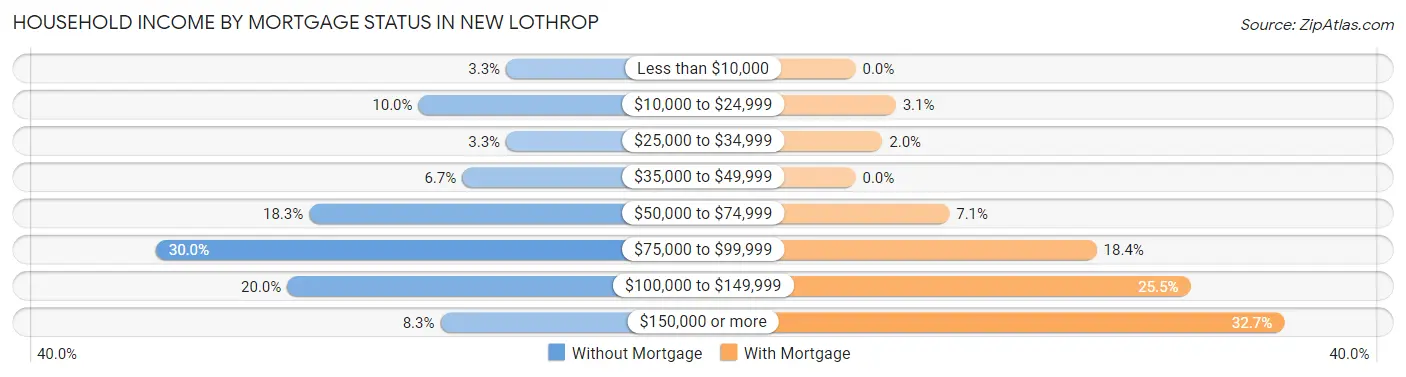
| Household Income | Without Mortgage | With Mortgage |
| Less than $10,000 | 2 (3.3%) | 0 (0.0%) |
| $10,000 to $24,999 | 6 (10.0%) | 3 (3.1%) |
| $25,000 to $34,999 | 2 (3.3%) | 2 (2.0%) |
| $35,000 to $49,999 | 4 (6.7%) | 0 (0.0%) |
| $50,000 to $74,999 | 11 (18.3%) | 7 (7.1%) |
| $75,000 to $99,999 | 18 (30.0%) | 18 (18.4%) |
| $100,000 to $149,999 | 12 (20.0%) | 25 (25.5%) |
| $150,000 or more | 5 (8.3%) | 32 (32.7%) |
| Total | 60 (100.0%) | 98 (100.0%) |
Property Value to Household Income Ratio in New Lothrop
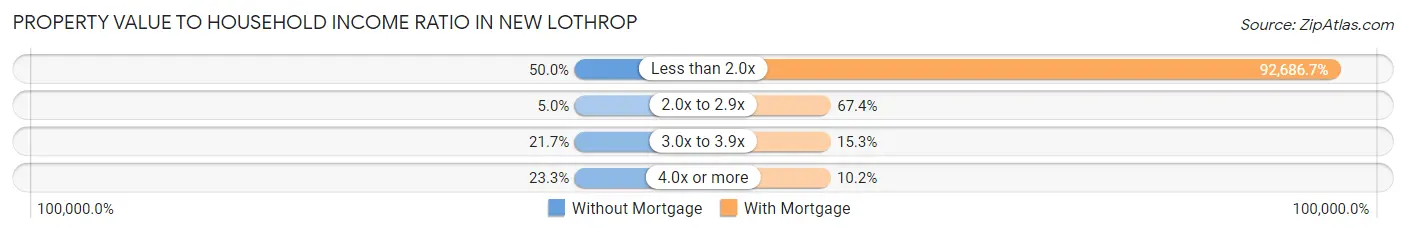
| Value-to-Income Ratio | Without Mortgage | With Mortgage |
| Less than 2.0x | 30 (50.0%) | 90,833 (92,686.7%) |
| 2.0x to 2.9x | 3 (5.0%) | 66 (67.3%) |
| 3.0x to 3.9x | 13 (21.7%) | 15 (15.3%) |
| 4.0x or more | 14 (23.3%) | 10 (10.2%) |
| Total | 60 (100.0%) | 98 (100.0%) |
Real Estate Taxes by Mortgage Status in New Lothrop
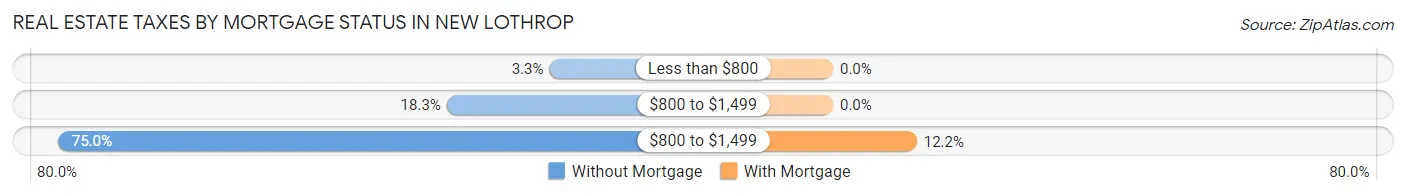
| Property Taxes | Without Mortgage | With Mortgage |
| Less than $800 | 2 (3.3%) | 0 (0.0%) |
| $800 to $1,499 | 11 (18.3%) | 0 (0.0%) |
| $800 to $1,499 | 45 (75.0%) | 12 (12.2%) |
| Total | 60 (100.0%) | 98 (100.0%) |
Health & Disability in New Lothrop
Health Insurance Coverage by Age in New Lothrop
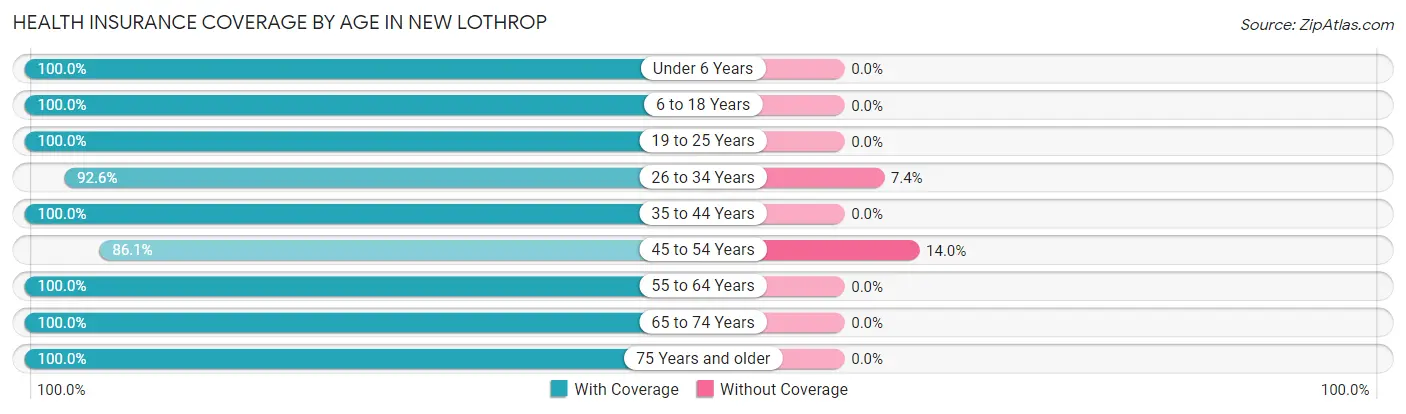
| Age Bracket | With Coverage | Without Coverage |
| Under 6 Years | 42 (100.0%) | 0 (0.0%) |
| 6 to 18 Years | 105 (100.0%) | 0 (0.0%) |
| 19 to 25 Years | 47 (100.0%) | 0 (0.0%) |
| 26 to 34 Years | 88 (92.6%) | 7 (7.4%) |
| 35 to 44 Years | 70 (100.0%) | 0 (0.0%) |
| 45 to 54 Years | 74 (86.1%) | 12 (14.0%) |
| 55 to 64 Years | 81 (100.0%) | 0 (0.0%) |
| 65 to 74 Years | 54 (100.0%) | 0 (0.0%) |
| 75 Years and older | 41 (100.0%) | 0 (0.0%) |
| Total | 602 (96.9%) | 19 (3.1%) |
Health Insurance Coverage by Citizenship Status in New Lothrop
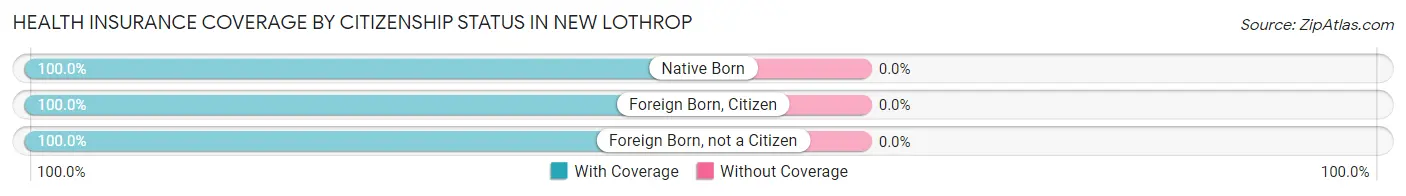
| Citizenship Status | With Coverage | Without Coverage |
| Native Born | 42 (100.0%) | 0 (0.0%) |
| Foreign Born, Citizen | 105 (100.0%) | 0 (0.0%) |
| Foreign Born, not a Citizen | 47 (100.0%) | 0 (0.0%) |
Health Insurance Coverage by Household Income in New Lothrop
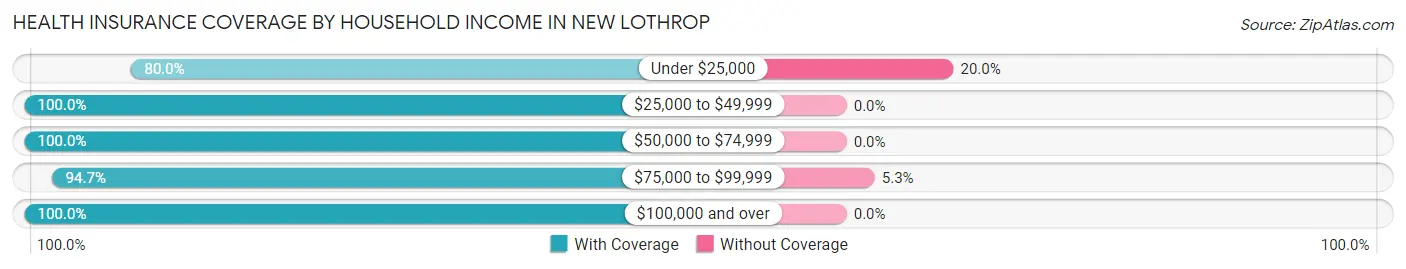
| Household Income | With Coverage | Without Coverage |
| Under $25,000 | 48 (80.0%) | 12 (20.0%) |
| $25,000 to $49,999 | 52 (100.0%) | 0 (0.0%) |
| $50,000 to $74,999 | 143 (100.0%) | 0 (0.0%) |
| $75,000 to $99,999 | 126 (94.7%) | 7 (5.3%) |
| $100,000 and over | 233 (100.0%) | 0 (0.0%) |
Public vs Private Health Insurance Coverage by Age in New Lothrop
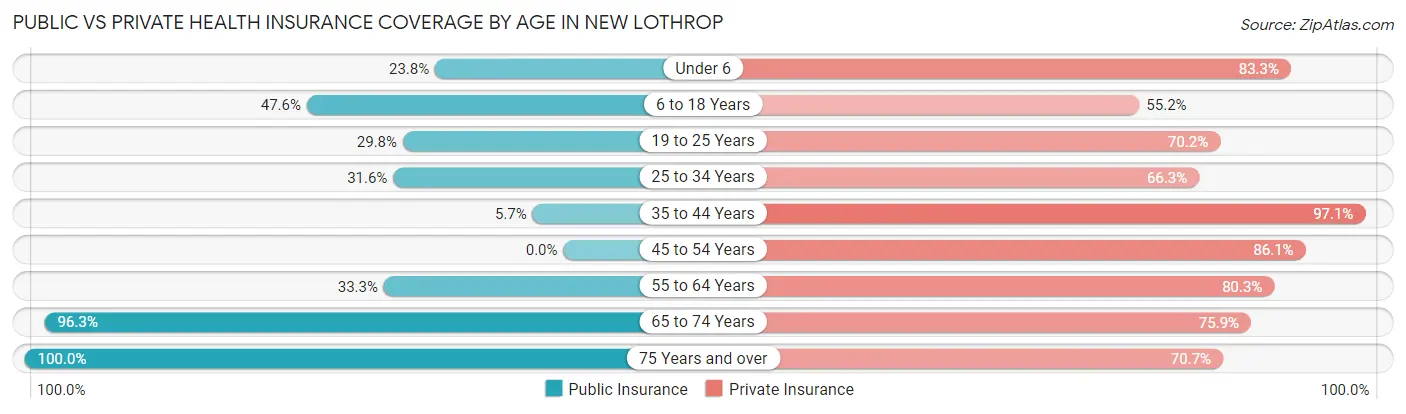
| Age Bracket | Public Insurance | Private Insurance |
| Under 6 | 10 (23.8%) | 35 (83.3%) |
| 6 to 18 Years | 50 (47.6%) | 58 (55.2%) |
| 19 to 25 Years | 14 (29.8%) | 33 (70.2%) |
| 25 to 34 Years | 30 (31.6%) | 63 (66.3%) |
| 35 to 44 Years | 4 (5.7%) | 68 (97.1%) |
| 45 to 54 Years | 0 (0.0%) | 74 (86.1%) |
| 55 to 64 Years | 27 (33.3%) | 65 (80.2%) |
| 65 to 74 Years | 52 (96.3%) | 41 (75.9%) |
| 75 Years and over | 41 (100.0%) | 29 (70.7%) |
| Total | 228 (36.7%) | 466 (75.0%) |
Disability Status by Sex by Age in New Lothrop
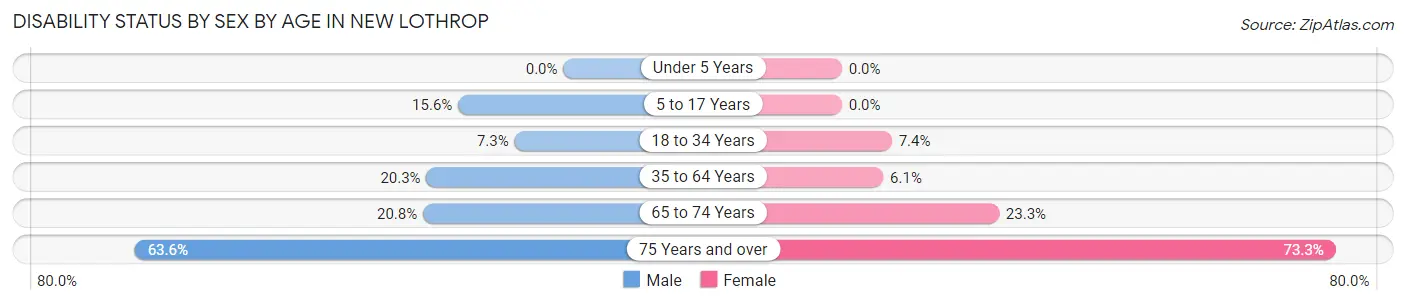
| Age Bracket | Male | Female |
| Under 5 Years | 0 (0.0%) | 0 (0.0%) |
| 5 to 17 Years | 10 (15.6%) | 0 (0.0%) |
| 18 to 34 Years | 5 (7.2%) | 6 (7.4%) |
| 35 to 64 Years | 25 (20.3%) | 7 (6.1%) |
| 65 to 74 Years | 5 (20.8%) | 7 (23.3%) |
| 75 Years and over | 7 (63.6%) | 22 (73.3%) |
Disability Class by Sex by Age in New Lothrop
Disability Class: Hearing Difficulty
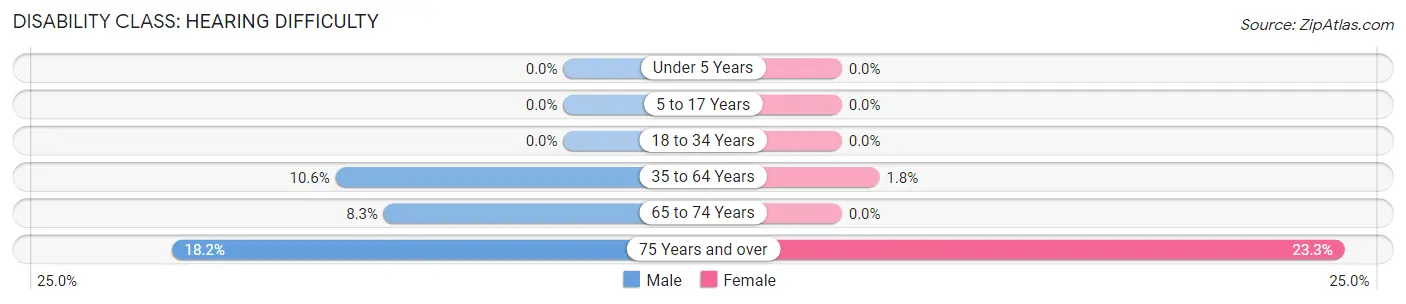
| Age Bracket | Male | Female |
| Under 5 Years | 0 (0.0%) | 0 (0.0%) |
| 5 to 17 Years | 0 (0.0%) | 0 (0.0%) |
| 18 to 34 Years | 0 (0.0%) | 0 (0.0%) |
| 35 to 64 Years | 13 (10.6%) | 2 (1.8%) |
| 65 to 74 Years | 2 (8.3%) | 0 (0.0%) |
| 75 Years and over | 2 (18.2%) | 7 (23.3%) |
Disability Class: Vision Difficulty
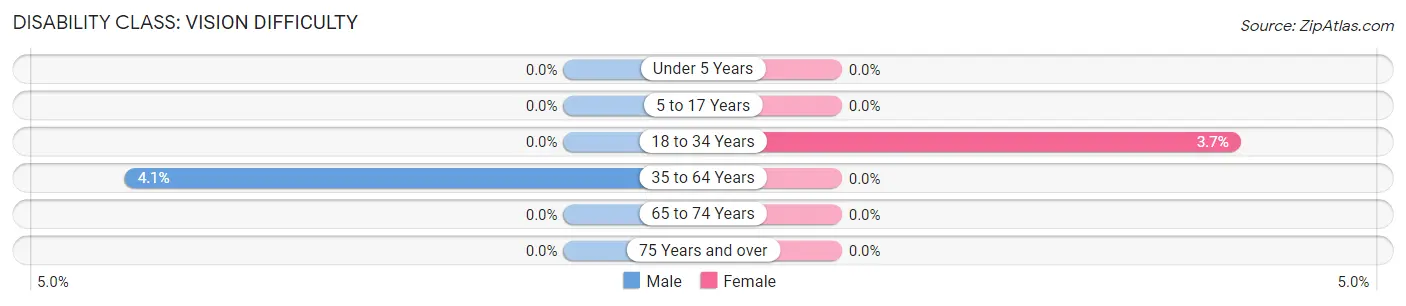
| Age Bracket | Male | Female |
| Under 5 Years | 0 (0.0%) | 0 (0.0%) |
| 5 to 17 Years | 0 (0.0%) | 0 (0.0%) |
| 18 to 34 Years | 0 (0.0%) | 3 (3.7%) |
| 35 to 64 Years | 5 (4.1%) | 0 (0.0%) |
| 65 to 74 Years | 0 (0.0%) | 0 (0.0%) |
| 75 Years and over | 0 (0.0%) | 0 (0.0%) |
Disability Class: Cognitive Difficulty
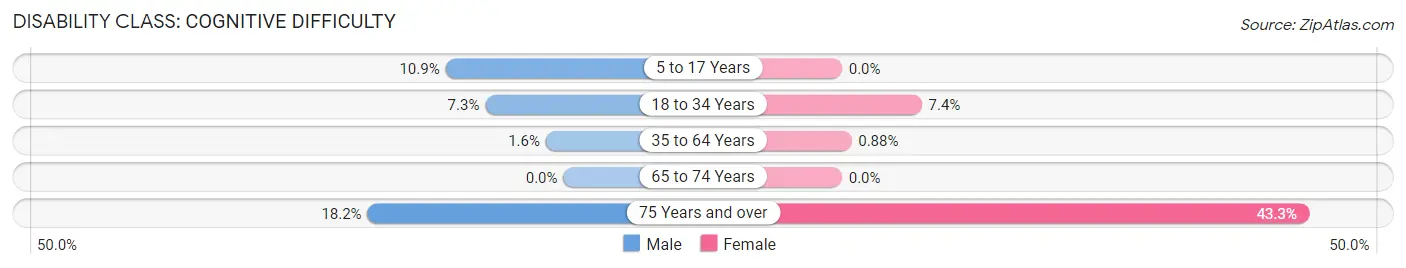
| Age Bracket | Male | Female |
| 5 to 17 Years | 7 (10.9%) | 0 (0.0%) |
| 18 to 34 Years | 5 (7.2%) | 6 (7.4%) |
| 35 to 64 Years | 2 (1.6%) | 1 (0.9%) |
| 65 to 74 Years | 0 (0.0%) | 0 (0.0%) |
| 75 Years and over | 2 (18.2%) | 13 (43.3%) |
Disability Class: Ambulatory Difficulty
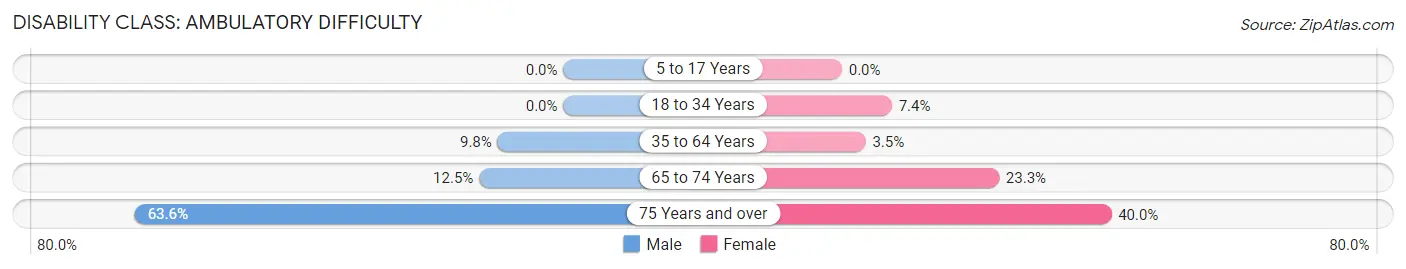
| Age Bracket | Male | Female |
| 5 to 17 Years | 0 (0.0%) | 0 (0.0%) |
| 18 to 34 Years | 0 (0.0%) | 6 (7.4%) |
| 35 to 64 Years | 12 (9.8%) | 4 (3.5%) |
| 65 to 74 Years | 3 (12.5%) | 7 (23.3%) |
| 75 Years and over | 7 (63.6%) | 12 (40.0%) |
Disability Class: Self-Care Difficulty
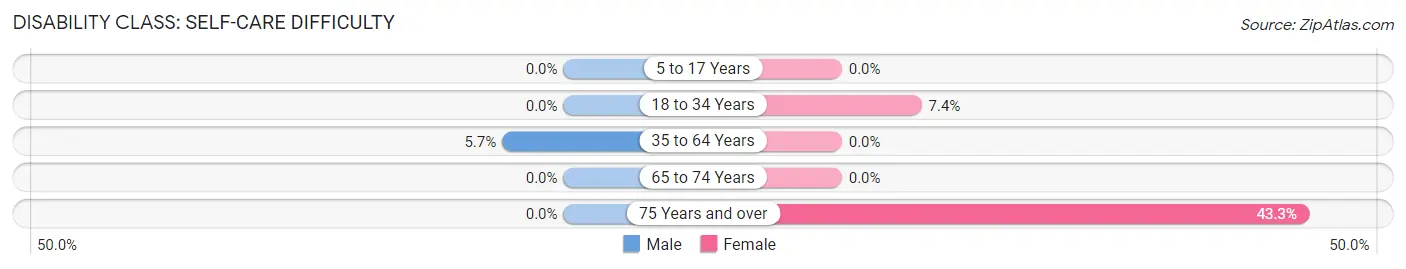
| Age Bracket | Male | Female |
| 5 to 17 Years | 0 (0.0%) | 0 (0.0%) |
| 18 to 34 Years | 0 (0.0%) | 6 (7.4%) |
| 35 to 64 Years | 7 (5.7%) | 0 (0.0%) |
| 65 to 74 Years | 0 (0.0%) | 0 (0.0%) |
| 75 Years and over | 0 (0.0%) | 13 (43.3%) |
Technology Access in New Lothrop
Computing Device Access in New Lothrop
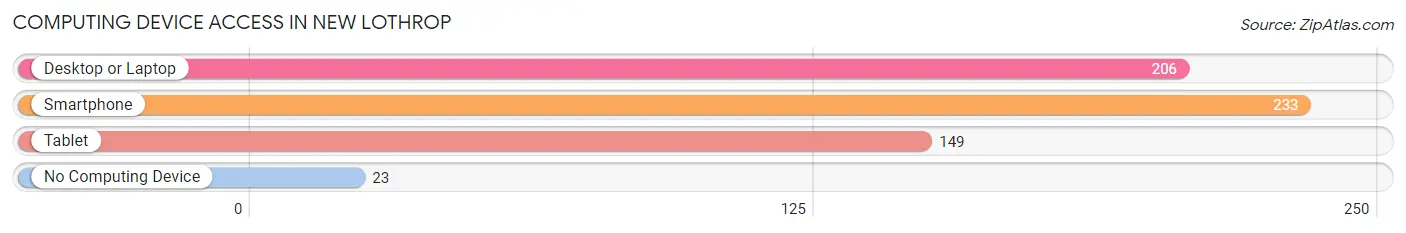
| Device Type | # Households | % Households |
| Desktop or Laptop | 206 | 78.9% |
| Smartphone | 233 | 89.3% |
| Tablet | 149 | 57.1% |
| No Computing Device | 23 | 8.8% |
| Total | 261 | 100.0% |
Internet Access in New Lothrop
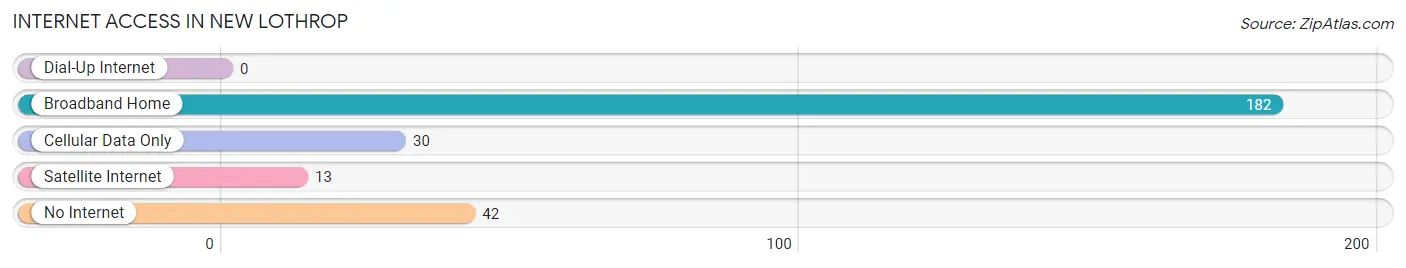
| Internet Type | # Households | % Households |
| Dial-Up Internet | 0 | 0.0% |
| Broadband Home | 182 | 69.7% |
| Cellular Data Only | 30 | 11.5% |
| Satellite Internet | 13 | 5.0% |
| No Internet | 42 | 16.1% |
| Total | 261 | 100.0% |
New Lothrop Summary
New Lothrop is a small village located in Shiawassee County, Michigan. It is situated in the southeastern corner of the county, approximately 10 miles south of the city of Corunna. The village has a population of approximately 1,000 people and covers an area of 0.7 square miles.
History
New Lothrop was founded in 1837 by a group of settlers from New York. The village was named after the town of Lothrop, New York, which was the hometown of the settlers. The settlers were attracted to the area due to its fertile soil and abundant natural resources.
The village was initially a farming community, with the main crops being wheat, corn, and oats. In the late 19th century, the village began to expand and develop. A post office was established in 1876, and a railroad line was built in 1881. This allowed the village to become a hub for trade and commerce.
In the early 20th century, the village began to diversify its economy. A canning factory was established in 1910, and a cheese factory was built in 1912. The village also became a popular tourist destination, with several resorts and hotels being built in the area.
Geography
New Lothrop is located in the southeastern corner of Shiawassee County. It is situated on the banks of the Shiawassee River, which flows through the village. The village is surrounded by rolling hills and farmland. The climate is humid continental, with hot summers and cold winters.
The village is located approximately 10 miles south of the city of Corunna. It is also close to the cities of Flint and Lansing, which are both located approximately 30 miles away.
Economy
The economy of New Lothrop is largely based on agriculture. The village is home to several farms, which produce a variety of crops, including wheat, corn, and oats. The village also has several businesses, including a canning factory, a cheese factory, and several resorts and hotels.
Demographics
As of the 2010 census, the population of New Lothrop was 1,000. The racial makeup of the village was 97.2% White, 0.7% African American, 0.3% Native American, 0.3% Asian, and 1.5% from other races. The median household income was $45,000, and the median family income was $50,000.
Conclusion
New Lothrop is a small village located in Shiawassee County, Michigan. It was founded in 1837 by a group of settlers from New York and has since grown into a thriving agricultural community. The village has a population of approximately 1,000 people and is home to several businesses, including a canning factory, a cheese factory, and several resorts and hotels. The economy of New Lothrop is largely based on agriculture, and the racial makeup of the village is predominantly White.
Common Questions
What is Per Capita Income in New Lothrop?
Per Capita income in New Lothrop is $37,254.
What is the Median Family Income in New Lothrop?
Median Family Income in New Lothrop is $81,023.
What is the Median Household income in New Lothrop?
Median Household Income in New Lothrop is $67,404.
What is Income or Wage Gap in New Lothrop?
Income or Wage Gap in New Lothrop is 33.3%.
Women in New Lothrop earn 66.7 cents for every dollar earned by a man.
What is Inequality or Gini Index in New Lothrop?
Inequality or Gini Index in New Lothrop is 0.47.
What is the Total Population of New Lothrop?
Total Population of New Lothrop is 621.
What is the Total Male Population of New Lothrop?
Total Male Population of New Lothrop is 307.
What is the Total Female Population of New Lothrop?
Total Female Population of New Lothrop is 314.
What is the Ratio of Males per 100 Females in New Lothrop?
There are 97.77 Males per 100 Females in New Lothrop.
What is the Ratio of Females per 100 Males in New Lothrop?
There are 102.28 Females per 100 Males in New Lothrop.
What is the Median Population Age in New Lothrop?
Median Population Age in New Lothrop is 36.1 Years.
What is the Average Family Size in New Lothrop
Average Family Size in New Lothrop is 2.9 People.
What is the Average Household Size in New Lothrop
Average Household Size in New Lothrop is 2.4 People.
How Large is the Labor Force in New Lothrop?
There are 310 People in the Labor Forcein in New Lothrop.
What is the Percentage of People in the Labor Force in New Lothrop?
61.8% of People are in the Labor Force in New Lothrop.
What is the Unemployment Rate in New Lothrop?
Unemployment Rate in New Lothrop is 5.8%.