Zip Codes with the Highest Percentage of Families with Income Below $10,000 in Bloomfield Hills, MI
RELATED REPORTS & OPTIONS
Family Income | $0-10k
Bloomfield Hills
Compare Zip Codes
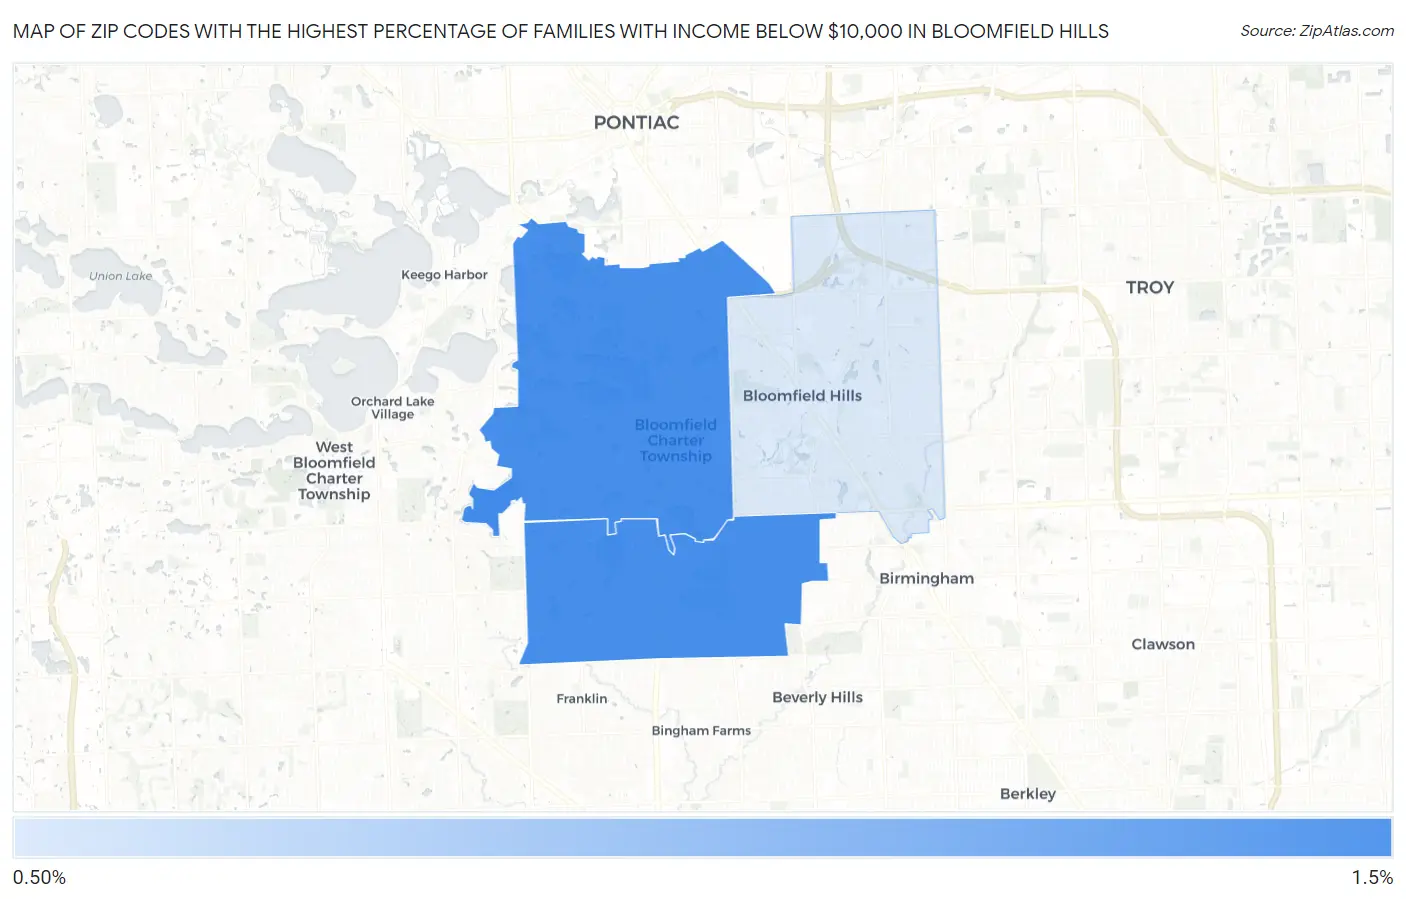
Map of Zip Codes with the Highest Percentage of Families with Income Below $10,000 in Bloomfield Hills
0.50%
1.4%
Zip Codes with the Highest Percentage of Families with Income Below $10,000 in Bloomfield Hills, MI
| Zip Code | Families with Income < $10k | vs State | vs National | |
| 1. | 48302 | 1.4% | 3.0%(-1.60)#599 | 3.1%(-1.70)#18,318 |
| 2. | 48301 | 1.4% | 3.0%(-1.60)#601 | 3.1%(-1.70)#18,342 |
| 3. | 48304 | 0.50% | 3.0%(-2.50)#797 | 3.1%(-2.60)#22,675 |
1
Common Questions
What are the Top Zip Codes with the Highest Percentage of Families with Income Below $10,000 in Bloomfield Hills, MI?
Top Zip Codes with the Highest Percentage of Families with Income Below $10,000 in Bloomfield Hills, MI are:
What zip code has the Highest Percentage of Families with Income Below $10,000 in Bloomfield Hills, MI?
48302 has the Highest Percentage of Families with Income Below $10,000 in Bloomfield Hills, MI with 1.4%.
What is the Percentage of Families with Income Below $10,000 in Bloomfield Hills, MI?
Percentage of Families with Income Below $10,000 in Bloomfield Hills is 0.50%.
What is the Percentage of Families with Income Below $10,000 in Michigan?
Percentage of Families with Income Below $10,000 in Michigan is 3.0%.
What is the Percentage of Families with Income Below $10,000 in the United States?
Percentage of Families with Income Below $10,000 in the United States is 3.1%.