Ocean Pointe, HI Map & Demographics
Ocean Pointe Map
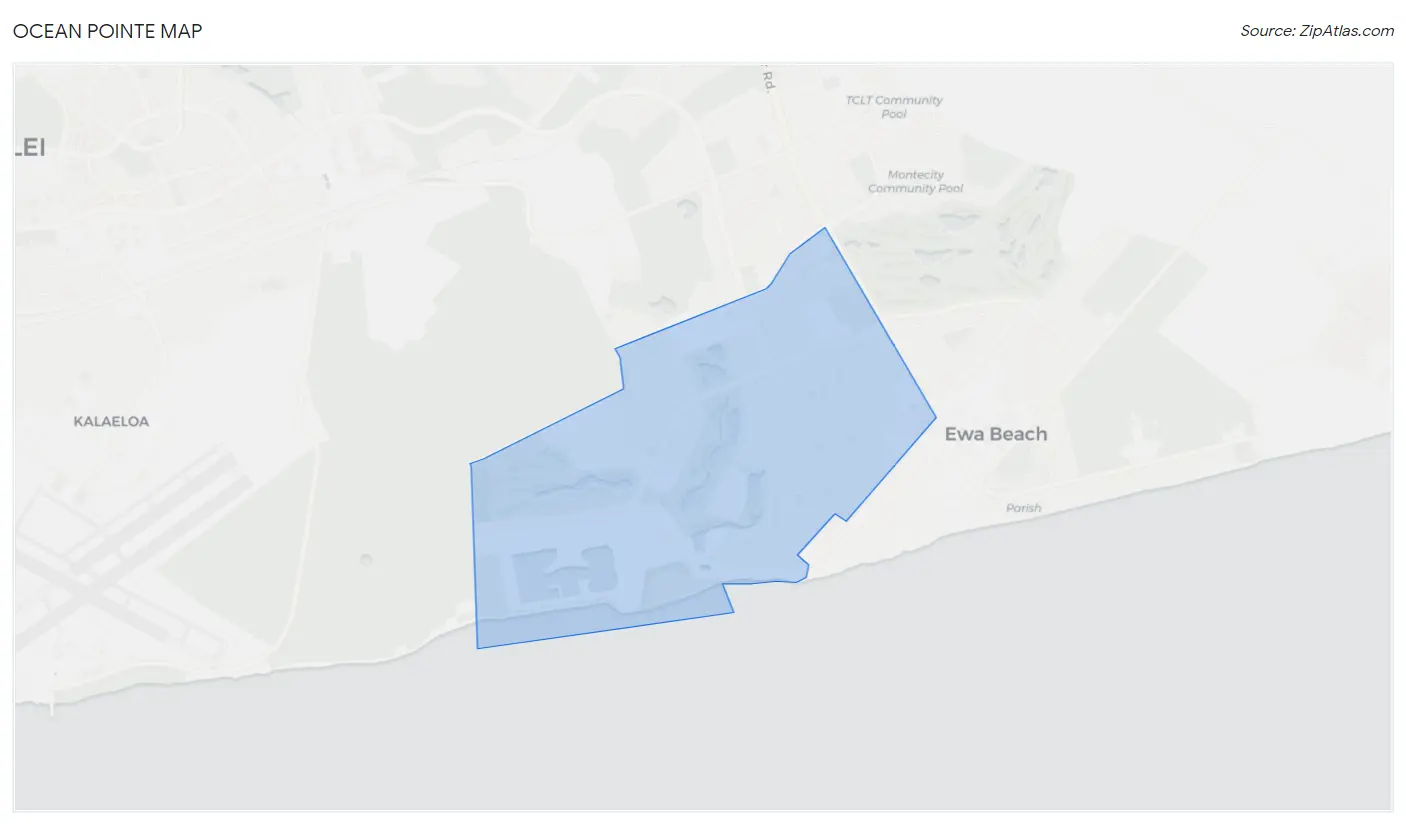
Ocean Pointe Overview
$46,493
PER CAPITA INCOME
$136,382
AVG FAMILY INCOME
$136,540
AVG HOUSEHOLD INCOME
35.0%
WAGE / INCOME GAP [ % ]
65.0¢/ $1
WAGE / INCOME GAP [ $ ]
0.29
INEQUALITY / GINI INDEX
16,173
TOTAL POPULATION
8,340
MALE POPULATION
7,833
FEMALE POPULATION
106.47
MALES / 100 FEMALES
93.92
FEMALES / 100 MALES
31.9
MEDIAN AGE
3.4
AVG FAMILY SIZE
3.2
AVG HOUSEHOLD SIZE
8,608
LABOR FORCE [ PEOPLE ]
75.6%
PERCENT IN LABOR FORCE
2.9%
UNEMPLOYMENT RATE
Income in Ocean Pointe
Income Overview in Ocean Pointe
Per Capita Income in Ocean Pointe is $46,493, while median incomes of families and households are $136,382 and $136,540 respectively.
| Characteristic | Number | Measure |
| Per Capita Income | 16,173 | $46,493 |
| Median Family Income | 4,375 | $136,382 |
| Mean Family Income | 4,375 | $151,959 |
| Median Household Income | 5,027 | $136,540 |
| Mean Household Income | 5,027 | $149,720 |
| Income Deficit | 4,375 | $0 |
| Wage / Income Gap (%) | 16,173 | 34.96% |
| Wage / Income Gap ($) | 16,173 | 65.04¢ per $1 |
| Gini / Inequality Index | 16,173 | 0.29 |
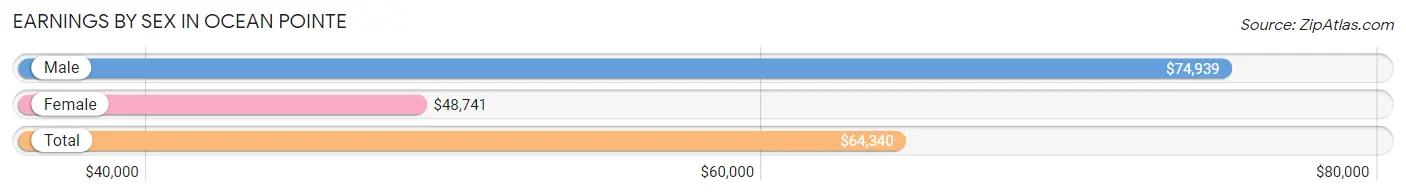
Earnings by Sex in Ocean Pointe
Average Earnings in Ocean Pointe are $64,340, $74,939 for men and $48,741 for women, a difference of 35.0%.
| Sex | Number | Average Earnings |
| Male | 4,757 (53.8%) | $74,939 |
| Female | 4,087 (46.2%) | $48,741 |
| Total | 8,844 (100.0%) | $64,340 |
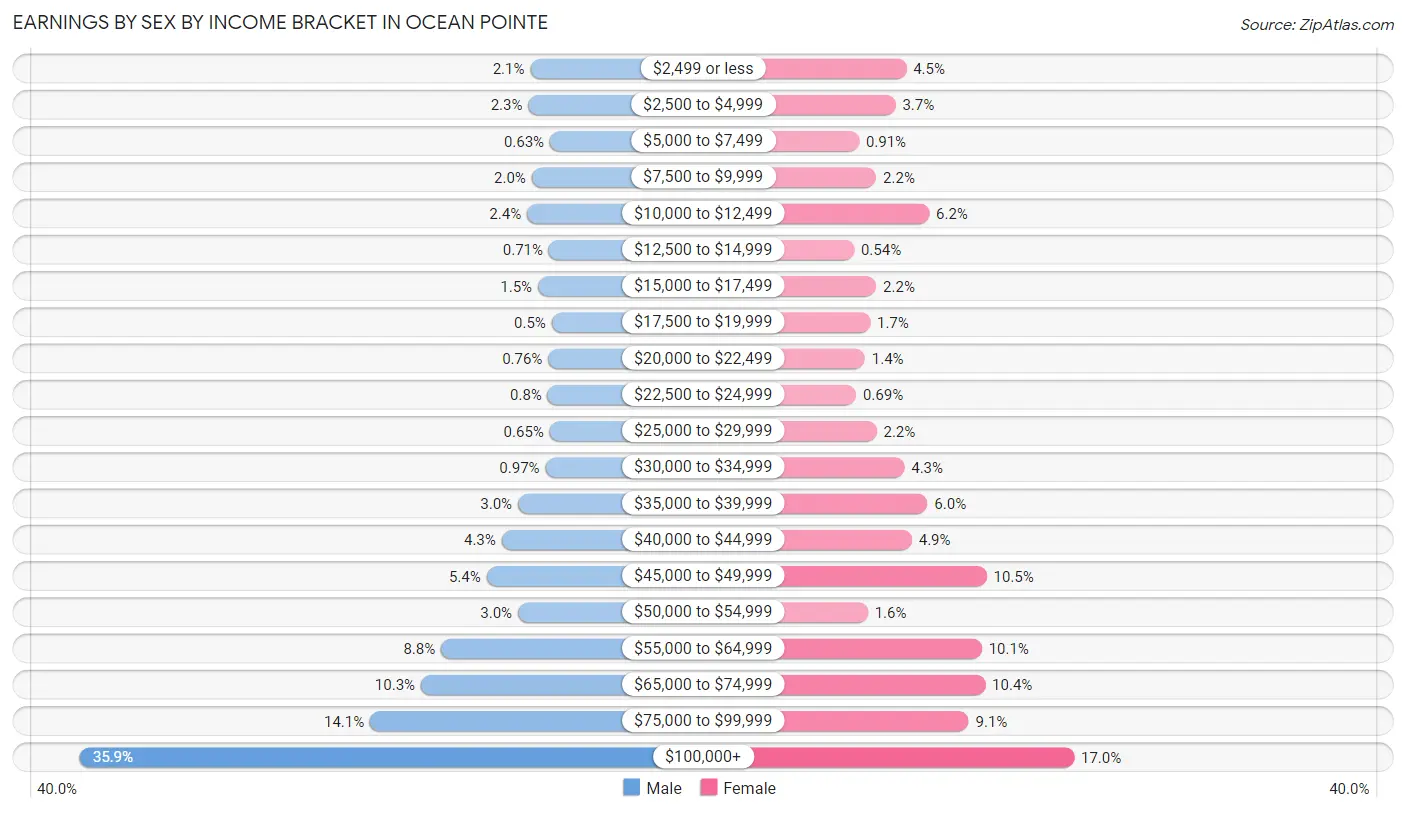
Earnings by Sex by Income Bracket in Ocean Pointe
The most common earnings brackets in Ocean Pointe are $100,000+ for men (1,706 | 35.9%) and $100,000+ for women (696 | 17.0%).
| Income | Male | Female |
| $2,499 or less | 100 (2.1%) | 182 (4.4%) |
| $2,500 to $4,999 | 107 (2.2%) | 149 (3.6%) |
| $5,000 to $7,499 | 30 (0.6%) | 37 (0.9%) |
| $7,500 to $9,999 | 95 (2.0%) | 90 (2.2%) |
| $10,000 to $12,499 | 112 (2.4%) | 252 (6.2%) |
| $12,500 to $14,999 | 34 (0.7%) | 22 (0.5%) |
| $15,000 to $17,499 | 73 (1.5%) | 90 (2.2%) |
| $17,500 to $19,999 | 24 (0.5%) | 71 (1.7%) |
| $20,000 to $22,499 | 36 (0.8%) | 55 (1.3%) |
| $22,500 to $24,999 | 38 (0.8%) | 28 (0.7%) |
| $25,000 to $29,999 | 31 (0.6%) | 91 (2.2%) |
| $30,000 to $34,999 | 46 (1.0%) | 176 (4.3%) |
| $35,000 to $39,999 | 144 (3.0%) | 247 (6.0%) |
| $40,000 to $44,999 | 202 (4.3%) | 199 (4.9%) |
| $45,000 to $49,999 | 256 (5.4%) | 428 (10.5%) |
| $50,000 to $54,999 | 144 (3.0%) | 64 (1.6%) |
| $55,000 to $64,999 | 418 (8.8%) | 413 (10.1%) |
| $65,000 to $74,999 | 490 (10.3%) | 424 (10.4%) |
| $75,000 to $99,999 | 671 (14.1%) | 373 (9.1%) |
| $100,000+ | 1,706 (35.9%) | 696 (17.0%) |
| Total | 4,757 (100.0%) | 4,087 (100.0%) |
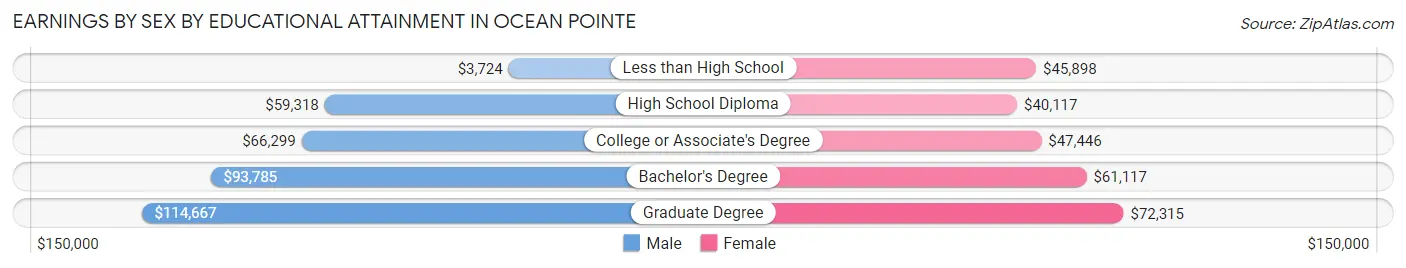
Earnings by Sex by Educational Attainment in Ocean Pointe
Average earnings in Ocean Pointe are $78,201 for men and $55,925 for women, a difference of 28.5%. Men with an educational attainment of graduate degree enjoy the highest average annual earnings of $114,667, while those with less than high school education earn the least with $3,724. Women with an educational attainment of graduate degree earn the most with the average annual earnings of $72,315, while those with high school diploma education have the smallest earnings of $40,117.
| Educational Attainment | Male Income | Female Income |
| Less than High School | $3,724 | $45,898 |
| High School Diploma | $59,318 | $40,117 |
| College or Associate's Degree | $66,299 | $47,446 |
| Bachelor's Degree | $93,785 | $61,117 |
| Graduate Degree | $114,667 | $72,315 |
| Total | $78,201 | $55,925 |
Family Income in Ocean Pointe
Family Income Brackets in Ocean Pointe
According to the Ocean Pointe family income data, there are 1,540 families falling into the $100,000 to $149,999 income range, which is the most common income bracket and makes up 35.2% of all families.
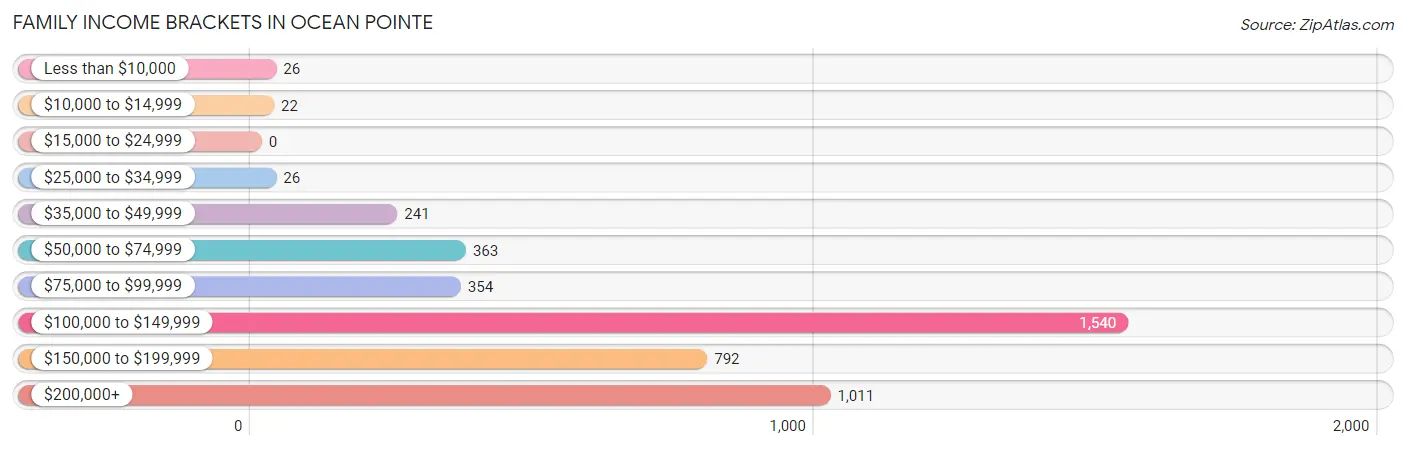
| Income Bracket | # Families | % Families |
| Less than $10,000 | 26 | 0.6% |
| $10,000 to $14,999 | 22 | 0.5% |
| $15,000 to $24,999 | 0 | 0.0% |
| $25,000 to $34,999 | 26 | 0.6% |
| $35,000 to $49,999 | 241 | 5.5% |
| $50,000 to $74,999 | 363 | 8.3% |
| $75,000 to $99,999 | 354 | 8.1% |
| $100,000 to $149,999 | 1,540 | 35.2% |
| $150,000 to $199,999 | 792 | 18.1% |
| $200,000+ | 1,011 | 23.1% |
Family Income by Famaliy Size in Ocean Pointe
6-person families (227 | 5.2%) account for the highest median family income in Ocean Pointe with $238,098 per family, while 2-person families (1,367 | 31.2%) have the highest median income of $57,400 per family member.
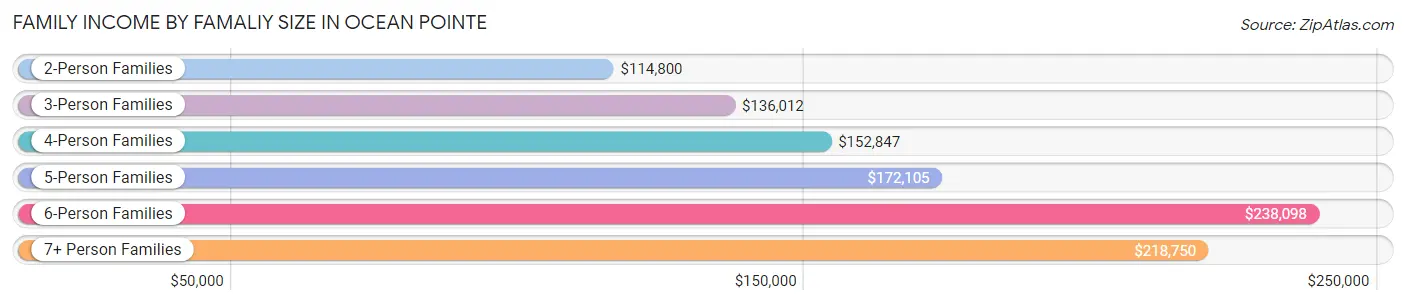
| Income Bracket | # Families | Median Income |
| 2-Person Families | 1,367 (31.2%) | $114,800 |
| 3-Person Families | 1,299 (29.7%) | $136,012 |
| 4-Person Families | 987 (22.6%) | $152,847 |
| 5-Person Families | 448 (10.2%) | $172,105 |
| 6-Person Families | 227 (5.2%) | $238,098 |
| 7+ Person Families | 47 (1.1%) | $218,750 |
| Total | 4,375 (100.0%) | $136,382 |
Family Income by Number of Earners in Ocean Pointe
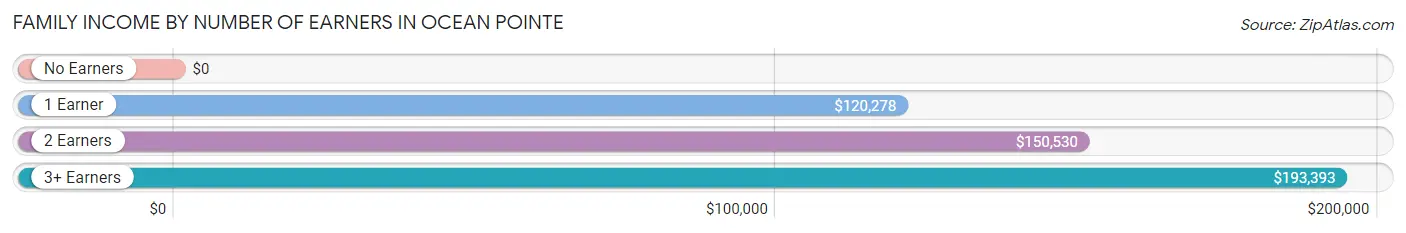
| Number of Earners | # Families | Median Income |
| No Earners | 149 (3.4%) | $0 |
| 1 Earner | 1,286 (29.4%) | $120,278 |
| 2 Earners | 2,428 (55.5%) | $150,530 |
| 3+ Earners | 512 (11.7%) | $193,393 |
| Total | 4,375 (100.0%) | $136,382 |
Household Income in Ocean Pointe
Household Income Brackets in Ocean Pointe
With 1,664 households falling in the category, the $100,000 to $149,999 income range is the most frequent in Ocean Pointe, accounting for 33.1% of all households.
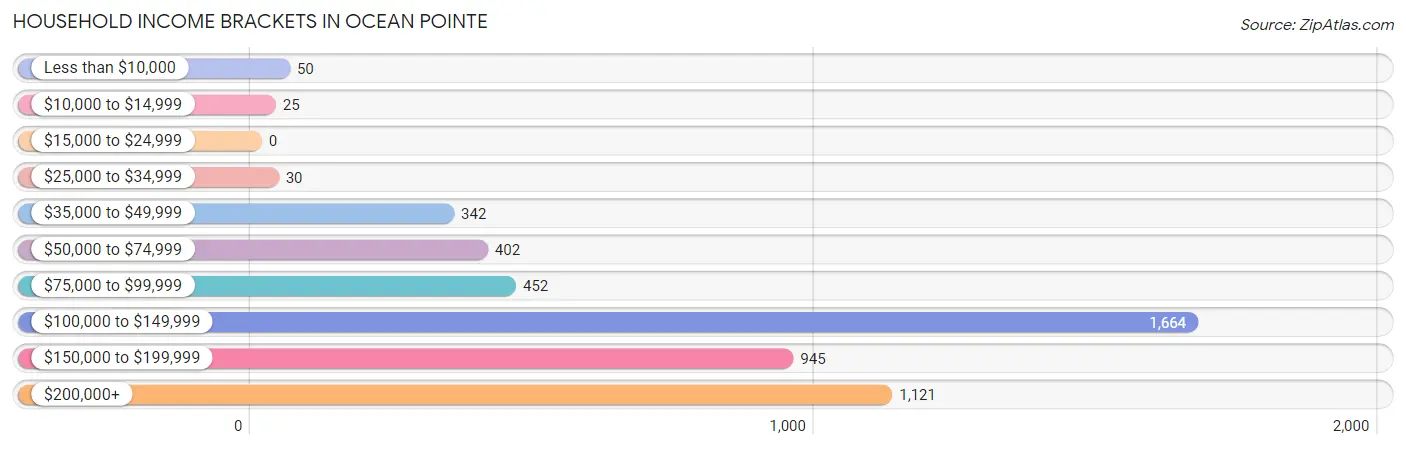
| Income Bracket | # Households | % Households |
| Less than $10,000 | 50 | 1.0% |
| $10,000 to $14,999 | 25 | 0.5% |
| $15,000 to $24,999 | 0 | 0.0% |
| $25,000 to $34,999 | 30 | 0.6% |
| $35,000 to $49,999 | 342 | 6.8% |
| $50,000 to $74,999 | 402 | 8.0% |
| $75,000 to $99,999 | 452 | 9.0% |
| $100,000 to $149,999 | 1,664 | 33.1% |
| $150,000 to $199,999 | 945 | 18.8% |
| $200,000+ | 1,121 | 22.3% |
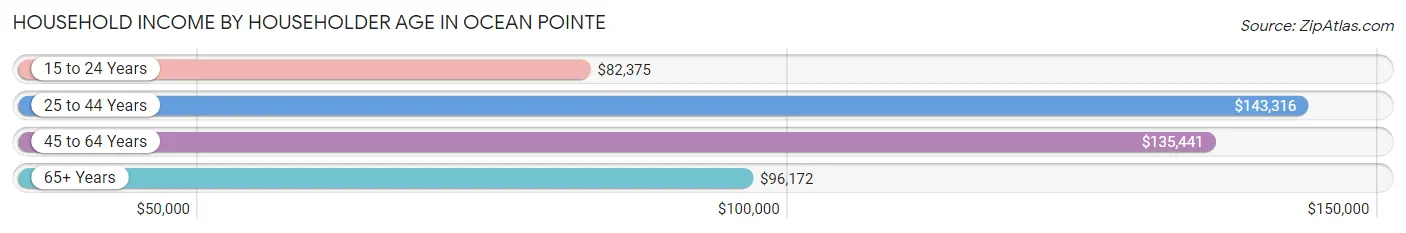
Household Income by Householder Age in Ocean Pointe
The median household income in Ocean Pointe is $136,540, with the highest median household income of $143,316 found in the 25 to 44 years age bracket for the primary householder. A total of 2,836 households (56.4%) fall into this category. Meanwhile, the 15 to 24 years age bracket for the primary householder has the lowest median household income of $82,375, with 70 households (1.4%) in this group.
| Income Bracket | # Households | Median Income |
| 15 to 24 Years | 70 (1.4%) | $82,375 |
| 25 to 44 Years | 2,836 (56.4%) | $143,316 |
| 45 to 64 Years | 1,664 (33.1%) | $135,441 |
| 65+ Years | 457 (9.1%) | $96,172 |
| Total | 5,027 (100.0%) | $136,540 |
Poverty in Ocean Pointe
Income Below Poverty by Sex and Age in Ocean Pointe
With 2.4% poverty level for males and 2.0% for females among the residents of Ocean Pointe, 75 year old and over males and 75 year old and over females are the most vulnerable to poverty, with 24 males (20.0%) and 36 females (14.3%) in their respective age groups living below the poverty level.
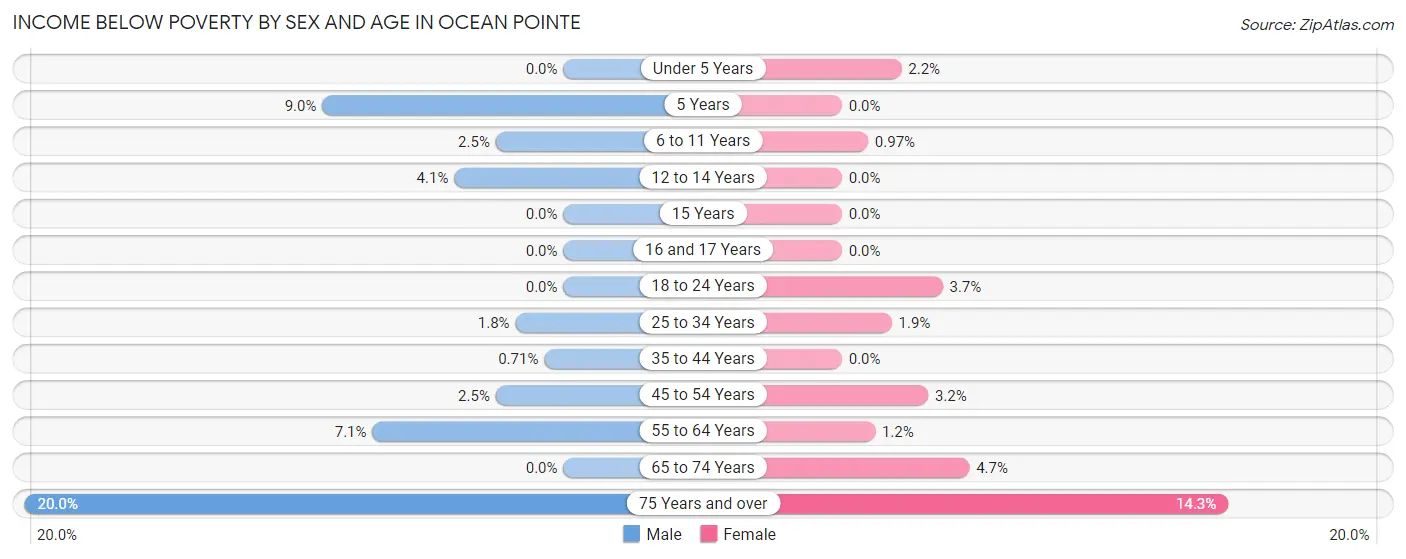
| Age Bracket | Male | Female |
| Under 5 Years | 0 (0.0%) | 18 (2.2%) |
| 5 Years | 17 (8.9%) | 0 (0.0%) |
| 6 to 11 Years | 28 (2.5%) | 8 (1.0%) |
| 12 to 14 Years | 20 (4.1%) | 0 (0.0%) |
| 15 Years | 0 (0.0%) | 0 (0.0%) |
| 16 and 17 Years | 0 (0.0%) | 0 (0.0%) |
| 18 to 24 Years | 0 (0.0%) | 15 (3.7%) |
| 25 to 34 Years | 28 (1.8%) | 25 (1.8%) |
| 35 to 44 Years | 11 (0.7%) | 0 (0.0%) |
| 45 to 54 Years | 20 (2.5%) | 29 (3.2%) |
| 55 to 64 Years | 52 (7.1%) | 8 (1.2%) |
| 65 to 74 Years | 0 (0.0%) | 15 (4.7%) |
| 75 Years and over | 24 (20.0%) | 36 (14.3%) |
| Total | 200 (2.4%) | 154 (2.0%) |
Income Above Poverty by Sex and Age in Ocean Pointe
According to the poverty statistics in Ocean Pointe, males aged under 5 years and females aged 5 years are the age groups that are most secure financially, with 100.0% of males and 100.0% of females in these age groups living above the poverty line.
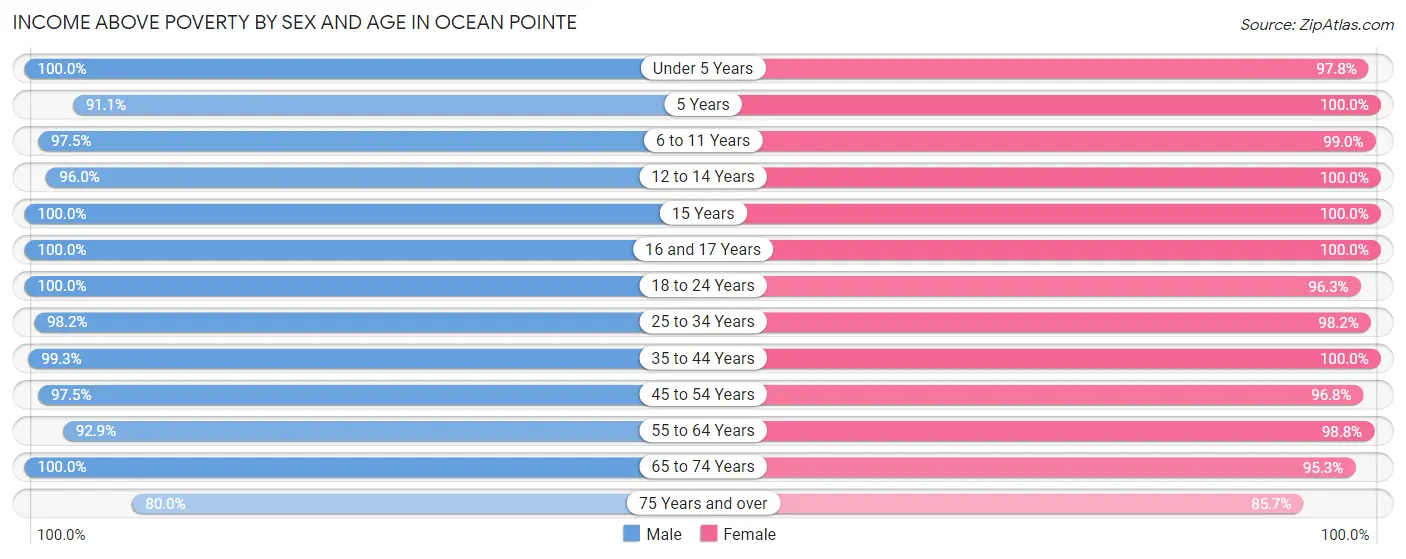
| Age Bracket | Male | Female |
| Under 5 Years | 623 (100.0%) | 797 (97.8%) |
| 5 Years | 173 (91.0%) | 66 (100.0%) |
| 6 to 11 Years | 1,086 (97.5%) | 815 (99.0%) |
| 12 to 14 Years | 474 (96.0%) | 392 (100.0%) |
| 15 Years | 65 (100.0%) | 140 (100.0%) |
| 16 and 17 Years | 204 (100.0%) | 173 (100.0%) |
| 18 to 24 Years | 477 (100.0%) | 386 (96.3%) |
| 25 to 34 Years | 1,546 (98.2%) | 1,327 (98.2%) |
| 35 to 44 Years | 1,536 (99.3%) | 1,517 (100.0%) |
| 45 to 54 Years | 777 (97.5%) | 878 (96.8%) |
| 55 to 64 Years | 681 (92.9%) | 642 (98.8%) |
| 65 to 74 Years | 366 (100.0%) | 302 (95.3%) |
| 75 Years and over | 96 (80.0%) | 215 (85.7%) |
| Total | 8,104 (97.6%) | 7,650 (98.0%) |
Income Below Poverty Among Married-Couple Families in Ocean Pointe
The poverty statistics for married-couple families in Ocean Pointe show that 1.8% or 67 of the total 3,736 families live below the poverty line. Families with 1 or 2 children have the highest poverty rate of 2.2%, comprising of 37 families. On the other hand, families with 3 or 4 children have the lowest poverty rate of 0.0%, which includes 0 families.
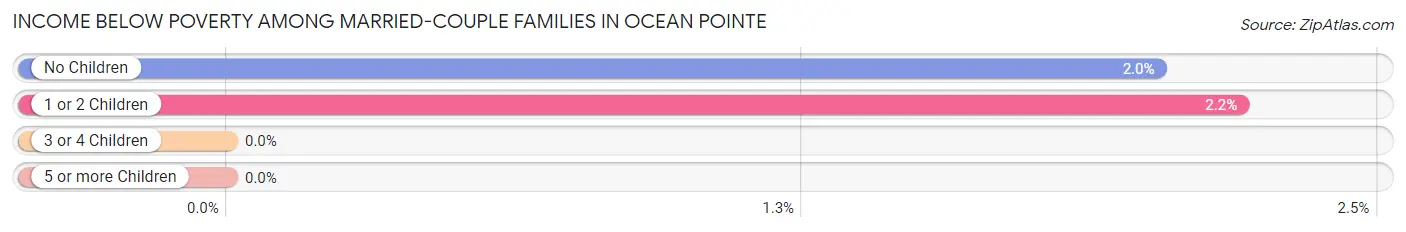
| Children | Above Poverty | Below Poverty |
| No Children | 1,452 (98.0%) | 30 (2.0%) |
| 1 or 2 Children | 1,645 (97.8%) | 37 (2.2%) |
| 3 or 4 Children | 546 (100.0%) | 0 (0.0%) |
| 5 or more Children | 26 (100.0%) | 0 (0.0%) |
| Total | 3,669 (98.2%) | 67 (1.8%) |
Income Below Poverty Among Single-Parent Households in Ocean Pointe
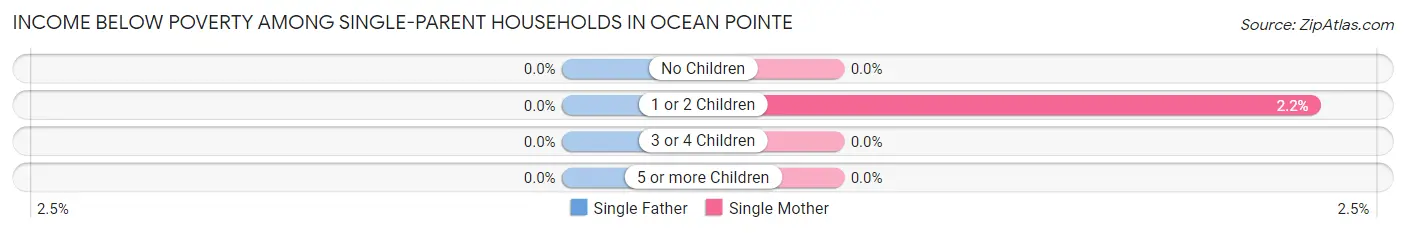
| Children | Single Father | Single Mother |
| No Children | 0 (0.0%) | 0 (0.0%) |
| 1 or 2 Children | 0 (0.0%) | 8 (2.2%) |
| 3 or 4 Children | 0 (0.0%) | 0 (0.0%) |
| 5 or more Children | 0 (0.0%) | 0 (0.0%) |
| Total | 0 (0.0%) | 8 (1.8%) |
Income Below Poverty Among Married-Couple vs Single-Parent Households in Ocean Pointe
The poverty data for Ocean Pointe shows that 67 of the married-couple family households (1.8%) and 8 of the single-parent households (1.3%) are living below the poverty level. Within the married-couple family households, those with 1 or 2 children have the highest poverty rate, with 37 households (2.2%) falling below the poverty line. Among the single-parent households, those with 1 or 2 children have the highest poverty rate, with 8 household (1.8%) living below poverty.
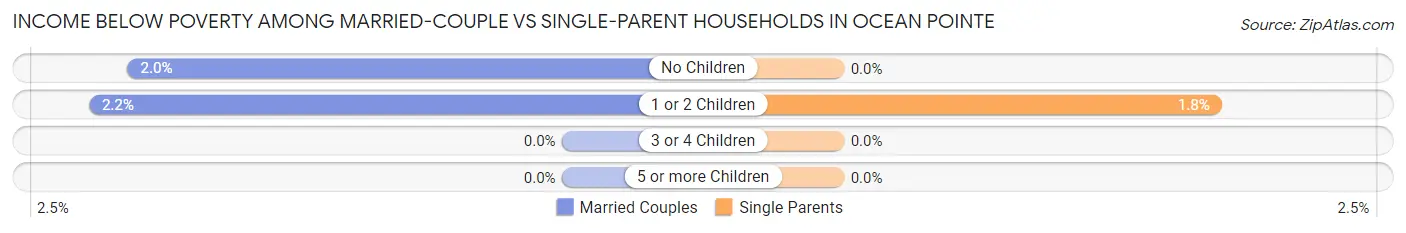
| Children | Married-Couple Families | Single-Parent Households |
| No Children | 30 (2.0%) | 0 (0.0%) |
| 1 or 2 Children | 37 (2.2%) | 8 (1.8%) |
| 3 or 4 Children | 0 (0.0%) | 0 (0.0%) |
| 5 or more Children | 0 (0.0%) | 0 (0.0%) |
| Total | 67 (1.8%) | 8 (1.3%) |
Race in Ocean Pointe
The most populous races in Ocean Pointe are Asian (5,114 | 31.6%), Two or more Races (4,769 | 29.5%), and White / Caucasian (4,534 | 28.0%).
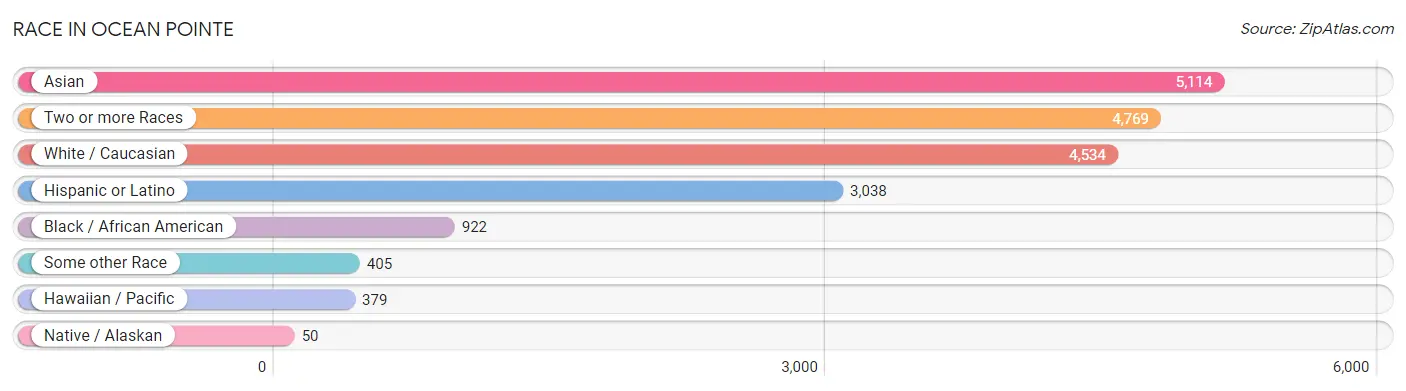
| Race | # Population | % Population |
| Asian | 5,114 | 31.6% |
| Black / African American | 922 | 5.7% |
| Hawaiian / Pacific | 379 | 2.3% |
| Hispanic or Latino | 3,038 | 18.8% |
| Native / Alaskan | 50 | 0.3% |
| White / Caucasian | 4,534 | 28.0% |
| Two or more Races | 4,769 | 29.5% |
| Some other Race | 405 | 2.5% |
| Total | 16,173 | 100.0% |
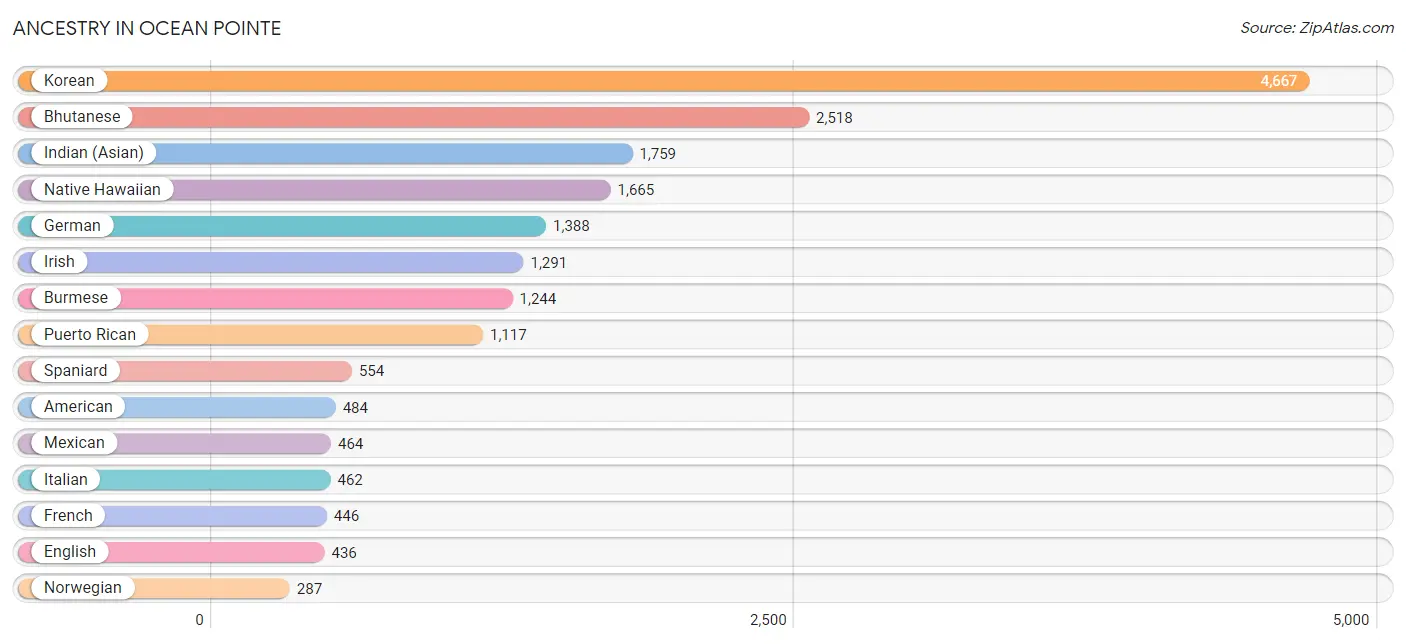
Ancestry in Ocean Pointe
The most populous ancestries reported in Ocean Pointe are Korean (4,667 | 28.9%), Bhutanese (2,518 | 15.6%), Indian (Asian) (1,759 | 10.9%), Native Hawaiian (1,665 | 10.3%), and German (1,388 | 8.6%), together accounting for 74.2% of all Ocean Pointe residents.
| Ancestry | # Population | % Population |
| American | 484 | 3.0% |
| Arab | 10 | 0.1% |
| Argentinean | 126 | 0.8% |
| Belgian | 61 | 0.4% |
| Bhutanese | 2,518 | 15.6% |
| Blackfeet | 11 | 0.1% |
| Brazilian | 47 | 0.3% |
| British | 32 | 0.2% |
| British West Indian | 27 | 0.2% |
| Burmese | 1,244 | 7.7% |
| Canadian | 21 | 0.1% |
| Central American | 22 | 0.1% |
| Cherokee | 258 | 1.6% |
| Chinese | 72 | 0.4% |
| Croatian | 53 | 0.3% |
| Cuban | 56 | 0.4% |
| Czech | 73 | 0.4% |
| Czechoslovakian | 55 | 0.3% |
| Danish | 19 | 0.1% |
| Dominican | 283 | 1.8% |
| Dutch | 57 | 0.4% |
| Ecuadorian | 60 | 0.4% |
| English | 436 | 2.7% |
| European | 132 | 0.8% |
| Filipino | 139 | 0.9% |
| French | 446 | 2.8% |
| French Canadian | 5 | 0.0% |
| German | 1,388 | 8.6% |
| Guamanian / Chamorro | 285 | 1.8% |
| Haitian | 144 | 0.9% |
| Honduran | 22 | 0.1% |
| Indian (Asian) | 1,759 | 10.9% |
| Iranian | 8 | 0.1% |
| Irish | 1,291 | 8.0% |
| Italian | 462 | 2.9% |
| Jamaican | 46 | 0.3% |
| Japanese | 41 | 0.3% |
| Korean | 4,667 | 28.9% |
| Lithuanian | 10 | 0.1% |
| Malaysian | 167 | 1.0% |
| Mexican | 464 | 2.9% |
| Mexican American Indian | 42 | 0.3% |
| Native Hawaiian | 1,665 | 10.3% |
| Northern European | 15 | 0.1% |
| Norwegian | 287 | 1.8% |
| Pakistani | 111 | 0.7% |
| Polish | 194 | 1.2% |
| Portuguese | 240 | 1.5% |
| Pueblo | 10 | 0.1% |
| Puerto Rican | 1,117 | 6.9% |
| Russian | 9 | 0.1% |
| Samoan | 146 | 0.9% |
| Scotch-Irish | 21 | 0.1% |
| Scottish | 168 | 1.0% |
| Slovak | 47 | 0.3% |
| South American | 207 | 1.3% |
| South American Indian | 21 | 0.1% |
| Spaniard | 554 | 3.4% |
| Spanish | 216 | 1.3% |
| Sri Lankan | 254 | 1.6% |
| Swedish | 37 | 0.2% |
| Thai | 86 | 0.5% |
| Tongan | 98 | 0.6% |
| Turkish | 66 | 0.4% |
| Ukrainian | 9 | 0.1% |
| Welsh | 9 | 0.1% | View All 66 Rows |
Immigrants in Ocean Pointe
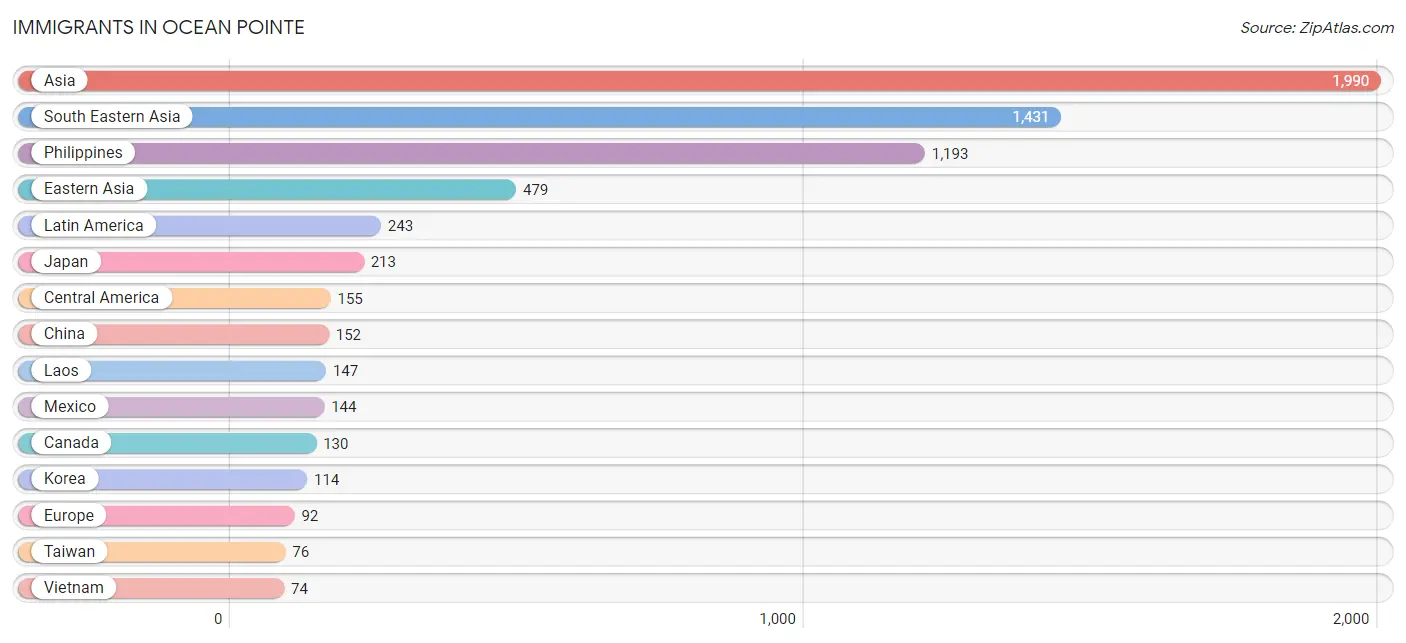
The most numerous immigrant groups reported in Ocean Pointe came from Asia (1,990 | 12.3%), South Eastern Asia (1,431 | 8.8%), Philippines (1,193 | 7.4%), Eastern Asia (479 | 3.0%), and Latin America (243 | 1.5%), together accounting for 33.0% of all Ocean Pointe residents.
| Immigration Origin | # Population | % Population |
| Asia | 1,990 | 12.3% |
| Brazil | 12 | 0.1% |
| Canada | 130 | 0.8% |
| Caribbean | 57 | 0.4% |
| Central America | 155 | 1.0% |
| China | 152 | 0.9% |
| Cuba | 9 | 0.1% |
| Dominican Republic | 21 | 0.1% |
| Eastern Asia | 479 | 3.0% |
| Ecuador | 10 | 0.1% |
| England | 41 | 0.3% |
| Europe | 92 | 0.6% |
| Germany | 22 | 0.1% |
| Guyana | 9 | 0.1% |
| Honduras | 11 | 0.1% |
| Hong Kong | 37 | 0.2% |
| India | 30 | 0.2% |
| Iran | 10 | 0.1% |
| Italy | 9 | 0.1% |
| Japan | 213 | 1.3% |
| Korea | 114 | 0.7% |
| Laos | 147 | 0.9% |
| Latin America | 243 | 1.5% |
| Mexico | 144 | 0.9% |
| Northern Europe | 61 | 0.4% |
| Philippines | 1,193 | 7.4% |
| South America | 31 | 0.2% |
| South Central Asia | 47 | 0.3% |
| South Eastern Asia | 1,431 | 8.8% |
| Southern Europe | 9 | 0.1% |
| Taiwan | 76 | 0.5% |
| Thailand | 17 | 0.1% |
| Turkey | 33 | 0.2% |
| Vietnam | 74 | 0.5% |
| Western Asia | 33 | 0.2% |
| Western Europe | 22 | 0.1% | View All 36 Rows |
Sex and Age in Ocean Pointe
Sex and Age in Ocean Pointe
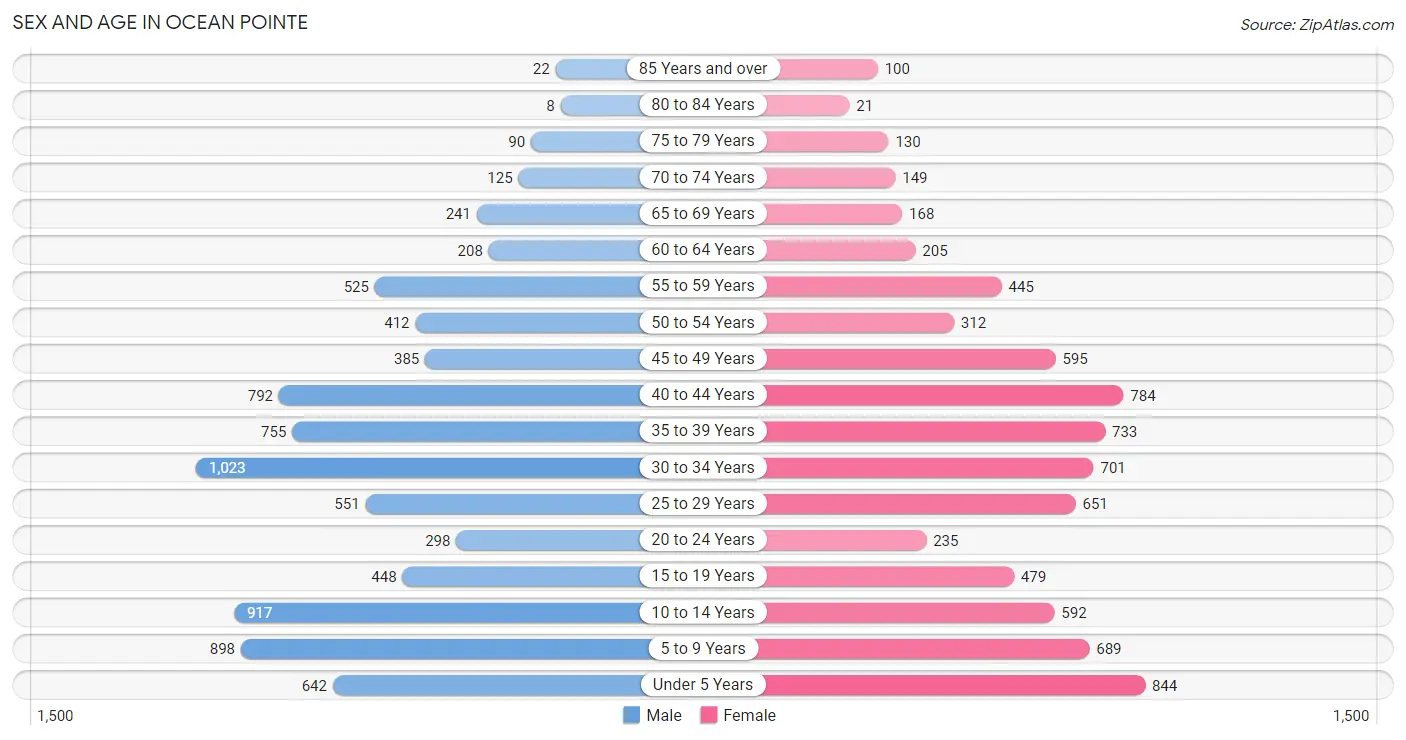
The most populous age groups in Ocean Pointe are 30 to 34 Years (1,023 | 12.3%) for men and Under 5 Years (844 | 10.8%) for women.
| Age Bracket | Male | Female |
| Under 5 Years | 642 (7.7%) | 844 (10.8%) |
| 5 to 9 Years | 898 (10.8%) | 689 (8.8%) |
| 10 to 14 Years | 917 (11.0%) | 592 (7.6%) |
| 15 to 19 Years | 448 (5.4%) | 479 (6.1%) |
| 20 to 24 Years | 298 (3.6%) | 235 (3.0%) |
| 25 to 29 Years | 551 (6.6%) | 651 (8.3%) |
| 30 to 34 Years | 1,023 (12.3%) | 701 (8.9%) |
| 35 to 39 Years | 755 (9.0%) | 733 (9.4%) |
| 40 to 44 Years | 792 (9.5%) | 784 (10.0%) |
| 45 to 49 Years | 385 (4.6%) | 595 (7.6%) |
| 50 to 54 Years | 412 (4.9%) | 312 (4.0%) |
| 55 to 59 Years | 525 (6.3%) | 445 (5.7%) |
| 60 to 64 Years | 208 (2.5%) | 205 (2.6%) |
| 65 to 69 Years | 241 (2.9%) | 168 (2.1%) |
| 70 to 74 Years | 125 (1.5%) | 149 (1.9%) |
| 75 to 79 Years | 90 (1.1%) | 130 (1.7%) |
| 80 to 84 Years | 8 (0.1%) | 21 (0.3%) |
| 85 Years and over | 22 (0.3%) | 100 (1.3%) |
| Total | 8,340 (100.0%) | 7,833 (100.0%) |
Families and Households in Ocean Pointe
Median Family Size in Ocean Pointe
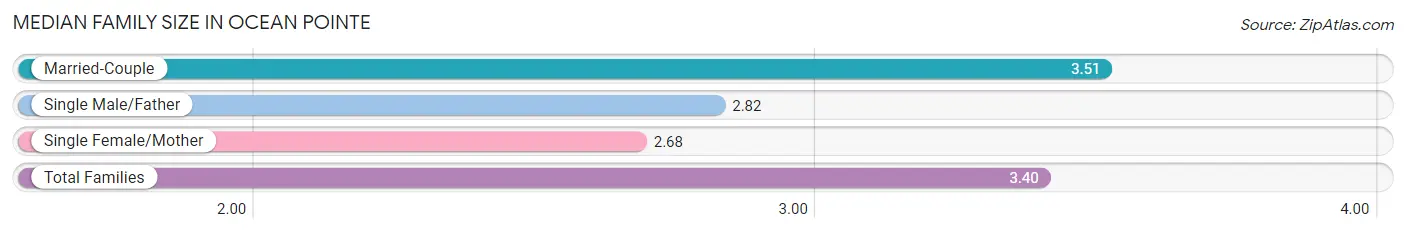
The median family size in Ocean Pointe is 3.40 persons per family, with married-couple families (3,736 | 85.4%) accounting for the largest median family size of 3.51 persons per family. On the other hand, single female/mother families (449 | 10.3%) represent the smallest median family size with 2.68 persons per family.
| Family Type | # Families | Family Size |
| Married-Couple | 3,736 (85.4%) | 3.51 |
| Single Male/Father | 190 (4.3%) | 2.82 |
| Single Female/Mother | 449 (10.3%) | 2.68 |
| Total Families | 4,375 (100.0%) | 3.40 |
Median Household Size in Ocean Pointe
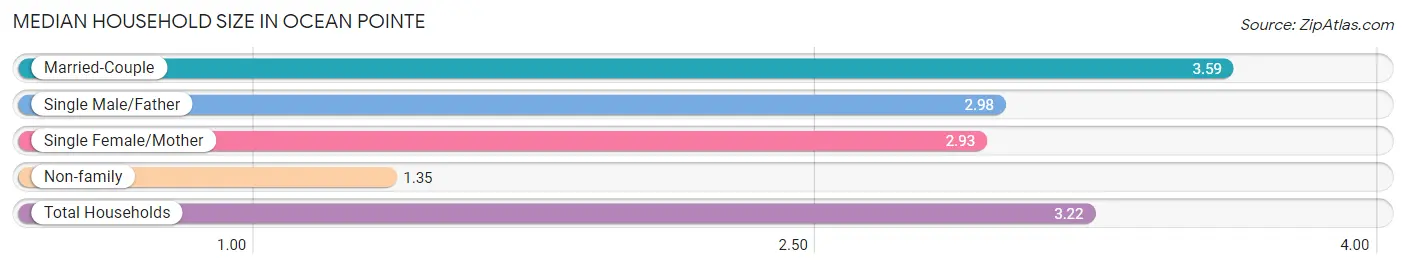
The median household size in Ocean Pointe is 3.22 persons per household, with married-couple households (3,736 | 74.3%) accounting for the largest median household size of 3.59 persons per household. non-family households (652 | 13.0%) represent the smallest median household size with 1.35 persons per household.
| Household Type | # Households | Household Size |
| Married-Couple | 3,736 (74.3%) | 3.59 |
| Single Male/Father | 190 (3.8%) | 2.98 |
| Single Female/Mother | 449 (8.9%) | 2.93 |
| Non-family | 652 (13.0%) | 1.35 |
| Total Households | 5,027 (100.0%) | 3.22 |
Household Size by Marriage Status in Ocean Pointe
Out of a total of 5,027 households in Ocean Pointe, 4,375 (87.0%) are family households, while 652 (13.0%) are nonfamily households. The most numerous type of family households are 3-person households, comprising 1,293, and the most common type of nonfamily households are 1-person households, comprising 449.
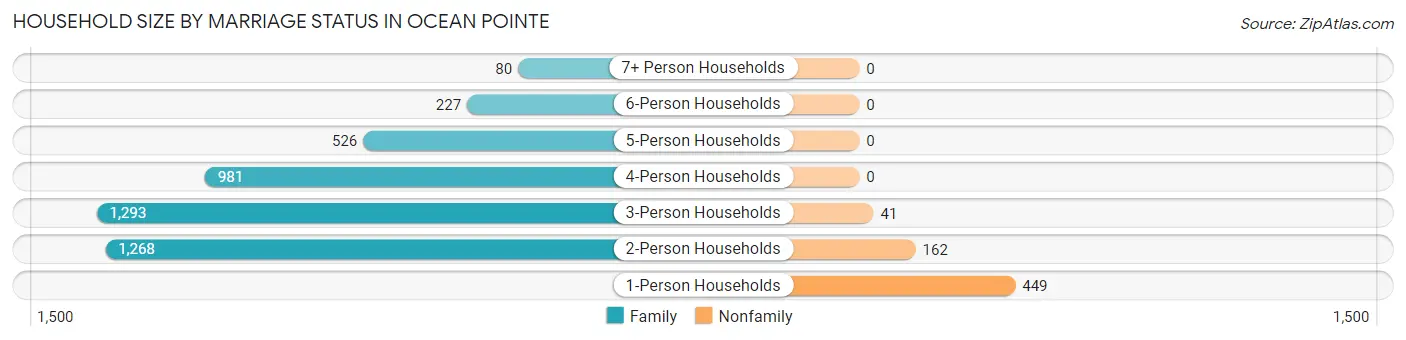
| Household Size | Family Households | Nonfamily Households |
| 1-Person Households | - | 449 (8.9%) |
| 2-Person Households | 1,268 (25.2%) | 162 (3.2%) |
| 3-Person Households | 1,293 (25.7%) | 41 (0.8%) |
| 4-Person Households | 981 (19.5%) | 0 (0.0%) |
| 5-Person Households | 526 (10.5%) | 0 (0.0%) |
| 6-Person Households | 227 (4.5%) | 0 (0.0%) |
| 7+ Person Households | 80 (1.6%) | 0 (0.0%) |
| Total | 4,375 (87.0%) | 652 (13.0%) |
Female Fertility in Ocean Pointe
Fertility by Age in Ocean Pointe
Average fertility rate in Ocean Pointe is 79.0 births per 1,000 women. Women in the age bracket of 20 to 34 years have the highest fertility rate with 126.0 births per 1,000 women. Women in the age bracket of 20 to 34 years acount for 59.9% of all women with births.
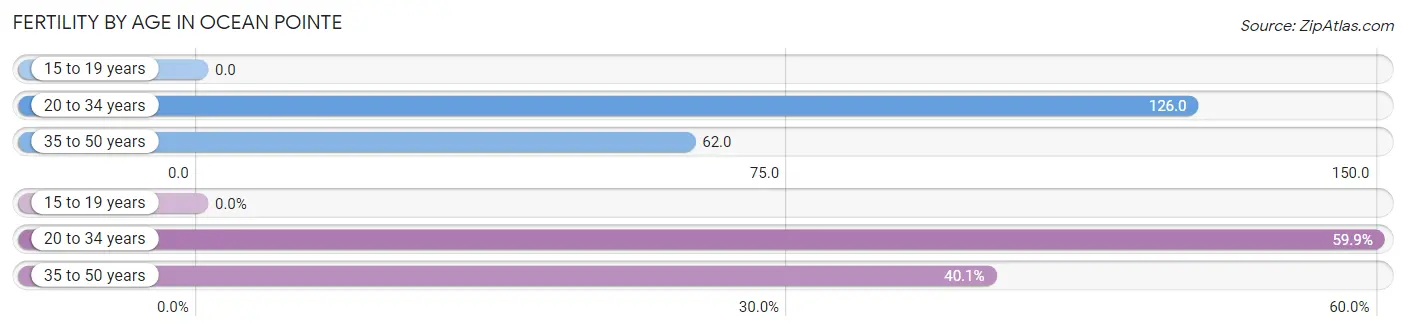
| Age Bracket | Women with Births | Births / 1,000 Women |
| 15 to 19 years | 0 (0.0%) | 0.0 |
| 20 to 34 years | 200 (59.9%) | 126.0 |
| 35 to 50 years | 134 (40.1%) | 62.0 |
| Total | 334 (100.0%) | 79.0 |
Fertility by Age by Marriage Status in Ocean Pointe
73.1% of women with births (334) in Ocean Pointe are married. The highest percentage of unmarried women with births falls into 20 to 34 years age bracket with 28.5% of them unmarried at the time of birth, while the lowest percentage of unmarried women with births belong to 35 to 50 years age bracket with 24.6% of them unmarried.
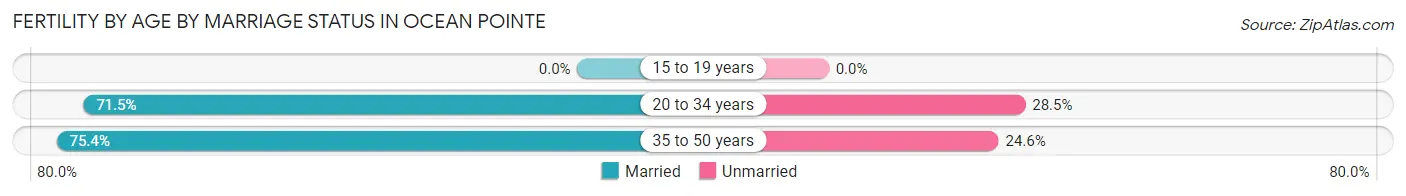
| Age Bracket | Married | Unmarried |
| 15 to 19 years | 0 (0.0%) | 0 (0.0%) |
| 20 to 34 years | 143 (71.5%) | 57 (28.5%) |
| 35 to 50 years | 101 (75.4%) | 33 (24.6%) |
| Total | 244 (73.1%) | 90 (27.0%) |
Fertility by Education in Ocean Pointe
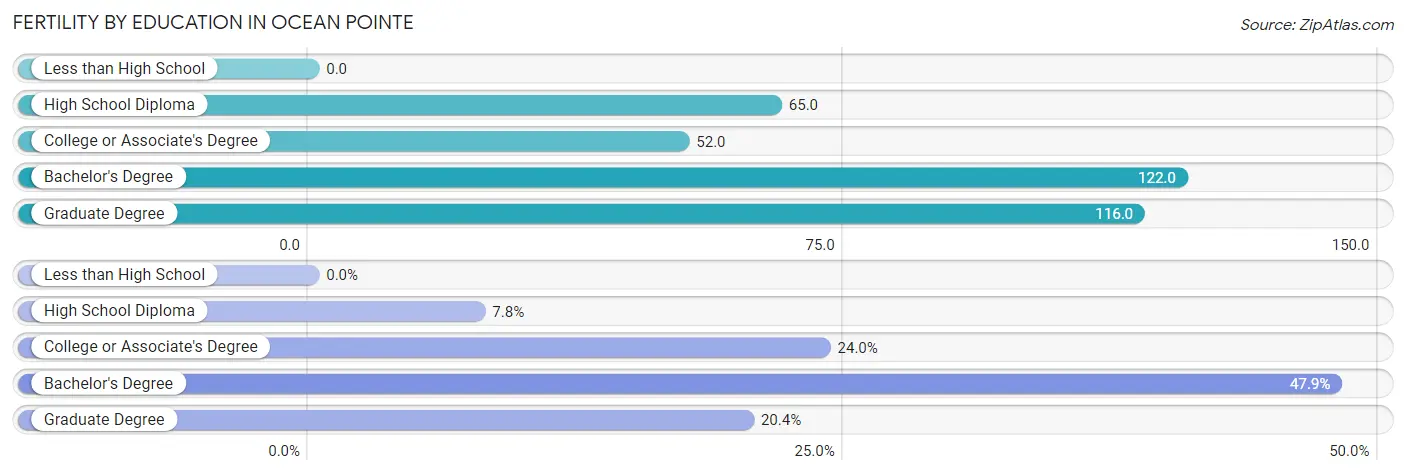
| Educational Attainment | Women with Births | Births / 1,000 Women |
| Less than High School | 0 (0.0%) | 0.0 |
| High School Diploma | 26 (7.8%) | 65.0 |
| College or Associate's Degree | 80 (23.9%) | 52.0 |
| Bachelor's Degree | 160 (47.9%) | 122.0 |
| Graduate Degree | 68 (20.4%) | 116.0 |
| Total | 334 (100.0%) | 79.0 |
Fertility by Education by Marriage Status in Ocean Pointe
27.0% of women with births in Ocean Pointe are unmarried. Women with the educational attainment of high school diploma are most likely to be married with 100.0% of them married at childbirth, while women with the educational attainment of college or associate's degree are least likely to be married with 57.5% of them unmarried at childbirth.
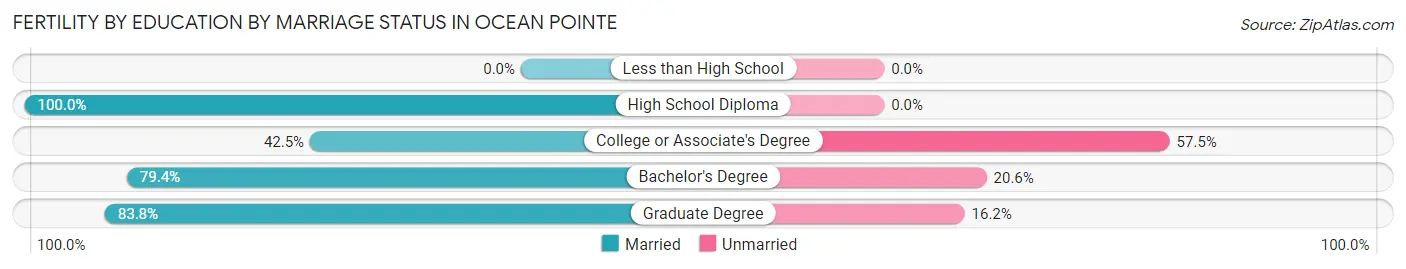
| Educational Attainment | Married | Unmarried |
| Less than High School | 0 (0.0%) | 0 (0.0%) |
| High School Diploma | 26 (100.0%) | 0 (0.0%) |
| College or Associate's Degree | 34 (42.5%) | 46 (57.5%) |
| Bachelor's Degree | 127 (79.4%) | 33 (20.6%) |
| Graduate Degree | 57 (83.8%) | 11 (16.2%) |
| Total | 244 (73.1%) | 90 (27.0%) |
Employment Characteristics in Ocean Pointe
Employment by Class of Employer in Ocean Pointe
Among the 8,129 employed individuals in Ocean Pointe, private company employees (3,443 | 42.3%), federal government employees (2,713 | 33.4%), and not-for-profit organizations (562 | 6.9%) make up the most common classes of employment.
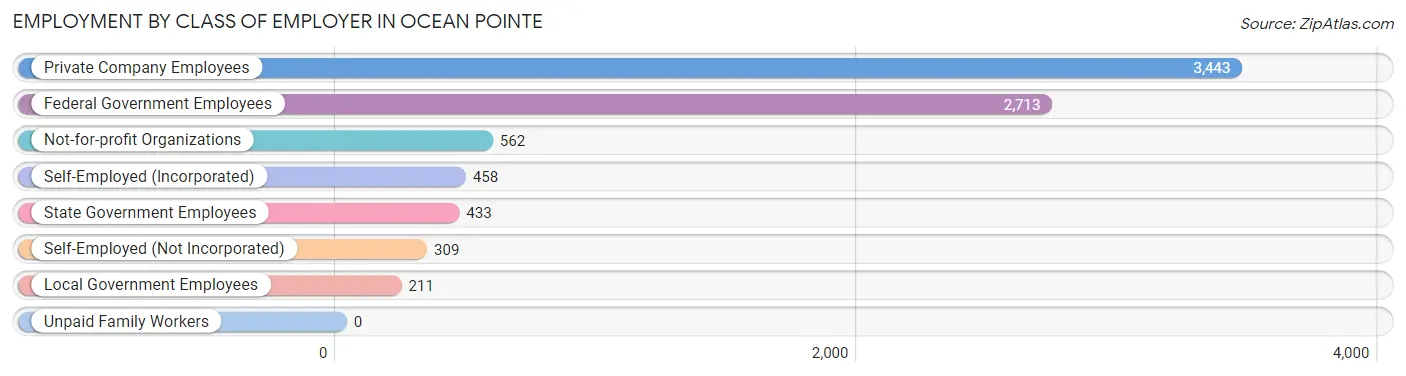
| Employer Class | # Employees | % Employees |
| Private Company Employees | 3,443 | 42.3% |
| Self-Employed (Incorporated) | 458 | 5.6% |
| Self-Employed (Not Incorporated) | 309 | 3.8% |
| Not-for-profit Organizations | 562 | 6.9% |
| Local Government Employees | 211 | 2.6% |
| State Government Employees | 433 | 5.3% |
| Federal Government Employees | 2,713 | 33.4% |
| Unpaid Family Workers | 0 | 0.0% |
| Total | 8,129 | 100.0% |
Employment Status by Age in Ocean Pointe
According to the labor force statistics for Ocean Pointe, out of the total population over 16 years of age (11,386), 75.6% or 8,608 individuals are in the labor force, with 2.9% or 250 of them unemployed. The age group with the highest labor force participation rate is 35 to 44 years, with 91.4% or 2,800 individuals in the labor force. Within the labor force, the 20 to 24 years age range has the highest percentage of unemployed individuals, with 16.0% or 65 of them being unemployed.
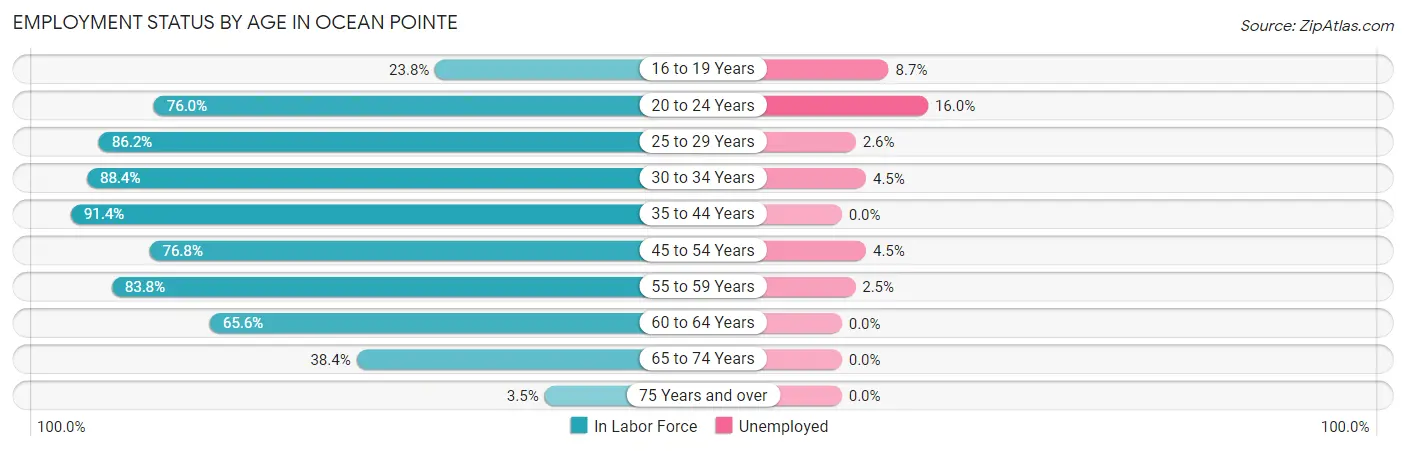
| Age Bracket | In Labor Force | Unemployed |
| 16 to 19 Years | 172 (23.8%) | 15 (8.7%) |
| 20 to 24 Years | 405 (76.0%) | 65 (16.0%) |
| 25 to 29 Years | 1,036 (86.2%) | 27 (2.6%) |
| 30 to 34 Years | 1,524 (88.4%) | 69 (4.5%) |
| 35 to 44 Years | 2,800 (91.4%) | 0 (0.0%) |
| 45 to 54 Years | 1,309 (76.8%) | 59 (4.5%) |
| 55 to 59 Years | 813 (83.8%) | 20 (2.5%) |
| 60 to 64 Years | 271 (65.6%) | 0 (0.0%) |
| 65 to 74 Years | 262 (38.4%) | 0 (0.0%) |
| 75 Years and over | 13 (3.5%) | 0 (0.0%) |
| Total | 8,608 (75.6%) | 250 (2.9%) |
Employment Status by Educational Attainment in Ocean Pointe
According to labor force statistics for Ocean Pointe, 85.4% of individuals (7,752) out of the total population between 25 and 64 years of age (9,077) are in the labor force, with 2.2% or 171 of them being unemployed. The group with the highest labor force participation rate are those with the educational attainment of bachelor's degree or higher, with 89.7% or 3,801 individuals in the labor force. Within the labor force, individuals with less than high school education have the highest percentage of unemployment, with 34.5% or 49 of them being unemployed.
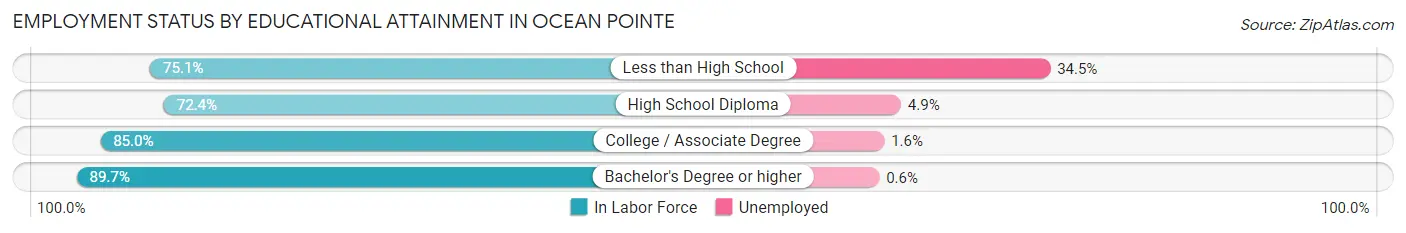
| Educational Attainment | In Labor Force | Unemployed |
| Less than High School | 142 (75.1%) | 65 (34.5%) |
| High School Diploma | 812 (72.4%) | 55 (4.9%) |
| College / Associate Degree | 2,999 (85.0%) | 56 (1.6%) |
| Bachelor's Degree or higher | 3,801 (89.7%) | 25 (0.6%) |
| Total | 7,752 (85.4%) | 200 (2.2%) |
Employment Occupations by Sex in Ocean Pointe
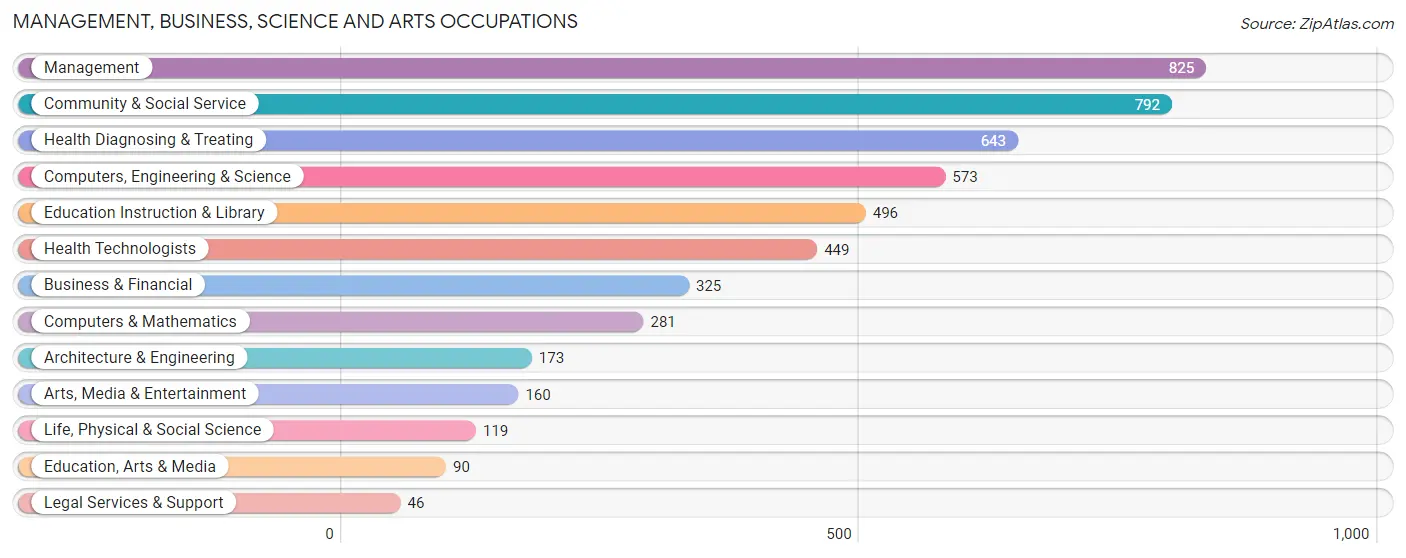
Management, Business, Science and Arts Occupations
The most common Management, Business, Science and Arts occupations in Ocean Pointe are Management (825 | 11.8%), Community & Social Service (792 | 11.3%), Health Diagnosing & Treating (643 | 9.2%), Computers, Engineering & Science (573 | 8.2%), and Education Instruction & Library (496 | 7.1%).
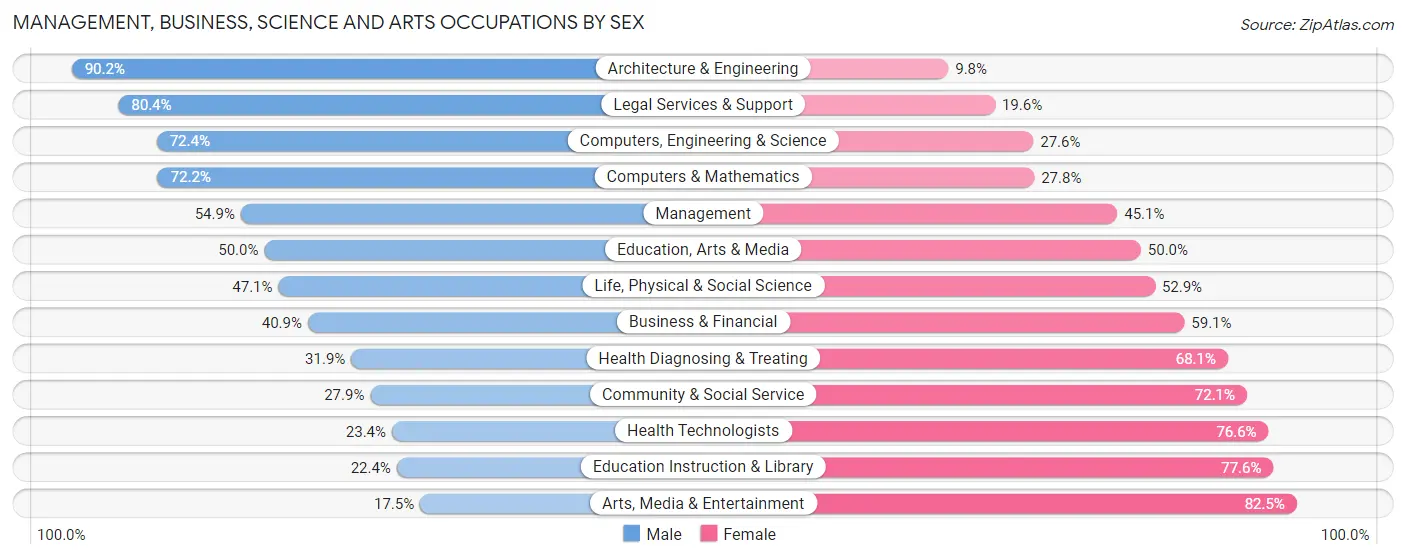
Management, Business, Science and Arts Occupations by Sex
Within the Management, Business, Science and Arts occupations in Ocean Pointe, the most male-oriented occupations are Architecture & Engineering (90.2%), Legal Services & Support (80.4%), and Computers, Engineering & Science (72.4%), while the most female-oriented occupations are Arts, Media & Entertainment (82.5%), Education Instruction & Library (77.6%), and Health Technologists (76.6%).
| Occupation | Male | Female |
| Management | 453 (54.9%) | 372 (45.1%) |
| Business & Financial | 133 (40.9%) | 192 (59.1%) |
| Computers, Engineering & Science | 415 (72.4%) | 158 (27.6%) |
| Computers & Mathematics | 203 (72.2%) | 78 (27.8%) |
| Architecture & Engineering | 156 (90.2%) | 17 (9.8%) |
| Life, Physical & Social Science | 56 (47.1%) | 63 (52.9%) |
| Community & Social Service | 221 (27.9%) | 571 (72.1%) |
| Education, Arts & Media | 45 (50.0%) | 45 (50.0%) |
| Legal Services & Support | 37 (80.4%) | 9 (19.6%) |
| Education Instruction & Library | 111 (22.4%) | 385 (77.6%) |
| Arts, Media & Entertainment | 28 (17.5%) | 132 (82.5%) |
| Health Diagnosing & Treating | 205 (31.9%) | 438 (68.1%) |
| Health Technologists | 105 (23.4%) | 344 (76.6%) |
| Total (Category) | 1,427 (45.2%) | 1,731 (54.8%) |
| Total (Overall) | 3,442 (49.2%) | 3,552 (50.8%) |
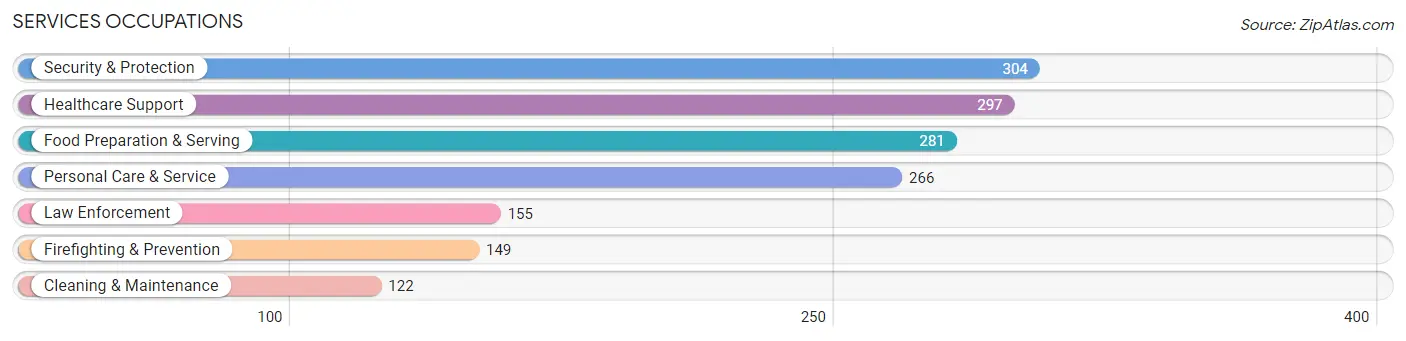
Services Occupations
The most common Services occupations in Ocean Pointe are Security & Protection (304 | 4.3%), Healthcare Support (297 | 4.3%), Food Preparation & Serving (281 | 4.0%), Personal Care & Service (266 | 3.8%), and Law Enforcement (155 | 2.2%).
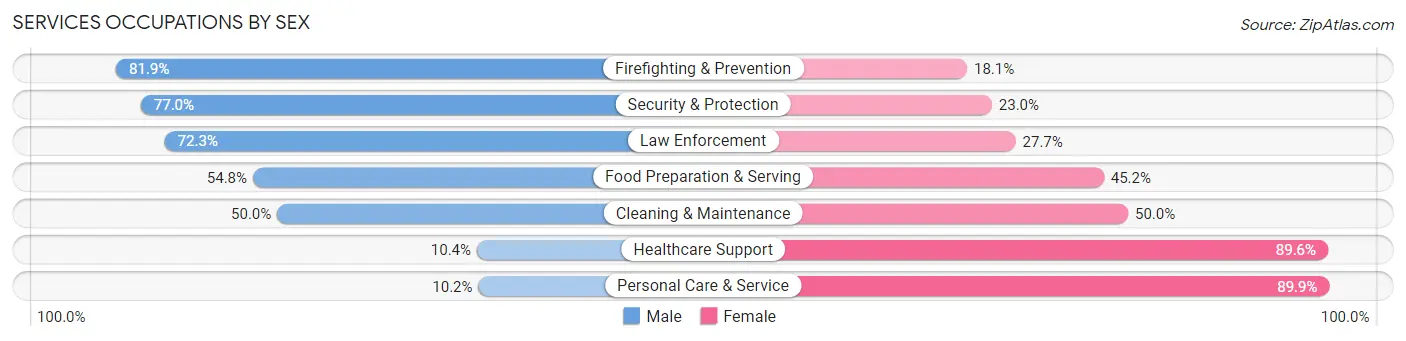
Services Occupations by Sex
Within the Services occupations in Ocean Pointe, the most male-oriented occupations are Firefighting & Prevention (81.9%), Security & Protection (77.0%), and Law Enforcement (72.3%), while the most female-oriented occupations are Personal Care & Service (89.8%), Healthcare Support (89.6%), and Cleaning & Maintenance (50.0%).
| Occupation | Male | Female |
| Healthcare Support | 31 (10.4%) | 266 (89.6%) |
| Security & Protection | 234 (77.0%) | 70 (23.0%) |
| Firefighting & Prevention | 122 (81.9%) | 27 (18.1%) |
| Law Enforcement | 112 (72.3%) | 43 (27.7%) |
| Food Preparation & Serving | 154 (54.8%) | 127 (45.2%) |
| Cleaning & Maintenance | 61 (50.0%) | 61 (50.0%) |
| Personal Care & Service | 27 (10.2%) | 239 (89.8%) |
| Total (Category) | 507 (39.9%) | 763 (60.1%) |
| Total (Overall) | 3,442 (49.2%) | 3,552 (50.8%) |
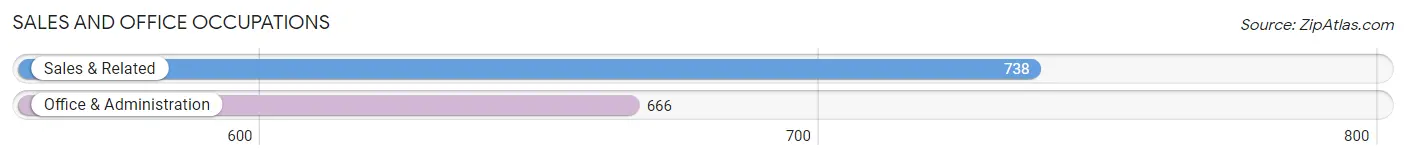
Sales and Office Occupations
The most common Sales and Office occupations in Ocean Pointe are Sales & Related (738 | 10.5%), and Office & Administration (666 | 9.5%).
Sales and Office Occupations by Sex
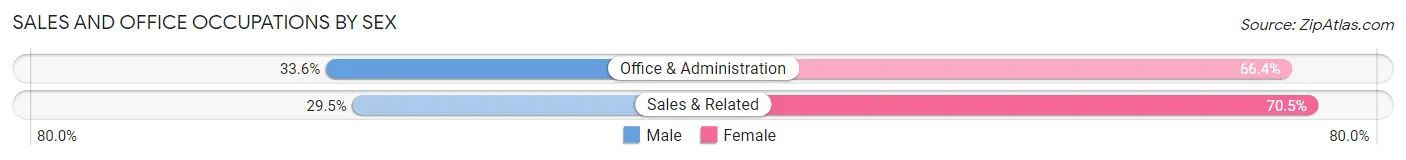
| Occupation | Male | Female |
| Sales & Related | 218 (29.5%) | 520 (70.5%) |
| Office & Administration | 224 (33.6%) | 442 (66.4%) |
| Total (Category) | 442 (31.5%) | 962 (68.5%) |
| Total (Overall) | 3,442 (49.2%) | 3,552 (50.8%) |
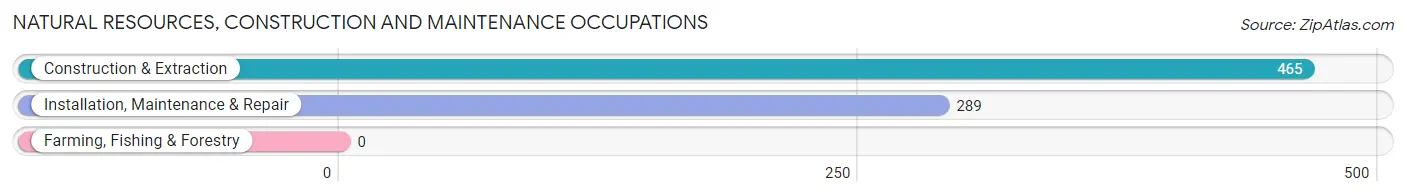
Natural Resources, Construction and Maintenance Occupations
The most common Natural Resources, Construction and Maintenance occupations in Ocean Pointe are Construction & Extraction (465 | 6.7%), and Installation, Maintenance & Repair (289 | 4.1%).
Natural Resources, Construction and Maintenance Occupations by Sex
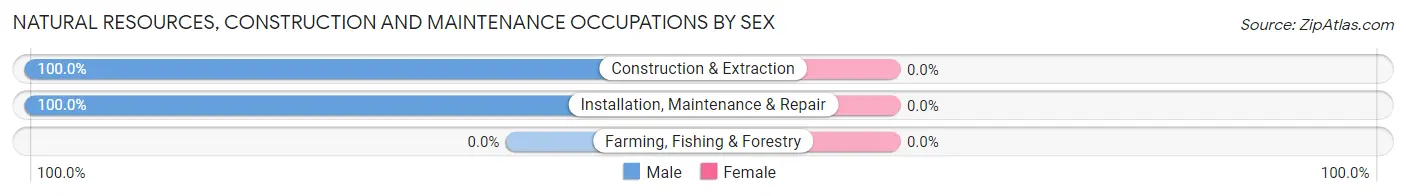
| Occupation | Male | Female |
| Farming, Fishing & Forestry | 0 (0.0%) | 0 (0.0%) |
| Construction & Extraction | 465 (100.0%) | 0 (0.0%) |
| Installation, Maintenance & Repair | 289 (100.0%) | 0 (0.0%) |
| Total (Category) | 754 (100.0%) | 0 (0.0%) |
| Total (Overall) | 3,442 (49.2%) | 3,552 (50.8%) |
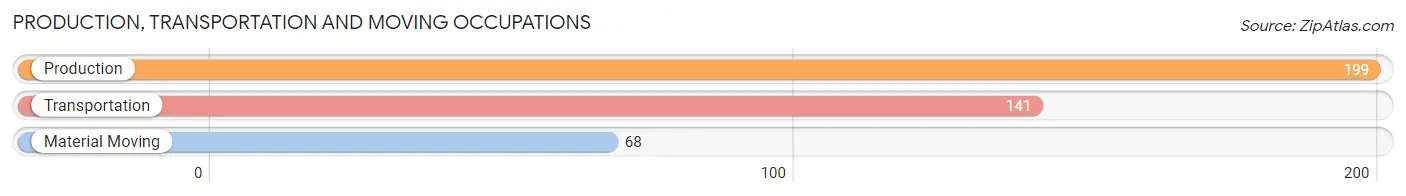
Production, Transportation and Moving Occupations
The most common Production, Transportation and Moving occupations in Ocean Pointe are Production (199 | 2.9%), Transportation (141 | 2.0%), and Material Moving (68 | 1.0%).
Production, Transportation and Moving Occupations by Sex
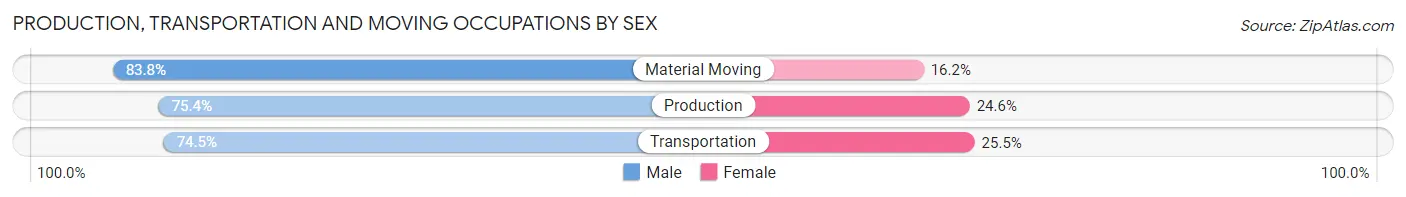
| Occupation | Male | Female |
| Production | 150 (75.4%) | 49 (24.6%) |
| Transportation | 105 (74.5%) | 36 (25.5%) |
| Material Moving | 57 (83.8%) | 11 (16.2%) |
| Total (Category) | 312 (76.5%) | 96 (23.5%) |
| Total (Overall) | 3,442 (49.2%) | 3,552 (50.8%) |
Employment Industries by Sex in Ocean Pointe
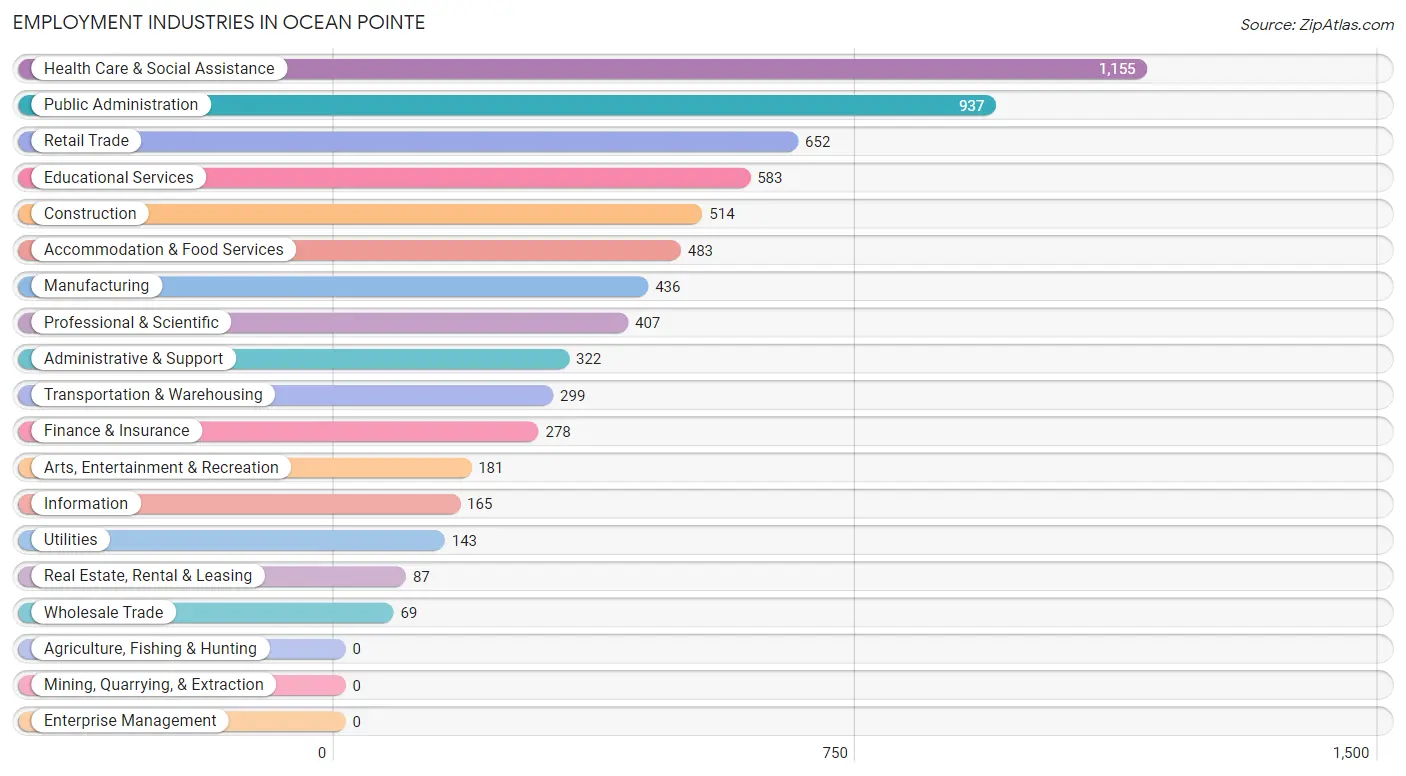
Employment Industries in Ocean Pointe
The major employment industries in Ocean Pointe include Health Care & Social Assistance (1,155 | 16.5%), Public Administration (937 | 13.4%), Retail Trade (652 | 9.3%), Educational Services (583 | 8.3%), and Construction (514 | 7.3%).
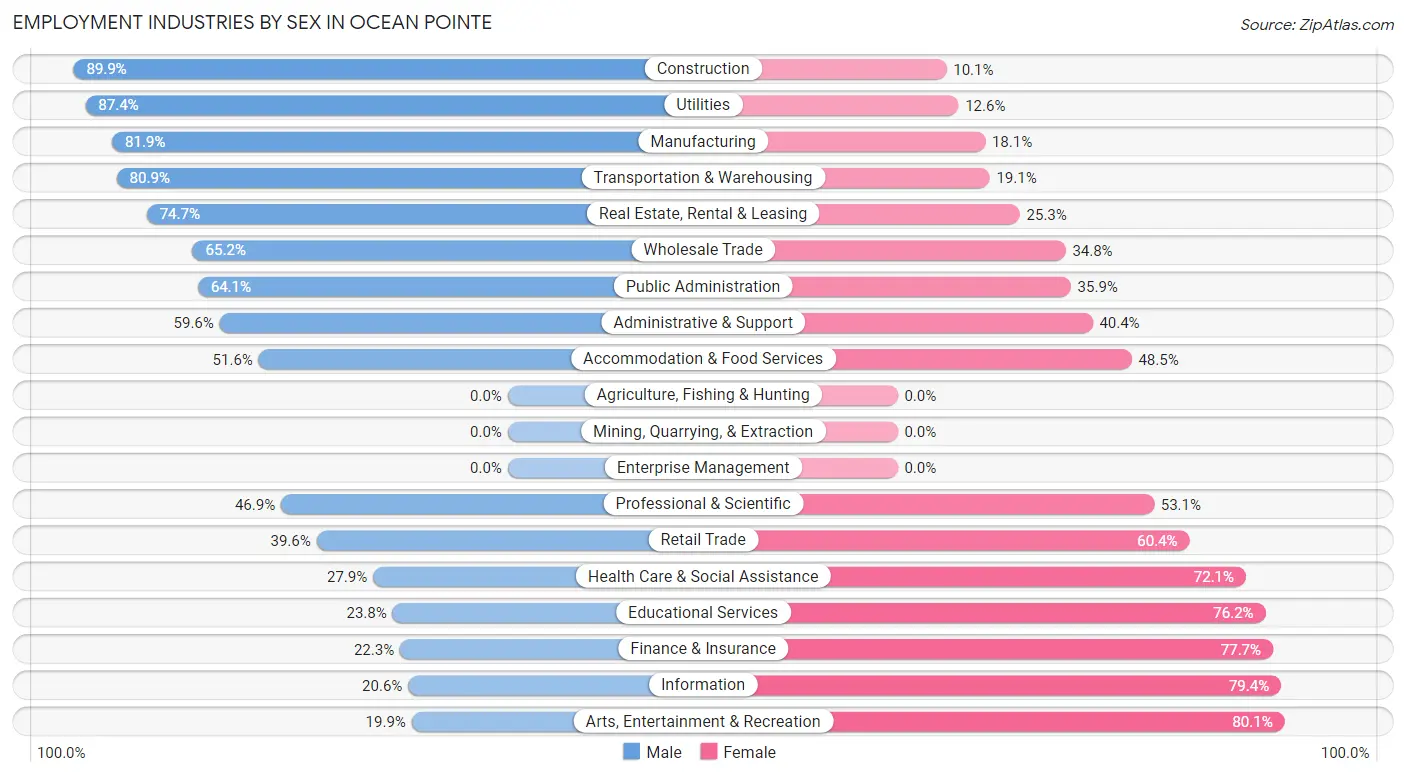
Employment Industries by Sex in Ocean Pointe
The Ocean Pointe industries that see more men than women are Construction (89.9%), Utilities (87.4%), and Manufacturing (81.9%), whereas the industries that tend to have a higher number of women are Arts, Entertainment & Recreation (80.1%), Information (79.4%), and Finance & Insurance (77.7%).
| Industry | Male | Female |
| Agriculture, Fishing & Hunting | 0 (0.0%) | 0 (0.0%) |
| Mining, Quarrying, & Extraction | 0 (0.0%) | 0 (0.0%) |
| Construction | 462 (89.9%) | 52 (10.1%) |
| Manufacturing | 357 (81.9%) | 79 (18.1%) |
| Wholesale Trade | 45 (65.2%) | 24 (34.8%) |
| Retail Trade | 258 (39.6%) | 394 (60.4%) |
| Transportation & Warehousing | 242 (80.9%) | 57 (19.1%) |
| Utilities | 125 (87.4%) | 18 (12.6%) |
| Information | 34 (20.6%) | 131 (79.4%) |
| Finance & Insurance | 62 (22.3%) | 216 (77.7%) |
| Real Estate, Rental & Leasing | 65 (74.7%) | 22 (25.3%) |
| Professional & Scientific | 191 (46.9%) | 216 (53.1%) |
| Enterprise Management | 0 (0.0%) | 0 (0.0%) |
| Administrative & Support | 192 (59.6%) | 130 (40.4%) |
| Educational Services | 139 (23.8%) | 444 (76.2%) |
| Health Care & Social Assistance | 322 (27.9%) | 833 (72.1%) |
| Arts, Entertainment & Recreation | 36 (19.9%) | 145 (80.1%) |
| Accommodation & Food Services | 249 (51.5%) | 234 (48.4%) |
| Public Administration | 601 (64.1%) | 336 (35.9%) |
| Total | 3,442 (49.2%) | 3,552 (50.8%) |
Education in Ocean Pointe
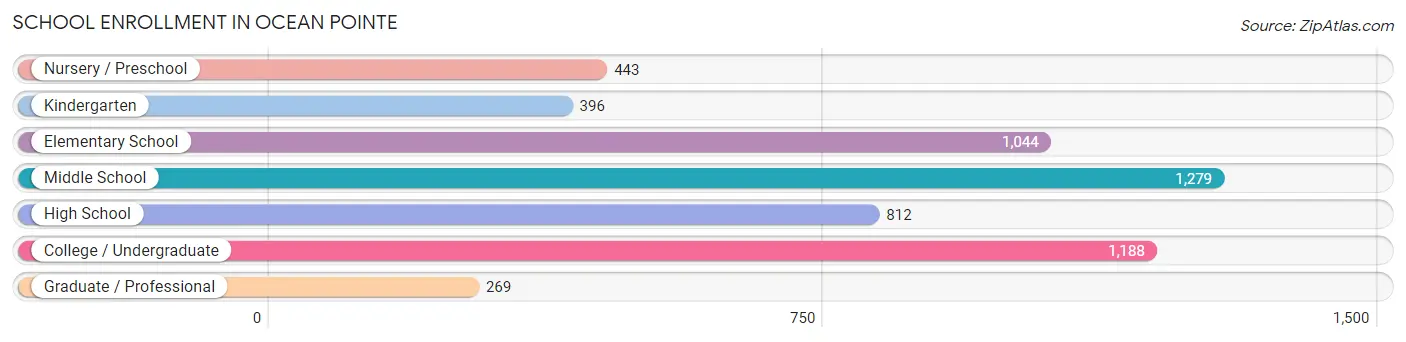
School Enrollment in Ocean Pointe
The most common levels of schooling among the 5,431 students in Ocean Pointe are middle school (1,279 | 23.5%), college / undergraduate (1,188 | 21.9%), and elementary school (1,044 | 19.2%).
| School Level | # Students | % Students |
| Nursery / Preschool | 443 | 8.2% |
| Kindergarten | 396 | 7.3% |
| Elementary School | 1,044 | 19.2% |
| Middle School | 1,279 | 23.5% |
| High School | 812 | 14.9% |
| College / Undergraduate | 1,188 | 21.9% |
| Graduate / Professional | 269 | 5.0% |
| Total | 5,431 | 100.0% |
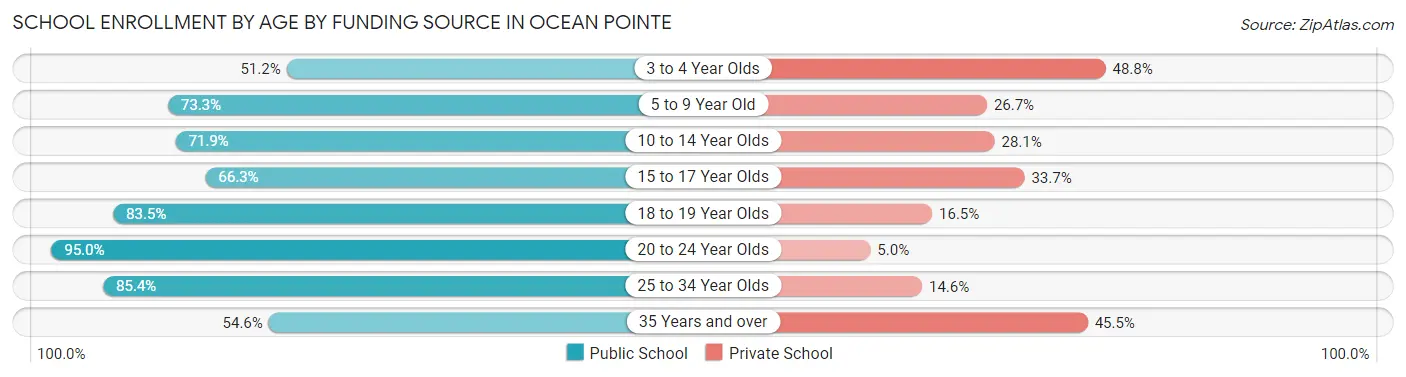
School Enrollment by Age by Funding Source in Ocean Pointe
Out of a total of 5,431 students who are enrolled in schools in Ocean Pointe, 1,564 (28.8%) attend a private institution, while the remaining 3,867 (71.2%) are enrolled in public schools. The age group of 3 to 4 year olds has the highest likelihood of being enrolled in private schools, with 160 (48.8% in the age bracket) enrolled. Conversely, the age group of 20 to 24 year olds has the lowest likelihood of being enrolled in a private school, with 191 (95.0% in the age bracket) attending a public institution.
| Age Bracket | Public School | Private School |
| 3 to 4 Year Olds | 168 (51.2%) | 160 (48.8%) |
| 5 to 9 Year Old | 1,093 (73.3%) | 398 (26.7%) |
| 10 to 14 Year Olds | 1,085 (71.9%) | 424 (28.1%) |
| 15 to 17 Year Olds | 386 (66.3%) | 196 (33.7%) |
| 18 to 19 Year Olds | 213 (83.5%) | 42 (16.5%) |
| 20 to 24 Year Olds | 191 (95.0%) | 10 (5.0%) |
| 25 to 34 Year Olds | 421 (85.4%) | 72 (14.6%) |
| 35 Years and over | 312 (54.5%) | 260 (45.5%) |
| Total | 3,867 (71.2%) | 1,564 (28.8%) |
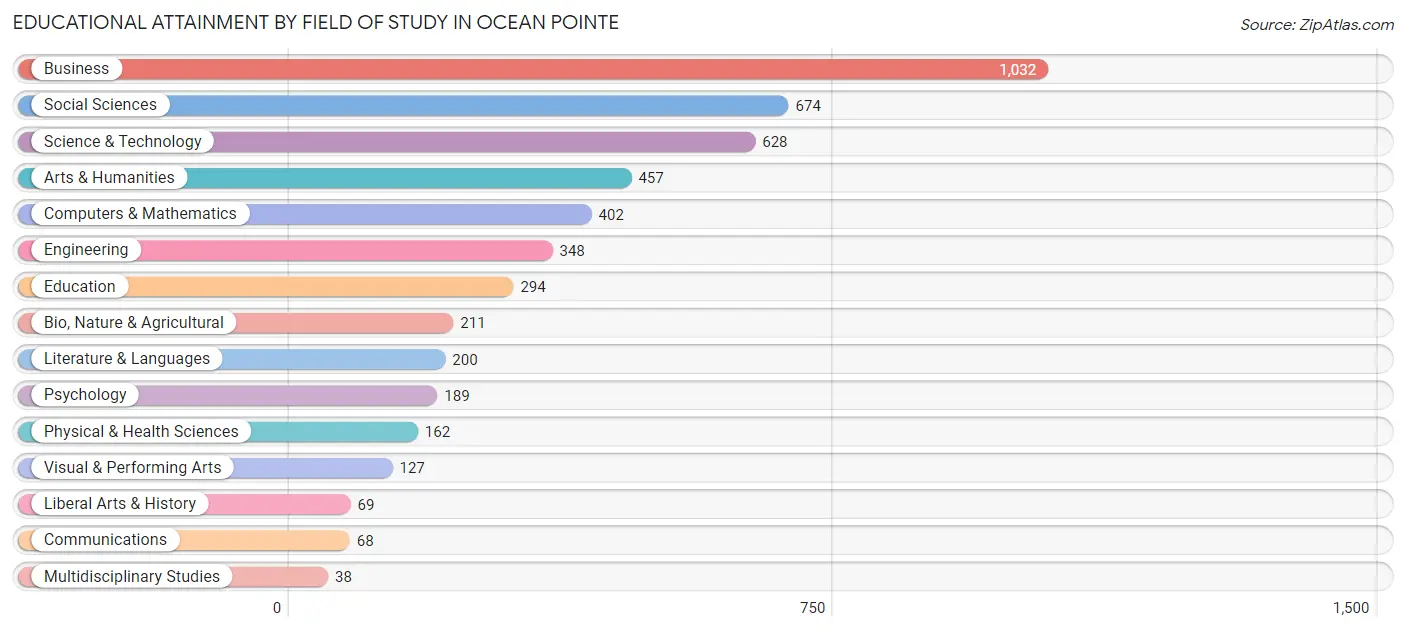
Educational Attainment by Field of Study in Ocean Pointe
Business (1,032 | 21.1%), social sciences (674 | 13.8%), science & technology (628 | 12.8%), arts & humanities (457 | 9.3%), and computers & mathematics (402 | 8.2%) are the most common fields of study among 4,899 individuals in Ocean Pointe who have obtained a bachelor's degree or higher.
| Field of Study | # Graduates | % Graduates |
| Computers & Mathematics | 402 | 8.2% |
| Bio, Nature & Agricultural | 211 | 4.3% |
| Physical & Health Sciences | 162 | 3.3% |
| Psychology | 189 | 3.9% |
| Social Sciences | 674 | 13.8% |
| Engineering | 348 | 7.1% |
| Multidisciplinary Studies | 38 | 0.8% |
| Science & Technology | 628 | 12.8% |
| Business | 1,032 | 21.1% |
| Education | 294 | 6.0% |
| Literature & Languages | 200 | 4.1% |
| Liberal Arts & History | 69 | 1.4% |
| Visual & Performing Arts | 127 | 2.6% |
| Communications | 68 | 1.4% |
| Arts & Humanities | 457 | 9.3% |
| Total | 4,899 | 100.0% |
Transportation & Commute in Ocean Pointe
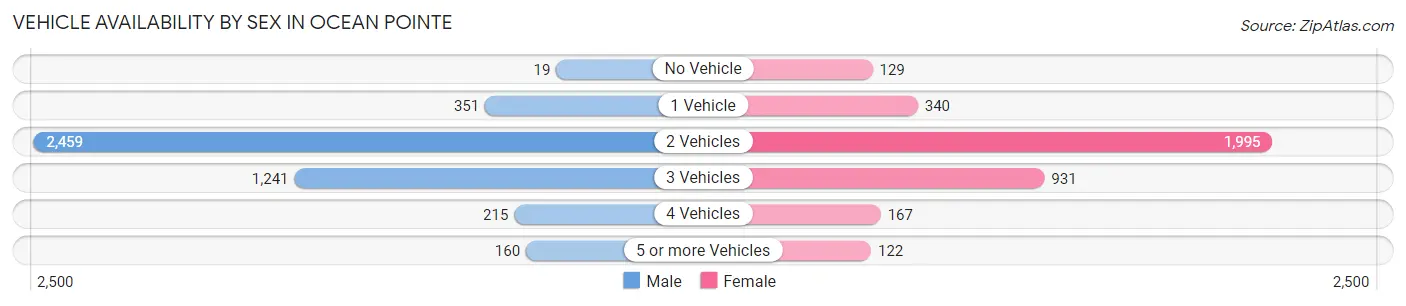
Vehicle Availability by Sex in Ocean Pointe
The most prevalent vehicle ownership categories in Ocean Pointe are males with 2 vehicles (2,459, accounting for 55.3%) and females with 2 vehicles (1,995, making up 66.7%).
| Vehicles Available | Male | Female |
| No Vehicle | 19 (0.4%) | 129 (3.5%) |
| 1 Vehicle | 351 (7.9%) | 340 (9.2%) |
| 2 Vehicles | 2,459 (55.3%) | 1,995 (54.1%) |
| 3 Vehicles | 1,241 (27.9%) | 931 (25.3%) |
| 4 Vehicles | 215 (4.8%) | 167 (4.5%) |
| 5 or more Vehicles | 160 (3.6%) | 122 (3.3%) |
| Total | 4,445 (100.0%) | 3,684 (100.0%) |
Commute Time in Ocean Pointe
The most frequently occuring commute durations in Ocean Pointe are 45 to 59 minutes (1,690 commuters, 22.0%), 30 to 34 minutes (1,034 commuters, 13.5%), and 60 to 89 minutes (909 commuters, 11.9%).
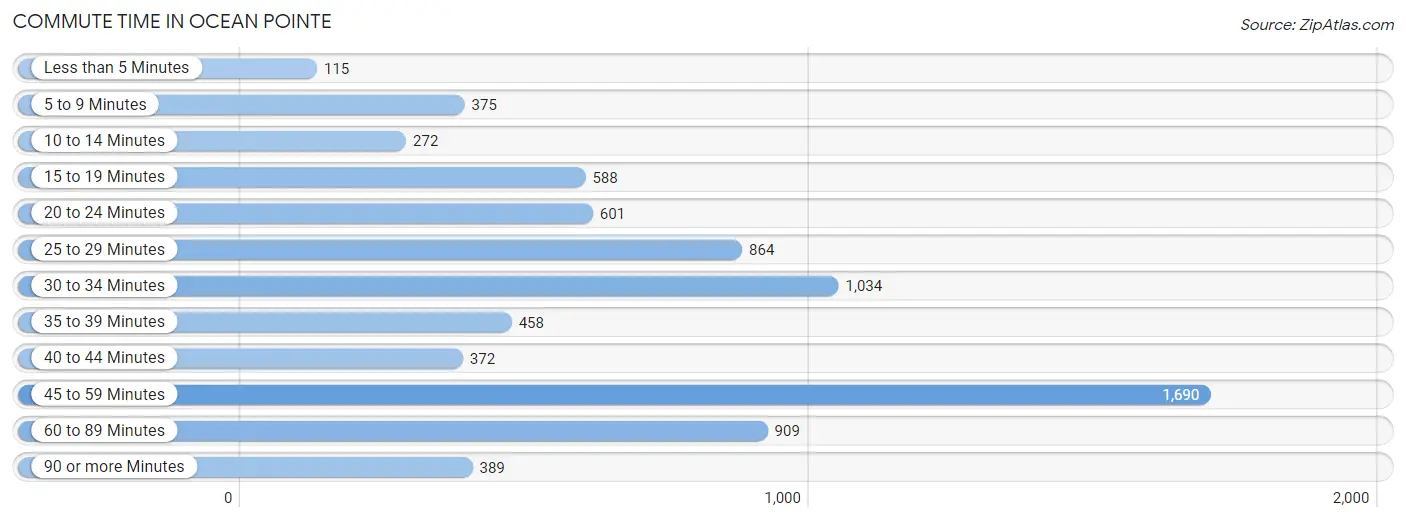
| Commute Time | # Commuters | % Commuters |
| Less than 5 Minutes | 115 | 1.5% |
| 5 to 9 Minutes | 375 | 4.9% |
| 10 to 14 Minutes | 272 | 3.5% |
| 15 to 19 Minutes | 588 | 7.7% |
| 20 to 24 Minutes | 601 | 7.8% |
| 25 to 29 Minutes | 864 | 11.3% |
| 30 to 34 Minutes | 1,034 | 13.5% |
| 35 to 39 Minutes | 458 | 6.0% |
| 40 to 44 Minutes | 372 | 4.9% |
| 45 to 59 Minutes | 1,690 | 22.0% |
| 60 to 89 Minutes | 909 | 11.9% |
| 90 or more Minutes | 389 | 5.1% |
Commute Time by Sex in Ocean Pointe
The most common commute times in Ocean Pointe are 45 to 59 minutes (959 commuters, 22.1%) for males and 45 to 59 minutes (731 commuters, 22.0%) for females.
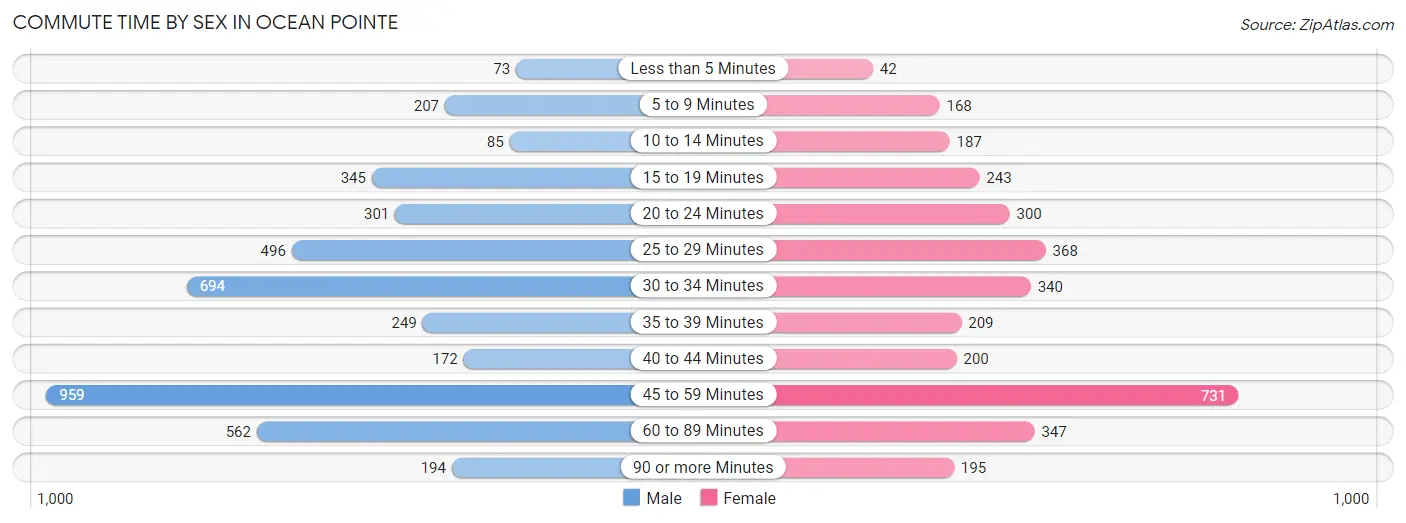
| Commute Time | Male | Female |
| Less than 5 Minutes | 73 (1.7%) | 42 (1.3%) |
| 5 to 9 Minutes | 207 (4.8%) | 168 (5.1%) |
| 10 to 14 Minutes | 85 (2.0%) | 187 (5.6%) |
| 15 to 19 Minutes | 345 (8.0%) | 243 (7.3%) |
| 20 to 24 Minutes | 301 (6.9%) | 300 (9.0%) |
| 25 to 29 Minutes | 496 (11.4%) | 368 (11.1%) |
| 30 to 34 Minutes | 694 (16.0%) | 340 (10.2%) |
| 35 to 39 Minutes | 249 (5.7%) | 209 (6.3%) |
| 40 to 44 Minutes | 172 (4.0%) | 200 (6.0%) |
| 45 to 59 Minutes | 959 (22.1%) | 731 (22.0%) |
| 60 to 89 Minutes | 562 (13.0%) | 347 (10.4%) |
| 90 or more Minutes | 194 (4.5%) | 195 (5.9%) |
Time of Departure to Work by Sex in Ocean Pointe
The most frequent times of departure to work in Ocean Pointe are 5:00 AM to 5:29 AM (923, 21.3%) for males and 6:00 AM to 6:29 AM (495, 14.9%) for females.
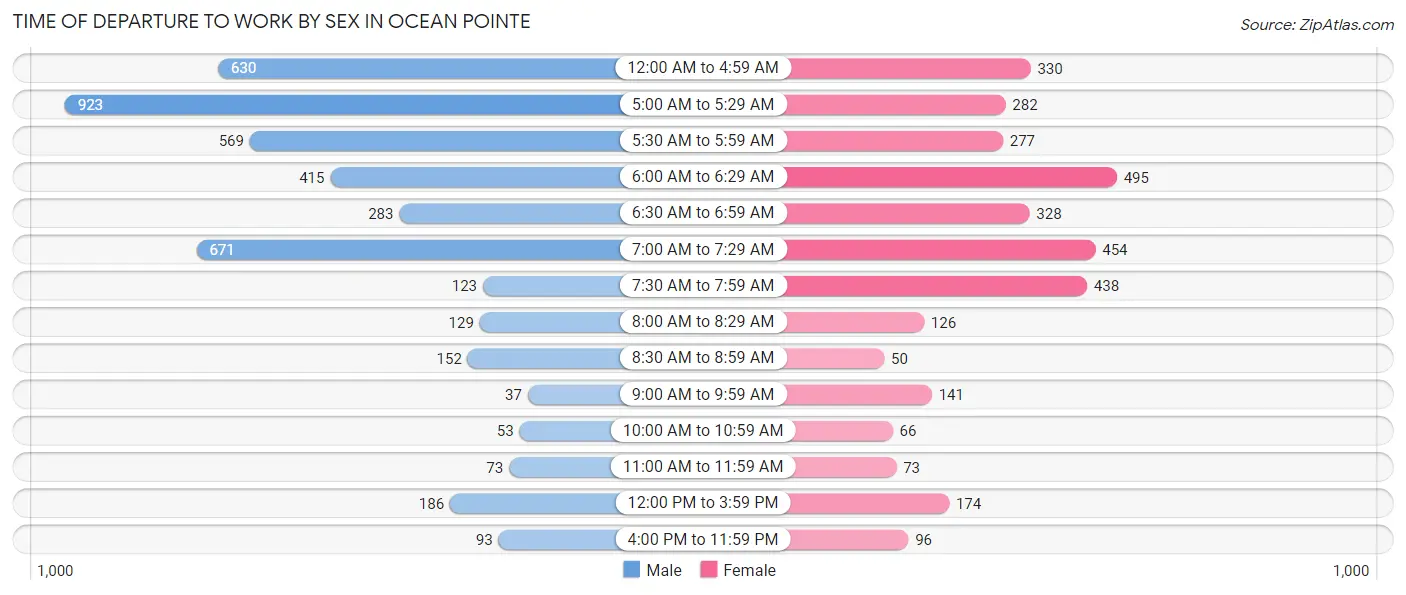
| Time of Departure | Male | Female |
| 12:00 AM to 4:59 AM | 630 (14.5%) | 330 (9.9%) |
| 5:00 AM to 5:29 AM | 923 (21.3%) | 282 (8.5%) |
| 5:30 AM to 5:59 AM | 569 (13.1%) | 277 (8.3%) |
| 6:00 AM to 6:29 AM | 415 (9.6%) | 495 (14.9%) |
| 6:30 AM to 6:59 AM | 283 (6.5%) | 328 (9.9%) |
| 7:00 AM to 7:29 AM | 671 (15.5%) | 454 (13.6%) |
| 7:30 AM to 7:59 AM | 123 (2.8%) | 438 (13.2%) |
| 8:00 AM to 8:29 AM | 129 (3.0%) | 126 (3.8%) |
| 8:30 AM to 8:59 AM | 152 (3.5%) | 50 (1.5%) |
| 9:00 AM to 9:59 AM | 37 (0.9%) | 141 (4.2%) |
| 10:00 AM to 10:59 AM | 53 (1.2%) | 66 (2.0%) |
| 11:00 AM to 11:59 AM | 73 (1.7%) | 73 (2.2%) |
| 12:00 PM to 3:59 PM | 186 (4.3%) | 174 (5.2%) |
| 4:00 PM to 11:59 PM | 93 (2.1%) | 96 (2.9%) |
| Total | 4,337 (100.0%) | 3,330 (100.0%) |
Housing Occupancy in Ocean Pointe
Occupancy by Ownership in Ocean Pointe
Of the total 5,027 dwellings in Ocean Pointe, owner-occupied units account for 3,790 (75.4%), while renter-occupied units make up 1,237 (24.6%).
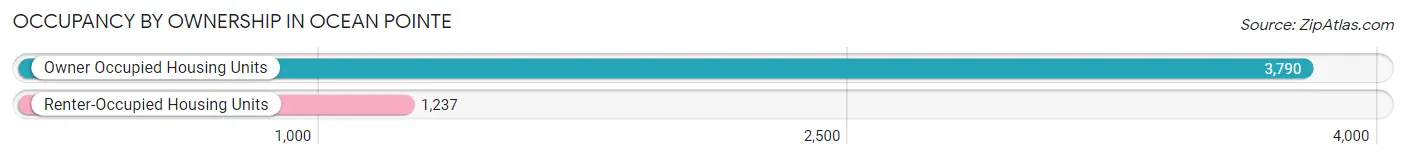
| Occupancy | # Housing Units | % Housing Units |
| Owner Occupied Housing Units | 3,790 | 75.4% |
| Renter-Occupied Housing Units | 1,237 | 24.6% |
| Total Occupied Housing Units | 5,027 | 100.0% |
Occupancy by Household Size in Ocean Pointe
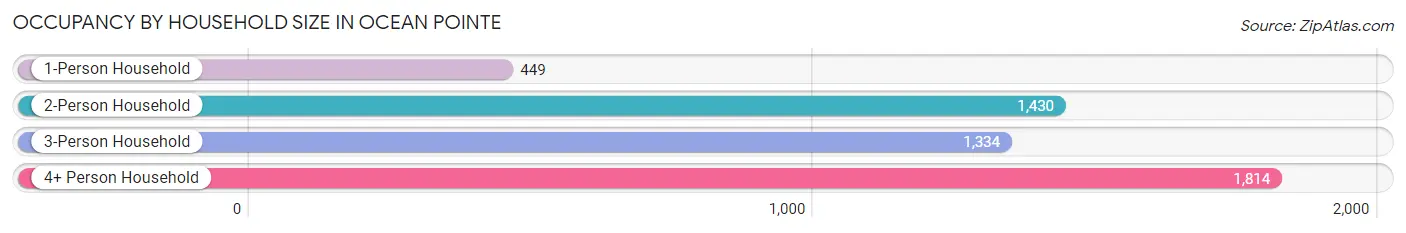
| Household Size | # Housing Units | % Housing Units |
| 1-Person Household | 449 | 8.9% |
| 2-Person Household | 1,430 | 28.4% |
| 3-Person Household | 1,334 | 26.5% |
| 4+ Person Household | 1,814 | 36.1% |
| Total Housing Units | 5,027 | 100.0% |
Occupancy by Ownership by Household Size in Ocean Pointe
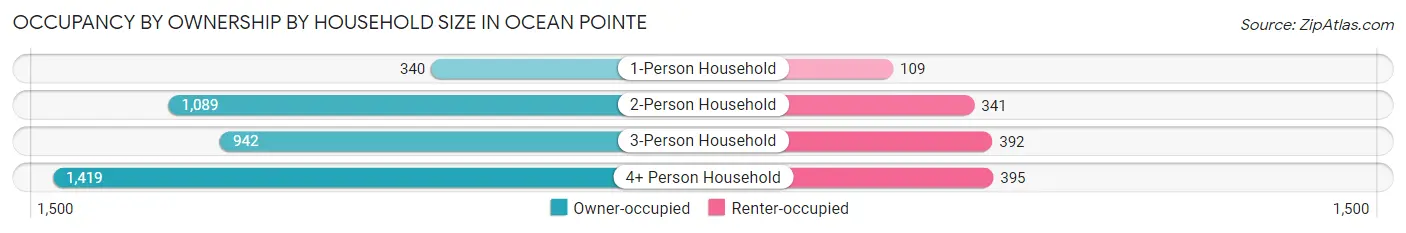
| Household Size | Owner-occupied | Renter-occupied |
| 1-Person Household | 340 (75.7%) | 109 (24.3%) |
| 2-Person Household | 1,089 (76.1%) | 341 (23.8%) |
| 3-Person Household | 942 (70.6%) | 392 (29.4%) |
| 4+ Person Household | 1,419 (78.2%) | 395 (21.8%) |
| Total Housing Units | 3,790 (75.4%) | 1,237 (24.6%) |
Occupancy by Educational Attainment in Ocean Pointe
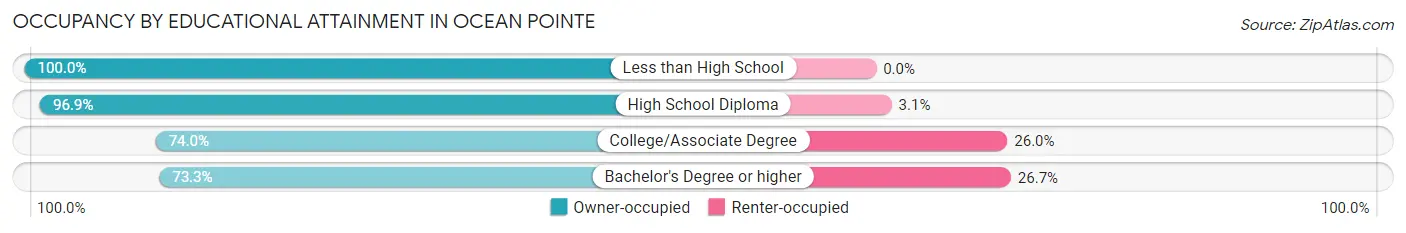
| Household Size | Owner-occupied | Renter-occupied |
| Less than High School | 24 (100.0%) | 0 (0.0%) |
| High School Diploma | 347 (96.9%) | 11 (3.1%) |
| College/Associate Degree | 1,553 (74.0%) | 546 (26.0%) |
| Bachelor's Degree or higher | 1,866 (73.3%) | 680 (26.7%) |
Occupancy by Age of Householder in Ocean Pointe
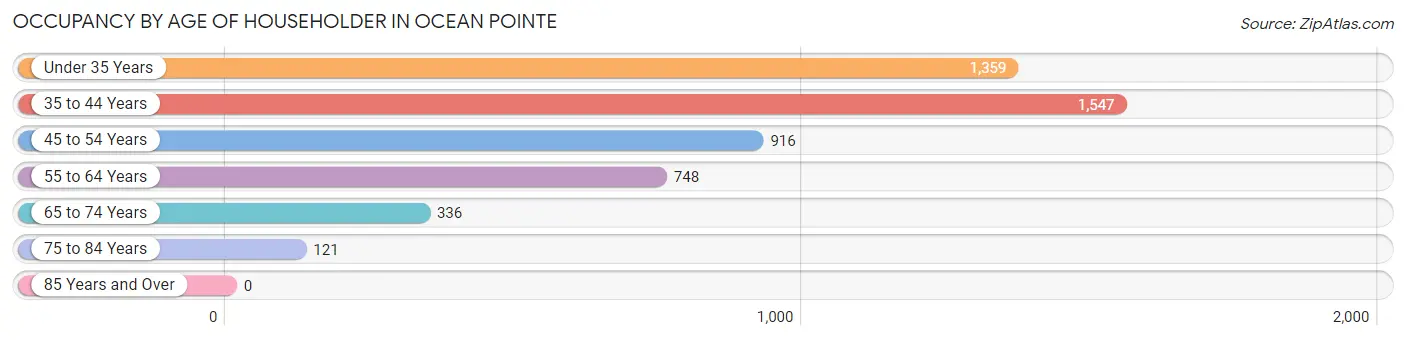
| Age Bracket | # Households | % Households |
| Under 35 Years | 1,359 | 27.0% |
| 35 to 44 Years | 1,547 | 30.8% |
| 45 to 54 Years | 916 | 18.2% |
| 55 to 64 Years | 748 | 14.9% |
| 65 to 74 Years | 336 | 6.7% |
| 75 to 84 Years | 121 | 2.4% |
| 85 Years and Over | 0 | 0.0% |
| Total | 5,027 | 100.0% |
Housing Finances in Ocean Pointe
Median Income by Occupancy in Ocean Pointe
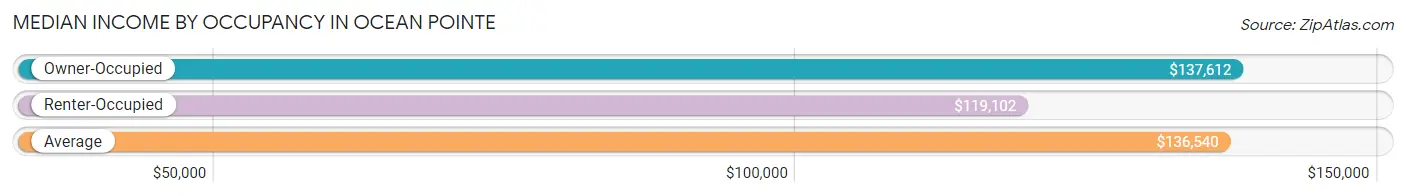
| Occupancy Type | # Households | Median Income |
| Owner-Occupied | 3,790 (75.4%) | $137,612 |
| Renter-Occupied | 1,237 (24.6%) | $119,102 |
| Average | 5,027 (100.0%) | $136,540 |
Occupancy by Householder Income Bracket in Ocean Pointe
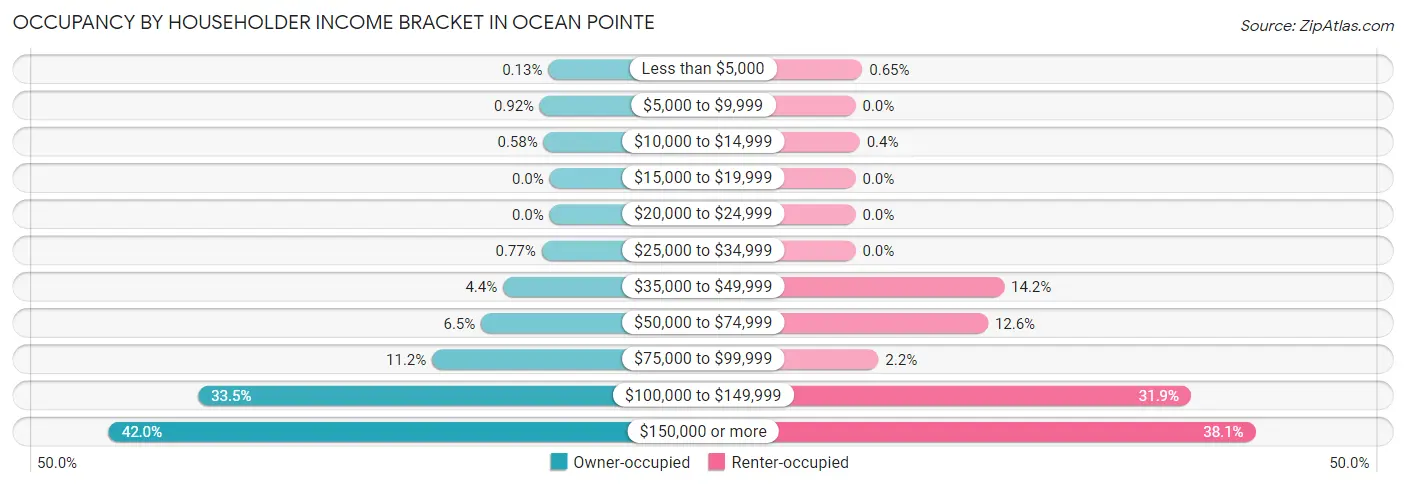
| Income Bracket | Owner-occupied | Renter-occupied |
| Less than $5,000 | 5 (0.1%) | 8 (0.6%) |
| $5,000 to $9,999 | 35 (0.9%) | 0 (0.0%) |
| $10,000 to $14,999 | 22 (0.6%) | 5 (0.4%) |
| $15,000 to $19,999 | 0 (0.0%) | 0 (0.0%) |
| $20,000 to $24,999 | 0 (0.0%) | 0 (0.0%) |
| $25,000 to $34,999 | 29 (0.8%) | 0 (0.0%) |
| $35,000 to $49,999 | 168 (4.4%) | 175 (14.1%) |
| $50,000 to $74,999 | 247 (6.5%) | 156 (12.6%) |
| $75,000 to $99,999 | 424 (11.2%) | 27 (2.2%) |
| $100,000 to $149,999 | 1,269 (33.5%) | 395 (31.9%) |
| $150,000 or more | 1,591 (42.0%) | 471 (38.1%) |
| Total | 3,790 (100.0%) | 1,237 (100.0%) |
Monthly Housing Cost Tiers in Ocean Pointe
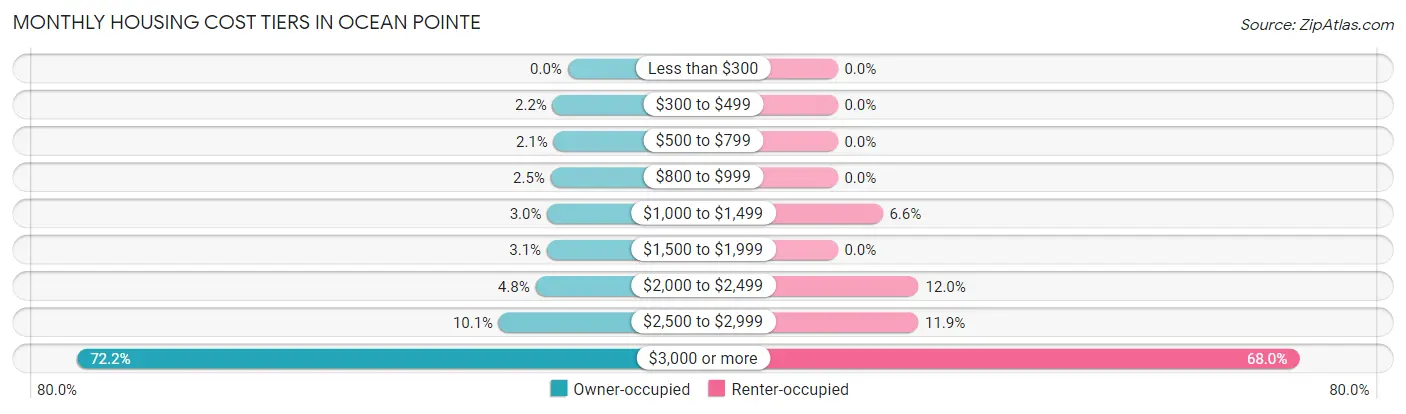
| Monthly Cost | Owner-occupied | Renter-occupied |
| Less than $300 | 0 (0.0%) | 0 (0.0%) |
| $300 to $499 | 84 (2.2%) | 0 (0.0%) |
| $500 to $799 | 79 (2.1%) | 0 (0.0%) |
| $800 to $999 | 95 (2.5%) | 0 (0.0%) |
| $1,000 to $1,499 | 114 (3.0%) | 82 (6.6%) |
| $1,500 to $1,999 | 116 (3.1%) | 0 (0.0%) |
| $2,000 to $2,499 | 180 (4.8%) | 148 (12.0%) |
| $2,500 to $2,999 | 384 (10.1%) | 147 (11.9%) |
| $3,000 or more | 2,738 (72.2%) | 841 (68.0%) |
| Total | 3,790 (100.0%) | 1,237 (100.0%) |
Physical Housing Characteristics in Ocean Pointe
Housing Structures in Ocean Pointe
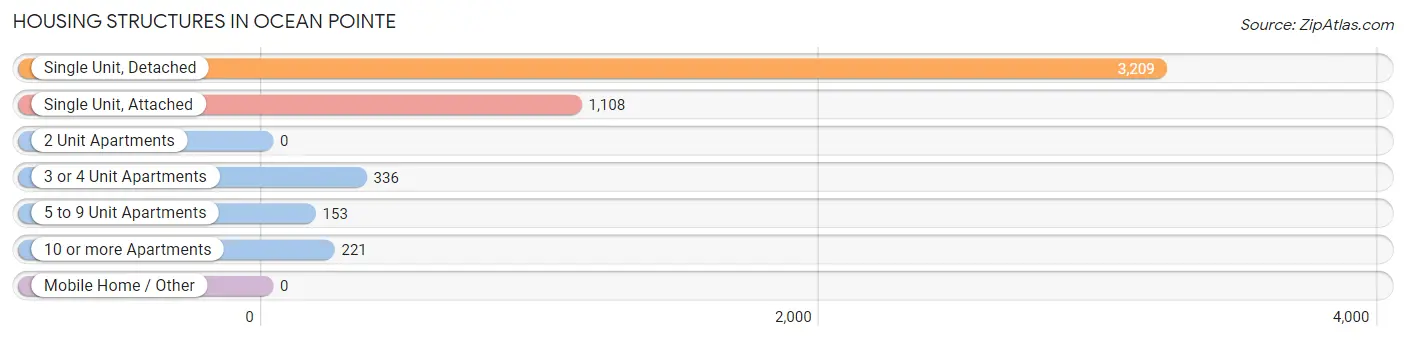
| Structure Type | # Housing Units | % Housing Units |
| Single Unit, Detached | 3,209 | 63.8% |
| Single Unit, Attached | 1,108 | 22.0% |
| 2 Unit Apartments | 0 | 0.0% |
| 3 or 4 Unit Apartments | 336 | 6.7% |
| 5 to 9 Unit Apartments | 153 | 3.0% |
| 10 or more Apartments | 221 | 4.4% |
| Mobile Home / Other | 0 | 0.0% |
| Total | 5,027 | 100.0% |
Housing Structures by Occupancy in Ocean Pointe
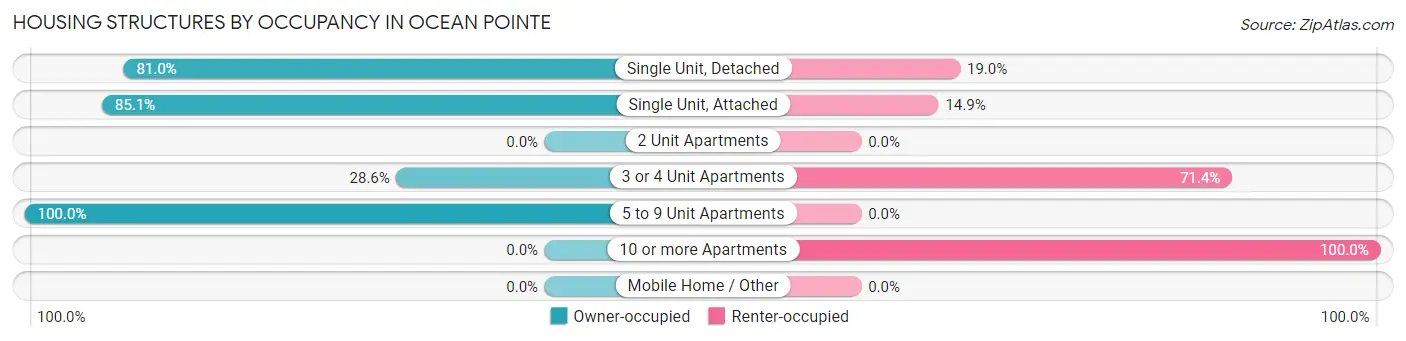
| Structure Type | Owner-occupied | Renter-occupied |
| Single Unit, Detached | 2,598 (81.0%) | 611 (19.0%) |
| Single Unit, Attached | 943 (85.1%) | 165 (14.9%) |
| 2 Unit Apartments | 0 (0.0%) | 0 (0.0%) |
| 3 or 4 Unit Apartments | 96 (28.6%) | 240 (71.4%) |
| 5 to 9 Unit Apartments | 153 (100.0%) | 0 (0.0%) |
| 10 or more Apartments | 0 (0.0%) | 221 (100.0%) |
| Mobile Home / Other | 0 (0.0%) | 0 (0.0%) |
| Total | 3,790 (75.4%) | 1,237 (24.6%) |
Housing Structures by Number of Rooms in Ocean Pointe
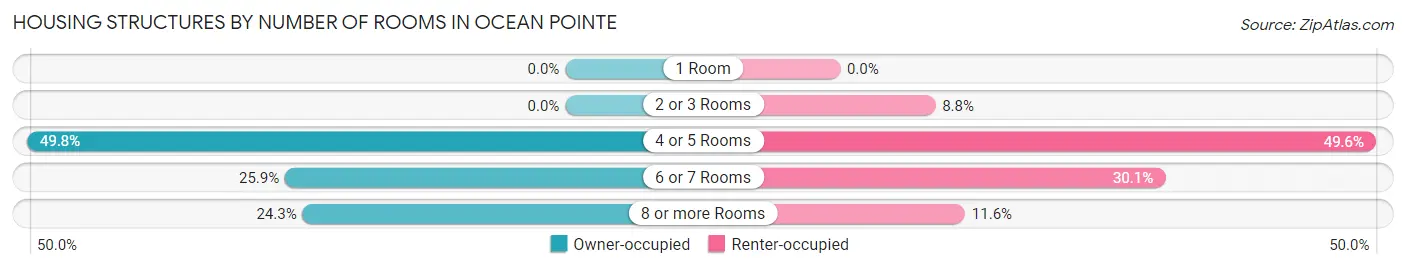
| Number of Rooms | Owner-occupied | Renter-occupied |
| 1 Room | 0 (0.0%) | 0 (0.0%) |
| 2 or 3 Rooms | 0 (0.0%) | 109 (8.8%) |
| 4 or 5 Rooms | 1,887 (49.8%) | 613 (49.6%) |
| 6 or 7 Rooms | 982 (25.9%) | 372 (30.1%) |
| 8 or more Rooms | 921 (24.3%) | 143 (11.6%) |
| Total | 3,790 (100.0%) | 1,237 (100.0%) |
Housing Structure by Heating Type in Ocean Pointe
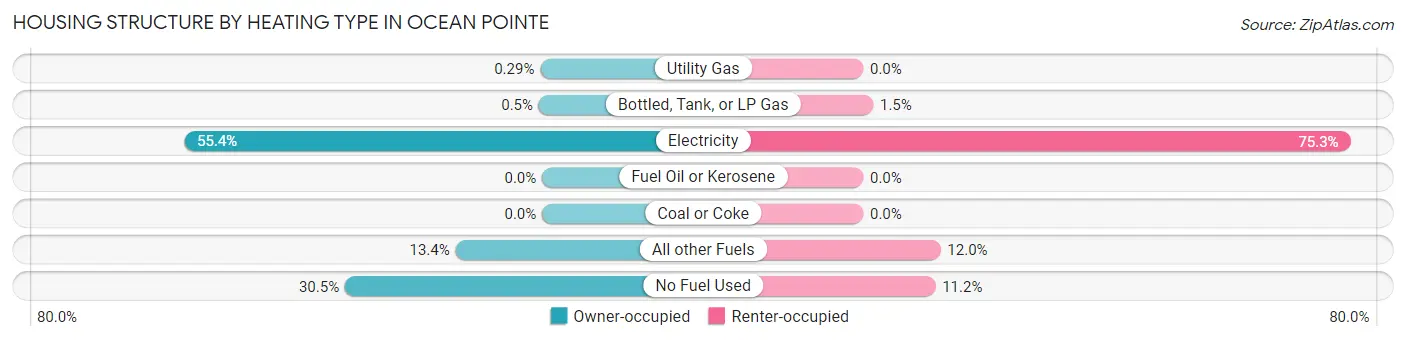
| Heating Type | Owner-occupied | Renter-occupied |
| Utility Gas | 11 (0.3%) | 0 (0.0%) |
| Bottled, Tank, or LP Gas | 19 (0.5%) | 19 (1.5%) |
| Electricity | 2,098 (55.4%) | 932 (75.3%) |
| Fuel Oil or Kerosene | 0 (0.0%) | 0 (0.0%) |
| Coal or Coke | 0 (0.0%) | 0 (0.0%) |
| All other Fuels | 507 (13.4%) | 148 (12.0%) |
| No Fuel Used | 1,155 (30.5%) | 138 (11.2%) |
| Total | 3,790 (100.0%) | 1,237 (100.0%) |
Household Vehicle Usage in Ocean Pointe
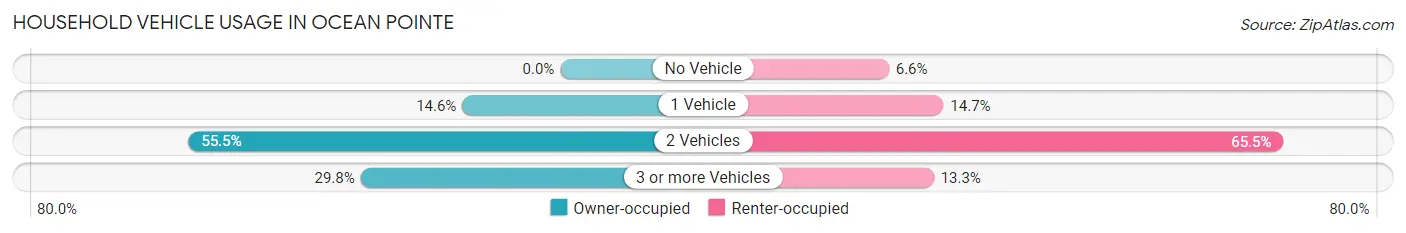
| Vehicles per Household | Owner-occupied | Renter-occupied |
| No Vehicle | 0 (0.0%) | 81 (6.6%) |
| 1 Vehicle | 555 (14.6%) | 182 (14.7%) |
| 2 Vehicles | 2,105 (55.5%) | 810 (65.5%) |
| 3 or more Vehicles | 1,130 (29.8%) | 164 (13.3%) |
| Total | 3,790 (100.0%) | 1,237 (100.0%) |
Real Estate & Mortgages in Ocean Pointe
Real Estate and Mortgage Overview in Ocean Pointe
| Characteristic | Without Mortgage | With Mortgage |
| Housing Units | 324 | 3,466 |
| Median Property Value | $704,500 | $808,800 |
| Median Household Income | $100,625 | $1,502 |
| Monthly Housing Costs | $788 | $2,738 |
| Real Estate Taxes | $1,669 | $176 |
Property Value by Mortgage Status in Ocean Pointe
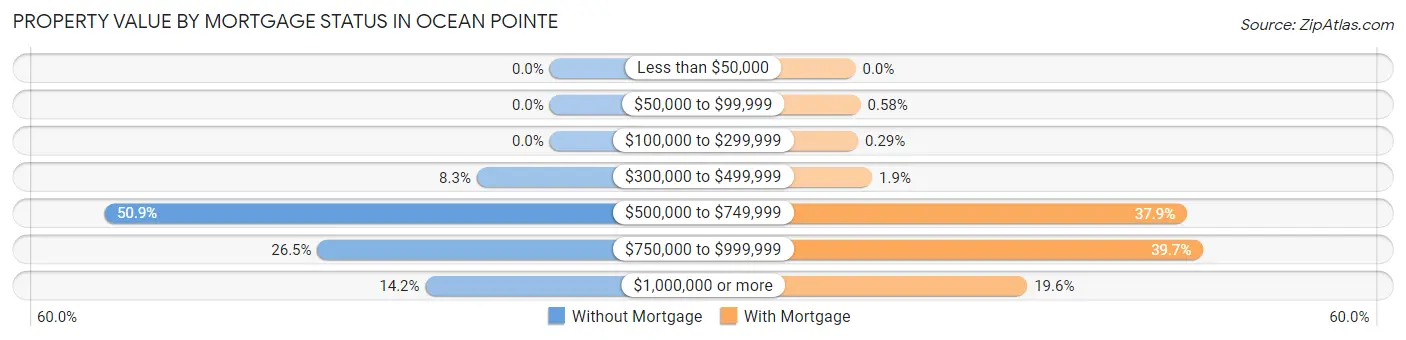
| Property Value | Without Mortgage | With Mortgage |
| Less than $50,000 | 0 (0.0%) | 0 (0.0%) |
| $50,000 to $99,999 | 0 (0.0%) | 20 (0.6%) |
| $100,000 to $299,999 | 0 (0.0%) | 10 (0.3%) |
| $300,000 to $499,999 | 27 (8.3%) | 66 (1.9%) |
| $500,000 to $749,999 | 165 (50.9%) | 1,313 (37.9%) |
| $750,000 to $999,999 | 86 (26.5%) | 1,377 (39.7%) |
| $1,000,000 or more | 46 (14.2%) | 680 (19.6%) |
| Total | 324 (100.0%) | 3,466 (100.0%) |
Household Income by Mortgage Status in Ocean Pointe
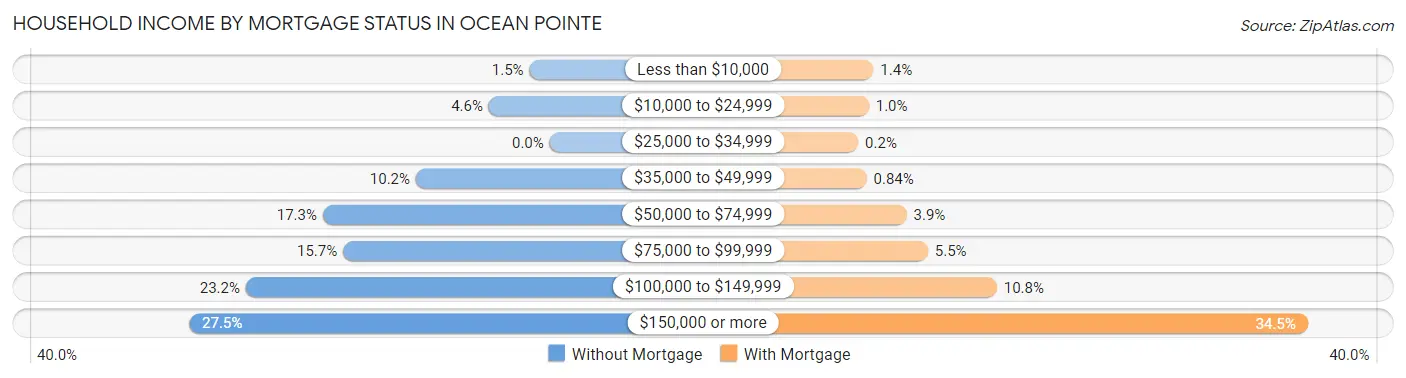
| Household Income | Without Mortgage | With Mortgage |
| Less than $10,000 | 5 (1.5%) | 47 (1.4%) |
| $10,000 to $24,999 | 15 (4.6%) | 35 (1.0%) |
| $25,000 to $34,999 | 0 (0.0%) | 7 (0.2%) |
| $35,000 to $49,999 | 33 (10.2%) | 29 (0.8%) |
| $50,000 to $74,999 | 56 (17.3%) | 135 (3.9%) |
| $75,000 to $99,999 | 51 (15.7%) | 191 (5.5%) |
| $100,000 to $149,999 | 75 (23.2%) | 373 (10.8%) |
| $150,000 or more | 89 (27.5%) | 1,194 (34.4%) |
| Total | 324 (100.0%) | 3,466 (100.0%) |
Property Value to Household Income Ratio in Ocean Pointe
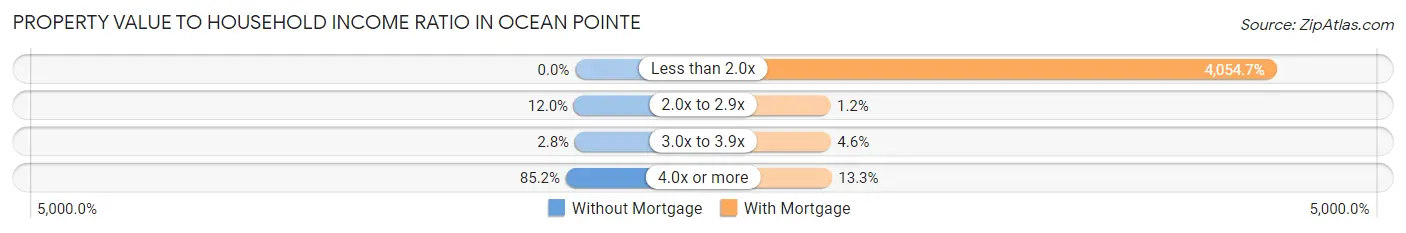
| Value-to-Income Ratio | Without Mortgage | With Mortgage |
| Less than 2.0x | 0 (0.0%) | 140,536 (4,054.7%) |
| 2.0x to 2.9x | 39 (12.0%) | 40 (1.1%) |
| 3.0x to 3.9x | 9 (2.8%) | 158 (4.6%) |
| 4.0x or more | 276 (85.2%) | 461 (13.3%) |
| Total | 324 (100.0%) | 3,466 (100.0%) |
Real Estate Taxes by Mortgage Status in Ocean Pointe
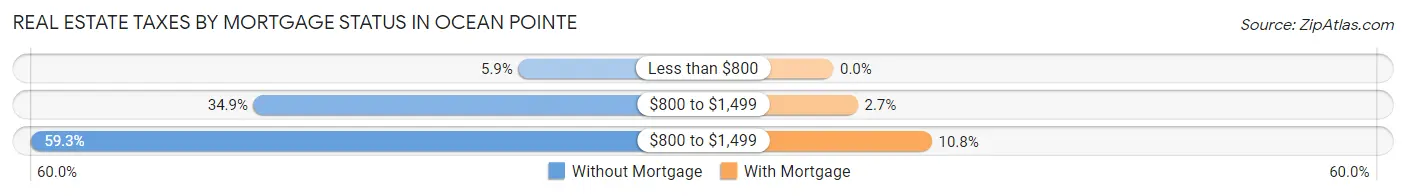
| Property Taxes | Without Mortgage | With Mortgage |
| Less than $800 | 19 (5.9%) | 0 (0.0%) |
| $800 to $1,499 | 113 (34.9%) | 93 (2.7%) |
| $800 to $1,499 | 192 (59.3%) | 374 (10.8%) |
| Total | 324 (100.0%) | 3,466 (100.0%) |
Health & Disability in Ocean Pointe
Health Insurance Coverage by Age in Ocean Pointe
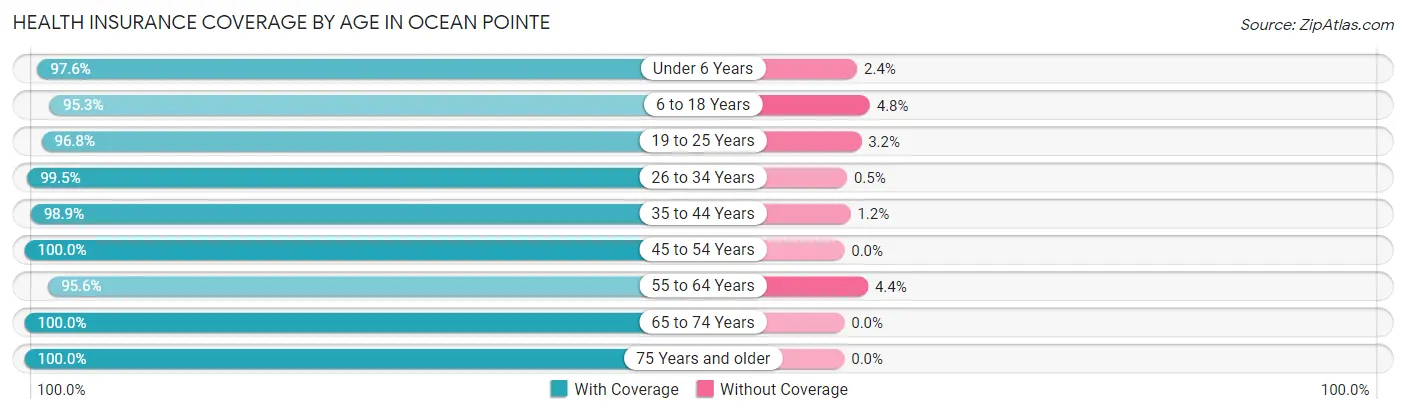
| Age Bracket | With Coverage | Without Coverage |
| Under 6 Years | 1,717 (97.6%) | 42 (2.4%) |
| 6 to 18 Years | 3,387 (95.3%) | 169 (4.8%) |
| 19 to 25 Years | 798 (96.8%) | 26 (3.2%) |
| 26 to 34 Years | 1,982 (99.5%) | 10 (0.5%) |
| 35 to 44 Years | 2,586 (98.9%) | 30 (1.1%) |
| 45 to 54 Years | 1,633 (100.0%) | 0 (0.0%) |
| 55 to 64 Years | 1,279 (95.6%) | 59 (4.4%) |
| 65 to 74 Years | 683 (100.0%) | 0 (0.0%) |
| 75 Years and older | 371 (100.0%) | 0 (0.0%) |
| Total | 14,436 (97.7%) | 336 (2.3%) |
Health Insurance Coverage by Citizenship Status in Ocean Pointe
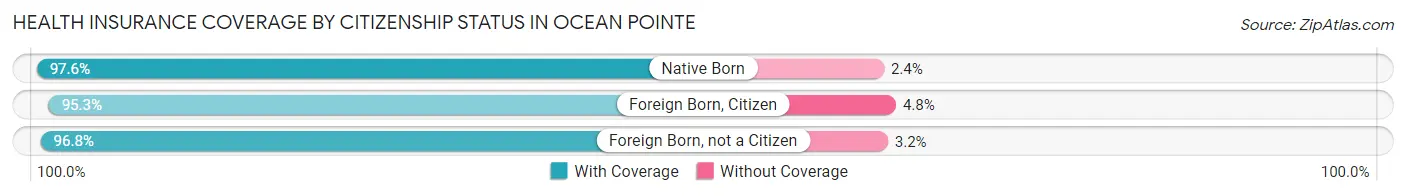
| Citizenship Status | With Coverage | Without Coverage |
| Native Born | 1,717 (97.6%) | 42 (2.4%) |
| Foreign Born, Citizen | 3,387 (95.3%) | 169 (4.8%) |
| Foreign Born, not a Citizen | 798 (96.8%) | 26 (3.2%) |
Health Insurance Coverage by Household Income in Ocean Pointe
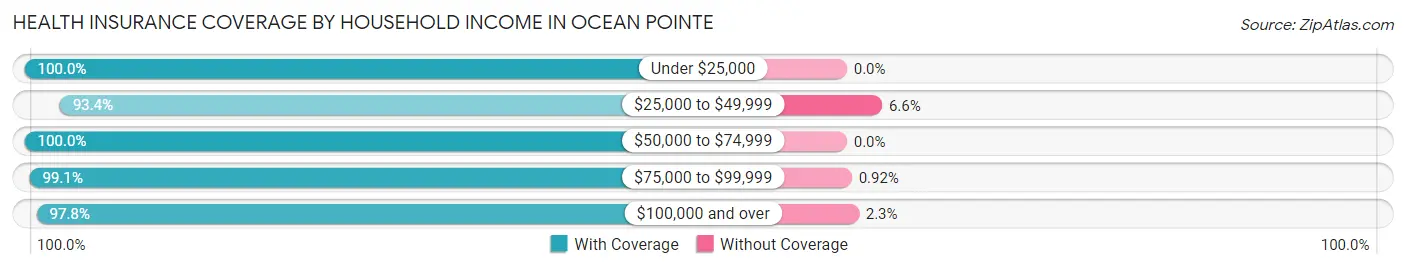
| Household Income | With Coverage | Without Coverage |
| Under $25,000 | 165 (100.0%) | 0 (0.0%) |
| $25,000 to $49,999 | 836 (93.4%) | 59 (6.6%) |
| $50,000 to $74,999 | 763 (100.0%) | 0 (0.0%) |
| $75,000 to $99,999 | 1,077 (99.1%) | 10 (0.9%) |
| $100,000 and over | 11,594 (97.8%) | 267 (2.2%) |
Public vs Private Health Insurance Coverage by Age in Ocean Pointe
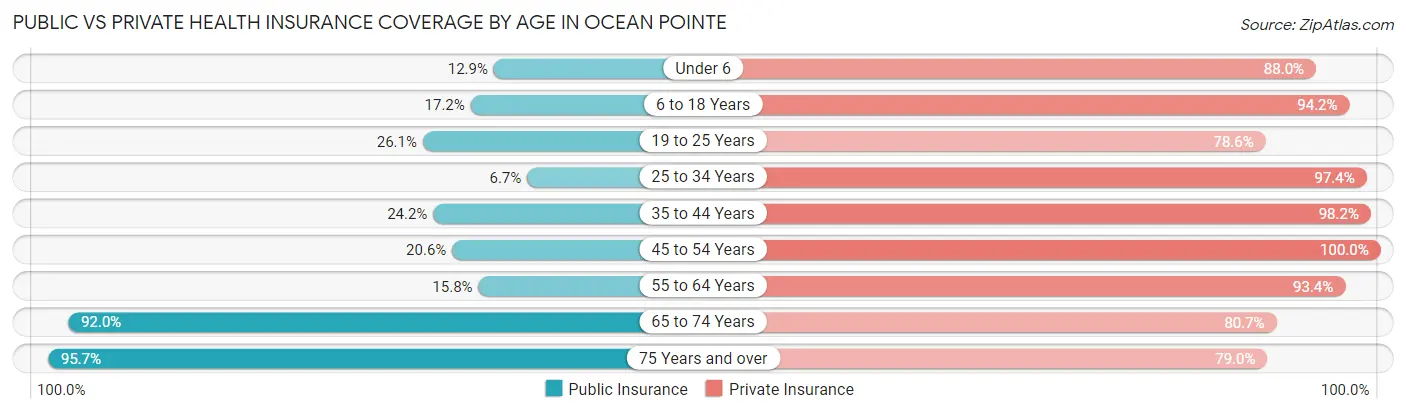
| Age Bracket | Public Insurance | Private Insurance |
| Under 6 | 227 (12.9%) | 1,548 (88.0%) |
| 6 to 18 Years | 612 (17.2%) | 3,350 (94.2%) |
| 19 to 25 Years | 215 (26.1%) | 648 (78.6%) |
| 25 to 34 Years | 134 (6.7%) | 1,940 (97.4%) |
| 35 to 44 Years | 632 (24.2%) | 2,568 (98.2%) |
| 45 to 54 Years | 337 (20.6%) | 1,633 (100.0%) |
| 55 to 64 Years | 211 (15.8%) | 1,250 (93.4%) |
| 65 to 74 Years | 628 (91.9%) | 551 (80.7%) |
| 75 Years and over | 355 (95.7%) | 293 (79.0%) |
| Total | 3,351 (22.7%) | 13,781 (93.3%) |
Disability Status by Sex by Age in Ocean Pointe
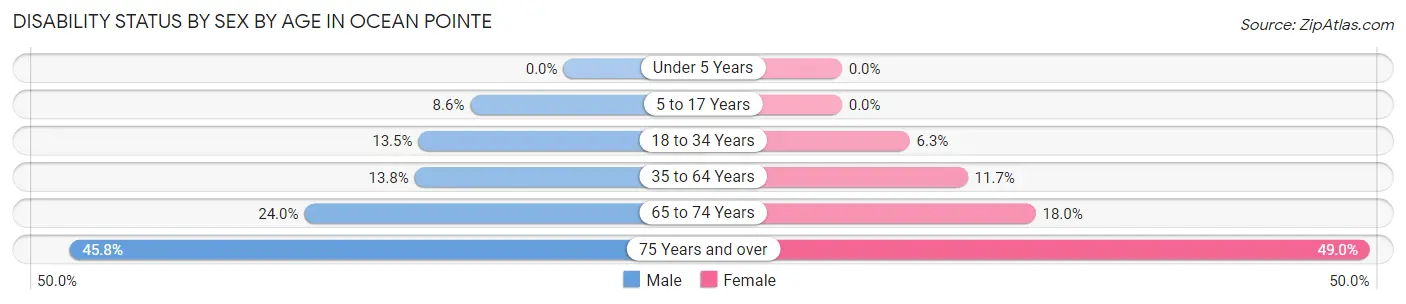
| Age Bracket | Male | Female |
| Under 5 Years | 0 (0.0%) | 0 (0.0%) |
| 5 to 17 Years | 180 (8.6%) | 0 (0.0%) |
| 18 to 34 Years | 192 (13.5%) | 97 (6.3%) |
| 35 to 64 Years | 359 (13.8%) | 349 (11.7%) |
| 65 to 74 Years | 88 (24.0%) | 57 (18.0%) |
| 75 Years and over | 55 (45.8%) | 123 (49.0%) |
Disability Class by Sex by Age in Ocean Pointe
Disability Class: Hearing Difficulty
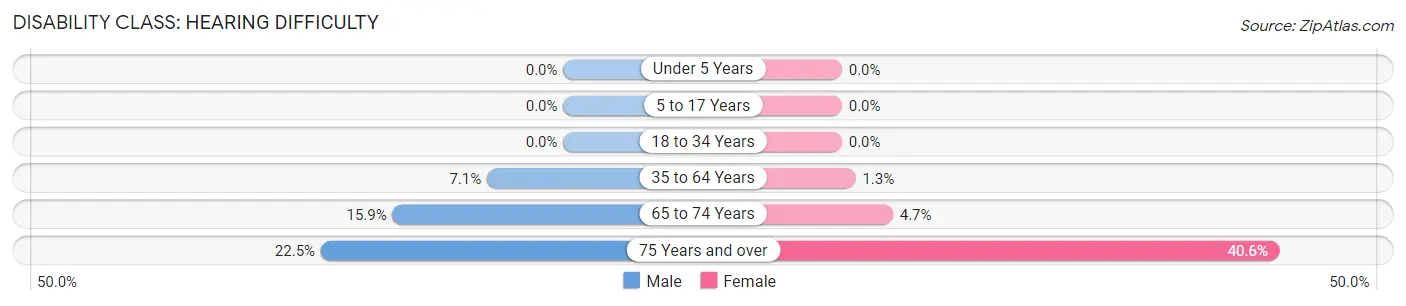
| Age Bracket | Male | Female |
| Under 5 Years | 0 (0.0%) | 0 (0.0%) |
| 5 to 17 Years | 0 (0.0%) | 0 (0.0%) |
| 18 to 34 Years | 0 (0.0%) | 0 (0.0%) |
| 35 to 64 Years | 184 (7.1%) | 38 (1.3%) |
| 65 to 74 Years | 58 (15.9%) | 15 (4.7%) |
| 75 Years and over | 27 (22.5%) | 102 (40.6%) |
Disability Class: Vision Difficulty
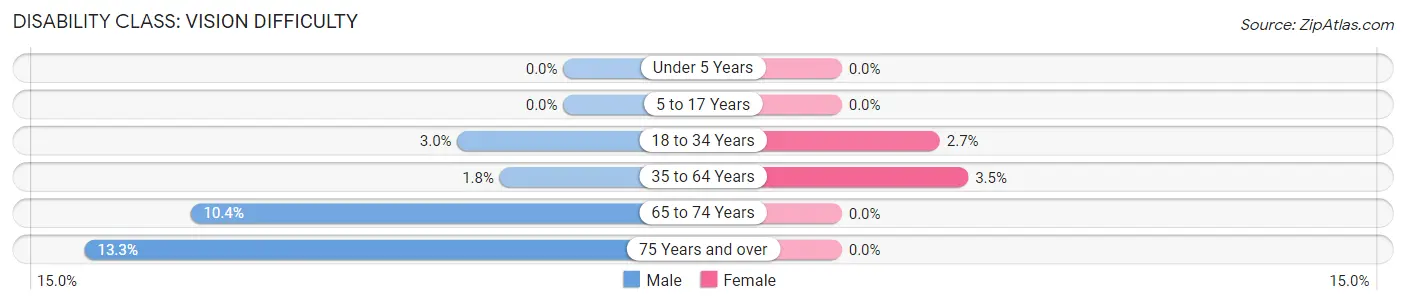
| Age Bracket | Male | Female |
| Under 5 Years | 0 (0.0%) | 0 (0.0%) |
| 5 to 17 Years | 0 (0.0%) | 0 (0.0%) |
| 18 to 34 Years | 42 (2.9%) | 42 (2.7%) |
| 35 to 64 Years | 46 (1.8%) | 105 (3.5%) |
| 65 to 74 Years | 38 (10.4%) | 0 (0.0%) |
| 75 Years and over | 16 (13.3%) | 0 (0.0%) |
Disability Class: Cognitive Difficulty
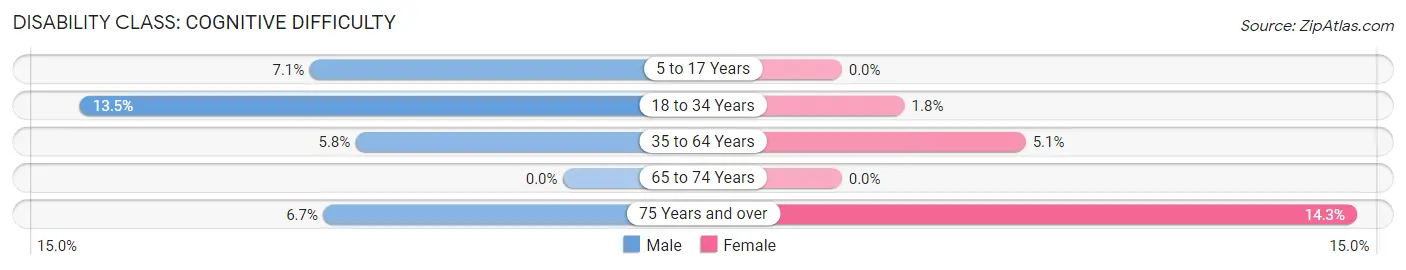
| Age Bracket | Male | Female |
| 5 to 17 Years | 147 (7.0%) | 0 (0.0%) |
| 18 to 34 Years | 192 (13.5%) | 27 (1.8%) |
| 35 to 64 Years | 150 (5.8%) | 153 (5.1%) |
| 65 to 74 Years | 0 (0.0%) | 0 (0.0%) |
| 75 Years and over | 8 (6.7%) | 36 (14.3%) |
Disability Class: Ambulatory Difficulty
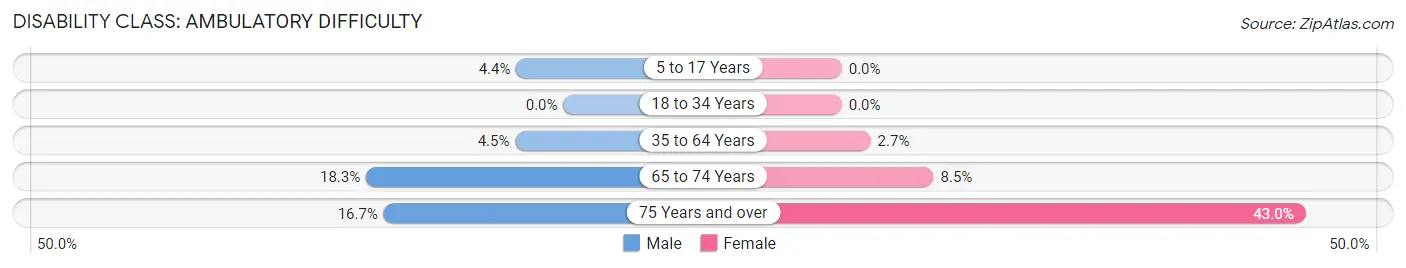
| Age Bracket | Male | Female |
| 5 to 17 Years | 91 (4.4%) | 0 (0.0%) |
| 18 to 34 Years | 0 (0.0%) | 0 (0.0%) |
| 35 to 64 Years | 116 (4.5%) | 80 (2.7%) |
| 65 to 74 Years | 67 (18.3%) | 27 (8.5%) |
| 75 Years and over | 20 (16.7%) | 108 (43.0%) |
Disability Class: Self-Care Difficulty
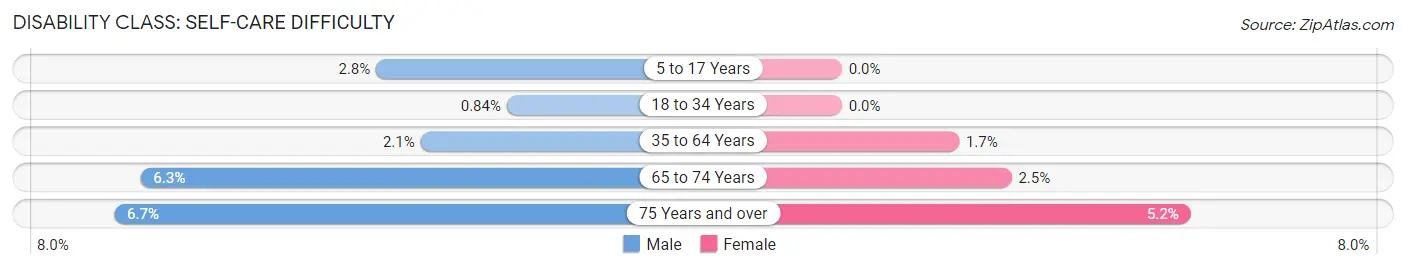
| Age Bracket | Male | Female |
| 5 to 17 Years | 58 (2.8%) | 0 (0.0%) |
| 18 to 34 Years | 12 (0.8%) | 0 (0.0%) |
| 35 to 64 Years | 55 (2.1%) | 52 (1.7%) |
| 65 to 74 Years | 23 (6.3%) | 8 (2.5%) |
| 75 Years and over | 8 (6.7%) | 13 (5.2%) |
Technology Access in Ocean Pointe
Computing Device Access in Ocean Pointe
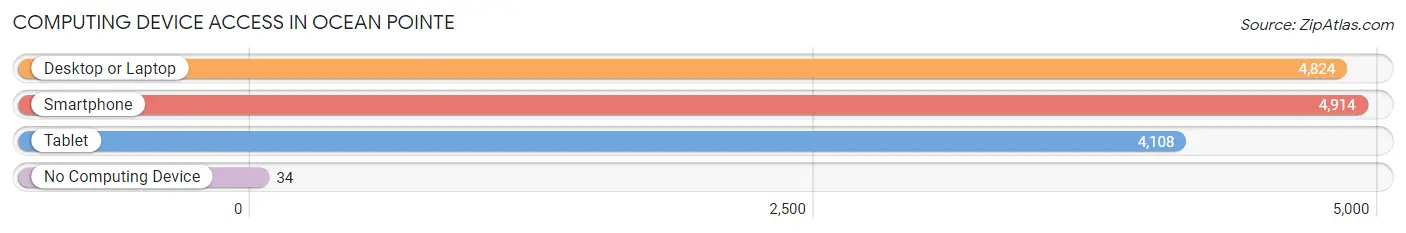
| Device Type | # Households | % Households |
| Desktop or Laptop | 4,824 | 96.0% |
| Smartphone | 4,914 | 97.8% |
| Tablet | 4,108 | 81.7% |
| No Computing Device | 34 | 0.7% |
| Total | 5,027 | 100.0% |
Internet Access in Ocean Pointe
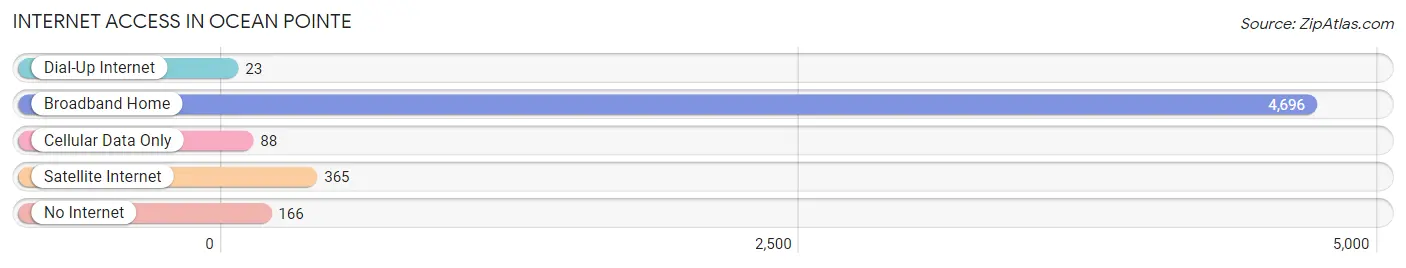
| Internet Type | # Households | % Households |
| Dial-Up Internet | 23 | 0.5% |
| Broadband Home | 4,696 | 93.4% |
| Cellular Data Only | 88 | 1.8% |
| Satellite Internet | 365 | 7.3% |
| No Internet | 166 | 3.3% |
| Total | 5,027 | 100.0% |
Ocean Pointe Summary
Pointe, HI is a small unincorporated community located on the island of Oahu in the state of Hawaii. It is located in the Waianae District of Honolulu County and is part of the Ewa Beach-Ocean Pointe-Ewa Villages census-designated place. The population of Ocean Pointe was 2,845 at the 2010 census.
History
The area now known as Ocean Pointe was originally part of the ahupuaa of Waianae, which was part of the larger moku of Waialua. The ahupuaa was divided into several smaller ahupuaa, including the ahupuaa of Kahekili, which included the area now known as Ocean Pointe. The ahupuaa was home to several Hawaiian settlements, including the settlement of Kahekili, which was located near the present-day intersection of Farrington Highway and Fort Weaver Road.
In the late 19th century, the area was developed by the Ewa Plantation Company, which was owned by the Castle & Cooke Corporation. The company developed the area for sugar cane production and built a railroad line to transport the sugar cane to Honolulu. The area was also home to a number of small fishing villages, including the village of Kahekili.
In the early 20th century, the area was developed for residential use. The area was annexed by the City and County of Honolulu in 1959 and was subsequently developed into a residential neighborhood.
Geography
Ocean Pointe is located on the western side of the island of Oahu, approximately 20 miles (32 km) west of Honolulu. The community is bordered to the north by the Ewa Beach-Ocean Pointe-Ewa Villages census-designated place, to the east by the Waianae District, to the south by the Makaha Valley, and to the west by the Pacific Ocean.
The community is located at an elevation of approximately 20 feet (6 m) above sea level. The terrain is generally flat, with some rolling hills. The climate is tropical, with temperatures ranging from an average low of 68°F (20°C) in the winter to an average high of 85°F (29°C) in the summer.
Economy
The economy of Ocean Pointe is largely based on tourism and service industries. The area is home to several hotels and resorts, as well as a number of restaurants and retail stores. The area is also home to a number of small businesses, including auto repair shops, beauty salons, and medical offices.
Demographics
As of the 2010 census, there were 2,845 people, 890 households, and 690 families residing in the community. The population density was 2,845 people per square mile (1,098/km2). The racial makeup of the community was 44.3% White, 8.2% African American, 0.7% Native American, 22.2% Asian, 0.2% Pacific Islander, 19.2% from other races, and 5.2% from two or more races. Hispanic or Latino of any race were 28.3% of the population.
The median income for a household in the community was $50,938, and the median income for a family was $58,938. Males had a median income of $37,938 versus $30,938 for females. The per capita income for the community was $20,938. About 8.2% of families and 10.2% of the population were below the poverty line, including 14.2% of those under age 18 and 6.2% of those age 65 or over.
Common Questions
What is Per Capita Income in Ocean Pointe?
Per Capita income in Ocean Pointe is $46,493.
What is the Median Family Income in Ocean Pointe?
Median Family Income in Ocean Pointe is $136,382.
What is the Median Household income in Ocean Pointe?
Median Household Income in Ocean Pointe is $136,540.
What is Income or Wage Gap in Ocean Pointe?
Income or Wage Gap in Ocean Pointe is 35.0%.
Women in Ocean Pointe earn 65.0 cents for every dollar earned by a man.
What is Inequality or Gini Index in Ocean Pointe?
Inequality or Gini Index in Ocean Pointe is 0.29.
What is the Total Population of Ocean Pointe?
Total Population of Ocean Pointe is 16,173.
What is the Total Male Population of Ocean Pointe?
Total Male Population of Ocean Pointe is 8,340.
What is the Total Female Population of Ocean Pointe?
Total Female Population of Ocean Pointe is 7,833.
What is the Ratio of Males per 100 Females in Ocean Pointe?
There are 106.47 Males per 100 Females in Ocean Pointe.
What is the Ratio of Females per 100 Males in Ocean Pointe?
There are 93.92 Females per 100 Males in Ocean Pointe.
What is the Median Population Age in Ocean Pointe?
Median Population Age in Ocean Pointe is 31.9 Years.
What is the Average Family Size in Ocean Pointe
Average Family Size in Ocean Pointe is 3.4 People.
What is the Average Household Size in Ocean Pointe
Average Household Size in Ocean Pointe is 3.2 People.
How Large is the Labor Force in Ocean Pointe?
There are 8,608 People in the Labor Forcein in Ocean Pointe.
What is the Percentage of People in the Labor Force in Ocean Pointe?
75.6% of People are in the Labor Force in Ocean Pointe.
What is the Unemployment Rate in Ocean Pointe?
Unemployment Rate in Ocean Pointe is 2.9%.