Ahuimanu, HI Map & Demographics
Ahuimanu Map
Ahuimanu Overview
$47,828
PER CAPITA INCOME
$143,829
AVG FAMILY INCOME
$124,018
AVG HOUSEHOLD INCOME
15.2%
WAGE / INCOME GAP [ % ]
84.8¢/ $1
WAGE / INCOME GAP [ $ ]
0.35
INEQUALITY / GINI INDEX
9,177
TOTAL POPULATION
4,431
MALE POPULATION
4,746
FEMALE POPULATION
93.36
MALES / 100 FEMALES
107.11
FEMALES / 100 MALES
38.9
MEDIAN AGE
3.4
AVG FAMILY SIZE
3.1
AVG HOUSEHOLD SIZE
4,715
LABOR FORCE [ PEOPLE ]
67.9%
PERCENT IN LABOR FORCE
1.9%
UNEMPLOYMENT RATE
Income in Ahuimanu
Income Overview in Ahuimanu
Per Capita Income in Ahuimanu is $47,828, while median incomes of families and households are $143,829 and $124,018 respectively.
| Characteristic | Number | Measure |
| Per Capita Income | 9,177 | $47,828 |
| Median Family Income | 2,342 | $143,829 |
| Mean Family Income | 2,342 | $154,599 |
| Median Household Income | 2,966 | $124,018 |
| Mean Household Income | 2,966 | $145,933 |
| Income Deficit | 2,342 | $0 |
| Wage / Income Gap (%) | 9,177 | 15.17% |
| Wage / Income Gap ($) | 9,177 | 84.83¢ per $1 |
| Gini / Inequality Index | 9,177 | 0.35 |
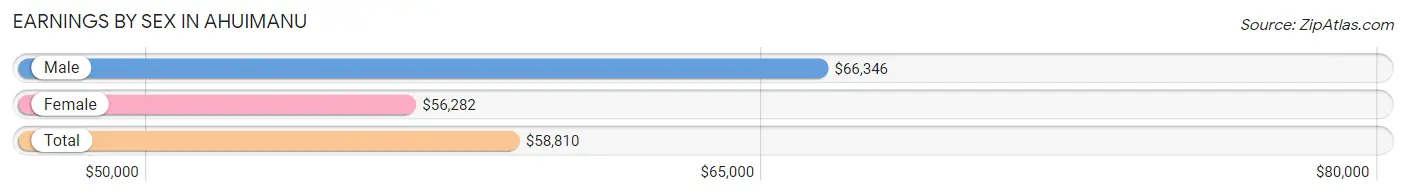
Earnings by Sex in Ahuimanu
Average Earnings in Ahuimanu are $58,810, $66,346 for men and $56,282 for women, a difference of 15.2%.
| Sex | Number | Average Earnings |
| Male | 2,392 (48.7%) | $66,346 |
| Female | 2,518 (51.3%) | $56,282 |
| Total | 4,910 (100.0%) | $58,810 |
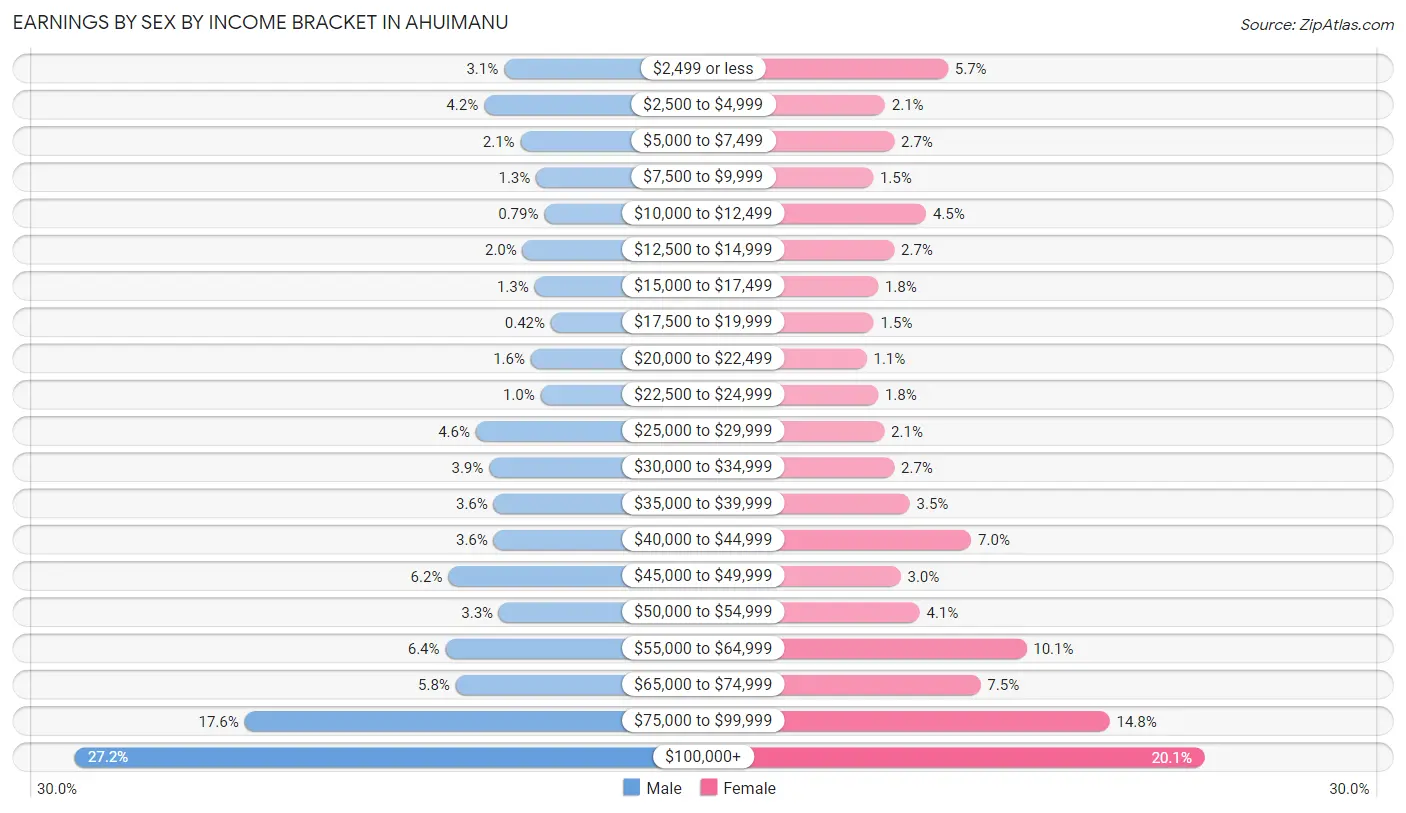
Earnings by Sex by Income Bracket in Ahuimanu
The most common earnings brackets in Ahuimanu are $100,000+ for men (650 | 27.2%) and $100,000+ for women (505 | 20.1%).
| Income | Male | Female |
| $2,499 or less | 73 (3.0%) | 143 (5.7%) |
| $2,500 to $4,999 | 100 (4.2%) | 54 (2.1%) |
| $5,000 to $7,499 | 51 (2.1%) | 67 (2.7%) |
| $7,500 to $9,999 | 30 (1.3%) | 37 (1.5%) |
| $10,000 to $12,499 | 19 (0.8%) | 112 (4.4%) |
| $12,500 to $14,999 | 48 (2.0%) | 67 (2.7%) |
| $15,000 to $17,499 | 32 (1.3%) | 44 (1.8%) |
| $17,500 to $19,999 | 10 (0.4%) | 38 (1.5%) |
| $20,000 to $22,499 | 37 (1.5%) | 28 (1.1%) |
| $22,500 to $24,999 | 24 (1.0%) | 44 (1.8%) |
| $25,000 to $29,999 | 111 (4.6%) | 53 (2.1%) |
| $30,000 to $34,999 | 93 (3.9%) | 67 (2.7%) |
| $35,000 to $39,999 | 87 (3.6%) | 89 (3.5%) |
| $40,000 to $44,999 | 87 (3.6%) | 176 (7.0%) |
| $45,000 to $49,999 | 148 (6.2%) | 76 (3.0%) |
| $50,000 to $54,999 | 80 (3.3%) | 103 (4.1%) |
| $55,000 to $64,999 | 152 (6.4%) | 254 (10.1%) |
| $65,000 to $74,999 | 138 (5.8%) | 189 (7.5%) |
| $75,000 to $99,999 | 422 (17.6%) | 372 (14.8%) |
| $100,000+ | 650 (27.2%) | 505 (20.1%) |
| Total | 2,392 (100.0%) | 2,518 (100.0%) |
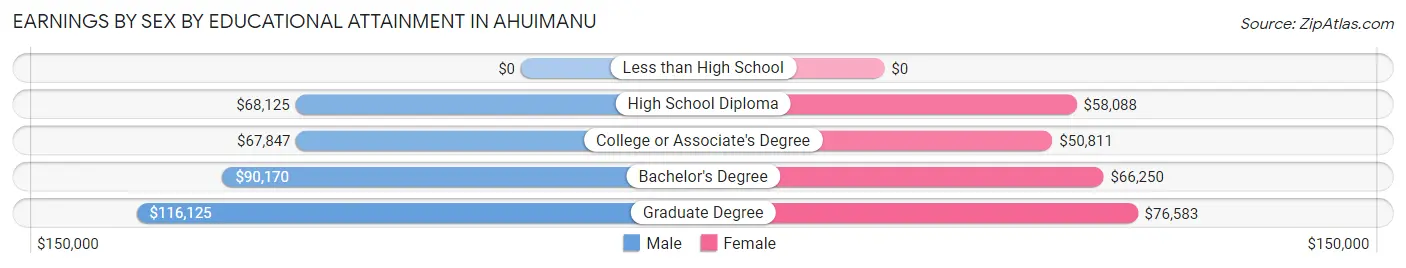
Earnings by Sex by Educational Attainment in Ahuimanu
Average earnings in Ahuimanu are $75,072 for men and $62,929 for women, a difference of 16.2%. Men with an educational attainment of graduate degree enjoy the highest average annual earnings of $116,125, while those with college or associate's degree education earn the least with $67,847. Women with an educational attainment of graduate degree earn the most with the average annual earnings of $76,583, while those with college or associate's degree education have the smallest earnings of $50,811.
| Educational Attainment | Male Income | Female Income |
| Less than High School | - | - |
| High School Diploma | $68,125 | $58,088 |
| College or Associate's Degree | $67,847 | $50,811 |
| Bachelor's Degree | $90,170 | $66,250 |
| Graduate Degree | $116,125 | $76,583 |
| Total | $75,072 | $62,929 |
Family Income in Ahuimanu
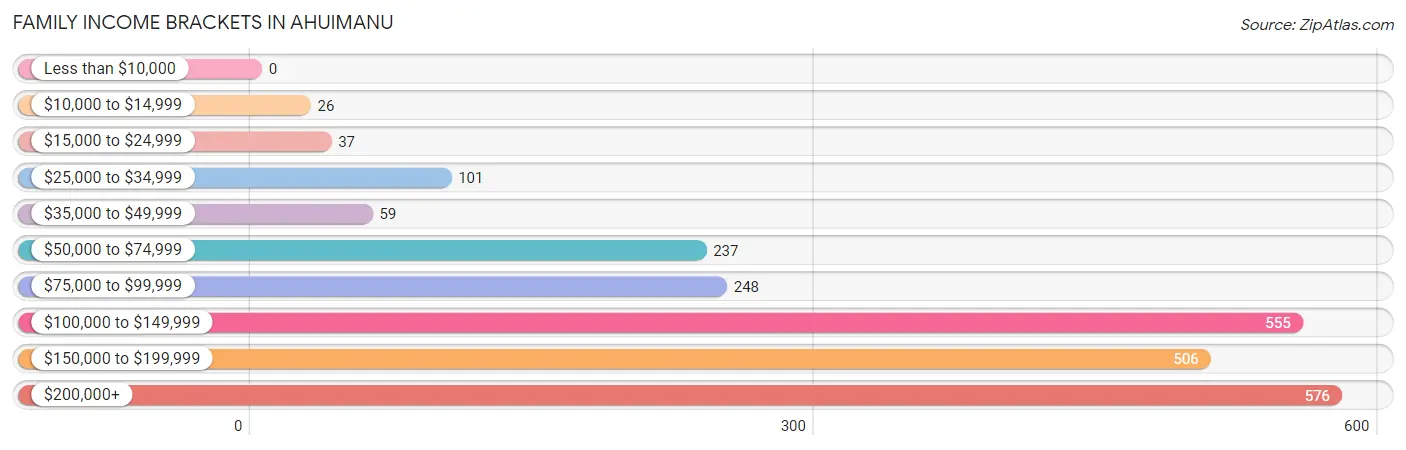
Family Income Brackets in Ahuimanu
According to the Ahuimanu family income data, there are 576 families falling into the $200,000+ income range, which is the most common income bracket and makes up 24.6% of all families.
| Income Bracket | # Families | % Families |
| Less than $10,000 | 0 | 0.0% |
| $10,000 to $14,999 | 26 | 1.1% |
| $15,000 to $24,999 | 37 | 1.6% |
| $25,000 to $34,999 | 101 | 4.3% |
| $35,000 to $49,999 | 59 | 2.5% |
| $50,000 to $74,999 | 237 | 10.1% |
| $75,000 to $99,999 | 248 | 10.6% |
| $100,000 to $149,999 | 555 | 23.7% |
| $150,000 to $199,999 | 506 | 21.6% |
| $200,000+ | 576 | 24.6% |
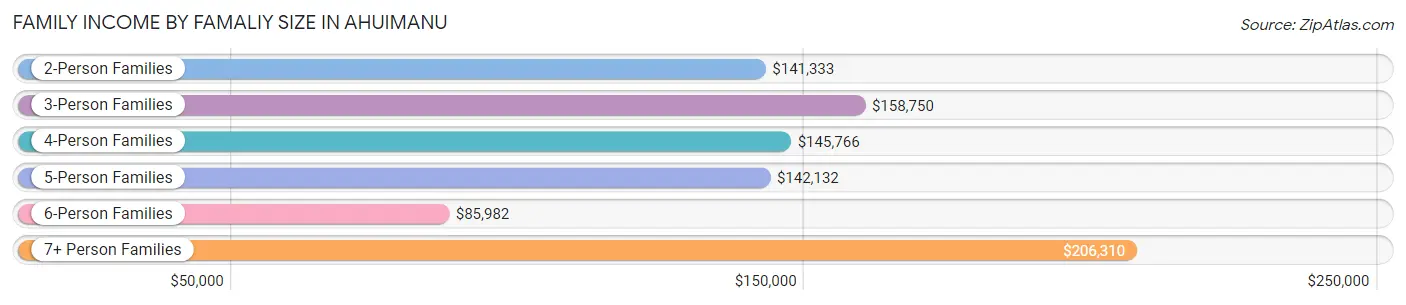
Family Income by Famaliy Size in Ahuimanu
7+ person families (46 | 2.0%) account for the highest median family income in Ahuimanu with $206,310 per family, while 2-person families (954 | 40.7%) have the highest median income of $70,666 per family member.
| Income Bracket | # Families | Median Income |
| 2-Person Families | 954 (40.7%) | $141,333 |
| 3-Person Families | 607 (25.9%) | $158,750 |
| 4-Person Families | 311 (13.3%) | $145,766 |
| 5-Person Families | 325 (13.9%) | $142,132 |
| 6-Person Families | 99 (4.2%) | $85,982 |
| 7+ Person Families | 46 (2.0%) | $206,310 |
| Total | 2,342 (100.0%) | $143,829 |
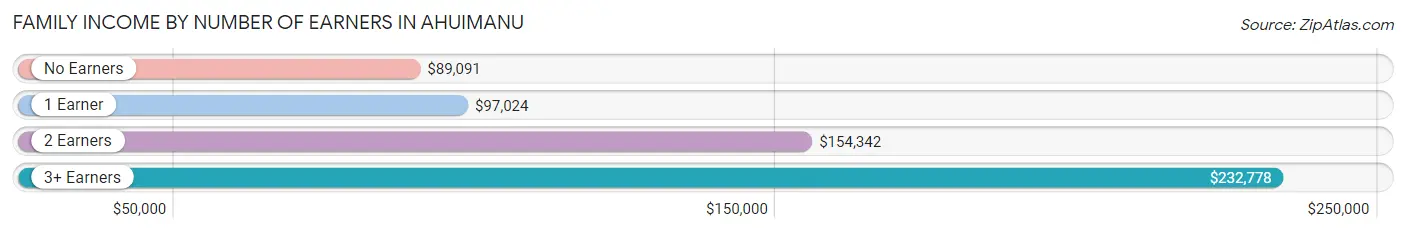
Family Income by Number of Earners in Ahuimanu
The median family income in Ahuimanu is $143,829, with families comprising 3+ earners (340) having the highest median family income of $232,778, while families with no earners (254) have the lowest median family income of $89,091, accounting for 14.5% and 10.8% of families, respectively.
| Number of Earners | # Families | Median Income |
| No Earners | 254 (10.8%) | $89,091 |
| 1 Earner | 526 (22.5%) | $97,024 |
| 2 Earners | 1,222 (52.2%) | $154,342 |
| 3+ Earners | 340 (14.5%) | $232,778 |
| Total | 2,342 (100.0%) | $143,829 |
Household Income in Ahuimanu
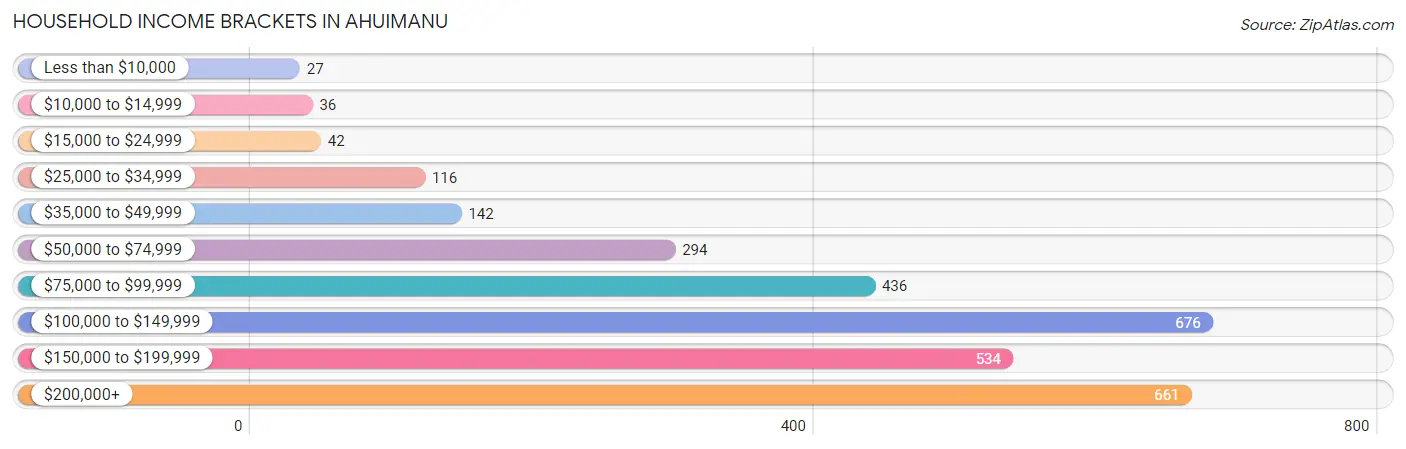
Household Income Brackets in Ahuimanu
With 676 households falling in the category, the $100,000 to $149,999 income range is the most frequent in Ahuimanu, accounting for 22.8% of all households. In contrast, only 27 households (0.9%) fall into the less than $10,000 income bracket, making it the least populous group.
| Income Bracket | # Households | % Households |
| Less than $10,000 | 27 | 0.9% |
| $10,000 to $14,999 | 36 | 1.2% |
| $15,000 to $24,999 | 42 | 1.4% |
| $25,000 to $34,999 | 116 | 3.9% |
| $35,000 to $49,999 | 142 | 4.8% |
| $50,000 to $74,999 | 294 | 9.9% |
| $75,000 to $99,999 | 436 | 14.7% |
| $100,000 to $149,999 | 676 | 22.8% |
| $150,000 to $199,999 | 534 | 18.0% |
| $200,000+ | 661 | 22.3% |
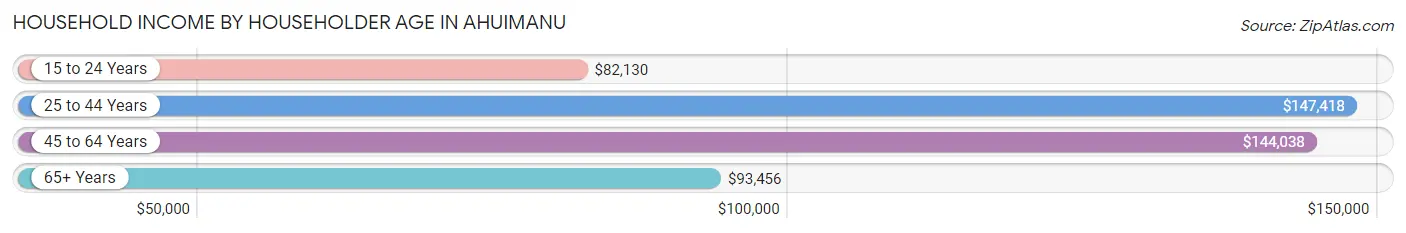
Household Income by Householder Age in Ahuimanu
The median household income in Ahuimanu is $124,018, with the highest median household income of $147,418 found in the 25 to 44 years age bracket for the primary householder. A total of 671 households (22.6%) fall into this category. Meanwhile, the 15 to 24 years age bracket for the primary householder has the lowest median household income of $82,130, with 64 households (2.2%) in this group.
| Income Bracket | # Households | Median Income |
| 15 to 24 Years | 64 (2.2%) | $82,130 |
| 25 to 44 Years | 671 (22.6%) | $147,418 |
| 45 to 64 Years | 1,070 (36.1%) | $144,038 |
| 65+ Years | 1,161 (39.1%) | $93,456 |
| Total | 2,966 (100.0%) | $124,018 |
Poverty in Ahuimanu
Income Below Poverty by Sex and Age in Ahuimanu
With 4.6% poverty level for males and 3.3% for females among the residents of Ahuimanu, 16 and 17 year old males and 18 to 24 year old females are the most vulnerable to poverty, with 36 males (30.0%) and 64 females (19.1%) in their respective age groups living below the poverty level.
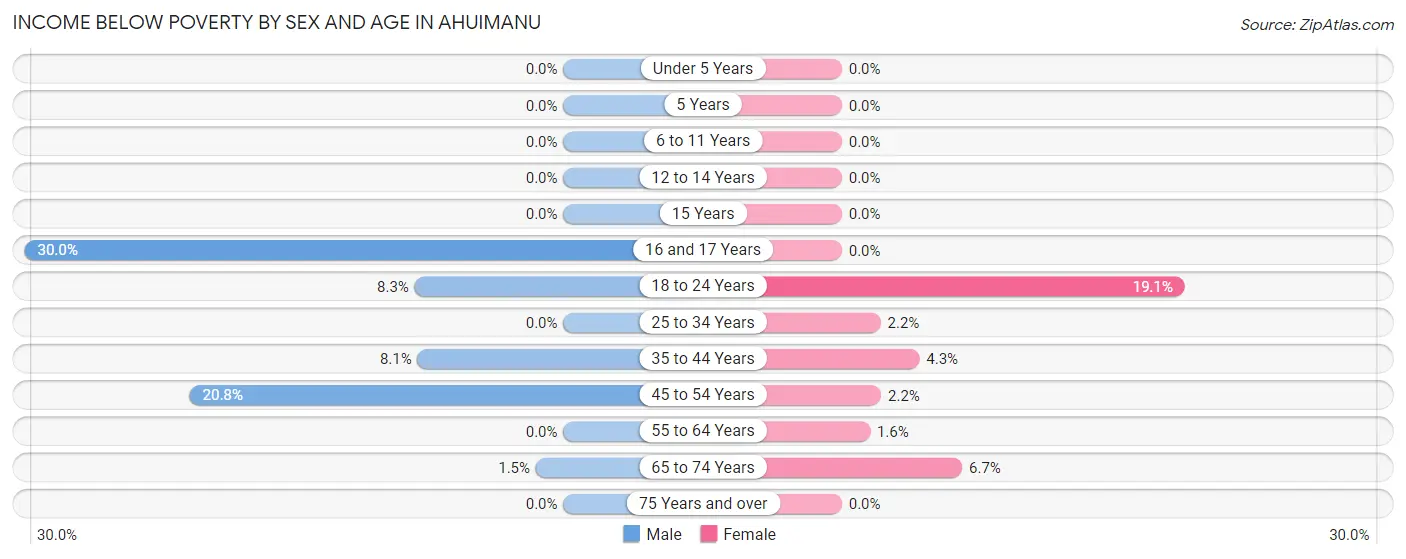
| Age Bracket | Male | Female |
| Under 5 Years | 0 (0.0%) | 0 (0.0%) |
| 5 Years | 0 (0.0%) | 0 (0.0%) |
| 6 to 11 Years | 0 (0.0%) | 0 (0.0%) |
| 12 to 14 Years | 0 (0.0%) | 0 (0.0%) |
| 15 Years | 0 (0.0%) | 0 (0.0%) |
| 16 and 17 Years | 36 (30.0%) | 0 (0.0%) |
| 18 to 24 Years | 27 (8.3%) | 64 (19.1%) |
| 25 to 34 Years | 0 (0.0%) | 12 (2.2%) |
| 35 to 44 Years | 39 (8.1%) | 18 (4.3%) |
| 45 to 54 Years | 93 (20.8%) | 11 (2.2%) |
| 55 to 64 Years | 0 (0.0%) | 10 (1.6%) |
| 65 to 74 Years | 6 (1.5%) | 38 (6.7%) |
| 75 Years and over | 0 (0.0%) | 0 (0.0%) |
| Total | 201 (4.6%) | 153 (3.3%) |
Income Above Poverty by Sex and Age in Ahuimanu
According to the poverty statistics in Ahuimanu, males aged under 5 years and females aged under 5 years are the age groups that are most secure financially, with 100.0% of males and 100.0% of females in these age groups living above the poverty line.
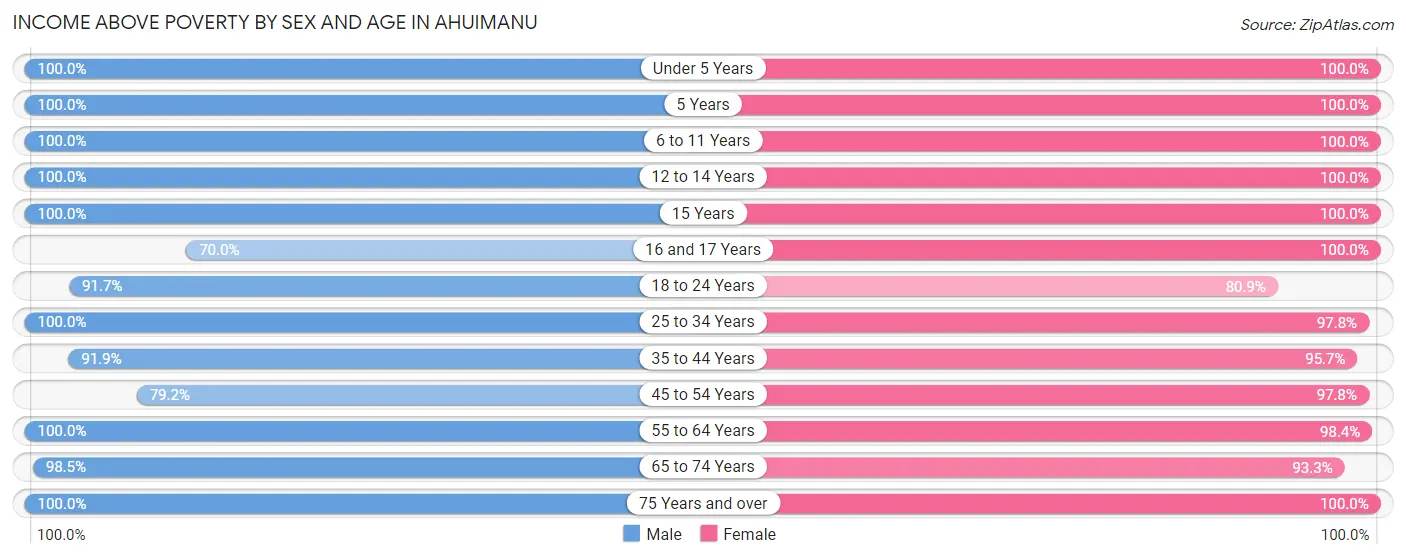
| Age Bracket | Male | Female |
| Under 5 Years | 476 (100.0%) | 357 (100.0%) |
| 5 Years | 14 (100.0%) | 62 (100.0%) |
| 6 to 11 Years | 535 (100.0%) | 339 (100.0%) |
| 12 to 14 Years | 126 (100.0%) | 156 (100.0%) |
| 15 Years | 13 (100.0%) | 51 (100.0%) |
| 16 and 17 Years | 84 (70.0%) | 128 (100.0%) |
| 18 to 24 Years | 299 (91.7%) | 271 (80.9%) |
| 25 to 34 Years | 490 (100.0%) | 543 (97.8%) |
| 35 to 44 Years | 441 (91.9%) | 399 (95.7%) |
| 45 to 54 Years | 354 (79.2%) | 492 (97.8%) |
| 55 to 64 Years | 681 (100.0%) | 626 (98.4%) |
| 65 to 74 Years | 385 (98.5%) | 529 (93.3%) |
| 75 Years and over | 277 (100.0%) | 551 (100.0%) |
| Total | 4,175 (95.4%) | 4,504 (96.7%) |
Income Below Poverty Among Married-Couple Families in Ahuimanu
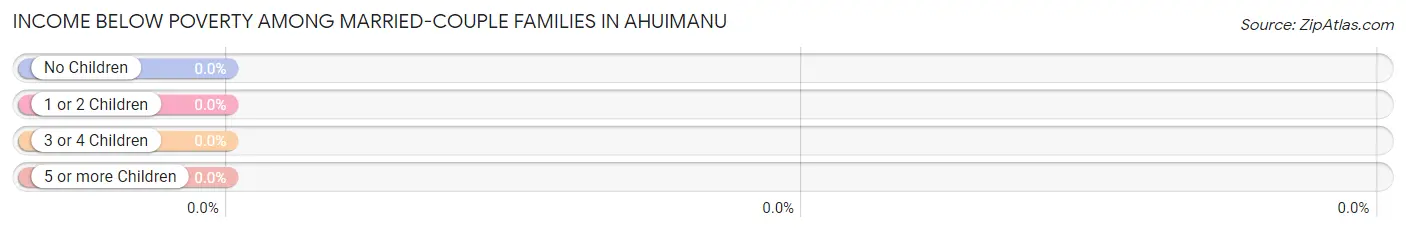
| Children | Above Poverty | Below Poverty |
| No Children | 1,097 (100.0%) | 0 (0.0%) |
| 1 or 2 Children | 400 (100.0%) | 0 (0.0%) |
| 3 or 4 Children | 209 (100.0%) | 0 (0.0%) |
| 5 or more Children | 0 (0.0%) | 0 (0.0%) |
| Total | 1,706 (100.0%) | 0 (0.0%) |
Income Below Poverty Among Single-Parent Households in Ahuimanu
According to the poverty data in Ahuimanu, 16.6% or 37 single-father households and 6.0% or 25 single-mother households are living below the poverty line. Among single-father households, those with 1 or 2 children have the highest poverty rate, with 37 households (37.8%) experiencing poverty. Likewise, among single-mother households, those with no children have the highest poverty rate, with 25 households (13.1%) falling below the poverty line.
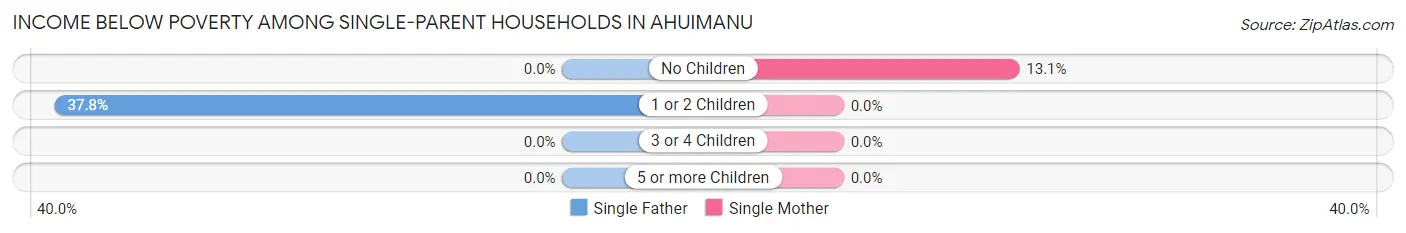
| Children | Single Father | Single Mother |
| No Children | 0 (0.0%) | 25 (13.1%) |
| 1 or 2 Children | 37 (37.8%) | 0 (0.0%) |
| 3 or 4 Children | 0 (0.0%) | 0 (0.0%) |
| 5 or more Children | 0 (0.0%) | 0 (0.0%) |
| Total | 37 (16.6%) | 25 (6.0%) |
Income Below Poverty Among Married-Couple vs Single-Parent Households in Ahuimanu
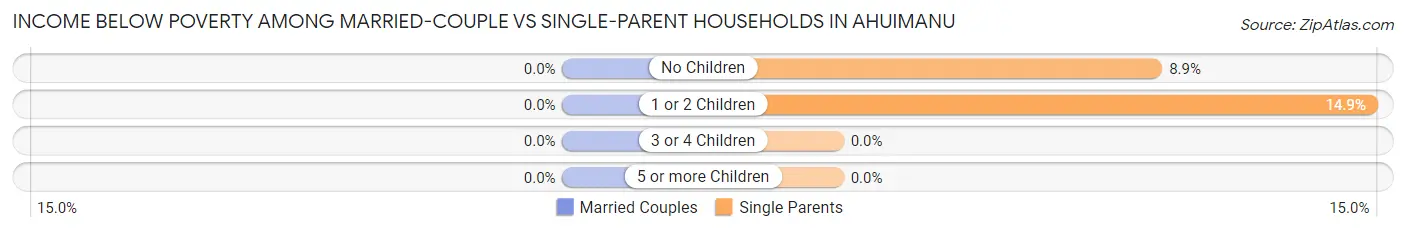
| Children | Married-Couple Families | Single-Parent Households |
| No Children | 0 (0.0%) | 25 (8.9%) |
| 1 or 2 Children | 0 (0.0%) | 37 (14.9%) |
| 3 or 4 Children | 0 (0.0%) | 0 (0.0%) |
| 5 or more Children | 0 (0.0%) | 0 (0.0%) |
| Total | 0 (0.0%) | 62 (9.8%) |
Race in Ahuimanu
The most populous races in Ahuimanu are Two or more Races (3,318 | 36.2%), Asian (2,750 | 30.0%), and White / Caucasian (1,597 | 17.4%).
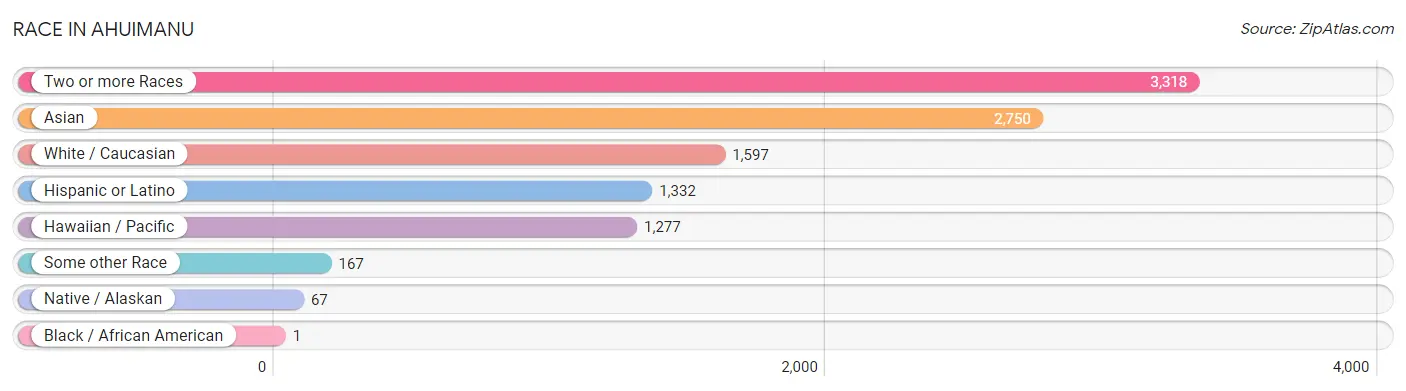
| Race | # Population | % Population |
| Asian | 2,750 | 30.0% |
| Black / African American | 1 | 0.0% |
| Hawaiian / Pacific | 1,277 | 13.9% |
| Hispanic or Latino | 1,332 | 14.5% |
| Native / Alaskan | 67 | 0.7% |
| White / Caucasian | 1,597 | 17.4% |
| Two or more Races | 3,318 | 36.2% |
| Some other Race | 167 | 1.8% |
| Total | 9,177 | 100.0% |
Ancestry in Ahuimanu
The most populous ancestries reported in Ahuimanu are Native Hawaiian (3,502 | 38.2%), Bhutanese (3,166 | 34.5%), Indian (Asian) (2,319 | 25.3%), Korean (1,167 | 12.7%), and Irish (523 | 5.7%), together accounting for 116.3% of all Ahuimanu residents.
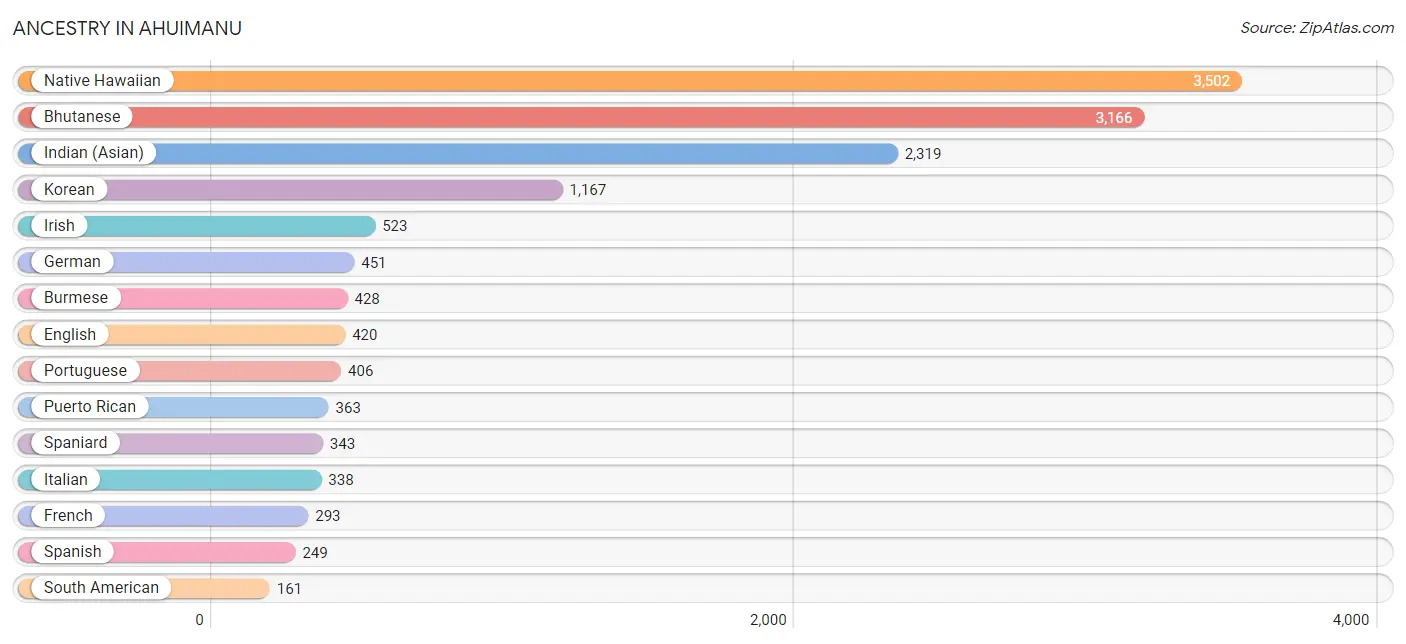
| Ancestry | # Population | % Population |
| American | 141 | 1.5% |
| Bhutanese | 3,166 | 34.5% |
| Blackfeet | 21 | 0.2% |
| British | 10 | 0.1% |
| Burmese | 428 | 4.7% |
| Central American | 24 | 0.3% |
| Cherokee | 84 | 0.9% |
| Chinese | 75 | 0.8% |
| Chippewa | 34 | 0.4% |
| Colombian | 114 | 1.2% |
| Czech | 7 | 0.1% |
| Danish | 25 | 0.3% |
| Dutch | 103 | 1.1% |
| Eastern European | 35 | 0.4% |
| Ecuadorian | 47 | 0.5% |
| English | 420 | 4.6% |
| European | 55 | 0.6% |
| Fijian | 43 | 0.5% |
| Filipino | 30 | 0.3% |
| French | 293 | 3.2% |
| French Canadian | 37 | 0.4% |
| German | 451 | 4.9% |
| Guamanian / Chamorro | 2 | 0.0% |
| Indian (Asian) | 2,319 | 25.3% |
| Irish | 523 | 5.7% |
| Italian | 338 | 3.7% |
| Korean | 1,167 | 12.7% |
| Marshallese | 17 | 0.2% |
| Mexican | 155 | 1.7% |
| Native Hawaiian | 3,502 | 38.2% |
| Norwegian | 49 | 0.5% |
| Pakistani | 26 | 0.3% |
| Panamanian | 8 | 0.1% |
| Polish | 136 | 1.5% |
| Portuguese | 406 | 4.4% |
| Potawatomi | 9 | 0.1% |
| Puerto Rican | 363 | 4.0% |
| Russian | 26 | 0.3% |
| Salvadoran | 16 | 0.2% |
| Samoan | 38 | 0.4% |
| Scandinavian | 19 | 0.2% |
| Scotch-Irish | 39 | 0.4% |
| Scottish | 75 | 0.8% |
| Slovak | 8 | 0.1% |
| South American | 161 | 1.8% |
| Spaniard | 343 | 3.7% |
| Spanish | 249 | 2.7% |
| Sri Lankan | 148 | 1.6% |
| Swedish | 5 | 0.1% |
| Swiss | 30 | 0.3% |
| Tongan | 119 | 1.3% |
| Ukrainian | 37 | 0.4% |
| Welsh | 12 | 0.1% |
| West Indian | 8 | 0.1% |
| Yup'ik | 24 | 0.3% | View All 55 Rows |
Immigrants in Ahuimanu
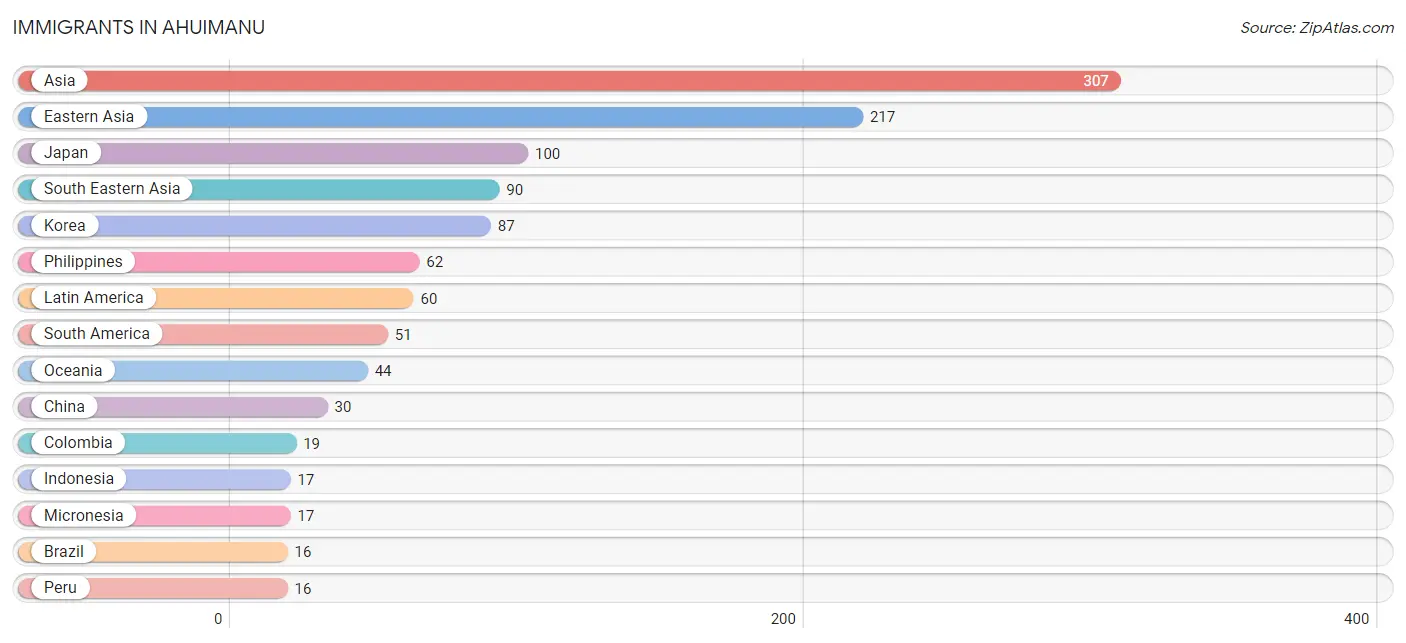
The most numerous immigrant groups reported in Ahuimanu came from Asia (307 | 3.4%), Eastern Asia (217 | 2.4%), Japan (100 | 1.1%), South Eastern Asia (90 | 1.0%), and Korea (87 | 0.9%), together accounting for 8.7% of all Ahuimanu residents.
| Immigration Origin | # Population | % Population |
| Asia | 307 | 3.4% |
| Brazil | 16 | 0.2% |
| Canada | 9 | 0.1% |
| Central America | 9 | 0.1% |
| China | 30 | 0.3% |
| Colombia | 19 | 0.2% |
| Eastern Asia | 217 | 2.4% |
| Europe | 13 | 0.1% |
| Germany | 13 | 0.1% |
| Indonesia | 17 | 0.2% |
| Japan | 100 | 1.1% |
| Korea | 87 | 0.9% |
| Latin America | 60 | 0.6% |
| Mexico | 9 | 0.1% |
| Micronesia | 17 | 0.2% |
| Oceania | 44 | 0.5% |
| Peru | 16 | 0.2% |
| Philippines | 62 | 0.7% |
| South America | 51 | 0.6% |
| South Eastern Asia | 90 | 1.0% |
| Thailand | 11 | 0.1% |
| Western Europe | 13 | 0.1% | View All 22 Rows |
Sex and Age in Ahuimanu
Sex and Age in Ahuimanu
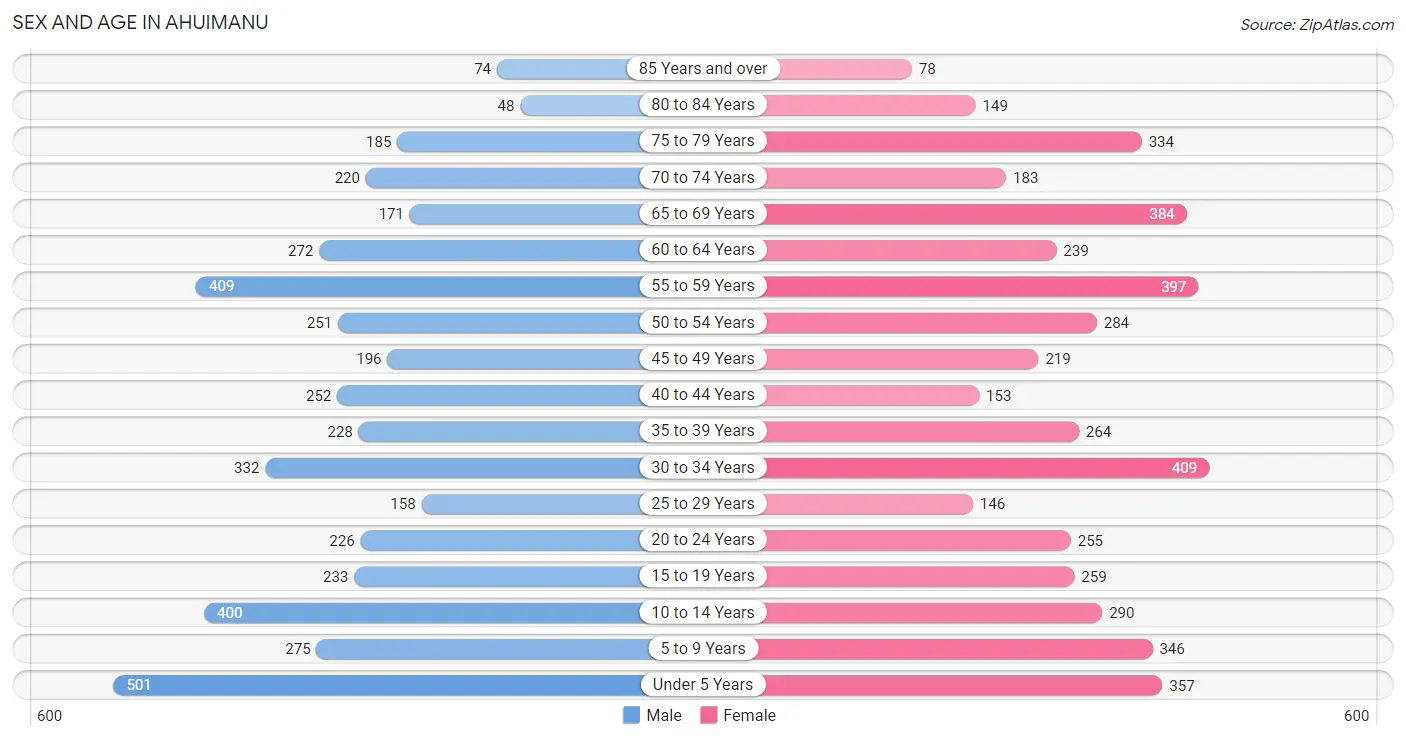
The most populous age groups in Ahuimanu are Under 5 Years (501 | 11.3%) for men and 30 to 34 Years (409 | 8.6%) for women.
| Age Bracket | Male | Female |
| Under 5 Years | 501 (11.3%) | 357 (7.5%) |
| 5 to 9 Years | 275 (6.2%) | 346 (7.3%) |
| 10 to 14 Years | 400 (9.0%) | 290 (6.1%) |
| 15 to 19 Years | 233 (5.3%) | 259 (5.5%) |
| 20 to 24 Years | 226 (5.1%) | 255 (5.4%) |
| 25 to 29 Years | 158 (3.6%) | 146 (3.1%) |
| 30 to 34 Years | 332 (7.5%) | 409 (8.6%) |
| 35 to 39 Years | 228 (5.1%) | 264 (5.6%) |
| 40 to 44 Years | 252 (5.7%) | 153 (3.2%) |
| 45 to 49 Years | 196 (4.4%) | 219 (4.6%) |
| 50 to 54 Years | 251 (5.7%) | 284 (6.0%) |
| 55 to 59 Years | 409 (9.2%) | 397 (8.4%) |
| 60 to 64 Years | 272 (6.1%) | 239 (5.0%) |
| 65 to 69 Years | 171 (3.9%) | 384 (8.1%) |
| 70 to 74 Years | 220 (5.0%) | 183 (3.9%) |
| 75 to 79 Years | 185 (4.2%) | 334 (7.0%) |
| 80 to 84 Years | 48 (1.1%) | 149 (3.1%) |
| 85 Years and over | 74 (1.7%) | 78 (1.6%) |
| Total | 4,431 (100.0%) | 4,746 (100.0%) |
Families and Households in Ahuimanu
Median Family Size in Ahuimanu
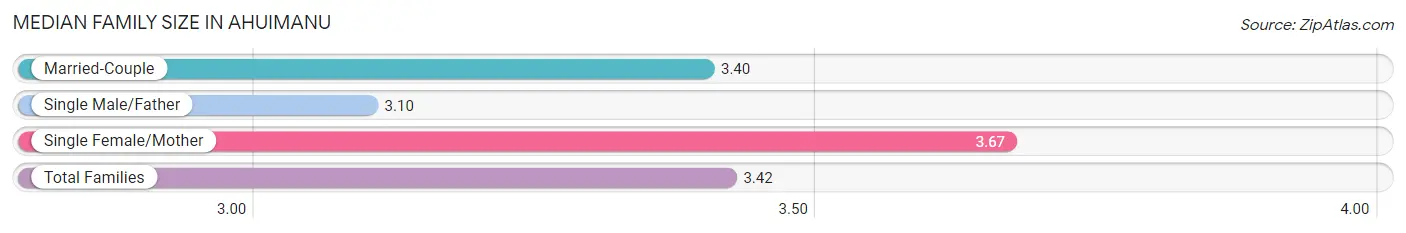
The median family size in Ahuimanu is 3.42 persons per family, with single female/mother families (413 | 17.6%) accounting for the largest median family size of 3.67 persons per family. On the other hand, single male/father families (223 | 9.5%) represent the smallest median family size with 3.10 persons per family.
| Family Type | # Families | Family Size |
| Married-Couple | 1,706 (72.8%) | 3.40 |
| Single Male/Father | 223 (9.5%) | 3.10 |
| Single Female/Mother | 413 (17.6%) | 3.67 |
| Total Families | 2,342 (100.0%) | 3.42 |
Median Household Size in Ahuimanu
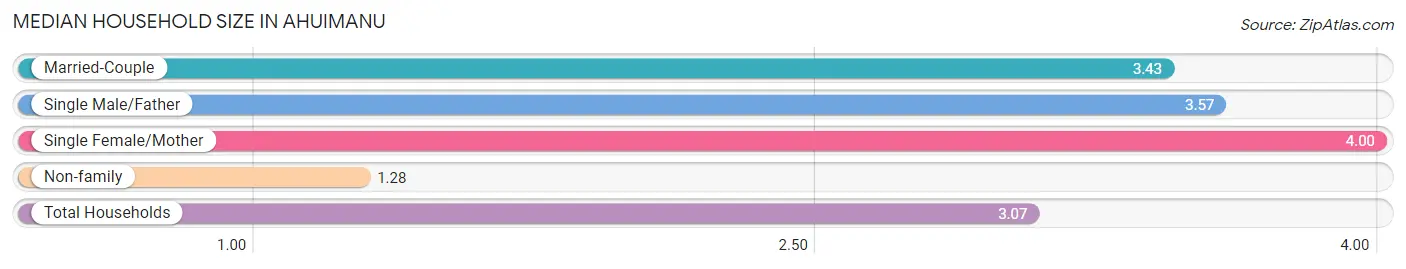
The median household size in Ahuimanu is 3.07 persons per household, with single female/mother households (413 | 13.9%) accounting for the largest median household size of 4 persons per household. non-family households (624 | 21.0%) represent the smallest median household size with 1.28 persons per household.
| Household Type | # Households | Household Size |
| Married-Couple | 1,706 (57.5%) | 3.43 |
| Single Male/Father | 223 (7.5%) | 3.57 |
| Single Female/Mother | 413 (13.9%) | 4.00 |
| Non-family | 624 (21.0%) | 1.28 |
| Total Households | 2,966 (100.0%) | 3.07 |
Household Size by Marriage Status in Ahuimanu
Out of a total of 2,966 households in Ahuimanu, 2,342 (79.0%) are family households, while 624 (21.0%) are nonfamily households. The most numerous type of family households are 2-person households, comprising 827, and the most common type of nonfamily households are 1-person households, comprising 499.
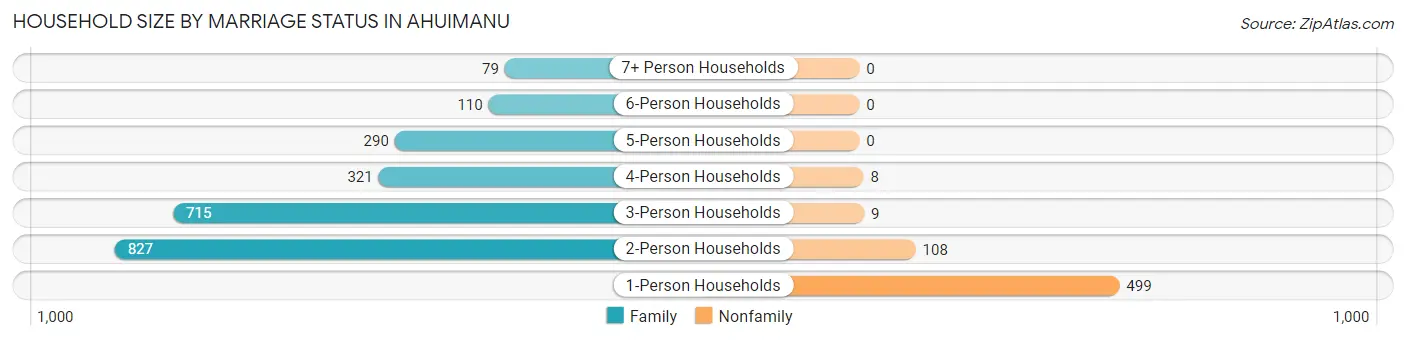
| Household Size | Family Households | Nonfamily Households |
| 1-Person Households | - | 499 (16.8%) |
| 2-Person Households | 827 (27.9%) | 108 (3.6%) |
| 3-Person Households | 715 (24.1%) | 9 (0.3%) |
| 4-Person Households | 321 (10.8%) | 8 (0.3%) |
| 5-Person Households | 290 (9.8%) | 0 (0.0%) |
| 6-Person Households | 110 (3.7%) | 0 (0.0%) |
| 7+ Person Households | 79 (2.7%) | 0 (0.0%) |
| Total | 2,342 (79.0%) | 624 (21.0%) |
Female Fertility in Ahuimanu
Fertility by Age in Ahuimanu
Average fertility rate in Ahuimanu is 50.0 births per 1,000 women. Women in the age bracket of 20 to 34 years have the highest fertility rate with 77.0 births per 1,000 women. Women in the age bracket of 20 to 34 years acount for 68.9% of all women with births.
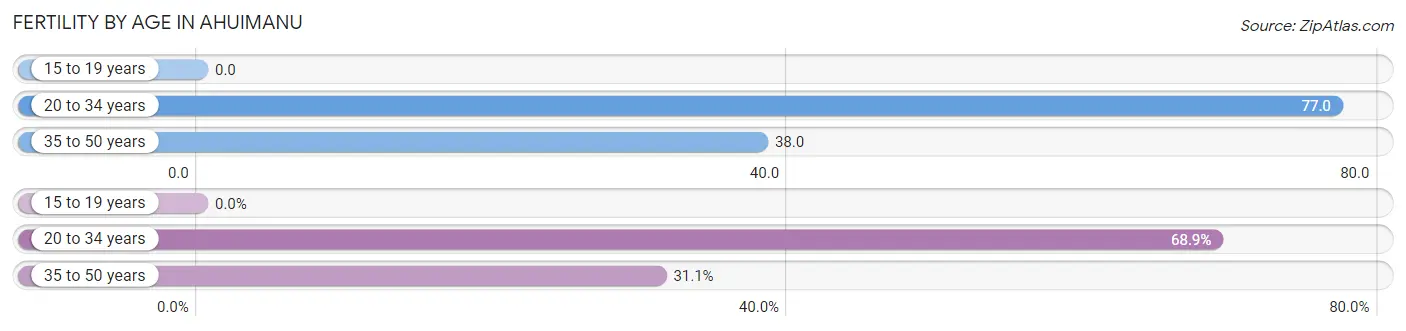
| Age Bracket | Women with Births | Births / 1,000 Women |
| 15 to 19 years | 0 (0.0%) | 0.0 |
| 20 to 34 years | 62 (68.9%) | 77.0 |
| 35 to 50 years | 28 (31.1%) | 38.0 |
| Total | 90 (100.0%) | 50.0 |
Fertility by Age by Marriage Status in Ahuimanu
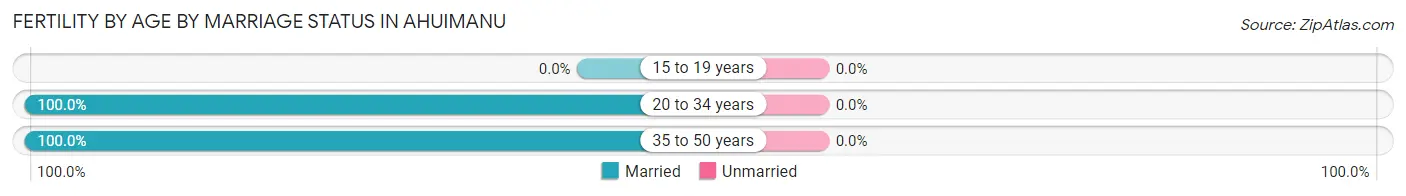
| Age Bracket | Married | Unmarried |
| 15 to 19 years | 0 (0.0%) | 0 (0.0%) |
| 20 to 34 years | 62 (100.0%) | 0 (0.0%) |
| 35 to 50 years | 28 (100.0%) | 0 (0.0%) |
| Total | 90 (100.0%) | 0 (0.0%) |
Fertility by Education in Ahuimanu
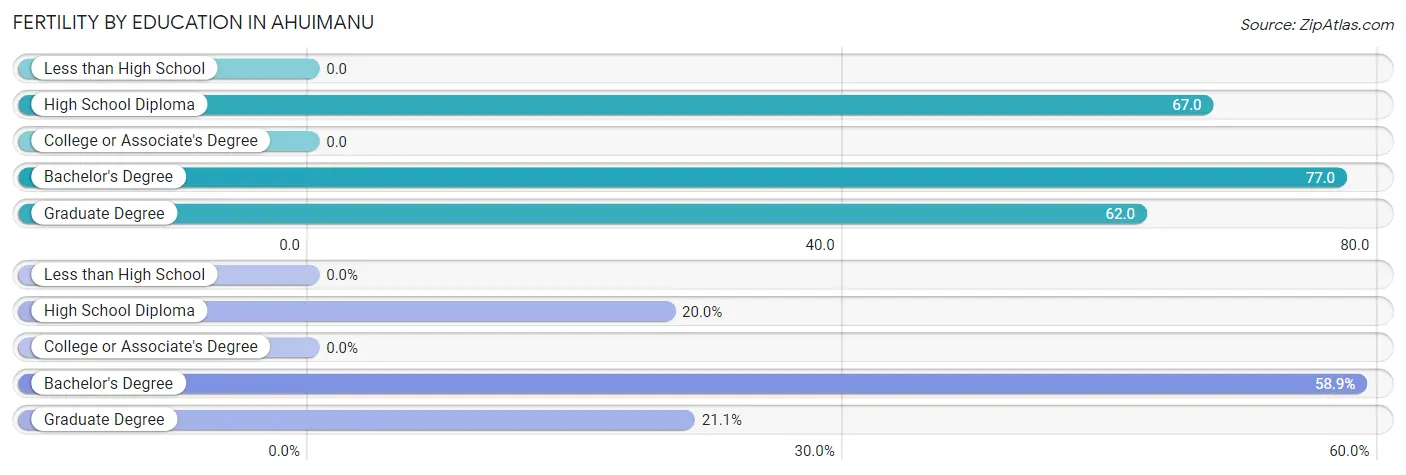
| Educational Attainment | Women with Births | Births / 1,000 Women |
| Less than High School | 0 (0.0%) | 0.0 |
| High School Diploma | 18 (20.0%) | 67.0 |
| College or Associate's Degree | 0 (0.0%) | 0.0 |
| Bachelor's Degree | 53 (58.9%) | 77.0 |
| Graduate Degree | 19 (21.1%) | 62.0 |
| Total | 90 (100.0%) | 50.0 |
Fertility by Education by Marriage Status in Ahuimanu
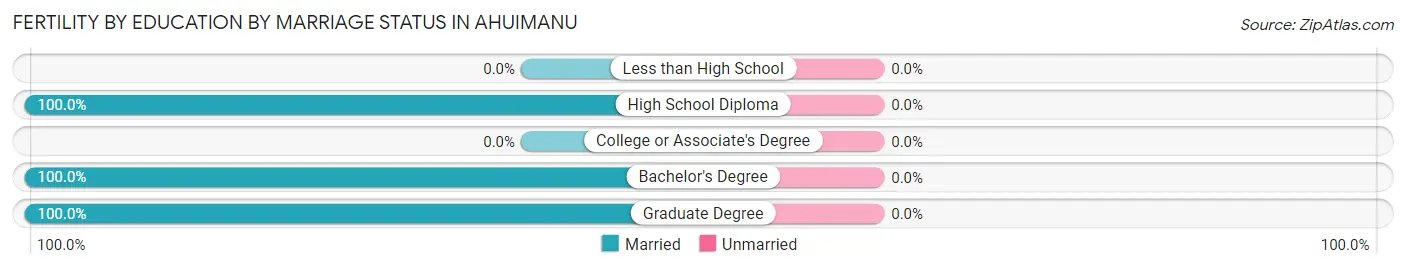
| Educational Attainment | Married | Unmarried |
| Less than High School | 0 (0.0%) | 0 (0.0%) |
| High School Diploma | 18 (100.0%) | 0 (0.0%) |
| College or Associate's Degree | 0 (0.0%) | 0 (0.0%) |
| Bachelor's Degree | 53 (100.0%) | 0 (0.0%) |
| Graduate Degree | 19 (100.0%) | 0 (0.0%) |
| Total | 90 (100.0%) | 0 (0.0%) |
Employment Characteristics in Ahuimanu
Employment by Class of Employer in Ahuimanu
Among the 4,504 employed individuals in Ahuimanu, private company employees (2,195 | 48.7%), federal government employees (613 | 13.6%), and state government employees (556 | 12.3%) make up the most common classes of employment.
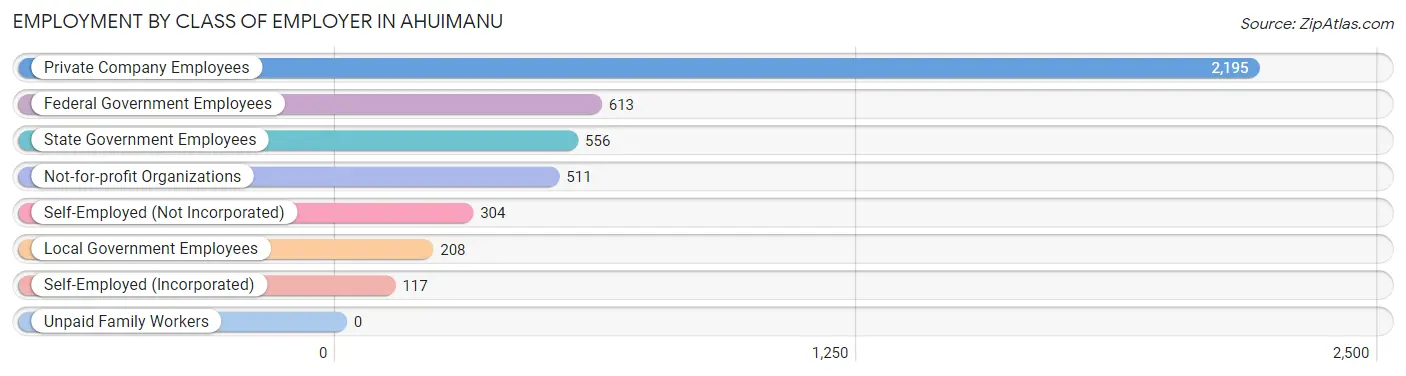
| Employer Class | # Employees | % Employees |
| Private Company Employees | 2,195 | 48.7% |
| Self-Employed (Incorporated) | 117 | 2.6% |
| Self-Employed (Not Incorporated) | 304 | 6.8% |
| Not-for-profit Organizations | 511 | 11.4% |
| Local Government Employees | 208 | 4.6% |
| State Government Employees | 556 | 12.3% |
| Federal Government Employees | 613 | 13.6% |
| Unpaid Family Workers | 0 | 0.0% |
| Total | 4,504 | 100.0% |
Employment Status by Age in Ahuimanu
According to the labor force statistics for Ahuimanu, out of the total population over 16 years of age (6,944), 67.9% or 4,715 individuals are in the labor force, with 1.9% or 90 of them unemployed. The age group with the highest labor force participation rate is 55 to 59 years, with 94.5% or 762 individuals in the labor force. Within the labor force, the 65 to 74 years age range has the highest percentage of unemployed individuals, with 7.3% or 23 of them being unemployed.
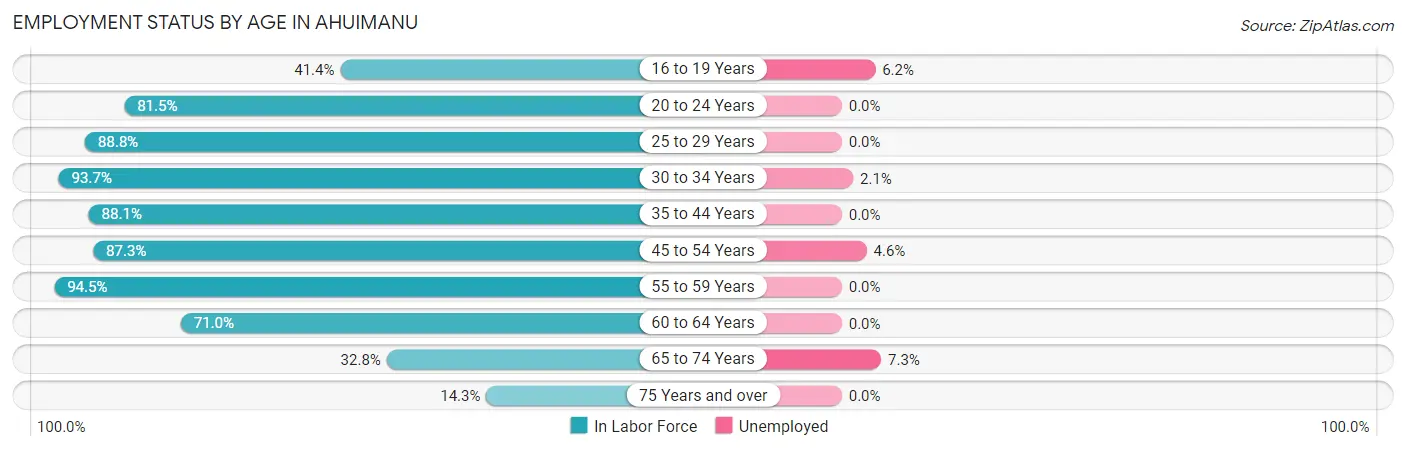
| Age Bracket | In Labor Force | Unemployed |
| 16 to 19 Years | 177 (41.4%) | 11 (6.2%) |
| 20 to 24 Years | 392 (81.5%) | 0 (0.0%) |
| 25 to 29 Years | 270 (88.8%) | 0 (0.0%) |
| 30 to 34 Years | 694 (93.7%) | 15 (2.1%) |
| 35 to 44 Years | 790 (88.1%) | 0 (0.0%) |
| 45 to 54 Years | 829 (87.3%) | 38 (4.6%) |
| 55 to 59 Years | 762 (94.5%) | 0 (0.0%) |
| 60 to 64 Years | 363 (71.0%) | 0 (0.0%) |
| 65 to 74 Years | 314 (32.8%) | 23 (7.3%) |
| 75 Years and over | 124 (14.3%) | 0 (0.0%) |
| Total | 4,715 (67.9%) | 90 (1.9%) |
Employment Status by Educational Attainment in Ahuimanu
According to labor force statistics for Ahuimanu, 88.1% of individuals (3,708) out of the total population between 25 and 64 years of age (4,209) are in the labor force, with 1.4% or 52 of them being unemployed. The group with the highest labor force participation rate are those with the educational attainment of college / associate degree, with 90.2% or 967 individuals in the labor force. Within the labor force, individuals with high school diploma education have the highest percentage of unemployment, with 3.5% or 26 of them being unemployed.
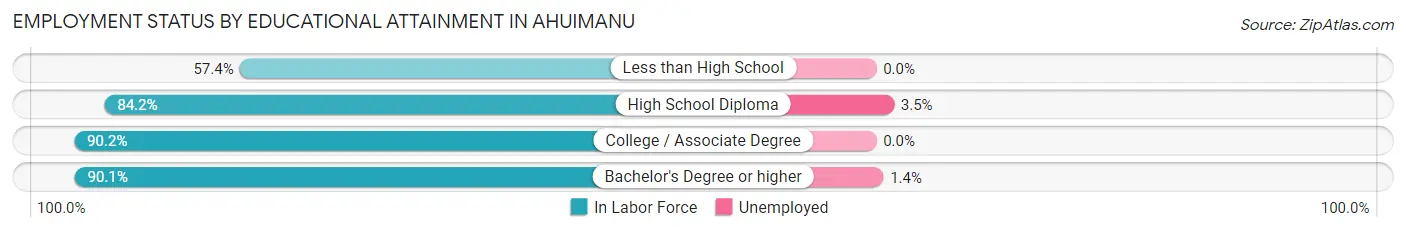
| Educational Attainment | In Labor Force | Unemployed |
| Less than High School | 58 (57.4%) | 0 (0.0%) |
| High School Diploma | 757 (84.2%) | 31 (3.5%) |
| College / Associate Degree | 967 (90.2%) | 0 (0.0%) |
| Bachelor's Degree or higher | 1,925 (90.1%) | 30 (1.4%) |
| Total | 3,708 (88.1%) | 59 (1.4%) |
Employment Occupations by Sex in Ahuimanu
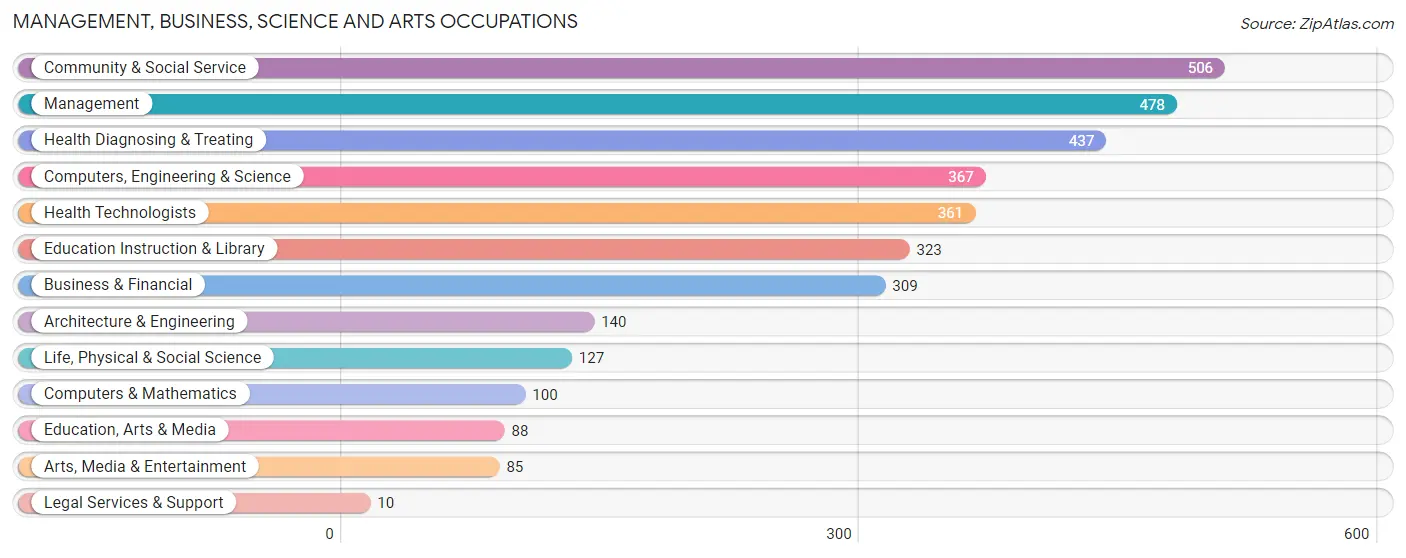
Management, Business, Science and Arts Occupations
The most common Management, Business, Science and Arts occupations in Ahuimanu are Community & Social Service (506 | 11.2%), Management (478 | 10.5%), Health Diagnosing & Treating (437 | 9.6%), Computers, Engineering & Science (367 | 8.1%), and Health Technologists (361 | 8.0%).
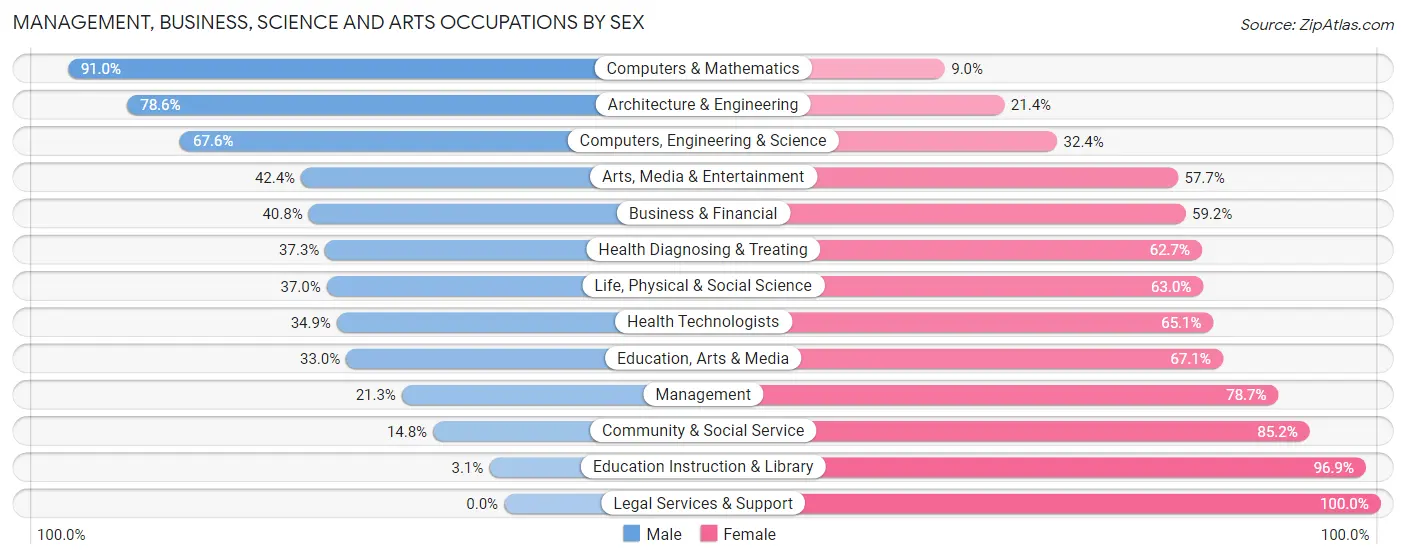
Management, Business, Science and Arts Occupations by Sex
Within the Management, Business, Science and Arts occupations in Ahuimanu, the most male-oriented occupations are Computers & Mathematics (91.0%), Architecture & Engineering (78.6%), and Computers, Engineering & Science (67.6%), while the most female-oriented occupations are Legal Services & Support (100.0%), Education Instruction & Library (96.9%), and Community & Social Service (85.2%).
| Occupation | Male | Female |
| Management | 102 (21.3%) | 376 (78.7%) |
| Business & Financial | 126 (40.8%) | 183 (59.2%) |
| Computers, Engineering & Science | 248 (67.6%) | 119 (32.4%) |
| Computers & Mathematics | 91 (91.0%) | 9 (9.0%) |
| Architecture & Engineering | 110 (78.6%) | 30 (21.4%) |
| Life, Physical & Social Science | 47 (37.0%) | 80 (63.0%) |
| Community & Social Service | 75 (14.8%) | 431 (85.2%) |
| Education, Arts & Media | 29 (33.0%) | 59 (67.0%) |
| Legal Services & Support | 0 (0.0%) | 10 (100.0%) |
| Education Instruction & Library | 10 (3.1%) | 313 (96.9%) |
| Arts, Media & Entertainment | 36 (42.3%) | 49 (57.7%) |
| Health Diagnosing & Treating | 163 (37.3%) | 274 (62.7%) |
| Health Technologists | 126 (34.9%) | 235 (65.1%) |
| Total (Category) | 714 (34.1%) | 1,383 (65.9%) |
| Total (Overall) | 2,126 (46.8%) | 2,413 (53.2%) |
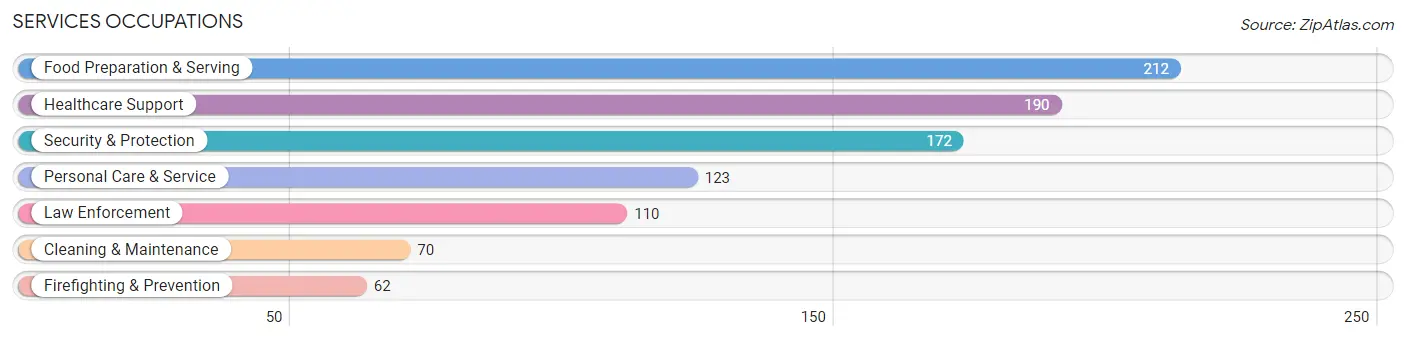
Services Occupations
The most common Services occupations in Ahuimanu are Food Preparation & Serving (212 | 4.7%), Healthcare Support (190 | 4.2%), Security & Protection (172 | 3.8%), Personal Care & Service (123 | 2.7%), and Law Enforcement (110 | 2.4%).
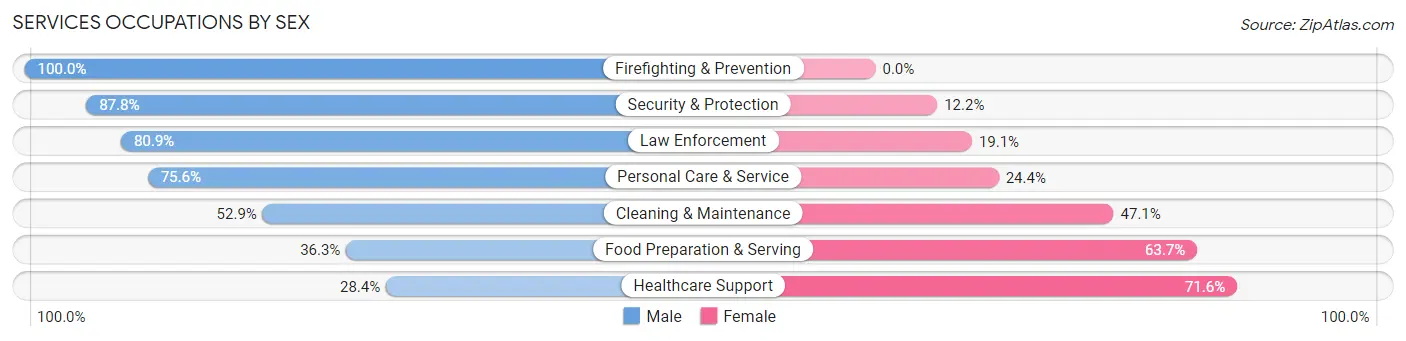
Services Occupations by Sex
Within the Services occupations in Ahuimanu, the most male-oriented occupations are Firefighting & Prevention (100.0%), Security & Protection (87.8%), and Law Enforcement (80.9%), while the most female-oriented occupations are Healthcare Support (71.6%), Food Preparation & Serving (63.7%), and Cleaning & Maintenance (47.1%).
| Occupation | Male | Female |
| Healthcare Support | 54 (28.4%) | 136 (71.6%) |
| Security & Protection | 151 (87.8%) | 21 (12.2%) |
| Firefighting & Prevention | 62 (100.0%) | 0 (0.0%) |
| Law Enforcement | 89 (80.9%) | 21 (19.1%) |
| Food Preparation & Serving | 77 (36.3%) | 135 (63.7%) |
| Cleaning & Maintenance | 37 (52.9%) | 33 (47.1%) |
| Personal Care & Service | 93 (75.6%) | 30 (24.4%) |
| Total (Category) | 412 (53.7%) | 355 (46.3%) |
| Total (Overall) | 2,126 (46.8%) | 2,413 (53.2%) |
Sales and Office Occupations
The most common Sales and Office occupations in Ahuimanu are Office & Administration (587 | 12.9%), and Sales & Related (326 | 7.2%).
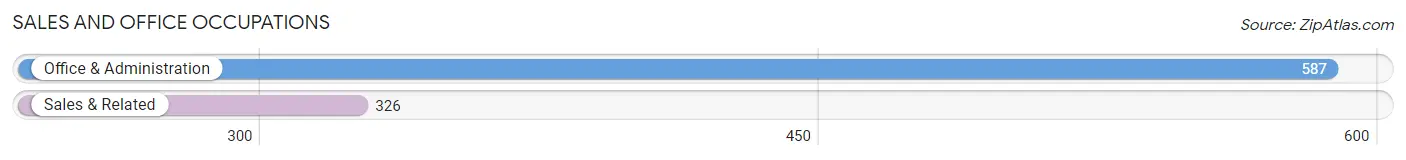
Sales and Office Occupations by Sex
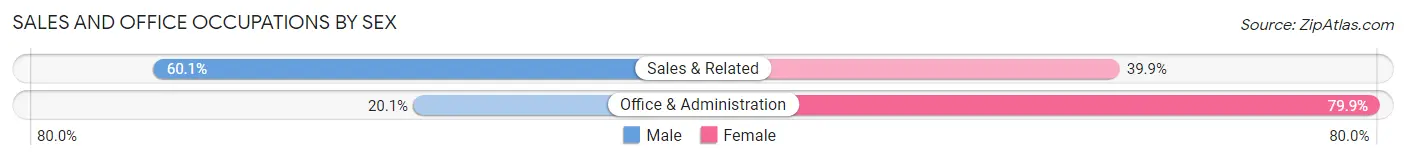
| Occupation | Male | Female |
| Sales & Related | 196 (60.1%) | 130 (39.9%) |
| Office & Administration | 118 (20.1%) | 469 (79.9%) |
| Total (Category) | 314 (34.4%) | 599 (65.6%) |
| Total (Overall) | 2,126 (46.8%) | 2,413 (53.2%) |
Natural Resources, Construction and Maintenance Occupations
The most common Natural Resources, Construction and Maintenance occupations in Ahuimanu are Construction & Extraction (245 | 5.4%), and Installation, Maintenance & Repair (189 | 4.2%).
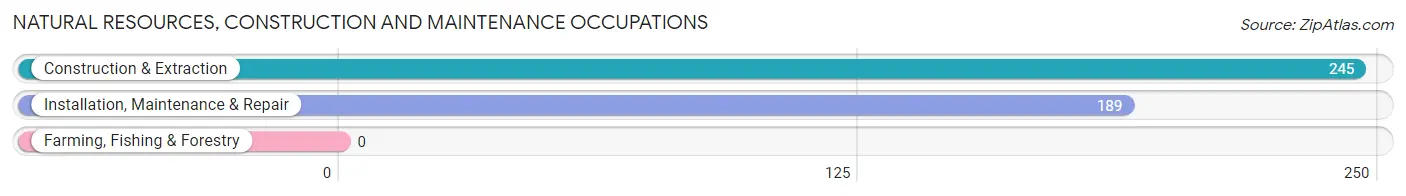
Natural Resources, Construction and Maintenance Occupations by Sex
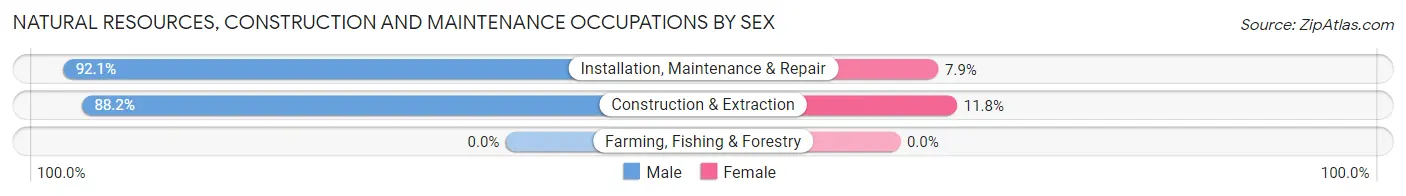
| Occupation | Male | Female |
| Farming, Fishing & Forestry | 0 (0.0%) | 0 (0.0%) |
| Construction & Extraction | 216 (88.2%) | 29 (11.8%) |
| Installation, Maintenance & Repair | 174 (92.1%) | 15 (7.9%) |
| Total (Category) | 390 (89.9%) | 44 (10.1%) |
| Total (Overall) | 2,126 (46.8%) | 2,413 (53.2%) |
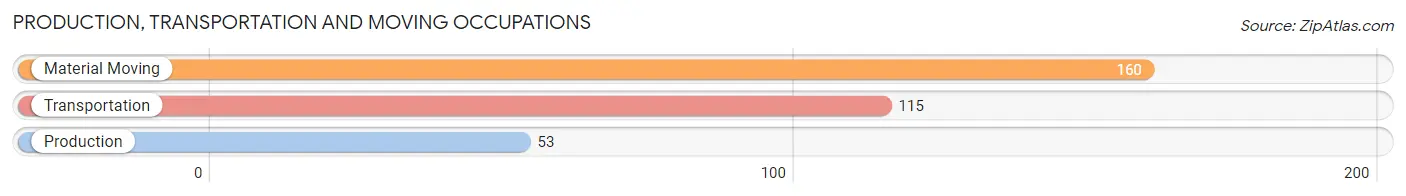
Production, Transportation and Moving Occupations
The most common Production, Transportation and Moving occupations in Ahuimanu are Material Moving (160 | 3.5%), Transportation (115 | 2.5%), and Production (53 | 1.2%).
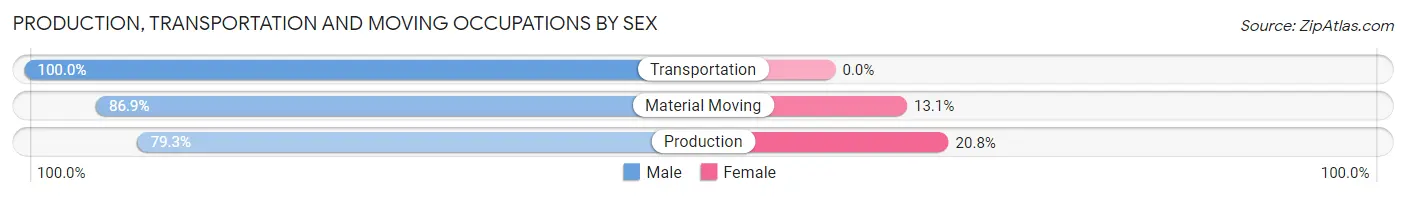
Production, Transportation and Moving Occupations by Sex
| Occupation | Male | Female |
| Production | 42 (79.2%) | 11 (20.7%) |
| Transportation | 115 (100.0%) | 0 (0.0%) |
| Material Moving | 139 (86.9%) | 21 (13.1%) |
| Total (Category) | 296 (90.2%) | 32 (9.8%) |
| Total (Overall) | 2,126 (46.8%) | 2,413 (53.2%) |
Employment Industries by Sex in Ahuimanu
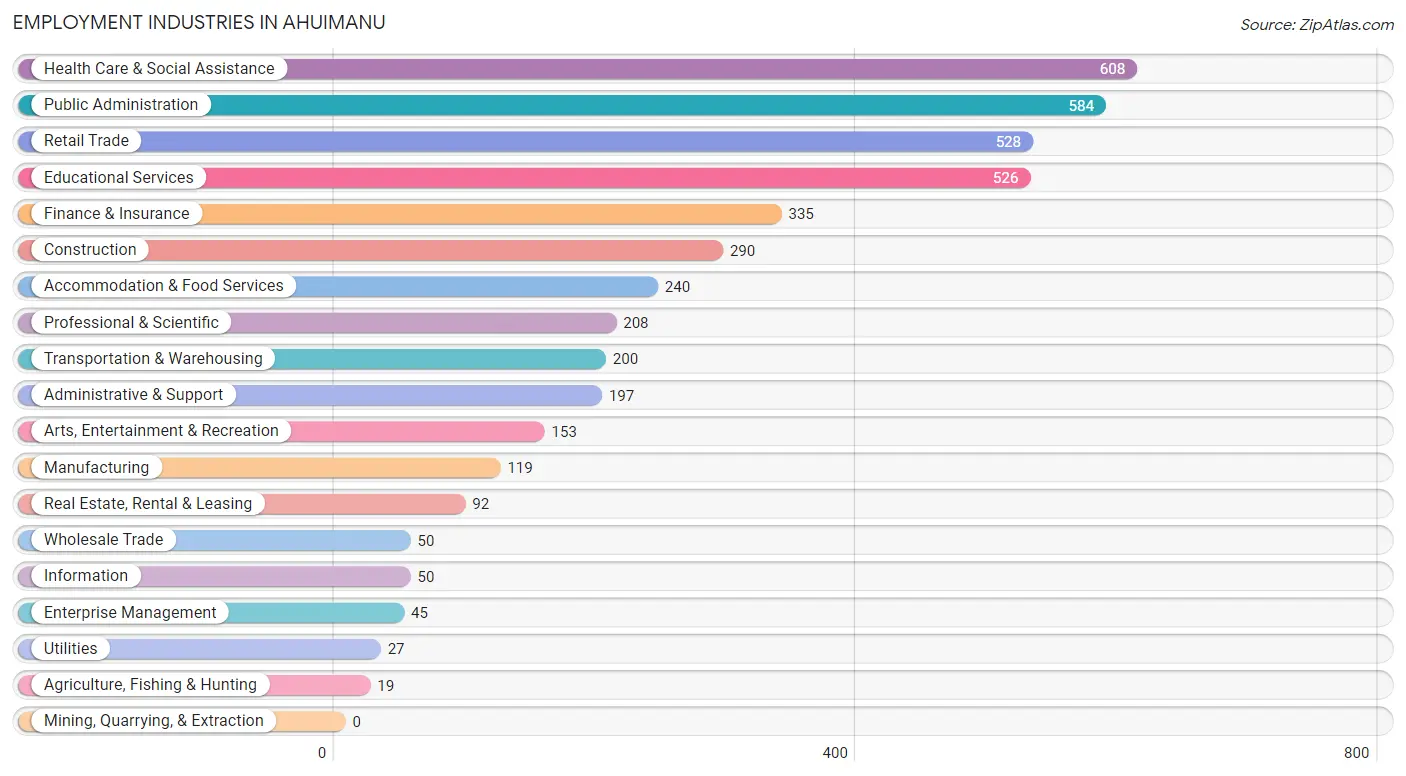
Employment Industries in Ahuimanu
The major employment industries in Ahuimanu include Health Care & Social Assistance (608 | 13.4%), Public Administration (584 | 12.9%), Retail Trade (528 | 11.6%), Educational Services (526 | 11.6%), and Finance & Insurance (335 | 7.4%).
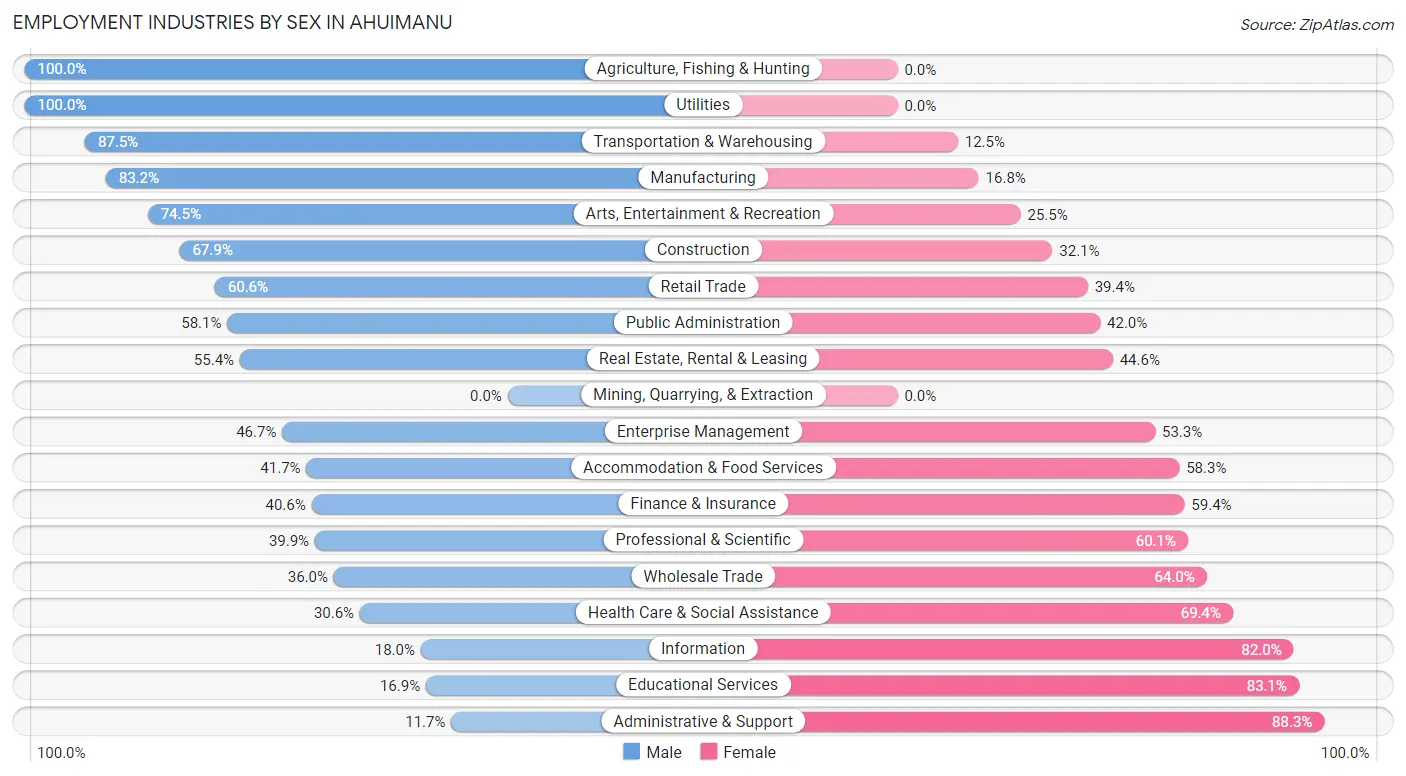
Employment Industries by Sex in Ahuimanu
The Ahuimanu industries that see more men than women are Agriculture, Fishing & Hunting (100.0%), Utilities (100.0%), and Transportation & Warehousing (87.5%), whereas the industries that tend to have a higher number of women are Administrative & Support (88.3%), Educational Services (83.1%), and Information (82.0%).
| Industry | Male | Female |
| Agriculture, Fishing & Hunting | 19 (100.0%) | 0 (0.0%) |
| Mining, Quarrying, & Extraction | 0 (0.0%) | 0 (0.0%) |
| Construction | 197 (67.9%) | 93 (32.1%) |
| Manufacturing | 99 (83.2%) | 20 (16.8%) |
| Wholesale Trade | 18 (36.0%) | 32 (64.0%) |
| Retail Trade | 320 (60.6%) | 208 (39.4%) |
| Transportation & Warehousing | 175 (87.5%) | 25 (12.5%) |
| Utilities | 27 (100.0%) | 0 (0.0%) |
| Information | 9 (18.0%) | 41 (82.0%) |
| Finance & Insurance | 136 (40.6%) | 199 (59.4%) |
| Real Estate, Rental & Leasing | 51 (55.4%) | 41 (44.6%) |
| Professional & Scientific | 83 (39.9%) | 125 (60.1%) |
| Enterprise Management | 21 (46.7%) | 24 (53.3%) |
| Administrative & Support | 23 (11.7%) | 174 (88.3%) |
| Educational Services | 89 (16.9%) | 437 (83.1%) |
| Health Care & Social Assistance | 186 (30.6%) | 422 (69.4%) |
| Arts, Entertainment & Recreation | 114 (74.5%) | 39 (25.5%) |
| Accommodation & Food Services | 100 (41.7%) | 140 (58.3%) |
| Public Administration | 339 (58.1%) | 245 (41.9%) |
| Total | 2,126 (46.8%) | 2,413 (53.2%) |
Education in Ahuimanu
School Enrollment in Ahuimanu
The most common levels of schooling among the 2,520 students in Ahuimanu are middle school (546 | 21.7%), college / undergraduate (538 | 21.3%), and elementary school (530 | 21.0%).
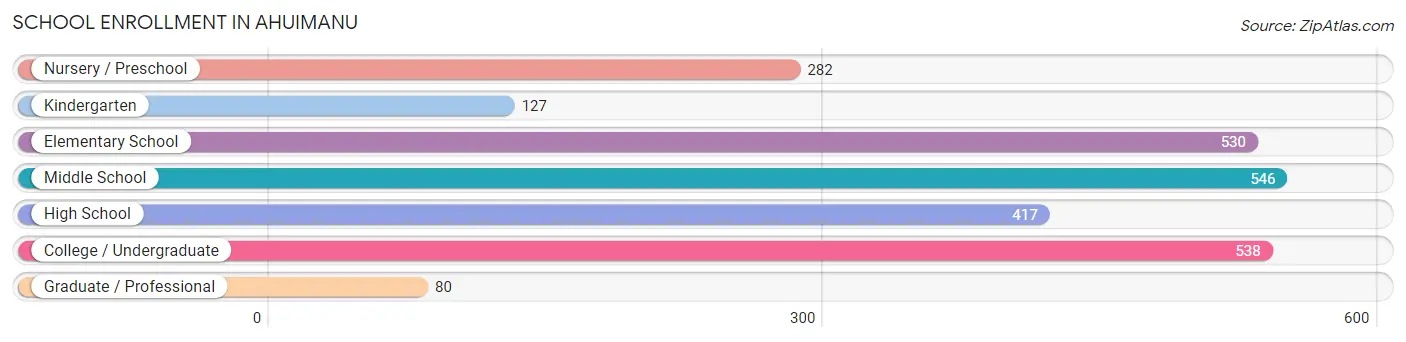
| School Level | # Students | % Students |
| Nursery / Preschool | 282 | 11.2% |
| Kindergarten | 127 | 5.0% |
| Elementary School | 530 | 21.0% |
| Middle School | 546 | 21.7% |
| High School | 417 | 16.6% |
| College / Undergraduate | 538 | 21.3% |
| Graduate / Professional | 80 | 3.2% |
| Total | 2,520 | 100.0% |
School Enrollment by Age by Funding Source in Ahuimanu
Out of a total of 2,520 students who are enrolled in schools in Ahuimanu, 738 (29.3%) attend a private institution, while the remaining 1,782 (70.7%) are enrolled in public schools. The age group of 3 to 4 year olds has the highest likelihood of being enrolled in private schools, with 201 (71.3% in the age bracket) enrolled. Conversely, the age group of 18 to 19 year olds has the lowest likelihood of being enrolled in a private school, with 114 (91.9% in the age bracket) attending a public institution.
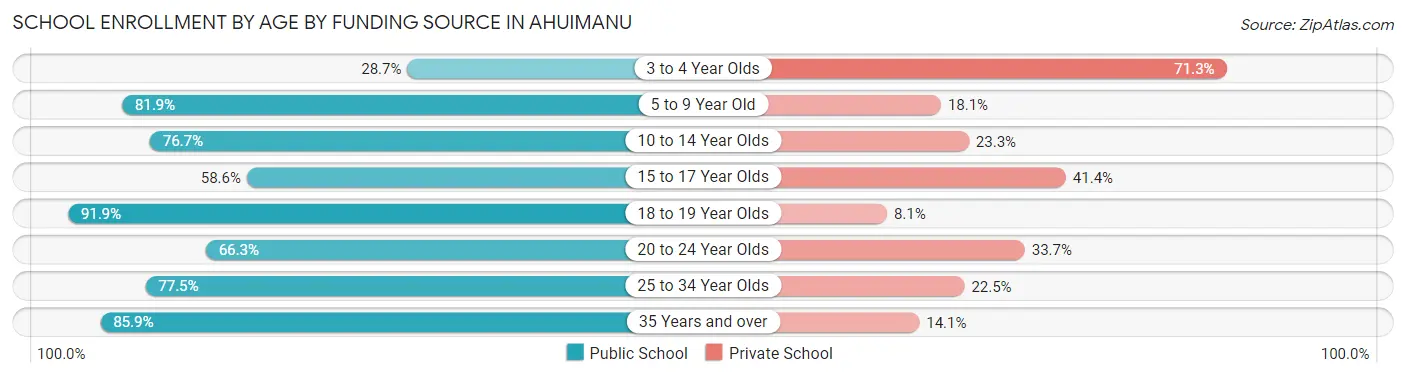
| Age Bracket | Public School | Private School |
| 3 to 4 Year Olds | 81 (28.7%) | 201 (71.3%) |
| 5 to 9 Year Old | 497 (81.9%) | 110 (18.1%) |
| 10 to 14 Year Olds | 529 (76.7%) | 161 (23.3%) |
| 15 to 17 Year Olds | 177 (58.6%) | 125 (41.4%) |
| 18 to 19 Year Olds | 114 (91.9%) | 10 (8.1%) |
| 20 to 24 Year Olds | 163 (66.3%) | 83 (33.7%) |
| 25 to 34 Year Olds | 93 (77.5%) | 27 (22.5%) |
| 35 Years and over | 128 (85.9%) | 21 (14.1%) |
| Total | 1,782 (70.7%) | 738 (29.3%) |
Educational Attainment by Field of Study in Ahuimanu
Business (710 | 23.4%), science & technology (297 | 9.8%), education (288 | 9.5%), bio, nature & agricultural (273 | 9.0%), and psychology (260 | 8.6%) are the most common fields of study among 3,037 individuals in Ahuimanu who have obtained a bachelor's degree or higher.
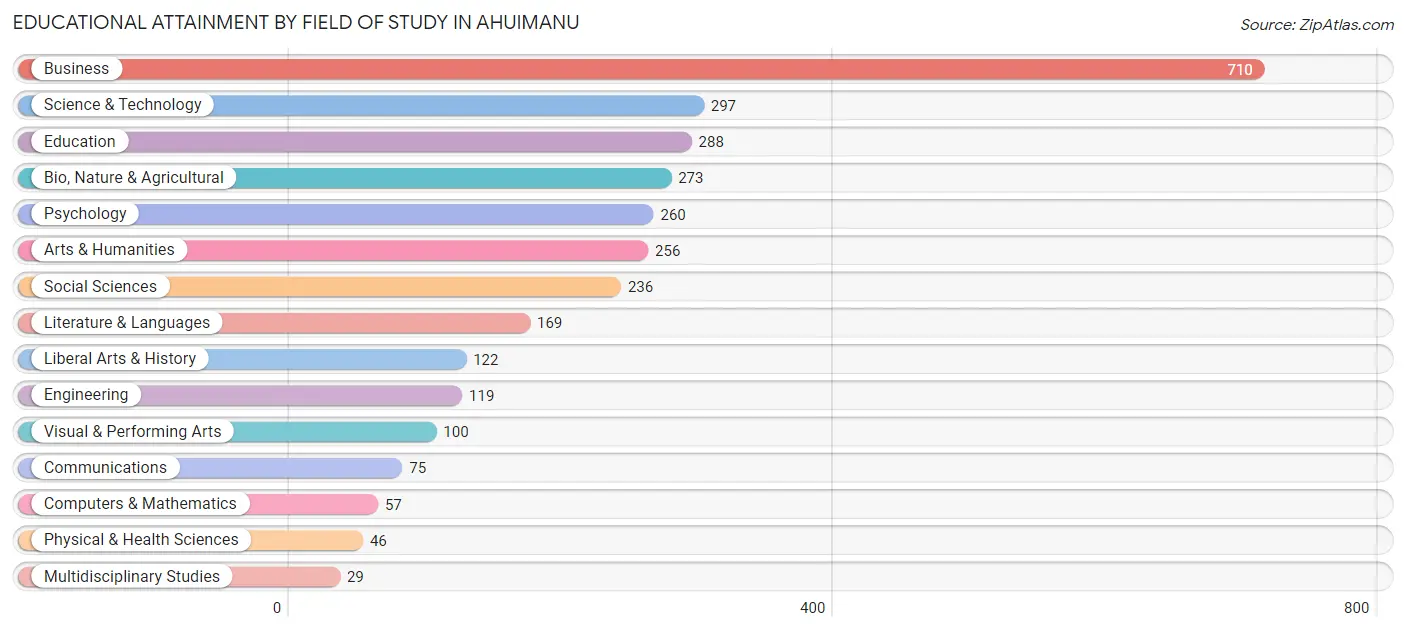
| Field of Study | # Graduates | % Graduates |
| Computers & Mathematics | 57 | 1.9% |
| Bio, Nature & Agricultural | 273 | 9.0% |
| Physical & Health Sciences | 46 | 1.5% |
| Psychology | 260 | 8.6% |
| Social Sciences | 236 | 7.8% |
| Engineering | 119 | 3.9% |
| Multidisciplinary Studies | 29 | 0.9% |
| Science & Technology | 297 | 9.8% |
| Business | 710 | 23.4% |
| Education | 288 | 9.5% |
| Literature & Languages | 169 | 5.6% |
| Liberal Arts & History | 122 | 4.0% |
| Visual & Performing Arts | 100 | 3.3% |
| Communications | 75 | 2.5% |
| Arts & Humanities | 256 | 8.4% |
| Total | 3,037 | 100.0% |
Transportation & Commute in Ahuimanu
Vehicle Availability by Sex in Ahuimanu
The most prevalent vehicle ownership categories in Ahuimanu are males with 2 vehicles (987, accounting for 46.1%) and females with 2 vehicles (937, making up 42.4%).
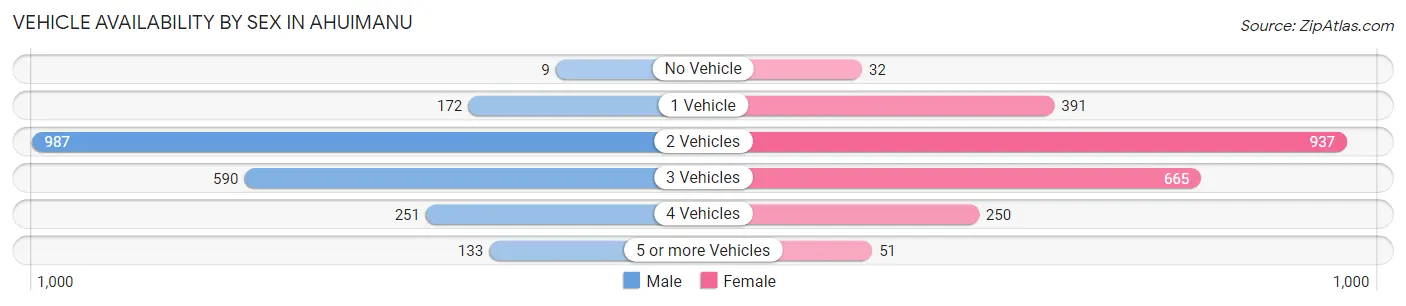
| Vehicles Available | Male | Female |
| No Vehicle | 9 (0.4%) | 32 (1.4%) |
| 1 Vehicle | 172 (8.0%) | 391 (16.8%) |
| 2 Vehicles | 987 (46.1%) | 937 (40.3%) |
| 3 Vehicles | 590 (27.5%) | 665 (28.6%) |
| 4 Vehicles | 251 (11.7%) | 250 (10.7%) |
| 5 or more Vehicles | 133 (6.2%) | 51 (2.2%) |
| Total | 2,142 (100.0%) | 2,326 (100.0%) |
Commute Time in Ahuimanu
The most frequently occuring commute durations in Ahuimanu are 30 to 34 minutes (1,300 commuters, 31.7%), 45 to 59 minutes (651 commuters, 15.9%), and 35 to 39 minutes (408 commuters, 10.0%).
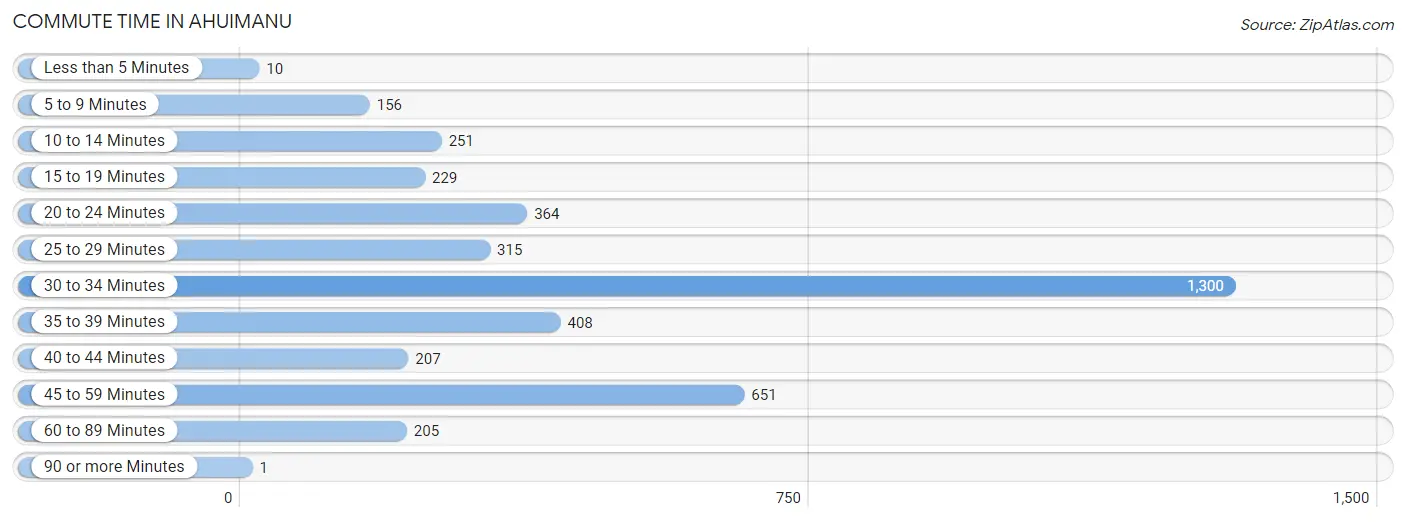
| Commute Time | # Commuters | % Commuters |
| Less than 5 Minutes | 10 | 0.2% |
| 5 to 9 Minutes | 156 | 3.8% |
| 10 to 14 Minutes | 251 | 6.1% |
| 15 to 19 Minutes | 229 | 5.6% |
| 20 to 24 Minutes | 364 | 8.9% |
| 25 to 29 Minutes | 315 | 7.7% |
| 30 to 34 Minutes | 1,300 | 31.7% |
| 35 to 39 Minutes | 408 | 10.0% |
| 40 to 44 Minutes | 207 | 5.1% |
| 45 to 59 Minutes | 651 | 15.9% |
| 60 to 89 Minutes | 205 | 5.0% |
| 90 or more Minutes | 1 | 0.0% |
Commute Time by Sex in Ahuimanu
The most common commute times in Ahuimanu are 30 to 34 minutes (701 commuters, 35.4%) for males and 30 to 34 minutes (599 commuters, 28.3%) for females.
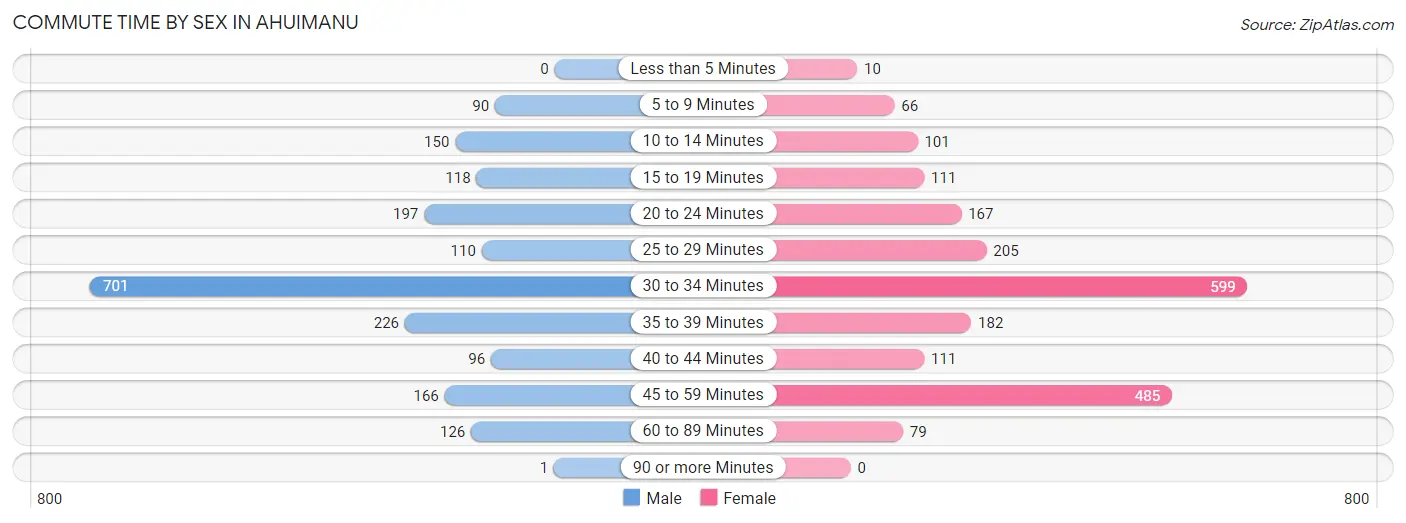
| Commute Time | Male | Female |
| Less than 5 Minutes | 0 (0.0%) | 10 (0.5%) |
| 5 to 9 Minutes | 90 (4.5%) | 66 (3.1%) |
| 10 to 14 Minutes | 150 (7.6%) | 101 (4.8%) |
| 15 to 19 Minutes | 118 (6.0%) | 111 (5.2%) |
| 20 to 24 Minutes | 197 (9.9%) | 167 (7.9%) |
| 25 to 29 Minutes | 110 (5.6%) | 205 (9.7%) |
| 30 to 34 Minutes | 701 (35.4%) | 599 (28.3%) |
| 35 to 39 Minutes | 226 (11.4%) | 182 (8.6%) |
| 40 to 44 Minutes | 96 (4.9%) | 111 (5.2%) |
| 45 to 59 Minutes | 166 (8.4%) | 485 (22.9%) |
| 60 to 89 Minutes | 126 (6.4%) | 79 (3.7%) |
| 90 or more Minutes | 1 (0.1%) | 0 (0.0%) |
Time of Departure to Work by Sex in Ahuimanu
The most frequent times of departure to work in Ahuimanu are 5:00 AM to 5:29 AM (385, 19.4%) for males and 6:30 AM to 6:59 AM (452, 21.4%) for females.
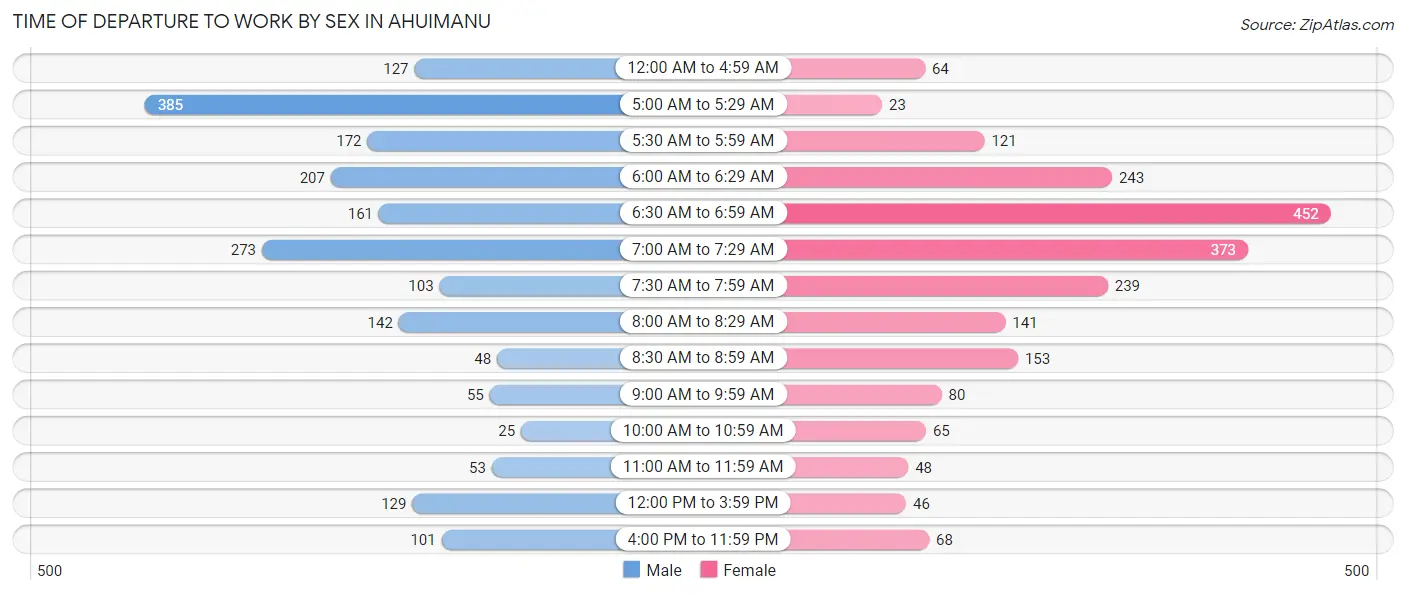
| Time of Departure | Male | Female |
| 12:00 AM to 4:59 AM | 127 (6.4%) | 64 (3.0%) |
| 5:00 AM to 5:29 AM | 385 (19.4%) | 23 (1.1%) |
| 5:30 AM to 5:59 AM | 172 (8.7%) | 121 (5.7%) |
| 6:00 AM to 6:29 AM | 207 (10.4%) | 243 (11.5%) |
| 6:30 AM to 6:59 AM | 161 (8.1%) | 452 (21.4%) |
| 7:00 AM to 7:29 AM | 273 (13.8%) | 373 (17.6%) |
| 7:30 AM to 7:59 AM | 103 (5.2%) | 239 (11.3%) |
| 8:00 AM to 8:29 AM | 142 (7.2%) | 141 (6.7%) |
| 8:30 AM to 8:59 AM | 48 (2.4%) | 153 (7.2%) |
| 9:00 AM to 9:59 AM | 55 (2.8%) | 80 (3.8%) |
| 10:00 AM to 10:59 AM | 25 (1.3%) | 65 (3.1%) |
| 11:00 AM to 11:59 AM | 53 (2.7%) | 48 (2.3%) |
| 12:00 PM to 3:59 PM | 129 (6.5%) | 46 (2.2%) |
| 4:00 PM to 11:59 PM | 101 (5.1%) | 68 (3.2%) |
| Total | 1,981 (100.0%) | 2,116 (100.0%) |
Housing Occupancy in Ahuimanu
Occupancy by Ownership in Ahuimanu
Of the total 2,966 dwellings in Ahuimanu, owner-occupied units account for 2,427 (81.8%), while renter-occupied units make up 539 (18.2%).
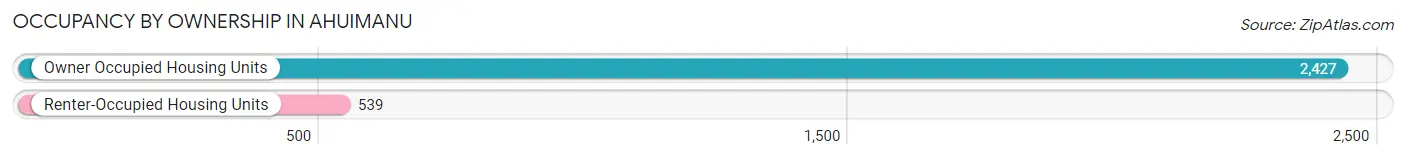
| Occupancy | # Housing Units | % Housing Units |
| Owner Occupied Housing Units | 2,427 | 81.8% |
| Renter-Occupied Housing Units | 539 | 18.2% |
| Total Occupied Housing Units | 2,966 | 100.0% |
Occupancy by Household Size in Ahuimanu
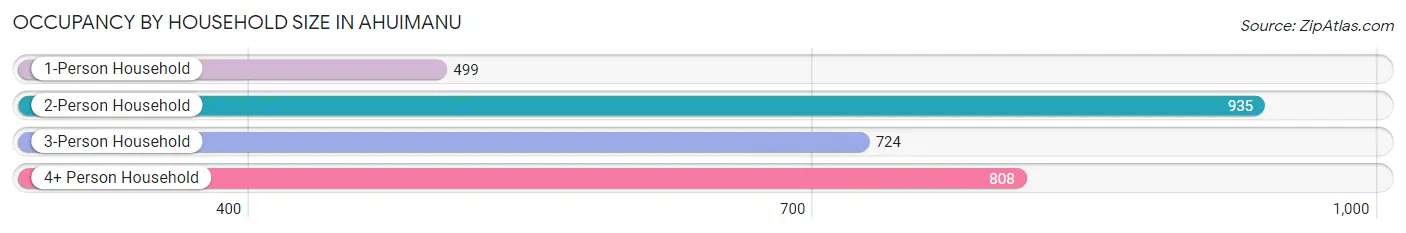
| Household Size | # Housing Units | % Housing Units |
| 1-Person Household | 499 | 16.8% |
| 2-Person Household | 935 | 31.5% |
| 3-Person Household | 724 | 24.4% |
| 4+ Person Household | 808 | 27.2% |
| Total Housing Units | 2,966 | 100.0% |
Occupancy by Ownership by Household Size in Ahuimanu
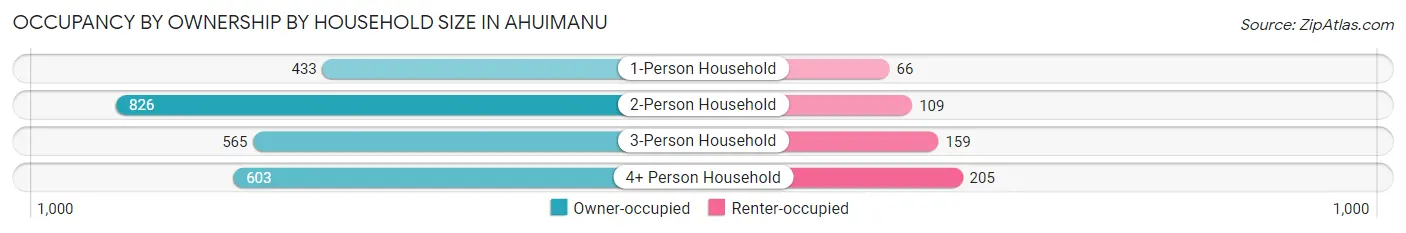
| Household Size | Owner-occupied | Renter-occupied |
| 1-Person Household | 433 (86.8%) | 66 (13.2%) |
| 2-Person Household | 826 (88.3%) | 109 (11.7%) |
| 3-Person Household | 565 (78.0%) | 159 (22.0%) |
| 4+ Person Household | 603 (74.6%) | 205 (25.4%) |
| Total Housing Units | 2,427 (81.8%) | 539 (18.2%) |
Occupancy by Educational Attainment in Ahuimanu
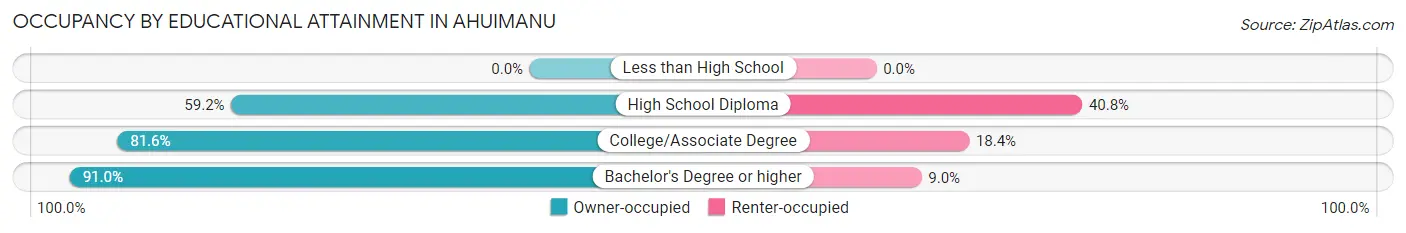
| Household Size | Owner-occupied | Renter-occupied |
| Less than High School | 0 (0.0%) | 0 (0.0%) |
| High School Diploma | 325 (59.2%) | 224 (40.8%) |
| College/Associate Degree | 852 (81.6%) | 192 (18.4%) |
| Bachelor's Degree or higher | 1,250 (91.0%) | 123 (9.0%) |
Occupancy by Age of Householder in Ahuimanu
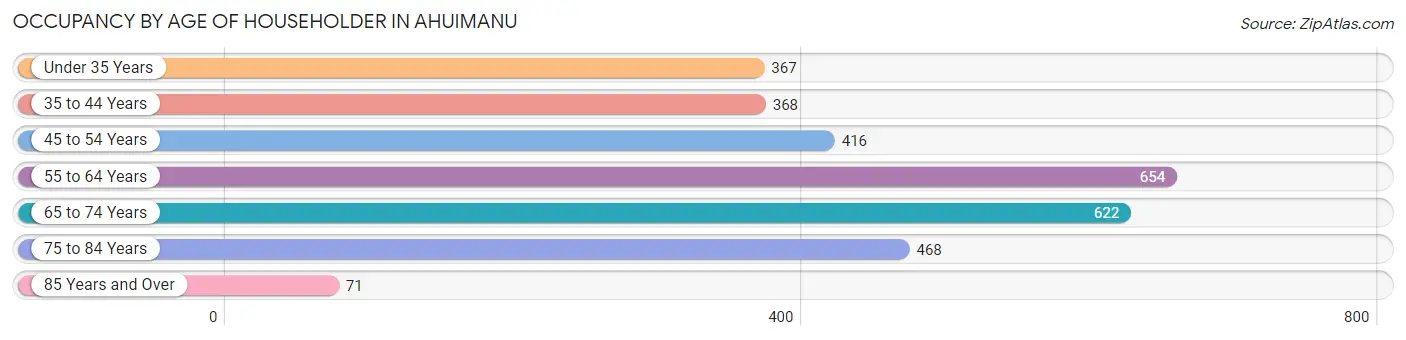
| Age Bracket | # Households | % Households |
| Under 35 Years | 367 | 12.4% |
| 35 to 44 Years | 368 | 12.4% |
| 45 to 54 Years | 416 | 14.0% |
| 55 to 64 Years | 654 | 22.1% |
| 65 to 74 Years | 622 | 21.0% |
| 75 to 84 Years | 468 | 15.8% |
| 85 Years and Over | 71 | 2.4% |
| Total | 2,966 | 100.0% |
Housing Finances in Ahuimanu
Median Income by Occupancy in Ahuimanu
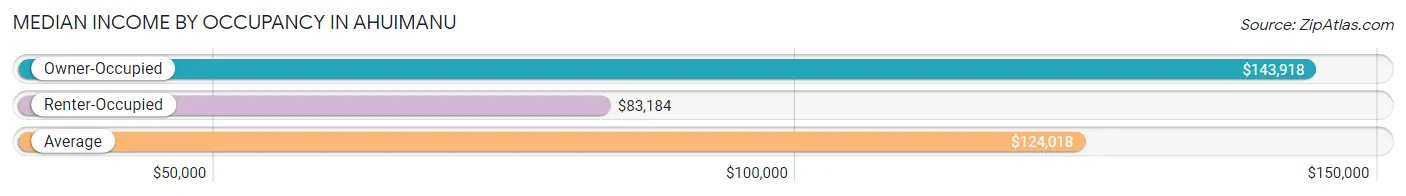
| Occupancy Type | # Households | Median Income |
| Owner-Occupied | 2,427 (81.8%) | $143,918 |
| Renter-Occupied | 539 (18.2%) | $83,184 |
| Average | 2,966 (100.0%) | $124,018 |
Occupancy by Householder Income Bracket in Ahuimanu
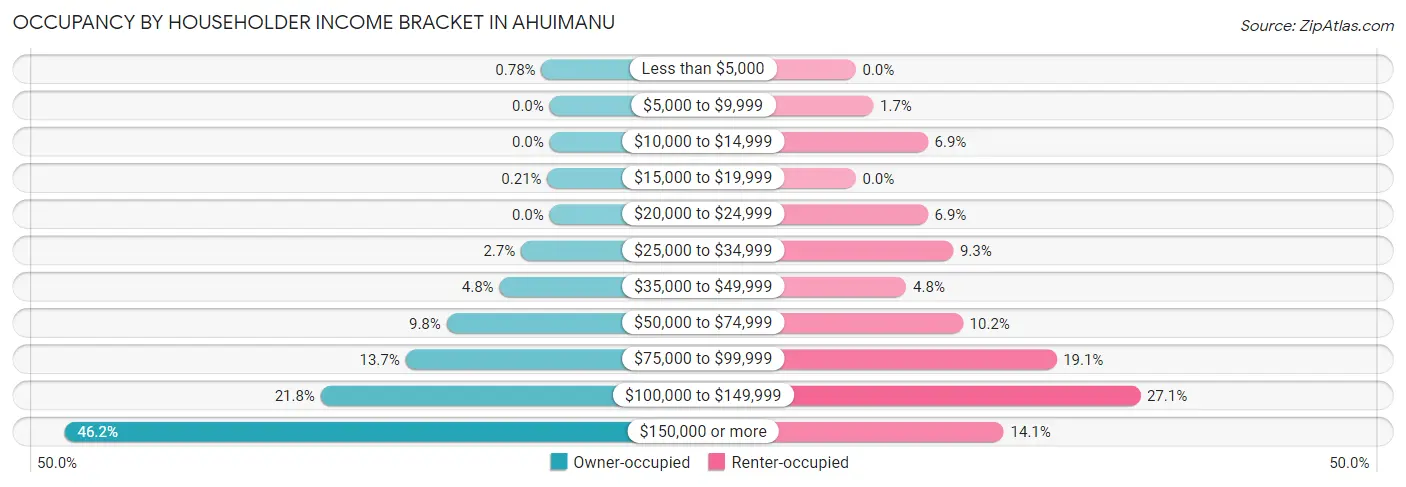
| Income Bracket | Owner-occupied | Renter-occupied |
| Less than $5,000 | 19 (0.8%) | 0 (0.0%) |
| $5,000 to $9,999 | 0 (0.0%) | 9 (1.7%) |
| $10,000 to $14,999 | 0 (0.0%) | 37 (6.9%) |
| $15,000 to $19,999 | 5 (0.2%) | 0 (0.0%) |
| $20,000 to $24,999 | 0 (0.0%) | 37 (6.9%) |
| $25,000 to $34,999 | 66 (2.7%) | 50 (9.3%) |
| $35,000 to $49,999 | 116 (4.8%) | 26 (4.8%) |
| $50,000 to $74,999 | 238 (9.8%) | 55 (10.2%) |
| $75,000 to $99,999 | 333 (13.7%) | 103 (19.1%) |
| $100,000 to $149,999 | 529 (21.8%) | 146 (27.1%) |
| $150,000 or more | 1,121 (46.2%) | 76 (14.1%) |
| Total | 2,427 (100.0%) | 539 (100.0%) |
Monthly Housing Cost Tiers in Ahuimanu
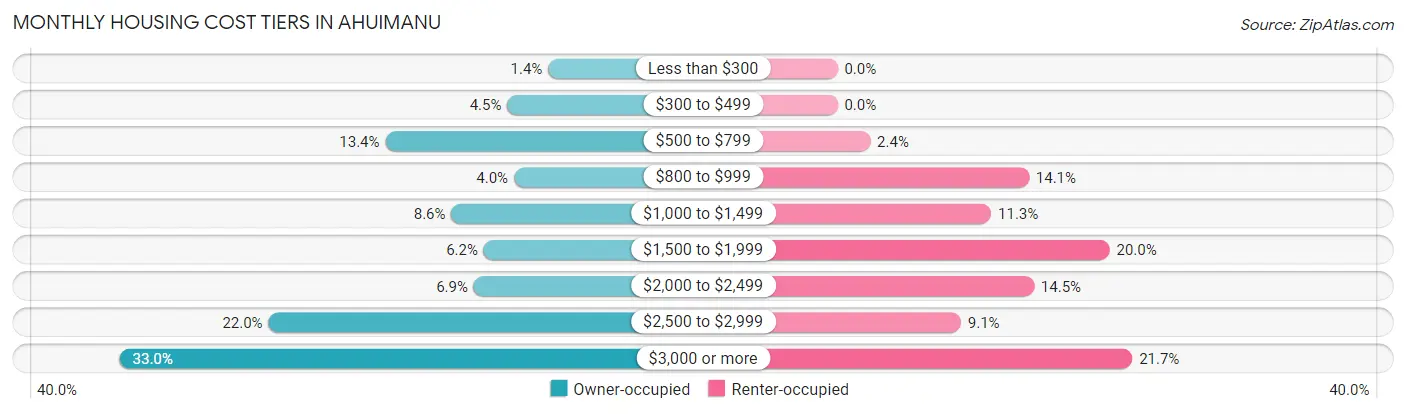
| Monthly Cost | Owner-occupied | Renter-occupied |
| Less than $300 | 35 (1.4%) | 0 (0.0%) |
| $300 to $499 | 108 (4.4%) | 0 (0.0%) |
| $500 to $799 | 326 (13.4%) | 13 (2.4%) |
| $800 to $999 | 96 (4.0%) | 76 (14.1%) |
| $1,000 to $1,499 | 208 (8.6%) | 61 (11.3%) |
| $1,500 to $1,999 | 150 (6.2%) | 108 (20.0%) |
| $2,000 to $2,499 | 168 (6.9%) | 78 (14.5%) |
| $2,500 to $2,999 | 535 (22.0%) | 49 (9.1%) |
| $3,000 or more | 801 (33.0%) | 117 (21.7%) |
| Total | 2,427 (100.0%) | 539 (100.0%) |
Physical Housing Characteristics in Ahuimanu
Housing Structures in Ahuimanu
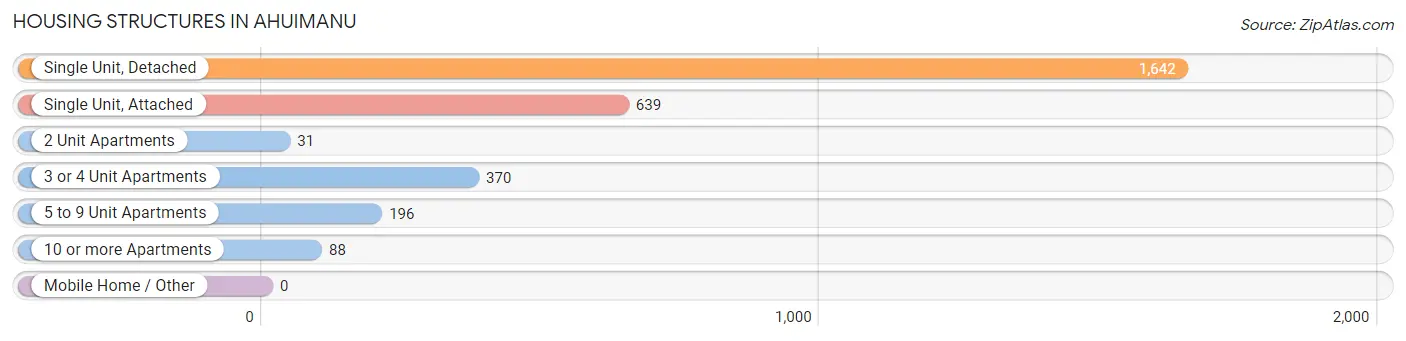
| Structure Type | # Housing Units | % Housing Units |
| Single Unit, Detached | 1,642 | 55.4% |
| Single Unit, Attached | 639 | 21.5% |
| 2 Unit Apartments | 31 | 1.1% |
| 3 or 4 Unit Apartments | 370 | 12.5% |
| 5 to 9 Unit Apartments | 196 | 6.6% |
| 10 or more Apartments | 88 | 3.0% |
| Mobile Home / Other | 0 | 0.0% |
| Total | 2,966 | 100.0% |
Housing Structures by Occupancy in Ahuimanu
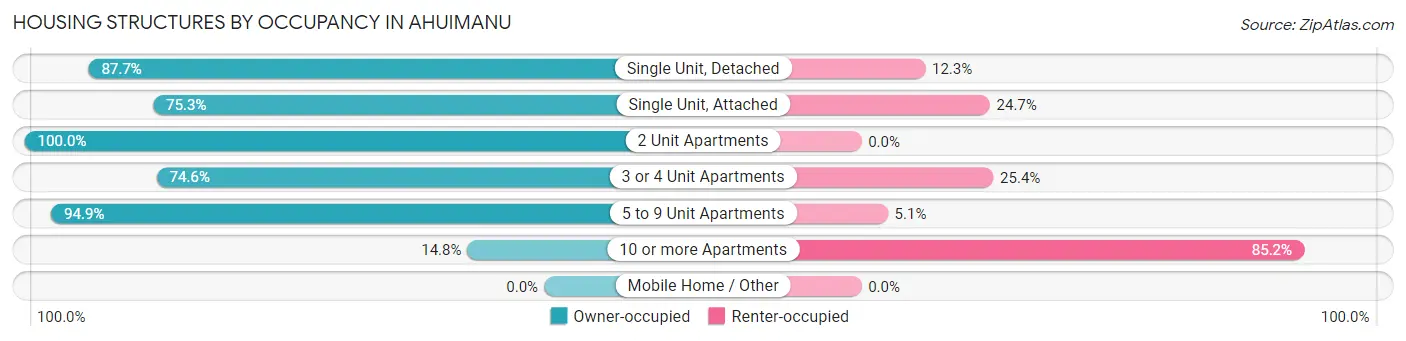
| Structure Type | Owner-occupied | Renter-occupied |
| Single Unit, Detached | 1,440 (87.7%) | 202 (12.3%) |
| Single Unit, Attached | 481 (75.3%) | 158 (24.7%) |
| 2 Unit Apartments | 31 (100.0%) | 0 (0.0%) |
| 3 or 4 Unit Apartments | 276 (74.6%) | 94 (25.4%) |
| 5 to 9 Unit Apartments | 186 (94.9%) | 10 (5.1%) |
| 10 or more Apartments | 13 (14.8%) | 75 (85.2%) |
| Mobile Home / Other | 0 (0.0%) | 0 (0.0%) |
| Total | 2,427 (81.8%) | 539 (18.2%) |
Housing Structures by Number of Rooms in Ahuimanu
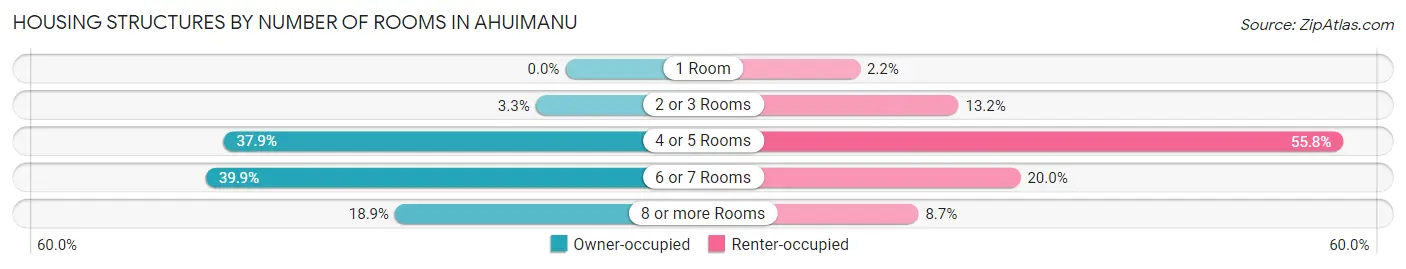
| Number of Rooms | Owner-occupied | Renter-occupied |
| 1 Room | 0 (0.0%) | 12 (2.2%) |
| 2 or 3 Rooms | 80 (3.3%) | 71 (13.2%) |
| 4 or 5 Rooms | 920 (37.9%) | 301 (55.8%) |
| 6 or 7 Rooms | 968 (39.9%) | 108 (20.0%) |
| 8 or more Rooms | 459 (18.9%) | 47 (8.7%) |
| Total | 2,427 (100.0%) | 539 (100.0%) |
Housing Structure by Heating Type in Ahuimanu
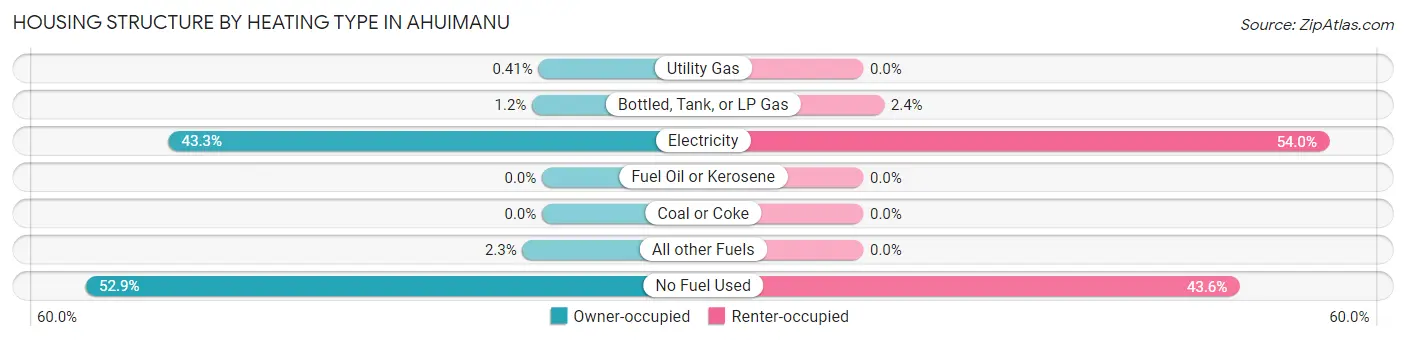
| Heating Type | Owner-occupied | Renter-occupied |
| Utility Gas | 10 (0.4%) | 0 (0.0%) |
| Bottled, Tank, or LP Gas | 28 (1.1%) | 13 (2.4%) |
| Electricity | 1,051 (43.3%) | 291 (54.0%) |
| Fuel Oil or Kerosene | 0 (0.0%) | 0 (0.0%) |
| Coal or Coke | 0 (0.0%) | 0 (0.0%) |
| All other Fuels | 55 (2.3%) | 0 (0.0%) |
| No Fuel Used | 1,283 (52.9%) | 235 (43.6%) |
| Total | 2,427 (100.0%) | 539 (100.0%) |
Household Vehicle Usage in Ahuimanu
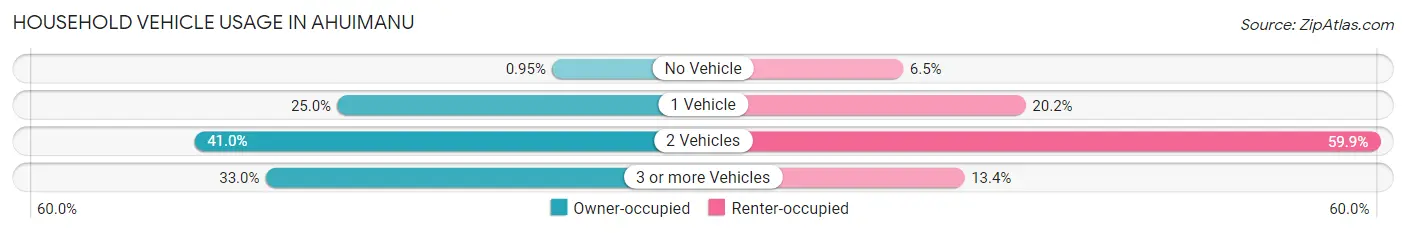
| Vehicles per Household | Owner-occupied | Renter-occupied |
| No Vehicle | 23 (0.9%) | 35 (6.5%) |
| 1 Vehicle | 607 (25.0%) | 109 (20.2%) |
| 2 Vehicles | 995 (41.0%) | 323 (59.9%) |
| 3 or more Vehicles | 802 (33.0%) | 72 (13.4%) |
| Total | 2,427 (100.0%) | 539 (100.0%) |
Real Estate & Mortgages in Ahuimanu
Real Estate and Mortgage Overview in Ahuimanu
| Characteristic | Without Mortgage | With Mortgage |
| Housing Units | 602 | 1,825 |
| Median Property Value | $877,000 | $826,800 |
| Median Household Income | $89,400 | $936 |
| Monthly Housing Costs | $638 | $801 |
| Real Estate Taxes | $2,347 | $72 |
Property Value by Mortgage Status in Ahuimanu
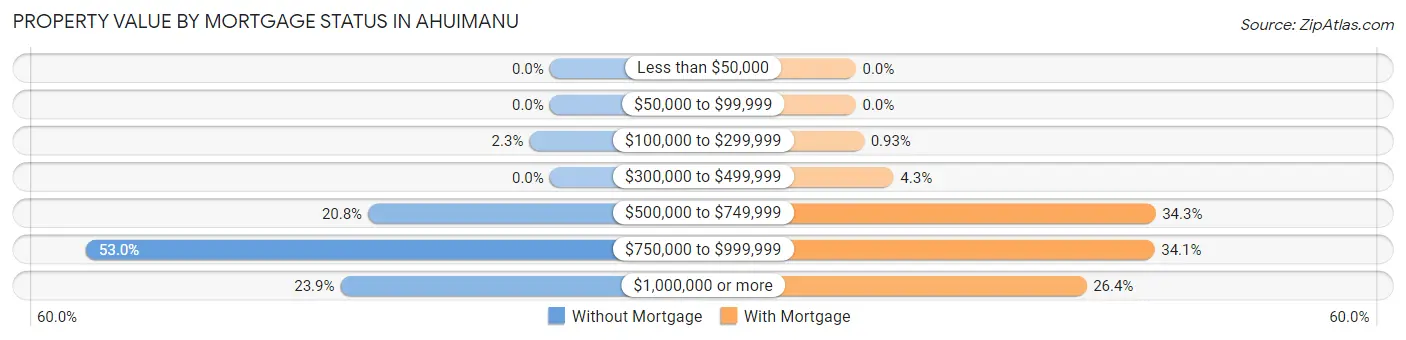
| Property Value | Without Mortgage | With Mortgage |
| Less than $50,000 | 0 (0.0%) | 0 (0.0%) |
| $50,000 to $99,999 | 0 (0.0%) | 0 (0.0%) |
| $100,000 to $299,999 | 14 (2.3%) | 17 (0.9%) |
| $300,000 to $499,999 | 0 (0.0%) | 79 (4.3%) |
| $500,000 to $749,999 | 125 (20.8%) | 625 (34.3%) |
| $750,000 to $999,999 | 319 (53.0%) | 623 (34.1%) |
| $1,000,000 or more | 144 (23.9%) | 481 (26.4%) |
| Total | 602 (100.0%) | 1,825 (100.0%) |
Household Income by Mortgage Status in Ahuimanu
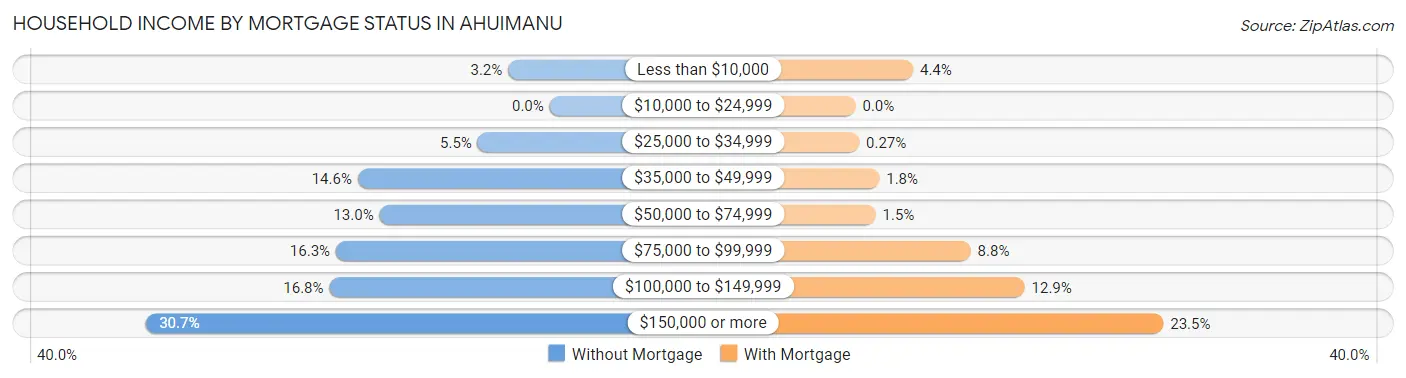
| Household Income | Without Mortgage | With Mortgage |
| Less than $10,000 | 19 (3.2%) | 80 (4.4%) |
| $10,000 to $24,999 | 0 (0.0%) | 0 (0.0%) |
| $25,000 to $34,999 | 33 (5.5%) | 5 (0.3%) |
| $35,000 to $49,999 | 88 (14.6%) | 33 (1.8%) |
| $50,000 to $74,999 | 78 (13.0%) | 28 (1.5%) |
| $75,000 to $99,999 | 98 (16.3%) | 160 (8.8%) |
| $100,000 to $149,999 | 101 (16.8%) | 235 (12.9%) |
| $150,000 or more | 185 (30.7%) | 428 (23.4%) |
| Total | 602 (100.0%) | 1,825 (100.0%) |
Property Value to Household Income Ratio in Ahuimanu
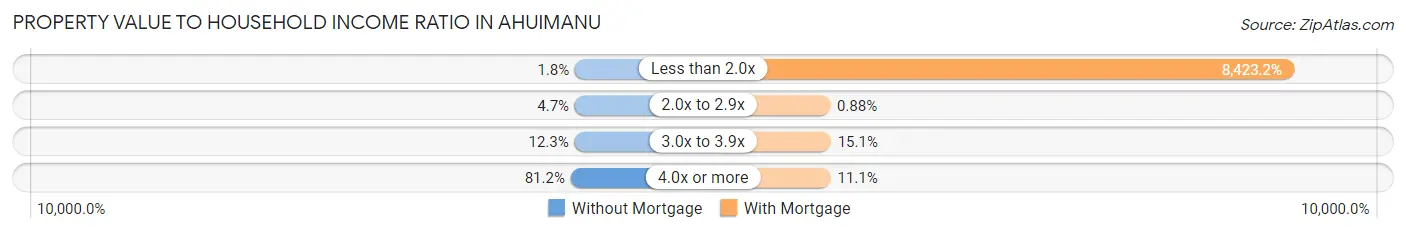
| Value-to-Income Ratio | Without Mortgage | With Mortgage |
| Less than 2.0x | 11 (1.8%) | 153,724 (8,423.2%) |
| 2.0x to 2.9x | 28 (4.6%) | 16 (0.9%) |
| 3.0x to 3.9x | 74 (12.3%) | 275 (15.1%) |
| 4.0x or more | 489 (81.2%) | 202 (11.1%) |
| Total | 602 (100.0%) | 1,825 (100.0%) |
Real Estate Taxes by Mortgage Status in Ahuimanu
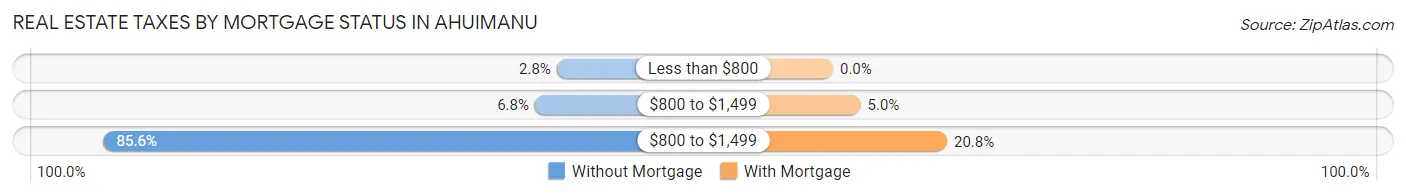
| Property Taxes | Without Mortgage | With Mortgage |
| Less than $800 | 17 (2.8%) | 0 (0.0%) |
| $800 to $1,499 | 41 (6.8%) | 92 (5.0%) |
| $800 to $1,499 | 515 (85.6%) | 380 (20.8%) |
| Total | 602 (100.0%) | 1,825 (100.0%) |
Health & Disability in Ahuimanu
Health Insurance Coverage by Age in Ahuimanu
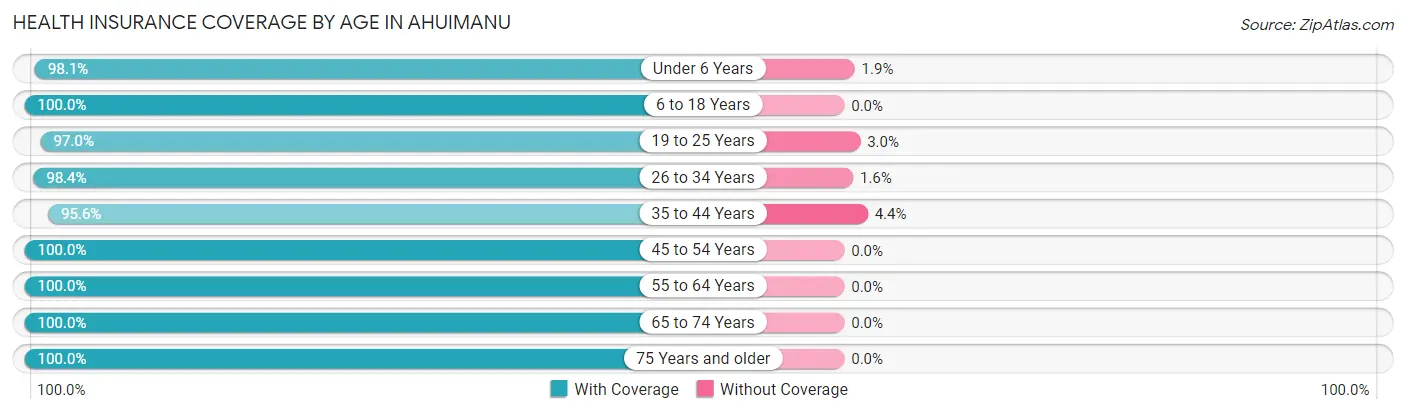
| Age Bracket | With Coverage | Without Coverage |
| Under 6 Years | 916 (98.1%) | 18 (1.9%) |
| 6 to 18 Years | 1,636 (100.0%) | 0 (0.0%) |
| 19 to 25 Years | 556 (97.0%) | 17 (3.0%) |
| 26 to 34 Years | 964 (98.4%) | 16 (1.6%) |
| 35 to 44 Years | 833 (95.6%) | 38 (4.4%) |
| 45 to 54 Years | 950 (100.0%) | 0 (0.0%) |
| 55 to 64 Years | 1,317 (100.0%) | 0 (0.0%) |
| 65 to 74 Years | 958 (100.0%) | 0 (0.0%) |
| 75 Years and older | 828 (100.0%) | 0 (0.0%) |
| Total | 8,958 (99.0%) | 89 (1.0%) |
Health Insurance Coverage by Citizenship Status in Ahuimanu
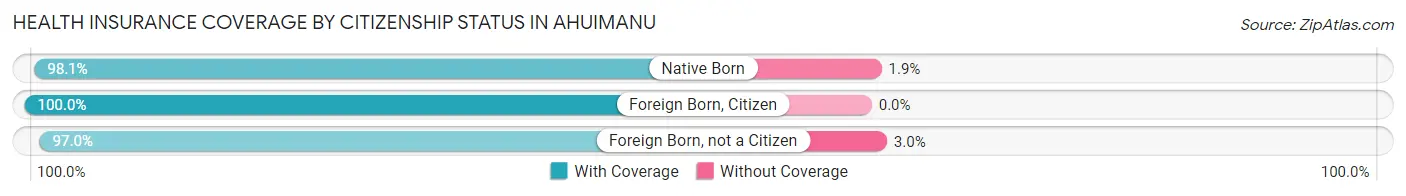
| Citizenship Status | With Coverage | Without Coverage |
| Native Born | 916 (98.1%) | 18 (1.9%) |
| Foreign Born, Citizen | 1,636 (100.0%) | 0 (0.0%) |
| Foreign Born, not a Citizen | 556 (97.0%) | 17 (3.0%) |
Health Insurance Coverage by Household Income in Ahuimanu
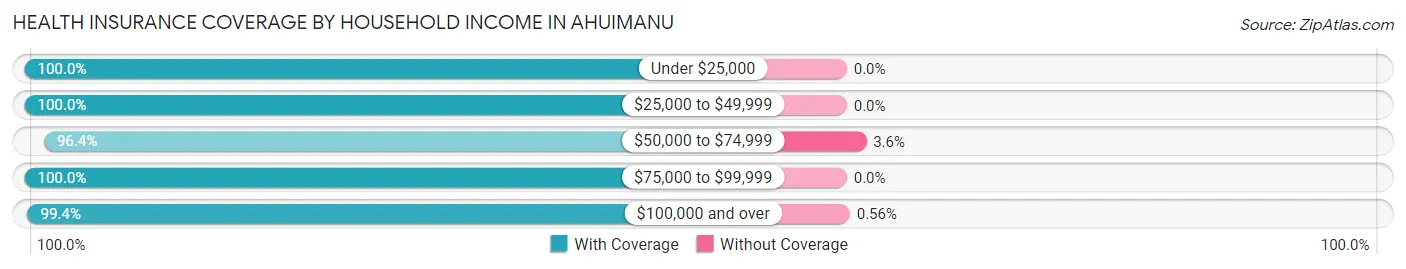
| Household Income | With Coverage | Without Coverage |
| Under $25,000 | 213 (100.0%) | 0 (0.0%) |
| $25,000 to $49,999 | 526 (100.0%) | 0 (0.0%) |
| $50,000 to $74,999 | 1,005 (96.4%) | 38 (3.6%) |
| $75,000 to $99,999 | 1,193 (100.0%) | 0 (0.0%) |
| $100,000 and over | 6,002 (99.4%) | 34 (0.6%) |
Public vs Private Health Insurance Coverage by Age in Ahuimanu
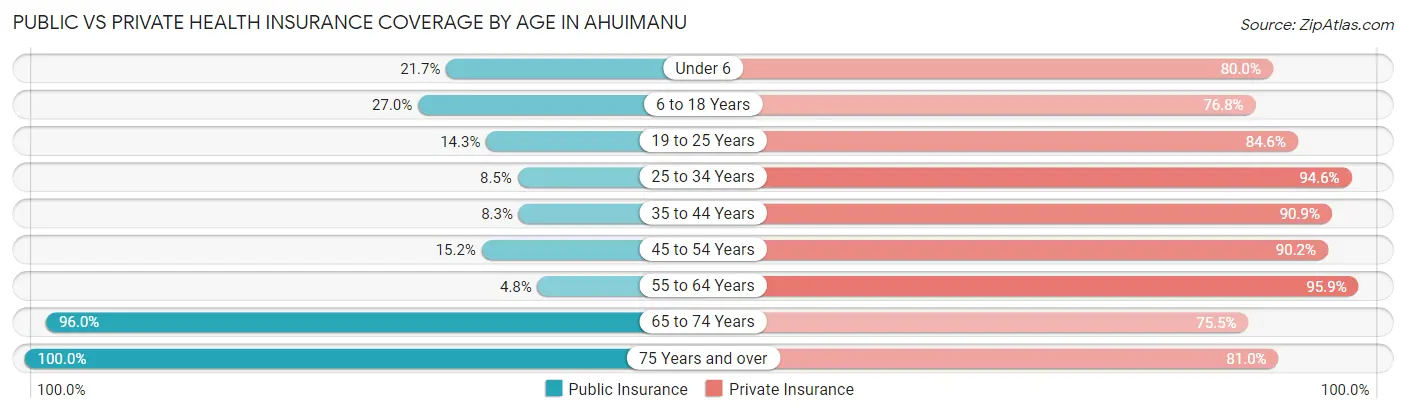
| Age Bracket | Public Insurance | Private Insurance |
| Under 6 | 203 (21.7%) | 747 (80.0%) |
| 6 to 18 Years | 441 (27.0%) | 1,256 (76.8%) |
| 19 to 25 Years | 82 (14.3%) | 485 (84.6%) |
| 25 to 34 Years | 83 (8.5%) | 927 (94.6%) |
| 35 to 44 Years | 72 (8.3%) | 792 (90.9%) |
| 45 to 54 Years | 144 (15.2%) | 857 (90.2%) |
| 55 to 64 Years | 63 (4.8%) | 1,263 (95.9%) |
| 65 to 74 Years | 920 (96.0%) | 723 (75.5%) |
| 75 Years and over | 828 (100.0%) | 671 (81.0%) |
| Total | 2,836 (31.4%) | 7,721 (85.3%) |
Disability Status by Sex by Age in Ahuimanu
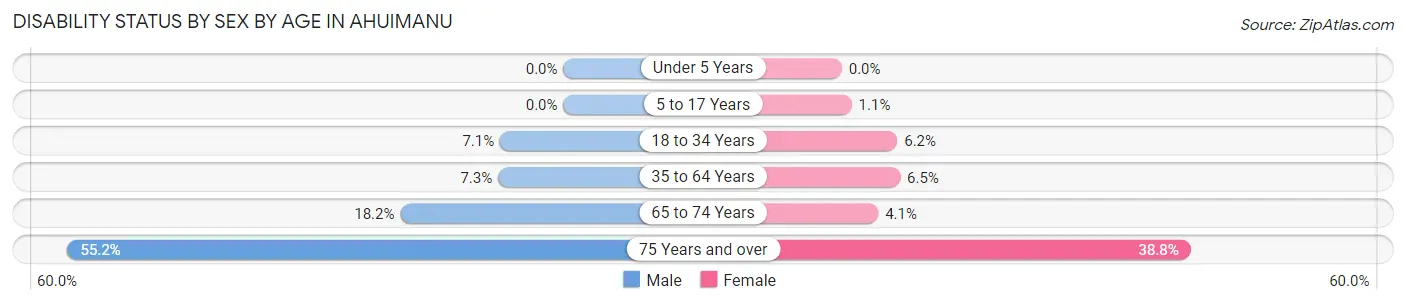
| Age Bracket | Male | Female |
| Under 5 Years | 0 (0.0%) | 0 (0.0%) |
| 5 to 17 Years | 0 (0.0%) | 9 (1.1%) |
| 18 to 34 Years | 53 (7.0%) | 55 (6.2%) |
| 35 to 64 Years | 115 (7.3%) | 101 (6.5%) |
| 65 to 74 Years | 71 (18.2%) | 23 (4.1%) |
| 75 Years and over | 153 (55.2%) | 214 (38.8%) |
Disability Class by Sex by Age in Ahuimanu
Disability Class: Hearing Difficulty
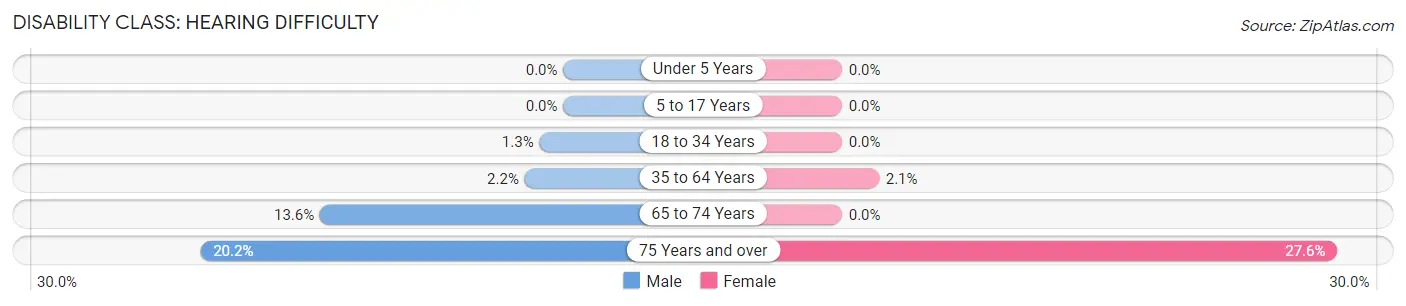
| Age Bracket | Male | Female |
| Under 5 Years | 0 (0.0%) | 0 (0.0%) |
| 5 to 17 Years | 0 (0.0%) | 0 (0.0%) |
| 18 to 34 Years | 10 (1.3%) | 0 (0.0%) |
| 35 to 64 Years | 34 (2.1%) | 32 (2.1%) |
| 65 to 74 Years | 53 (13.6%) | 0 (0.0%) |
| 75 Years and over | 56 (20.2%) | 152 (27.6%) |
Disability Class: Vision Difficulty
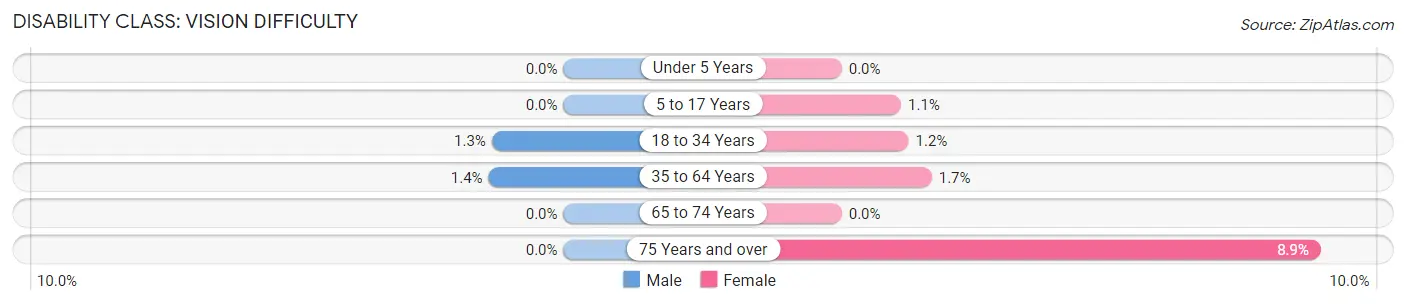
| Age Bracket | Male | Female |
| Under 5 Years | 0 (0.0%) | 0 (0.0%) |
| 5 to 17 Years | 0 (0.0%) | 9 (1.1%) |
| 18 to 34 Years | 10 (1.3%) | 11 (1.2%) |
| 35 to 64 Years | 22 (1.4%) | 26 (1.7%) |
| 65 to 74 Years | 0 (0.0%) | 0 (0.0%) |
| 75 Years and over | 0 (0.0%) | 49 (8.9%) |
Disability Class: Cognitive Difficulty
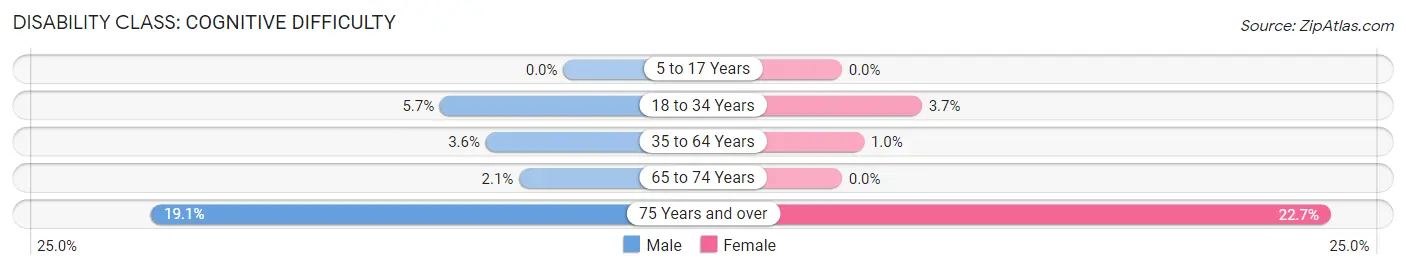
| Age Bracket | Male | Female |
| 5 to 17 Years | 0 (0.0%) | 0 (0.0%) |
| 18 to 34 Years | 43 (5.7%) | 33 (3.7%) |
| 35 to 64 Years | 57 (3.6%) | 16 (1.0%) |
| 65 to 74 Years | 8 (2.1%) | 0 (0.0%) |
| 75 Years and over | 53 (19.1%) | 125 (22.7%) |
Disability Class: Ambulatory Difficulty
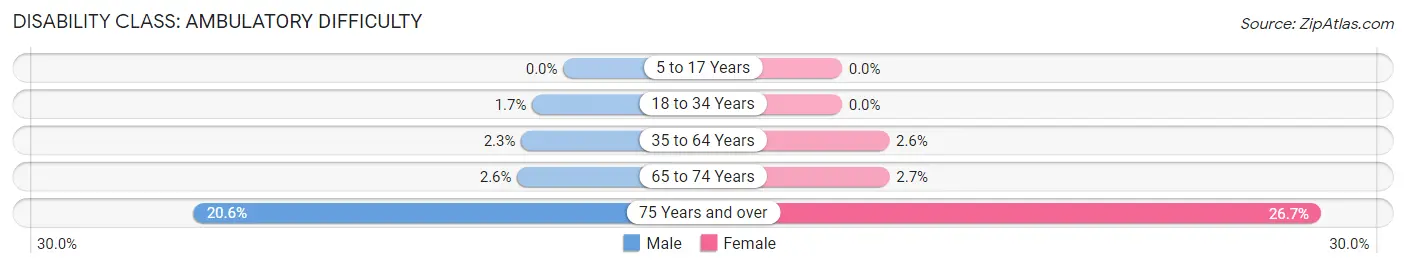
| Age Bracket | Male | Female |
| 5 to 17 Years | 0 (0.0%) | 0 (0.0%) |
| 18 to 34 Years | 13 (1.7%) | 0 (0.0%) |
| 35 to 64 Years | 37 (2.3%) | 41 (2.6%) |
| 65 to 74 Years | 10 (2.6%) | 15 (2.6%) |
| 75 Years and over | 57 (20.6%) | 147 (26.7%) |
Disability Class: Self-Care Difficulty
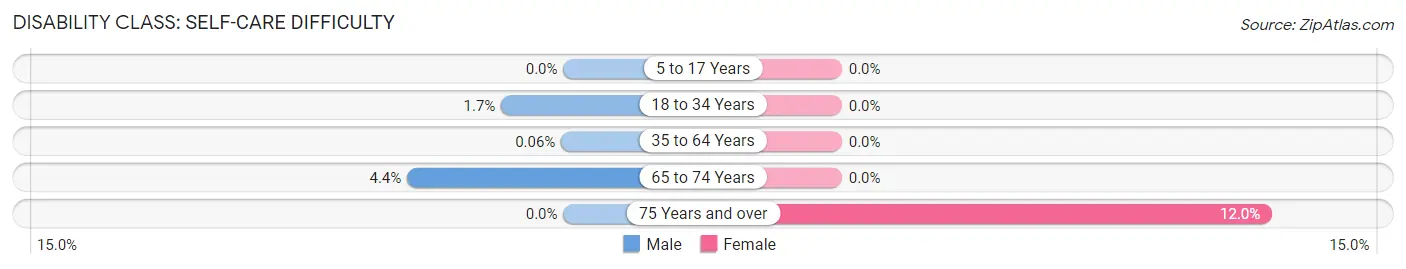
| Age Bracket | Male | Female |
| 5 to 17 Years | 0 (0.0%) | 0 (0.0%) |
| 18 to 34 Years | 13 (1.7%) | 0 (0.0%) |
| 35 to 64 Years | 1 (0.1%) | 0 (0.0%) |
| 65 to 74 Years | 17 (4.3%) | 0 (0.0%) |
| 75 Years and over | 0 (0.0%) | 66 (12.0%) |
Technology Access in Ahuimanu
Computing Device Access in Ahuimanu
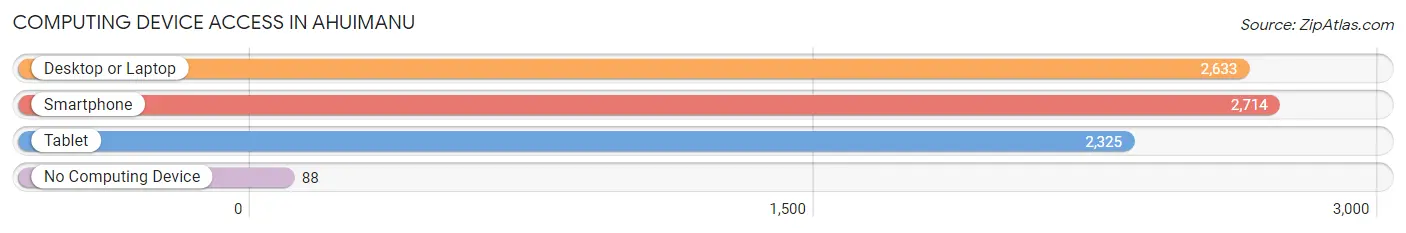
| Device Type | # Households | % Households |
| Desktop or Laptop | 2,633 | 88.8% |
| Smartphone | 2,714 | 91.5% |
| Tablet | 2,325 | 78.4% |
| No Computing Device | 88 | 3.0% |
| Total | 2,966 | 100.0% |
Internet Access in Ahuimanu
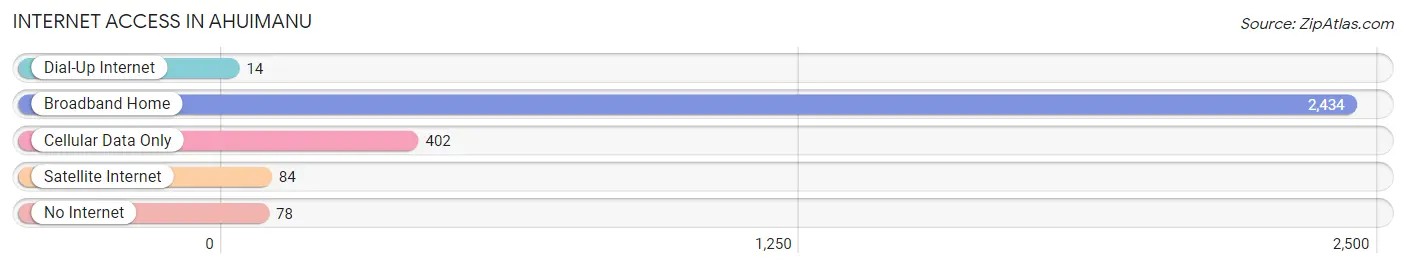
| Internet Type | # Households | % Households |
| Dial-Up Internet | 14 | 0.5% |
| Broadband Home | 2,434 | 82.1% |
| Cellular Data Only | 402 | 13.6% |
| Satellite Internet | 84 | 2.8% |
| No Internet | 78 | 2.6% |
| Total | 2,966 | 100.0% |
Ahuimanu Summary
Ahuimanu is a census-designated place (CDP) located in the City and County of Honolulu, Hawaii, United States. It is located on the windward side of the island of Oahu, approximately 20 miles (32 km) from downtown Honolulu. As of the 2010 Census, the CDP had a population of 8,914.
History
Ahuimanu was originally a small fishing village located in the ahupuaa (traditional Hawaiian land division) of Koolaupoko. The ahupuaa was part of the larger moku (district) of Koolaupoko, which was ruled by the high chief Kahahawai. The ahupuaa was divided into several smaller ahupuaa, including Ahuimanu, which was ruled by the high chief Kahahawai.
The first Europeans to visit Ahuimanu were the crew of the HMS Resolution, led by Captain James Cook, in 1778. Cook and his crew stayed in the area for several days, trading with the local Hawaiians and exploring the area.
In the early 19th century, Ahuimanu was a popular destination for whalers and traders. The area was also home to several sugar plantations, which were established in the late 19th century.
Geography
Ahuimanu is located on the windward side of the island of Oahu, approximately 20 miles (32 km) from downtown Honolulu. The CDP has a total area of 4.2 square miles (10.8 km2), of which 4.1 square miles (10.6 km2) is land and 0.1 square miles (0.2 km2) is water.
The terrain of Ahuimanu is mostly hilly, with elevations ranging from sea level to 1,000 feet (305 m). The area is located in the Koolaupoko District of Oahu, and is bordered by the towns of Kaneohe to the east, Kailua to the south, and Waiahole to the west.
Economy
Ahuimanu is primarily a residential community, with most of its residents commuting to Honolulu for work. The area is home to several small businesses, including restaurants, retail stores, and service providers.
The area is also home to several large employers, including the Hawaii State Hospital, the Hawaii National Guard, and the U.S. Army Corps of Engineers.
Demographics
As of the 2010 Census, there were 8,914 people, 2,945 households, and 2,521 families residing in the CDP. The population density was 2,150.3 people per square mile (830.2/km2). There were 3,093 housing units at an average density of 751.3 per square mile (290.2/km2).
The racial makeup of the CDP was 44.2% White, 0.7% African American, 0.3% Native American, 28.2% Asian, 8.2% Pacific Islander, 0.7% from other races, and 17.4% from two or more races. Hispanic or Latino of any race were 8.2% of the population.
There were 2,945 households, out of which 37.2% had children under the age of 18 living with them, 63.2% were married couples living together, 11.2% had a female householder with no husband present, and 20.7% were non-families. 16.2% of all households were made up of individuals, and 5.3% had someone living alone who was 65 years of age or older. The average household size was 3.02 and the average family size was 3.41.
In the CDP, the population was spread out, with 25.7% under the age of 18, 8.2% from 18 to 24, 28.2% from 25 to 44, 27.2% from 45 to 64, and 10.7% who were 65 years of age or older. The median age was 38 years. For every 100 females, there were 97.2 males. For every 100 females age 18 and over, there were 94.7 males.
The median income for a household in the CDP was $76,944, and the median income for a family was $81,944. Males had a median income of $51,944 versus $41,944 for females. The per capita income for the CDP was $30,944. About 4.2% of families and 5.3% of the population were below the poverty line, including 6.2% of those under age 18 and 4.2% of those age 65 or over.
Common Questions
What is Per Capita Income in Ahuimanu?
Per Capita income in Ahuimanu is $47,828.
What is the Median Family Income in Ahuimanu?
Median Family Income in Ahuimanu is $143,829.
What is the Median Household income in Ahuimanu?
Median Household Income in Ahuimanu is $124,018.
What is Income or Wage Gap in Ahuimanu?
Income or Wage Gap in Ahuimanu is 15.2%.
Women in Ahuimanu earn 84.8 cents for every dollar earned by a man.
What is Inequality or Gini Index in Ahuimanu?
Inequality or Gini Index in Ahuimanu is 0.35.
What is the Total Population of Ahuimanu?
Total Population of Ahuimanu is 9,177.
What is the Total Male Population of Ahuimanu?
Total Male Population of Ahuimanu is 4,431.
What is the Total Female Population of Ahuimanu?
Total Female Population of Ahuimanu is 4,746.
What is the Ratio of Males per 100 Females in Ahuimanu?
There are 93.36 Males per 100 Females in Ahuimanu.
What is the Ratio of Females per 100 Males in Ahuimanu?
There are 107.11 Females per 100 Males in Ahuimanu.
What is the Median Population Age in Ahuimanu?
Median Population Age in Ahuimanu is 38.9 Years.
What is the Average Family Size in Ahuimanu
Average Family Size in Ahuimanu is 3.4 People.
What is the Average Household Size in Ahuimanu
Average Household Size in Ahuimanu is 3.1 People.
How Large is the Labor Force in Ahuimanu?
There are 4,715 People in the Labor Forcein in Ahuimanu.
What is the Percentage of People in the Labor Force in Ahuimanu?
67.9% of People are in the Labor Force in Ahuimanu.
What is the Unemployment Rate in Ahuimanu?
Unemployment Rate in Ahuimanu is 1.9%.