Pukalani, HI Map & Demographics
Pukalani Map
Pukalani Overview
$51,150
PER CAPITA INCOME
$117,736
AVG FAMILY INCOME
$119,426
AVG HOUSEHOLD INCOME
17.5%
WAGE / INCOME GAP [ % ]
82.5¢/ $1
WAGE / INCOME GAP [ $ ]
0.41
INEQUALITY / GINI INDEX
7,930
TOTAL POPULATION
3,996
MALE POPULATION
3,934
FEMALE POPULATION
101.58
MALES / 100 FEMALES
98.45
FEMALES / 100 MALES
48.7
MEDIAN AGE
3.2
AVG FAMILY SIZE
2.8
AVG HOUSEHOLD SIZE
4,607
LABOR FORCE [ PEOPLE ]
66.3%
PERCENT IN LABOR FORCE
3.3%
UNEMPLOYMENT RATE
Pukalani Area Codes
Income in Pukalani
Income Overview in Pukalani
Per Capita Income in Pukalani is $51,150, while median incomes of families and households are $117,736 and $119,426 respectively.
| Characteristic | Number | Measure |
| Per Capita Income | 7,930 | $51,150 |
| Median Family Income | 1,967 | $117,736 |
| Mean Family Income | 1,967 | $133,558 |
| Median Household Income | 2,797 | $119,426 |
| Mean Household Income | 2,797 | $147,407 |
| Income Deficit | 1,967 | $0 |
| Wage / Income Gap (%) | 7,930 | 17.48% |
| Wage / Income Gap ($) | 7,930 | 82.52¢ per $1 |
| Gini / Inequality Index | 7,930 | 0.41 |
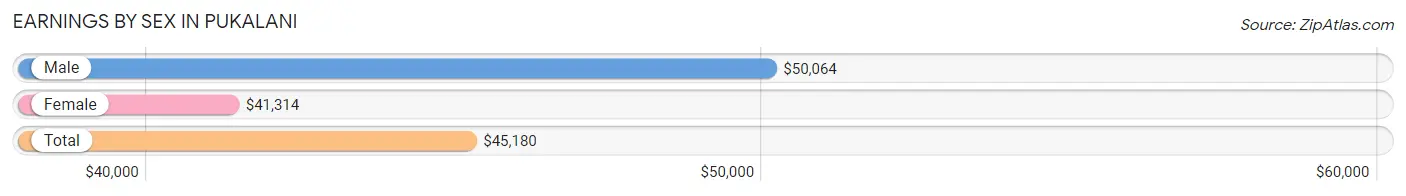
Earnings by Sex in Pukalani
Average Earnings in Pukalani are $45,180, $50,064 for men and $41,314 for women, a difference of 17.5%.
| Sex | Number | Average Earnings |
| Male | 2,122 (45.4%) | $50,064 |
| Female | 2,551 (54.6%) | $41,314 |
| Total | 4,673 (100.0%) | $45,180 |
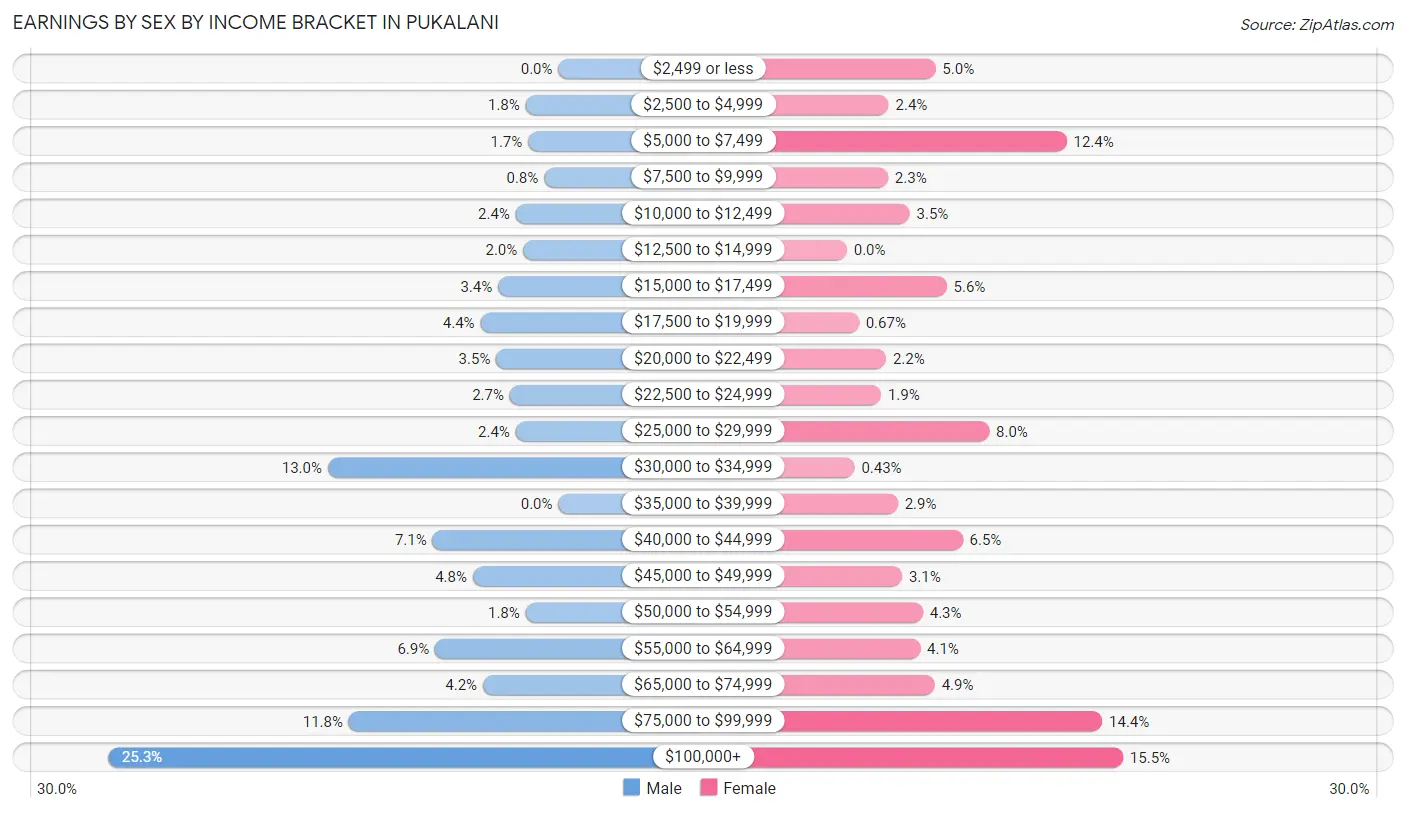
Earnings by Sex by Income Bracket in Pukalani
The most common earnings brackets in Pukalani are $100,000+ for men (536 | 25.3%) and $100,000+ for women (396 | 15.5%).
| Income | Male | Female |
| $2,499 or less | 0 (0.0%) | 127 (5.0%) |
| $2,500 to $4,999 | 39 (1.8%) | 60 (2.4%) |
| $5,000 to $7,499 | 36 (1.7%) | 315 (12.3%) |
| $7,500 to $9,999 | 17 (0.8%) | 59 (2.3%) |
| $10,000 to $12,499 | 51 (2.4%) | 90 (3.5%) |
| $12,500 to $14,999 | 42 (2.0%) | 0 (0.0%) |
| $15,000 to $17,499 | 72 (3.4%) | 143 (5.6%) |
| $17,500 to $19,999 | 93 (4.4%) | 17 (0.7%) |
| $20,000 to $22,499 | 74 (3.5%) | 56 (2.2%) |
| $22,500 to $24,999 | 58 (2.7%) | 49 (1.9%) |
| $25,000 to $29,999 | 51 (2.4%) | 204 (8.0%) |
| $30,000 to $34,999 | 275 (13.0%) | 11 (0.4%) |
| $35,000 to $39,999 | 0 (0.0%) | 73 (2.9%) |
| $40,000 to $44,999 | 150 (7.1%) | 166 (6.5%) |
| $45,000 to $49,999 | 102 (4.8%) | 79 (3.1%) |
| $50,000 to $54,999 | 39 (1.8%) | 109 (4.3%) |
| $55,000 to $64,999 | 147 (6.9%) | 105 (4.1%) |
| $65,000 to $74,999 | 90 (4.2%) | 126 (4.9%) |
| $75,000 to $99,999 | 250 (11.8%) | 366 (14.3%) |
| $100,000+ | 536 (25.3%) | 396 (15.5%) |
| Total | 2,122 (100.0%) | 2,551 (100.0%) |
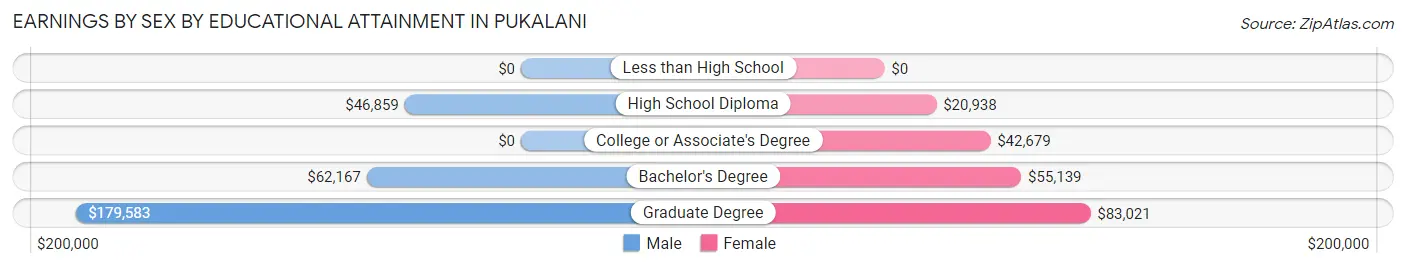
Earnings by Sex by Educational Attainment in Pukalani
Average earnings in Pukalani are $61,420 for men and $45,375 for women, a difference of 26.1%. Men with an educational attainment of graduate degree enjoy the highest average annual earnings of $179,583, while those with high school diploma education earn the least with $46,859. Women with an educational attainment of graduate degree earn the most with the average annual earnings of $83,021, while those with high school diploma education have the smallest earnings of $20,938.
| Educational Attainment | Male Income | Female Income |
| Less than High School | - | - |
| High School Diploma | $46,859 | $20,938 |
| College or Associate's Degree | - | - |
| Bachelor's Degree | $62,167 | $55,139 |
| Graduate Degree | $179,583 | $83,021 |
| Total | $61,420 | $45,375 |
Family Income in Pukalani
Family Income Brackets in Pukalani
According to the Pukalani family income data, there are 539 families falling into the $200,000+ income range, which is the most common income bracket and makes up 27.4% of all families. Conversely, the $10,000 to $14,999 income bracket is the least frequent group with only 28 families (1.4%) belonging to this category.
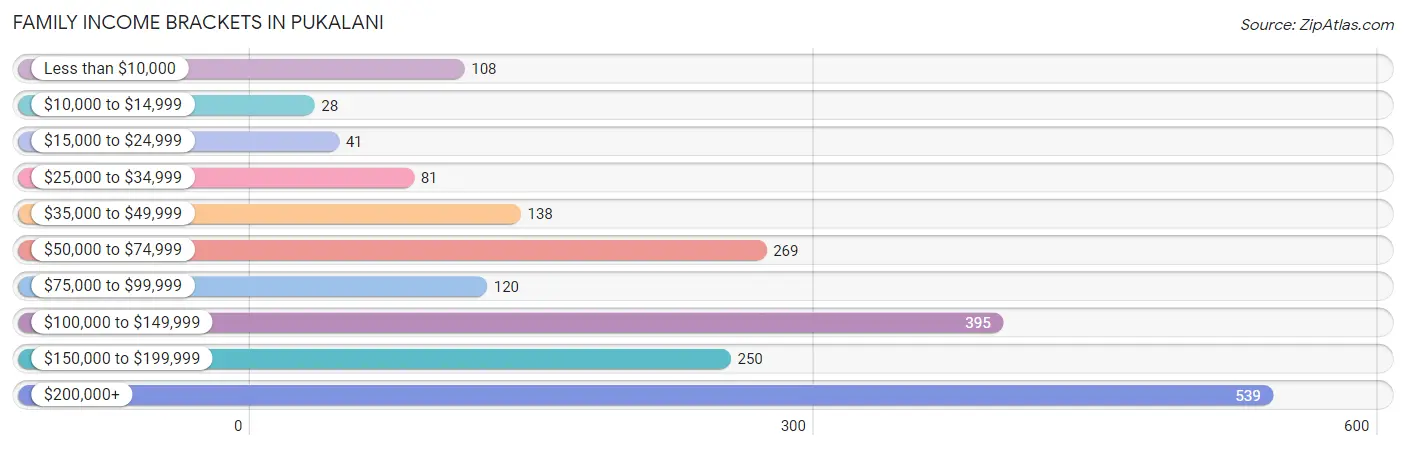
| Income Bracket | # Families | % Families |
| Less than $10,000 | 108 | 5.5% |
| $10,000 to $14,999 | 28 | 1.4% |
| $15,000 to $24,999 | 41 | 2.1% |
| $25,000 to $34,999 | 81 | 4.1% |
| $35,000 to $49,999 | 138 | 7.0% |
| $50,000 to $74,999 | 269 | 13.7% |
| $75,000 to $99,999 | 120 | 6.1% |
| $100,000 to $149,999 | 395 | 20.1% |
| $150,000 to $199,999 | 250 | 12.7% |
| $200,000+ | 539 | 27.4% |
Family Income by Famaliy Size in Pukalani
5-person families (251 | 12.8%) account for the highest median family income in Pukalani with $207,963 per family, while 2-person families (966 | 49.1%) have the highest median income of $55,057 per family member.
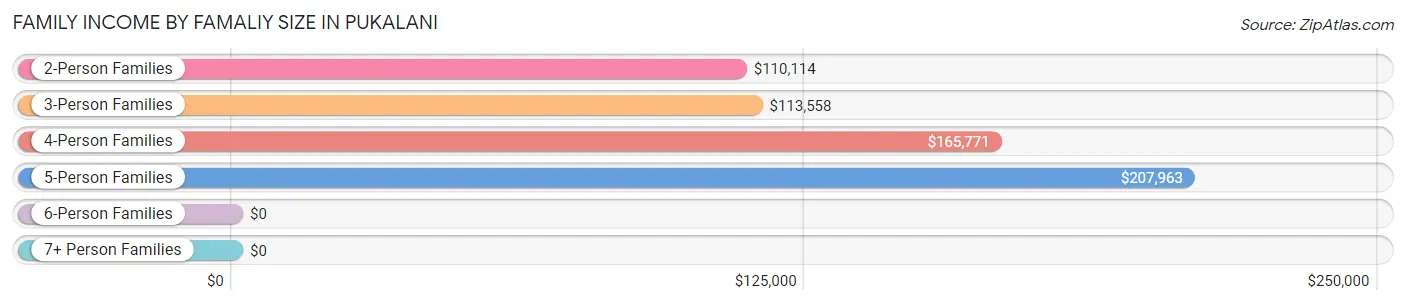
| Income Bracket | # Families | Median Income |
| 2-Person Families | 966 (49.1%) | $110,114 |
| 3-Person Families | 342 (17.4%) | $113,558 |
| 4-Person Families | 369 (18.8%) | $165,771 |
| 5-Person Families | 251 (12.8%) | $207,963 |
| 6-Person Families | 15 (0.8%) | $0 |
| 7+ Person Families | 24 (1.2%) | $0 |
| Total | 1,967 (100.0%) | $117,736 |
Family Income by Number of Earners in Pukalani
The median family income in Pukalani is $117,736, with families comprising 3+ earners (434) having the highest median family income of $208,315, while families with no earners (368) have the lowest median family income of $53,542, accounting for 22.1% and 18.7% of families, respectively.
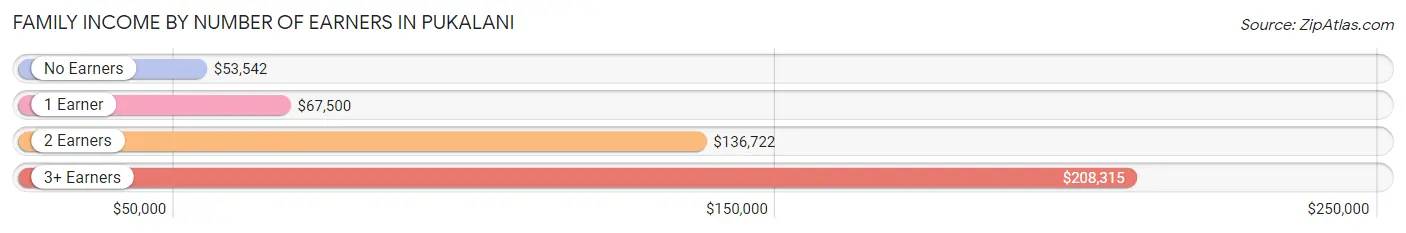
| Number of Earners | # Families | Median Income |
| No Earners | 368 (18.7%) | $53,542 |
| 1 Earner | 562 (28.6%) | $67,500 |
| 2 Earners | 603 (30.7%) | $136,722 |
| 3+ Earners | 434 (22.1%) | $208,315 |
| Total | 1,967 (100.0%) | $117,736 |
Household Income in Pukalani
Household Income Brackets in Pukalani
With 741 households falling in the category, the $200,000+ income range is the most frequent in Pukalani, accounting for 26.5% of all households. In contrast, only 22 households (0.8%) fall into the $25,000 to $34,999 income bracket, making it the least populous group.
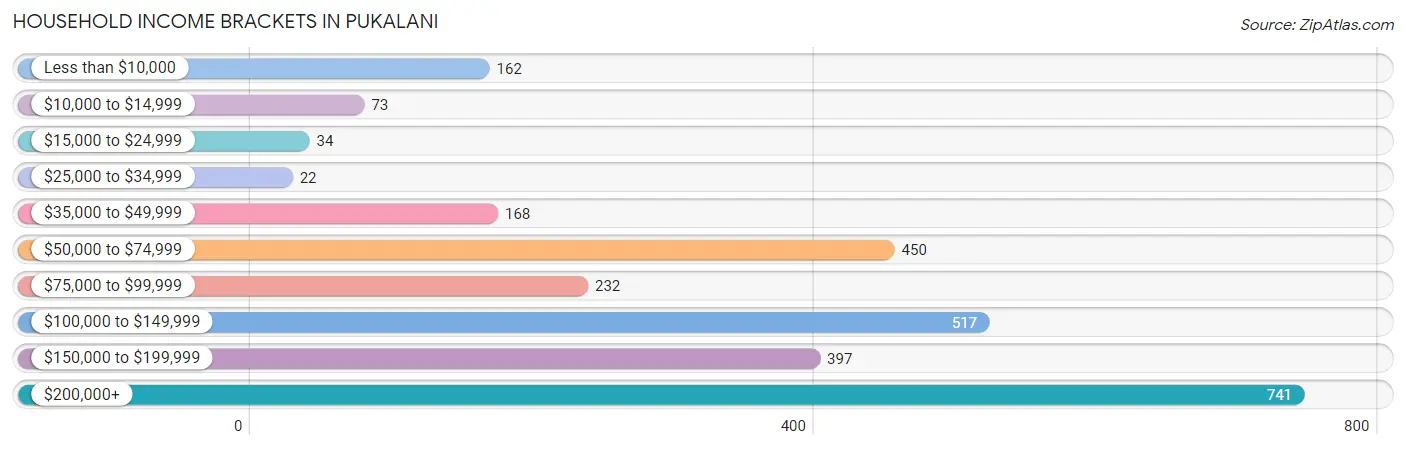
| Income Bracket | # Households | % Households |
| Less than $10,000 | 162 | 5.8% |
| $10,000 to $14,999 | 73 | 2.6% |
| $15,000 to $24,999 | 34 | 1.2% |
| $25,000 to $34,999 | 22 | 0.8% |
| $35,000 to $49,999 | 168 | 6.0% |
| $50,000 to $74,999 | 450 | 16.1% |
| $75,000 to $99,999 | 232 | 8.3% |
| $100,000 to $149,999 | 517 | 18.5% |
| $150,000 to $199,999 | 397 | 14.2% |
| $200,000+ | 741 | 26.5% |
Household Income by Householder Age in Pukalani
The median household income in Pukalani is $119,426, with the highest median household income of $150,060 found in the 45 to 64 years age bracket for the primary householder. A total of 1,420 households (50.8%) fall into this category.
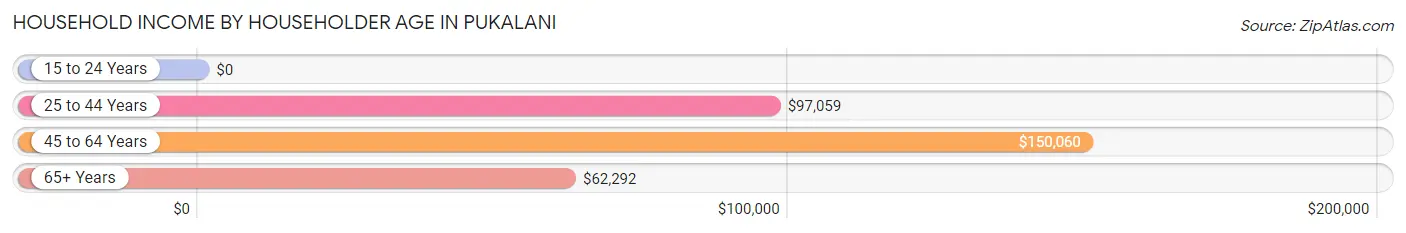
| Income Bracket | # Households | Median Income |
| 15 to 24 Years | 0 (0.0%) | $0 |
| 25 to 44 Years | 470 (16.8%) | $97,059 |
| 45 to 64 Years | 1,420 (50.8%) | $150,060 |
| 65+ Years | 907 (32.4%) | $62,292 |
| Total | 2,797 (100.0%) | $119,426 |
Poverty in Pukalani
Income Below Poverty by Sex and Age in Pukalani
With 15.1% poverty level for males and 10.4% for females among the residents of Pukalani, 12 to 14 year old males and 5 year old females are the most vulnerable to poverty, with 63 males (100.0%) and 52 females (43.7%) in their respective age groups living below the poverty level.
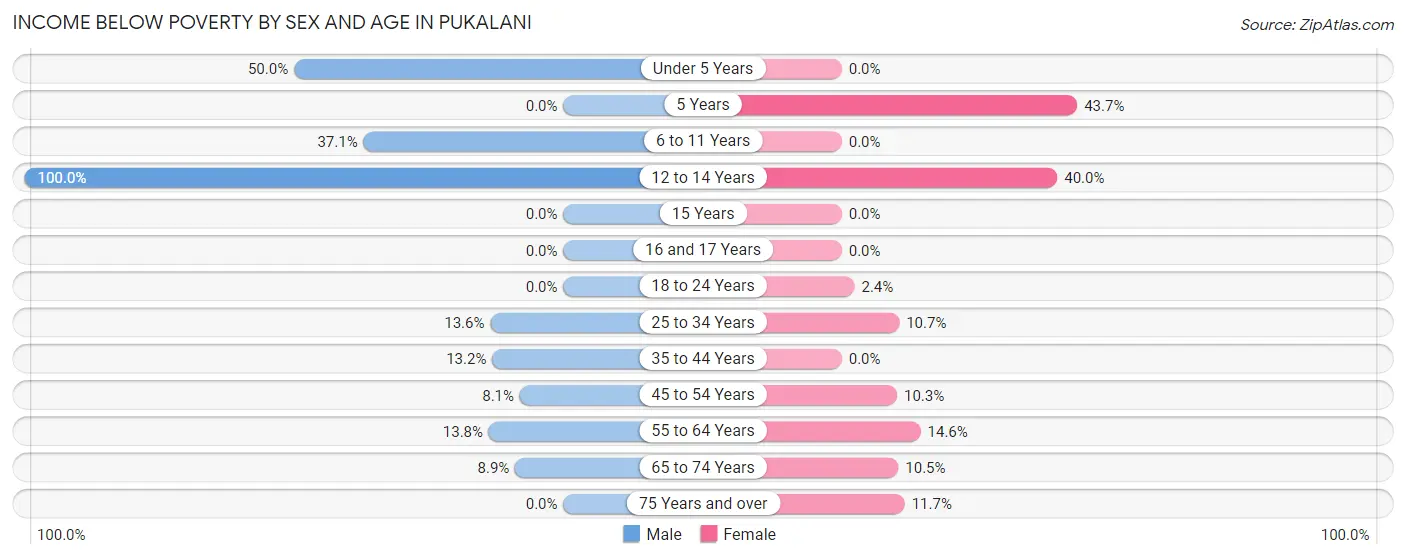
| Age Bracket | Male | Female |
| Under 5 Years | 168 (50.0%) | 0 (0.0%) |
| 5 Years | 0 (0.0%) | 52 (43.7%) |
| 6 to 11 Years | 69 (37.1%) | 0 (0.0%) |
| 12 to 14 Years | 63 (100.0%) | 16 (40.0%) |
| 15 Years | 0 (0.0%) | 0 (0.0%) |
| 16 and 17 Years | 0 (0.0%) | 0 (0.0%) |
| 18 to 24 Years | 0 (0.0%) | 6 (2.4%) |
| 25 to 34 Years | 72 (13.6%) | 76 (10.7%) |
| 35 to 44 Years | 45 (13.2%) | 0 (0.0%) |
| 45 to 54 Years | 49 (8.1%) | 62 (10.2%) |
| 55 to 64 Years | 78 (13.8%) | 103 (14.6%) |
| 65 to 74 Years | 58 (8.9%) | 71 (10.5%) |
| 75 Years and over | 0 (0.0%) | 25 (11.7%) |
| Total | 602 (15.1%) | 411 (10.4%) |
Income Above Poverty by Sex and Age in Pukalani
According to the poverty statistics in Pukalani, males aged 15 years and females aged under 5 years are the age groups that are most secure financially, with 100.0% of males and 100.0% of females in these age groups living above the poverty line.
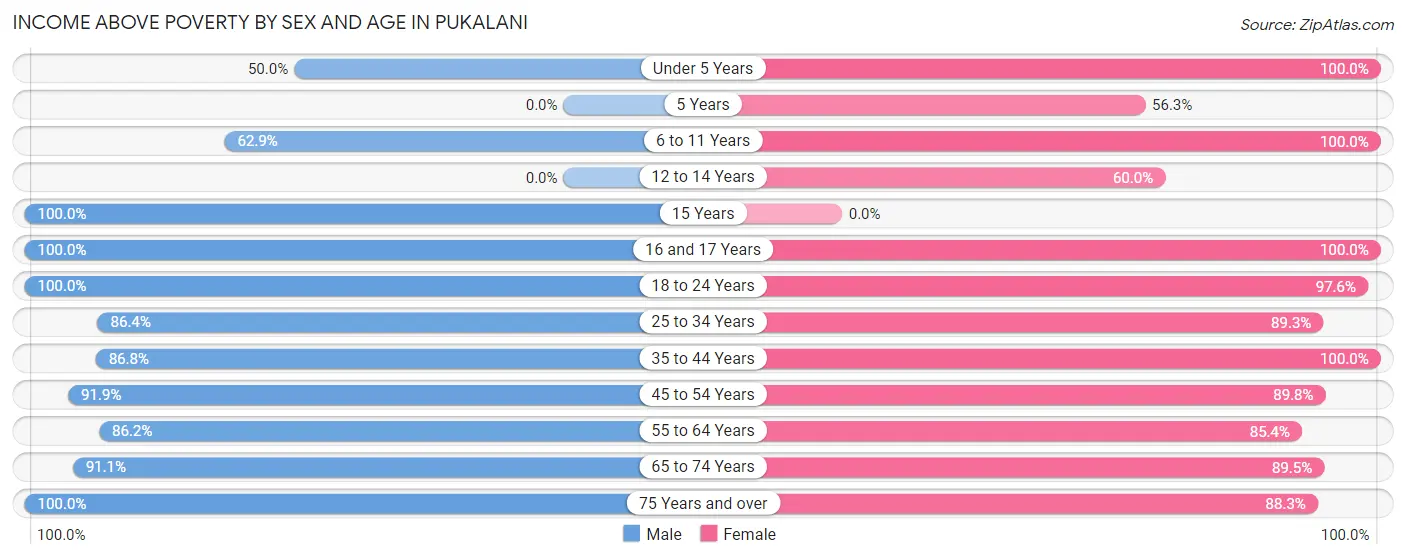
| Age Bracket | Male | Female |
| Under 5 Years | 168 (50.0%) | 144 (100.0%) |
| 5 Years | 0 (0.0%) | 67 (56.3%) |
| 6 to 11 Years | 117 (62.9%) | 43 (100.0%) |
| 12 to 14 Years | 0 (0.0%) | 24 (60.0%) |
| 15 Years | 50 (100.0%) | 0 (0.0%) |
| 16 and 17 Years | 171 (100.0%) | 97 (100.0%) |
| 18 to 24 Years | 313 (100.0%) | 247 (97.6%) |
| 25 to 34 Years | 459 (86.4%) | 637 (89.3%) |
| 35 to 44 Years | 296 (86.8%) | 326 (100.0%) |
| 45 to 54 Years | 558 (91.9%) | 543 (89.7%) |
| 55 to 64 Years | 486 (86.2%) | 601 (85.4%) |
| 65 to 74 Years | 591 (91.1%) | 605 (89.5%) |
| 75 Years and over | 185 (100.0%) | 189 (88.3%) |
| Total | 3,394 (84.9%) | 3,523 (89.5%) |
Income Below Poverty Among Married-Couple Families in Pukalani
The poverty statistics for married-couple families in Pukalani show that 7.3% or 110 of the total 1,503 families live below the poverty line. Families with no children have the highest poverty rate of 10.3%, comprising of 110 families. On the other hand, families with 1 or 2 children have the lowest poverty rate of 0.0%, which includes 0 families.
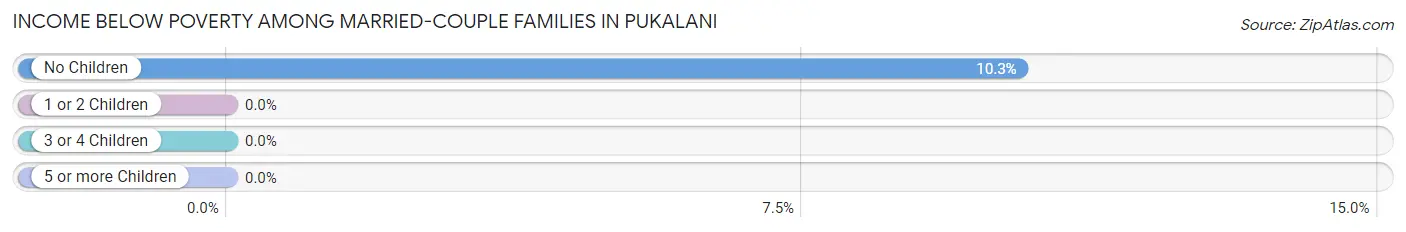
| Children | Above Poverty | Below Poverty |
| No Children | 956 (89.7%) | 110 (10.3%) |
| 1 or 2 Children | 375 (100.0%) | 0 (0.0%) |
| 3 or 4 Children | 62 (100.0%) | 0 (0.0%) |
| 5 or more Children | 0 (0.0%) | 0 (0.0%) |
| Total | 1,393 (92.7%) | 110 (7.3%) |
Income Below Poverty Among Single-Parent Households in Pukalani
According to the poverty data in Pukalani, 37.3% or 72 single-father households and 14.8% or 40 single-mother households are living below the poverty line. Among single-father households, those with 3 or 4 children have the highest poverty rate, with 72 households (100.0%) experiencing poverty. Likewise, among single-mother households, those with 3 or 4 children have the highest poverty rate, with 14 households (100.0%) falling below the poverty line.
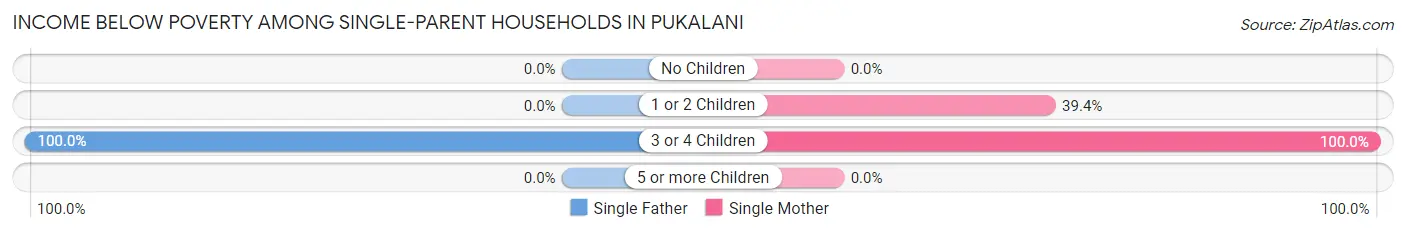
| Children | Single Father | Single Mother |
| No Children | 0 (0.0%) | 0 (0.0%) |
| 1 or 2 Children | 0 (0.0%) | 26 (39.4%) |
| 3 or 4 Children | 72 (100.0%) | 14 (100.0%) |
| 5 or more Children | 0 (0.0%) | 0 (0.0%) |
| Total | 72 (37.3%) | 40 (14.8%) |
Income Below Poverty Among Married-Couple vs Single-Parent Households in Pukalani
The poverty data for Pukalani shows that 110 of the married-couple family households (7.3%) and 112 of the single-parent households (24.1%) are living below the poverty level. Within the married-couple family households, those with no children have the highest poverty rate, with 110 households (10.3%) falling below the poverty line. Among the single-parent households, those with 3 or 4 children have the highest poverty rate, with 86 household (100.0%) living below poverty.
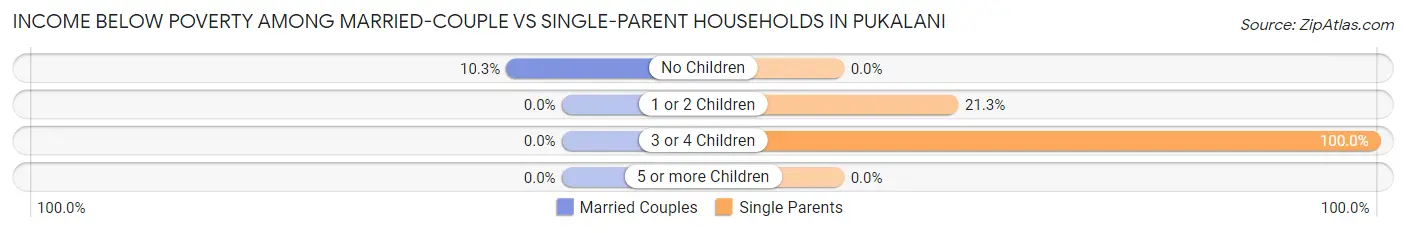
| Children | Married-Couple Families | Single-Parent Households |
| No Children | 110 (10.3%) | 0 (0.0%) |
| 1 or 2 Children | 0 (0.0%) | 26 (21.3%) |
| 3 or 4 Children | 0 (0.0%) | 86 (100.0%) |
| 5 or more Children | 0 (0.0%) | 0 (0.0%) |
| Total | 110 (7.3%) | 112 (24.1%) |
Race in Pukalani
The most populous races in Pukalani are Two or more Races (2,847 | 35.9%), White / Caucasian (2,631 | 33.2%), and Asian (1,965 | 24.8%).
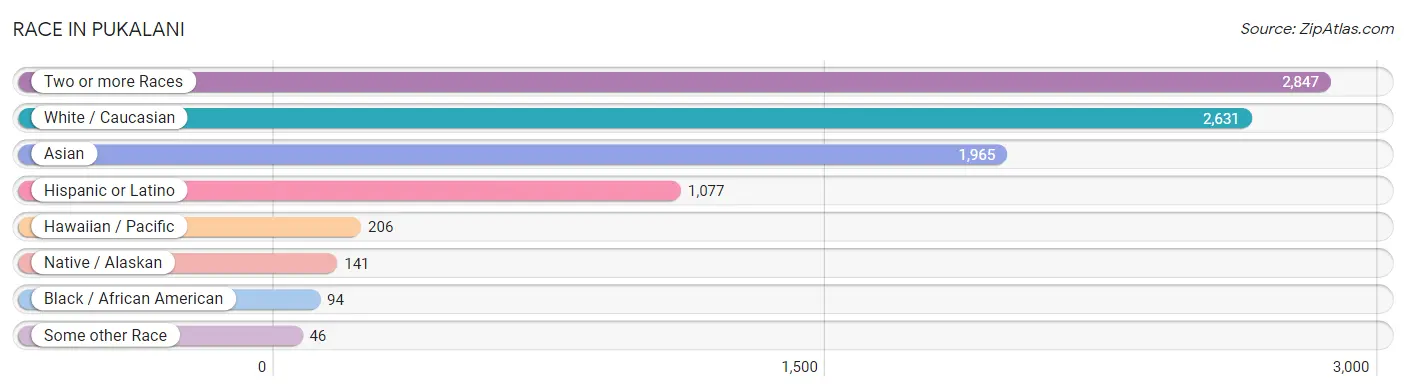
| Race | # Population | % Population |
| Asian | 1,965 | 24.8% |
| Black / African American | 94 | 1.2% |
| Hawaiian / Pacific | 206 | 2.6% |
| Hispanic or Latino | 1,077 | 13.6% |
| Native / Alaskan | 141 | 1.8% |
| White / Caucasian | 2,631 | 33.2% |
| Two or more Races | 2,847 | 35.9% |
| Some other Race | 46 | 0.6% |
| Total | 7,930 | 100.0% |
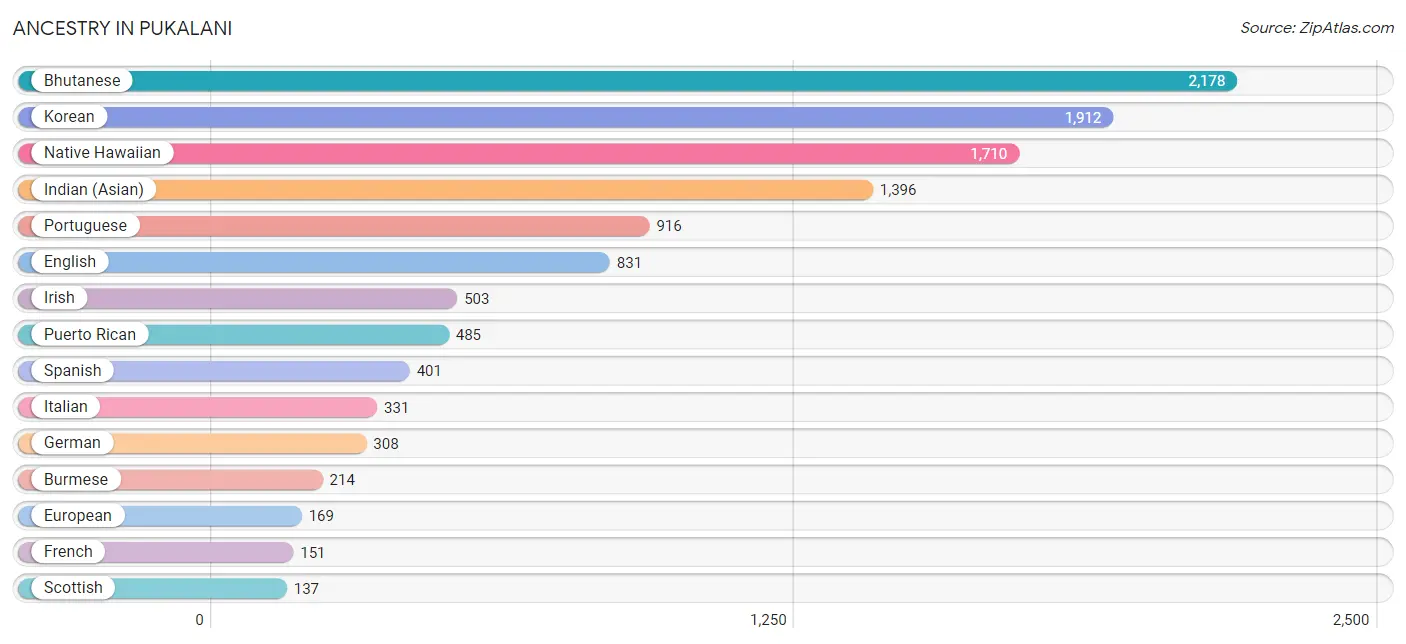
Ancestry in Pukalani
The most populous ancestries reported in Pukalani are Bhutanese (2,178 | 27.5%), Korean (1,912 | 24.1%), Native Hawaiian (1,710 | 21.6%), Indian (Asian) (1,396 | 17.6%), and Portuguese (916 | 11.6%), together accounting for 102.3% of all Pukalani residents.
| Ancestry | # Population | % Population |
| African | 52 | 0.7% |
| Arab | 55 | 0.7% |
| Austrian | 34 | 0.4% |
| Bhutanese | 2,178 | 27.5% |
| British | 41 | 0.5% |
| Burmese | 214 | 2.7% |
| Cherokee | 94 | 1.2% |
| Chippewa | 98 | 1.2% |
| Czech | 12 | 0.2% |
| Dutch | 43 | 0.5% |
| Eastern European | 64 | 0.8% |
| English | 831 | 10.5% |
| European | 169 | 2.1% |
| French | 151 | 1.9% |
| German | 308 | 3.9% |
| Ghanaian | 48 | 0.6% |
| Hungarian | 28 | 0.4% |
| Indian (Asian) | 1,396 | 17.6% |
| Irish | 503 | 6.3% |
| Italian | 331 | 4.2% |
| Korean | 1,912 | 24.1% |
| Lebanese | 55 | 0.7% |
| Mexican | 127 | 1.6% |
| Native Hawaiian | 1,710 | 21.6% |
| Northern European | 5 | 0.1% |
| Norwegian | 15 | 0.2% |
| Polish | 117 | 1.5% |
| Portuguese | 916 | 11.6% |
| Puerto Rican | 485 | 6.1% |
| Russian | 39 | 0.5% |
| Samoan | 23 | 0.3% |
| Scandinavian | 22 | 0.3% |
| Scotch-Irish | 15 | 0.2% |
| Scottish | 137 | 1.7% |
| Slovak | 13 | 0.2% |
| Spanish | 401 | 5.1% |
| Subsaharan African | 100 | 1.3% |
| Swedish | 63 | 0.8% |
| Swiss | 23 | 0.3% | View All 39 Rows |
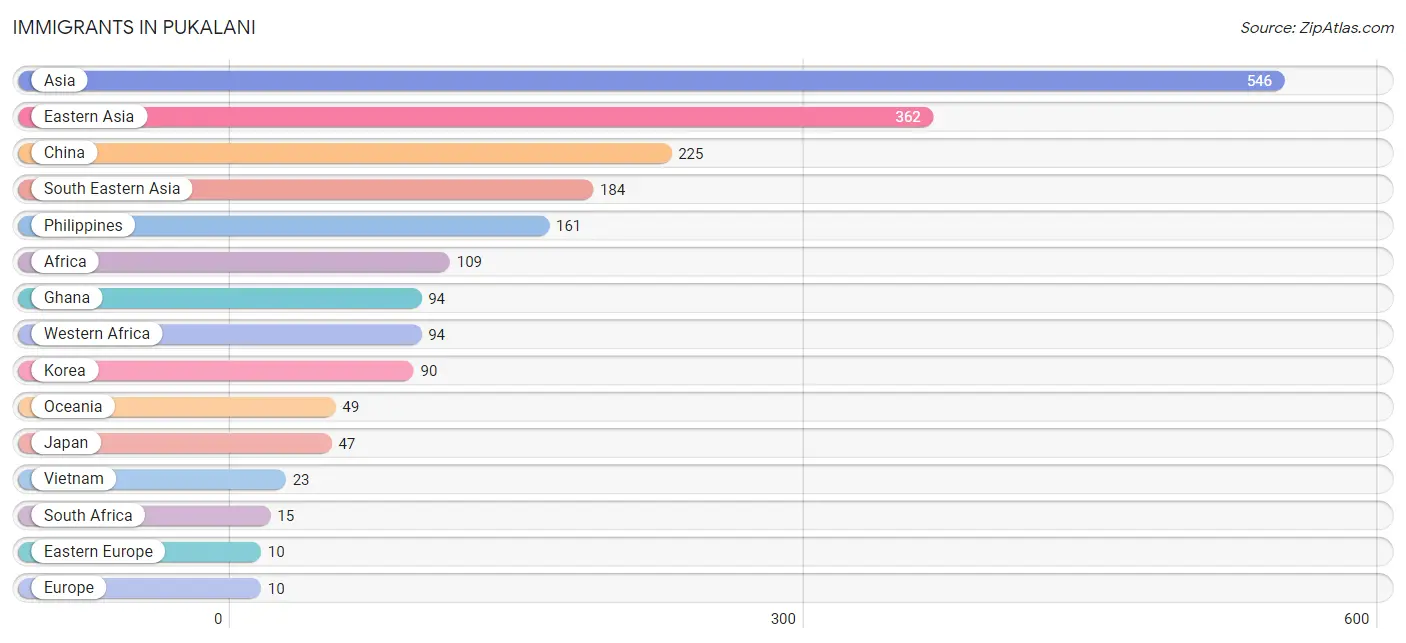
Immigrants in Pukalani
The most numerous immigrant groups reported in Pukalani came from Asia (546 | 6.9%), Eastern Asia (362 | 4.6%), China (225 | 2.8%), South Eastern Asia (184 | 2.3%), and Philippines (161 | 2.0%), together accounting for 18.6% of all Pukalani residents.
| Immigration Origin | # Population | % Population |
| Africa | 109 | 1.4% |
| Asia | 546 | 6.9% |
| Canada | 7 | 0.1% |
| China | 225 | 2.8% |
| Eastern Asia | 362 | 4.6% |
| Eastern Europe | 10 | 0.1% |
| Europe | 10 | 0.1% |
| Ghana | 94 | 1.2% |
| Hungary | 10 | 0.1% |
| Japan | 47 | 0.6% |
| Korea | 90 | 1.1% |
| Oceania | 49 | 0.6% |
| Philippines | 161 | 2.0% |
| South Africa | 15 | 0.2% |
| South Eastern Asia | 184 | 2.3% |
| Vietnam | 23 | 0.3% |
| Western Africa | 94 | 1.2% | View All 17 Rows |
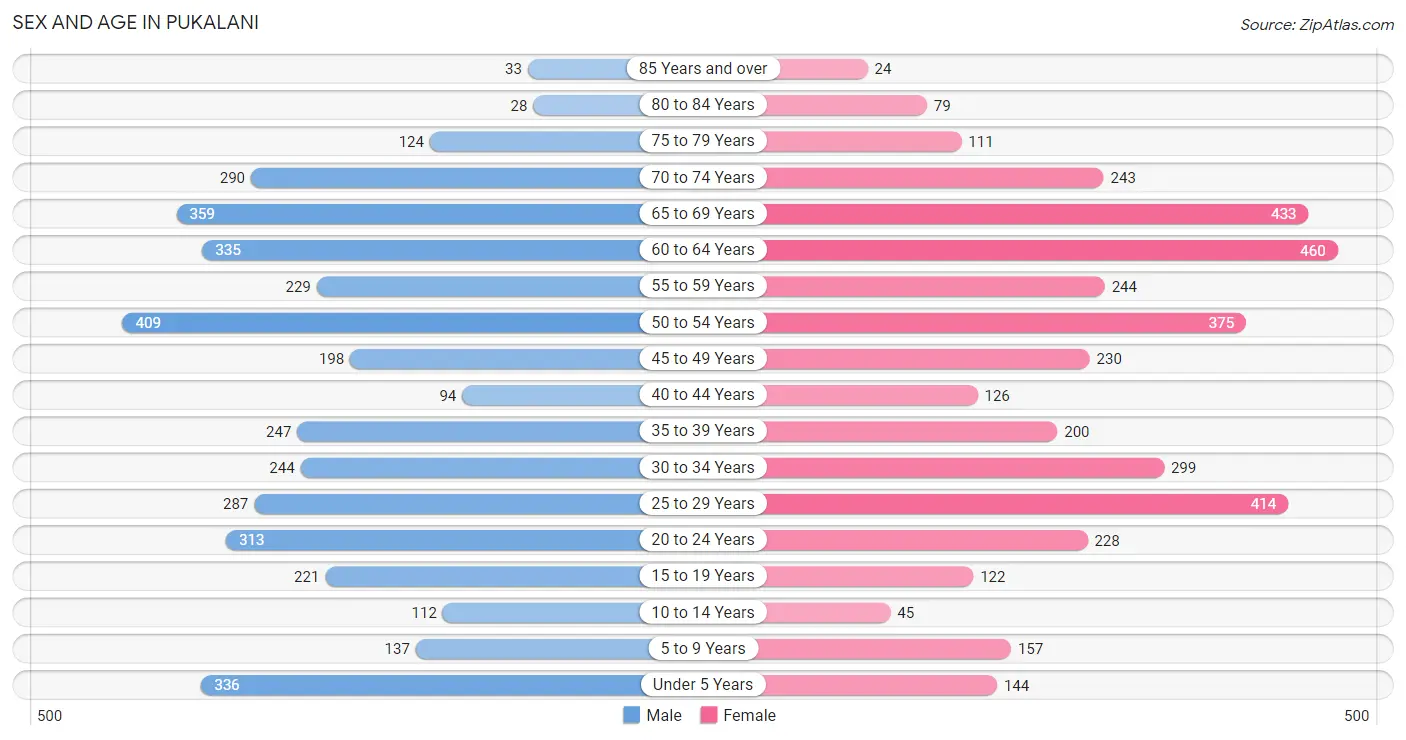
Sex and Age in Pukalani
Sex and Age in Pukalani
The most populous age groups in Pukalani are 50 to 54 Years (409 | 10.2%) for men and 60 to 64 Years (460 | 11.7%) for women.
| Age Bracket | Male | Female |
| Under 5 Years | 336 (8.4%) | 144 (3.7%) |
| 5 to 9 Years | 137 (3.4%) | 157 (4.0%) |
| 10 to 14 Years | 112 (2.8%) | 45 (1.1%) |
| 15 to 19 Years | 221 (5.5%) | 122 (3.1%) |
| 20 to 24 Years | 313 (7.8%) | 228 (5.8%) |
| 25 to 29 Years | 287 (7.2%) | 414 (10.5%) |
| 30 to 34 Years | 244 (6.1%) | 299 (7.6%) |
| 35 to 39 Years | 247 (6.2%) | 200 (5.1%) |
| 40 to 44 Years | 94 (2.4%) | 126 (3.2%) |
| 45 to 49 Years | 198 (5.0%) | 230 (5.9%) |
| 50 to 54 Years | 409 (10.2%) | 375 (9.5%) |
| 55 to 59 Years | 229 (5.7%) | 244 (6.2%) |
| 60 to 64 Years | 335 (8.4%) | 460 (11.7%) |
| 65 to 69 Years | 359 (9.0%) | 433 (11.0%) |
| 70 to 74 Years | 290 (7.3%) | 243 (6.2%) |
| 75 to 79 Years | 124 (3.1%) | 111 (2.8%) |
| 80 to 84 Years | 28 (0.7%) | 79 (2.0%) |
| 85 Years and over | 33 (0.8%) | 24 (0.6%) |
| Total | 3,996 (100.0%) | 3,934 (100.0%) |
Families and Households in Pukalani
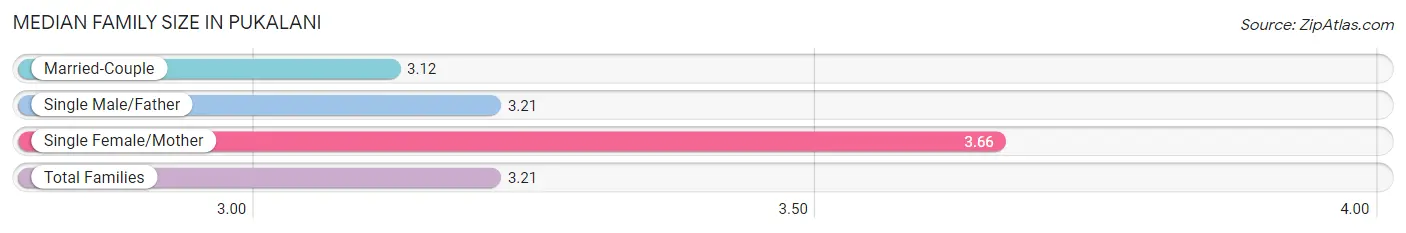
Median Family Size in Pukalani
The median family size in Pukalani is 3.21 persons per family, with single female/mother families (271 | 13.8%) accounting for the largest median family size of 3.66 persons per family. On the other hand, married-couple families (1,503 | 76.4%) represent the smallest median family size with 3.12 persons per family.
| Family Type | # Families | Family Size |
| Married-Couple | 1,503 (76.4%) | 3.12 |
| Single Male/Father | 193 (9.8%) | 3.21 |
| Single Female/Mother | 271 (13.8%) | 3.66 |
| Total Families | 1,967 (100.0%) | 3.21 |
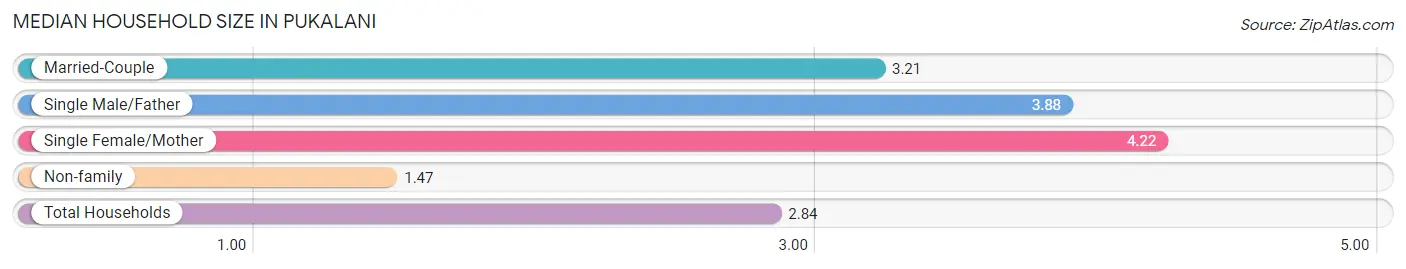
Median Household Size in Pukalani
The median household size in Pukalani is 2.84 persons per household, with single female/mother households (271 | 9.7%) accounting for the largest median household size of 4.22 persons per household. non-family households (830 | 29.7%) represent the smallest median household size with 1.47 persons per household.
| Household Type | # Households | Household Size |
| Married-Couple | 1,503 (53.7%) | 3.21 |
| Single Male/Father | 193 (6.9%) | 3.88 |
| Single Female/Mother | 271 (9.7%) | 4.22 |
| Non-family | 830 (29.7%) | 1.47 |
| Total Households | 2,797 (100.0%) | 2.84 |
Household Size by Marriage Status in Pukalani
Out of a total of 2,797 households in Pukalani, 1,967 (70.3%) are family households, while 830 (29.7%) are nonfamily households. The most numerous type of family households are 2-person households, comprising 917, and the most common type of nonfamily households are 1-person households, comprising 560.
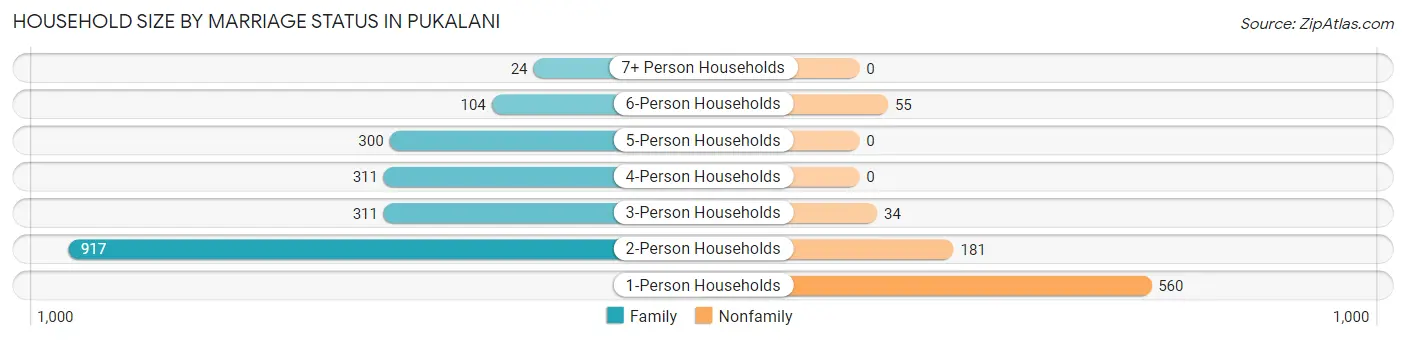
| Household Size | Family Households | Nonfamily Households |
| 1-Person Households | - | 560 (20.0%) |
| 2-Person Households | 917 (32.8%) | 181 (6.5%) |
| 3-Person Households | 311 (11.1%) | 34 (1.2%) |
| 4-Person Households | 311 (11.1%) | 0 (0.0%) |
| 5-Person Households | 300 (10.7%) | 0 (0.0%) |
| 6-Person Households | 104 (3.7%) | 55 (2.0%) |
| 7+ Person Households | 24 (0.9%) | 0 (0.0%) |
| Total | 1,967 (70.3%) | 830 (29.7%) |
Female Fertility in Pukalani
Fertility by Age in Pukalani
Average fertility rate in Pukalani is 33.0 births per 1,000 women. Women in the age bracket of 20 to 34 years have the highest fertility rate with 58.0 births per 1,000 women. Women in the age bracket of 20 to 34 years acount for 100.0% of all women with births.
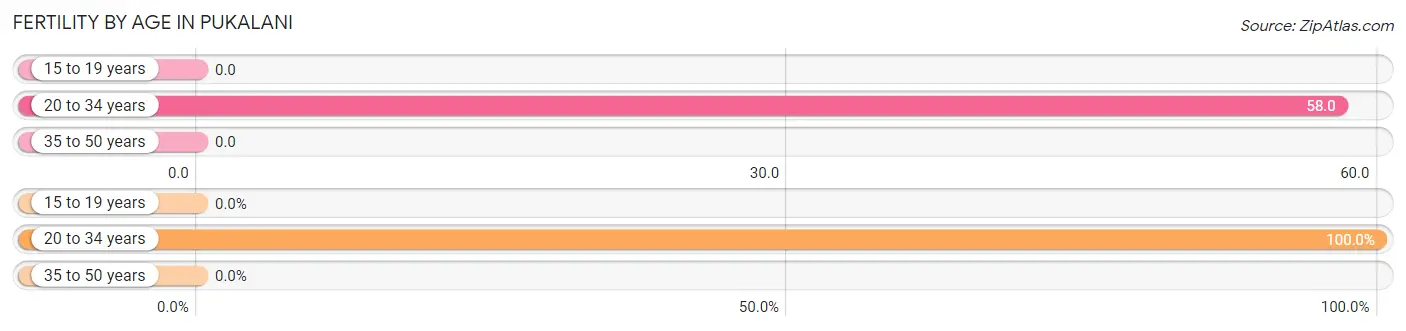
| Age Bracket | Women with Births | Births / 1,000 Women |
| 15 to 19 years | 0 (0.0%) | 0.0 |
| 20 to 34 years | 55 (100.0%) | 58.0 |
| 35 to 50 years | 0 (0.0%) | 0.0 |
| Total | 55 (100.0%) | 33.0 |
Fertility by Age by Marriage Status in Pukalani
89.1% of women with births (55) in Pukalani are married. The highest percentage of unmarried women with births falls into 20 to 34 years age bracket with 10.9% of them unmarried at the time of birth, while the lowest percentage of unmarried women with births belong to 20 to 34 years age bracket with 10.9% of them unmarried.
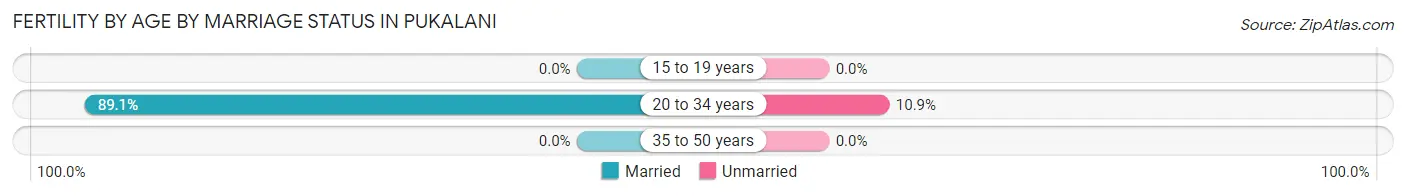
| Age Bracket | Married | Unmarried |
| 15 to 19 years | 0 (0.0%) | 0 (0.0%) |
| 20 to 34 years | 49 (89.1%) | 6 (10.9%) |
| 35 to 50 years | 0 (0.0%) | 0 (0.0%) |
| Total | 49 (89.1%) | 6 (10.9%) |
Fertility by Education in Pukalani
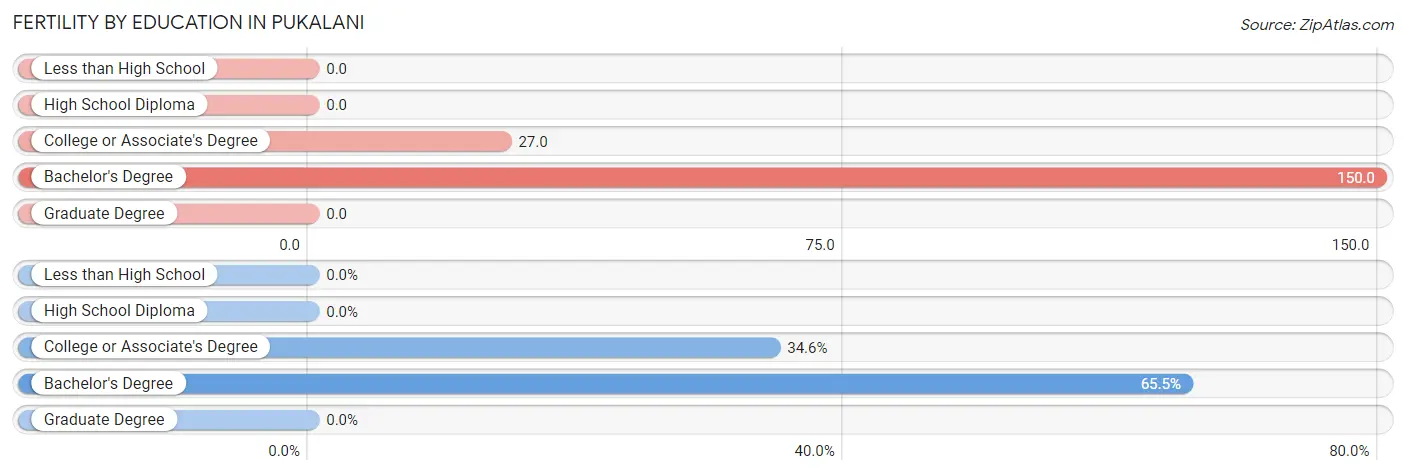
| Educational Attainment | Women with Births | Births / 1,000 Women |
| Less than High School | 0 (0.0%) | 0.0 |
| High School Diploma | 0 (0.0%) | 0.0 |
| College or Associate's Degree | 19 (34.5%) | 27.0 |
| Bachelor's Degree | 36 (65.4%) | 150.0 |
| Graduate Degree | 0 (0.0%) | 0.0 |
| Total | 55 (100.0%) | 33.0 |
Fertility by Education by Marriage Status in Pukalani
10.9% of women with births in Pukalani are unmarried. Women with the educational attainment of bachelor's degree are most likely to be married with 100.0% of them married at childbirth, while women with the educational attainment of college or associate's degree are least likely to be married with 31.6% of them unmarried at childbirth.
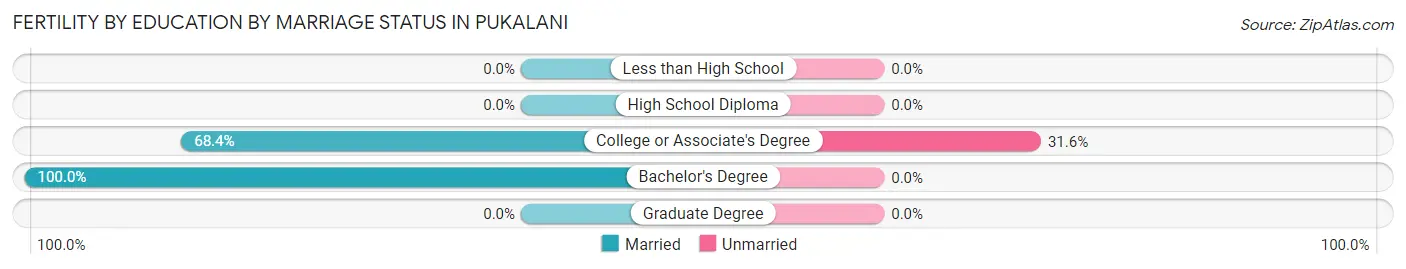
| Educational Attainment | Married | Unmarried |
| Less than High School | 0 (0.0%) | 0 (0.0%) |
| High School Diploma | 0 (0.0%) | 0 (0.0%) |
| College or Associate's Degree | 13 (68.4%) | 6 (31.6%) |
| Bachelor's Degree | 36 (100.0%) | 0 (0.0%) |
| Graduate Degree | 0 (0.0%) | 0 (0.0%) |
| Total | 49 (89.1%) | 6 (10.9%) |
Employment Characteristics in Pukalani
Employment by Class of Employer in Pukalani
Among the 4,344 employed individuals in Pukalani, private company employees (2,523 | 58.1%), state government employees (453 | 10.4%), and not-for-profit organizations (411 | 9.5%) make up the most common classes of employment.
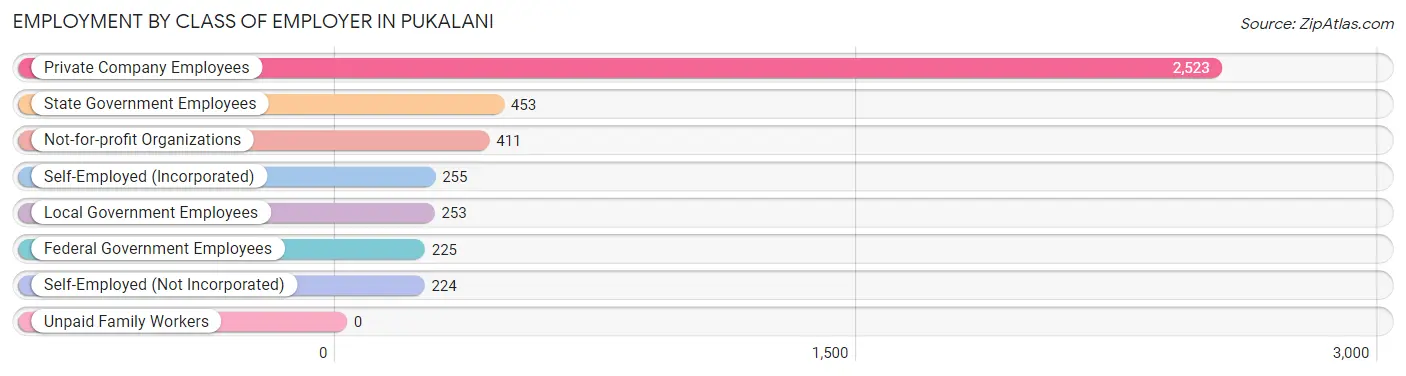
| Employer Class | # Employees | % Employees |
| Private Company Employees | 2,523 | 58.1% |
| Self-Employed (Incorporated) | 255 | 5.9% |
| Self-Employed (Not Incorporated) | 224 | 5.2% |
| Not-for-profit Organizations | 411 | 9.5% |
| Local Government Employees | 253 | 5.8% |
| State Government Employees | 453 | 10.4% |
| Federal Government Employees | 225 | 5.2% |
| Unpaid Family Workers | 0 | 0.0% |
| Total | 4,344 | 100.0% |
Employment Status by Age in Pukalani
According to the labor force statistics for Pukalani, out of the total population over 16 years of age (6,949), 66.3% or 4,607 individuals are in the labor force, with 3.3% or 152 of them unemployed. The age group with the highest labor force participation rate is 25 to 29 years, with 100.0% or 701 individuals in the labor force. Within the labor force, the 55 to 59 years age range has the highest percentage of unemployed individuals, with 9.2% or 31 of them being unemployed.
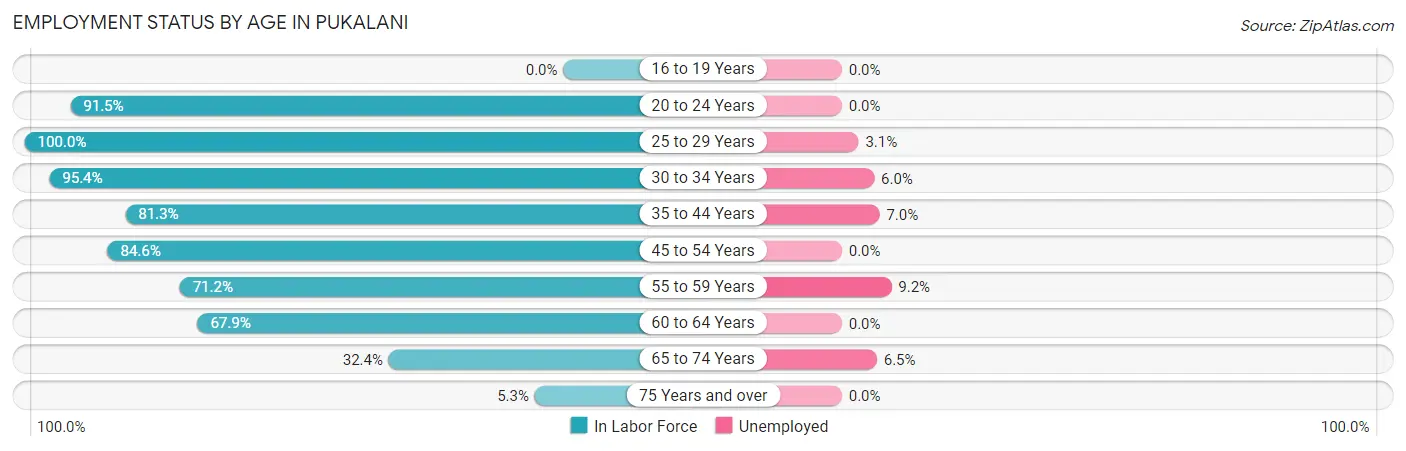
| Age Bracket | In Labor Force | Unemployed |
| 16 to 19 Years | 0 (0.0%) | 0 (0.0%) |
| 20 to 24 Years | 495 (91.5%) | 0 (0.0%) |
| 25 to 29 Years | 701 (100.0%) | 22 (3.1%) |
| 30 to 34 Years | 518 (95.4%) | 31 (6.0%) |
| 35 to 44 Years | 542 (81.3%) | 38 (7.0%) |
| 45 to 54 Years | 1,025 (84.6%) | 0 (0.0%) |
| 55 to 59 Years | 337 (71.2%) | 31 (9.2%) |
| 60 to 64 Years | 540 (67.9%) | 0 (0.0%) |
| 65 to 74 Years | 429 (32.4%) | 28 (6.5%) |
| 75 Years and over | 21 (5.3%) | 0 (0.0%) |
| Total | 4,607 (66.3%) | 152 (3.3%) |
Employment Status by Educational Attainment in Pukalani
According to labor force statistics for Pukalani, 83.4% of individuals (3,662) out of the total population between 25 and 64 years of age (4,391) are in the labor force, with 3.3% or 121 of them being unemployed. The group with the highest labor force participation rate are those with the educational attainment of bachelor's degree or higher, with 92.2% or 1,120 individuals in the labor force. Within the labor force, individuals with less than high school education have the highest percentage of unemployment, with 20.1% or 31 of them being unemployed.
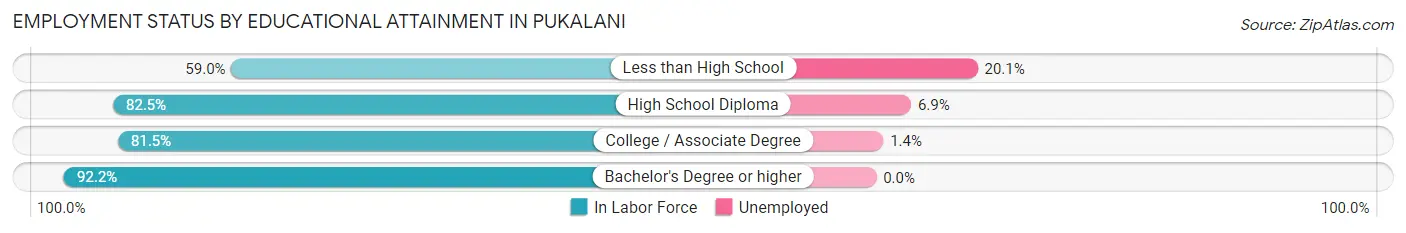
| Educational Attainment | In Labor Force | Unemployed |
| Less than High School | 154 (59.0%) | 52 (20.1%) |
| High School Diploma | 1,059 (82.5%) | 89 (6.9%) |
| College / Associate Degree | 1,329 (81.5%) | 23 (1.4%) |
| Bachelor's Degree or higher | 1,120 (92.2%) | 0 (0.0%) |
| Total | 3,662 (83.4%) | 145 (3.3%) |
Employment Occupations by Sex in Pukalani
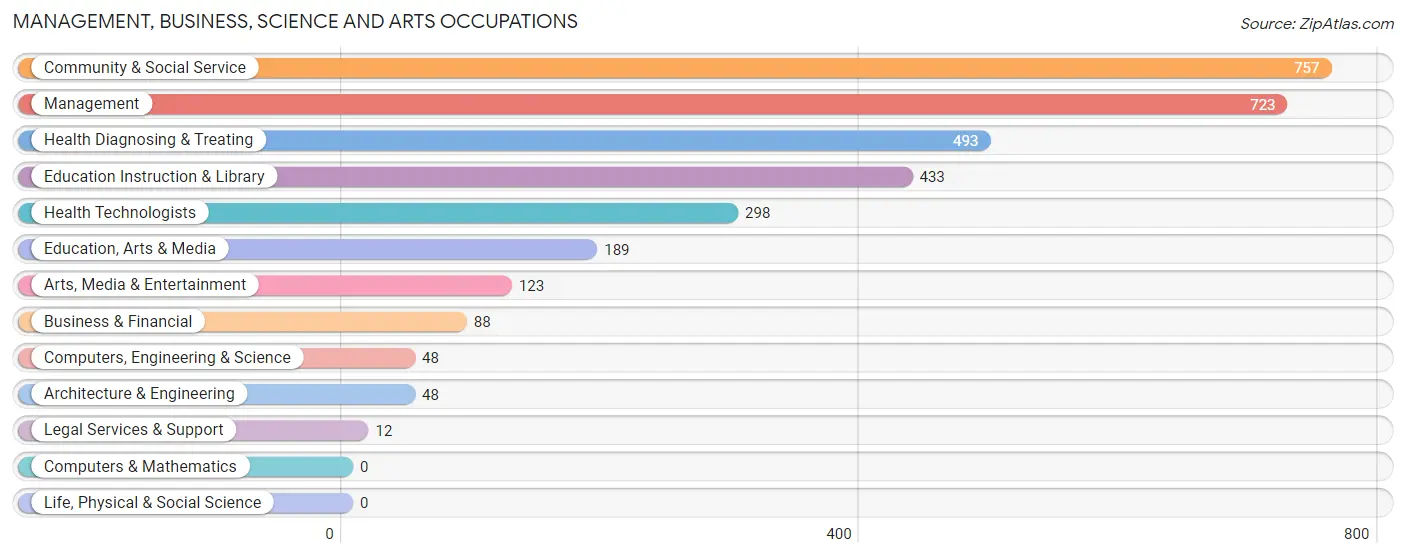
Management, Business, Science and Arts Occupations
The most common Management, Business, Science and Arts occupations in Pukalani are Community & Social Service (757 | 17.2%), Management (723 | 16.4%), Health Diagnosing & Treating (493 | 11.2%), Education Instruction & Library (433 | 9.9%), and Health Technologists (298 | 6.8%).
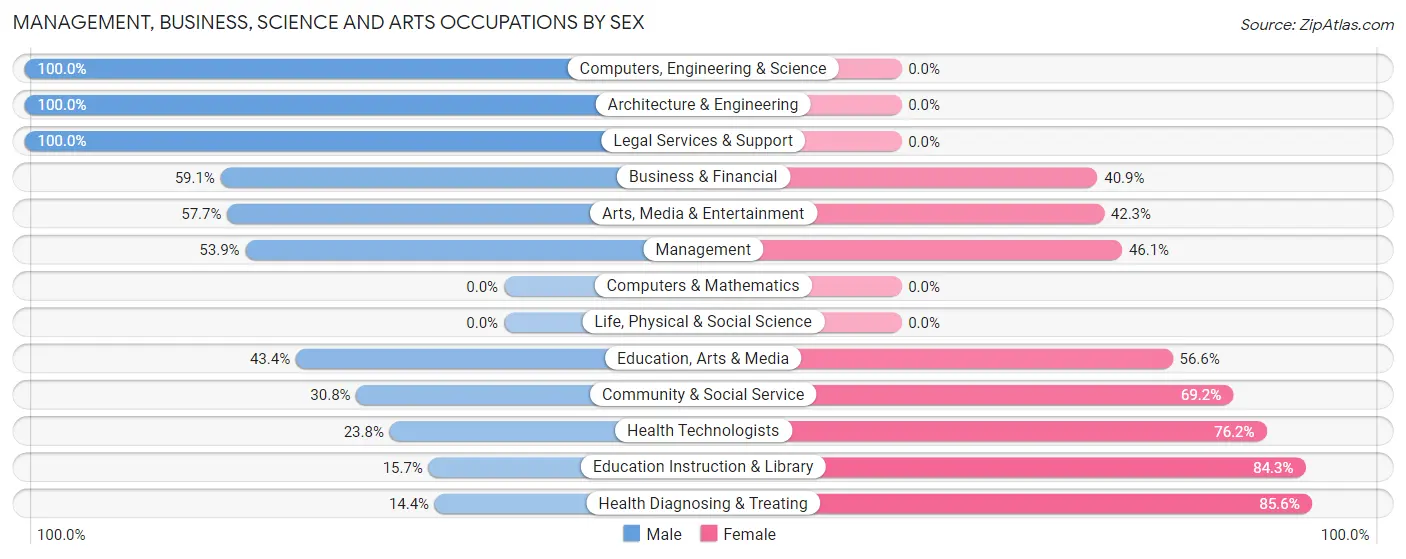
Management, Business, Science and Arts Occupations by Sex
Within the Management, Business, Science and Arts occupations in Pukalani, the most male-oriented occupations are Computers, Engineering & Science (100.0%), Architecture & Engineering (100.0%), and Legal Services & Support (100.0%), while the most female-oriented occupations are Health Diagnosing & Treating (85.6%), Education Instruction & Library (84.3%), and Health Technologists (76.2%).
| Occupation | Male | Female |
| Management | 390 (53.9%) | 333 (46.1%) |
| Business & Financial | 52 (59.1%) | 36 (40.9%) |
| Computers, Engineering & Science | 48 (100.0%) | 0 (0.0%) |
| Computers & Mathematics | 0 (0.0%) | 0 (0.0%) |
| Architecture & Engineering | 48 (100.0%) | 0 (0.0%) |
| Life, Physical & Social Science | 0 (0.0%) | 0 (0.0%) |
| Community & Social Service | 233 (30.8%) | 524 (69.2%) |
| Education, Arts & Media | 82 (43.4%) | 107 (56.6%) |
| Legal Services & Support | 12 (100.0%) | 0 (0.0%) |
| Education Instruction & Library | 68 (15.7%) | 365 (84.3%) |
| Arts, Media & Entertainment | 71 (57.7%) | 52 (42.3%) |
| Health Diagnosing & Treating | 71 (14.4%) | 422 (85.6%) |
| Health Technologists | 71 (23.8%) | 227 (76.2%) |
| Total (Category) | 794 (37.7%) | 1,315 (62.4%) |
| Total (Overall) | 2,006 (45.6%) | 2,391 (54.4%) |
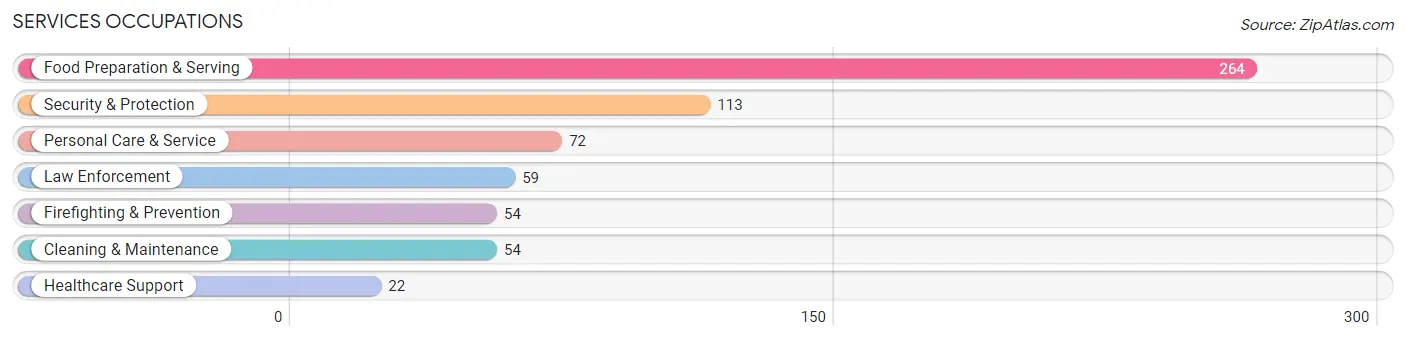
Services Occupations
The most common Services occupations in Pukalani are Food Preparation & Serving (264 | 6.0%), Security & Protection (113 | 2.6%), Personal Care & Service (72 | 1.6%), Law Enforcement (59 | 1.3%), and Firefighting & Prevention (54 | 1.2%).
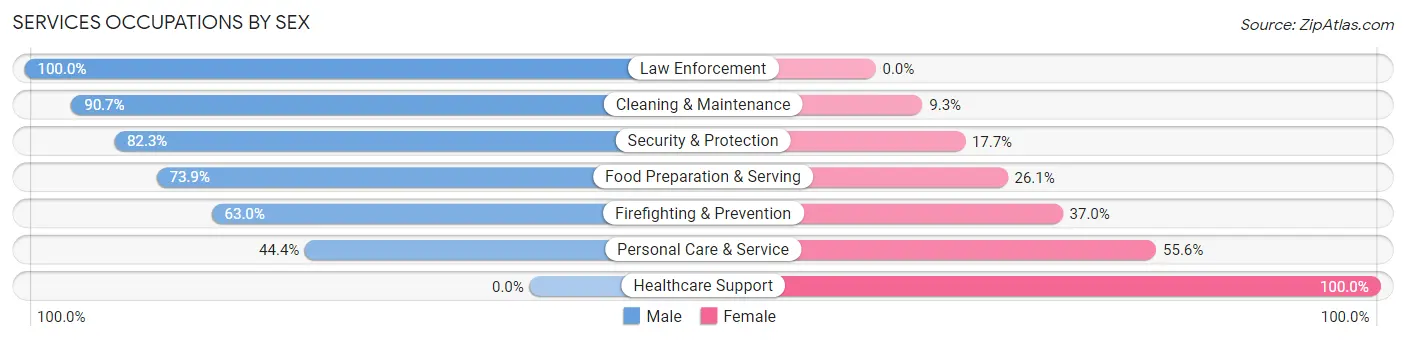
Services Occupations by Sex
Within the Services occupations in Pukalani, the most male-oriented occupations are Law Enforcement (100.0%), Cleaning & Maintenance (90.7%), and Security & Protection (82.3%), while the most female-oriented occupations are Healthcare Support (100.0%), Personal Care & Service (55.6%), and Firefighting & Prevention (37.0%).
| Occupation | Male | Female |
| Healthcare Support | 0 (0.0%) | 22 (100.0%) |
| Security & Protection | 93 (82.3%) | 20 (17.7%) |
| Firefighting & Prevention | 34 (63.0%) | 20 (37.0%) |
| Law Enforcement | 59 (100.0%) | 0 (0.0%) |
| Food Preparation & Serving | 195 (73.9%) | 69 (26.1%) |
| Cleaning & Maintenance | 49 (90.7%) | 5 (9.3%) |
| Personal Care & Service | 32 (44.4%) | 40 (55.6%) |
| Total (Category) | 369 (70.3%) | 156 (29.7%) |
| Total (Overall) | 2,006 (45.6%) | 2,391 (54.4%) |
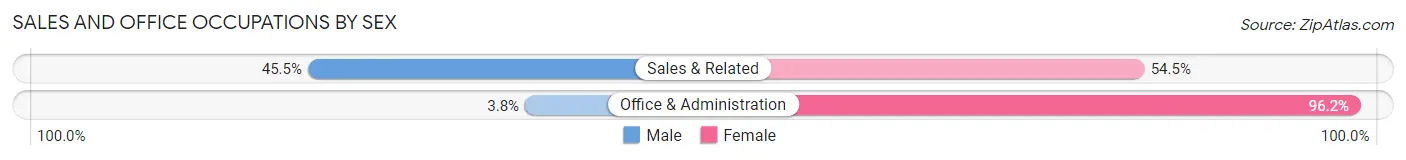
Sales and Office Occupations
The most common Sales and Office occupations in Pukalani are Sales & Related (718 | 16.3%), and Office & Administration (397 | 9.0%).
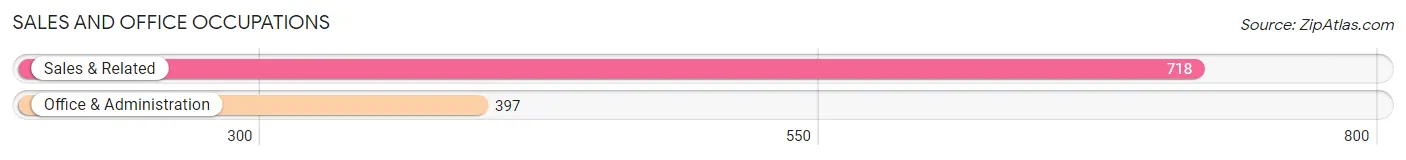
Sales and Office Occupations by Sex
| Occupation | Male | Female |
| Sales & Related | 327 (45.5%) | 391 (54.5%) |
| Office & Administration | 15 (3.8%) | 382 (96.2%) |
| Total (Category) | 342 (30.7%) | 773 (69.3%) |
| Total (Overall) | 2,006 (45.6%) | 2,391 (54.4%) |
Natural Resources, Construction and Maintenance Occupations
The most common Natural Resources, Construction and Maintenance occupations in Pukalani are Installation, Maintenance & Repair (152 | 3.5%), Construction & Extraction (135 | 3.1%), and Farming, Fishing & Forestry (26 | 0.6%).
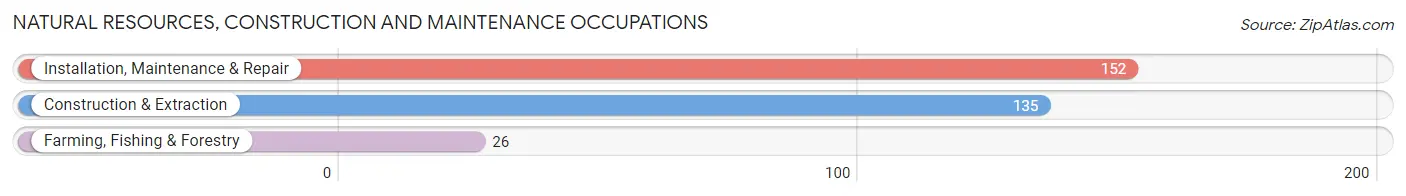
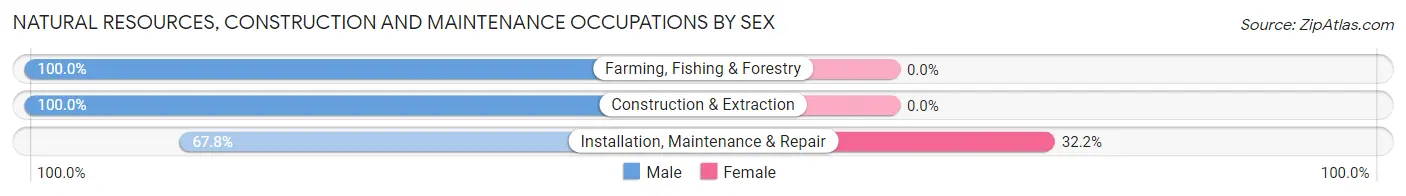
Natural Resources, Construction and Maintenance Occupations by Sex
| Occupation | Male | Female |
| Farming, Fishing & Forestry | 26 (100.0%) | 0 (0.0%) |
| Construction & Extraction | 135 (100.0%) | 0 (0.0%) |
| Installation, Maintenance & Repair | 103 (67.8%) | 49 (32.2%) |
| Total (Category) | 264 (84.4%) | 49 (15.7%) |
| Total (Overall) | 2,006 (45.6%) | 2,391 (54.4%) |
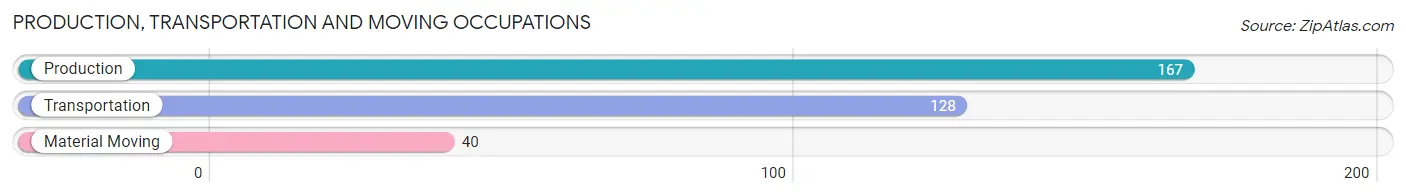
Production, Transportation and Moving Occupations
The most common Production, Transportation and Moving occupations in Pukalani are Production (167 | 3.8%), Transportation (128 | 2.9%), and Material Moving (40 | 0.9%).
Production, Transportation and Moving Occupations by Sex
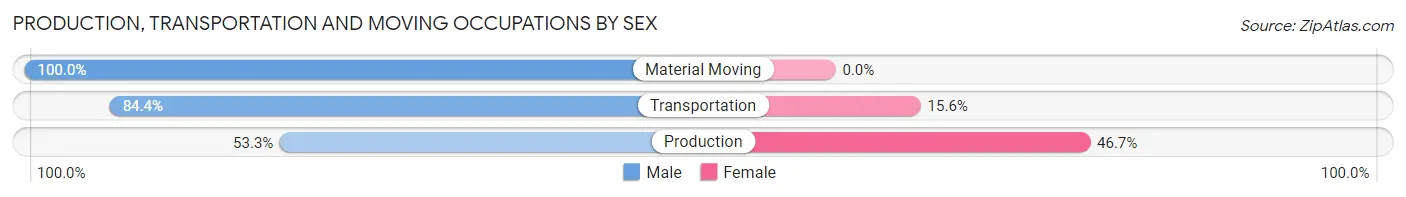
| Occupation | Male | Female |
| Production | 89 (53.3%) | 78 (46.7%) |
| Transportation | 108 (84.4%) | 20 (15.6%) |
| Material Moving | 40 (100.0%) | 0 (0.0%) |
| Total (Category) | 237 (70.8%) | 98 (29.2%) |
| Total (Overall) | 2,006 (45.6%) | 2,391 (54.4%) |
Employment Industries by Sex in Pukalani
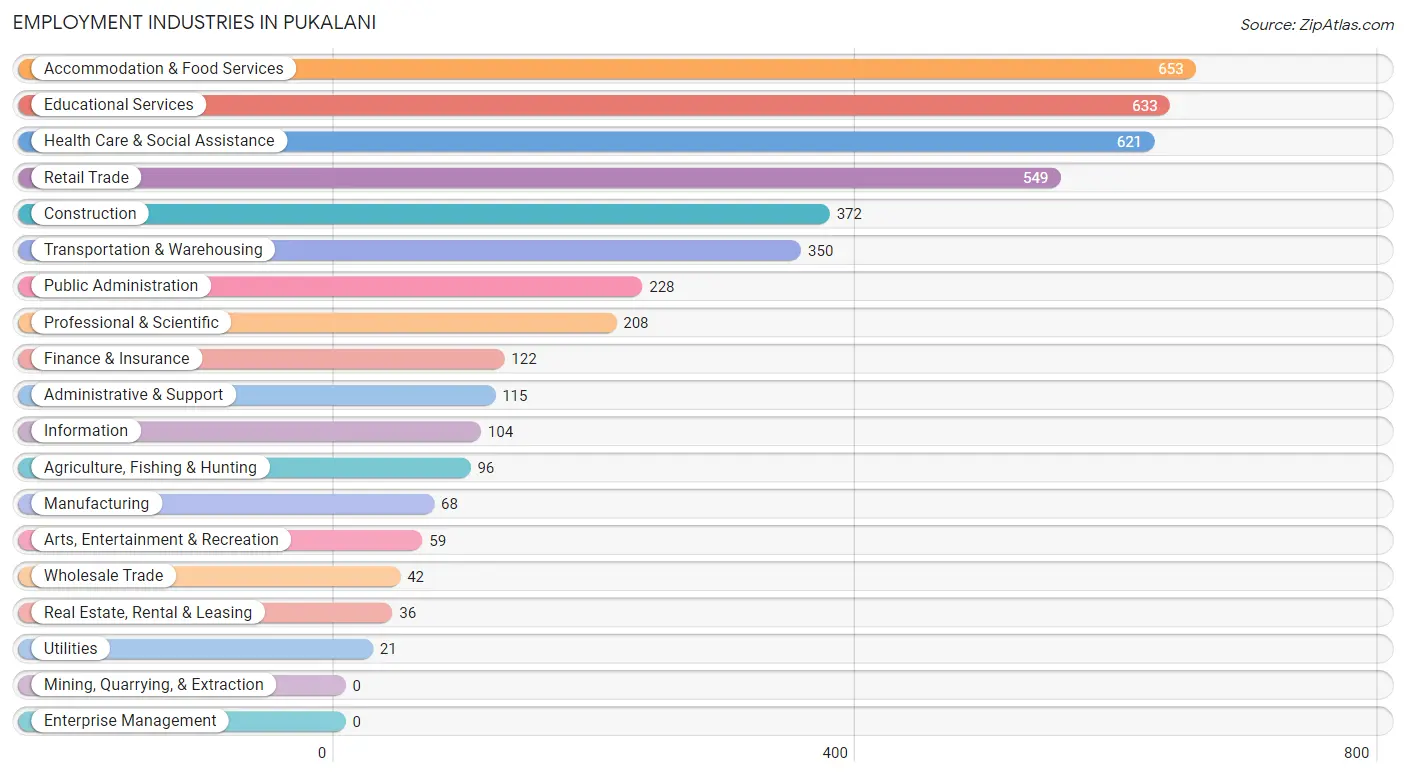
Employment Industries in Pukalani
The major employment industries in Pukalani include Accommodation & Food Services (653 | 14.8%), Educational Services (633 | 14.4%), Health Care & Social Assistance (621 | 14.1%), Retail Trade (549 | 12.5%), and Construction (372 | 8.5%).
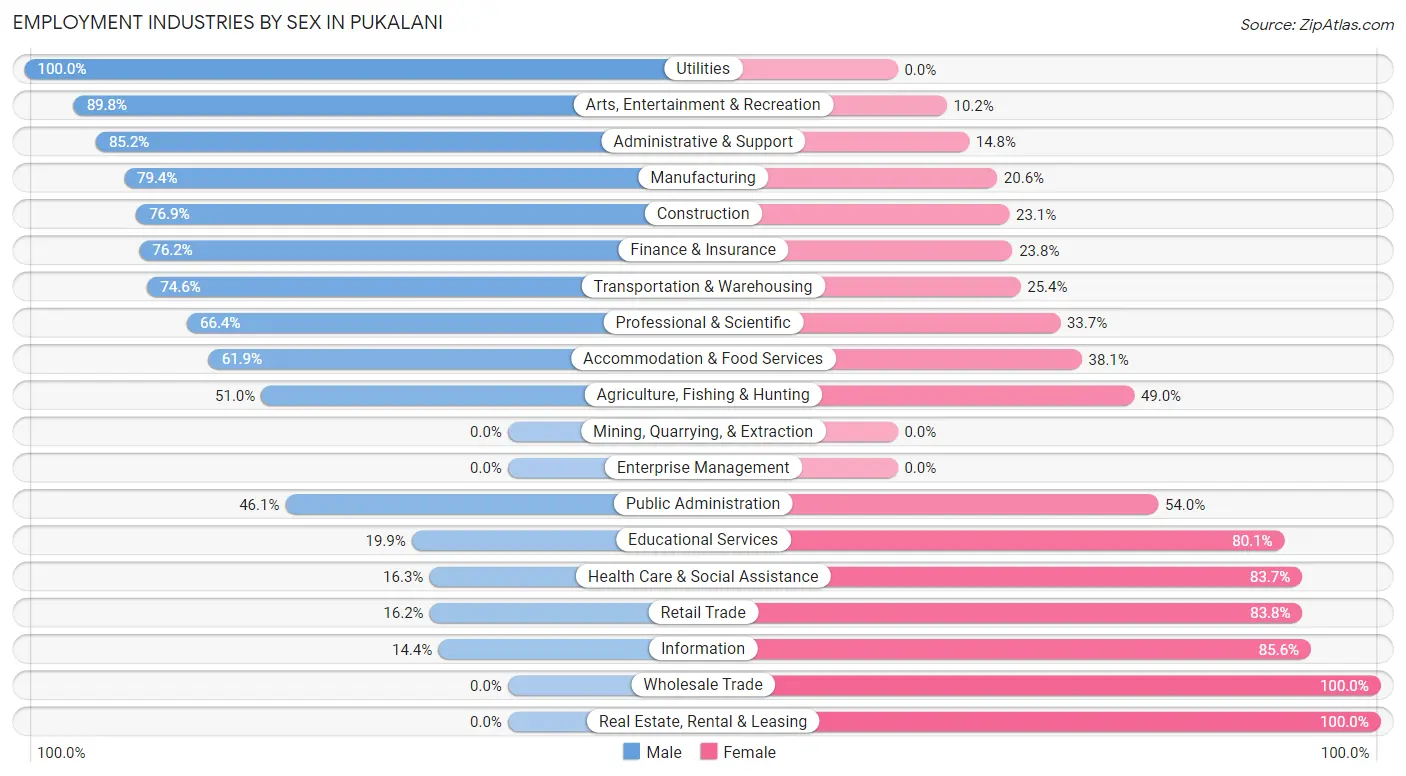
Employment Industries by Sex in Pukalani
The Pukalani industries that see more men than women are Utilities (100.0%), Arts, Entertainment & Recreation (89.8%), and Administrative & Support (85.2%), whereas the industries that tend to have a higher number of women are Wholesale Trade (100.0%), Real Estate, Rental & Leasing (100.0%), and Information (85.6%).
| Industry | Male | Female |
| Agriculture, Fishing & Hunting | 49 (51.0%) | 47 (49.0%) |
| Mining, Quarrying, & Extraction | 0 (0.0%) | 0 (0.0%) |
| Construction | 286 (76.9%) | 86 (23.1%) |
| Manufacturing | 54 (79.4%) | 14 (20.6%) |
| Wholesale Trade | 0 (0.0%) | 42 (100.0%) |
| Retail Trade | 89 (16.2%) | 460 (83.8%) |
| Transportation & Warehousing | 261 (74.6%) | 89 (25.4%) |
| Utilities | 21 (100.0%) | 0 (0.0%) |
| Information | 15 (14.4%) | 89 (85.6%) |
| Finance & Insurance | 93 (76.2%) | 29 (23.8%) |
| Real Estate, Rental & Leasing | 0 (0.0%) | 36 (100.0%) |
| Professional & Scientific | 138 (66.3%) | 70 (33.7%) |
| Enterprise Management | 0 (0.0%) | 0 (0.0%) |
| Administrative & Support | 98 (85.2%) | 17 (14.8%) |
| Educational Services | 126 (19.9%) | 507 (80.1%) |
| Health Care & Social Assistance | 101 (16.3%) | 520 (83.7%) |
| Arts, Entertainment & Recreation | 53 (89.8%) | 6 (10.2%) |
| Accommodation & Food Services | 404 (61.9%) | 249 (38.1%) |
| Public Administration | 105 (46.1%) | 123 (53.9%) |
| Total | 2,006 (45.6%) | 2,391 (54.4%) |
Education in Pukalani
School Enrollment in Pukalani
The most common levels of schooling among the 945 students in Pukalani are high school (343 | 36.3%), nursery / preschool (200 | 21.2%), and elementary school (173 | 18.3%).
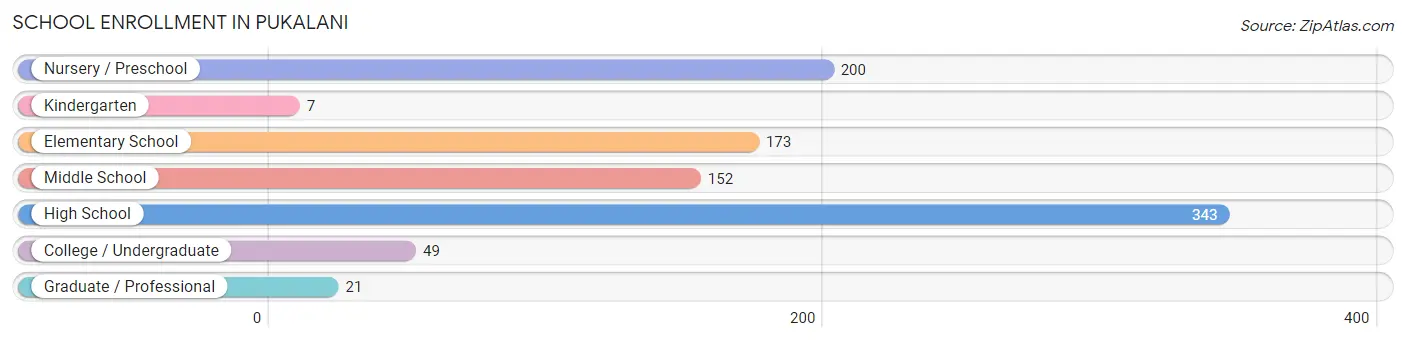
| School Level | # Students | % Students |
| Nursery / Preschool | 200 | 21.2% |
| Kindergarten | 7 | 0.7% |
| Elementary School | 173 | 18.3% |
| Middle School | 152 | 16.1% |
| High School | 343 | 36.3% |
| College / Undergraduate | 49 | 5.2% |
| Graduate / Professional | 21 | 2.2% |
| Total | 945 | 100.0% |
School Enrollment by Age by Funding Source in Pukalani
Out of a total of 945 students who are enrolled in schools in Pukalani, 202 (21.4%) attend a private institution, while the remaining 743 (78.6%) are enrolled in public schools. The age group of 35 years and over has the highest likelihood of being enrolled in private schools, with 30 (100.0% in the age bracket) enrolled. Conversely, the age group of 3 to 4 year olds has the lowest likelihood of being enrolled in a private school, with 81 (100.0% in the age bracket) attending a public institution.
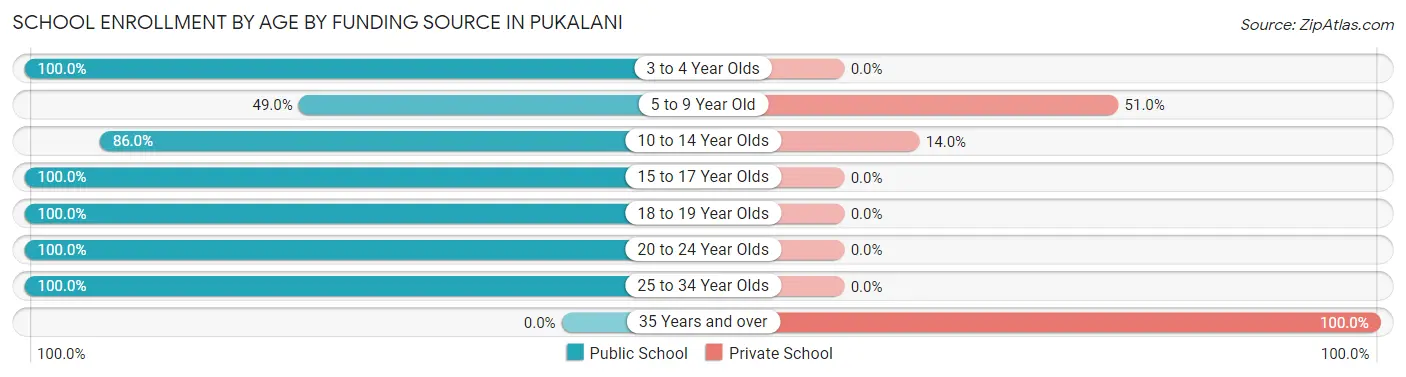
| Age Bracket | Public School | Private School |
| 3 to 4 Year Olds | 81 (100.0%) | 0 (0.0%) |
| 5 to 9 Year Old | 144 (49.0%) | 150 (51.0%) |
| 10 to 14 Year Olds | 135 (86.0%) | 22 (14.0%) |
| 15 to 17 Year Olds | 318 (100.0%) | 0 (0.0%) |
| 18 to 19 Year Olds | 25 (100.0%) | 0 (0.0%) |
| 20 to 24 Year Olds | 25 (100.0%) | 0 (0.0%) |
| 25 to 34 Year Olds | 15 (100.0%) | 0 (0.0%) |
| 35 Years and over | 0 (0.0%) | 30 (100.0%) |
| Total | 743 (78.6%) | 202 (21.4%) |
Educational Attainment by Field of Study in Pukalani
Business (418 | 17.7%), education (415 | 17.6%), science & technology (304 | 12.9%), visual & performing arts (271 | 11.5%), and social sciences (261 | 11.1%) are the most common fields of study among 2,356 individuals in Pukalani who have obtained a bachelor's degree or higher.
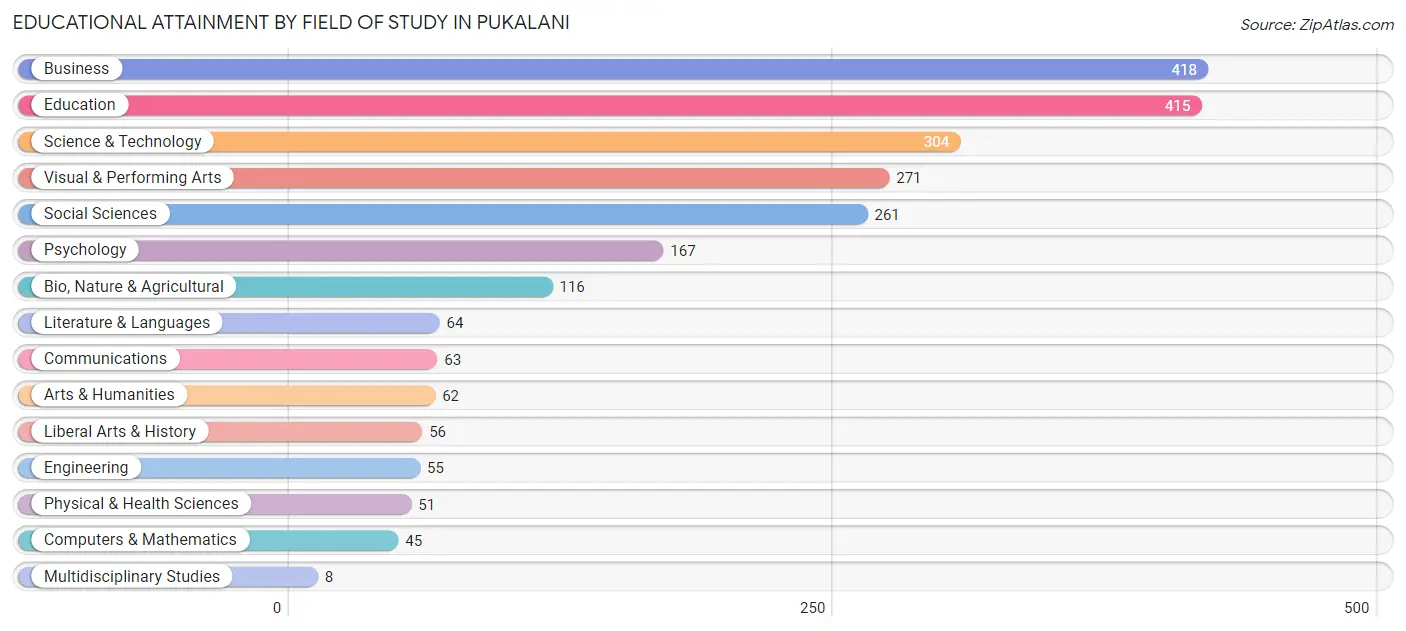
| Field of Study | # Graduates | % Graduates |
| Computers & Mathematics | 45 | 1.9% |
| Bio, Nature & Agricultural | 116 | 4.9% |
| Physical & Health Sciences | 51 | 2.2% |
| Psychology | 167 | 7.1% |
| Social Sciences | 261 | 11.1% |
| Engineering | 55 | 2.3% |
| Multidisciplinary Studies | 8 | 0.3% |
| Science & Technology | 304 | 12.9% |
| Business | 418 | 17.7% |
| Education | 415 | 17.6% |
| Literature & Languages | 64 | 2.7% |
| Liberal Arts & History | 56 | 2.4% |
| Visual & Performing Arts | 271 | 11.5% |
| Communications | 63 | 2.7% |
| Arts & Humanities | 62 | 2.6% |
| Total | 2,356 | 100.0% |
Transportation & Commute in Pukalani
Vehicle Availability by Sex in Pukalani
The most prevalent vehicle ownership categories in Pukalani are males with 2 vehicles (709, accounting for 35.4%) and females with 2 vehicles (837, making up 30.3%).
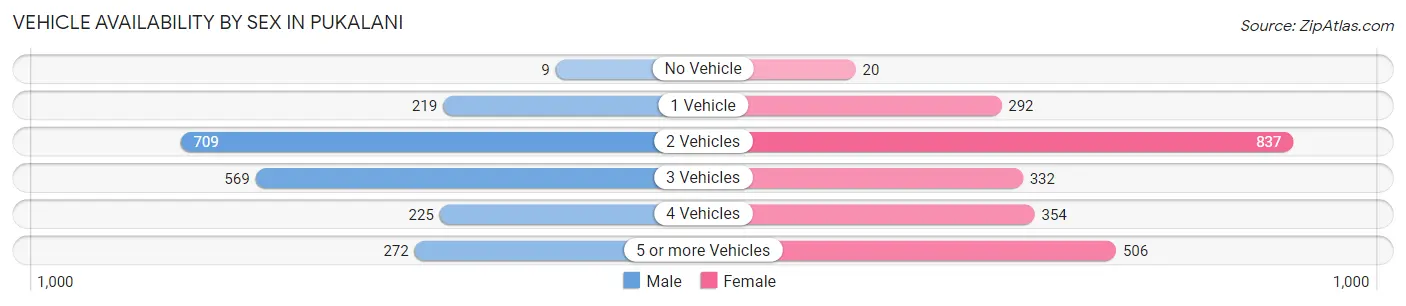
| Vehicles Available | Male | Female |
| No Vehicle | 9 (0.4%) | 20 (0.9%) |
| 1 Vehicle | 219 (10.9%) | 292 (12.5%) |
| 2 Vehicles | 709 (35.4%) | 837 (35.7%) |
| 3 Vehicles | 569 (28.4%) | 332 (14.2%) |
| 4 Vehicles | 225 (11.2%) | 354 (15.1%) |
| 5 or more Vehicles | 272 (13.6%) | 506 (21.6%) |
| Total | 2,003 (100.0%) | 2,341 (100.0%) |
Commute Time in Pukalani
The most frequently occuring commute durations in Pukalani are 20 to 24 minutes (1,056 commuters, 26.7%), 30 to 34 minutes (635 commuters, 16.1%), and 5 to 9 minutes (628 commuters, 15.9%).
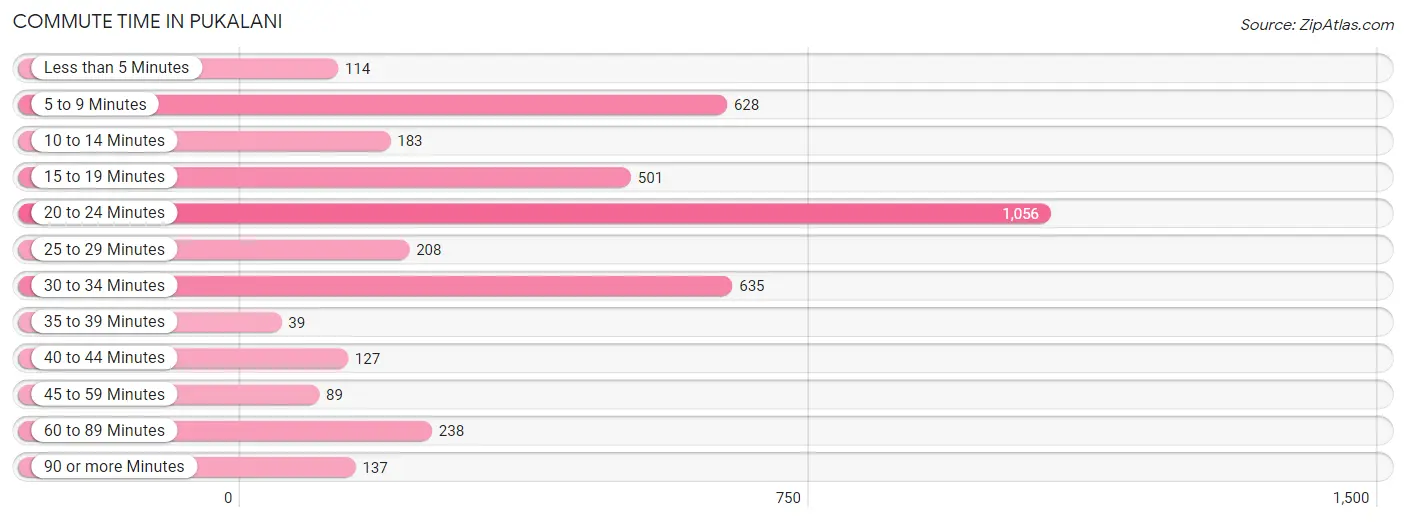
| Commute Time | # Commuters | % Commuters |
| Less than 5 Minutes | 114 | 2.9% |
| 5 to 9 Minutes | 628 | 15.9% |
| 10 to 14 Minutes | 183 | 4.6% |
| 15 to 19 Minutes | 501 | 12.7% |
| 20 to 24 Minutes | 1,056 | 26.7% |
| 25 to 29 Minutes | 208 | 5.3% |
| 30 to 34 Minutes | 635 | 16.1% |
| 35 to 39 Minutes | 39 | 1.0% |
| 40 to 44 Minutes | 127 | 3.2% |
| 45 to 59 Minutes | 89 | 2.2% |
| 60 to 89 Minutes | 238 | 6.0% |
| 90 or more Minutes | 137 | 3.5% |
Commute Time by Sex in Pukalani
The most common commute times in Pukalani are 20 to 24 minutes (585 commuters, 31.3%) for males and 20 to 24 minutes (471 commuters, 22.6%) for females.
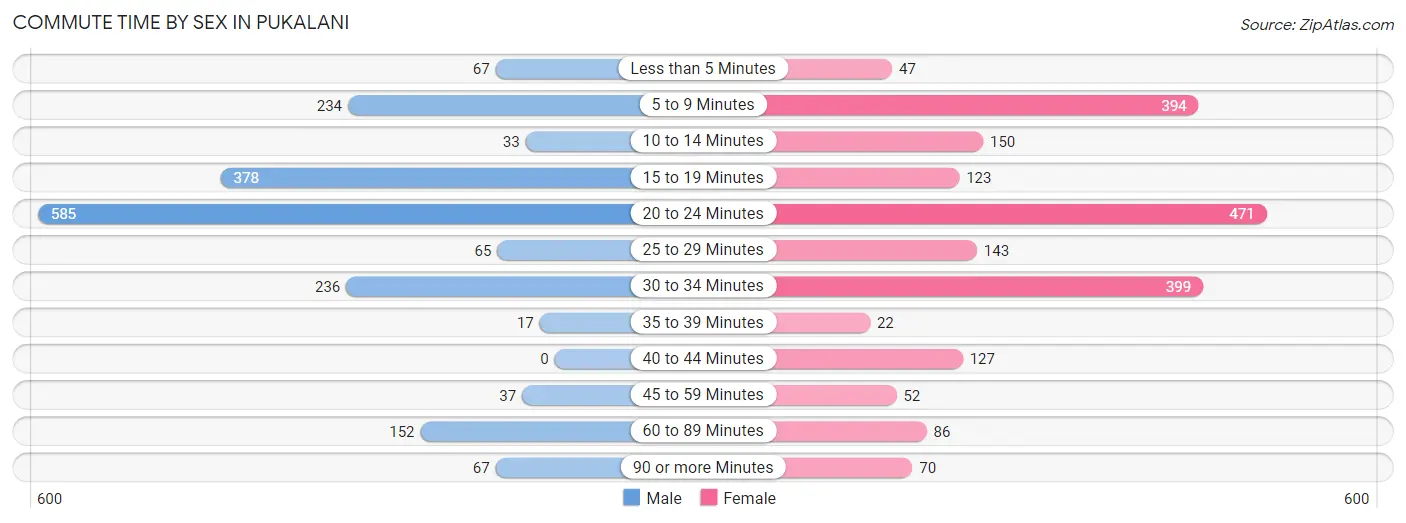
| Commute Time | Male | Female |
| Less than 5 Minutes | 67 (3.6%) | 47 (2.3%) |
| 5 to 9 Minutes | 234 (12.5%) | 394 (18.9%) |
| 10 to 14 Minutes | 33 (1.8%) | 150 (7.2%) |
| 15 to 19 Minutes | 378 (20.2%) | 123 (5.9%) |
| 20 to 24 Minutes | 585 (31.3%) | 471 (22.6%) |
| 25 to 29 Minutes | 65 (3.5%) | 143 (6.9%) |
| 30 to 34 Minutes | 236 (12.6%) | 399 (19.2%) |
| 35 to 39 Minutes | 17 (0.9%) | 22 (1.1%) |
| 40 to 44 Minutes | 0 (0.0%) | 127 (6.1%) |
| 45 to 59 Minutes | 37 (2.0%) | 52 (2.5%) |
| 60 to 89 Minutes | 152 (8.1%) | 86 (4.1%) |
| 90 or more Minutes | 67 (3.6%) | 70 (3.4%) |
Time of Departure to Work by Sex in Pukalani
The most frequent times of departure to work in Pukalani are 7:00 AM to 7:29 AM (362, 19.4%) for males and 7:00 AM to 7:29 AM (528, 25.3%) for females.
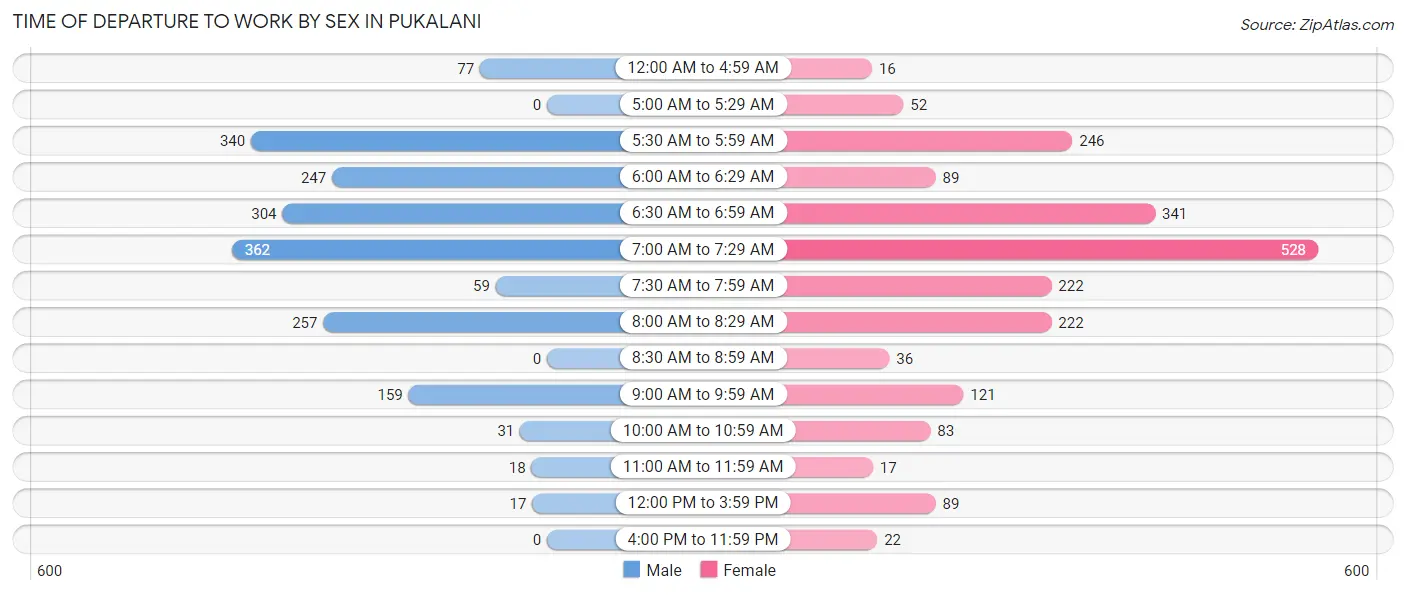
| Time of Departure | Male | Female |
| 12:00 AM to 4:59 AM | 77 (4.1%) | 16 (0.8%) |
| 5:00 AM to 5:29 AM | 0 (0.0%) | 52 (2.5%) |
| 5:30 AM to 5:59 AM | 340 (18.2%) | 246 (11.8%) |
| 6:00 AM to 6:29 AM | 247 (13.2%) | 89 (4.3%) |
| 6:30 AM to 6:59 AM | 304 (16.3%) | 341 (16.4%) |
| 7:00 AM to 7:29 AM | 362 (19.4%) | 528 (25.3%) |
| 7:30 AM to 7:59 AM | 59 (3.2%) | 222 (10.6%) |
| 8:00 AM to 8:29 AM | 257 (13.7%) | 222 (10.6%) |
| 8:30 AM to 8:59 AM | 0 (0.0%) | 36 (1.7%) |
| 9:00 AM to 9:59 AM | 159 (8.5%) | 121 (5.8%) |
| 10:00 AM to 10:59 AM | 31 (1.7%) | 83 (4.0%) |
| 11:00 AM to 11:59 AM | 18 (1.0%) | 17 (0.8%) |
| 12:00 PM to 3:59 PM | 17 (0.9%) | 89 (4.3%) |
| 4:00 PM to 11:59 PM | 0 (0.0%) | 22 (1.1%) |
| Total | 1,871 (100.0%) | 2,084 (100.0%) |
Housing Occupancy in Pukalani
Occupancy by Ownership in Pukalani
Of the total 2,797 dwellings in Pukalani, owner-occupied units account for 1,819 (65.0%), while renter-occupied units make up 978 (35.0%).
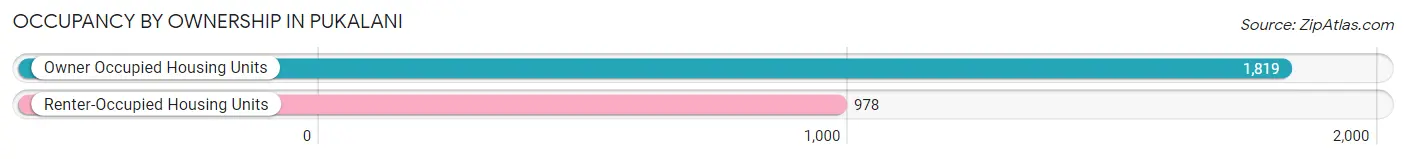
| Occupancy | # Housing Units | % Housing Units |
| Owner Occupied Housing Units | 1,819 | 65.0% |
| Renter-Occupied Housing Units | 978 | 35.0% |
| Total Occupied Housing Units | 2,797 | 100.0% |
Occupancy by Household Size in Pukalani
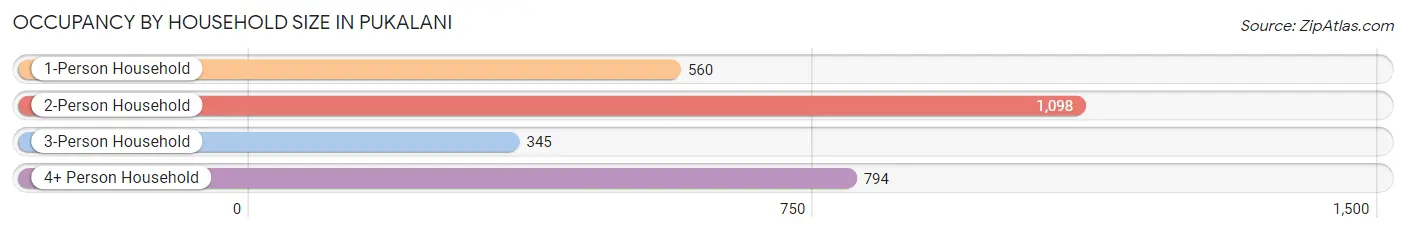
| Household Size | # Housing Units | % Housing Units |
| 1-Person Household | 560 | 20.0% |
| 2-Person Household | 1,098 | 39.3% |
| 3-Person Household | 345 | 12.3% |
| 4+ Person Household | 794 | 28.4% |
| Total Housing Units | 2,797 | 100.0% |
Occupancy by Ownership by Household Size in Pukalani
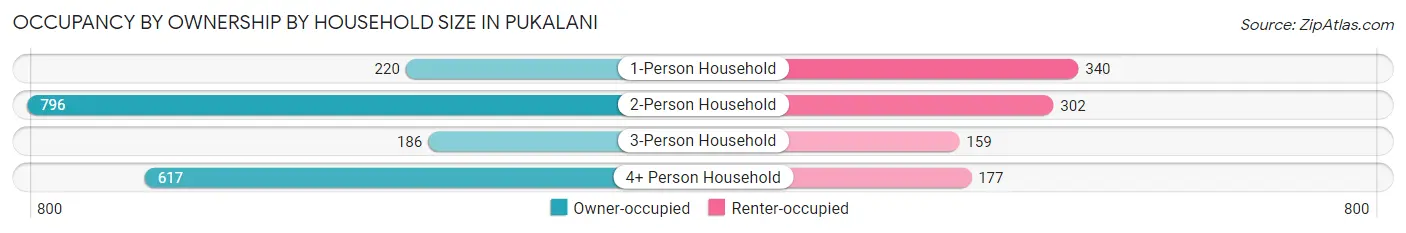
| Household Size | Owner-occupied | Renter-occupied |
| 1-Person Household | 220 (39.3%) | 340 (60.7%) |
| 2-Person Household | 796 (72.5%) | 302 (27.5%) |
| 3-Person Household | 186 (53.9%) | 159 (46.1%) |
| 4+ Person Household | 617 (77.7%) | 177 (22.3%) |
| Total Housing Units | 1,819 (65.0%) | 978 (35.0%) |
Occupancy by Educational Attainment in Pukalani
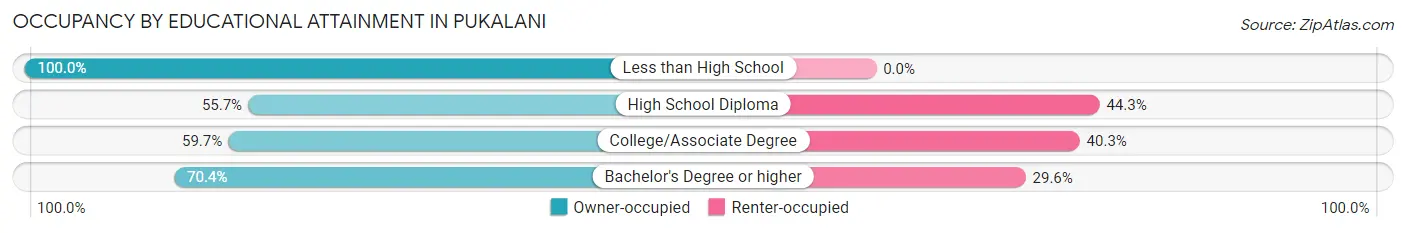
| Household Size | Owner-occupied | Renter-occupied |
| Less than High School | 156 (100.0%) | 0 (0.0%) |
| High School Diploma | 385 (55.7%) | 306 (44.3%) |
| College/Associate Degree | 525 (59.7%) | 355 (40.3%) |
| Bachelor's Degree or higher | 753 (70.4%) | 317 (29.6%) |
Occupancy by Age of Householder in Pukalani
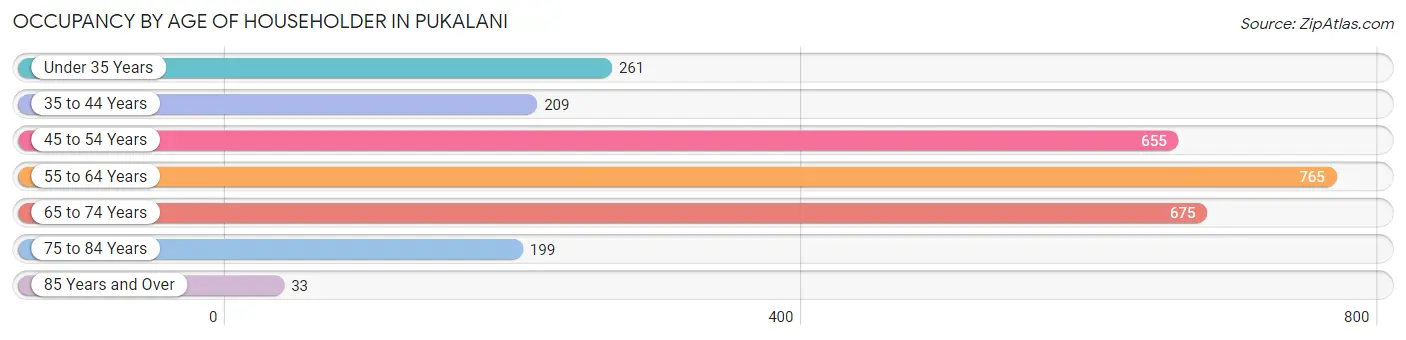
| Age Bracket | # Households | % Households |
| Under 35 Years | 261 | 9.3% |
| 35 to 44 Years | 209 | 7.5% |
| 45 to 54 Years | 655 | 23.4% |
| 55 to 64 Years | 765 | 27.4% |
| 65 to 74 Years | 675 | 24.1% |
| 75 to 84 Years | 199 | 7.1% |
| 85 Years and Over | 33 | 1.2% |
| Total | 2,797 | 100.0% |
Housing Finances in Pukalani
Median Income by Occupancy in Pukalani
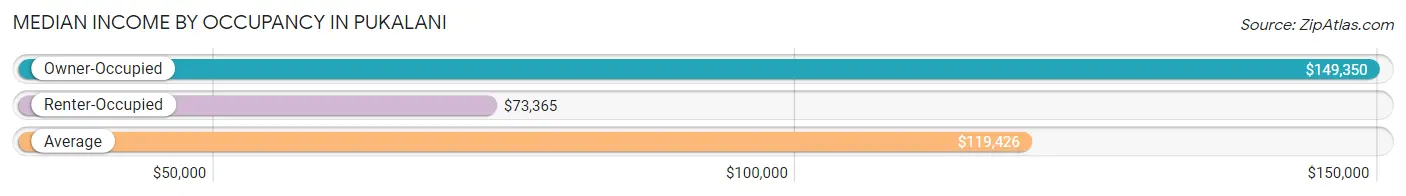
| Occupancy Type | # Households | Median Income |
| Owner-Occupied | 1,819 (65.0%) | $149,350 |
| Renter-Occupied | 978 (35.0%) | $73,365 |
| Average | 2,797 (100.0%) | $119,426 |
Occupancy by Householder Income Bracket in Pukalani
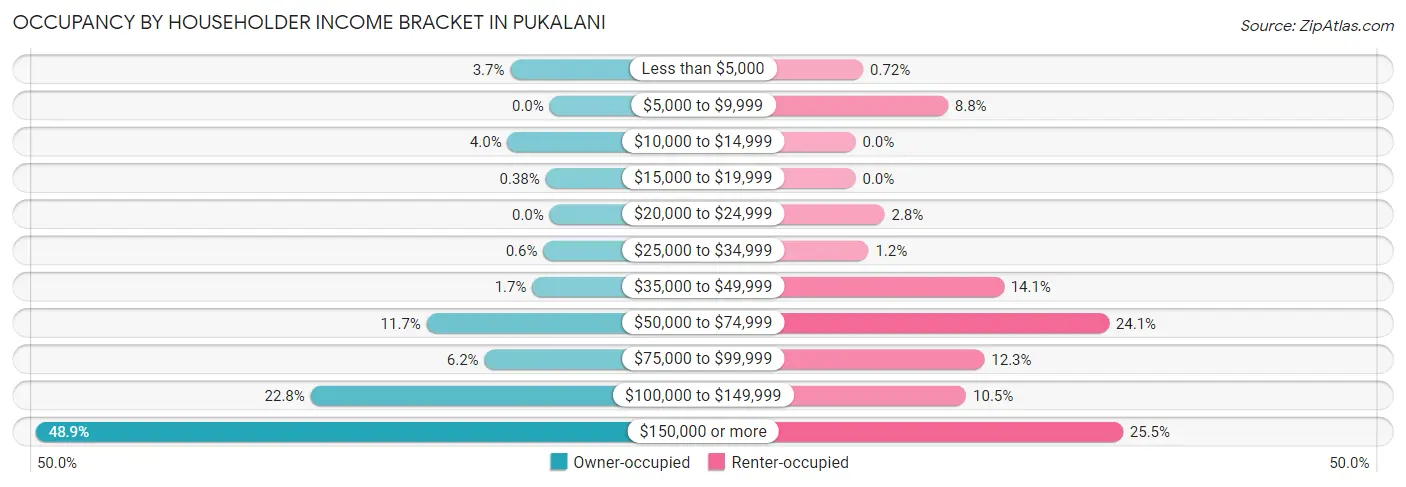
| Income Bracket | Owner-occupied | Renter-occupied |
| Less than $5,000 | 68 (3.7%) | 7 (0.7%) |
| $5,000 to $9,999 | 0 (0.0%) | 86 (8.8%) |
| $10,000 to $14,999 | 73 (4.0%) | 0 (0.0%) |
| $15,000 to $19,999 | 7 (0.4%) | 0 (0.0%) |
| $20,000 to $24,999 | 0 (0.0%) | 27 (2.8%) |
| $25,000 to $34,999 | 11 (0.6%) | 12 (1.2%) |
| $35,000 to $49,999 | 30 (1.7%) | 138 (14.1%) |
| $50,000 to $74,999 | 213 (11.7%) | 236 (24.1%) |
| $75,000 to $99,999 | 113 (6.2%) | 120 (12.3%) |
| $100,000 to $149,999 | 414 (22.8%) | 103 (10.5%) |
| $150,000 or more | 890 (48.9%) | 249 (25.5%) |
| Total | 1,819 (100.0%) | 978 (100.0%) |
Monthly Housing Cost Tiers in Pukalani
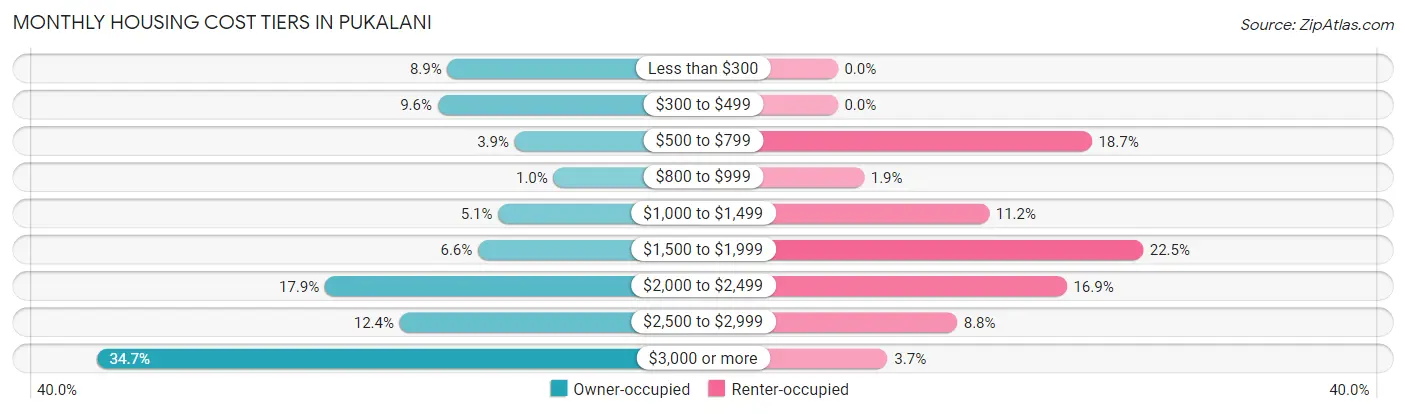
| Monthly Cost | Owner-occupied | Renter-occupied |
| Less than $300 | 161 (8.8%) | 0 (0.0%) |
| $300 to $499 | 174 (9.6%) | 0 (0.0%) |
| $500 to $799 | 71 (3.9%) | 183 (18.7%) |
| $800 to $999 | 19 (1.0%) | 19 (1.9%) |
| $1,000 to $1,499 | 93 (5.1%) | 109 (11.2%) |
| $1,500 to $1,999 | 120 (6.6%) | 220 (22.5%) |
| $2,000 to $2,499 | 325 (17.9%) | 165 (16.9%) |
| $2,500 to $2,999 | 225 (12.4%) | 86 (8.8%) |
| $3,000 or more | 631 (34.7%) | 36 (3.7%) |
| Total | 1,819 (100.0%) | 978 (100.0%) |
Physical Housing Characteristics in Pukalani
Housing Structures in Pukalani
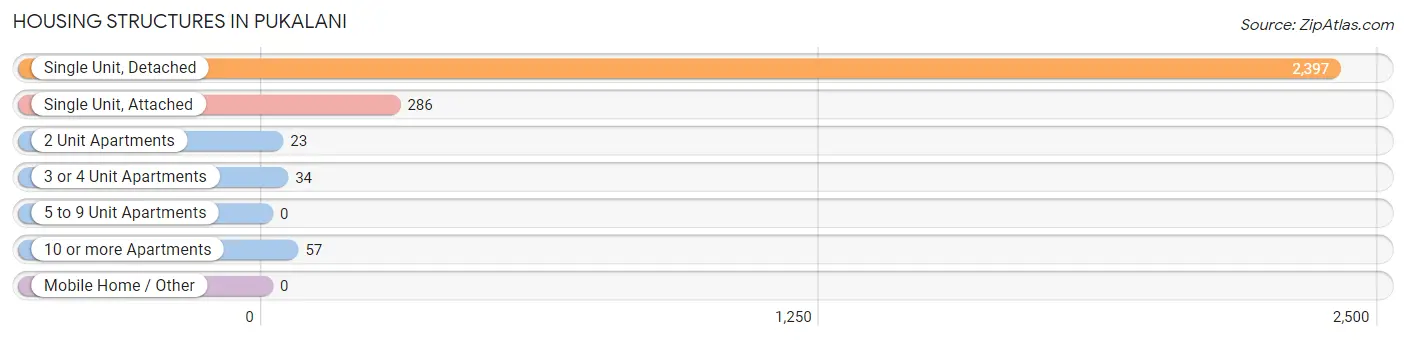
| Structure Type | # Housing Units | % Housing Units |
| Single Unit, Detached | 2,397 | 85.7% |
| Single Unit, Attached | 286 | 10.2% |
| 2 Unit Apartments | 23 | 0.8% |
| 3 or 4 Unit Apartments | 34 | 1.2% |
| 5 to 9 Unit Apartments | 0 | 0.0% |
| 10 or more Apartments | 57 | 2.0% |
| Mobile Home / Other | 0 | 0.0% |
| Total | 2,797 | 100.0% |
Housing Structures by Occupancy in Pukalani
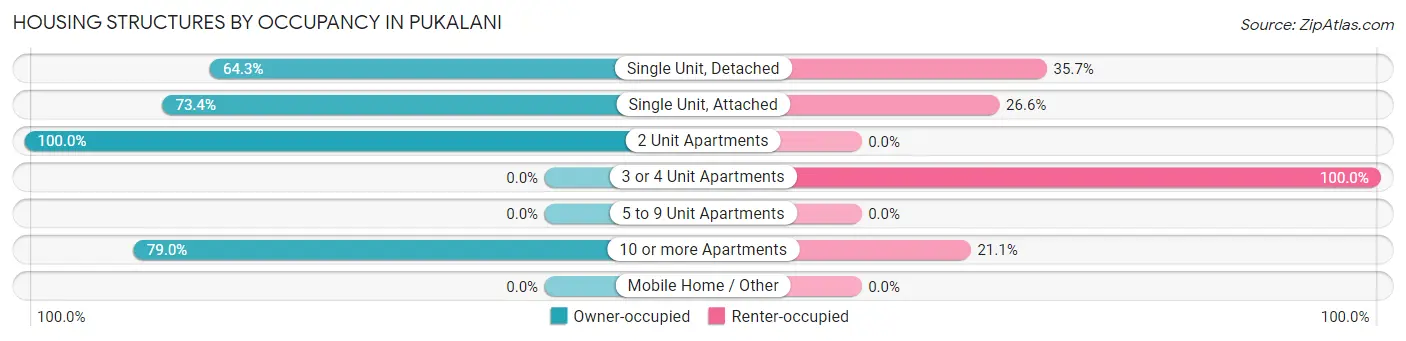
| Structure Type | Owner-occupied | Renter-occupied |
| Single Unit, Detached | 1,541 (64.3%) | 856 (35.7%) |
| Single Unit, Attached | 210 (73.4%) | 76 (26.6%) |
| 2 Unit Apartments | 23 (100.0%) | 0 (0.0%) |
| 3 or 4 Unit Apartments | 0 (0.0%) | 34 (100.0%) |
| 5 to 9 Unit Apartments | 0 (0.0%) | 0 (0.0%) |
| 10 or more Apartments | 45 (78.9%) | 12 (21.0%) |
| Mobile Home / Other | 0 (0.0%) | 0 (0.0%) |
| Total | 1,819 (65.0%) | 978 (35.0%) |
Housing Structures by Number of Rooms in Pukalani
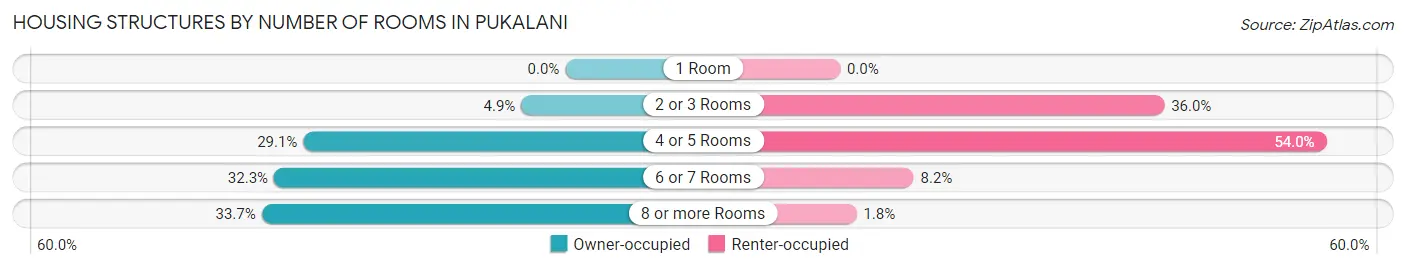
| Number of Rooms | Owner-occupied | Renter-occupied |
| 1 Room | 0 (0.0%) | 0 (0.0%) |
| 2 or 3 Rooms | 89 (4.9%) | 352 (36.0%) |
| 4 or 5 Rooms | 529 (29.1%) | 528 (54.0%) |
| 6 or 7 Rooms | 588 (32.3%) | 80 (8.2%) |
| 8 or more Rooms | 613 (33.7%) | 18 (1.8%) |
| Total | 1,819 (100.0%) | 978 (100.0%) |
Housing Structure by Heating Type in Pukalani
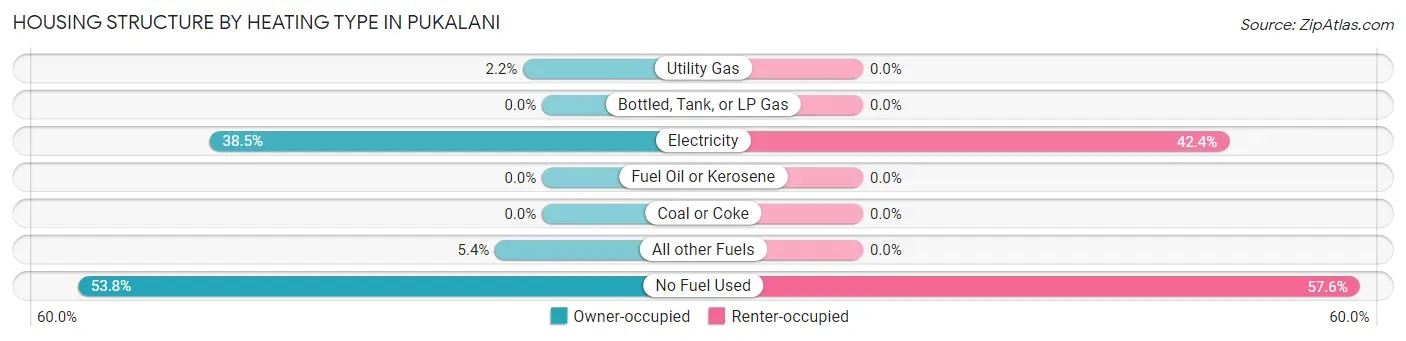
| Heating Type | Owner-occupied | Renter-occupied |
| Utility Gas | 40 (2.2%) | 0 (0.0%) |
| Bottled, Tank, or LP Gas | 0 (0.0%) | 0 (0.0%) |
| Electricity | 701 (38.5%) | 415 (42.4%) |
| Fuel Oil or Kerosene | 0 (0.0%) | 0 (0.0%) |
| Coal or Coke | 0 (0.0%) | 0 (0.0%) |
| All other Fuels | 99 (5.4%) | 0 (0.0%) |
| No Fuel Used | 979 (53.8%) | 563 (57.6%) |
| Total | 1,819 (100.0%) | 978 (100.0%) |
Household Vehicle Usage in Pukalani
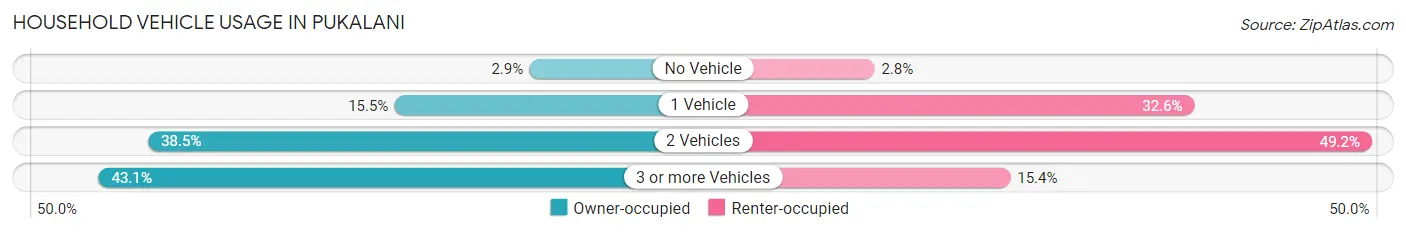
| Vehicles per Household | Owner-occupied | Renter-occupied |
| No Vehicle | 53 (2.9%) | 27 (2.8%) |
| 1 Vehicle | 282 (15.5%) | 319 (32.6%) |
| 2 Vehicles | 700 (38.5%) | 481 (49.2%) |
| 3 or more Vehicles | 784 (43.1%) | 151 (15.4%) |
| Total | 1,819 (100.0%) | 978 (100.0%) |
Real Estate & Mortgages in Pukalani
Real Estate and Mortgage Overview in Pukalani
| Characteristic | Without Mortgage | With Mortgage |
| Housing Units | 453 | 1,366 |
| Median Property Value | $777,000 | $928,800 |
| Median Household Income | $111,985 | $768 |
| Monthly Housing Costs | $338 | $631 |
| Real Estate Taxes | $1,403 | $77 |
Property Value by Mortgage Status in Pukalani
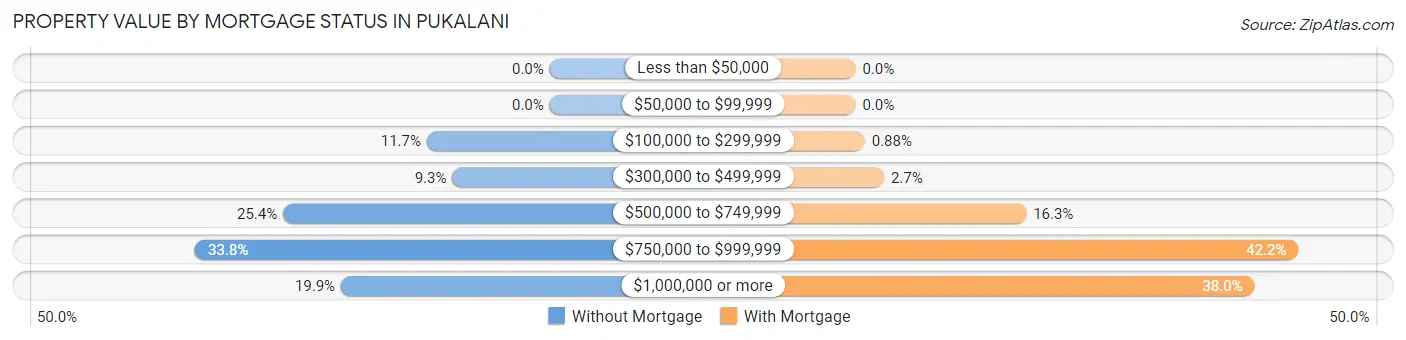
| Property Value | Without Mortgage | With Mortgage |
| Less than $50,000 | 0 (0.0%) | 0 (0.0%) |
| $50,000 to $99,999 | 0 (0.0%) | 0 (0.0%) |
| $100,000 to $299,999 | 53 (11.7%) | 12 (0.9%) |
| $300,000 to $499,999 | 42 (9.3%) | 37 (2.7%) |
| $500,000 to $749,999 | 115 (25.4%) | 222 (16.3%) |
| $750,000 to $999,999 | 153 (33.8%) | 576 (42.2%) |
| $1,000,000 or more | 90 (19.9%) | 519 (38.0%) |
| Total | 453 (100.0%) | 1,366 (100.0%) |
Household Income by Mortgage Status in Pukalani
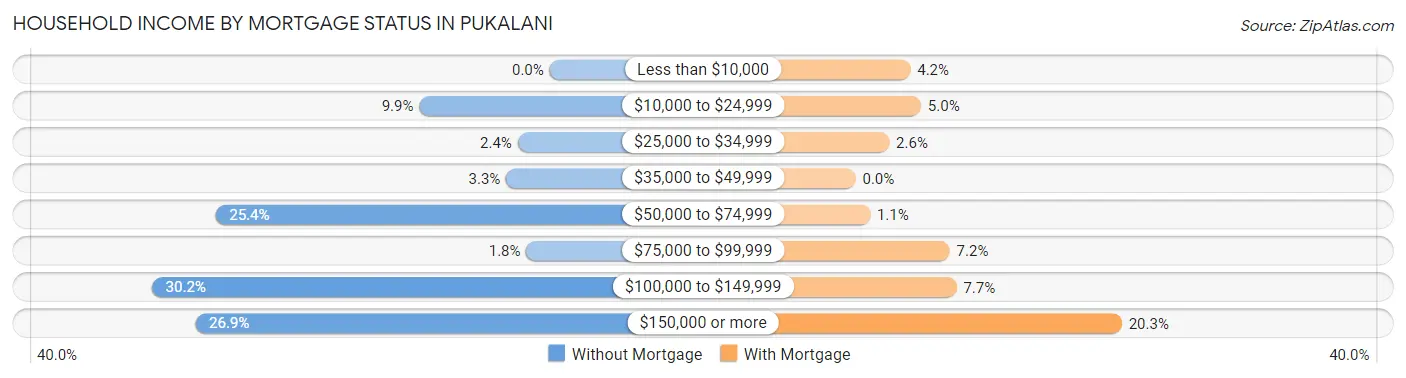
| Household Income | Without Mortgage | With Mortgage |
| Less than $10,000 | 0 (0.0%) | 57 (4.2%) |
| $10,000 to $24,999 | 45 (9.9%) | 68 (5.0%) |
| $25,000 to $34,999 | 11 (2.4%) | 35 (2.6%) |
| $35,000 to $49,999 | 15 (3.3%) | 0 (0.0%) |
| $50,000 to $74,999 | 115 (25.4%) | 15 (1.1%) |
| $75,000 to $99,999 | 8 (1.8%) | 98 (7.2%) |
| $100,000 to $149,999 | 137 (30.2%) | 105 (7.7%) |
| $150,000 or more | 122 (26.9%) | 277 (20.3%) |
| Total | 453 (100.0%) | 1,366 (100.0%) |
Property Value to Household Income Ratio in Pukalani
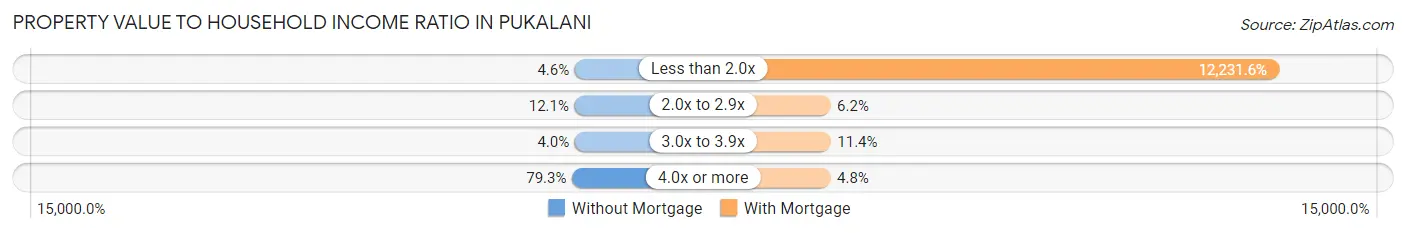
| Value-to-Income Ratio | Without Mortgage | With Mortgage |
| Less than 2.0x | 21 (4.6%) | 167,083 (12,231.6%) |
| 2.0x to 2.9x | 55 (12.1%) | 85 (6.2%) |
| 3.0x to 3.9x | 18 (4.0%) | 156 (11.4%) |
| 4.0x or more | 359 (79.2%) | 66 (4.8%) |
| Total | 453 (100.0%) | 1,366 (100.0%) |
Real Estate Taxes by Mortgage Status in Pukalani
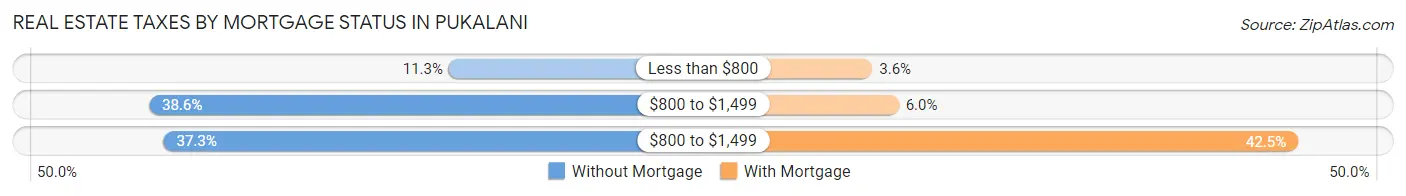
| Property Taxes | Without Mortgage | With Mortgage |
| Less than $800 | 51 (11.3%) | 49 (3.6%) |
| $800 to $1,499 | 175 (38.6%) | 82 (6.0%) |
| $800 to $1,499 | 169 (37.3%) | 580 (42.5%) |
| Total | 453 (100.0%) | 1,366 (100.0%) |
Health & Disability in Pukalani
Health Insurance Coverage by Age in Pukalani
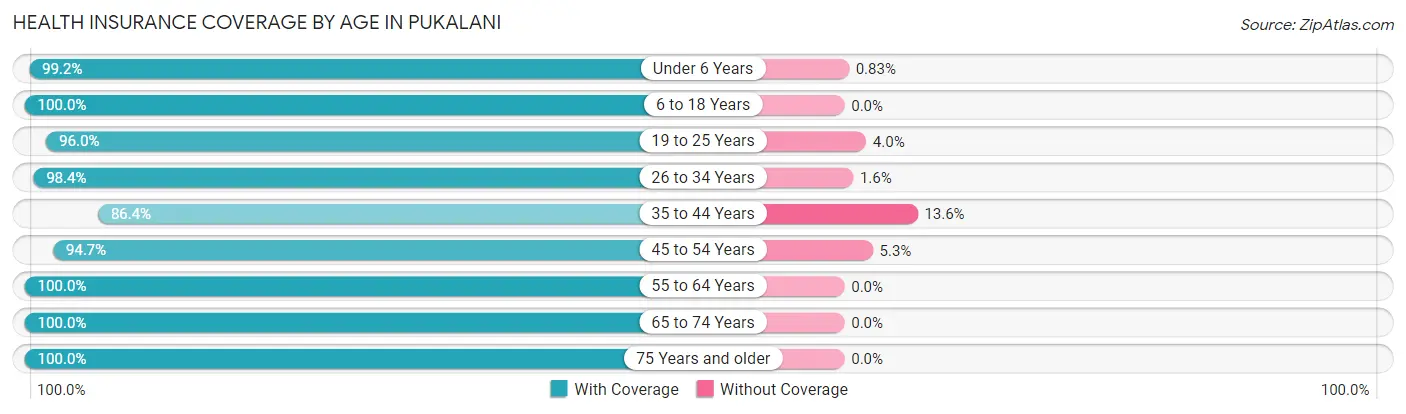
| Age Bracket | With Coverage | Without Coverage |
| Under 6 Years | 594 (99.2%) | 5 (0.8%) |
| 6 to 18 Years | 675 (100.0%) | 0 (0.0%) |
| 19 to 25 Years | 643 (96.0%) | 27 (4.0%) |
| 26 to 34 Years | 1,037 (98.4%) | 17 (1.6%) |
| 35 to 44 Years | 576 (86.4%) | 91 (13.6%) |
| 45 to 54 Years | 1,148 (94.7%) | 64 (5.3%) |
| 55 to 64 Years | 1,268 (100.0%) | 0 (0.0%) |
| 65 to 74 Years | 1,325 (100.0%) | 0 (0.0%) |
| 75 Years and older | 399 (100.0%) | 0 (0.0%) |
| Total | 7,665 (97.4%) | 204 (2.6%) |
Health Insurance Coverage by Citizenship Status in Pukalani
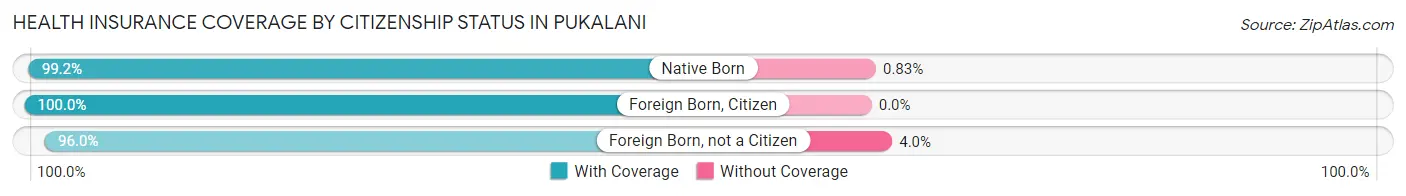
| Citizenship Status | With Coverage | Without Coverage |
| Native Born | 594 (99.2%) | 5 (0.8%) |
| Foreign Born, Citizen | 675 (100.0%) | 0 (0.0%) |
| Foreign Born, not a Citizen | 643 (96.0%) | 27 (4.0%) |
Health Insurance Coverage by Household Income in Pukalani
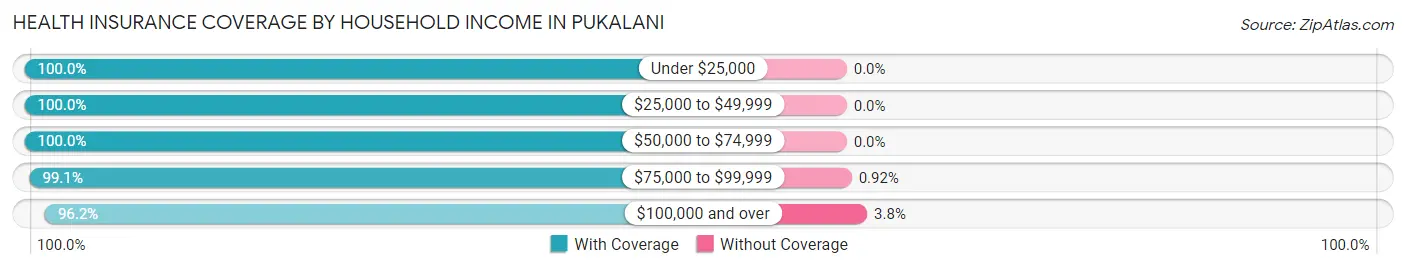
| Household Income | With Coverage | Without Coverage |
| Under $25,000 | 437 (100.0%) | 0 (0.0%) |
| $25,000 to $49,999 | 409 (100.0%) | 0 (0.0%) |
| $50,000 to $74,999 | 1,266 (100.0%) | 0 (0.0%) |
| $75,000 to $99,999 | 541 (99.1%) | 5 (0.9%) |
| $100,000 and over | 5,012 (96.2%) | 199 (3.8%) |
Public vs Private Health Insurance Coverage by Age in Pukalani
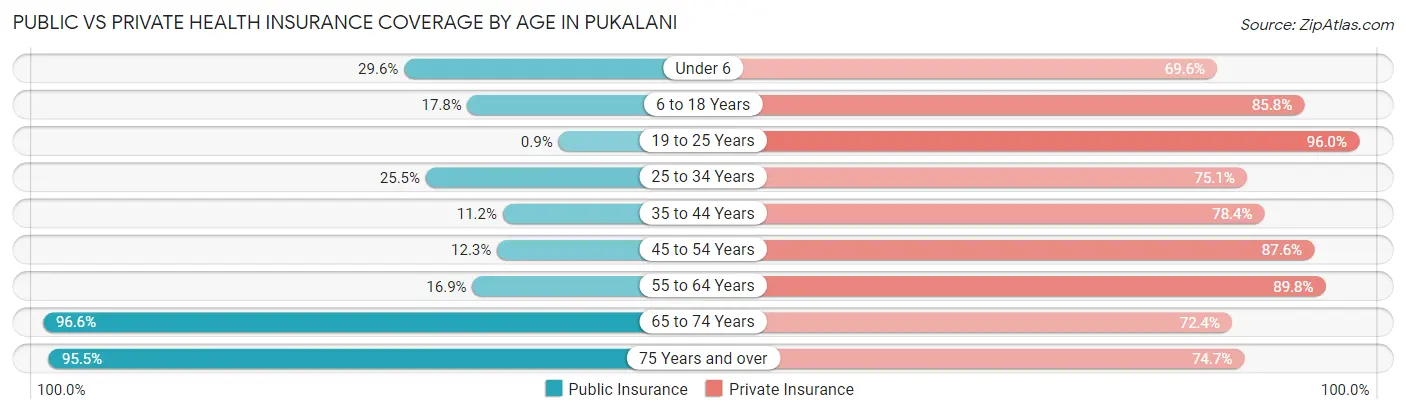
| Age Bracket | Public Insurance | Private Insurance |
| Under 6 | 177 (29.5%) | 417 (69.6%) |
| 6 to 18 Years | 120 (17.8%) | 579 (85.8%) |
| 19 to 25 Years | 6 (0.9%) | 643 (96.0%) |
| 25 to 34 Years | 269 (25.5%) | 792 (75.1%) |
| 35 to 44 Years | 75 (11.2%) | 523 (78.4%) |
| 45 to 54 Years | 149 (12.3%) | 1,062 (87.6%) |
| 55 to 64 Years | 214 (16.9%) | 1,138 (89.7%) |
| 65 to 74 Years | 1,280 (96.6%) | 959 (72.4%) |
| 75 Years and over | 381 (95.5%) | 298 (74.7%) |
| Total | 2,671 (33.9%) | 6,411 (81.5%) |
Disability Status by Sex by Age in Pukalani
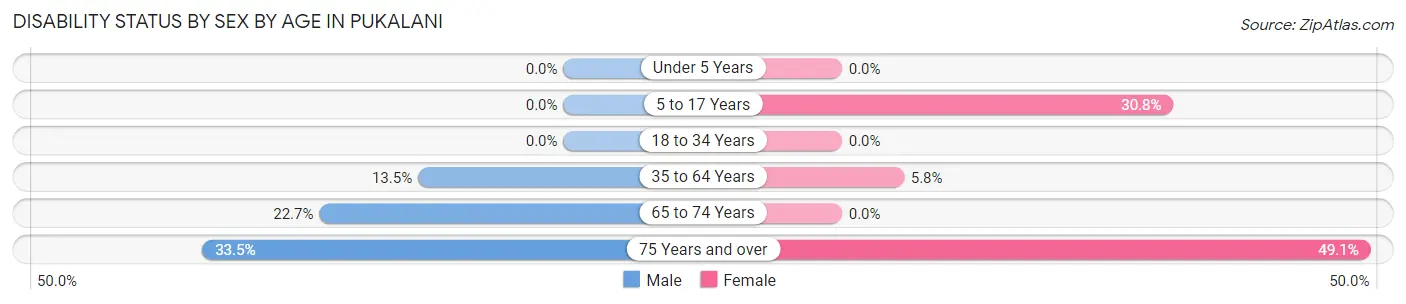
| Age Bracket | Male | Female |
| Under 5 Years | 0 (0.0%) | 0 (0.0%) |
| 5 to 17 Years | 0 (0.0%) | 92 (30.8%) |
| 18 to 34 Years | 0 (0.0%) | 0 (0.0%) |
| 35 to 64 Years | 204 (13.5%) | 94 (5.8%) |
| 65 to 74 Years | 147 (22.7%) | 0 (0.0%) |
| 75 Years and over | 62 (33.5%) | 105 (49.1%) |
Disability Class by Sex by Age in Pukalani
Disability Class: Hearing Difficulty
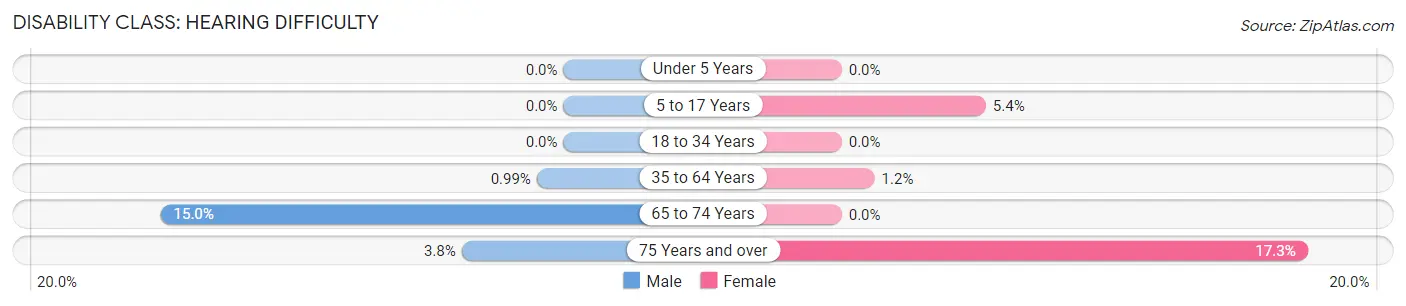
| Age Bracket | Male | Female |
| Under 5 Years | 0 (0.0%) | 0 (0.0%) |
| 5 to 17 Years | 0 (0.0%) | 16 (5.3%) |
| 18 to 34 Years | 0 (0.0%) | 0 (0.0%) |
| 35 to 64 Years | 15 (1.0%) | 20 (1.2%) |
| 65 to 74 Years | 97 (14.9%) | 0 (0.0%) |
| 75 Years and over | 7 (3.8%) | 37 (17.3%) |
Disability Class: Vision Difficulty
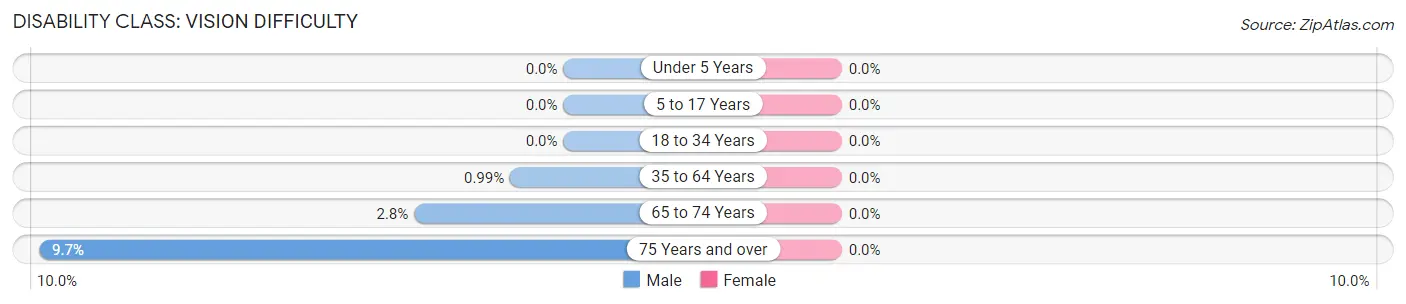
| Age Bracket | Male | Female |
| Under 5 Years | 0 (0.0%) | 0 (0.0%) |
| 5 to 17 Years | 0 (0.0%) | 0 (0.0%) |
| 18 to 34 Years | 0 (0.0%) | 0 (0.0%) |
| 35 to 64 Years | 15 (1.0%) | 0 (0.0%) |
| 65 to 74 Years | 18 (2.8%) | 0 (0.0%) |
| 75 Years and over | 18 (9.7%) | 0 (0.0%) |
Disability Class: Cognitive Difficulty
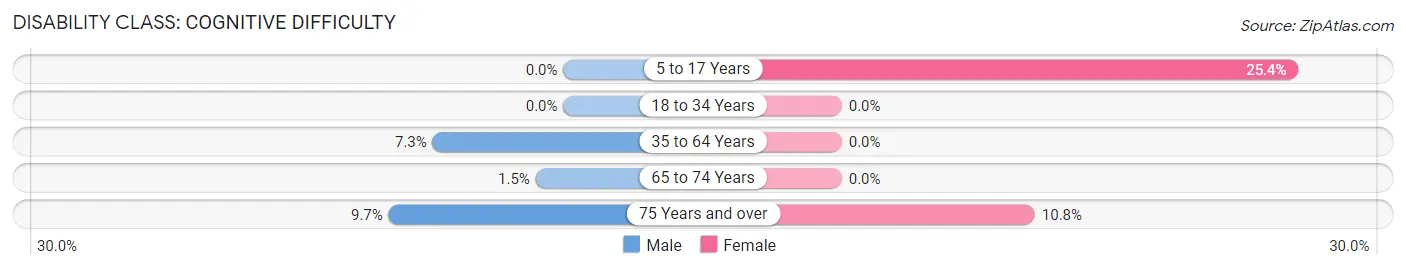
| Age Bracket | Male | Female |
| 5 to 17 Years | 0 (0.0%) | 76 (25.4%) |
| 18 to 34 Years | 0 (0.0%) | 0 (0.0%) |
| 35 to 64 Years | 110 (7.3%) | 0 (0.0%) |
| 65 to 74 Years | 10 (1.5%) | 0 (0.0%) |
| 75 Years and over | 18 (9.7%) | 23 (10.7%) |
Disability Class: Ambulatory Difficulty
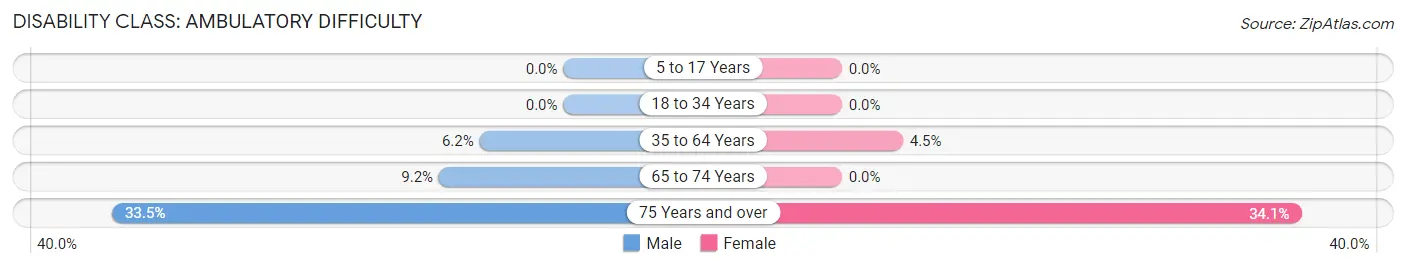
| Age Bracket | Male | Female |
| 5 to 17 Years | 0 (0.0%) | 0 (0.0%) |
| 18 to 34 Years | 0 (0.0%) | 0 (0.0%) |
| 35 to 64 Years | 94 (6.2%) | 74 (4.5%) |
| 65 to 74 Years | 60 (9.2%) | 0 (0.0%) |
| 75 Years and over | 62 (33.5%) | 73 (34.1%) |
Disability Class: Self-Care Difficulty
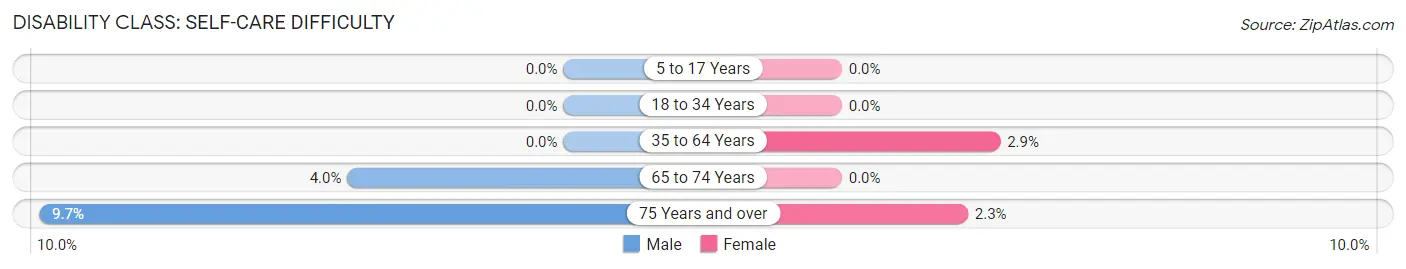
| Age Bracket | Male | Female |
| 5 to 17 Years | 0 (0.0%) | 0 (0.0%) |
| 18 to 34 Years | 0 (0.0%) | 0 (0.0%) |
| 35 to 64 Years | 0 (0.0%) | 48 (2.9%) |
| 65 to 74 Years | 26 (4.0%) | 0 (0.0%) |
| 75 Years and over | 18 (9.7%) | 5 (2.3%) |
Technology Access in Pukalani
Computing Device Access in Pukalani
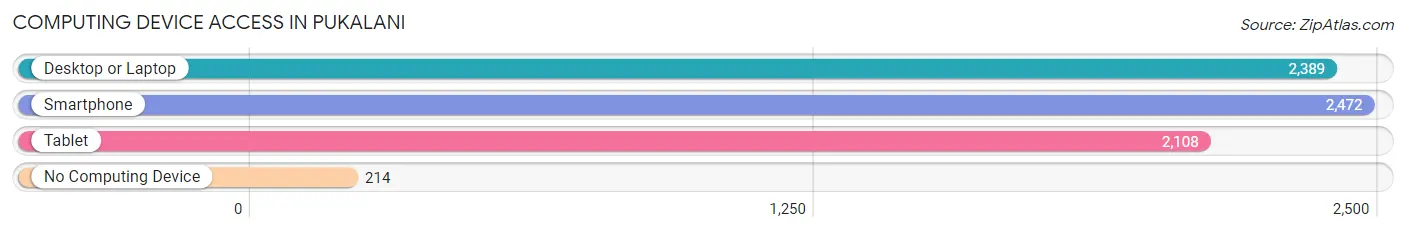
| Device Type | # Households | % Households |
| Desktop or Laptop | 2,389 | 85.4% |
| Smartphone | 2,472 | 88.4% |
| Tablet | 2,108 | 75.4% |
| No Computing Device | 214 | 7.6% |
| Total | 2,797 | 100.0% |
Internet Access in Pukalani
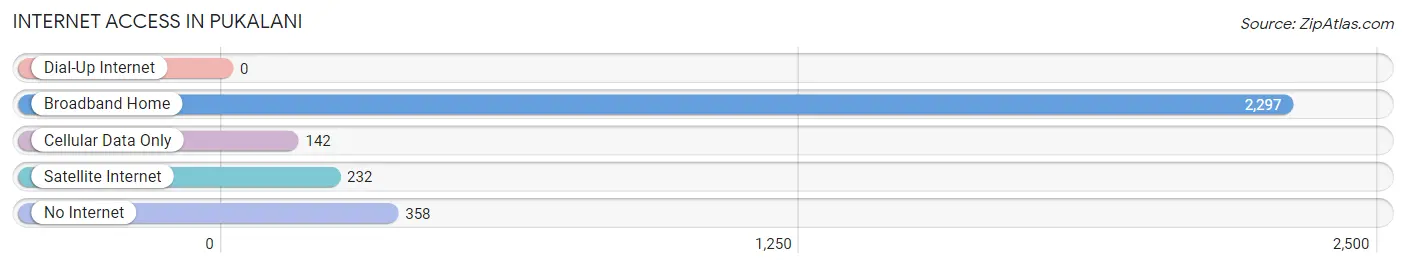
| Internet Type | # Households | % Households |
| Dial-Up Internet | 0 | 0.0% |
| Broadband Home | 2,297 | 82.1% |
| Cellular Data Only | 142 | 5.1% |
| Satellite Internet | 232 | 8.3% |
| No Internet | 358 | 12.8% |
| Total | 2,797 | 100.0% |
Pukalani Summary
Pukalani is a small town located on the island of Maui in the state of Hawaii. It is situated in the central part of the island, about five miles from the town of Makawao. The population of Pukalani was 8,890 at the 2010 census.
History
Pukalani was founded in the early 1900s by a group of Hawaiian homesteaders. The name Pukalani means “hole in the sky” in Hawaiian, and was chosen to reflect the town’s location in the clouds. The town was originally a small agricultural community, with many of the residents growing sugar cane, pineapple, and other crops.
In the 1950s, Pukalani began to experience rapid growth as more people moved to the area. The town was incorporated in 1959, and the population grew to over 5,000 by the 1970s.
Geography
Pukalani is located in the central part of Maui, about five miles from the town of Makawao. The town is situated at an elevation of 1,400 feet, and is surrounded by the West Maui Mountains. The climate in Pukalani is tropical, with temperatures ranging from the mid-70s to the mid-80s throughout the year.
Economy
The economy of Pukalani is largely based on tourism and agriculture. The town is home to several resorts and hotels, as well as a number of small businesses. Agriculture is also an important part of the local economy, with many of the residents growing sugar cane, pineapple, and other crops.
Demographics
As of the 2010 census, the population of Pukalani was 8,890. The racial makeup of the town was 57.3% White, 0.7% African American, 0.3% Native American, 11.2% Asian, 0.2% Pacific Islander, and 30.5% from other races. The median household income in Pukalani was $50,945, and the median family income was $60,945.
Conclusion
Pukalani is a small town located on the island of Maui in the state of Hawaii. It is situated in the central part of the island, about five miles from the town of Makawao. The population of Pukalani was 8,890 at the 2010 census. The town’s economy is largely based on tourism and agriculture, and the racial makeup of the town is diverse. Pukalani is a great place to visit, and offers a unique blend of Hawaiian culture and modern amenities.
Common Questions
What is Per Capita Income in Pukalani?
Per Capita income in Pukalani is $51,150.
What is the Median Family Income in Pukalani?
Median Family Income in Pukalani is $117,736.
What is the Median Household income in Pukalani?
Median Household Income in Pukalani is $119,426.
What is Income or Wage Gap in Pukalani?
Income or Wage Gap in Pukalani is 17.5%.
Women in Pukalani earn 82.5 cents for every dollar earned by a man.
What is Inequality or Gini Index in Pukalani?
Inequality or Gini Index in Pukalani is 0.41.
What is the Total Population of Pukalani?
Total Population of Pukalani is 7,930.
What is the Total Male Population of Pukalani?
Total Male Population of Pukalani is 3,996.
What is the Total Female Population of Pukalani?
Total Female Population of Pukalani is 3,934.
What is the Ratio of Males per 100 Females in Pukalani?
There are 101.58 Males per 100 Females in Pukalani.
What is the Ratio of Females per 100 Males in Pukalani?
There are 98.45 Females per 100 Males in Pukalani.
What is the Median Population Age in Pukalani?
Median Population Age in Pukalani is 48.7 Years.
What is the Average Family Size in Pukalani
Average Family Size in Pukalani is 3.2 People.
What is the Average Household Size in Pukalani
Average Household Size in Pukalani is 2.8 People.
How Large is the Labor Force in Pukalani?
There are 4,607 People in the Labor Forcein in Pukalani.
What is the Percentage of People in the Labor Force in Pukalani?
66.3% of People are in the Labor Force in Pukalani.
What is the Unemployment Rate in Pukalani?
Unemployment Rate in Pukalani is 3.3%.