Ewa Gentry, HI Map & Demographics
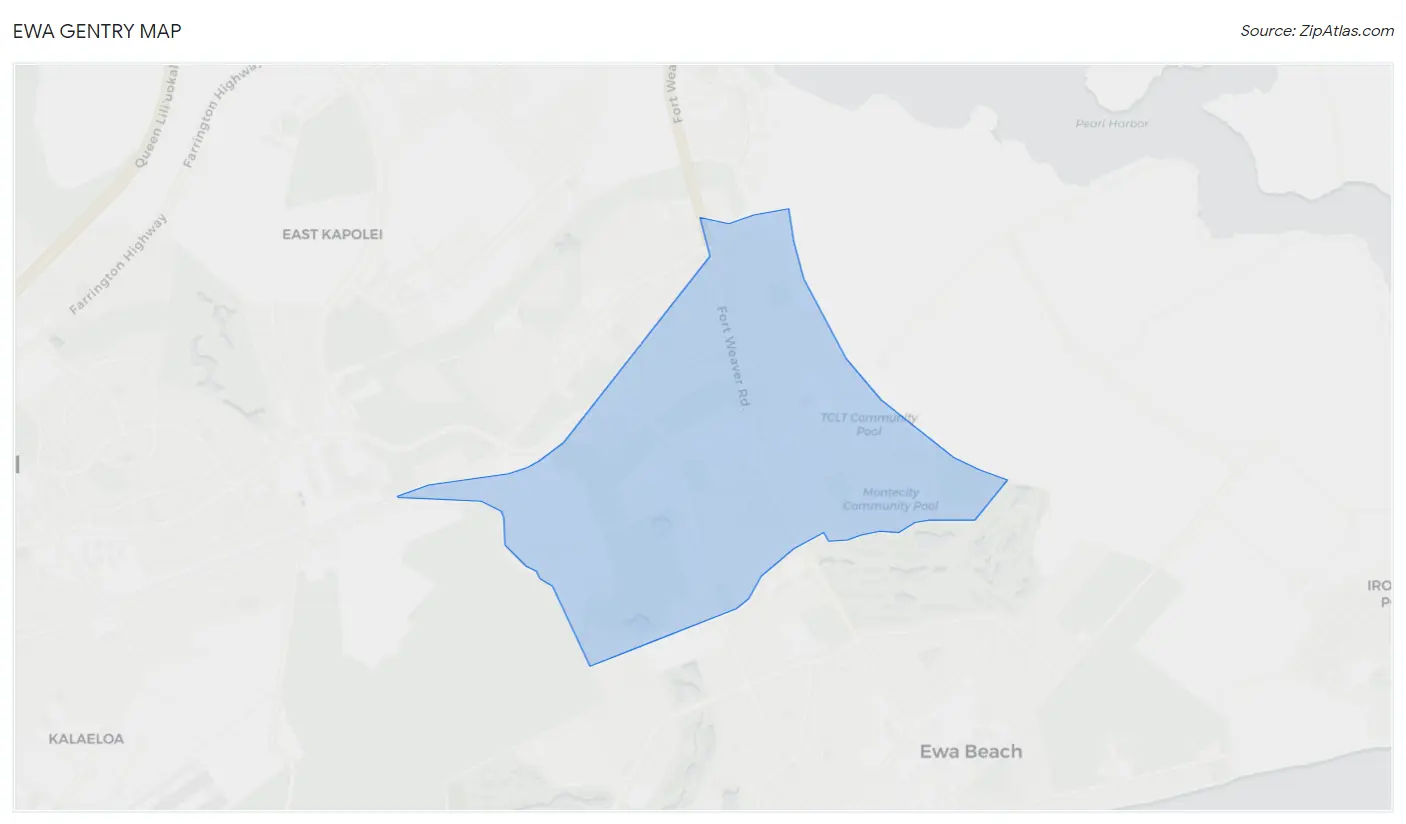
Ewa Gentry Map
Ewa Gentry Overview
$39,900
PER CAPITA INCOME
$133,135
AVG FAMILY INCOME
$125,300
AVG HOUSEHOLD INCOME
29.0%
WAGE / INCOME GAP [ % ]
71.0¢/ $1
WAGE / INCOME GAP [ $ ]
0.31
INEQUALITY / GINI INDEX
27,198
TOTAL POPULATION
13,690
MALE POPULATION
13,508
FEMALE POPULATION
101.35
MALES / 100 FEMALES
98.67
FEMALES / 100 MALES
34.2
MEDIAN AGE
3.8
AVG FAMILY SIZE
3.5
AVG HOUSEHOLD SIZE
15,034
LABOR FORCE [ PEOPLE ]
72.9%
PERCENT IN LABOR FORCE
3.5%
UNEMPLOYMENT RATE
Income in Ewa Gentry
Income Overview in Ewa Gentry
Per Capita Income in Ewa Gentry is $39,900, while median incomes of families and households are $133,135 and $125,300 respectively.
| Characteristic | Number | Measure |
| Per Capita Income | 27,198 | $39,900 |
| Median Family Income | 6,225 | $133,135 |
| Mean Family Income | 6,225 | $139,276 |
| Median Household Income | 7,824 | $125,300 |
| Mean Household Income | 7,824 | $135,584 |
| Income Deficit | 6,225 | $0 |
| Wage / Income Gap (%) | 27,198 | 29.04% |
| Wage / Income Gap ($) | 27,198 | 70.96¢ per $1 |
| Gini / Inequality Index | 27,198 | 0.31 |
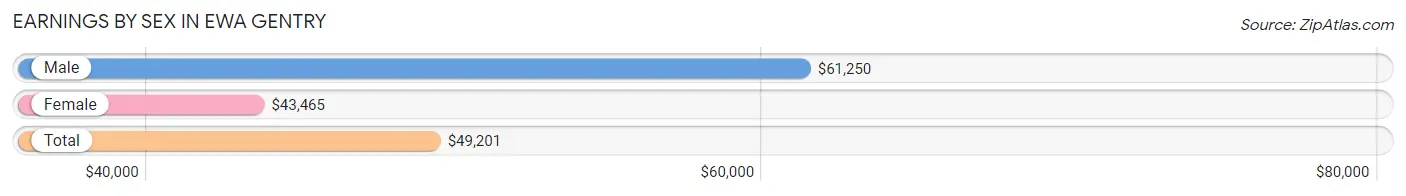
Earnings by Sex in Ewa Gentry
Average Earnings in Ewa Gentry are $49,201, $61,250 for men and $43,465 for women, a difference of 29.0%.
| Sex | Number | Average Earnings |
| Male | 7,961 (51.4%) | $61,250 |
| Female | 7,534 (48.6%) | $43,465 |
| Total | 15,495 (100.0%) | $49,201 |
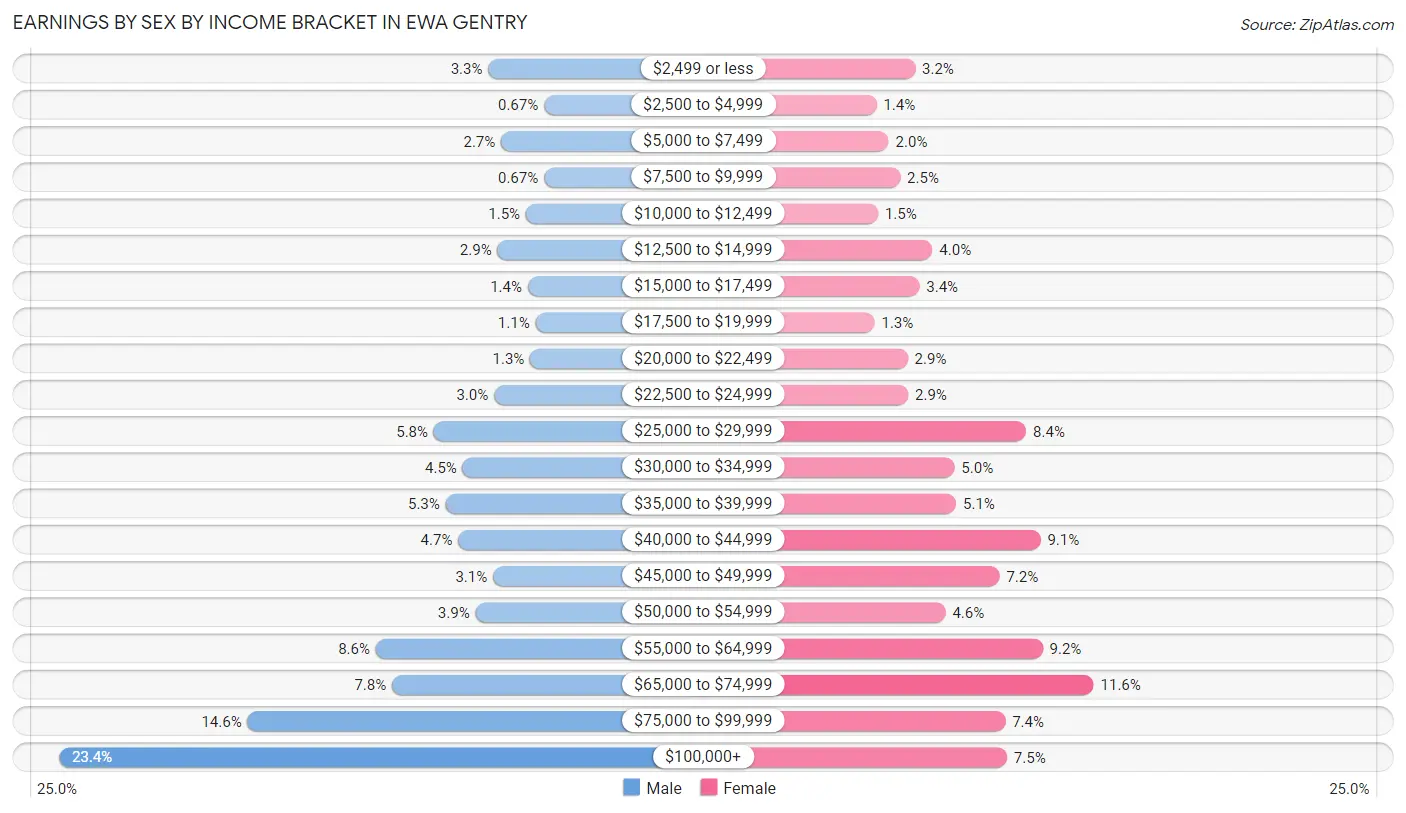
Earnings by Sex by Income Bracket in Ewa Gentry
The most common earnings brackets in Ewa Gentry are $100,000+ for men (1,862 | 23.4%) and $65,000 to $74,999 for women (871 | 11.6%).
| Income | Male | Female |
| $2,499 or less | 261 (3.3%) | 241 (3.2%) |
| $2,500 to $4,999 | 53 (0.7%) | 105 (1.4%) |
| $5,000 to $7,499 | 213 (2.7%) | 148 (2.0%) |
| $7,500 to $9,999 | 53 (0.7%) | 188 (2.5%) |
| $10,000 to $12,499 | 121 (1.5%) | 110 (1.5%) |
| $12,500 to $14,999 | 227 (2.9%) | 302 (4.0%) |
| $15,000 to $17,499 | 114 (1.4%) | 256 (3.4%) |
| $17,500 to $19,999 | 85 (1.1%) | 98 (1.3%) |
| $20,000 to $22,499 | 105 (1.3%) | 215 (2.9%) |
| $22,500 to $24,999 | 240 (3.0%) | 216 (2.9%) |
| $25,000 to $29,999 | 464 (5.8%) | 633 (8.4%) |
| $30,000 to $34,999 | 357 (4.5%) | 380 (5.0%) |
| $35,000 to $39,999 | 420 (5.3%) | 386 (5.1%) |
| $40,000 to $44,999 | 373 (4.7%) | 683 (9.1%) |
| $45,000 to $49,999 | 244 (3.1%) | 539 (7.1%) |
| $50,000 to $54,999 | 309 (3.9%) | 348 (4.6%) |
| $55,000 to $64,999 | 681 (8.6%) | 691 (9.2%) |
| $65,000 to $74,999 | 620 (7.8%) | 871 (11.6%) |
| $75,000 to $99,999 | 1,159 (14.6%) | 559 (7.4%) |
| $100,000+ | 1,862 (23.4%) | 565 (7.5%) |
| Total | 7,961 (100.0%) | 7,534 (100.0%) |
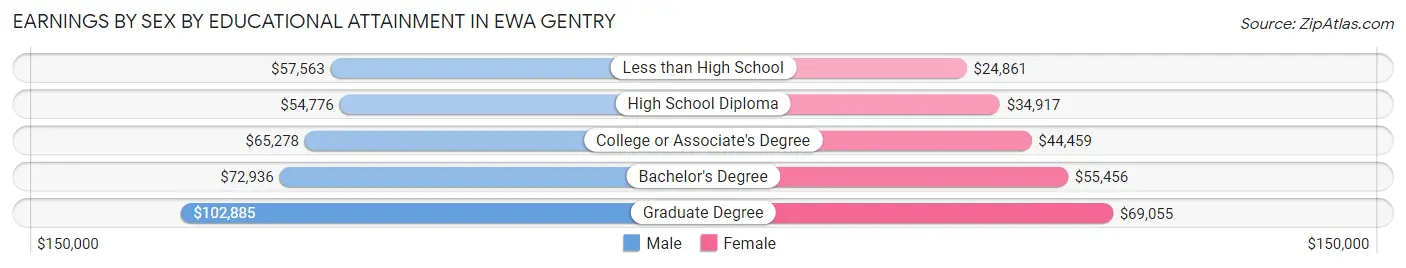
Earnings by Sex by Educational Attainment in Ewa Gentry
Average earnings in Ewa Gentry are $65,343 for men and $46,102 for women, a difference of 29.4%. Men with an educational attainment of graduate degree enjoy the highest average annual earnings of $102,885, while those with high school diploma education earn the least with $54,776. Women with an educational attainment of graduate degree earn the most with the average annual earnings of $69,055, while those with less than high school education have the smallest earnings of $24,861.
| Educational Attainment | Male Income | Female Income |
| Less than High School | $57,563 | $24,861 |
| High School Diploma | $54,776 | $34,917 |
| College or Associate's Degree | $65,278 | $44,459 |
| Bachelor's Degree | $72,936 | $55,456 |
| Graduate Degree | $102,885 | $69,055 |
| Total | $65,343 | $46,102 |
Family Income in Ewa Gentry
Family Income Brackets in Ewa Gentry
According to the Ewa Gentry family income data, there are 1,637 families falling into the $100,000 to $149,999 income range, which is the most common income bracket and makes up 26.3% of all families. Conversely, the $10,000 to $14,999 income bracket is the least frequent group with only 12 families (0.2%) belonging to this category.
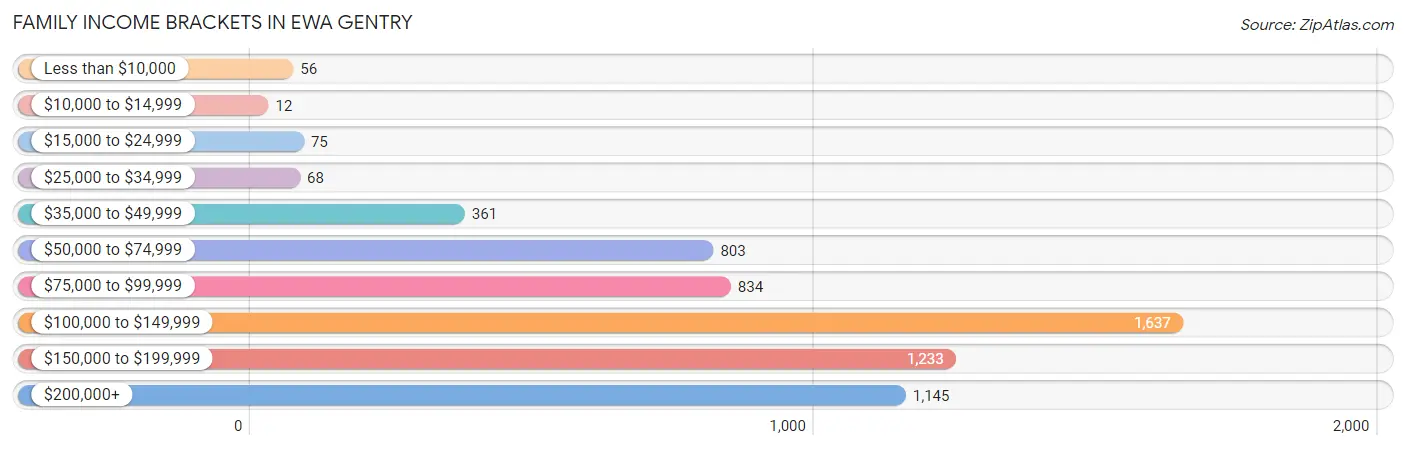
| Income Bracket | # Families | % Families |
| Less than $10,000 | 56 | 0.9% |
| $10,000 to $14,999 | 12 | 0.2% |
| $15,000 to $24,999 | 75 | 1.2% |
| $25,000 to $34,999 | 68 | 1.1% |
| $35,000 to $49,999 | 361 | 5.8% |
| $50,000 to $74,999 | 803 | 12.9% |
| $75,000 to $99,999 | 834 | 13.4% |
| $100,000 to $149,999 | 1,637 | 26.3% |
| $150,000 to $199,999 | 1,233 | 19.8% |
| $200,000+ | 1,145 | 18.4% |
Family Income by Famaliy Size in Ewa Gentry
7+ person families (277 | 4.4%) account for the highest median family income in Ewa Gentry with $178,594 per family, while 2-person families (1,912 | 30.7%) have the highest median income of $44,235 per family member.
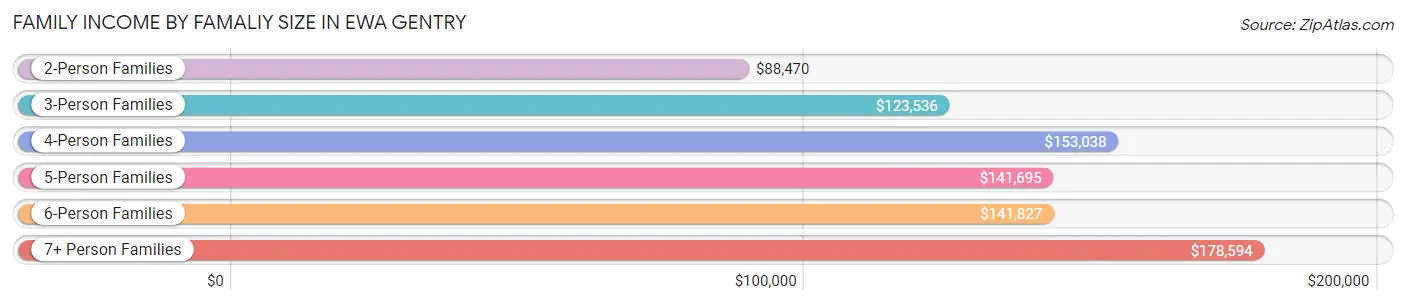
| Income Bracket | # Families | Median Income |
| 2-Person Families | 1,912 (30.7%) | $88,470 |
| 3-Person Families | 1,431 (23.0%) | $123,536 |
| 4-Person Families | 1,450 (23.3%) | $153,038 |
| 5-Person Families | 618 (9.9%) | $141,695 |
| 6-Person Families | 537 (8.6%) | $141,827 |
| 7+ Person Families | 277 (4.4%) | $178,594 |
| Total | 6,225 (100.0%) | $133,135 |
Family Income by Number of Earners in Ewa Gentry
The median family income in Ewa Gentry is $133,135, with families comprising 3+ earners (1,496) having the highest median family income of $170,804, while families with no earners (340) have the lowest median family income of $65,720, accounting for 24.0% and 5.5% of families, respectively.
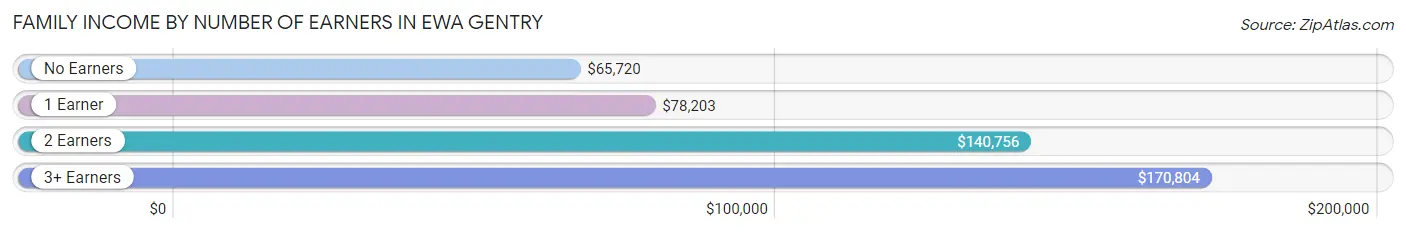
| Number of Earners | # Families | Median Income |
| No Earners | 340 (5.5%) | $65,720 |
| 1 Earner | 1,804 (29.0%) | $78,203 |
| 2 Earners | 2,585 (41.5%) | $140,756 |
| 3+ Earners | 1,496 (24.0%) | $170,804 |
| Total | 6,225 (100.0%) | $133,135 |
Household Income in Ewa Gentry
Household Income Brackets in Ewa Gentry
With 2,277 households falling in the category, the $100,000 to $149,999 income range is the most frequent in Ewa Gentry, accounting for 29.1% of all households. In contrast, only 23 households (0.3%) fall into the $10,000 to $14,999 income bracket, making it the least populous group.
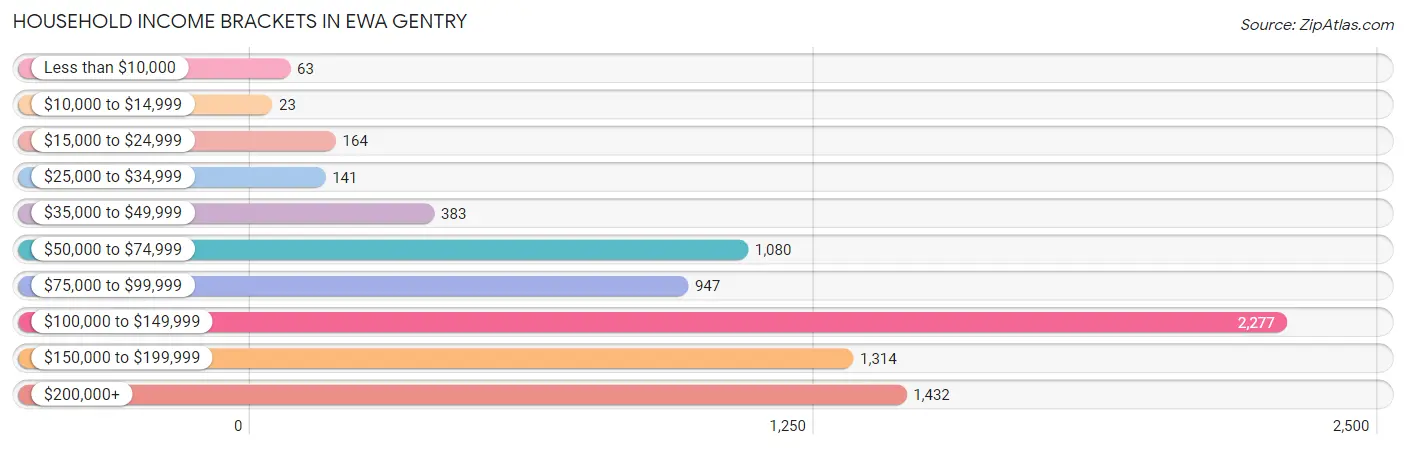
| Income Bracket | # Households | % Households |
| Less than $10,000 | 63 | 0.8% |
| $10,000 to $14,999 | 23 | 0.3% |
| $15,000 to $24,999 | 164 | 2.1% |
| $25,000 to $34,999 | 141 | 1.8% |
| $35,000 to $49,999 | 383 | 4.9% |
| $50,000 to $74,999 | 1,080 | 13.8% |
| $75,000 to $99,999 | 947 | 12.1% |
| $100,000 to $149,999 | 2,277 | 29.1% |
| $150,000 to $199,999 | 1,314 | 16.8% |
| $200,000+ | 1,432 | 18.3% |
Household Income by Householder Age in Ewa Gentry
The median household income in Ewa Gentry is $125,300, with the highest median household income of $133,250 found in the 45 to 64 years age bracket for the primary householder. A total of 3,245 households (41.5%) fall into this category. Meanwhile, the 15 to 24 years age bracket for the primary householder has the lowest median household income of $0, with 108 households (1.4%) in this group.
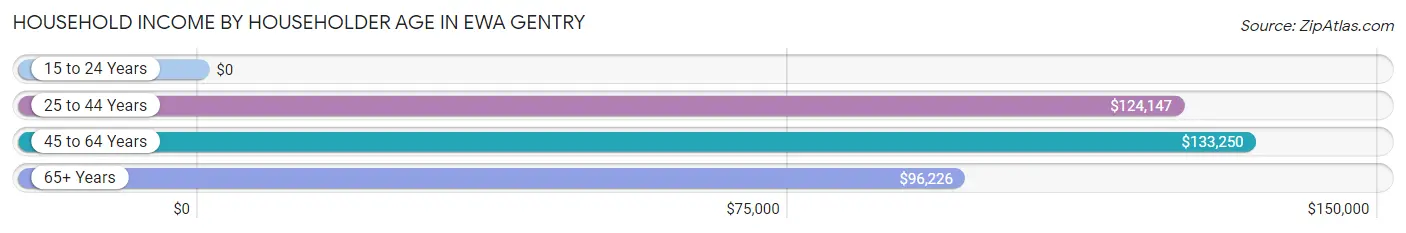
| Income Bracket | # Households | Median Income |
| 15 to 24 Years | 108 (1.4%) | $0 |
| 25 to 44 Years | 3,342 (42.7%) | $124,147 |
| 45 to 64 Years | 3,245 (41.5%) | $133,250 |
| 65+ Years | 1,129 (14.4%) | $96,226 |
| Total | 7,824 (100.0%) | $125,300 |
Poverty in Ewa Gentry
Income Below Poverty by Sex and Age in Ewa Gentry
With 3.4% poverty level for males and 4.0% for females among the residents of Ewa Gentry, 15 year old males and 18 to 24 year old females are the most vulnerable to poverty, with 23 males (17.3%) and 134 females (15.2%) in their respective age groups living below the poverty level.
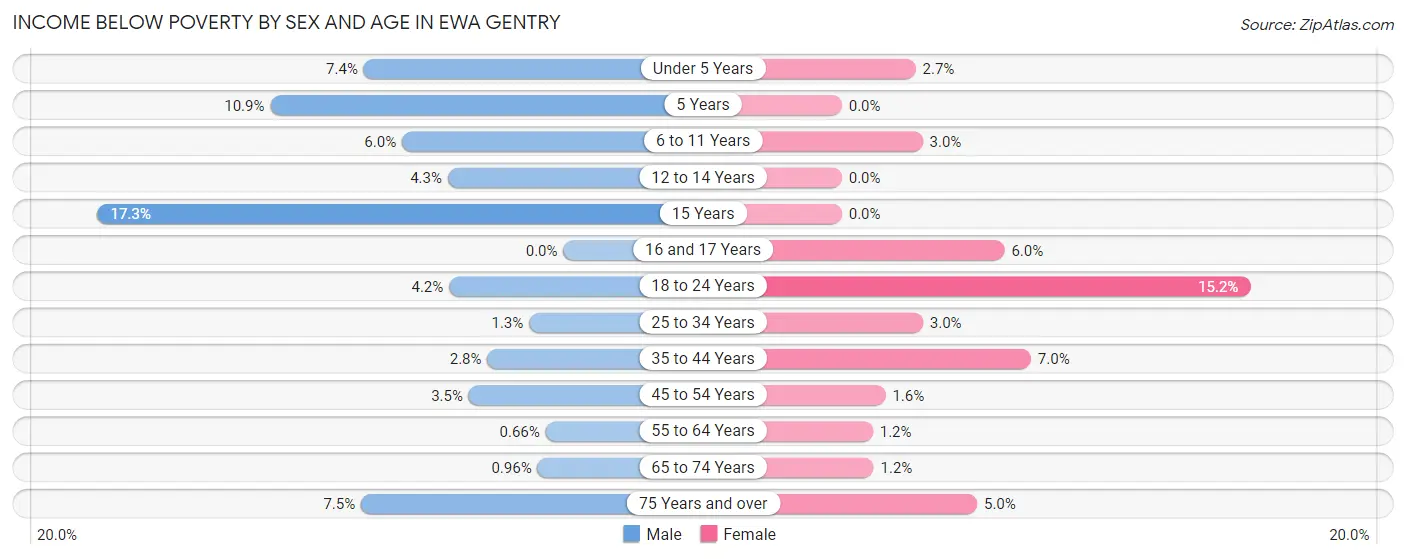
| Age Bracket | Male | Female |
| Under 5 Years | 81 (7.4%) | 28 (2.7%) |
| 5 Years | 26 (10.9%) | 0 (0.0%) |
| 6 to 11 Years | 72 (6.0%) | 34 (3.0%) |
| 12 to 14 Years | 24 (4.3%) | 0 (0.0%) |
| 15 Years | 23 (17.3%) | 0 (0.0%) |
| 16 and 17 Years | 0 (0.0%) | 25 (6.0%) |
| 18 to 24 Years | 38 (4.2%) | 134 (15.2%) |
| 25 to 34 Years | 28 (1.3%) | 77 (3.0%) |
| 35 to 44 Years | 67 (2.8%) | 153 (7.0%) |
| 45 to 54 Years | 57 (3.5%) | 29 (1.6%) |
| 55 to 64 Years | 10 (0.7%) | 15 (1.1%) |
| 65 to 74 Years | 9 (1.0%) | 9 (1.2%) |
| 75 Years and over | 22 (7.5%) | 28 (5.0%) |
| Total | 457 (3.4%) | 532 (4.0%) |
Income Above Poverty by Sex and Age in Ewa Gentry
According to the poverty statistics in Ewa Gentry, males aged 16 and 17 years and females aged 5 years are the age groups that are most secure financially, with 100.0% of males and 100.0% of females in these age groups living above the poverty line.
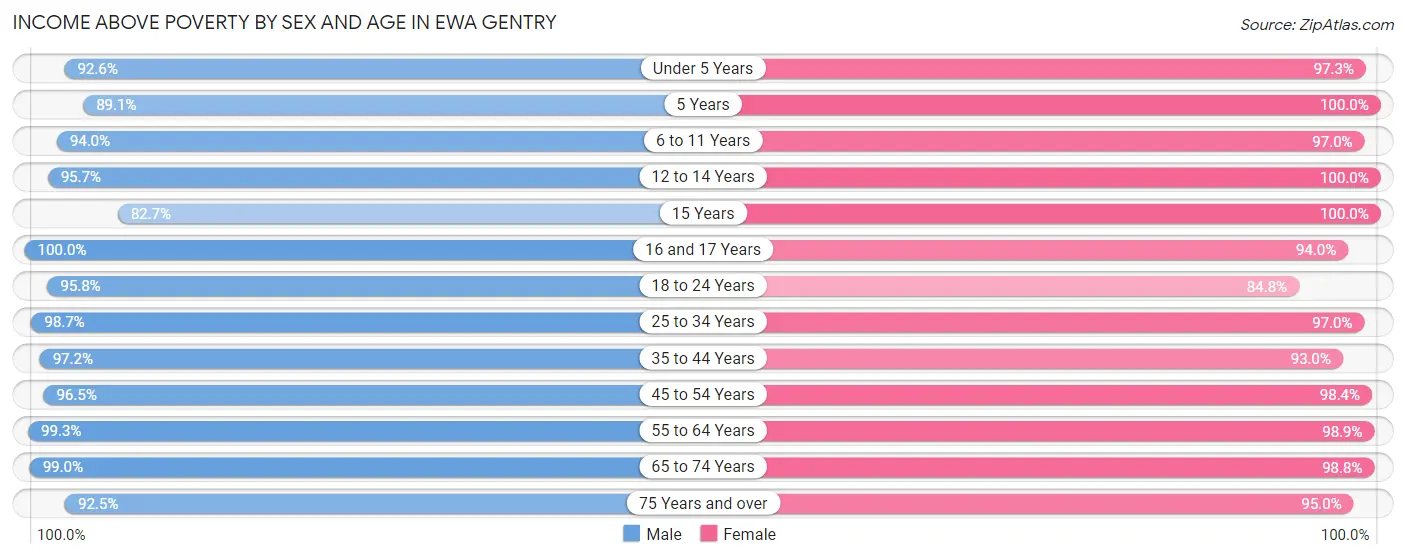
| Age Bracket | Male | Female |
| Under 5 Years | 1,012 (92.6%) | 994 (97.3%) |
| 5 Years | 213 (89.1%) | 110 (100.0%) |
| 6 to 11 Years | 1,130 (94.0%) | 1,100 (97.0%) |
| 12 to 14 Years | 535 (95.7%) | 545 (100.0%) |
| 15 Years | 110 (82.7%) | 143 (100.0%) |
| 16 and 17 Years | 333 (100.0%) | 389 (94.0%) |
| 18 to 24 Years | 859 (95.8%) | 750 (84.8%) |
| 25 to 34 Years | 2,173 (98.7%) | 2,478 (97.0%) |
| 35 to 44 Years | 2,311 (97.2%) | 2,026 (93.0%) |
| 45 to 54 Years | 1,567 (96.5%) | 1,756 (98.4%) |
| 55 to 64 Years | 1,496 (99.3%) | 1,295 (98.9%) |
| 65 to 74 Years | 932 (99.0%) | 756 (98.8%) |
| 75 Years and over | 271 (92.5%) | 530 (95.0%) |
| Total | 12,942 (96.6%) | 12,872 (96.0%) |
Income Below Poverty Among Married-Couple Families in Ewa Gentry
The poverty statistics for married-couple families in Ewa Gentry show that 1.6% or 70 of the total 4,465 families live below the poverty line. Families with 3 or 4 children have the highest poverty rate of 6.1%, comprising of 25 families. On the other hand, families with 5 or more children have the lowest poverty rate of 0.0%, which includes 0 families.
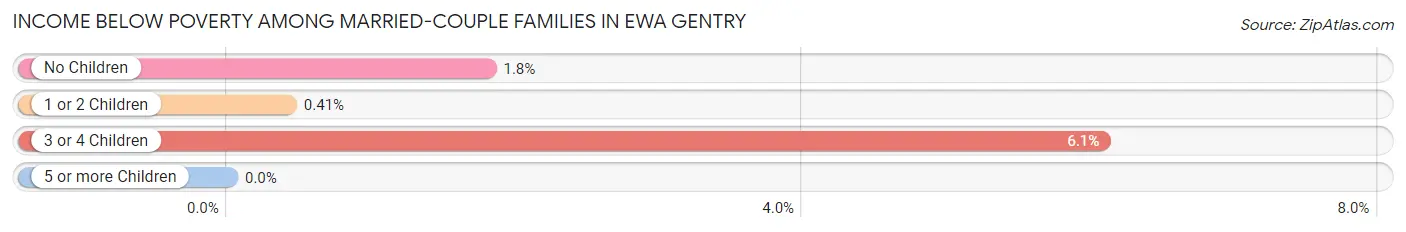
| Children | Above Poverty | Below Poverty |
| No Children | 2,013 (98.2%) | 37 (1.8%) |
| 1 or 2 Children | 1,927 (99.6%) | 8 (0.4%) |
| 3 or 4 Children | 386 (93.9%) | 25 (6.1%) |
| 5 or more Children | 69 (100.0%) | 0 (0.0%) |
| Total | 4,395 (98.4%) | 70 (1.6%) |
Income Below Poverty Among Single-Parent Households in Ewa Gentry
According to the poverty data in Ewa Gentry, 1.9% or 13 single-father households and 8.3% or 88 single-mother households are living below the poverty line. Among single-father households, those with 3 or 4 children have the highest poverty rate, with 3 households (6.0%) experiencing poverty. Likewise, among single-mother households, those with 3 or 4 children have the highest poverty rate, with 38 households (25.5%) falling below the poverty line.
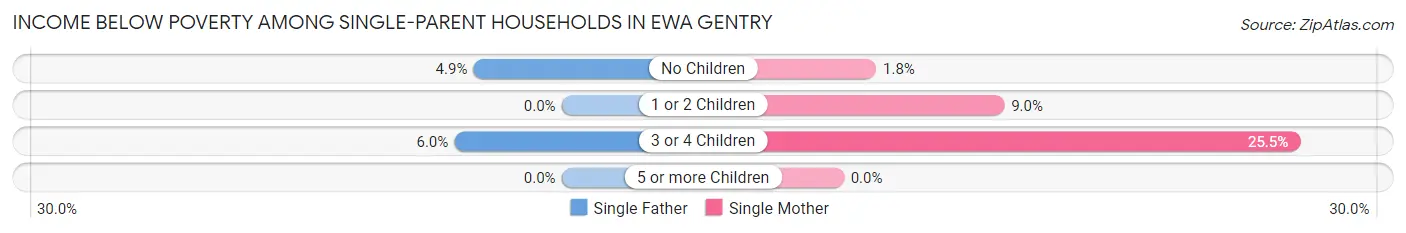
| Children | Single Father | Single Mother |
| No Children | 10 (4.9%) | 8 (1.8%) |
| 1 or 2 Children | 0 (0.0%) | 42 (9.0%) |
| 3 or 4 Children | 3 (6.0%) | 38 (25.5%) |
| 5 or more Children | 0 (0.0%) | 0 (0.0%) |
| Total | 13 (1.9%) | 88 (8.3%) |
Income Below Poverty Among Married-Couple vs Single-Parent Households in Ewa Gentry
The poverty data for Ewa Gentry shows that 70 of the married-couple family households (1.6%) and 101 of the single-parent households (5.7%) are living below the poverty level. Within the married-couple family households, those with 3 or 4 children have the highest poverty rate, with 25 households (6.1%) falling below the poverty line. Among the single-parent households, those with 3 or 4 children have the highest poverty rate, with 41 household (20.6%) living below poverty.
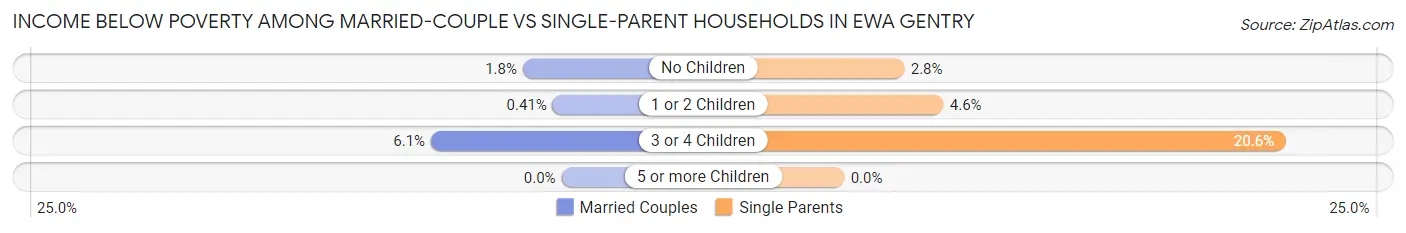
| Children | Married-Couple Families | Single-Parent Households |
| No Children | 37 (1.8%) | 18 (2.8%) |
| 1 or 2 Children | 8 (0.4%) | 42 (4.6%) |
| 3 or 4 Children | 25 (6.1%) | 41 (20.6%) |
| 5 or more Children | 0 (0.0%) | 0 (0.0%) |
| Total | 70 (1.6%) | 101 (5.7%) |
Race in Ewa Gentry
The most populous races in Ewa Gentry are Asian (12,953 | 47.6%), Two or more Races (8,213 | 30.2%), and Hispanic or Latino (4,082 | 15.0%).
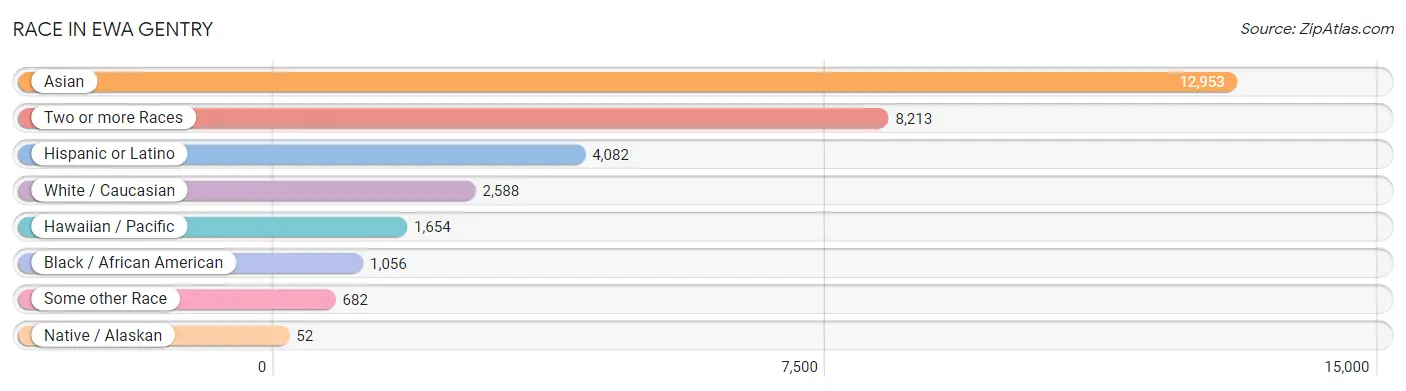
| Race | # Population | % Population |
| Asian | 12,953 | 47.6% |
| Black / African American | 1,056 | 3.9% |
| Hawaiian / Pacific | 1,654 | 6.1% |
| Hispanic or Latino | 4,082 | 15.0% |
| Native / Alaskan | 52 | 0.2% |
| White / Caucasian | 2,588 | 9.5% |
| Two or more Races | 8,213 | 30.2% |
| Some other Race | 682 | 2.5% |
| Total | 27,198 | 100.0% |
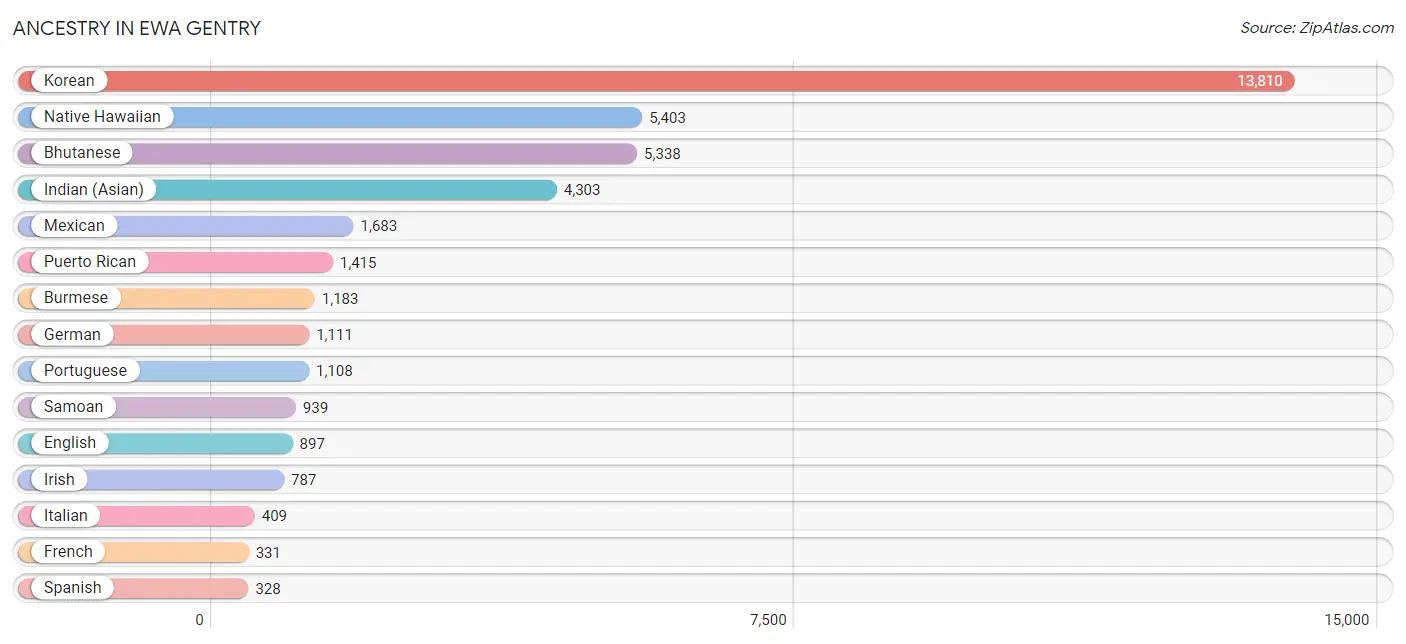
Ancestry in Ewa Gentry
The most populous ancestries reported in Ewa Gentry are Korean (13,810 | 50.8%), Native Hawaiian (5,403 | 19.9%), Bhutanese (5,338 | 19.6%), Indian (Asian) (4,303 | 15.8%), and Mexican (1,683 | 6.2%), together accounting for 112.3% of all Ewa Gentry residents.
| Ancestry | # Population | % Population |
| American | 268 | 1.0% |
| Arab | 30 | 0.1% |
| Bhutanese | 5,338 | 19.6% |
| Blackfeet | 139 | 0.5% |
| British | 75 | 0.3% |
| Burmese | 1,183 | 4.3% |
| Canadian | 13 | 0.1% |
| Central American | 148 | 0.5% |
| Central American Indian | 33 | 0.1% |
| Cherokee | 299 | 1.1% |
| Chinese | 168 | 0.6% |
| Chippewa | 83 | 0.3% |
| Colombian | 62 | 0.2% |
| Danish | 48 | 0.2% |
| Dominican | 11 | 0.0% |
| Dutch | 10 | 0.0% |
| Ecuadorian | 42 | 0.2% |
| Egyptian | 30 | 0.1% |
| English | 897 | 3.3% |
| Ethiopian | 15 | 0.1% |
| European | 56 | 0.2% |
| Fijian | 67 | 0.3% |
| French | 331 | 1.2% |
| French Canadian | 25 | 0.1% |
| German | 1,111 | 4.1% |
| Greek | 37 | 0.1% |
| Guamanian / Chamorro | 274 | 1.0% |
| Honduran | 113 | 0.4% |
| Hungarian | 16 | 0.1% |
| Indian (Asian) | 4,303 | 15.8% |
| Irish | 787 | 2.9% |
| Italian | 409 | 1.5% |
| Jamaican | 71 | 0.3% |
| Japanese | 125 | 0.5% |
| Korean | 13,810 | 50.8% |
| Lumbee | 19 | 0.1% |
| Malaysian | 79 | 0.3% |
| Marshallese | 35 | 0.1% |
| Mexican | 1,683 | 6.2% |
| Native Hawaiian | 5,403 | 19.9% |
| Northern European | 14 | 0.1% |
| Norwegian | 30 | 0.1% |
| Pakistani | 93 | 0.3% |
| Polish | 265 | 1.0% |
| Portuguese | 1,108 | 4.1% |
| Puerto Rican | 1,415 | 5.2% |
| Russian | 79 | 0.3% |
| Salvadoran | 35 | 0.1% |
| Samoan | 939 | 3.5% |
| Scotch-Irish | 101 | 0.4% |
| Scottish | 139 | 0.5% |
| Shoshone | 56 | 0.2% |
| Slavic | 12 | 0.0% |
| South American | 231 | 0.9% |
| Spaniard | 111 | 0.4% |
| Spanish | 328 | 1.2% |
| Sri Lankan | 312 | 1.1% |
| Subsaharan African | 15 | 0.1% |
| Swedish | 43 | 0.2% |
| Thai | 27 | 0.1% |
| Tongan | 15 | 0.1% |
| Ukrainian | 21 | 0.1% |
| Venezuelan | 127 | 0.5% |
| Welsh | 47 | 0.2% |
| West Indian | 7 | 0.0% | View All 65 Rows |
Immigrants in Ewa Gentry
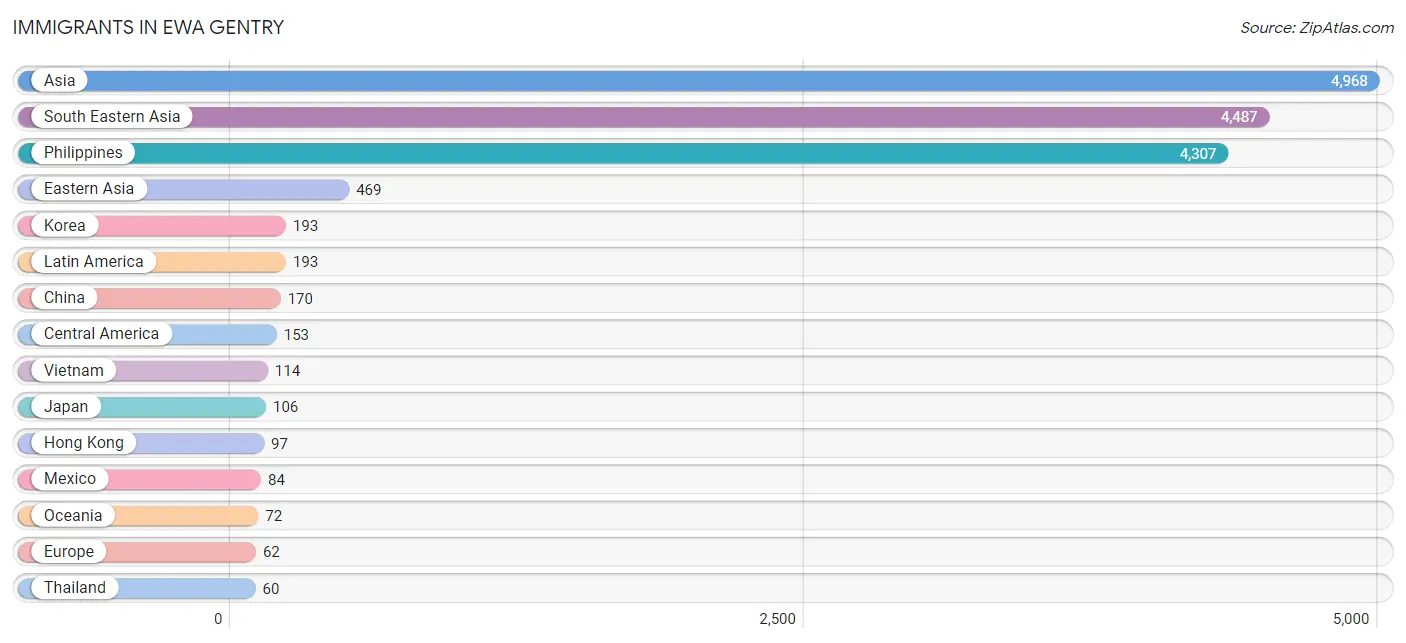
The most numerous immigrant groups reported in Ewa Gentry came from Asia (4,968 | 18.3%), South Eastern Asia (4,487 | 16.5%), Philippines (4,307 | 15.8%), Eastern Asia (469 | 1.7%), and Korea (193 | 0.7%), together accounting for 53.0% of all Ewa Gentry residents.
| Immigration Origin | # Population | % Population |
| Asia | 4,968 | 18.3% |
| Australia | 10 | 0.0% |
| Central America | 153 | 0.6% |
| China | 170 | 0.6% |
| Eastern Asia | 469 | 1.7% |
| Eastern Europe | 19 | 0.1% |
| Ecuador | 12 | 0.0% |
| El Salvador | 11 | 0.0% |
| Europe | 62 | 0.2% |
| Germany | 36 | 0.1% |
| Honduras | 58 | 0.2% |
| Hong Kong | 97 | 0.4% |
| Indonesia | 6 | 0.0% |
| Japan | 106 | 0.4% |
| Korea | 193 | 0.7% |
| Latin America | 193 | 0.7% |
| Mexico | 84 | 0.3% |
| Northern Europe | 7 | 0.0% |
| Oceania | 72 | 0.3% |
| Philippines | 4,307 | 15.8% |
| Poland | 19 | 0.1% |
| South America | 40 | 0.2% |
| South Central Asia | 12 | 0.0% |
| South Eastern Asia | 4,487 | 16.5% |
| Taiwan | 15 | 0.1% |
| Thailand | 60 | 0.2% |
| Venezuela | 28 | 0.1% |
| Vietnam | 114 | 0.4% |
| Western Europe | 36 | 0.1% | View All 29 Rows |
Sex and Age in Ewa Gentry
Sex and Age in Ewa Gentry
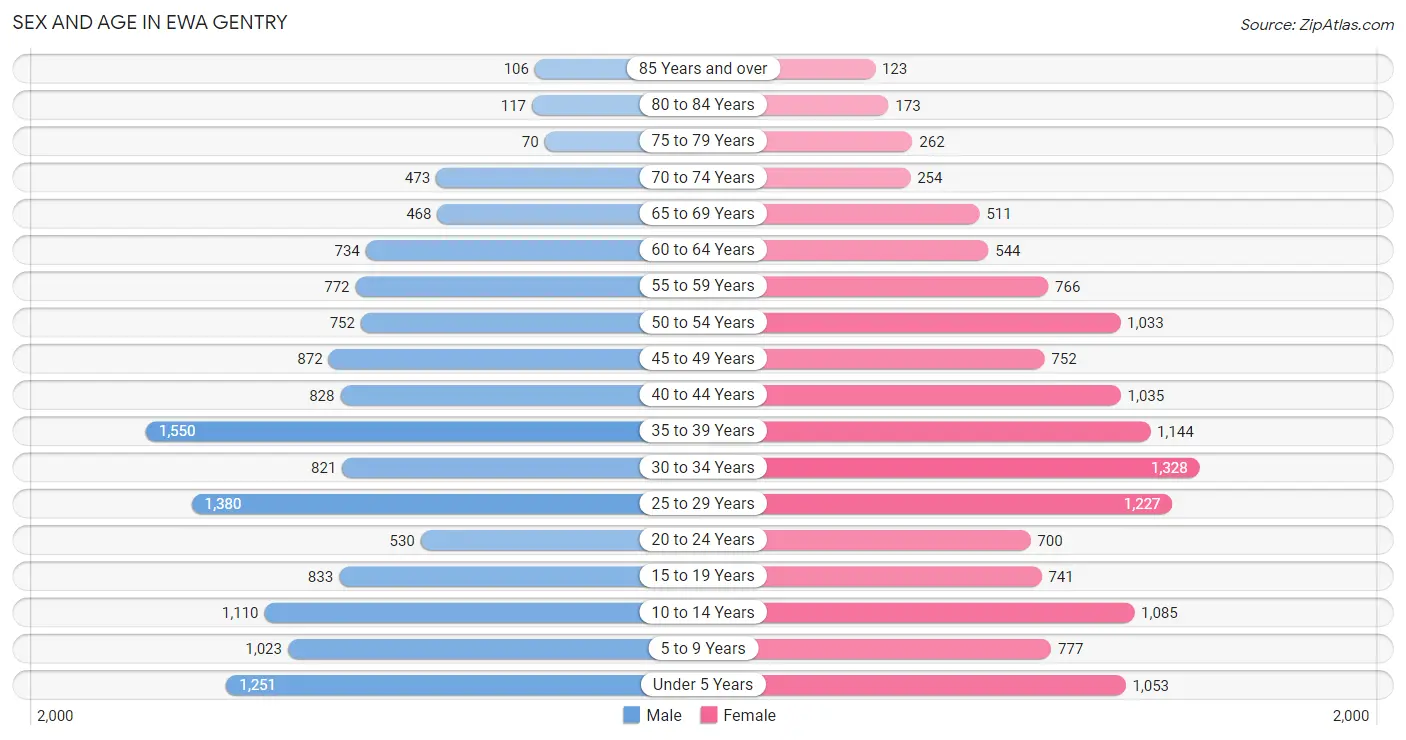
The most populous age groups in Ewa Gentry are 35 to 39 Years (1,550 | 11.3%) for men and 30 to 34 Years (1,328 | 9.8%) for women.
| Age Bracket | Male | Female |
| Under 5 Years | 1,251 (9.1%) | 1,053 (7.8%) |
| 5 to 9 Years | 1,023 (7.5%) | 777 (5.8%) |
| 10 to 14 Years | 1,110 (8.1%) | 1,085 (8.0%) |
| 15 to 19 Years | 833 (6.1%) | 741 (5.5%) |
| 20 to 24 Years | 530 (3.9%) | 700 (5.2%) |
| 25 to 29 Years | 1,380 (10.1%) | 1,227 (9.1%) |
| 30 to 34 Years | 821 (6.0%) | 1,328 (9.8%) |
| 35 to 39 Years | 1,550 (11.3%) | 1,144 (8.5%) |
| 40 to 44 Years | 828 (6.0%) | 1,035 (7.7%) |
| 45 to 49 Years | 872 (6.4%) | 752 (5.6%) |
| 50 to 54 Years | 752 (5.5%) | 1,033 (7.6%) |
| 55 to 59 Years | 772 (5.6%) | 766 (5.7%) |
| 60 to 64 Years | 734 (5.4%) | 544 (4.0%) |
| 65 to 69 Years | 468 (3.4%) | 511 (3.8%) |
| 70 to 74 Years | 473 (3.5%) | 254 (1.9%) |
| 75 to 79 Years | 70 (0.5%) | 262 (1.9%) |
| 80 to 84 Years | 117 (0.9%) | 173 (1.3%) |
| 85 Years and over | 106 (0.8%) | 123 (0.9%) |
| Total | 13,690 (100.0%) | 13,508 (100.0%) |
Families and Households in Ewa Gentry
Median Family Size in Ewa Gentry
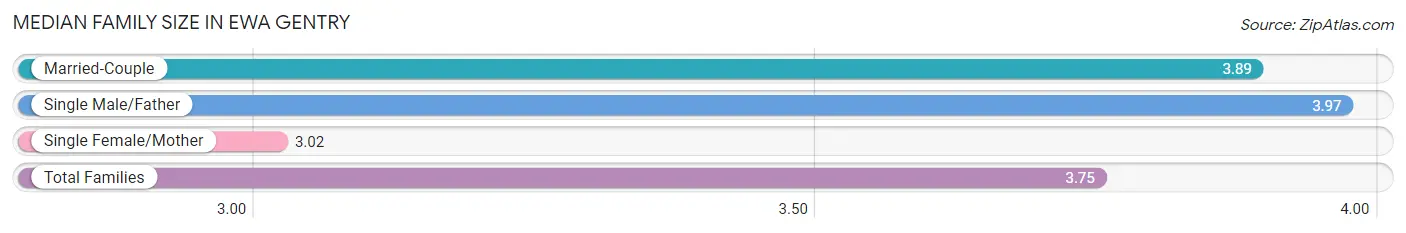
The median family size in Ewa Gentry is 3.75 persons per family, with single male/father families (695 | 11.2%) accounting for the largest median family size of 3.97 persons per family. On the other hand, single female/mother families (1,065 | 17.1%) represent the smallest median family size with 3.02 persons per family.
| Family Type | # Families | Family Size |
| Married-Couple | 4,465 (71.7%) | 3.89 |
| Single Male/Father | 695 (11.2%) | 3.97 |
| Single Female/Mother | 1,065 (17.1%) | 3.02 |
| Total Families | 6,225 (100.0%) | 3.75 |
Median Household Size in Ewa Gentry
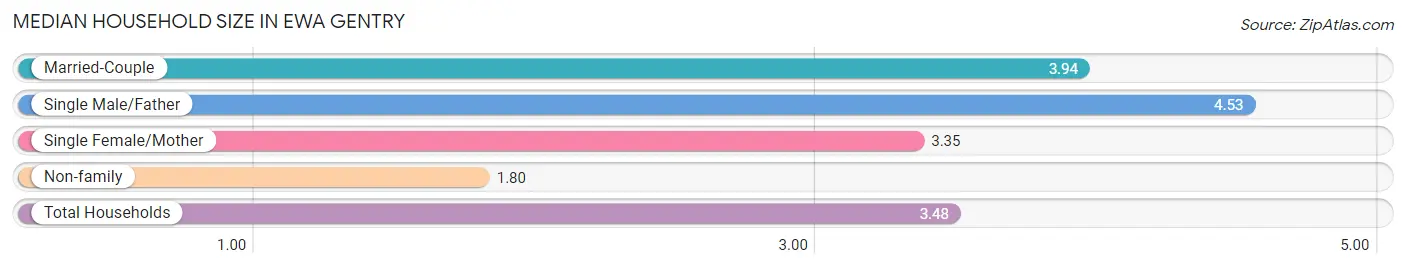
The median household size in Ewa Gentry is 3.48 persons per household, with single male/father households (695 | 8.9%) accounting for the largest median household size of 4.53 persons per household. non-family households (1,599 | 20.4%) represent the smallest median household size with 1.80 persons per household.
| Household Type | # Households | Household Size |
| Married-Couple | 4,465 (57.1%) | 3.94 |
| Single Male/Father | 695 (8.9%) | 4.53 |
| Single Female/Mother | 1,065 (13.6%) | 3.35 |
| Non-family | 1,599 (20.4%) | 1.80 |
| Total Households | 7,824 (100.0%) | 3.48 |
Household Size by Marriage Status in Ewa Gentry
Out of a total of 7,824 households in Ewa Gentry, 6,225 (79.6%) are family households, while 1,599 (20.4%) are nonfamily households. The most numerous type of family households are 2-person households, comprising 1,711, and the most common type of nonfamily households are 1-person households, comprising 978.
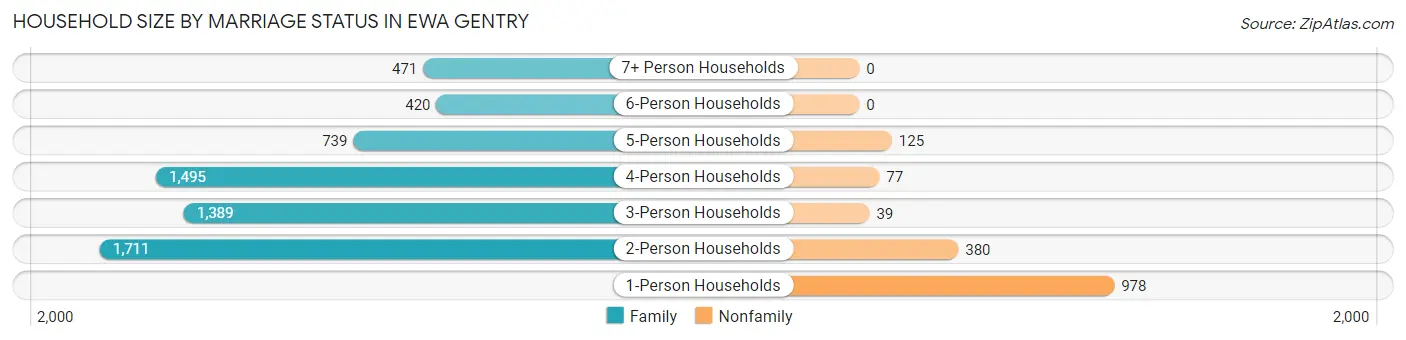
| Household Size | Family Households | Nonfamily Households |
| 1-Person Households | - | 978 (12.5%) |
| 2-Person Households | 1,711 (21.9%) | 380 (4.9%) |
| 3-Person Households | 1,389 (17.7%) | 39 (0.5%) |
| 4-Person Households | 1,495 (19.1%) | 77 (1.0%) |
| 5-Person Households | 739 (9.5%) | 125 (1.6%) |
| 6-Person Households | 420 (5.4%) | 0 (0.0%) |
| 7+ Person Households | 471 (6.0%) | 0 (0.0%) |
| Total | 6,225 (79.6%) | 1,599 (20.4%) |
Female Fertility in Ewa Gentry
Fertility by Age in Ewa Gentry
Average fertility rate in Ewa Gentry is 60.0 births per 1,000 women. Women in the age bracket of 20 to 34 years have the highest fertility rate with 97.0 births per 1,000 women. Women in the age bracket of 20 to 34 years acount for 73.3% of all women with births.
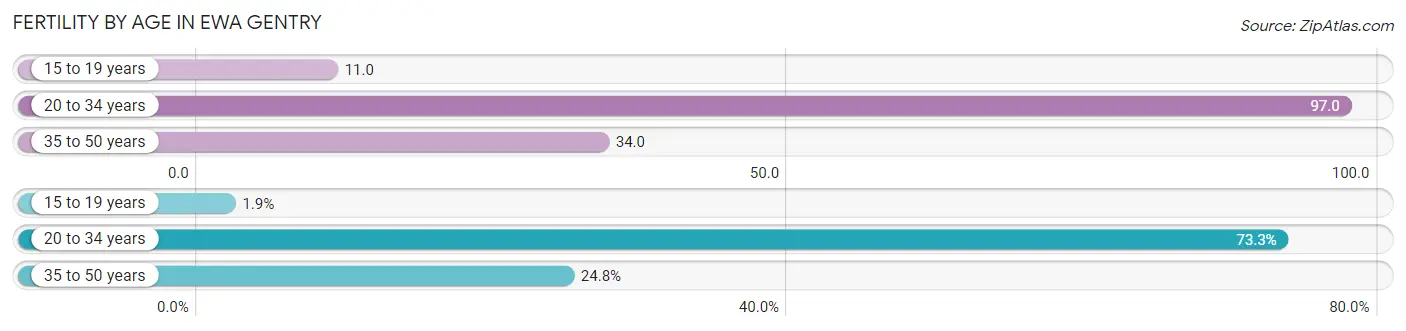
| Age Bracket | Women with Births | Births / 1,000 Women |
| 15 to 19 years | 8 (1.9%) | 11.0 |
| 20 to 34 years | 316 (73.3%) | 97.0 |
| 35 to 50 years | 107 (24.8%) | 34.0 |
| Total | 431 (100.0%) | 60.0 |
Fertility by Age by Marriage Status in Ewa Gentry
71.9% of women with births (431) in Ewa Gentry are married. The highest percentage of unmarried women with births falls into 15 to 19 years age bracket with 100.0% of them unmarried at the time of birth, while the lowest percentage of unmarried women with births belong to 35 to 50 years age bracket with 21.5% of them unmarried.
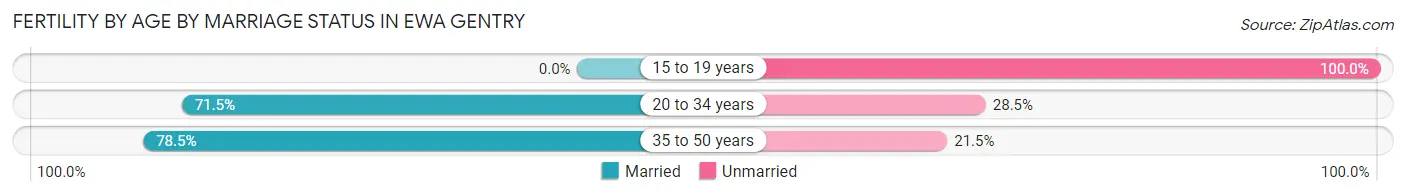
| Age Bracket | Married | Unmarried |
| 15 to 19 years | 0 (0.0%) | 8 (100.0%) |
| 20 to 34 years | 226 (71.5%) | 90 (28.5%) |
| 35 to 50 years | 84 (78.5%) | 23 (21.5%) |
| Total | 310 (71.9%) | 121 (28.1%) |
Fertility by Education in Ewa Gentry
Average fertility rate in Ewa Gentry is 60.0 births per 1,000 women. Women with the education attainment of high school diploma have the highest fertility rate of 92.0 births per 1,000 women, while women with the education attainment of less than high school have the lowest fertility at 28.0 births per 1,000 women. Women with the education attainment of high school diploma represent 36.9% of all women with births.
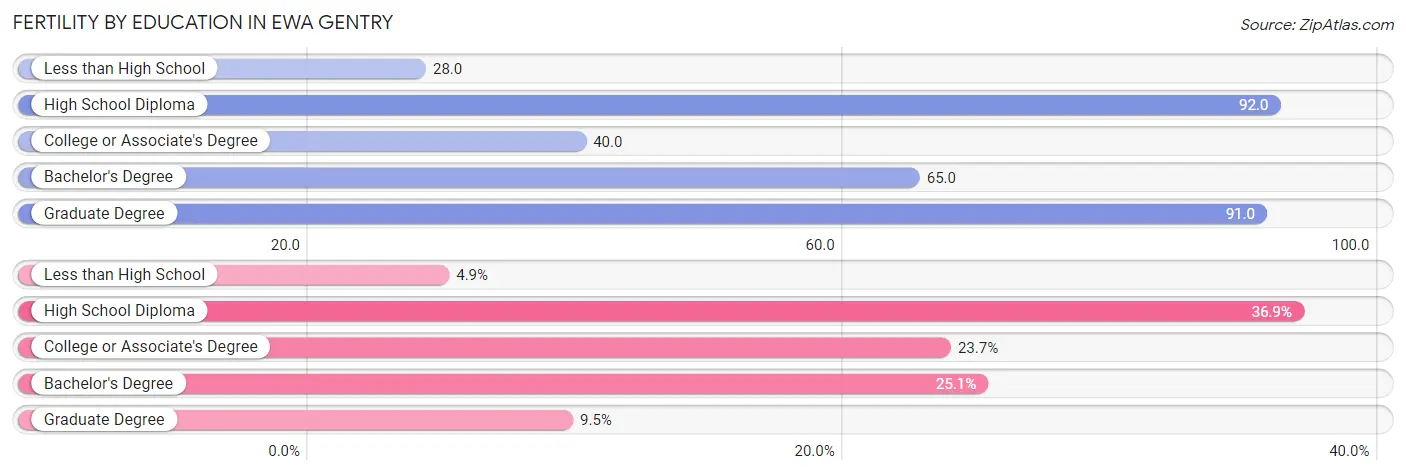
| Educational Attainment | Women with Births | Births / 1,000 Women |
| Less than High School | 21 (4.9%) | 28.0 |
| High School Diploma | 159 (36.9%) | 92.0 |
| College or Associate's Degree | 102 (23.7%) | 40.0 |
| Bachelor's Degree | 108 (25.1%) | 65.0 |
| Graduate Degree | 41 (9.5%) | 91.0 |
| Total | 431 (100.0%) | 60.0 |
Fertility by Education by Marriage Status in Ewa Gentry
28.1% of women with births in Ewa Gentry are unmarried. Women with the educational attainment of graduate degree are most likely to be married with 100.0% of them married at childbirth, while women with the educational attainment of bachelor's degree are least likely to be married with 45.4% of them unmarried at childbirth.
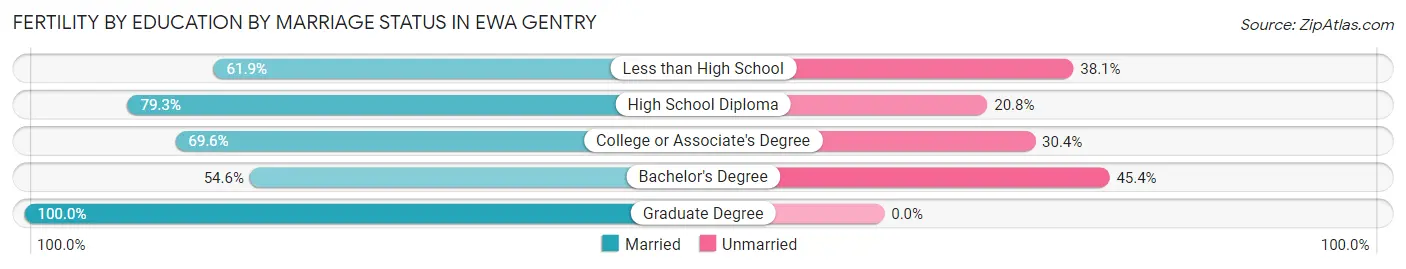
| Educational Attainment | Married | Unmarried |
| Less than High School | 13 (61.9%) | 8 (38.1%) |
| High School Diploma | 126 (79.2%) | 33 (20.7%) |
| College or Associate's Degree | 71 (69.6%) | 31 (30.4%) |
| Bachelor's Degree | 59 (54.6%) | 49 (45.4%) |
| Graduate Degree | 41 (100.0%) | 0 (0.0%) |
| Total | 310 (71.9%) | 121 (28.1%) |
Employment Characteristics in Ewa Gentry
Employment by Class of Employer in Ewa Gentry
Among the 14,390 employed individuals in Ewa Gentry, private company employees (8,444 | 58.7%), federal government employees (2,308 | 16.0%), and not-for-profit organizations (1,406 | 9.8%) make up the most common classes of employment.
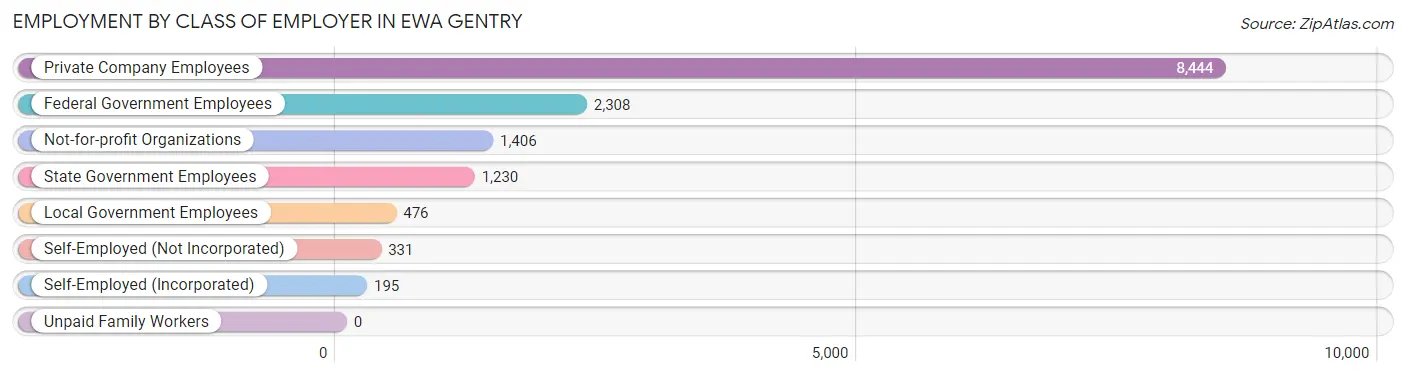
| Employer Class | # Employees | % Employees |
| Private Company Employees | 8,444 | 58.7% |
| Self-Employed (Incorporated) | 195 | 1.4% |
| Self-Employed (Not Incorporated) | 331 | 2.3% |
| Not-for-profit Organizations | 1,406 | 9.8% |
| Local Government Employees | 476 | 3.3% |
| State Government Employees | 1,230 | 8.6% |
| Federal Government Employees | 2,308 | 16.0% |
| Unpaid Family Workers | 0 | 0.0% |
| Total | 14,390 | 100.0% |
Employment Status by Age in Ewa Gentry
According to the labor force statistics for Ewa Gentry, out of the total population over 16 years of age (20,623), 72.9% or 15,034 individuals are in the labor force, with 3.5% or 526 of them unemployed. The age group with the highest labor force participation rate is 35 to 44 years, with 88.2% or 4,019 individuals in the labor force. Within the labor force, the 16 to 19 years age range has the highest percentage of unemployed individuals, with 8.7% or 41 of them being unemployed.
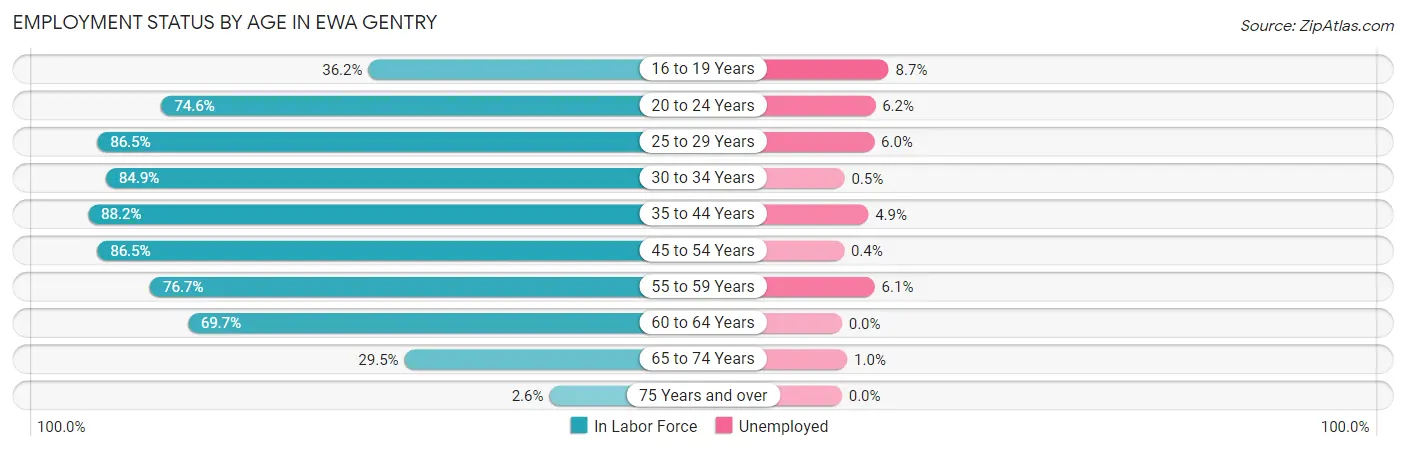
| Age Bracket | In Labor Force | Unemployed |
| 16 to 19 Years | 470 (36.2%) | 41 (8.7%) |
| 20 to 24 Years | 918 (74.6%) | 57 (6.2%) |
| 25 to 29 Years | 2,255 (86.5%) | 135 (6.0%) |
| 30 to 34 Years | 1,825 (84.9%) | 9 (0.5%) |
| 35 to 44 Years | 4,019 (88.2%) | 197 (4.9%) |
| 45 to 54 Years | 2,949 (86.5%) | 12 (0.4%) |
| 55 to 59 Years | 1,180 (76.7%) | 72 (6.1%) |
| 60 to 64 Years | 891 (69.7%) | 0 (0.0%) |
| 65 to 74 Years | 503 (29.5%) | 5 (1.0%) |
| 75 Years and over | 22 (2.6%) | 0 (0.0%) |
| Total | 15,034 (72.9%) | 526 (3.5%) |
Employment Status by Educational Attainment in Ewa Gentry
According to labor force statistics for Ewa Gentry, 84.4% of individuals (13,114) out of the total population between 25 and 64 years of age (15,538) are in the labor force, with 3.2% or 420 of them being unemployed. The group with the highest labor force participation rate are those with the educational attainment of bachelor's degree or higher, with 88.7% or 3,994 individuals in the labor force. Within the labor force, individuals with bachelor's degree or higher education have the highest percentage of unemployment, with 4.2% or 168 of them being unemployed.
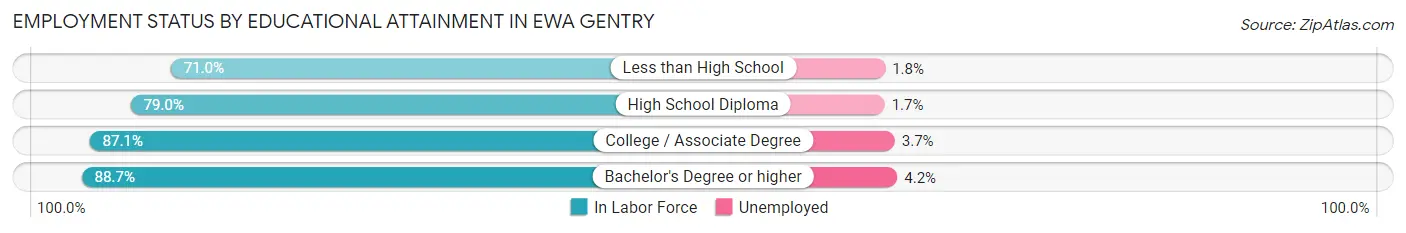
| Educational Attainment | In Labor Force | Unemployed |
| Less than High School | 523 (71.0%) | 13 (1.8%) |
| High School Diploma | 3,615 (79.0%) | 78 (1.7%) |
| College / Associate Degree | 4,984 (87.1%) | 212 (3.7%) |
| Bachelor's Degree or higher | 3,994 (88.7%) | 189 (4.2%) |
| Total | 13,114 (84.4%) | 497 (3.2%) |
Employment Occupations by Sex in Ewa Gentry
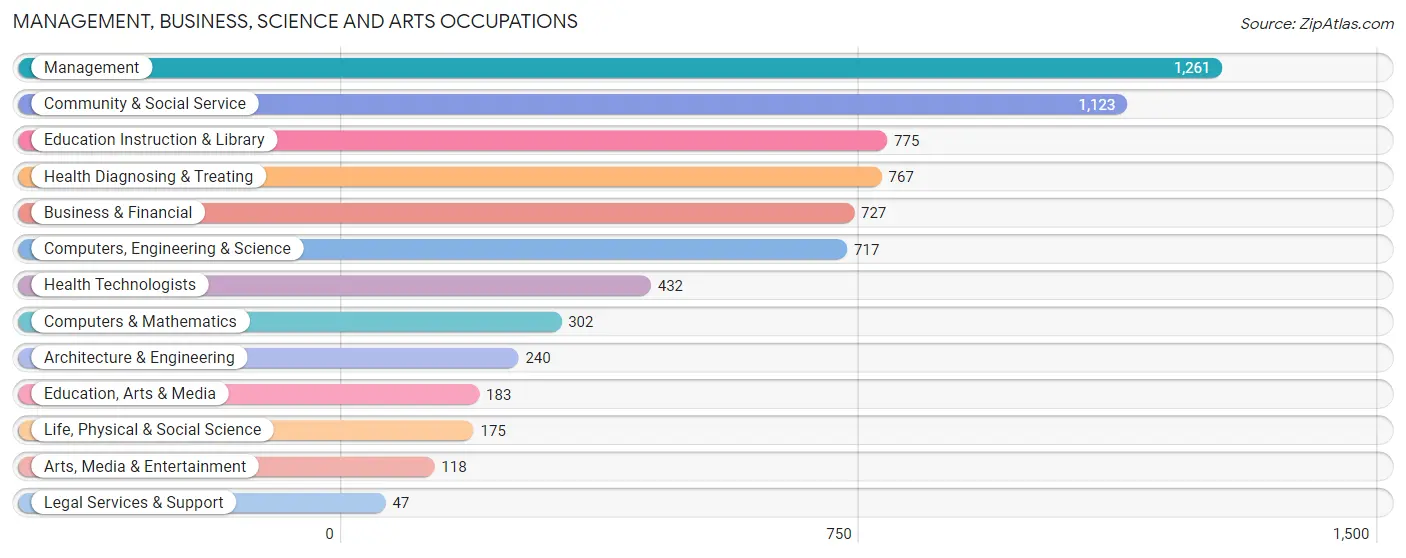
Management, Business, Science and Arts Occupations
The most common Management, Business, Science and Arts occupations in Ewa Gentry are Management (1,261 | 9.2%), Community & Social Service (1,123 | 8.2%), Education Instruction & Library (775 | 5.7%), Health Diagnosing & Treating (767 | 5.6%), and Business & Financial (727 | 5.3%).
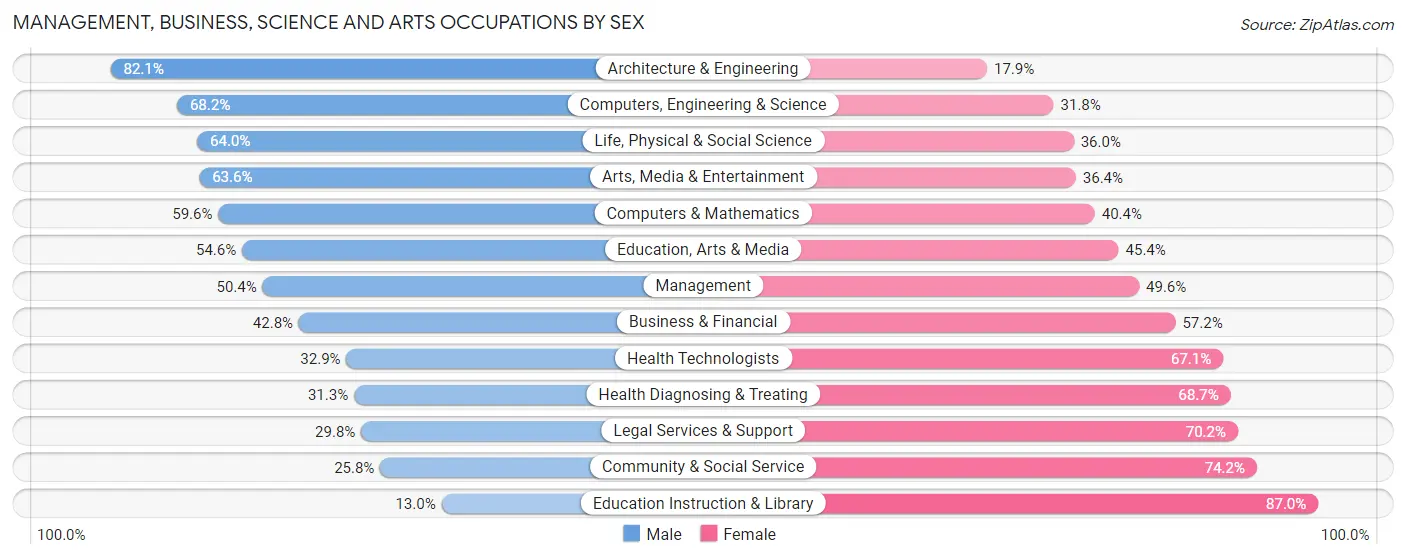
Management, Business, Science and Arts Occupations by Sex
Within the Management, Business, Science and Arts occupations in Ewa Gentry, the most male-oriented occupations are Architecture & Engineering (82.1%), Computers, Engineering & Science (68.2%), and Life, Physical & Social Science (64.0%), while the most female-oriented occupations are Education Instruction & Library (87.0%), Community & Social Service (74.2%), and Legal Services & Support (70.2%).
| Occupation | Male | Female |
| Management | 635 (50.4%) | 626 (49.6%) |
| Business & Financial | 311 (42.8%) | 416 (57.2%) |
| Computers, Engineering & Science | 489 (68.2%) | 228 (31.8%) |
| Computers & Mathematics | 180 (59.6%) | 122 (40.4%) |
| Architecture & Engineering | 197 (82.1%) | 43 (17.9%) |
| Life, Physical & Social Science | 112 (64.0%) | 63 (36.0%) |
| Community & Social Service | 290 (25.8%) | 833 (74.2%) |
| Education, Arts & Media | 100 (54.6%) | 83 (45.4%) |
| Legal Services & Support | 14 (29.8%) | 33 (70.2%) |
| Education Instruction & Library | 101 (13.0%) | 674 (87.0%) |
| Arts, Media & Entertainment | 75 (63.6%) | 43 (36.4%) |
| Health Diagnosing & Treating | 240 (31.3%) | 527 (68.7%) |
| Health Technologists | 142 (32.9%) | 290 (67.1%) |
| Total (Category) | 1,965 (42.8%) | 2,630 (57.2%) |
| Total (Overall) | 6,660 (48.5%) | 7,061 (51.5%) |
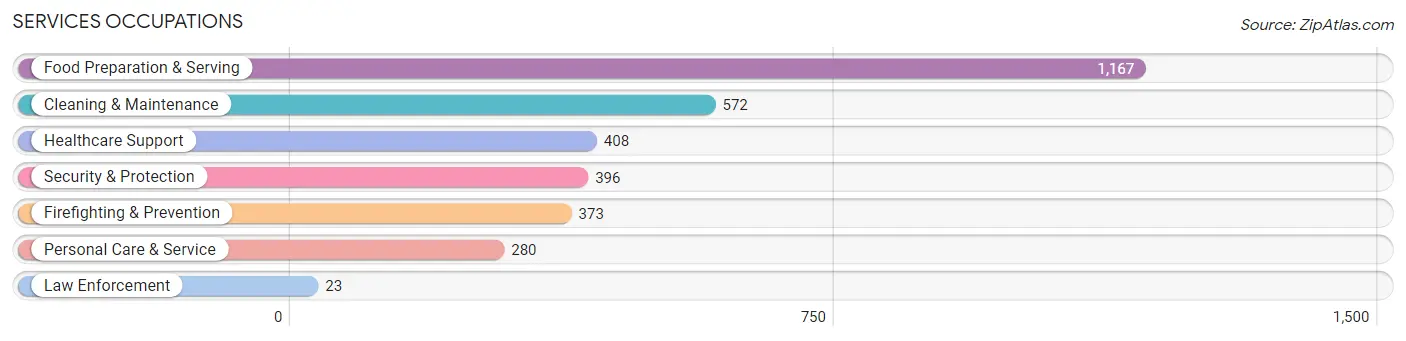
Services Occupations
The most common Services occupations in Ewa Gentry are Food Preparation & Serving (1,167 | 8.5%), Cleaning & Maintenance (572 | 4.2%), Healthcare Support (408 | 3.0%), Security & Protection (396 | 2.9%), and Firefighting & Prevention (373 | 2.7%).
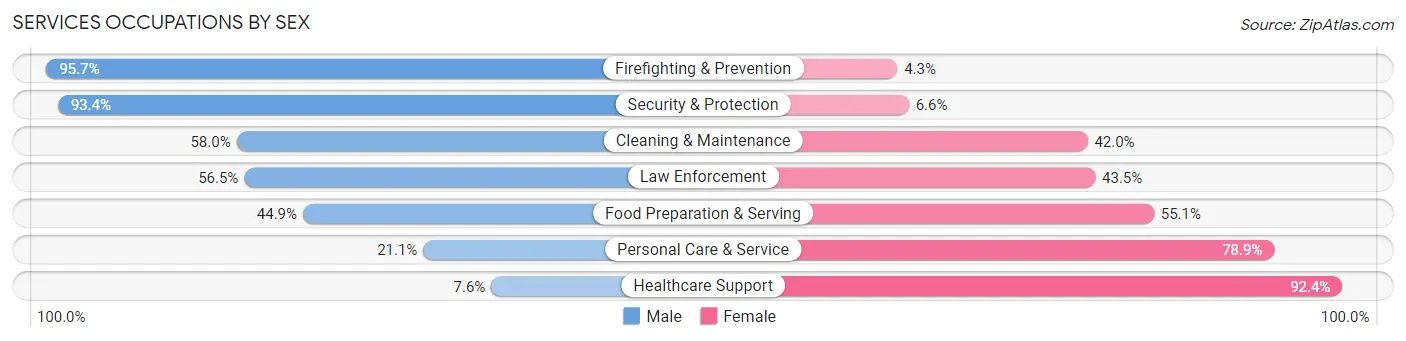
Services Occupations by Sex
Within the Services occupations in Ewa Gentry, the most male-oriented occupations are Firefighting & Prevention (95.7%), Security & Protection (93.4%), and Cleaning & Maintenance (58.0%), while the most female-oriented occupations are Healthcare Support (92.4%), Personal Care & Service (78.9%), and Food Preparation & Serving (55.1%).
| Occupation | Male | Female |
| Healthcare Support | 31 (7.6%) | 377 (92.4%) |
| Security & Protection | 370 (93.4%) | 26 (6.6%) |
| Firefighting & Prevention | 357 (95.7%) | 16 (4.3%) |
| Law Enforcement | 13 (56.5%) | 10 (43.5%) |
| Food Preparation & Serving | 524 (44.9%) | 643 (55.1%) |
| Cleaning & Maintenance | 332 (58.0%) | 240 (42.0%) |
| Personal Care & Service | 59 (21.1%) | 221 (78.9%) |
| Total (Category) | 1,316 (46.6%) | 1,507 (53.4%) |
| Total (Overall) | 6,660 (48.5%) | 7,061 (51.5%) |
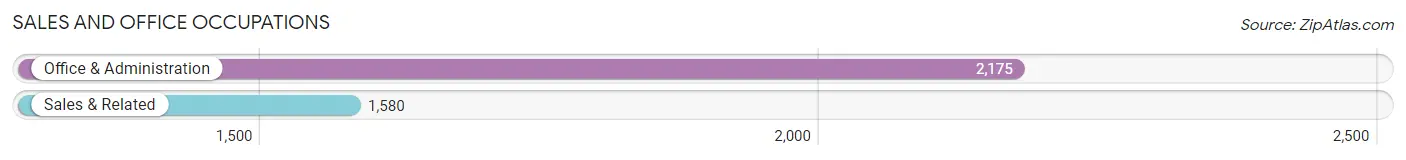
Sales and Office Occupations
The most common Sales and Office occupations in Ewa Gentry are Office & Administration (2,175 | 15.9%), and Sales & Related (1,580 | 11.5%).
Sales and Office Occupations by Sex
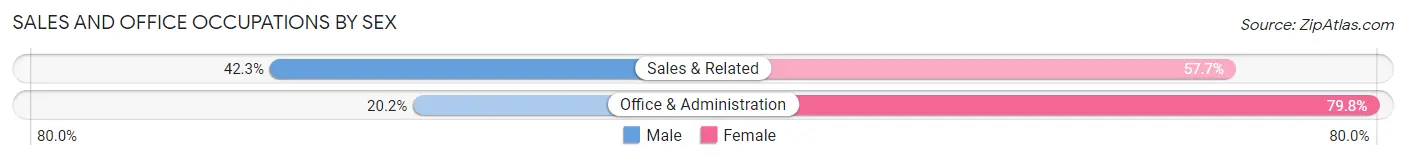
| Occupation | Male | Female |
| Sales & Related | 668 (42.3%) | 912 (57.7%) |
| Office & Administration | 440 (20.2%) | 1,735 (79.8%) |
| Total (Category) | 1,108 (29.5%) | 2,647 (70.5%) |
| Total (Overall) | 6,660 (48.5%) | 7,061 (51.5%) |
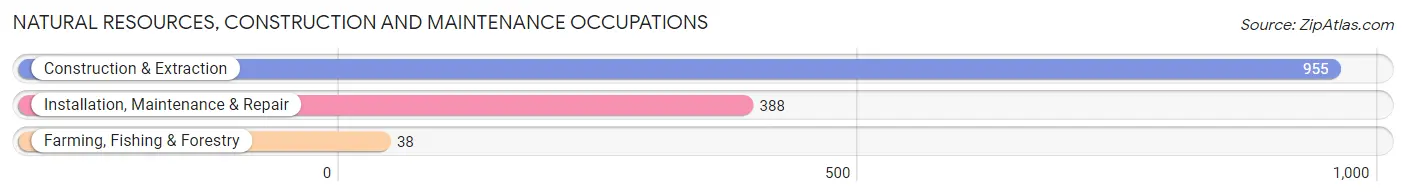
Natural Resources, Construction and Maintenance Occupations
The most common Natural Resources, Construction and Maintenance occupations in Ewa Gentry are Construction & Extraction (955 | 7.0%), Installation, Maintenance & Repair (388 | 2.8%), and Farming, Fishing & Forestry (38 | 0.3%).
Natural Resources, Construction and Maintenance Occupations by Sex
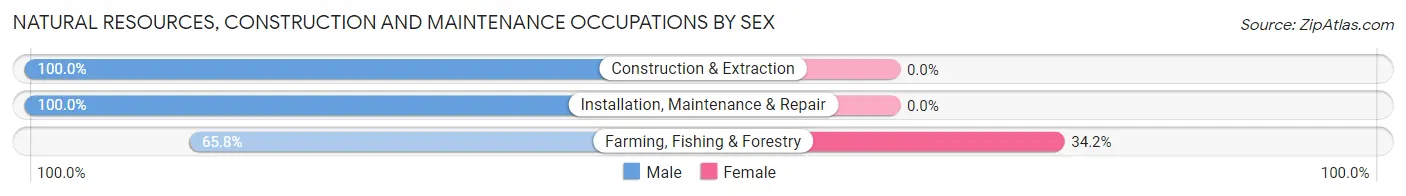
| Occupation | Male | Female |
| Farming, Fishing & Forestry | 25 (65.8%) | 13 (34.2%) |
| Construction & Extraction | 955 (100.0%) | 0 (0.0%) |
| Installation, Maintenance & Repair | 388 (100.0%) | 0 (0.0%) |
| Total (Category) | 1,368 (99.1%) | 13 (0.9%) |
| Total (Overall) | 6,660 (48.5%) | 7,061 (51.5%) |
Production, Transportation and Moving Occupations
The most common Production, Transportation and Moving occupations in Ewa Gentry are Transportation (519 | 3.8%), Production (380 | 2.8%), and Material Moving (268 | 1.9%).
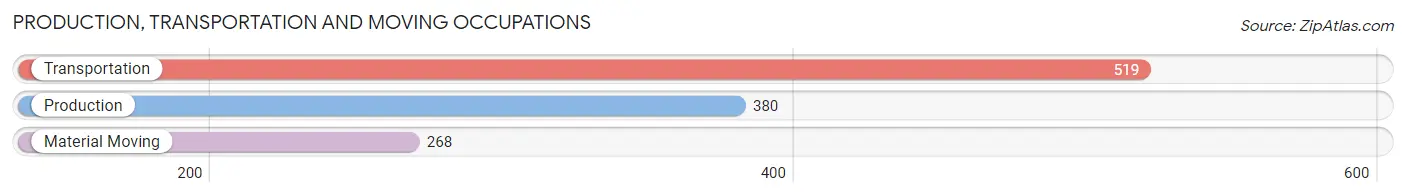
Production, Transportation and Moving Occupations by Sex
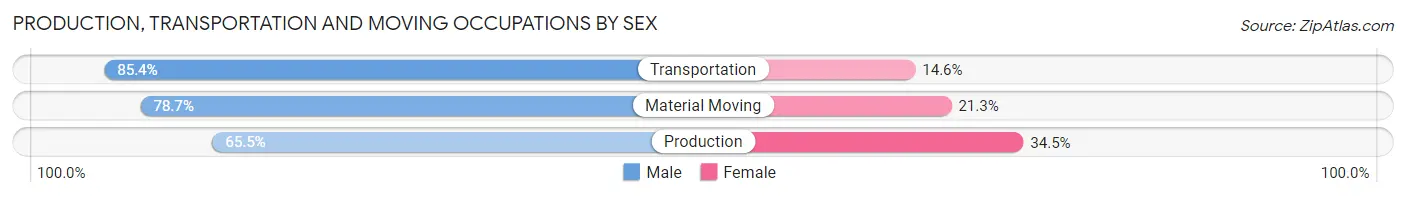
| Occupation | Male | Female |
| Production | 249 (65.5%) | 131 (34.5%) |
| Transportation | 443 (85.4%) | 76 (14.6%) |
| Material Moving | 211 (78.7%) | 57 (21.3%) |
| Total (Category) | 903 (77.4%) | 264 (22.6%) |
| Total (Overall) | 6,660 (48.5%) | 7,061 (51.5%) |
Employment Industries by Sex in Ewa Gentry
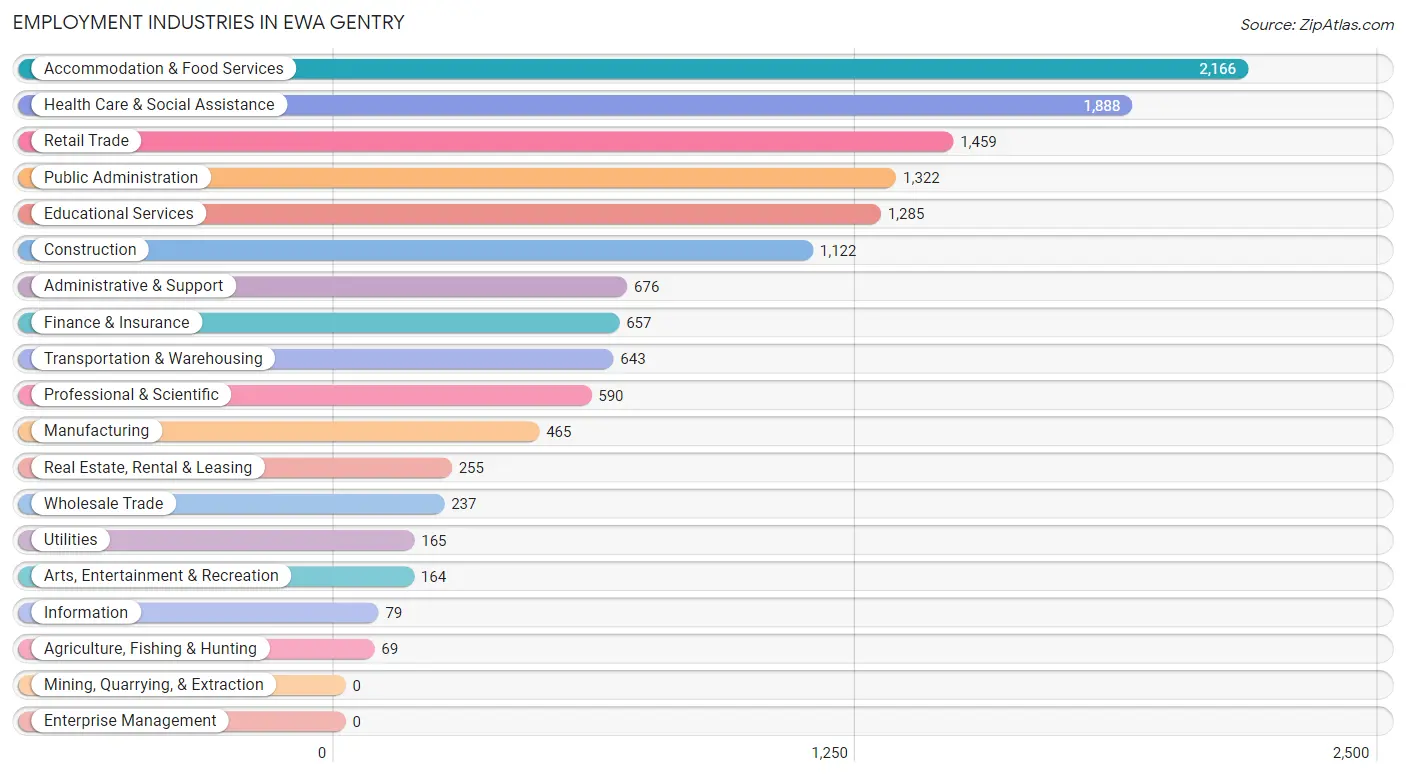
Employment Industries in Ewa Gentry
The major employment industries in Ewa Gentry include Accommodation & Food Services (2,166 | 15.8%), Health Care & Social Assistance (1,888 | 13.8%), Retail Trade (1,459 | 10.6%), Public Administration (1,322 | 9.6%), and Educational Services (1,285 | 9.4%).
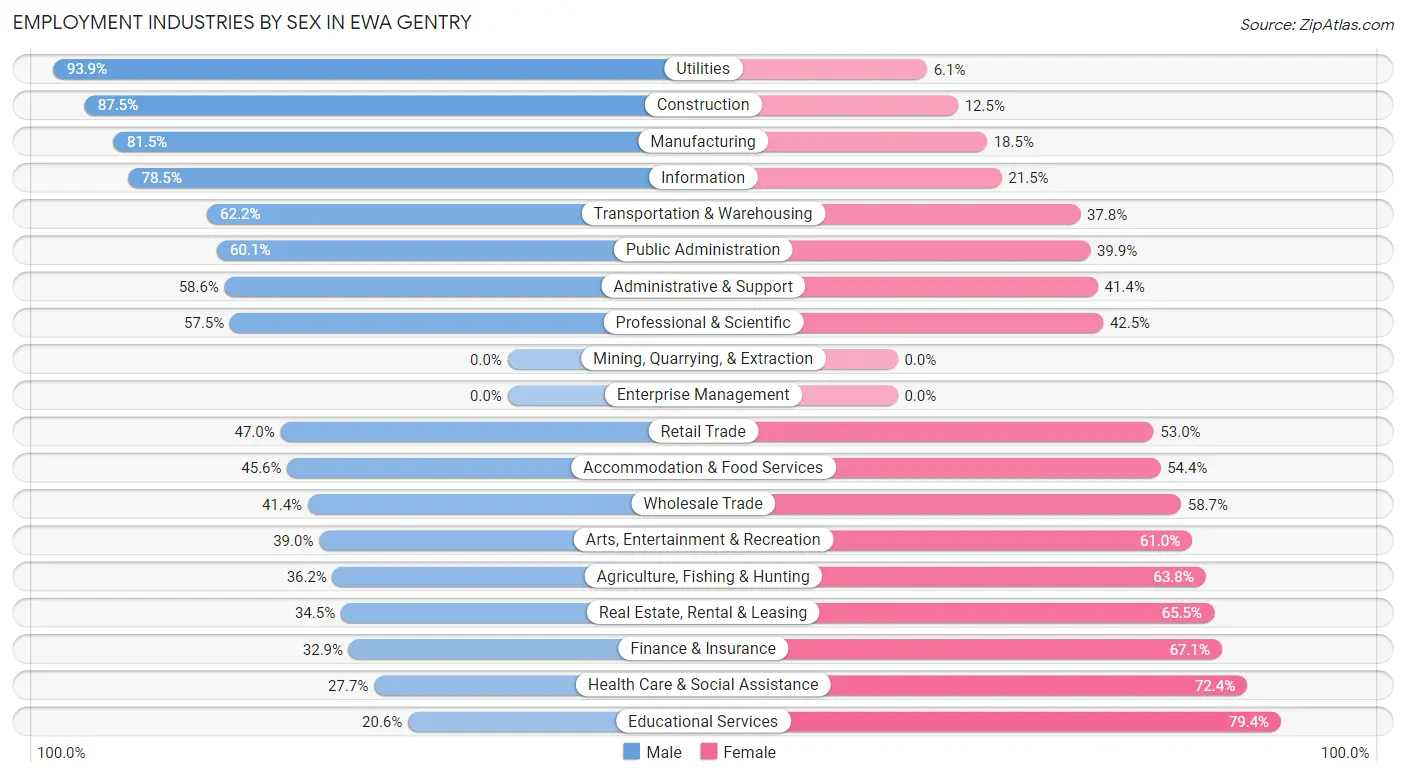
Employment Industries by Sex in Ewa Gentry
The Ewa Gentry industries that see more men than women are Utilities (93.9%), Construction (87.5%), and Manufacturing (81.5%), whereas the industries that tend to have a higher number of women are Educational Services (79.4%), Health Care & Social Assistance (72.4%), and Finance & Insurance (67.1%).
| Industry | Male | Female |
| Agriculture, Fishing & Hunting | 25 (36.2%) | 44 (63.8%) |
| Mining, Quarrying, & Extraction | 0 (0.0%) | 0 (0.0%) |
| Construction | 982 (87.5%) | 140 (12.5%) |
| Manufacturing | 379 (81.5%) | 86 (18.5%) |
| Wholesale Trade | 98 (41.3%) | 139 (58.7%) |
| Retail Trade | 686 (47.0%) | 773 (53.0%) |
| Transportation & Warehousing | 400 (62.2%) | 243 (37.8%) |
| Utilities | 155 (93.9%) | 10 (6.1%) |
| Information | 62 (78.5%) | 17 (21.5%) |
| Finance & Insurance | 216 (32.9%) | 441 (67.1%) |
| Real Estate, Rental & Leasing | 88 (34.5%) | 167 (65.5%) |
| Professional & Scientific | 339 (57.5%) | 251 (42.5%) |
| Enterprise Management | 0 (0.0%) | 0 (0.0%) |
| Administrative & Support | 396 (58.6%) | 280 (41.4%) |
| Educational Services | 265 (20.6%) | 1,020 (79.4%) |
| Health Care & Social Assistance | 522 (27.7%) | 1,366 (72.4%) |
| Arts, Entertainment & Recreation | 64 (39.0%) | 100 (61.0%) |
| Accommodation & Food Services | 988 (45.6%) | 1,178 (54.4%) |
| Public Administration | 795 (60.1%) | 527 (39.9%) |
| Total | 6,660 (48.5%) | 7,061 (51.5%) |
Education in Ewa Gentry
School Enrollment in Ewa Gentry
The most common levels of schooling among the 7,066 students in Ewa Gentry are high school (1,626 | 23.0%), middle school (1,592 | 22.5%), and elementary school (1,274 | 18.0%).
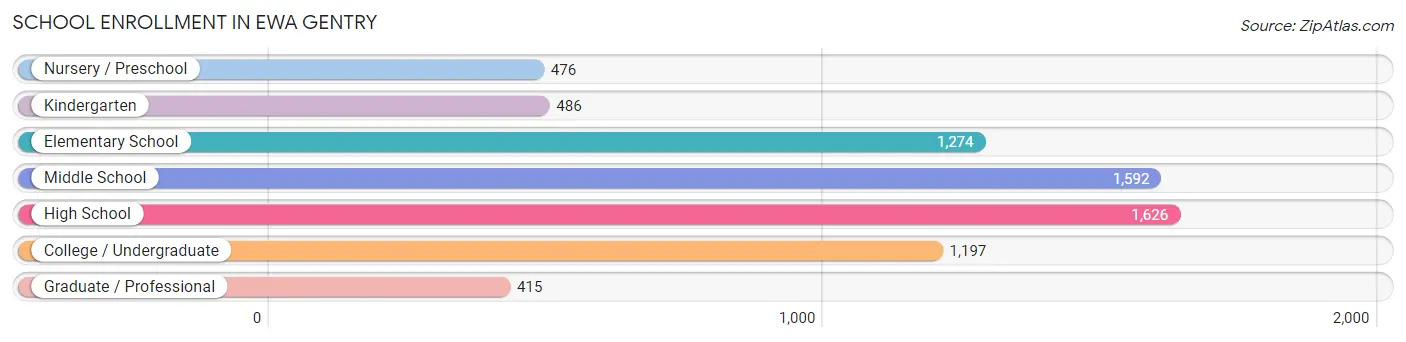
| School Level | # Students | % Students |
| Nursery / Preschool | 476 | 6.7% |
| Kindergarten | 486 | 6.9% |
| Elementary School | 1,274 | 18.0% |
| Middle School | 1,592 | 22.5% |
| High School | 1,626 | 23.0% |
| College / Undergraduate | 1,197 | 16.9% |
| Graduate / Professional | 415 | 5.9% |
| Total | 7,066 | 100.0% |
School Enrollment by Age by Funding Source in Ewa Gentry
Out of a total of 7,066 students who are enrolled in schools in Ewa Gentry, 1,420 (20.1%) attend a private institution, while the remaining 5,646 (79.9%) are enrolled in public schools. The age group of 35 years and over has the highest likelihood of being enrolled in private schools, with 266 (50.4% in the age bracket) enrolled. Conversely, the age group of 10 to 14 year olds has the lowest likelihood of being enrolled in a private school, with 1,884 (86.4% in the age bracket) attending a public institution.
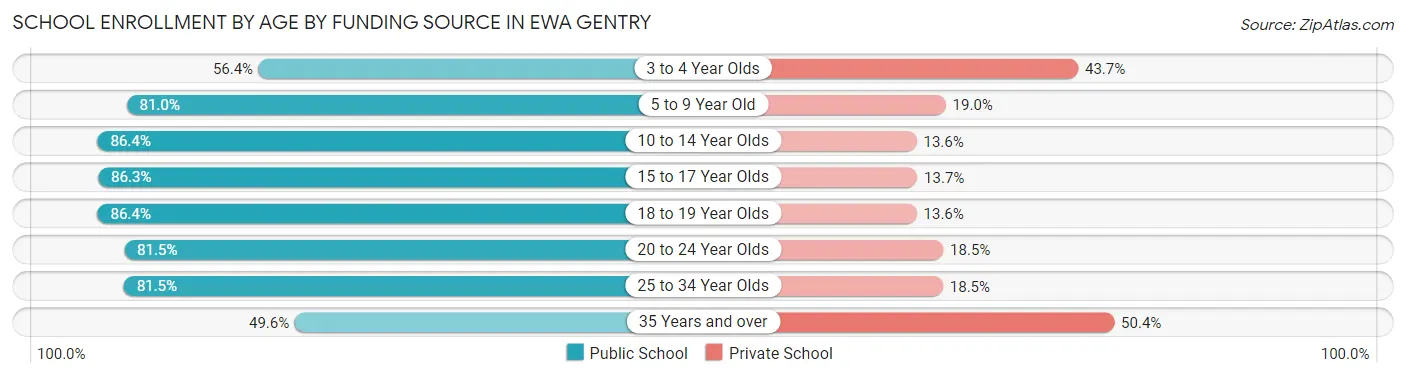
| Age Bracket | Public School | Private School |
| 3 to 4 Year Olds | 235 (56.4%) | 182 (43.6%) |
| 5 to 9 Year Old | 1,381 (81.0%) | 324 (19.0%) |
| 10 to 14 Year Olds | 1,884 (86.4%) | 296 (13.6%) |
| 15 to 17 Year Olds | 870 (86.3%) | 138 (13.7%) |
| 18 to 19 Year Olds | 267 (86.4%) | 42 (13.6%) |
| 20 to 24 Year Olds | 343 (81.5%) | 78 (18.5%) |
| 25 to 34 Year Olds | 406 (81.5%) | 92 (18.5%) |
| 35 Years and over | 262 (49.6%) | 266 (50.4%) |
| Total | 5,646 (79.9%) | 1,420 (20.1%) |
Educational Attainment by Field of Study in Ewa Gentry
Business (1,179 | 22.2%), science & technology (682 | 12.8%), education (653 | 12.3%), psychology (448 | 8.4%), and arts & humanities (446 | 8.4%) are the most common fields of study among 5,323 individuals in Ewa Gentry who have obtained a bachelor's degree or higher.
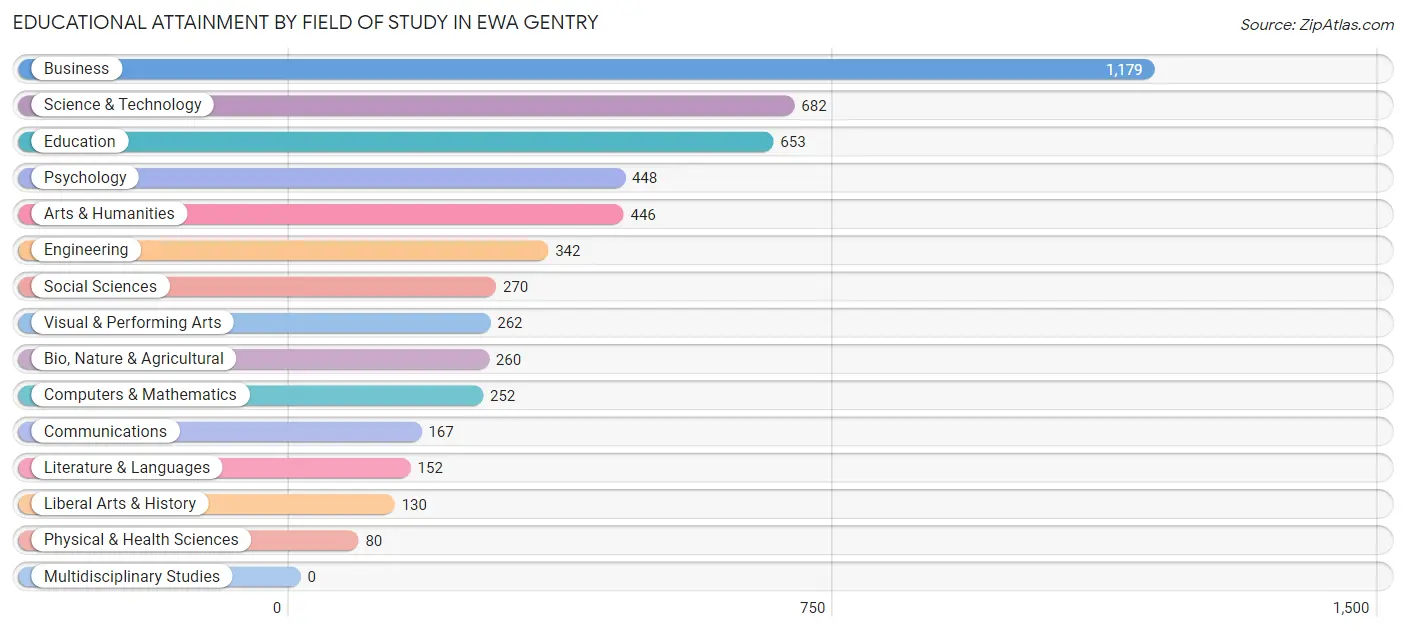
| Field of Study | # Graduates | % Graduates |
| Computers & Mathematics | 252 | 4.7% |
| Bio, Nature & Agricultural | 260 | 4.9% |
| Physical & Health Sciences | 80 | 1.5% |
| Psychology | 448 | 8.4% |
| Social Sciences | 270 | 5.1% |
| Engineering | 342 | 6.4% |
| Multidisciplinary Studies | 0 | 0.0% |
| Science & Technology | 682 | 12.8% |
| Business | 1,179 | 22.2% |
| Education | 653 | 12.3% |
| Literature & Languages | 152 | 2.9% |
| Liberal Arts & History | 130 | 2.4% |
| Visual & Performing Arts | 262 | 4.9% |
| Communications | 167 | 3.1% |
| Arts & Humanities | 446 | 8.4% |
| Total | 5,323 | 100.0% |
Transportation & Commute in Ewa Gentry
Vehicle Availability by Sex in Ewa Gentry
The most prevalent vehicle ownership categories in Ewa Gentry are males with 2 vehicles (2,618, accounting for 35.9%) and females with 2 vehicles (2,641, making up 36.9%).
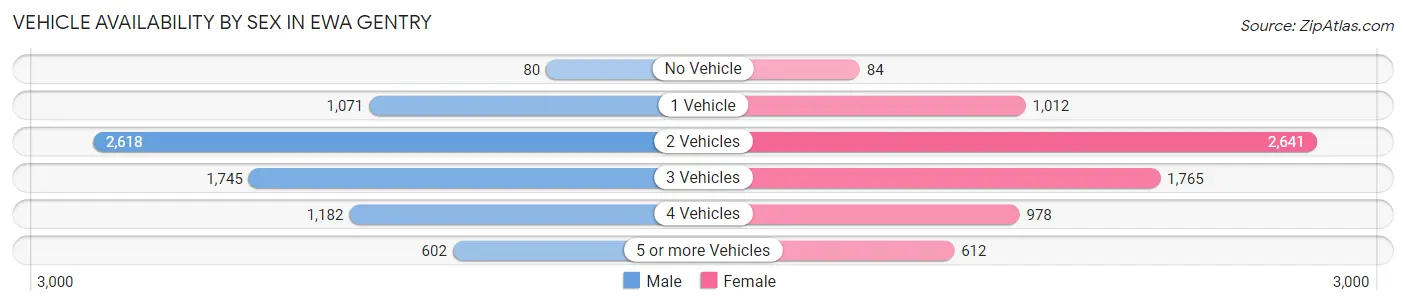
| Vehicles Available | Male | Female |
| No Vehicle | 80 (1.1%) | 84 (1.2%) |
| 1 Vehicle | 1,071 (14.7%) | 1,012 (14.3%) |
| 2 Vehicles | 2,618 (35.9%) | 2,641 (37.2%) |
| 3 Vehicles | 1,745 (23.9%) | 1,765 (24.9%) |
| 4 Vehicles | 1,182 (16.2%) | 978 (13.8%) |
| 5 or more Vehicles | 602 (8.3%) | 612 (8.6%) |
| Total | 7,298 (100.0%) | 7,092 (100.0%) |
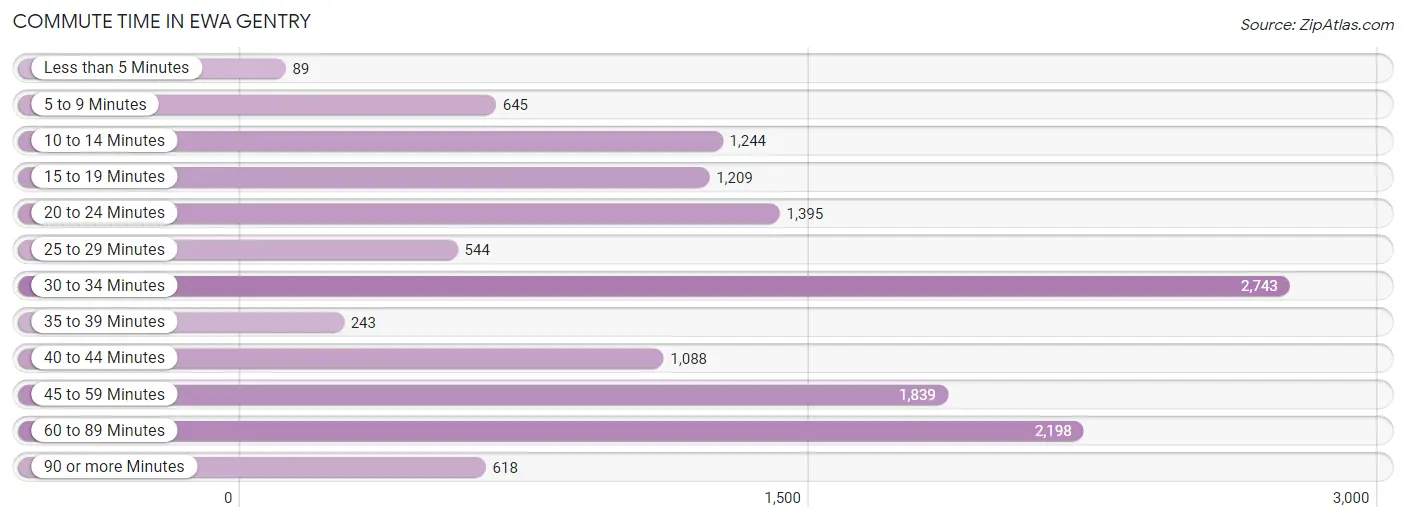
Commute Time in Ewa Gentry
The most frequently occuring commute durations in Ewa Gentry are 30 to 34 minutes (2,743 commuters, 19.8%), 60 to 89 minutes (2,198 commuters, 15.9%), and 45 to 59 minutes (1,839 commuters, 13.3%).
| Commute Time | # Commuters | % Commuters |
| Less than 5 Minutes | 89 | 0.6% |
| 5 to 9 Minutes | 645 | 4.7% |
| 10 to 14 Minutes | 1,244 | 9.0% |
| 15 to 19 Minutes | 1,209 | 8.7% |
| 20 to 24 Minutes | 1,395 | 10.1% |
| 25 to 29 Minutes | 544 | 3.9% |
| 30 to 34 Minutes | 2,743 | 19.8% |
| 35 to 39 Minutes | 243 | 1.8% |
| 40 to 44 Minutes | 1,088 | 7.9% |
| 45 to 59 Minutes | 1,839 | 13.3% |
| 60 to 89 Minutes | 2,198 | 15.9% |
| 90 or more Minutes | 618 | 4.5% |
Commute Time by Sex in Ewa Gentry
The most common commute times in Ewa Gentry are 30 to 34 minutes (1,503 commuters, 21.0%) for males and 30 to 34 minutes (1,240 commuters, 18.5%) for females.
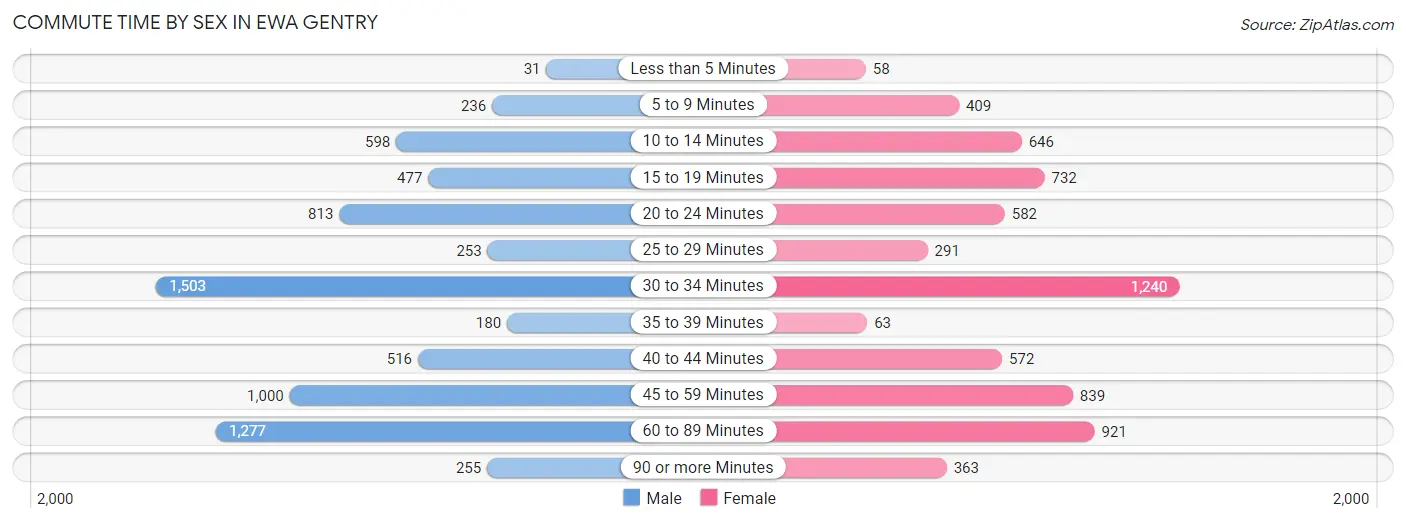
| Commute Time | Male | Female |
| Less than 5 Minutes | 31 (0.4%) | 58 (0.9%) |
| 5 to 9 Minutes | 236 (3.3%) | 409 (6.1%) |
| 10 to 14 Minutes | 598 (8.4%) | 646 (9.6%) |
| 15 to 19 Minutes | 477 (6.7%) | 732 (10.9%) |
| 20 to 24 Minutes | 813 (11.4%) | 582 (8.7%) |
| 25 to 29 Minutes | 253 (3.5%) | 291 (4.3%) |
| 30 to 34 Minutes | 1,503 (21.0%) | 1,240 (18.5%) |
| 35 to 39 Minutes | 180 (2.5%) | 63 (0.9%) |
| 40 to 44 Minutes | 516 (7.2%) | 572 (8.5%) |
| 45 to 59 Minutes | 1,000 (14.0%) | 839 (12.5%) |
| 60 to 89 Minutes | 1,277 (17.9%) | 921 (13.7%) |
| 90 or more Minutes | 255 (3.6%) | 363 (5.4%) |
Time of Departure to Work by Sex in Ewa Gentry
The most frequent times of departure to work in Ewa Gentry are 12:00 AM to 4:59 AM (1,313, 18.4%) for males and 6:00 AM to 6:29 AM (987, 14.7%) for females.
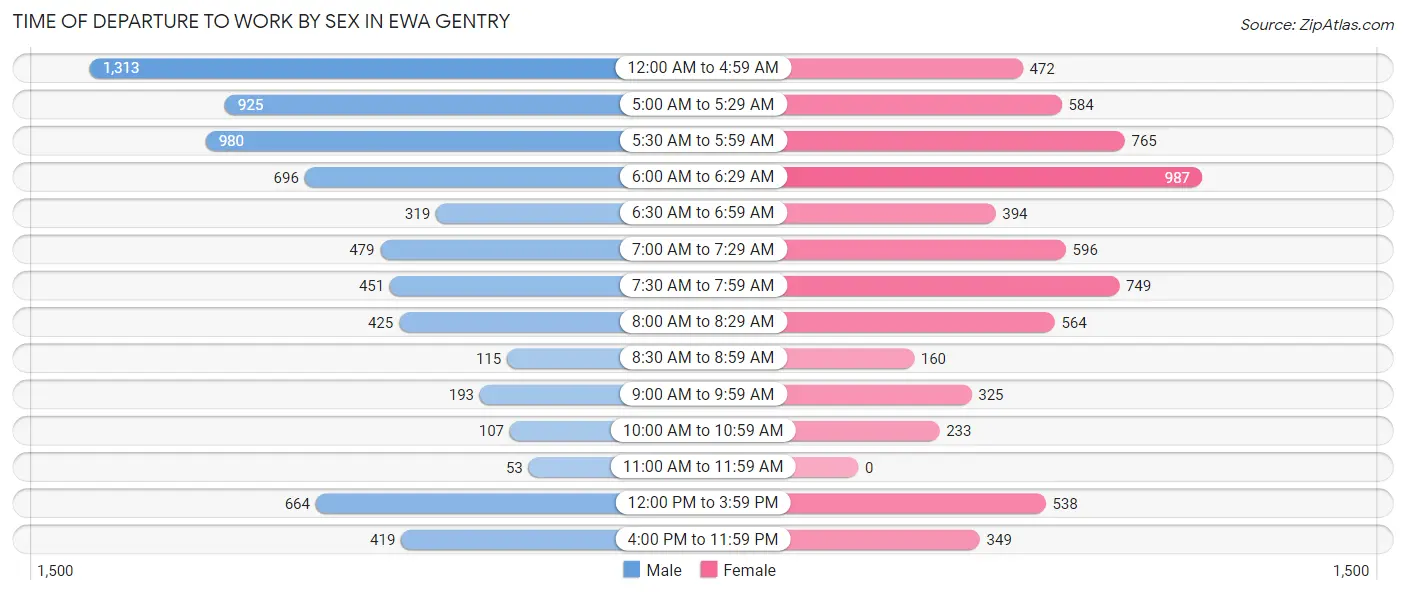
| Time of Departure | Male | Female |
| 12:00 AM to 4:59 AM | 1,313 (18.4%) | 472 (7.0%) |
| 5:00 AM to 5:29 AM | 925 (13.0%) | 584 (8.7%) |
| 5:30 AM to 5:59 AM | 980 (13.7%) | 765 (11.4%) |
| 6:00 AM to 6:29 AM | 696 (9.8%) | 987 (14.7%) |
| 6:30 AM to 6:59 AM | 319 (4.5%) | 394 (5.9%) |
| 7:00 AM to 7:29 AM | 479 (6.7%) | 596 (8.9%) |
| 7:30 AM to 7:59 AM | 451 (6.3%) | 749 (11.2%) |
| 8:00 AM to 8:29 AM | 425 (5.9%) | 564 (8.4%) |
| 8:30 AM to 8:59 AM | 115 (1.6%) | 160 (2.4%) |
| 9:00 AM to 9:59 AM | 193 (2.7%) | 325 (4.8%) |
| 10:00 AM to 10:59 AM | 107 (1.5%) | 233 (3.5%) |
| 11:00 AM to 11:59 AM | 53 (0.7%) | 0 (0.0%) |
| 12:00 PM to 3:59 PM | 664 (9.3%) | 538 (8.0%) |
| 4:00 PM to 11:59 PM | 419 (5.9%) | 349 (5.2%) |
| Total | 7,139 (100.0%) | 6,716 (100.0%) |
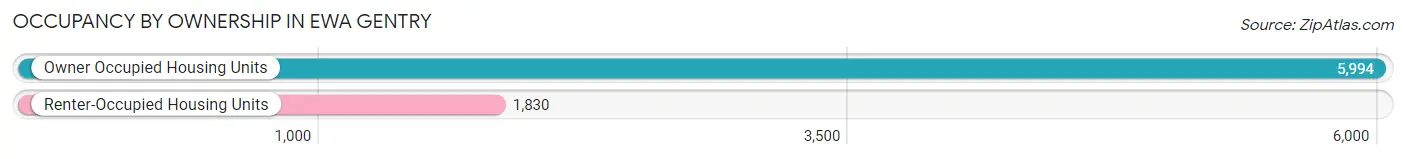
Housing Occupancy in Ewa Gentry
Occupancy by Ownership in Ewa Gentry
Of the total 7,824 dwellings in Ewa Gentry, owner-occupied units account for 5,994 (76.6%), while renter-occupied units make up 1,830 (23.4%).
| Occupancy | # Housing Units | % Housing Units |
| Owner Occupied Housing Units | 5,994 | 76.6% |
| Renter-Occupied Housing Units | 1,830 | 23.4% |
| Total Occupied Housing Units | 7,824 | 100.0% |
Occupancy by Household Size in Ewa Gentry
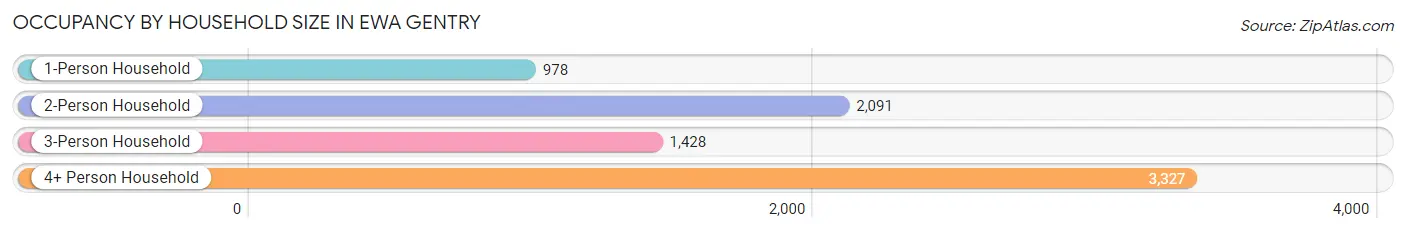
| Household Size | # Housing Units | % Housing Units |
| 1-Person Household | 978 | 12.5% |
| 2-Person Household | 2,091 | 26.7% |
| 3-Person Household | 1,428 | 18.2% |
| 4+ Person Household | 3,327 | 42.5% |
| Total Housing Units | 7,824 | 100.0% |
Occupancy by Ownership by Household Size in Ewa Gentry
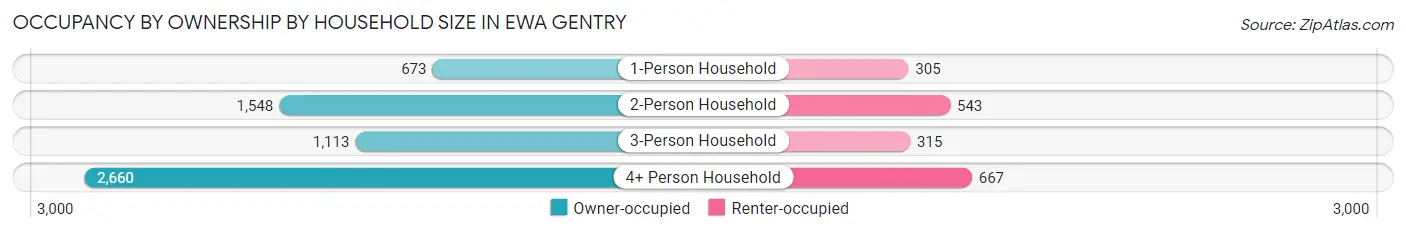
| Household Size | Owner-occupied | Renter-occupied |
| 1-Person Household | 673 (68.8%) | 305 (31.2%) |
| 2-Person Household | 1,548 (74.0%) | 543 (26.0%) |
| 3-Person Household | 1,113 (77.9%) | 315 (22.1%) |
| 4+ Person Household | 2,660 (79.9%) | 667 (20.1%) |
| Total Housing Units | 5,994 (76.6%) | 1,830 (23.4%) |
Occupancy by Educational Attainment in Ewa Gentry
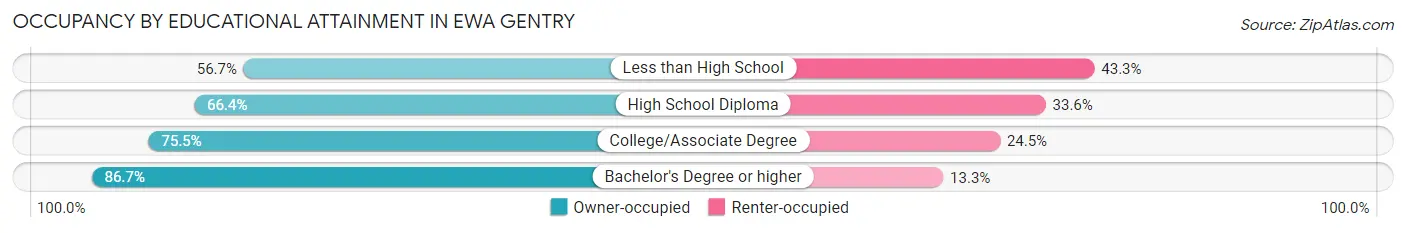
| Household Size | Owner-occupied | Renter-occupied |
| Less than High School | 160 (56.7%) | 122 (43.3%) |
| High School Diploma | 1,172 (66.4%) | 593 (33.6%) |
| College/Associate Degree | 2,331 (75.5%) | 758 (24.5%) |
| Bachelor's Degree or higher | 2,331 (86.7%) | 357 (13.3%) |
Occupancy by Age of Householder in Ewa Gentry
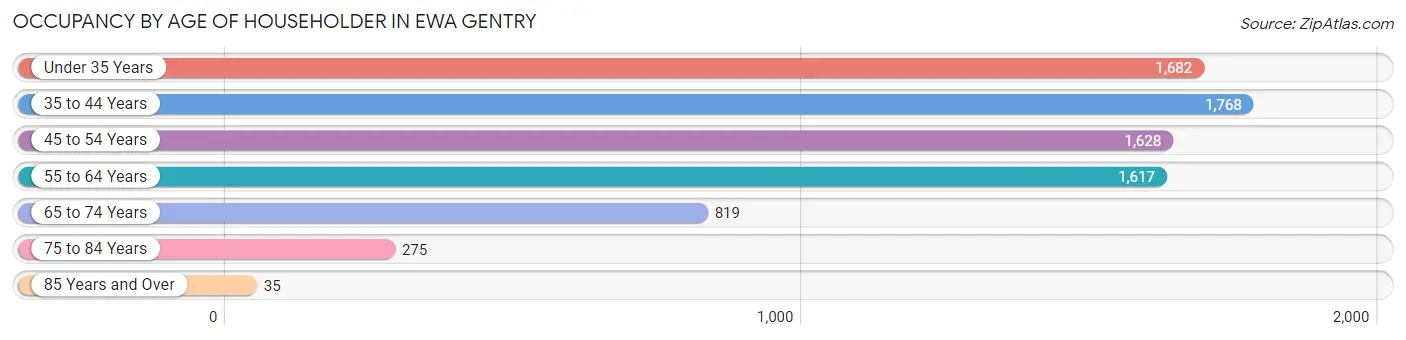
| Age Bracket | # Households | % Households |
| Under 35 Years | 1,682 | 21.5% |
| 35 to 44 Years | 1,768 | 22.6% |
| 45 to 54 Years | 1,628 | 20.8% |
| 55 to 64 Years | 1,617 | 20.7% |
| 65 to 74 Years | 819 | 10.5% |
| 75 to 84 Years | 275 | 3.5% |
| 85 Years and Over | 35 | 0.4% |
| Total | 7,824 | 100.0% |
Housing Finances in Ewa Gentry
Median Income by Occupancy in Ewa Gentry
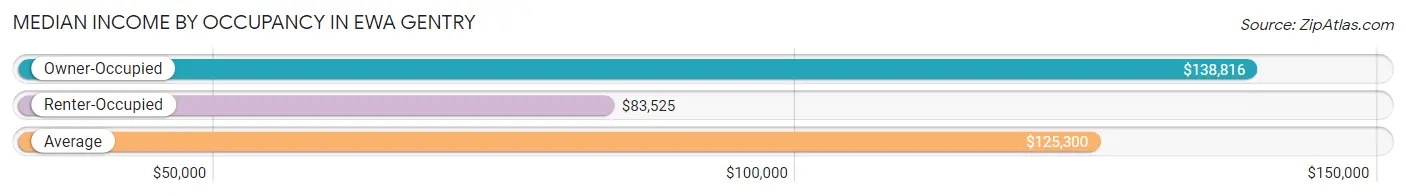
| Occupancy Type | # Households | Median Income |
| Owner-Occupied | 5,994 (76.6%) | $138,816 |
| Renter-Occupied | 1,830 (23.4%) | $83,525 |
| Average | 7,824 (100.0%) | $125,300 |
Occupancy by Householder Income Bracket in Ewa Gentry
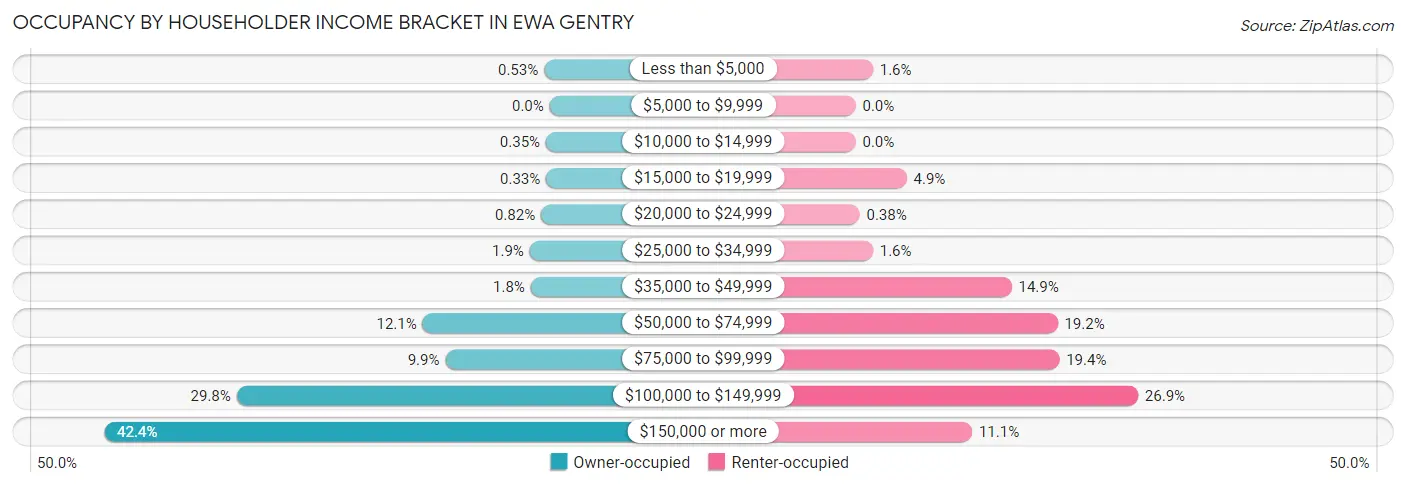
| Income Bracket | Owner-occupied | Renter-occupied |
| Less than $5,000 | 32 (0.5%) | 30 (1.6%) |
| $5,000 to $9,999 | 0 (0.0%) | 0 (0.0%) |
| $10,000 to $14,999 | 21 (0.4%) | 0 (0.0%) |
| $15,000 to $19,999 | 20 (0.3%) | 89 (4.9%) |
| $20,000 to $24,999 | 49 (0.8%) | 7 (0.4%) |
| $25,000 to $34,999 | 114 (1.9%) | 30 (1.6%) |
| $35,000 to $49,999 | 108 (1.8%) | 272 (14.9%) |
| $50,000 to $74,999 | 725 (12.1%) | 352 (19.2%) |
| $75,000 to $99,999 | 595 (9.9%) | 355 (19.4%) |
| $100,000 to $149,999 | 1,787 (29.8%) | 492 (26.9%) |
| $150,000 or more | 2,543 (42.4%) | 203 (11.1%) |
| Total | 5,994 (100.0%) | 1,830 (100.0%) |
Monthly Housing Cost Tiers in Ewa Gentry
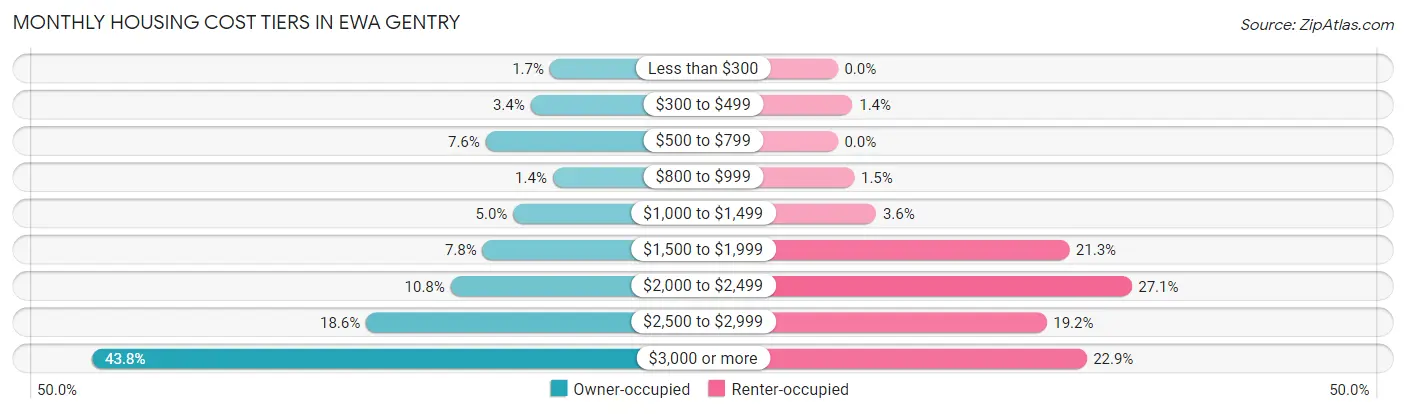
| Monthly Cost | Owner-occupied | Renter-occupied |
| Less than $300 | 99 (1.7%) | 0 (0.0%) |
| $300 to $499 | 205 (3.4%) | 25 (1.4%) |
| $500 to $799 | 453 (7.6%) | 0 (0.0%) |
| $800 to $999 | 83 (1.4%) | 28 (1.5%) |
| $1,000 to $1,499 | 301 (5.0%) | 65 (3.5%) |
| $1,500 to $1,999 | 470 (7.8%) | 390 (21.3%) |
| $2,000 to $2,499 | 646 (10.8%) | 495 (27.1%) |
| $2,500 to $2,999 | 1,113 (18.6%) | 352 (19.2%) |
| $3,000 or more | 2,624 (43.8%) | 419 (22.9%) |
| Total | 5,994 (100.0%) | 1,830 (100.0%) |
Physical Housing Characteristics in Ewa Gentry
Housing Structures in Ewa Gentry
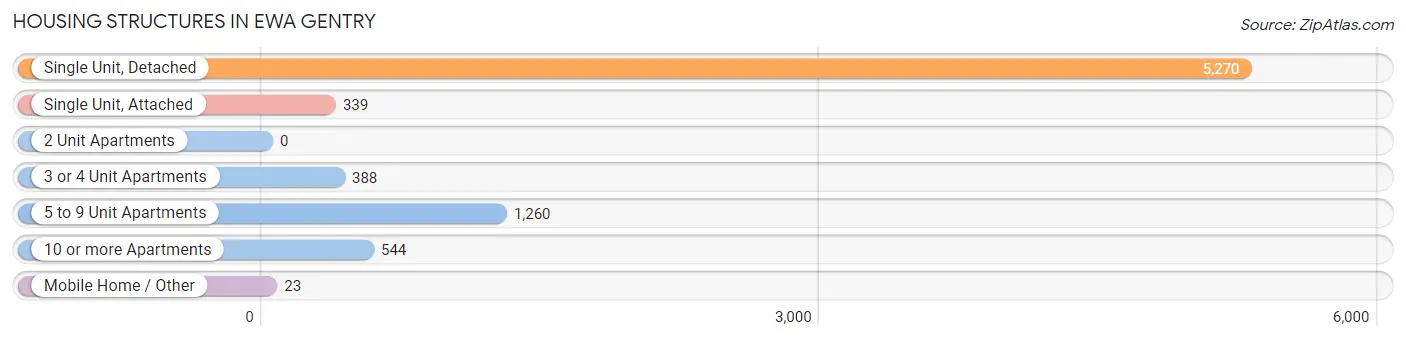
| Structure Type | # Housing Units | % Housing Units |
| Single Unit, Detached | 5,270 | 67.4% |
| Single Unit, Attached | 339 | 4.3% |
| 2 Unit Apartments | 0 | 0.0% |
| 3 or 4 Unit Apartments | 388 | 5.0% |
| 5 to 9 Unit Apartments | 1,260 | 16.1% |
| 10 or more Apartments | 544 | 7.0% |
| Mobile Home / Other | 23 | 0.3% |
| Total | 7,824 | 100.0% |
Housing Structures by Occupancy in Ewa Gentry
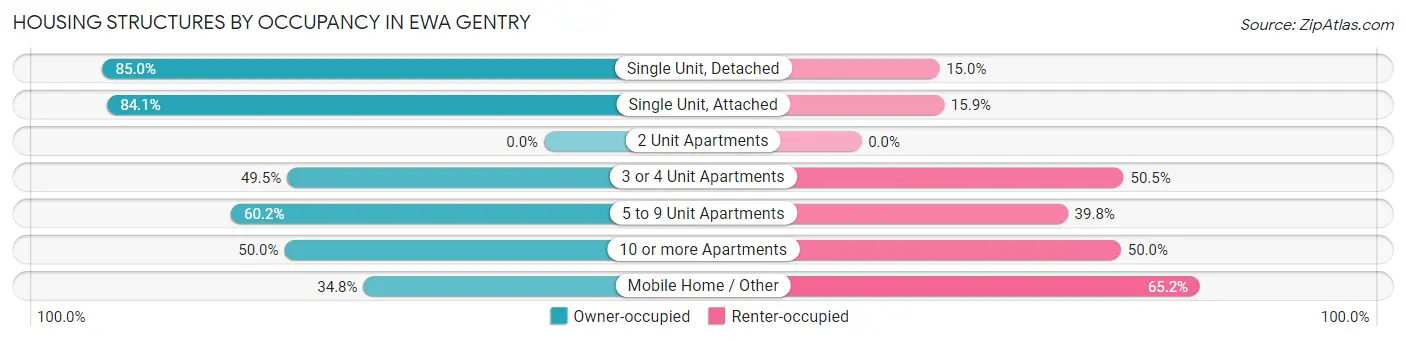
| Structure Type | Owner-occupied | Renter-occupied |
| Single Unit, Detached | 4,478 (85.0%) | 792 (15.0%) |
| Single Unit, Attached | 285 (84.1%) | 54 (15.9%) |
| 2 Unit Apartments | 0 (0.0%) | 0 (0.0%) |
| 3 or 4 Unit Apartments | 192 (49.5%) | 196 (50.5%) |
| 5 to 9 Unit Apartments | 759 (60.2%) | 501 (39.8%) |
| 10 or more Apartments | 272 (50.0%) | 272 (50.0%) |
| Mobile Home / Other | 8 (34.8%) | 15 (65.2%) |
| Total | 5,994 (76.6%) | 1,830 (23.4%) |
Housing Structures by Number of Rooms in Ewa Gentry
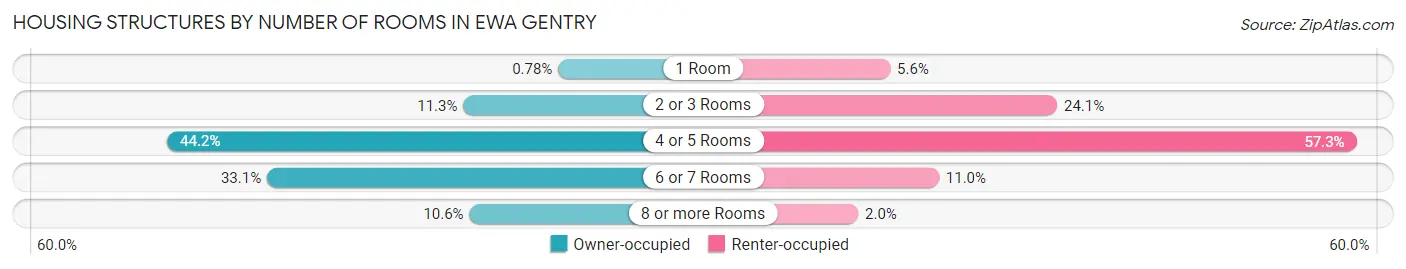
| Number of Rooms | Owner-occupied | Renter-occupied |
| 1 Room | 47 (0.8%) | 102 (5.6%) |
| 2 or 3 Rooms | 678 (11.3%) | 441 (24.1%) |
| 4 or 5 Rooms | 2,648 (44.2%) | 1,049 (57.3%) |
| 6 or 7 Rooms | 1,984 (33.1%) | 201 (11.0%) |
| 8 or more Rooms | 637 (10.6%) | 37 (2.0%) |
| Total | 5,994 (100.0%) | 1,830 (100.0%) |
Housing Structure by Heating Type in Ewa Gentry
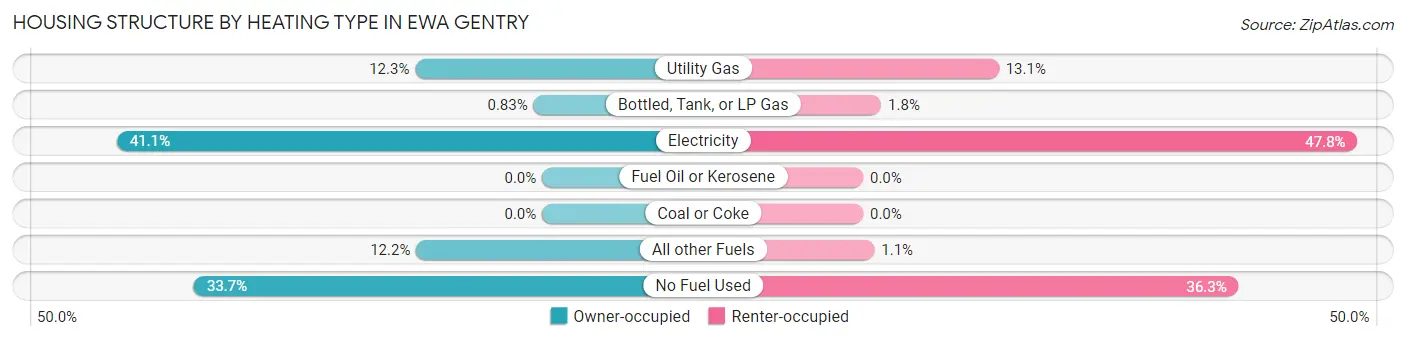
| Heating Type | Owner-occupied | Renter-occupied |
| Utility Gas | 735 (12.3%) | 240 (13.1%) |
| Bottled, Tank, or LP Gas | 50 (0.8%) | 32 (1.8%) |
| Electricity | 2,463 (41.1%) | 874 (47.8%) |
| Fuel Oil or Kerosene | 0 (0.0%) | 0 (0.0%) |
| Coal or Coke | 0 (0.0%) | 0 (0.0%) |
| All other Fuels | 729 (12.2%) | 20 (1.1%) |
| No Fuel Used | 2,017 (33.7%) | 664 (36.3%) |
| Total | 5,994 (100.0%) | 1,830 (100.0%) |
Household Vehicle Usage in Ewa Gentry
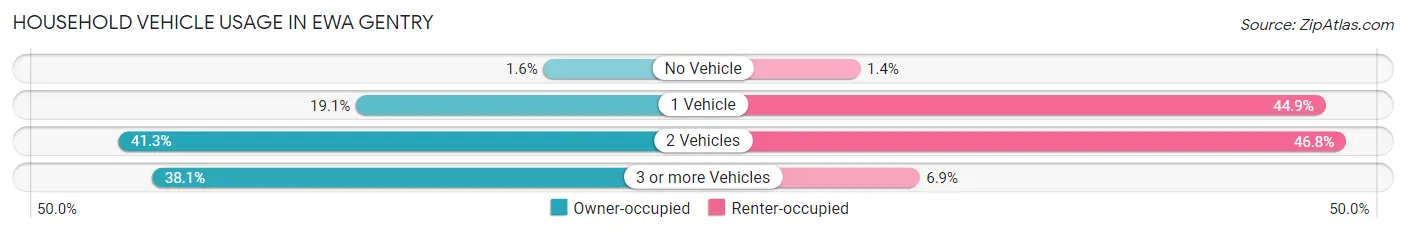
| Vehicles per Household | Owner-occupied | Renter-occupied |
| No Vehicle | 93 (1.5%) | 26 (1.4%) |
| 1 Vehicle | 1,142 (19.1%) | 821 (44.9%) |
| 2 Vehicles | 2,474 (41.3%) | 856 (46.8%) |
| 3 or more Vehicles | 2,285 (38.1%) | 127 (6.9%) |
| Total | 5,994 (100.0%) | 1,830 (100.0%) |
Real Estate & Mortgages in Ewa Gentry
Real Estate and Mortgage Overview in Ewa Gentry
| Characteristic | Without Mortgage | With Mortgage |
| Housing Units | 771 | 5,223 |
| Median Property Value | $719,800 | $714,300 |
| Median Household Income | $115,461 | $2,320 |
| Monthly Housing Costs | $642 | $2,624 |
| Real Estate Taxes | $1,871 | $430 |
Property Value by Mortgage Status in Ewa Gentry

| Property Value | Without Mortgage | With Mortgage |
| Less than $50,000 | 8 (1.0%) | 147 (2.8%) |
| $50,000 to $99,999 | 0 (0.0%) | 70 (1.3%) |
| $100,000 to $299,999 | 15 (1.9%) | 40 (0.8%) |
| $300,000 to $499,999 | 133 (17.2%) | 874 (16.7%) |
| $500,000 to $749,999 | 261 (33.9%) | 1,727 (33.1%) |
| $750,000 to $999,999 | 206 (26.7%) | 1,977 (37.9%) |
| $1,000,000 or more | 148 (19.2%) | 388 (7.4%) |
| Total | 771 (100.0%) | 5,223 (100.0%) |
Household Income by Mortgage Status in Ewa Gentry
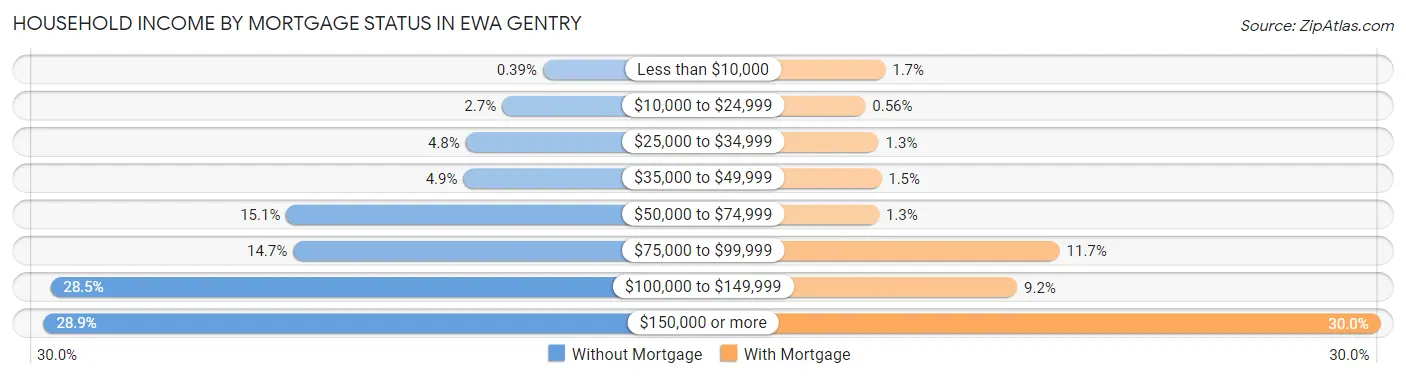
| Household Income | Without Mortgage | With Mortgage |
| Less than $10,000 | 3 (0.4%) | 89 (1.7%) |
| $10,000 to $24,999 | 21 (2.7%) | 29 (0.6%) |
| $25,000 to $34,999 | 37 (4.8%) | 69 (1.3%) |
| $35,000 to $49,999 | 38 (4.9%) | 77 (1.5%) |
| $50,000 to $74,999 | 116 (15.0%) | 70 (1.3%) |
| $75,000 to $99,999 | 113 (14.7%) | 609 (11.7%) |
| $100,000 to $149,999 | 220 (28.5%) | 482 (9.2%) |
| $150,000 or more | 223 (28.9%) | 1,567 (30.0%) |
| Total | 771 (100.0%) | 5,223 (100.0%) |
Property Value to Household Income Ratio in Ewa Gentry
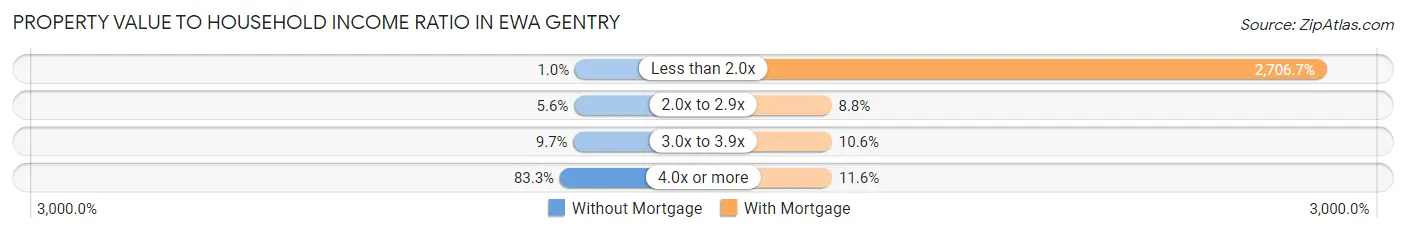
| Value-to-Income Ratio | Without Mortgage | With Mortgage |
| Less than 2.0x | 8 (1.0%) | 141,372 (2,706.7%) |
| 2.0x to 2.9x | 43 (5.6%) | 457 (8.7%) |
| 3.0x to 3.9x | 75 (9.7%) | 551 (10.5%) |
| 4.0x or more | 642 (83.3%) | 606 (11.6%) |
| Total | 771 (100.0%) | 5,223 (100.0%) |
Real Estate Taxes by Mortgage Status in Ewa Gentry
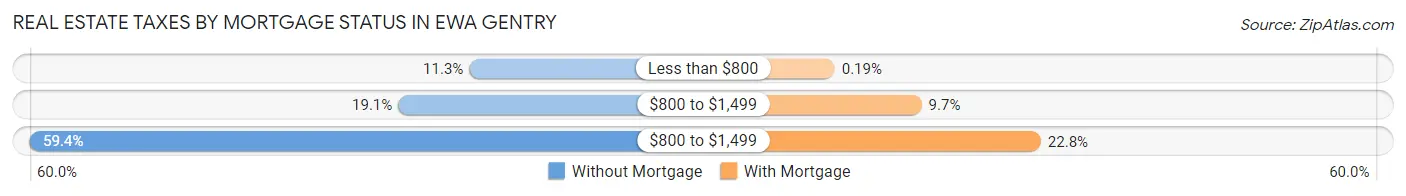
| Property Taxes | Without Mortgage | With Mortgage |
| Less than $800 | 87 (11.3%) | 10 (0.2%) |
| $800 to $1,499 | 147 (19.1%) | 507 (9.7%) |
| $800 to $1,499 | 458 (59.4%) | 1,190 (22.8%) |
| Total | 771 (100.0%) | 5,223 (100.0%) |
Health & Disability in Ewa Gentry
Health Insurance Coverage by Age in Ewa Gentry
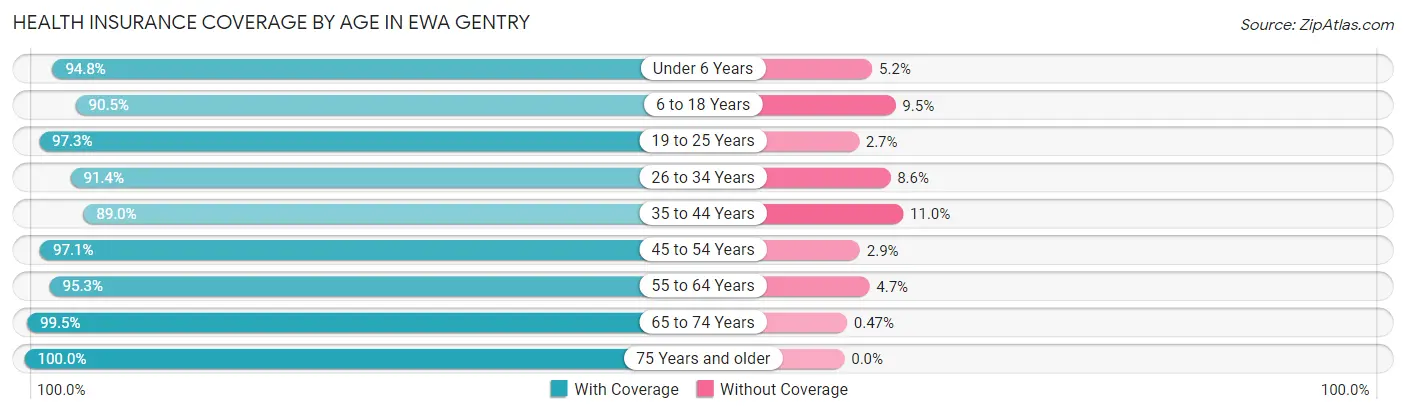
| Age Bracket | With Coverage | Without Coverage |
| Under 6 Years | 2,515 (94.8%) | 138 (5.2%) |
| 6 to 18 Years | 4,488 (90.5%) | 473 (9.5%) |
| 19 to 25 Years | 1,876 (97.3%) | 52 (2.7%) |
| 26 to 34 Years | 3,476 (91.4%) | 326 (8.6%) |
| 35 to 44 Years | 3,887 (89.0%) | 479 (11.0%) |
| 45 to 54 Years | 3,217 (97.1%) | 96 (2.9%) |
| 55 to 64 Years | 2,673 (95.3%) | 131 (4.7%) |
| 65 to 74 Years | 1,698 (99.5%) | 8 (0.5%) |
| 75 Years and older | 851 (100.0%) | 0 (0.0%) |
| Total | 24,681 (93.5%) | 1,703 (6.5%) |
Health Insurance Coverage by Citizenship Status in Ewa Gentry
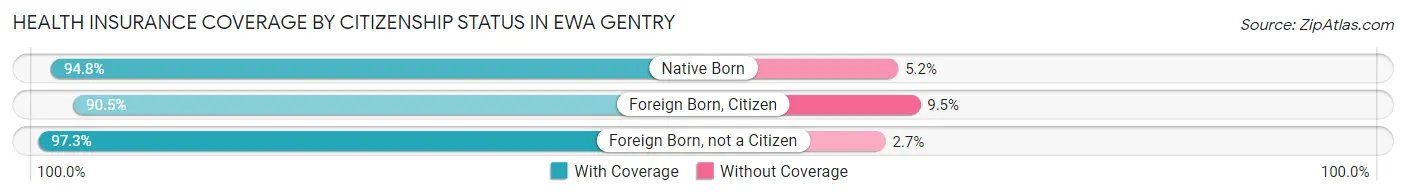
| Citizenship Status | With Coverage | Without Coverage |
| Native Born | 2,515 (94.8%) | 138 (5.2%) |
| Foreign Born, Citizen | 4,488 (90.5%) | 473 (9.5%) |
| Foreign Born, not a Citizen | 1,876 (97.3%) | 52 (2.7%) |
Health Insurance Coverage by Household Income in Ewa Gentry
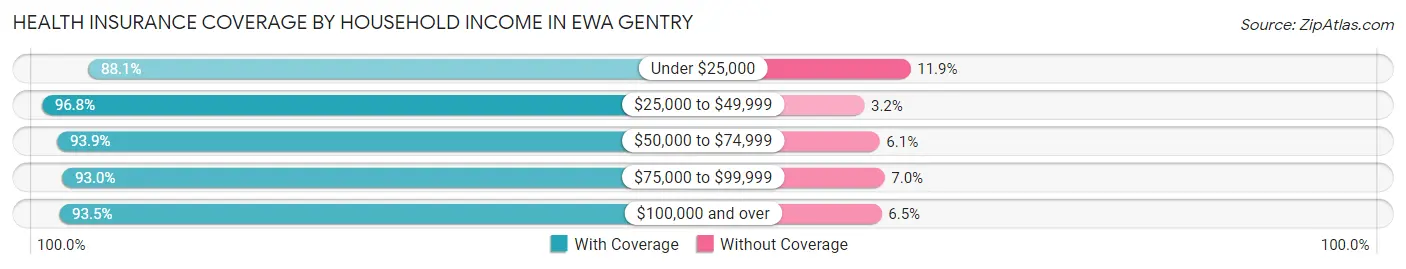
| Household Income | With Coverage | Without Coverage |
| Under $25,000 | 407 (88.1%) | 55 (11.9%) |
| $25,000 to $49,999 | 1,198 (96.8%) | 40 (3.2%) |
| $50,000 to $74,999 | 2,150 (93.9%) | 140 (6.1%) |
| $75,000 to $99,999 | 2,812 (93.0%) | 213 (7.0%) |
| $100,000 and over | 18,111 (93.5%) | 1,255 (6.5%) |
Public vs Private Health Insurance Coverage by Age in Ewa Gentry
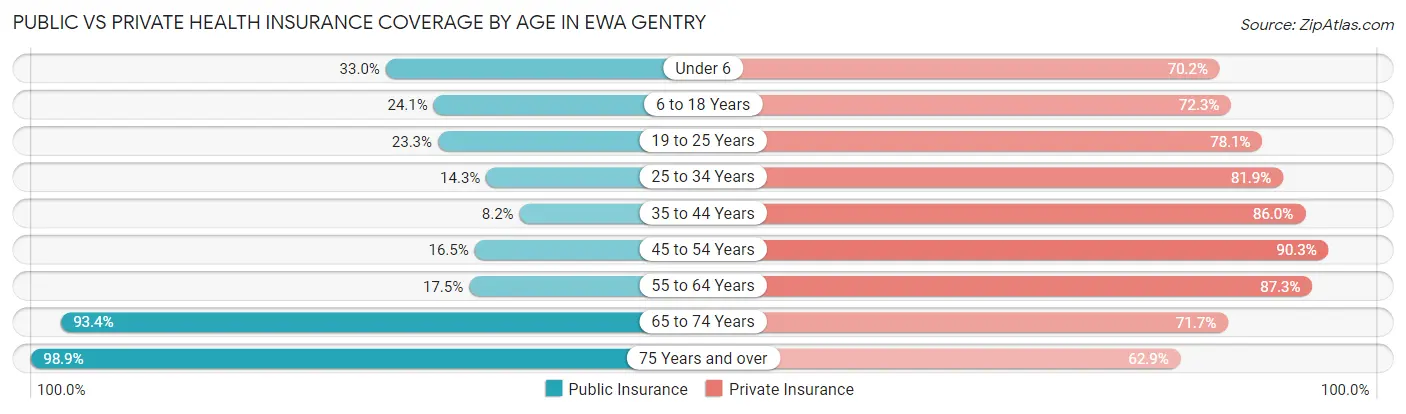
| Age Bracket | Public Insurance | Private Insurance |
| Under 6 | 875 (33.0%) | 1,861 (70.2%) |
| 6 to 18 Years | 1,195 (24.1%) | 3,585 (72.3%) |
| 19 to 25 Years | 449 (23.3%) | 1,505 (78.1%) |
| 25 to 34 Years | 545 (14.3%) | 3,114 (81.9%) |
| 35 to 44 Years | 356 (8.2%) | 3,754 (86.0%) |
| 45 to 54 Years | 546 (16.5%) | 2,993 (90.3%) |
| 55 to 64 Years | 491 (17.5%) | 2,449 (87.3%) |
| 65 to 74 Years | 1,593 (93.4%) | 1,223 (71.7%) |
| 75 Years and over | 842 (98.9%) | 535 (62.9%) |
| Total | 6,892 (26.1%) | 21,019 (79.7%) |
Disability Status by Sex by Age in Ewa Gentry
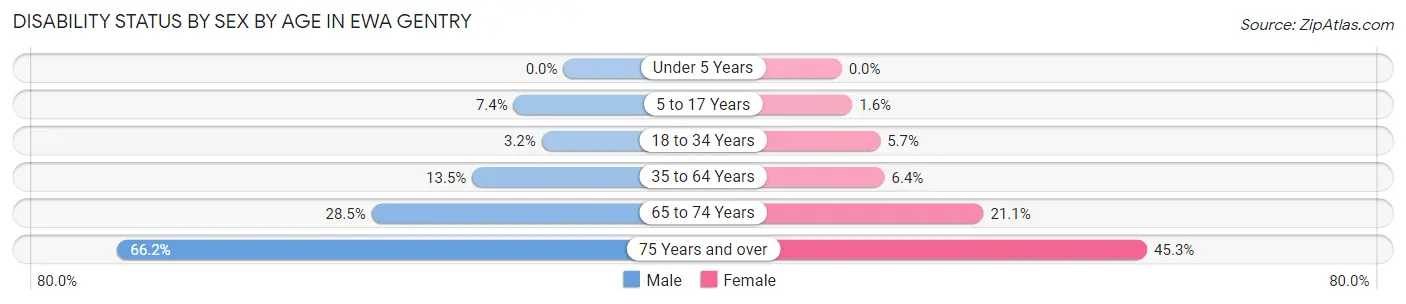
| Age Bracket | Male | Female |
| Under 5 Years | 0 (0.0%) | 0 (0.0%) |
| 5 to 17 Years | 192 (7.4%) | 38 (1.6%) |
| 18 to 34 Years | 86 (3.2%) | 192 (5.7%) |
| 35 to 64 Years | 709 (13.5%) | 334 (6.4%) |
| 65 to 74 Years | 268 (28.5%) | 161 (21.0%) |
| 75 Years and over | 194 (66.2%) | 253 (45.3%) |
Disability Class by Sex by Age in Ewa Gentry
Disability Class: Hearing Difficulty
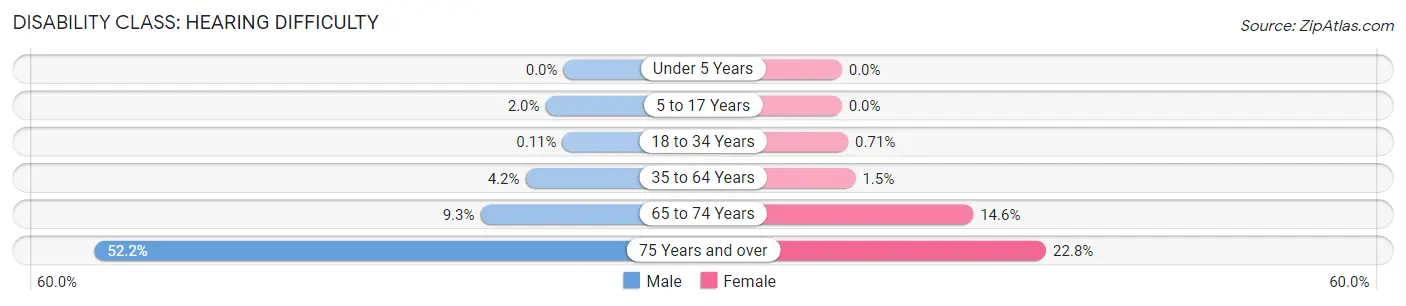
| Age Bracket | Male | Female |
| Under 5 Years | 0 (0.0%) | 0 (0.0%) |
| 5 to 17 Years | 52 (2.0%) | 0 (0.0%) |
| 18 to 34 Years | 3 (0.1%) | 24 (0.7%) |
| 35 to 64 Years | 222 (4.2%) | 80 (1.5%) |
| 65 to 74 Years | 87 (9.2%) | 112 (14.6%) |
| 75 Years and over | 153 (52.2%) | 127 (22.8%) |
Disability Class: Vision Difficulty
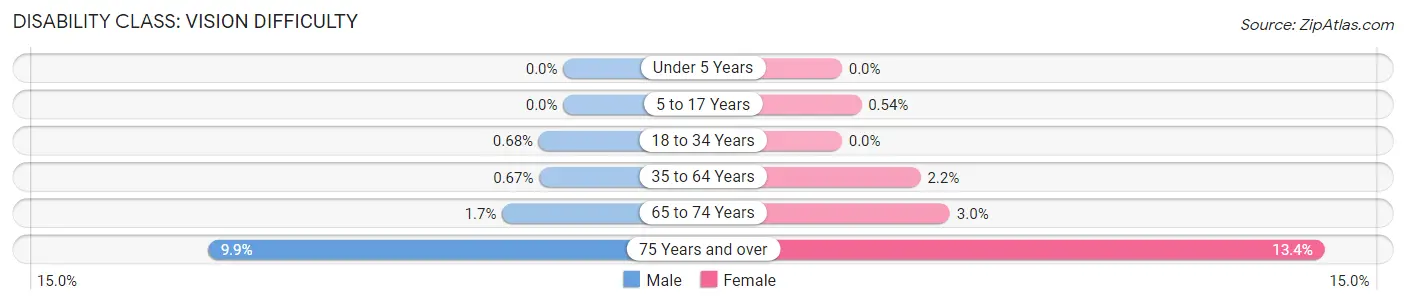
| Age Bracket | Male | Female |
| Under 5 Years | 0 (0.0%) | 0 (0.0%) |
| 5 to 17 Years | 0 (0.0%) | 13 (0.5%) |
| 18 to 34 Years | 18 (0.7%) | 0 (0.0%) |
| 35 to 64 Years | 35 (0.7%) | 115 (2.2%) |
| 65 to 74 Years | 16 (1.7%) | 23 (3.0%) |
| 75 Years and over | 29 (9.9%) | 75 (13.4%) |
Disability Class: Cognitive Difficulty
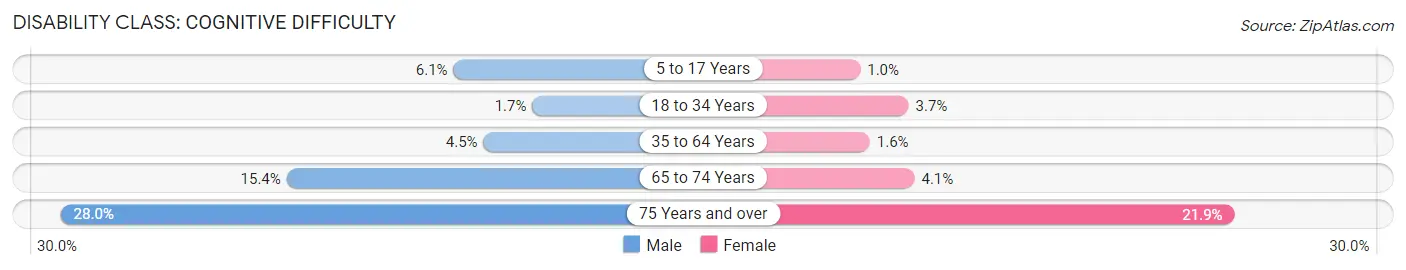
| Age Bracket | Male | Female |
| 5 to 17 Years | 159 (6.1%) | 25 (1.0%) |
| 18 to 34 Years | 46 (1.7%) | 125 (3.7%) |
| 35 to 64 Years | 233 (4.4%) | 82 (1.6%) |
| 65 to 74 Years | 145 (15.4%) | 31 (4.1%) |
| 75 Years and over | 82 (28.0%) | 122 (21.9%) |
Disability Class: Ambulatory Difficulty
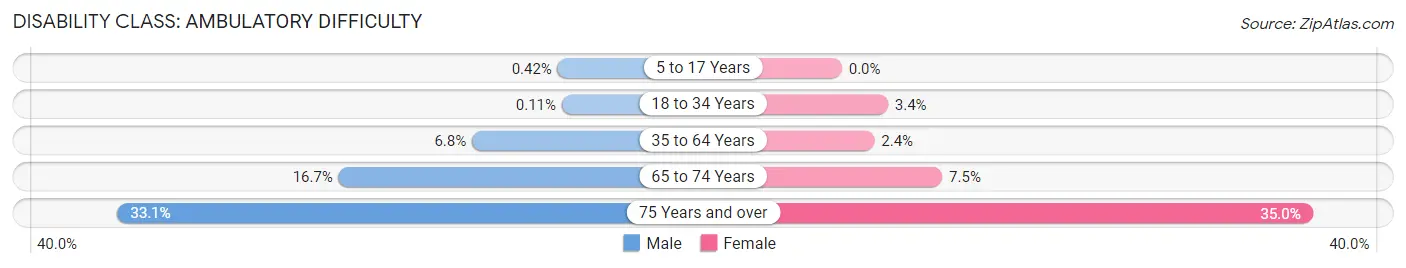
| Age Bracket | Male | Female |
| 5 to 17 Years | 11 (0.4%) | 0 (0.0%) |
| 18 to 34 Years | 3 (0.1%) | 115 (3.4%) |
| 35 to 64 Years | 355 (6.8%) | 127 (2.4%) |
| 65 to 74 Years | 157 (16.7%) | 57 (7.4%) |
| 75 Years and over | 97 (33.1%) | 195 (34.9%) |
Disability Class: Self-Care Difficulty
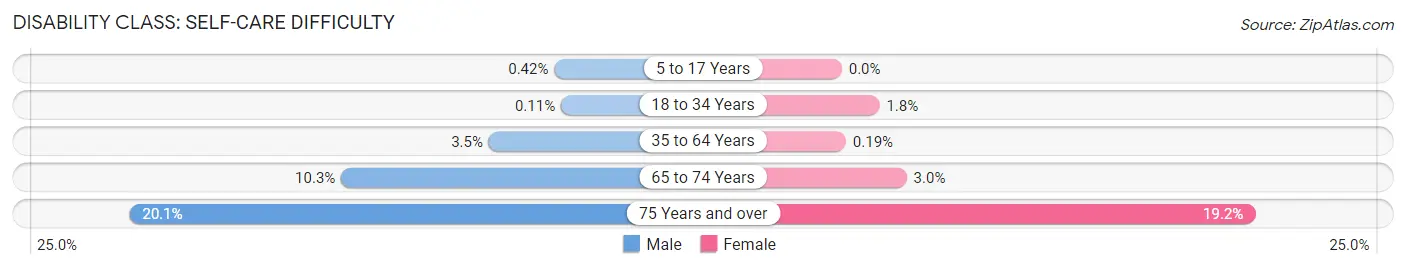
| Age Bracket | Male | Female |
| 5 to 17 Years | 11 (0.4%) | 0 (0.0%) |
| 18 to 34 Years | 3 (0.1%) | 59 (1.8%) |
| 35 to 64 Years | 181 (3.5%) | 10 (0.2%) |
| 65 to 74 Years | 97 (10.3%) | 23 (3.0%) |
| 75 Years and over | 59 (20.1%) | 107 (19.2%) |
Technology Access in Ewa Gentry
Computing Device Access in Ewa Gentry
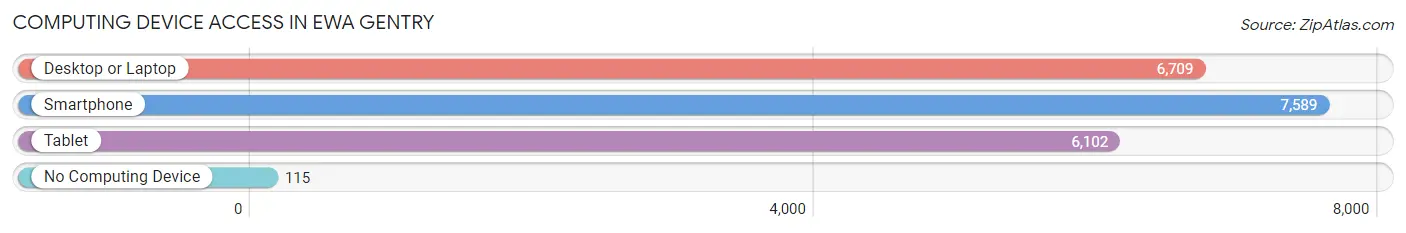
| Device Type | # Households | % Households |
| Desktop or Laptop | 6,709 | 85.8% |
| Smartphone | 7,589 | 97.0% |
| Tablet | 6,102 | 78.0% |
| No Computing Device | 115 | 1.5% |
| Total | 7,824 | 100.0% |
Internet Access in Ewa Gentry
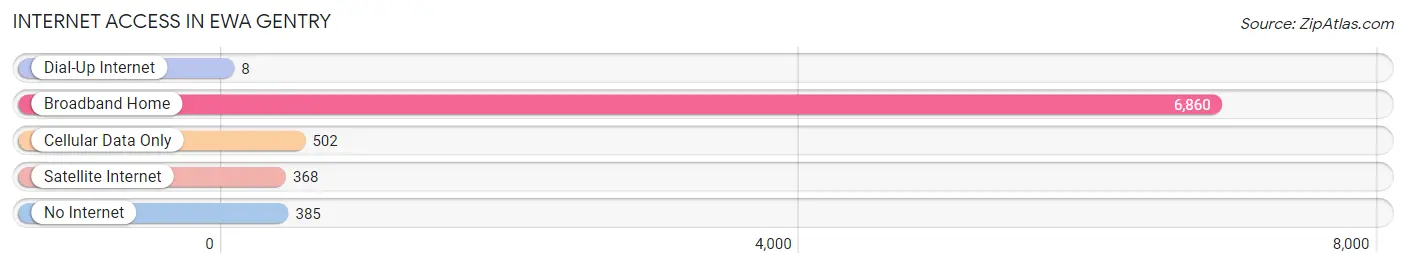
| Internet Type | # Households | % Households |
| Dial-Up Internet | 8 | 0.1% |
| Broadband Home | 6,860 | 87.7% |
| Cellular Data Only | 502 | 6.4% |
| Satellite Internet | 368 | 4.7% |
| No Internet | 385 | 4.9% |
| Total | 7,824 | 100.0% |
Ewa Gentry Summary
Ewa Gentry is a census-designated place (CDP) located in the City and County of Honolulu, Hawaii. It is located on the island of Oahu, and is part of the Honolulu metropolitan area. As of the 2010 census, the population of Ewa Gentry was 8,108.
Geography
Ewa Gentry is located at 21°21'25"N 158°2'17"W (21.356944, -158.038194). It is bordered to the north by Ewa Villages, to the east by Ewa Beach, to the south by Iroquois Point, and to the west by Kapolei.
Ewa Gentry is located in the Ewa Plain, a flat region of land that stretches from Pearl Harbor to the Waianae Mountains. The area is composed of low-lying plains and is characterized by its dry, arid climate.
History
Ewa Gentry was originally part of the ahupuaa of Ewa, which was a traditional Hawaiian land division. The ahupuaa was divided into several smaller districts, including Ewa Gentry.
In the late 19th century, the area was developed by sugar plantations. The area was known as Ewa Plantation, and was home to a large population of Japanese immigrants who worked on the plantations.
In the early 20th century, the area was developed into a residential community. The area was named Ewa Gentry after the Gentry family, who were among the first settlers in the area.
Economy
Ewa Gentry is primarily a residential community, and the majority of its residents are employed in the service sector. The area is home to several retail stores, restaurants, and other businesses.
The area is also home to several industrial and manufacturing businesses, including a large shipyard. The shipyard is the largest employer in the area, and provides jobs for many of the area's residents.
Demographics
As of the 2010 census, the population of Ewa Gentry was 8,108. The racial makeup of the area was 44.3% White, 8.2% African American, 0.7% Native American, 24.2% Asian, 0.3% Pacific Islander, and 22.5% from other races.
The median household income in Ewa Gentry was $67,917, and the median family income was $76,917. The per capita income was $27,917.
Conclusion
Ewa Gentry is a census-designated place located in the City and County of Honolulu, Hawaii. It is located on the island of Oahu, and is part of the Honolulu metropolitan area. The area was originally part of the ahupuaa of Ewa, and was developed into a residential community in the early 20th century. The area is primarily a residential community, and is home to several retail stores, restaurants, and other businesses. As of the 2010 census, the population of Ewa Gentry was 8,108. The racial makeup of the area was 44.3% White, 8.2% African American, 0.7% Native American, 24.2% Asian, 0.3% Pacific Islander, and 22.5% from other races. The median household income in Ewa Gentry was $67,917, and the median family income was $76,917. The per capita income was $27,917.
Common Questions
What is Per Capita Income in Ewa Gentry?
Per Capita income in Ewa Gentry is $39,900.
What is the Median Family Income in Ewa Gentry?
Median Family Income in Ewa Gentry is $133,135.
What is the Median Household income in Ewa Gentry?
Median Household Income in Ewa Gentry is $125,300.
What is Income or Wage Gap in Ewa Gentry?
Income or Wage Gap in Ewa Gentry is 29.0%.
Women in Ewa Gentry earn 71.0 cents for every dollar earned by a man.
What is Inequality or Gini Index in Ewa Gentry?
Inequality or Gini Index in Ewa Gentry is 0.31.
What is the Total Population of Ewa Gentry?
Total Population of Ewa Gentry is 27,198.
What is the Total Male Population of Ewa Gentry?
Total Male Population of Ewa Gentry is 13,690.
What is the Total Female Population of Ewa Gentry?
Total Female Population of Ewa Gentry is 13,508.
What is the Ratio of Males per 100 Females in Ewa Gentry?
There are 101.35 Males per 100 Females in Ewa Gentry.
What is the Ratio of Females per 100 Males in Ewa Gentry?
There are 98.67 Females per 100 Males in Ewa Gentry.
What is the Median Population Age in Ewa Gentry?
Median Population Age in Ewa Gentry is 34.2 Years.
What is the Average Family Size in Ewa Gentry
Average Family Size in Ewa Gentry is 3.8 People.
What is the Average Household Size in Ewa Gentry
Average Household Size in Ewa Gentry is 3.5 People.
How Large is the Labor Force in Ewa Gentry?
There are 15,034 People in the Labor Forcein in Ewa Gentry.
What is the Percentage of People in the Labor Force in Ewa Gentry?
72.9% of People are in the Labor Force in Ewa Gentry.
What is the Unemployment Rate in Ewa Gentry?
Unemployment Rate in Ewa Gentry is 3.5%.