Kapolei, HI Map & Demographics
Kapolei Map
Kapolei Overview
$45,164
PER CAPITA INCOME
$127,217
AVG FAMILY INCOME
$121,768
AVG HOUSEHOLD INCOME
31.0%
WAGE / INCOME GAP [ % ]
69.0¢/ $1
WAGE / INCOME GAP [ $ ]
$7,957
FAMILY INCOME DEFICIT
0.37
INEQUALITY / GINI INDEX
22,701
TOTAL POPULATION
11,476
MALE POPULATION
11,225
FEMALE POPULATION
102.24
MALES / 100 FEMALES
97.81
FEMALES / 100 MALES
33.9
MEDIAN AGE
3.5
AVG FAMILY SIZE
3.2
AVG HOUSEHOLD SIZE
12,164
LABOR FORCE [ PEOPLE ]
72.4%
PERCENT IN LABOR FORCE
5.6%
UNEMPLOYMENT RATE
Kapolei Zip Codes
Kapolei Area Codes
Income in Kapolei
Income Overview in Kapolei
Per Capita Income in Kapolei is $45,164, while median incomes of families and households are $127,217 and $121,768 respectively.
| Characteristic | Number | Measure |
| Per Capita Income | 22,701 | $45,164 |
| Median Family Income | 5,696 | $127,217 |
| Mean Family Income | 5,696 | $150,045 |
| Median Household Income | 6,944 | $121,768 |
| Mean Household Income | 6,944 | $144,835 |
| Income Deficit | 5,696 | $7,957 |
| Wage / Income Gap (%) | 22,701 | 30.96% |
| Wage / Income Gap ($) | 22,701 | 69.04¢ per $1 |
| Gini / Inequality Index | 22,701 | 0.37 |
Earnings by Sex in Kapolei
Average Earnings in Kapolei are $57,108, $67,627 for men and $46,692 for women, a difference of 31.0%.
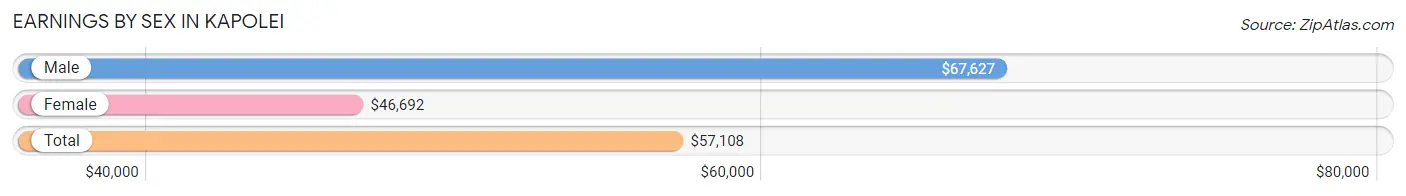
| Sex | Number | Average Earnings |
| Male | 6,373 (51.5%) | $67,627 |
| Female | 5,992 (48.5%) | $46,692 |
| Total | 12,365 (100.0%) | $57,108 |
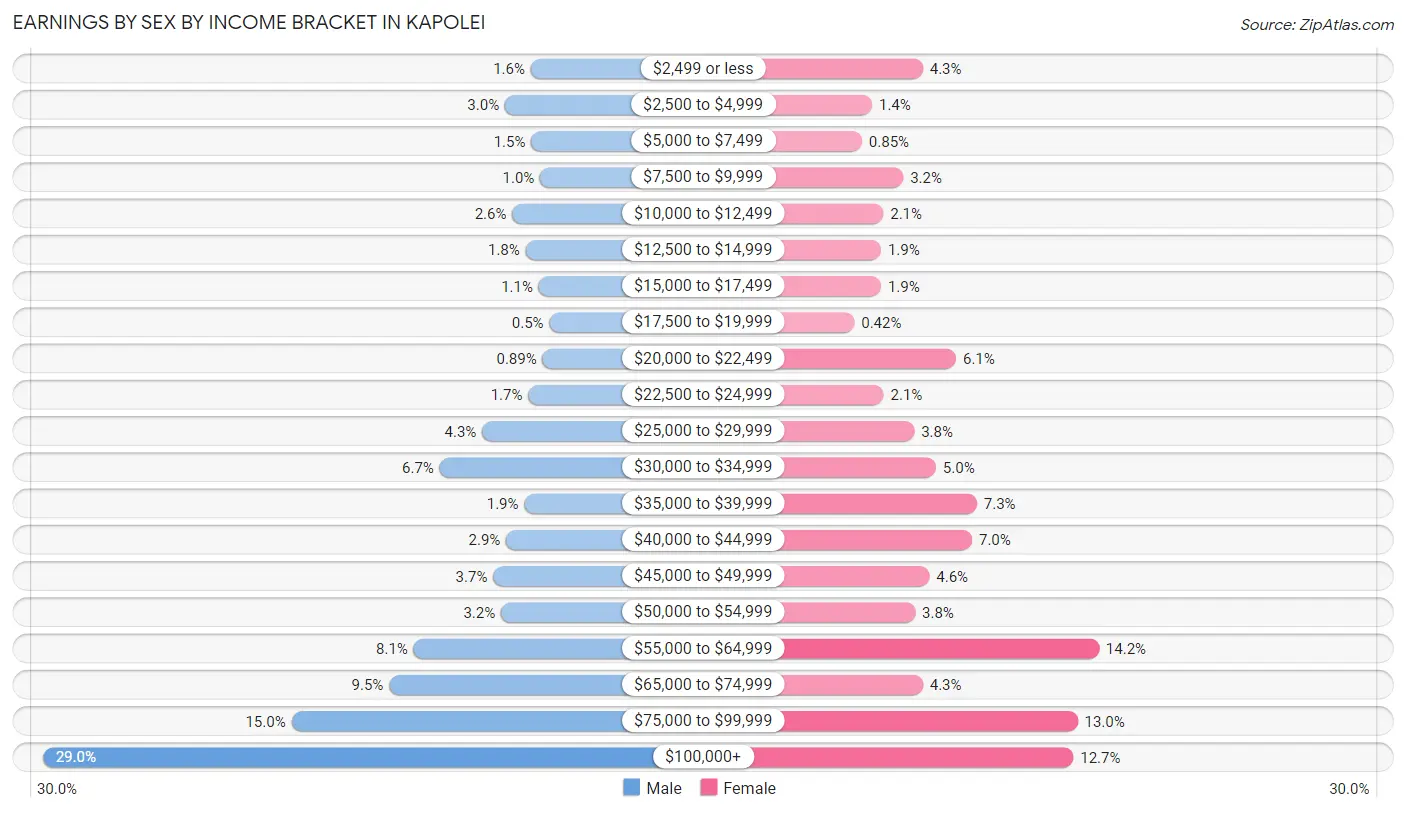
Earnings by Sex by Income Bracket in Kapolei
The most common earnings brackets in Kapolei are $100,000+ for men (1,847 | 29.0%) and $55,000 to $64,999 for women (849 | 14.2%).
| Income | Male | Female |
| $2,499 or less | 99 (1.5%) | 256 (4.3%) |
| $2,500 to $4,999 | 191 (3.0%) | 85 (1.4%) |
| $5,000 to $7,499 | 97 (1.5%) | 51 (0.9%) |
| $7,500 to $9,999 | 65 (1.0%) | 190 (3.2%) |
| $10,000 to $12,499 | 165 (2.6%) | 123 (2.1%) |
| $12,500 to $14,999 | 117 (1.8%) | 115 (1.9%) |
| $15,000 to $17,499 | 70 (1.1%) | 115 (1.9%) |
| $17,500 to $19,999 | 32 (0.5%) | 25 (0.4%) |
| $20,000 to $22,499 | 57 (0.9%) | 368 (6.1%) |
| $22,500 to $24,999 | 108 (1.7%) | 124 (2.1%) |
| $25,000 to $29,999 | 273 (4.3%) | 227 (3.8%) |
| $30,000 to $34,999 | 425 (6.7%) | 300 (5.0%) |
| $35,000 to $39,999 | 122 (1.9%) | 438 (7.3%) |
| $40,000 to $44,999 | 187 (2.9%) | 422 (7.0%) |
| $45,000 to $49,999 | 233 (3.7%) | 278 (4.6%) |
| $50,000 to $54,999 | 205 (3.2%) | 230 (3.8%) |
| $55,000 to $64,999 | 518 (8.1%) | 849 (14.2%) |
| $65,000 to $74,999 | 606 (9.5%) | 256 (4.3%) |
| $75,000 to $99,999 | 956 (15.0%) | 777 (13.0%) |
| $100,000+ | 1,847 (29.0%) | 763 (12.7%) |
| Total | 6,373 (100.0%) | 5,992 (100.0%) |
Earnings by Sex by Educational Attainment in Kapolei
Average earnings in Kapolei are $72,432 for men and $51,173 for women, a difference of 29.3%. Men with an educational attainment of graduate degree enjoy the highest average annual earnings of $120,234, while those with less than high school education earn the least with $33,750. Women with an educational attainment of graduate degree earn the most with the average annual earnings of $75,492, while those with high school diploma education have the smallest earnings of $37,917.
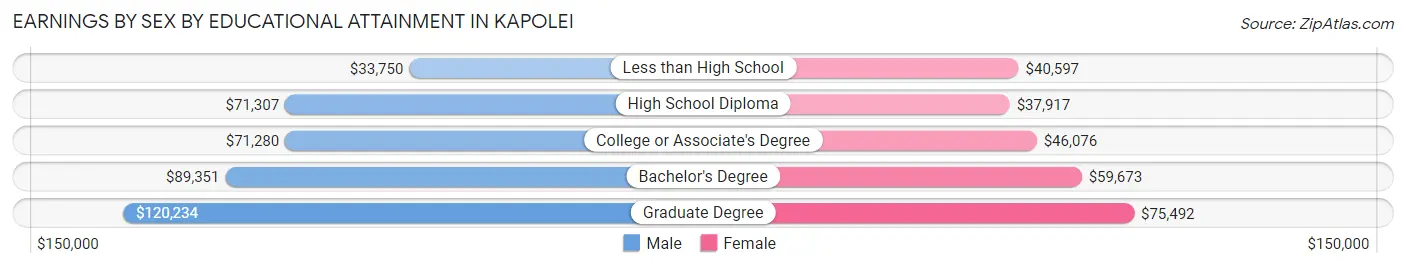
| Educational Attainment | Male Income | Female Income |
| Less than High School | $33,750 | $40,597 |
| High School Diploma | $71,307 | $37,917 |
| College or Associate's Degree | $71,280 | $46,076 |
| Bachelor's Degree | $89,351 | $59,673 |
| Graduate Degree | $120,234 | $75,492 |
| Total | $72,432 | $51,173 |
Family Income in Kapolei
Family Income Brackets in Kapolei
According to the Kapolei family income data, there are 1,692 families falling into the $100,000 to $149,999 income range, which is the most common income bracket and makes up 29.7% of all families. Conversely, the less than $10,000 income bracket is the least frequent group with only 57 families (1.0%) belonging to this category.
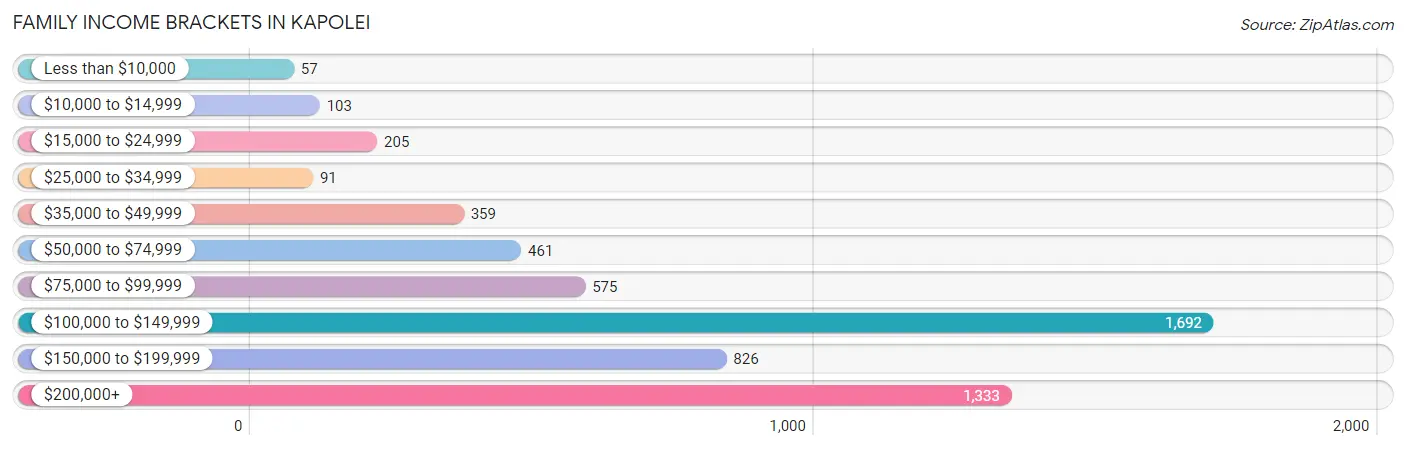
| Income Bracket | # Families | % Families |
| Less than $10,000 | 57 | 1.0% |
| $10,000 to $14,999 | 103 | 1.8% |
| $15,000 to $24,999 | 205 | 3.6% |
| $25,000 to $34,999 | 91 | 1.6% |
| $35,000 to $49,999 | 359 | 6.3% |
| $50,000 to $74,999 | 461 | 8.1% |
| $75,000 to $99,999 | 575 | 10.1% |
| $100,000 to $149,999 | 1,692 | 29.7% |
| $150,000 to $199,999 | 826 | 14.5% |
| $200,000+ | 1,333 | 23.4% |
Family Income by Famaliy Size in Kapolei
7+ person families (173 | 3.0%) account for the highest median family income in Kapolei with $217,625 per family, while 2-person families (1,847 | 32.4%) have the highest median income of $49,858 per family member.
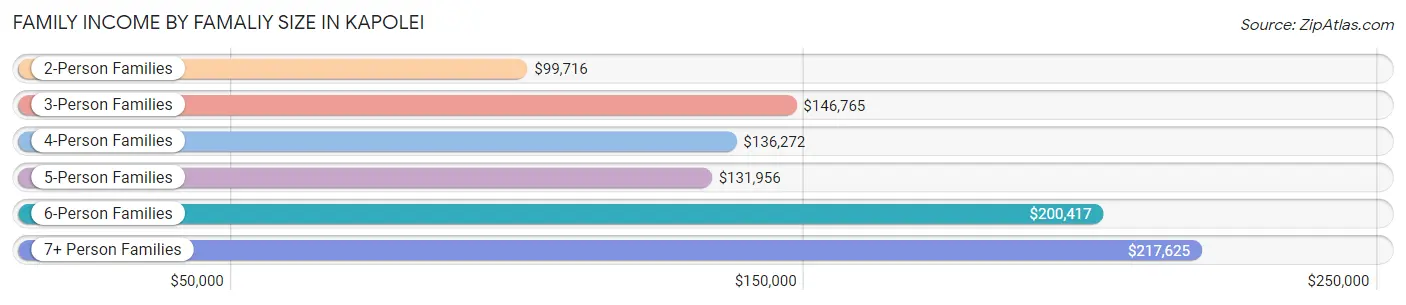
| Income Bracket | # Families | Median Income |
| 2-Person Families | 1,847 (32.4%) | $99,716 |
| 3-Person Families | 1,530 (26.9%) | $146,765 |
| 4-Person Families | 1,291 (22.7%) | $136,272 |
| 5-Person Families | 475 (8.3%) | $131,956 |
| 6-Person Families | 380 (6.7%) | $200,417 |
| 7+ Person Families | 173 (3.0%) | $217,625 |
| Total | 5,696 (100.0%) | $127,217 |
Family Income by Number of Earners in Kapolei
The median family income in Kapolei is $127,217, with families comprising 3+ earners (974) having the highest median family income of $194,167, while families with no earners (561) have the lowest median family income of $72,813, accounting for 17.1% and 9.9% of families, respectively.
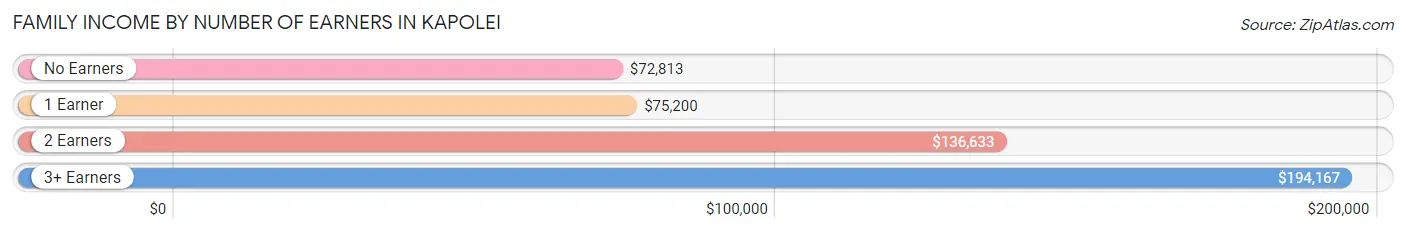
| Number of Earners | # Families | Median Income |
| No Earners | 561 (9.9%) | $72,813 |
| 1 Earner | 1,326 (23.3%) | $75,200 |
| 2 Earners | 2,835 (49.8%) | $136,633 |
| 3+ Earners | 974 (17.1%) | $194,167 |
| Total | 5,696 (100.0%) | $127,217 |
Household Income in Kapolei
Household Income Brackets in Kapolei
With 1,937 households falling in the category, the $100,000 to $149,999 income range is the most frequent in Kapolei, accounting for 27.9% of all households. In contrast, only 76 households (1.1%) fall into the less than $10,000 income bracket, making it the least populous group.
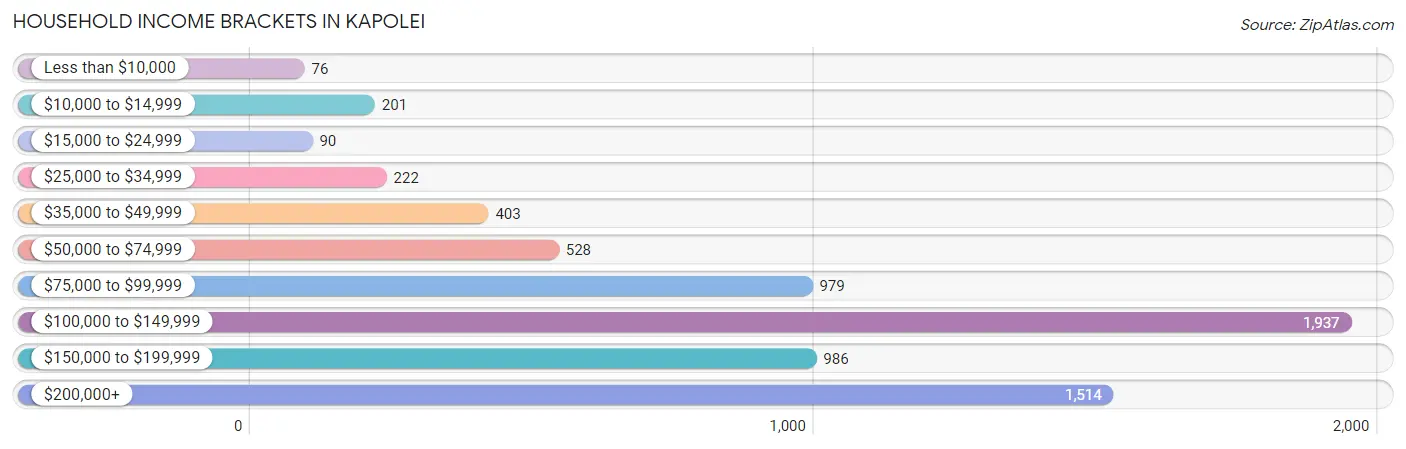
| Income Bracket | # Households | % Households |
| Less than $10,000 | 76 | 1.1% |
| $10,000 to $14,999 | 201 | 2.9% |
| $15,000 to $24,999 | 90 | 1.3% |
| $25,000 to $34,999 | 222 | 3.2% |
| $35,000 to $49,999 | 403 | 5.8% |
| $50,000 to $74,999 | 528 | 7.6% |
| $75,000 to $99,999 | 979 | 14.1% |
| $100,000 to $149,999 | 1,937 | 27.9% |
| $150,000 to $199,999 | 986 | 14.2% |
| $200,000+ | 1,514 | 21.8% |
Household Income by Householder Age in Kapolei
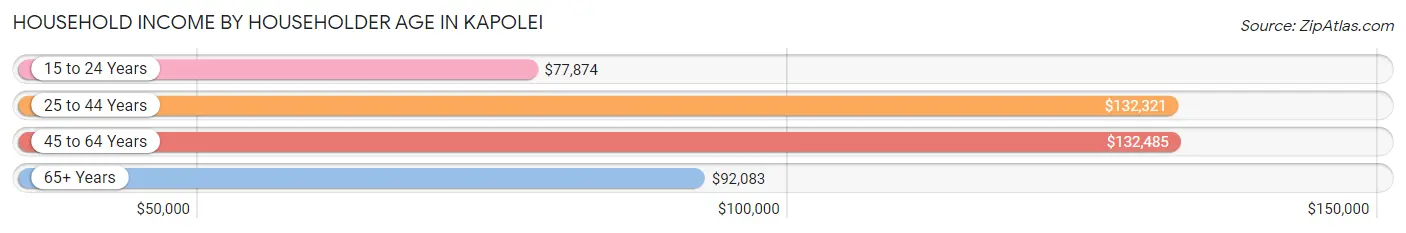
The median household income in Kapolei is $121,768, with the highest median household income of $132,485 found in the 45 to 64 years age bracket for the primary householder. A total of 2,491 households (35.9%) fall into this category. Meanwhile, the 15 to 24 years age bracket for the primary householder has the lowest median household income of $77,874, with 266 households (3.8%) in this group.
| Income Bracket | # Households | Median Income |
| 15 to 24 Years | 266 (3.8%) | $77,874 |
| 25 to 44 Years | 3,136 (45.2%) | $132,321 |
| 45 to 64 Years | 2,491 (35.9%) | $132,485 |
| 65+ Years | 1,051 (15.1%) | $92,083 |
| Total | 6,944 (100.0%) | $121,768 |
Poverty in Kapolei
Income Below Poverty by Sex and Age in Kapolei
With 6.7% poverty level for males and 8.9% for females among the residents of Kapolei, 6 to 11 year old males and under 5 year old females are the most vulnerable to poverty, with 223 males (16.0%) and 147 females (26.2%) in their respective age groups living below the poverty level.
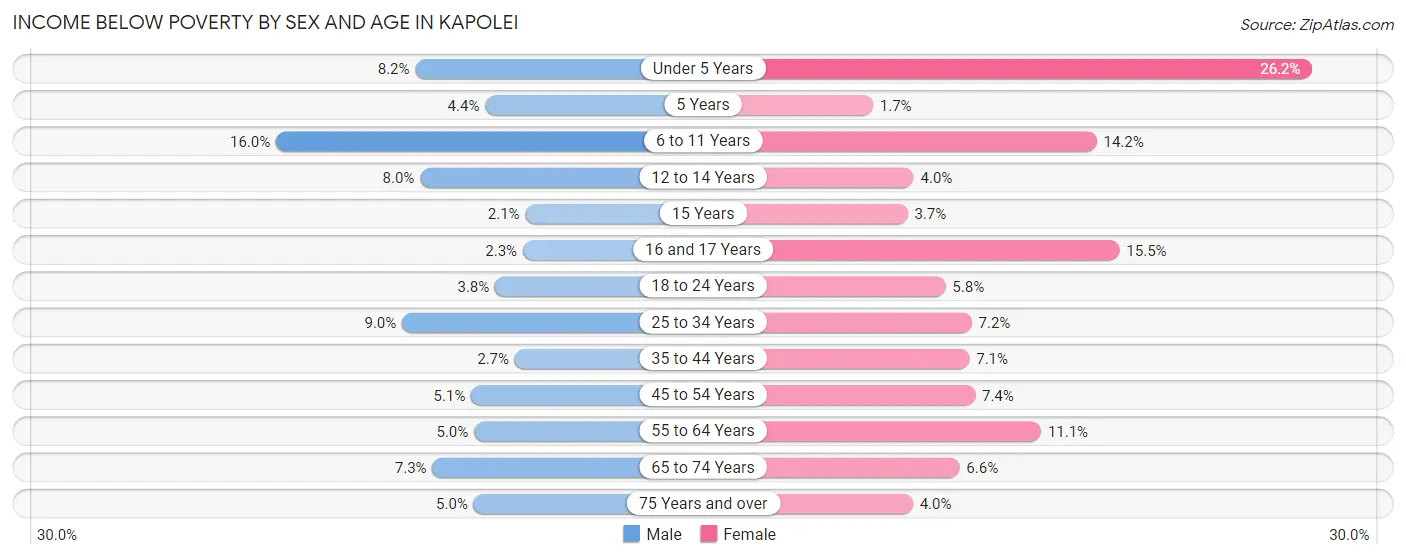
| Age Bracket | Male | Female |
| Under 5 Years | 67 (8.2%) | 147 (26.2%) |
| 5 Years | 7 (4.3%) | 5 (1.7%) |
| 6 to 11 Years | 223 (16.0%) | 189 (14.2%) |
| 12 to 14 Years | 31 (8.0%) | 15 (4.0%) |
| 15 Years | 5 (2.1%) | 3 (3.7%) |
| 16 and 17 Years | 8 (2.2%) | 30 (15.5%) |
| 18 to 24 Years | 42 (3.8%) | 49 (5.8%) |
| 25 to 34 Years | 131 (9.0%) | 130 (7.2%) |
| 35 to 44 Years | 52 (2.7%) | 130 (7.1%) |
| 45 to 54 Years | 54 (5.1%) | 101 (7.4%) |
| 55 to 64 Years | 69 (5.0%) | 126 (11.1%) |
| 65 to 74 Years | 38 (7.3%) | 44 (6.6%) |
| 75 Years and over | 18 (5.0%) | 27 (4.0%) |
| Total | 745 (6.7%) | 996 (8.9%) |
Income Above Poverty by Sex and Age in Kapolei
According to the poverty statistics in Kapolei, males aged 15 years and females aged 5 years are the age groups that are most secure financially, with 97.9% of males and 98.3% of females in these age groups living above the poverty line.
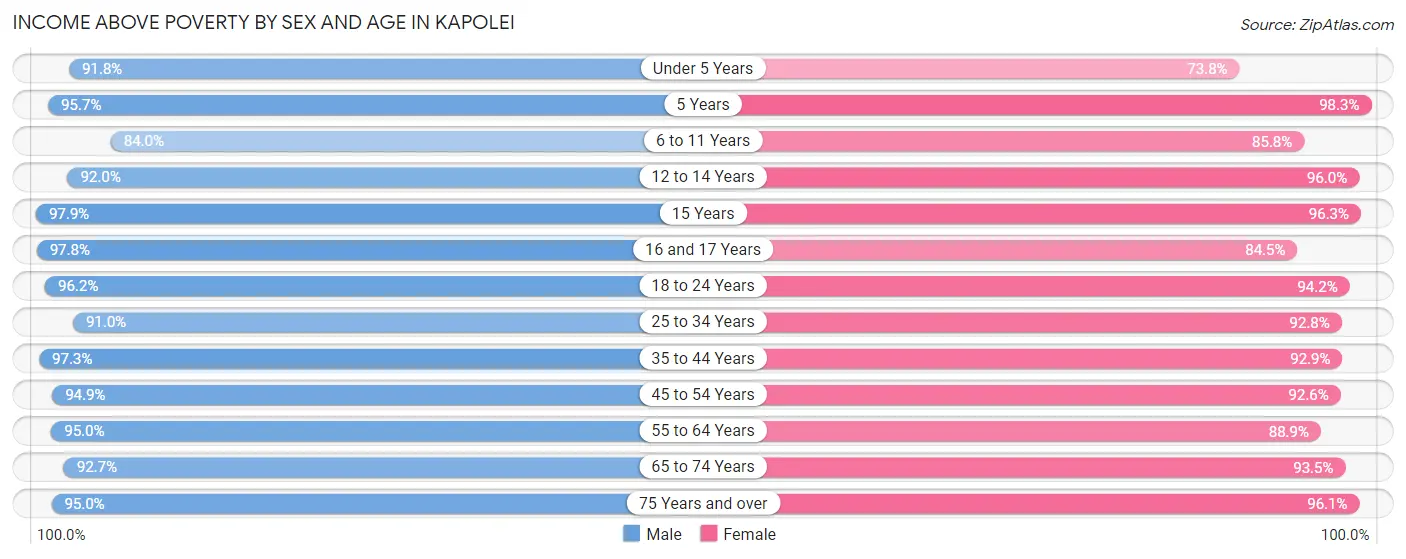
| Age Bracket | Male | Female |
| Under 5 Years | 746 (91.8%) | 414 (73.8%) |
| 5 Years | 154 (95.7%) | 284 (98.3%) |
| 6 to 11 Years | 1,171 (84.0%) | 1,143 (85.8%) |
| 12 to 14 Years | 358 (92.0%) | 360 (96.0%) |
| 15 Years | 232 (97.9%) | 79 (96.3%) |
| 16 and 17 Years | 348 (97.8%) | 164 (84.5%) |
| 18 to 24 Years | 1,063 (96.2%) | 800 (94.2%) |
| 25 to 34 Years | 1,328 (91.0%) | 1,668 (92.8%) |
| 35 to 44 Years | 1,871 (97.3%) | 1,702 (92.9%) |
| 45 to 54 Years | 998 (94.9%) | 1,261 (92.6%) |
| 55 to 64 Years | 1,318 (95.0%) | 1,010 (88.9%) |
| 65 to 74 Years | 483 (92.7%) | 628 (93.4%) |
| 75 Years and over | 343 (95.0%) | 657 (96.1%) |
| Total | 10,413 (93.3%) | 10,170 (91.1%) |
Income Below Poverty Among Married-Couple Families in Kapolei
The poverty statistics for married-couple families in Kapolei show that 3.7% or 166 of the total 4,432 families live below the poverty line. Families with 5 or more children have the highest poverty rate of 57.1%, comprising of 48 families. On the other hand, families with 1 or 2 children have the lowest poverty rate of 0.9%, which includes 17 families.
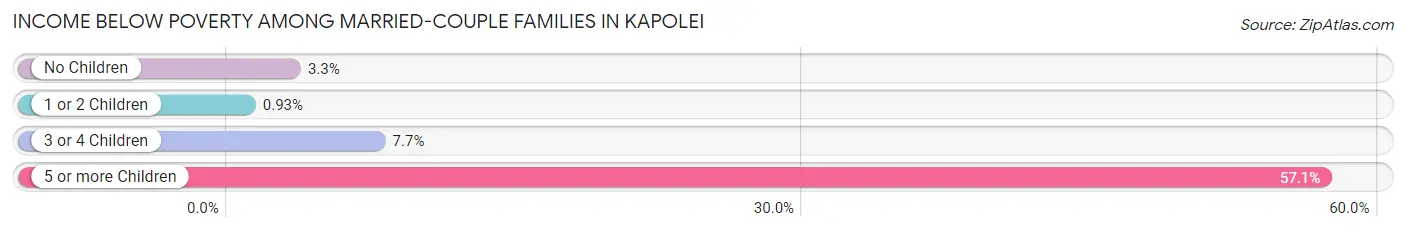
| Children | Above Poverty | Below Poverty |
| No Children | 2,030 (96.7%) | 69 (3.3%) |
| 1 or 2 Children | 1,817 (99.1%) | 17 (0.9%) |
| 3 or 4 Children | 383 (92.3%) | 32 (7.7%) |
| 5 or more Children | 36 (42.9%) | 48 (57.1%) |
| Total | 4,266 (96.3%) | 166 (3.7%) |
Income Below Poverty Among Single-Parent Households in Kapolei
According to the poverty data in Kapolei, 3.0% or 8 single-father households and 17.2% or 172 single-mother households are living below the poverty line. Among single-father households, those with 3 or 4 children have the highest poverty rate, with 3 households (30.0%) experiencing poverty. Likewise, among single-mother households, those with 5 or more children have the highest poverty rate, with 2 households (66.7%) falling below the poverty line.
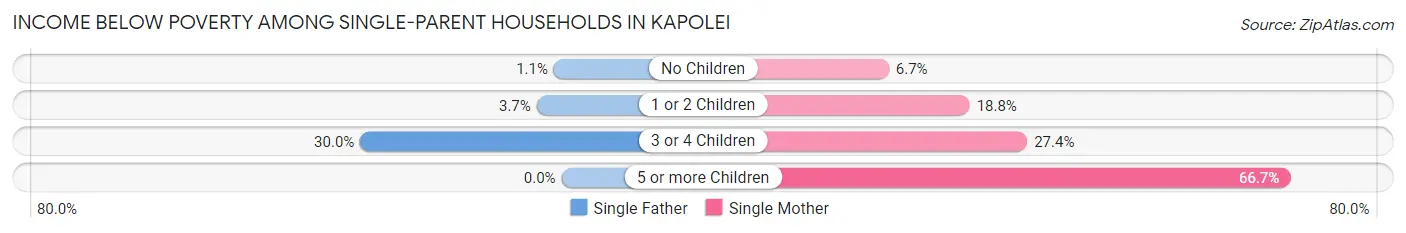
| Children | Single Father | Single Mother |
| No Children | 2 (1.1%) | 15 (6.7%) |
| 1 or 2 Children | 3 (3.7%) | 123 (18.8%) |
| 3 or 4 Children | 3 (30.0%) | 32 (27.4%) |
| 5 or more Children | 0 (0.0%) | 2 (66.7%) |
| Total | 8 (3.0%) | 172 (17.2%) |
Income Below Poverty Among Married-Couple vs Single-Parent Households in Kapolei
The poverty data for Kapolei shows that 166 of the married-couple family households (3.7%) and 180 of the single-parent households (14.2%) are living below the poverty level. Within the married-couple family households, those with 5 or more children have the highest poverty rate, with 48 households (57.1%) falling below the poverty line. Among the single-parent households, those with 5 or more children have the highest poverty rate, with 2 household (66.7%) living below poverty.
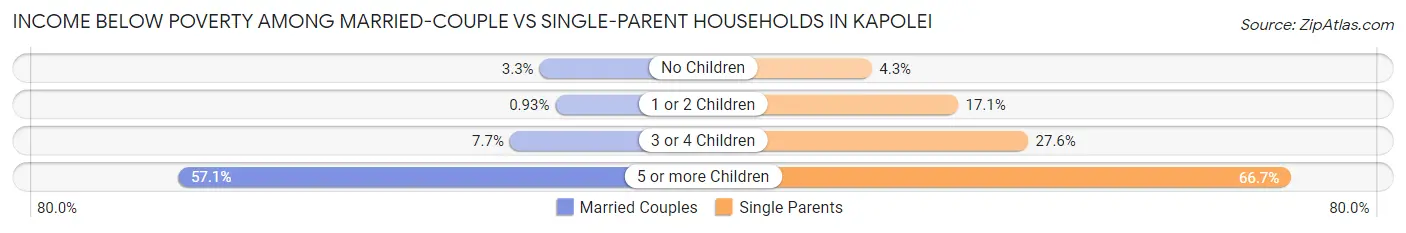
| Children | Married-Couple Families | Single-Parent Households |
| No Children | 69 (3.3%) | 17 (4.3%) |
| 1 or 2 Children | 17 (0.9%) | 126 (17.1%) |
| 3 or 4 Children | 32 (7.7%) | 35 (27.6%) |
| 5 or more Children | 48 (57.1%) | 2 (66.7%) |
| Total | 166 (3.7%) | 180 (14.2%) |
Race in Kapolei
The most populous races in Kapolei are Two or more Races (8,243 | 36.3%), Asian (6,903 | 30.4%), and Hispanic or Latino (3,454 | 15.2%).
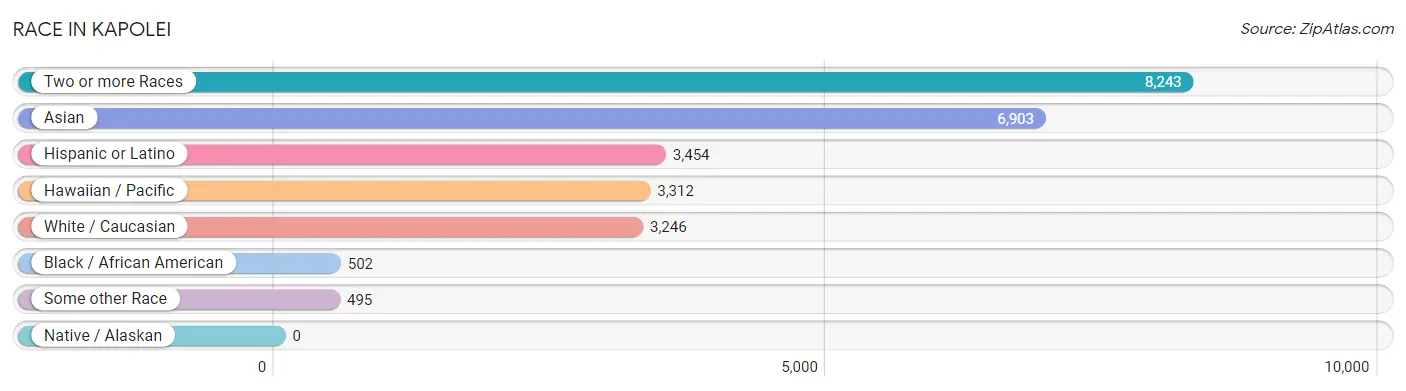
| Race | # Population | % Population |
| Asian | 6,903 | 30.4% |
| Black / African American | 502 | 2.2% |
| Hawaiian / Pacific | 3,312 | 14.6% |
| Hispanic or Latino | 3,454 | 15.2% |
| Native / Alaskan | 0 | 0.0% |
| White / Caucasian | 3,246 | 14.3% |
| Two or more Races | 8,243 | 36.3% |
| Some other Race | 495 | 2.2% |
| Total | 22,701 | 100.0% |
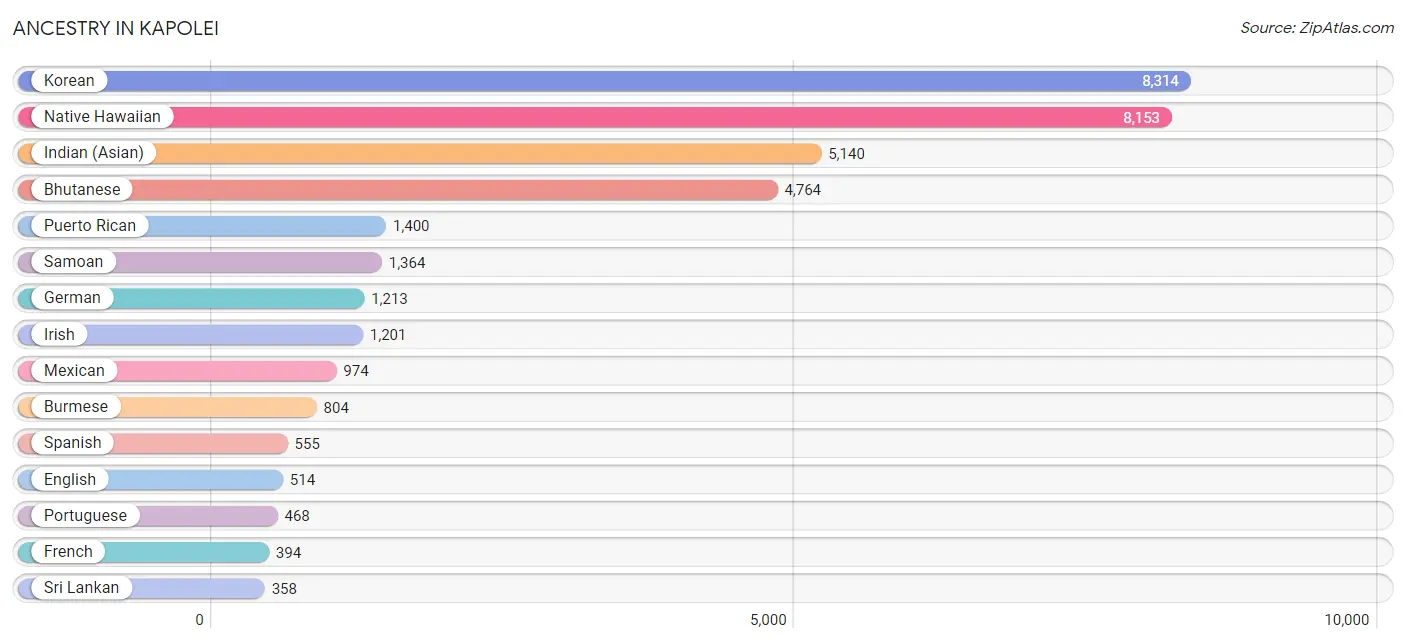
Ancestry in Kapolei
The most populous ancestries reported in Kapolei are Korean (8,314 | 36.6%), Native Hawaiian (8,153 | 35.9%), Indian (Asian) (5,140 | 22.6%), Bhutanese (4,764 | 21.0%), and Puerto Rican (1,400 | 6.2%), together accounting for 122.3% of all Kapolei residents.
| Ancestry | # Population | % Population |
| African | 78 | 0.3% |
| American | 356 | 1.6% |
| Apache | 10 | 0.0% |
| Arab | 24 | 0.1% |
| Australian | 2 | 0.0% |
| Austrian | 37 | 0.2% |
| Bhutanese | 4,764 | 21.0% |
| Blackfeet | 9 | 0.0% |
| British | 56 | 0.3% |
| Burmese | 804 | 3.5% |
| Canadian | 5 | 0.0% |
| Central American | 309 | 1.4% |
| Cherokee | 56 | 0.3% |
| Chinese | 226 | 1.0% |
| Cree | 8 | 0.0% |
| Creek | 6 | 0.0% |
| Cuban | 46 | 0.2% |
| Dutch | 133 | 0.6% |
| Ecuadorian | 30 | 0.1% |
| English | 514 | 2.3% |
| European | 90 | 0.4% |
| Fijian | 185 | 0.8% |
| Finnish | 22 | 0.1% |
| French | 394 | 1.7% |
| French American Indian | 10 | 0.0% |
| German | 1,213 | 5.3% |
| Ghanaian | 117 | 0.5% |
| Greek | 13 | 0.1% |
| Guamanian / Chamorro | 257 | 1.1% |
| Hungarian | 18 | 0.1% |
| Indian (Asian) | 5,140 | 22.6% |
| Irish | 1,201 | 5.3% |
| Iroquois | 17 | 0.1% |
| Italian | 336 | 1.5% |
| Jamaican | 102 | 0.4% |
| Korean | 8,314 | 36.6% |
| Lebanese | 24 | 0.1% |
| Lithuanian | 16 | 0.1% |
| Malaysian | 1 | 0.0% |
| Mexican | 974 | 4.3% |
| Native Hawaiian | 8,153 | 35.9% |
| Northern European | 2 | 0.0% |
| Norwegian | 122 | 0.5% |
| Okinawan | 37 | 0.2% |
| Pakistani | 178 | 0.8% |
| Polish | 89 | 0.4% |
| Portuguese | 468 | 2.1% |
| Puerto Rican | 1,400 | 6.2% |
| Romanian | 10 | 0.0% |
| Russian | 59 | 0.3% |
| Salvadoran | 309 | 1.4% |
| Samoan | 1,364 | 6.0% |
| Scandinavian | 78 | 0.3% |
| Scotch-Irish | 75 | 0.3% |
| Scottish | 62 | 0.3% |
| Seminole | 4 | 0.0% |
| South American | 30 | 0.1% |
| Spaniard | 92 | 0.4% |
| Spanish | 555 | 2.4% |
| Sri Lankan | 358 | 1.6% |
| Subsaharan African | 195 | 0.9% |
| Swedish | 33 | 0.2% |
| Swiss | 29 | 0.1% |
| Thai | 2 | 0.0% |
| Tongan | 164 | 0.7% |
| Ukrainian | 54 | 0.2% |
| Welsh | 73 | 0.3% | View All 67 Rows |
Immigrants in Kapolei
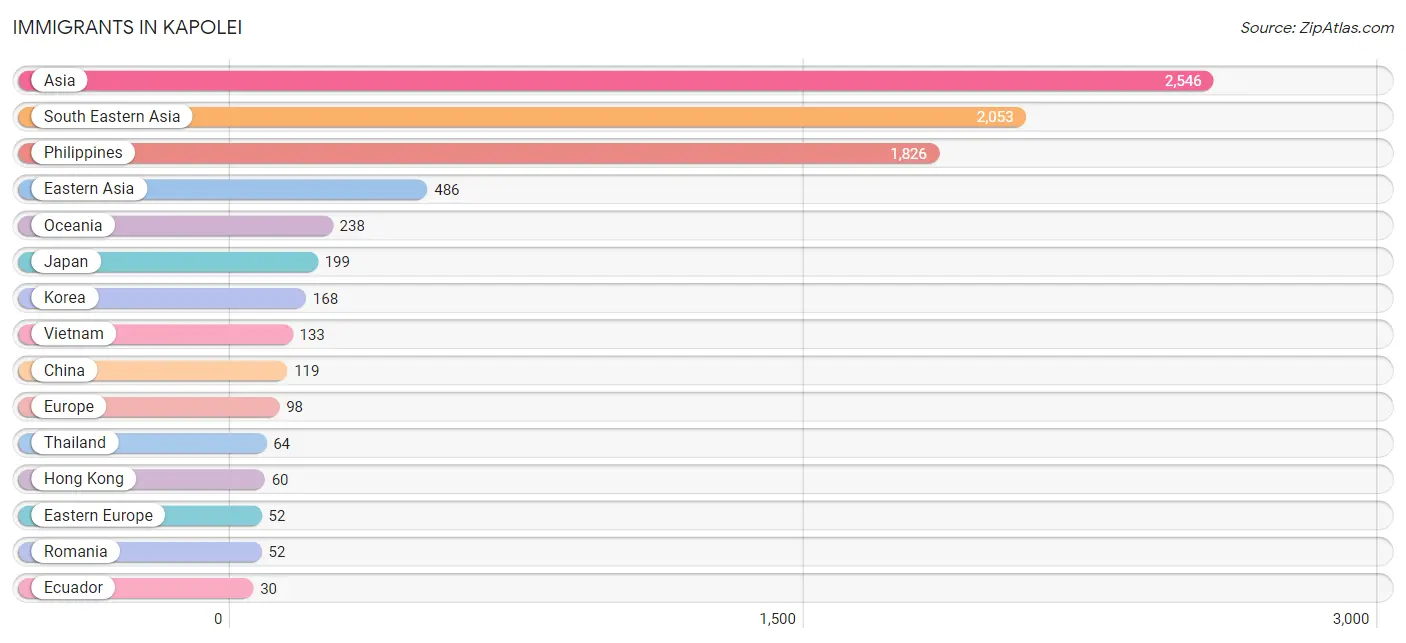
The most numerous immigrant groups reported in Kapolei came from Asia (2,546 | 11.2%), South Eastern Asia (2,053 | 9.0%), Philippines (1,826 | 8.0%), Eastern Asia (486 | 2.1%), and Oceania (238 | 1.1%), together accounting for 31.5% of all Kapolei residents.
| Immigration Origin | # Population | % Population |
| Africa | 5 | 0.0% |
| Asia | 2,546 | 11.2% |
| Australia | 4 | 0.0% |
| Canada | 15 | 0.1% |
| China | 119 | 0.5% |
| Eastern Asia | 486 | 2.1% |
| Eastern Europe | 52 | 0.2% |
| Ecuador | 30 | 0.1% |
| Egypt | 5 | 0.0% |
| England | 3 | 0.0% |
| Europe | 98 | 0.4% |
| Germany | 4 | 0.0% |
| Hong Kong | 60 | 0.3% |
| Indonesia | 10 | 0.0% |
| Iran | 7 | 0.0% |
| Italy | 17 | 0.1% |
| Japan | 199 | 0.9% |
| Korea | 168 | 0.7% |
| Latin America | 30 | 0.1% |
| Malaysia | 2 | 0.0% |
| Micronesia | 5 | 0.0% |
| Northern Africa | 5 | 0.0% |
| Northern Europe | 25 | 0.1% |
| Oceania | 238 | 1.1% |
| Philippines | 1,826 | 8.0% |
| Romania | 52 | 0.2% |
| Singapore | 18 | 0.1% |
| South America | 30 | 0.1% |
| South Central Asia | 7 | 0.0% |
| South Eastern Asia | 2,053 | 9.0% |
| Southern Europe | 17 | 0.1% |
| Sweden | 15 | 0.1% |
| Taiwan | 11 | 0.1% |
| Thailand | 64 | 0.3% |
| Vietnam | 133 | 0.6% |
| Western Europe | 4 | 0.0% | View All 36 Rows |
Sex and Age in Kapolei
Sex and Age in Kapolei
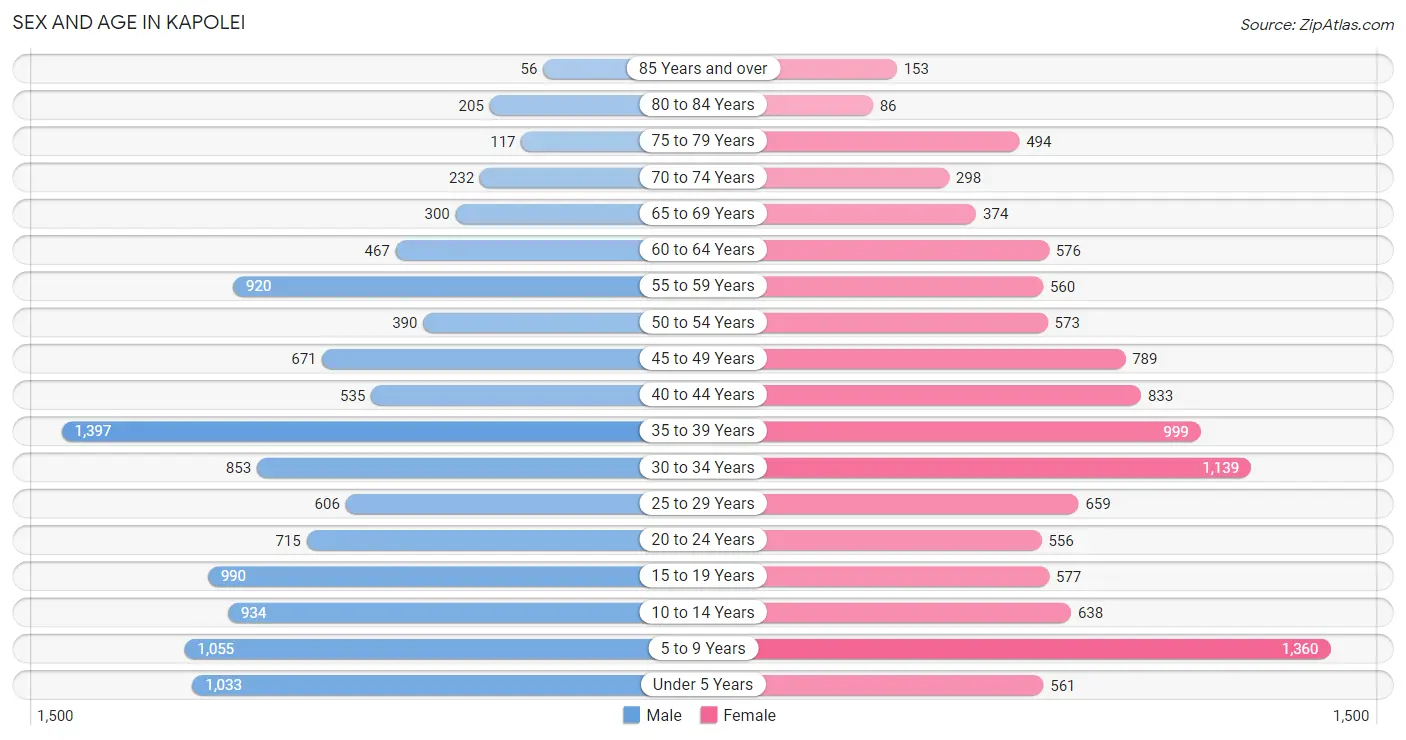
The most populous age groups in Kapolei are 35 to 39 Years (1,397 | 12.2%) for men and 5 to 9 Years (1,360 | 12.1%) for women.
| Age Bracket | Male | Female |
| Under 5 Years | 1,033 (9.0%) | 561 (5.0%) |
| 5 to 9 Years | 1,055 (9.2%) | 1,360 (12.1%) |
| 10 to 14 Years | 934 (8.1%) | 638 (5.7%) |
| 15 to 19 Years | 990 (8.6%) | 577 (5.1%) |
| 20 to 24 Years | 715 (6.2%) | 556 (5.0%) |
| 25 to 29 Years | 606 (5.3%) | 659 (5.9%) |
| 30 to 34 Years | 853 (7.4%) | 1,139 (10.2%) |
| 35 to 39 Years | 1,397 (12.2%) | 999 (8.9%) |
| 40 to 44 Years | 535 (4.7%) | 833 (7.4%) |
| 45 to 49 Years | 671 (5.9%) | 789 (7.0%) |
| 50 to 54 Years | 390 (3.4%) | 573 (5.1%) |
| 55 to 59 Years | 920 (8.0%) | 560 (5.0%) |
| 60 to 64 Years | 467 (4.1%) | 576 (5.1%) |
| 65 to 69 Years | 300 (2.6%) | 374 (3.3%) |
| 70 to 74 Years | 232 (2.0%) | 298 (2.6%) |
| 75 to 79 Years | 117 (1.0%) | 494 (4.4%) |
| 80 to 84 Years | 205 (1.8%) | 86 (0.8%) |
| 85 Years and over | 56 (0.5%) | 153 (1.4%) |
| Total | 11,476 (100.0%) | 11,225 (100.0%) |
Families and Households in Kapolei
Median Family Size in Kapolei
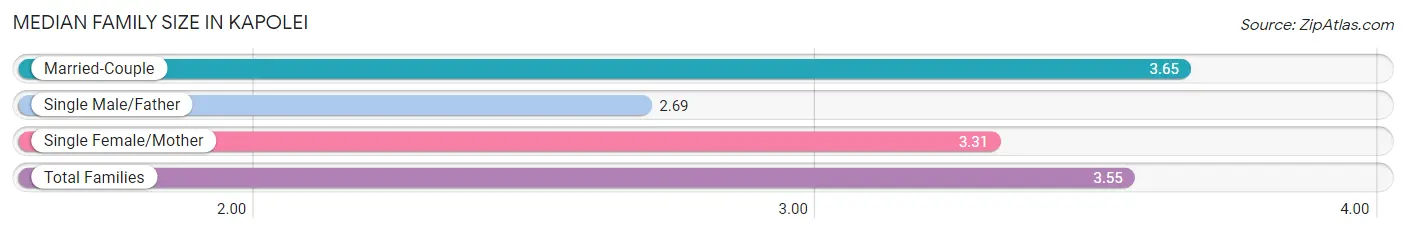
The median family size in Kapolei is 3.55 persons per family, with married-couple families (4,432 | 77.8%) accounting for the largest median family size of 3.65 persons per family. On the other hand, single male/father families (266 | 4.7%) represent the smallest median family size with 2.69 persons per family.
| Family Type | # Families | Family Size |
| Married-Couple | 4,432 (77.8%) | 3.65 |
| Single Male/Father | 266 (4.7%) | 2.69 |
| Single Female/Mother | 998 (17.5%) | 3.31 |
| Total Families | 5,696 (100.0%) | 3.55 |
Median Household Size in Kapolei
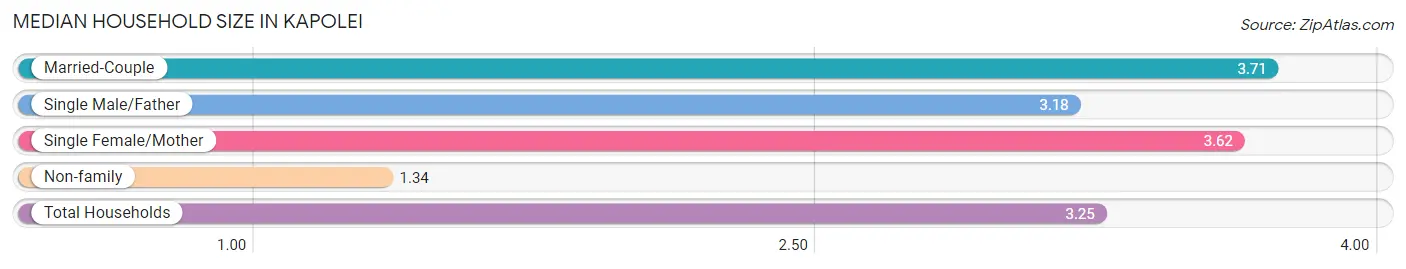
The median household size in Kapolei is 3.25 persons per household, with married-couple households (4,432 | 63.8%) accounting for the largest median household size of 3.71 persons per household. non-family households (1,248 | 18.0%) represent the smallest median household size with 1.34 persons per household.
| Household Type | # Households | Household Size |
| Married-Couple | 4,432 (63.8%) | 3.71 |
| Single Male/Father | 266 (3.8%) | 3.18 |
| Single Female/Mother | 998 (14.4%) | 3.62 |
| Non-family | 1,248 (18.0%) | 1.34 |
| Total Households | 6,944 (100.0%) | 3.25 |
Household Size by Marriage Status in Kapolei
Out of a total of 6,944 households in Kapolei, 5,696 (82.0%) are family households, while 1,248 (18.0%) are nonfamily households. The most numerous type of family households are 3-person households, comprising 1,721, and the most common type of nonfamily households are 1-person households, comprising 1,003.
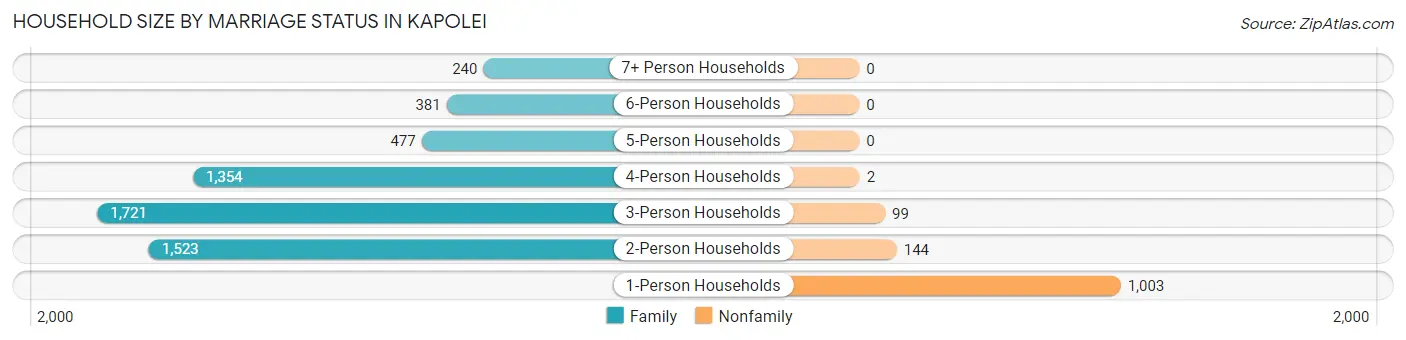
| Household Size | Family Households | Nonfamily Households |
| 1-Person Households | - | 1,003 (14.4%) |
| 2-Person Households | 1,523 (21.9%) | 144 (2.1%) |
| 3-Person Households | 1,721 (24.8%) | 99 (1.4%) |
| 4-Person Households | 1,354 (19.5%) | 2 (0.0%) |
| 5-Person Households | 477 (6.9%) | 0 (0.0%) |
| 6-Person Households | 381 (5.5%) | 0 (0.0%) |
| 7+ Person Households | 240 (3.5%) | 0 (0.0%) |
| Total | 5,696 (82.0%) | 1,248 (18.0%) |
Female Fertility in Kapolei
Fertility by Age in Kapolei
Average fertility rate in Kapolei is 61.0 births per 1,000 women. Women in the age bracket of 20 to 34 years have the highest fertility rate with 68.0 births per 1,000 women. Women in the age bracket of 35 to 50 years acount for 52.3% of all women with births.
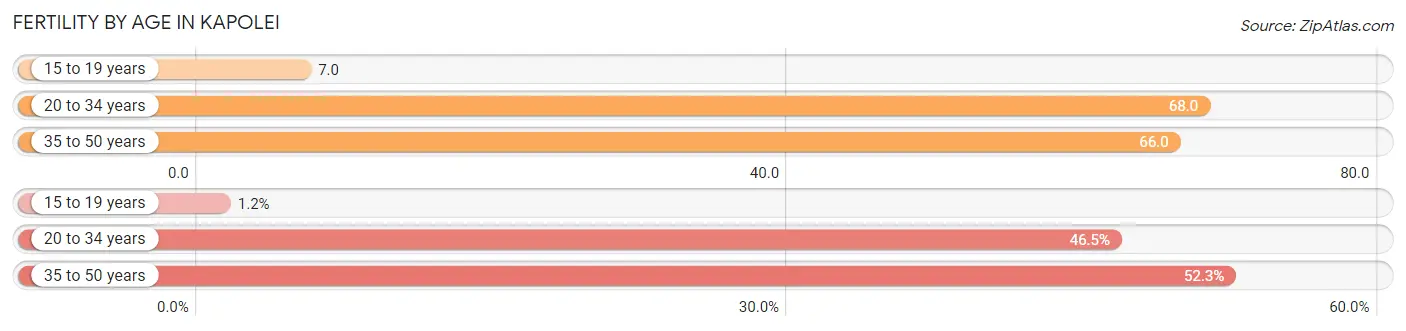
| Age Bracket | Women with Births | Births / 1,000 Women |
| 15 to 19 years | 4 (1.2%) | 7.0 |
| 20 to 34 years | 160 (46.5%) | 68.0 |
| 35 to 50 years | 180 (52.3%) | 66.0 |
| Total | 344 (100.0%) | 61.0 |
Fertility by Age by Marriage Status in Kapolei
81.1% of women with births (344) in Kapolei are married. The highest percentage of unmarried women with births falls into 15 to 19 years age bracket with 100.0% of them unmarried at the time of birth, while the lowest percentage of unmarried women with births belong to 35 to 50 years age bracket with 13.3% of them unmarried.
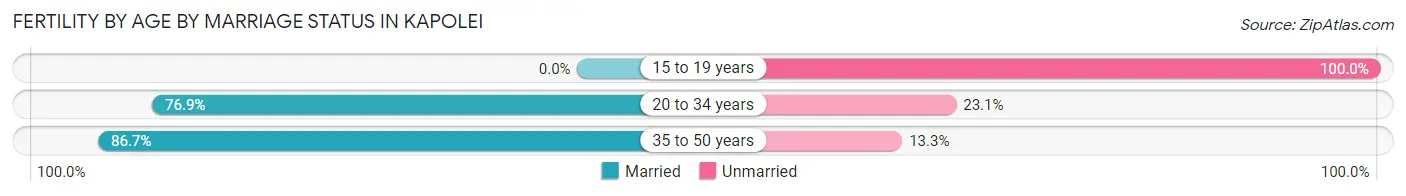
| Age Bracket | Married | Unmarried |
| 15 to 19 years | 0 (0.0%) | 4 (100.0%) |
| 20 to 34 years | 123 (76.9%) | 37 (23.1%) |
| 35 to 50 years | 156 (86.7%) | 24 (13.3%) |
| Total | 279 (81.1%) | 65 (18.9%) |
Fertility by Education in Kapolei
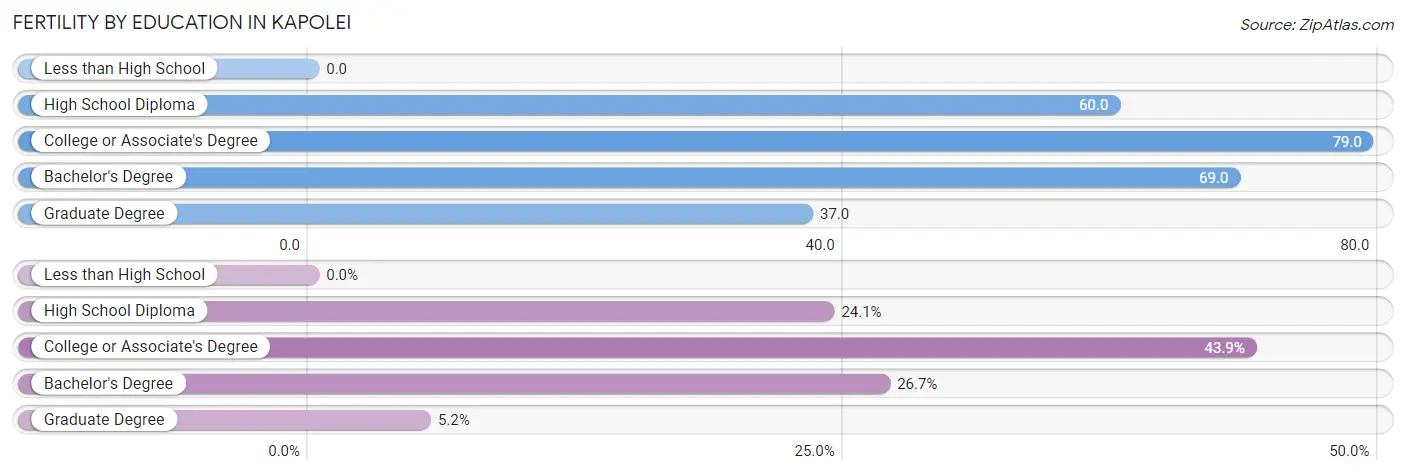
| Educational Attainment | Women with Births | Births / 1,000 Women |
| Less than High School | 0 (0.0%) | 0.0 |
| High School Diploma | 83 (24.1%) | 60.0 |
| College or Associate's Degree | 151 (43.9%) | 79.0 |
| Bachelor's Degree | 92 (26.7%) | 69.0 |
| Graduate Degree | 18 (5.2%) | 37.0 |
| Total | 344 (100.0%) | 61.0 |
Fertility by Education by Marriage Status in Kapolei
18.9% of women with births in Kapolei are unmarried. Women with the educational attainment of bachelor's degree are most likely to be married with 100.0% of them married at childbirth, while women with the educational attainment of high school diploma are least likely to be married with 34.9% of them unmarried at childbirth.
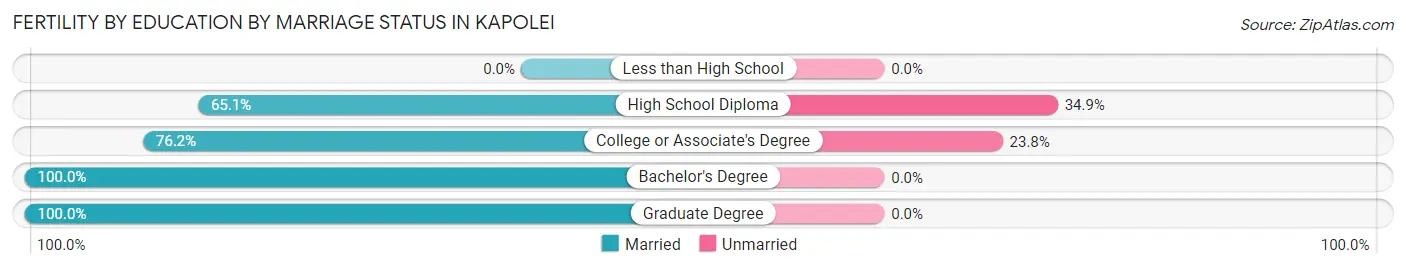
| Educational Attainment | Married | Unmarried |
| Less than High School | 0 (0.0%) | 0 (0.0%) |
| High School Diploma | 54 (65.1%) | 29 (34.9%) |
| College or Associate's Degree | 115 (76.2%) | 36 (23.8%) |
| Bachelor's Degree | 92 (100.0%) | 0 (0.0%) |
| Graduate Degree | 18 (100.0%) | 0 (0.0%) |
| Total | 279 (81.1%) | 65 (18.9%) |
Employment Characteristics in Kapolei
Employment by Class of Employer in Kapolei
Among the 11,292 employed individuals in Kapolei, private company employees (6,198 | 54.9%), federal government employees (2,195 | 19.4%), and not-for-profit organizations (934 | 8.3%) make up the most common classes of employment.
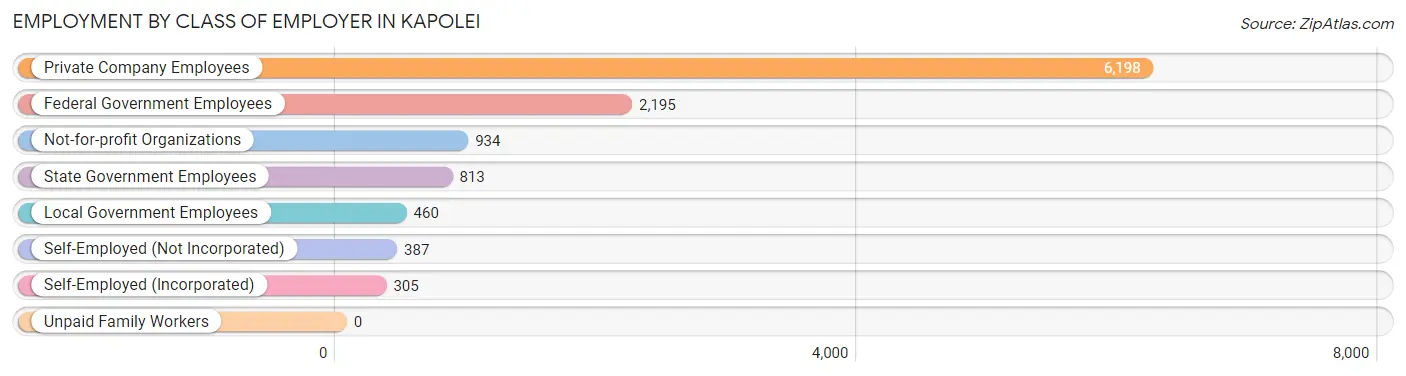
| Employer Class | # Employees | % Employees |
| Private Company Employees | 6,198 | 54.9% |
| Self-Employed (Incorporated) | 305 | 2.7% |
| Self-Employed (Not Incorporated) | 387 | 3.4% |
| Not-for-profit Organizations | 934 | 8.3% |
| Local Government Employees | 460 | 4.1% |
| State Government Employees | 813 | 7.2% |
| Federal Government Employees | 2,195 | 19.4% |
| Unpaid Family Workers | 0 | 0.0% |
| Total | 11,292 | 100.0% |
Employment Status by Age in Kapolei
According to the labor force statistics for Kapolei, out of the total population over 16 years of age (16,801), 72.4% or 12,164 individuals are in the labor force, with 5.6% or 681 of them unemployed. The age group with the highest labor force participation rate is 30 to 34 years, with 94.1% or 1,874 individuals in the labor force. Within the labor force, the 75 years and over age range has the highest percentage of unemployed individuals, with 60.9% or 28 of them being unemployed.
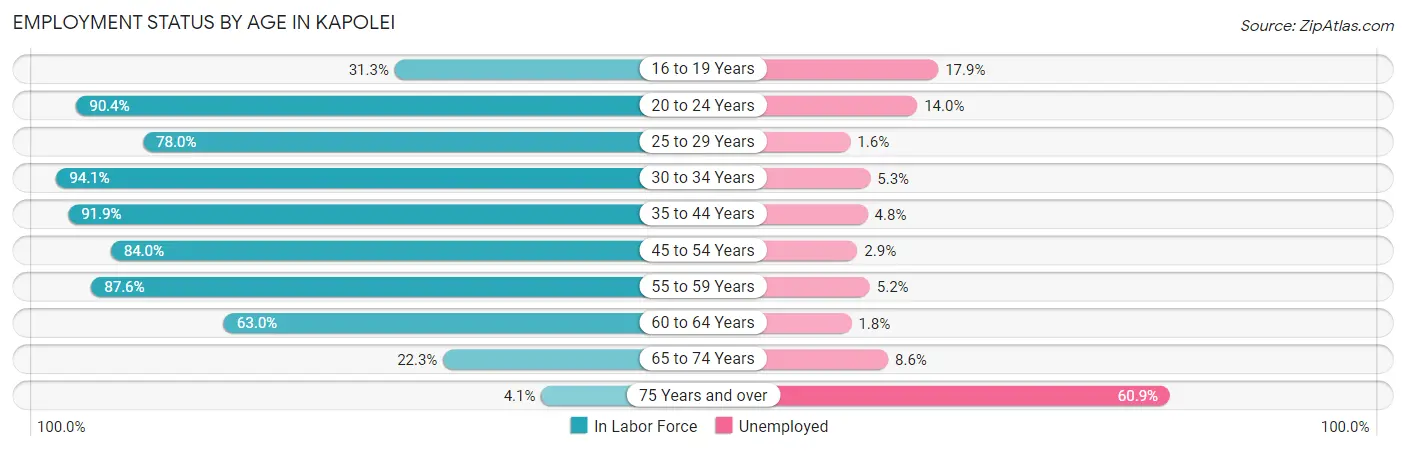
| Age Bracket | In Labor Force | Unemployed |
| 16 to 19 Years | 391 (31.3%) | 70 (17.9%) |
| 20 to 24 Years | 1,149 (90.4%) | 161 (14.0%) |
| 25 to 29 Years | 987 (78.0%) | 16 (1.6%) |
| 30 to 34 Years | 1,874 (94.1%) | 99 (5.3%) |
| 35 to 44 Years | 3,459 (91.9%) | 166 (4.8%) |
| 45 to 54 Years | 2,035 (84.0%) | 59 (2.9%) |
| 55 to 59 Years | 1,296 (87.6%) | 67 (5.2%) |
| 60 to 64 Years | 657 (63.0%) | 12 (1.8%) |
| 65 to 74 Years | 268 (22.3%) | 23 (8.6%) |
| 75 Years and over | 46 (4.1%) | 28 (60.9%) |
| Total | 12,164 (72.4%) | 681 (5.6%) |
Employment Status by Educational Attainment in Kapolei
According to labor force statistics for Kapolei, 86.1% of individuals (10,304) out of the total population between 25 and 64 years of age (11,967) are in the labor force, with 4.0% or 412 of them being unemployed. The group with the highest labor force participation rate are those with the educational attainment of bachelor's degree or higher, with 93.2% or 3,524 individuals in the labor force. Within the labor force, individuals with less than high school education have the highest percentage of unemployment, with 9.6% or 30 of them being unemployed.
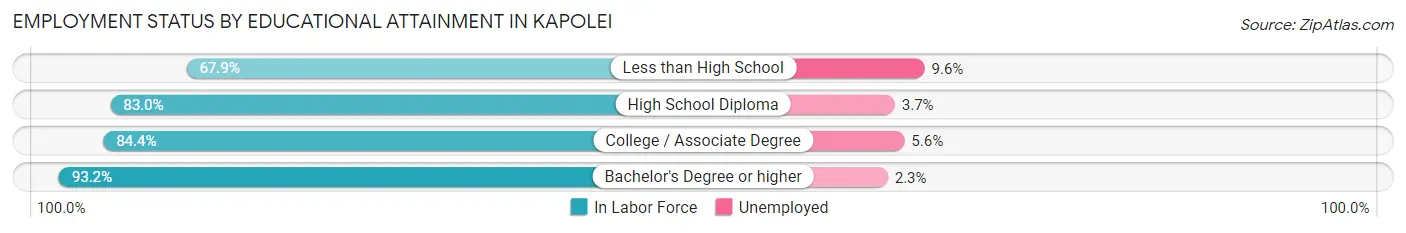
| Educational Attainment | In Labor Force | Unemployed |
| Less than High School | 311 (67.9%) | 44 (9.6%) |
| High School Diploma | 3,016 (83.0%) | 134 (3.7%) |
| College / Associate Degree | 3,455 (84.4%) | 229 (5.6%) |
| Bachelor's Degree or higher | 3,524 (93.2%) | 87 (2.3%) |
| Total | 10,304 (86.1%) | 479 (4.0%) |
Employment Occupations by Sex in Kapolei
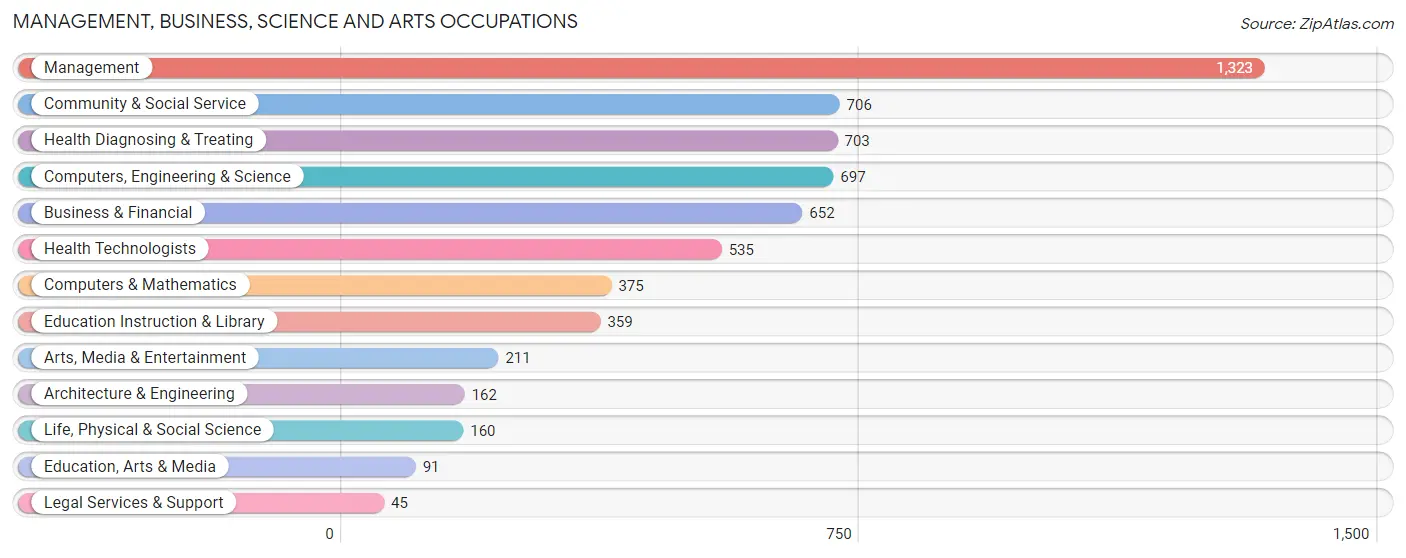
Management, Business, Science and Arts Occupations
The most common Management, Business, Science and Arts occupations in Kapolei are Management (1,323 | 12.5%), Community & Social Service (706 | 6.7%), Health Diagnosing & Treating (703 | 6.6%), Computers, Engineering & Science (697 | 6.6%), and Business & Financial (652 | 6.2%).
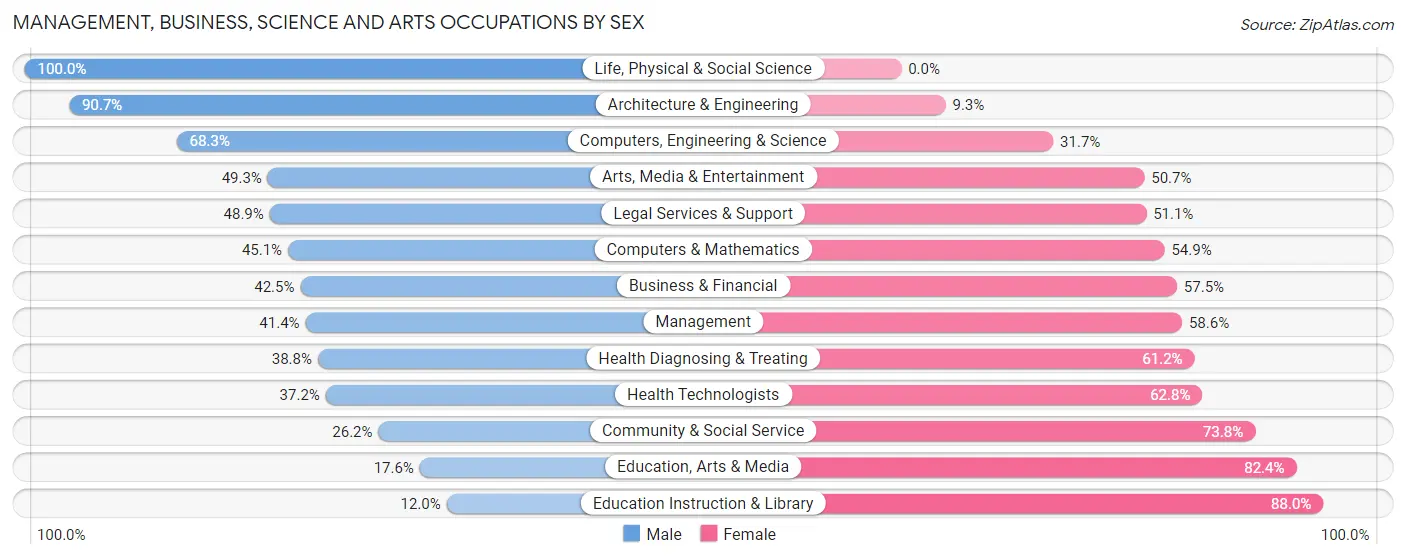
Management, Business, Science and Arts Occupations by Sex
Within the Management, Business, Science and Arts occupations in Kapolei, the most male-oriented occupations are Life, Physical & Social Science (100.0%), Architecture & Engineering (90.7%), and Computers, Engineering & Science (68.3%), while the most female-oriented occupations are Education Instruction & Library (88.0%), Education, Arts & Media (82.4%), and Community & Social Service (73.8%).
| Occupation | Male | Female |
| Management | 548 (41.4%) | 775 (58.6%) |
| Business & Financial | 277 (42.5%) | 375 (57.5%) |
| Computers, Engineering & Science | 476 (68.3%) | 221 (31.7%) |
| Computers & Mathematics | 169 (45.1%) | 206 (54.9%) |
| Architecture & Engineering | 147 (90.7%) | 15 (9.3%) |
| Life, Physical & Social Science | 160 (100.0%) | 0 (0.0%) |
| Community & Social Service | 185 (26.2%) | 521 (73.8%) |
| Education, Arts & Media | 16 (17.6%) | 75 (82.4%) |
| Legal Services & Support | 22 (48.9%) | 23 (51.1%) |
| Education Instruction & Library | 43 (12.0%) | 316 (88.0%) |
| Arts, Media & Entertainment | 104 (49.3%) | 107 (50.7%) |
| Health Diagnosing & Treating | 273 (38.8%) | 430 (61.2%) |
| Health Technologists | 199 (37.2%) | 336 (62.8%) |
| Total (Category) | 1,759 (43.1%) | 2,322 (56.9%) |
| Total (Overall) | 5,268 (49.7%) | 5,320 (50.2%) |
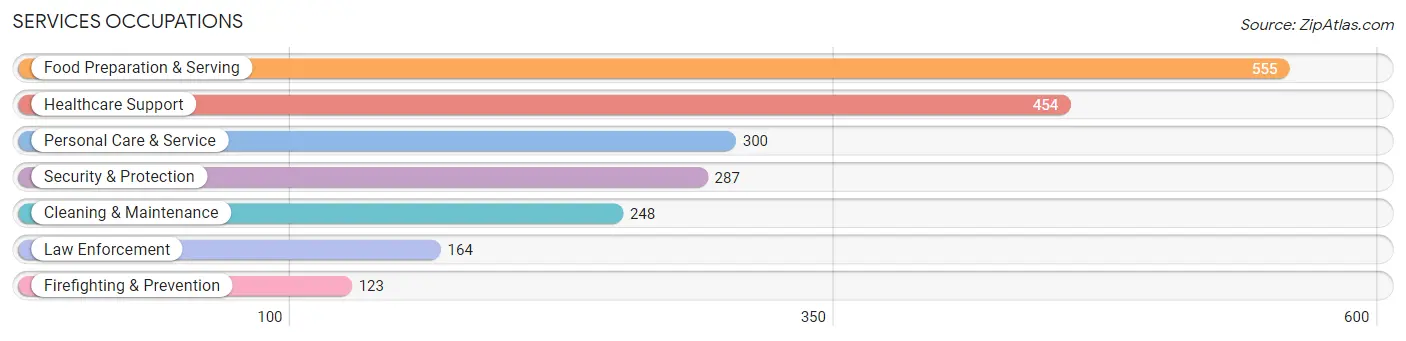
Services Occupations
The most common Services occupations in Kapolei are Food Preparation & Serving (555 | 5.2%), Healthcare Support (454 | 4.3%), Personal Care & Service (300 | 2.8%), Security & Protection (287 | 2.7%), and Cleaning & Maintenance (248 | 2.3%).
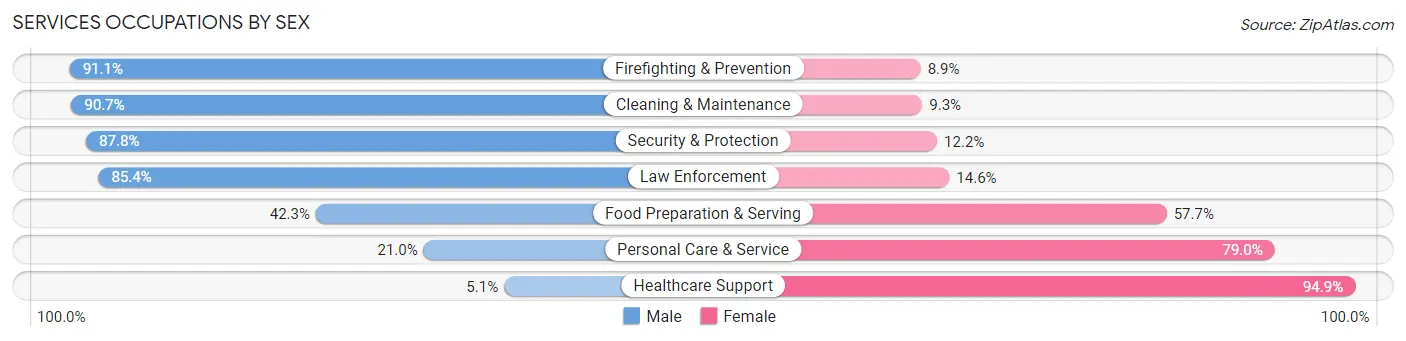
Services Occupations by Sex
Within the Services occupations in Kapolei, the most male-oriented occupations are Firefighting & Prevention (91.1%), Cleaning & Maintenance (90.7%), and Security & Protection (87.8%), while the most female-oriented occupations are Healthcare Support (94.9%), Personal Care & Service (79.0%), and Food Preparation & Serving (57.7%).
| Occupation | Male | Female |
| Healthcare Support | 23 (5.1%) | 431 (94.9%) |
| Security & Protection | 252 (87.8%) | 35 (12.2%) |
| Firefighting & Prevention | 112 (91.1%) | 11 (8.9%) |
| Law Enforcement | 140 (85.4%) | 24 (14.6%) |
| Food Preparation & Serving | 235 (42.3%) | 320 (57.7%) |
| Cleaning & Maintenance | 225 (90.7%) | 23 (9.3%) |
| Personal Care & Service | 63 (21.0%) | 237 (79.0%) |
| Total (Category) | 798 (43.3%) | 1,046 (56.7%) |
| Total (Overall) | 5,268 (49.7%) | 5,320 (50.2%) |
Sales and Office Occupations
The most common Sales and Office occupations in Kapolei are Office & Administration (1,366 | 12.9%), and Sales & Related (873 | 8.3%).
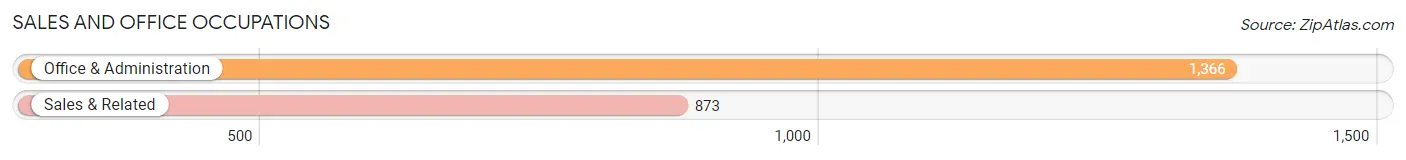
Sales and Office Occupations by Sex
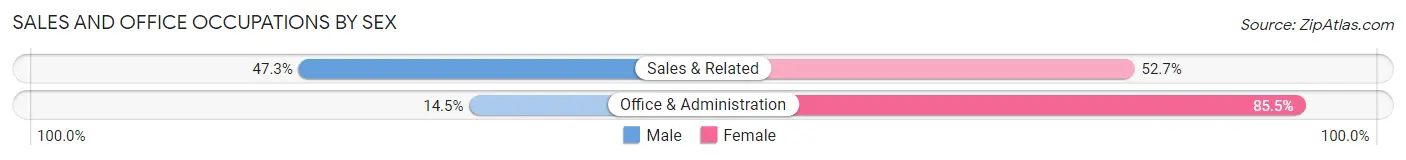
| Occupation | Male | Female |
| Sales & Related | 413 (47.3%) | 460 (52.7%) |
| Office & Administration | 198 (14.5%) | 1,168 (85.5%) |
| Total (Category) | 611 (27.3%) | 1,628 (72.7%) |
| Total (Overall) | 5,268 (49.7%) | 5,320 (50.2%) |
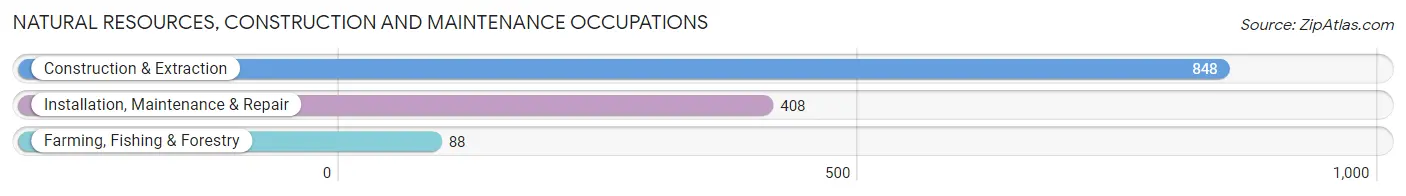
Natural Resources, Construction and Maintenance Occupations
The most common Natural Resources, Construction and Maintenance occupations in Kapolei are Construction & Extraction (848 | 8.0%), Installation, Maintenance & Repair (408 | 3.8%), and Farming, Fishing & Forestry (88 | 0.8%).
Natural Resources, Construction and Maintenance Occupations by Sex
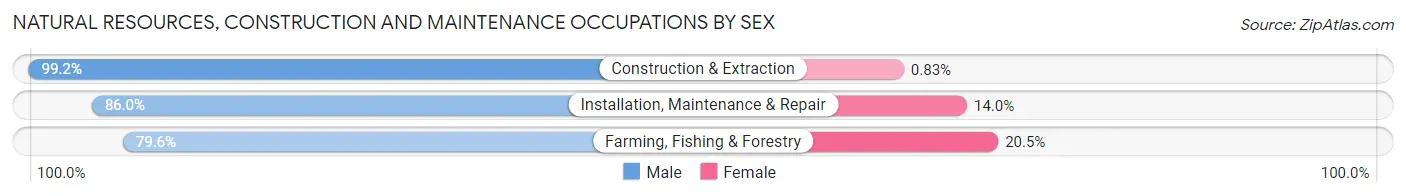
| Occupation | Male | Female |
| Farming, Fishing & Forestry | 70 (79.5%) | 18 (20.4%) |
| Construction & Extraction | 841 (99.2%) | 7 (0.8%) |
| Installation, Maintenance & Repair | 351 (86.0%) | 57 (14.0%) |
| Total (Category) | 1,262 (93.9%) | 82 (6.1%) |
| Total (Overall) | 5,268 (49.7%) | 5,320 (50.2%) |
Production, Transportation and Moving Occupations
The most common Production, Transportation and Moving occupations in Kapolei are Transportation (510 | 4.8%), Material Moving (336 | 3.2%), and Production (234 | 2.2%).
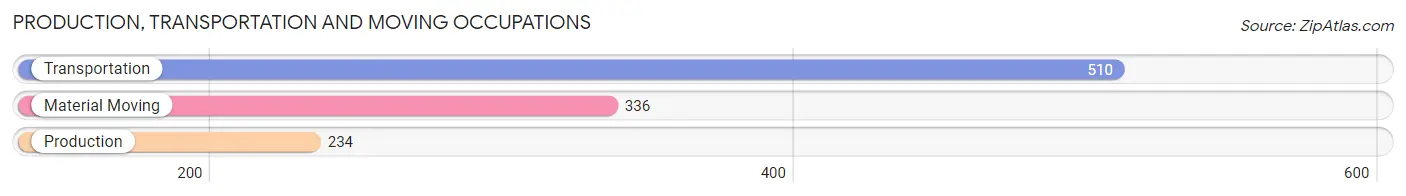
Production, Transportation and Moving Occupations by Sex
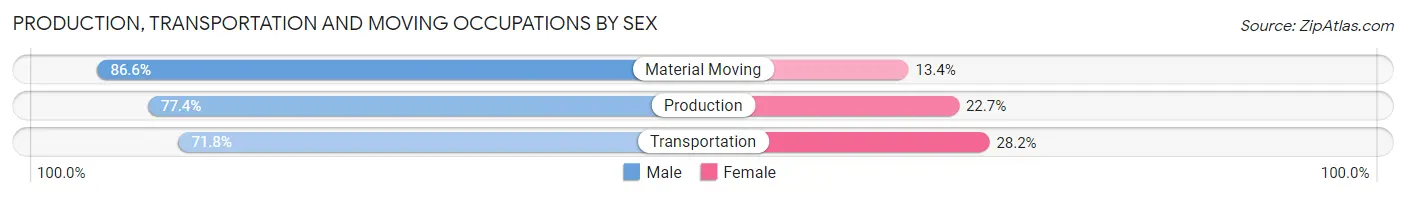
| Occupation | Male | Female |
| Production | 181 (77.3%) | 53 (22.7%) |
| Transportation | 366 (71.8%) | 144 (28.2%) |
| Material Moving | 291 (86.6%) | 45 (13.4%) |
| Total (Category) | 838 (77.6%) | 242 (22.4%) |
| Total (Overall) | 5,268 (49.7%) | 5,320 (50.2%) |
Employment Industries by Sex in Kapolei
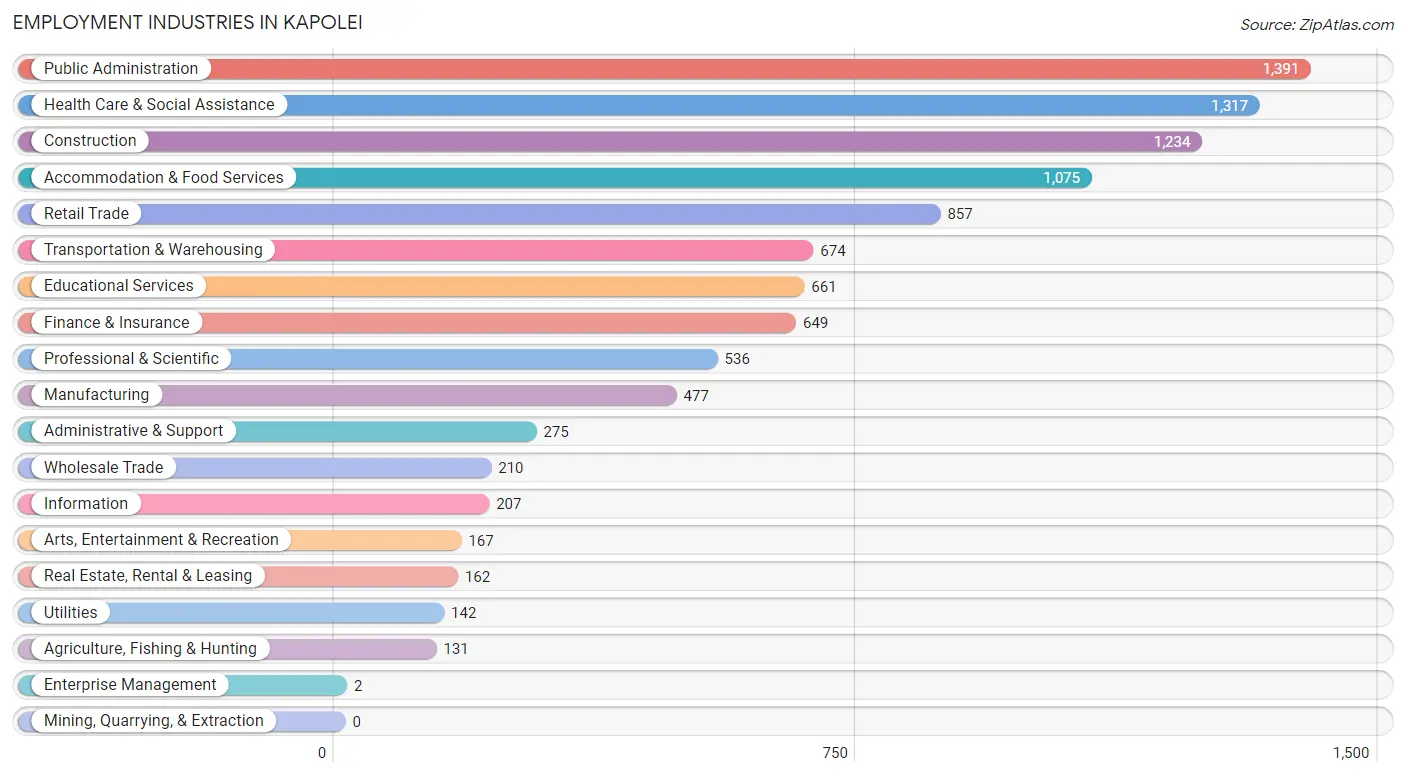
Employment Industries in Kapolei
The major employment industries in Kapolei include Public Administration (1,391 | 13.1%), Health Care & Social Assistance (1,317 | 12.4%), Construction (1,234 | 11.7%), Accommodation & Food Services (1,075 | 10.2%), and Retail Trade (857 | 8.1%).
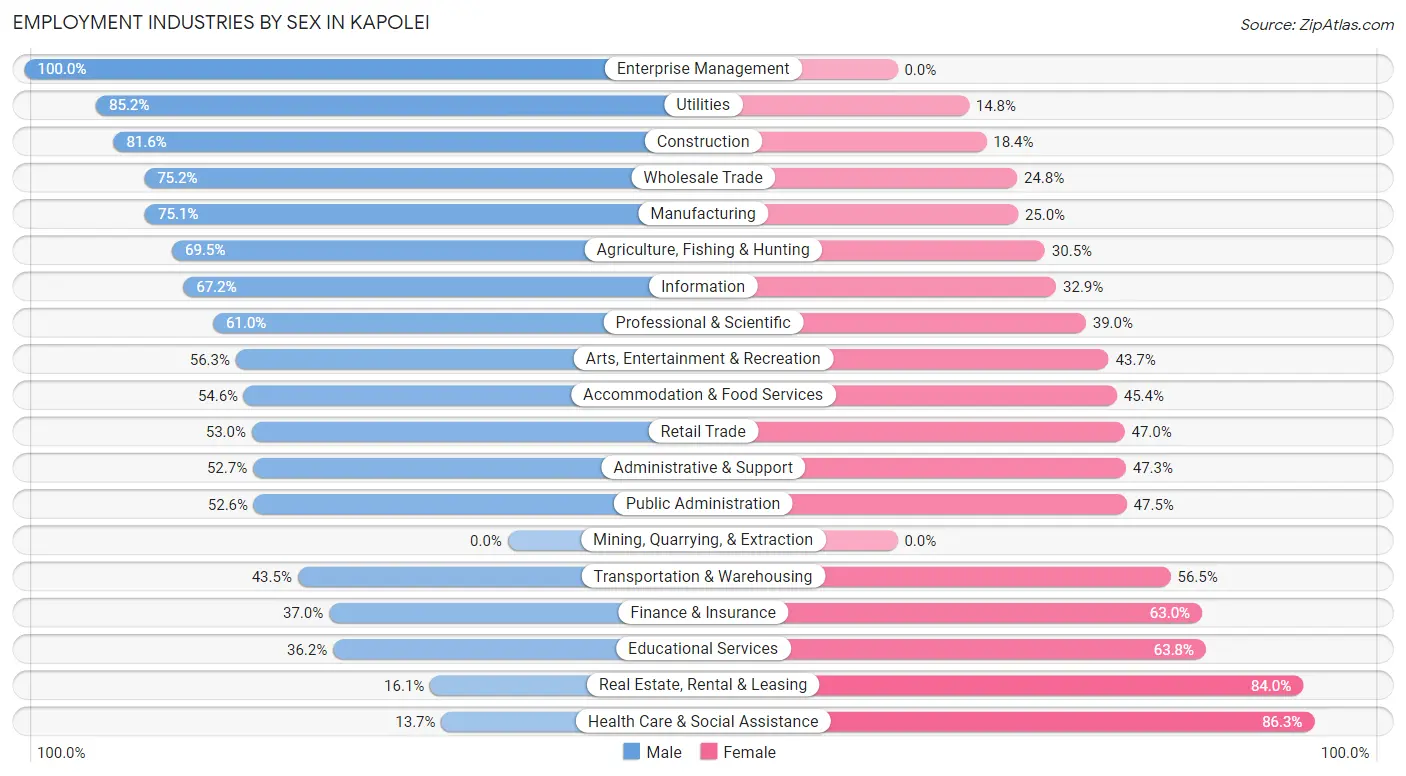
Employment Industries by Sex in Kapolei
The Kapolei industries that see more men than women are Enterprise Management (100.0%), Utilities (85.2%), and Construction (81.6%), whereas the industries that tend to have a higher number of women are Health Care & Social Assistance (86.3%), Real Estate, Rental & Leasing (84.0%), and Educational Services (63.8%).
| Industry | Male | Female |
| Agriculture, Fishing & Hunting | 91 (69.5%) | 40 (30.5%) |
| Mining, Quarrying, & Extraction | 0 (0.0%) | 0 (0.0%) |
| Construction | 1,007 (81.6%) | 227 (18.4%) |
| Manufacturing | 358 (75.0%) | 119 (24.9%) |
| Wholesale Trade | 158 (75.2%) | 52 (24.8%) |
| Retail Trade | 454 (53.0%) | 403 (47.0%) |
| Transportation & Warehousing | 293 (43.5%) | 381 (56.5%) |
| Utilities | 121 (85.2%) | 21 (14.8%) |
| Information | 139 (67.1%) | 68 (32.9%) |
| Finance & Insurance | 240 (37.0%) | 409 (63.0%) |
| Real Estate, Rental & Leasing | 26 (16.1%) | 136 (84.0%) |
| Professional & Scientific | 327 (61.0%) | 209 (39.0%) |
| Enterprise Management | 2 (100.0%) | 0 (0.0%) |
| Administrative & Support | 145 (52.7%) | 130 (47.3%) |
| Educational Services | 239 (36.2%) | 422 (63.8%) |
| Health Care & Social Assistance | 181 (13.7%) | 1,136 (86.3%) |
| Arts, Entertainment & Recreation | 94 (56.3%) | 73 (43.7%) |
| Accommodation & Food Services | 587 (54.6%) | 488 (45.4%) |
| Public Administration | 731 (52.5%) | 660 (47.4%) |
| Total | 5,268 (49.7%) | 5,320 (50.2%) |
Education in Kapolei
School Enrollment in Kapolei
The most common levels of schooling among the 6,797 students in Kapolei are elementary school (1,876 | 27.6%), college / undergraduate (1,520 | 22.4%), and high school (1,213 | 17.8%).
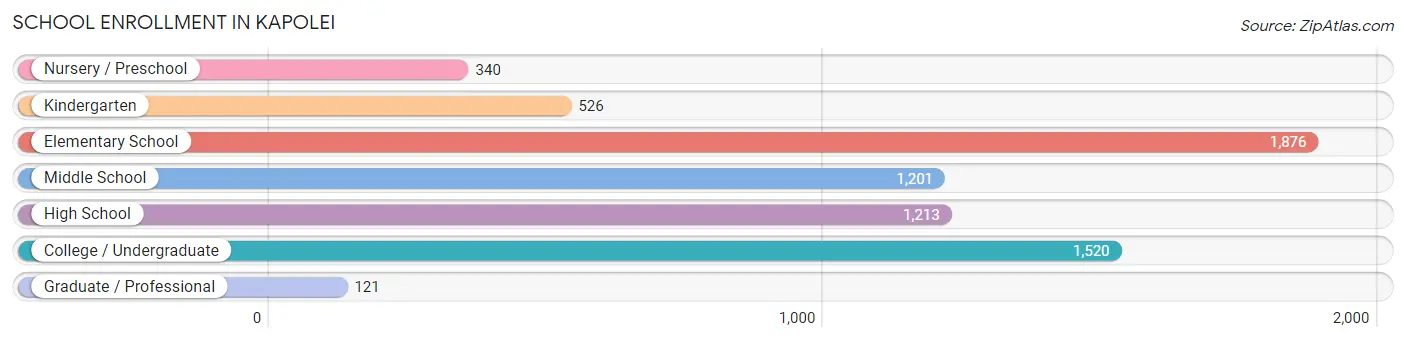
| School Level | # Students | % Students |
| Nursery / Preschool | 340 | 5.0% |
| Kindergarten | 526 | 7.7% |
| Elementary School | 1,876 | 27.6% |
| Middle School | 1,201 | 17.7% |
| High School | 1,213 | 17.8% |
| College / Undergraduate | 1,520 | 22.4% |
| Graduate / Professional | 121 | 1.8% |
| Total | 6,797 | 100.0% |
School Enrollment by Age by Funding Source in Kapolei
Out of a total of 6,797 students who are enrolled in schools in Kapolei, 1,264 (18.6%) attend a private institution, while the remaining 5,533 (81.4%) are enrolled in public schools. The age group of 3 to 4 year olds has the highest likelihood of being enrolled in private schools, with 267 (94.7% in the age bracket) enrolled. Conversely, the age group of 25 to 34 year olds has the lowest likelihood of being enrolled in a private school, with 484 (93.8% in the age bracket) attending a public institution.
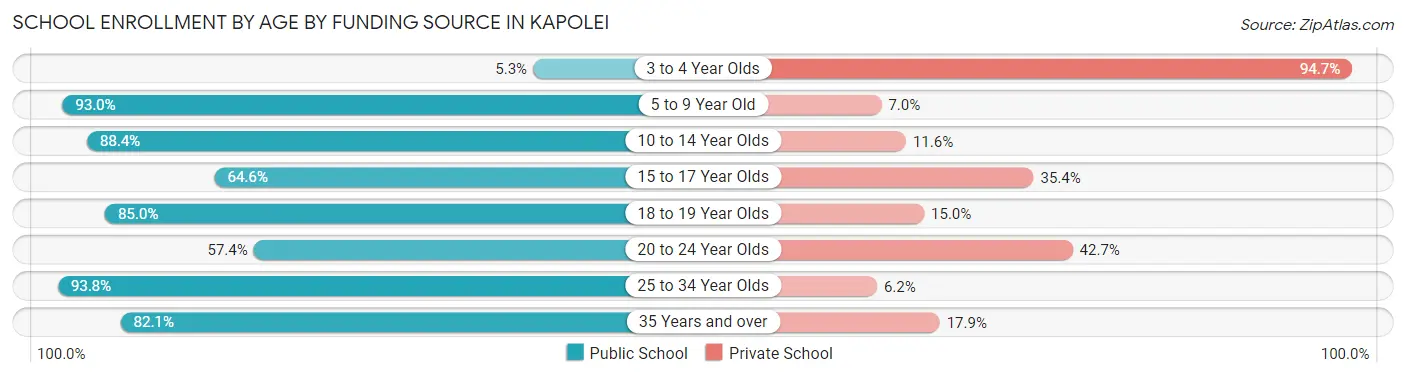
| Age Bracket | Public School | Private School |
| 3 to 4 Year Olds | 15 (5.3%) | 267 (94.7%) |
| 5 to 9 Year Old | 2,138 (93.0%) | 162 (7.0%) |
| 10 to 14 Year Olds | 1,370 (88.4%) | 180 (11.6%) |
| 15 to 17 Year Olds | 546 (64.6%) | 299 (35.4%) |
| 18 to 19 Year Olds | 403 (85.0%) | 71 (15.0%) |
| 20 to 24 Year Olds | 242 (57.4%) | 180 (42.6%) |
| 25 to 34 Year Olds | 484 (93.8%) | 32 (6.2%) |
| 35 Years and over | 335 (82.1%) | 73 (17.9%) |
| Total | 5,533 (81.4%) | 1,264 (18.6%) |
Educational Attainment by Field of Study in Kapolei
Business (1,237 | 27.0%), science & technology (807 | 17.6%), arts & humanities (460 | 10.0%), social sciences (457 | 10.0%), and education (301 | 6.6%) are the most common fields of study among 4,587 individuals in Kapolei who have obtained a bachelor's degree or higher.
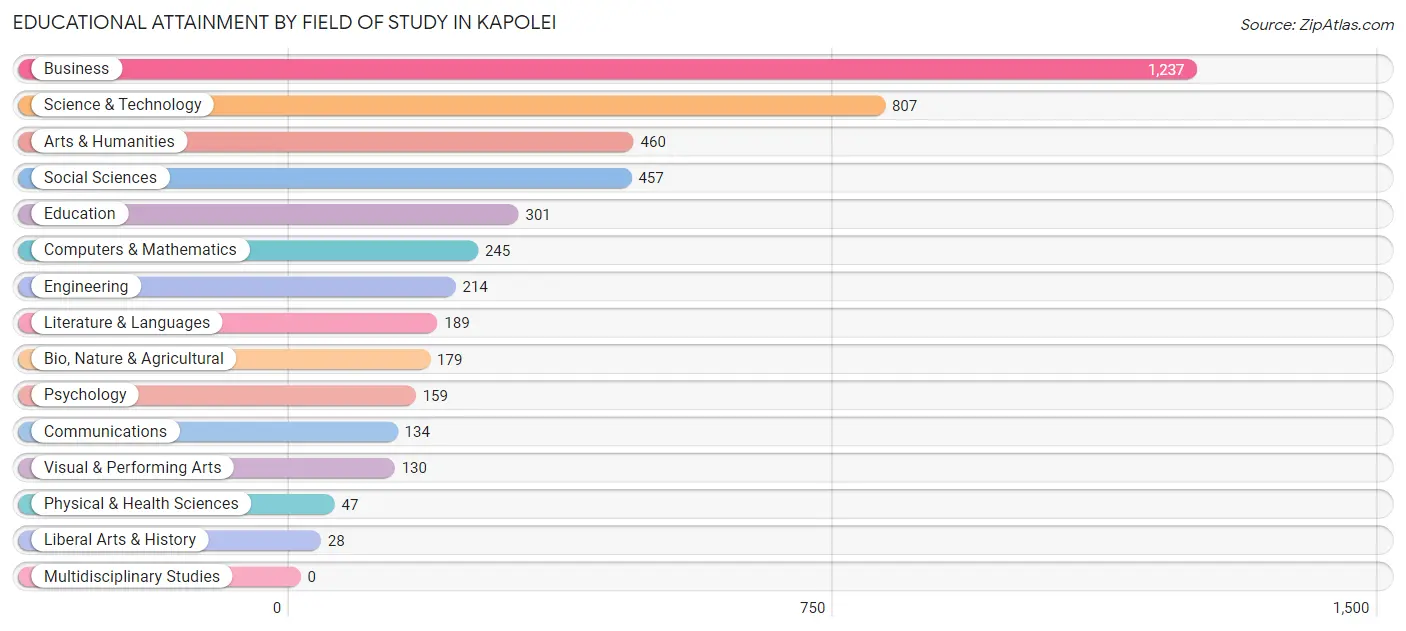
| Field of Study | # Graduates | % Graduates |
| Computers & Mathematics | 245 | 5.3% |
| Bio, Nature & Agricultural | 179 | 3.9% |
| Physical & Health Sciences | 47 | 1.0% |
| Psychology | 159 | 3.5% |
| Social Sciences | 457 | 10.0% |
| Engineering | 214 | 4.7% |
| Multidisciplinary Studies | 0 | 0.0% |
| Science & Technology | 807 | 17.6% |
| Business | 1,237 | 27.0% |
| Education | 301 | 6.6% |
| Literature & Languages | 189 | 4.1% |
| Liberal Arts & History | 28 | 0.6% |
| Visual & Performing Arts | 130 | 2.8% |
| Communications | 134 | 2.9% |
| Arts & Humanities | 460 | 10.0% |
| Total | 4,587 | 100.0% |
Transportation & Commute in Kapolei
Vehicle Availability by Sex in Kapolei
The most prevalent vehicle ownership categories in Kapolei are males with 2 vehicles (2,156, accounting for 37.0%) and females with 2 vehicles (1,754, making up 39.4%).
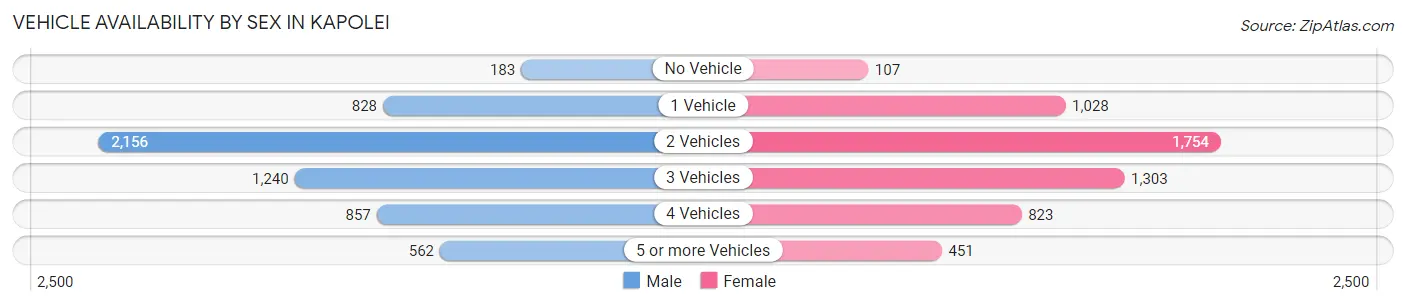
| Vehicles Available | Male | Female |
| No Vehicle | 183 (3.1%) | 107 (2.0%) |
| 1 Vehicle | 828 (14.2%) | 1,028 (18.8%) |
| 2 Vehicles | 2,156 (37.0%) | 1,754 (32.1%) |
| 3 Vehicles | 1,240 (21.3%) | 1,303 (23.8%) |
| 4 Vehicles | 857 (14.7%) | 823 (15.1%) |
| 5 or more Vehicles | 562 (9.7%) | 451 (8.3%) |
| Total | 5,826 (100.0%) | 5,466 (100.0%) |
Commute Time in Kapolei
The most frequently occuring commute durations in Kapolei are 30 to 34 minutes (2,004 commuters, 19.5%), 45 to 59 minutes (1,583 commuters, 15.4%), and 20 to 24 minutes (1,236 commuters, 12.0%).
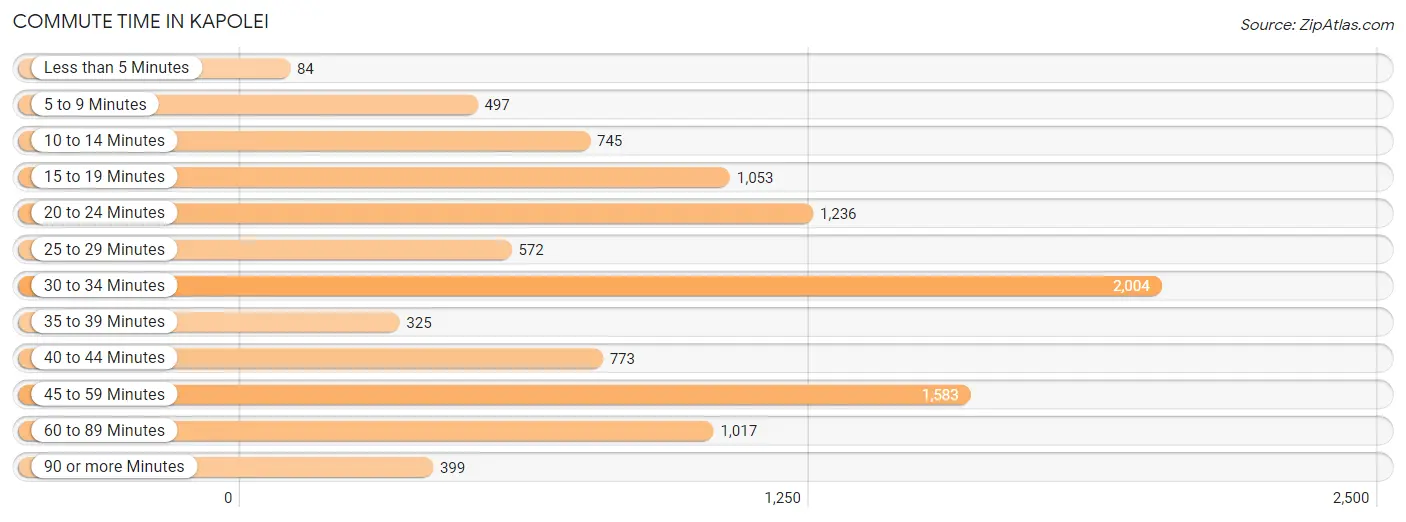
| Commute Time | # Commuters | % Commuters |
| Less than 5 Minutes | 84 | 0.8% |
| 5 to 9 Minutes | 497 | 4.8% |
| 10 to 14 Minutes | 745 | 7.2% |
| 15 to 19 Minutes | 1,053 | 10.2% |
| 20 to 24 Minutes | 1,236 | 12.0% |
| 25 to 29 Minutes | 572 | 5.6% |
| 30 to 34 Minutes | 2,004 | 19.5% |
| 35 to 39 Minutes | 325 | 3.2% |
| 40 to 44 Minutes | 773 | 7.5% |
| 45 to 59 Minutes | 1,583 | 15.4% |
| 60 to 89 Minutes | 1,017 | 9.9% |
| 90 or more Minutes | 399 | 3.9% |
Commute Time by Sex in Kapolei
The most common commute times in Kapolei are 30 to 34 minutes (1,131 commuters, 20.6%) for males and 30 to 34 minutes (873 commuters, 18.2%) for females.
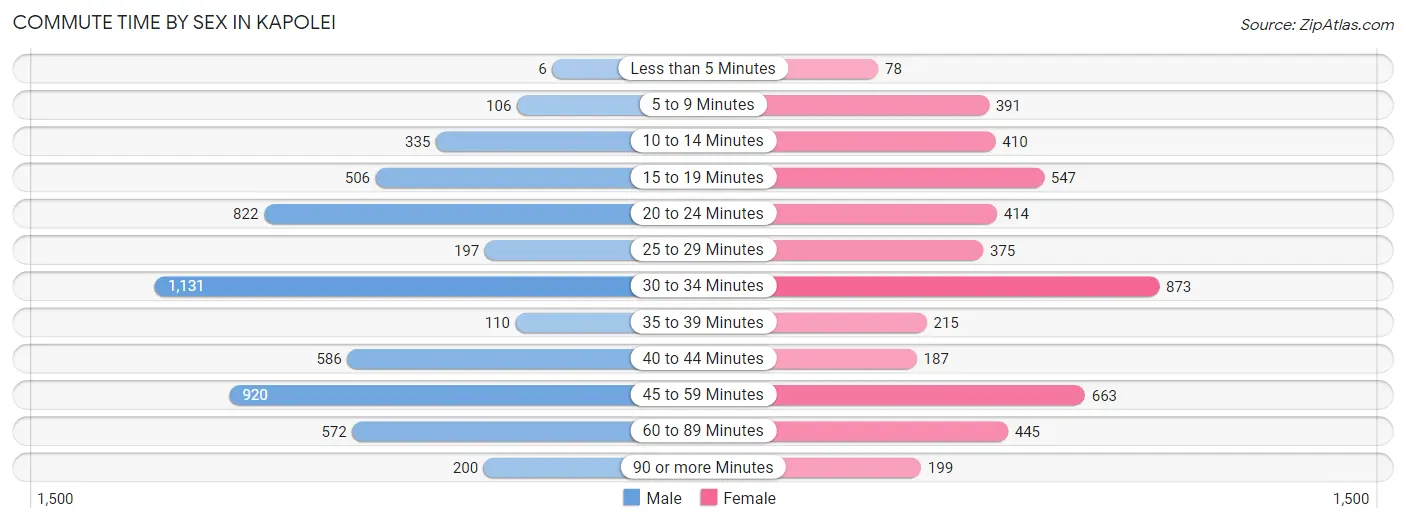
| Commute Time | Male | Female |
| Less than 5 Minutes | 6 (0.1%) | 78 (1.6%) |
| 5 to 9 Minutes | 106 (1.9%) | 391 (8.2%) |
| 10 to 14 Minutes | 335 (6.1%) | 410 (8.6%) |
| 15 to 19 Minutes | 506 (9.2%) | 547 (11.4%) |
| 20 to 24 Minutes | 822 (15.0%) | 414 (8.6%) |
| 25 to 29 Minutes | 197 (3.6%) | 375 (7.8%) |
| 30 to 34 Minutes | 1,131 (20.6%) | 873 (18.2%) |
| 35 to 39 Minutes | 110 (2.0%) | 215 (4.5%) |
| 40 to 44 Minutes | 586 (10.7%) | 187 (3.9%) |
| 45 to 59 Minutes | 920 (16.8%) | 663 (13.8%) |
| 60 to 89 Minutes | 572 (10.4%) | 445 (9.3%) |
| 90 or more Minutes | 200 (3.6%) | 199 (4.2%) |
Time of Departure to Work by Sex in Kapolei
The most frequent times of departure to work in Kapolei are 5:00 AM to 5:29 AM (816, 14.9%) for males and 7:00 AM to 7:29 AM (735, 15.3%) for females.
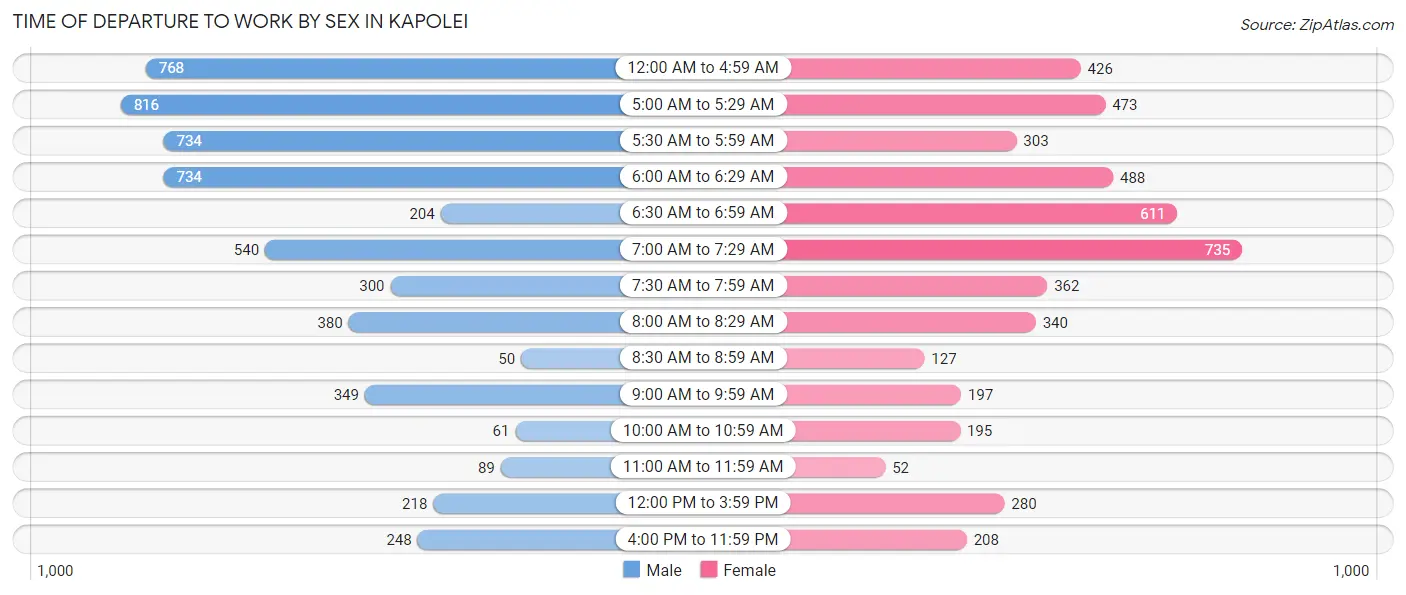
| Time of Departure | Male | Female |
| 12:00 AM to 4:59 AM | 768 (14.0%) | 426 (8.9%) |
| 5:00 AM to 5:29 AM | 816 (14.9%) | 473 (9.9%) |
| 5:30 AM to 5:59 AM | 734 (13.4%) | 303 (6.3%) |
| 6:00 AM to 6:29 AM | 734 (13.4%) | 488 (10.2%) |
| 6:30 AM to 6:59 AM | 204 (3.7%) | 611 (12.7%) |
| 7:00 AM to 7:29 AM | 540 (9.8%) | 735 (15.3%) |
| 7:30 AM to 7:59 AM | 300 (5.5%) | 362 (7.5%) |
| 8:00 AM to 8:29 AM | 380 (6.9%) | 340 (7.1%) |
| 8:30 AM to 8:59 AM | 50 (0.9%) | 127 (2.6%) |
| 9:00 AM to 9:59 AM | 349 (6.4%) | 197 (4.1%) |
| 10:00 AM to 10:59 AM | 61 (1.1%) | 195 (4.1%) |
| 11:00 AM to 11:59 AM | 89 (1.6%) | 52 (1.1%) |
| 12:00 PM to 3:59 PM | 218 (4.0%) | 280 (5.8%) |
| 4:00 PM to 11:59 PM | 248 (4.5%) | 208 (4.3%) |
| Total | 5,491 (100.0%) | 4,797 (100.0%) |
Housing Occupancy in Kapolei
Occupancy by Ownership in Kapolei
Of the total 6,944 dwellings in Kapolei, owner-occupied units account for 5,384 (77.5%), while renter-occupied units make up 1,560 (22.5%).
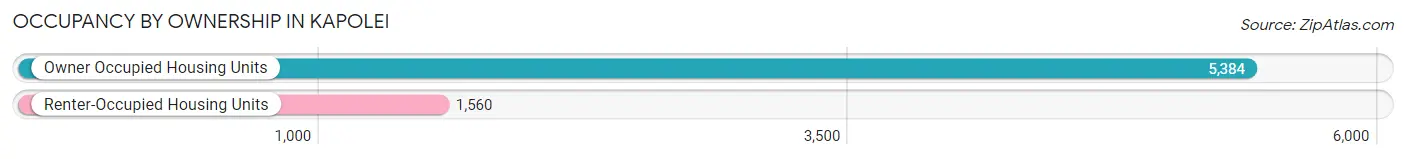
| Occupancy | # Housing Units | % Housing Units |
| Owner Occupied Housing Units | 5,384 | 77.5% |
| Renter-Occupied Housing Units | 1,560 | 22.5% |
| Total Occupied Housing Units | 6,944 | 100.0% |
Occupancy by Household Size in Kapolei
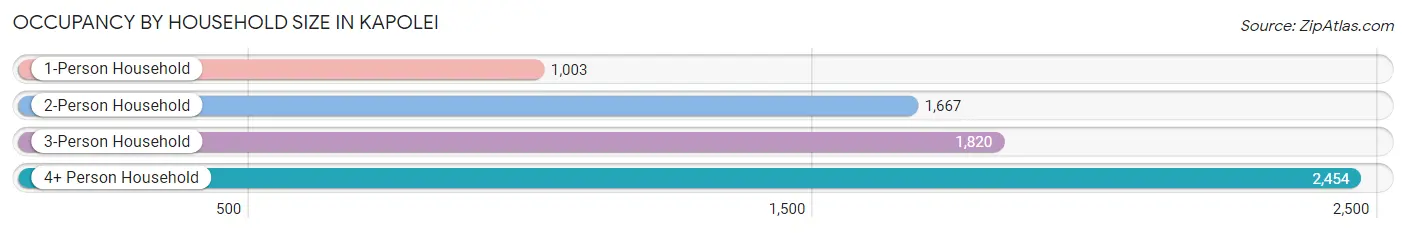
| Household Size | # Housing Units | % Housing Units |
| 1-Person Household | 1,003 | 14.4% |
| 2-Person Household | 1,667 | 24.0% |
| 3-Person Household | 1,820 | 26.2% |
| 4+ Person Household | 2,454 | 35.3% |
| Total Housing Units | 6,944 | 100.0% |
Occupancy by Ownership by Household Size in Kapolei
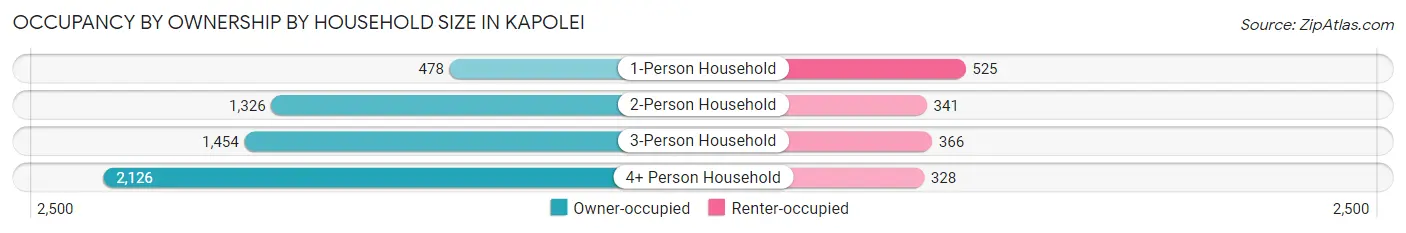
| Household Size | Owner-occupied | Renter-occupied |
| 1-Person Household | 478 (47.7%) | 525 (52.3%) |
| 2-Person Household | 1,326 (79.5%) | 341 (20.5%) |
| 3-Person Household | 1,454 (79.9%) | 366 (20.1%) |
| 4+ Person Household | 2,126 (86.6%) | 328 (13.4%) |
| Total Housing Units | 5,384 (77.5%) | 1,560 (22.5%) |
Occupancy by Educational Attainment in Kapolei
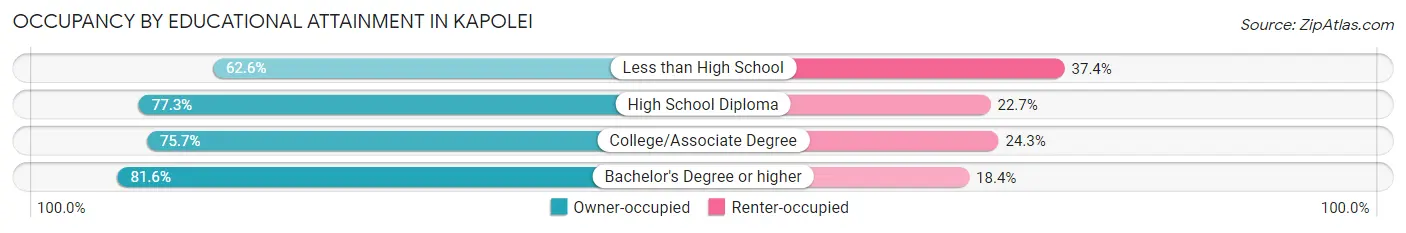
| Household Size | Owner-occupied | Renter-occupied |
| Less than High School | 223 (62.6%) | 133 (37.4%) |
| High School Diploma | 1,102 (77.3%) | 323 (22.7%) |
| College/Associate Degree | 1,972 (75.7%) | 632 (24.3%) |
| Bachelor's Degree or higher | 2,087 (81.6%) | 472 (18.4%) |
Occupancy by Age of Householder in Kapolei
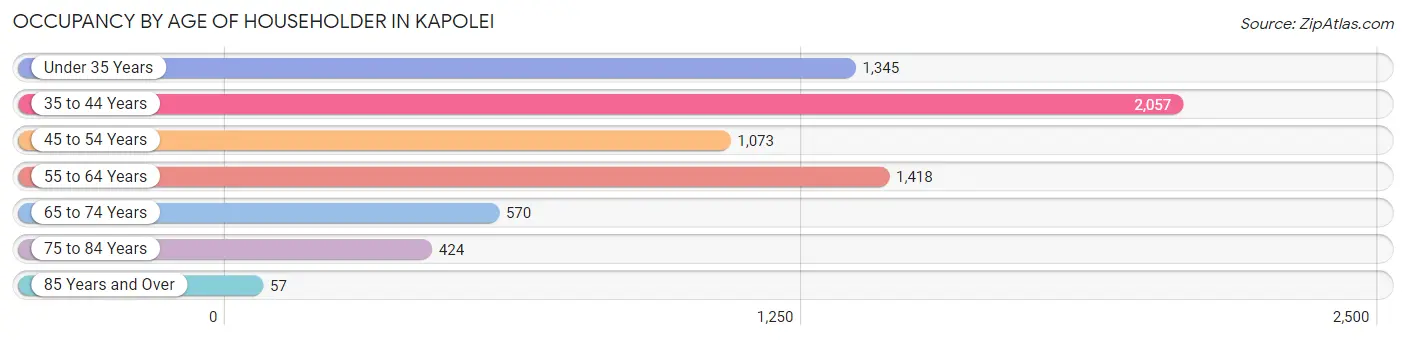
| Age Bracket | # Households | % Households |
| Under 35 Years | 1,345 | 19.4% |
| 35 to 44 Years | 2,057 | 29.6% |
| 45 to 54 Years | 1,073 | 15.4% |
| 55 to 64 Years | 1,418 | 20.4% |
| 65 to 74 Years | 570 | 8.2% |
| 75 to 84 Years | 424 | 6.1% |
| 85 Years and Over | 57 | 0.8% |
| Total | 6,944 | 100.0% |
Housing Finances in Kapolei
Median Income by Occupancy in Kapolei
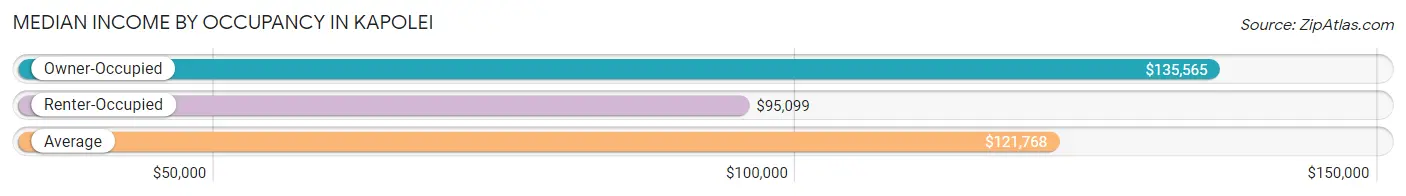
| Occupancy Type | # Households | Median Income |
| Owner-Occupied | 5,384 (77.5%) | $135,565 |
| Renter-Occupied | 1,560 (22.5%) | $95,099 |
| Average | 6,944 (100.0%) | $121,768 |
Occupancy by Householder Income Bracket in Kapolei
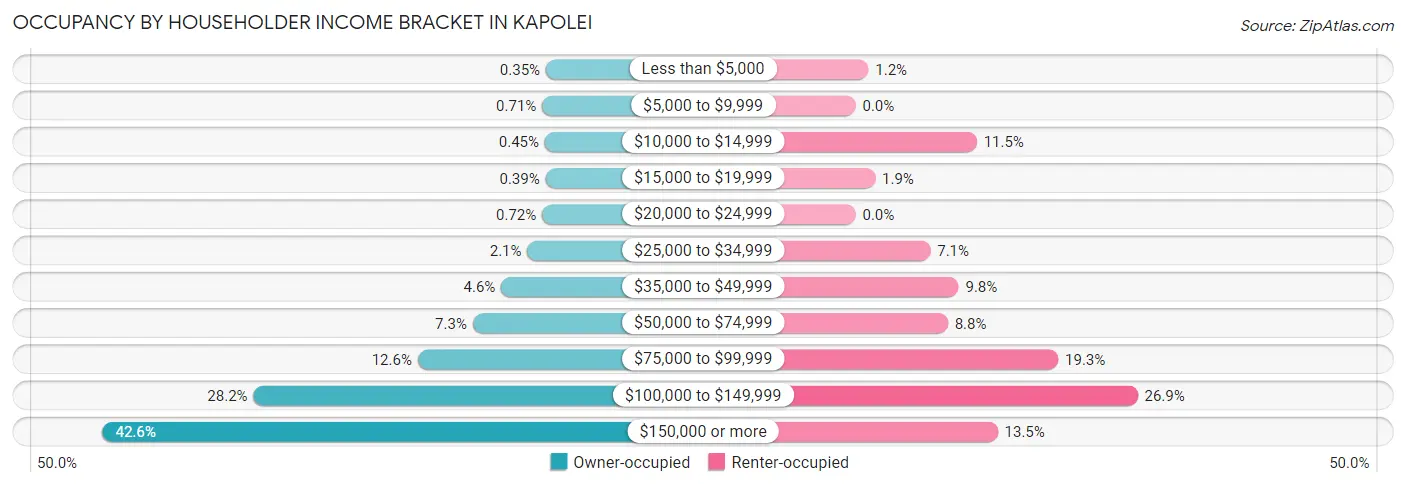
| Income Bracket | Owner-occupied | Renter-occupied |
| Less than $5,000 | 19 (0.4%) | 19 (1.2%) |
| $5,000 to $9,999 | 38 (0.7%) | 0 (0.0%) |
| $10,000 to $14,999 | 24 (0.4%) | 180 (11.5%) |
| $15,000 to $19,999 | 21 (0.4%) | 29 (1.9%) |
| $20,000 to $24,999 | 39 (0.7%) | 0 (0.0%) |
| $25,000 to $34,999 | 114 (2.1%) | 111 (7.1%) |
| $35,000 to $49,999 | 248 (4.6%) | 153 (9.8%) |
| $50,000 to $74,999 | 394 (7.3%) | 137 (8.8%) |
| $75,000 to $99,999 | 676 (12.6%) | 301 (19.3%) |
| $100,000 to $149,999 | 1,519 (28.2%) | 419 (26.9%) |
| $150,000 or more | 2,292 (42.6%) | 211 (13.5%) |
| Total | 5,384 (100.0%) | 1,560 (100.0%) |
Monthly Housing Cost Tiers in Kapolei
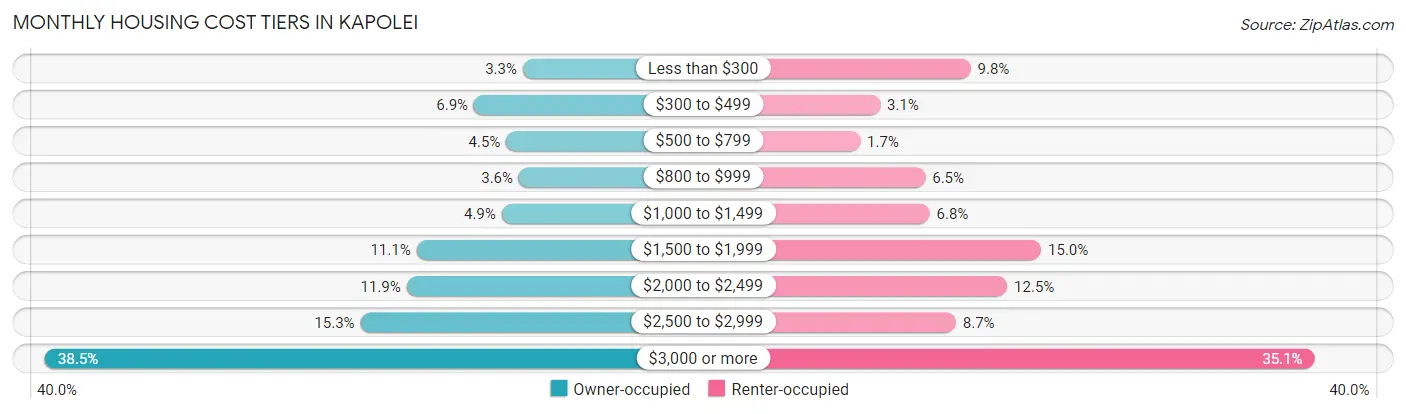
| Monthly Cost | Owner-occupied | Renter-occupied |
| Less than $300 | 178 (3.3%) | 153 (9.8%) |
| $300 to $499 | 372 (6.9%) | 49 (3.1%) |
| $500 to $799 | 244 (4.5%) | 26 (1.7%) |
| $800 to $999 | 194 (3.6%) | 101 (6.5%) |
| $1,000 to $1,499 | 262 (4.9%) | 106 (6.8%) |
| $1,500 to $1,999 | 600 (11.1%) | 234 (15.0%) |
| $2,000 to $2,499 | 639 (11.9%) | 195 (12.5%) |
| $2,500 to $2,999 | 822 (15.3%) | 136 (8.7%) |
| $3,000 or more | 2,073 (38.5%) | 548 (35.1%) |
| Total | 5,384 (100.0%) | 1,560 (100.0%) |
Physical Housing Characteristics in Kapolei
Housing Structures in Kapolei
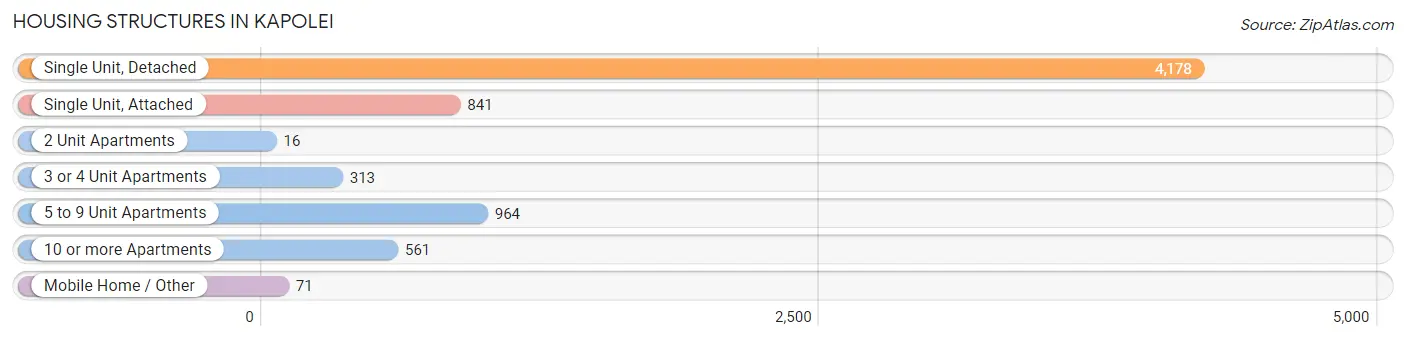
| Structure Type | # Housing Units | % Housing Units |
| Single Unit, Detached | 4,178 | 60.2% |
| Single Unit, Attached | 841 | 12.1% |
| 2 Unit Apartments | 16 | 0.2% |
| 3 or 4 Unit Apartments | 313 | 4.5% |
| 5 to 9 Unit Apartments | 964 | 13.9% |
| 10 or more Apartments | 561 | 8.1% |
| Mobile Home / Other | 71 | 1.0% |
| Total | 6,944 | 100.0% |
Housing Structures by Occupancy in Kapolei
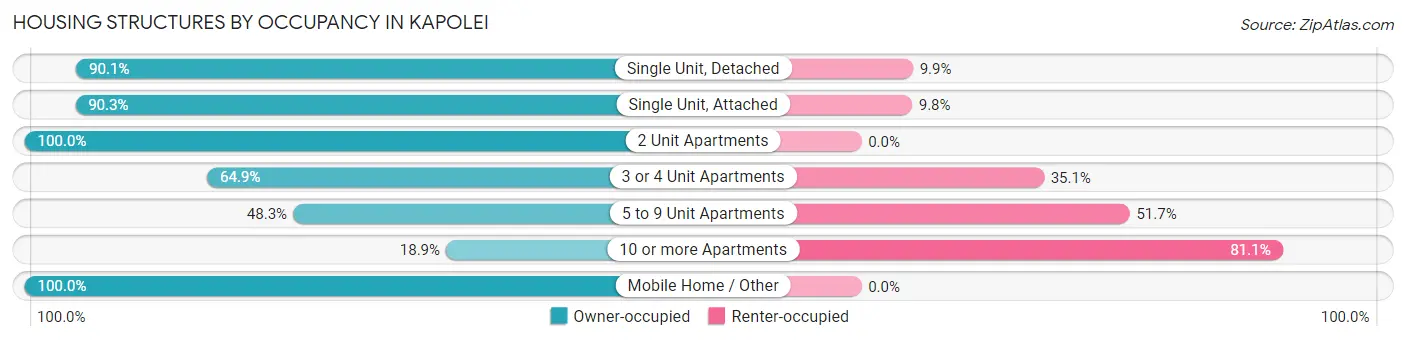
| Structure Type | Owner-occupied | Renter-occupied |
| Single Unit, Detached | 3,763 (90.1%) | 415 (9.9%) |
| Single Unit, Attached | 759 (90.2%) | 82 (9.8%) |
| 2 Unit Apartments | 16 (100.0%) | 0 (0.0%) |
| 3 or 4 Unit Apartments | 203 (64.9%) | 110 (35.1%) |
| 5 to 9 Unit Apartments | 466 (48.3%) | 498 (51.7%) |
| 10 or more Apartments | 106 (18.9%) | 455 (81.1%) |
| Mobile Home / Other | 71 (100.0%) | 0 (0.0%) |
| Total | 5,384 (77.5%) | 1,560 (22.5%) |
Housing Structures by Number of Rooms in Kapolei
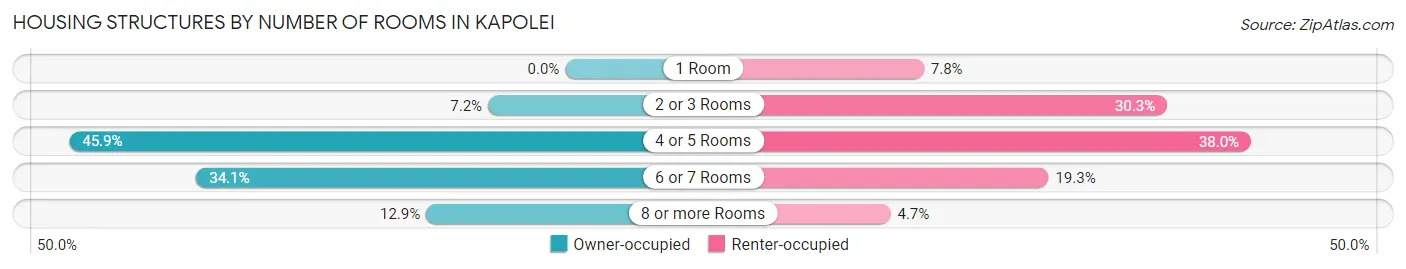
| Number of Rooms | Owner-occupied | Renter-occupied |
| 1 Room | 0 (0.0%) | 121 (7.8%) |
| 2 or 3 Rooms | 385 (7.1%) | 472 (30.3%) |
| 4 or 5 Rooms | 2,469 (45.9%) | 593 (38.0%) |
| 6 or 7 Rooms | 1,837 (34.1%) | 301 (19.3%) |
| 8 or more Rooms | 693 (12.9%) | 73 (4.7%) |
| Total | 5,384 (100.0%) | 1,560 (100.0%) |
Housing Structure by Heating Type in Kapolei
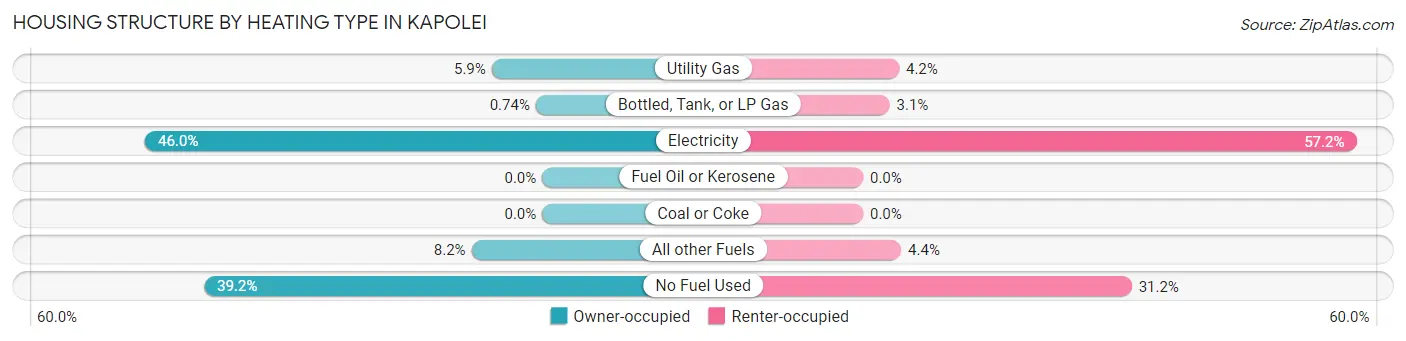
| Heating Type | Owner-occupied | Renter-occupied |
| Utility Gas | 315 (5.9%) | 65 (4.2%) |
| Bottled, Tank, or LP Gas | 40 (0.7%) | 48 (3.1%) |
| Electricity | 2,478 (46.0%) | 892 (57.2%) |
| Fuel Oil or Kerosene | 0 (0.0%) | 0 (0.0%) |
| Coal or Coke | 0 (0.0%) | 0 (0.0%) |
| All other Fuels | 441 (8.2%) | 69 (4.4%) |
| No Fuel Used | 2,110 (39.2%) | 486 (31.1%) |
| Total | 5,384 (100.0%) | 1,560 (100.0%) |
Household Vehicle Usage in Kapolei
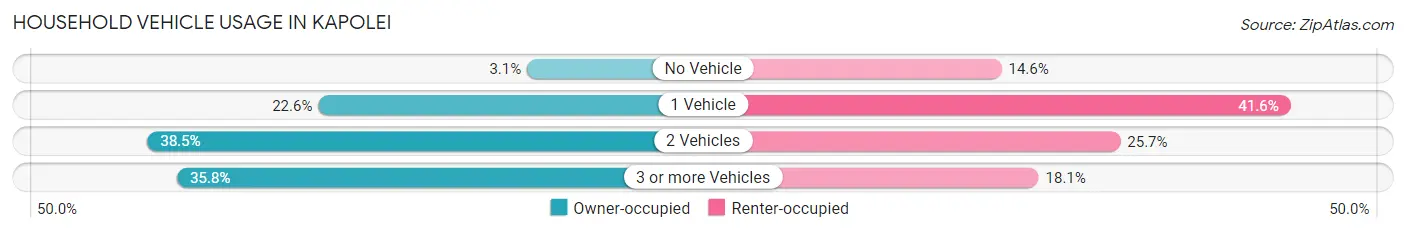
| Vehicles per Household | Owner-occupied | Renter-occupied |
| No Vehicle | 167 (3.1%) | 228 (14.6%) |
| 1 Vehicle | 1,216 (22.6%) | 649 (41.6%) |
| 2 Vehicles | 2,075 (38.5%) | 401 (25.7%) |
| 3 or more Vehicles | 1,926 (35.8%) | 282 (18.1%) |
| Total | 5,384 (100.0%) | 1,560 (100.0%) |
Real Estate & Mortgages in Kapolei
Real Estate and Mortgage Overview in Kapolei
| Characteristic | Without Mortgage | With Mortgage |
| Housing Units | 976 | 4,408 |
| Median Property Value | $661,300 | $709,500 |
| Median Household Income | $108,409 | $2,043 |
| Monthly Housing Costs | $480 | $2,073 |
| Real Estate Taxes | $1,880 | $722 |
Property Value by Mortgage Status in Kapolei
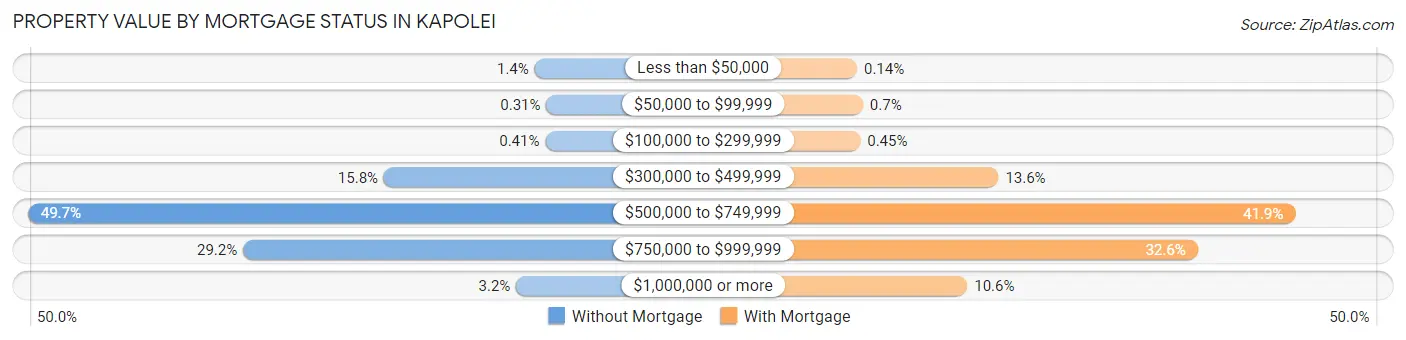
| Property Value | Without Mortgage | With Mortgage |
| Less than $50,000 | 14 (1.4%) | 6 (0.1%) |
| $50,000 to $99,999 | 3 (0.3%) | 31 (0.7%) |
| $100,000 to $299,999 | 4 (0.4%) | 20 (0.4%) |
| $300,000 to $499,999 | 154 (15.8%) | 600 (13.6%) |
| $500,000 to $749,999 | 485 (49.7%) | 1,846 (41.9%) |
| $750,000 to $999,999 | 285 (29.2%) | 1,436 (32.6%) |
| $1,000,000 or more | 31 (3.2%) | 469 (10.6%) |
| Total | 976 (100.0%) | 4,408 (100.0%) |
Household Income by Mortgage Status in Kapolei
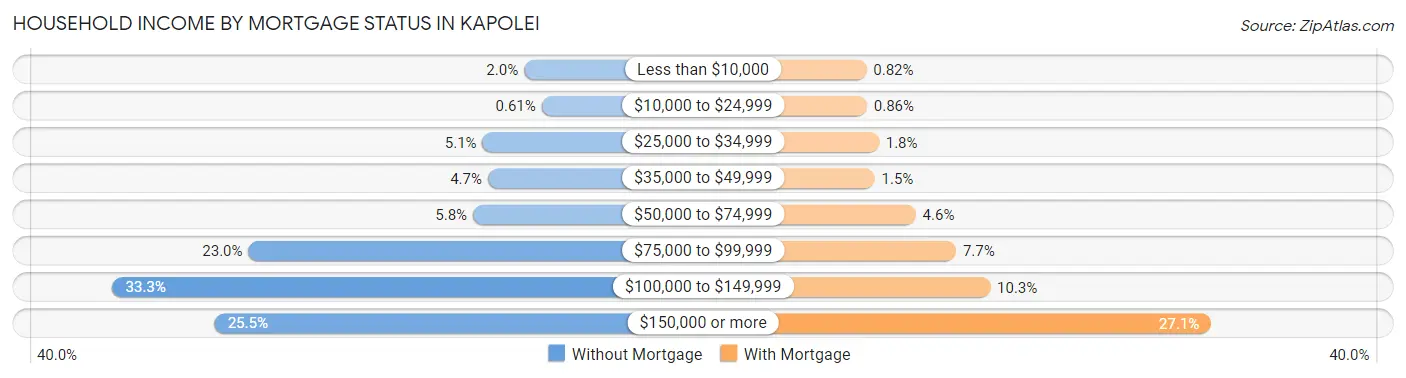
| Household Income | Without Mortgage | With Mortgage |
| Less than $10,000 | 19 (1.9%) | 36 (0.8%) |
| $10,000 to $24,999 | 6 (0.6%) | 38 (0.9%) |
| $25,000 to $34,999 | 50 (5.1%) | 78 (1.8%) |
| $35,000 to $49,999 | 46 (4.7%) | 64 (1.5%) |
| $50,000 to $74,999 | 57 (5.8%) | 202 (4.6%) |
| $75,000 to $99,999 | 224 (23.0%) | 337 (7.6%) |
| $100,000 to $149,999 | 325 (33.3%) | 452 (10.2%) |
| $150,000 or more | 249 (25.5%) | 1,194 (27.1%) |
| Total | 976 (100.0%) | 4,408 (100.0%) |
Property Value to Household Income Ratio in Kapolei
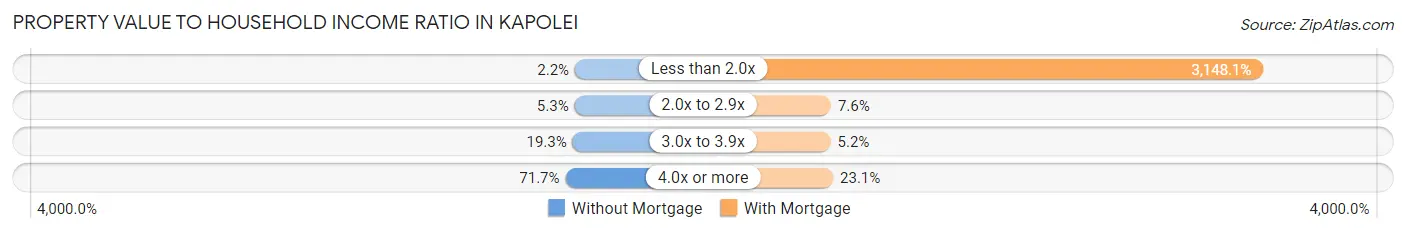
| Value-to-Income Ratio | Without Mortgage | With Mortgage |
| Less than 2.0x | 21 (2.1%) | 138,769 (3,148.1%) |
| 2.0x to 2.9x | 52 (5.3%) | 335 (7.6%) |
| 3.0x to 3.9x | 188 (19.3%) | 231 (5.2%) |
| 4.0x or more | 700 (71.7%) | 1,016 (23.1%) |
| Total | 976 (100.0%) | 4,408 (100.0%) |
Real Estate Taxes by Mortgage Status in Kapolei
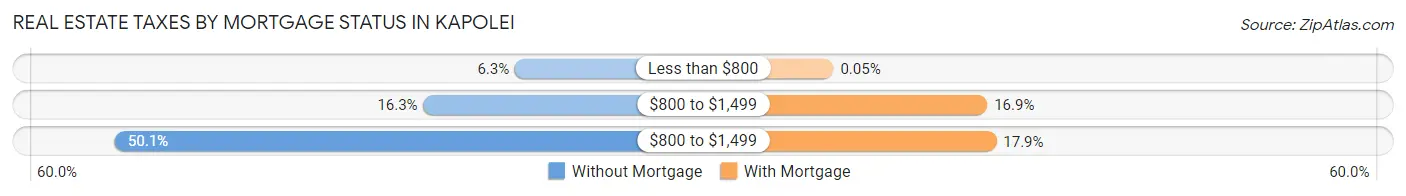
| Property Taxes | Without Mortgage | With Mortgage |
| Less than $800 | 61 (6.2%) | 2 (0.1%) |
| $800 to $1,499 | 159 (16.3%) | 745 (16.9%) |
| $800 to $1,499 | 489 (50.1%) | 789 (17.9%) |
| Total | 976 (100.0%) | 4,408 (100.0%) |
Health & Disability in Kapolei
Health Insurance Coverage by Age in Kapolei
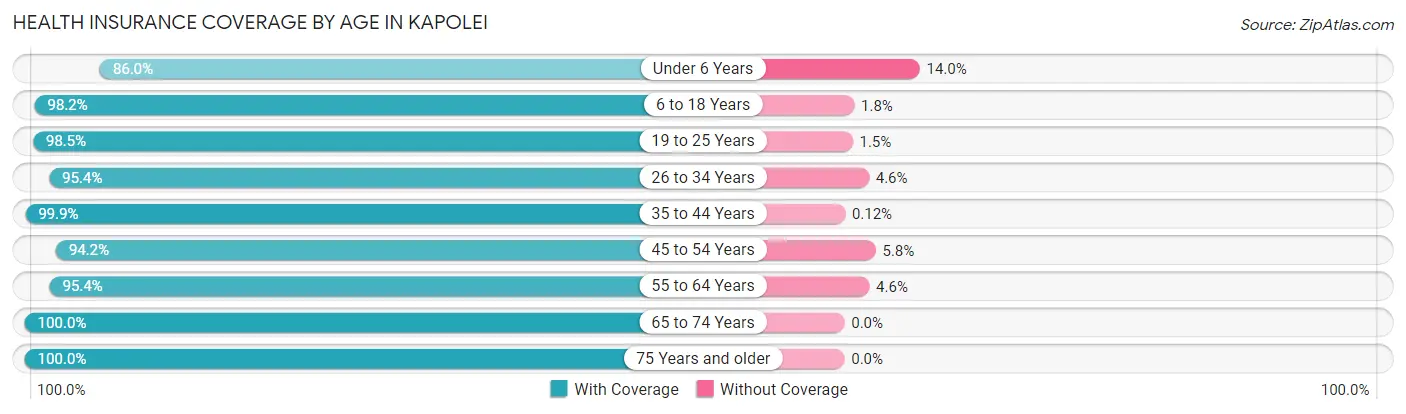
| Age Bracket | With Coverage | Without Coverage |
| Under 6 Years | 1,757 (86.0%) | 287 (14.0%) |
| 6 to 18 Years | 4,823 (98.2%) | 90 (1.8%) |
| 19 to 25 Years | 1,354 (98.5%) | 21 (1.5%) |
| 26 to 34 Years | 2,611 (95.4%) | 125 (4.6%) |
| 35 to 44 Years | 3,432 (99.9%) | 4 (0.1%) |
| 45 to 54 Years | 2,260 (94.2%) | 140 (5.8%) |
| 55 to 64 Years | 2,406 (95.4%) | 117 (4.6%) |
| 65 to 74 Years | 1,193 (100.0%) | 0 (0.0%) |
| 75 Years and older | 1,045 (100.0%) | 0 (0.0%) |
| Total | 20,881 (96.4%) | 784 (3.6%) |
Health Insurance Coverage by Citizenship Status in Kapolei
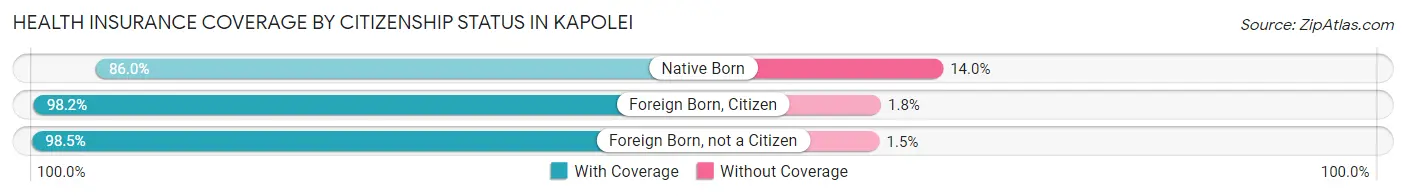
| Citizenship Status | With Coverage | Without Coverage |
| Native Born | 1,757 (86.0%) | 287 (14.0%) |
| Foreign Born, Citizen | 4,823 (98.2%) | 90 (1.8%) |
| Foreign Born, not a Citizen | 1,354 (98.5%) | 21 (1.5%) |
Health Insurance Coverage by Household Income in Kapolei
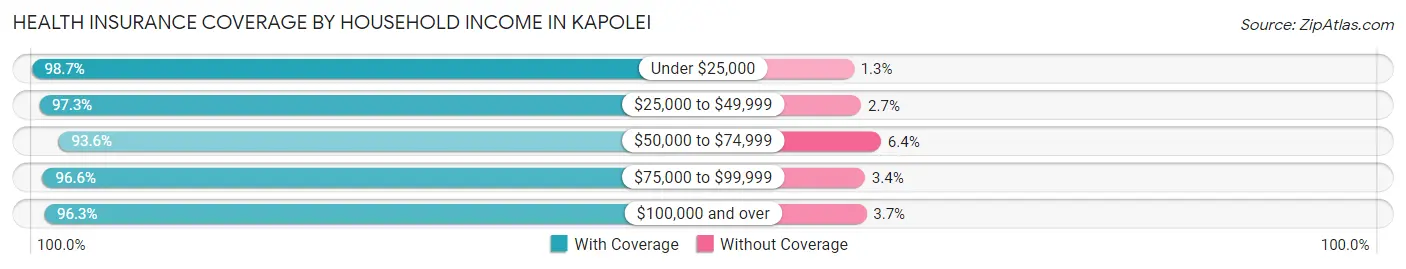
| Household Income | With Coverage | Without Coverage |
| Under $25,000 | 611 (98.7%) | 8 (1.3%) |
| $25,000 to $49,999 | 2,174 (97.3%) | 60 (2.7%) |
| $50,000 to $74,999 | 1,172 (93.6%) | 80 (6.4%) |
| $75,000 to $99,999 | 2,279 (96.6%) | 80 (3.4%) |
| $100,000 and over | 14,630 (96.3%) | 556 (3.7%) |
Public vs Private Health Insurance Coverage by Age in Kapolei
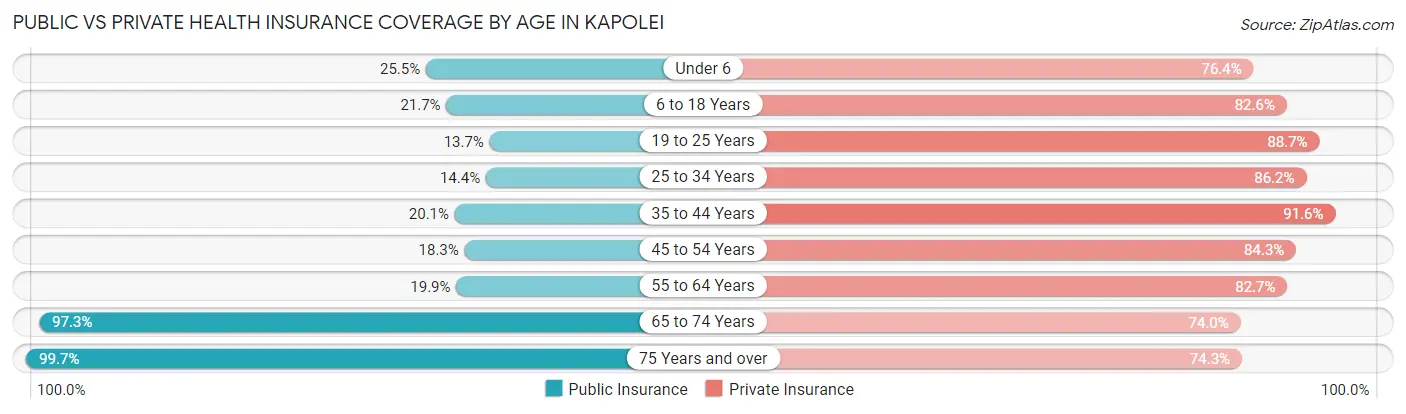
| Age Bracket | Public Insurance | Private Insurance |
| Under 6 | 521 (25.5%) | 1,562 (76.4%) |
| 6 to 18 Years | 1,066 (21.7%) | 4,057 (82.6%) |
| 19 to 25 Years | 188 (13.7%) | 1,219 (88.6%) |
| 25 to 34 Years | 393 (14.4%) | 2,359 (86.2%) |
| 35 to 44 Years | 692 (20.1%) | 3,147 (91.6%) |
| 45 to 54 Years | 440 (18.3%) | 2,024 (84.3%) |
| 55 to 64 Years | 501 (19.9%) | 2,086 (82.7%) |
| 65 to 74 Years | 1,161 (97.3%) | 883 (74.0%) |
| 75 Years and over | 1,042 (99.7%) | 776 (74.3%) |
| Total | 6,004 (27.7%) | 18,113 (83.6%) |
Disability Status by Sex by Age in Kapolei
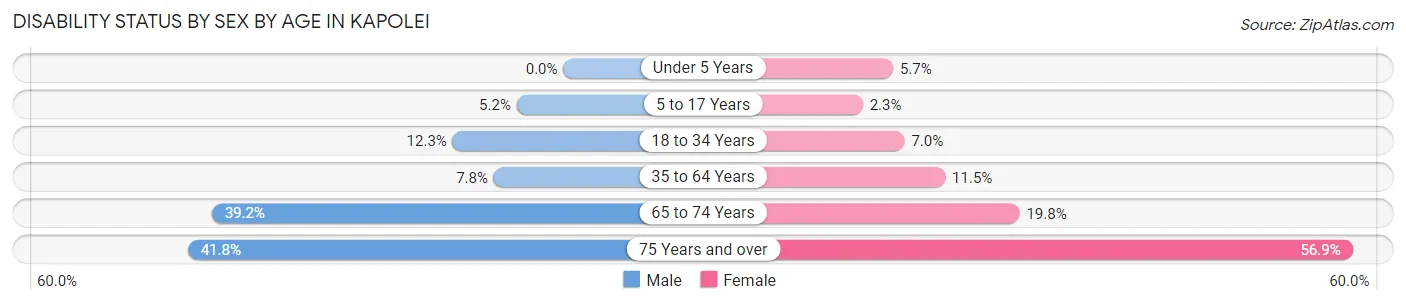
| Age Bracket | Male | Female |
| Under 5 Years | 0 (0.0%) | 32 (5.7%) |
| 5 to 17 Years | 134 (5.2%) | 53 (2.3%) |
| 18 to 34 Years | 269 (12.3%) | 170 (7.0%) |
| 35 to 64 Years | 318 (7.7%) | 490 (11.5%) |
| 65 to 74 Years | 204 (39.2%) | 133 (19.8%) |
| 75 Years and over | 151 (41.8%) | 389 (56.9%) |
Disability Class by Sex by Age in Kapolei
Disability Class: Hearing Difficulty
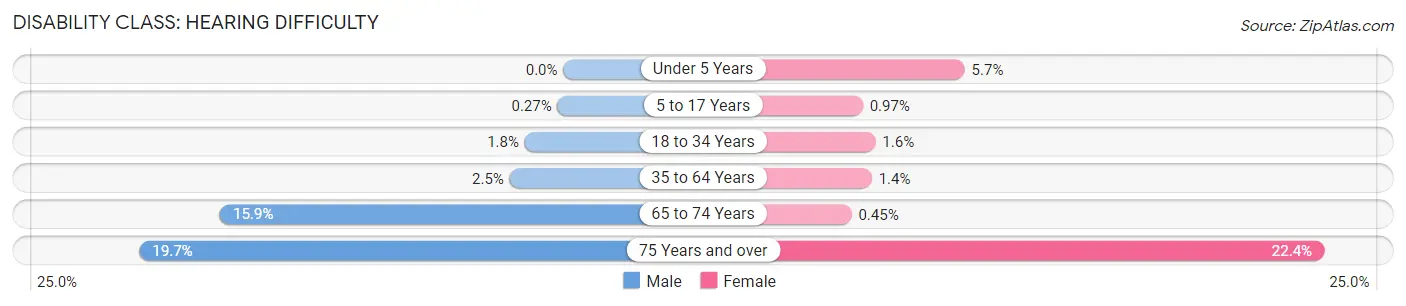
| Age Bracket | Male | Female |
| Under 5 Years | 0 (0.0%) | 32 (5.7%) |
| 5 to 17 Years | 7 (0.3%) | 22 (1.0%) |
| 18 to 34 Years | 39 (1.8%) | 38 (1.6%) |
| 35 to 64 Years | 102 (2.5%) | 59 (1.4%) |
| 65 to 74 Years | 83 (15.9%) | 3 (0.4%) |
| 75 Years and over | 71 (19.7%) | 153 (22.4%) |
Disability Class: Vision Difficulty
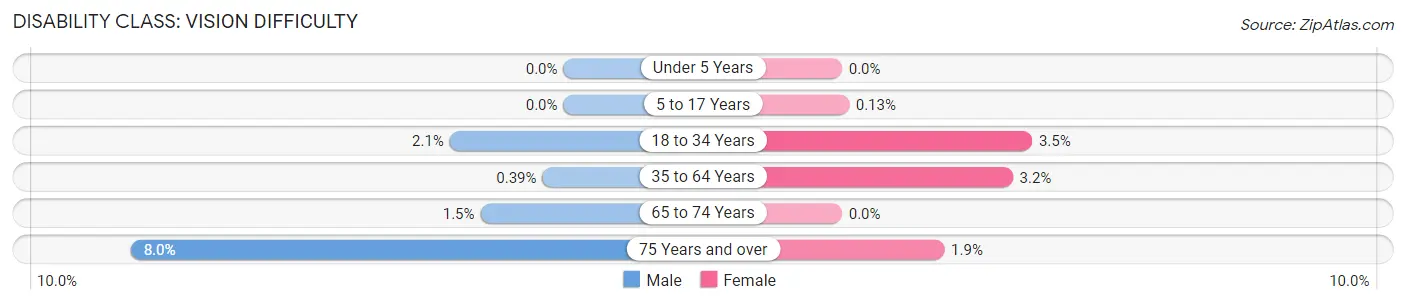
| Age Bracket | Male | Female |
| Under 5 Years | 0 (0.0%) | 0 (0.0%) |
| 5 to 17 Years | 0 (0.0%) | 3 (0.1%) |
| 18 to 34 Years | 46 (2.1%) | 86 (3.5%) |
| 35 to 64 Years | 16 (0.4%) | 135 (3.2%) |
| 65 to 74 Years | 8 (1.5%) | 0 (0.0%) |
| 75 Years and over | 29 (8.0%) | 13 (1.9%) |
Disability Class: Cognitive Difficulty
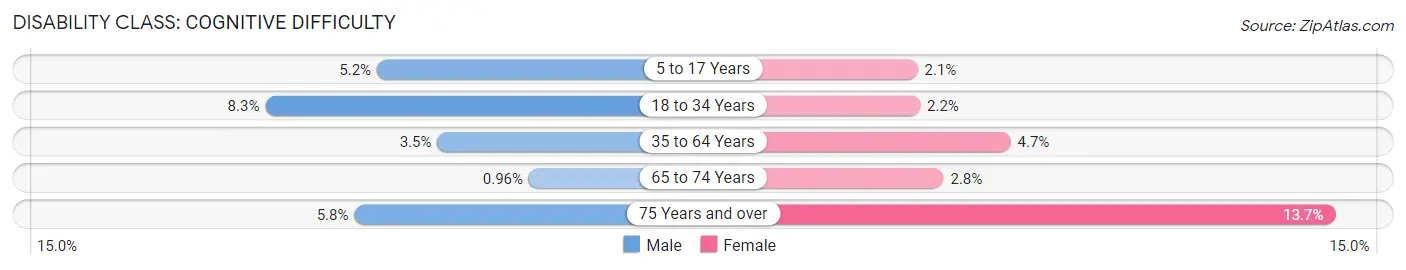
| Age Bracket | Male | Female |
| 5 to 17 Years | 134 (5.2%) | 48 (2.1%) |
| 18 to 34 Years | 181 (8.3%) | 53 (2.2%) |
| 35 to 64 Years | 144 (3.5%) | 200 (4.7%) |
| 65 to 74 Years | 5 (1.0%) | 19 (2.8%) |
| 75 Years and over | 21 (5.8%) | 94 (13.7%) |
Disability Class: Ambulatory Difficulty
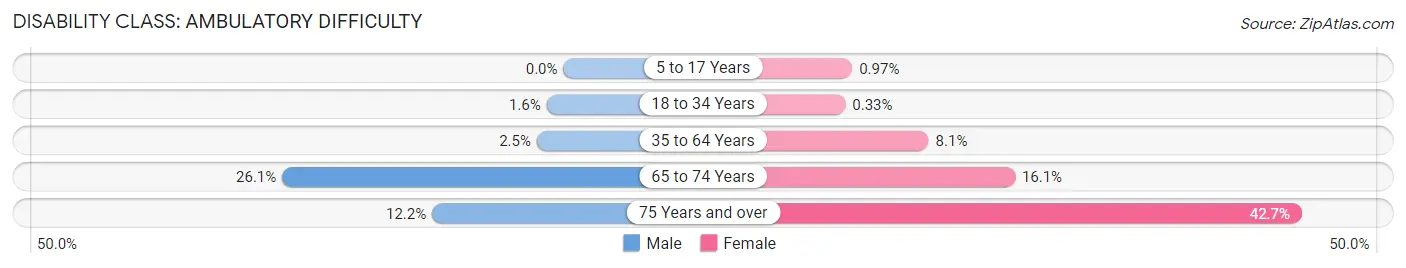
| Age Bracket | Male | Female |
| 5 to 17 Years | 0 (0.0%) | 22 (1.0%) |
| 18 to 34 Years | 34 (1.6%) | 8 (0.3%) |
| 35 to 64 Years | 101 (2.5%) | 343 (8.1%) |
| 65 to 74 Years | 136 (26.1%) | 108 (16.1%) |
| 75 Years and over | 44 (12.2%) | 292 (42.7%) |
Disability Class: Self-Care Difficulty
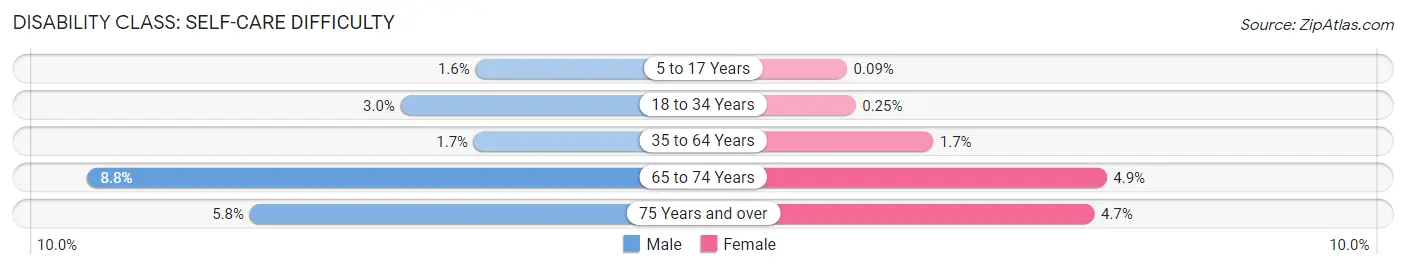
| Age Bracket | Male | Female |
| 5 to 17 Years | 42 (1.6%) | 2 (0.1%) |
| 18 to 34 Years | 66 (3.0%) | 6 (0.3%) |
| 35 to 64 Years | 68 (1.7%) | 72 (1.7%) |
| 65 to 74 Years | 46 (8.8%) | 33 (4.9%) |
| 75 Years and over | 21 (5.8%) | 32 (4.7%) |
Technology Access in Kapolei
Computing Device Access in Kapolei
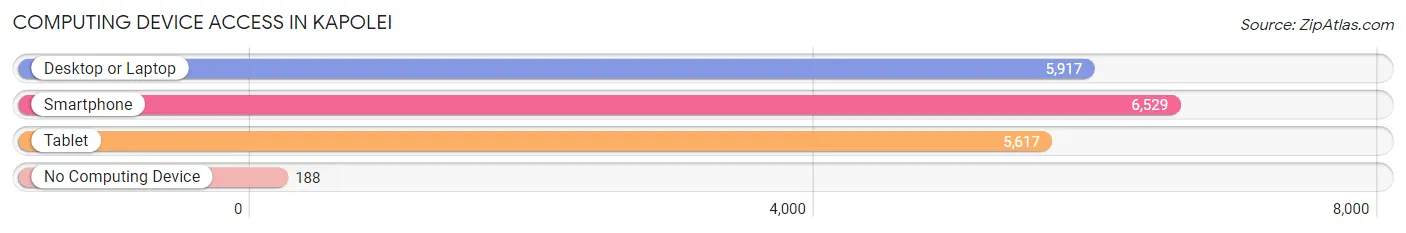
| Device Type | # Households | % Households |
| Desktop or Laptop | 5,917 | 85.2% |
| Smartphone | 6,529 | 94.0% |
| Tablet | 5,617 | 80.9% |
| No Computing Device | 188 | 2.7% |
| Total | 6,944 | 100.0% |
Internet Access in Kapolei
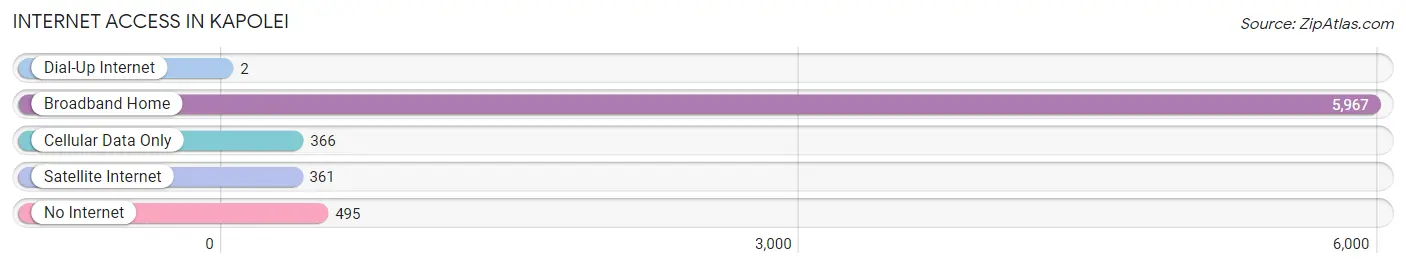
| Internet Type | # Households | % Households |
| Dial-Up Internet | 2 | 0.0% |
| Broadband Home | 5,967 | 85.9% |
| Cellular Data Only | 366 | 5.3% |
| Satellite Internet | 361 | 5.2% |
| No Internet | 495 | 7.1% |
| Total | 6,944 | 100.0% |
Kapolei Summary
Kapolei is a city located in the state of Hawaii, United States. It is the second largest city in the state, and is located on the island of Oahu. Kapolei is located in the Ewa District of the island, and is part of the Honolulu metropolitan area. The city was founded in the late 1960s, and has since grown to become a major economic and residential hub in the region.
History
Kapolei was founded in the late 1960s, when the state of Hawaii began to develop the area for residential and commercial use. The city was named after the Kapolei River, which runs through the area. The city was initially planned as a satellite city of Honolulu, and was intended to provide housing and employment opportunities for the growing population of the island.
The city was officially incorporated in 1967, and the first mayor was elected in 1968. The city has since grown rapidly, and is now home to a population of over 20,000 people.
Geography
Kapolei is located on the island of Oahu, in the Ewa District. The city is located approximately 20 miles west of Honolulu, and is bordered by the cities of Ewa Beach, Waipahu, and Makakilo. The city is situated on the western side of the island, and is surrounded by the Pacific Ocean to the west, and the Waianae Mountains to the east.
The city has a total area of 8.3 square miles, and is located at an elevation of approximately 50 feet above sea level. The climate in Kapolei is tropical, with temperatures ranging from an average low of 65°F in the winter to an average high of 85°F in the summer.
Economy
Kapolei is a major economic hub in the state of Hawaii, and is home to a variety of businesses and industries. The city is home to several large employers, including the University of Hawaii, the US Navy, and the US Army. The city is also home to several major shopping centers, including the Kapolei Shopping Center and the Kapolei Commons.
The city is also home to several major tourist attractions, including the Kapolei Golf Course, the Kapolei Water Park, and the Kapolei Adventure Park. The city is also home to several major events, including the Kapolei Festival and the Kapolei Luau.
Demographics
As of the 2010 census, the population of Kapolei was 20,194. The racial makeup of the city was 44.3% White, 8.2% African American, 0.7% Native American, 24.3% Asian, 0.3% Pacific Islander, and 21.4% from other races. The median household income in the city was $67,945, and the median family income was $76,945.
The city is home to a variety of religious denominations, including Christianity, Buddhism, Hinduism, and Islam. The city is also home to a variety of cultural and recreational activities, including the Kapolei Arts Festival, the Kapolei Music Festival, and the Kapolei Film Festival.
Conclusion
Kapolei is a vibrant and growing city located on the island of Oahu in the state of Hawaii. The city was founded in the late 1960s, and has since grown to become a major economic and residential hub in the region. The city is home to a diverse population, and is home to a variety of businesses and industries. The city is also home to several major tourist attractions, and is home to a variety of cultural and recreational activities.
Common Questions
What is Per Capita Income in Kapolei?
Per Capita income in Kapolei is $45,164.
What is the Median Family Income in Kapolei?
Median Family Income in Kapolei is $127,217.
What is the Median Household income in Kapolei?
Median Household Income in Kapolei is $121,768.
What is Income or Wage Gap in Kapolei?
Income or Wage Gap in Kapolei is 31.0%.
Women in Kapolei earn 69.0 cents for every dollar earned by a man.
What is Family Income Deficit in Kapolei?
Family Income Deficit in Kapolei is $7,957.
Families that are below poverty line in Kapolei earn $7,957 less on average than the poverty threshold level.
What is Inequality or Gini Index in Kapolei?
Inequality or Gini Index in Kapolei is 0.37.
What is the Total Population of Kapolei?
Total Population of Kapolei is 22,701.
What is the Total Male Population of Kapolei?
Total Male Population of Kapolei is 11,476.
What is the Total Female Population of Kapolei?
Total Female Population of Kapolei is 11,225.
What is the Ratio of Males per 100 Females in Kapolei?
There are 102.24 Males per 100 Females in Kapolei.
What is the Ratio of Females per 100 Males in Kapolei?
There are 97.81 Females per 100 Males in Kapolei.
What is the Median Population Age in Kapolei?
Median Population Age in Kapolei is 33.9 Years.
What is the Average Family Size in Kapolei
Average Family Size in Kapolei is 3.5 People.
What is the Average Household Size in Kapolei
Average Household Size in Kapolei is 3.2 People.
How Large is the Labor Force in Kapolei?
There are 12,164 People in the Labor Forcein in Kapolei.
What is the Percentage of People in the Labor Force in Kapolei?
72.4% of People are in the Labor Force in Kapolei.
What is the Unemployment Rate in Kapolei?
Unemployment Rate in Kapolei is 5.6%.