Mililani Mauka, HI Map & Demographics
Mililani Mauka Map
Mililani Mauka Overview
$51,874
PER CAPITA INCOME
$147,648
AVG FAMILY INCOME
$132,043
AVG HOUSEHOLD INCOME
31.6%
WAGE / INCOME GAP [ % ]
68.4¢/ $1
WAGE / INCOME GAP [ $ ]
$10,113
FAMILY INCOME DEFICIT
0.36
INEQUALITY / GINI INDEX
21,546
TOTAL POPULATION
10,860
MALE POPULATION
10,686
FEMALE POPULATION
101.63
MALES / 100 FEMALES
98.40
FEMALES / 100 MALES
38.2
MEDIAN AGE
3.3
AVG FAMILY SIZE
2.9
AVG HOUSEHOLD SIZE
12,374
LABOR FORCE [ PEOPLE ]
73.5%
PERCENT IN LABOR FORCE
2.0%
UNEMPLOYMENT RATE
Income in Mililani Mauka
Income Overview in Mililani Mauka
Per Capita Income in Mililani Mauka is $51,874, while median incomes of families and households are $147,648 and $132,043 respectively.
| Characteristic | Number | Measure |
| Per Capita Income | 21,546 | $51,874 |
| Median Family Income | 5,773 | $147,648 |
| Mean Family Income | 5,773 | $162,789 |
| Median Household Income | 7,525 | $132,043 |
| Mean Household Income | 7,525 | $145,949 |
| Income Deficit | 5,773 | $10,113 |
| Wage / Income Gap (%) | 21,546 | 31.61% |
| Wage / Income Gap ($) | 21,546 | 68.39¢ per $1 |
| Gini / Inequality Index | 21,546 | 0.36 |
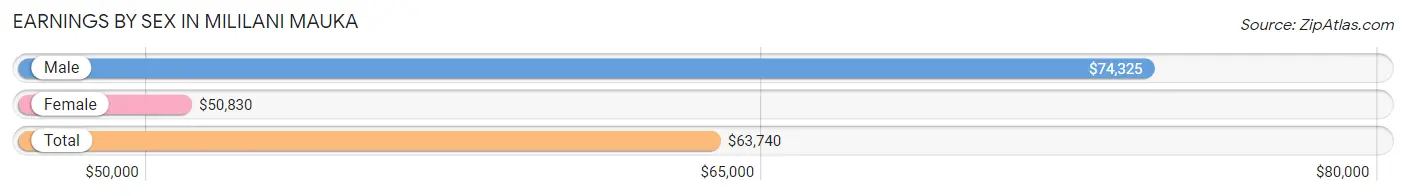
Earnings by Sex in Mililani Mauka
Average Earnings in Mililani Mauka are $63,740, $74,325 for men and $50,830 for women, a difference of 31.6%.
| Sex | Number | Average Earnings |
| Male | 6,736 (52.2%) | $74,325 |
| Female | 6,161 (47.8%) | $50,830 |
| Total | 12,897 (100.0%) | $63,740 |
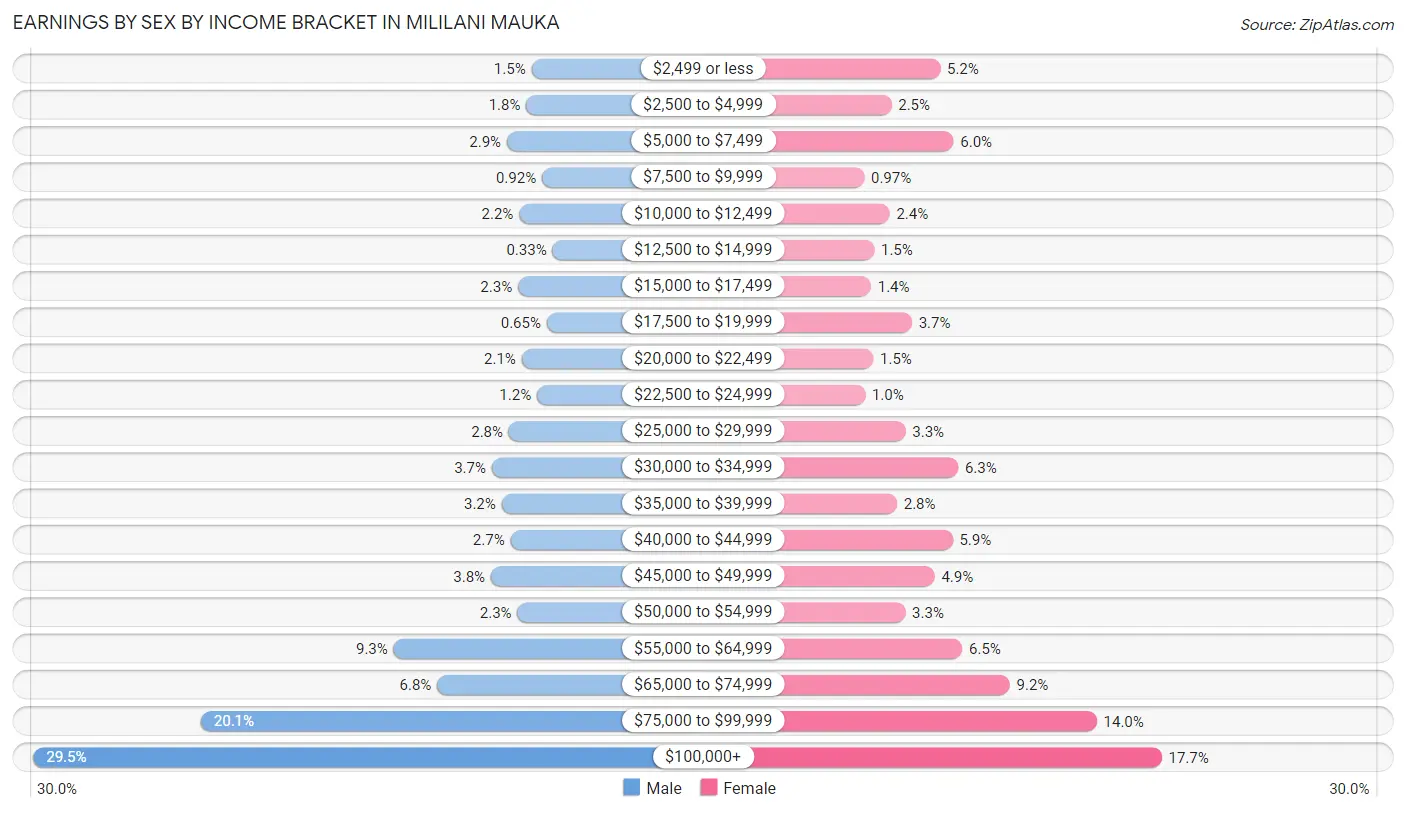
Earnings by Sex by Income Bracket in Mililani Mauka
The most common earnings brackets in Mililani Mauka are $100,000+ for men (1,988 | 29.5%) and $100,000+ for women (1,090 | 17.7%).
| Income | Male | Female |
| $2,499 or less | 102 (1.5%) | 323 (5.2%) |
| $2,500 to $4,999 | 121 (1.8%) | 154 (2.5%) |
| $5,000 to $7,499 | 195 (2.9%) | 369 (6.0%) |
| $7,500 to $9,999 | 62 (0.9%) | 60 (1.0%) |
| $10,000 to $12,499 | 148 (2.2%) | 148 (2.4%) |
| $12,500 to $14,999 | 22 (0.3%) | 94 (1.5%) |
| $15,000 to $17,499 | 153 (2.3%) | 83 (1.3%) |
| $17,500 to $19,999 | 44 (0.6%) | 225 (3.6%) |
| $20,000 to $22,499 | 139 (2.1%) | 91 (1.5%) |
| $22,500 to $24,999 | 81 (1.2%) | 63 (1.0%) |
| $25,000 to $29,999 | 187 (2.8%) | 203 (3.3%) |
| $30,000 to $34,999 | 252 (3.7%) | 385 (6.2%) |
| $35,000 to $39,999 | 215 (3.2%) | 173 (2.8%) |
| $40,000 to $44,999 | 181 (2.7%) | 366 (5.9%) |
| $45,000 to $49,999 | 255 (3.8%) | 304 (4.9%) |
| $50,000 to $54,999 | 155 (2.3%) | 202 (3.3%) |
| $55,000 to $64,999 | 624 (9.3%) | 399 (6.5%) |
| $65,000 to $74,999 | 459 (6.8%) | 564 (9.1%) |
| $75,000 to $99,999 | 1,353 (20.1%) | 865 (14.0%) |
| $100,000+ | 1,988 (29.5%) | 1,090 (17.7%) |
| Total | 6,736 (100.0%) | 6,161 (100.0%) |
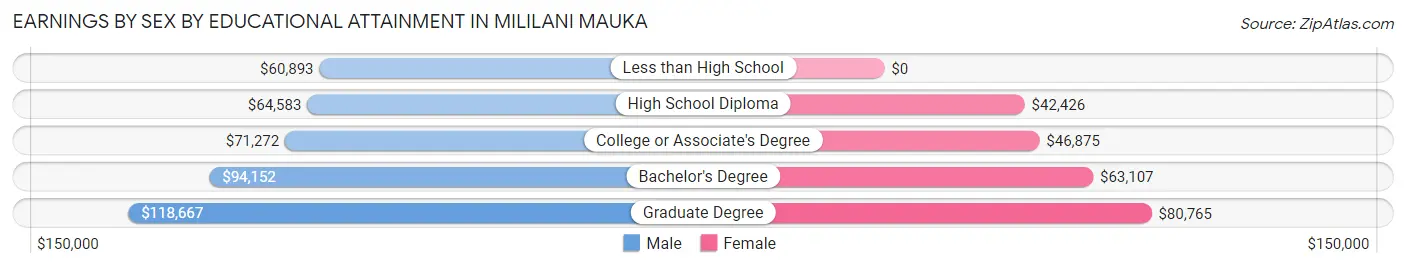
Earnings by Sex by Educational Attainment in Mililani Mauka
Average earnings in Mililani Mauka are $81,360 for men and $59,898 for women, a difference of 26.4%. Men with an educational attainment of graduate degree enjoy the highest average annual earnings of $118,667, while those with less than high school education earn the least with $60,893. Women with an educational attainment of graduate degree earn the most with the average annual earnings of $80,765, while those with high school diploma education have the smallest earnings of $42,426.
| Educational Attainment | Male Income | Female Income |
| Less than High School | $60,893 | $0 |
| High School Diploma | $64,583 | $42,426 |
| College or Associate's Degree | $71,272 | $46,875 |
| Bachelor's Degree | $94,152 | $63,107 |
| Graduate Degree | $118,667 | $80,765 |
| Total | $81,360 | $59,898 |
Family Income in Mililani Mauka
Family Income Brackets in Mililani Mauka
According to the Mililani Mauka family income data, there are 1,437 families falling into the $100,000 to $149,999 income range, which is the most common income bracket and makes up 24.9% of all families. Conversely, the $10,000 to $14,999 income bracket is the least frequent group with only 17 families (0.3%) belonging to this category.
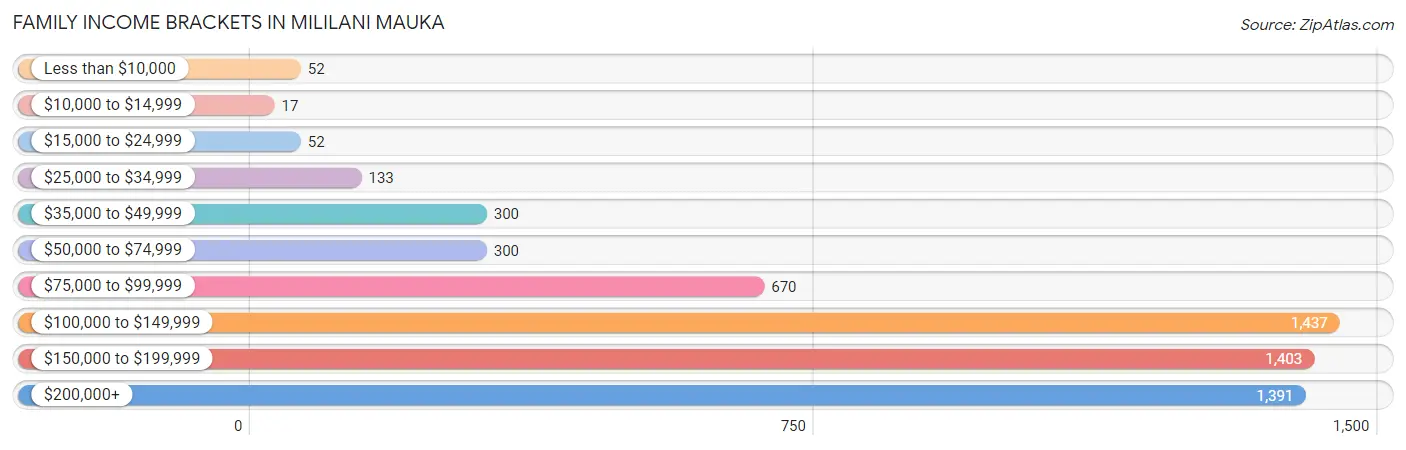
| Income Bracket | # Families | % Families |
| Less than $10,000 | 52 | 0.9% |
| $10,000 to $14,999 | 17 | 0.3% |
| $15,000 to $24,999 | 52 | 0.9% |
| $25,000 to $34,999 | 133 | 2.3% |
| $35,000 to $49,999 | 300 | 5.2% |
| $50,000 to $74,999 | 300 | 5.2% |
| $75,000 to $99,999 | 670 | 11.6% |
| $100,000 to $149,999 | 1,437 | 24.9% |
| $150,000 to $199,999 | 1,403 | 24.3% |
| $200,000+ | 1,391 | 24.1% |
Family Income by Famaliy Size in Mililani Mauka
7+ person families (139 | 2.4%) account for the highest median family income in Mililani Mauka with $250,001 per family, while 2-person families (2,401 | 41.6%) have the highest median income of $61,899 per family member.
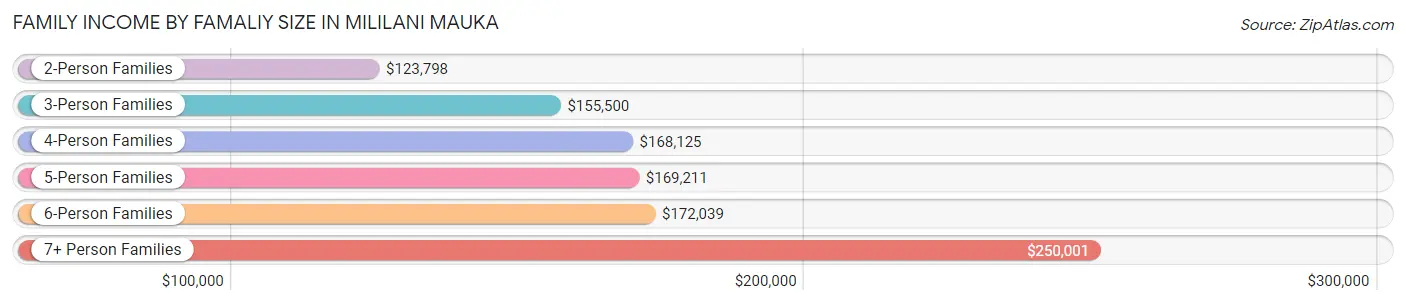
| Income Bracket | # Families | Median Income |
| 2-Person Families | 2,401 (41.6%) | $123,798 |
| 3-Person Families | 1,472 (25.5%) | $155,500 |
| 4-Person Families | 1,016 (17.6%) | $168,125 |
| 5-Person Families | 570 (9.9%) | $169,211 |
| 6-Person Families | 175 (3.0%) | $172,039 |
| 7+ Person Families | 139 (2.4%) | $250,001 |
| Total | 5,773 (100.0%) | $147,648 |
Family Income by Number of Earners in Mililani Mauka
The median family income in Mililani Mauka is $147,648, with families comprising 3+ earners (891) having the highest median family income of $203,325, while families with 1 earner (1,343) have the lowest median family income of $103,596, accounting for 15.4% and 23.3% of families, respectively.
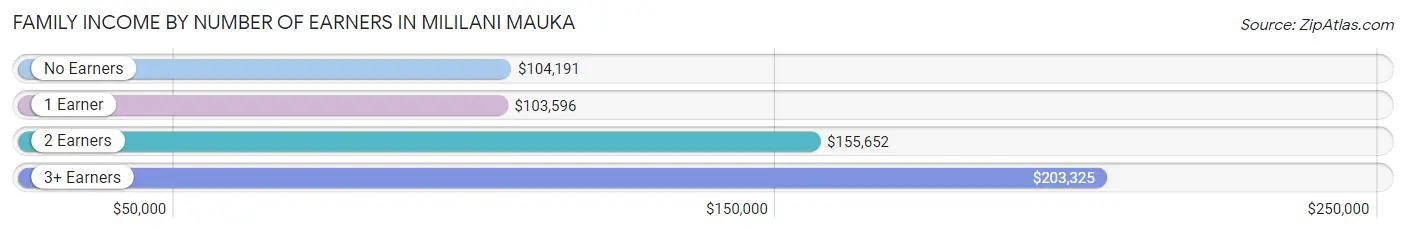
| Number of Earners | # Families | Median Income |
| No Earners | 439 (7.6%) | $104,191 |
| 1 Earner | 1,343 (23.3%) | $103,596 |
| 2 Earners | 3,100 (53.7%) | $155,652 |
| 3+ Earners | 891 (15.4%) | $203,325 |
| Total | 5,773 (100.0%) | $147,648 |
Household Income in Mililani Mauka
Household Income Brackets in Mililani Mauka
With 1,656 households falling in the category, the $100,000 to $149,999 income range is the most frequent in Mililani Mauka, accounting for 22.0% of all households. In contrast, only 15 households (0.2%) fall into the $10,000 to $14,999 income bracket, making it the least populous group.
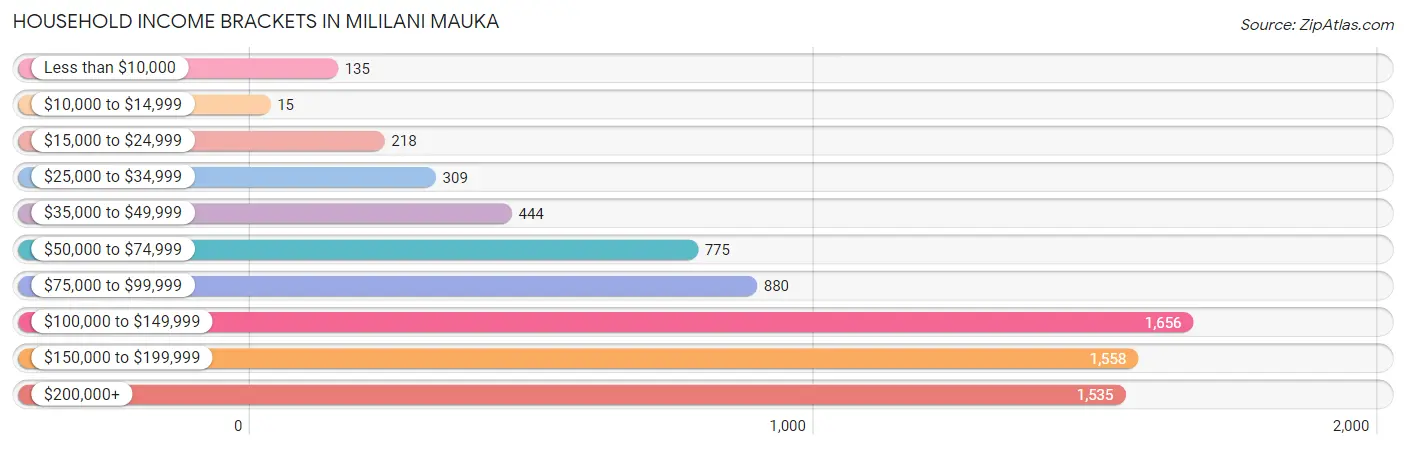
| Income Bracket | # Households | % Households |
| Less than $10,000 | 135 | 1.8% |
| $10,000 to $14,999 | 15 | 0.2% |
| $15,000 to $24,999 | 218 | 2.9% |
| $25,000 to $34,999 | 309 | 4.1% |
| $35,000 to $49,999 | 444 | 5.9% |
| $50,000 to $74,999 | 775 | 10.3% |
| $75,000 to $99,999 | 880 | 11.7% |
| $100,000 to $149,999 | 1,656 | 22.0% |
| $150,000 to $199,999 | 1,558 | 20.7% |
| $200,000+ | 1,535 | 20.4% |
Household Income by Householder Age in Mililani Mauka
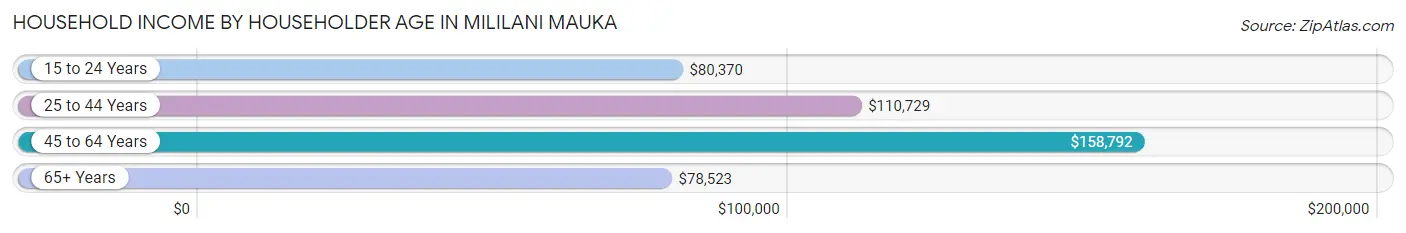
The median household income in Mililani Mauka is $132,043, with the highest median household income of $158,792 found in the 45 to 64 years age bracket for the primary householder. A total of 3,593 households (47.7%) fall into this category. Meanwhile, the 65+ years age bracket for the primary householder has the lowest median household income of $78,523, with 1,340 households (17.8%) in this group.
| Income Bracket | # Households | Median Income |
| 15 to 24 Years | 104 (1.4%) | $80,370 |
| 25 to 44 Years | 2,488 (33.1%) | $110,729 |
| 45 to 64 Years | 3,593 (47.7%) | $158,792 |
| 65+ Years | 1,340 (17.8%) | $78,523 |
| Total | 7,525 (100.0%) | $132,043 |
Poverty in Mililani Mauka
Income Below Poverty by Sex and Age in Mililani Mauka
With 2.9% poverty level for males and 2.5% for females among the residents of Mililani Mauka, 5 year old males and 15 year old females are the most vulnerable to poverty, with 34 males (21.7%) and 10 females (7.9%) in their respective age groups living below the poverty level.
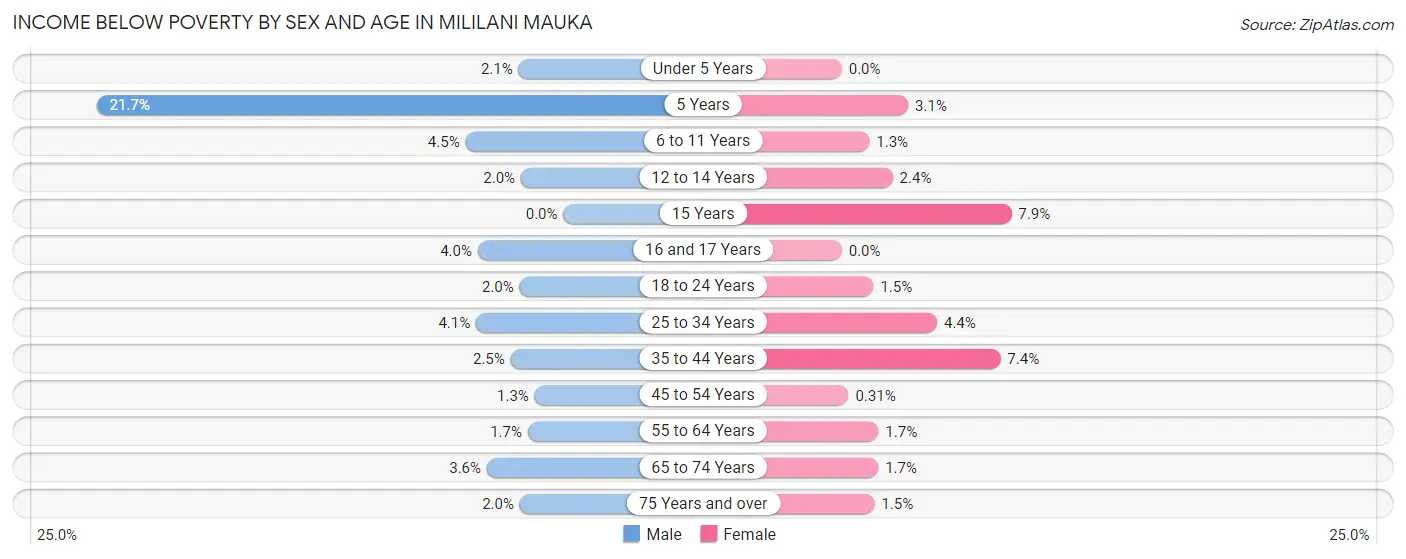
| Age Bracket | Male | Female |
| Under 5 Years | 10 (2.1%) | 0 (0.0%) |
| 5 Years | 34 (21.7%) | 4 (3.1%) |
| 6 to 11 Years | 48 (4.5%) | 12 (1.3%) |
| 12 to 14 Years | 11 (2.0%) | 12 (2.4%) |
| 15 Years | 0 (0.0%) | 10 (7.9%) |
| 16 and 17 Years | 12 (4.0%) | 0 (0.0%) |
| 18 to 24 Years | 19 (2.0%) | 14 (1.5%) |
| 25 to 34 Years | 66 (4.1%) | 51 (4.4%) |
| 35 to 44 Years | 29 (2.5%) | 110 (7.4%) |
| 45 to 54 Years | 21 (1.3%) | 5 (0.3%) |
| 55 to 64 Years | 29 (1.7%) | 29 (1.7%) |
| 65 to 74 Years | 23 (3.5%) | 12 (1.7%) |
| 75 Years and over | 7 (2.0%) | 8 (1.5%) |
| Total | 309 (2.9%) | 267 (2.5%) |
Income Above Poverty by Sex and Age in Mililani Mauka
According to the poverty statistics in Mililani Mauka, males aged 15 years and females aged under 5 years are the age groups that are most secure financially, with 100.0% of males and 100.0% of females in these age groups living above the poverty line.
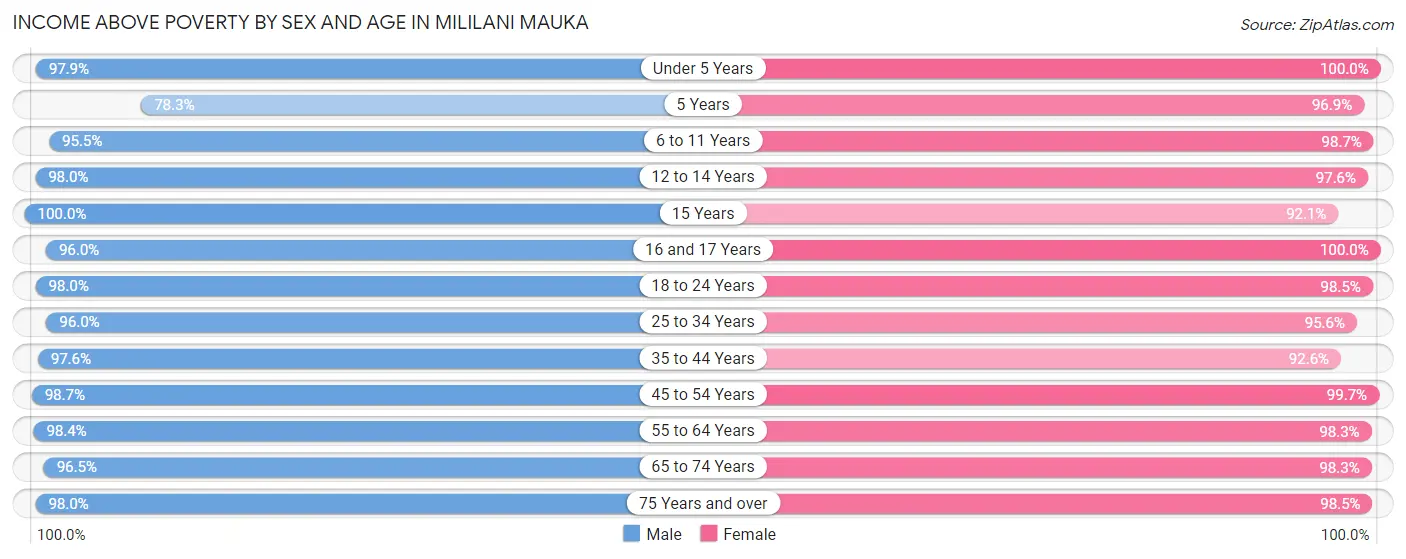
| Age Bracket | Male | Female |
| Under 5 Years | 470 (97.9%) | 535 (100.0%) |
| 5 Years | 123 (78.3%) | 126 (96.9%) |
| 6 to 11 Years | 1,009 (95.5%) | 927 (98.7%) |
| 12 to 14 Years | 546 (98.0%) | 496 (97.6%) |
| 15 Years | 213 (100.0%) | 117 (92.1%) |
| 16 and 17 Years | 290 (96.0%) | 259 (100.0%) |
| 18 to 24 Years | 917 (98.0%) | 937 (98.5%) |
| 25 to 34 Years | 1,562 (96.0%) | 1,104 (95.6%) |
| 35 to 44 Years | 1,157 (97.6%) | 1,385 (92.6%) |
| 45 to 54 Years | 1,560 (98.7%) | 1,610 (99.7%) |
| 55 to 64 Years | 1,733 (98.4%) | 1,675 (98.3%) |
| 65 to 74 Years | 624 (96.5%) | 699 (98.3%) |
| 75 Years and over | 340 (98.0%) | 517 (98.5%) |
| Total | 10,544 (97.2%) | 10,387 (97.5%) |
Income Below Poverty Among Married-Couple Families in Mililani Mauka
The poverty statistics for married-couple families in Mililani Mauka show that 1.6% or 76 of the total 4,764 families live below the poverty line. Families with 3 or 4 children have the highest poverty rate of 4.3%, comprising of 20 families. On the other hand, families with no children have the lowest poverty rate of 1.2%, which includes 31 families.
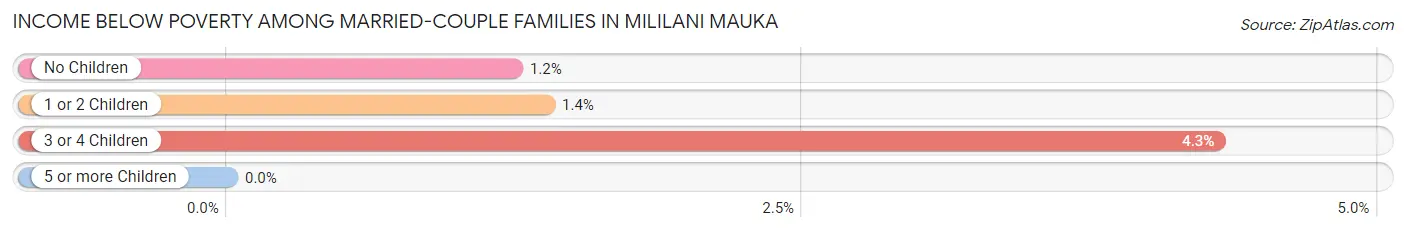
| Children | Above Poverty | Below Poverty |
| No Children | 2,462 (98.8%) | 31 (1.2%) |
| 1 or 2 Children | 1,781 (98.6%) | 25 (1.4%) |
| 3 or 4 Children | 445 (95.7%) | 20 (4.3%) |
| 5 or more Children | 0 (0.0%) | 0 (0.0%) |
| Total | 4,688 (98.4%) | 76 (1.6%) |
Income Below Poverty Among Single-Parent Households in Mililani Mauka
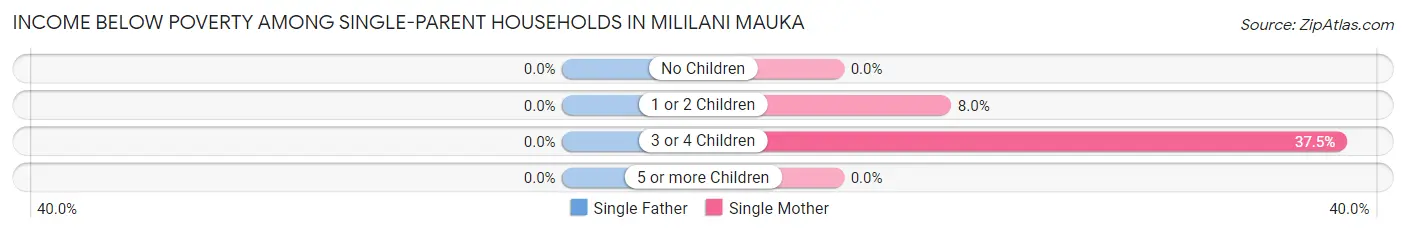
| Children | Single Father | Single Mother |
| No Children | 0 (0.0%) | 0 (0.0%) |
| 1 or 2 Children | 0 (0.0%) | 35 (8.0%) |
| 3 or 4 Children | 0 (0.0%) | 9 (37.5%) |
| 5 or more Children | 0 (0.0%) | 0 (0.0%) |
| Total | 0 (0.0%) | 44 (5.9%) |
Income Below Poverty Among Married-Couple vs Single-Parent Households in Mililani Mauka
The poverty data for Mililani Mauka shows that 76 of the married-couple family households (1.6%) and 44 of the single-parent households (4.4%) are living below the poverty level. Within the married-couple family households, those with 3 or 4 children have the highest poverty rate, with 20 households (4.3%) falling below the poverty line. Among the single-parent households, those with 3 or 4 children have the highest poverty rate, with 9 household (16.4%) living below poverty.
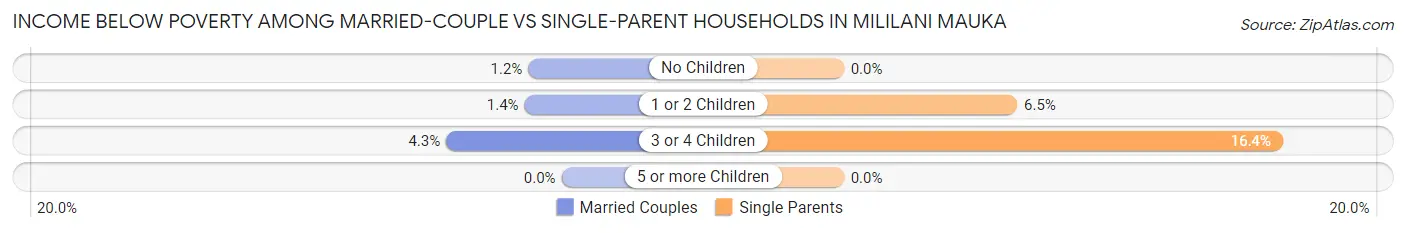
| Children | Married-Couple Families | Single-Parent Households |
| No Children | 31 (1.2%) | 0 (0.0%) |
| 1 or 2 Children | 25 (1.4%) | 35 (6.5%) |
| 3 or 4 Children | 20 (4.3%) | 9 (16.4%) |
| 5 or more Children | 0 (0.0%) | 0 (0.0%) |
| Total | 76 (1.6%) | 44 (4.4%) |
Race in Mililani Mauka
The most populous races in Mililani Mauka are Asian (11,370 | 52.8%), Two or more Races (5,132 | 23.8%), and White / Caucasian (3,079 | 14.3%).
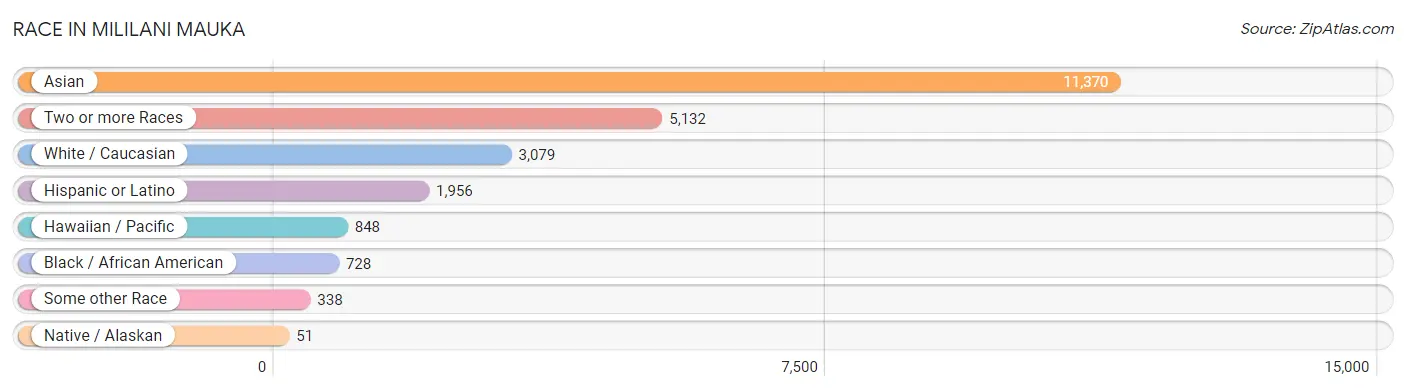
| Race | # Population | % Population |
| Asian | 11,370 | 52.8% |
| Black / African American | 728 | 3.4% |
| Hawaiian / Pacific | 848 | 3.9% |
| Hispanic or Latino | 1,956 | 9.1% |
| Native / Alaskan | 51 | 0.2% |
| White / Caucasian | 3,079 | 14.3% |
| Two or more Races | 5,132 | 23.8% |
| Some other Race | 338 | 1.6% |
| Total | 21,546 | 100.0% |
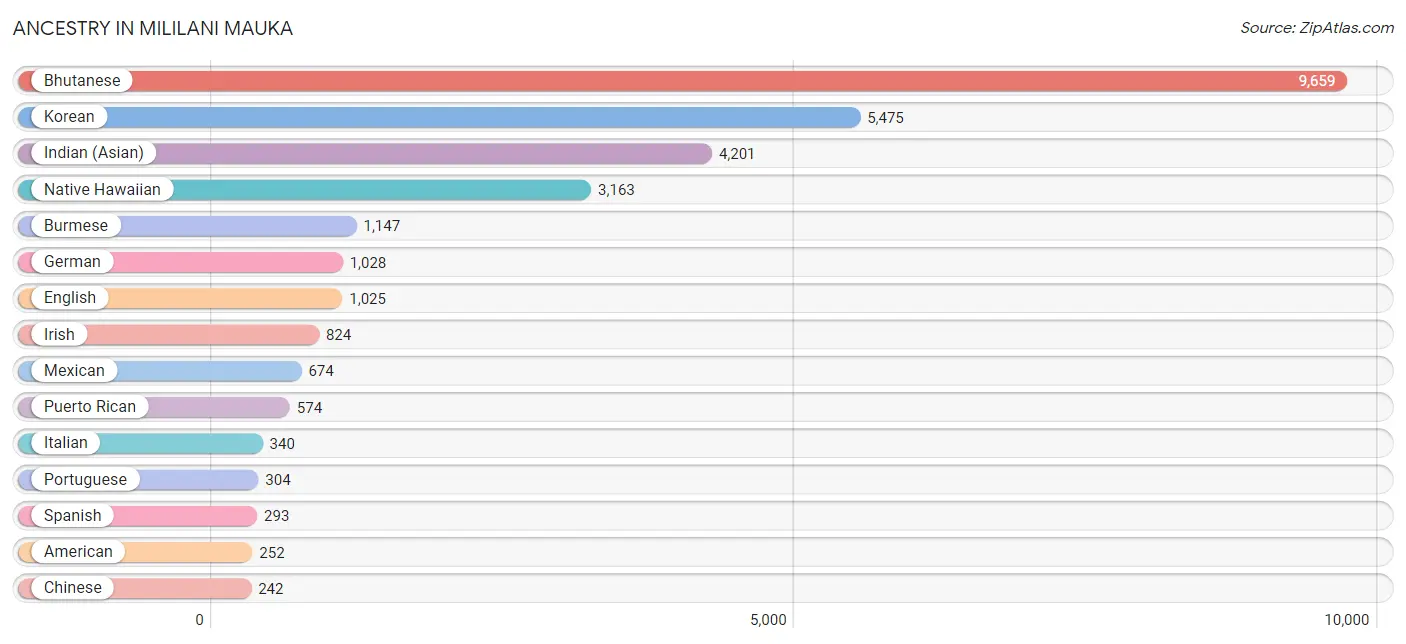
Ancestry in Mililani Mauka
The most populous ancestries reported in Mililani Mauka are Bhutanese (9,659 | 44.8%), Korean (5,475 | 25.4%), Indian (Asian) (4,201 | 19.5%), Native Hawaiian (3,163 | 14.7%), and Burmese (1,147 | 5.3%), together accounting for 109.7% of all Mililani Mauka residents.
| Ancestry | # Population | % Population |
| African | 8 | 0.0% |
| American | 252 | 1.2% |
| Australian | 40 | 0.2% |
| Austrian | 16 | 0.1% |
| Bhutanese | 9,659 | 44.8% |
| Blackfeet | 17 | 0.1% |
| British | 74 | 0.3% |
| Burmese | 1,147 | 5.3% |
| Canadian | 5 | 0.0% |
| Central American | 50 | 0.2% |
| Cherokee | 106 | 0.5% |
| Chinese | 242 | 1.1% |
| Chippewa | 25 | 0.1% |
| Creek | 6 | 0.0% |
| Cuban | 11 | 0.1% |
| Czech | 10 | 0.1% |
| Danish | 140 | 0.6% |
| Dominican | 142 | 0.7% |
| Dutch | 56 | 0.3% |
| English | 1,025 | 4.8% |
| European | 69 | 0.3% |
| Fijian | 37 | 0.2% |
| Filipino | 9 | 0.0% |
| Finnish | 25 | 0.1% |
| French | 150 | 0.7% |
| French Canadian | 4 | 0.0% |
| German | 1,028 | 4.8% |
| Greek | 36 | 0.2% |
| Guamanian / Chamorro | 121 | 0.6% |
| Honduran | 8 | 0.0% |
| Hungarian | 30 | 0.1% |
| Indian (Asian) | 4,201 | 19.5% |
| Irish | 824 | 3.8% |
| Italian | 340 | 1.6% |
| Jamaican | 61 | 0.3% |
| Korean | 5,475 | 25.4% |
| Laotian | 33 | 0.2% |
| Liberian | 42 | 0.2% |
| Malaysian | 116 | 0.5% |
| Mexican | 674 | 3.1% |
| Mexican American Indian | 17 | 0.1% |
| Mongolian | 20 | 0.1% |
| Native Hawaiian | 3,163 | 14.7% |
| Navajo | 56 | 0.3% |
| Nigerian | 20 | 0.1% |
| Northern European | 36 | 0.2% |
| Norwegian | 82 | 0.4% |
| Pakistani | 38 | 0.2% |
| Panamanian | 25 | 0.1% |
| Polish | 82 | 0.4% |
| Portuguese | 304 | 1.4% |
| Puerto Rican | 574 | 2.7% |
| Romanian | 27 | 0.1% |
| Russian | 58 | 0.3% |
| Salvadoran | 17 | 0.1% |
| Samoan | 212 | 1.0% |
| Scandinavian | 37 | 0.2% |
| Scotch-Irish | 45 | 0.2% |
| Scottish | 60 | 0.3% |
| Spaniard | 82 | 0.4% |
| Spanish | 293 | 1.4% |
| Spanish American | 22 | 0.1% |
| Sri Lankan | 52 | 0.2% |
| Subsaharan African | 70 | 0.3% |
| Swedish | 170 | 0.8% |
| Swiss | 12 | 0.1% |
| Thai | 18 | 0.1% |
| Tongan | 26 | 0.1% |
| Trinidadian and Tobagonian | 30 | 0.1% |
| Turkish | 7 | 0.0% |
| Ukrainian | 10 | 0.1% |
| Ute | 21 | 0.1% |
| Welsh | 15 | 0.1% | View All 73 Rows |
Immigrants in Mililani Mauka
The most numerous immigrant groups reported in Mililani Mauka came from Asia (1,704 | 7.9%), South Eastern Asia (969 | 4.5%), Philippines (831 | 3.9%), Eastern Asia (717 | 3.3%), and Japan (302 | 1.4%), together accounting for 21.0% of all Mililani Mauka residents.
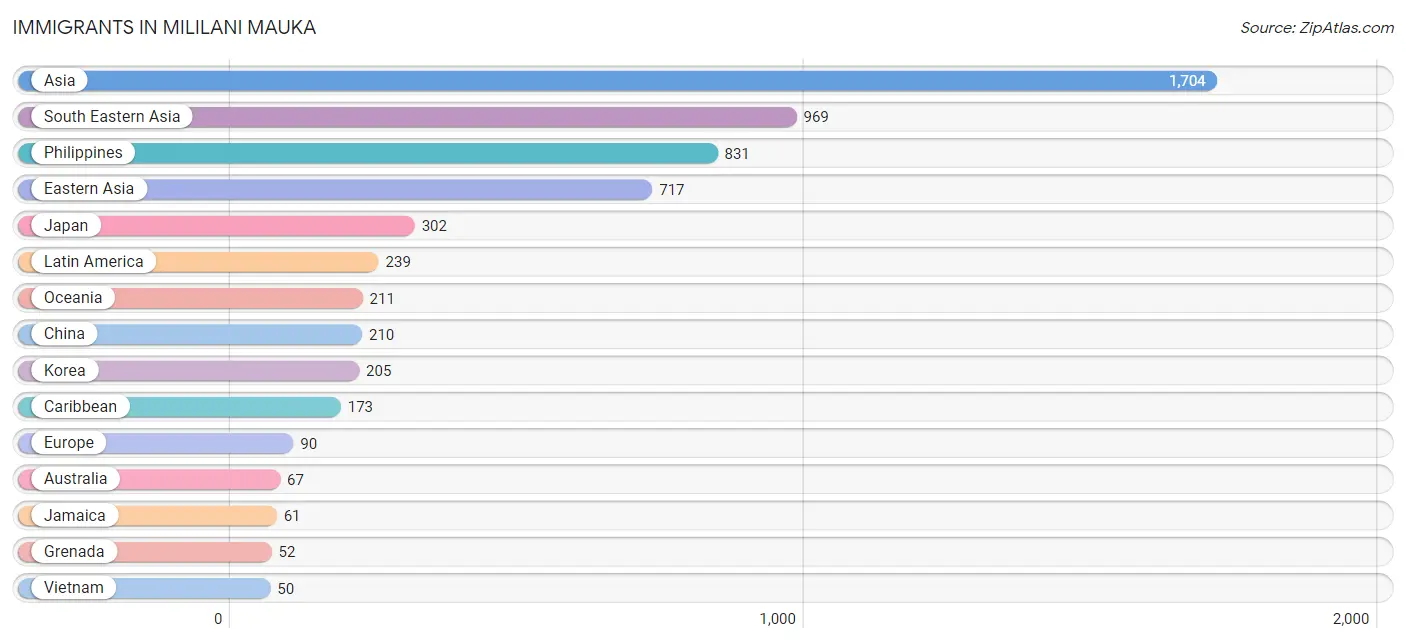
| Immigration Origin | # Population | % Population |
| Africa | 25 | 0.1% |
| Asia | 1,704 | 7.9% |
| Australia | 67 | 0.3% |
| Canada | 14 | 0.1% |
| Caribbean | 173 | 0.8% |
| Central America | 47 | 0.2% |
| China | 210 | 1.0% |
| Colombia | 6 | 0.0% |
| Dominican Republic | 30 | 0.1% |
| Eastern Asia | 717 | 3.3% |
| Eastern Europe | 40 | 0.2% |
| El Salvador | 15 | 0.1% |
| Europe | 90 | 0.4% |
| France | 5 | 0.0% |
| Germany | 29 | 0.1% |
| Grenada | 52 | 0.2% |
| Honduras | 7 | 0.0% |
| Hong Kong | 47 | 0.2% |
| Indonesia | 15 | 0.1% |
| Jamaica | 61 | 0.3% |
| Japan | 302 | 1.4% |
| Korea | 205 | 0.9% |
| Laos | 17 | 0.1% |
| Latin America | 239 | 1.1% |
| Liberia | 25 | 0.1% |
| Malaysia | 37 | 0.2% |
| Mexico | 18 | 0.1% |
| Micronesia | 12 | 0.1% |
| Moldova | 9 | 0.0% |
| Nepal | 11 | 0.1% |
| Northern Europe | 16 | 0.1% |
| Norway | 16 | 0.1% |
| Oceania | 211 | 1.0% |
| Panama | 7 | 0.0% |
| Peru | 13 | 0.1% |
| Philippines | 831 | 3.9% |
| Romania | 6 | 0.0% |
| Russia | 13 | 0.1% |
| South America | 19 | 0.1% |
| South Central Asia | 11 | 0.1% |
| South Eastern Asia | 969 | 4.5% |
| Taiwan | 41 | 0.2% |
| Thailand | 19 | 0.1% |
| Trinidad and Tobago | 30 | 0.1% |
| Turkey | 7 | 0.0% |
| Vietnam | 50 | 0.2% |
| Western Africa | 25 | 0.1% |
| Western Asia | 7 | 0.0% |
| Western Europe | 34 | 0.2% | View All 49 Rows |
Sex and Age in Mililani Mauka
Sex and Age in Mililani Mauka
The most populous age groups in Mililani Mauka are 55 to 59 Years (1,085 | 10.0%) for men and 55 to 59 Years (1,087 | 10.2%) for women.
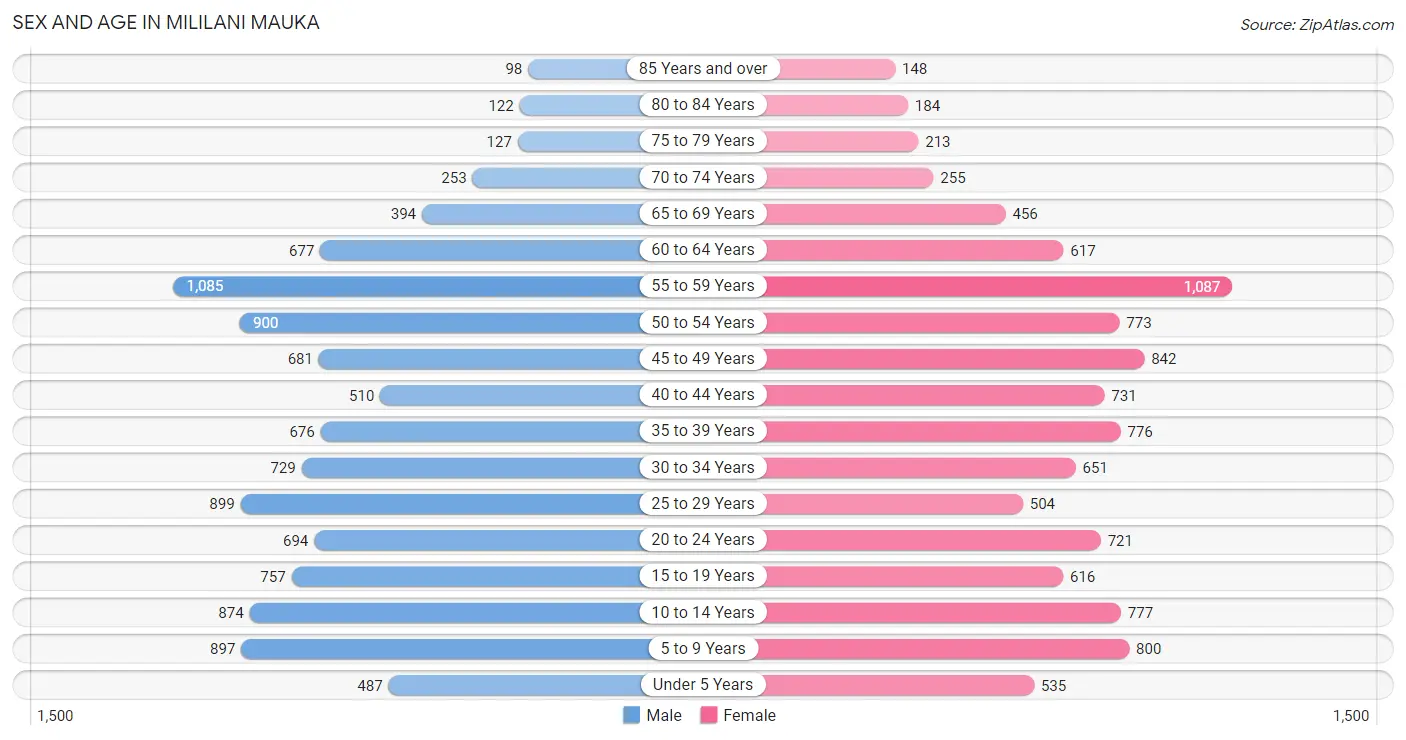
| Age Bracket | Male | Female |
| Under 5 Years | 487 (4.5%) | 535 (5.0%) |
| 5 to 9 Years | 897 (8.3%) | 800 (7.5%) |
| 10 to 14 Years | 874 (8.1%) | 777 (7.3%) |
| 15 to 19 Years | 757 (7.0%) | 616 (5.8%) |
| 20 to 24 Years | 694 (6.4%) | 721 (6.8%) |
| 25 to 29 Years | 899 (8.3%) | 504 (4.7%) |
| 30 to 34 Years | 729 (6.7%) | 651 (6.1%) |
| 35 to 39 Years | 676 (6.2%) | 776 (7.3%) |
| 40 to 44 Years | 510 (4.7%) | 731 (6.8%) |
| 45 to 49 Years | 681 (6.3%) | 842 (7.9%) |
| 50 to 54 Years | 900 (8.3%) | 773 (7.2%) |
| 55 to 59 Years | 1,085 (10.0%) | 1,087 (10.2%) |
| 60 to 64 Years | 677 (6.2%) | 617 (5.8%) |
| 65 to 69 Years | 394 (3.6%) | 456 (4.3%) |
| 70 to 74 Years | 253 (2.3%) | 255 (2.4%) |
| 75 to 79 Years | 127 (1.2%) | 213 (2.0%) |
| 80 to 84 Years | 122 (1.1%) | 184 (1.7%) |
| 85 Years and over | 98 (0.9%) | 148 (1.4%) |
| Total | 10,860 (100.0%) | 10,686 (100.0%) |
Families and Households in Mililani Mauka
Median Family Size in Mililani Mauka
The median family size in Mililani Mauka is 3.31 persons per family, with single male/father families (263 | 4.6%) accounting for the largest median family size of 3.46 persons per family. On the other hand, single female/mother families (746 | 12.9%) represent the smallest median family size with 2.77 persons per family.
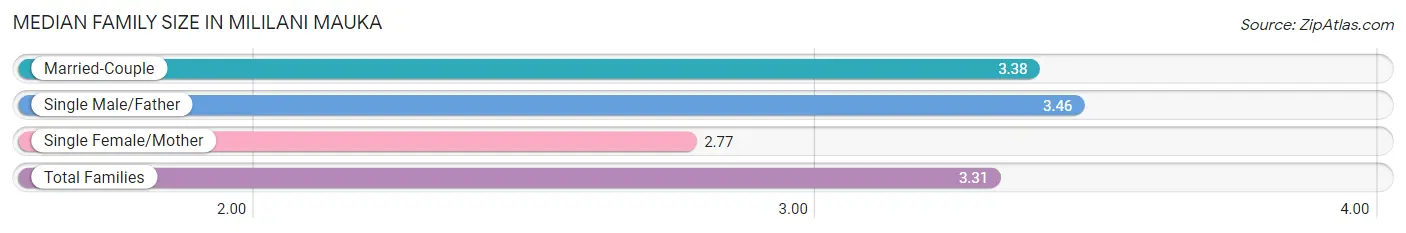
| Family Type | # Families | Family Size |
| Married-Couple | 4,764 (82.5%) | 3.38 |
| Single Male/Father | 263 (4.6%) | 3.46 |
| Single Female/Mother | 746 (12.9%) | 2.77 |
| Total Families | 5,773 (100.0%) | 3.31 |
Median Household Size in Mililani Mauka
The median household size in Mililani Mauka is 2.86 persons per household, with single male/father households (263 | 3.5%) accounting for the largest median household size of 3.81 persons per household. non-family households (1,752 | 23.3%) represent the smallest median household size with 1.22 persons per household.
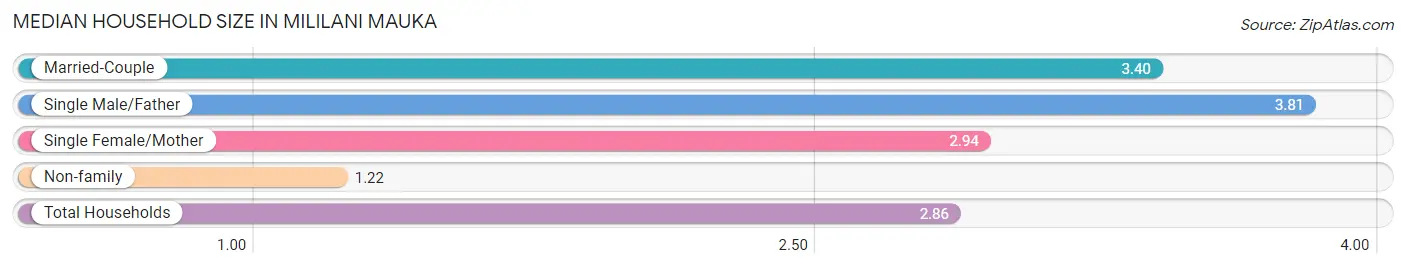
| Household Type | # Households | Household Size |
| Married-Couple | 4,764 (63.3%) | 3.40 |
| Single Male/Father | 263 (3.5%) | 3.81 |
| Single Female/Mother | 746 (9.9%) | 2.94 |
| Non-family | 1,752 (23.3%) | 1.22 |
| Total Households | 7,525 (100.0%) | 2.86 |
Household Size by Marriage Status in Mililani Mauka
Out of a total of 7,525 households in Mililani Mauka, 5,773 (76.7%) are family households, while 1,752 (23.3%) are nonfamily households. The most numerous type of family households are 2-person households, comprising 2,330, and the most common type of nonfamily households are 1-person households, comprising 1,434.
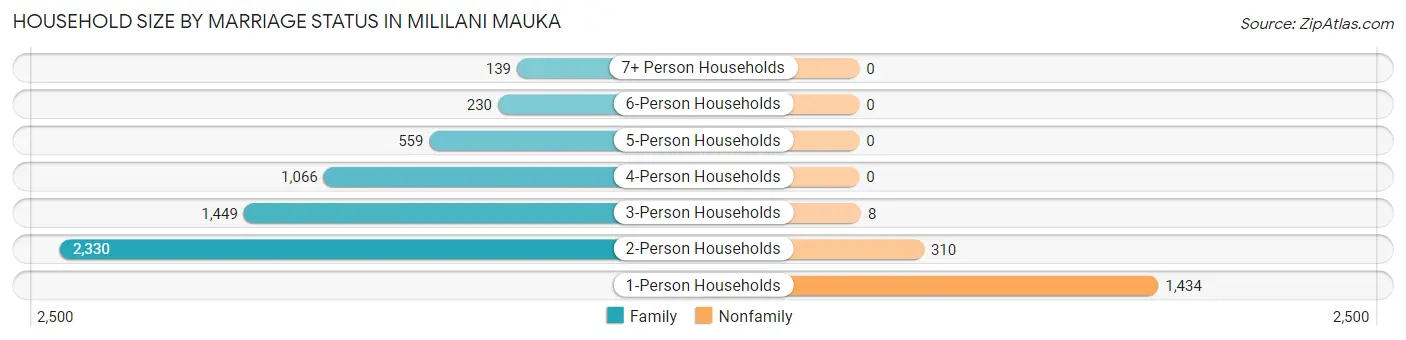
| Household Size | Family Households | Nonfamily Households |
| 1-Person Households | - | 1,434 (19.1%) |
| 2-Person Households | 2,330 (31.0%) | 310 (4.1%) |
| 3-Person Households | 1,449 (19.3%) | 8 (0.1%) |
| 4-Person Households | 1,066 (14.2%) | 0 (0.0%) |
| 5-Person Households | 559 (7.4%) | 0 (0.0%) |
| 6-Person Households | 230 (3.1%) | 0 (0.0%) |
| 7+ Person Households | 139 (1.8%) | 0 (0.0%) |
| Total | 5,773 (76.7%) | 1,752 (23.3%) |
Female Fertility in Mililani Mauka
Fertility by Age in Mililani Mauka
Average fertility rate in Mililani Mauka is 61.0 births per 1,000 women. Women in the age bracket of 20 to 34 years have the highest fertility rate with 115.0 births per 1,000 women. Women in the age bracket of 20 to 34 years acount for 70.6% of all women with births.
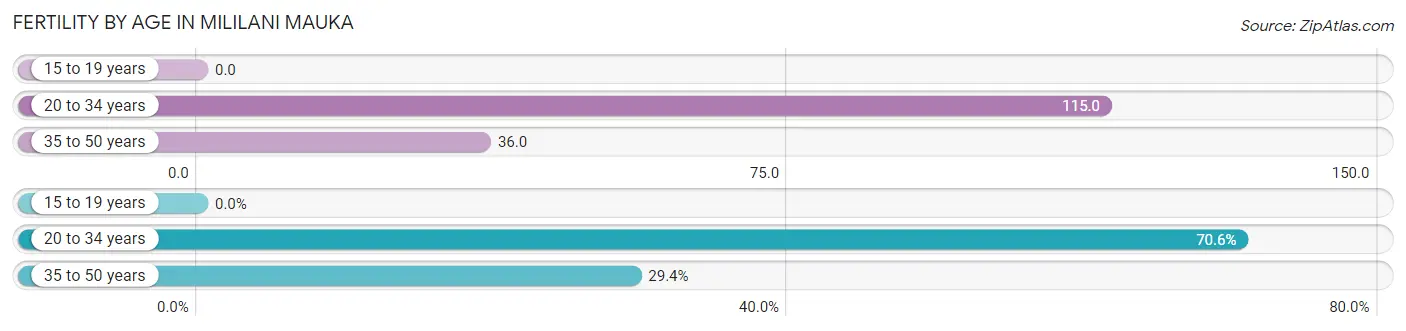
| Age Bracket | Women with Births | Births / 1,000 Women |
| 15 to 19 years | 0 (0.0%) | 0.0 |
| 20 to 34 years | 216 (70.6%) | 115.0 |
| 35 to 50 years | 90 (29.4%) | 36.0 |
| Total | 306 (100.0%) | 61.0 |
Fertility by Age by Marriage Status in Mililani Mauka
80.1% of women with births (306) in Mililani Mauka are married. The highest percentage of unmarried women with births falls into 35 to 50 years age bracket with 36.7% of them unmarried at the time of birth, while the lowest percentage of unmarried women with births belong to 20 to 34 years age bracket with 13.0% of them unmarried.
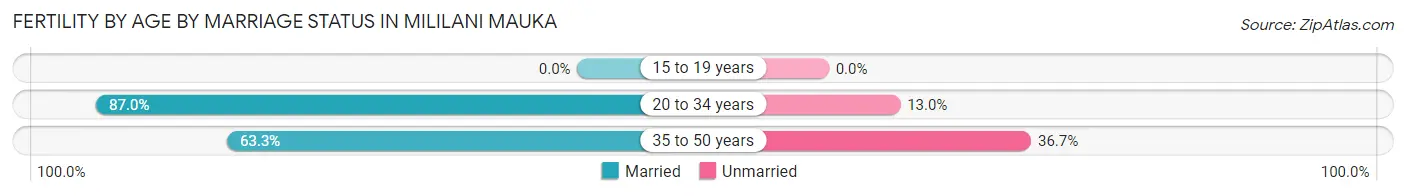
| Age Bracket | Married | Unmarried |
| 15 to 19 years | 0 (0.0%) | 0 (0.0%) |
| 20 to 34 years | 188 (87.0%) | 28 (13.0%) |
| 35 to 50 years | 57 (63.3%) | 33 (36.7%) |
| Total | 245 (80.1%) | 61 (19.9%) |
Fertility by Education in Mililani Mauka
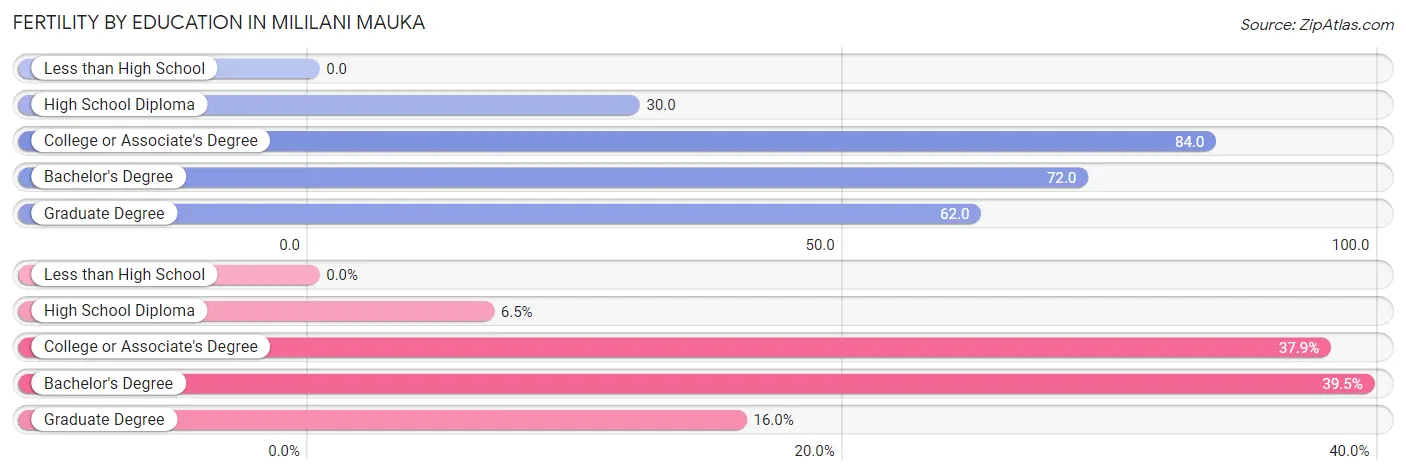
| Educational Attainment | Women with Births | Births / 1,000 Women |
| Less than High School | 0 (0.0%) | 0.0 |
| High School Diploma | 20 (6.5%) | 30.0 |
| College or Associate's Degree | 116 (37.9%) | 84.0 |
| Bachelor's Degree | 121 (39.5%) | 72.0 |
| Graduate Degree | 49 (16.0%) | 62.0 |
| Total | 306 (100.0%) | 61.0 |
Fertility by Education by Marriage Status in Mililani Mauka
19.9% of women with births in Mililani Mauka are unmarried. Women with the educational attainment of high school diploma are most likely to be married with 100.0% of them married at childbirth, while women with the educational attainment of college or associate's degree are least likely to be married with 33.6% of them unmarried at childbirth.
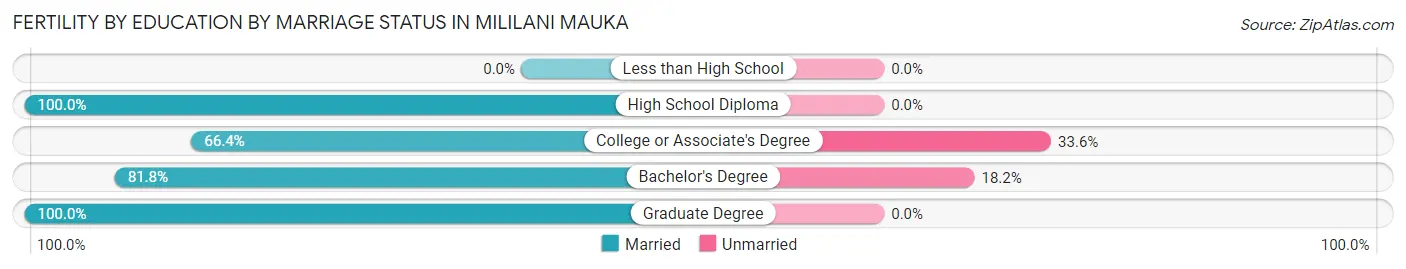
| Educational Attainment | Married | Unmarried |
| Less than High School | 0 (0.0%) | 0 (0.0%) |
| High School Diploma | 20 (100.0%) | 0 (0.0%) |
| College or Associate's Degree | 77 (66.4%) | 39 (33.6%) |
| Bachelor's Degree | 99 (81.8%) | 22 (18.2%) |
| Graduate Degree | 49 (100.0%) | 0 (0.0%) |
| Total | 245 (80.1%) | 61 (19.9%) |
Employment Characteristics in Mililani Mauka
Employment by Class of Employer in Mililani Mauka
Among the 11,944 employed individuals in Mililani Mauka, private company employees (5,797 | 48.5%), federal government employees (2,496 | 20.9%), and state government employees (1,469 | 12.3%) make up the most common classes of employment.
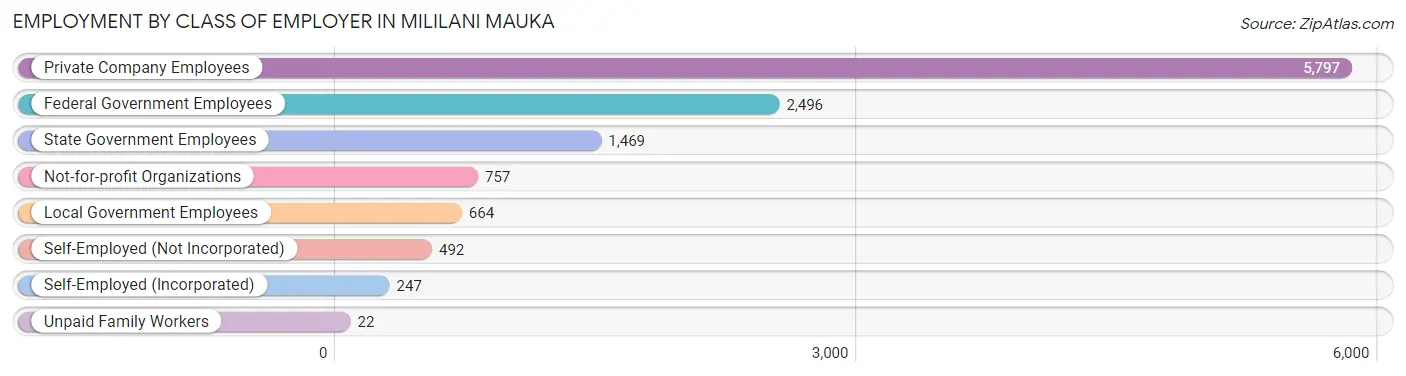
| Employer Class | # Employees | % Employees |
| Private Company Employees | 5,797 | 48.5% |
| Self-Employed (Incorporated) | 247 | 2.1% |
| Self-Employed (Not Incorporated) | 492 | 4.1% |
| Not-for-profit Organizations | 757 | 6.3% |
| Local Government Employees | 664 | 5.6% |
| State Government Employees | 1,469 | 12.3% |
| Federal Government Employees | 2,496 | 20.9% |
| Unpaid Family Workers | 22 | 0.2% |
| Total | 11,944 | 100.0% |
Employment Status by Age in Mililani Mauka
According to the labor force statistics for Mililani Mauka, out of the total population over 16 years of age (16,836), 73.5% or 12,374 individuals are in the labor force, with 2.0% or 247 of them unemployed. The age group with the highest labor force participation rate is 45 to 54 years, with 93.0% or 2,972 individuals in the labor force. Within the labor force, the 16 to 19 years age range has the highest percentage of unemployed individuals, with 5.7% or 21 of them being unemployed.
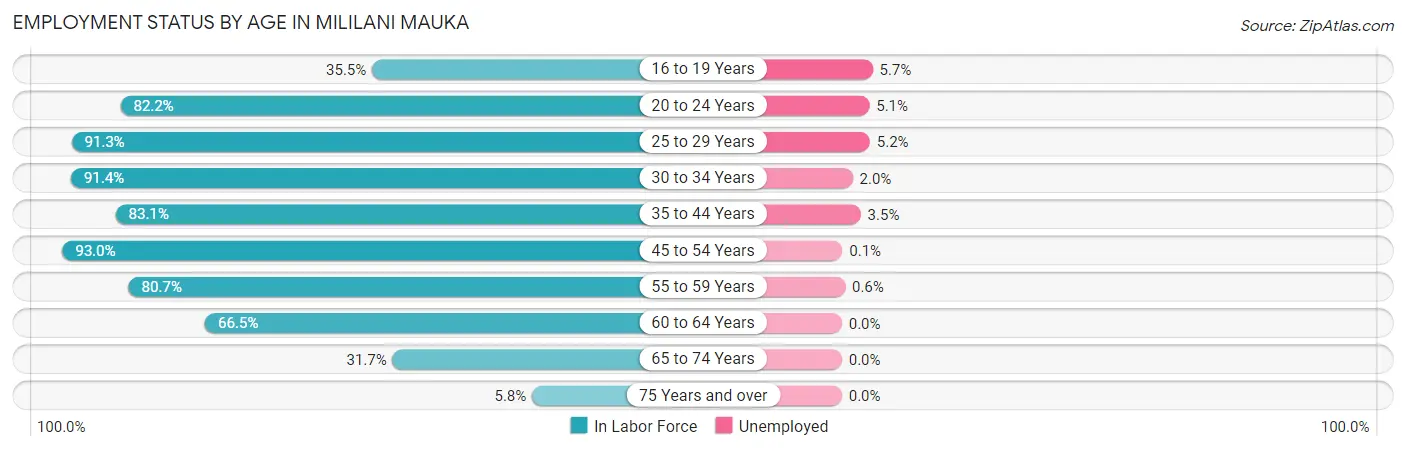
| Age Bracket | In Labor Force | Unemployed |
| 16 to 19 Years | 367 (35.5%) | 21 (5.7%) |
| 20 to 24 Years | 1,163 (82.2%) | 59 (5.1%) |
| 25 to 29 Years | 1,281 (91.3%) | 67 (5.2%) |
| 30 to 34 Years | 1,261 (91.4%) | 25 (2.0%) |
| 35 to 44 Years | 2,238 (83.1%) | 78 (3.5%) |
| 45 to 54 Years | 2,972 (93.0%) | 3 (0.1%) |
| 55 to 59 Years | 1,753 (80.7%) | 11 (0.6%) |
| 60 to 64 Years | 861 (66.5%) | 0 (0.0%) |
| 65 to 74 Years | 430 (31.7%) | 0 (0.0%) |
| 75 Years and over | 52 (5.8%) | 0 (0.0%) |
| Total | 12,374 (73.5%) | 247 (2.0%) |
Employment Status by Educational Attainment in Mililani Mauka
According to labor force statistics for Mililani Mauka, 85.4% of individuals (10,366) out of the total population between 25 and 64 years of age (12,138) are in the labor force, with 1.6% or 166 of them being unemployed. The group with the highest labor force participation rate are those with the educational attainment of bachelor's degree or higher, with 88.3% or 5,619 individuals in the labor force. Within the labor force, individuals with college / associate degree education have the highest percentage of unemployment, with 2.0% or 65 of them being unemployed.
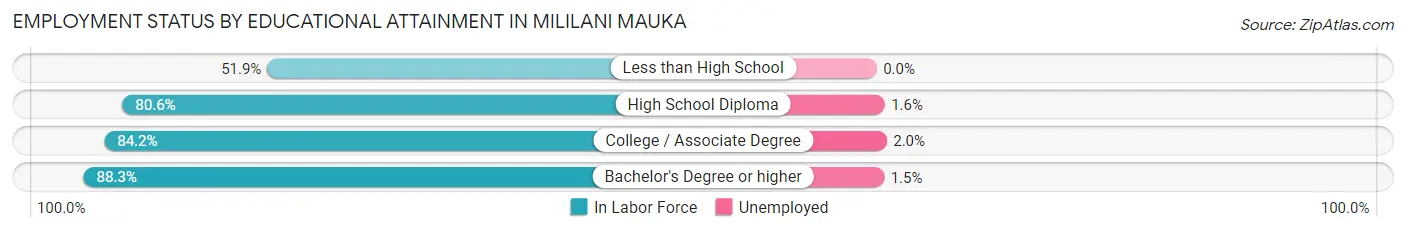
| Educational Attainment | In Labor Force | Unemployed |
| Less than High School | 83 (51.9%) | 0 (0.0%) |
| High School Diploma | 1,432 (80.6%) | 28 (1.6%) |
| College / Associate Degree | 3,232 (84.2%) | 77 (2.0%) |
| Bachelor's Degree or higher | 5,619 (88.3%) | 95 (1.5%) |
| Total | 10,366 (85.4%) | 194 (1.6%) |
Employment Occupations by Sex in Mililani Mauka
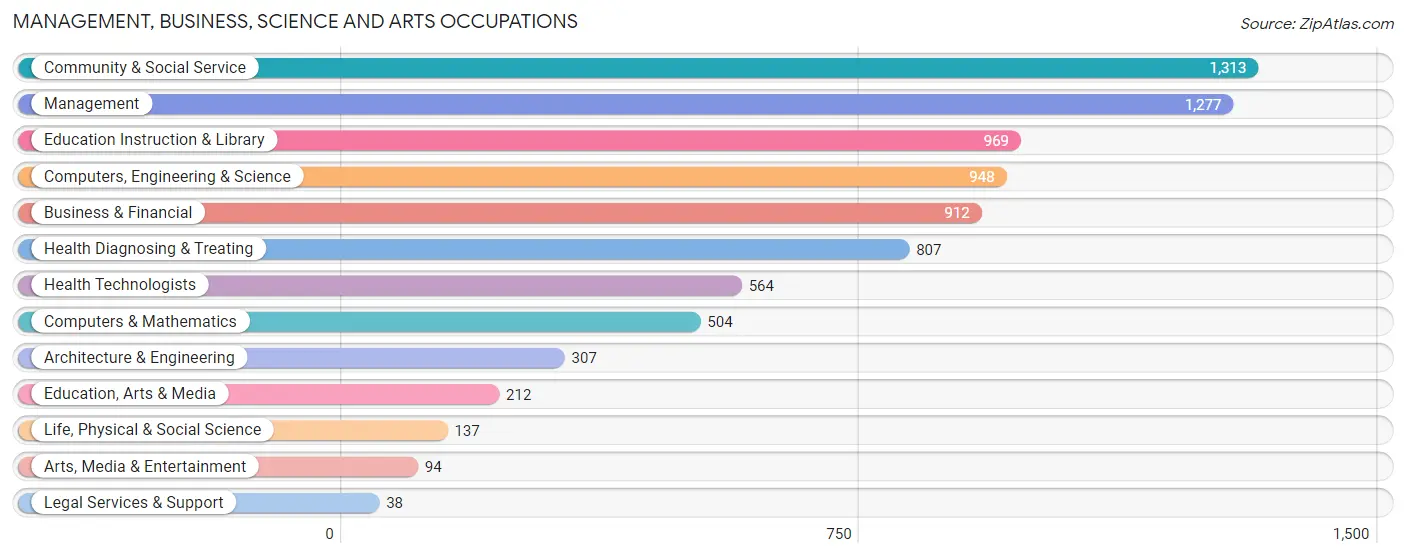
Management, Business, Science and Arts Occupations
The most common Management, Business, Science and Arts occupations in Mililani Mauka are Community & Social Service (1,313 | 11.6%), Management (1,277 | 11.3%), Education Instruction & Library (969 | 8.6%), Computers, Engineering & Science (948 | 8.4%), and Business & Financial (912 | 8.1%).
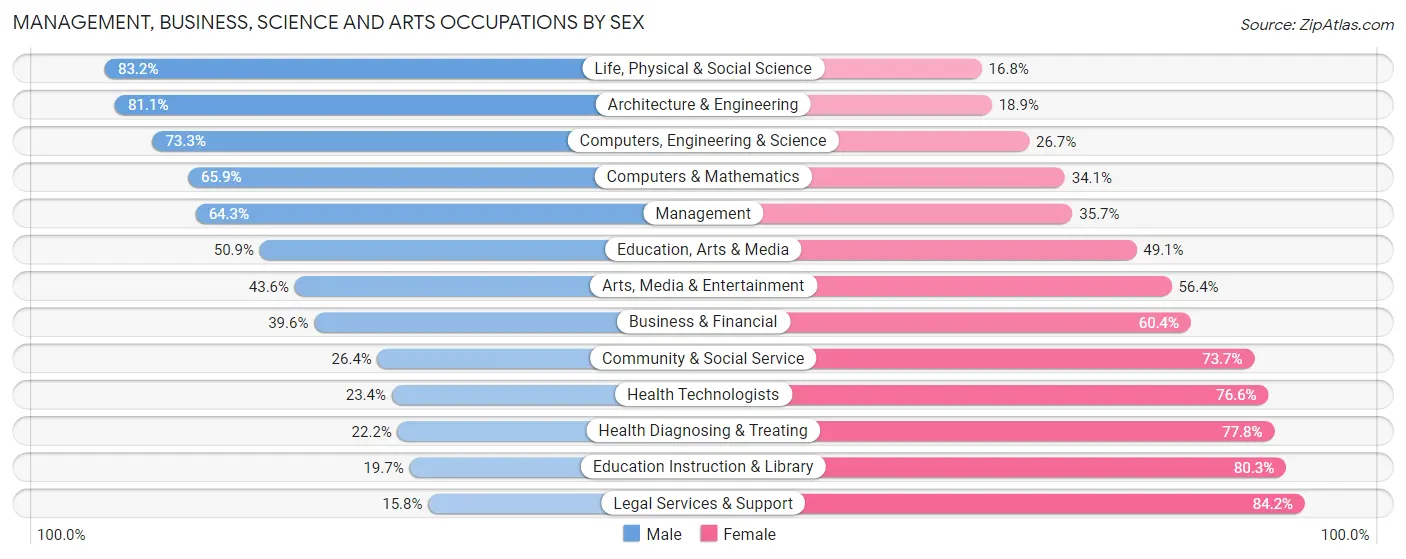
Management, Business, Science and Arts Occupations by Sex
Within the Management, Business, Science and Arts occupations in Mililani Mauka, the most male-oriented occupations are Life, Physical & Social Science (83.2%), Architecture & Engineering (81.1%), and Computers, Engineering & Science (73.3%), while the most female-oriented occupations are Legal Services & Support (84.2%), Education Instruction & Library (80.3%), and Health Diagnosing & Treating (77.8%).
| Occupation | Male | Female |
| Management | 821 (64.3%) | 456 (35.7%) |
| Business & Financial | 361 (39.6%) | 551 (60.4%) |
| Computers, Engineering & Science | 695 (73.3%) | 253 (26.7%) |
| Computers & Mathematics | 332 (65.9%) | 172 (34.1%) |
| Architecture & Engineering | 249 (81.1%) | 58 (18.9%) |
| Life, Physical & Social Science | 114 (83.2%) | 23 (16.8%) |
| Community & Social Service | 346 (26.4%) | 967 (73.7%) |
| Education, Arts & Media | 108 (50.9%) | 104 (49.1%) |
| Legal Services & Support | 6 (15.8%) | 32 (84.2%) |
| Education Instruction & Library | 191 (19.7%) | 778 (80.3%) |
| Arts, Media & Entertainment | 41 (43.6%) | 53 (56.4%) |
| Health Diagnosing & Treating | 179 (22.2%) | 628 (77.8%) |
| Health Technologists | 132 (23.4%) | 432 (76.6%) |
| Total (Category) | 2,402 (45.7%) | 2,855 (54.3%) |
| Total (Overall) | 5,785 (51.3%) | 5,494 (48.7%) |
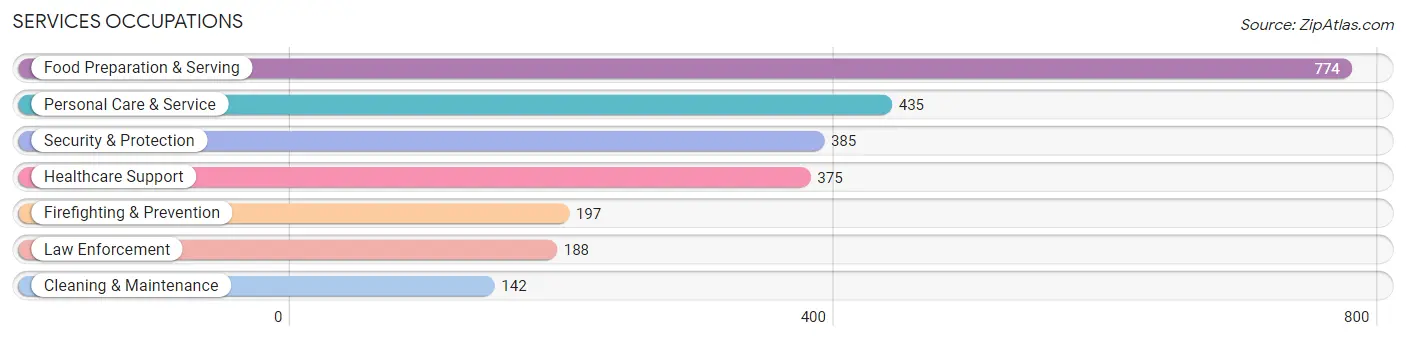
Services Occupations
The most common Services occupations in Mililani Mauka are Food Preparation & Serving (774 | 6.9%), Personal Care & Service (435 | 3.9%), Security & Protection (385 | 3.4%), Healthcare Support (375 | 3.3%), and Firefighting & Prevention (197 | 1.8%).
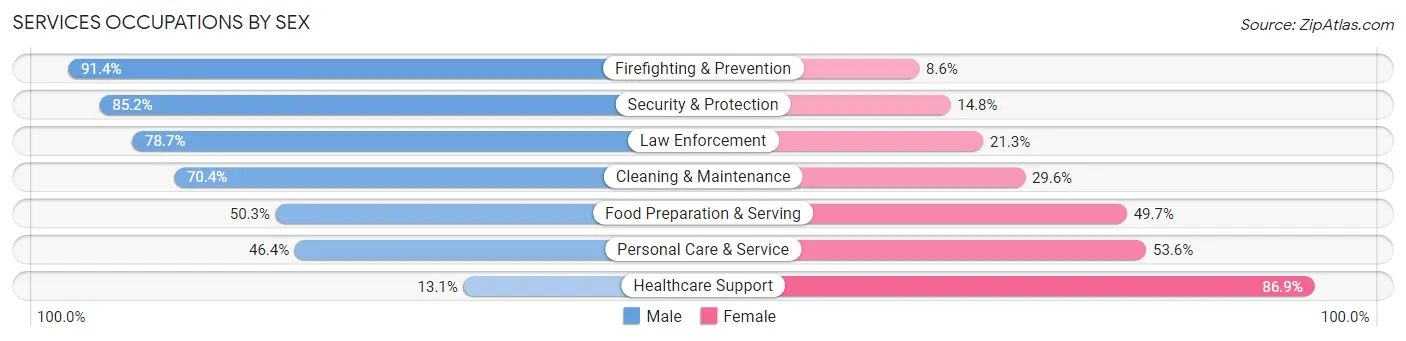
Services Occupations by Sex
Within the Services occupations in Mililani Mauka, the most male-oriented occupations are Firefighting & Prevention (91.4%), Security & Protection (85.2%), and Law Enforcement (78.7%), while the most female-oriented occupations are Healthcare Support (86.9%), Personal Care & Service (53.6%), and Food Preparation & Serving (49.7%).
| Occupation | Male | Female |
| Healthcare Support | 49 (13.1%) | 326 (86.9%) |
| Security & Protection | 328 (85.2%) | 57 (14.8%) |
| Firefighting & Prevention | 180 (91.4%) | 17 (8.6%) |
| Law Enforcement | 148 (78.7%) | 40 (21.3%) |
| Food Preparation & Serving | 389 (50.3%) | 385 (49.7%) |
| Cleaning & Maintenance | 100 (70.4%) | 42 (29.6%) |
| Personal Care & Service | 202 (46.4%) | 233 (53.6%) |
| Total (Category) | 1,068 (50.6%) | 1,043 (49.4%) |
| Total (Overall) | 5,785 (51.3%) | 5,494 (48.7%) |
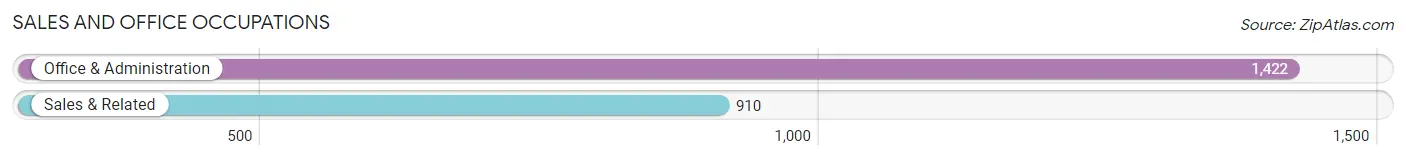
Sales and Office Occupations
The most common Sales and Office occupations in Mililani Mauka are Office & Administration (1,422 | 12.6%), and Sales & Related (910 | 8.1%).
Sales and Office Occupations by Sex
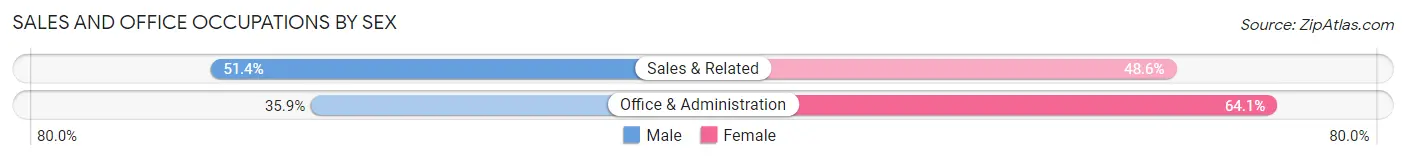
| Occupation | Male | Female |
| Sales & Related | 468 (51.4%) | 442 (48.6%) |
| Office & Administration | 511 (35.9%) | 911 (64.1%) |
| Total (Category) | 979 (42.0%) | 1,353 (58.0%) |
| Total (Overall) | 5,785 (51.3%) | 5,494 (48.7%) |
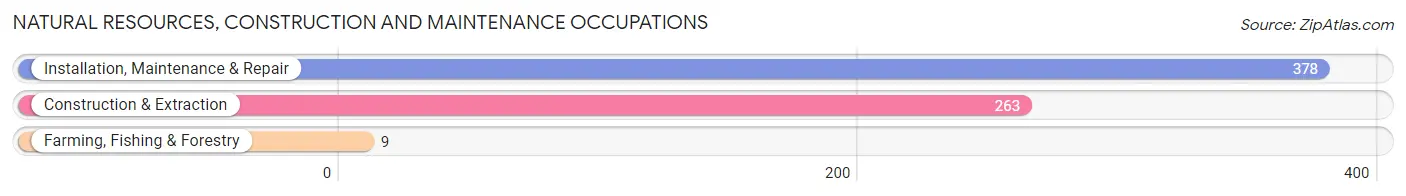
Natural Resources, Construction and Maintenance Occupations
The most common Natural Resources, Construction and Maintenance occupations in Mililani Mauka are Installation, Maintenance & Repair (378 | 3.4%), Construction & Extraction (263 | 2.3%), and Farming, Fishing & Forestry (9 | 0.1%).
Natural Resources, Construction and Maintenance Occupations by Sex
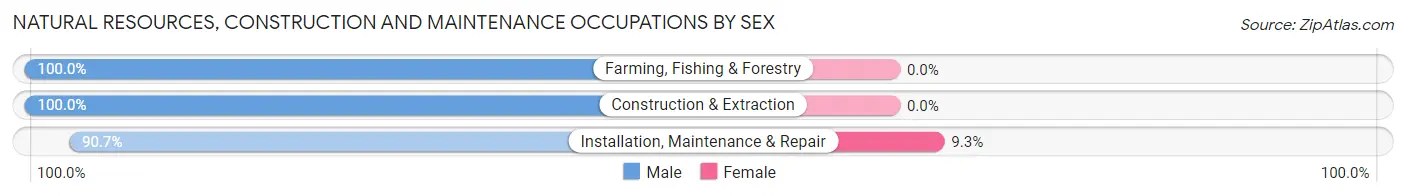
| Occupation | Male | Female |
| Farming, Fishing & Forestry | 9 (100.0%) | 0 (0.0%) |
| Construction & Extraction | 263 (100.0%) | 0 (0.0%) |
| Installation, Maintenance & Repair | 343 (90.7%) | 35 (9.3%) |
| Total (Category) | 615 (94.6%) | 35 (5.4%) |
| Total (Overall) | 5,785 (51.3%) | 5,494 (48.7%) |
Production, Transportation and Moving Occupations
The most common Production, Transportation and Moving occupations in Mililani Mauka are Transportation (458 | 4.1%), Production (247 | 2.2%), and Material Moving (224 | 2.0%).
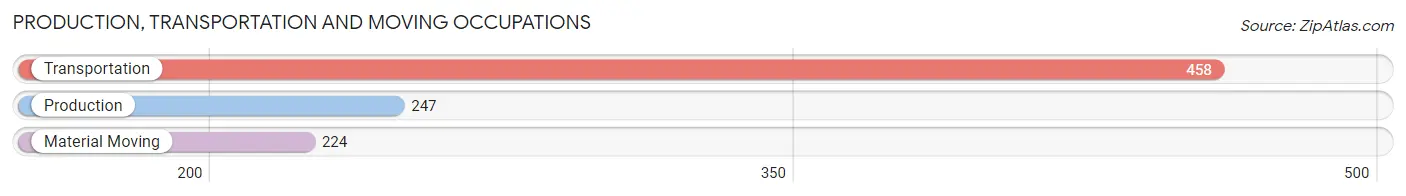
Production, Transportation and Moving Occupations by Sex
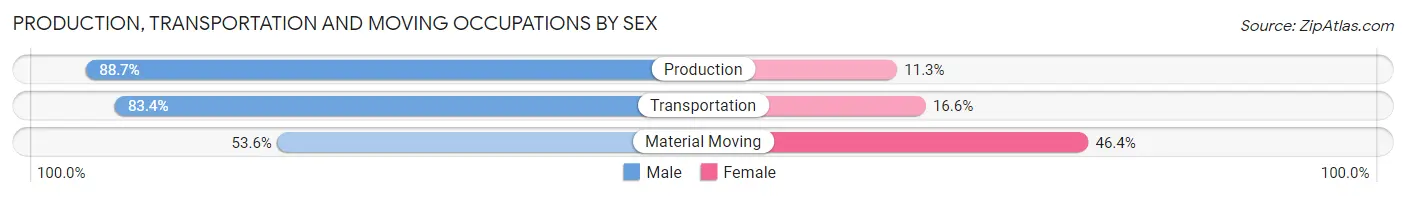
| Occupation | Male | Female |
| Production | 219 (88.7%) | 28 (11.3%) |
| Transportation | 382 (83.4%) | 76 (16.6%) |
| Material Moving | 120 (53.6%) | 104 (46.4%) |
| Total (Category) | 721 (77.6%) | 208 (22.4%) |
| Total (Overall) | 5,785 (51.3%) | 5,494 (48.7%) |
Employment Industries by Sex in Mililani Mauka
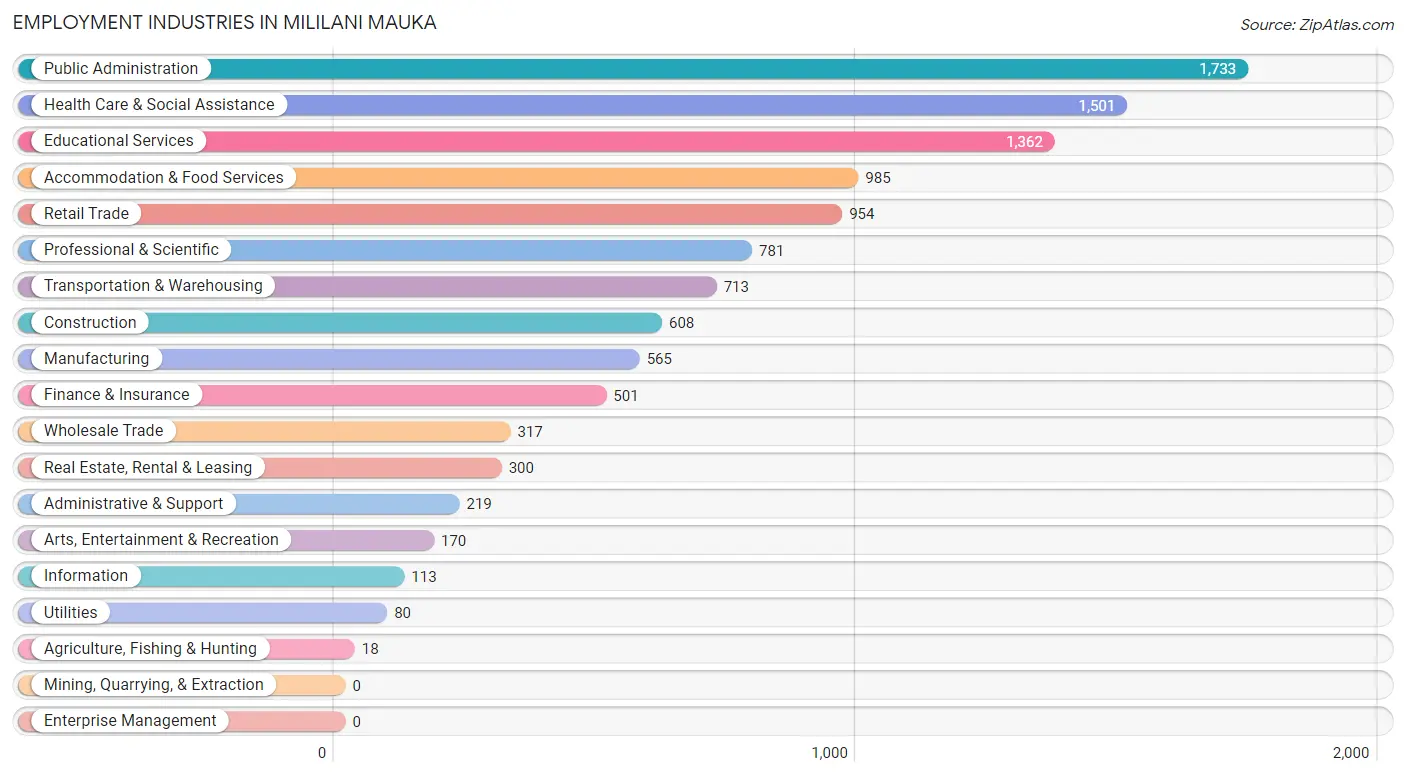
Employment Industries in Mililani Mauka
The major employment industries in Mililani Mauka include Public Administration (1,733 | 15.4%), Health Care & Social Assistance (1,501 | 13.3%), Educational Services (1,362 | 12.1%), Accommodation & Food Services (985 | 8.7%), and Retail Trade (954 | 8.5%).
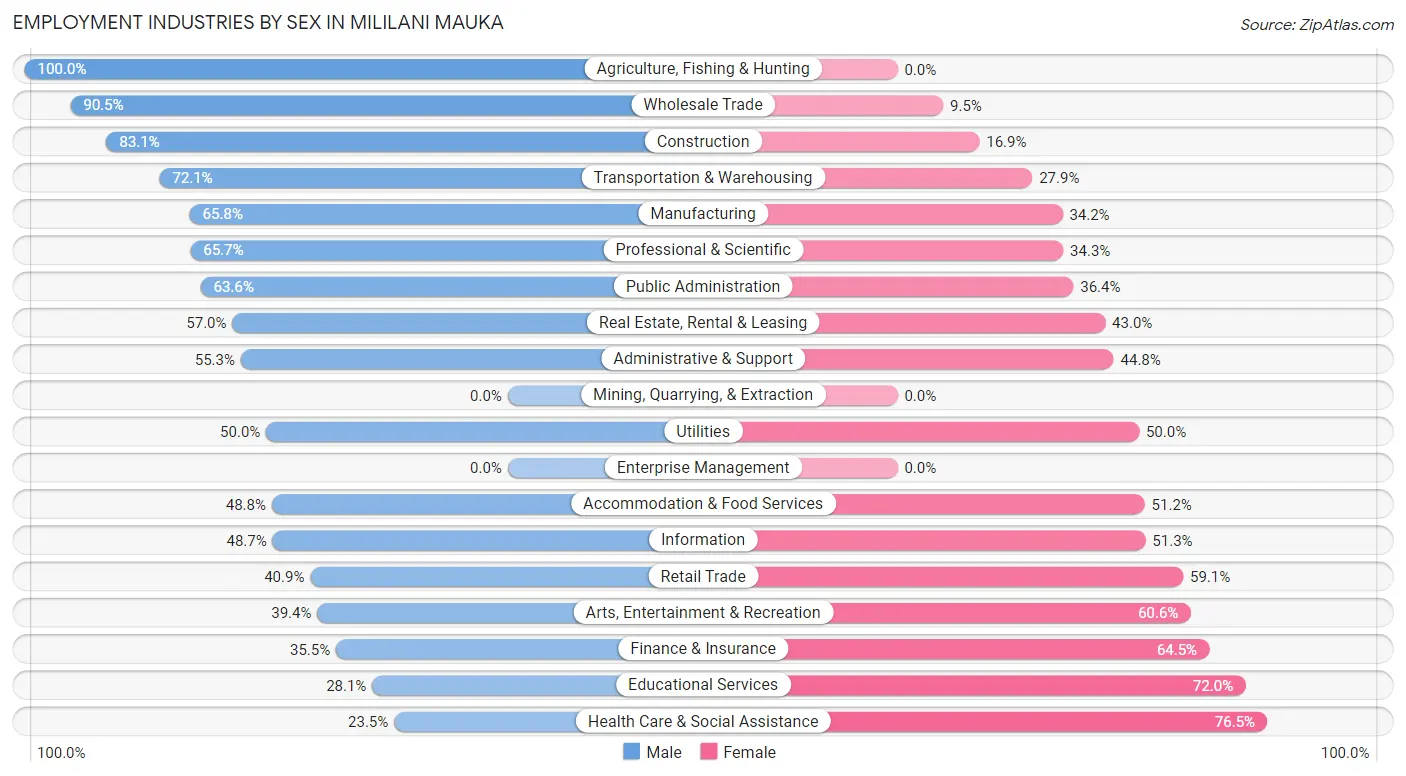
Employment Industries by Sex in Mililani Mauka
The Mililani Mauka industries that see more men than women are Agriculture, Fishing & Hunting (100.0%), Wholesale Trade (90.5%), and Construction (83.1%), whereas the industries that tend to have a higher number of women are Health Care & Social Assistance (76.5%), Educational Services (72.0%), and Finance & Insurance (64.5%).
| Industry | Male | Female |
| Agriculture, Fishing & Hunting | 18 (100.0%) | 0 (0.0%) |
| Mining, Quarrying, & Extraction | 0 (0.0%) | 0 (0.0%) |
| Construction | 505 (83.1%) | 103 (16.9%) |
| Manufacturing | 372 (65.8%) | 193 (34.2%) |
| Wholesale Trade | 287 (90.5%) | 30 (9.5%) |
| Retail Trade | 390 (40.9%) | 564 (59.1%) |
| Transportation & Warehousing | 514 (72.1%) | 199 (27.9%) |
| Utilities | 40 (50.0%) | 40 (50.0%) |
| Information | 55 (48.7%) | 58 (51.3%) |
| Finance & Insurance | 178 (35.5%) | 323 (64.5%) |
| Real Estate, Rental & Leasing | 171 (57.0%) | 129 (43.0%) |
| Professional & Scientific | 513 (65.7%) | 268 (34.3%) |
| Enterprise Management | 0 (0.0%) | 0 (0.0%) |
| Administrative & Support | 121 (55.2%) | 98 (44.8%) |
| Educational Services | 382 (28.1%) | 980 (72.0%) |
| Health Care & Social Assistance | 353 (23.5%) | 1,148 (76.5%) |
| Arts, Entertainment & Recreation | 67 (39.4%) | 103 (60.6%) |
| Accommodation & Food Services | 481 (48.8%) | 504 (51.2%) |
| Public Administration | 1,102 (63.6%) | 631 (36.4%) |
| Total | 5,785 (51.3%) | 5,494 (48.7%) |
Education in Mililani Mauka
School Enrollment in Mililani Mauka
The most common levels of schooling among the 6,476 students in Mililani Mauka are college / undergraduate (1,638 | 25.3%), middle school (1,341 | 20.7%), and elementary school (1,333 | 20.6%).
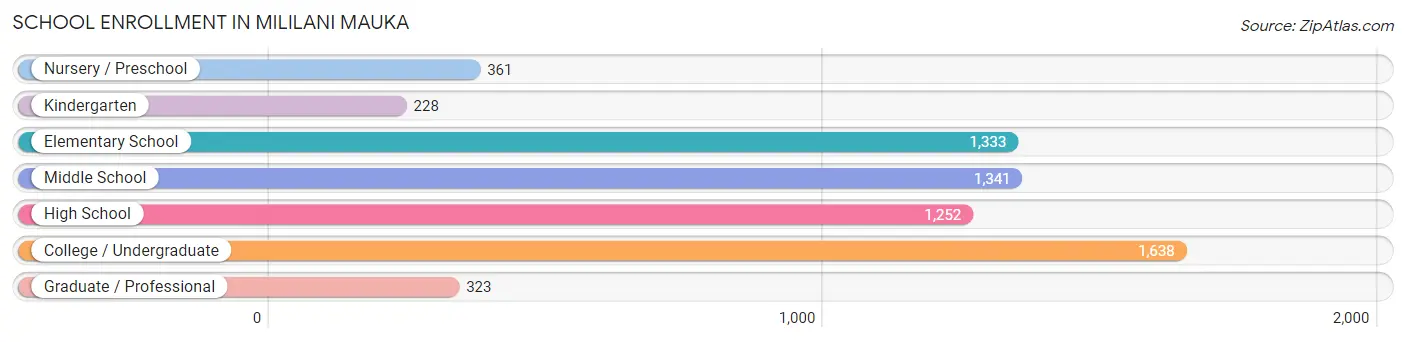
| School Level | # Students | % Students |
| Nursery / Preschool | 361 | 5.6% |
| Kindergarten | 228 | 3.5% |
| Elementary School | 1,333 | 20.6% |
| Middle School | 1,341 | 20.7% |
| High School | 1,252 | 19.3% |
| College / Undergraduate | 1,638 | 25.3% |
| Graduate / Professional | 323 | 5.0% |
| Total | 6,476 | 100.0% |
School Enrollment by Age by Funding Source in Mililani Mauka
Out of a total of 6,476 students who are enrolled in schools in Mililani Mauka, 1,328 (20.5%) attend a private institution, while the remaining 5,148 (79.5%) are enrolled in public schools. The age group of 3 to 4 year olds has the highest likelihood of being enrolled in private schools, with 130 (66.0% in the age bracket) enrolled. Conversely, the age group of 18 to 19 year olds has the lowest likelihood of being enrolled in a private school, with 381 (92.9% in the age bracket) attending a public institution.
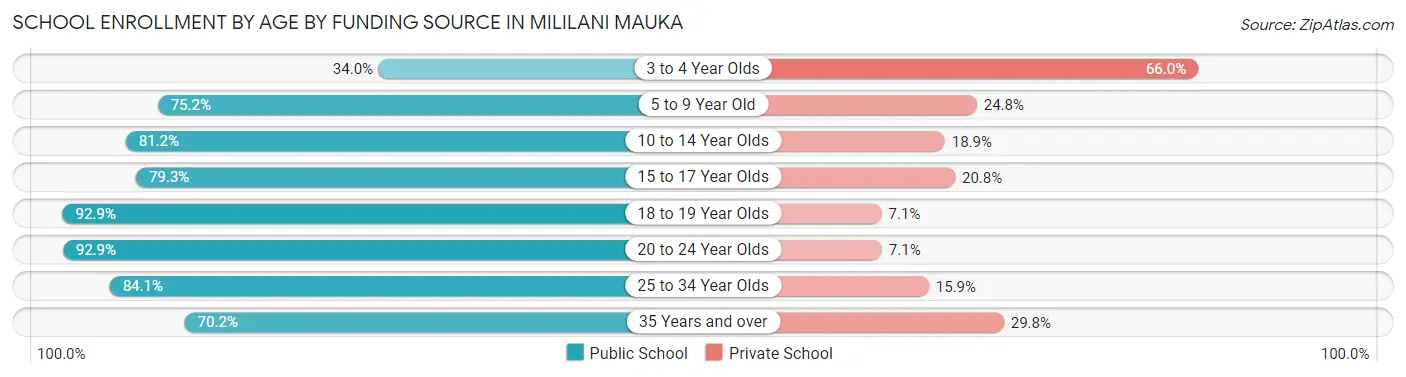
| Age Bracket | Public School | Private School |
| 3 to 4 Year Olds | 67 (34.0%) | 130 (66.0%) |
| 5 to 9 Year Old | 1,216 (75.2%) | 401 (24.8%) |
| 10 to 14 Year Olds | 1,326 (81.1%) | 308 (18.9%) |
| 15 to 17 Year Olds | 714 (79.2%) | 187 (20.7%) |
| 18 to 19 Year Olds | 381 (92.9%) | 29 (7.1%) |
| 20 to 24 Year Olds | 691 (92.9%) | 53 (7.1%) |
| 25 to 34 Year Olds | 435 (84.1%) | 82 (15.9%) |
| 35 Years and over | 320 (70.2%) | 136 (29.8%) |
| Total | 5,148 (79.5%) | 1,328 (20.5%) |
Educational Attainment by Field of Study in Mililani Mauka
Business (1,703 | 22.8%), science & technology (960 | 12.8%), education (782 | 10.4%), engineering (768 | 10.3%), and social sciences (717 | 9.6%) are the most common fields of study among 7,484 individuals in Mililani Mauka who have obtained a bachelor's degree or higher.
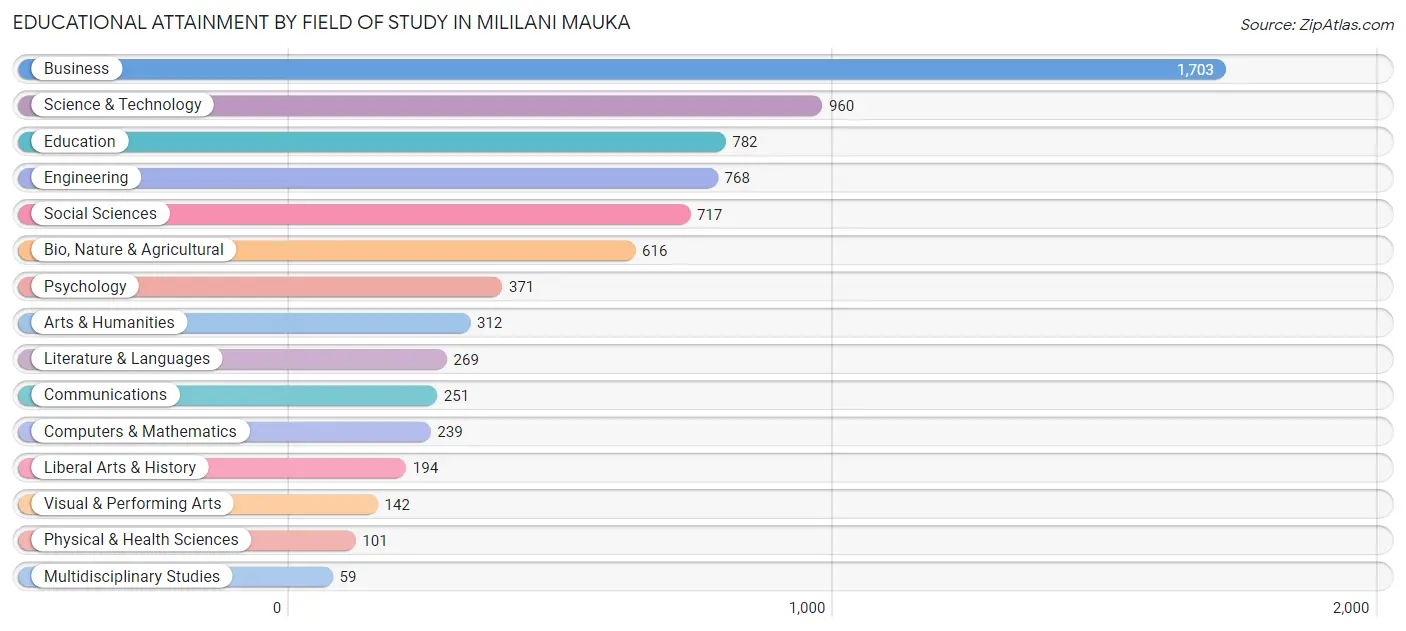
| Field of Study | # Graduates | % Graduates |
| Computers & Mathematics | 239 | 3.2% |
| Bio, Nature & Agricultural | 616 | 8.2% |
| Physical & Health Sciences | 101 | 1.3% |
| Psychology | 371 | 5.0% |
| Social Sciences | 717 | 9.6% |
| Engineering | 768 | 10.3% |
| Multidisciplinary Studies | 59 | 0.8% |
| Science & Technology | 960 | 12.8% |
| Business | 1,703 | 22.8% |
| Education | 782 | 10.4% |
| Literature & Languages | 269 | 3.6% |
| Liberal Arts & History | 194 | 2.6% |
| Visual & Performing Arts | 142 | 1.9% |
| Communications | 251 | 3.4% |
| Arts & Humanities | 312 | 4.2% |
| Total | 7,484 | 100.0% |
Transportation & Commute in Mililani Mauka
Vehicle Availability by Sex in Mililani Mauka
The most prevalent vehicle ownership categories in Mililani Mauka are males with 2 vehicles (2,855, accounting for 44.5%) and females with 2 vehicles (2,340, making up 51.7%).
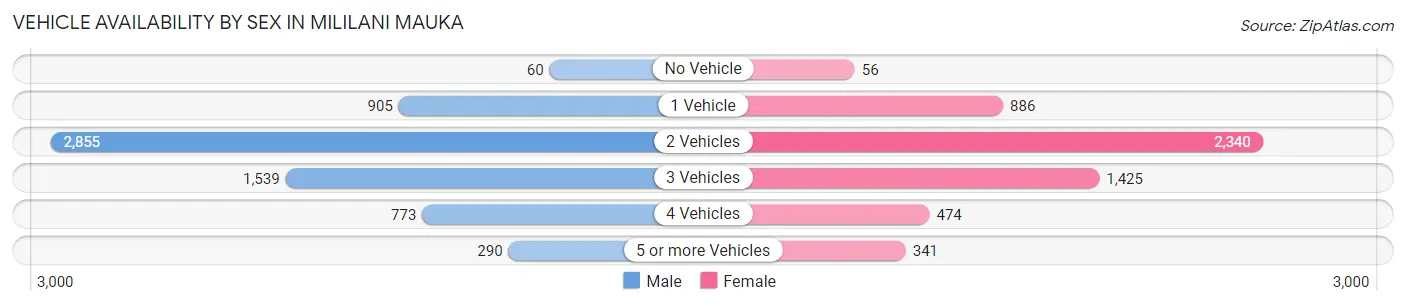
| Vehicles Available | Male | Female |
| No Vehicle | 60 (0.9%) | 56 (1.0%) |
| 1 Vehicle | 905 (14.1%) | 886 (16.0%) |
| 2 Vehicles | 2,855 (44.5%) | 2,340 (42.4%) |
| 3 Vehicles | 1,539 (24.0%) | 1,425 (25.8%) |
| 4 Vehicles | 773 (12.0%) | 474 (8.6%) |
| 5 or more Vehicles | 290 (4.5%) | 341 (6.2%) |
| Total | 6,422 (100.0%) | 5,522 (100.0%) |
Commute Time in Mililani Mauka
The most frequently occuring commute durations in Mililani Mauka are 30 to 34 minutes (2,751 commuters, 25.1%), 20 to 24 minutes (1,617 commuters, 14.7%), and 45 to 59 minutes (1,182 commuters, 10.8%).
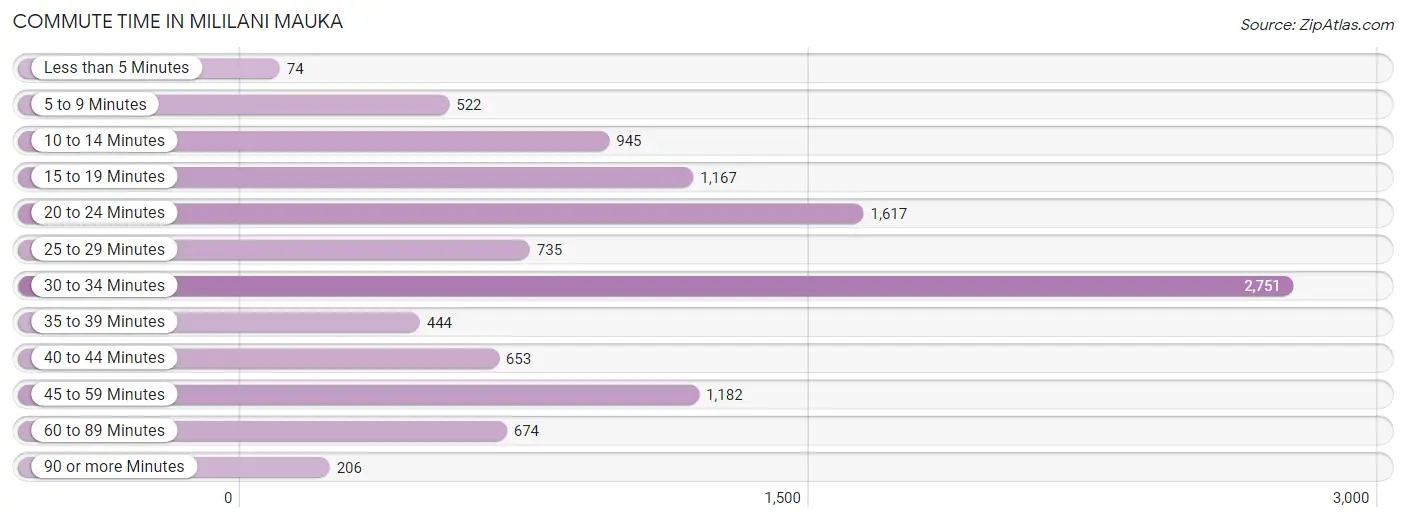
| Commute Time | # Commuters | % Commuters |
| Less than 5 Minutes | 74 | 0.7% |
| 5 to 9 Minutes | 522 | 4.8% |
| 10 to 14 Minutes | 945 | 8.6% |
| 15 to 19 Minutes | 1,167 | 10.6% |
| 20 to 24 Minutes | 1,617 | 14.7% |
| 25 to 29 Minutes | 735 | 6.7% |
| 30 to 34 Minutes | 2,751 | 25.1% |
| 35 to 39 Minutes | 444 | 4.1% |
| 40 to 44 Minutes | 653 | 5.9% |
| 45 to 59 Minutes | 1,182 | 10.8% |
| 60 to 89 Minutes | 674 | 6.1% |
| 90 or more Minutes | 206 | 1.9% |
Commute Time by Sex in Mililani Mauka
The most common commute times in Mililani Mauka are 30 to 34 minutes (1,313 commuters, 21.7%) for males and 30 to 34 minutes (1,438 commuters, 29.2%) for females.
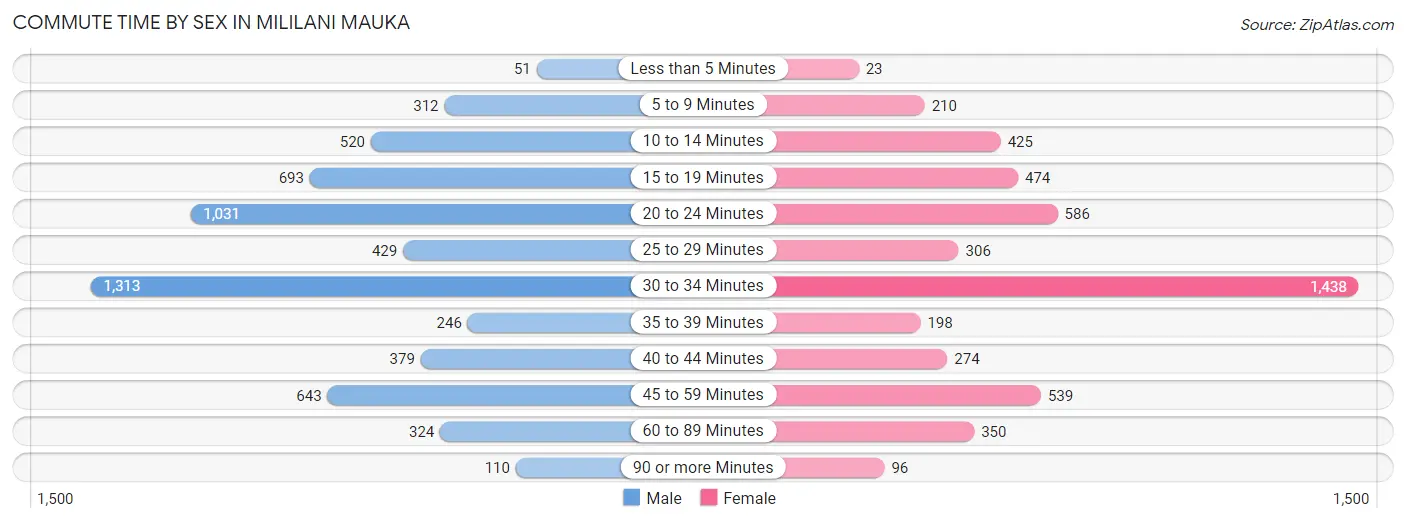
| Commute Time | Male | Female |
| Less than 5 Minutes | 51 (0.8%) | 23 (0.5%) |
| 5 to 9 Minutes | 312 (5.2%) | 210 (4.3%) |
| 10 to 14 Minutes | 520 (8.6%) | 425 (8.6%) |
| 15 to 19 Minutes | 693 (11.5%) | 474 (9.6%) |
| 20 to 24 Minutes | 1,031 (17.0%) | 586 (11.9%) |
| 25 to 29 Minutes | 429 (7.1%) | 306 (6.2%) |
| 30 to 34 Minutes | 1,313 (21.7%) | 1,438 (29.2%) |
| 35 to 39 Minutes | 246 (4.1%) | 198 (4.0%) |
| 40 to 44 Minutes | 379 (6.3%) | 274 (5.6%) |
| 45 to 59 Minutes | 643 (10.6%) | 539 (11.0%) |
| 60 to 89 Minutes | 324 (5.3%) | 350 (7.1%) |
| 90 or more Minutes | 110 (1.8%) | 96 (1.9%) |
Time of Departure to Work by Sex in Mililani Mauka
The most frequent times of departure to work in Mililani Mauka are 6:00 AM to 6:29 AM (777, 12.8%) for males and 6:30 AM to 6:59 AM (820, 16.7%) for females.
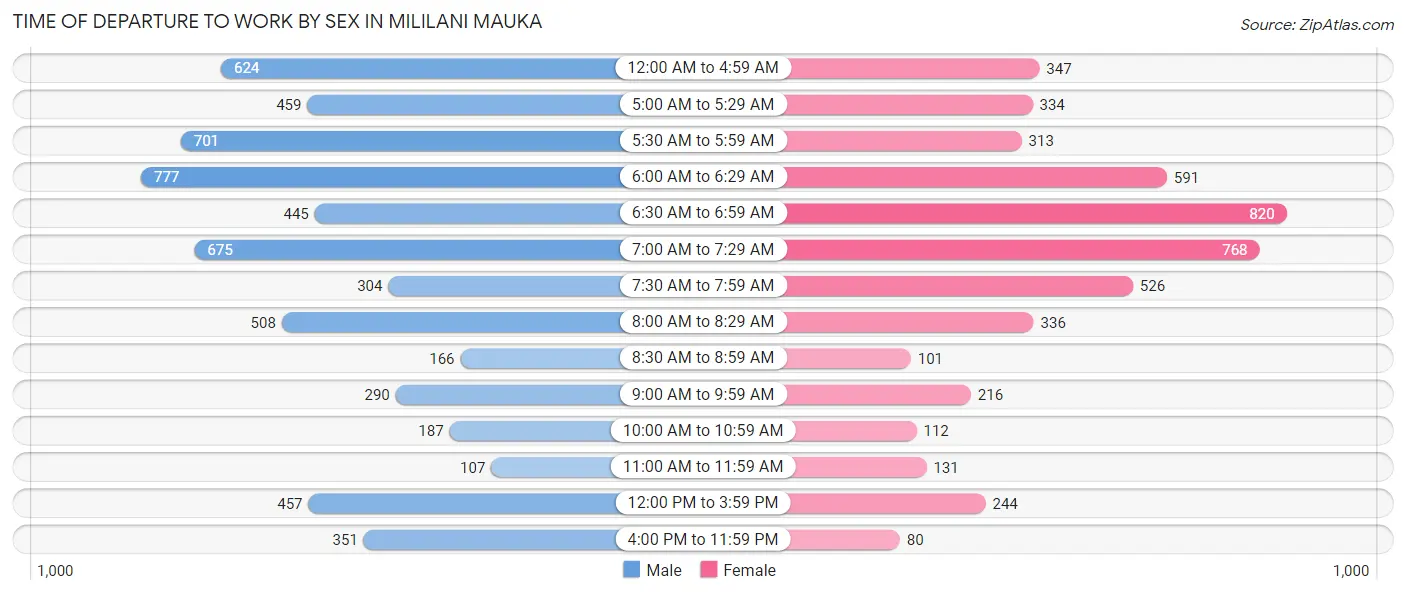
| Time of Departure | Male | Female |
| 12:00 AM to 4:59 AM | 624 (10.3%) | 347 (7.0%) |
| 5:00 AM to 5:29 AM | 459 (7.6%) | 334 (6.8%) |
| 5:30 AM to 5:59 AM | 701 (11.6%) | 313 (6.4%) |
| 6:00 AM to 6:29 AM | 777 (12.8%) | 591 (12.0%) |
| 6:30 AM to 6:59 AM | 445 (7.3%) | 820 (16.7%) |
| 7:00 AM to 7:29 AM | 675 (11.2%) | 768 (15.6%) |
| 7:30 AM to 7:59 AM | 304 (5.0%) | 526 (10.7%) |
| 8:00 AM to 8:29 AM | 508 (8.4%) | 336 (6.8%) |
| 8:30 AM to 8:59 AM | 166 (2.7%) | 101 (2.1%) |
| 9:00 AM to 9:59 AM | 290 (4.8%) | 216 (4.4%) |
| 10:00 AM to 10:59 AM | 187 (3.1%) | 112 (2.3%) |
| 11:00 AM to 11:59 AM | 107 (1.8%) | 131 (2.7%) |
| 12:00 PM to 3:59 PM | 457 (7.5%) | 244 (5.0%) |
| 4:00 PM to 11:59 PM | 351 (5.8%) | 80 (1.6%) |
| Total | 6,051 (100.0%) | 4,919 (100.0%) |
Housing Occupancy in Mililani Mauka
Occupancy by Ownership in Mililani Mauka
Of the total 7,525 dwellings in Mililani Mauka, owner-occupied units account for 5,838 (77.6%), while renter-occupied units make up 1,687 (22.4%).
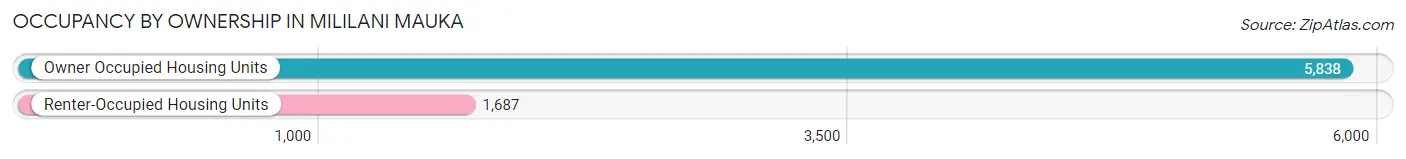
| Occupancy | # Housing Units | % Housing Units |
| Owner Occupied Housing Units | 5,838 | 77.6% |
| Renter-Occupied Housing Units | 1,687 | 22.4% |
| Total Occupied Housing Units | 7,525 | 100.0% |
Occupancy by Household Size in Mililani Mauka
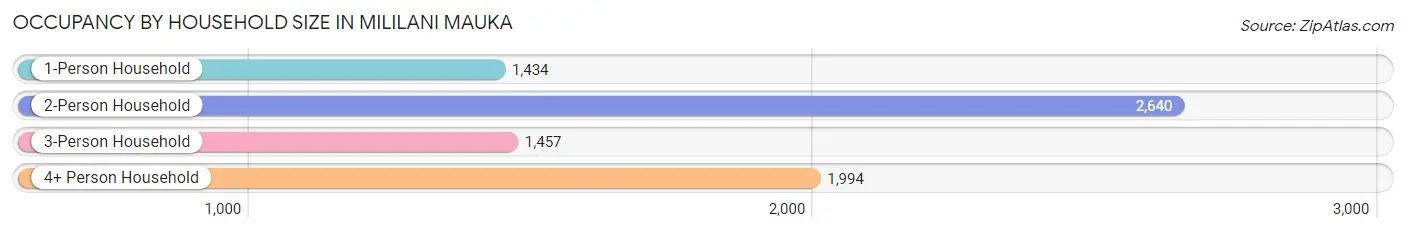
| Household Size | # Housing Units | % Housing Units |
| 1-Person Household | 1,434 | 19.1% |
| 2-Person Household | 2,640 | 35.1% |
| 3-Person Household | 1,457 | 19.4% |
| 4+ Person Household | 1,994 | 26.5% |
| Total Housing Units | 7,525 | 100.0% |
Occupancy by Ownership by Household Size in Mililani Mauka
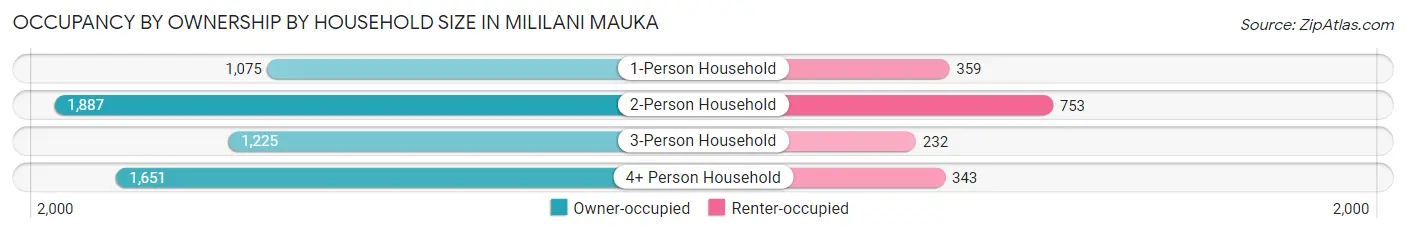
| Household Size | Owner-occupied | Renter-occupied |
| 1-Person Household | 1,075 (75.0%) | 359 (25.0%) |
| 2-Person Household | 1,887 (71.5%) | 753 (28.5%) |
| 3-Person Household | 1,225 (84.1%) | 232 (15.9%) |
| 4+ Person Household | 1,651 (82.8%) | 343 (17.2%) |
| Total Housing Units | 5,838 (77.6%) | 1,687 (22.4%) |
Occupancy by Educational Attainment in Mililani Mauka
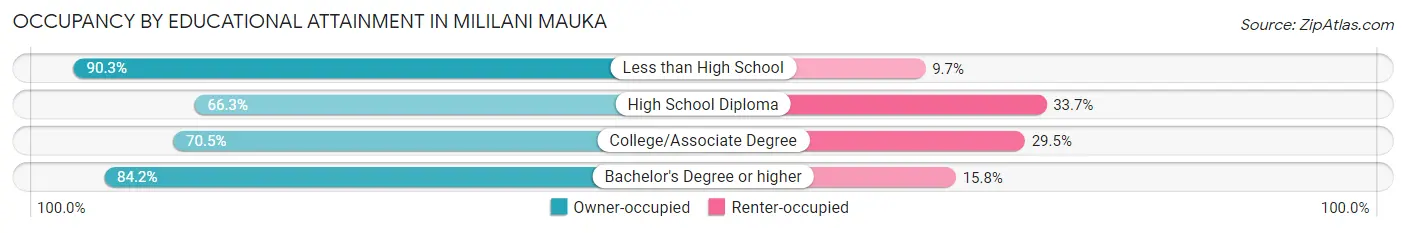
| Household Size | Owner-occupied | Renter-occupied |
| Less than High School | 65 (90.3%) | 7 (9.7%) |
| High School Diploma | 696 (66.3%) | 354 (33.7%) |
| College/Associate Degree | 1,631 (70.5%) | 681 (29.5%) |
| Bachelor's Degree or higher | 3,446 (84.2%) | 645 (15.8%) |
Occupancy by Age of Householder in Mililani Mauka
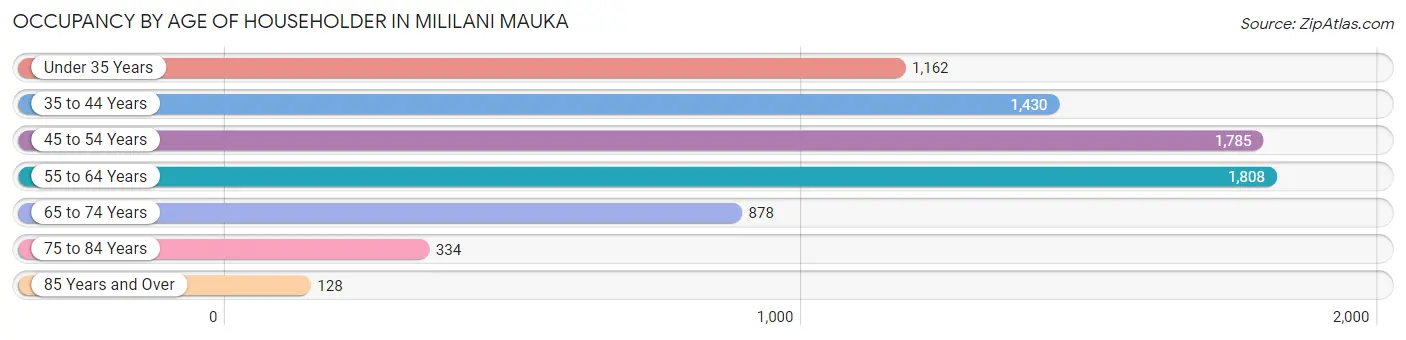
| Age Bracket | # Households | % Households |
| Under 35 Years | 1,162 | 15.4% |
| 35 to 44 Years | 1,430 | 19.0% |
| 45 to 54 Years | 1,785 | 23.7% |
| 55 to 64 Years | 1,808 | 24.0% |
| 65 to 74 Years | 878 | 11.7% |
| 75 to 84 Years | 334 | 4.4% |
| 85 Years and Over | 128 | 1.7% |
| Total | 7,525 | 100.0% |
Housing Finances in Mililani Mauka
Median Income by Occupancy in Mililani Mauka
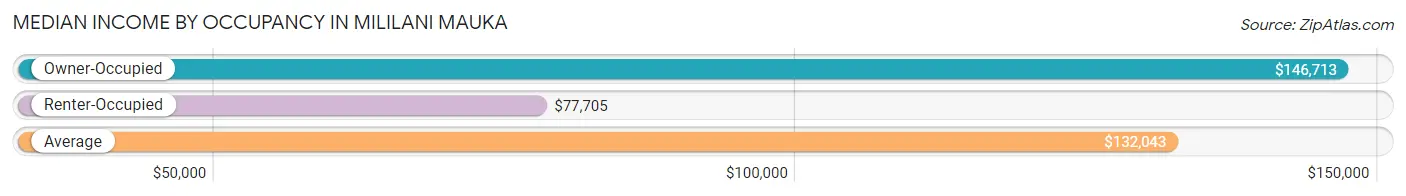
| Occupancy Type | # Households | Median Income |
| Owner-Occupied | 5,838 (77.6%) | $146,713 |
| Renter-Occupied | 1,687 (22.4%) | $77,705 |
| Average | 7,525 (100.0%) | $132,043 |
Occupancy by Householder Income Bracket in Mililani Mauka
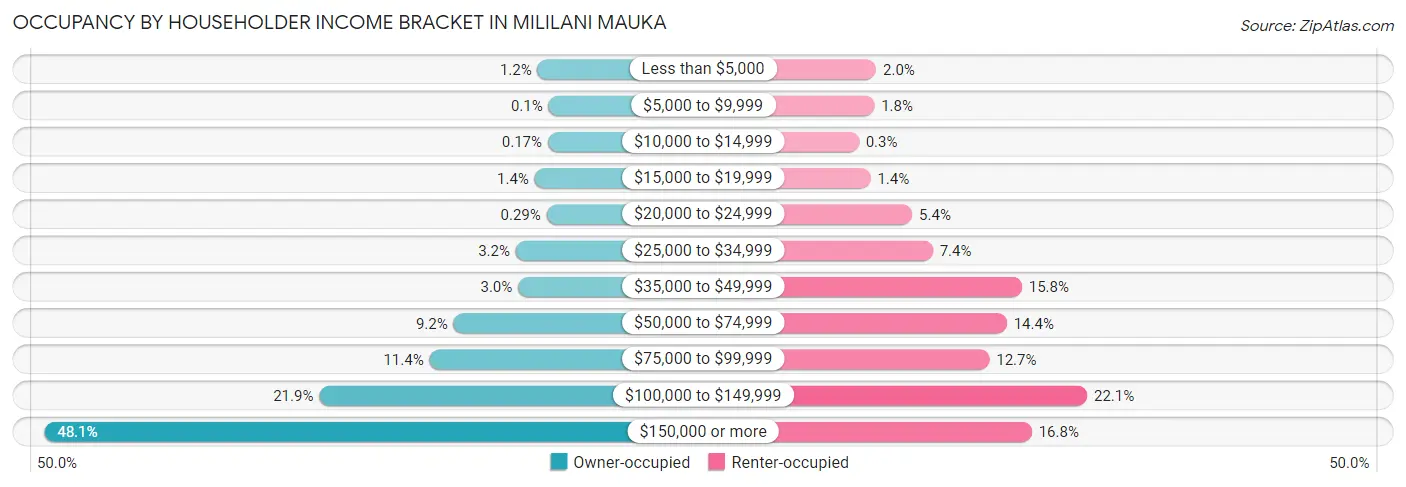
| Income Bracket | Owner-occupied | Renter-occupied |
| Less than $5,000 | 67 (1.1%) | 33 (2.0%) |
| $5,000 to $9,999 | 6 (0.1%) | 30 (1.8%) |
| $10,000 to $14,999 | 10 (0.2%) | 5 (0.3%) |
| $15,000 to $19,999 | 83 (1.4%) | 24 (1.4%) |
| $20,000 to $24,999 | 17 (0.3%) | 91 (5.4%) |
| $25,000 to $34,999 | 188 (3.2%) | 124 (7.3%) |
| $35,000 to $49,999 | 175 (3.0%) | 267 (15.8%) |
| $50,000 to $74,999 | 534 (9.1%) | 243 (14.4%) |
| $75,000 to $99,999 | 668 (11.4%) | 215 (12.7%) |
| $100,000 to $149,999 | 1,281 (21.9%) | 372 (22.1%) |
| $150,000 or more | 2,809 (48.1%) | 283 (16.8%) |
| Total | 5,838 (100.0%) | 1,687 (100.0%) |
Monthly Housing Cost Tiers in Mililani Mauka
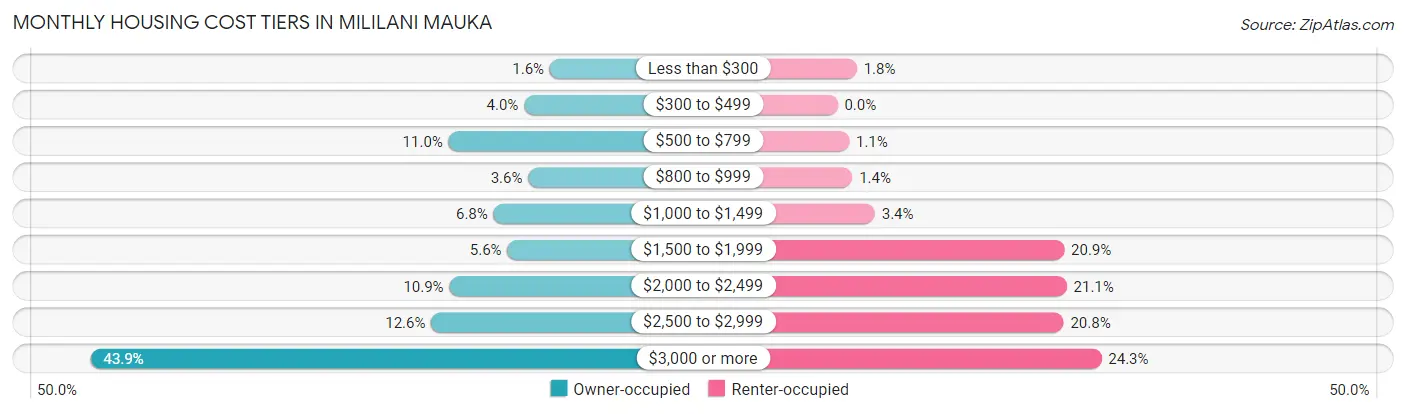
| Monthly Cost | Owner-occupied | Renter-occupied |
| Less than $300 | 96 (1.6%) | 30 (1.8%) |
| $300 to $499 | 234 (4.0%) | 0 (0.0%) |
| $500 to $799 | 640 (11.0%) | 18 (1.1%) |
| $800 to $999 | 212 (3.6%) | 23 (1.4%) |
| $1,000 to $1,499 | 398 (6.8%) | 58 (3.4%) |
| $1,500 to $1,999 | 324 (5.6%) | 352 (20.9%) |
| $2,000 to $2,499 | 636 (10.9%) | 356 (21.1%) |
| $2,500 to $2,999 | 733 (12.6%) | 351 (20.8%) |
| $3,000 or more | 2,565 (43.9%) | 410 (24.3%) |
| Total | 5,838 (100.0%) | 1,687 (100.0%) |
Physical Housing Characteristics in Mililani Mauka
Housing Structures in Mililani Mauka
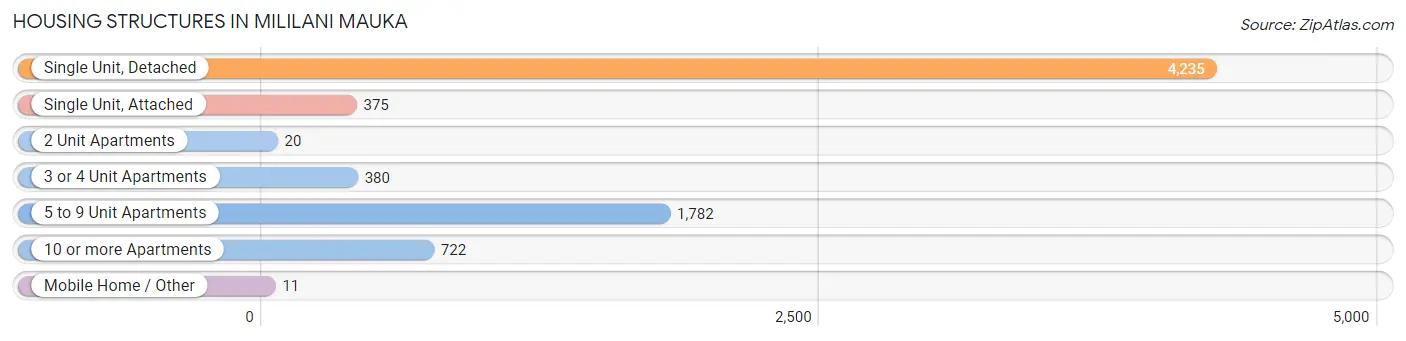
| Structure Type | # Housing Units | % Housing Units |
| Single Unit, Detached | 4,235 | 56.3% |
| Single Unit, Attached | 375 | 5.0% |
| 2 Unit Apartments | 20 | 0.3% |
| 3 or 4 Unit Apartments | 380 | 5.1% |
| 5 to 9 Unit Apartments | 1,782 | 23.7% |
| 10 or more Apartments | 722 | 9.6% |
| Mobile Home / Other | 11 | 0.2% |
| Total | 7,525 | 100.0% |
Housing Structures by Occupancy in Mililani Mauka
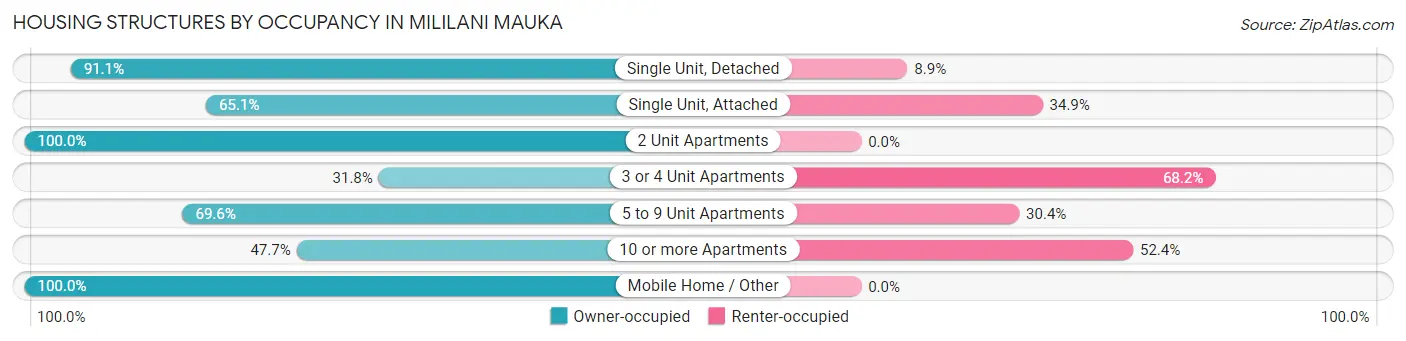
| Structure Type | Owner-occupied | Renter-occupied |
| Single Unit, Detached | 3,858 (91.1%) | 377 (8.9%) |
| Single Unit, Attached | 244 (65.1%) | 131 (34.9%) |
| 2 Unit Apartments | 20 (100.0%) | 0 (0.0%) |
| 3 or 4 Unit Apartments | 121 (31.8%) | 259 (68.2%) |
| 5 to 9 Unit Apartments | 1,240 (69.6%) | 542 (30.4%) |
| 10 or more Apartments | 344 (47.6%) | 378 (52.3%) |
| Mobile Home / Other | 11 (100.0%) | 0 (0.0%) |
| Total | 5,838 (77.6%) | 1,687 (22.4%) |
Housing Structures by Number of Rooms in Mililani Mauka
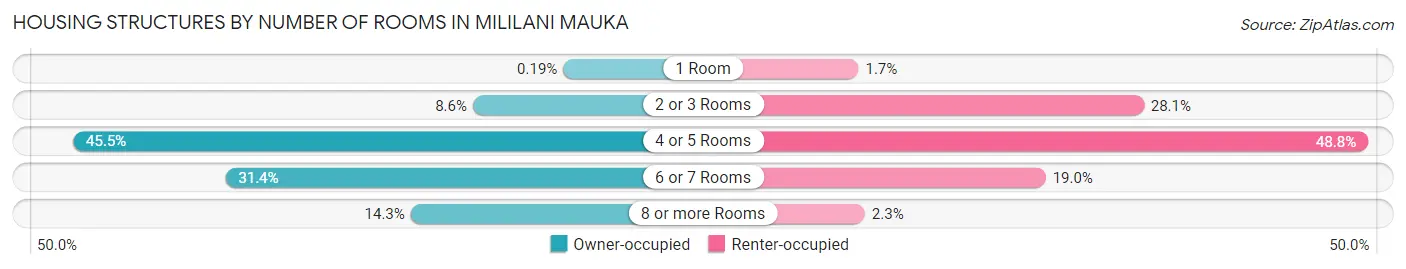
| Number of Rooms | Owner-occupied | Renter-occupied |
| 1 Room | 11 (0.2%) | 29 (1.7%) |
| 2 or 3 Rooms | 499 (8.6%) | 474 (28.1%) |
| 4 or 5 Rooms | 2,658 (45.5%) | 824 (48.8%) |
| 6 or 7 Rooms | 1,835 (31.4%) | 321 (19.0%) |
| 8 or more Rooms | 835 (14.3%) | 39 (2.3%) |
| Total | 5,838 (100.0%) | 1,687 (100.0%) |
Housing Structure by Heating Type in Mililani Mauka
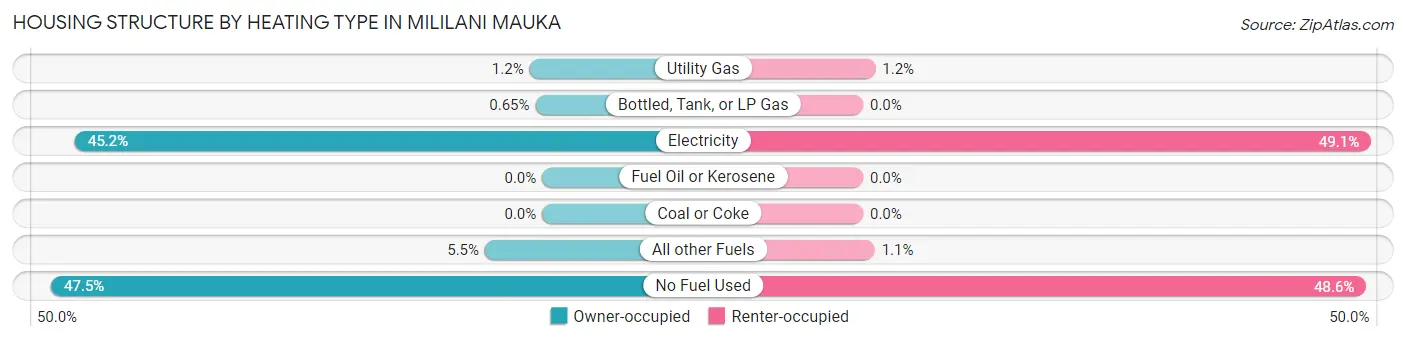
| Heating Type | Owner-occupied | Renter-occupied |
| Utility Gas | 71 (1.2%) | 20 (1.2%) |
| Bottled, Tank, or LP Gas | 38 (0.6%) | 0 (0.0%) |
| Electricity | 2,636 (45.2%) | 828 (49.1%) |
| Fuel Oil or Kerosene | 0 (0.0%) | 0 (0.0%) |
| Coal or Coke | 0 (0.0%) | 0 (0.0%) |
| All other Fuels | 323 (5.5%) | 19 (1.1%) |
| No Fuel Used | 2,770 (47.4%) | 820 (48.6%) |
| Total | 5,838 (100.0%) | 1,687 (100.0%) |
Household Vehicle Usage in Mililani Mauka
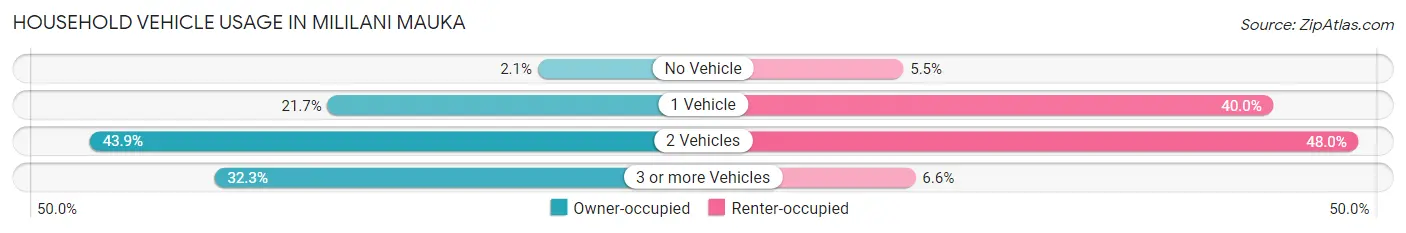
| Vehicles per Household | Owner-occupied | Renter-occupied |
| No Vehicle | 122 (2.1%) | 92 (5.4%) |
| 1 Vehicle | 1,268 (21.7%) | 675 (40.0%) |
| 2 Vehicles | 2,564 (43.9%) | 809 (47.9%) |
| 3 or more Vehicles | 1,884 (32.3%) | 111 (6.6%) |
| Total | 5,838 (100.0%) | 1,687 (100.0%) |
Real Estate & Mortgages in Mililani Mauka
Real Estate and Mortgage Overview in Mililani Mauka
| Characteristic | Without Mortgage | With Mortgage |
| Housing Units | 1,121 | 4,717 |
| Median Property Value | $755,800 | $870,900 |
| Median Household Income | $118,942 | $2,423 |
| Monthly Housing Costs | $631 | $2,565 |
| Real Estate Taxes | $1,898 | $321 |
Property Value by Mortgage Status in Mililani Mauka
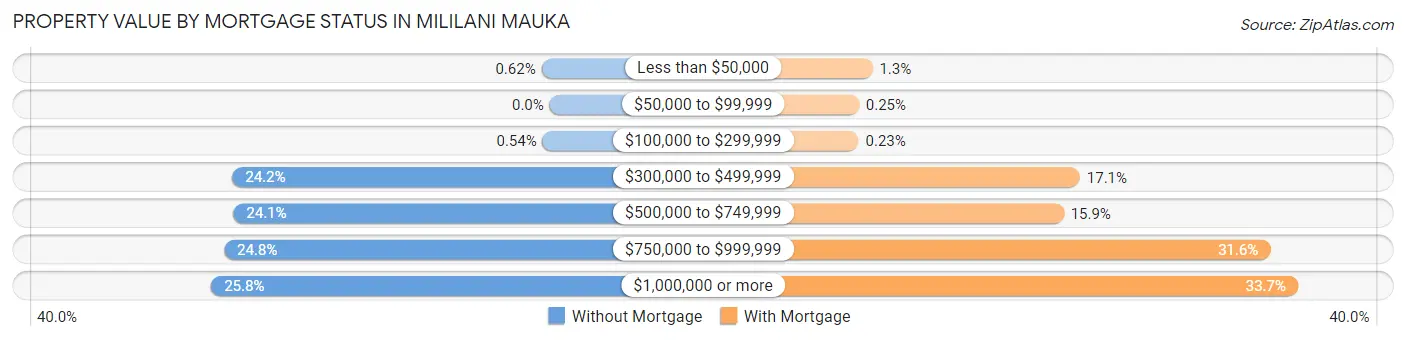
| Property Value | Without Mortgage | With Mortgage |
| Less than $50,000 | 7 (0.6%) | 61 (1.3%) |
| $50,000 to $99,999 | 0 (0.0%) | 12 (0.3%) |
| $100,000 to $299,999 | 6 (0.5%) | 11 (0.2%) |
| $300,000 to $499,999 | 271 (24.2%) | 806 (17.1%) |
| $500,000 to $749,999 | 270 (24.1%) | 748 (15.9%) |
| $750,000 to $999,999 | 278 (24.8%) | 1,490 (31.6%) |
| $1,000,000 or more | 289 (25.8%) | 1,589 (33.7%) |
| Total | 1,121 (100.0%) | 4,717 (100.0%) |
Household Income by Mortgage Status in Mililani Mauka
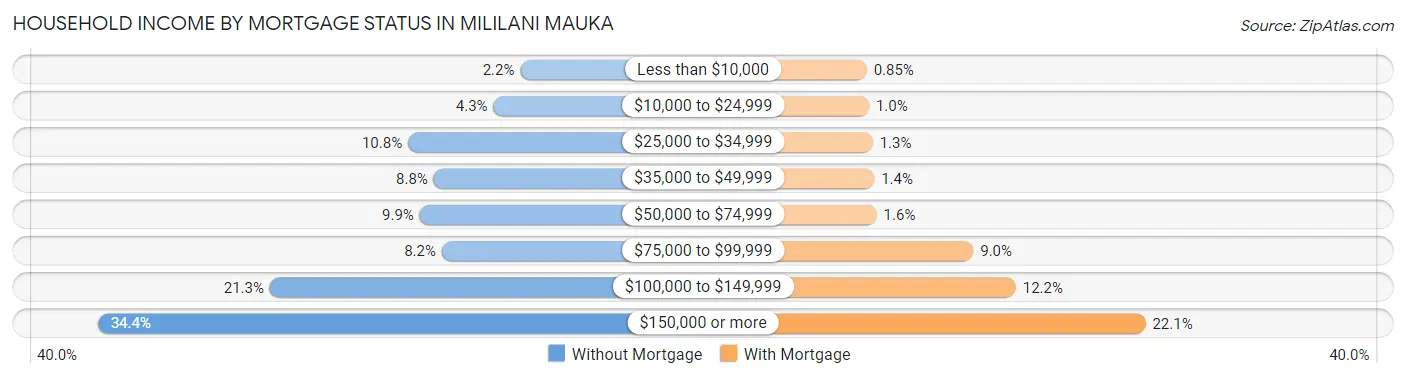
| Household Income | Without Mortgage | With Mortgage |
| Less than $10,000 | 25 (2.2%) | 40 (0.9%) |
| $10,000 to $24,999 | 48 (4.3%) | 48 (1.0%) |
| $25,000 to $34,999 | 121 (10.8%) | 62 (1.3%) |
| $35,000 to $49,999 | 99 (8.8%) | 67 (1.4%) |
| $50,000 to $74,999 | 111 (9.9%) | 76 (1.6%) |
| $75,000 to $99,999 | 92 (8.2%) | 423 (9.0%) |
| $100,000 to $149,999 | 239 (21.3%) | 576 (12.2%) |
| $150,000 or more | 386 (34.4%) | 1,042 (22.1%) |
| Total | 1,121 (100.0%) | 4,717 (100.0%) |
Property Value to Household Income Ratio in Mililani Mauka
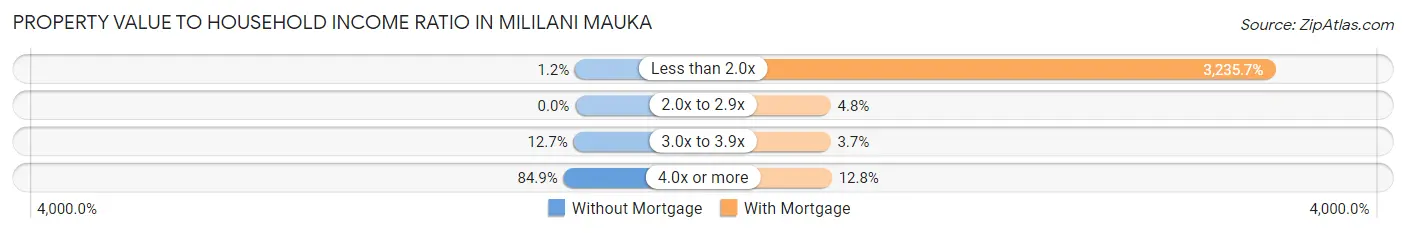
| Value-to-Income Ratio | Without Mortgage | With Mortgage |
| Less than 2.0x | 13 (1.2%) | 152,627 (3,235.7%) |
| 2.0x to 2.9x | 0 (0.0%) | 224 (4.8%) |
| 3.0x to 3.9x | 142 (12.7%) | 175 (3.7%) |
| 4.0x or more | 952 (84.9%) | 605 (12.8%) |
| Total | 1,121 (100.0%) | 4,717 (100.0%) |
Real Estate Taxes by Mortgage Status in Mililani Mauka
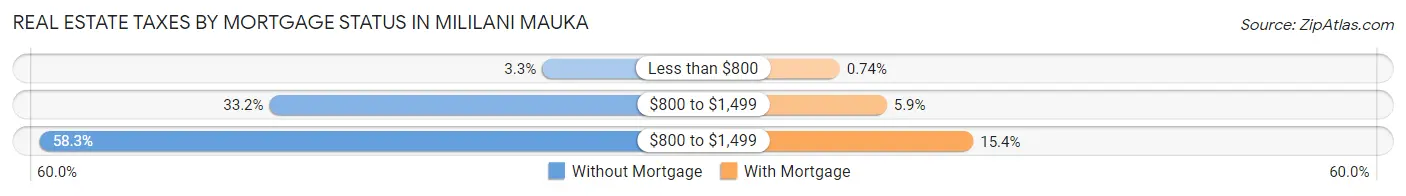
| Property Taxes | Without Mortgage | With Mortgage |
| Less than $800 | 37 (3.3%) | 35 (0.7%) |
| $800 to $1,499 | 372 (33.2%) | 278 (5.9%) |
| $800 to $1,499 | 654 (58.3%) | 725 (15.4%) |
| Total | 1,121 (100.0%) | 4,717 (100.0%) |
Health & Disability in Mililani Mauka
Health Insurance Coverage by Age in Mililani Mauka
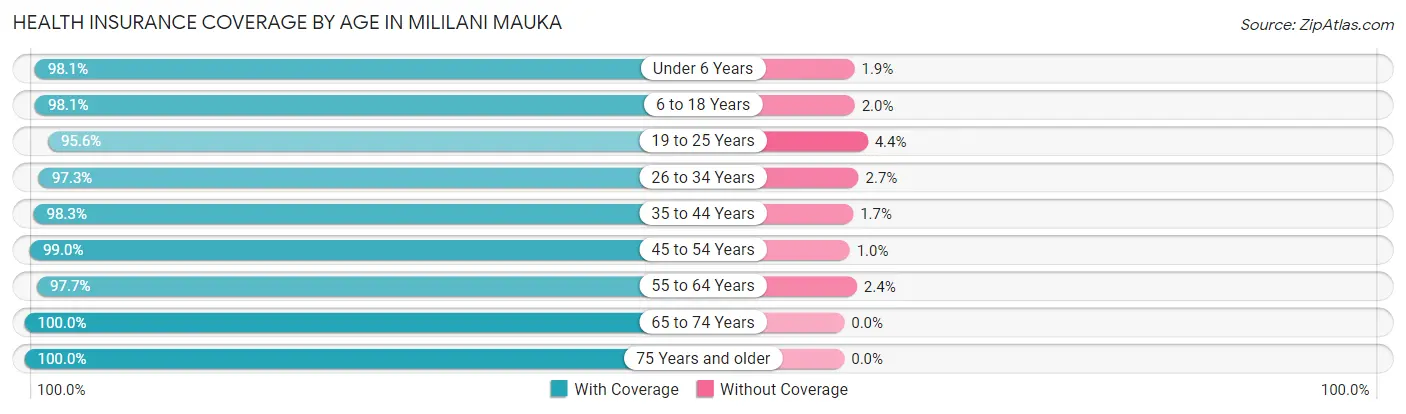
| Age Bracket | With Coverage | Without Coverage |
| Under 6 Years | 1,284 (98.1%) | 25 (1.9%) |
| 6 to 18 Years | 4,115 (98.1%) | 82 (1.9%) |
| 19 to 25 Years | 1,798 (95.6%) | 82 (4.4%) |
| 26 to 34 Years | 1,929 (97.3%) | 53 (2.7%) |
| 35 to 44 Years | 2,410 (98.3%) | 41 (1.7%) |
| 45 to 54 Years | 3,127 (99.0%) | 32 (1.0%) |
| 55 to 64 Years | 3,359 (97.7%) | 81 (2.4%) |
| 65 to 74 Years | 1,358 (100.0%) | 0 (0.0%) |
| 75 Years and older | 872 (100.0%) | 0 (0.0%) |
| Total | 20,252 (98.1%) | 396 (1.9%) |
Health Insurance Coverage by Citizenship Status in Mililani Mauka
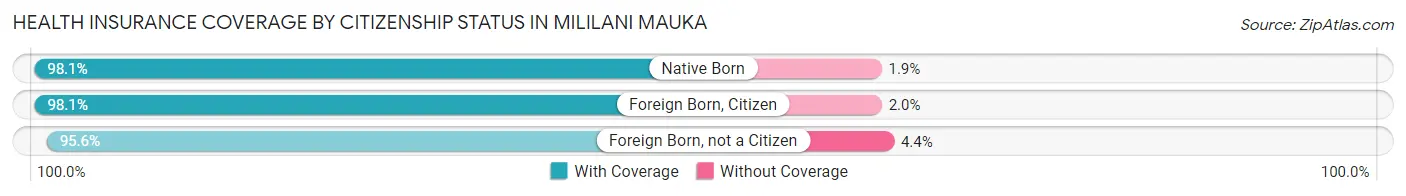
| Citizenship Status | With Coverage | Without Coverage |
| Native Born | 1,284 (98.1%) | 25 (1.9%) |
| Foreign Born, Citizen | 4,115 (98.1%) | 82 (1.9%) |
| Foreign Born, not a Citizen | 1,798 (95.6%) | 82 (4.4%) |
Health Insurance Coverage by Household Income in Mililani Mauka
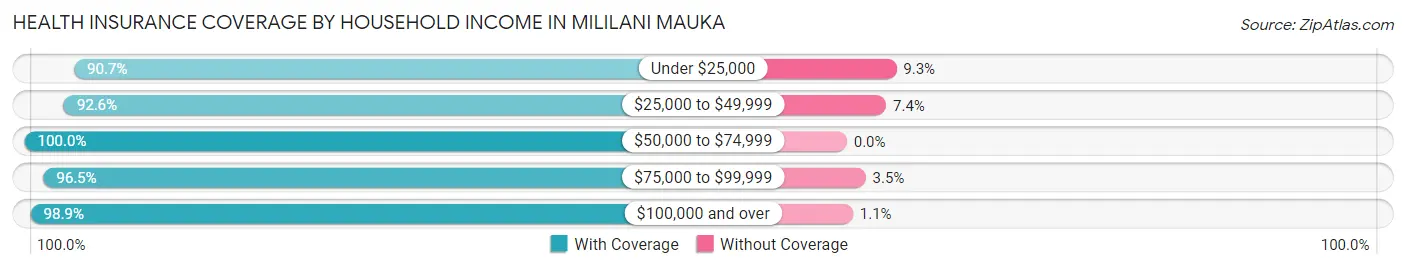
| Household Income | With Coverage | Without Coverage |
| Under $25,000 | 479 (90.7%) | 49 (9.3%) |
| $25,000 to $49,999 | 1,258 (92.6%) | 100 (7.4%) |
| $50,000 to $74,999 | 1,240 (100.0%) | 0 (0.0%) |
| $75,000 to $99,999 | 1,944 (96.5%) | 71 (3.5%) |
| $100,000 and over | 15,331 (98.9%) | 176 (1.1%) |
Public vs Private Health Insurance Coverage by Age in Mililani Mauka
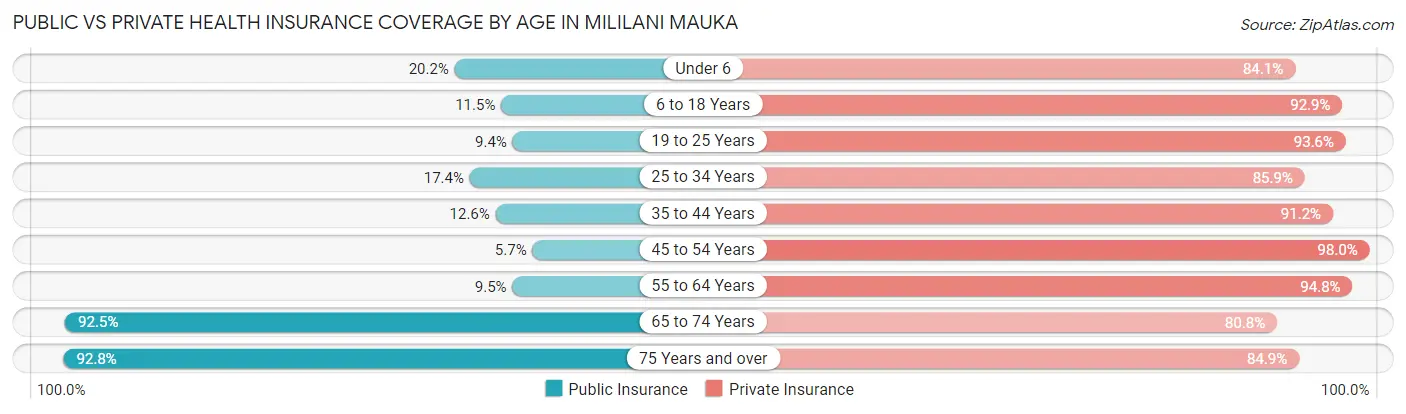
| Age Bracket | Public Insurance | Private Insurance |
| Under 6 | 264 (20.2%) | 1,101 (84.1%) |
| 6 to 18 Years | 484 (11.5%) | 3,899 (92.9%) |
| 19 to 25 Years | 177 (9.4%) | 1,759 (93.6%) |
| 25 to 34 Years | 344 (17.4%) | 1,703 (85.9%) |
| 35 to 44 Years | 308 (12.6%) | 2,234 (91.1%) |
| 45 to 54 Years | 181 (5.7%) | 3,095 (98.0%) |
| 55 to 64 Years | 325 (9.5%) | 3,260 (94.8%) |
| 65 to 74 Years | 1,256 (92.5%) | 1,097 (80.8%) |
| 75 Years and over | 809 (92.8%) | 740 (84.9%) |
| Total | 4,148 (20.1%) | 18,888 (91.5%) |
Disability Status by Sex by Age in Mililani Mauka
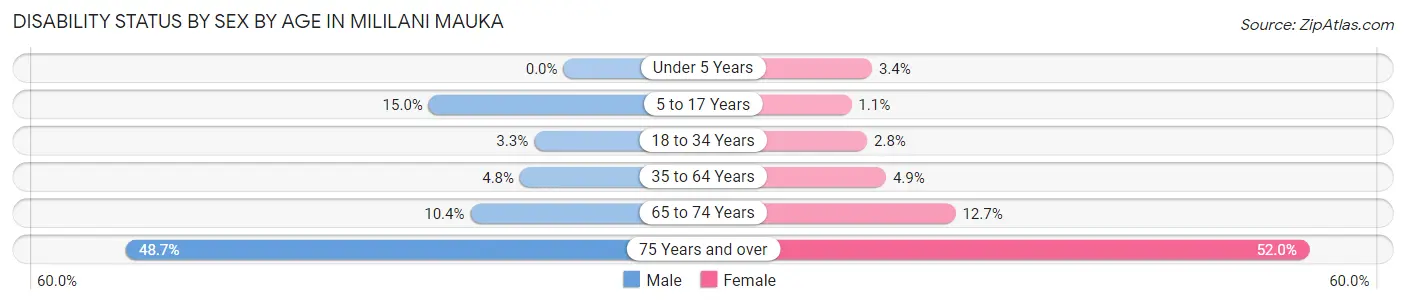
| Age Bracket | Male | Female |
| Under 5 Years | 0 (0.0%) | 18 (3.4%) |
| 5 to 17 Years | 343 (15.0%) | 21 (1.1%) |
| 18 to 34 Years | 69 (3.3%) | 56 (2.8%) |
| 35 to 64 Years | 207 (4.8%) | 235 (4.9%) |
| 65 to 74 Years | 67 (10.4%) | 90 (12.7%) |
| 75 Years and over | 169 (48.7%) | 273 (52.0%) |
Disability Class by Sex by Age in Mililani Mauka
Disability Class: Hearing Difficulty
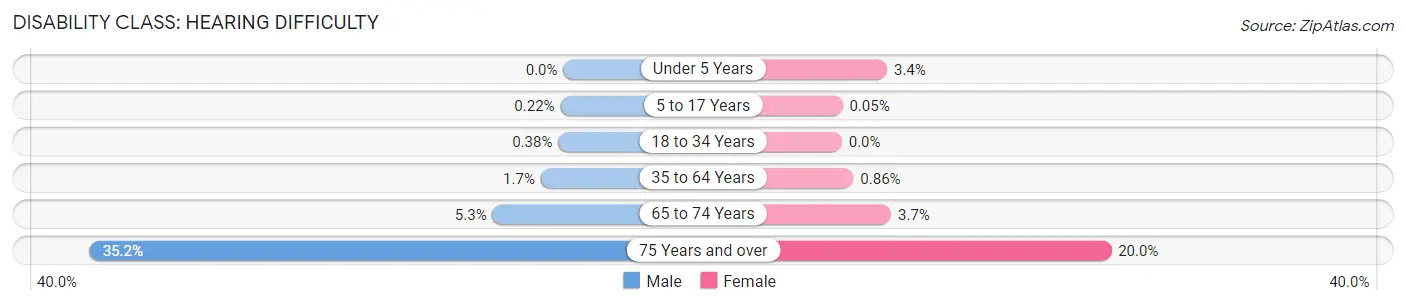
| Age Bracket | Male | Female |
| Under 5 Years | 0 (0.0%) | 18 (3.4%) |
| 5 to 17 Years | 5 (0.2%) | 1 (0.1%) |
| 18 to 34 Years | 8 (0.4%) | 0 (0.0%) |
| 35 to 64 Years | 72 (1.7%) | 41 (0.9%) |
| 65 to 74 Years | 34 (5.3%) | 26 (3.7%) |
| 75 Years and over | 122 (35.2%) | 105 (20.0%) |
Disability Class: Vision Difficulty
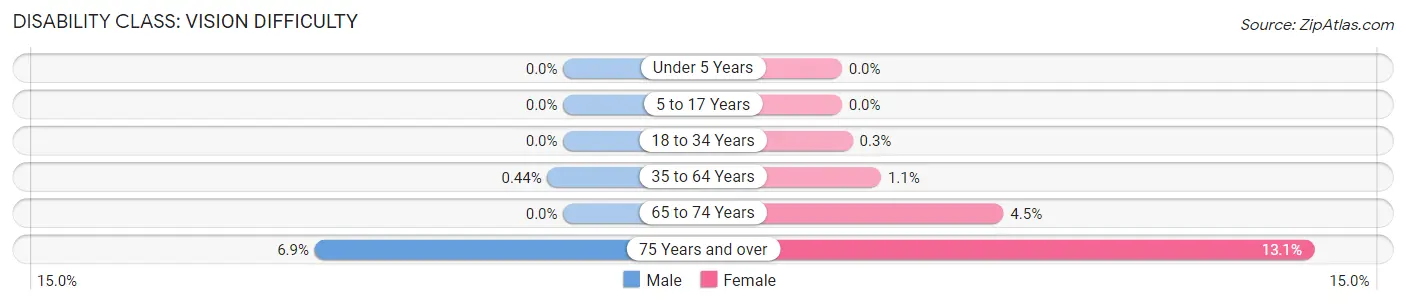
| Age Bracket | Male | Female |
| Under 5 Years | 0 (0.0%) | 0 (0.0%) |
| 5 to 17 Years | 0 (0.0%) | 0 (0.0%) |
| 18 to 34 Years | 0 (0.0%) | 6 (0.3%) |
| 35 to 64 Years | 19 (0.4%) | 52 (1.1%) |
| 65 to 74 Years | 0 (0.0%) | 32 (4.5%) |
| 75 Years and over | 24 (6.9%) | 69 (13.1%) |
Disability Class: Cognitive Difficulty
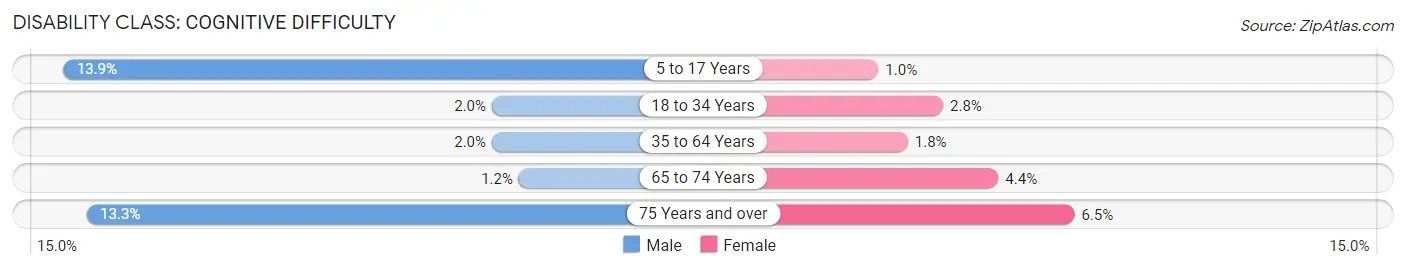
| Age Bracket | Male | Female |
| 5 to 17 Years | 318 (13.9%) | 20 (1.0%) |
| 18 to 34 Years | 42 (2.0%) | 56 (2.8%) |
| 35 to 64 Years | 85 (2.0%) | 88 (1.8%) |
| 65 to 74 Years | 8 (1.2%) | 31 (4.4%) |
| 75 Years and over | 46 (13.3%) | 34 (6.5%) |
Disability Class: Ambulatory Difficulty
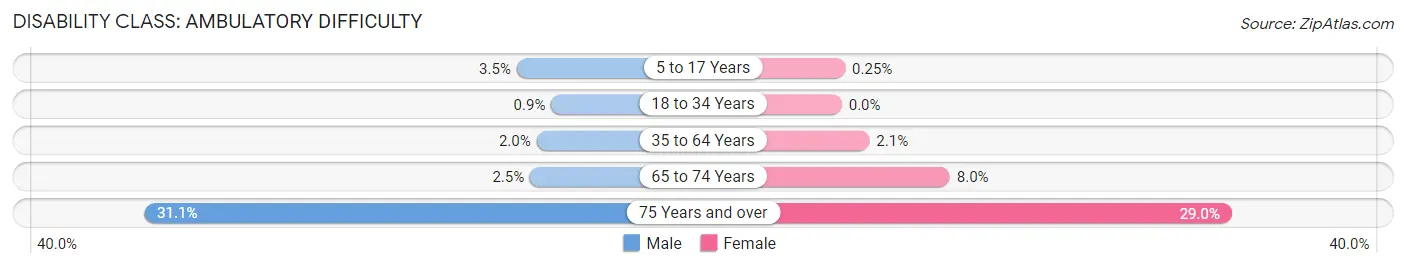
| Age Bracket | Male | Female |
| 5 to 17 Years | 79 (3.5%) | 5 (0.3%) |
| 18 to 34 Years | 19 (0.9%) | 0 (0.0%) |
| 35 to 64 Years | 85 (2.0%) | 98 (2.1%) |
| 65 to 74 Years | 16 (2.5%) | 57 (8.0%) |
| 75 Years and over | 108 (31.1%) | 152 (28.9%) |
Disability Class: Self-Care Difficulty
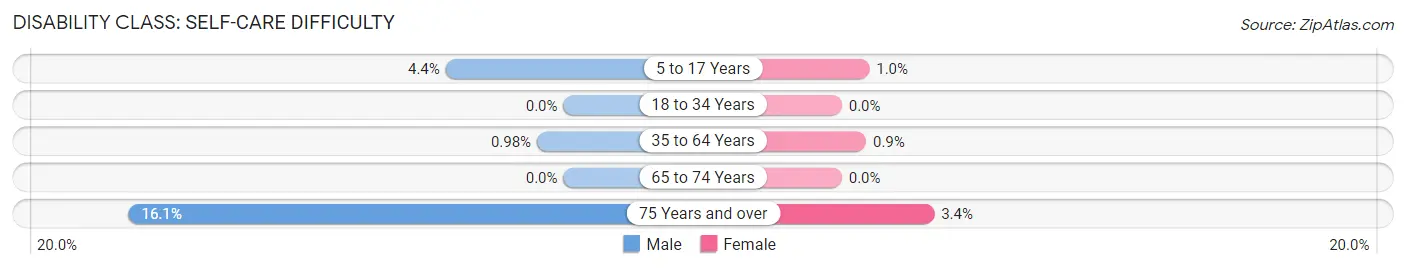
| Age Bracket | Male | Female |
| 5 to 17 Years | 100 (4.4%) | 20 (1.0%) |
| 18 to 34 Years | 0 (0.0%) | 0 (0.0%) |
| 35 to 64 Years | 42 (1.0%) | 43 (0.9%) |
| 65 to 74 Years | 0 (0.0%) | 0 (0.0%) |
| 75 Years and over | 56 (16.1%) | 18 (3.4%) |
Technology Access in Mililani Mauka
Computing Device Access in Mililani Mauka
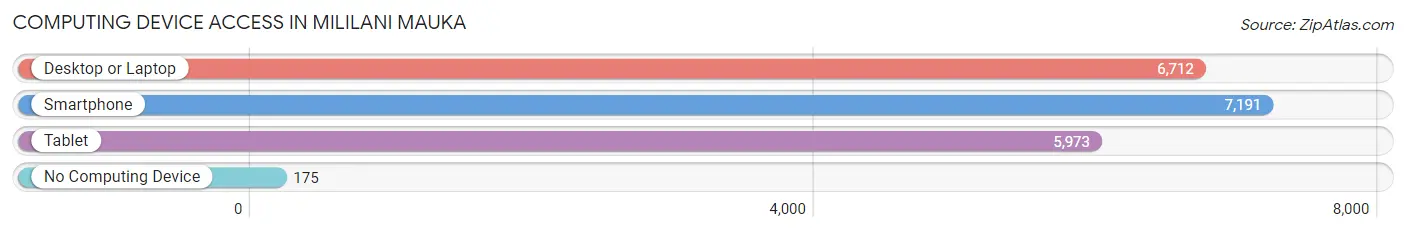
| Device Type | # Households | % Households |
| Desktop or Laptop | 6,712 | 89.2% |
| Smartphone | 7,191 | 95.6% |
| Tablet | 5,973 | 79.4% |
| No Computing Device | 175 | 2.3% |
| Total | 7,525 | 100.0% |
Internet Access in Mililani Mauka
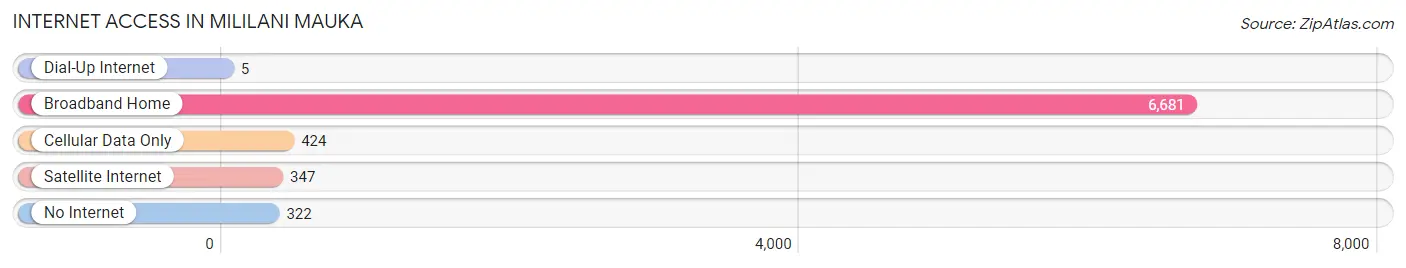
| Internet Type | # Households | % Households |
| Dial-Up Internet | 5 | 0.1% |
| Broadband Home | 6,681 | 88.8% |
| Cellular Data Only | 424 | 5.6% |
| Satellite Internet | 347 | 4.6% |
| No Internet | 322 | 4.3% |
| Total | 7,525 | 100.0% |
Mililani Mauka Summary
Mililani Mauka is a census-designated place (CDP) located in the central part of the island of Oahu in the state of Hawaii. It is located in the City and County of Honolulu and is part of the Honolulu metropolitan area. As of the 2010 census, the population of Mililani Mauka was 15,872.
History
The area now known as Mililani Mauka was originally part of the ahupuaa of Waipio, which was part of the larger ahupuaa of Waialua. The ahupuaa was divided into two parts, the mauka (mountain) and makai (ocean) sections. The mauka section was known as Waipio Uka and the makai section was known as Waipio Makai.
In the early 1900s, the area was used for agricultural purposes, primarily for growing sugar cane. In the 1950s, the area was developed as a residential community by the Oahu Sugar Company. The company built the first homes in the area in 1954 and the community was officially named Mililani Mauka in 1959.
Geography
Mililani Mauka is located at 21°27'N 158°00'W (21.45, -158.00). It is located in the central part of the island of Oahu, about 20 miles (32 km) northwest of Honolulu. The total area of the CDP is 4.2 square miles (10.8 km2), of which 4.1 square miles (10.6 km2) is land and 0.1 square miles (0.2 km2) is water.
The terrain of Mililani Mauka is mostly flat, with some rolling hills. The area is located in the Waianae Mountains, which are part of the larger Koolau Range. The highest point in the CDP is 1,068 feet (325 m) above sea level.
Economy
The economy of Mililani Mauka is primarily based on the service industry. The largest employers in the area are the Mililani Town Center, the Mililani Shopping Center, and the Mililani Technology Park. Other major employers include the Mililani Golf Course, the Mililani High School, and the Mililani Mauka Elementary School.
The Mililani Town Center is a shopping center located in the heart of Mililani Mauka. It features a variety of stores, restaurants, and entertainment venues. The Mililani Shopping Center is located nearby and features a variety of stores, restaurants, and services. The Mililani Technology Park is a business park located in the area and is home to a variety of technology companies.
Demographics
As of the 2010 census, there were 15,872 people, 5,845 households, and 4,717 families residing in the CDP. The population density was 3,817.3 people per square mile (1,475.2/km2). There were 6,093 housing units at an average density of 1,478.3 per square mile (571.2/km2). The racial makeup of the CDP was 44.2% White, 8.2% African American, 0.4% Native American, 24.3% Asian, 0.2% Pacific Islander, 1.7% from other races, and 20.2% from two or more races. Hispanic or Latino of any race were 8.7% of the population.
The median income for a household in the CDP was $76,945, and the median income for a family was $86,945. Males had a median income of $60,945 versus $41,945 for females. The per capita income for the CDP was $31,945. About 3.2% of families and 4.2% of the population were below the poverty line, including 5.2% of those under age 18 and 4.2% of those age 65 or over.
Conclusion
Mililani Mauka is a census-designated place located in the central part of the island of Oahu in the state of Hawaii. It is part of the Honolulu metropolitan area and has a population of 15,872 as of the 2010 census. The area was originally used for agricultural purposes, but was developed as a residential community in the 1950s. The economy of Mililani Mauka is primarily based on the service industry, with the largest employers being the Mililani Town Center, the Mililani Shopping Center, and the Mililani Technology Park. The population of Mililani Mauka is diverse, with the largest racial groups being White, Asian, and African American. The median income for a household in the CDP was $76,945, and the median income for a family was $86,945.
Common Questions
What is Per Capita Income in Mililani Mauka?
Per Capita income in Mililani Mauka is $51,874.
What is the Median Family Income in Mililani Mauka?
Median Family Income in Mililani Mauka is $147,648.
What is the Median Household income in Mililani Mauka?
Median Household Income in Mililani Mauka is $132,043.
What is Income or Wage Gap in Mililani Mauka?
Income or Wage Gap in Mililani Mauka is 31.6%.
Women in Mililani Mauka earn 68.4 cents for every dollar earned by a man.
What is Family Income Deficit in Mililani Mauka?
Family Income Deficit in Mililani Mauka is $10,113.
Families that are below poverty line in Mililani Mauka earn $10,113 less on average than the poverty threshold level.
What is Inequality or Gini Index in Mililani Mauka?
Inequality or Gini Index in Mililani Mauka is 0.36.
What is the Total Population of Mililani Mauka?
Total Population of Mililani Mauka is 21,546.
What is the Total Male Population of Mililani Mauka?
Total Male Population of Mililani Mauka is 10,860.
What is the Total Female Population of Mililani Mauka?
Total Female Population of Mililani Mauka is 10,686.
What is the Ratio of Males per 100 Females in Mililani Mauka?
There are 101.63 Males per 100 Females in Mililani Mauka.
What is the Ratio of Females per 100 Males in Mililani Mauka?
There are 98.40 Females per 100 Males in Mililani Mauka.
What is the Median Population Age in Mililani Mauka?
Median Population Age in Mililani Mauka is 38.2 Years.
What is the Average Family Size in Mililani Mauka
Average Family Size in Mililani Mauka is 3.3 People.
What is the Average Household Size in Mililani Mauka
Average Household Size in Mililani Mauka is 2.9 People.
How Large is the Labor Force in Mililani Mauka?
There are 12,374 People in the Labor Forcein in Mililani Mauka.
What is the Percentage of People in the Labor Force in Mililani Mauka?
73.5% of People are in the Labor Force in Mililani Mauka.
What is the Unemployment Rate in Mililani Mauka?
Unemployment Rate in Mililani Mauka is 2.0%.