Mililani Town, HI Map & Demographics
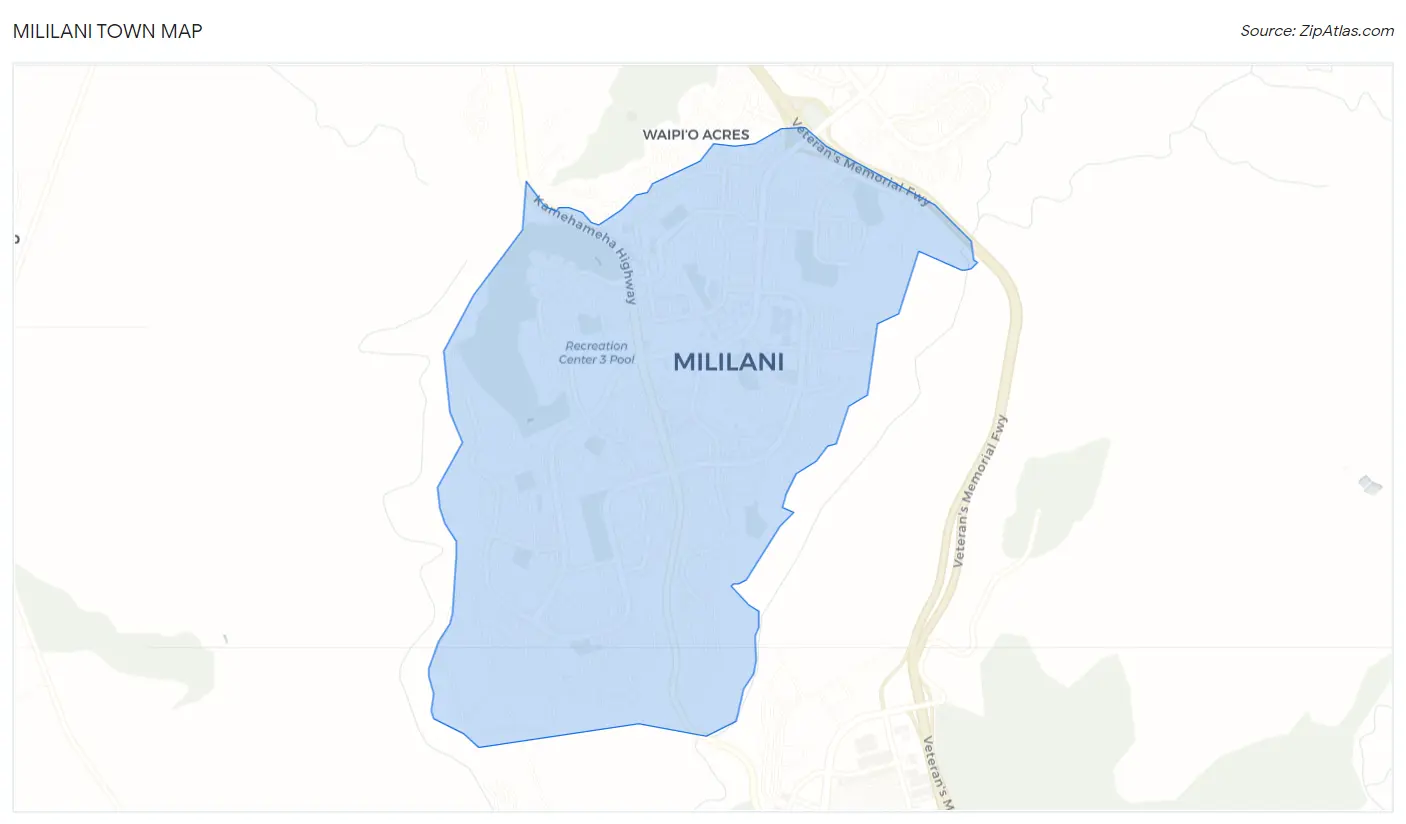
Mililani Town Map
Mililani Town Overview
$49,165
PER CAPITA INCOME
$132,833
AVG FAMILY INCOME
$119,502
AVG HOUSEHOLD INCOME
18.1%
WAGE / INCOME GAP [ % ]
81.9¢/ $1
WAGE / INCOME GAP [ $ ]
0.34
INEQUALITY / GINI INDEX
27,423
TOTAL POPULATION
14,103
MALE POPULATION
13,320
FEMALE POPULATION
105.88
MALES / 100 FEMALES
94.45
FEMALES / 100 MALES
45.3
MEDIAN AGE
3.2
AVG FAMILY SIZE
2.8
AVG HOUSEHOLD SIZE
14,215
LABOR FORCE [ PEOPLE ]
62.3%
PERCENT IN LABOR FORCE
3.6%
UNEMPLOYMENT RATE
Income in Mililani Town
Income Overview in Mililani Town
Per Capita Income in Mililani Town is $49,165, while median incomes of families and households are $132,833 and $119,502 respectively.
| Characteristic | Number | Measure |
| Per Capita Income | 27,423 | $49,165 |
| Median Family Income | 7,418 | $132,833 |
| Mean Family Income | 7,418 | $148,590 |
| Median Household Income | 9,647 | $119,502 |
| Mean Household Income | 9,647 | $136,299 |
| Income Deficit | 7,418 | $0 |
| Wage / Income Gap (%) | 27,423 | 18.05% |
| Wage / Income Gap ($) | 27,423 | 81.95¢ per $1 |
| Gini / Inequality Index | 27,423 | 0.34 |
Earnings by Sex in Mililani Town
Average Earnings in Mililani Town are $53,672, $58,855 for men and $48,230 for women, a difference of 18.0%.
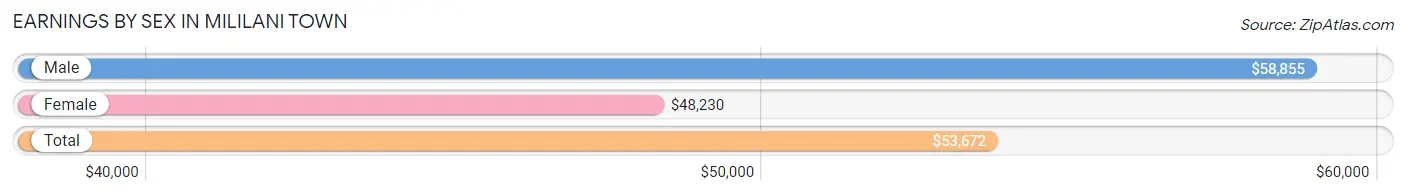
| Sex | Number | Average Earnings |
| Male | 8,049 (55.0%) | $58,855 |
| Female | 6,584 (45.0%) | $48,230 |
| Total | 14,633 (100.0%) | $53,672 |
Earnings by Sex by Income Bracket in Mililani Town
The most common earnings brackets in Mililani Town are $100,000+ for men (1,976 | 24.5%) and $100,000+ for women (1,061 | 16.1%).
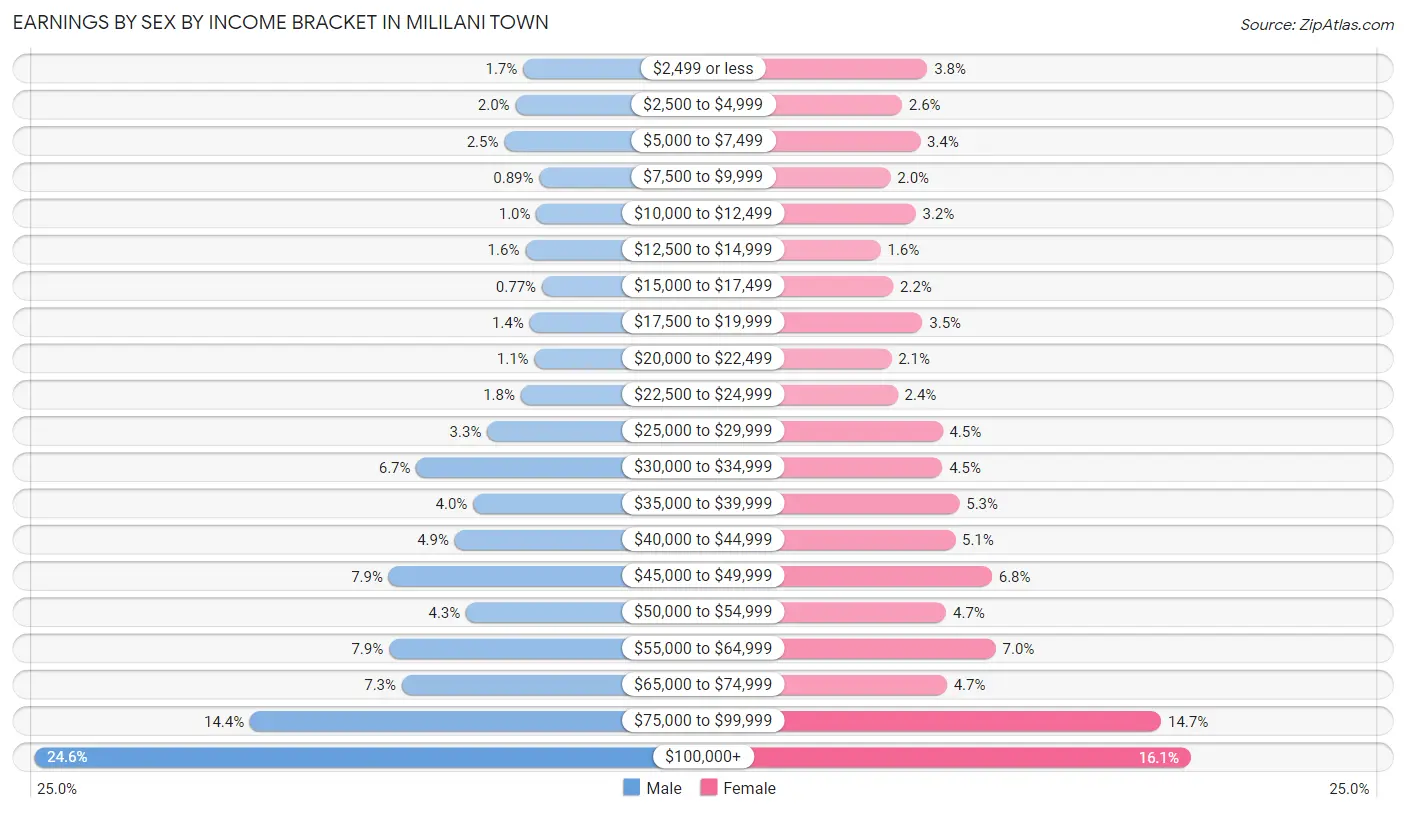
| Income | Male | Female |
| $2,499 or less | 133 (1.7%) | 248 (3.8%) |
| $2,500 to $4,999 | 162 (2.0%) | 170 (2.6%) |
| $5,000 to $7,499 | 204 (2.5%) | 226 (3.4%) |
| $7,500 to $9,999 | 72 (0.9%) | 134 (2.0%) |
| $10,000 to $12,499 | 83 (1.0%) | 212 (3.2%) |
| $12,500 to $14,999 | 125 (1.5%) | 104 (1.6%) |
| $15,000 to $17,499 | 62 (0.8%) | 143 (2.2%) |
| $17,500 to $19,999 | 109 (1.3%) | 233 (3.5%) |
| $20,000 to $22,499 | 90 (1.1%) | 137 (2.1%) |
| $22,500 to $24,999 | 142 (1.8%) | 157 (2.4%) |
| $25,000 to $29,999 | 268 (3.3%) | 295 (4.5%) |
| $30,000 to $34,999 | 535 (6.7%) | 294 (4.5%) |
| $35,000 to $39,999 | 321 (4.0%) | 347 (5.3%) |
| $40,000 to $44,999 | 390 (4.9%) | 334 (5.1%) |
| $45,000 to $49,999 | 639 (7.9%) | 447 (6.8%) |
| $50,000 to $54,999 | 348 (4.3%) | 306 (4.6%) |
| $55,000 to $64,999 | 638 (7.9%) | 459 (7.0%) |
| $65,000 to $74,999 | 590 (7.3%) | 308 (4.7%) |
| $75,000 to $99,999 | 1,162 (14.4%) | 969 (14.7%) |
| $100,000+ | 1,976 (24.5%) | 1,061 (16.1%) |
| Total | 8,049 (100.0%) | 6,584 (100.0%) |
Earnings by Sex by Educational Attainment in Mililani Town
Average earnings in Mililani Town are $65,666 for men and $50,892 for women, a difference of 22.5%. Men with an educational attainment of graduate degree enjoy the highest average annual earnings of $118,518, while those with less than high school education earn the least with $41,667. Women with an educational attainment of graduate degree earn the most with the average annual earnings of $78,778, while those with high school diploma education have the smallest earnings of $33,388.
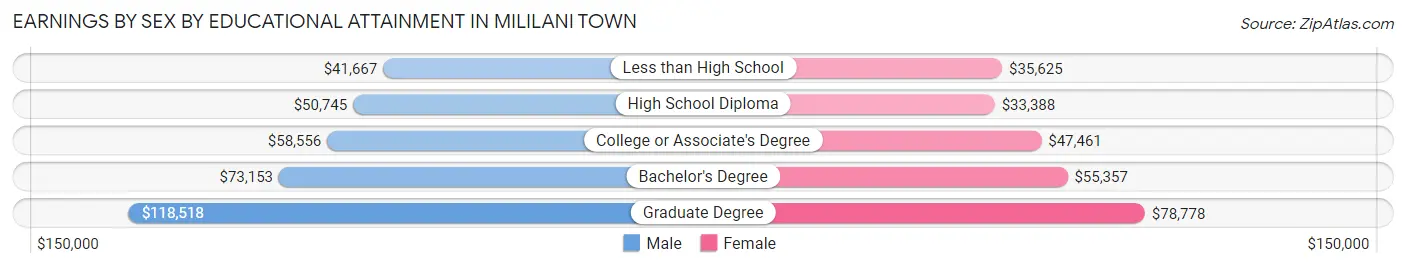
| Educational Attainment | Male Income | Female Income |
| Less than High School | $41,667 | $35,625 |
| High School Diploma | $50,745 | $33,388 |
| College or Associate's Degree | $58,556 | $47,461 |
| Bachelor's Degree | $73,153 | $55,357 |
| Graduate Degree | $118,518 | $78,778 |
| Total | $65,666 | $50,892 |
Family Income in Mililani Town
Family Income Brackets in Mililani Town
According to the Mililani Town family income data, there are 1,936 families falling into the $100,000 to $149,999 income range, which is the most common income bracket and makes up 26.1% of all families.
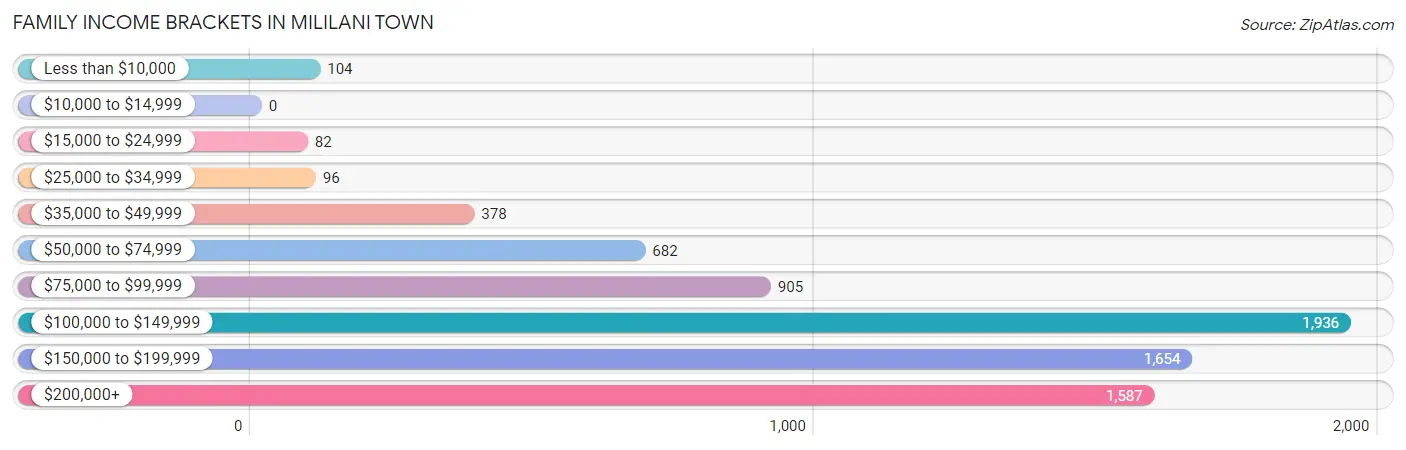
| Income Bracket | # Families | % Families |
| Less than $10,000 | 104 | 1.4% |
| $10,000 to $14,999 | 0 | 0.0% |
| $15,000 to $24,999 | 82 | 1.1% |
| $25,000 to $34,999 | 96 | 1.3% |
| $35,000 to $49,999 | 378 | 5.1% |
| $50,000 to $74,999 | 682 | 9.2% |
| $75,000 to $99,999 | 905 | 12.2% |
| $100,000 to $149,999 | 1,936 | 26.1% |
| $150,000 to $199,999 | 1,654 | 22.3% |
| $200,000+ | 1,587 | 21.4% |
Family Income by Famaliy Size in Mililani Town
6-person families (372 | 5.0%) account for the highest median family income in Mililani Town with $187,847 per family, while 2-person families (3,129 | 42.2%) have the highest median income of $56,188 per family member.
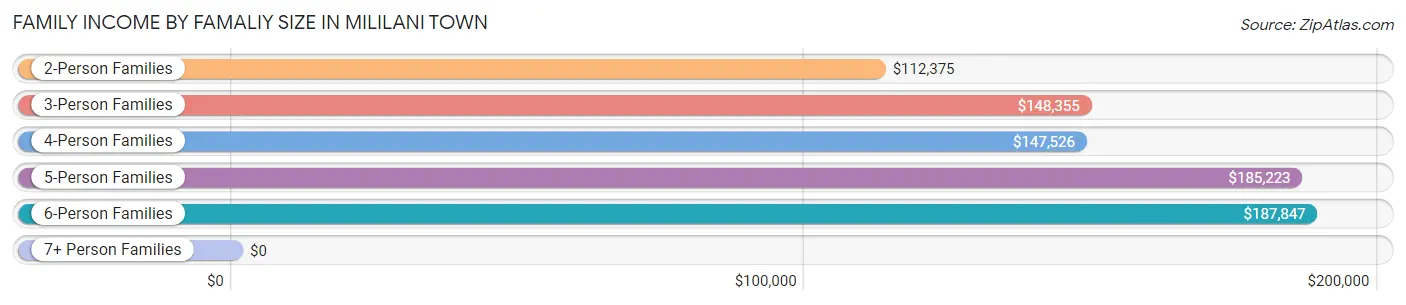
| Income Bracket | # Families | Median Income |
| 2-Person Families | 3,129 (42.2%) | $112,375 |
| 3-Person Families | 2,215 (29.9%) | $148,355 |
| 4-Person Families | 1,179 (15.9%) | $147,526 |
| 5-Person Families | 403 (5.4%) | $185,223 |
| 6-Person Families | 372 (5.0%) | $187,847 |
| 7+ Person Families | 120 (1.6%) | $0 |
| Total | 7,418 (100.0%) | $132,833 |
Family Income by Number of Earners in Mililani Town
The median family income in Mililani Town is $132,833, with families comprising 3+ earners (1,286) having the highest median family income of $194,877, while families with no earners (1,273) have the lowest median family income of $95,398, accounting for 17.3% and 17.2% of families, respectively.
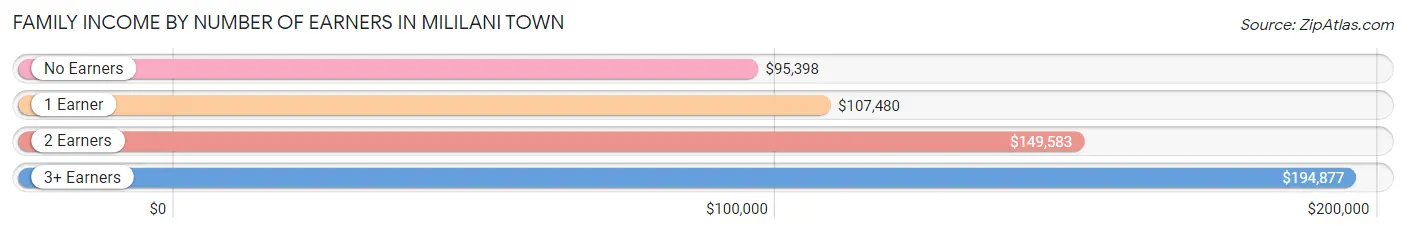
| Number of Earners | # Families | Median Income |
| No Earners | 1,273 (17.2%) | $95,398 |
| 1 Earner | 2,159 (29.1%) | $107,480 |
| 2 Earners | 2,700 (36.4%) | $149,583 |
| 3+ Earners | 1,286 (17.3%) | $194,877 |
| Total | 7,418 (100.0%) | $132,833 |
Household Income in Mililani Town
Household Income Brackets in Mililani Town
With 2,209 households falling in the category, the $100,000 to $149,999 income range is the most frequent in Mililani Town, accounting for 22.9% of all households. In contrast, only 29 households (0.3%) fall into the $10,000 to $14,999 income bracket, making it the least populous group.
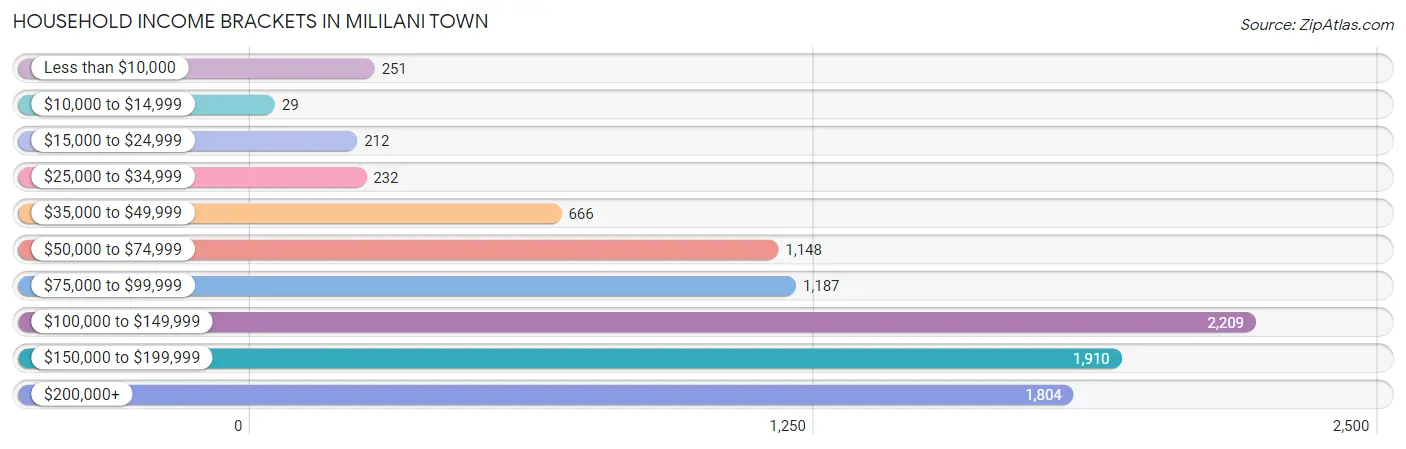
| Income Bracket | # Households | % Households |
| Less than $10,000 | 251 | 2.6% |
| $10,000 to $14,999 | 29 | 0.3% |
| $15,000 to $24,999 | 212 | 2.2% |
| $25,000 to $34,999 | 232 | 2.4% |
| $35,000 to $49,999 | 666 | 6.9% |
| $50,000 to $74,999 | 1,148 | 11.9% |
| $75,000 to $99,999 | 1,187 | 12.3% |
| $100,000 to $149,999 | 2,209 | 22.9% |
| $150,000 to $199,999 | 1,910 | 19.8% |
| $200,000+ | 1,804 | 18.7% |
Household Income by Householder Age in Mililani Town
The median household income in Mililani Town is $119,502, with the highest median household income of $134,000 found in the 45 to 64 years age bracket for the primary householder. A total of 3,502 households (36.3%) fall into this category. Meanwhile, the 15 to 24 years age bracket for the primary householder has the lowest median household income of $90,052, with 157 households (1.6%) in this group.
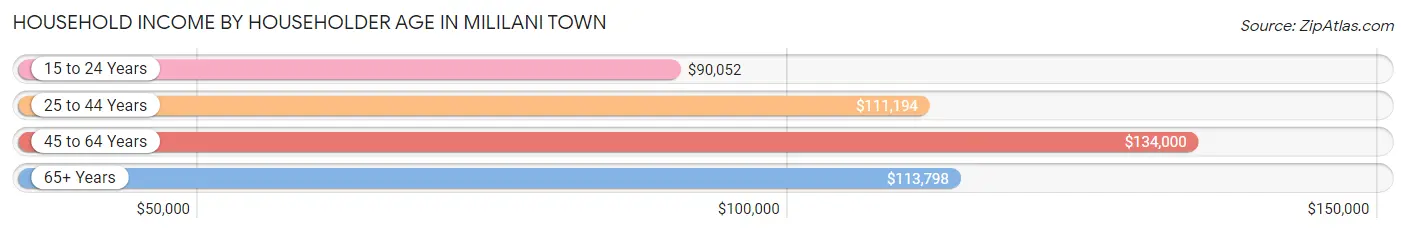
| Income Bracket | # Households | Median Income |
| 15 to 24 Years | 157 (1.6%) | $90,052 |
| 25 to 44 Years | 2,221 (23.0%) | $111,194 |
| 45 to 64 Years | 3,502 (36.3%) | $134,000 |
| 65+ Years | 3,767 (39.1%) | $113,798 |
| Total | 9,647 (100.0%) | $119,502 |
Poverty in Mililani Town
Income Below Poverty by Sex and Age in Mililani Town
With 3.7% poverty level for males and 4.2% for females among the residents of Mililani Town, 6 to 11 year old males and 18 to 24 year old females are the most vulnerable to poverty, with 95 males (12.3%) and 80 females (9.5%) in their respective age groups living below the poverty level.
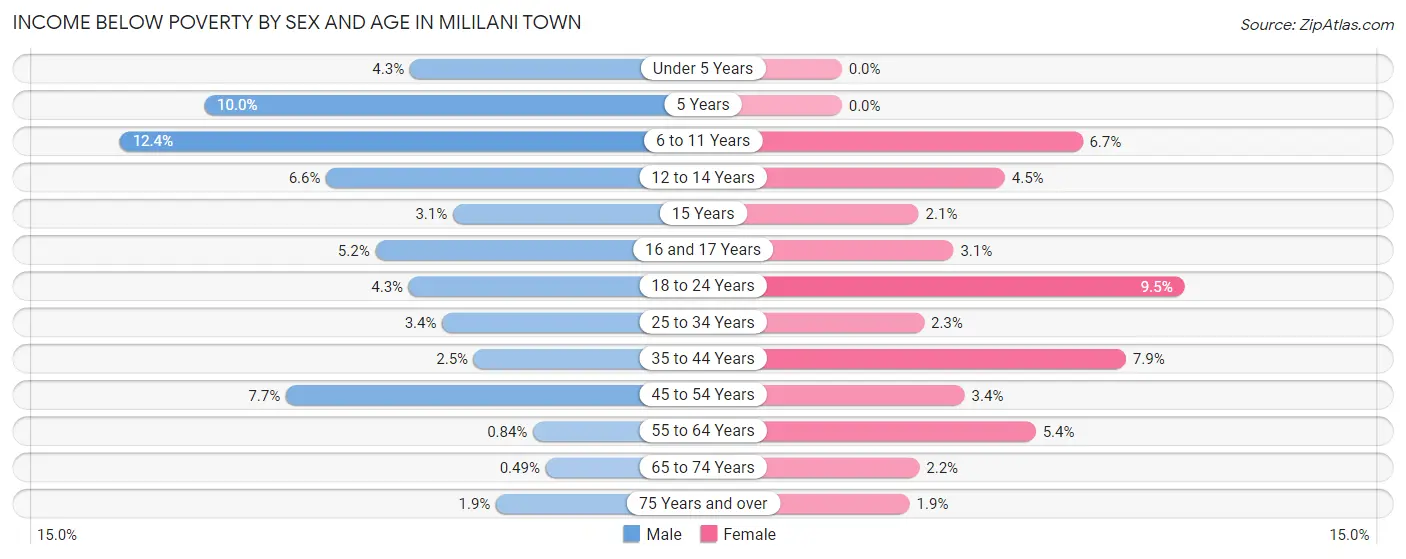
| Age Bracket | Male | Female |
| Under 5 Years | 31 (4.3%) | 0 (0.0%) |
| 5 Years | 10 (10.0%) | 0 (0.0%) |
| 6 to 11 Years | 95 (12.3%) | 50 (6.7%) |
| 12 to 14 Years | 34 (6.6%) | 26 (4.5%) |
| 15 Years | 7 (3.1%) | 5 (2.1%) |
| 16 and 17 Years | 9 (5.2%) | 8 (3.1%) |
| 18 to 24 Years | 42 (4.3%) | 80 (9.5%) |
| 25 to 34 Years | 68 (3.4%) | 30 (2.3%) |
| 35 to 44 Years | 44 (2.5%) | 133 (7.9%) |
| 45 to 54 Years | 130 (7.7%) | 59 (3.4%) |
| 55 to 64 Years | 14 (0.8%) | 95 (5.4%) |
| 65 to 74 Years | 10 (0.5%) | 44 (2.2%) |
| 75 Years and over | 26 (1.9%) | 28 (1.9%) |
| Total | 520 (3.7%) | 558 (4.2%) |
Income Above Poverty by Sex and Age in Mililani Town
According to the poverty statistics in Mililani Town, males aged 65 to 74 years and females aged under 5 years are the age groups that are most secure financially, with 99.5% of males and 100.0% of females in these age groups living above the poverty line.
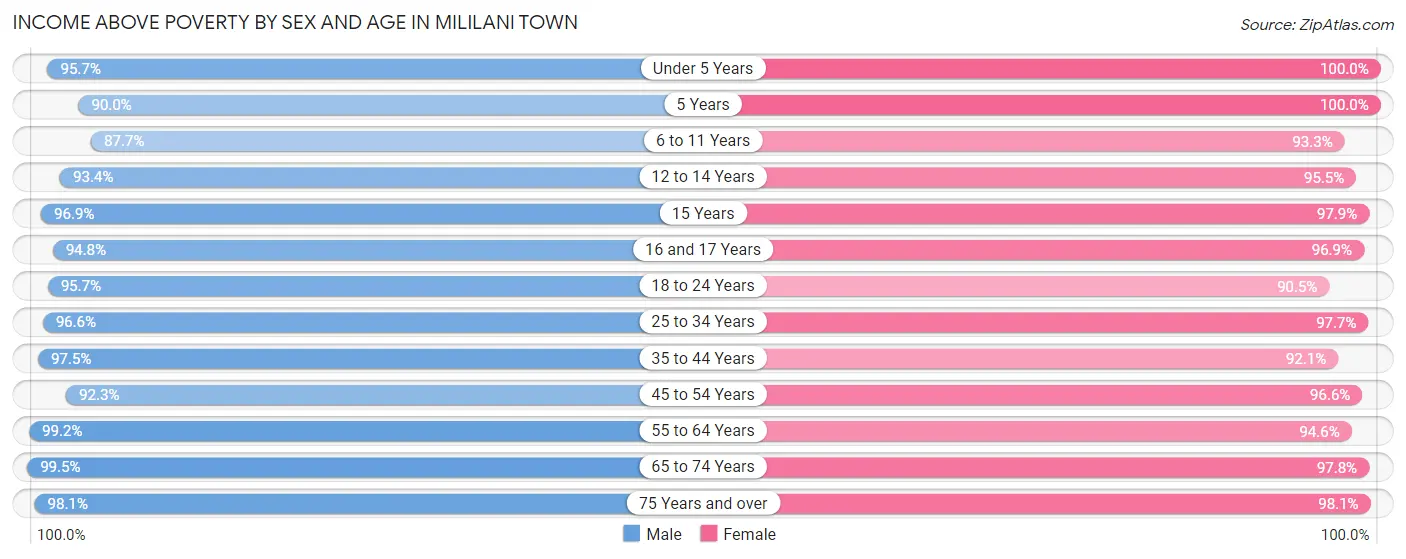
| Age Bracket | Male | Female |
| Under 5 Years | 695 (95.7%) | 543 (100.0%) |
| 5 Years | 90 (90.0%) | 71 (100.0%) |
| 6 to 11 Years | 674 (87.6%) | 696 (93.3%) |
| 12 to 14 Years | 481 (93.4%) | 547 (95.5%) |
| 15 Years | 221 (96.9%) | 229 (97.9%) |
| 16 and 17 Years | 163 (94.8%) | 249 (96.9%) |
| 18 to 24 Years | 934 (95.7%) | 759 (90.5%) |
| 25 to 34 Years | 1,952 (96.6%) | 1,281 (97.7%) |
| 35 to 44 Years | 1,721 (97.5%) | 1,549 (92.1%) |
| 45 to 54 Years | 1,555 (92.3%) | 1,664 (96.6%) |
| 55 to 64 Years | 1,645 (99.2%) | 1,663 (94.6%) |
| 65 to 74 Years | 2,048 (99.5%) | 1,996 (97.8%) |
| 75 Years and over | 1,361 (98.1%) | 1,457 (98.1%) |
| Total | 13,540 (96.3%) | 12,704 (95.8%) |
Income Below Poverty Among Married-Couple Families in Mililani Town
The poverty statistics for married-couple families in Mililani Town show that 0.5% or 31 of the total 5,741 families live below the poverty line. Families with 5 or more children have the highest poverty rate of 100.0%, comprising of 9 families. On the other hand, families with 3 or 4 children have the lowest poverty rate of 0.0%, which includes 0 families.
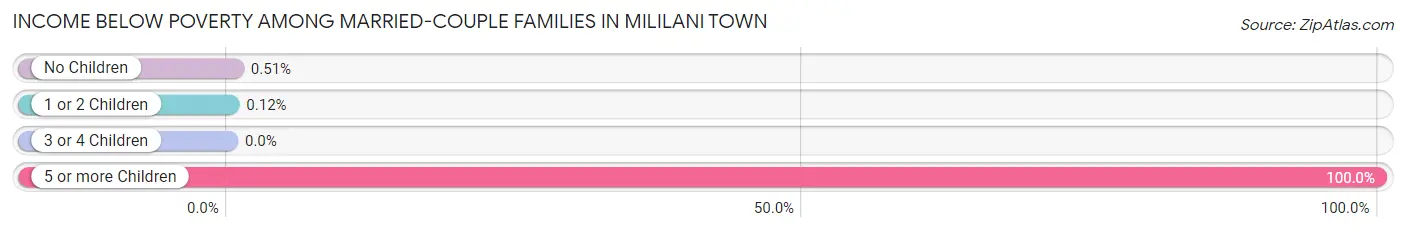
| Children | Above Poverty | Below Poverty |
| No Children | 3,926 (99.5%) | 20 (0.5%) |
| 1 or 2 Children | 1,600 (99.9%) | 2 (0.1%) |
| 3 or 4 Children | 184 (100.0%) | 0 (0.0%) |
| 5 or more Children | 0 (0.0%) | 9 (100.0%) |
| Total | 5,710 (99.5%) | 31 (0.5%) |
Income Below Poverty Among Single-Parent Households in Mililani Town
According to the poverty data in Mililani Town, 1.9% or 9 single-father households and 7.8% or 94 single-mother households are living below the poverty line. Among single-father households, those with 1 or 2 children have the highest poverty rate, with 9 households (6.1%) experiencing poverty. Likewise, among single-mother households, those with 3 or 4 children have the highest poverty rate, with 19 households (24.4%) falling below the poverty line.
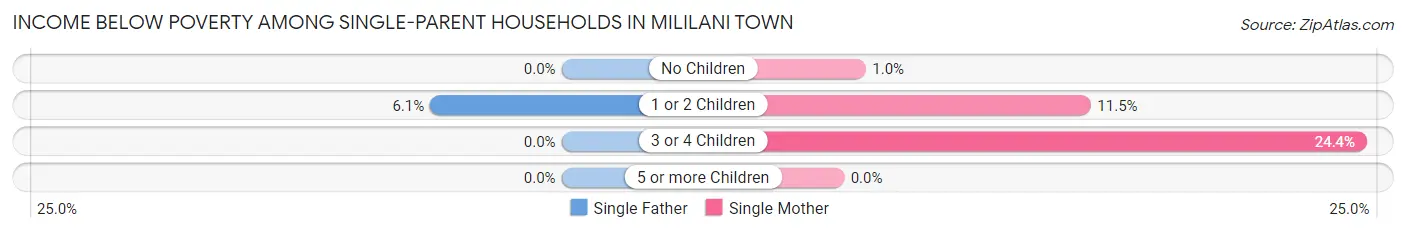
| Children | Single Father | Single Mother |
| No Children | 0 (0.0%) | 5 (1.0%) |
| 1 or 2 Children | 9 (6.1%) | 70 (11.5%) |
| 3 or 4 Children | 0 (0.0%) | 19 (24.4%) |
| 5 or more Children | 0 (0.0%) | 0 (0.0%) |
| Total | 9 (1.9%) | 94 (7.8%) |
Income Below Poverty Among Married-Couple vs Single-Parent Households in Mililani Town
The poverty data for Mililani Town shows that 31 of the married-couple family households (0.5%) and 103 of the single-parent households (6.1%) are living below the poverty level. Within the married-couple family households, those with 5 or more children have the highest poverty rate, with 9 households (100.0%) falling below the poverty line. Among the single-parent households, those with 3 or 4 children have the highest poverty rate, with 19 household (18.1%) living below poverty.
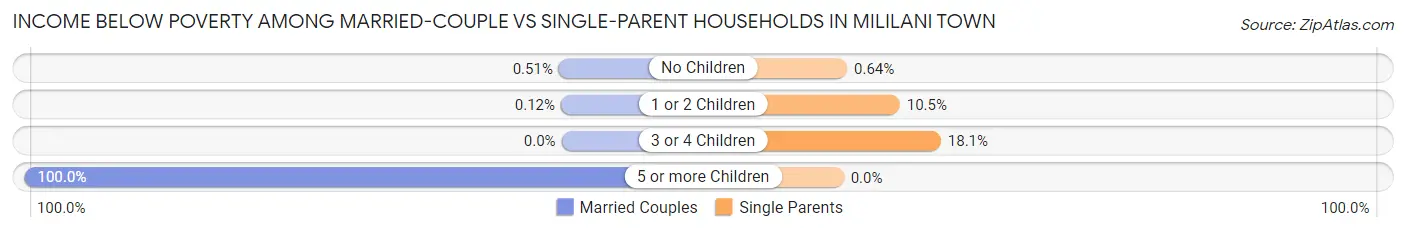
| Children | Married-Couple Families | Single-Parent Households |
| No Children | 20 (0.5%) | 5 (0.6%) |
| 1 or 2 Children | 2 (0.1%) | 79 (10.4%) |
| 3 or 4 Children | 0 (0.0%) | 19 (18.1%) |
| 5 or more Children | 9 (100.0%) | 0 (0.0%) |
| Total | 31 (0.5%) | 103 (6.1%) |
Race in Mililani Town
The most populous races in Mililani Town are Asian (12,946 | 47.2%), Two or more Races (8,842 | 32.2%), and White / Caucasian (3,234 | 11.8%).
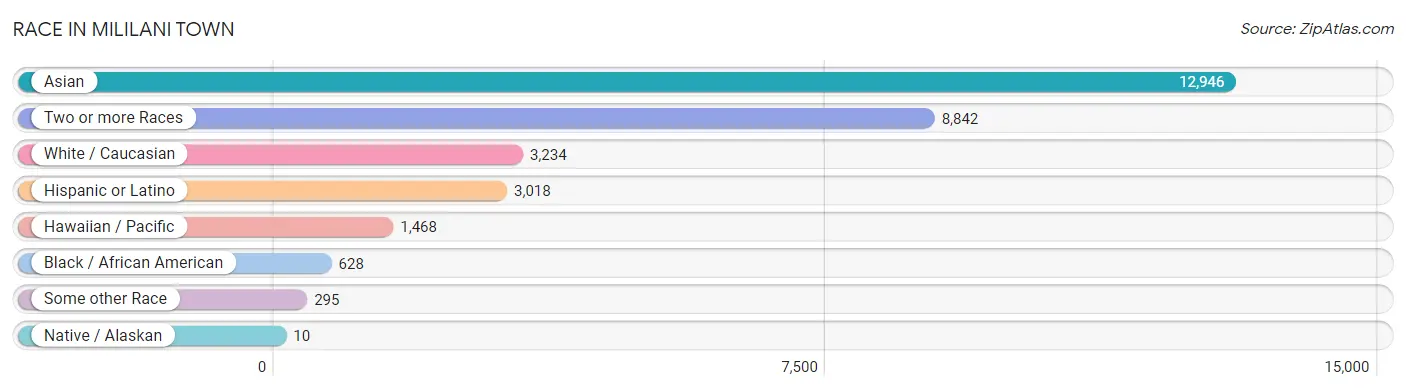
| Race | # Population | % Population |
| Asian | 12,946 | 47.2% |
| Black / African American | 628 | 2.3% |
| Hawaiian / Pacific | 1,468 | 5.3% |
| Hispanic or Latino | 3,018 | 11.0% |
| Native / Alaskan | 10 | 0.0% |
| White / Caucasian | 3,234 | 11.8% |
| Two or more Races | 8,842 | 32.2% |
| Some other Race | 295 | 1.1% |
| Total | 27,423 | 100.0% |
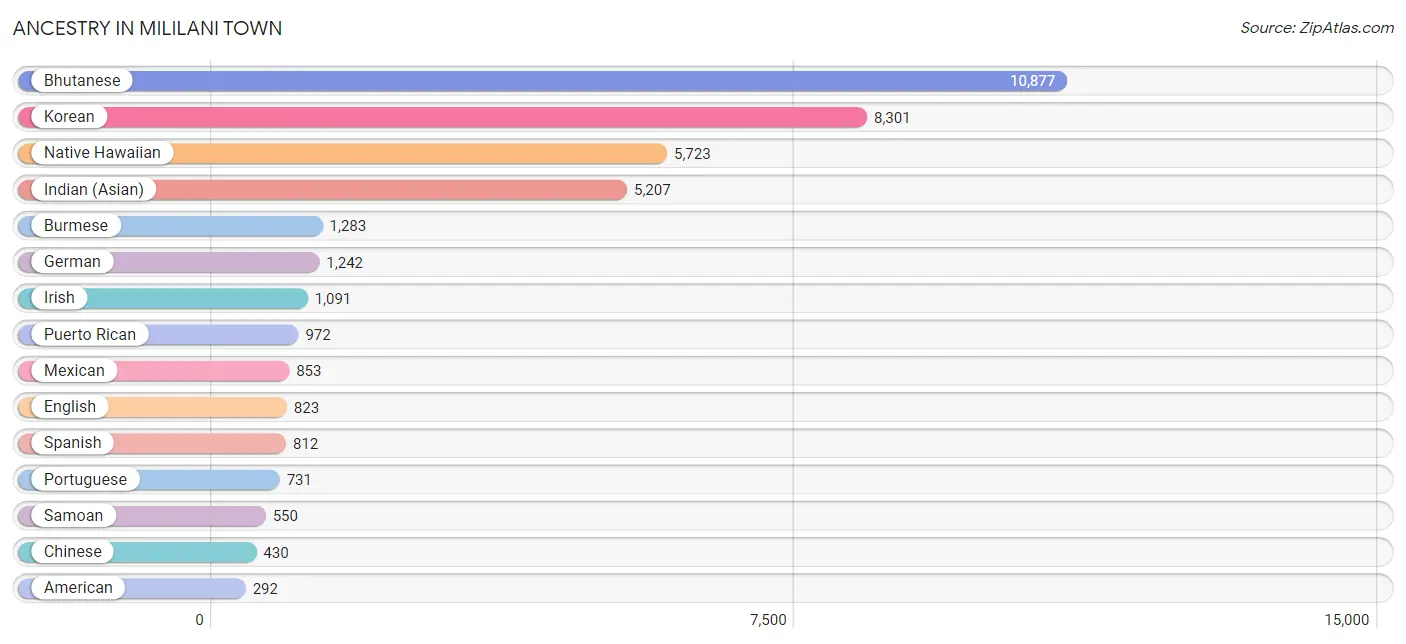
Ancestry in Mililani Town
The most populous ancestries reported in Mililani Town are Bhutanese (10,877 | 39.7%), Korean (8,301 | 30.3%), Native Hawaiian (5,723 | 20.9%), Indian (Asian) (5,207 | 19.0%), and Burmese (1,283 | 4.7%), together accounting for 114.5% of all Mililani Town residents.
| Ancestry | # Population | % Population |
| African | 40 | 0.2% |
| American | 292 | 1.1% |
| Apache | 10 | 0.0% |
| Arab | 100 | 0.4% |
| Australian | 24 | 0.1% |
| Austrian | 25 | 0.1% |
| Belgian | 9 | 0.0% |
| Bhutanese | 10,877 | 39.7% |
| Blackfeet | 8 | 0.0% |
| British | 60 | 0.2% |
| Burmese | 1,283 | 4.7% |
| Central American | 10 | 0.0% |
| Central American Indian | 27 | 0.1% |
| Cherokee | 175 | 0.6% |
| Cheyenne | 109 | 0.4% |
| Chinese | 430 | 1.6% |
| Choctaw | 38 | 0.1% |
| Colombian | 31 | 0.1% |
| Croatian | 9 | 0.0% |
| Cuban | 5 | 0.0% |
| Czech | 27 | 0.1% |
| Dominican | 7 | 0.0% |
| Dutch | 36 | 0.1% |
| English | 823 | 3.0% |
| European | 181 | 0.7% |
| Fijian | 139 | 0.5% |
| Filipino | 77 | 0.3% |
| Finnish | 26 | 0.1% |
| French | 162 | 0.6% |
| French Canadian | 29 | 0.1% |
| German | 1,242 | 4.5% |
| Ghanaian | 15 | 0.1% |
| Greek | 63 | 0.2% |
| Guamanian / Chamorro | 102 | 0.4% |
| Guatemalan | 10 | 0.0% |
| Hungarian | 29 | 0.1% |
| Indian (Asian) | 5,207 | 19.0% |
| Irish | 1,091 | 4.0% |
| Italian | 245 | 0.9% |
| Jamaican | 36 | 0.1% |
| Japanese | 10 | 0.0% |
| Korean | 8,301 | 30.3% |
| Laotian | 9 | 0.0% |
| Lebanese | 81 | 0.3% |
| Lithuanian | 22 | 0.1% |
| Marshallese | 75 | 0.3% |
| Mexican | 853 | 3.1% |
| Native Hawaiian | 5,723 | 20.9% |
| Northern European | 8 | 0.0% |
| Norwegian | 83 | 0.3% |
| Osage | 9 | 0.0% |
| Pakistani | 134 | 0.5% |
| Polish | 233 | 0.9% |
| Portuguese | 731 | 2.7% |
| Pueblo | 8 | 0.0% |
| Puerto Rican | 972 | 3.5% |
| Romanian | 8 | 0.0% |
| Russian | 44 | 0.2% |
| Samoan | 550 | 2.0% |
| Scandinavian | 15 | 0.1% |
| Scotch-Irish | 149 | 0.5% |
| Scottish | 79 | 0.3% |
| Seminole | 5 | 0.0% |
| Slovene | 8 | 0.0% |
| South American | 54 | 0.2% |
| Spaniard | 216 | 0.8% |
| Spanish | 812 | 3.0% |
| Sri Lankan | 94 | 0.3% |
| Subsaharan African | 78 | 0.3% |
| Swedish | 123 | 0.4% |
| Thai | 56 | 0.2% |
| Tongan | 222 | 0.8% |
| Venezuelan | 23 | 0.1% |
| Welsh | 102 | 0.4% |
| Yugoslavian | 4 | 0.0% | View All 75 Rows |
Immigrants in Mililani Town
The most numerous immigrant groups reported in Mililani Town came from Asia (2,238 | 8.2%), South Eastern Asia (1,412 | 5.1%), Philippines (1,318 | 4.8%), Eastern Asia (789 | 2.9%), and Japan (292 | 1.1%), together accounting for 22.1% of all Mililani Town residents.
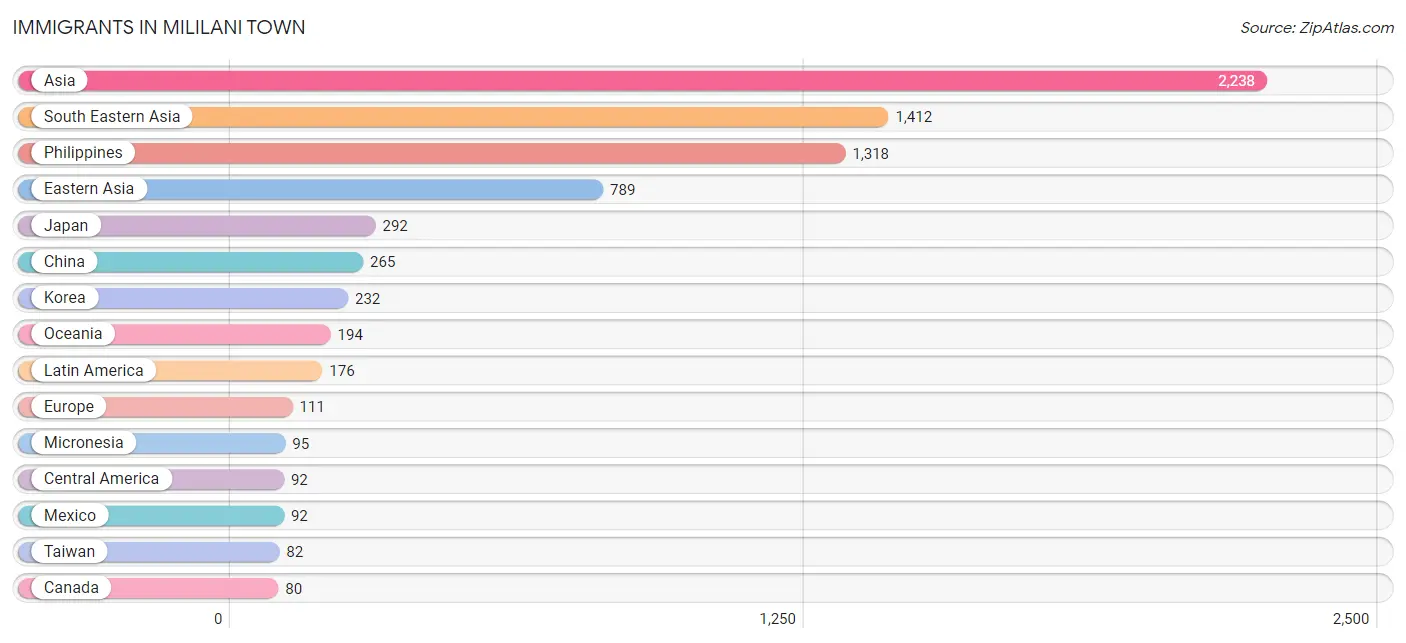
| Immigration Origin | # Population | % Population |
| Africa | 75 | 0.3% |
| Asia | 2,238 | 8.2% |
| Cambodia | 10 | 0.0% |
| Canada | 80 | 0.3% |
| Caribbean | 12 | 0.0% |
| Central America | 92 | 0.3% |
| China | 265 | 1.0% |
| Colombia | 19 | 0.1% |
| Eastern Africa | 18 | 0.1% |
| Eastern Asia | 789 | 2.9% |
| Eastern Europe | 7 | 0.0% |
| England | 18 | 0.1% |
| Europe | 111 | 0.4% |
| Germany | 62 | 0.2% |
| Ghana | 44 | 0.2% |
| Guyana | 10 | 0.0% |
| Hong Kong | 8 | 0.0% |
| Hungary | 7 | 0.0% |
| India | 8 | 0.0% |
| Indonesia | 9 | 0.0% |
| Jamaica | 12 | 0.0% |
| Japan | 292 | 1.1% |
| Korea | 232 | 0.9% |
| Latin America | 176 | 0.6% |
| Lebanon | 29 | 0.1% |
| Malaysia | 9 | 0.0% |
| Mexico | 92 | 0.3% |
| Micronesia | 95 | 0.4% |
| Nigeria | 13 | 0.1% |
| Northern Europe | 28 | 0.1% |
| Oceania | 194 | 0.7% |
| Peru | 32 | 0.1% |
| Philippines | 1,318 | 4.8% |
| South America | 72 | 0.3% |
| South Central Asia | 8 | 0.0% |
| South Eastern Asia | 1,412 | 5.1% |
| Southern Europe | 14 | 0.1% |
| Spain | 14 | 0.1% |
| Sweden | 10 | 0.0% |
| Taiwan | 82 | 0.3% |
| Thailand | 40 | 0.2% |
| Venezuela | 11 | 0.0% |
| Vietnam | 26 | 0.1% |
| Western Africa | 57 | 0.2% |
| Western Asia | 29 | 0.1% |
| Western Europe | 62 | 0.2% | View All 46 Rows |
Sex and Age in Mililani Town
Sex and Age in Mililani Town
The most populous age groups in Mililani Town are 25 to 29 Years (1,353 | 9.6%) for men and 70 to 74 Years (1,021 | 7.7%) for women.
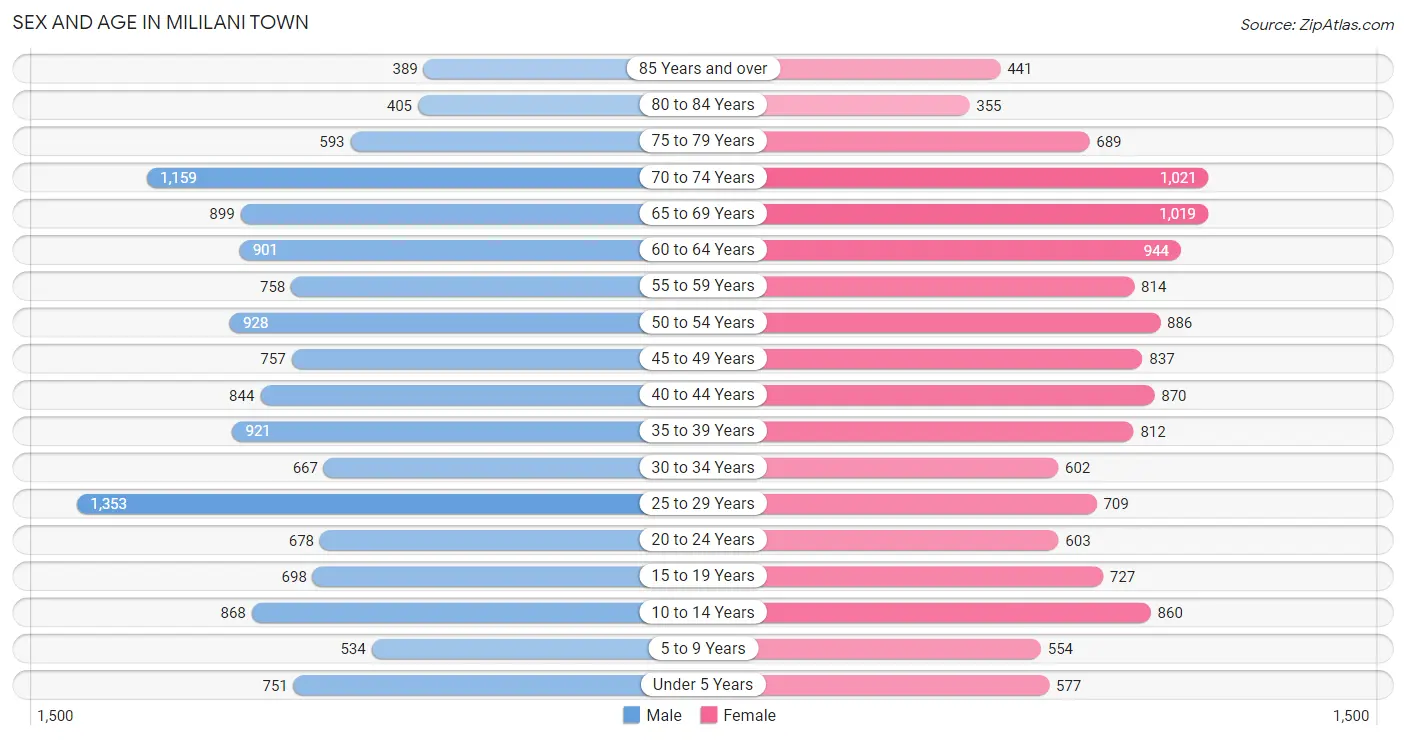
| Age Bracket | Male | Female |
| Under 5 Years | 751 (5.3%) | 577 (4.3%) |
| 5 to 9 Years | 534 (3.8%) | 554 (4.2%) |
| 10 to 14 Years | 868 (6.1%) | 860 (6.5%) |
| 15 to 19 Years | 698 (5.0%) | 727 (5.5%) |
| 20 to 24 Years | 678 (4.8%) | 603 (4.5%) |
| 25 to 29 Years | 1,353 (9.6%) | 709 (5.3%) |
| 30 to 34 Years | 667 (4.7%) | 602 (4.5%) |
| 35 to 39 Years | 921 (6.5%) | 812 (6.1%) |
| 40 to 44 Years | 844 (6.0%) | 870 (6.5%) |
| 45 to 49 Years | 757 (5.4%) | 837 (6.3%) |
| 50 to 54 Years | 928 (6.6%) | 886 (6.7%) |
| 55 to 59 Years | 758 (5.4%) | 814 (6.1%) |
| 60 to 64 Years | 901 (6.4%) | 944 (7.1%) |
| 65 to 69 Years | 899 (6.4%) | 1,019 (7.6%) |
| 70 to 74 Years | 1,159 (8.2%) | 1,021 (7.7%) |
| 75 to 79 Years | 593 (4.2%) | 689 (5.2%) |
| 80 to 84 Years | 405 (2.9%) | 355 (2.7%) |
| 85 Years and over | 389 (2.8%) | 441 (3.3%) |
| Total | 14,103 (100.0%) | 13,320 (100.0%) |
Families and Households in Mililani Town
Median Family Size in Mililani Town
The median family size in Mililani Town is 3.21 persons per family, with single female/mother families (1,209 | 16.3%) accounting for the largest median family size of 3.34 persons per family. On the other hand, single male/father families (468 | 6.3%) represent the smallest median family size with 3.10 persons per family.
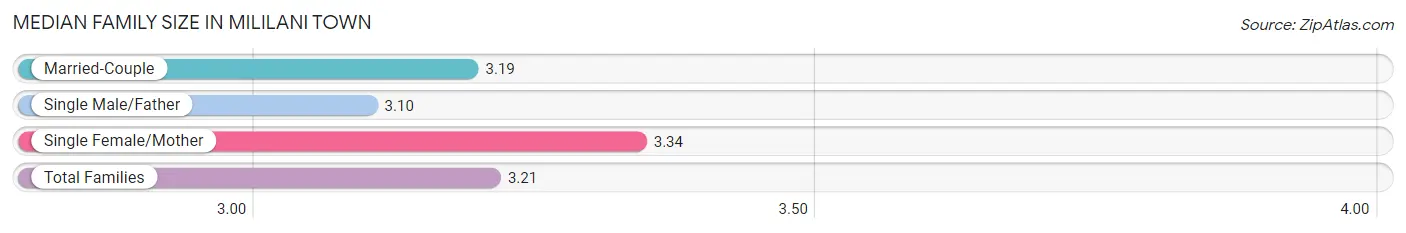
| Family Type | # Families | Family Size |
| Married-Couple | 5,741 (77.4%) | 3.19 |
| Single Male/Father | 468 (6.3%) | 3.10 |
| Single Female/Mother | 1,209 (16.3%) | 3.34 |
| Total Families | 7,418 (100.0%) | 3.21 |
Median Household Size in Mililani Town
The median household size in Mililani Town is 2.84 persons per household, with single female/mother households (1,209 | 12.5%) accounting for the largest median household size of 3.6 persons per household. non-family households (2,229 | 23.1%) represent the smallest median household size with 1.29 persons per household.
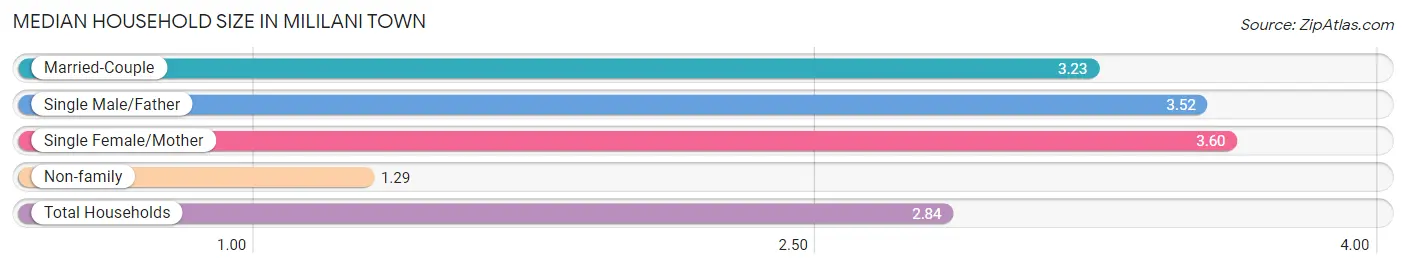
| Household Type | # Households | Household Size |
| Married-Couple | 5,741 (59.5%) | 3.23 |
| Single Male/Father | 468 (4.9%) | 3.52 |
| Single Female/Mother | 1,209 (12.5%) | 3.60 |
| Non-family | 2,229 (23.1%) | 1.29 |
| Total Households | 9,647 (100.0%) | 2.84 |
Household Size by Marriage Status in Mililani Town
Out of a total of 9,647 households in Mililani Town, 7,418 (76.9%) are family households, while 2,229 (23.1%) are nonfamily households. The most numerous type of family households are 2-person households, comprising 2,891, and the most common type of nonfamily households are 1-person households, comprising 1,780.
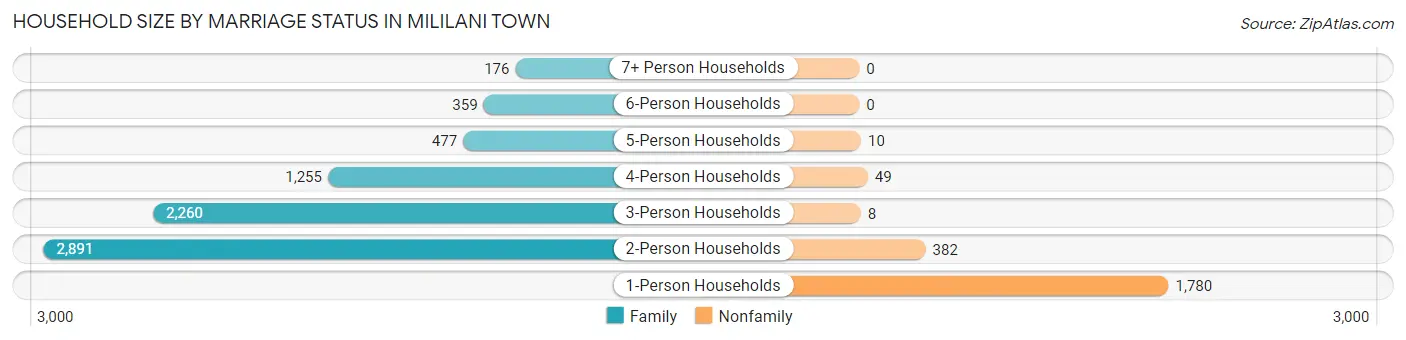
| Household Size | Family Households | Nonfamily Households |
| 1-Person Households | - | 1,780 (18.4%) |
| 2-Person Households | 2,891 (30.0%) | 382 (4.0%) |
| 3-Person Households | 2,260 (23.4%) | 8 (0.1%) |
| 4-Person Households | 1,255 (13.0%) | 49 (0.5%) |
| 5-Person Households | 477 (4.9%) | 10 (0.1%) |
| 6-Person Households | 359 (3.7%) | 0 (0.0%) |
| 7+ Person Households | 176 (1.8%) | 0 (0.0%) |
| Total | 7,418 (76.9%) | 2,229 (23.1%) |
Female Fertility in Mililani Town
Fertility by Age in Mililani Town
Average fertility rate in Mililani Town is 59.0 births per 1,000 women. Women in the age bracket of 20 to 34 years have the highest fertility rate with 103.0 births per 1,000 women. Women in the age bracket of 20 to 34 years acount for 63.3% of all women with births.
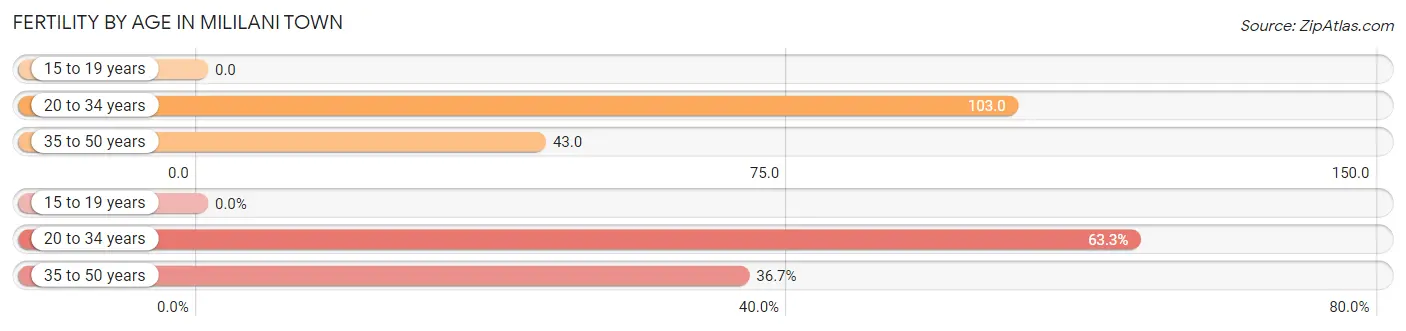
| Age Bracket | Women with Births | Births / 1,000 Women |
| 15 to 19 years | 0 (0.0%) | 0.0 |
| 20 to 34 years | 198 (63.3%) | 103.0 |
| 35 to 50 years | 115 (36.7%) | 43.0 |
| Total | 313 (100.0%) | 59.0 |
Fertility by Age by Marriage Status in Mililani Town
78.0% of women with births (313) in Mililani Town are married. The highest percentage of unmarried women with births falls into 20 to 34 years age bracket with 22.2% of them unmarried at the time of birth, while the lowest percentage of unmarried women with births belong to 35 to 50 years age bracket with 21.7% of them unmarried.
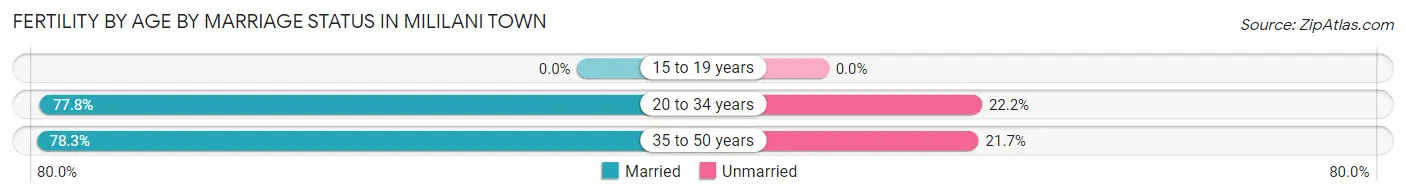
| Age Bracket | Married | Unmarried |
| 15 to 19 years | 0 (0.0%) | 0 (0.0%) |
| 20 to 34 years | 154 (77.8%) | 44 (22.2%) |
| 35 to 50 years | 90 (78.3%) | 25 (21.7%) |
| Total | 244 (78.0%) | 69 (22.0%) |
Fertility by Education in Mililani Town
Average fertility rate in Mililani Town is 59.0 births per 1,000 women. Women with the education attainment of graduate degree have the highest fertility rate of 79.0 births per 1,000 women, while women with the education attainment of high school diploma have the lowest fertility at 17.0 births per 1,000 women. Women with the education attainment of college or associate's degree represent 38.0% of all women with births.
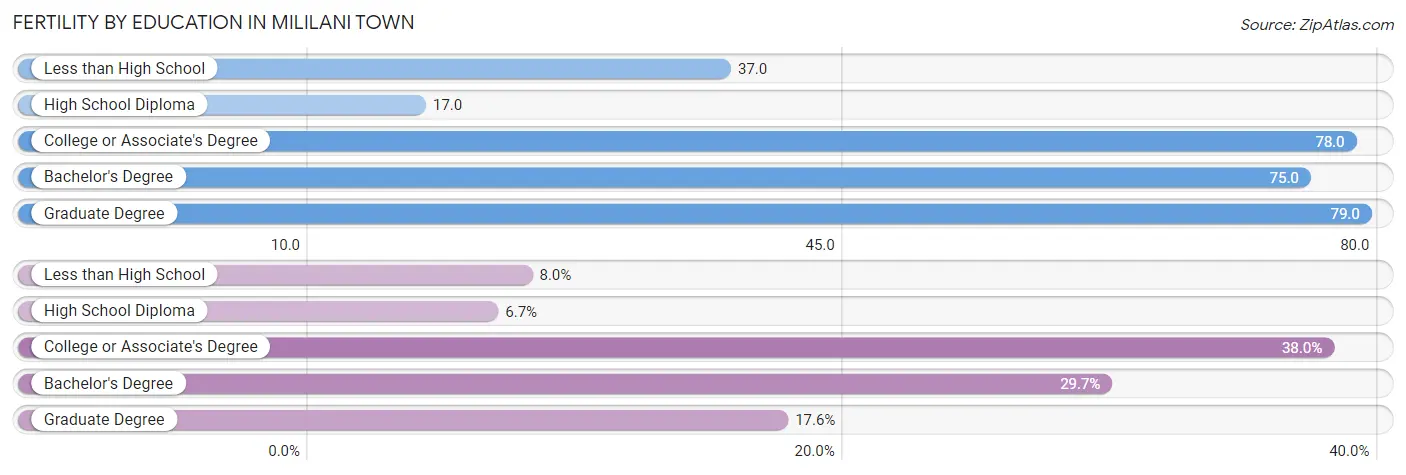
| Educational Attainment | Women with Births | Births / 1,000 Women |
| Less than High School | 25 (8.0%) | 37.0 |
| High School Diploma | 21 (6.7%) | 17.0 |
| College or Associate's Degree | 119 (38.0%) | 78.0 |
| Bachelor's Degree | 93 (29.7%) | 75.0 |
| Graduate Degree | 55 (17.6%) | 79.0 |
| Total | 313 (100.0%) | 59.0 |
Fertility by Education by Marriage Status in Mililani Town
22.0% of women with births in Mililani Town are unmarried. Women with the educational attainment of graduate degree are most likely to be married with 100.0% of them married at childbirth, while women with the educational attainment of less than high school are least likely to be married with 100.0% of them unmarried at childbirth.
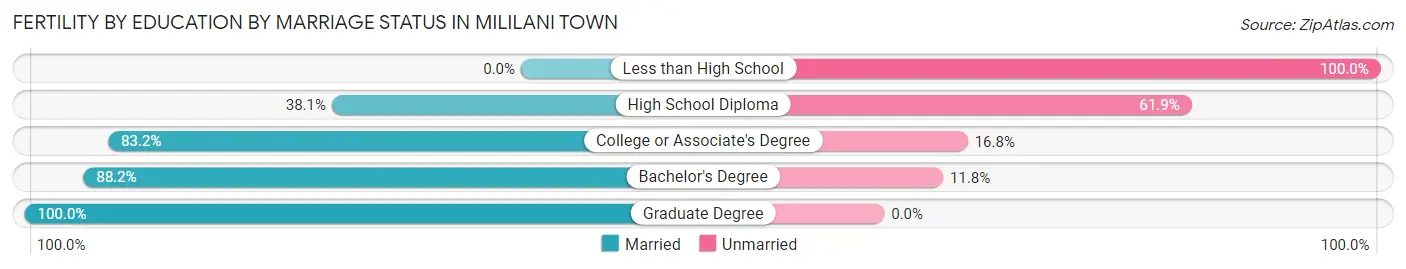
| Educational Attainment | Married | Unmarried |
| Less than High School | 0 (0.0%) | 25 (100.0%) |
| High School Diploma | 8 (38.1%) | 13 (61.9%) |
| College or Associate's Degree | 99 (83.2%) | 20 (16.8%) |
| Bachelor's Degree | 82 (88.2%) | 11 (11.8%) |
| Graduate Degree | 55 (100.0%) | 0 (0.0%) |
| Total | 244 (78.0%) | 69 (22.0%) |
Employment Characteristics in Mililani Town
Employment by Class of Employer in Mililani Town
Among the 13,461 employed individuals in Mililani Town, private company employees (7,247 | 53.8%), federal government employees (2,229 | 16.6%), and not-for-profit organizations (1,238 | 9.2%) make up the most common classes of employment.
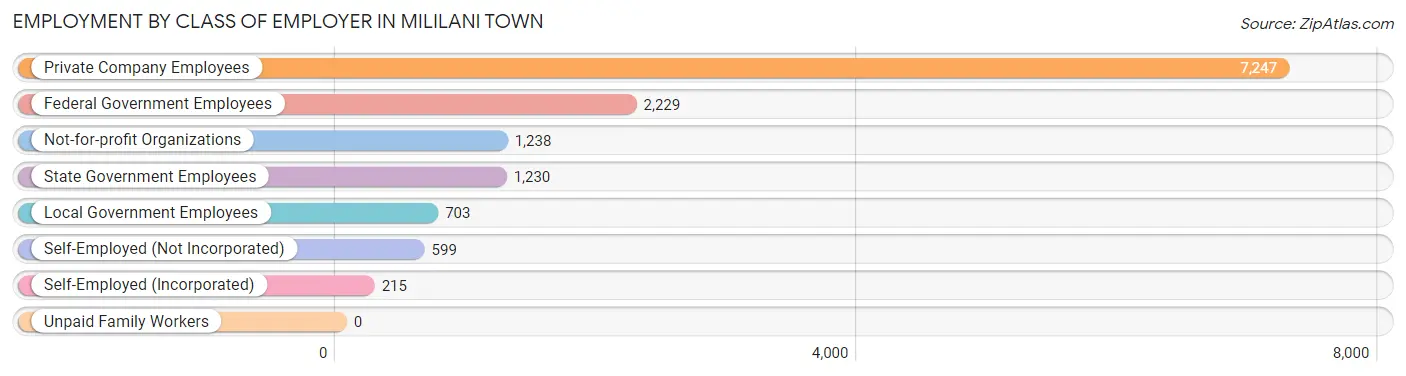
| Employer Class | # Employees | % Employees |
| Private Company Employees | 7,247 | 53.8% |
| Self-Employed (Incorporated) | 215 | 1.6% |
| Self-Employed (Not Incorporated) | 599 | 4.4% |
| Not-for-profit Organizations | 1,238 | 9.2% |
| Local Government Employees | 703 | 5.2% |
| State Government Employees | 1,230 | 9.1% |
| Federal Government Employees | 2,229 | 16.6% |
| Unpaid Family Workers | 0 | 0.0% |
| Total | 13,461 | 100.0% |
Employment Status by Age in Mililani Town
According to the labor force statistics for Mililani Town, out of the total population over 16 years of age (22,817), 62.3% or 14,215 individuals are in the labor force, with 3.6% or 512 of them unemployed. The age group with the highest labor force participation rate is 30 to 34 years, with 93.2% or 1,183 individuals in the labor force. Within the labor force, the 75 years and over age range has the highest percentage of unemployed individuals, with 11.2% or 11 of them being unemployed.
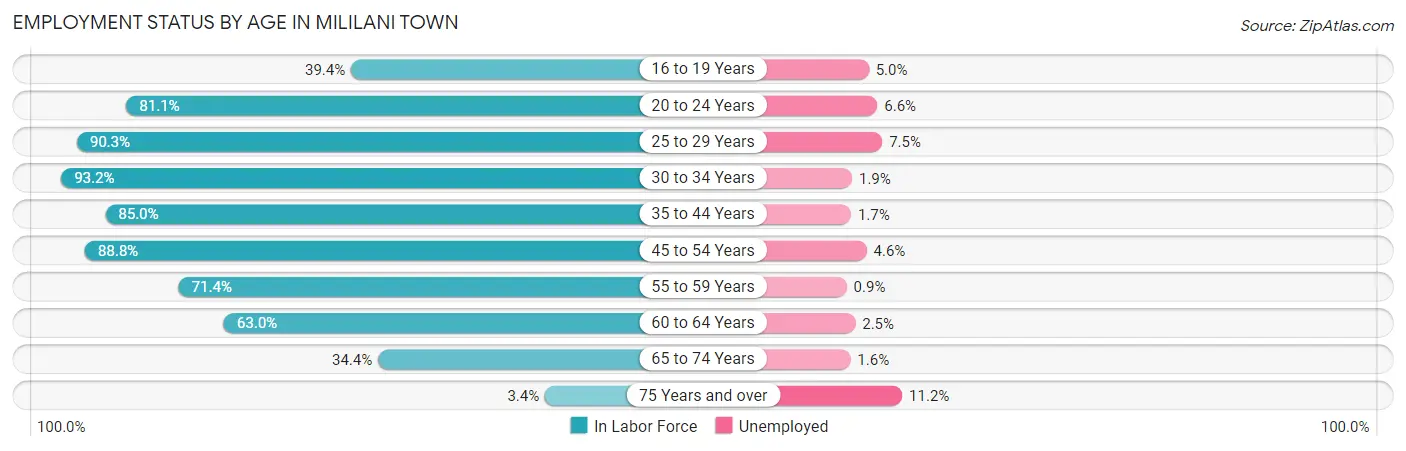
| Age Bracket | In Labor Force | Unemployed |
| 16 to 19 Years | 379 (39.4%) | 19 (5.0%) |
| 20 to 24 Years | 1,039 (81.1%) | 69 (6.6%) |
| 25 to 29 Years | 1,862 (90.3%) | 140 (7.5%) |
| 30 to 34 Years | 1,183 (93.2%) | 22 (1.9%) |
| 35 to 44 Years | 2,930 (85.0%) | 50 (1.7%) |
| 45 to 54 Years | 3,026 (88.8%) | 139 (4.6%) |
| 55 to 59 Years | 1,122 (71.4%) | 10 (0.9%) |
| 60 to 64 Years | 1,162 (63.0%) | 29 (2.5%) |
| 65 to 74 Years | 1,410 (34.4%) | 23 (1.6%) |
| 75 Years and over | 98 (3.4%) | 11 (11.2%) |
| Total | 14,215 (62.3%) | 512 (3.6%) |
Employment Status by Educational Attainment in Mililani Town
According to labor force statistics for Mililani Town, 83.0% of individuals (11,290) out of the total population between 25 and 64 years of age (13,603) are in the labor force, with 3.4% or 384 of them being unemployed. The group with the highest labor force participation rate are those with the educational attainment of bachelor's degree or higher, with 90.1% or 4,774 individuals in the labor force. Within the labor force, individuals with college / associate degree education have the highest percentage of unemployment, with 5.0% or 196 of them being unemployed.
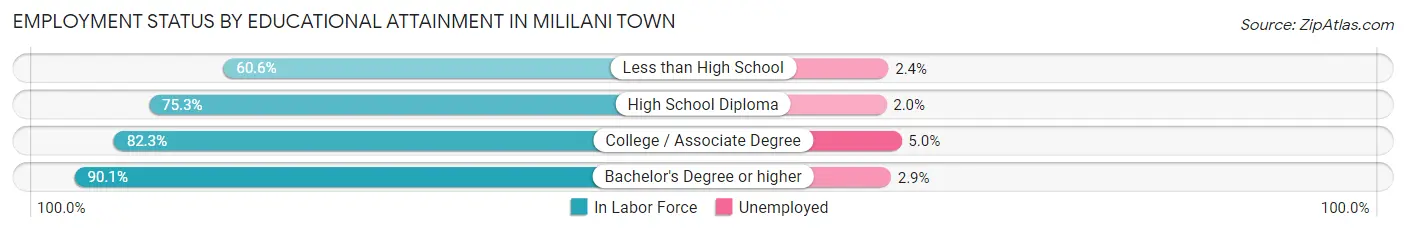
| Educational Attainment | In Labor Force | Unemployed |
| Less than High School | 304 (60.6%) | 12 (2.4%) |
| High School Diploma | 2,279 (75.3%) | 61 (2.0%) |
| College / Associate Degree | 3,930 (82.3%) | 239 (5.0%) |
| Bachelor's Degree or higher | 4,774 (90.1%) | 154 (2.9%) |
| Total | 11,290 (83.0%) | 463 (3.4%) |
Employment Occupations by Sex in Mililani Town
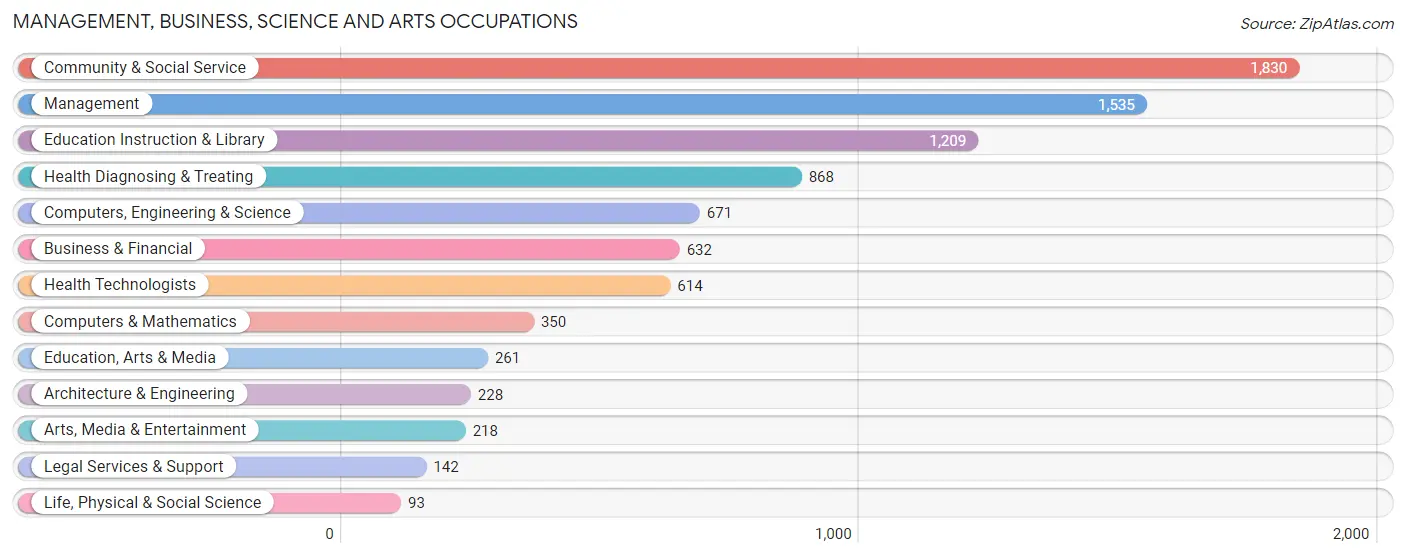
Management, Business, Science and Arts Occupations
The most common Management, Business, Science and Arts occupations in Mililani Town are Community & Social Service (1,830 | 13.7%), Management (1,535 | 11.5%), Education Instruction & Library (1,209 | 9.1%), Health Diagnosing & Treating (868 | 6.5%), and Computers, Engineering & Science (671 | 5.0%).
Management, Business, Science and Arts Occupations by Sex
Within the Management, Business, Science and Arts occupations in Mililani Town, the most male-oriented occupations are Architecture & Engineering (89.5%), Computers, Engineering & Science (73.3%), and Arts, Media & Entertainment (72.9%), while the most female-oriented occupations are Education, Arts & Media (72.0%), Health Diagnosing & Treating (61.1%), and Management (58.1%).
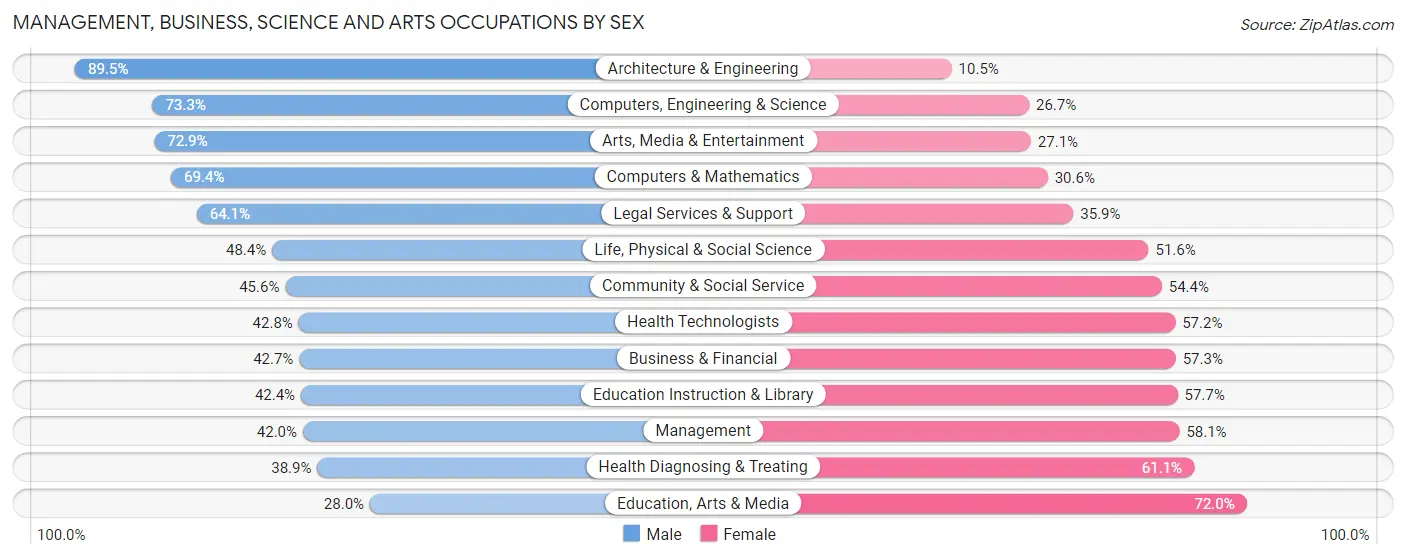
| Occupation | Male | Female |
| Management | 644 (41.9%) | 891 (58.1%) |
| Business & Financial | 270 (42.7%) | 362 (57.3%) |
| Computers, Engineering & Science | 492 (73.3%) | 179 (26.7%) |
| Computers & Mathematics | 243 (69.4%) | 107 (30.6%) |
| Architecture & Engineering | 204 (89.5%) | 24 (10.5%) |
| Life, Physical & Social Science | 45 (48.4%) | 48 (51.6%) |
| Community & Social Service | 835 (45.6%) | 995 (54.4%) |
| Education, Arts & Media | 73 (28.0%) | 188 (72.0%) |
| Legal Services & Support | 91 (64.1%) | 51 (35.9%) |
| Education Instruction & Library | 512 (42.3%) | 697 (57.7%) |
| Arts, Media & Entertainment | 159 (72.9%) | 59 (27.1%) |
| Health Diagnosing & Treating | 338 (38.9%) | 530 (61.1%) |
| Health Technologists | 263 (42.8%) | 351 (57.2%) |
| Total (Category) | 2,579 (46.6%) | 2,957 (53.4%) |
| Total (Overall) | 7,340 (55.1%) | 5,982 (44.9%) |
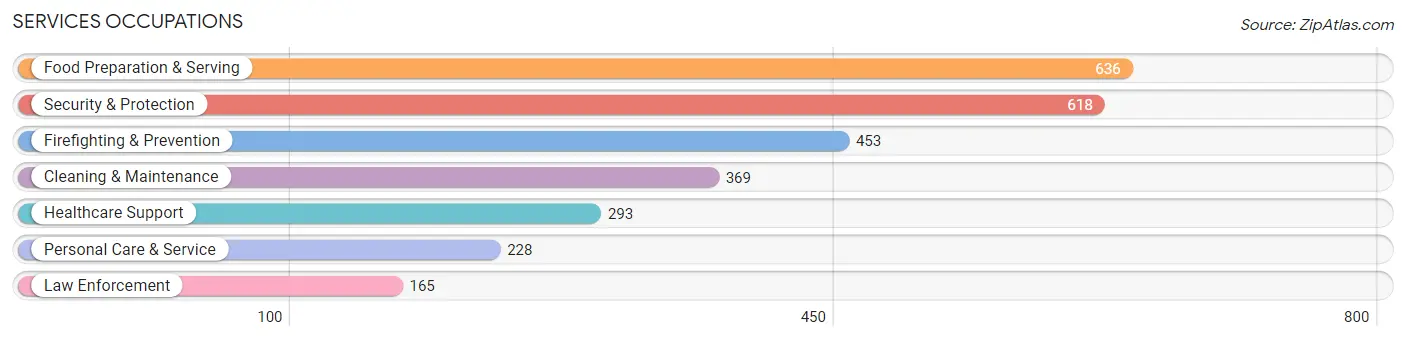
Services Occupations
The most common Services occupations in Mililani Town are Food Preparation & Serving (636 | 4.8%), Security & Protection (618 | 4.6%), Firefighting & Prevention (453 | 3.4%), Cleaning & Maintenance (369 | 2.8%), and Healthcare Support (293 | 2.2%).
Services Occupations by Sex
Within the Services occupations in Mililani Town, the most male-oriented occupations are Law Enforcement (90.3%), Security & Protection (85.0%), and Firefighting & Prevention (83.0%), while the most female-oriented occupations are Healthcare Support (75.1%), Personal Care & Service (63.2%), and Food Preparation & Serving (54.2%).
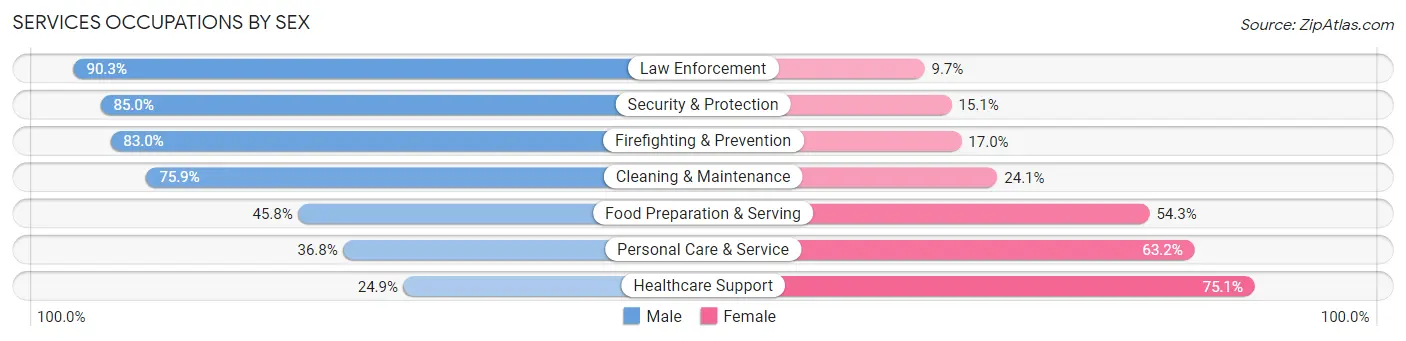
| Occupation | Male | Female |
| Healthcare Support | 73 (24.9%) | 220 (75.1%) |
| Security & Protection | 525 (85.0%) | 93 (15.0%) |
| Firefighting & Prevention | 376 (83.0%) | 77 (17.0%) |
| Law Enforcement | 149 (90.3%) | 16 (9.7%) |
| Food Preparation & Serving | 291 (45.8%) | 345 (54.2%) |
| Cleaning & Maintenance | 280 (75.9%) | 89 (24.1%) |
| Personal Care & Service | 84 (36.8%) | 144 (63.2%) |
| Total (Category) | 1,253 (58.4%) | 891 (41.6%) |
| Total (Overall) | 7,340 (55.1%) | 5,982 (44.9%) |
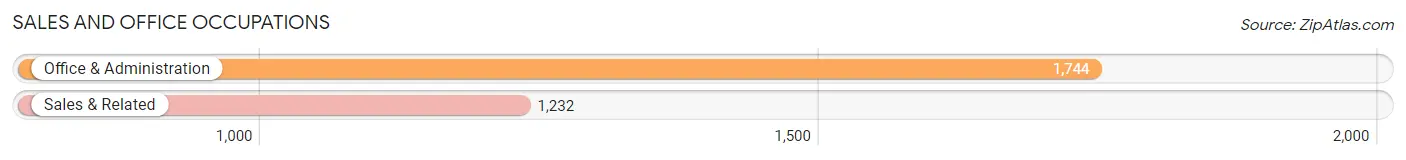
Sales and Office Occupations
The most common Sales and Office occupations in Mililani Town are Office & Administration (1,744 | 13.1%), and Sales & Related (1,232 | 9.2%).
Sales and Office Occupations by Sex
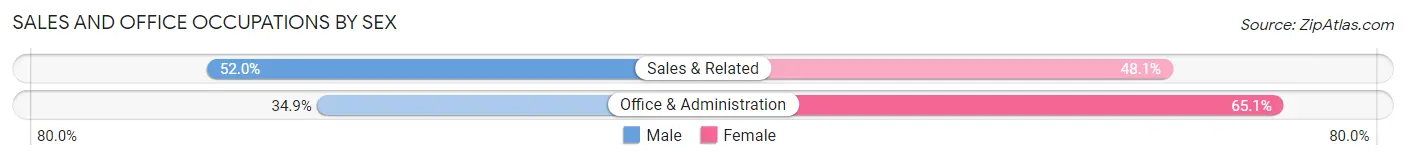
| Occupation | Male | Female |
| Sales & Related | 640 (51.9%) | 592 (48.0%) |
| Office & Administration | 609 (34.9%) | 1,135 (65.1%) |
| Total (Category) | 1,249 (42.0%) | 1,727 (58.0%) |
| Total (Overall) | 7,340 (55.1%) | 5,982 (44.9%) |
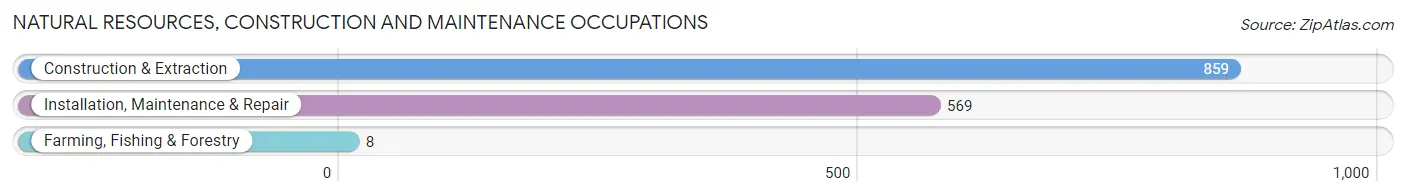
Natural Resources, Construction and Maintenance Occupations
The most common Natural Resources, Construction and Maintenance occupations in Mililani Town are Construction & Extraction (859 | 6.5%), Installation, Maintenance & Repair (569 | 4.3%), and Farming, Fishing & Forestry (8 | 0.1%).
Natural Resources, Construction and Maintenance Occupations by Sex
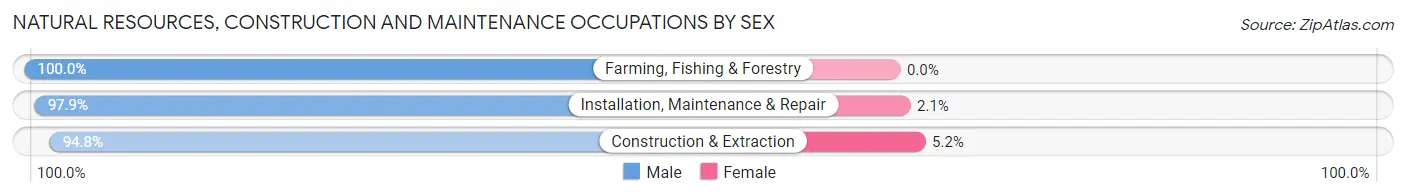
| Occupation | Male | Female |
| Farming, Fishing & Forestry | 8 (100.0%) | 0 (0.0%) |
| Construction & Extraction | 814 (94.8%) | 45 (5.2%) |
| Installation, Maintenance & Repair | 557 (97.9%) | 12 (2.1%) |
| Total (Category) | 1,379 (96.0%) | 57 (4.0%) |
| Total (Overall) | 7,340 (55.1%) | 5,982 (44.9%) |
Production, Transportation and Moving Occupations
The most common Production, Transportation and Moving occupations in Mililani Town are Transportation (552 | 4.1%), Production (416 | 3.1%), and Material Moving (262 | 2.0%).
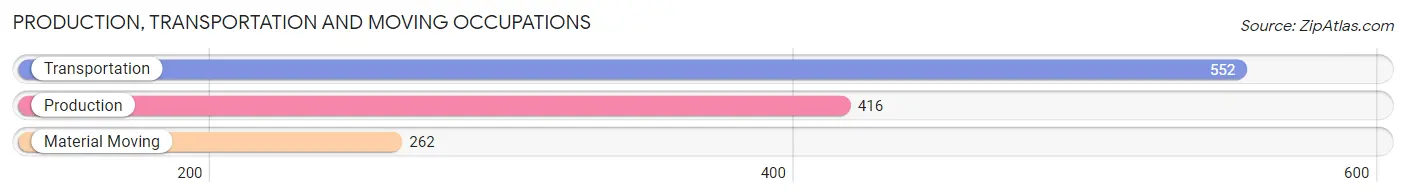
Production, Transportation and Moving Occupations by Sex
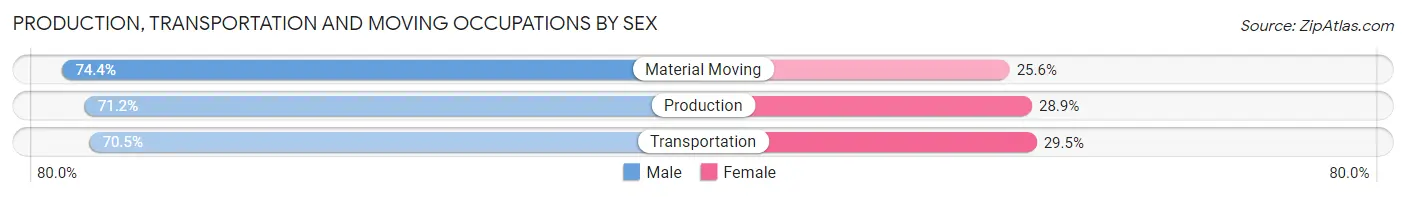
| Occupation | Male | Female |
| Production | 296 (71.2%) | 120 (28.8%) |
| Transportation | 389 (70.5%) | 163 (29.5%) |
| Material Moving | 195 (74.4%) | 67 (25.6%) |
| Total (Category) | 880 (71.5%) | 350 (28.5%) |
| Total (Overall) | 7,340 (55.1%) | 5,982 (44.9%) |
Employment Industries by Sex in Mililani Town
Employment Industries in Mililani Town
The major employment industries in Mililani Town include Health Care & Social Assistance (2,006 | 15.1%), Public Administration (1,890 | 14.2%), Educational Services (1,559 | 11.7%), Retail Trade (1,322 | 9.9%), and Construction (1,159 | 8.7%).
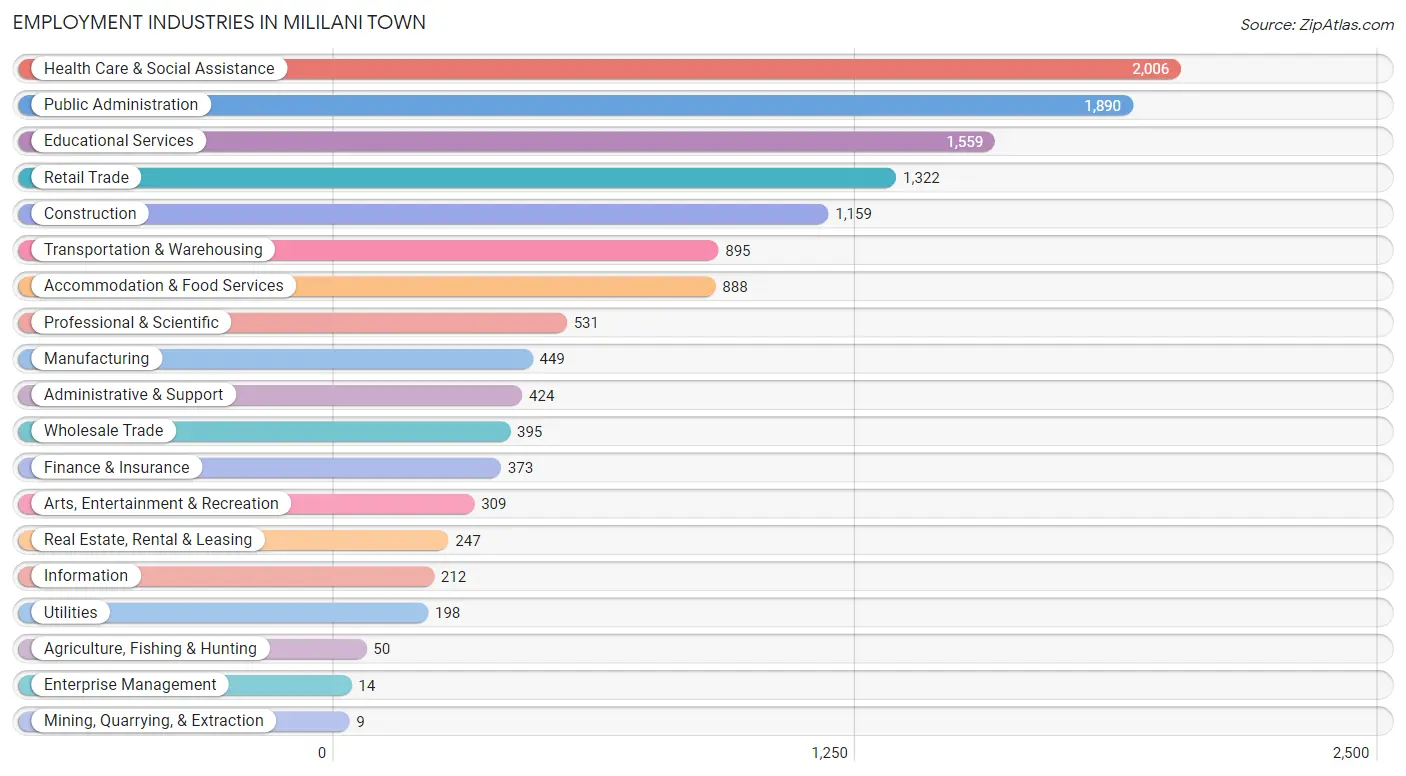
Employment Industries by Sex in Mililani Town
The Mililani Town industries that see more men than women are Mining, Quarrying, & Extraction (100.0%), Manufacturing (83.1%), and Construction (82.6%), whereas the industries that tend to have a higher number of women are Enterprise Management (100.0%), Finance & Insurance (73.2%), and Health Care & Social Assistance (69.3%).
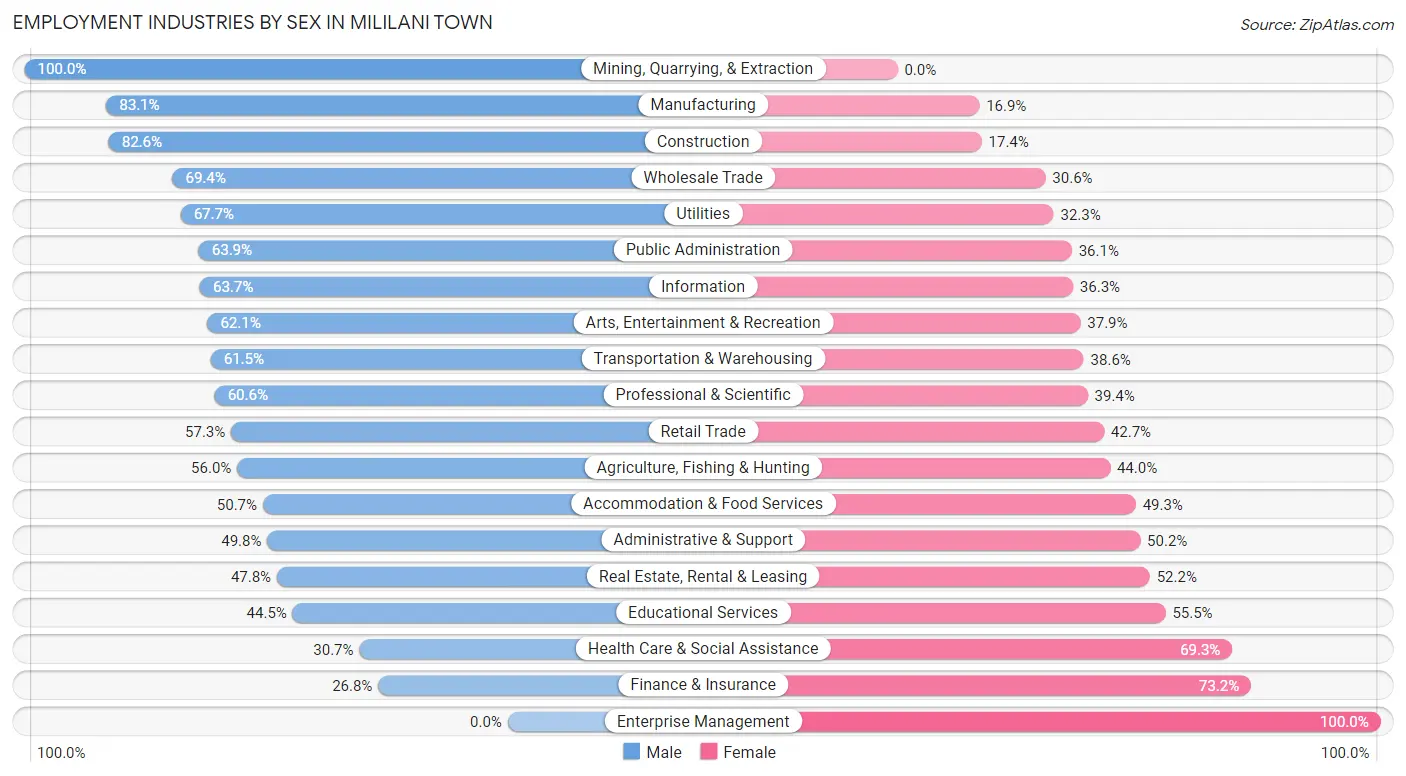
| Industry | Male | Female |
| Agriculture, Fishing & Hunting | 28 (56.0%) | 22 (44.0%) |
| Mining, Quarrying, & Extraction | 9 (100.0%) | 0 (0.0%) |
| Construction | 957 (82.6%) | 202 (17.4%) |
| Manufacturing | 373 (83.1%) | 76 (16.9%) |
| Wholesale Trade | 274 (69.4%) | 121 (30.6%) |
| Retail Trade | 757 (57.3%) | 565 (42.7%) |
| Transportation & Warehousing | 550 (61.5%) | 345 (38.6%) |
| Utilities | 134 (67.7%) | 64 (32.3%) |
| Information | 135 (63.7%) | 77 (36.3%) |
| Finance & Insurance | 100 (26.8%) | 273 (73.2%) |
| Real Estate, Rental & Leasing | 118 (47.8%) | 129 (52.2%) |
| Professional & Scientific | 322 (60.6%) | 209 (39.4%) |
| Enterprise Management | 0 (0.0%) | 14 (100.0%) |
| Administrative & Support | 211 (49.8%) | 213 (50.2%) |
| Educational Services | 694 (44.5%) | 865 (55.5%) |
| Health Care & Social Assistance | 616 (30.7%) | 1,390 (69.3%) |
| Arts, Entertainment & Recreation | 192 (62.1%) | 117 (37.9%) |
| Accommodation & Food Services | 450 (50.7%) | 438 (49.3%) |
| Public Administration | 1,208 (63.9%) | 682 (36.1%) |
| Total | 7,340 (55.1%) | 5,982 (44.9%) |
Education in Mililani Town
School Enrollment in Mililani Town
The most common levels of schooling among the 5,450 students in Mililani Town are high school (1,330 | 24.4%), middle school (1,292 | 23.7%), and college / undergraduate (1,124 | 20.6%).
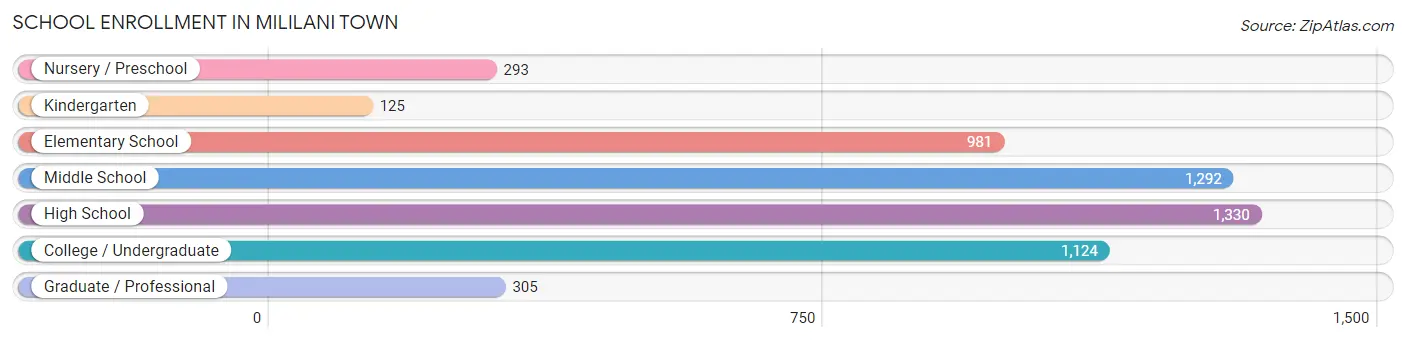
| School Level | # Students | % Students |
| Nursery / Preschool | 293 | 5.4% |
| Kindergarten | 125 | 2.3% |
| Elementary School | 981 | 18.0% |
| Middle School | 1,292 | 23.7% |
| High School | 1,330 | 24.4% |
| College / Undergraduate | 1,124 | 20.6% |
| Graduate / Professional | 305 | 5.6% |
| Total | 5,450 | 100.0% |
School Enrollment by Age by Funding Source in Mililani Town
Out of a total of 5,450 students who are enrolled in schools in Mililani Town, 1,232 (22.6%) attend a private institution, while the remaining 4,218 (77.4%) are enrolled in public schools. The age group of 3 to 4 year olds has the highest likelihood of being enrolled in private schools, with 127 (68.6% in the age bracket) enrolled. Conversely, the age group of 20 to 24 year olds has the lowest likelihood of being enrolled in a private school, with 489 (84.2% in the age bracket) attending a public institution.
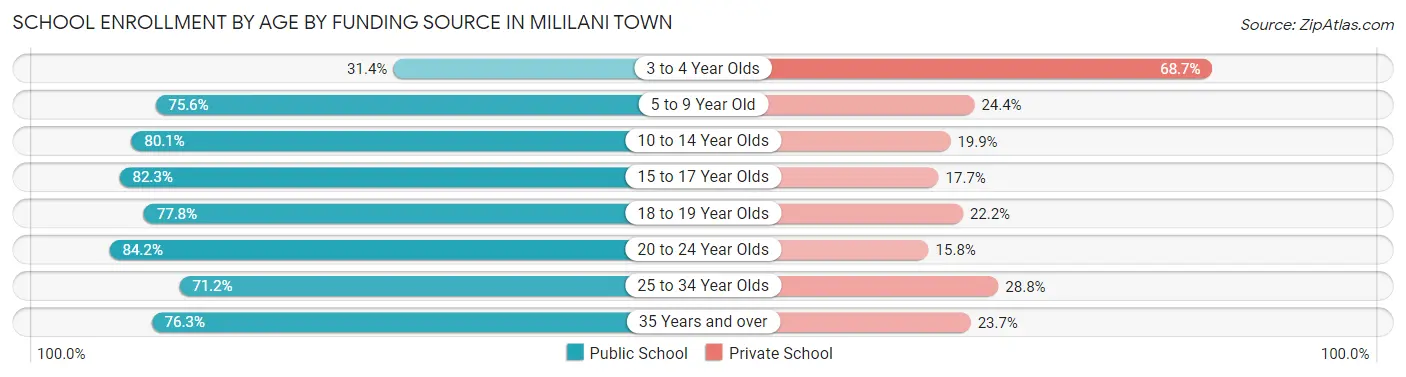
| Age Bracket | Public School | Private School |
| 3 to 4 Year Olds | 58 (31.4%) | 127 (68.6%) |
| 5 to 9 Year Old | 792 (75.6%) | 255 (24.4%) |
| 10 to 14 Year Olds | 1,345 (80.1%) | 334 (19.9%) |
| 15 to 17 Year Olds | 712 (82.3%) | 153 (17.7%) |
| 18 to 19 Year Olds | 280 (77.8%) | 80 (22.2%) |
| 20 to 24 Year Olds | 489 (84.2%) | 92 (15.8%) |
| 25 to 34 Year Olds | 242 (71.2%) | 98 (28.8%) |
| 35 Years and over | 300 (76.3%) | 93 (23.7%) |
| Total | 4,218 (77.4%) | 1,232 (22.6%) |
Educational Attainment by Field of Study in Mililani Town
Business (2,051 | 23.0%), education (1,300 | 14.6%), science & technology (880 | 9.9%), bio, nature & agricultural (756 | 8.5%), and social sciences (745 | 8.4%) are the most common fields of study among 8,901 individuals in Mililani Town who have obtained a bachelor's degree or higher.
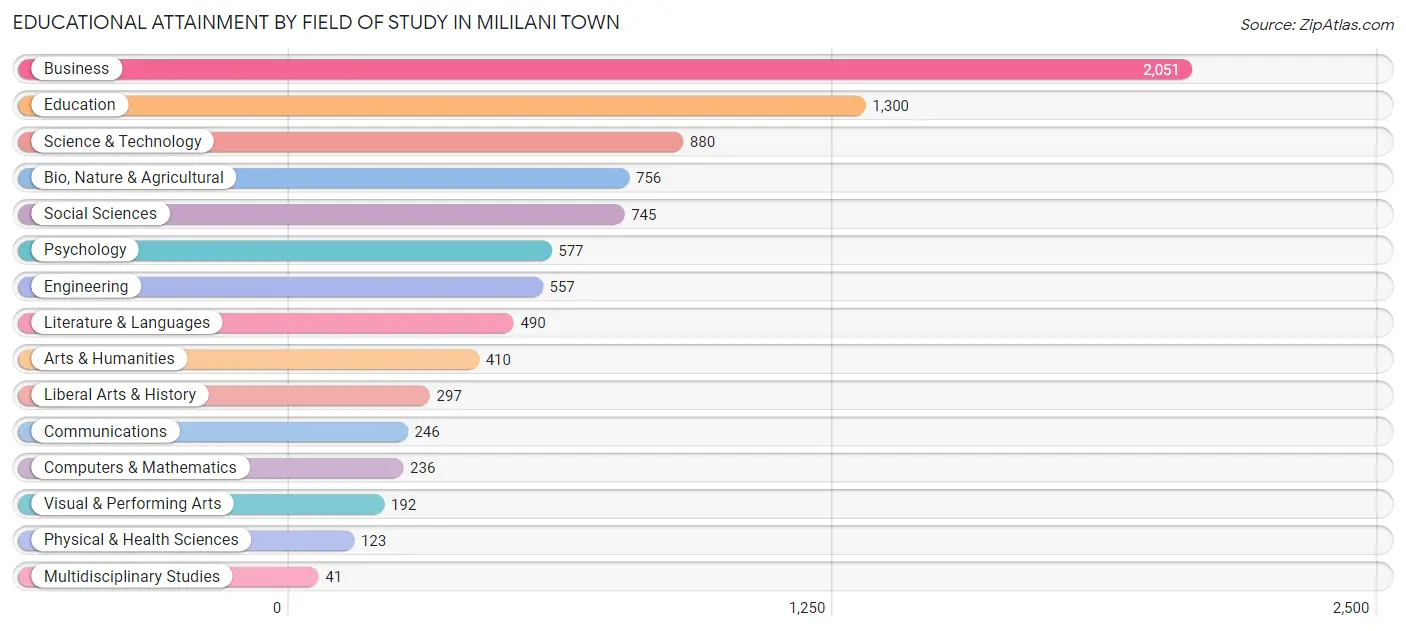
| Field of Study | # Graduates | % Graduates |
| Computers & Mathematics | 236 | 2.6% |
| Bio, Nature & Agricultural | 756 | 8.5% |
| Physical & Health Sciences | 123 | 1.4% |
| Psychology | 577 | 6.5% |
| Social Sciences | 745 | 8.4% |
| Engineering | 557 | 6.3% |
| Multidisciplinary Studies | 41 | 0.5% |
| Science & Technology | 880 | 9.9% |
| Business | 2,051 | 23.0% |
| Education | 1,300 | 14.6% |
| Literature & Languages | 490 | 5.5% |
| Liberal Arts & History | 297 | 3.3% |
| Visual & Performing Arts | 192 | 2.2% |
| Communications | 246 | 2.8% |
| Arts & Humanities | 410 | 4.6% |
| Total | 8,901 | 100.0% |
Transportation & Commute in Mililani Town
Vehicle Availability by Sex in Mililani Town
The most prevalent vehicle ownership categories in Mililani Town are males with 2 vehicles (2,588, accounting for 34.2%) and females with 2 vehicles (2,045, making up 44.0%).
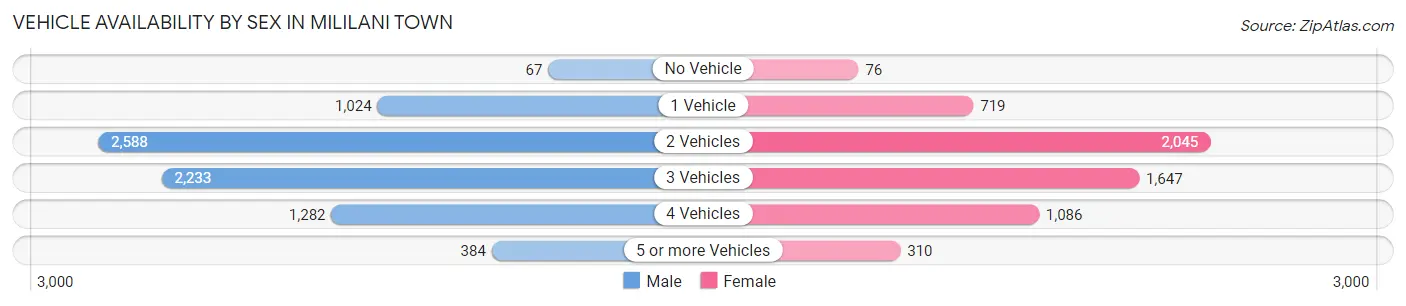
| Vehicles Available | Male | Female |
| No Vehicle | 67 (0.9%) | 76 (1.3%) |
| 1 Vehicle | 1,024 (13.5%) | 719 (12.2%) |
| 2 Vehicles | 2,588 (34.2%) | 2,045 (34.8%) |
| 3 Vehicles | 2,233 (29.5%) | 1,647 (28.0%) |
| 4 Vehicles | 1,282 (16.9%) | 1,086 (18.5%) |
| 5 or more Vehicles | 384 (5.1%) | 310 (5.3%) |
| Total | 7,578 (100.0%) | 5,883 (100.0%) |
Commute Time in Mililani Town
The most frequently occuring commute durations in Mililani Town are 30 to 34 minutes (3,065 commuters, 24.2%), 45 to 59 minutes (1,872 commuters, 14.8%), and 20 to 24 minutes (1,572 commuters, 12.4%).
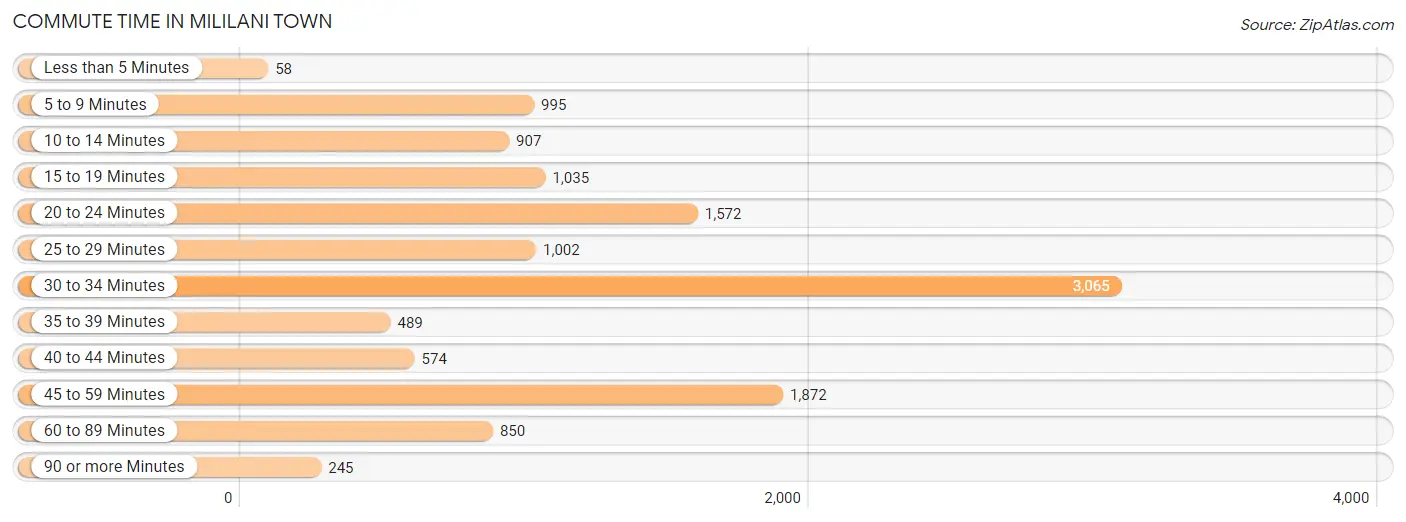
| Commute Time | # Commuters | % Commuters |
| Less than 5 Minutes | 58 | 0.5% |
| 5 to 9 Minutes | 995 | 7.9% |
| 10 to 14 Minutes | 907 | 7.2% |
| 15 to 19 Minutes | 1,035 | 8.2% |
| 20 to 24 Minutes | 1,572 | 12.4% |
| 25 to 29 Minutes | 1,002 | 7.9% |
| 30 to 34 Minutes | 3,065 | 24.2% |
| 35 to 39 Minutes | 489 | 3.9% |
| 40 to 44 Minutes | 574 | 4.5% |
| 45 to 59 Minutes | 1,872 | 14.8% |
| 60 to 89 Minutes | 850 | 6.7% |
| 90 or more Minutes | 245 | 1.9% |
Commute Time by Sex in Mililani Town
The most common commute times in Mililani Town are 30 to 34 minutes (1,932 commuters, 26.9%) for males and 30 to 34 minutes (1,133 commuters, 20.7%) for females.
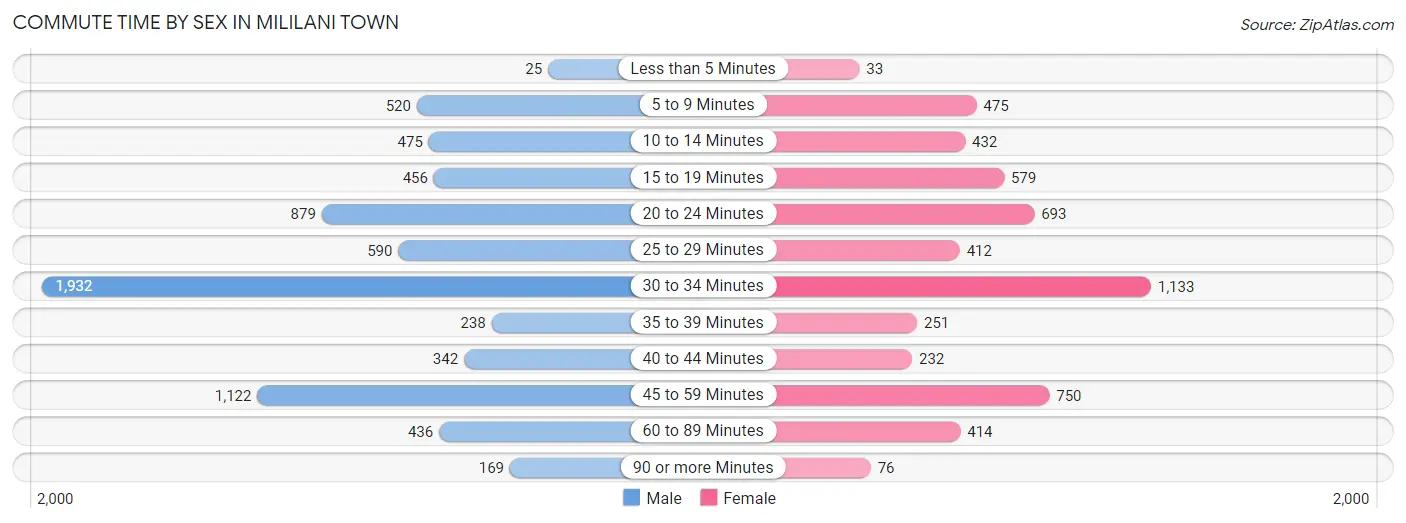
| Commute Time | Male | Female |
| Less than 5 Minutes | 25 (0.4%) | 33 (0.6%) |
| 5 to 9 Minutes | 520 (7.2%) | 475 (8.7%) |
| 10 to 14 Minutes | 475 (6.6%) | 432 (7.9%) |
| 15 to 19 Minutes | 456 (6.4%) | 579 (10.6%) |
| 20 to 24 Minutes | 879 (12.2%) | 693 (12.7%) |
| 25 to 29 Minutes | 590 (8.2%) | 412 (7.5%) |
| 30 to 34 Minutes | 1,932 (26.9%) | 1,133 (20.7%) |
| 35 to 39 Minutes | 238 (3.3%) | 251 (4.6%) |
| 40 to 44 Minutes | 342 (4.8%) | 232 (4.2%) |
| 45 to 59 Minutes | 1,122 (15.6%) | 750 (13.7%) |
| 60 to 89 Minutes | 436 (6.1%) | 414 (7.5%) |
| 90 or more Minutes | 169 (2.4%) | 76 (1.4%) |
Time of Departure to Work by Sex in Mililani Town
The most frequent times of departure to work in Mililani Town are 12:00 AM to 4:59 AM (908, 12.6%) for males and 7:00 AM to 7:29 AM (909, 16.6%) for females.
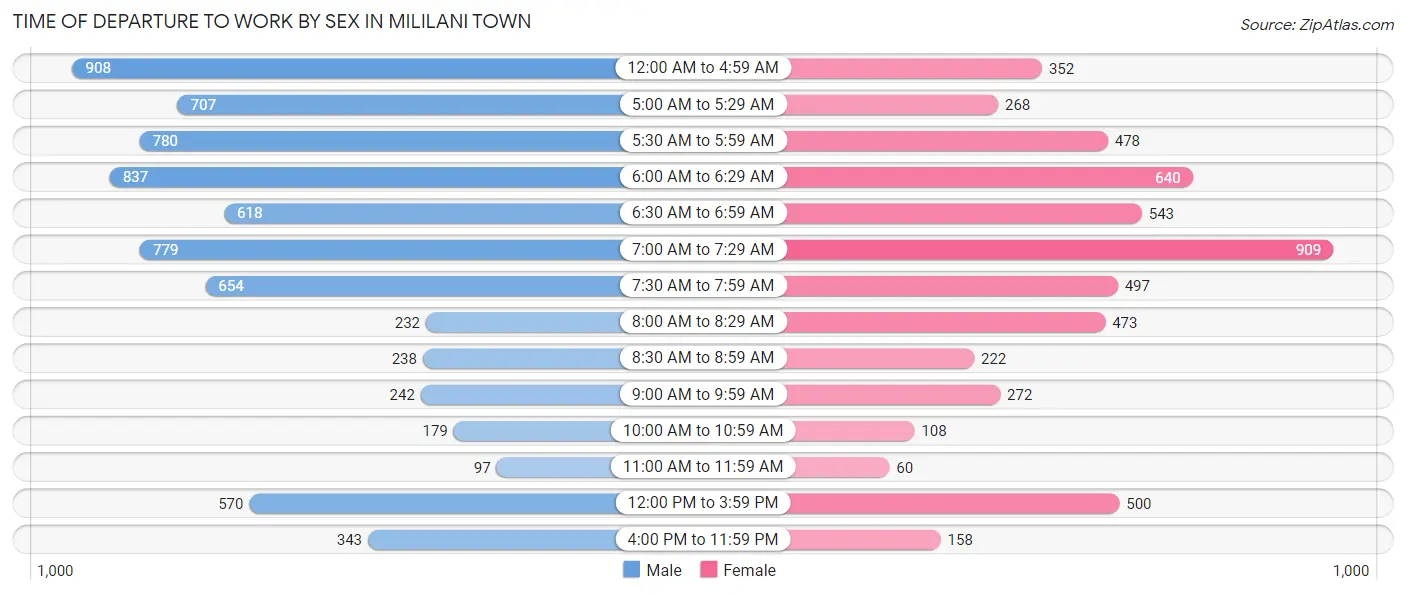
| Time of Departure | Male | Female |
| 12:00 AM to 4:59 AM | 908 (12.6%) | 352 (6.4%) |
| 5:00 AM to 5:29 AM | 707 (9.8%) | 268 (4.9%) |
| 5:30 AM to 5:59 AM | 780 (10.9%) | 478 (8.7%) |
| 6:00 AM to 6:29 AM | 837 (11.7%) | 640 (11.7%) |
| 6:30 AM to 6:59 AM | 618 (8.6%) | 543 (9.9%) |
| 7:00 AM to 7:29 AM | 779 (10.8%) | 909 (16.6%) |
| 7:30 AM to 7:59 AM | 654 (9.1%) | 497 (9.1%) |
| 8:00 AM to 8:29 AM | 232 (3.2%) | 473 (8.6%) |
| 8:30 AM to 8:59 AM | 238 (3.3%) | 222 (4.1%) |
| 9:00 AM to 9:59 AM | 242 (3.4%) | 272 (5.0%) |
| 10:00 AM to 10:59 AM | 179 (2.5%) | 108 (2.0%) |
| 11:00 AM to 11:59 AM | 97 (1.3%) | 60 (1.1%) |
| 12:00 PM to 3:59 PM | 570 (7.9%) | 500 (9.1%) |
| 4:00 PM to 11:59 PM | 343 (4.8%) | 158 (2.9%) |
| Total | 7,184 (100.0%) | 5,480 (100.0%) |
Housing Occupancy in Mililani Town
Occupancy by Ownership in Mililani Town
Of the total 9,647 dwellings in Mililani Town, owner-occupied units account for 7,841 (81.3%), while renter-occupied units make up 1,806 (18.7%).
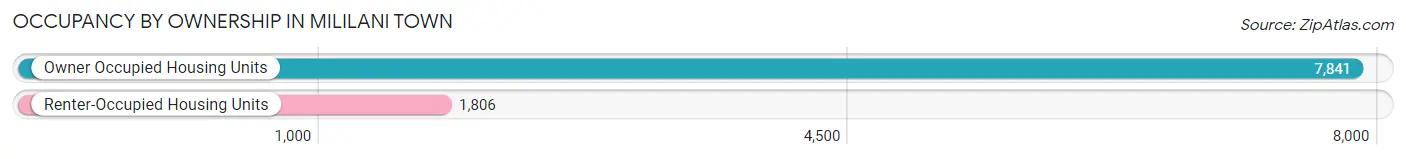
| Occupancy | # Housing Units | % Housing Units |
| Owner Occupied Housing Units | 7,841 | 81.3% |
| Renter-Occupied Housing Units | 1,806 | 18.7% |
| Total Occupied Housing Units | 9,647 | 100.0% |
Occupancy by Household Size in Mililani Town
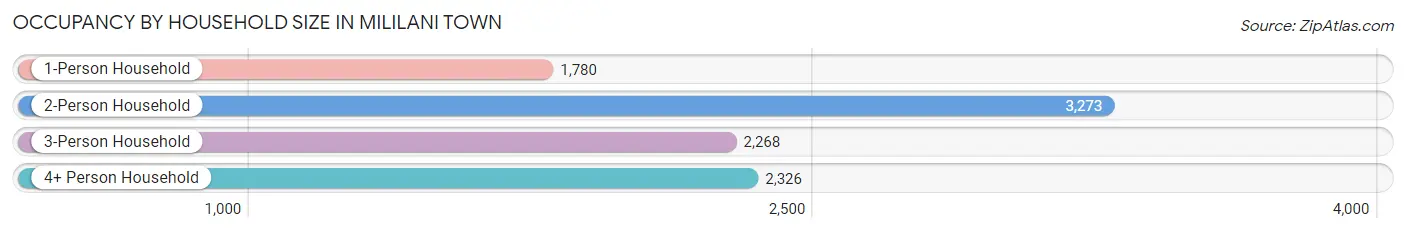
| Household Size | # Housing Units | % Housing Units |
| 1-Person Household | 1,780 | 18.4% |
| 2-Person Household | 3,273 | 33.9% |
| 3-Person Household | 2,268 | 23.5% |
| 4+ Person Household | 2,326 | 24.1% |
| Total Housing Units | 9,647 | 100.0% |
Occupancy by Ownership by Household Size in Mililani Town
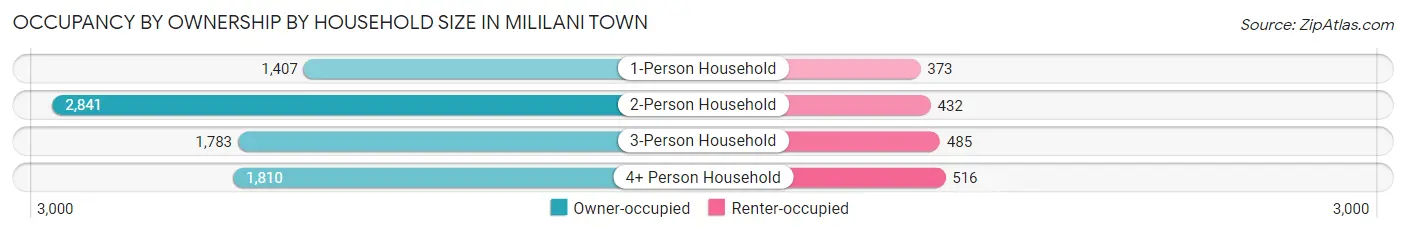
| Household Size | Owner-occupied | Renter-occupied |
| 1-Person Household | 1,407 (79.0%) | 373 (21.0%) |
| 2-Person Household | 2,841 (86.8%) | 432 (13.2%) |
| 3-Person Household | 1,783 (78.6%) | 485 (21.4%) |
| 4+ Person Household | 1,810 (77.8%) | 516 (22.2%) |
| Total Housing Units | 7,841 (81.3%) | 1,806 (18.7%) |
Occupancy by Educational Attainment in Mililani Town
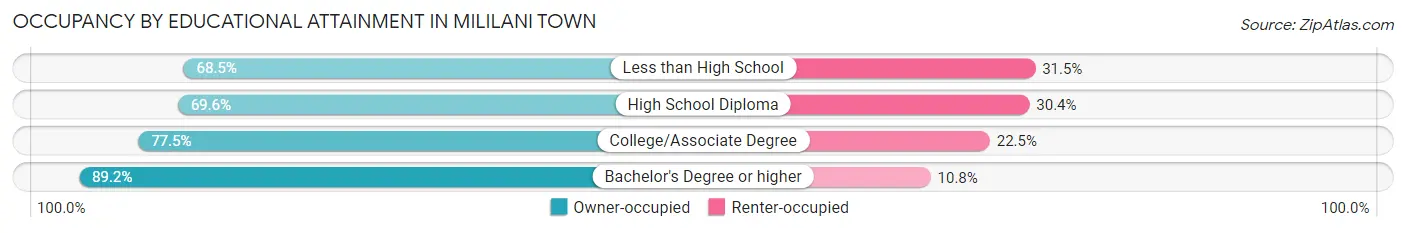
| Household Size | Owner-occupied | Renter-occupied |
| Less than High School | 202 (68.5%) | 93 (31.5%) |
| High School Diploma | 1,050 (69.6%) | 458 (30.4%) |
| College/Associate Degree | 2,696 (77.5%) | 784 (22.5%) |
| Bachelor's Degree or higher | 3,893 (89.2%) | 471 (10.8%) |
Occupancy by Age of Householder in Mililani Town
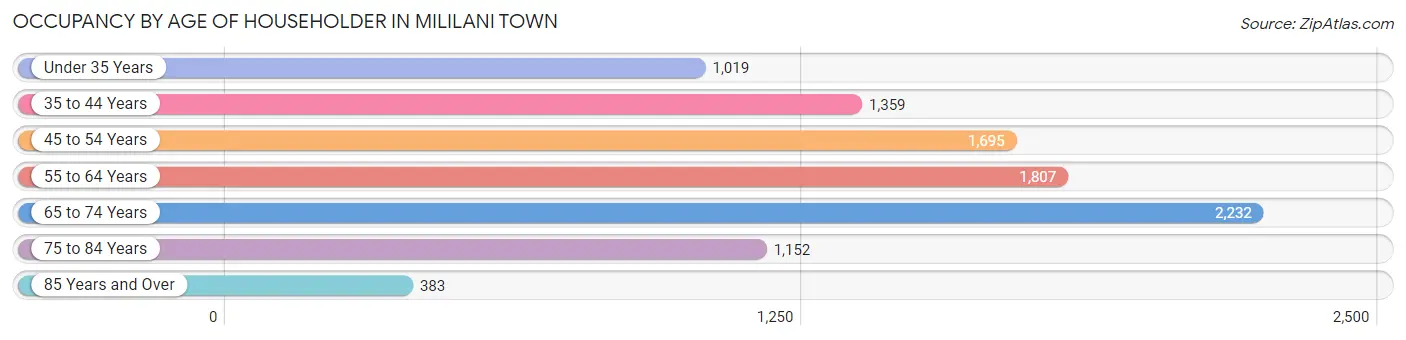
| Age Bracket | # Households | % Households |
| Under 35 Years | 1,019 | 10.6% |
| 35 to 44 Years | 1,359 | 14.1% |
| 45 to 54 Years | 1,695 | 17.6% |
| 55 to 64 Years | 1,807 | 18.7% |
| 65 to 74 Years | 2,232 | 23.1% |
| 75 to 84 Years | 1,152 | 11.9% |
| 85 Years and Over | 383 | 4.0% |
| Total | 9,647 | 100.0% |
Housing Finances in Mililani Town
Median Income by Occupancy in Mililani Town
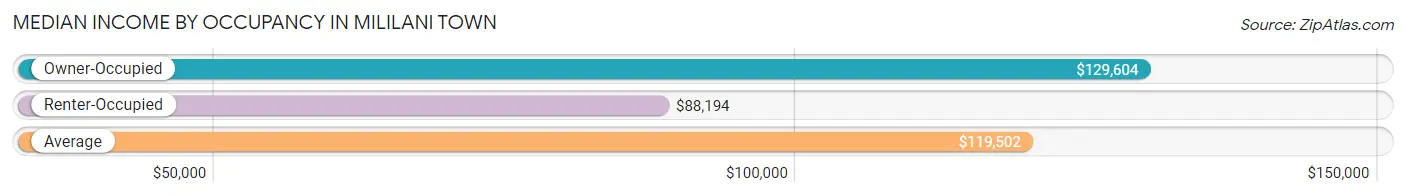
| Occupancy Type | # Households | Median Income |
| Owner-Occupied | 7,841 (81.3%) | $129,604 |
| Renter-Occupied | 1,806 (18.7%) | $88,194 |
| Average | 9,647 (100.0%) | $119,502 |
Occupancy by Householder Income Bracket in Mililani Town
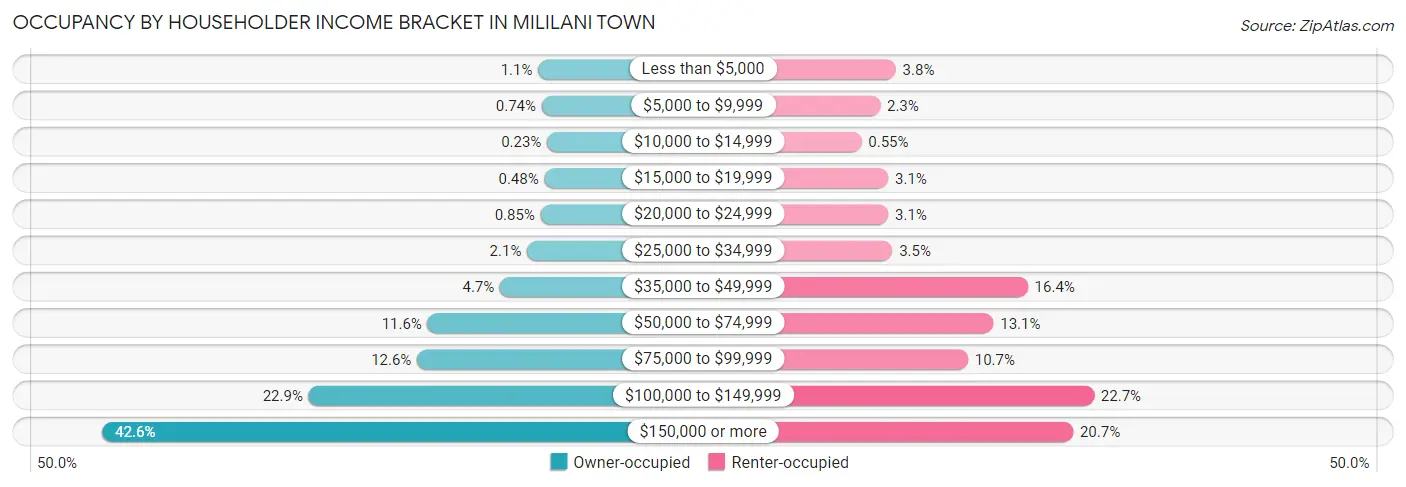
| Income Bracket | Owner-occupied | Renter-occupied |
| Less than $5,000 | 85 (1.1%) | 69 (3.8%) |
| $5,000 to $9,999 | 58 (0.7%) | 42 (2.3%) |
| $10,000 to $14,999 | 18 (0.2%) | 10 (0.5%) |
| $15,000 to $19,999 | 38 (0.5%) | 56 (3.1%) |
| $20,000 to $24,999 | 67 (0.9%) | 56 (3.1%) |
| $25,000 to $34,999 | 167 (2.1%) | 63 (3.5%) |
| $35,000 to $49,999 | 369 (4.7%) | 296 (16.4%) |
| $50,000 to $74,999 | 910 (11.6%) | 237 (13.1%) |
| $75,000 to $99,999 | 989 (12.6%) | 193 (10.7%) |
| $100,000 to $149,999 | 1,799 (22.9%) | 410 (22.7%) |
| $150,000 or more | 3,341 (42.6%) | 374 (20.7%) |
| Total | 7,841 (100.0%) | 1,806 (100.0%) |
Monthly Housing Cost Tiers in Mililani Town
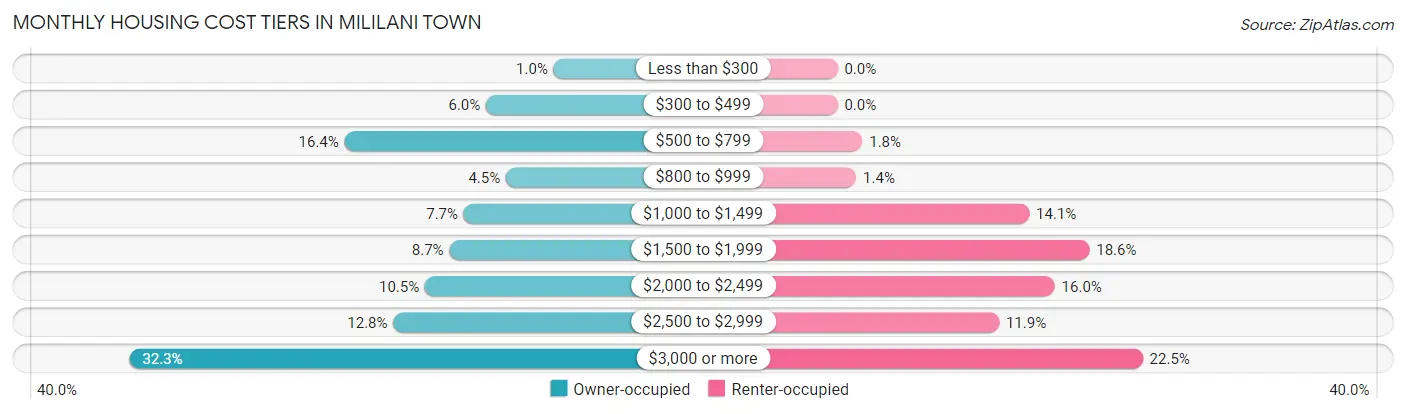
| Monthly Cost | Owner-occupied | Renter-occupied |
| Less than $300 | 81 (1.0%) | 0 (0.0%) |
| $300 to $499 | 471 (6.0%) | 0 (0.0%) |
| $500 to $799 | 1,288 (16.4%) | 33 (1.8%) |
| $800 to $999 | 356 (4.5%) | 25 (1.4%) |
| $1,000 to $1,499 | 600 (7.6%) | 255 (14.1%) |
| $1,500 to $1,999 | 683 (8.7%) | 335 (18.5%) |
| $2,000 to $2,499 | 824 (10.5%) | 289 (16.0%) |
| $2,500 to $2,999 | 1,007 (12.8%) | 215 (11.9%) |
| $3,000 or more | 2,531 (32.3%) | 406 (22.5%) |
| Total | 7,841 (100.0%) | 1,806 (100.0%) |
Physical Housing Characteristics in Mililani Town
Housing Structures in Mililani Town
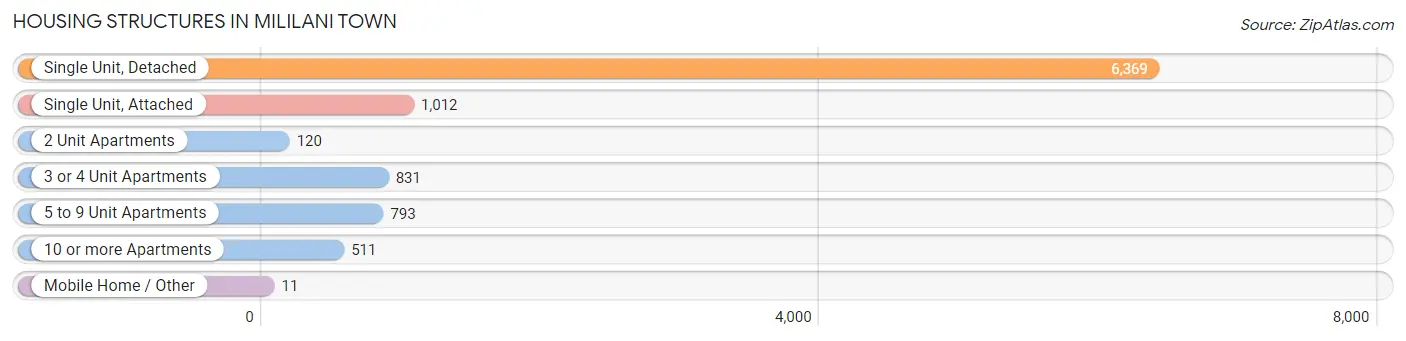
| Structure Type | # Housing Units | % Housing Units |
| Single Unit, Detached | 6,369 | 66.0% |
| Single Unit, Attached | 1,012 | 10.5% |
| 2 Unit Apartments | 120 | 1.2% |
| 3 or 4 Unit Apartments | 831 | 8.6% |
| 5 to 9 Unit Apartments | 793 | 8.2% |
| 10 or more Apartments | 511 | 5.3% |
| Mobile Home / Other | 11 | 0.1% |
| Total | 9,647 | 100.0% |
Housing Structures by Occupancy in Mililani Town
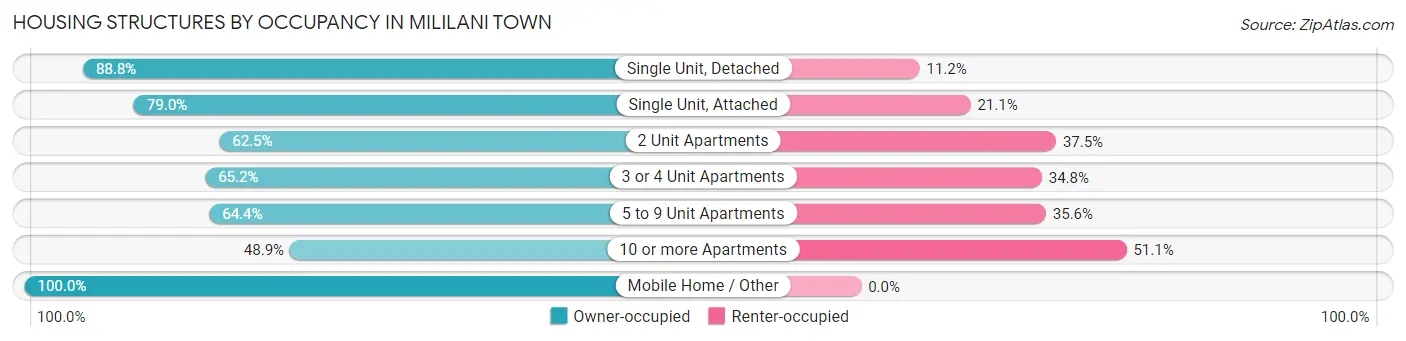
| Structure Type | Owner-occupied | Renter-occupied |
| Single Unit, Detached | 5,653 (88.8%) | 716 (11.2%) |
| Single Unit, Attached | 799 (78.9%) | 213 (21.0%) |
| 2 Unit Apartments | 75 (62.5%) | 45 (37.5%) |
| 3 or 4 Unit Apartments | 542 (65.2%) | 289 (34.8%) |
| 5 to 9 Unit Apartments | 511 (64.4%) | 282 (35.6%) |
| 10 or more Apartments | 250 (48.9%) | 261 (51.1%) |
| Mobile Home / Other | 11 (100.0%) | 0 (0.0%) |
| Total | 7,841 (81.3%) | 1,806 (18.7%) |
Housing Structures by Number of Rooms in Mililani Town
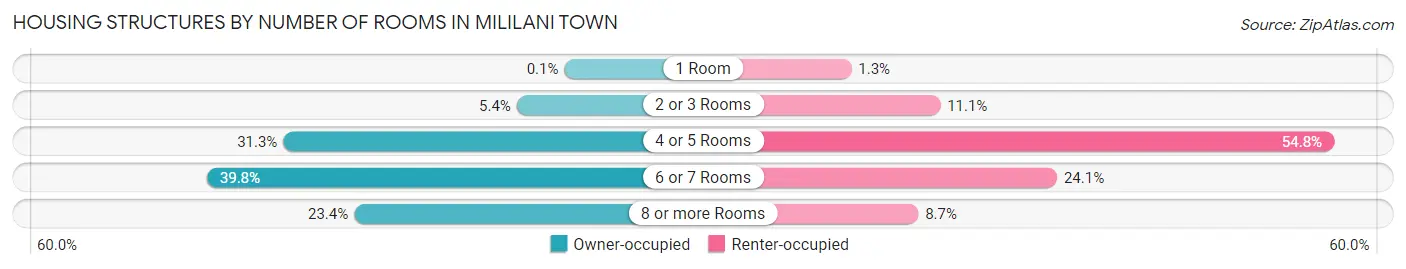
| Number of Rooms | Owner-occupied | Renter-occupied |
| 1 Room | 8 (0.1%) | 23 (1.3%) |
| 2 or 3 Rooms | 423 (5.4%) | 201 (11.1%) |
| 4 or 5 Rooms | 2,454 (31.3%) | 990 (54.8%) |
| 6 or 7 Rooms | 3,118 (39.8%) | 435 (24.1%) |
| 8 or more Rooms | 1,838 (23.4%) | 157 (8.7%) |
| Total | 7,841 (100.0%) | 1,806 (100.0%) |
Housing Structure by Heating Type in Mililani Town
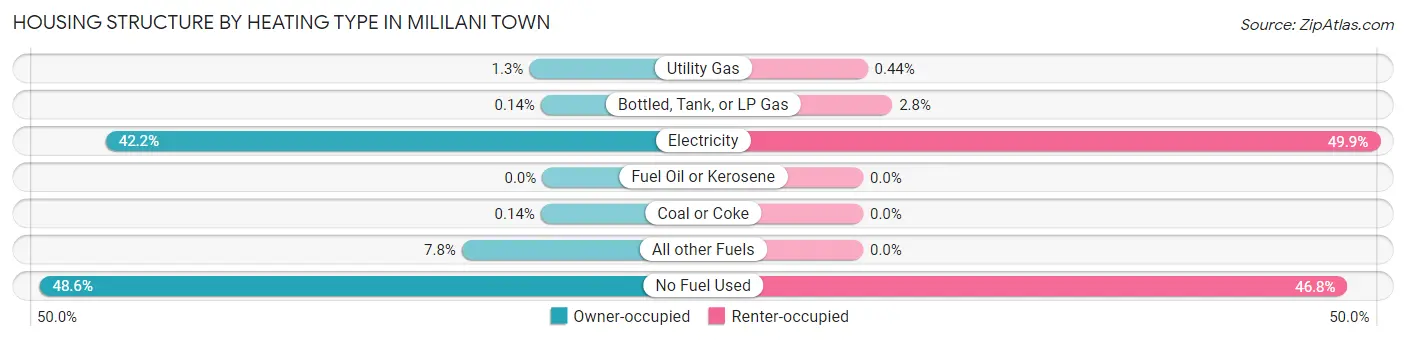
| Heating Type | Owner-occupied | Renter-occupied |
| Utility Gas | 98 (1.3%) | 8 (0.4%) |
| Bottled, Tank, or LP Gas | 11 (0.1%) | 51 (2.8%) |
| Electricity | 3,305 (42.1%) | 902 (49.9%) |
| Fuel Oil or Kerosene | 0 (0.0%) | 0 (0.0%) |
| Coal or Coke | 11 (0.1%) | 0 (0.0%) |
| All other Fuels | 609 (7.8%) | 0 (0.0%) |
| No Fuel Used | 3,807 (48.5%) | 845 (46.8%) |
| Total | 7,841 (100.0%) | 1,806 (100.0%) |
Household Vehicle Usage in Mililani Town
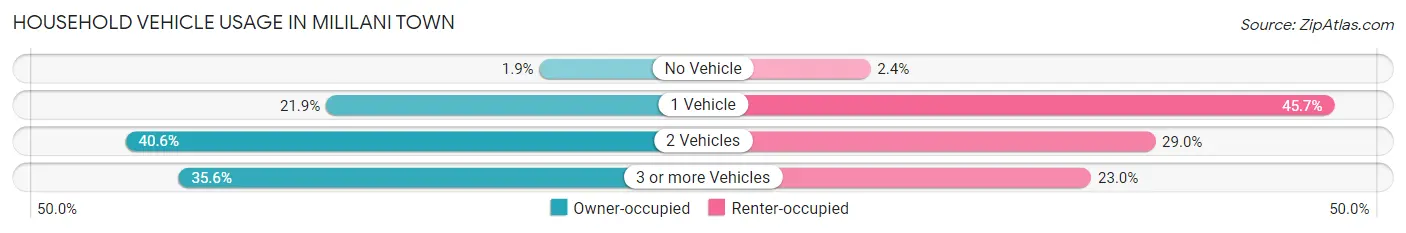
| Vehicles per Household | Owner-occupied | Renter-occupied |
| No Vehicle | 152 (1.9%) | 43 (2.4%) |
| 1 Vehicle | 1,714 (21.9%) | 825 (45.7%) |
| 2 Vehicles | 3,181 (40.6%) | 523 (29.0%) |
| 3 or more Vehicles | 2,794 (35.6%) | 415 (23.0%) |
| Total | 7,841 (100.0%) | 1,806 (100.0%) |
Real Estate & Mortgages in Mililani Town
Real Estate and Mortgage Overview in Mililani Town
| Characteristic | Without Mortgage | With Mortgage |
| Housing Units | 2,238 | 5,603 |
| Median Property Value | $859,500 | $840,400 |
| Median Household Income | $115,139 | $2,518 |
| Monthly Housing Costs | $640 | $2,531 |
| Real Estate Taxes | $2,493 | $229 |
Property Value by Mortgage Status in Mililani Town
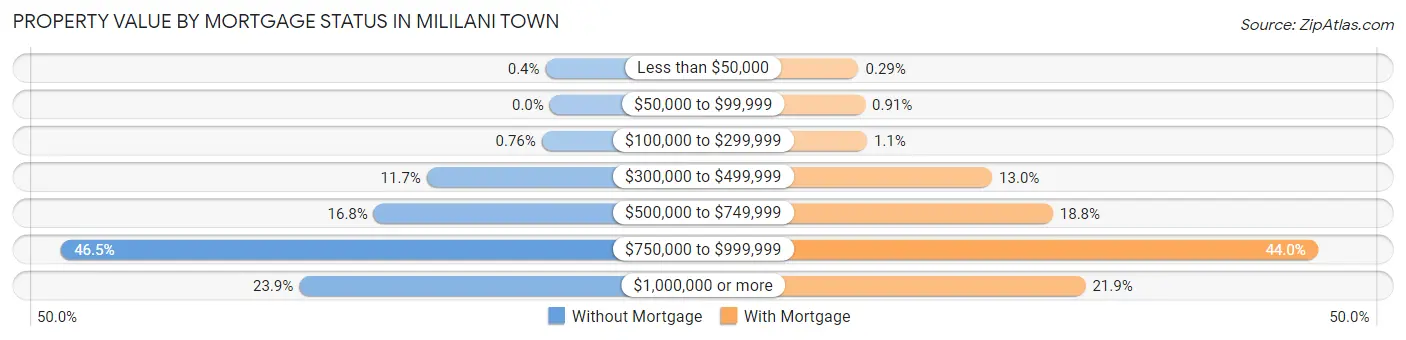
| Property Value | Without Mortgage | With Mortgage |
| Less than $50,000 | 9 (0.4%) | 16 (0.3%) |
| $50,000 to $99,999 | 0 (0.0%) | 51 (0.9%) |
| $100,000 to $299,999 | 17 (0.8%) | 61 (1.1%) |
| $300,000 to $499,999 | 262 (11.7%) | 729 (13.0%) |
| $500,000 to $749,999 | 375 (16.8%) | 1,053 (18.8%) |
| $750,000 to $999,999 | 1,041 (46.5%) | 2,466 (44.0%) |
| $1,000,000 or more | 534 (23.9%) | 1,227 (21.9%) |
| Total | 2,238 (100.0%) | 5,603 (100.0%) |
Household Income by Mortgage Status in Mililani Town
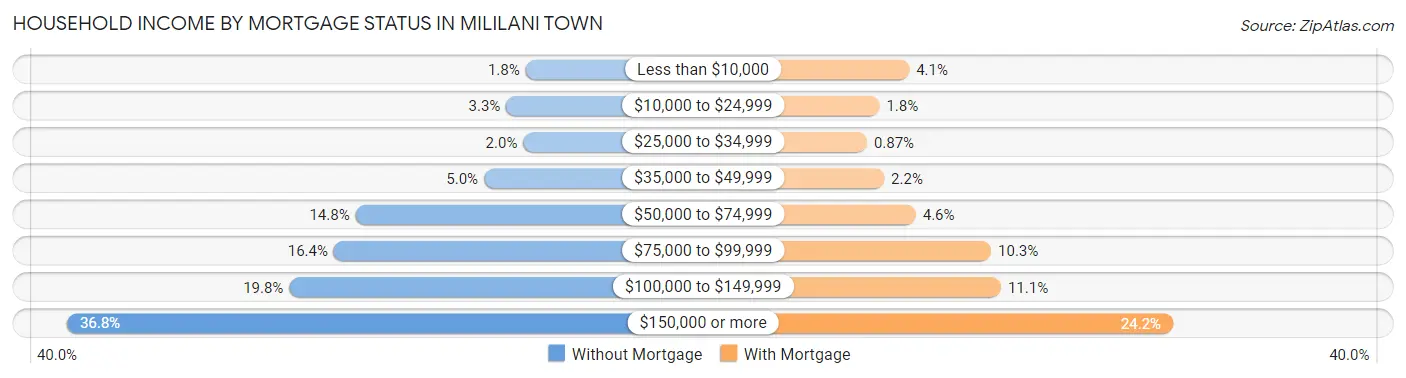
| Household Income | Without Mortgage | With Mortgage |
| Less than $10,000 | 41 (1.8%) | 229 (4.1%) |
| $10,000 to $24,999 | 74 (3.3%) | 102 (1.8%) |
| $25,000 to $34,999 | 45 (2.0%) | 49 (0.9%) |
| $35,000 to $49,999 | 112 (5.0%) | 122 (2.2%) |
| $50,000 to $74,999 | 331 (14.8%) | 257 (4.6%) |
| $75,000 to $99,999 | 368 (16.4%) | 579 (10.3%) |
| $100,000 to $149,999 | 444 (19.8%) | 621 (11.1%) |
| $150,000 or more | 823 (36.8%) | 1,355 (24.2%) |
| Total | 2,238 (100.0%) | 5,603 (100.0%) |
Property Value to Household Income Ratio in Mililani Town
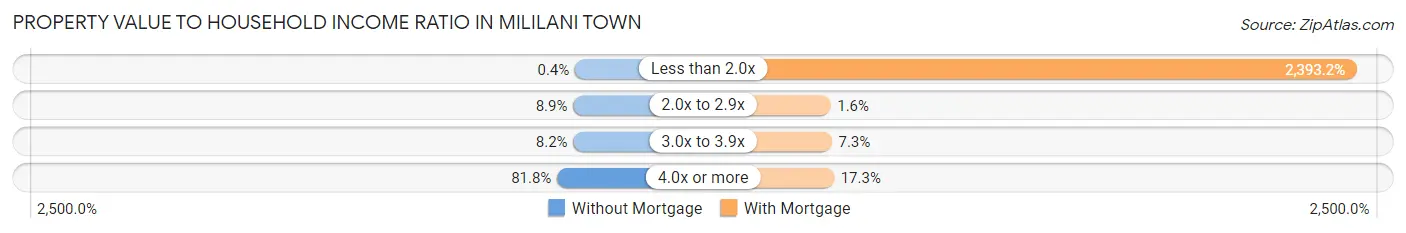
| Value-to-Income Ratio | Without Mortgage | With Mortgage |
| Less than 2.0x | 9 (0.4%) | 134,089 (2,393.2%) |
| 2.0x to 2.9x | 200 (8.9%) | 87 (1.5%) |
| 3.0x to 3.9x | 184 (8.2%) | 409 (7.3%) |
| 4.0x or more | 1,830 (81.8%) | 971 (17.3%) |
| Total | 2,238 (100.0%) | 5,603 (100.0%) |
Real Estate Taxes by Mortgage Status in Mililani Town
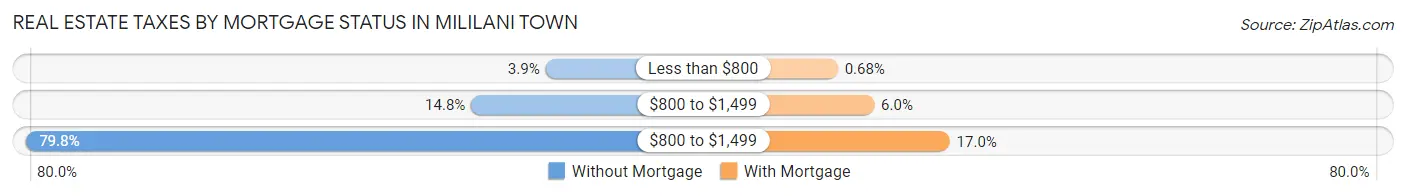
| Property Taxes | Without Mortgage | With Mortgage |
| Less than $800 | 87 (3.9%) | 38 (0.7%) |
| $800 to $1,499 | 330 (14.7%) | 337 (6.0%) |
| $800 to $1,499 | 1,785 (79.8%) | 955 (17.0%) |
| Total | 2,238 (100.0%) | 5,603 (100.0%) |
Health & Disability in Mililani Town
Health Insurance Coverage by Age in Mililani Town
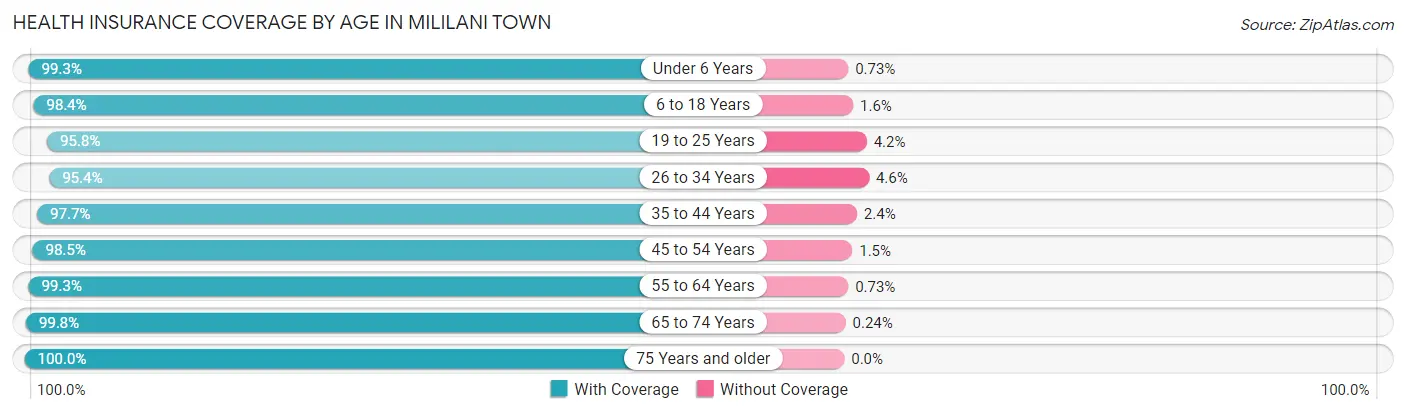
| Age Bracket | With Coverage | Without Coverage |
| Under 6 Years | 1,488 (99.3%) | 11 (0.7%) |
| 6 to 18 Years | 3,775 (98.4%) | 63 (1.6%) |
| 19 to 25 Years | 1,718 (95.8%) | 75 (4.2%) |
| 26 to 34 Years | 2,652 (95.4%) | 128 (4.6%) |
| 35 to 44 Years | 3,288 (97.7%) | 79 (2.4%) |
| 45 to 54 Years | 3,310 (98.5%) | 50 (1.5%) |
| 55 to 64 Years | 3,392 (99.3%) | 25 (0.7%) |
| 65 to 74 Years | 4,088 (99.8%) | 10 (0.2%) |
| 75 Years and older | 2,872 (100.0%) | 0 (0.0%) |
| Total | 26,583 (98.4%) | 441 (1.6%) |
Health Insurance Coverage by Citizenship Status in Mililani Town
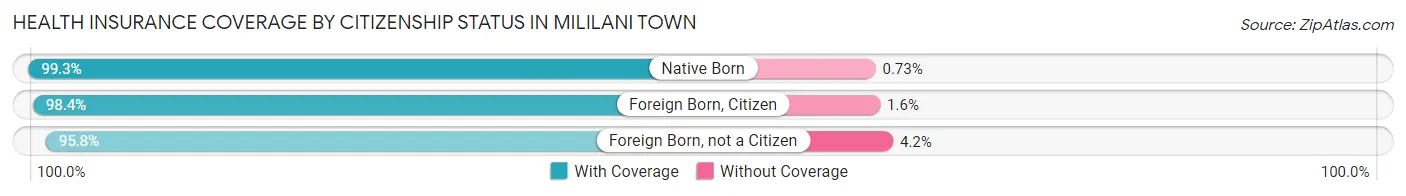
| Citizenship Status | With Coverage | Without Coverage |
| Native Born | 1,488 (99.3%) | 11 (0.7%) |
| Foreign Born, Citizen | 3,775 (98.4%) | 63 (1.6%) |
| Foreign Born, not a Citizen | 1,718 (95.8%) | 75 (4.2%) |
Health Insurance Coverage by Household Income in Mililani Town
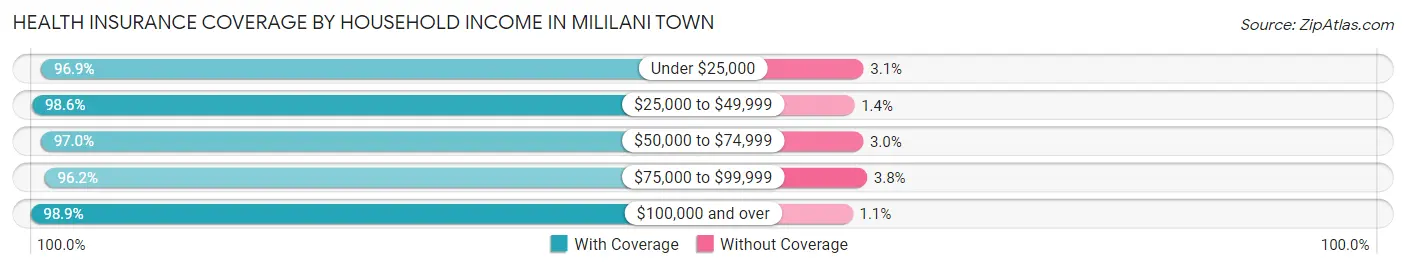
| Household Income | With Coverage | Without Coverage |
| Under $25,000 | 907 (96.9%) | 29 (3.1%) |
| $25,000 to $49,999 | 1,771 (98.6%) | 25 (1.4%) |
| $50,000 to $74,999 | 2,333 (97.0%) | 73 (3.0%) |
| $75,000 to $99,999 | 2,865 (96.2%) | 112 (3.8%) |
| $100,000 and over | 18,706 (98.9%) | 202 (1.1%) |
Public vs Private Health Insurance Coverage by Age in Mililani Town
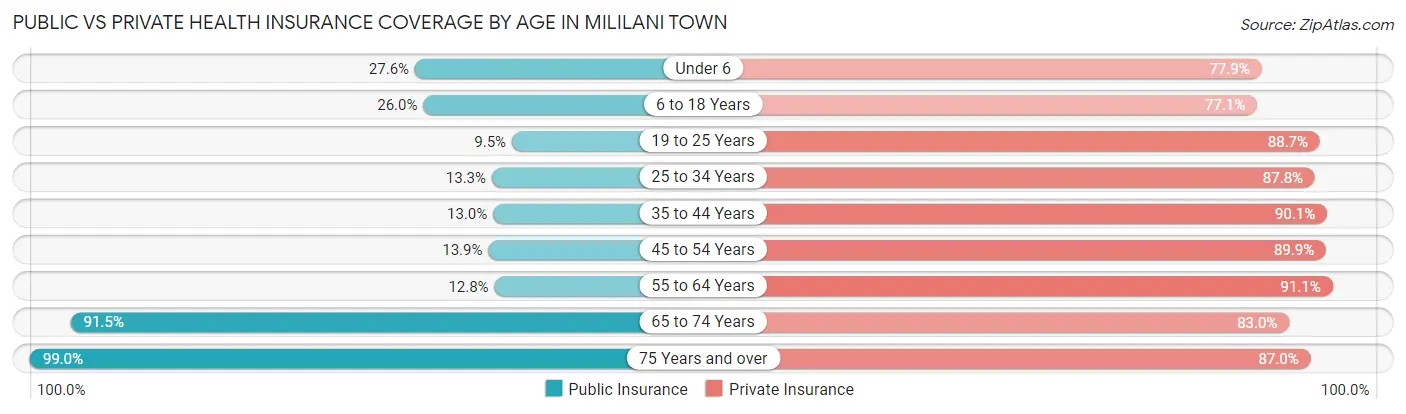
| Age Bracket | Public Insurance | Private Insurance |
| Under 6 | 413 (27.6%) | 1,168 (77.9%) |
| 6 to 18 Years | 998 (26.0%) | 2,958 (77.1%) |
| 19 to 25 Years | 171 (9.5%) | 1,591 (88.7%) |
| 25 to 34 Years | 369 (13.3%) | 2,441 (87.8%) |
| 35 to 44 Years | 439 (13.0%) | 3,033 (90.1%) |
| 45 to 54 Years | 468 (13.9%) | 3,020 (89.9%) |
| 55 to 64 Years | 437 (12.8%) | 3,113 (91.1%) |
| 65 to 74 Years | 3,748 (91.5%) | 3,403 (83.0%) |
| 75 Years and over | 2,844 (99.0%) | 2,499 (87.0%) |
| Total | 9,887 (36.6%) | 23,226 (86.0%) |
Disability Status by Sex by Age in Mililani Town
| Age Bracket | Male | Female |
| Under 5 Years | 25 (3.3%) | 27 (4.7%) |
| 5 to 17 Years | 93 (5.2%) | 67 (3.5%) |
| 18 to 34 Years | 110 (4.0%) | 66 (3.2%) |
| 35 to 64 Years | 521 (10.4%) | 387 (7.6%) |
| 65 to 74 Years | 431 (20.9%) | 422 (20.7%) |
| 75 Years and over | 540 (38.9%) | 731 (49.2%) |
Disability Class by Sex by Age in Mililani Town
Disability Class: Hearing Difficulty
| Age Bracket | Male | Female |
| Under 5 Years | 25 (3.3%) | 0 (0.0%) |
| 5 to 17 Years | 9 (0.5%) | 0 (0.0%) |
| 18 to 34 Years | 29 (1.0%) | 0 (0.0%) |
| 35 to 64 Years | 203 (4.0%) | 82 (1.6%) |
| 65 to 74 Years | 190 (9.2%) | 93 (4.6%) |
| 75 Years and over | 345 (24.9%) | 314 (21.1%) |
Disability Class: Vision Difficulty
| Age Bracket | Male | Female |
| Under 5 Years | 0 (0.0%) | 27 (4.7%) |
| 5 to 17 Years | 22 (1.2%) | 25 (1.3%) |
| 18 to 34 Years | 9 (0.3%) | 0 (0.0%) |
| 35 to 64 Years | 82 (1.6%) | 26 (0.5%) |
| 65 to 74 Years | 88 (4.3%) | 40 (2.0%) |
| 75 Years and over | 39 (2.8%) | 255 (17.2%) |
Disability Class: Cognitive Difficulty
| Age Bracket | Male | Female |
| 5 to 17 Years | 53 (2.9%) | 30 (1.6%) |
| 18 to 34 Years | 74 (2.7%) | 56 (2.7%) |
| 35 to 64 Years | 150 (3.0%) | 105 (2.1%) |
| 65 to 74 Years | 109 (5.3%) | 38 (1.9%) |
| 75 Years and over | 118 (8.5%) | 209 (14.1%) |
Disability Class: Ambulatory Difficulty
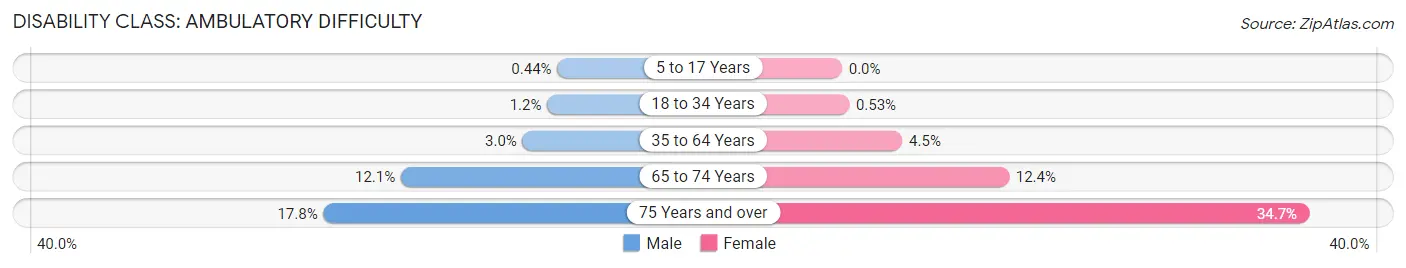
| Age Bracket | Male | Female |
| 5 to 17 Years | 8 (0.4%) | 0 (0.0%) |
| 18 to 34 Years | 33 (1.2%) | 11 (0.5%) |
| 35 to 64 Years | 152 (3.0%) | 229 (4.5%) |
| 65 to 74 Years | 248 (12.0%) | 253 (12.4%) |
| 75 Years and over | 247 (17.8%) | 515 (34.7%) |
Disability Class: Self-Care Difficulty
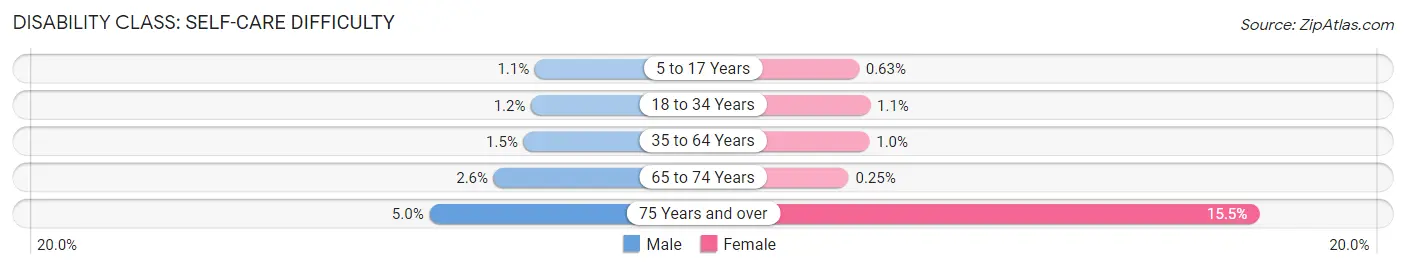
| Age Bracket | Male | Female |
| 5 to 17 Years | 19 (1.1%) | 12 (0.6%) |
| 18 to 34 Years | 33 (1.2%) | 22 (1.1%) |
| 35 to 64 Years | 74 (1.5%) | 52 (1.0%) |
| 65 to 74 Years | 53 (2.6%) | 5 (0.3%) |
| 75 Years and over | 69 (5.0%) | 230 (15.5%) |
Technology Access in Mililani Town
Computing Device Access in Mililani Town
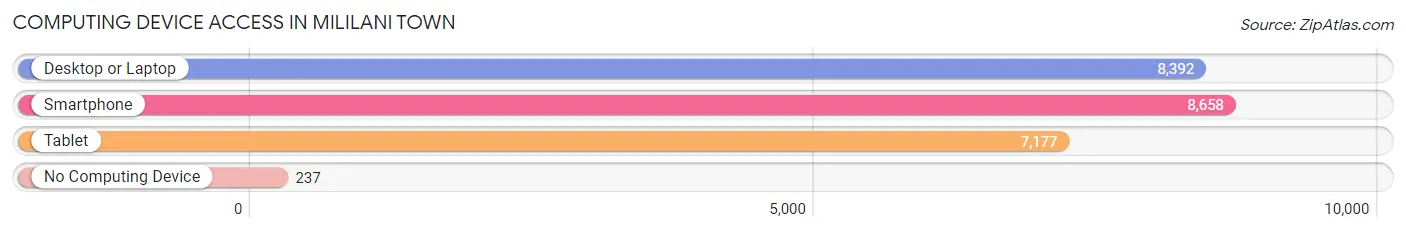
| Device Type | # Households | % Households |
| Desktop or Laptop | 8,392 | 87.0% |
| Smartphone | 8,658 | 89.7% |
| Tablet | 7,177 | 74.4% |
| No Computing Device | 237 | 2.5% |
| Total | 9,647 | 100.0% |
Internet Access in Mililani Town
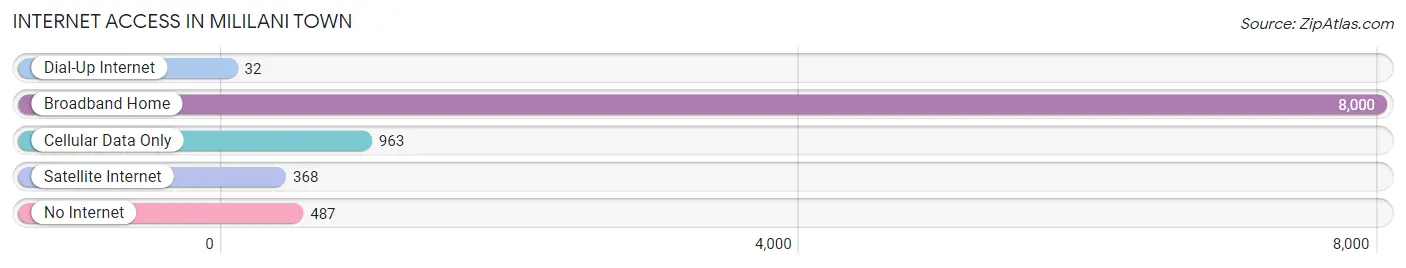
| Internet Type | # Households | % Households |
| Dial-Up Internet | 32 | 0.3% |
| Broadband Home | 8,000 | 82.9% |
| Cellular Data Only | 963 | 10.0% |
| Satellite Internet | 368 | 3.8% |
| No Internet | 487 | 5.1% |
| Total | 9,647 | 100.0% |
Mililani Town Summary
Mililani Town is a census-designated place (CDP) located in the central part of the island of Oahu in the state of Hawaii. It is located in the City and County of Honolulu and is part of the Honolulu metropolitan area. As of the 2010 census, the population of Mililani Town was 27,629.
Geography
Mililani Town is located at 21°27'N 158°00'W, about 20 miles northwest of Honolulu. It is bordered to the north by Waipio, to the east by Waikele, to the south by Waipahu, and to the west by Kunia. The total area of Mililani Town is 8.3 square miles, of which 8.2 square miles is land and 0.1 square miles is water.
The terrain of Mililani Town is mostly flat, with some rolling hills. The climate is tropical, with temperatures ranging from the mid-70s to the mid-80s.
History
The area that is now Mililani Town was originally inhabited by the native Hawaiians. In the late 19th century, the area was developed by the Oahu Railway and Land Company as a sugar plantation. The plantation was eventually abandoned and the land was sold to the US military in the 1950s.
In the 1960s, the US military began to develop the area as a residential community for its personnel. The first homes were built in 1968 and the community was officially incorporated as Mililani Town in 1973.
Economy
The economy of Mililani Town is largely based on the military, with many of its residents employed by the US military. The town is also home to several large companies, including Hawaiian Electric Company, Hawaiian Telcom, and Bank of Hawaii.
In addition, Mililani Town is home to several shopping centers, including Mililani Town Center, Mililani Shopping Center, and Mililani Marketplace. The town also has several restaurants, bars, and other entertainment venues.
Demographics
As of the 2010 census, the population of Mililani Town was 27,629. The racial makeup of the town was 57.3% White, 11.2% Asian, 8.2% Native Hawaiian or Pacific Islander, 6.2% Hispanic or Latino, and 17.1% other.
The median household income in Mililani Town was $76,845, and the median family income was $86,945. The per capita income was $31,945.
Conclusion
Mililani Town is a census-designated place located in the central part of the island of Oahu in the state of Hawaii. It is part of the Honolulu metropolitan area and has a population of 27,629. The economy of Mililani Town is largely based on the military, with many of its residents employed by the US military. The town is also home to several large companies, shopping centers, restaurants, bars, and other entertainment venues. The racial makeup of the town is 57.3% White, 11.2% Asian, 8.2% Native Hawaiian or Pacific Islander, 6.2% Hispanic or Latino, and 17.1% other. The median household income in Mililani Town was $76,845, and the median family income was $86,945.
Common Questions
What is Per Capita Income in Mililani Town?
Per Capita income in Mililani Town is $49,165.
What is the Median Family Income in Mililani Town?
Median Family Income in Mililani Town is $132,833.
What is the Median Household income in Mililani Town?
Median Household Income in Mililani Town is $119,502.
What is Income or Wage Gap in Mililani Town?
Income or Wage Gap in Mililani Town is 18.1%.
Women in Mililani Town earn 81.9 cents for every dollar earned by a man.
What is Inequality or Gini Index in Mililani Town?
Inequality or Gini Index in Mililani Town is 0.34.
What is the Total Population of Mililani Town?
Total Population of Mililani Town is 27,423.
What is the Total Male Population of Mililani Town?
Total Male Population of Mililani Town is 14,103.
What is the Total Female Population of Mililani Town?
Total Female Population of Mililani Town is 13,320.
What is the Ratio of Males per 100 Females in Mililani Town?
There are 105.88 Males per 100 Females in Mililani Town.
What is the Ratio of Females per 100 Males in Mililani Town?
There are 94.45 Females per 100 Males in Mililani Town.
What is the Median Population Age in Mililani Town?
Median Population Age in Mililani Town is 45.3 Years.
What is the Average Family Size in Mililani Town
Average Family Size in Mililani Town is 3.2 People.
What is the Average Household Size in Mililani Town
Average Household Size in Mililani Town is 2.8 People.
How Large is the Labor Force in Mililani Town?
There are 14,215 People in the Labor Forcein in Mililani Town.
What is the Percentage of People in the Labor Force in Mililani Town?
62.3% of People are in the Labor Force in Mililani Town.
What is the Unemployment Rate in Mililani Town?
Unemployment Rate in Mililani Town is 3.6%.