Waikele, HI Map & Demographics
Waikele Map
Waikele Overview
$52,750
PER CAPITA INCOME
$137,628
AVG FAMILY INCOME
$115,858
AVG HOUSEHOLD INCOME
22.1%
WAGE / INCOME GAP [ % ]
77.9¢/ $1
WAGE / INCOME GAP [ $ ]
0.34
INEQUALITY / GINI INDEX
7,551
TOTAL POPULATION
3,364
MALE POPULATION
4,187
FEMALE POPULATION
80.34
MALES / 100 FEMALES
124.46
FEMALES / 100 MALES
42.7
MEDIAN AGE
3.0
AVG FAMILY SIZE
2.5
AVG HOUSEHOLD SIZE
5,064
LABOR FORCE [ PEOPLE ]
76.9%
PERCENT IN LABOR FORCE
0.5%
UNEMPLOYMENT RATE
Income in Waikele
Income Overview in Waikele
Per Capita Income in Waikele is $52,750, while median incomes of families and households are $137,628 and $115,858 respectively.
| Characteristic | Number | Measure |
| Per Capita Income | 7,551 | $52,750 |
| Median Family Income | 2,097 | $137,628 |
| Mean Family Income | 2,097 | $146,514 |
| Median Household Income | 2,977 | $115,858 |
| Mean Household Income | 2,977 | $131,561 |
| Income Deficit | 2,097 | $0 |
| Wage / Income Gap (%) | 7,551 | 22.12% |
| Wage / Income Gap ($) | 7,551 | 77.88¢ per $1 |
| Gini / Inequality Index | 7,551 | 0.34 |
Earnings by Sex in Waikele
Average Earnings in Waikele are $60,969, $70,896 for men and $55,213 for women, a difference of 22.1%.
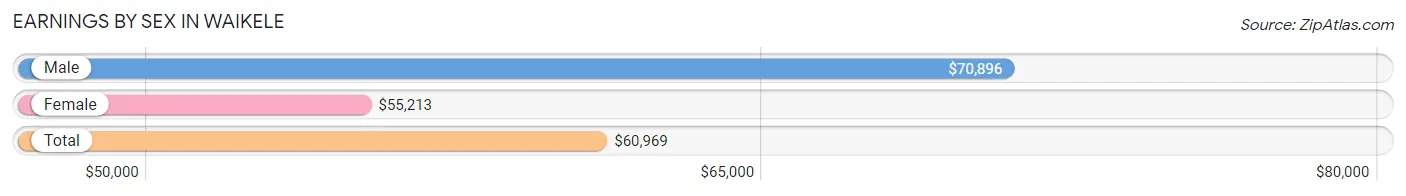
| Sex | Number | Average Earnings |
| Male | 2,419 (46.6%) | $70,896 |
| Female | 2,775 (53.4%) | $55,213 |
| Total | 5,194 (100.0%) | $60,969 |
Earnings by Sex by Income Bracket in Waikele
The most common earnings brackets in Waikele are $100,000+ for men (602 | 24.9%) and $75,000 to $99,999 for women (417 | 15.0%).
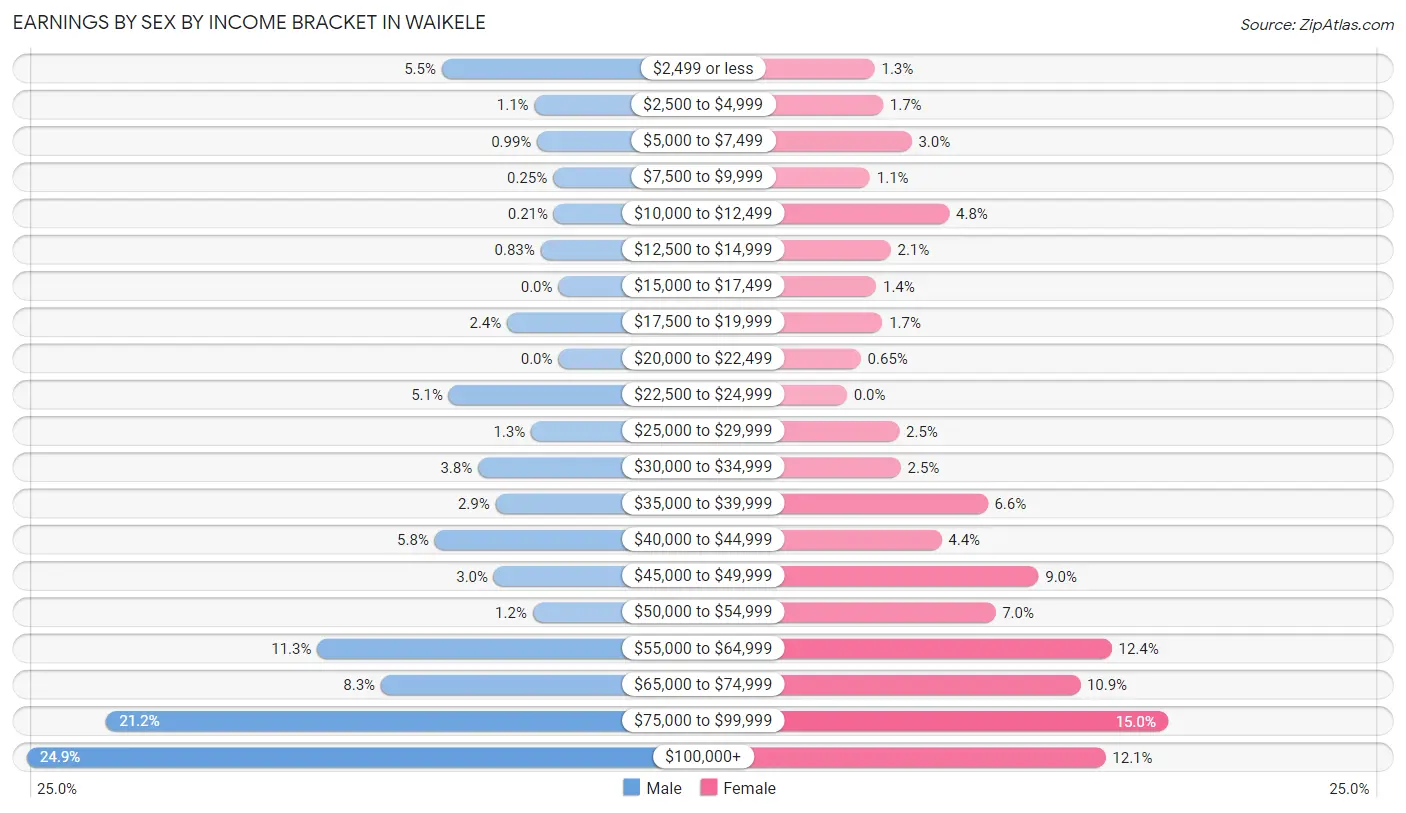
| Income | Male | Female |
| $2,499 or less | 132 (5.5%) | 36 (1.3%) |
| $2,500 to $4,999 | 27 (1.1%) | 47 (1.7%) |
| $5,000 to $7,499 | 24 (1.0%) | 84 (3.0%) |
| $7,500 to $9,999 | 6 (0.3%) | 30 (1.1%) |
| $10,000 to $12,499 | 5 (0.2%) | 133 (4.8%) |
| $12,500 to $14,999 | 20 (0.8%) | 57 (2.1%) |
| $15,000 to $17,499 | 0 (0.0%) | 38 (1.4%) |
| $17,500 to $19,999 | 58 (2.4%) | 46 (1.7%) |
| $20,000 to $22,499 | 0 (0.0%) | 18 (0.6%) |
| $22,500 to $24,999 | 124 (5.1%) | 0 (0.0%) |
| $25,000 to $29,999 | 31 (1.3%) | 68 (2.5%) |
| $30,000 to $34,999 | 91 (3.8%) | 70 (2.5%) |
| $35,000 to $39,999 | 71 (2.9%) | 183 (6.6%) |
| $40,000 to $44,999 | 140 (5.8%) | 123 (4.4%) |
| $45,000 to $49,999 | 73 (3.0%) | 249 (9.0%) |
| $50,000 to $54,999 | 29 (1.2%) | 193 (7.0%) |
| $55,000 to $64,999 | 273 (11.3%) | 344 (12.4%) |
| $65,000 to $74,999 | 201 (8.3%) | 303 (10.9%) |
| $75,000 to $99,999 | 512 (21.2%) | 417 (15.0%) |
| $100,000+ | 602 (24.9%) | 336 (12.1%) |
| Total | 2,419 (100.0%) | 2,775 (100.0%) |
Earnings by Sex by Educational Attainment in Waikele
Average earnings in Waikele are $75,572 for men and $57,254 for women, a difference of 24.2%. Men with an educational attainment of graduate degree enjoy the highest average annual earnings of $112,813, while those with high school diploma education earn the least with $58,103. Women with an educational attainment of bachelor's degree earn the most with the average annual earnings of $76,569, while those with high school diploma education have the smallest earnings of $36,866.
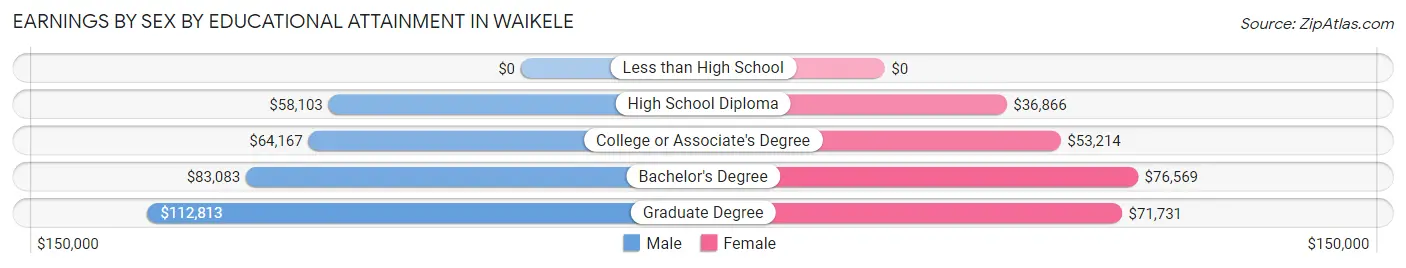
| Educational Attainment | Male Income | Female Income |
| Less than High School | - | - |
| High School Diploma | $58,103 | $36,866 |
| College or Associate's Degree | $64,167 | $53,214 |
| Bachelor's Degree | $83,083 | $76,569 |
| Graduate Degree | $112,813 | $71,731 |
| Total | $75,572 | $57,254 |
Family Income in Waikele
Family Income Brackets in Waikele
According to the Waikele family income data, there are 663 families falling into the $100,000 to $149,999 income range, which is the most common income bracket and makes up 31.6% of all families. Conversely, the $25,000 to $34,999 income bracket is the least frequent group with only 15 families (0.7%) belonging to this category.
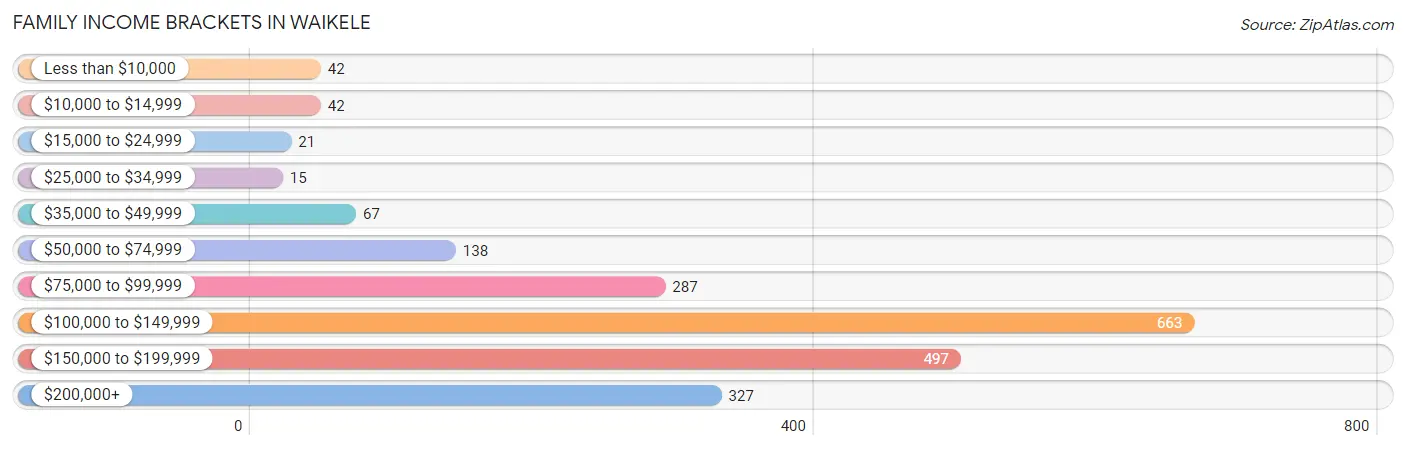
| Income Bracket | # Families | % Families |
| Less than $10,000 | 42 | 2.0% |
| $10,000 to $14,999 | 42 | 2.0% |
| $15,000 to $24,999 | 21 | 1.0% |
| $25,000 to $34,999 | 15 | 0.7% |
| $35,000 to $49,999 | 67 | 3.2% |
| $50,000 to $74,999 | 138 | 6.6% |
| $75,000 to $99,999 | 287 | 13.7% |
| $100,000 to $149,999 | 663 | 31.6% |
| $150,000 to $199,999 | 497 | 23.7% |
| $200,000+ | 327 | 15.6% |
Family Income by Famaliy Size in Waikele
4-person families (447 | 21.3%) account for the highest median family income in Waikele with $156,328 per family, while 2-person families (951 | 45.4%) have the highest median income of $55,347 per family member.
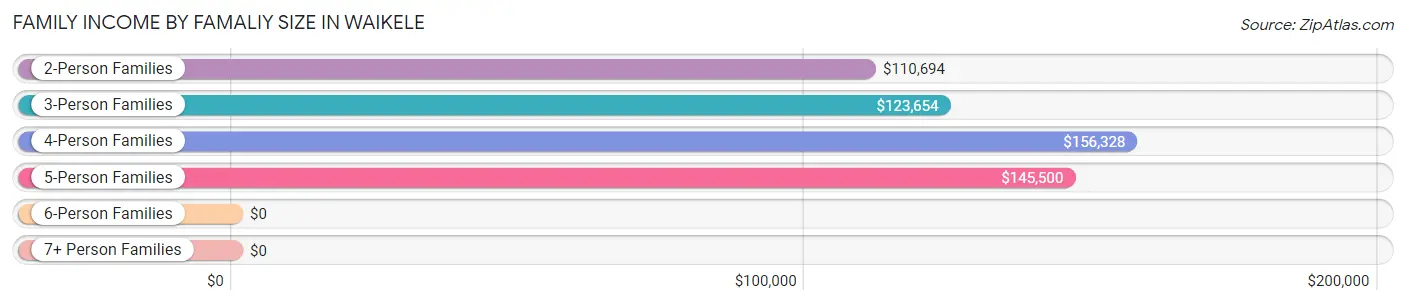
| Income Bracket | # Families | Median Income |
| 2-Person Families | 951 (45.4%) | $110,694 |
| 3-Person Families | 460 (21.9%) | $123,654 |
| 4-Person Families | 447 (21.3%) | $156,328 |
| 5-Person Families | 224 (10.7%) | $145,500 |
| 6-Person Families | 15 (0.7%) | $0 |
| 7+ Person Families | 0 (0.0%) | $0 |
| Total | 2,097 (100.0%) | $137,628 |
Family Income by Number of Earners in Waikele
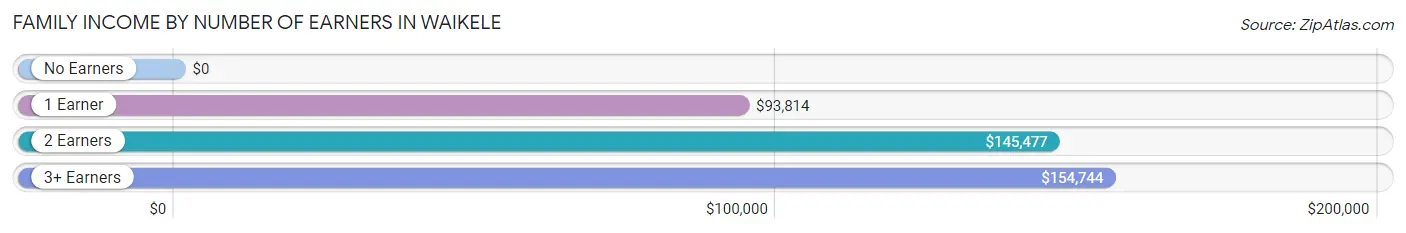
| Number of Earners | # Families | Median Income |
| No Earners | 118 (5.6%) | $0 |
| 1 Earner | 484 (23.1%) | $93,814 |
| 2 Earners | 987 (47.1%) | $145,477 |
| 3+ Earners | 508 (24.2%) | $154,744 |
| Total | 2,097 (100.0%) | $137,628 |
Household Income in Waikele
Household Income Brackets in Waikele
With 878 households falling in the category, the $100,000 to $149,999 income range is the most frequent in Waikele, accounting for 29.5% of all households. In contrast, only 30 households (1.0%) fall into the $25,000 to $34,999 income bracket, making it the least populous group.
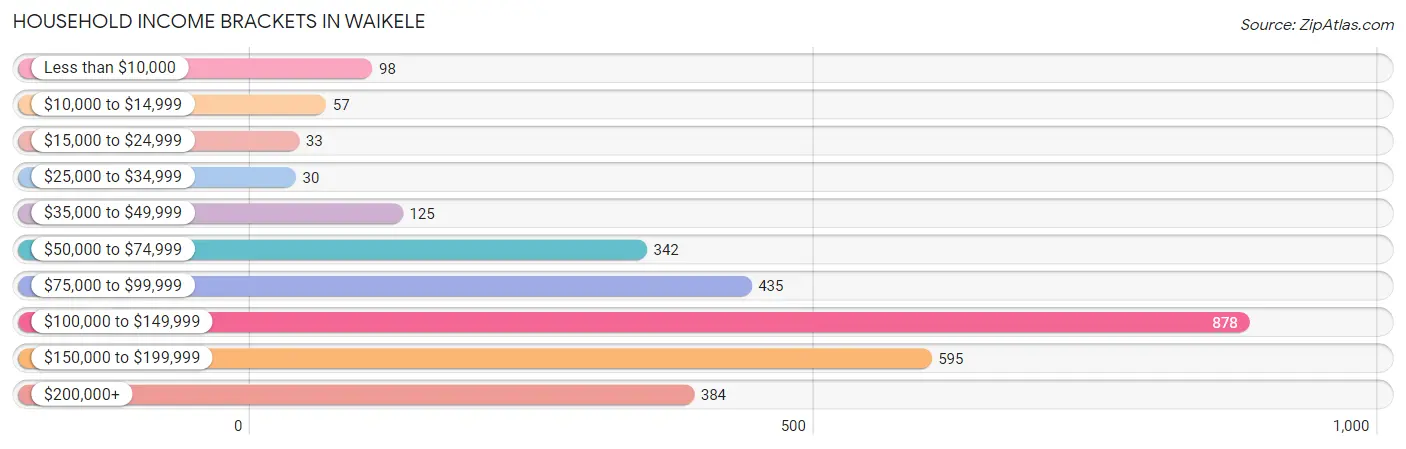
| Income Bracket | # Households | % Households |
| Less than $10,000 | 98 | 3.3% |
| $10,000 to $14,999 | 57 | 1.9% |
| $15,000 to $24,999 | 33 | 1.1% |
| $25,000 to $34,999 | 30 | 1.0% |
| $35,000 to $49,999 | 125 | 4.2% |
| $50,000 to $74,999 | 342 | 11.5% |
| $75,000 to $99,999 | 435 | 14.6% |
| $100,000 to $149,999 | 878 | 29.5% |
| $150,000 to $199,999 | 595 | 20.0% |
| $200,000+ | 384 | 12.9% |
Household Income by Householder Age in Waikele
The median household income in Waikele is $115,858, with the highest median household income of $130,504 found in the 25 to 44 years age bracket for the primary householder. A total of 1,067 households (35.8%) fall into this category. Meanwhile, the 15 to 24 years age bracket for the primary householder has the lowest median household income of $87,292, with 131 households (4.4%) in this group.
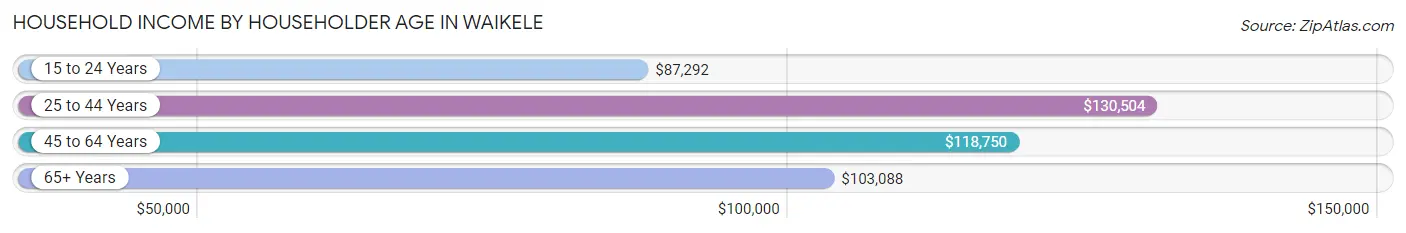
| Income Bracket | # Households | Median Income |
| 15 to 24 Years | 131 (4.4%) | $87,292 |
| 25 to 44 Years | 1,067 (35.8%) | $130,504 |
| 45 to 64 Years | 1,191 (40.0%) | $118,750 |
| 65+ Years | 588 (19.8%) | $103,088 |
| Total | 2,977 (100.0%) | $115,858 |
Poverty in Waikele
Income Below Poverty by Sex and Age in Waikele
With 2.1% poverty level for males and 5.0% for females among the residents of Waikele, 75 year old and over males and 75 year old and over females are the most vulnerable to poverty, with 33 males (18.6%) and 46 females (15.5%) in their respective age groups living below the poverty level.
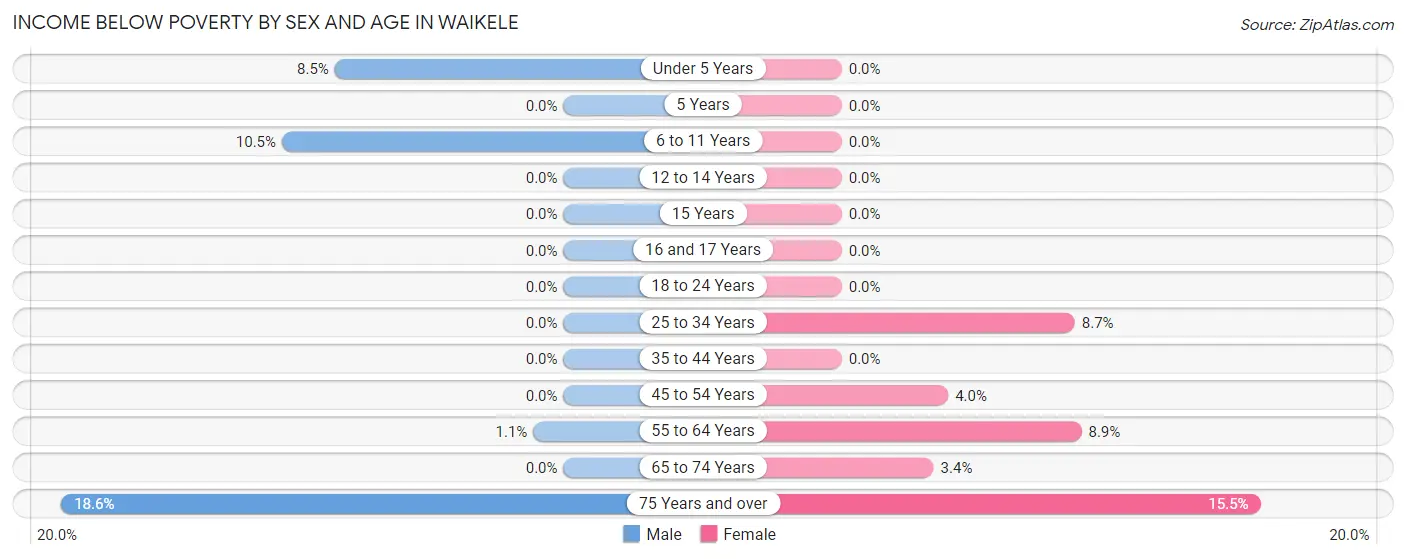
| Age Bracket | Male | Female |
| Under 5 Years | 18 (8.5%) | 0 (0.0%) |
| 5 Years | 0 (0.0%) | 0 (0.0%) |
| 6 to 11 Years | 14 (10.4%) | 0 (0.0%) |
| 12 to 14 Years | 0 (0.0%) | 0 (0.0%) |
| 15 Years | 0 (0.0%) | 0 (0.0%) |
| 16 and 17 Years | 0 (0.0%) | 0 (0.0%) |
| 18 to 24 Years | 0 (0.0%) | 0 (0.0%) |
| 25 to 34 Years | 0 (0.0%) | 67 (8.6%) |
| 35 to 44 Years | 0 (0.0%) | 0 (0.0%) |
| 45 to 54 Years | 0 (0.0%) | 23 (4.0%) |
| 55 to 64 Years | 5 (1.1%) | 62 (8.9%) |
| 65 to 74 Years | 0 (0.0%) | 12 (3.4%) |
| 75 Years and over | 33 (18.6%) | 46 (15.5%) |
| Total | 70 (2.1%) | 210 (5.0%) |
Income Above Poverty by Sex and Age in Waikele
According to the poverty statistics in Waikele, males aged 5 years and females aged under 5 years are the age groups that are most secure financially, with 100.0% of males and 100.0% of females in these age groups living above the poverty line.
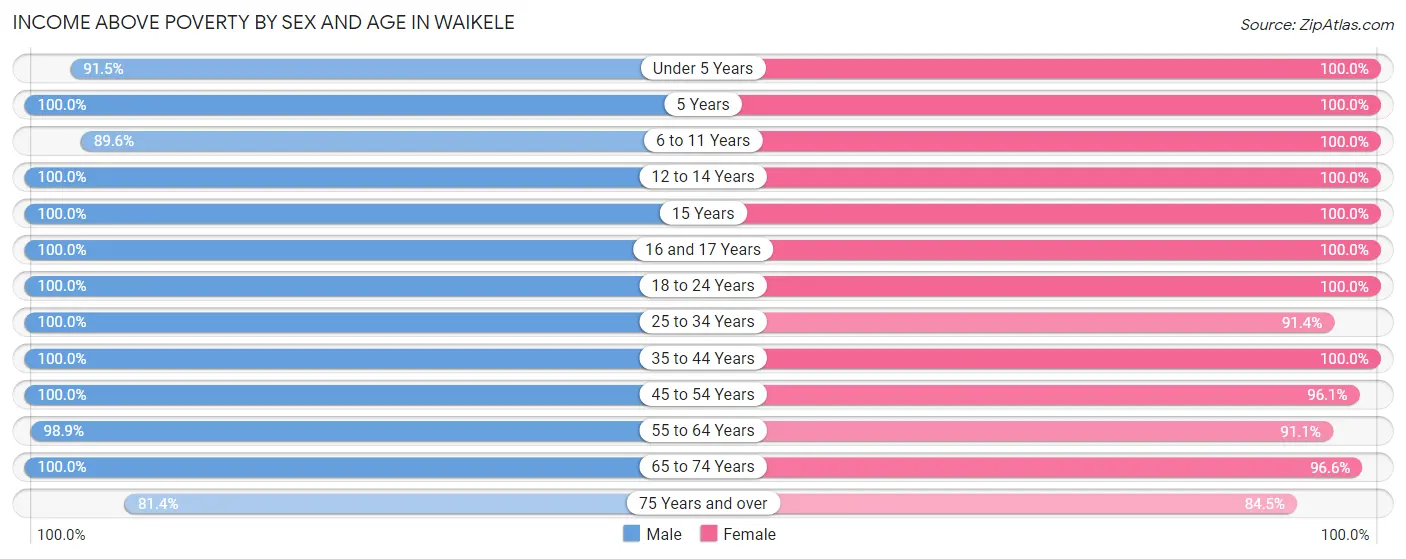
| Age Bracket | Male | Female |
| Under 5 Years | 194 (91.5%) | 77 (100.0%) |
| 5 Years | 15 (100.0%) | 67 (100.0%) |
| 6 to 11 Years | 120 (89.5%) | 251 (100.0%) |
| 12 to 14 Years | 56 (100.0%) | 82 (100.0%) |
| 15 Years | 26 (100.0%) | 46 (100.0%) |
| 16 and 17 Years | 59 (100.0%) | 142 (100.0%) |
| 18 to 24 Years | 254 (100.0%) | 368 (100.0%) |
| 25 to 34 Years | 747 (100.0%) | 708 (91.3%) |
| 35 to 44 Years | 328 (100.0%) | 452 (100.0%) |
| 45 to 54 Years | 716 (100.0%) | 559 (96.1%) |
| 55 to 64 Years | 441 (98.9%) | 635 (91.1%) |
| 65 to 74 Years | 194 (100.0%) | 340 (96.6%) |
| 75 Years and over | 144 (81.4%) | 250 (84.5%) |
| Total | 3,294 (97.9%) | 3,977 (95.0%) |
Income Below Poverty Among Married-Couple Families in Waikele
The poverty statistics for married-couple families in Waikele show that 1.2% or 19 of the total 1,584 families live below the poverty line. Families with no children have the highest poverty rate of 2.1%, comprising of 19 families. On the other hand, families with 1 or 2 children have the lowest poverty rate of 0.0%, which includes 0 families.
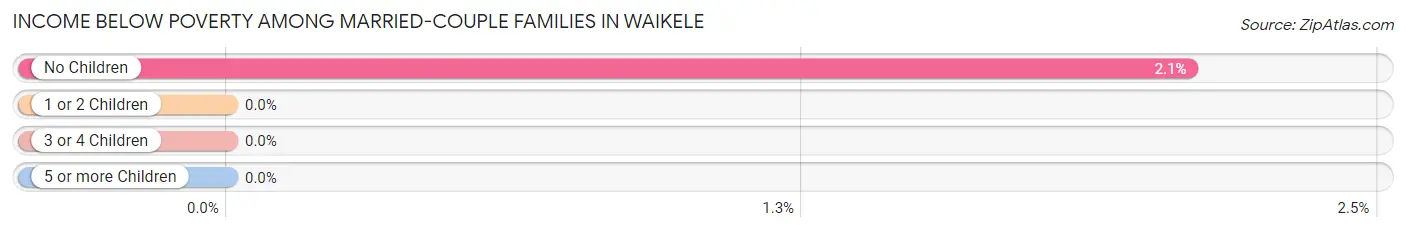
| Children | Above Poverty | Below Poverty |
| No Children | 891 (97.9%) | 19 (2.1%) |
| 1 or 2 Children | 625 (100.0%) | 0 (0.0%) |
| 3 or 4 Children | 49 (100.0%) | 0 (0.0%) |
| 5 or more Children | 0 (0.0%) | 0 (0.0%) |
| Total | 1,565 (98.8%) | 19 (1.2%) |
Income Below Poverty Among Single-Parent Households in Waikele
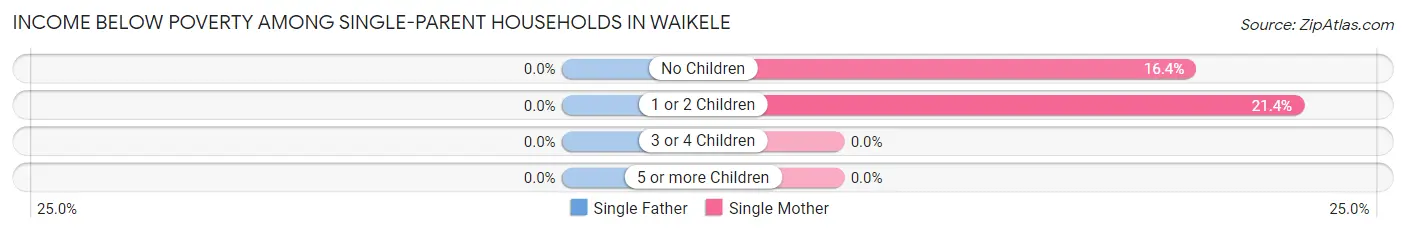
| Children | Single Father | Single Mother |
| No Children | 0 (0.0%) | 42 (16.4%) |
| 1 or 2 Children | 0 (0.0%) | 30 (21.4%) |
| 3 or 4 Children | 0 (0.0%) | 0 (0.0%) |
| 5 or more Children | 0 (0.0%) | 0 (0.0%) |
| Total | 0 (0.0%) | 72 (18.2%) |
Income Below Poverty Among Married-Couple vs Single-Parent Households in Waikele
The poverty data for Waikele shows that 19 of the married-couple family households (1.2%) and 72 of the single-parent households (14.0%) are living below the poverty level. Within the married-couple family households, those with no children have the highest poverty rate, with 19 households (2.1%) falling below the poverty line. Among the single-parent households, those with 1 or 2 children have the highest poverty rate, with 30 household (17.1%) living below poverty.
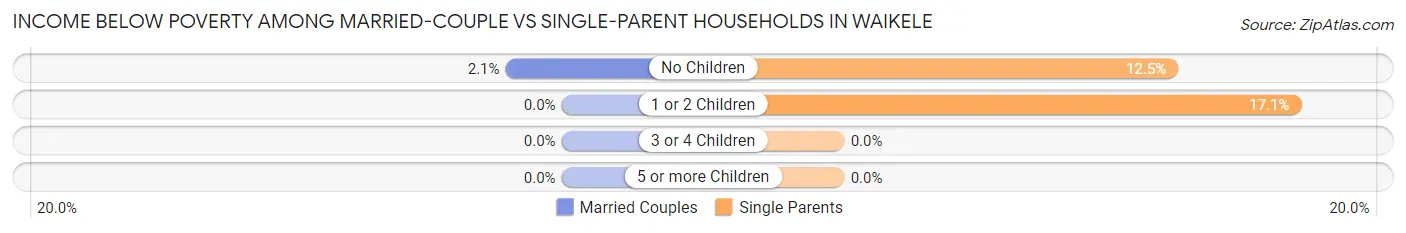
| Children | Married-Couple Families | Single-Parent Households |
| No Children | 19 (2.1%) | 42 (12.5%) |
| 1 or 2 Children | 0 (0.0%) | 30 (17.1%) |
| 3 or 4 Children | 0 (0.0%) | 0 (0.0%) |
| 5 or more Children | 0 (0.0%) | 0 (0.0%) |
| Total | 19 (1.2%) | 72 (14.0%) |
Race in Waikele
The most populous races in Waikele are Asian (4,082 | 54.1%), Two or more Races (1,883 | 24.9%), and White / Caucasian (882 | 11.7%).
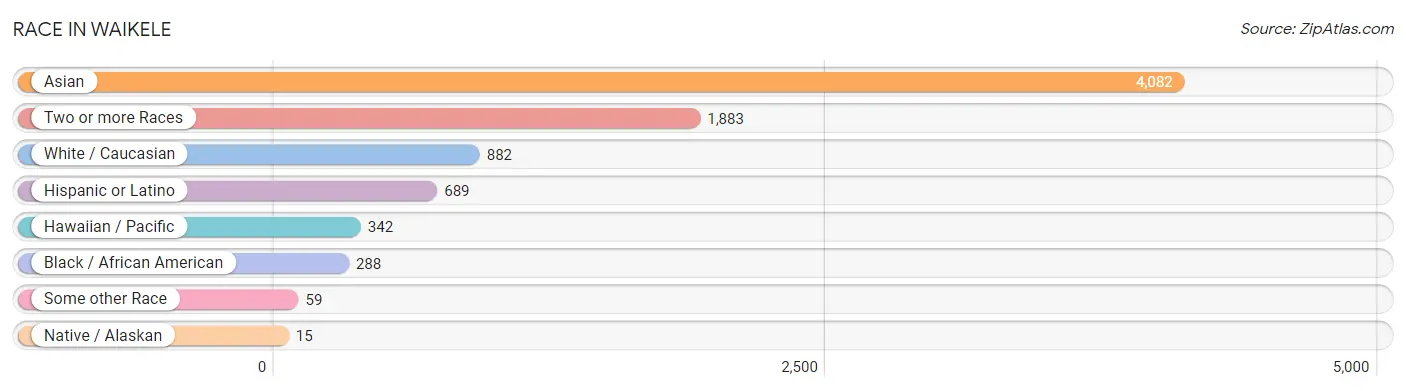
| Race | # Population | % Population |
| Asian | 4,082 | 54.1% |
| Black / African American | 288 | 3.8% |
| Hawaiian / Pacific | 342 | 4.5% |
| Hispanic or Latino | 689 | 9.1% |
| Native / Alaskan | 15 | 0.2% |
| White / Caucasian | 882 | 11.7% |
| Two or more Races | 1,883 | 24.9% |
| Some other Race | 59 | 0.8% |
| Total | 7,551 | 100.0% |
Ancestry in Waikele
The most populous ancestries reported in Waikele are Korean (2,697 | 35.7%), Bhutanese (2,592 | 34.3%), Indian (Asian) (1,466 | 19.4%), Native Hawaiian (800 | 10.6%), and Samoan (502 | 6.7%), together accounting for 106.7% of all Waikele residents.
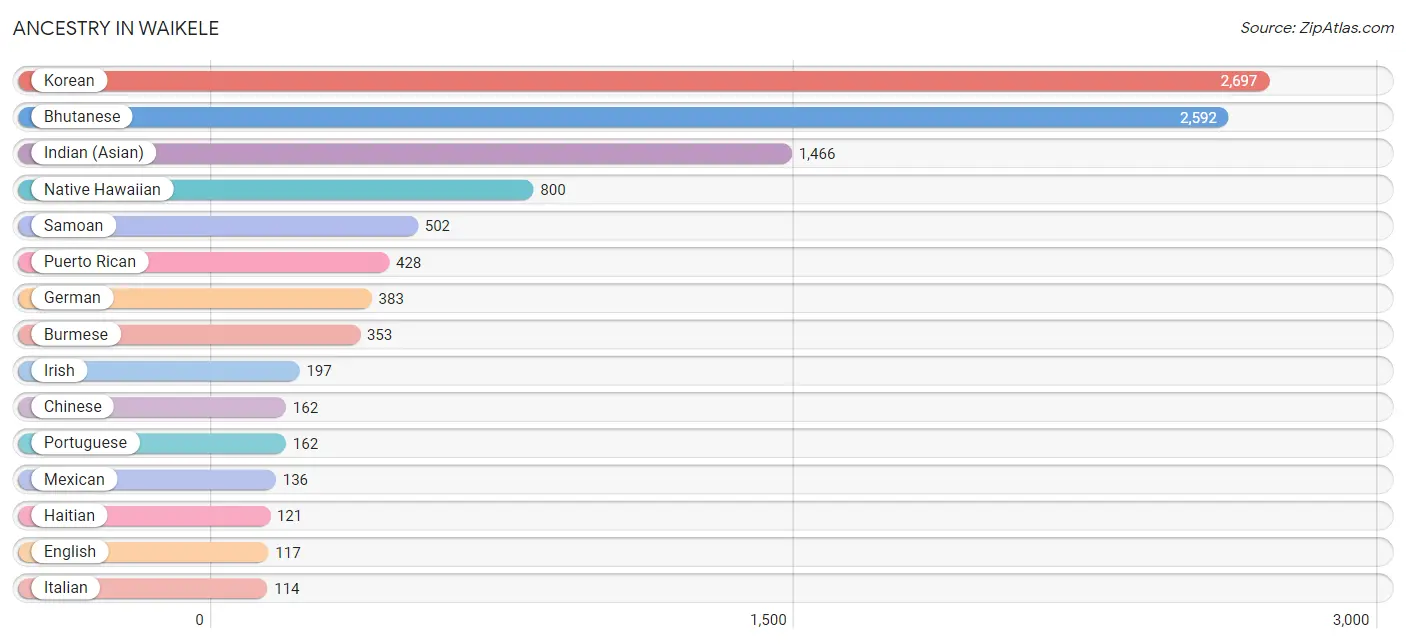
| Ancestry | # Population | % Population |
| African | 23 | 0.3% |
| American | 52 | 0.7% |
| Bhutanese | 2,592 | 34.3% |
| Burmese | 353 | 4.7% |
| Cherokee | 107 | 1.4% |
| Chinese | 162 | 2.1% |
| Czech | 17 | 0.2% |
| Dominican | 17 | 0.2% |
| Dutch | 5 | 0.1% |
| Ecuadorian | 6 | 0.1% |
| English | 117 | 1.5% |
| European | 23 | 0.3% |
| French | 52 | 0.7% |
| German | 383 | 5.1% |
| Greek | 30 | 0.4% |
| Haitian | 121 | 1.6% |
| Indian (Asian) | 1,466 | 19.4% |
| Irish | 197 | 2.6% |
| Iroquois | 8 | 0.1% |
| Italian | 114 | 1.5% |
| Korean | 2,697 | 35.7% |
| Malaysian | 77 | 1.0% |
| Marshallese | 16 | 0.2% |
| Mexican | 136 | 1.8% |
| Native Hawaiian | 800 | 10.6% |
| Navajo | 18 | 0.2% |
| Norwegian | 13 | 0.2% |
| Pakistani | 14 | 0.2% |
| Polish | 16 | 0.2% |
| Portuguese | 162 | 2.1% |
| Puerto Rican | 428 | 5.7% |
| Samoan | 502 | 6.7% |
| Scotch-Irish | 10 | 0.1% |
| Scottish | 43 | 0.6% |
| Sioux | 14 | 0.2% |
| South American | 6 | 0.1% |
| Spaniard | 44 | 0.6% |
| Spanish | 58 | 0.8% |
| Sri Lankan | 74 | 1.0% |
| Subsaharan African | 23 | 0.3% |
| Swedish | 16 | 0.2% |
| Swiss | 47 | 0.6% |
| Thai | 7 | 0.1% |
| Welsh | 32 | 0.4% | View All 44 Rows |
Immigrants in Waikele
The most numerous immigrant groups reported in Waikele came from Asia (1,154 | 15.3%), South Eastern Asia (873 | 11.6%), Philippines (773 | 10.2%), Eastern Asia (274 | 3.6%), and China (135 | 1.8%), together accounting for 42.5% of all Waikele residents.
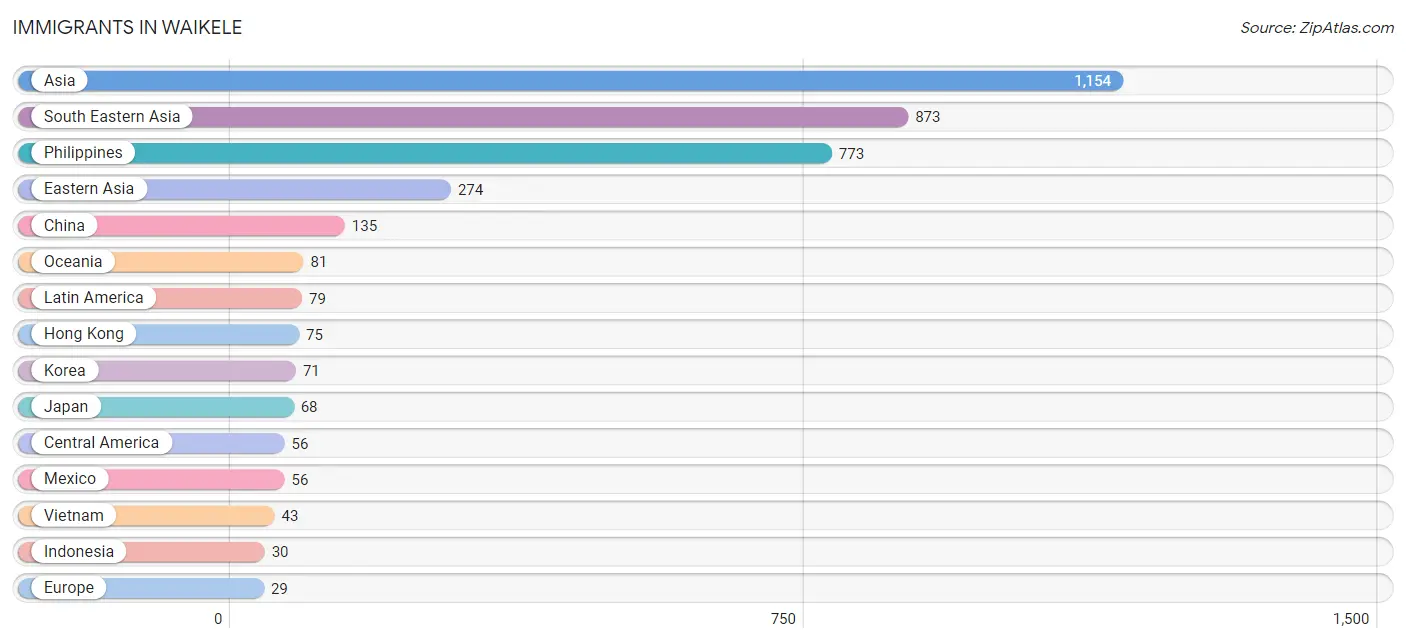
| Immigration Origin | # Population | % Population |
| Asia | 1,154 | 15.3% |
| Canada | 5 | 0.1% |
| Caribbean | 17 | 0.2% |
| Central America | 56 | 0.7% |
| China | 135 | 1.8% |
| Dominican Republic | 17 | 0.2% |
| Eastern Asia | 274 | 3.6% |
| Ecuador | 6 | 0.1% |
| Europe | 29 | 0.4% |
| Greece | 14 | 0.2% |
| Hong Kong | 75 | 1.0% |
| India | 7 | 0.1% |
| Indonesia | 30 | 0.4% |
| Italy | 15 | 0.2% |
| Japan | 68 | 0.9% |
| Korea | 71 | 0.9% |
| Laos | 13 | 0.2% |
| Latin America | 79 | 1.1% |
| Mexico | 56 | 0.7% |
| Micronesia | 16 | 0.2% |
| Oceania | 81 | 1.1% |
| Philippines | 773 | 10.2% |
| South America | 6 | 0.1% |
| South Central Asia | 7 | 0.1% |
| South Eastern Asia | 873 | 11.6% |
| Southern Europe | 29 | 0.4% |
| Taiwan | 12 | 0.2% |
| Thailand | 14 | 0.2% |
| Vietnam | 43 | 0.6% | View All 29 Rows |
Sex and Age in Waikele
Sex and Age in Waikele
The most populous age groups in Waikele are 50 to 54 Years (496 | 14.7%) for men and 55 to 59 Years (544 | 13.0%) for women.
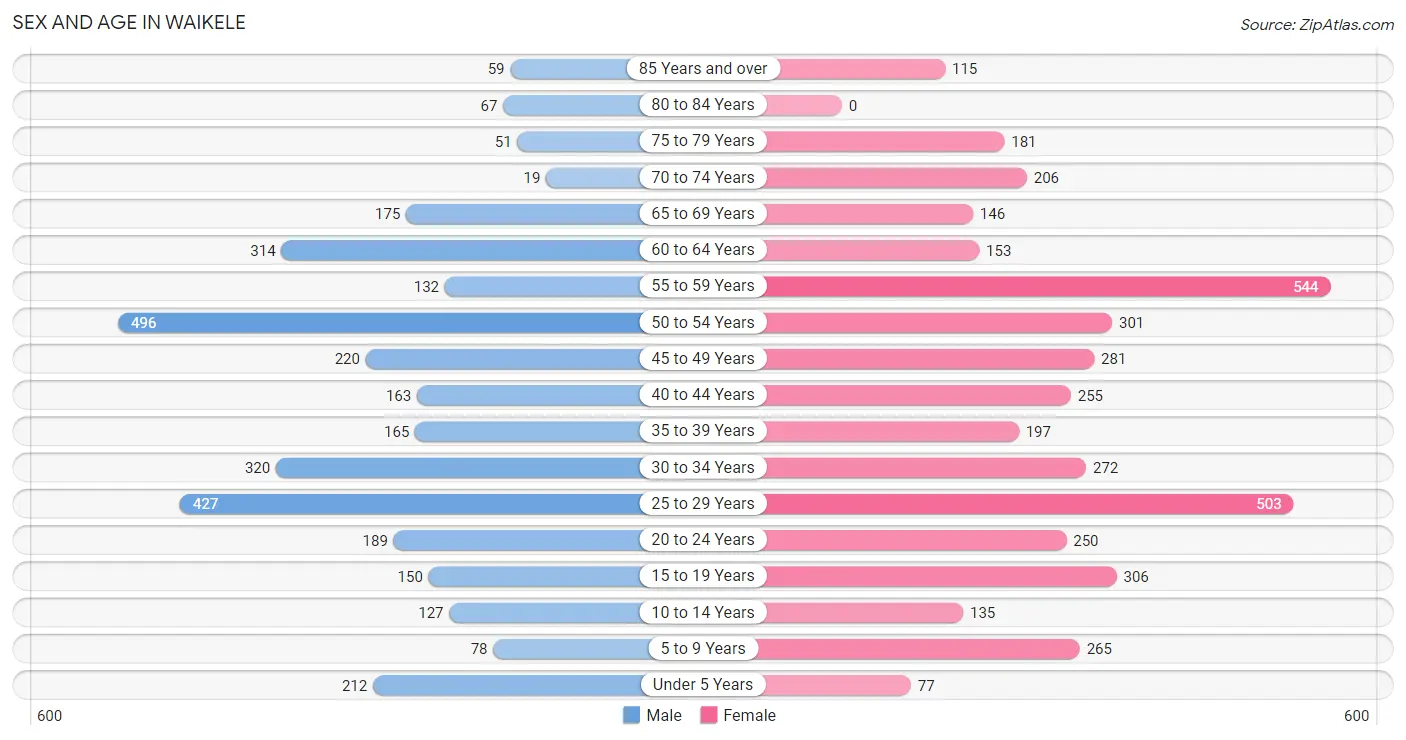
| Age Bracket | Male | Female |
| Under 5 Years | 212 (6.3%) | 77 (1.8%) |
| 5 to 9 Years | 78 (2.3%) | 265 (6.3%) |
| 10 to 14 Years | 127 (3.8%) | 135 (3.2%) |
| 15 to 19 Years | 150 (4.5%) | 306 (7.3%) |
| 20 to 24 Years | 189 (5.6%) | 250 (6.0%) |
| 25 to 29 Years | 427 (12.7%) | 503 (12.0%) |
| 30 to 34 Years | 320 (9.5%) | 272 (6.5%) |
| 35 to 39 Years | 165 (4.9%) | 197 (4.7%) |
| 40 to 44 Years | 163 (4.9%) | 255 (6.1%) |
| 45 to 49 Years | 220 (6.5%) | 281 (6.7%) |
| 50 to 54 Years | 496 (14.7%) | 301 (7.2%) |
| 55 to 59 Years | 132 (3.9%) | 544 (13.0%) |
| 60 to 64 Years | 314 (9.3%) | 153 (3.6%) |
| 65 to 69 Years | 175 (5.2%) | 146 (3.5%) |
| 70 to 74 Years | 19 (0.6%) | 206 (4.9%) |
| 75 to 79 Years | 51 (1.5%) | 181 (4.3%) |
| 80 to 84 Years | 67 (2.0%) | 0 (0.0%) |
| 85 Years and over | 59 (1.8%) | 115 (2.8%) |
| Total | 3,364 (100.0%) | 4,187 (100.0%) |
Families and Households in Waikele
Median Family Size in Waikele
The median family size in Waikele is 3.05 persons per family, with single female/mother families (396 | 18.9%) accounting for the largest median family size of 3.18 persons per family. On the other hand, single male/father families (117 | 5.6%) represent the smallest median family size with 2.44 persons per family.
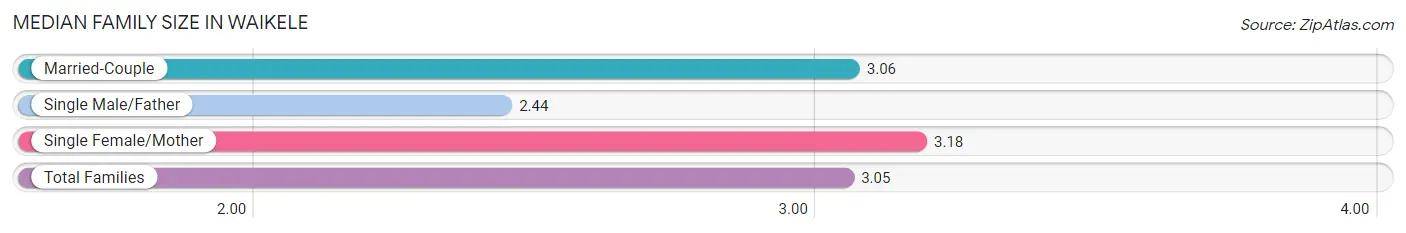
| Family Type | # Families | Family Size |
| Married-Couple | 1,584 (75.5%) | 3.06 |
| Single Male/Father | 117 (5.6%) | 2.44 |
| Single Female/Mother | 396 (18.9%) | 3.18 |
| Total Families | 2,097 (100.0%) | 3.05 |
Median Household Size in Waikele
The median household size in Waikele is 2.54 persons per household, with single female/mother households (396 | 13.3%) accounting for the largest median household size of 3.21 persons per household. non-family households (880 | 29.6%) represent the smallest median household size with 1.17 persons per household.
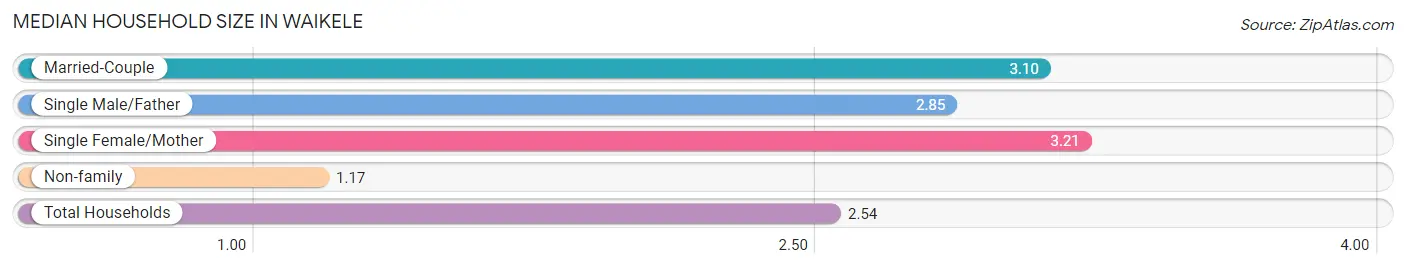
| Household Type | # Households | Household Size |
| Married-Couple | 1,584 (53.2%) | 3.10 |
| Single Male/Father | 117 (3.9%) | 2.85 |
| Single Female/Mother | 396 (13.3%) | 3.21 |
| Non-family | 880 (29.6%) | 1.17 |
| Total Households | 2,977 (100.0%) | 2.54 |
Household Size by Marriage Status in Waikele
Out of a total of 2,977 households in Waikele, 2,097 (70.4%) are family households, while 880 (29.6%) are nonfamily households. The most numerous type of family households are 2-person households, comprising 895, and the most common type of nonfamily households are 1-person households, comprising 719.
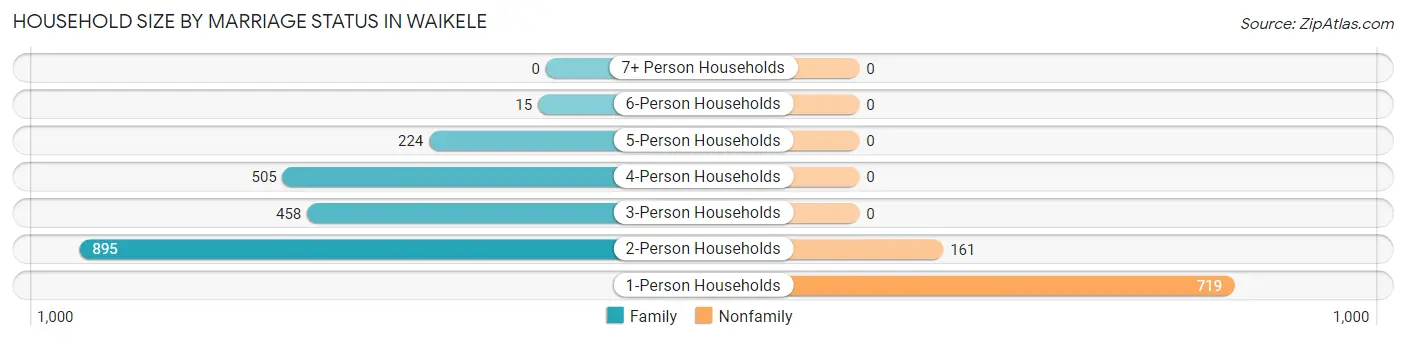
| Household Size | Family Households | Nonfamily Households |
| 1-Person Households | - | 719 (24.1%) |
| 2-Person Households | 895 (30.1%) | 161 (5.4%) |
| 3-Person Households | 458 (15.4%) | 0 (0.0%) |
| 4-Person Households | 505 (17.0%) | 0 (0.0%) |
| 5-Person Households | 224 (7.5%) | 0 (0.0%) |
| 6-Person Households | 15 (0.5%) | 0 (0.0%) |
| 7+ Person Households | 0 (0.0%) | 0 (0.0%) |
| Total | 2,097 (70.4%) | 880 (29.6%) |
Female Fertility in Waikele
Fertility by Age in Waikele
Average fertility rate in Waikele is 55.0 births per 1,000 women. Women in the age bracket of 20 to 34 years have the highest fertility rate with 82.0 births per 1,000 women. Women in the age bracket of 20 to 34 years acount for 72.4% of all women with births.
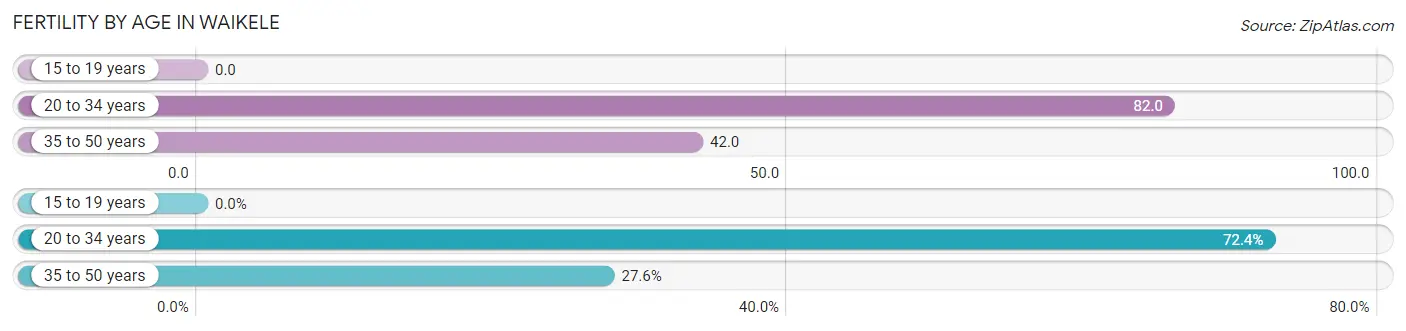
| Age Bracket | Women with Births | Births / 1,000 Women |
| 15 to 19 years | 0 (0.0%) | 0.0 |
| 20 to 34 years | 84 (72.4%) | 82.0 |
| 35 to 50 years | 32 (27.6%) | 42.0 |
| Total | 116 (100.0%) | 55.0 |
Fertility by Age by Marriage Status in Waikele
95.7% of women with births (116) in Waikele are married. The highest percentage of unmarried women with births falls into 20 to 34 years age bracket with 5.9% of them unmarried at the time of birth, while the lowest percentage of unmarried women with births belong to 35 to 50 years age bracket with 0.0% of them unmarried.
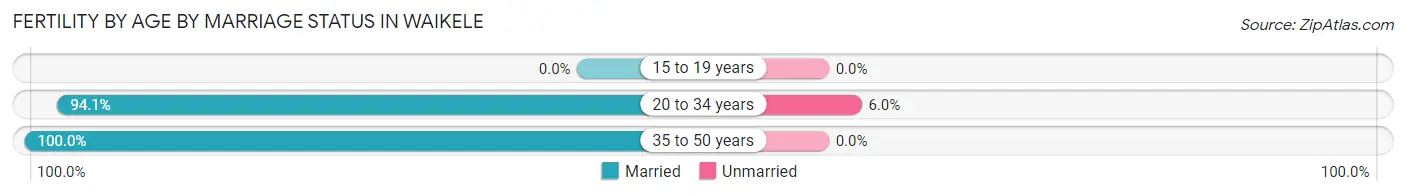
| Age Bracket | Married | Unmarried |
| 15 to 19 years | 0 (0.0%) | 0 (0.0%) |
| 20 to 34 years | 79 (94.1%) | 5 (5.9%) |
| 35 to 50 years | 32 (100.0%) | 0 (0.0%) |
| Total | 111 (95.7%) | 5 (4.3%) |
Fertility by Education in Waikele
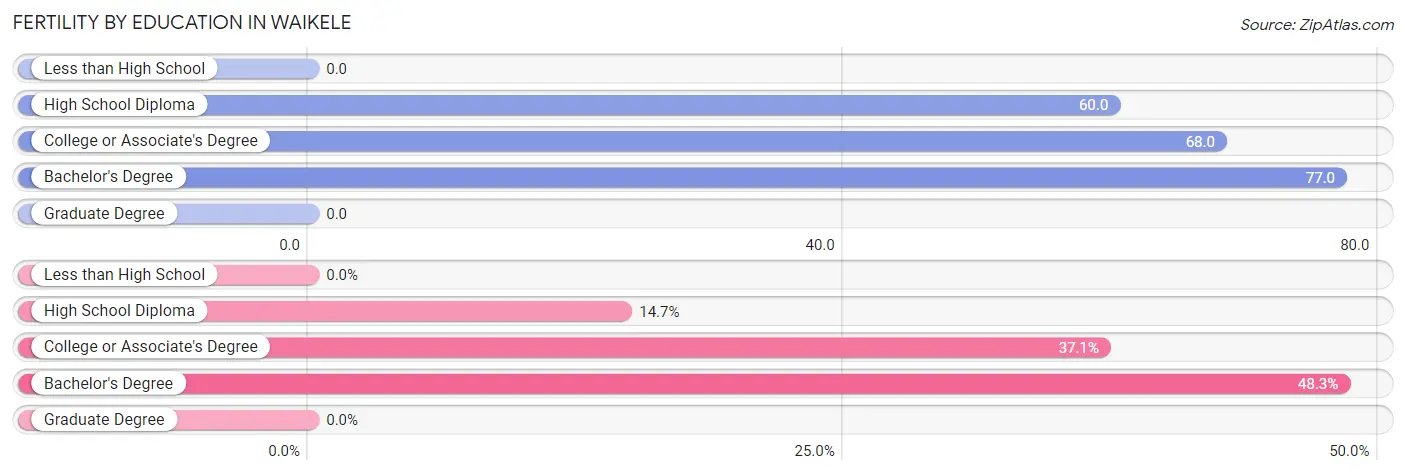
| Educational Attainment | Women with Births | Births / 1,000 Women |
| Less than High School | 0 (0.0%) | 0.0 |
| High School Diploma | 17 (14.7%) | 60.0 |
| College or Associate's Degree | 43 (37.1%) | 68.0 |
| Bachelor's Degree | 56 (48.3%) | 77.0 |
| Graduate Degree | 0 (0.0%) | 0.0 |
| Total | 116 (100.0%) | 55.0 |
Fertility by Education by Marriage Status in Waikele
4.3% of women with births in Waikele are unmarried. Women with the educational attainment of high school diploma are most likely to be married with 100.0% of them married at childbirth, while women with the educational attainment of bachelor's degree are least likely to be married with 8.9% of them unmarried at childbirth.
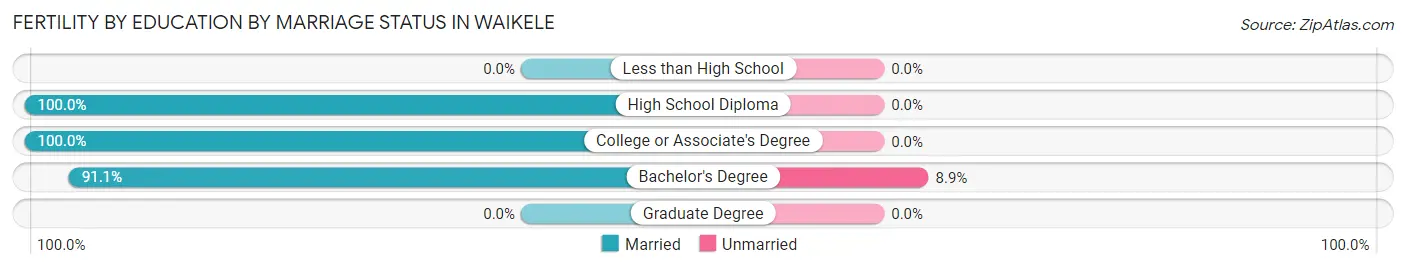
| Educational Attainment | Married | Unmarried |
| Less than High School | 0 (0.0%) | 0 (0.0%) |
| High School Diploma | 17 (100.0%) | 0 (0.0%) |
| College or Associate's Degree | 43 (100.0%) | 0 (0.0%) |
| Bachelor's Degree | 51 (91.1%) | 5 (8.9%) |
| Graduate Degree | 0 (0.0%) | 0 (0.0%) |
| Total | 111 (95.7%) | 5 (4.3%) |
Employment Characteristics in Waikele
Employment by Class of Employer in Waikele
Among the 4,815 employed individuals in Waikele, private company employees (2,435 | 50.6%), federal government employees (1,049 | 21.8%), and state government employees (471 | 9.8%) make up the most common classes of employment.
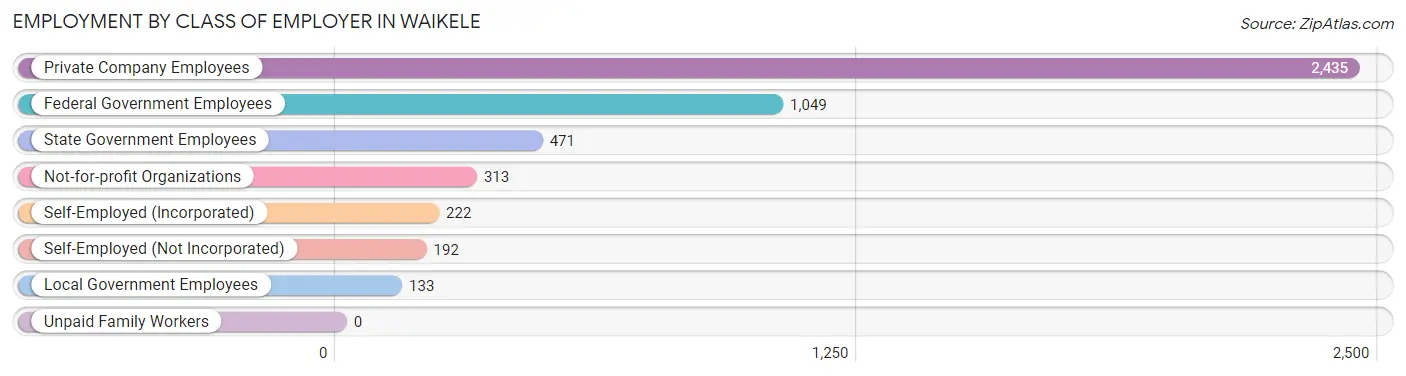
| Employer Class | # Employees | % Employees |
| Private Company Employees | 2,435 | 50.6% |
| Self-Employed (Incorporated) | 222 | 4.6% |
| Self-Employed (Not Incorporated) | 192 | 4.0% |
| Not-for-profit Organizations | 313 | 6.5% |
| Local Government Employees | 133 | 2.8% |
| State Government Employees | 471 | 9.8% |
| Federal Government Employees | 1,049 | 21.8% |
| Unpaid Family Workers | 0 | 0.0% |
| Total | 4,815 | 100.0% |
Employment Status by Age in Waikele
According to the labor force statistics for Waikele, out of the total population over 16 years of age (6,585), 76.9% or 5,064 individuals are in the labor force, with 0.5% or 25 of them unemployed. The age group with the highest labor force participation rate is 35 to 44 years, with 98.1% or 765 individuals in the labor force. Within the labor force, the 60 to 64 years age range has the highest percentage of unemployed individuals, with 3.1% or 12 of them being unemployed.
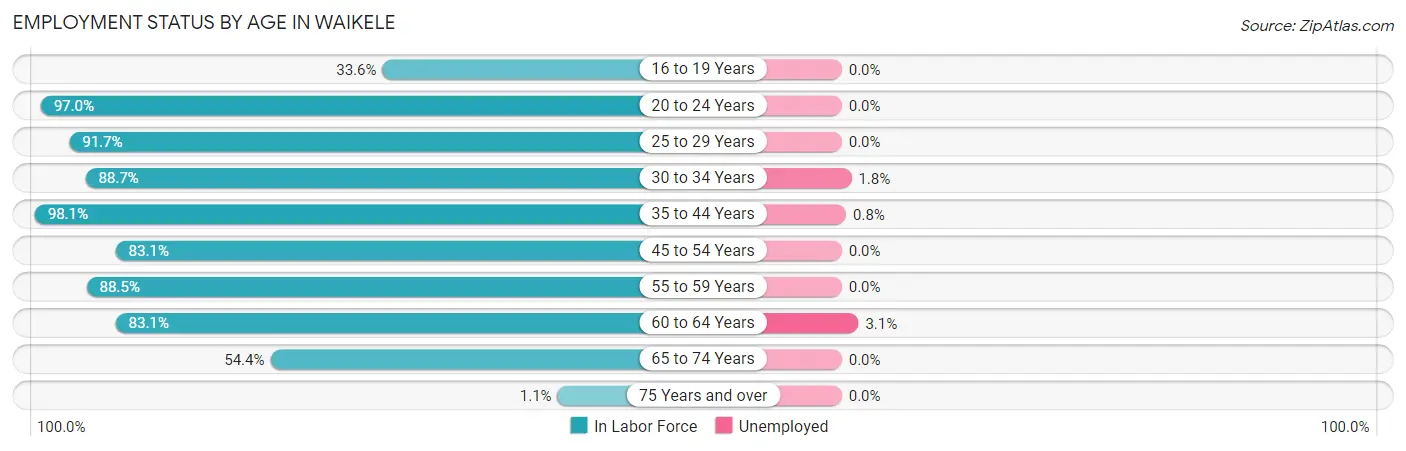
| Age Bracket | In Labor Force | Unemployed |
| 16 to 19 Years | 129 (33.6%) | 0 (0.0%) |
| 20 to 24 Years | 426 (97.0%) | 0 (0.0%) |
| 25 to 29 Years | 853 (91.7%) | 0 (0.0%) |
| 30 to 34 Years | 525 (88.7%) | 9 (1.8%) |
| 35 to 44 Years | 765 (98.1%) | 6 (0.8%) |
| 45 to 54 Years | 1,079 (83.1%) | 0 (0.0%) |
| 55 to 59 Years | 598 (88.5%) | 0 (0.0%) |
| 60 to 64 Years | 388 (83.1%) | 12 (3.1%) |
| 65 to 74 Years | 297 (54.4%) | 0 (0.0%) |
| 75 Years and over | 5 (1.1%) | 0 (0.0%) |
| Total | 5,064 (76.9%) | 25 (0.5%) |
Employment Status by Educational Attainment in Waikele
According to labor force statistics for Waikele, 88.7% of individuals (4,207) out of the total population between 25 and 64 years of age (4,743) are in the labor force, with 0.6% or 25 of them being unemployed. The group with the highest labor force participation rate are those with the educational attainment of bachelor's degree or higher, with 97.1% or 1,767 individuals in the labor force. Within the labor force, individuals with high school diploma education have the highest percentage of unemployment, with 1.5% or 11 of them being unemployed.
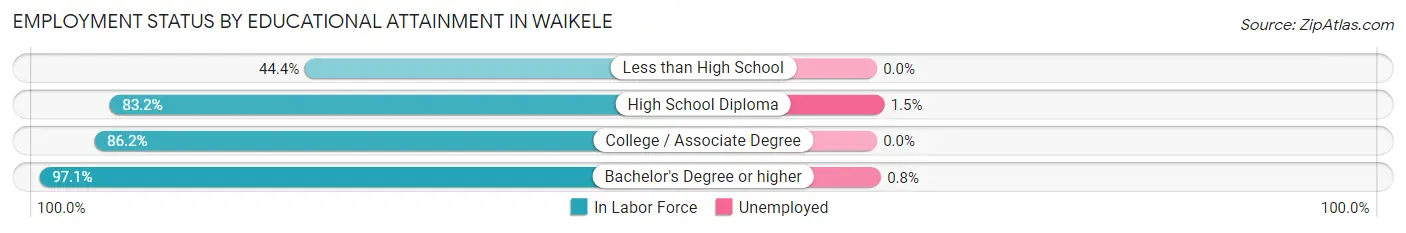
| Educational Attainment | In Labor Force | Unemployed |
| Less than High School | 55 (44.4%) | 0 (0.0%) |
| High School Diploma | 757 (83.2%) | 14 (1.5%) |
| College / Associate Degree | 1,628 (86.2%) | 0 (0.0%) |
| Bachelor's Degree or higher | 1,767 (97.1%) | 15 (0.8%) |
| Total | 4,207 (88.7%) | 28 (0.6%) |
Employment Occupations by Sex in Waikele
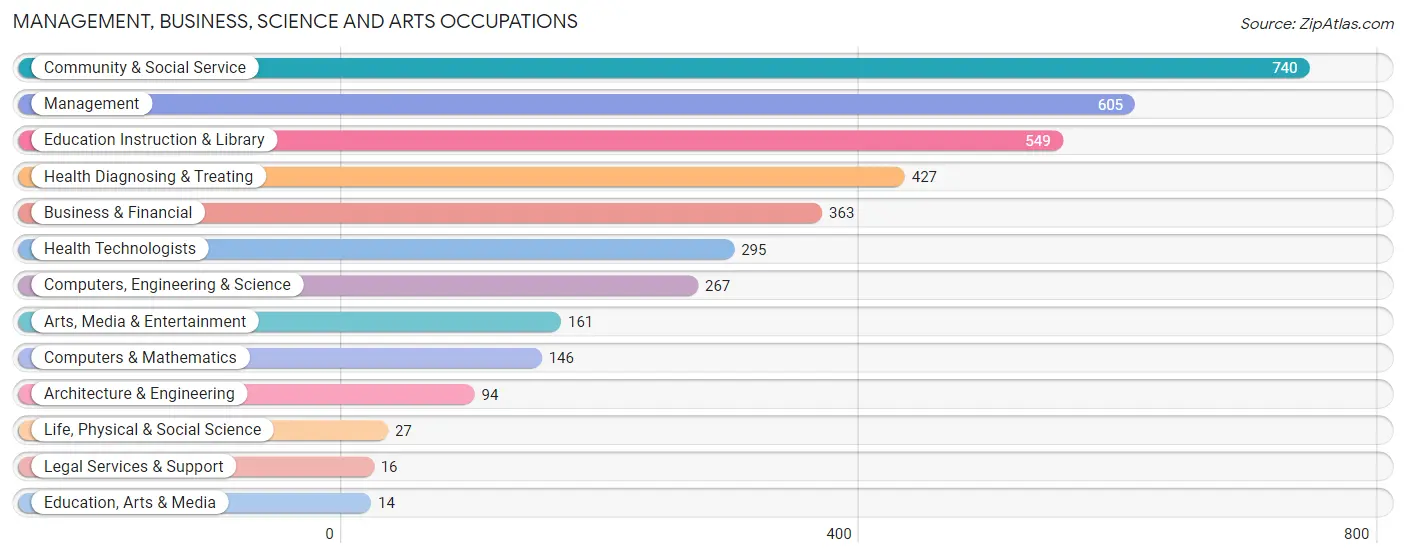
Management, Business, Science and Arts Occupations
The most common Management, Business, Science and Arts occupations in Waikele are Community & Social Service (740 | 16.5%), Management (605 | 13.5%), Education Instruction & Library (549 | 12.2%), Health Diagnosing & Treating (427 | 9.5%), and Business & Financial (363 | 8.1%).
Management, Business, Science and Arts Occupations by Sex
Within the Management, Business, Science and Arts occupations in Waikele, the most male-oriented occupations are Life, Physical & Social Science (100.0%), Education, Arts & Media (100.0%), and Arts, Media & Entertainment (91.9%), while the most female-oriented occupations are Health Diagnosing & Treating (79.9%), Health Technologists (76.9%), and Education Instruction & Library (74.0%).
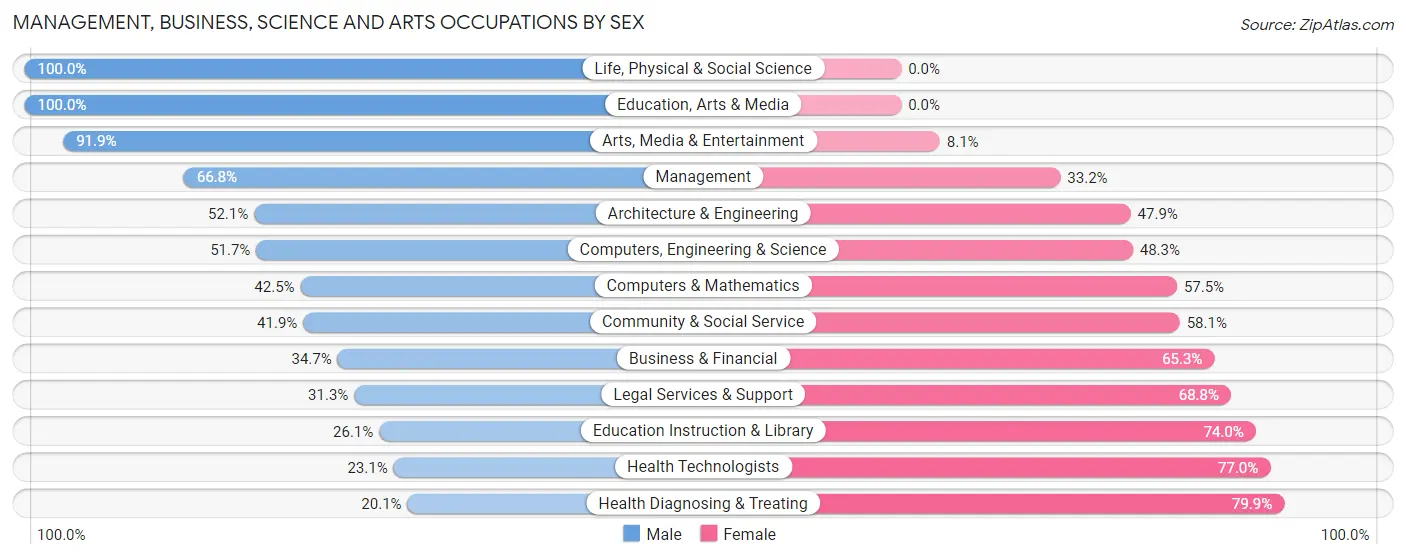
| Occupation | Male | Female |
| Management | 404 (66.8%) | 201 (33.2%) |
| Business & Financial | 126 (34.7%) | 237 (65.3%) |
| Computers, Engineering & Science | 138 (51.7%) | 129 (48.3%) |
| Computers & Mathematics | 62 (42.5%) | 84 (57.5%) |
| Architecture & Engineering | 49 (52.1%) | 45 (47.9%) |
| Life, Physical & Social Science | 27 (100.0%) | 0 (0.0%) |
| Community & Social Service | 310 (41.9%) | 430 (58.1%) |
| Education, Arts & Media | 14 (100.0%) | 0 (0.0%) |
| Legal Services & Support | 5 (31.2%) | 11 (68.8%) |
| Education Instruction & Library | 143 (26.1%) | 406 (74.0%) |
| Arts, Media & Entertainment | 148 (91.9%) | 13 (8.1%) |
| Health Diagnosing & Treating | 86 (20.1%) | 341 (79.9%) |
| Health Technologists | 68 (23.1%) | 227 (76.9%) |
| Total (Category) | 1,064 (44.3%) | 1,338 (55.7%) |
| Total (Overall) | 2,043 (45.6%) | 2,438 (54.4%) |
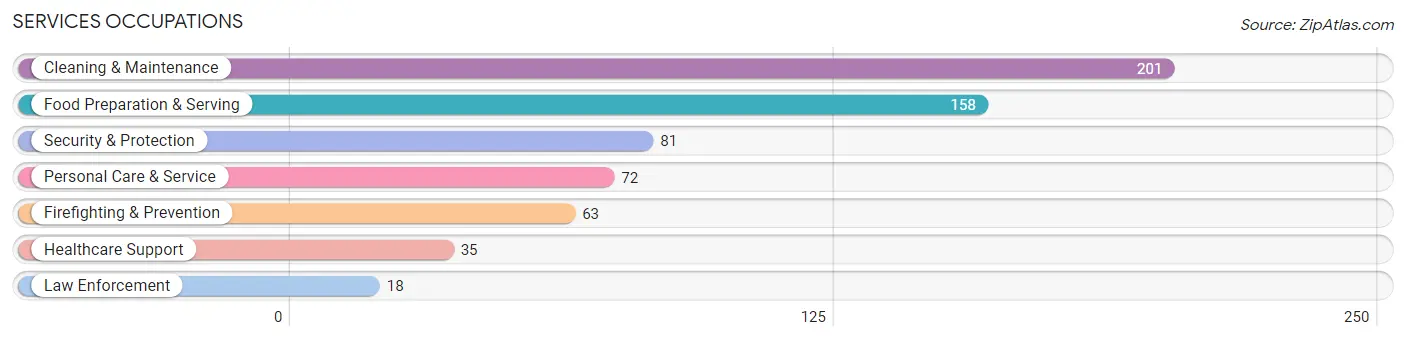
Services Occupations
The most common Services occupations in Waikele are Cleaning & Maintenance (201 | 4.5%), Food Preparation & Serving (158 | 3.5%), Security & Protection (81 | 1.8%), Personal Care & Service (72 | 1.6%), and Firefighting & Prevention (63 | 1.4%).
Services Occupations by Sex
Within the Services occupations in Waikele, the most male-oriented occupations are Security & Protection (100.0%), Firefighting & Prevention (100.0%), and Law Enforcement (100.0%), while the most female-oriented occupations are Healthcare Support (100.0%), Personal Care & Service (81.9%), and Cleaning & Maintenance (69.2%).
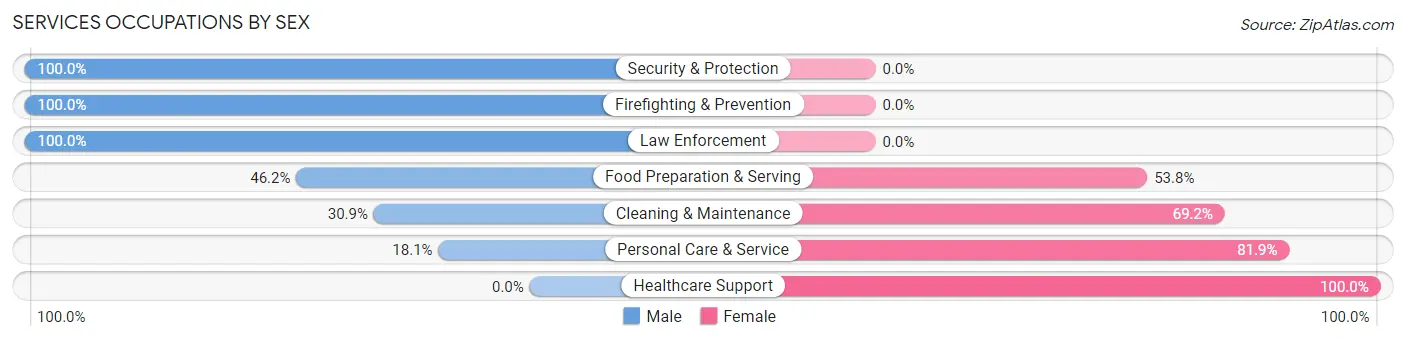
| Occupation | Male | Female |
| Healthcare Support | 0 (0.0%) | 35 (100.0%) |
| Security & Protection | 81 (100.0%) | 0 (0.0%) |
| Firefighting & Prevention | 63 (100.0%) | 0 (0.0%) |
| Law Enforcement | 18 (100.0%) | 0 (0.0%) |
| Food Preparation & Serving | 73 (46.2%) | 85 (53.8%) |
| Cleaning & Maintenance | 62 (30.8%) | 139 (69.2%) |
| Personal Care & Service | 13 (18.1%) | 59 (81.9%) |
| Total (Category) | 229 (41.9%) | 318 (58.1%) |
| Total (Overall) | 2,043 (45.6%) | 2,438 (54.4%) |
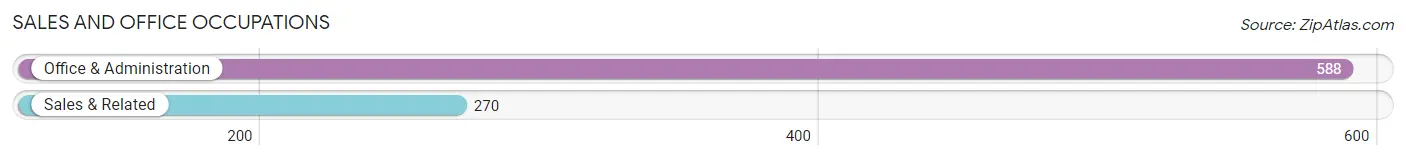
Sales and Office Occupations
The most common Sales and Office occupations in Waikele are Office & Administration (588 | 13.1%), and Sales & Related (270 | 6.0%).
Sales and Office Occupations by Sex
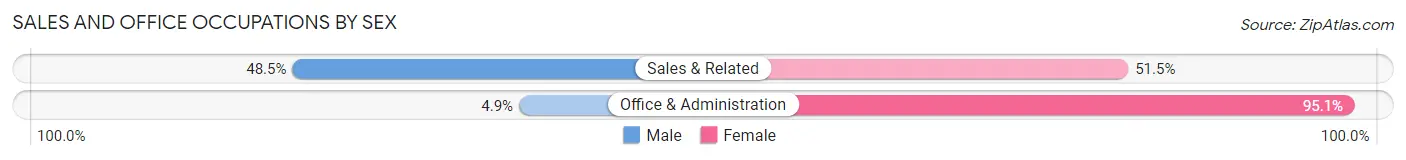
| Occupation | Male | Female |
| Sales & Related | 131 (48.5%) | 139 (51.5%) |
| Office & Administration | 29 (4.9%) | 559 (95.1%) |
| Total (Category) | 160 (18.6%) | 698 (81.4%) |
| Total (Overall) | 2,043 (45.6%) | 2,438 (54.4%) |
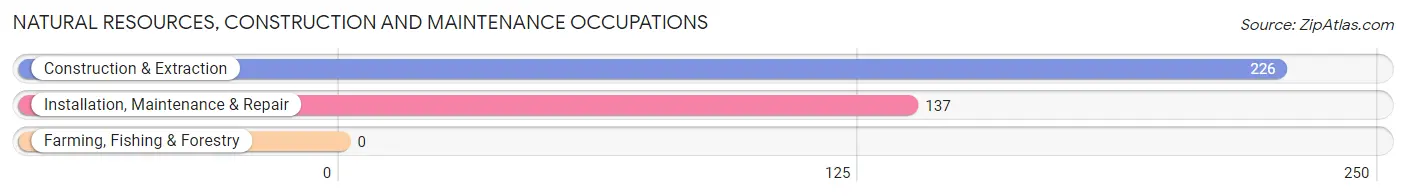
Natural Resources, Construction and Maintenance Occupations
The most common Natural Resources, Construction and Maintenance occupations in Waikele are Construction & Extraction (226 | 5.0%), and Installation, Maintenance & Repair (137 | 3.1%).
Natural Resources, Construction and Maintenance Occupations by Sex
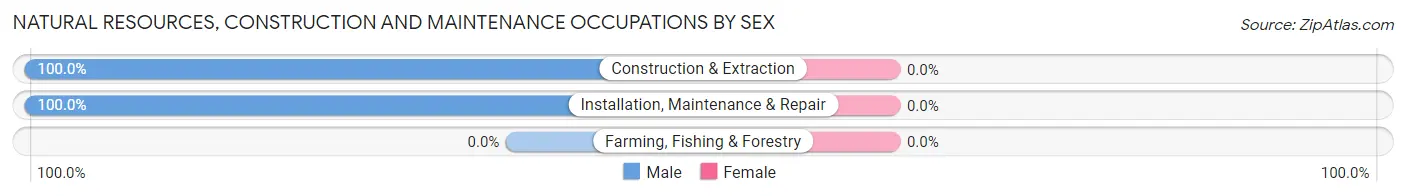
| Occupation | Male | Female |
| Farming, Fishing & Forestry | 0 (0.0%) | 0 (0.0%) |
| Construction & Extraction | 226 (100.0%) | 0 (0.0%) |
| Installation, Maintenance & Repair | 137 (100.0%) | 0 (0.0%) |
| Total (Category) | 363 (100.0%) | 0 (0.0%) |
| Total (Overall) | 2,043 (45.6%) | 2,438 (54.4%) |
Production, Transportation and Moving Occupations
The most common Production, Transportation and Moving occupations in Waikele are Transportation (124 | 2.8%), Material Moving (109 | 2.4%), and Production (78 | 1.7%).
Production, Transportation and Moving Occupations by Sex
| Occupation | Male | Female |
| Production | 15 (19.2%) | 63 (80.8%) |
| Transportation | 103 (83.1%) | 21 (16.9%) |
| Material Moving | 109 (100.0%) | 0 (0.0%) |
| Total (Category) | 227 (73.0%) | 84 (27.0%) |
| Total (Overall) | 2,043 (45.6%) | 2,438 (54.4%) |
Employment Industries by Sex in Waikele
Employment Industries in Waikele
The major employment industries in Waikele include Health Care & Social Assistance (632 | 14.1%), Educational Services (601 | 13.4%), Public Administration (553 | 12.3%), Construction (470 | 10.5%), and Retail Trade (369 | 8.2%).
Employment Industries by Sex in Waikele
The Waikele industries that see more men than women are Utilities (100.0%), Arts, Entertainment & Recreation (100.0%), and Real Estate, Rental & Leasing (81.2%), whereas the industries that tend to have a higher number of women are Finance & Insurance (87.1%), Health Care & Social Assistance (81.8%), and Educational Services (73.5%).
| Industry | Male | Female |
| Agriculture, Fishing & Hunting | 0 (0.0%) | 0 (0.0%) |
| Mining, Quarrying, & Extraction | 0 (0.0%) | 0 (0.0%) |
| Construction | 372 (79.1%) | 98 (20.8%) |
| Manufacturing | 13 (43.3%) | 17 (56.7%) |
| Wholesale Trade | 213 (75.5%) | 69 (24.5%) |
| Retail Trade | 127 (34.4%) | 242 (65.6%) |
| Transportation & Warehousing | 71 (43.0%) | 94 (57.0%) |
| Utilities | 50 (100.0%) | 0 (0.0%) |
| Information | 76 (56.3%) | 59 (43.7%) |
| Finance & Insurance | 23 (12.9%) | 155 (87.1%) |
| Real Estate, Rental & Leasing | 69 (81.2%) | 16 (18.8%) |
| Professional & Scientific | 94 (38.8%) | 148 (61.2%) |
| Enterprise Management | 0 (0.0%) | 0 (0.0%) |
| Administrative & Support | 114 (64.4%) | 63 (35.6%) |
| Educational Services | 159 (26.5%) | 442 (73.5%) |
| Health Care & Social Assistance | 115 (18.2%) | 517 (81.8%) |
| Arts, Entertainment & Recreation | 58 (100.0%) | 0 (0.0%) |
| Accommodation & Food Services | 149 (51.6%) | 140 (48.4%) |
| Public Administration | 198 (35.8%) | 355 (64.2%) |
| Total | 2,043 (45.6%) | 2,438 (54.4%) |
Education in Waikele
School Enrollment in Waikele
The most common levels of schooling among the 1,423 students in Waikele are high school (395 | 27.8%), elementary school (269 | 18.9%), and college / undergraduate (267 | 18.8%).
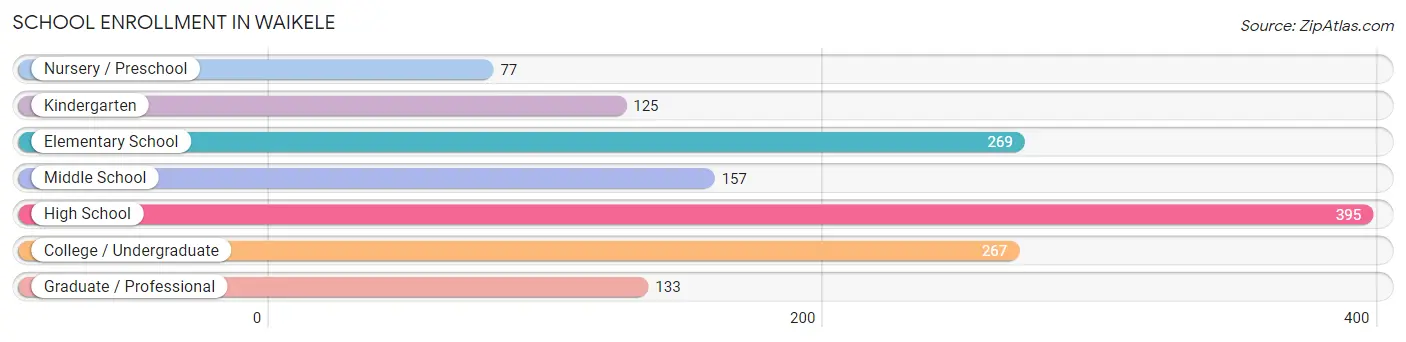
| School Level | # Students | % Students |
| Nursery / Preschool | 77 | 5.4% |
| Kindergarten | 125 | 8.8% |
| Elementary School | 269 | 18.9% |
| Middle School | 157 | 11.0% |
| High School | 395 | 27.8% |
| College / Undergraduate | 267 | 18.8% |
| Graduate / Professional | 133 | 9.3% |
| Total | 1,423 | 100.0% |
School Enrollment by Age by Funding Source in Waikele
Out of a total of 1,423 students who are enrolled in schools in Waikele, 410 (28.8%) attend a private institution, while the remaining 1,013 (71.2%) are enrolled in public schools. The age group of 3 to 4 year olds has the highest likelihood of being enrolled in private schools, with 77 (100.0% in the age bracket) enrolled. Conversely, the age group of 35 years and over has the lowest likelihood of being enrolled in a private school, with 29 (100.0% in the age bracket) attending a public institution.
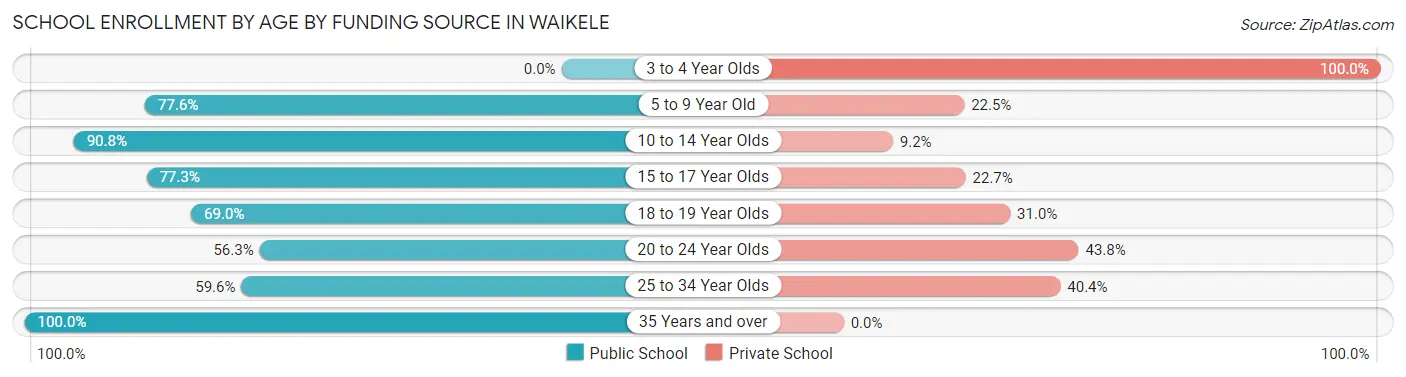
| Age Bracket | Public School | Private School |
| 3 to 4 Year Olds | 0 (0.0%) | 77 (100.0%) |
| 5 to 9 Year Old | 266 (77.5%) | 77 (22.5%) |
| 10 to 14 Year Olds | 238 (90.8%) | 24 (9.2%) |
| 15 to 17 Year Olds | 211 (77.3%) | 62 (22.7%) |
| 18 to 19 Year Olds | 89 (69.0%) | 40 (31.0%) |
| 20 to 24 Year Olds | 81 (56.2%) | 63 (43.8%) |
| 25 to 34 Year Olds | 99 (59.6%) | 67 (40.4%) |
| 35 Years and over | 29 (100.0%) | 0 (0.0%) |
| Total | 1,013 (71.2%) | 410 (28.8%) |
Educational Attainment by Field of Study in Waikele
Business (441 | 20.5%), science & technology (291 | 13.5%), education (234 | 10.9%), social sciences (157 | 7.3%), and engineering (148 | 6.9%) are the most common fields of study among 2,150 individuals in Waikele who have obtained a bachelor's degree or higher.
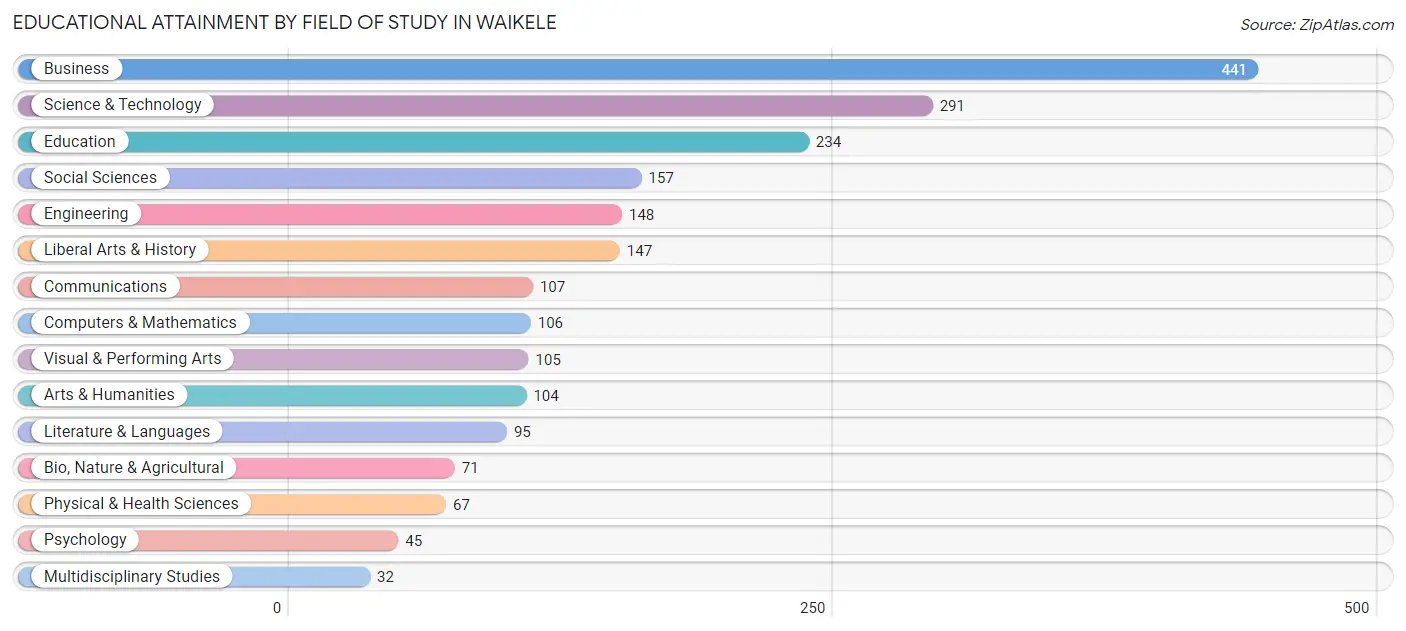
| Field of Study | # Graduates | % Graduates |
| Computers & Mathematics | 106 | 4.9% |
| Bio, Nature & Agricultural | 71 | 3.3% |
| Physical & Health Sciences | 67 | 3.1% |
| Psychology | 45 | 2.1% |
| Social Sciences | 157 | 7.3% |
| Engineering | 148 | 6.9% |
| Multidisciplinary Studies | 32 | 1.5% |
| Science & Technology | 291 | 13.5% |
| Business | 441 | 20.5% |
| Education | 234 | 10.9% |
| Literature & Languages | 95 | 4.4% |
| Liberal Arts & History | 147 | 6.8% |
| Visual & Performing Arts | 105 | 4.9% |
| Communications | 107 | 5.0% |
| Arts & Humanities | 104 | 4.8% |
| Total | 2,150 | 100.0% |
Transportation & Commute in Waikele
Vehicle Availability by Sex in Waikele
The most prevalent vehicle ownership categories in Waikele are males with 2 vehicles (1,156, accounting for 50.3%) and females with 2 vehicles (1,171, making up 46.0%).
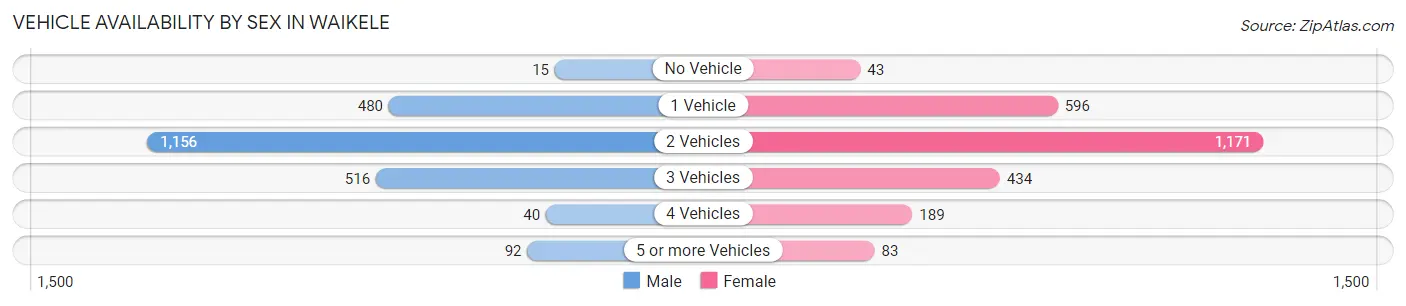
| Vehicles Available | Male | Female |
| No Vehicle | 15 (0.6%) | 43 (1.7%) |
| 1 Vehicle | 480 (20.9%) | 596 (23.7%) |
| 2 Vehicles | 1,156 (50.3%) | 1,171 (46.5%) |
| 3 Vehicles | 516 (22.4%) | 434 (17.2%) |
| 4 Vehicles | 40 (1.7%) | 189 (7.5%) |
| 5 or more Vehicles | 92 (4.0%) | 83 (3.3%) |
| Total | 2,299 (100.0%) | 2,516 (100.0%) |
Commute Time in Waikele
The most frequently occuring commute durations in Waikele are 20 to 24 minutes (1,099 commuters, 24.4%), 30 to 34 minutes (905 commuters, 20.1%), and 45 to 59 minutes (435 commuters, 9.7%).
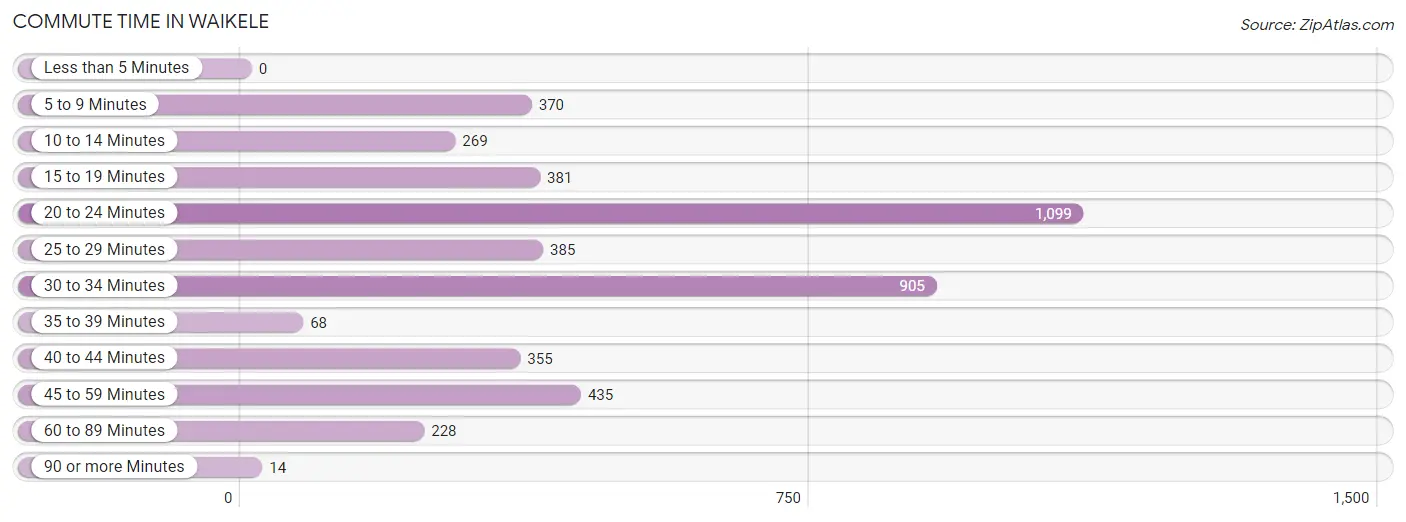
| Commute Time | # Commuters | % Commuters |
| Less than 5 Minutes | 0 | 0.0% |
| 5 to 9 Minutes | 370 | 8.2% |
| 10 to 14 Minutes | 269 | 6.0% |
| 15 to 19 Minutes | 381 | 8.5% |
| 20 to 24 Minutes | 1,099 | 24.4% |
| 25 to 29 Minutes | 385 | 8.5% |
| 30 to 34 Minutes | 905 | 20.1% |
| 35 to 39 Minutes | 68 | 1.5% |
| 40 to 44 Minutes | 355 | 7.9% |
| 45 to 59 Minutes | 435 | 9.7% |
| 60 to 89 Minutes | 228 | 5.1% |
| 90 or more Minutes | 14 | 0.3% |
Commute Time by Sex in Waikele
The most common commute times in Waikele are 30 to 34 minutes (487 commuters, 21.9%) for males and 20 to 24 minutes (632 commuters, 27.7%) for females.
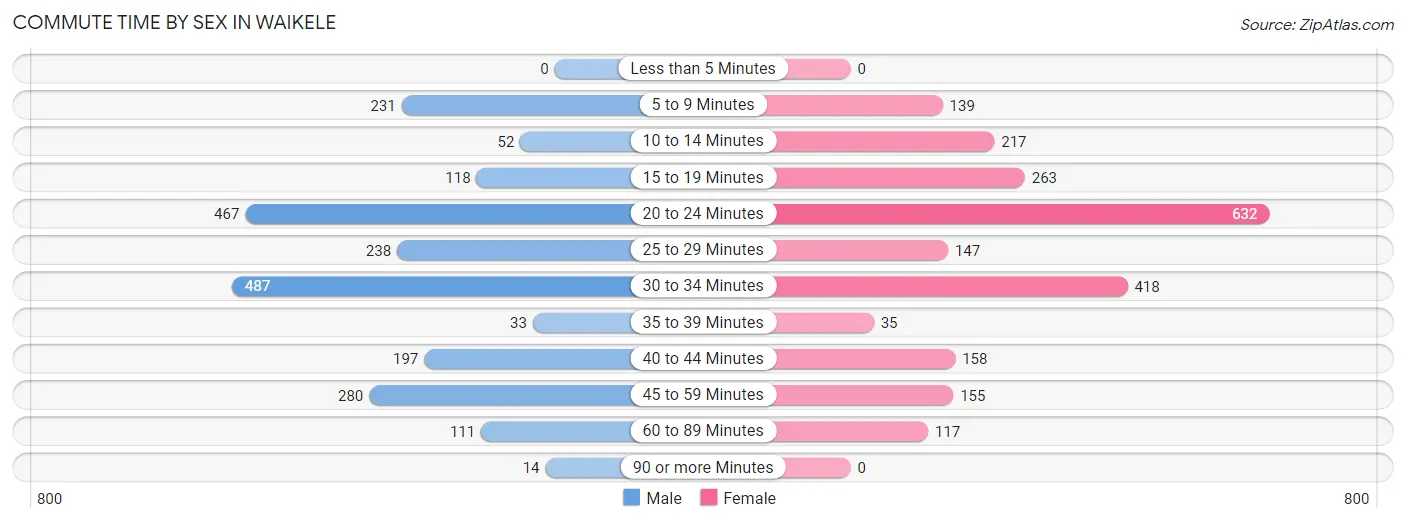
| Commute Time | Male | Female |
| Less than 5 Minutes | 0 (0.0%) | 0 (0.0%) |
| 5 to 9 Minutes | 231 (10.4%) | 139 (6.1%) |
| 10 to 14 Minutes | 52 (2.3%) | 217 (9.5%) |
| 15 to 19 Minutes | 118 (5.3%) | 263 (11.5%) |
| 20 to 24 Minutes | 467 (21.0%) | 632 (27.7%) |
| 25 to 29 Minutes | 238 (10.7%) | 147 (6.4%) |
| 30 to 34 Minutes | 487 (21.9%) | 418 (18.3%) |
| 35 to 39 Minutes | 33 (1.5%) | 35 (1.5%) |
| 40 to 44 Minutes | 197 (8.8%) | 158 (6.9%) |
| 45 to 59 Minutes | 280 (12.6%) | 155 (6.8%) |
| 60 to 89 Minutes | 111 (5.0%) | 117 (5.1%) |
| 90 or more Minutes | 14 (0.6%) | 0 (0.0%) |
Time of Departure to Work by Sex in Waikele
The most frequent times of departure to work in Waikele are 5:30 AM to 5:59 AM (392, 17.6%) for males and 6:00 AM to 6:29 AM (411, 18.0%) for females.
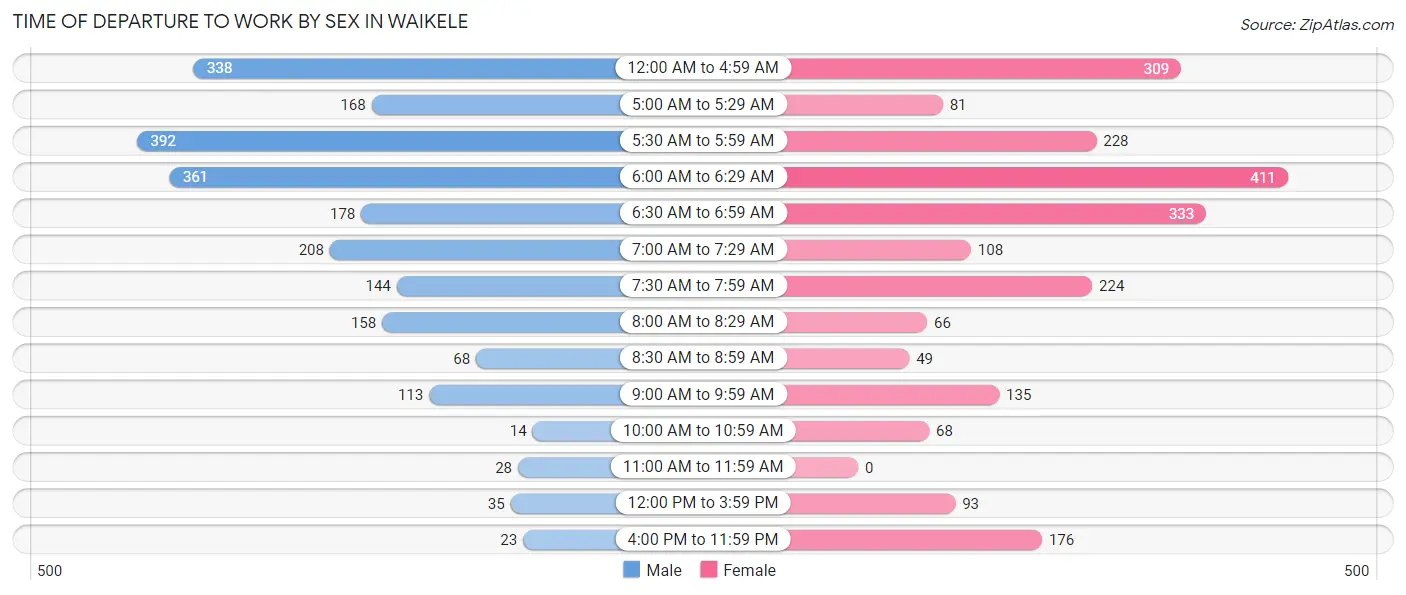
| Time of Departure | Male | Female |
| 12:00 AM to 4:59 AM | 338 (15.2%) | 309 (13.6%) |
| 5:00 AM to 5:29 AM | 168 (7.5%) | 81 (3.5%) |
| 5:30 AM to 5:59 AM | 392 (17.6%) | 228 (10.0%) |
| 6:00 AM to 6:29 AM | 361 (16.2%) | 411 (18.0%) |
| 6:30 AM to 6:59 AM | 178 (8.0%) | 333 (14.6%) |
| 7:00 AM to 7:29 AM | 208 (9.3%) | 108 (4.7%) |
| 7:30 AM to 7:59 AM | 144 (6.5%) | 224 (9.8%) |
| 8:00 AM to 8:29 AM | 158 (7.1%) | 66 (2.9%) |
| 8:30 AM to 8:59 AM | 68 (3.0%) | 49 (2.1%) |
| 9:00 AM to 9:59 AM | 113 (5.1%) | 135 (5.9%) |
| 10:00 AM to 10:59 AM | 14 (0.6%) | 68 (3.0%) |
| 11:00 AM to 11:59 AM | 28 (1.3%) | 0 (0.0%) |
| 12:00 PM to 3:59 PM | 35 (1.6%) | 93 (4.1%) |
| 4:00 PM to 11:59 PM | 23 (1.0%) | 176 (7.7%) |
| Total | 2,228 (100.0%) | 2,281 (100.0%) |
Housing Occupancy in Waikele
Occupancy by Ownership in Waikele
Of the total 2,977 dwellings in Waikele, owner-occupied units account for 2,082 (69.9%), while renter-occupied units make up 895 (30.1%).
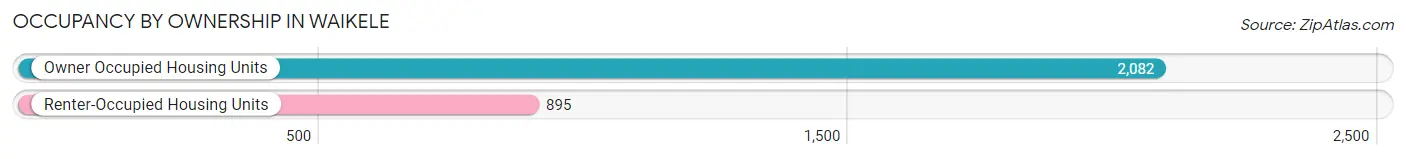
| Occupancy | # Housing Units | % Housing Units |
| Owner Occupied Housing Units | 2,082 | 69.9% |
| Renter-Occupied Housing Units | 895 | 30.1% |
| Total Occupied Housing Units | 2,977 | 100.0% |
Occupancy by Household Size in Waikele
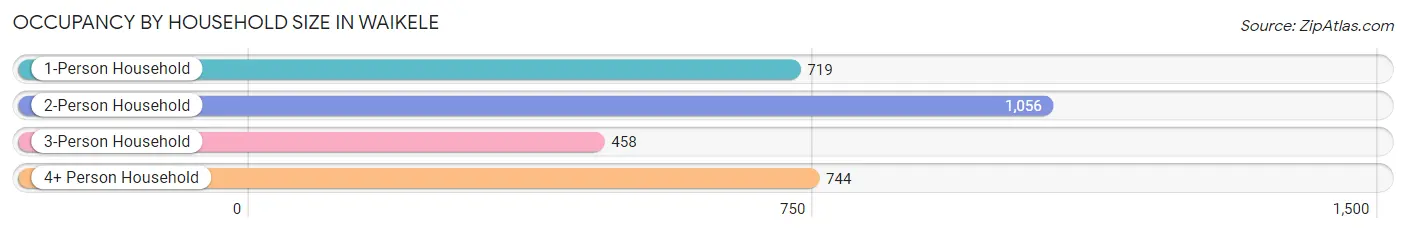
| Household Size | # Housing Units | % Housing Units |
| 1-Person Household | 719 | 24.1% |
| 2-Person Household | 1,056 | 35.5% |
| 3-Person Household | 458 | 15.4% |
| 4+ Person Household | 744 | 25.0% |
| Total Housing Units | 2,977 | 100.0% |
Occupancy by Ownership by Household Size in Waikele
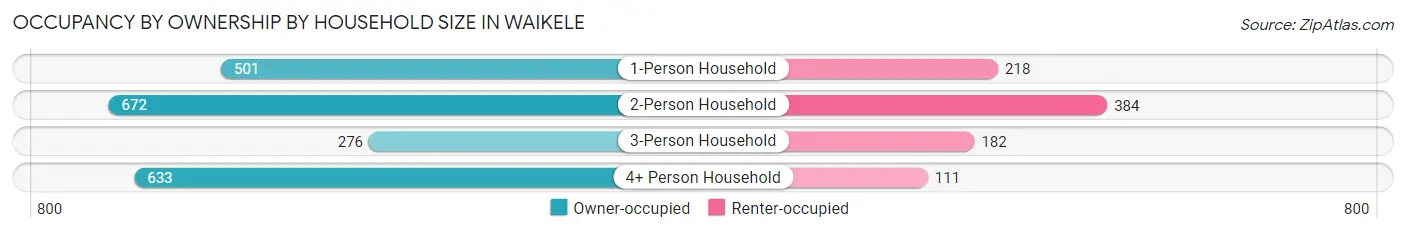
| Household Size | Owner-occupied | Renter-occupied |
| 1-Person Household | 501 (69.7%) | 218 (30.3%) |
| 2-Person Household | 672 (63.6%) | 384 (36.4%) |
| 3-Person Household | 276 (60.3%) | 182 (39.7%) |
| 4+ Person Household | 633 (85.1%) | 111 (14.9%) |
| Total Housing Units | 2,082 (69.9%) | 895 (30.1%) |
Occupancy by Educational Attainment in Waikele
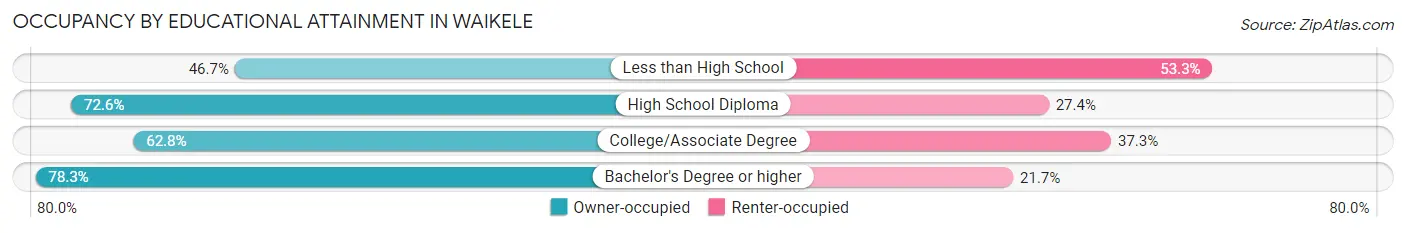
| Household Size | Owner-occupied | Renter-occupied |
| Less than High School | 35 (46.7%) | 40 (53.3%) |
| High School Diploma | 337 (72.6%) | 127 (27.4%) |
| College/Associate Degree | 802 (62.7%) | 476 (37.2%) |
| Bachelor's Degree or higher | 908 (78.3%) | 252 (21.7%) |
Occupancy by Age of Householder in Waikele
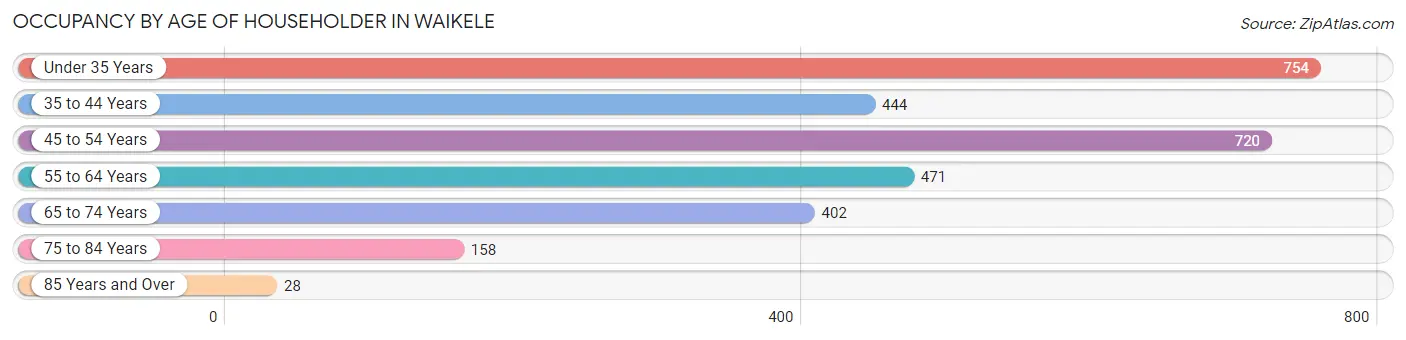
| Age Bracket | # Households | % Households |
| Under 35 Years | 754 | 25.3% |
| 35 to 44 Years | 444 | 14.9% |
| 45 to 54 Years | 720 | 24.2% |
| 55 to 64 Years | 471 | 15.8% |
| 65 to 74 Years | 402 | 13.5% |
| 75 to 84 Years | 158 | 5.3% |
| 85 Years and Over | 28 | 0.9% |
| Total | 2,977 | 100.0% |
Housing Finances in Waikele
Median Income by Occupancy in Waikele
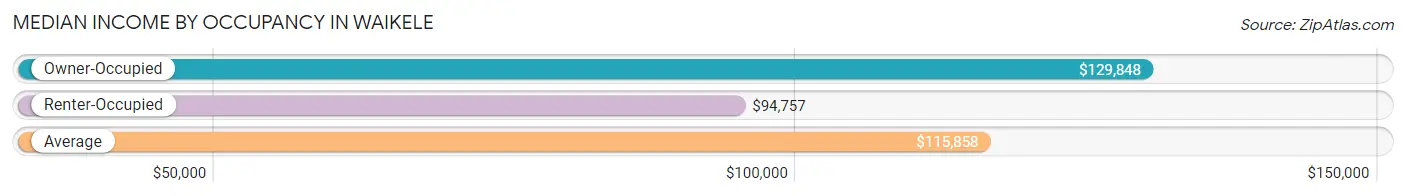
| Occupancy Type | # Households | Median Income |
| Owner-Occupied | 2,082 (69.9%) | $129,848 |
| Renter-Occupied | 895 (30.1%) | $94,757 |
| Average | 2,977 (100.0%) | $115,858 |
Occupancy by Householder Income Bracket in Waikele
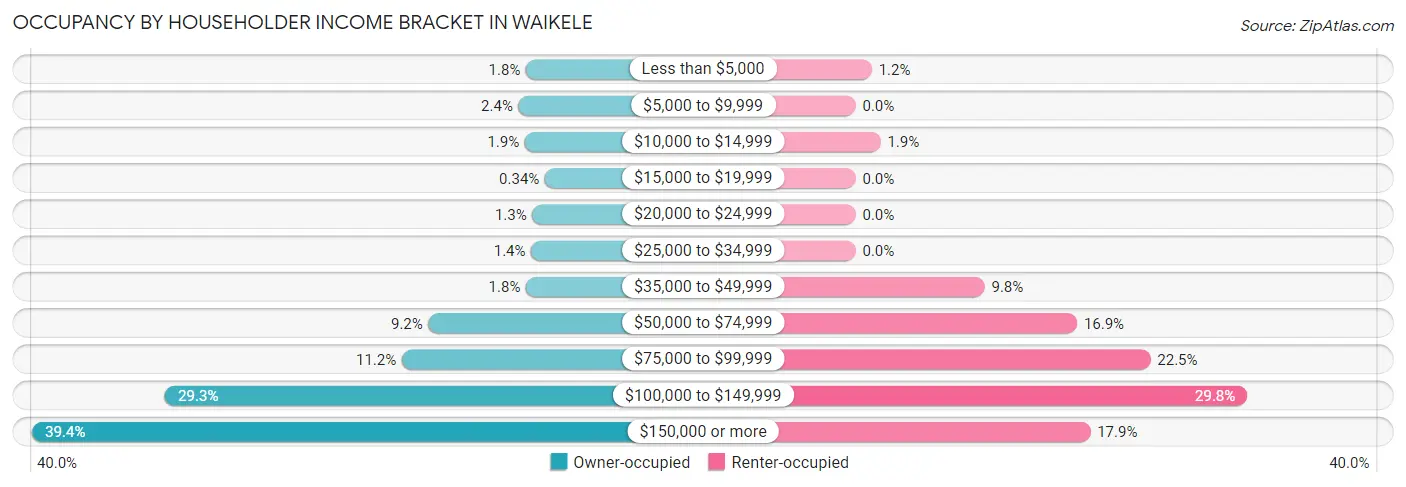
| Income Bracket | Owner-occupied | Renter-occupied |
| Less than $5,000 | 37 (1.8%) | 11 (1.2%) |
| $5,000 to $9,999 | 49 (2.4%) | 0 (0.0%) |
| $10,000 to $14,999 | 39 (1.9%) | 17 (1.9%) |
| $15,000 to $19,999 | 7 (0.3%) | 0 (0.0%) |
| $20,000 to $24,999 | 27 (1.3%) | 0 (0.0%) |
| $25,000 to $34,999 | 29 (1.4%) | 0 (0.0%) |
| $35,000 to $49,999 | 37 (1.8%) | 88 (9.8%) |
| $50,000 to $74,999 | 192 (9.2%) | 151 (16.9%) |
| $75,000 to $99,999 | 234 (11.2%) | 201 (22.5%) |
| $100,000 to $149,999 | 610 (29.3%) | 267 (29.8%) |
| $150,000 or more | 821 (39.4%) | 160 (17.9%) |
| Total | 2,082 (100.0%) | 895 (100.0%) |
Monthly Housing Cost Tiers in Waikele
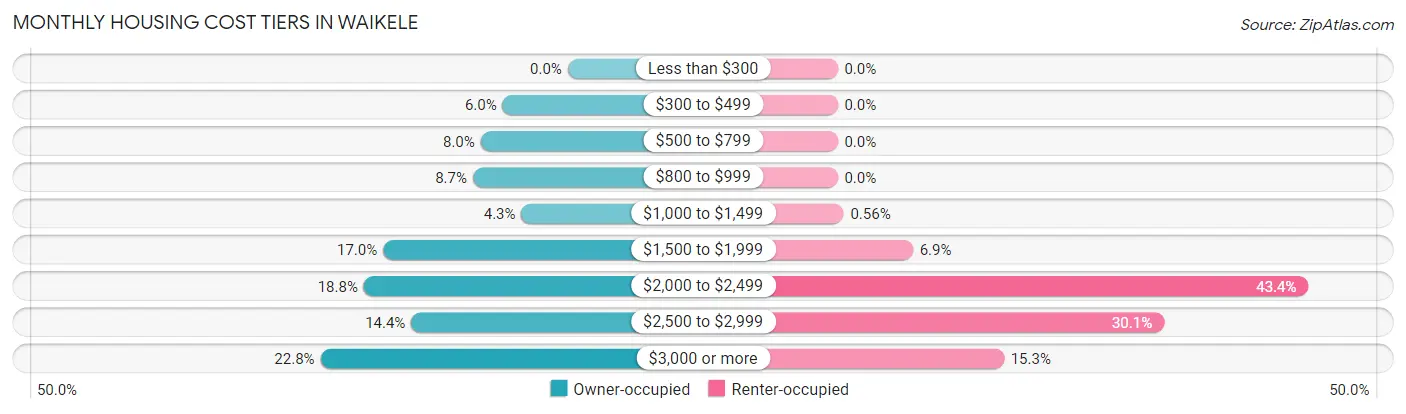
| Monthly Cost | Owner-occupied | Renter-occupied |
| Less than $300 | 0 (0.0%) | 0 (0.0%) |
| $300 to $499 | 125 (6.0%) | 0 (0.0%) |
| $500 to $799 | 167 (8.0%) | 0 (0.0%) |
| $800 to $999 | 182 (8.7%) | 0 (0.0%) |
| $1,000 to $1,499 | 89 (4.3%) | 5 (0.6%) |
| $1,500 to $1,999 | 354 (17.0%) | 62 (6.9%) |
| $2,000 to $2,499 | 391 (18.8%) | 388 (43.3%) |
| $2,500 to $2,999 | 300 (14.4%) | 269 (30.1%) |
| $3,000 or more | 474 (22.8%) | 137 (15.3%) |
| Total | 2,082 (100.0%) | 895 (100.0%) |
Physical Housing Characteristics in Waikele
Housing Structures in Waikele
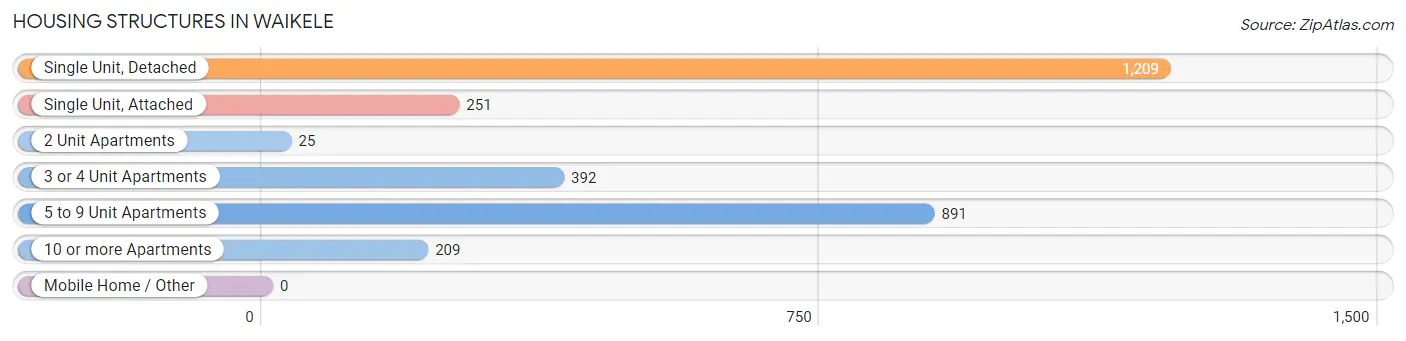
| Structure Type | # Housing Units | % Housing Units |
| Single Unit, Detached | 1,209 | 40.6% |
| Single Unit, Attached | 251 | 8.4% |
| 2 Unit Apartments | 25 | 0.8% |
| 3 or 4 Unit Apartments | 392 | 13.2% |
| 5 to 9 Unit Apartments | 891 | 29.9% |
| 10 or more Apartments | 209 | 7.0% |
| Mobile Home / Other | 0 | 0.0% |
| Total | 2,977 | 100.0% |
Housing Structures by Occupancy in Waikele
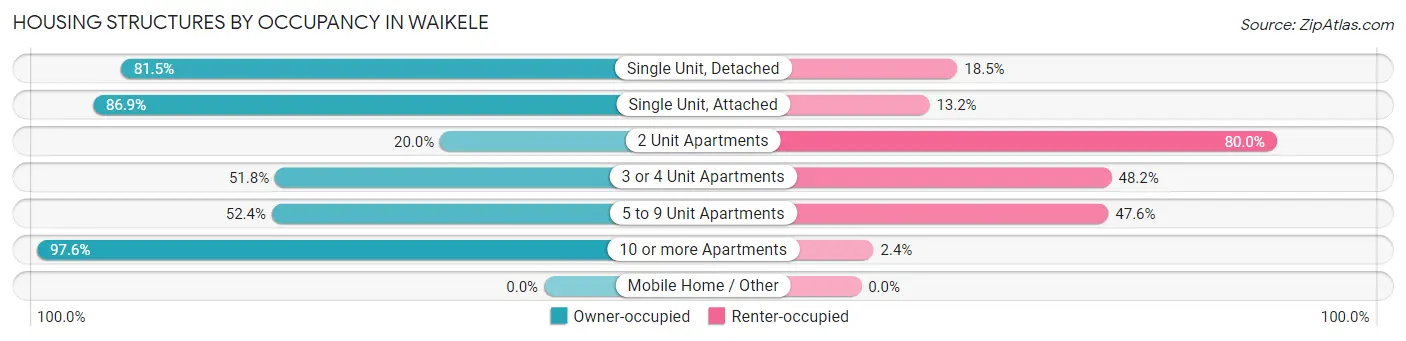
| Structure Type | Owner-occupied | Renter-occupied |
| Single Unit, Detached | 985 (81.5%) | 224 (18.5%) |
| Single Unit, Attached | 218 (86.9%) | 33 (13.2%) |
| 2 Unit Apartments | 5 (20.0%) | 20 (80.0%) |
| 3 or 4 Unit Apartments | 203 (51.8%) | 189 (48.2%) |
| 5 to 9 Unit Apartments | 467 (52.4%) | 424 (47.6%) |
| 10 or more Apartments | 204 (97.6%) | 5 (2.4%) |
| Mobile Home / Other | 0 (0.0%) | 0 (0.0%) |
| Total | 2,082 (69.9%) | 895 (30.1%) |
Housing Structures by Number of Rooms in Waikele
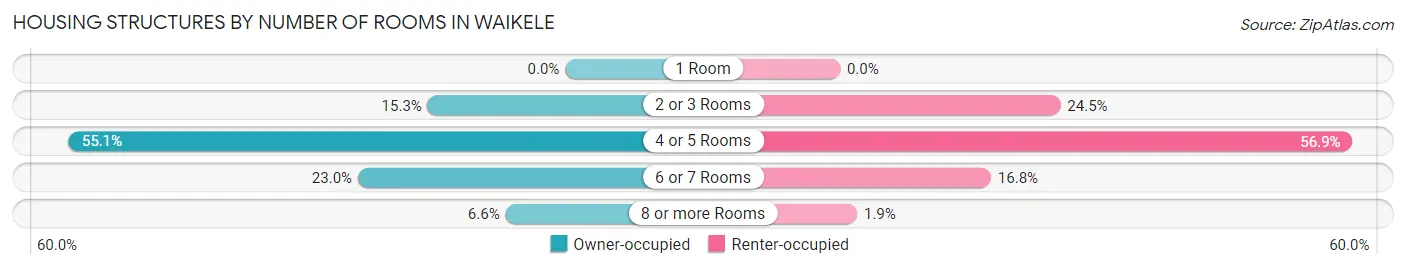
| Number of Rooms | Owner-occupied | Renter-occupied |
| 1 Room | 0 (0.0%) | 0 (0.0%) |
| 2 or 3 Rooms | 318 (15.3%) | 219 (24.5%) |
| 4 or 5 Rooms | 1,147 (55.1%) | 509 (56.9%) |
| 6 or 7 Rooms | 479 (23.0%) | 150 (16.8%) |
| 8 or more Rooms | 138 (6.6%) | 17 (1.9%) |
| Total | 2,082 (100.0%) | 895 (100.0%) |
Housing Structure by Heating Type in Waikele
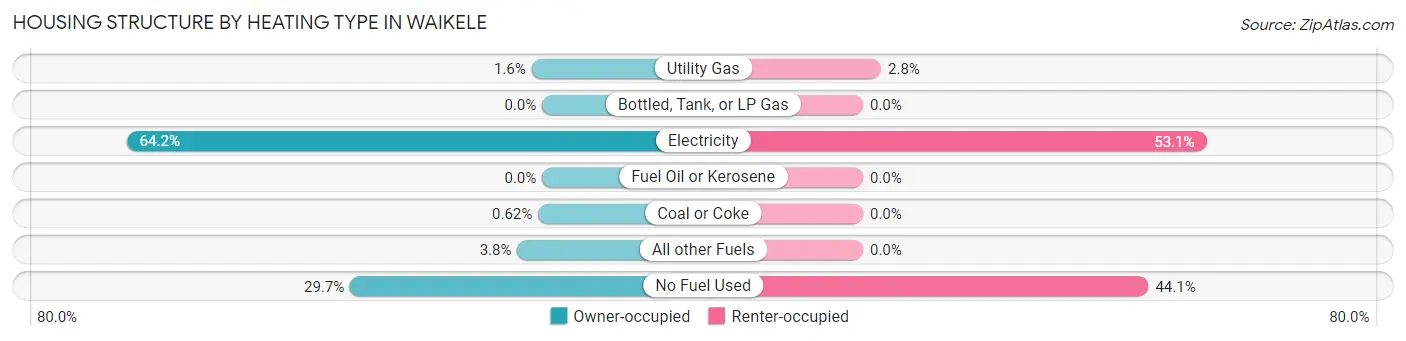
| Heating Type | Owner-occupied | Renter-occupied |
| Utility Gas | 34 (1.6%) | 25 (2.8%) |
| Bottled, Tank, or LP Gas | 0 (0.0%) | 0 (0.0%) |
| Electricity | 1,337 (64.2%) | 475 (53.1%) |
| Fuel Oil or Kerosene | 0 (0.0%) | 0 (0.0%) |
| Coal or Coke | 13 (0.6%) | 0 (0.0%) |
| All other Fuels | 80 (3.8%) | 0 (0.0%) |
| No Fuel Used | 618 (29.7%) | 395 (44.1%) |
| Total | 2,082 (100.0%) | 895 (100.0%) |
Household Vehicle Usage in Waikele
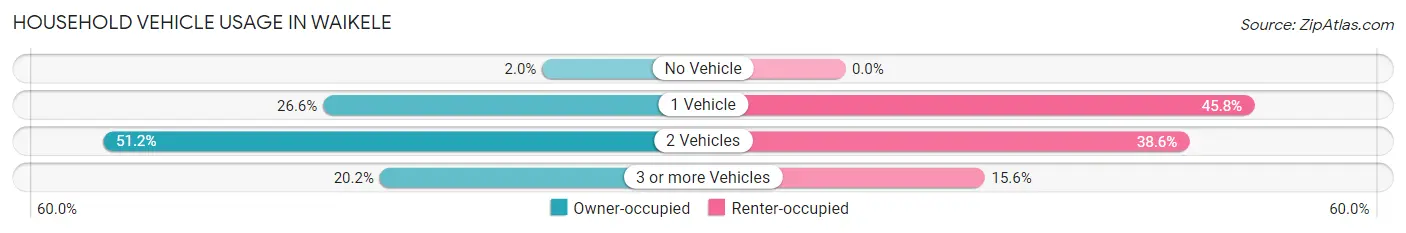
| Vehicles per Household | Owner-occupied | Renter-occupied |
| No Vehicle | 42 (2.0%) | 0 (0.0%) |
| 1 Vehicle | 553 (26.6%) | 410 (45.8%) |
| 2 Vehicles | 1,066 (51.2%) | 345 (38.6%) |
| 3 or more Vehicles | 421 (20.2%) | 140 (15.6%) |
| Total | 2,082 (100.0%) | 895 (100.0%) |
Real Estate & Mortgages in Waikele
Real Estate and Mortgage Overview in Waikele
| Characteristic | Without Mortgage | With Mortgage |
| Housing Units | 425 | 1,657 |
| Median Property Value | $657,000 | $686,400 |
| Median Household Income | $138,345 | $633 |
| Monthly Housing Costs | $727 | $474 |
| Real Estate Taxes | $1,426 | $182 |
Property Value by Mortgage Status in Waikele
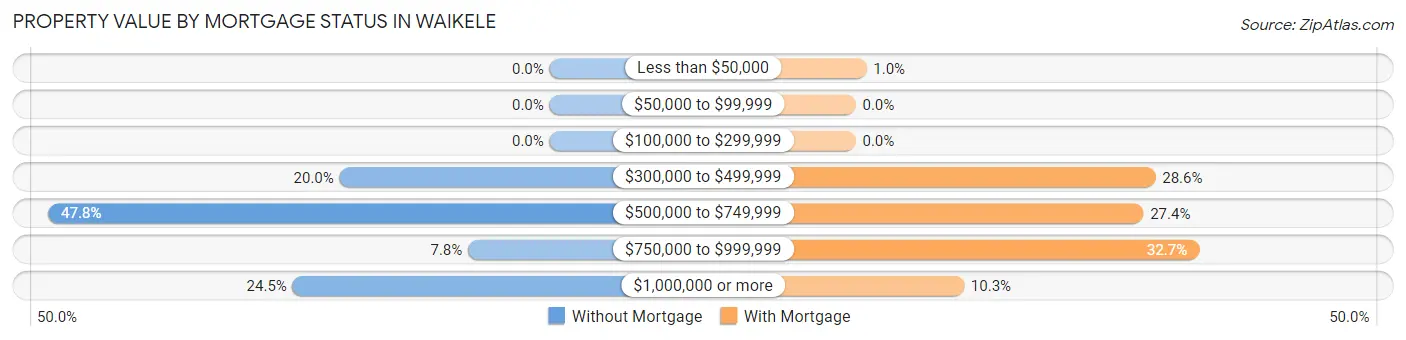
| Property Value | Without Mortgage | With Mortgage |
| Less than $50,000 | 0 (0.0%) | 17 (1.0%) |
| $50,000 to $99,999 | 0 (0.0%) | 0 (0.0%) |
| $100,000 to $299,999 | 0 (0.0%) | 0 (0.0%) |
| $300,000 to $499,999 | 85 (20.0%) | 473 (28.5%) |
| $500,000 to $749,999 | 203 (47.8%) | 454 (27.4%) |
| $750,000 to $999,999 | 33 (7.8%) | 542 (32.7%) |
| $1,000,000 or more | 104 (24.5%) | 171 (10.3%) |
| Total | 425 (100.0%) | 1,657 (100.0%) |
Household Income by Mortgage Status in Waikele
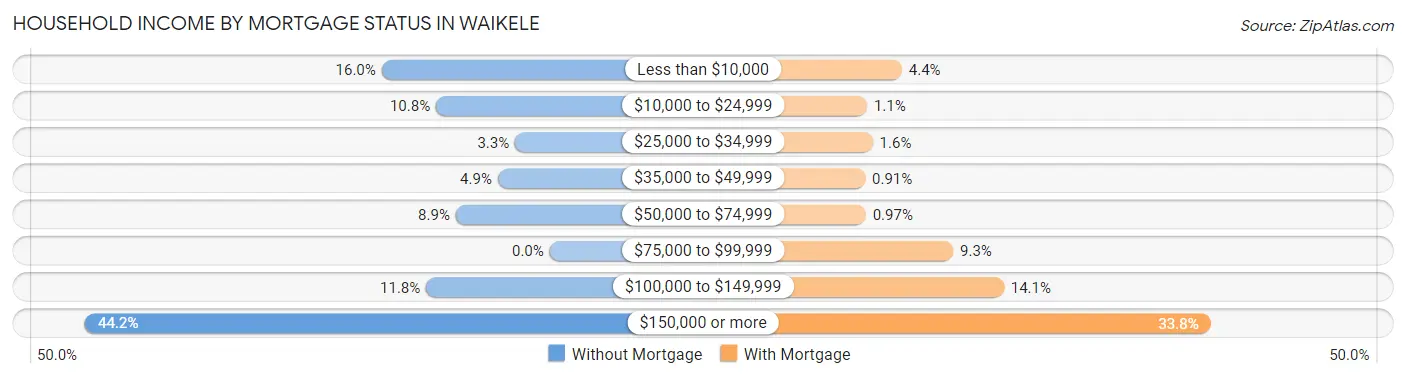
| Household Income | Without Mortgage | With Mortgage |
| Less than $10,000 | 68 (16.0%) | 73 (4.4%) |
| $10,000 to $24,999 | 46 (10.8%) | 18 (1.1%) |
| $25,000 to $34,999 | 14 (3.3%) | 27 (1.6%) |
| $35,000 to $49,999 | 21 (4.9%) | 15 (0.9%) |
| $50,000 to $74,999 | 38 (8.9%) | 16 (1.0%) |
| $75,000 to $99,999 | 0 (0.0%) | 154 (9.3%) |
| $100,000 to $149,999 | 50 (11.8%) | 234 (14.1%) |
| $150,000 or more | 188 (44.2%) | 560 (33.8%) |
| Total | 425 (100.0%) | 1,657 (100.0%) |
Property Value to Household Income Ratio in Waikele
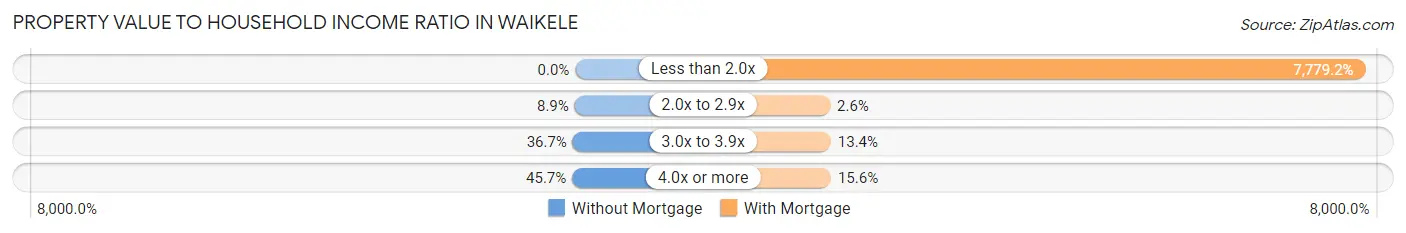
| Value-to-Income Ratio | Without Mortgage | With Mortgage |
| Less than 2.0x | 0 (0.0%) | 128,902 (7,779.2%) |
| 2.0x to 2.9x | 38 (8.9%) | 43 (2.6%) |
| 3.0x to 3.9x | 156 (36.7%) | 222 (13.4%) |
| 4.0x or more | 194 (45.7%) | 259 (15.6%) |
| Total | 425 (100.0%) | 1,657 (100.0%) |
Real Estate Taxes by Mortgage Status in Waikele
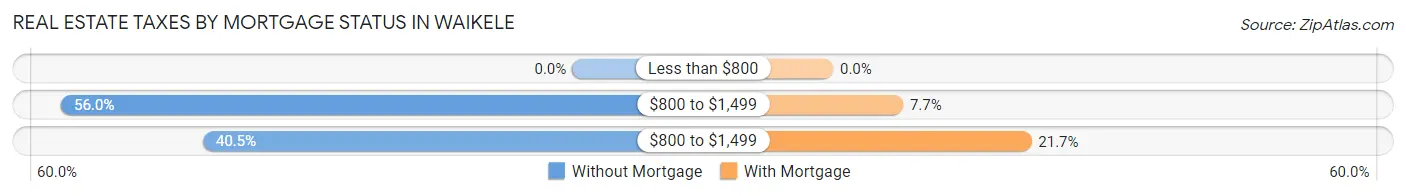
| Property Taxes | Without Mortgage | With Mortgage |
| Less than $800 | 0 (0.0%) | 0 (0.0%) |
| $800 to $1,499 | 238 (56.0%) | 127 (7.7%) |
| $800 to $1,499 | 172 (40.5%) | 360 (21.7%) |
| Total | 425 (100.0%) | 1,657 (100.0%) |
Health & Disability in Waikele
Health Insurance Coverage by Age in Waikele
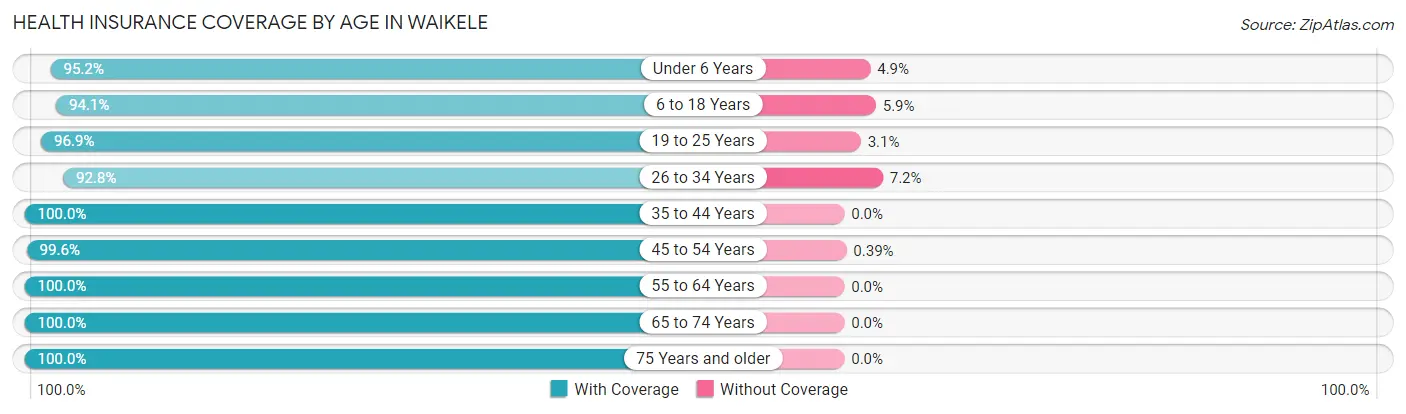
| Age Bracket | With Coverage | Without Coverage |
| Under 6 Years | 353 (95.2%) | 18 (4.9%) |
| 6 to 18 Years | 802 (94.1%) | 50 (5.9%) |
| 19 to 25 Years | 537 (96.9%) | 17 (3.1%) |
| 26 to 34 Years | 1,022 (92.8%) | 79 (7.2%) |
| 35 to 44 Years | 667 (100.0%) | 0 (0.0%) |
| 45 to 54 Years | 1,278 (99.6%) | 5 (0.4%) |
| 55 to 64 Years | 1,143 (100.0%) | 0 (0.0%) |
| 65 to 74 Years | 546 (100.0%) | 0 (0.0%) |
| 75 Years and older | 473 (100.0%) | 0 (0.0%) |
| Total | 6,821 (97.6%) | 169 (2.4%) |
Health Insurance Coverage by Citizenship Status in Waikele
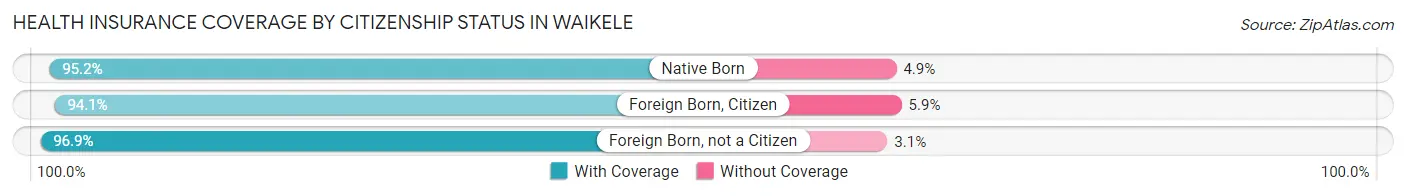
| Citizenship Status | With Coverage | Without Coverage |
| Native Born | 353 (95.2%) | 18 (4.9%) |
| Foreign Born, Citizen | 802 (94.1%) | 50 (5.9%) |
| Foreign Born, not a Citizen | 537 (96.9%) | 17 (3.1%) |
Health Insurance Coverage by Household Income in Waikele
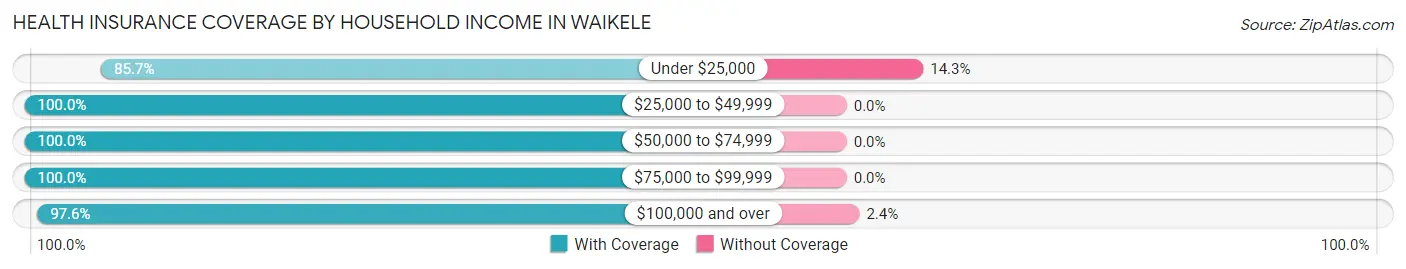
| Household Income | With Coverage | Without Coverage |
| Under $25,000 | 269 (85.7%) | 45 (14.3%) |
| $25,000 to $49,999 | 235 (100.0%) | 0 (0.0%) |
| $50,000 to $74,999 | 513 (100.0%) | 0 (0.0%) |
| $75,000 to $99,999 | 706 (100.0%) | 0 (0.0%) |
| $100,000 and over | 5,098 (97.6%) | 124 (2.4%) |
Public vs Private Health Insurance Coverage by Age in Waikele
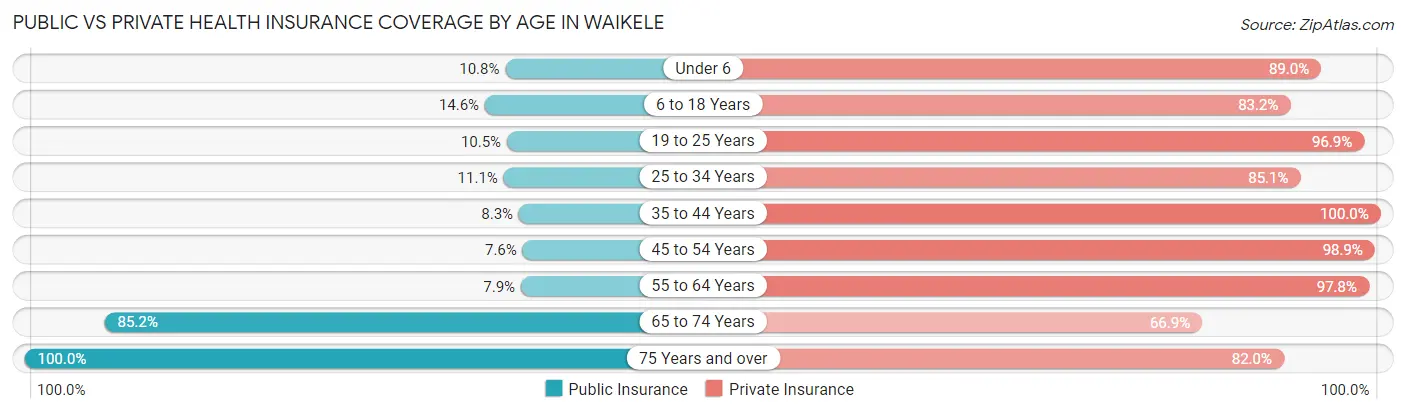
| Age Bracket | Public Insurance | Private Insurance |
| Under 6 | 40 (10.8%) | 330 (88.9%) |
| 6 to 18 Years | 124 (14.5%) | 709 (83.2%) |
| 19 to 25 Years | 58 (10.5%) | 537 (96.9%) |
| 25 to 34 Years | 122 (11.1%) | 937 (85.1%) |
| 35 to 44 Years | 55 (8.3%) | 667 (100.0%) |
| 45 to 54 Years | 97 (7.6%) | 1,269 (98.9%) |
| 55 to 64 Years | 90 (7.9%) | 1,118 (97.8%) |
| 65 to 74 Years | 465 (85.2%) | 365 (66.8%) |
| 75 Years and over | 473 (100.0%) | 388 (82.0%) |
| Total | 1,524 (21.8%) | 6,320 (90.4%) |
Disability Status by Sex by Age in Waikele
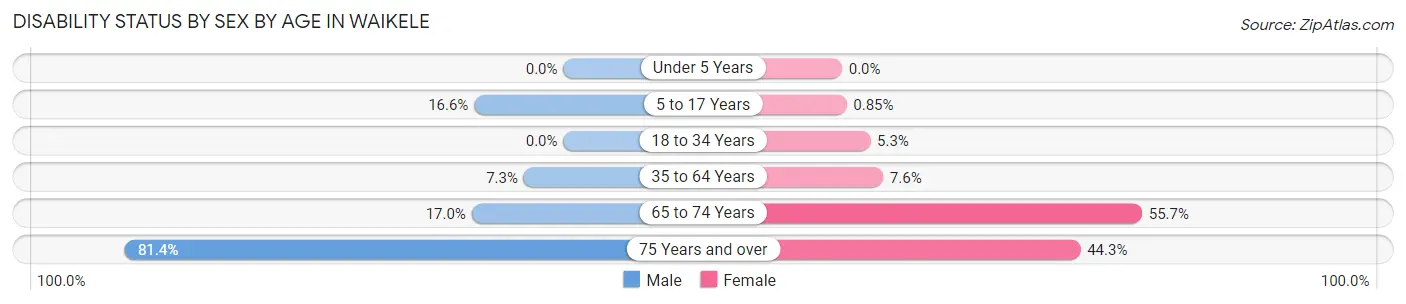
| Age Bracket | Male | Female |
| Under 5 Years | 0 (0.0%) | 0 (0.0%) |
| 5 to 17 Years | 48 (16.6%) | 5 (0.9%) |
| 18 to 34 Years | 0 (0.0%) | 47 (5.2%) |
| 35 to 64 Years | 100 (7.3%) | 132 (7.6%) |
| 65 to 74 Years | 33 (17.0%) | 196 (55.7%) |
| 75 Years and over | 144 (81.4%) | 131 (44.3%) |
Disability Class by Sex by Age in Waikele
Disability Class: Hearing Difficulty
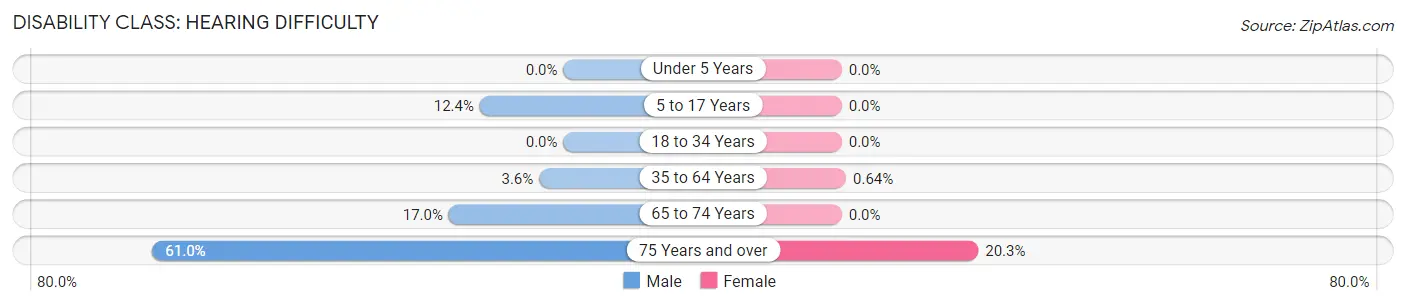
| Age Bracket | Male | Female |
| Under 5 Years | 0 (0.0%) | 0 (0.0%) |
| 5 to 17 Years | 36 (12.4%) | 0 (0.0%) |
| 18 to 34 Years | 0 (0.0%) | 0 (0.0%) |
| 35 to 64 Years | 49 (3.6%) | 11 (0.6%) |
| 65 to 74 Years | 33 (17.0%) | 0 (0.0%) |
| 75 Years and over | 108 (61.0%) | 60 (20.3%) |
Disability Class: Vision Difficulty
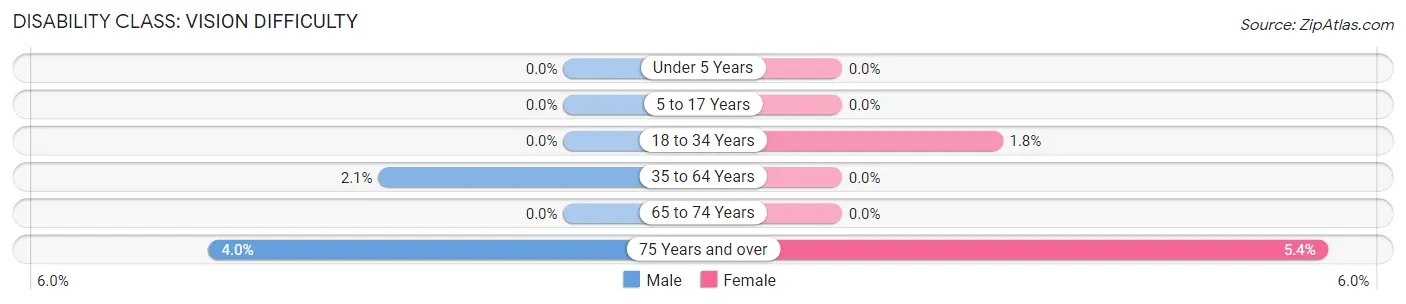
| Age Bracket | Male | Female |
| Under 5 Years | 0 (0.0%) | 0 (0.0%) |
| 5 to 17 Years | 0 (0.0%) | 0 (0.0%) |
| 18 to 34 Years | 0 (0.0%) | 16 (1.8%) |
| 35 to 64 Years | 28 (2.1%) | 0 (0.0%) |
| 65 to 74 Years | 0 (0.0%) | 0 (0.0%) |
| 75 Years and over | 7 (4.0%) | 16 (5.4%) |
Disability Class: Cognitive Difficulty
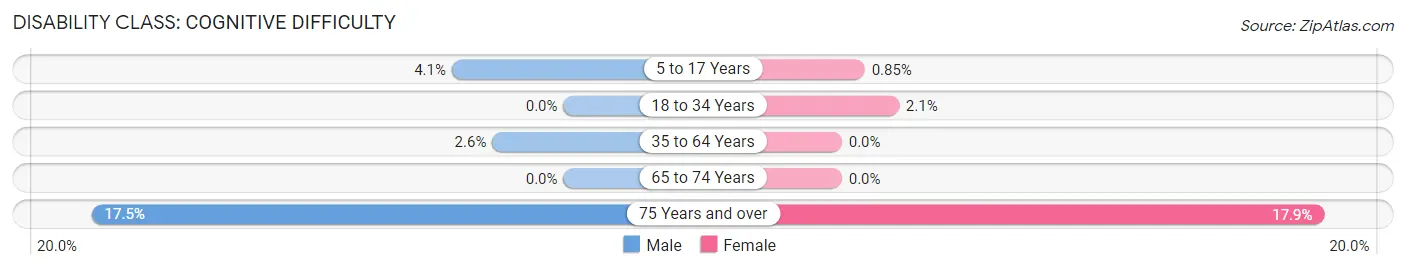
| Age Bracket | Male | Female |
| 5 to 17 Years | 12 (4.1%) | 5 (0.9%) |
| 18 to 34 Years | 0 (0.0%) | 19 (2.1%) |
| 35 to 64 Years | 36 (2.6%) | 0 (0.0%) |
| 65 to 74 Years | 0 (0.0%) | 0 (0.0%) |
| 75 Years and over | 31 (17.5%) | 53 (17.9%) |
Disability Class: Ambulatory Difficulty
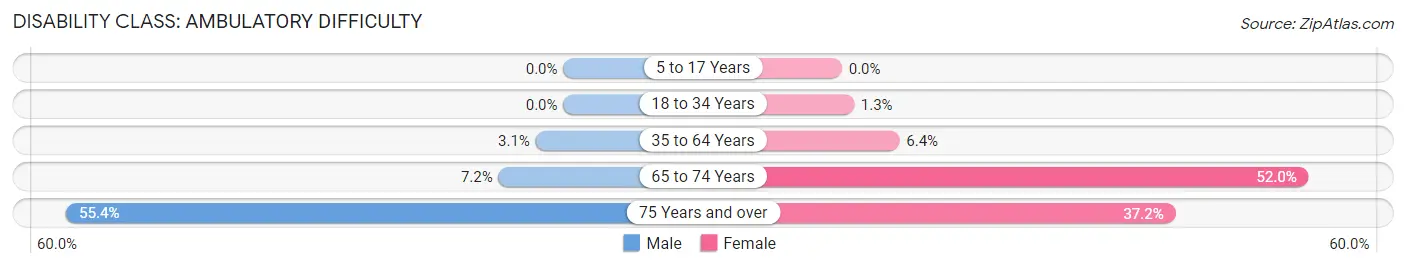
| Age Bracket | Male | Female |
| 5 to 17 Years | 0 (0.0%) | 0 (0.0%) |
| 18 to 34 Years | 0 (0.0%) | 12 (1.3%) |
| 35 to 64 Years | 42 (3.1%) | 111 (6.4%) |
| 65 to 74 Years | 14 (7.2%) | 183 (52.0%) |
| 75 Years and over | 98 (55.4%) | 110 (37.2%) |
Disability Class: Self-Care Difficulty
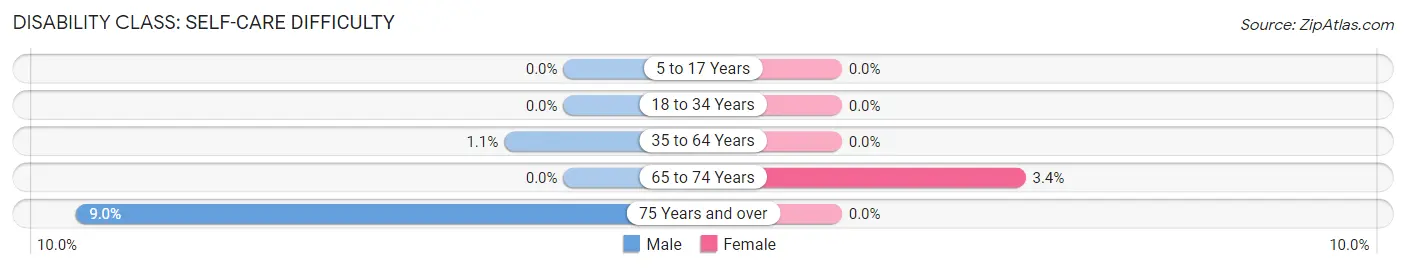
| Age Bracket | Male | Female |
| 5 to 17 Years | 0 (0.0%) | 0 (0.0%) |
| 18 to 34 Years | 0 (0.0%) | 0 (0.0%) |
| 35 to 64 Years | 15 (1.1%) | 0 (0.0%) |
| 65 to 74 Years | 0 (0.0%) | 12 (3.4%) |
| 75 Years and over | 16 (9.0%) | 0 (0.0%) |
Technology Access in Waikele
Computing Device Access in Waikele
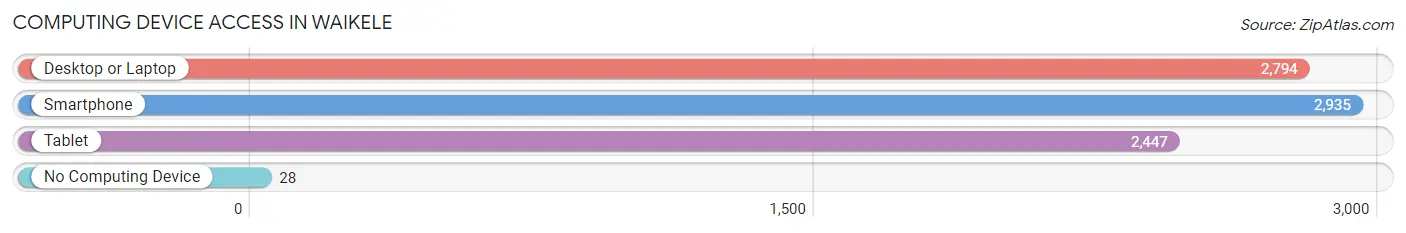
| Device Type | # Households | % Households |
| Desktop or Laptop | 2,794 | 93.9% |
| Smartphone | 2,935 | 98.6% |
| Tablet | 2,447 | 82.2% |
| No Computing Device | 28 | 0.9% |
| Total | 2,977 | 100.0% |
Internet Access in Waikele
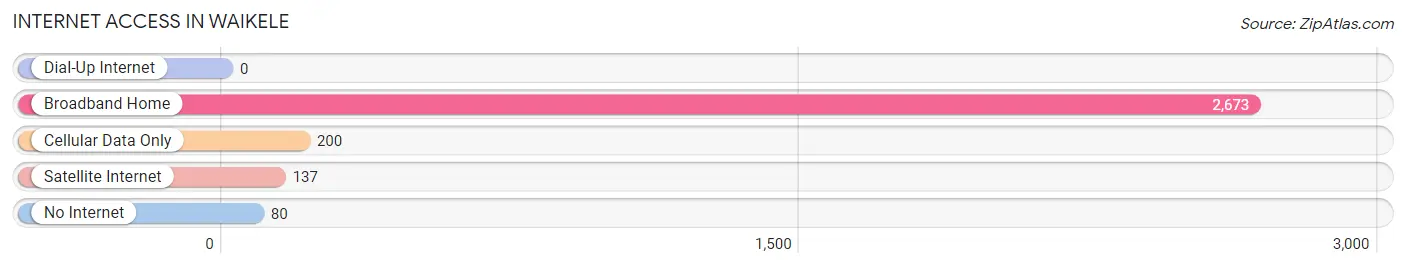
| Internet Type | # Households | % Households |
| Dial-Up Internet | 0 | 0.0% |
| Broadband Home | 2,673 | 89.8% |
| Cellular Data Only | 200 | 6.7% |
| Satellite Internet | 137 | 4.6% |
| No Internet | 80 | 2.7% |
| Total | 2,977 | 100.0% |
Waikele Summary
Waikele is a census-designated place (CDP) located in the City and County of Honolulu, Hawaii, United States. As of the 2010 census, the CDP had a population of 4,914.
Geography
Waikele is located at 21°24'17" North, 158°1'7" West (21.404722, -158.018611). It is bordered to the north by Waipahu, to the east by Waipio, to the south by Pearl City, and to the west by Waipio Acres.
The total area of Waikele is 1.3 square miles (3.4 km2), of which 0.9 square miles (2.3 km2) is land and 0.4 square miles (1.1 km2) is water.
History
Waikele was originally part of the ahupuaa of Waipio, which was part of the larger ahupuaa of Waipahu. The area was first settled by Native Hawaiians in the late 1700s. In the early 1800s, the area was used for agricultural purposes, primarily for growing taro and sweet potatoes.
In the late 1800s, the area was developed by the Waikele Sugar Company, which was founded in 1891. The company built a sugar mill and a railroad line to transport the sugar to Honolulu. The company also built a number of homes for its workers.
In the early 1900s, the area was developed further by the Waikele Development Company, which built a number of homes and businesses. The area was annexed by the City and County of Honolulu in 1959.
Economy
Waikele is primarily a residential area, with a few small businesses. The main employers in the area are the Waikele Shopping Center, the Waikele Golf Course, and the Waikele Country Club.
Demographics
As of the 2010 census, there were 4,914 people, 1,717 households, and 1,323 families residing in the CDP. The population density was 3,741.3 people per square mile (1,444.2/km2). There were 1,845 housing units at an average density of 1,420.7 per square mile (548.7/km2). The racial makeup of the CDP was 44.2% White, 4.2% African American, 0.3% Native American, 28.2% Asian, 8.2% Pacific Islander, 0.7% from other races, and 14.0% from two or more races. Hispanic or Latino of any race were 11.2% of the population.
There were 1,717 households, out of which 33.2% had children under the age of 18 living with them, 57.2% were married couples living together, 11.2% had a female householder with no husband present, and 26.2% were non-families. 19.7% of all households were made up of individuals, and 5.2% had someone living alone who was 65 years of age or older. The average household size was 2.86 and the average family size was 3.30.
In the CDP, the population was spread out, with 24.2% under the age of 18, 8.2% from 18 to 24, 28.2% from 25 to 44, 28.2% from 45 to 64, and 11.2% who were 65 years of age or older. The median age was 38 years. For every 100 females, there were 97.2 males. For every 100 females age 18 and over, there were 94.2 males.
The median income for a household in the CDP was $63,958, and the median income for a family was $68,958. Males had a median income of $45,000 versus $35,000 for females. The per capita income for the CDP was $25,958. About 4.2% of families and 5.2% of the population were below the poverty line, including 6.2% of those under age 18 and 4.2% of those age 65 or over.
Common Questions
What is Per Capita Income in Waikele?
Per Capita income in Waikele is $52,750.
What is the Median Family Income in Waikele?
Median Family Income in Waikele is $137,628.
What is the Median Household income in Waikele?
Median Household Income in Waikele is $115,858.
What is Income or Wage Gap in Waikele?
Income or Wage Gap in Waikele is 22.1%.
Women in Waikele earn 77.9 cents for every dollar earned by a man.
What is Inequality or Gini Index in Waikele?
Inequality or Gini Index in Waikele is 0.34.
What is the Total Population of Waikele?
Total Population of Waikele is 7,551.
What is the Total Male Population of Waikele?
Total Male Population of Waikele is 3,364.
What is the Total Female Population of Waikele?
Total Female Population of Waikele is 4,187.
What is the Ratio of Males per 100 Females in Waikele?
There are 80.34 Males per 100 Females in Waikele.
What is the Ratio of Females per 100 Males in Waikele?
There are 124.46 Females per 100 Males in Waikele.
What is the Median Population Age in Waikele?
Median Population Age in Waikele is 42.7 Years.
What is the Average Family Size in Waikele
Average Family Size in Waikele is 3.0 People.
What is the Average Household Size in Waikele
Average Household Size in Waikele is 2.5 People.
How Large is the Labor Force in Waikele?
There are 5,064 People in the Labor Forcein in Waikele.
What is the Percentage of People in the Labor Force in Waikele?
76.9% of People are in the Labor Force in Waikele.
What is the Unemployment Rate in Waikele?
Unemployment Rate in Waikele is 0.5%.