Waipio, HI Map & Demographics
Waipio Map
Waipio Overview
$44,826
PER CAPITA INCOME
$109,519
AVG FAMILY INCOME
$99,815
AVG HOUSEHOLD INCOME
32.4%
WAGE / INCOME GAP [ % ]
67.6¢/ $1
WAGE / INCOME GAP [ $ ]
0.40
INEQUALITY / GINI INDEX
11,138
TOTAL POPULATION
5,412
MALE POPULATION
5,726
FEMALE POPULATION
94.52
MALES / 100 FEMALES
105.80
FEMALES / 100 MALES
42.6
MEDIAN AGE
3.3
AVG FAMILY SIZE
2.7
AVG HOUSEHOLD SIZE
6,009
LABOR FORCE [ PEOPLE ]
64.2%
PERCENT IN LABOR FORCE
2.6%
UNEMPLOYMENT RATE
Income in Waipio
Income Overview in Waipio
Per Capita Income in Waipio is $44,826, while median incomes of families and households are $109,519 and $99,815 respectively.
| Characteristic | Number | Measure |
| Per Capita Income | 11,138 | $44,826 |
| Median Family Income | 2,875 | $109,519 |
| Mean Family Income | 2,875 | $135,372 |
| Median Household Income | 4,098 | $99,815 |
| Mean Household Income | 4,098 | $121,785 |
| Income Deficit | 2,875 | $0 |
| Wage / Income Gap (%) | 11,138 | 32.43% |
| Wage / Income Gap ($) | 11,138 | 67.57¢ per $1 |
| Gini / Inequality Index | 11,138 | 0.40 |
Earnings by Sex in Waipio
Average Earnings in Waipio are $53,641, $61,798 for men and $41,754 for women, a difference of 32.4%.
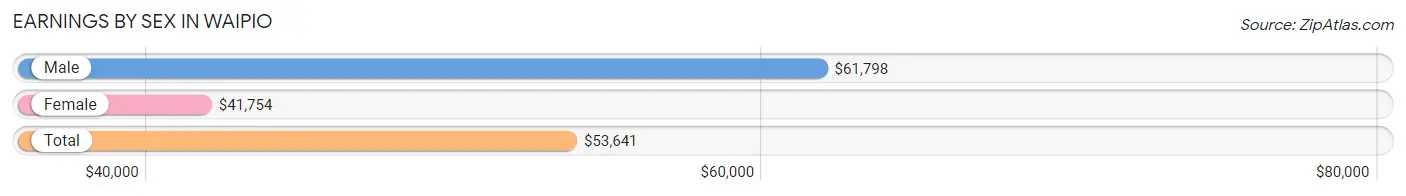
| Sex | Number | Average Earnings |
| Male | 3,127 (50.2%) | $61,798 |
| Female | 3,100 (49.8%) | $41,754 |
| Total | 6,227 (100.0%) | $53,641 |
Earnings by Sex by Income Bracket in Waipio
The most common earnings brackets in Waipio are $100,000+ for men (678 | 21.7%) and $55,000 to $64,999 for women (374 | 12.1%).
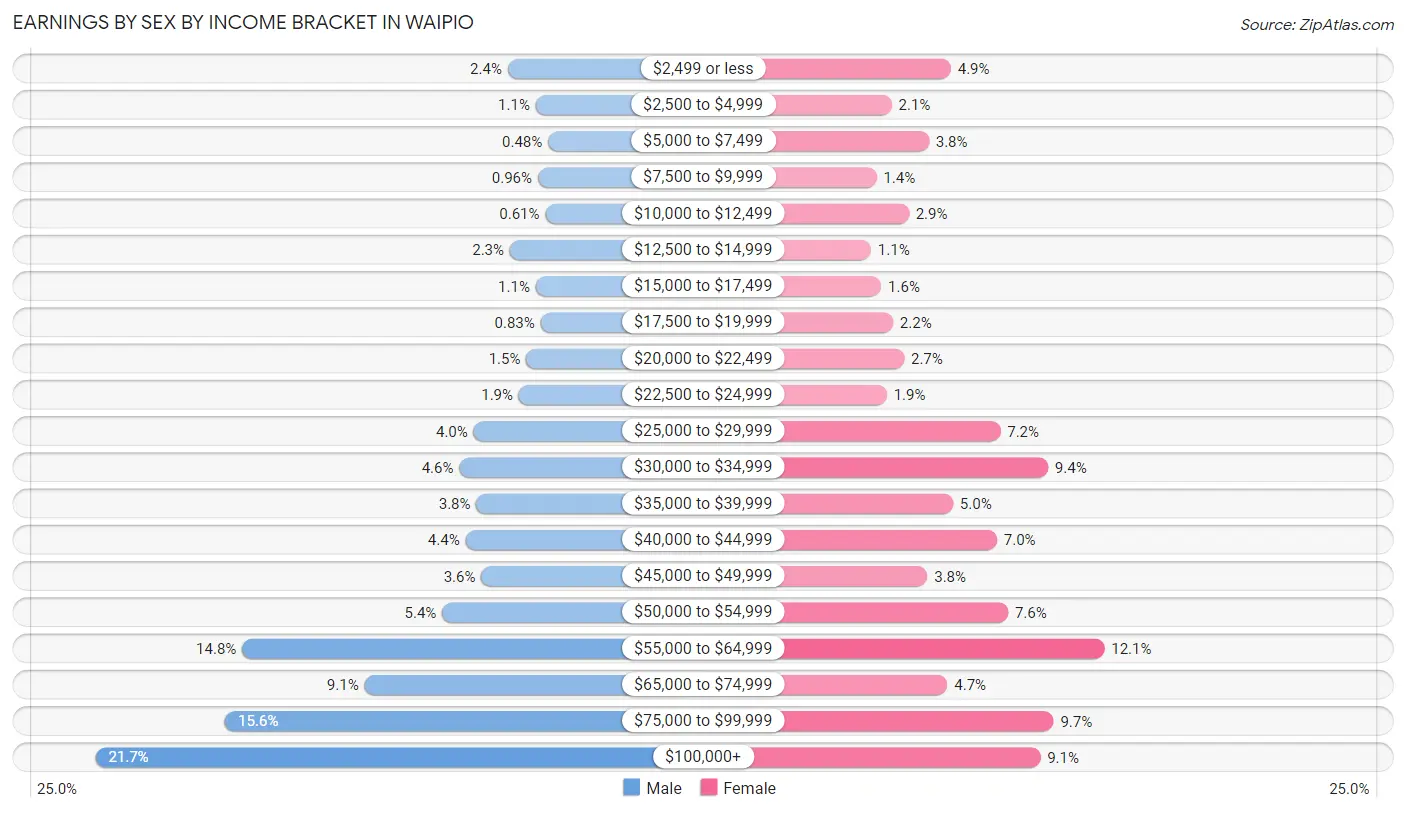
| Income | Male | Female |
| $2,499 or less | 74 (2.4%) | 151 (4.9%) |
| $2,500 to $4,999 | 33 (1.1%) | 65 (2.1%) |
| $5,000 to $7,499 | 15 (0.5%) | 119 (3.8%) |
| $7,500 to $9,999 | 30 (1.0%) | 43 (1.4%) |
| $10,000 to $12,499 | 19 (0.6%) | 90 (2.9%) |
| $12,500 to $14,999 | 71 (2.3%) | 35 (1.1%) |
| $15,000 to $17,499 | 33 (1.1%) | 50 (1.6%) |
| $17,500 to $19,999 | 26 (0.8%) | 67 (2.2%) |
| $20,000 to $22,499 | 47 (1.5%) | 83 (2.7%) |
| $22,500 to $24,999 | 58 (1.8%) | 58 (1.9%) |
| $25,000 to $29,999 | 124 (4.0%) | 223 (7.2%) |
| $30,000 to $34,999 | 145 (4.6%) | 292 (9.4%) |
| $35,000 to $39,999 | 120 (3.8%) | 154 (5.0%) |
| $40,000 to $44,999 | 136 (4.3%) | 218 (7.0%) |
| $45,000 to $49,999 | 113 (3.6%) | 117 (3.8%) |
| $50,000 to $54,999 | 170 (5.4%) | 234 (7.5%) |
| $55,000 to $64,999 | 463 (14.8%) | 374 (12.1%) |
| $65,000 to $74,999 | 284 (9.1%) | 146 (4.7%) |
| $75,000 to $99,999 | 488 (15.6%) | 300 (9.7%) |
| $100,000+ | 678 (21.7%) | 281 (9.1%) |
| Total | 3,127 (100.0%) | 3,100 (100.0%) |
Earnings by Sex by Educational Attainment in Waipio
Average earnings in Waipio are $64,703 for men and $43,005 for women, a difference of 33.5%. Men with an educational attainment of graduate degree enjoy the highest average annual earnings of $78,370, while those with less than high school education earn the least with $24,432. Women with an educational attainment of bachelor's degree earn the most with the average annual earnings of $62,500, while those with less than high school education have the smallest earnings of $29,423.
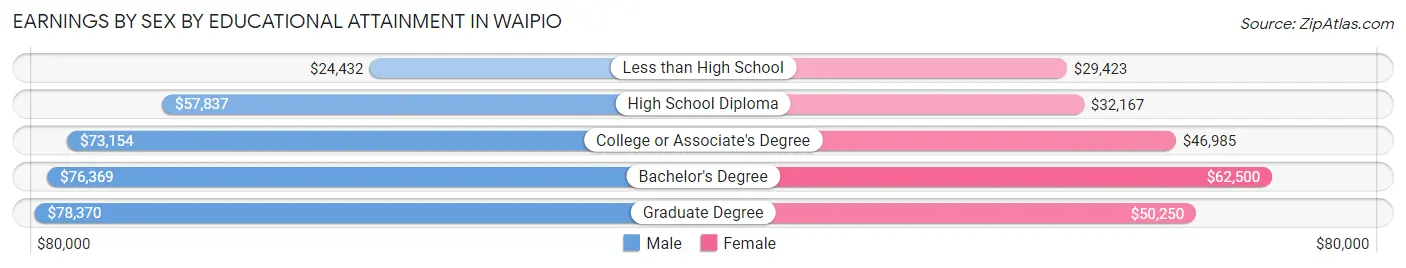
| Educational Attainment | Male Income | Female Income |
| Less than High School | $24,432 | $29,423 |
| High School Diploma | $57,837 | $32,167 |
| College or Associate's Degree | $73,154 | $46,985 |
| Bachelor's Degree | $76,369 | $62,500 |
| Graduate Degree | $78,370 | $50,250 |
| Total | $64,703 | $43,005 |
Family Income in Waipio
Family Income Brackets in Waipio
According to the Waipio family income data, there are 624 families falling into the $100,000 to $149,999 income range, which is the most common income bracket and makes up 21.7% of all families. Conversely, the $10,000 to $14,999 income bracket is the least frequent group with only 17 families (0.6%) belonging to this category.
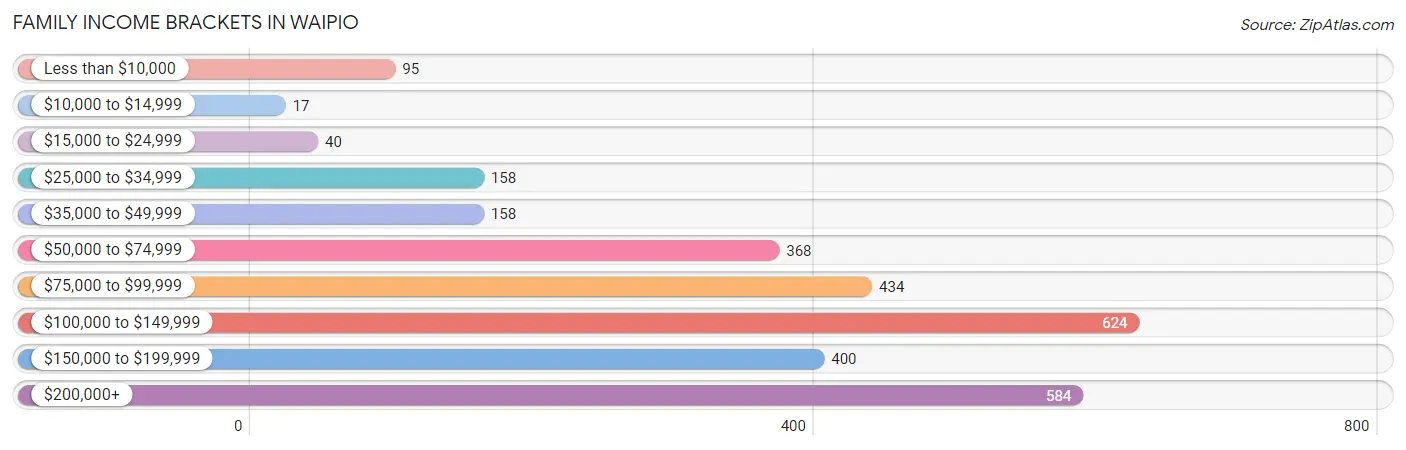
| Income Bracket | # Families | % Families |
| Less than $10,000 | 95 | 3.3% |
| $10,000 to $14,999 | 17 | 0.6% |
| $15,000 to $24,999 | 40 | 1.4% |
| $25,000 to $34,999 | 158 | 5.5% |
| $35,000 to $49,999 | 158 | 5.5% |
| $50,000 to $74,999 | 368 | 12.8% |
| $75,000 to $99,999 | 434 | 15.1% |
| $100,000 to $149,999 | 624 | 21.7% |
| $150,000 to $199,999 | 400 | 13.9% |
| $200,000+ | 584 | 20.3% |
Family Income by Famaliy Size in Waipio
7+ person families (158 | 5.5%) account for the highest median family income in Waipio with $250,001 per family, while 2-person families (1,312 | 45.6%) have the highest median income of $45,982 per family member.
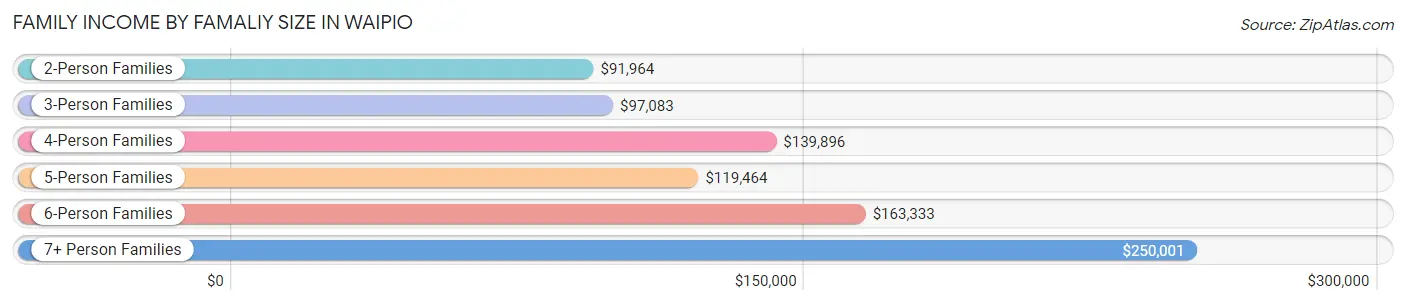
| Income Bracket | # Families | Median Income |
| 2-Person Families | 1,312 (45.6%) | $91,964 |
| 3-Person Families | 639 (22.2%) | $97,083 |
| 4-Person Families | 427 (14.8%) | $139,896 |
| 5-Person Families | 221 (7.7%) | $119,464 |
| 6-Person Families | 118 (4.1%) | $163,333 |
| 7+ Person Families | 158 (5.5%) | $250,001 |
| Total | 2,875 (100.0%) | $109,519 |
Family Income by Number of Earners in Waipio
The median family income in Waipio is $109,519, with families comprising 3+ earners (486) having the highest median family income of $209,750, while families with no earners (350) have the lowest median family income of $60,909, accounting for 16.9% and 12.2% of families, respectively.
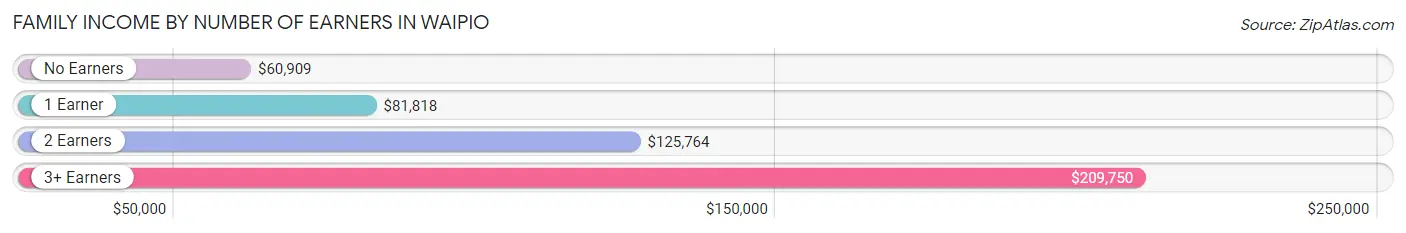
| Number of Earners | # Families | Median Income |
| No Earners | 350 (12.2%) | $60,909 |
| 1 Earner | 948 (33.0%) | $81,818 |
| 2 Earners | 1,091 (38.0%) | $125,764 |
| 3+ Earners | 486 (16.9%) | $209,750 |
| Total | 2,875 (100.0%) | $109,519 |
Household Income in Waipio
Household Income Brackets in Waipio
With 873 households falling in the category, the $100,000 to $149,999 income range is the most frequent in Waipio, accounting for 21.3% of all households. In contrast, only 45 households (1.1%) fall into the $10,000 to $14,999 income bracket, making it the least populous group.
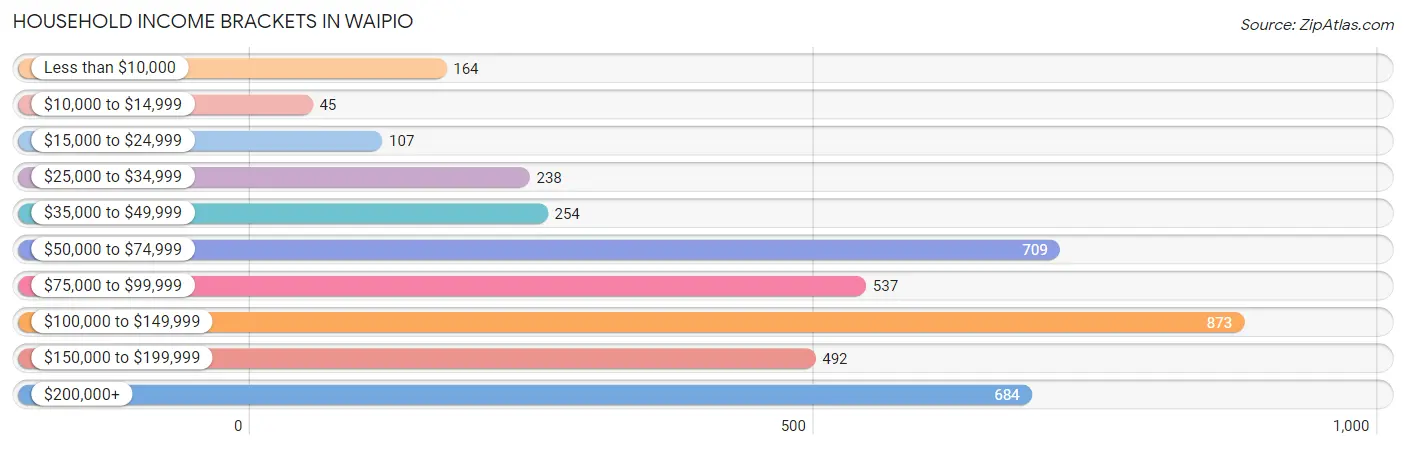
| Income Bracket | # Households | % Households |
| Less than $10,000 | 164 | 4.0% |
| $10,000 to $14,999 | 45 | 1.1% |
| $15,000 to $24,999 | 107 | 2.6% |
| $25,000 to $34,999 | 238 | 5.8% |
| $35,000 to $49,999 | 254 | 6.2% |
| $50,000 to $74,999 | 709 | 17.3% |
| $75,000 to $99,999 | 537 | 13.1% |
| $100,000 to $149,999 | 873 | 21.3% |
| $150,000 to $199,999 | 492 | 12.0% |
| $200,000+ | 684 | 16.7% |
Household Income by Householder Age in Waipio
The median household income in Waipio is $99,815, with the highest median household income of $136,121 found in the 45 to 64 years age bracket for the primary householder. A total of 1,366 households (33.3%) fall into this category. Meanwhile, the 15 to 24 years age bracket for the primary householder has the lowest median household income of $73,277, with 140 households (3.4%) in this group.
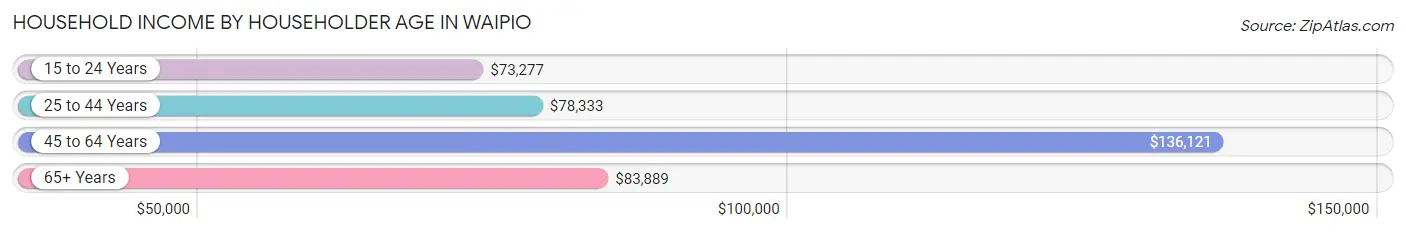
| Income Bracket | # Households | Median Income |
| 15 to 24 Years | 140 (3.4%) | $73,277 |
| 25 to 44 Years | 1,142 (27.9%) | $78,333 |
| 45 to 64 Years | 1,366 (33.3%) | $136,121 |
| 65+ Years | 1,450 (35.4%) | $83,889 |
| Total | 4,098 (100.0%) | $99,815 |
Poverty in Waipio
Income Below Poverty by Sex and Age in Waipio
With 5.1% poverty level for males and 7.4% for females among the residents of Waipio, 16 and 17 year old males and 5 year old females are the most vulnerable to poverty, with 38 males (32.2%) and 37 females (52.9%) in their respective age groups living below the poverty level.
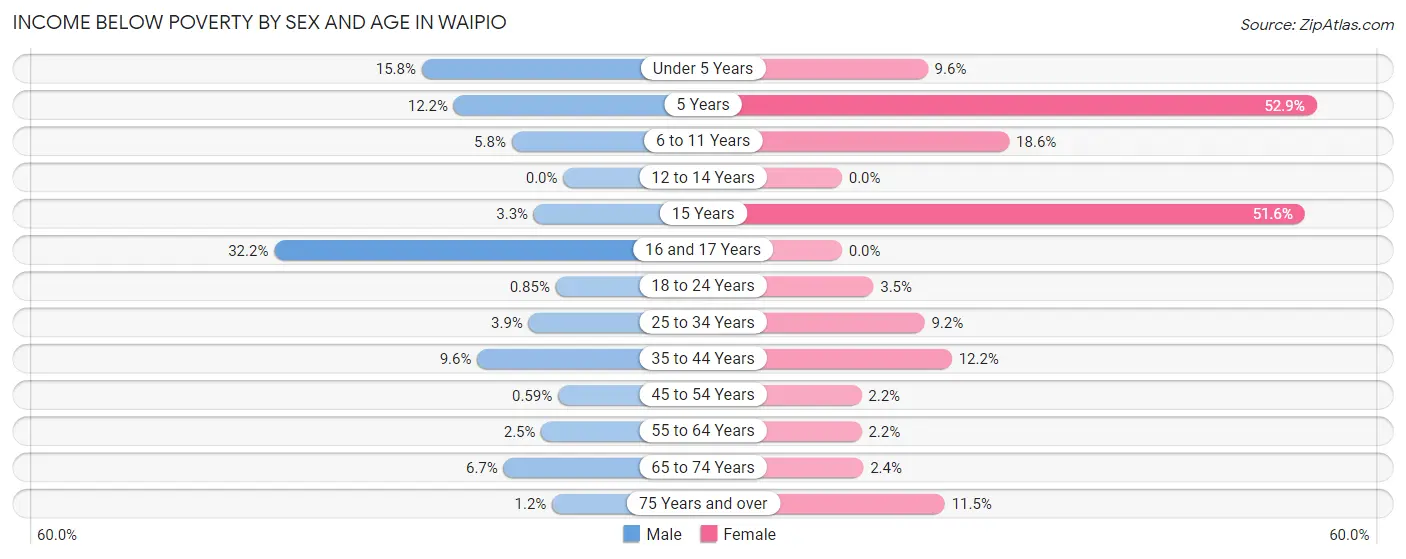
| Age Bracket | Male | Female |
| Under 5 Years | 35 (15.8%) | 35 (9.6%) |
| 5 Years | 5 (12.2%) | 37 (52.9%) |
| 6 to 11 Years | 21 (5.8%) | 33 (18.6%) |
| 12 to 14 Years | 0 (0.0%) | 0 (0.0%) |
| 15 Years | 4 (3.3%) | 33 (51.6%) |
| 16 and 17 Years | 38 (32.2%) | 0 (0.0%) |
| 18 to 24 Years | 3 (0.9%) | 16 (3.5%) |
| 25 to 34 Years | 41 (3.9%) | 71 (9.2%) |
| 35 to 44 Years | 55 (9.6%) | 78 (12.2%) |
| 45 to 54 Years | 4 (0.6%) | 13 (2.2%) |
| 55 to 64 Years | 14 (2.5%) | 19 (2.2%) |
| 65 to 74 Years | 50 (6.7%) | 19 (2.4%) |
| 75 Years and over | 5 (1.2%) | 69 (11.5%) |
| Total | 275 (5.1%) | 423 (7.4%) |
Income Above Poverty by Sex and Age in Waipio
According to the poverty statistics in Waipio, males aged 12 to 14 years and females aged 12 to 14 years are the age groups that are most secure financially, with 100.0% of males and 100.0% of females in these age groups living above the poverty line.
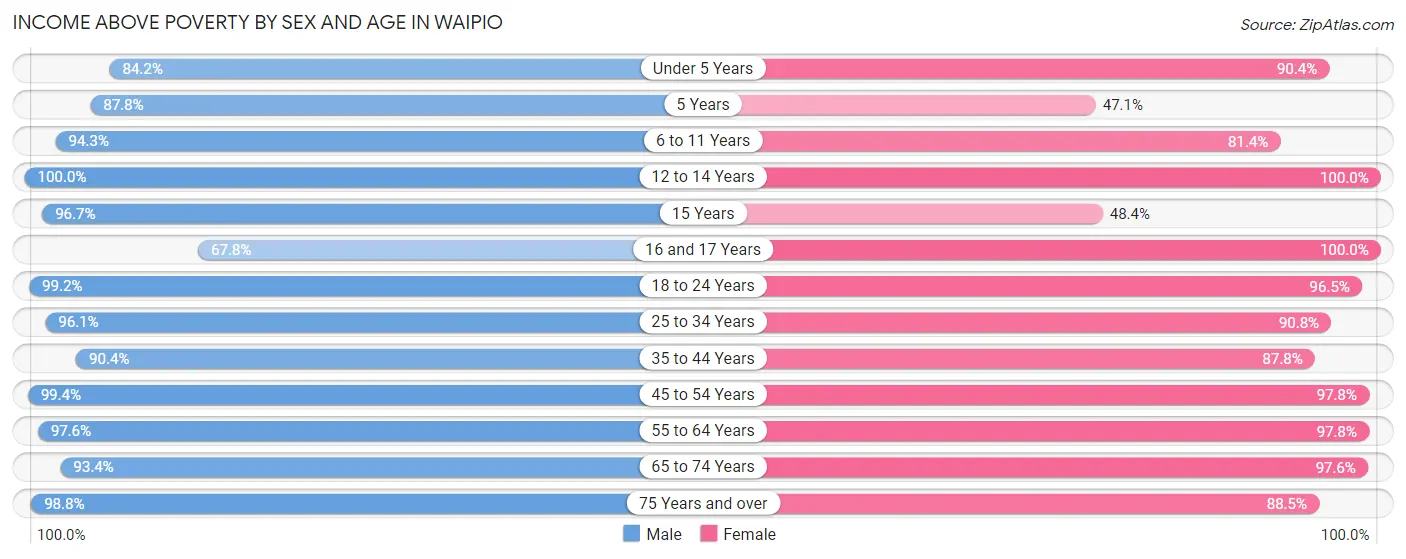
| Age Bracket | Male | Female |
| Under 5 Years | 187 (84.2%) | 331 (90.4%) |
| 5 Years | 36 (87.8%) | 33 (47.1%) |
| 6 to 11 Years | 344 (94.3%) | 144 (81.4%) |
| 12 to 14 Years | 153 (100.0%) | 189 (100.0%) |
| 15 Years | 118 (96.7%) | 31 (48.4%) |
| 16 and 17 Years | 80 (67.8%) | 120 (100.0%) |
| 18 to 24 Years | 348 (99.2%) | 440 (96.5%) |
| 25 to 34 Years | 1,021 (96.1%) | 700 (90.8%) |
| 35 to 44 Years | 519 (90.4%) | 559 (87.8%) |
| 45 to 54 Years | 673 (99.4%) | 582 (97.8%) |
| 55 to 64 Years | 558 (97.6%) | 849 (97.8%) |
| 65 to 74 Years | 702 (93.3%) | 775 (97.6%) |
| 75 Years and over | 398 (98.8%) | 533 (88.5%) |
| Total | 5,137 (94.9%) | 5,286 (92.6%) |
Income Below Poverty Among Married-Couple Families in Waipio
The poverty statistics for married-couple families in Waipio show that 3.4% or 64 of the total 1,912 families live below the poverty line. Families with 3 or 4 children have the highest poverty rate of 20.0%, comprising of 22 families. On the other hand, families with 1 or 2 children have the lowest poverty rate of 0.0%, which includes 0 families.
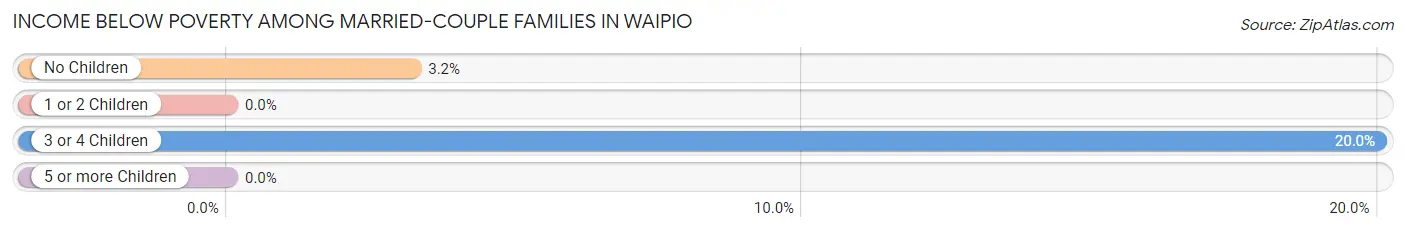
| Children | Above Poverty | Below Poverty |
| No Children | 1,273 (96.8%) | 42 (3.2%) |
| 1 or 2 Children | 479 (100.0%) | 0 (0.0%) |
| 3 or 4 Children | 88 (80.0%) | 22 (20.0%) |
| 5 or more Children | 8 (100.0%) | 0 (0.0%) |
| Total | 1,848 (96.7%) | 64 (3.4%) |
Income Below Poverty Among Single-Parent Households in Waipio
According to the poverty data in Waipio, 4.2% or 11 single-father households and 10.9% or 76 single-mother households are living below the poverty line. Among single-father households, those with 1 or 2 children have the highest poverty rate, with 11 households (7.7%) experiencing poverty. Likewise, among single-mother households, those with 3 or 4 children have the highest poverty rate, with 34 households (100.0%) falling below the poverty line.
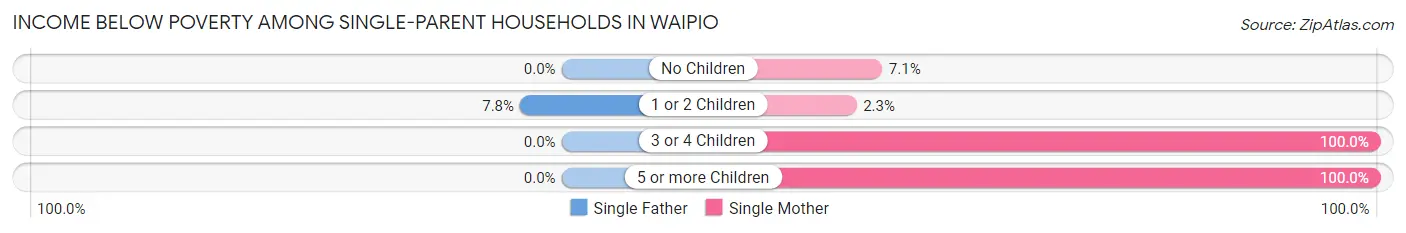
| Children | Single Father | Single Mother |
| No Children | 0 (0.0%) | 22 (7.1%) |
| 1 or 2 Children | 11 (7.7%) | 8 (2.3%) |
| 3 or 4 Children | 0 (0.0%) | 34 (100.0%) |
| 5 or more Children | 0 (0.0%) | 12 (100.0%) |
| Total | 11 (4.2%) | 76 (10.9%) |
Income Below Poverty Among Married-Couple vs Single-Parent Households in Waipio
The poverty data for Waipio shows that 64 of the married-couple family households (3.4%) and 87 of the single-parent households (9.0%) are living below the poverty level. Within the married-couple family households, those with 3 or 4 children have the highest poverty rate, with 22 households (20.0%) falling below the poverty line. Among the single-parent households, those with 5 or more children have the highest poverty rate, with 12 household (100.0%) living below poverty.
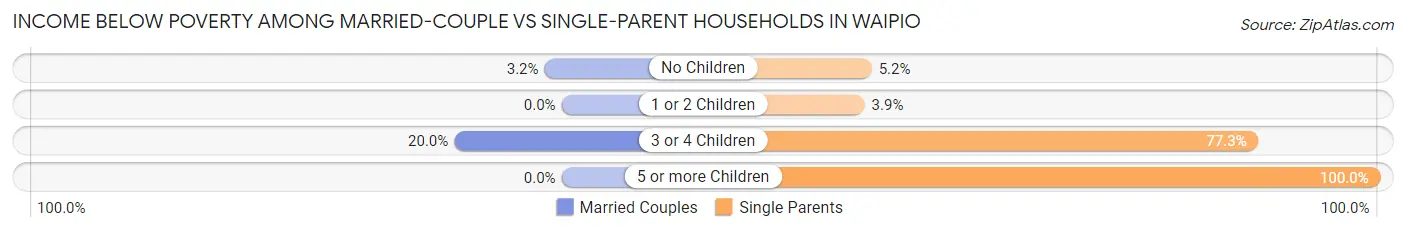
| Children | Married-Couple Families | Single-Parent Households |
| No Children | 42 (3.2%) | 22 (5.2%) |
| 1 or 2 Children | 0 (0.0%) | 19 (3.9%) |
| 3 or 4 Children | 22 (20.0%) | 34 (77.3%) |
| 5 or more Children | 0 (0.0%) | 12 (100.0%) |
| Total | 64 (3.4%) | 87 (9.0%) |
Race in Waipio
The most populous races in Waipio are Asian (6,553 | 58.8%), Two or more Races (2,665 | 23.9%), and Hawaiian / Pacific (1,052 | 9.5%).
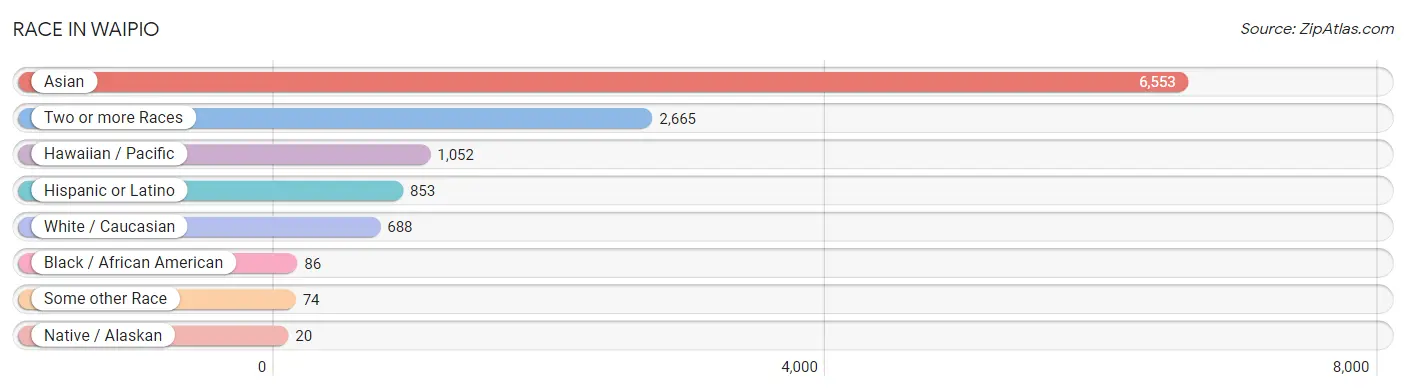
| Race | # Population | % Population |
| Asian | 6,553 | 58.8% |
| Black / African American | 86 | 0.8% |
| Hawaiian / Pacific | 1,052 | 9.5% |
| Hispanic or Latino | 853 | 7.7% |
| Native / Alaskan | 20 | 0.2% |
| White / Caucasian | 688 | 6.2% |
| Two or more Races | 2,665 | 23.9% |
| Some other Race | 74 | 0.7% |
| Total | 11,138 | 100.0% |
Ancestry in Waipio
The most populous ancestries reported in Waipio are Korean (4,224 | 37.9%), Bhutanese (3,783 | 34.0%), Native Hawaiian (2,119 | 19.0%), Indian (Asian) (1,847 | 16.6%), and Burmese (882 | 7.9%), together accounting for 115.4% of all Waipio residents.
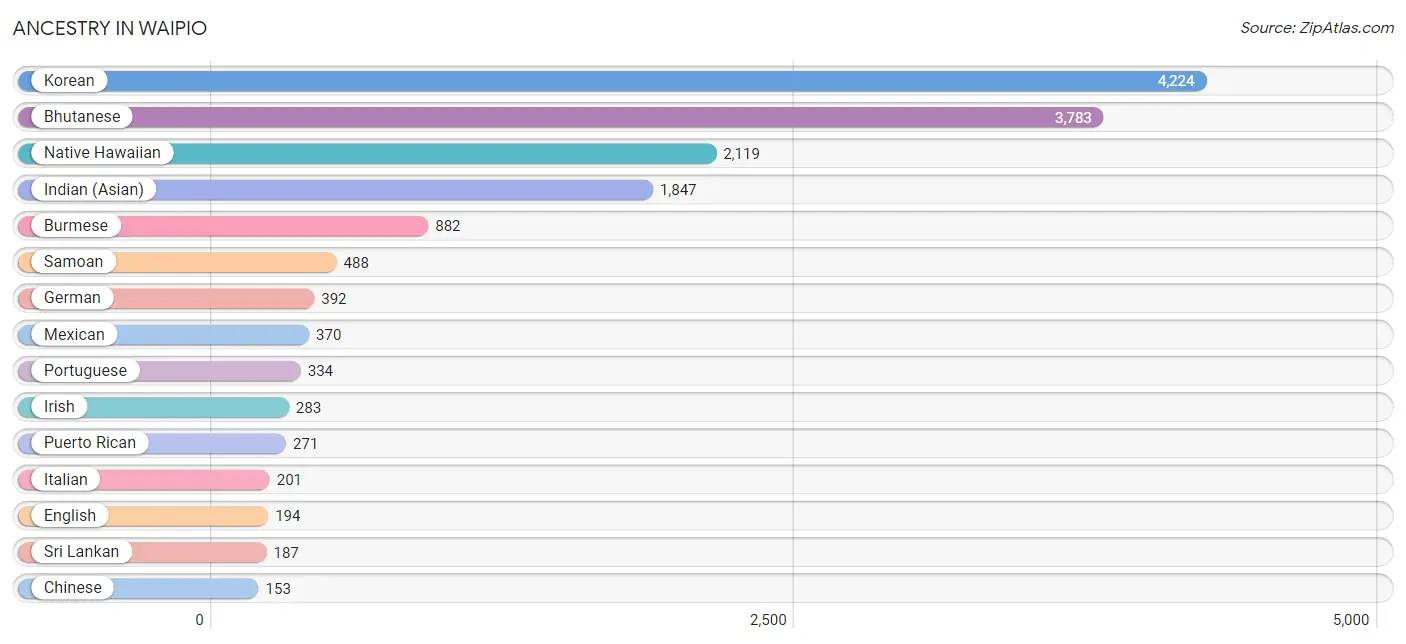
| Ancestry | # Population | % Population |
| American | 44 | 0.4% |
| Bhutanese | 3,783 | 34.0% |
| British | 5 | 0.0% |
| Burmese | 882 | 7.9% |
| Cape Verdean | 15 | 0.1% |
| Central American Indian | 23 | 0.2% |
| Cherokee | 11 | 0.1% |
| Chinese | 153 | 1.4% |
| Danish | 8 | 0.1% |
| Eastern European | 9 | 0.1% |
| English | 194 | 1.7% |
| European | 24 | 0.2% |
| French | 51 | 0.5% |
| German | 392 | 3.5% |
| Indian (Asian) | 1,847 | 16.6% |
| Irish | 283 | 2.5% |
| Italian | 201 | 1.8% |
| Korean | 4,224 | 37.9% |
| Latvian | 22 | 0.2% |
| Lithuanian | 5 | 0.0% |
| Malaysian | 32 | 0.3% |
| Marshallese | 2 | 0.0% |
| Mexican | 370 | 3.3% |
| Native Hawaiian | 2,119 | 19.0% |
| Navajo | 19 | 0.2% |
| Norwegian | 42 | 0.4% |
| Pakistani | 12 | 0.1% |
| Polish | 38 | 0.3% |
| Portuguese | 334 | 3.0% |
| Puerto Rican | 271 | 2.4% |
| Samoan | 488 | 4.4% |
| Scandinavian | 9 | 0.1% |
| Scottish | 23 | 0.2% |
| South American Indian | 5 | 0.0% |
| Spaniard | 41 | 0.4% |
| Spanish | 136 | 1.2% |
| Spanish American | 7 | 0.1% |
| Spanish American Indian | 7 | 0.1% |
| Sri Lankan | 187 | 1.7% |
| Subsaharan African | 15 | 0.1% |
| Thai | 38 | 0.3% |
| Tongan | 40 | 0.4% | View All 42 Rows |
Immigrants in Waipio
The most numerous immigrant groups reported in Waipio came from Asia (1,919 | 17.2%), South Eastern Asia (1,508 | 13.5%), Philippines (1,420 | 12.8%), Eastern Asia (411 | 3.7%), and Oceania (218 | 2.0%), together accounting for 49.2% of all Waipio residents.
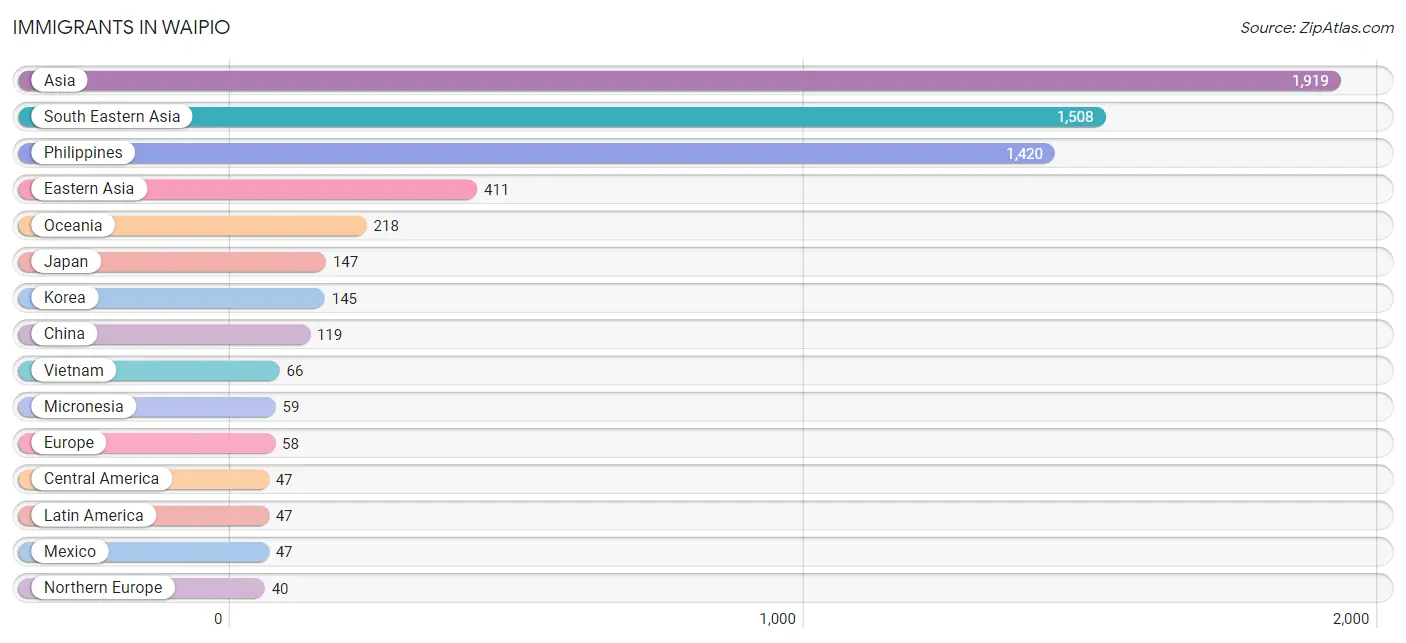
| Immigration Origin | # Population | % Population |
| Asia | 1,919 | 17.2% |
| Central America | 47 | 0.4% |
| China | 119 | 1.1% |
| Eastern Asia | 411 | 3.7% |
| Eastern Europe | 11 | 0.1% |
| England | 30 | 0.3% |
| Europe | 58 | 0.5% |
| Germany | 7 | 0.1% |
| Hong Kong | 27 | 0.2% |
| Japan | 147 | 1.3% |
| Korea | 145 | 1.3% |
| Laos | 10 | 0.1% |
| Latin America | 47 | 0.4% |
| Latvia | 11 | 0.1% |
| Mexico | 47 | 0.4% |
| Micronesia | 59 | 0.5% |
| Northern Europe | 40 | 0.4% |
| Oceania | 218 | 2.0% |
| Philippines | 1,420 | 12.8% |
| South Eastern Asia | 1,508 | 13.5% |
| Taiwan | 39 | 0.4% |
| Thailand | 12 | 0.1% |
| Vietnam | 66 | 0.6% |
| Western Europe | 7 | 0.1% | View All 24 Rows |
Sex and Age in Waipio
Sex and Age in Waipio
The most populous age groups in Waipio are 30 to 34 Years (622 | 11.5%) for men and 60 to 64 Years (513 | 9.0%) for women.
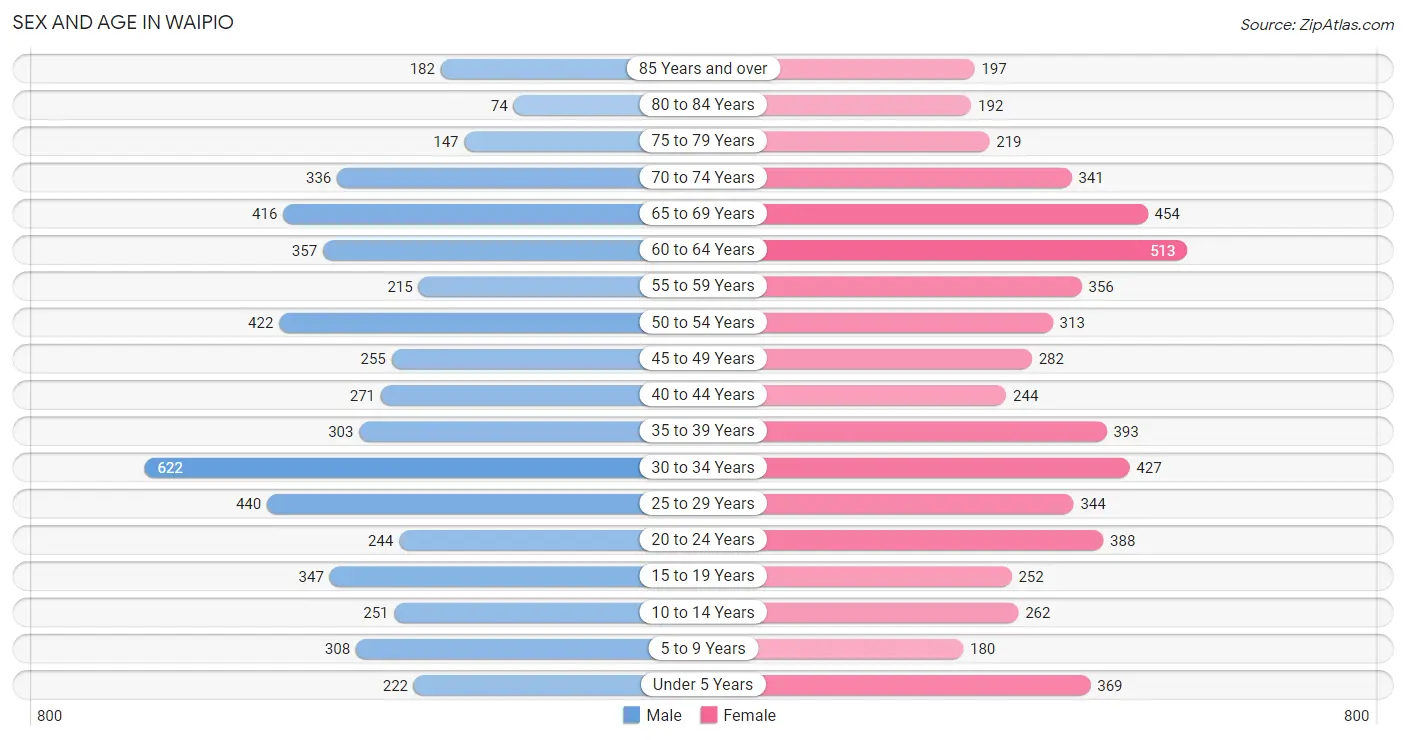
| Age Bracket | Male | Female |
| Under 5 Years | 222 (4.1%) | 369 (6.4%) |
| 5 to 9 Years | 308 (5.7%) | 180 (3.1%) |
| 10 to 14 Years | 251 (4.6%) | 262 (4.6%) |
| 15 to 19 Years | 347 (6.4%) | 252 (4.4%) |
| 20 to 24 Years | 244 (4.5%) | 388 (6.8%) |
| 25 to 29 Years | 440 (8.1%) | 344 (6.0%) |
| 30 to 34 Years | 622 (11.5%) | 427 (7.5%) |
| 35 to 39 Years | 303 (5.6%) | 393 (6.9%) |
| 40 to 44 Years | 271 (5.0%) | 244 (4.3%) |
| 45 to 49 Years | 255 (4.7%) | 282 (4.9%) |
| 50 to 54 Years | 422 (7.8%) | 313 (5.5%) |
| 55 to 59 Years | 215 (4.0%) | 356 (6.2%) |
| 60 to 64 Years | 357 (6.6%) | 513 (9.0%) |
| 65 to 69 Years | 416 (7.7%) | 454 (7.9%) |
| 70 to 74 Years | 336 (6.2%) | 341 (6.0%) |
| 75 to 79 Years | 147 (2.7%) | 219 (3.8%) |
| 80 to 84 Years | 74 (1.4%) | 192 (3.4%) |
| 85 Years and over | 182 (3.4%) | 197 (3.4%) |
| Total | 5,412 (100.0%) | 5,726 (100.0%) |
Families and Households in Waipio
Median Family Size in Waipio
The median family size in Waipio is 3.27 persons per family, with married-couple families (1,912 | 66.5%) accounting for the largest median family size of 3.33 persons per family. On the other hand, single male/father families (264 | 9.2%) represent the smallest median family size with 2.97 persons per family.
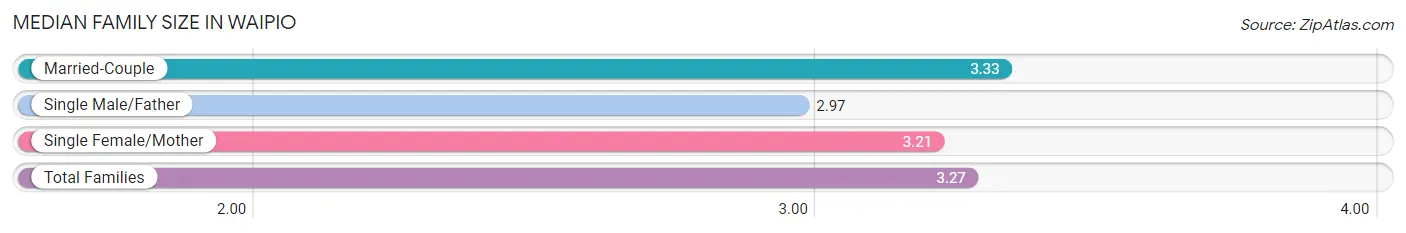
| Family Type | # Families | Family Size |
| Married-Couple | 1,912 (66.5%) | 3.33 |
| Single Male/Father | 264 (9.2%) | 2.97 |
| Single Female/Mother | 699 (24.3%) | 3.21 |
| Total Families | 2,875 (100.0%) | 3.27 |
Median Household Size in Waipio
The median household size in Waipio is 2.70 persons per household, with married-couple households (1,912 | 46.7%) accounting for the largest median household size of 3.35 persons per household. non-family households (1,223 | 29.8%) represent the smallest median household size with 1.20 persons per household.
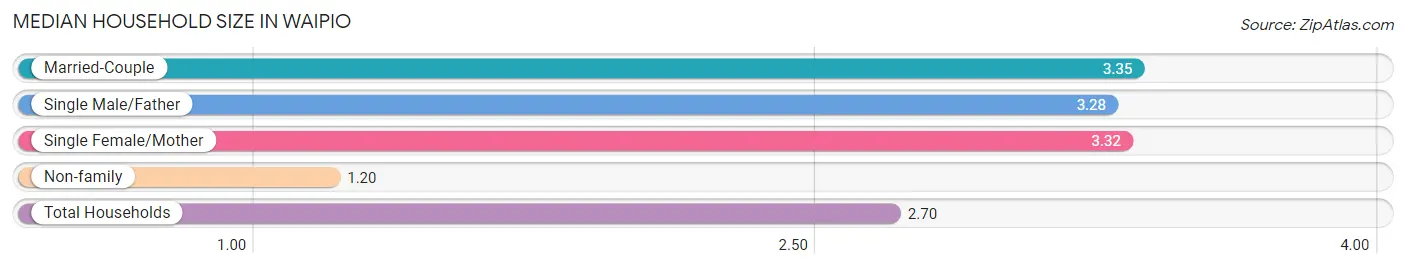
| Household Type | # Households | Household Size |
| Married-Couple | 1,912 (46.7%) | 3.35 |
| Single Male/Father | 264 (6.4%) | 3.28 |
| Single Female/Mother | 699 (17.1%) | 3.32 |
| Non-family | 1,223 (29.8%) | 1.20 |
| Total Households | 4,098 (100.0%) | 2.70 |
Household Size by Marriage Status in Waipio
Out of a total of 4,098 households in Waipio, 2,875 (70.2%) are family households, while 1,223 (29.8%) are nonfamily households. The most numerous type of family households are 2-person households, comprising 1,241, and the most common type of nonfamily households are 1-person households, comprising 936.
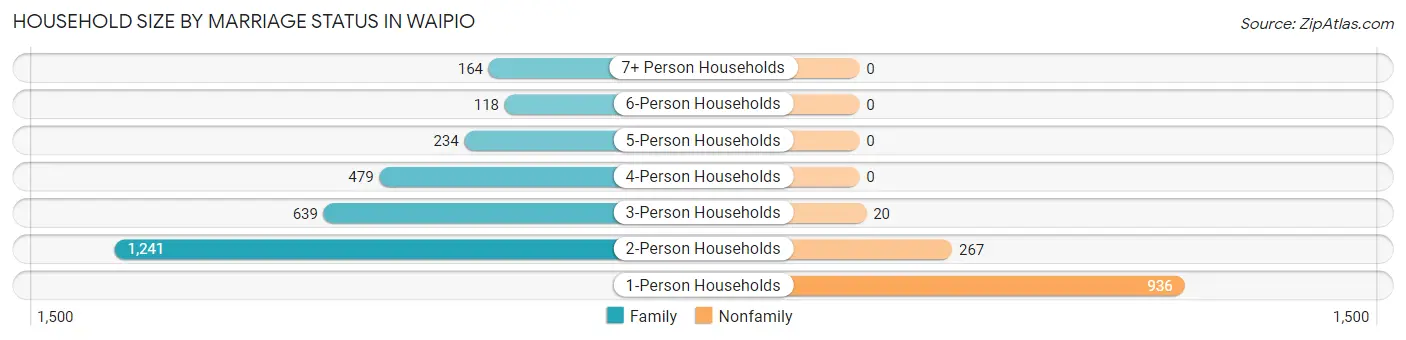
| Household Size | Family Households | Nonfamily Households |
| 1-Person Households | - | 936 (22.8%) |
| 2-Person Households | 1,241 (30.3%) | 267 (6.5%) |
| 3-Person Households | 639 (15.6%) | 20 (0.5%) |
| 4-Person Households | 479 (11.7%) | 0 (0.0%) |
| 5-Person Households | 234 (5.7%) | 0 (0.0%) |
| 6-Person Households | 118 (2.9%) | 0 (0.0%) |
| 7+ Person Households | 164 (4.0%) | 0 (0.0%) |
| Total | 2,875 (70.2%) | 1,223 (29.8%) |
Female Fertility in Waipio
Fertility by Age in Waipio
Average fertility rate in Waipio is 74.0 births per 1,000 women. Women in the age bracket of 20 to 34 years have the highest fertility rate with 109.0 births per 1,000 women. Women in the age bracket of 20 to 34 years acount for 70.8% of all women with births.
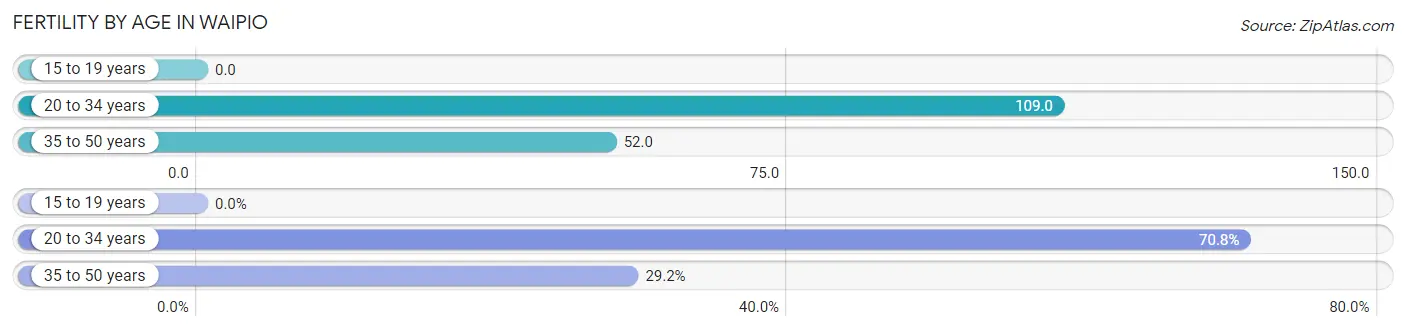
| Age Bracket | Women with Births | Births / 1,000 Women |
| 15 to 19 years | 0 (0.0%) | 0.0 |
| 20 to 34 years | 126 (70.8%) | 109.0 |
| 35 to 50 years | 52 (29.2%) | 52.0 |
| Total | 178 (100.0%) | 74.0 |
Fertility by Age by Marriage Status in Waipio
36.5% of women with births (178) in Waipio are married. The highest percentage of unmarried women with births falls into 20 to 34 years age bracket with 64.3% of them unmarried at the time of birth, while the lowest percentage of unmarried women with births belong to 35 to 50 years age bracket with 61.5% of them unmarried.
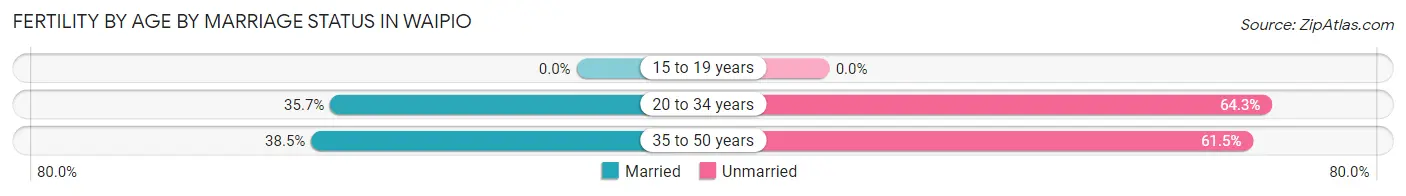
| Age Bracket | Married | Unmarried |
| 15 to 19 years | 0 (0.0%) | 0 (0.0%) |
| 20 to 34 years | 45 (35.7%) | 81 (64.3%) |
| 35 to 50 years | 20 (38.5%) | 32 (61.5%) |
| Total | 65 (36.5%) | 113 (63.5%) |
Fertility by Education in Waipio
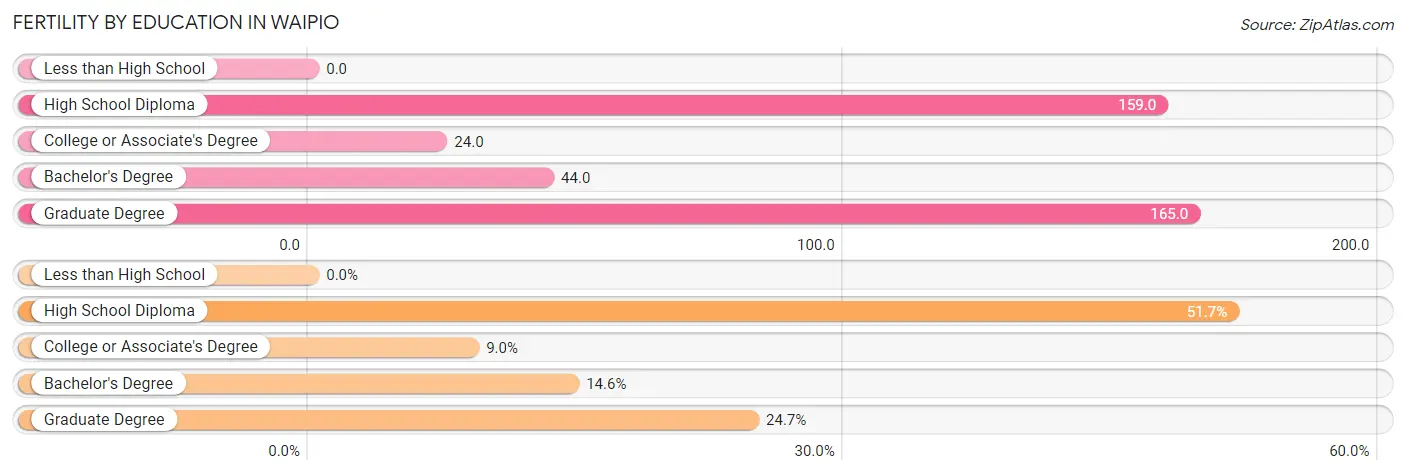
| Educational Attainment | Women with Births | Births / 1,000 Women |
| Less than High School | 0 (0.0%) | 0.0 |
| High School Diploma | 92 (51.7%) | 159.0 |
| College or Associate's Degree | 16 (9.0%) | 24.0 |
| Bachelor's Degree | 26 (14.6%) | 44.0 |
| Graduate Degree | 44 (24.7%) | 165.0 |
| Total | 178 (100.0%) | 74.0 |
Fertility by Education by Marriage Status in Waipio
63.5% of women with births in Waipio are unmarried. Women with the educational attainment of college or associate's degree are most likely to be married with 100.0% of them married at childbirth, while women with the educational attainment of high school diploma are least likely to be married with 88.0% of them unmarried at childbirth.
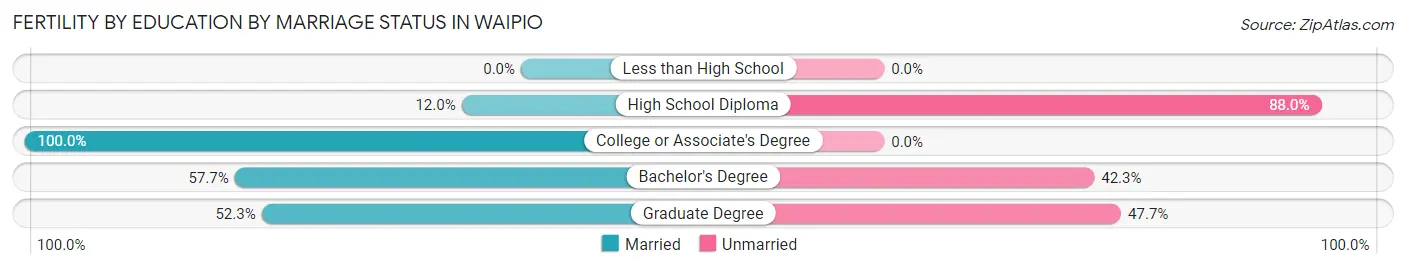
| Educational Attainment | Married | Unmarried |
| Less than High School | 0 (0.0%) | 0 (0.0%) |
| High School Diploma | 11 (12.0%) | 81 (88.0%) |
| College or Associate's Degree | 16 (100.0%) | 0 (0.0%) |
| Bachelor's Degree | 15 (57.7%) | 11 (42.3%) |
| Graduate Degree | 23 (52.3%) | 21 (47.7%) |
| Total | 65 (36.5%) | 113 (63.5%) |
Employment Characteristics in Waipio
Employment by Class of Employer in Waipio
Among the 5,675 employed individuals in Waipio, private company employees (2,986 | 52.6%), federal government employees (1,086 | 19.1%), and state government employees (595 | 10.5%) make up the most common classes of employment.
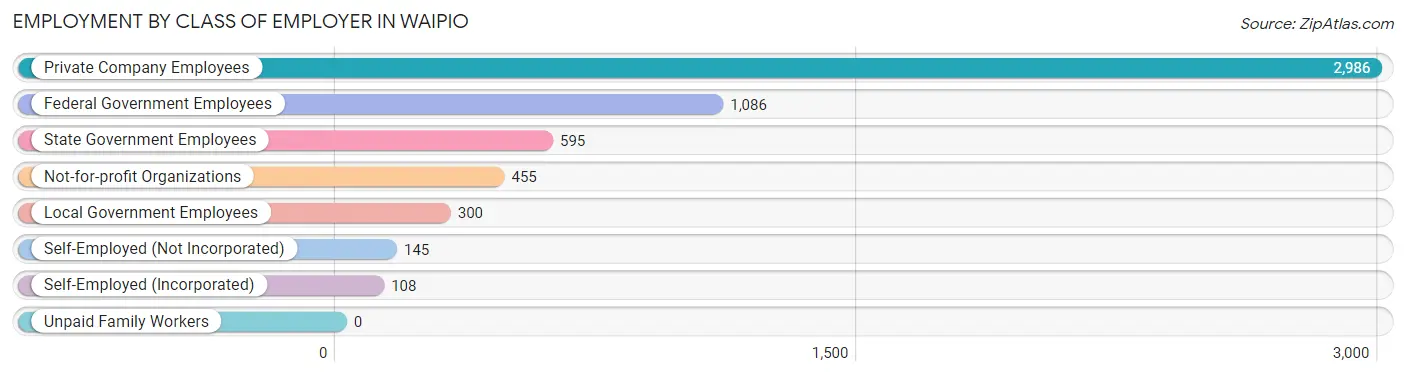
| Employer Class | # Employees | % Employees |
| Private Company Employees | 2,986 | 52.6% |
| Self-Employed (Incorporated) | 108 | 1.9% |
| Self-Employed (Not Incorporated) | 145 | 2.6% |
| Not-for-profit Organizations | 455 | 8.0% |
| Local Government Employees | 300 | 5.3% |
| State Government Employees | 595 | 10.5% |
| Federal Government Employees | 1,086 | 19.1% |
| Unpaid Family Workers | 0 | 0.0% |
| Total | 5,675 | 100.0% |
Employment Status by Age in Waipio
According to the labor force statistics for Waipio, out of the total population over 16 years of age (9,360), 64.2% or 6,009 individuals are in the labor force, with 2.6% or 156 of them unemployed. The age group with the highest labor force participation rate is 45 to 54 years, with 93.4% or 1,188 individuals in the labor force. Within the labor force, the 16 to 19 years age range has the highest percentage of unemployed individuals, with 24.5% or 13 of them being unemployed.
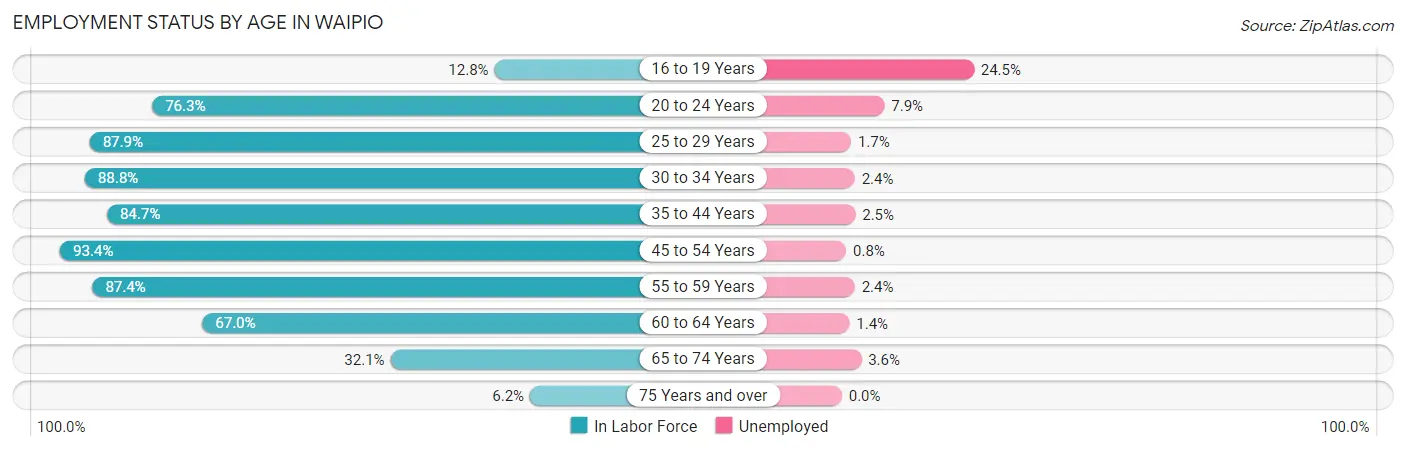
| Age Bracket | In Labor Force | Unemployed |
| 16 to 19 Years | 53 (12.8%) | 13 (24.5%) |
| 20 to 24 Years | 482 (76.3%) | 38 (7.9%) |
| 25 to 29 Years | 689 (87.9%) | 12 (1.7%) |
| 30 to 34 Years | 932 (88.8%) | 22 (2.4%) |
| 35 to 44 Years | 1,026 (84.7%) | 26 (2.5%) |
| 45 to 54 Years | 1,188 (93.4%) | 10 (0.8%) |
| 55 to 59 Years | 499 (87.4%) | 12 (2.4%) |
| 60 to 64 Years | 583 (67.0%) | 8 (1.4%) |
| 65 to 74 Years | 497 (32.1%) | 18 (3.6%) |
| 75 Years and over | 63 (6.2%) | 0 (0.0%) |
| Total | 6,009 (64.2%) | 156 (2.6%) |
Employment Status by Educational Attainment in Waipio
According to labor force statistics for Waipio, 85.4% of individuals (4,916) out of the total population between 25 and 64 years of age (5,757) are in the labor force, with 1.8% or 88 of them being unemployed. The group with the highest labor force participation rate are those with the educational attainment of college / associate degree, with 88.6% or 2,195 individuals in the labor force. Within the labor force, individuals with high school diploma education have the highest percentage of unemployment, with 3.1% or 37 of them being unemployed.
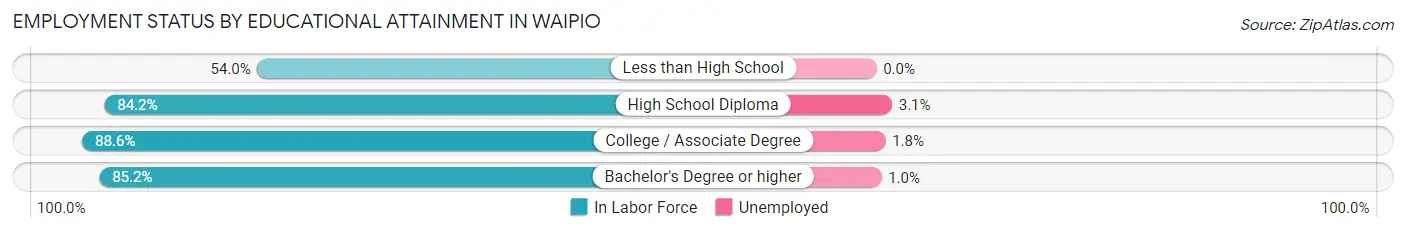
| Educational Attainment | In Labor Force | Unemployed |
| Less than High School | 102 (54.0%) | 0 (0.0%) |
| High School Diploma | 1,196 (84.2%) | 44 (3.1%) |
| College / Associate Degree | 2,195 (88.6%) | 45 (1.8%) |
| Bachelor's Degree or higher | 1,424 (85.2%) | 17 (1.0%) |
| Total | 4,916 (85.4%) | 104 (1.8%) |
Employment Occupations by Sex in Waipio
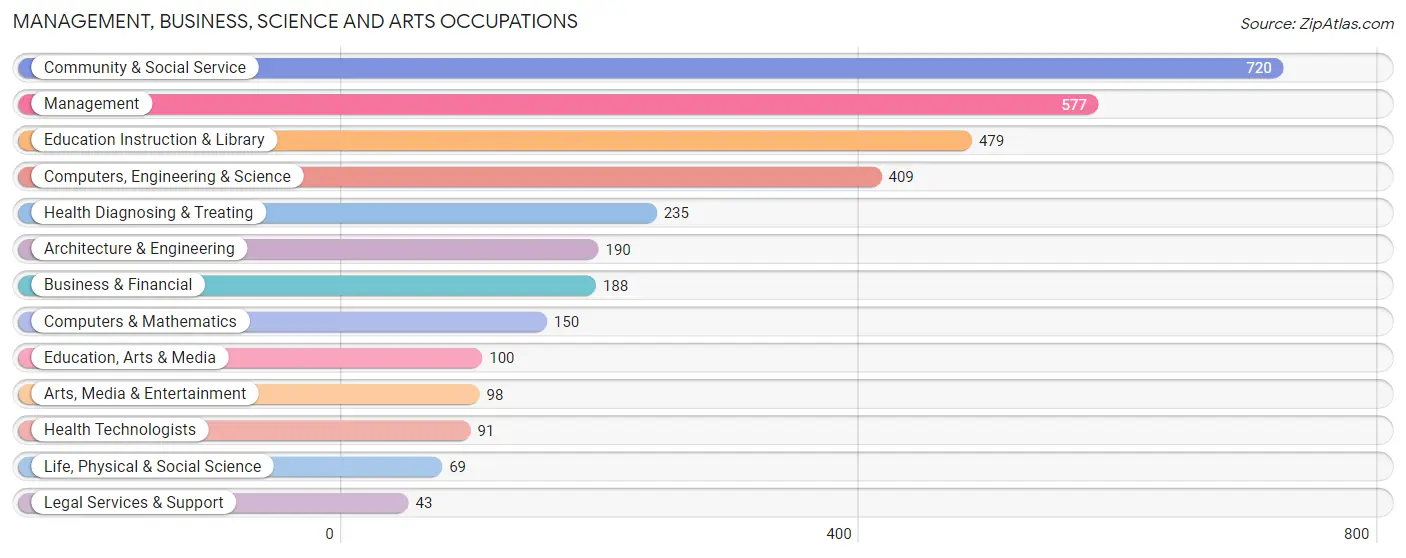
Management, Business, Science and Arts Occupations
The most common Management, Business, Science and Arts occupations in Waipio are Community & Social Service (720 | 12.9%), Management (577 | 10.3%), Education Instruction & Library (479 | 8.6%), Computers, Engineering & Science (409 | 7.3%), and Health Diagnosing & Treating (235 | 4.2%).
Management, Business, Science and Arts Occupations by Sex
Within the Management, Business, Science and Arts occupations in Waipio, the most male-oriented occupations are Architecture & Engineering (81.6%), Computers, Engineering & Science (71.6%), and Computers & Mathematics (70.7%), while the most female-oriented occupations are Health Technologists (87.9%), Education Instruction & Library (80.4%), and Legal Services & Support (79.1%).
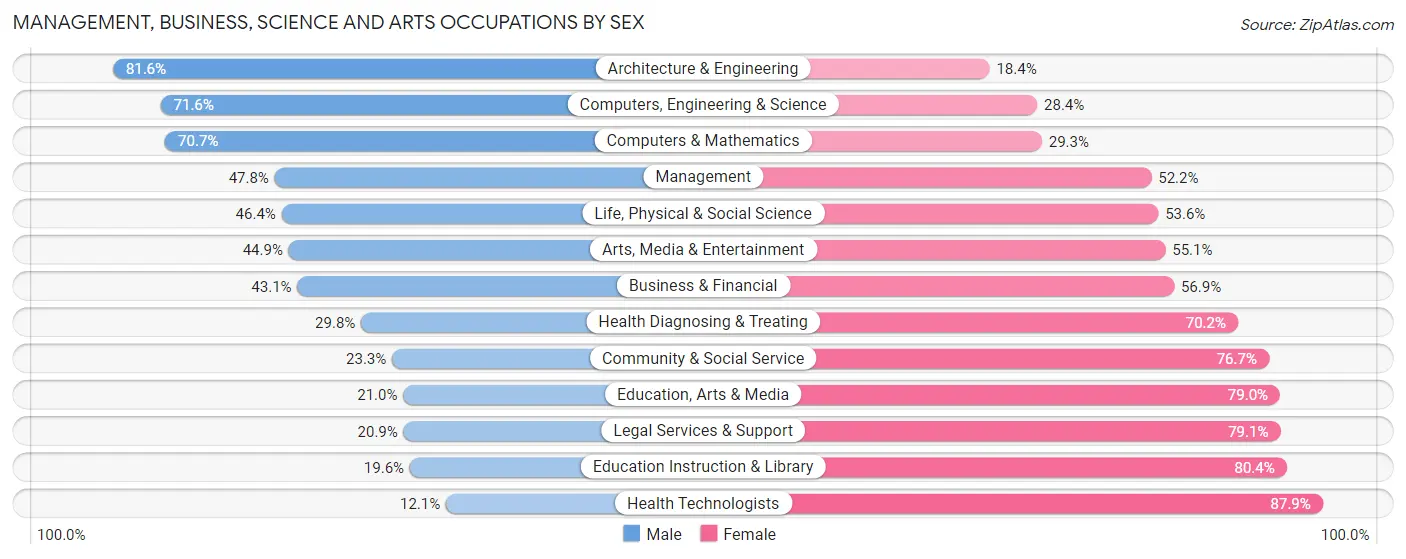
| Occupation | Male | Female |
| Management | 276 (47.8%) | 301 (52.2%) |
| Business & Financial | 81 (43.1%) | 107 (56.9%) |
| Computers, Engineering & Science | 293 (71.6%) | 116 (28.4%) |
| Computers & Mathematics | 106 (70.7%) | 44 (29.3%) |
| Architecture & Engineering | 155 (81.6%) | 35 (18.4%) |
| Life, Physical & Social Science | 32 (46.4%) | 37 (53.6%) |
| Community & Social Service | 168 (23.3%) | 552 (76.7%) |
| Education, Arts & Media | 21 (21.0%) | 79 (79.0%) |
| Legal Services & Support | 9 (20.9%) | 34 (79.1%) |
| Education Instruction & Library | 94 (19.6%) | 385 (80.4%) |
| Arts, Media & Entertainment | 44 (44.9%) | 54 (55.1%) |
| Health Diagnosing & Treating | 70 (29.8%) | 165 (70.2%) |
| Health Technologists | 11 (12.1%) | 80 (87.9%) |
| Total (Category) | 888 (41.7%) | 1,241 (58.3%) |
| Total (Overall) | 2,731 (48.8%) | 2,867 (51.2%) |
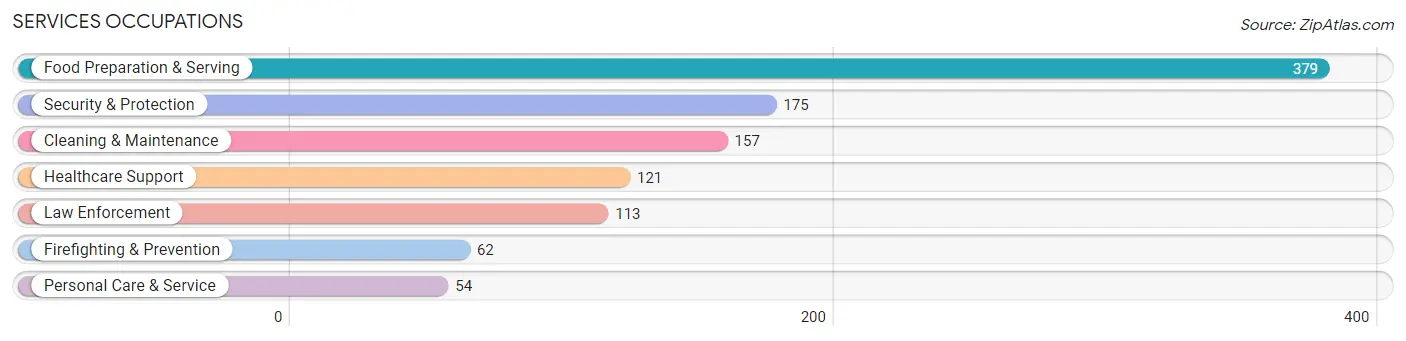
Services Occupations
The most common Services occupations in Waipio are Food Preparation & Serving (379 | 6.8%), Security & Protection (175 | 3.1%), Cleaning & Maintenance (157 | 2.8%), Healthcare Support (121 | 2.2%), and Law Enforcement (113 | 2.0%).
Services Occupations by Sex
Within the Services occupations in Waipio, the most male-oriented occupations are Firefighting & Prevention (91.9%), Security & Protection (85.1%), and Law Enforcement (81.4%), while the most female-oriented occupations are Healthcare Support (100.0%), Personal Care & Service (68.5%), and Food Preparation & Serving (57.5%).
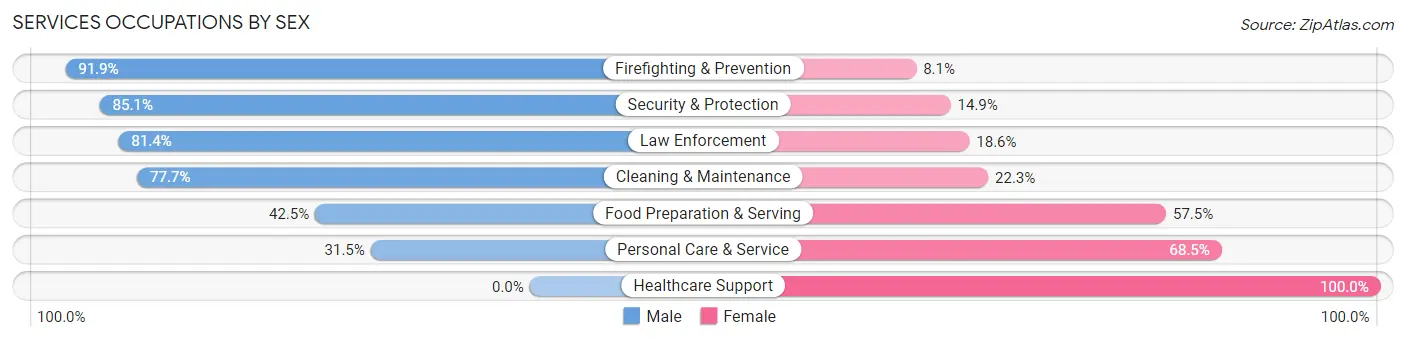
| Occupation | Male | Female |
| Healthcare Support | 0 (0.0%) | 121 (100.0%) |
| Security & Protection | 149 (85.1%) | 26 (14.9%) |
| Firefighting & Prevention | 57 (91.9%) | 5 (8.1%) |
| Law Enforcement | 92 (81.4%) | 21 (18.6%) |
| Food Preparation & Serving | 161 (42.5%) | 218 (57.5%) |
| Cleaning & Maintenance | 122 (77.7%) | 35 (22.3%) |
| Personal Care & Service | 17 (31.5%) | 37 (68.5%) |
| Total (Category) | 449 (50.7%) | 437 (49.3%) |
| Total (Overall) | 2,731 (48.8%) | 2,867 (51.2%) |
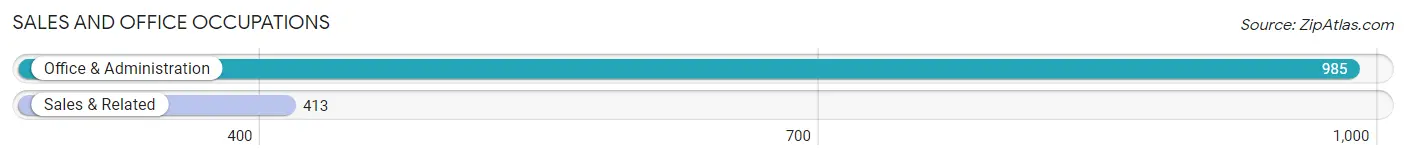
Sales and Office Occupations
The most common Sales and Office occupations in Waipio are Office & Administration (985 | 17.6%), and Sales & Related (413 | 7.4%).
Sales and Office Occupations by Sex
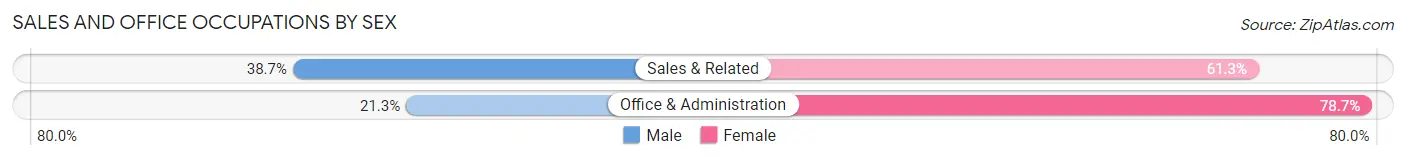
| Occupation | Male | Female |
| Sales & Related | 160 (38.7%) | 253 (61.3%) |
| Office & Administration | 210 (21.3%) | 775 (78.7%) |
| Total (Category) | 370 (26.5%) | 1,028 (73.5%) |
| Total (Overall) | 2,731 (48.8%) | 2,867 (51.2%) |
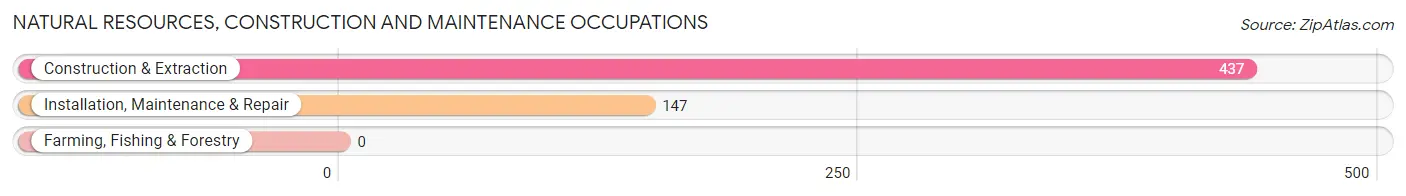
Natural Resources, Construction and Maintenance Occupations
The most common Natural Resources, Construction and Maintenance occupations in Waipio are Construction & Extraction (437 | 7.8%), and Installation, Maintenance & Repair (147 | 2.6%).
Natural Resources, Construction and Maintenance Occupations by Sex
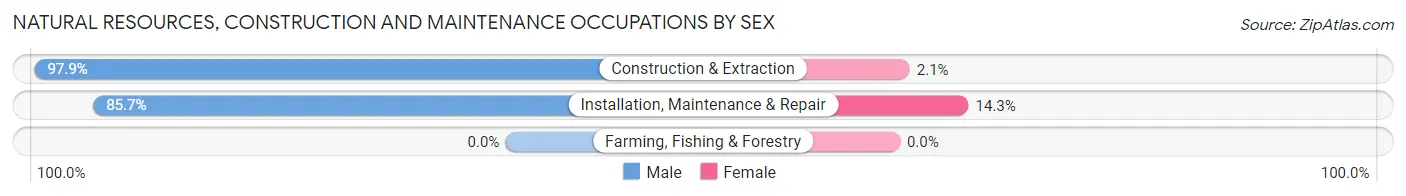
| Occupation | Male | Female |
| Farming, Fishing & Forestry | 0 (0.0%) | 0 (0.0%) |
| Construction & Extraction | 428 (97.9%) | 9 (2.1%) |
| Installation, Maintenance & Repair | 126 (85.7%) | 21 (14.3%) |
| Total (Category) | 554 (94.9%) | 30 (5.1%) |
| Total (Overall) | 2,731 (48.8%) | 2,867 (51.2%) |
Production, Transportation and Moving Occupations
The most common Production, Transportation and Moving occupations in Waipio are Production (271 | 4.8%), Material Moving (203 | 3.6%), and Transportation (127 | 2.3%).
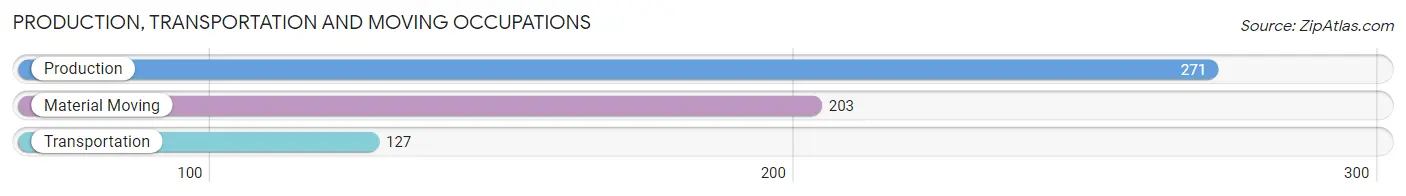
Production, Transportation and Moving Occupations by Sex
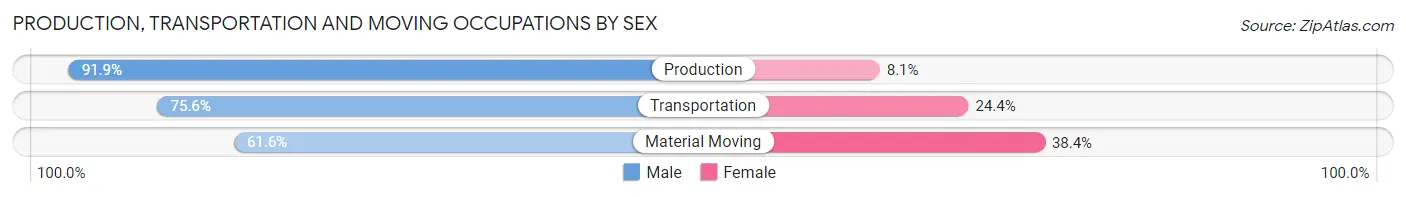
| Occupation | Male | Female |
| Production | 249 (91.9%) | 22 (8.1%) |
| Transportation | 96 (75.6%) | 31 (24.4%) |
| Material Moving | 125 (61.6%) | 78 (38.4%) |
| Total (Category) | 470 (78.2%) | 131 (21.8%) |
| Total (Overall) | 2,731 (48.8%) | 2,867 (51.2%) |
Employment Industries by Sex in Waipio
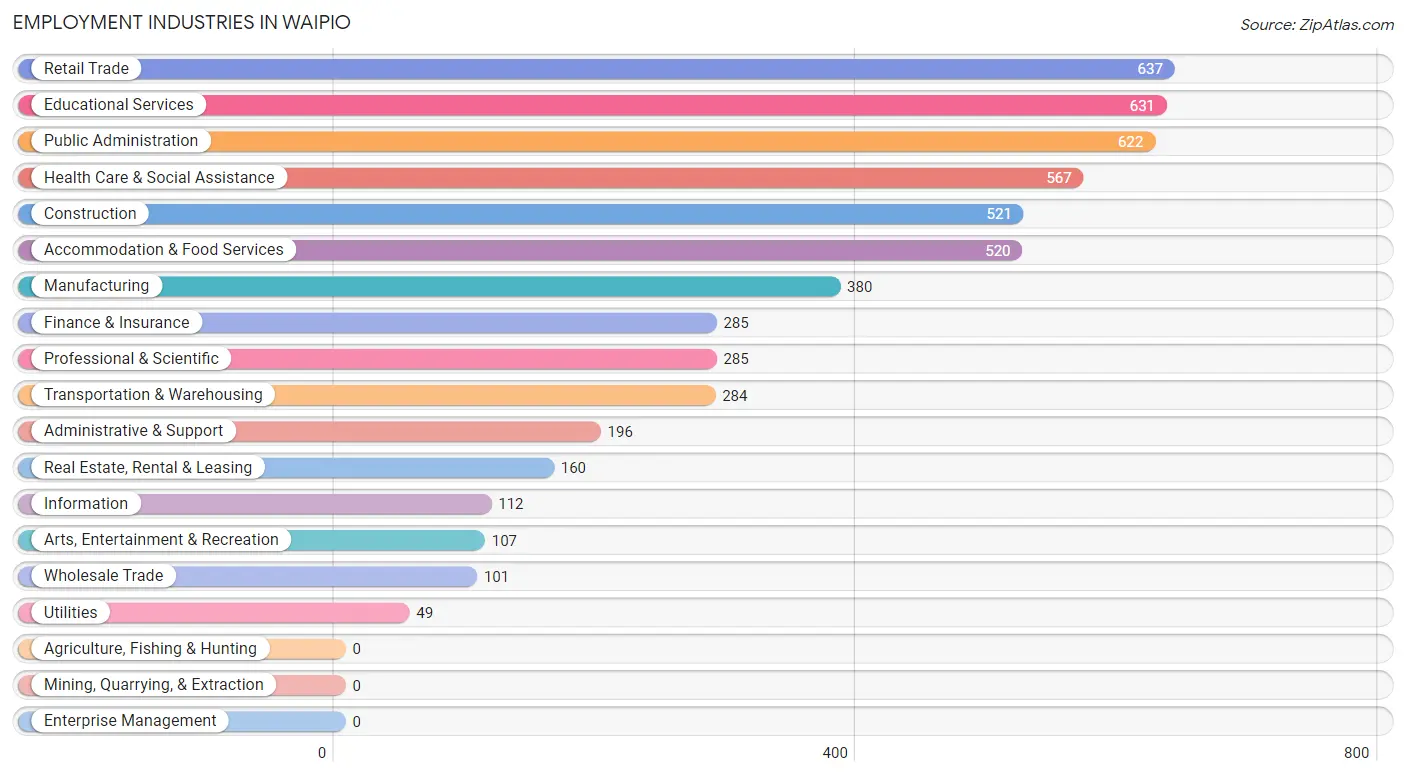
Employment Industries in Waipio
The major employment industries in Waipio include Retail Trade (637 | 11.4%), Educational Services (631 | 11.3%), Public Administration (622 | 11.1%), Health Care & Social Assistance (567 | 10.1%), and Construction (521 | 9.3%).
Employment Industries by Sex in Waipio
The Waipio industries that see more men than women are Construction (88.9%), Administrative & Support (76.0%), and Utilities (75.5%), whereas the industries that tend to have a higher number of women are Arts, Entertainment & Recreation (91.6%), Finance & Insurance (77.2%), and Educational Services (76.5%).
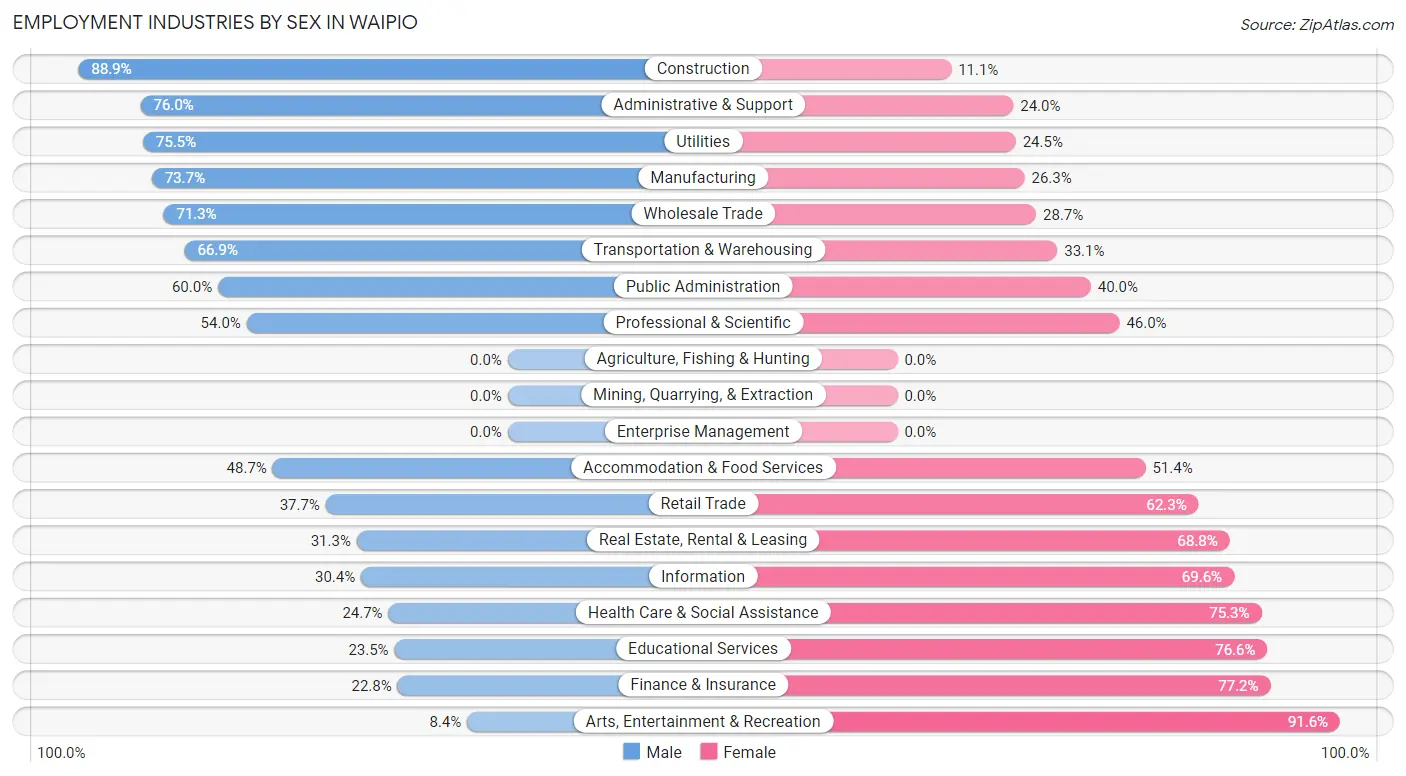
| Industry | Male | Female |
| Agriculture, Fishing & Hunting | 0 (0.0%) | 0 (0.0%) |
| Mining, Quarrying, & Extraction | 0 (0.0%) | 0 (0.0%) |
| Construction | 463 (88.9%) | 58 (11.1%) |
| Manufacturing | 280 (73.7%) | 100 (26.3%) |
| Wholesale Trade | 72 (71.3%) | 29 (28.7%) |
| Retail Trade | 240 (37.7%) | 397 (62.3%) |
| Transportation & Warehousing | 190 (66.9%) | 94 (33.1%) |
| Utilities | 37 (75.5%) | 12 (24.5%) |
| Information | 34 (30.4%) | 78 (69.6%) |
| Finance & Insurance | 65 (22.8%) | 220 (77.2%) |
| Real Estate, Rental & Leasing | 50 (31.2%) | 110 (68.8%) |
| Professional & Scientific | 154 (54.0%) | 131 (46.0%) |
| Enterprise Management | 0 (0.0%) | 0 (0.0%) |
| Administrative & Support | 149 (76.0%) | 47 (24.0%) |
| Educational Services | 148 (23.4%) | 483 (76.5%) |
| Health Care & Social Assistance | 140 (24.7%) | 427 (75.3%) |
| Arts, Entertainment & Recreation | 9 (8.4%) | 98 (91.6%) |
| Accommodation & Food Services | 253 (48.6%) | 267 (51.3%) |
| Public Administration | 373 (60.0%) | 249 (40.0%) |
| Total | 2,731 (48.8%) | 2,867 (51.2%) |
Education in Waipio
School Enrollment in Waipio
The most common levels of schooling among the 2,070 students in Waipio are high school (588 | 28.4%), college / undergraduate (511 | 24.7%), and middle school (371 | 17.9%).
| School Level | # Students | % Students |
| Nursery / Preschool | 124 | 6.0% |
| Kindergarten | 61 | 2.9% |
| Elementary School | 339 | 16.4% |
| Middle School | 371 | 17.9% |
| High School | 588 | 28.4% |
| College / Undergraduate | 511 | 24.7% |
| Graduate / Professional | 76 | 3.7% |
| Total | 2,070 | 100.0% |
School Enrollment by Age by Funding Source in Waipio
Out of a total of 2,070 students who are enrolled in schools in Waipio, 524 (25.3%) attend a private institution, while the remaining 1,546 (74.7%) are enrolled in public schools. The age group of 3 to 4 year olds has the highest likelihood of being enrolled in private schools, with 77 (81.9% in the age bracket) enrolled. Conversely, the age group of 35 years and over has the lowest likelihood of being enrolled in a private school, with 102 (90.3% in the age bracket) attending a public institution.
| Age Bracket | Public School | Private School |
| 3 to 4 Year Olds | 17 (18.1%) | 77 (81.9%) |
| 5 to 9 Year Old | 314 (76.4%) | 97 (23.6%) |
| 10 to 14 Year Olds | 424 (85.7%) | 71 (14.3%) |
| 15 to 17 Year Olds | 347 (81.8%) | 77 (18.2%) |
| 18 to 19 Year Olds | 94 (74.6%) | 32 (25.4%) |
| 20 to 24 Year Olds | 184 (88.0%) | 25 (12.0%) |
| 25 to 34 Year Olds | 64 (32.3%) | 134 (67.7%) |
| 35 Years and over | 102 (90.3%) | 11 (9.7%) |
| Total | 1,546 (74.7%) | 524 (25.3%) |
Educational Attainment by Field of Study in Waipio
Social sciences (439 | 17.6%), business (393 | 15.7%), education (314 | 12.6%), science & technology (262 | 10.5%), and arts & humanities (178 | 7.1%) are the most common fields of study among 2,498 individuals in Waipio who have obtained a bachelor's degree or higher.
| Field of Study | # Graduates | % Graduates |
| Computers & Mathematics | 76 | 3.0% |
| Bio, Nature & Agricultural | 78 | 3.1% |
| Physical & Health Sciences | 61 | 2.4% |
| Psychology | 146 | 5.8% |
| Social Sciences | 439 | 17.6% |
| Engineering | 173 | 6.9% |
| Multidisciplinary Studies | 0 | 0.0% |
| Science & Technology | 262 | 10.5% |
| Business | 393 | 15.7% |
| Education | 314 | 12.6% |
| Literature & Languages | 82 | 3.3% |
| Liberal Arts & History | 101 | 4.0% |
| Visual & Performing Arts | 71 | 2.8% |
| Communications | 124 | 5.0% |
| Arts & Humanities | 178 | 7.1% |
| Total | 2,498 | 100.0% |
Transportation & Commute in Waipio
Vehicle Availability by Sex in Waipio
The most prevalent vehicle ownership categories in Waipio are males with 2 vehicles (1,247, accounting for 43.9%) and females with 2 vehicles (1,216, making up 44.1%).
| Vehicles Available | Male | Female |
| No Vehicle | 54 (1.9%) | 10 (0.4%) |
| 1 Vehicle | 470 (16.6%) | 616 (21.8%) |
| 2 Vehicles | 1,247 (43.9%) | 1,216 (42.9%) |
| 3 Vehicles | 613 (21.6%) | 521 (18.4%) |
| 4 Vehicles | 213 (7.5%) | 221 (7.8%) |
| 5 or more Vehicles | 241 (8.5%) | 247 (8.7%) |
| Total | 2,838 (100.0%) | 2,831 (100.0%) |
Commute Time in Waipio
The most frequently occuring commute durations in Waipio are 30 to 34 minutes (1,407 commuters, 25.9%), 15 to 19 minutes (715 commuters, 13.2%), and 20 to 24 minutes (699 commuters, 12.9%).
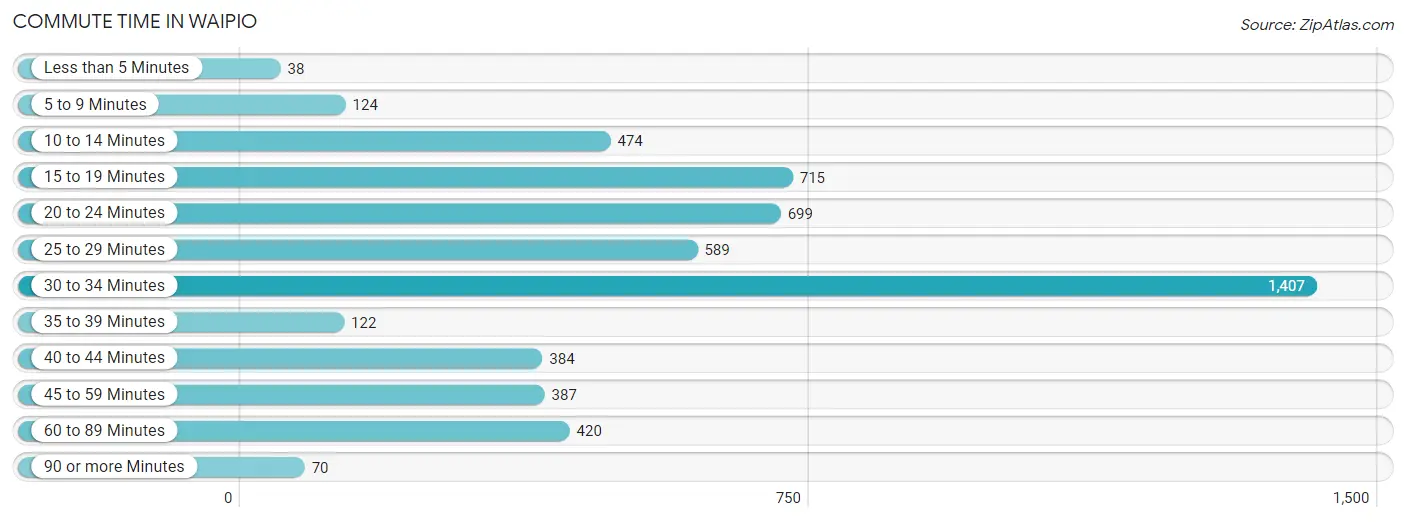
| Commute Time | # Commuters | % Commuters |
| Less than 5 Minutes | 38 | 0.7% |
| 5 to 9 Minutes | 124 | 2.3% |
| 10 to 14 Minutes | 474 | 8.7% |
| 15 to 19 Minutes | 715 | 13.2% |
| 20 to 24 Minutes | 699 | 12.9% |
| 25 to 29 Minutes | 589 | 10.8% |
| 30 to 34 Minutes | 1,407 | 25.9% |
| 35 to 39 Minutes | 122 | 2.2% |
| 40 to 44 Minutes | 384 | 7.1% |
| 45 to 59 Minutes | 387 | 7.1% |
| 60 to 89 Minutes | 420 | 7.7% |
| 90 or more Minutes | 70 | 1.3% |
Commute Time by Sex in Waipio
The most common commute times in Waipio are 30 to 34 minutes (908 commuters, 32.6%) for males and 30 to 34 minutes (499 commuters, 18.9%) for females.
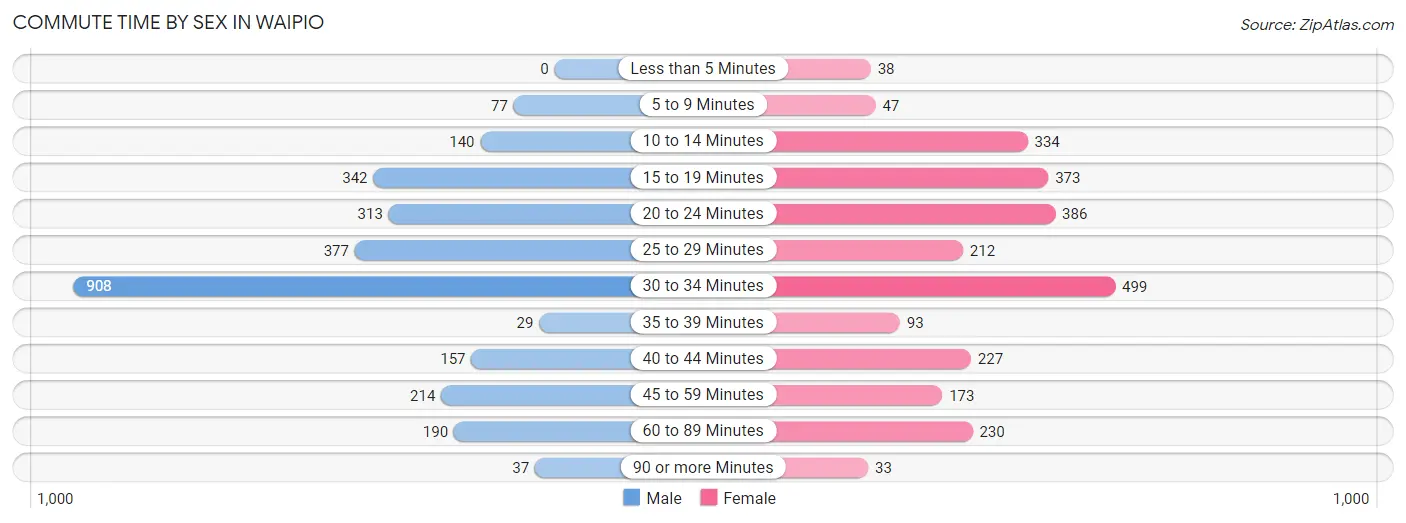
| Commute Time | Male | Female |
| Less than 5 Minutes | 0 (0.0%) | 38 (1.4%) |
| 5 to 9 Minutes | 77 (2.8%) | 47 (1.8%) |
| 10 to 14 Minutes | 140 (5.0%) | 334 (12.6%) |
| 15 to 19 Minutes | 342 (12.3%) | 373 (14.1%) |
| 20 to 24 Minutes | 313 (11.2%) | 386 (14.6%) |
| 25 to 29 Minutes | 377 (13.5%) | 212 (8.0%) |
| 30 to 34 Minutes | 908 (32.6%) | 499 (18.9%) |
| 35 to 39 Minutes | 29 (1.0%) | 93 (3.5%) |
| 40 to 44 Minutes | 157 (5.6%) | 227 (8.6%) |
| 45 to 59 Minutes | 214 (7.7%) | 173 (6.5%) |
| 60 to 89 Minutes | 190 (6.8%) | 230 (8.7%) |
| 90 or more Minutes | 37 (1.3%) | 33 (1.3%) |
Time of Departure to Work by Sex in Waipio
The most frequent times of departure to work in Waipio are 5:30 AM to 5:59 AM (427, 15.3%) for males and 6:30 AM to 6:59 AM (493, 18.6%) for females.
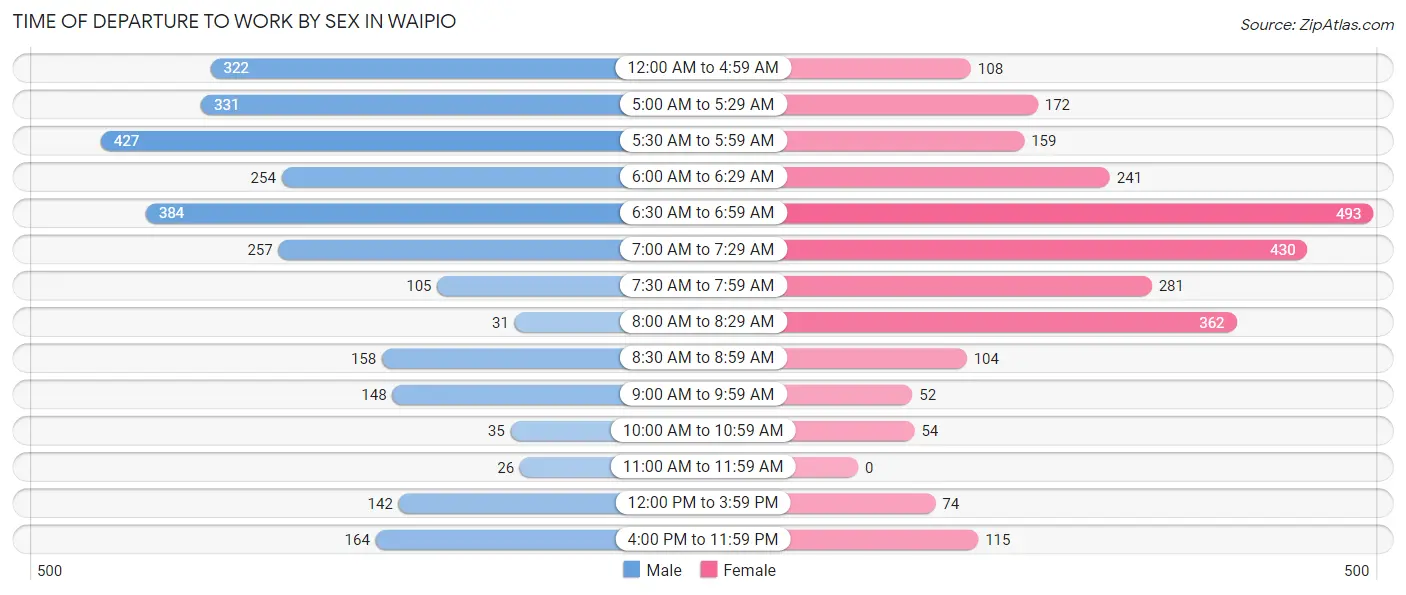
| Time of Departure | Male | Female |
| 12:00 AM to 4:59 AM | 322 (11.6%) | 108 (4.1%) |
| 5:00 AM to 5:29 AM | 331 (11.9%) | 172 (6.5%) |
| 5:30 AM to 5:59 AM | 427 (15.3%) | 159 (6.0%) |
| 6:00 AM to 6:29 AM | 254 (9.1%) | 241 (9.1%) |
| 6:30 AM to 6:59 AM | 384 (13.8%) | 493 (18.6%) |
| 7:00 AM to 7:29 AM | 257 (9.2%) | 430 (16.3%) |
| 7:30 AM to 7:59 AM | 105 (3.8%) | 281 (10.6%) |
| 8:00 AM to 8:29 AM | 31 (1.1%) | 362 (13.7%) |
| 8:30 AM to 8:59 AM | 158 (5.7%) | 104 (3.9%) |
| 9:00 AM to 9:59 AM | 148 (5.3%) | 52 (2.0%) |
| 10:00 AM to 10:59 AM | 35 (1.3%) | 54 (2.0%) |
| 11:00 AM to 11:59 AM | 26 (0.9%) | 0 (0.0%) |
| 12:00 PM to 3:59 PM | 142 (5.1%) | 74 (2.8%) |
| 4:00 PM to 11:59 PM | 164 (5.9%) | 115 (4.3%) |
| Total | 2,784 (100.0%) | 2,645 (100.0%) |
Housing Occupancy in Waipio
Occupancy by Ownership in Waipio
Of the total 4,098 dwellings in Waipio, owner-occupied units account for 3,018 (73.7%), while renter-occupied units make up 1,080 (26.4%).
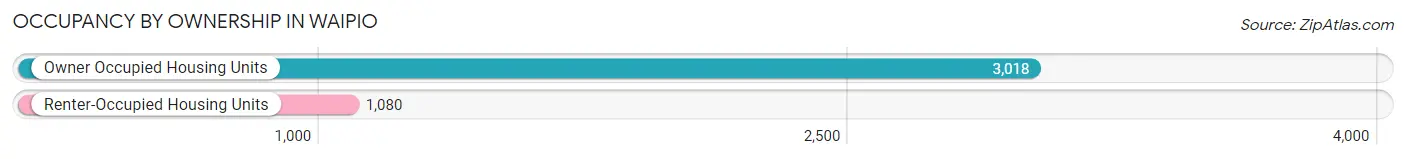
| Occupancy | # Housing Units | % Housing Units |
| Owner Occupied Housing Units | 3,018 | 73.7% |
| Renter-Occupied Housing Units | 1,080 | 26.4% |
| Total Occupied Housing Units | 4,098 | 100.0% |
Occupancy by Household Size in Waipio
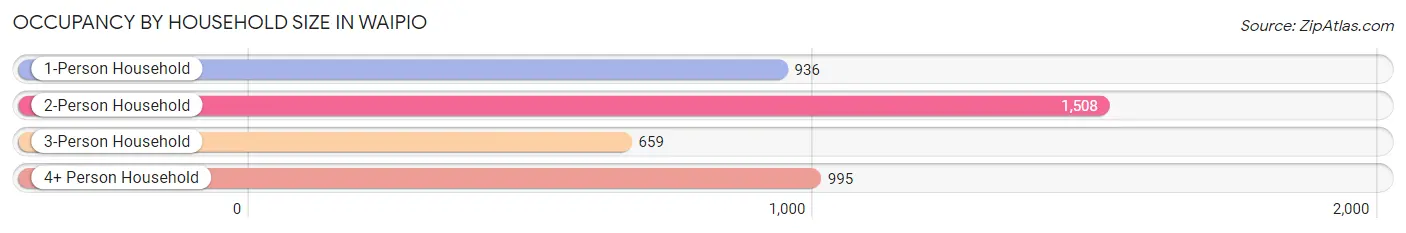
| Household Size | # Housing Units | % Housing Units |
| 1-Person Household | 936 | 22.8% |
| 2-Person Household | 1,508 | 36.8% |
| 3-Person Household | 659 | 16.1% |
| 4+ Person Household | 995 | 24.3% |
| Total Housing Units | 4,098 | 100.0% |
Occupancy by Ownership by Household Size in Waipio
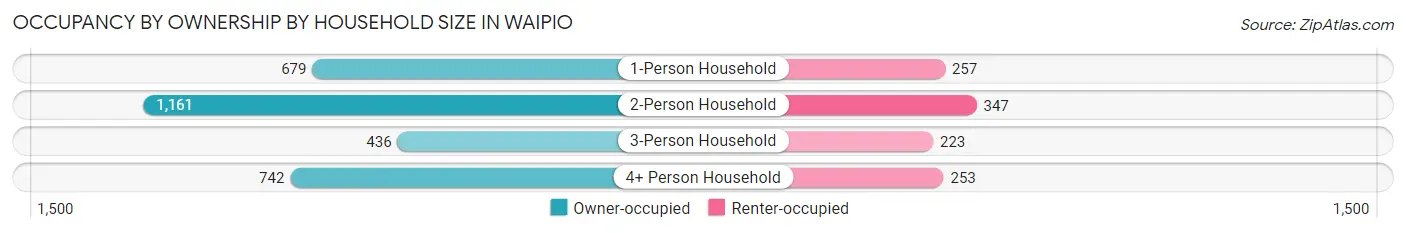
| Household Size | Owner-occupied | Renter-occupied |
| 1-Person Household | 679 (72.5%) | 257 (27.5%) |
| 2-Person Household | 1,161 (77.0%) | 347 (23.0%) |
| 3-Person Household | 436 (66.2%) | 223 (33.8%) |
| 4+ Person Household | 742 (74.6%) | 253 (25.4%) |
| Total Housing Units | 3,018 (73.7%) | 1,080 (26.4%) |
Occupancy by Educational Attainment in Waipio
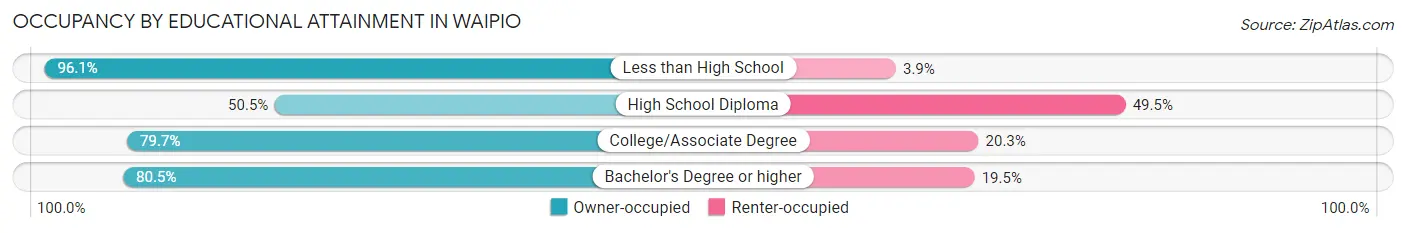
| Household Size | Owner-occupied | Renter-occupied |
| Less than High School | 122 (96.1%) | 5 (3.9%) |
| High School Diploma | 483 (50.5%) | 473 (49.5%) |
| College/Associate Degree | 1,330 (79.7%) | 339 (20.3%) |
| Bachelor's Degree or higher | 1,083 (80.5%) | 263 (19.5%) |
Occupancy by Age of Householder in Waipio
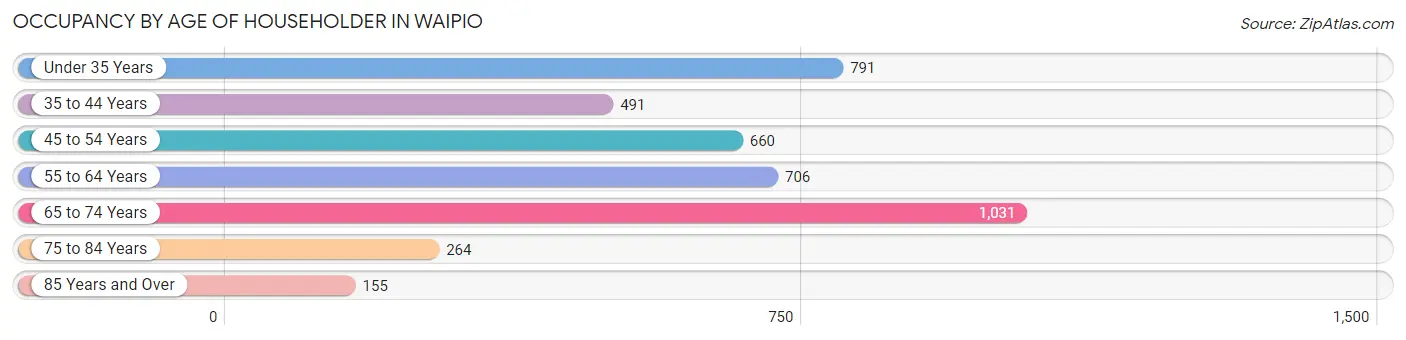
| Age Bracket | # Households | % Households |
| Under 35 Years | 791 | 19.3% |
| 35 to 44 Years | 491 | 12.0% |
| 45 to 54 Years | 660 | 16.1% |
| 55 to 64 Years | 706 | 17.2% |
| 65 to 74 Years | 1,031 | 25.2% |
| 75 to 84 Years | 264 | 6.4% |
| 85 Years and Over | 155 | 3.8% |
| Total | 4,098 | 100.0% |
Housing Finances in Waipio
Median Income by Occupancy in Waipio
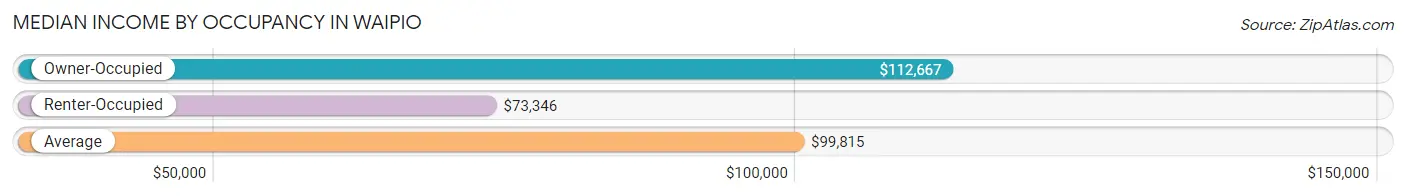
| Occupancy Type | # Households | Median Income |
| Owner-Occupied | 3,018 (73.7%) | $112,667 |
| Renter-Occupied | 1,080 (26.4%) | $73,346 |
| Average | 4,098 (100.0%) | $99,815 |
Occupancy by Householder Income Bracket in Waipio
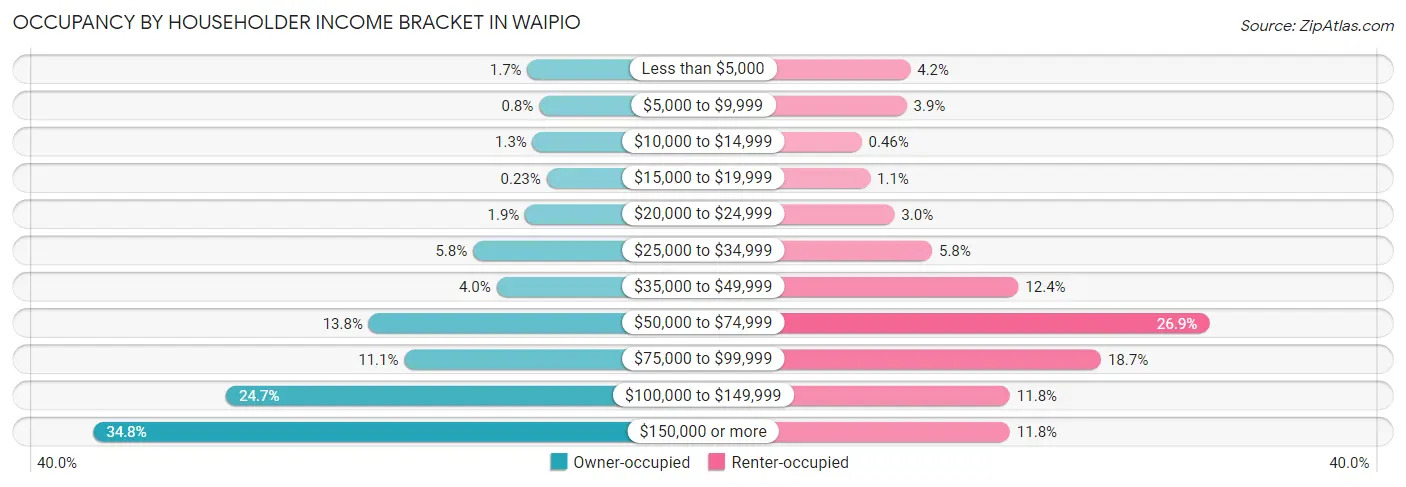
| Income Bracket | Owner-occupied | Renter-occupied |
| Less than $5,000 | 51 (1.7%) | 45 (4.2%) |
| $5,000 to $9,999 | 24 (0.8%) | 42 (3.9%) |
| $10,000 to $14,999 | 39 (1.3%) | 5 (0.5%) |
| $15,000 to $19,999 | 7 (0.2%) | 12 (1.1%) |
| $20,000 to $24,999 | 56 (1.9%) | 32 (3.0%) |
| $25,000 to $34,999 | 176 (5.8%) | 63 (5.8%) |
| $35,000 to $49,999 | 122 (4.0%) | 134 (12.4%) |
| $50,000 to $74,999 | 416 (13.8%) | 291 (26.9%) |
| $75,000 to $99,999 | 334 (11.1%) | 202 (18.7%) |
| $100,000 to $149,999 | 744 (24.6%) | 127 (11.8%) |
| $150,000 or more | 1,049 (34.8%) | 127 (11.8%) |
| Total | 3,018 (100.0%) | 1,080 (100.0%) |
Monthly Housing Cost Tiers in Waipio
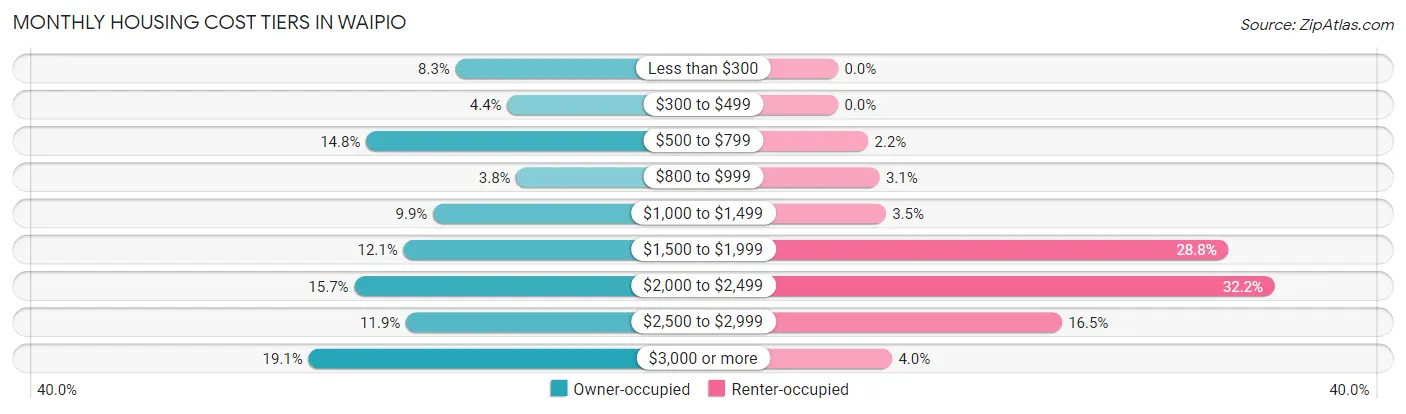
| Monthly Cost | Owner-occupied | Renter-occupied |
| Less than $300 | 249 (8.3%) | 0 (0.0%) |
| $300 to $499 | 134 (4.4%) | 0 (0.0%) |
| $500 to $799 | 448 (14.8%) | 24 (2.2%) |
| $800 to $999 | 114 (3.8%) | 33 (3.1%) |
| $1,000 to $1,499 | 299 (9.9%) | 38 (3.5%) |
| $1,500 to $1,999 | 365 (12.1%) | 311 (28.8%) |
| $2,000 to $2,499 | 474 (15.7%) | 348 (32.2%) |
| $2,500 to $2,999 | 359 (11.9%) | 178 (16.5%) |
| $3,000 or more | 576 (19.1%) | 43 (4.0%) |
| Total | 3,018 (100.0%) | 1,080 (100.0%) |
Physical Housing Characteristics in Waipio
Housing Structures in Waipio
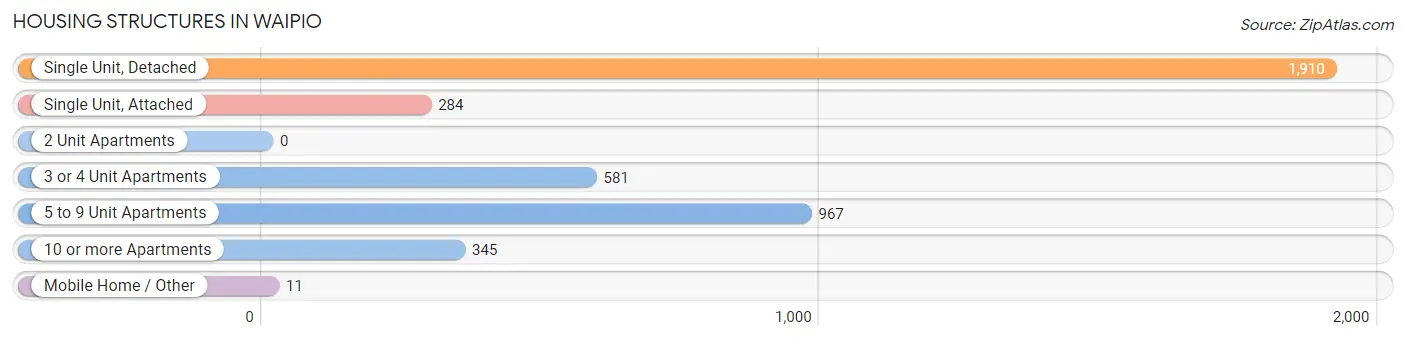
| Structure Type | # Housing Units | % Housing Units |
| Single Unit, Detached | 1,910 | 46.6% |
| Single Unit, Attached | 284 | 6.9% |
| 2 Unit Apartments | 0 | 0.0% |
| 3 or 4 Unit Apartments | 581 | 14.2% |
| 5 to 9 Unit Apartments | 967 | 23.6% |
| 10 or more Apartments | 345 | 8.4% |
| Mobile Home / Other | 11 | 0.3% |
| Total | 4,098 | 100.0% |
Housing Structures by Occupancy in Waipio
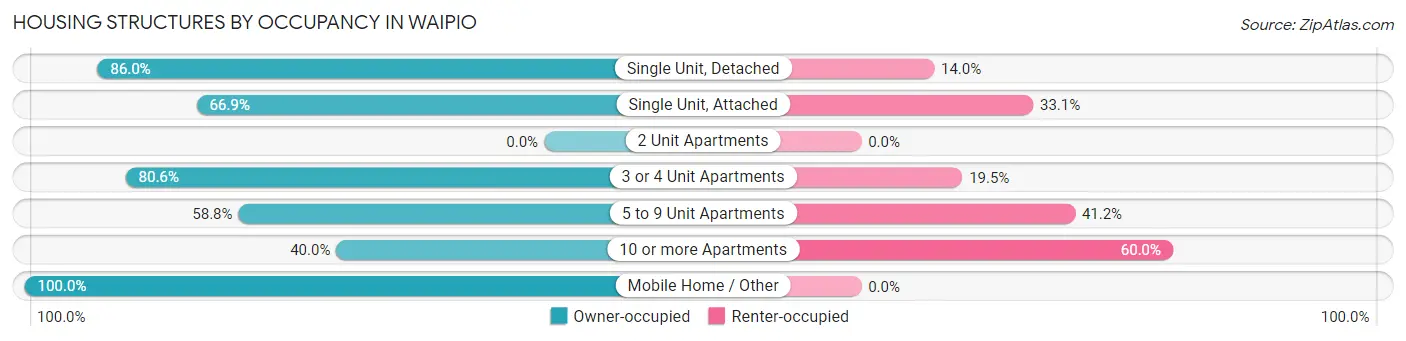
| Structure Type | Owner-occupied | Renter-occupied |
| Single Unit, Detached | 1,642 (86.0%) | 268 (14.0%) |
| Single Unit, Attached | 190 (66.9%) | 94 (33.1%) |
| 2 Unit Apartments | 0 (0.0%) | 0 (0.0%) |
| 3 or 4 Unit Apartments | 468 (80.5%) | 113 (19.5%) |
| 5 to 9 Unit Apartments | 569 (58.8%) | 398 (41.2%) |
| 10 or more Apartments | 138 (40.0%) | 207 (60.0%) |
| Mobile Home / Other | 11 (100.0%) | 0 (0.0%) |
| Total | 3,018 (73.7%) | 1,080 (26.4%) |
Housing Structures by Number of Rooms in Waipio
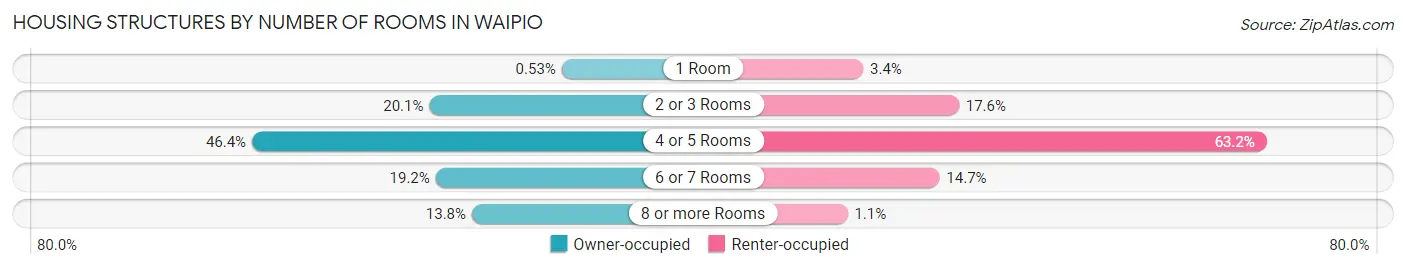
| Number of Rooms | Owner-occupied | Renter-occupied |
| 1 Room | 16 (0.5%) | 37 (3.4%) |
| 2 or 3 Rooms | 607 (20.1%) | 190 (17.6%) |
| 4 or 5 Rooms | 1,399 (46.4%) | 682 (63.1%) |
| 6 or 7 Rooms | 579 (19.2%) | 159 (14.7%) |
| 8 or more Rooms | 417 (13.8%) | 12 (1.1%) |
| Total | 3,018 (100.0%) | 1,080 (100.0%) |
Housing Structure by Heating Type in Waipio
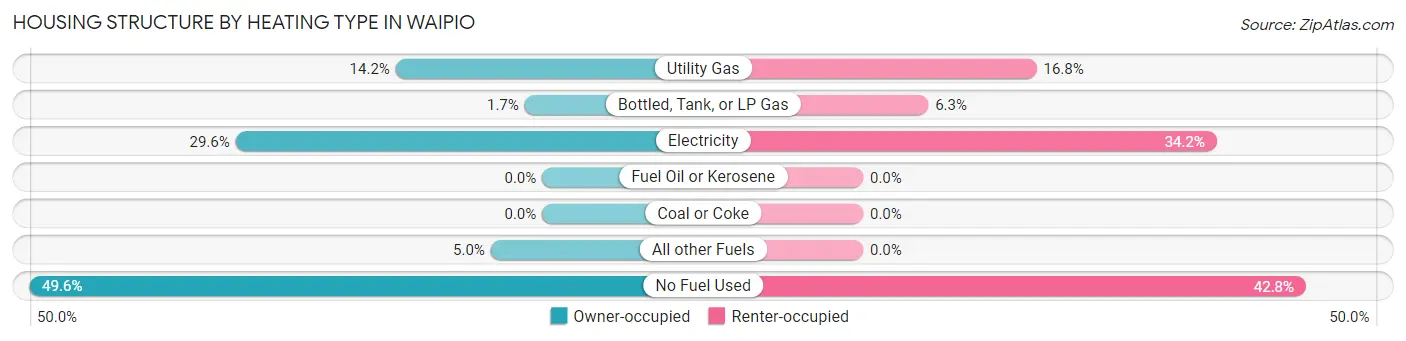
| Heating Type | Owner-occupied | Renter-occupied |
| Utility Gas | 427 (14.1%) | 181 (16.8%) |
| Bottled, Tank, or LP Gas | 51 (1.7%) | 68 (6.3%) |
| Electricity | 894 (29.6%) | 369 (34.2%) |
| Fuel Oil or Kerosene | 0 (0.0%) | 0 (0.0%) |
| Coal or Coke | 0 (0.0%) | 0 (0.0%) |
| All other Fuels | 150 (5.0%) | 0 (0.0%) |
| No Fuel Used | 1,496 (49.6%) | 462 (42.8%) |
| Total | 3,018 (100.0%) | 1,080 (100.0%) |
Household Vehicle Usage in Waipio
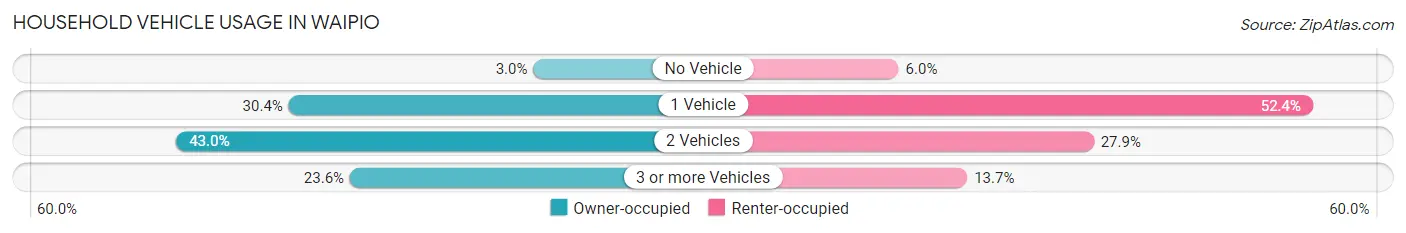
| Vehicles per Household | Owner-occupied | Renter-occupied |
| No Vehicle | 91 (3.0%) | 65 (6.0%) |
| 1 Vehicle | 918 (30.4%) | 566 (52.4%) |
| 2 Vehicles | 1,298 (43.0%) | 301 (27.9%) |
| 3 or more Vehicles | 711 (23.6%) | 148 (13.7%) |
| Total | 3,018 (100.0%) | 1,080 (100.0%) |
Real Estate & Mortgages in Waipio
Real Estate and Mortgage Overview in Waipio
| Characteristic | Without Mortgage | With Mortgage |
| Housing Units | 894 | 2,124 |
| Median Property Value | $598,700 | $685,300 |
| Median Household Income | $77,244 | $889 |
| Monthly Housing Costs | $539 | $572 |
| Real Estate Taxes | $1,552 | $152 |
Property Value by Mortgage Status in Waipio
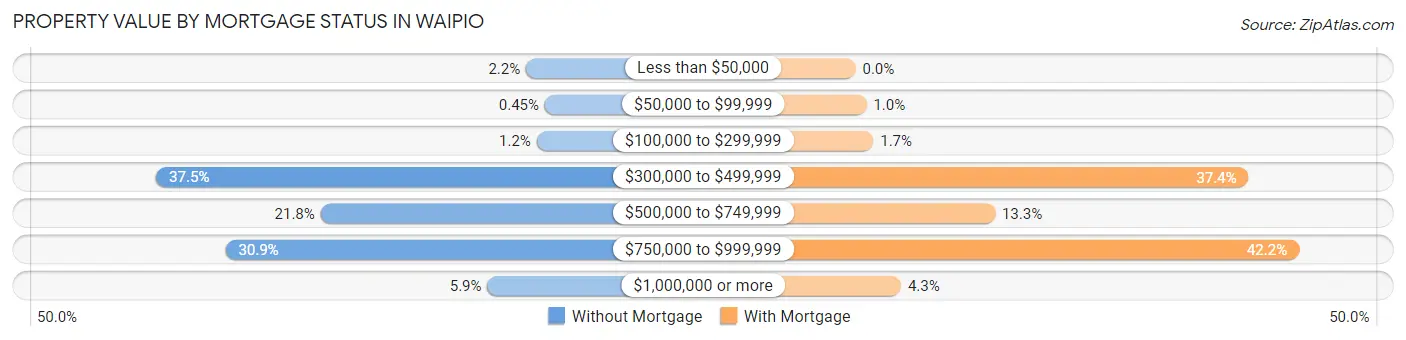
| Property Value | Without Mortgage | With Mortgage |
| Less than $50,000 | 20 (2.2%) | 0 (0.0%) |
| $50,000 to $99,999 | 4 (0.4%) | 22 (1.0%) |
| $100,000 to $299,999 | 11 (1.2%) | 36 (1.7%) |
| $300,000 to $499,999 | 335 (37.5%) | 795 (37.4%) |
| $500,000 to $749,999 | 195 (21.8%) | 282 (13.3%) |
| $750,000 to $999,999 | 276 (30.9%) | 897 (42.2%) |
| $1,000,000 or more | 53 (5.9%) | 92 (4.3%) |
| Total | 894 (100.0%) | 2,124 (100.0%) |
Household Income by Mortgage Status in Waipio
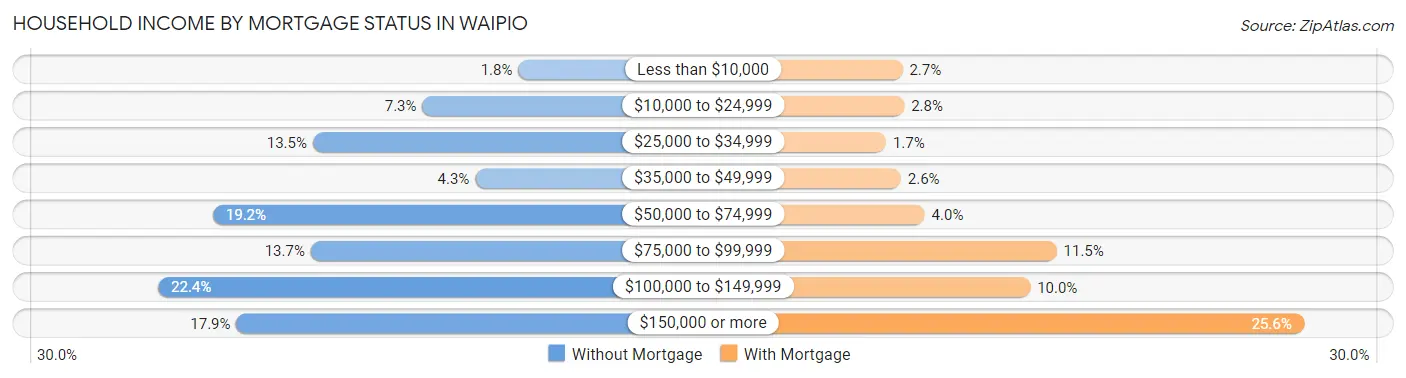
| Household Income | Without Mortgage | With Mortgage |
| Less than $10,000 | 16 (1.8%) | 57 (2.7%) |
| $10,000 to $24,999 | 65 (7.3%) | 59 (2.8%) |
| $25,000 to $34,999 | 121 (13.5%) | 37 (1.7%) |
| $35,000 to $49,999 | 38 (4.3%) | 55 (2.6%) |
| $50,000 to $74,999 | 172 (19.2%) | 84 (4.0%) |
| $75,000 to $99,999 | 122 (13.7%) | 244 (11.5%) |
| $100,000 to $149,999 | 200 (22.4%) | 212 (10.0%) |
| $150,000 or more | 160 (17.9%) | 544 (25.6%) |
| Total | 894 (100.0%) | 2,124 (100.0%) |
Property Value to Household Income Ratio in Waipio
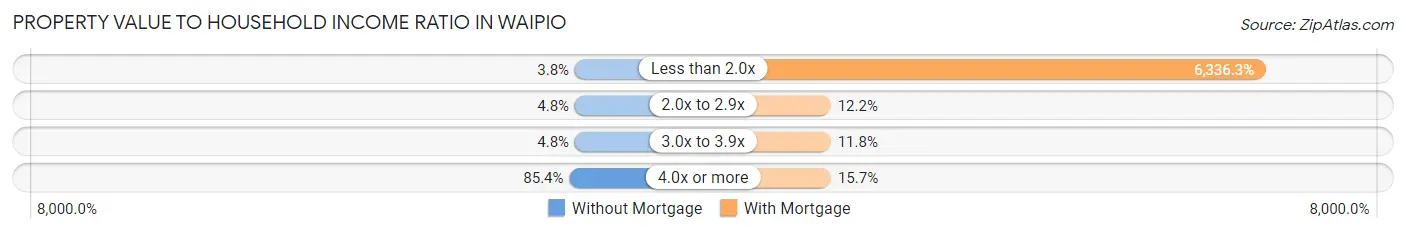
| Value-to-Income Ratio | Without Mortgage | With Mortgage |
| Less than 2.0x | 34 (3.8%) | 134,583 (6,336.3%) |
| 2.0x to 2.9x | 43 (4.8%) | 258 (12.1%) |
| 3.0x to 3.9x | 43 (4.8%) | 251 (11.8%) |
| 4.0x or more | 763 (85.4%) | 334 (15.7%) |
| Total | 894 (100.0%) | 2,124 (100.0%) |
Real Estate Taxes by Mortgage Status in Waipio
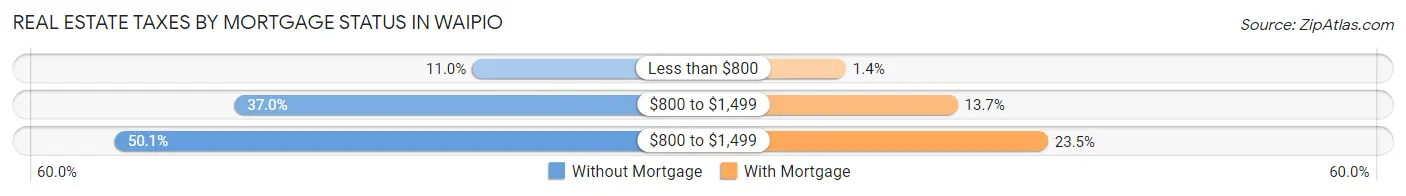
| Property Taxes | Without Mortgage | With Mortgage |
| Less than $800 | 98 (11.0%) | 30 (1.4%) |
| $800 to $1,499 | 331 (37.0%) | 290 (13.7%) |
| $800 to $1,499 | 448 (50.1%) | 500 (23.5%) |
| Total | 894 (100.0%) | 2,124 (100.0%) |
Health & Disability in Waipio
Health Insurance Coverage by Age in Waipio
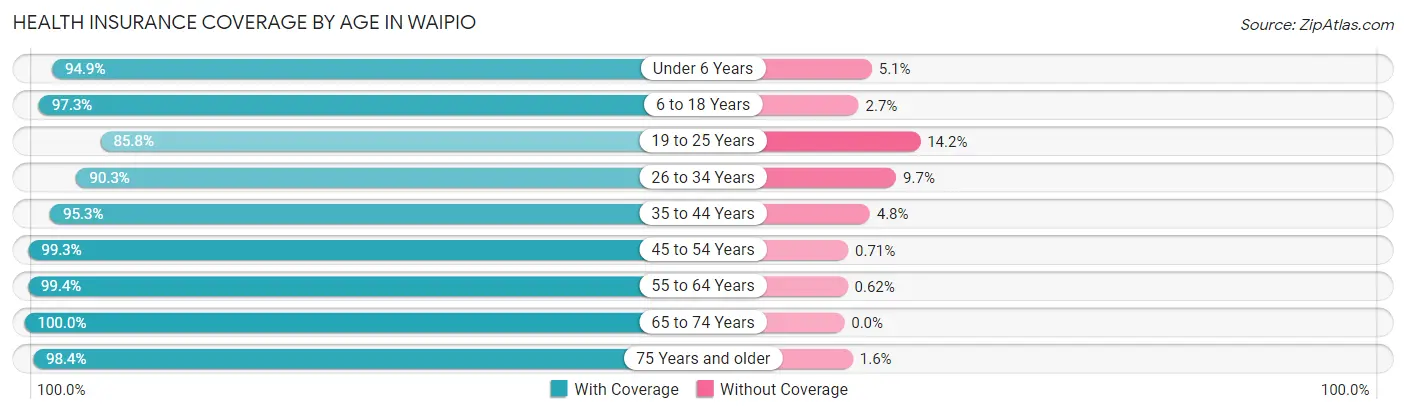
| Age Bracket | With Coverage | Without Coverage |
| Under 6 Years | 666 (94.9%) | 36 (5.1%) |
| 6 to 18 Years | 1,383 (97.3%) | 38 (2.7%) |
| 19 to 25 Years | 673 (85.8%) | 111 (14.2%) |
| 26 to 34 Years | 1,373 (90.3%) | 147 (9.7%) |
| 35 to 44 Years | 1,124 (95.3%) | 56 (4.8%) |
| 45 to 54 Years | 1,258 (99.3%) | 9 (0.7%) |
| 55 to 64 Years | 1,431 (99.4%) | 9 (0.6%) |
| 65 to 74 Years | 1,546 (100.0%) | 0 (0.0%) |
| 75 Years and older | 989 (98.4%) | 16 (1.6%) |
| Total | 10,443 (96.1%) | 422 (3.9%) |
Health Insurance Coverage by Citizenship Status in Waipio
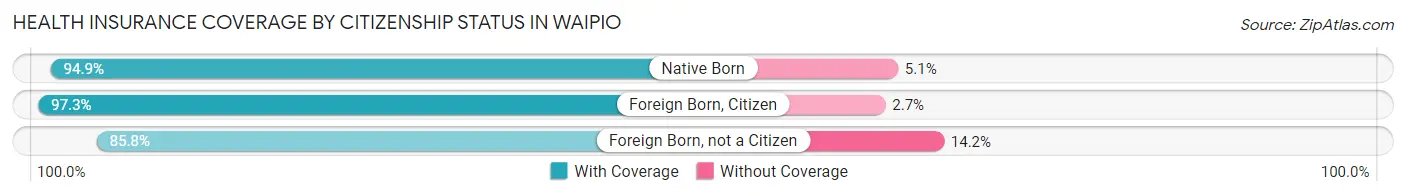
| Citizenship Status | With Coverage | Without Coverage |
| Native Born | 666 (94.9%) | 36 (5.1%) |
| Foreign Born, Citizen | 1,383 (97.3%) | 38 (2.7%) |
| Foreign Born, not a Citizen | 673 (85.8%) | 111 (14.2%) |
Health Insurance Coverage by Household Income in Waipio
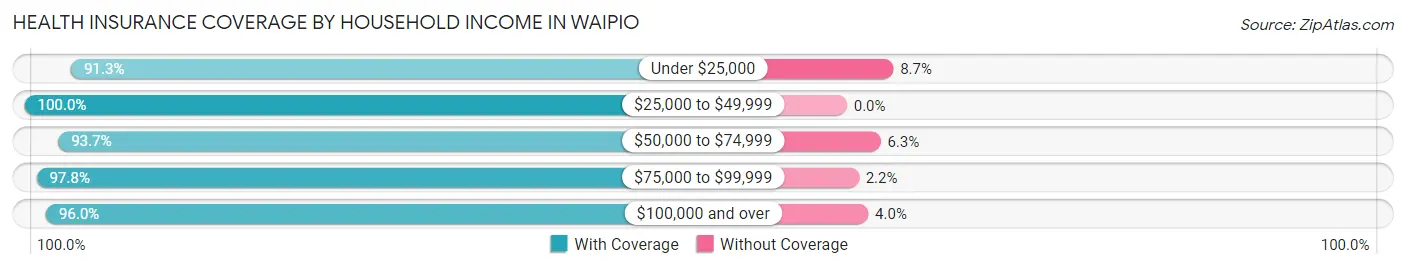
| Household Income | With Coverage | Without Coverage |
| Under $25,000 | 525 (91.3%) | 50 (8.7%) |
| $25,000 to $49,999 | 1,020 (100.0%) | 0 (0.0%) |
| $50,000 to $74,999 | 1,159 (93.7%) | 78 (6.3%) |
| $75,000 to $99,999 | 1,318 (97.8%) | 30 (2.2%) |
| $100,000 and over | 6,341 (96.0%) | 264 (4.0%) |
Public vs Private Health Insurance Coverage by Age in Waipio
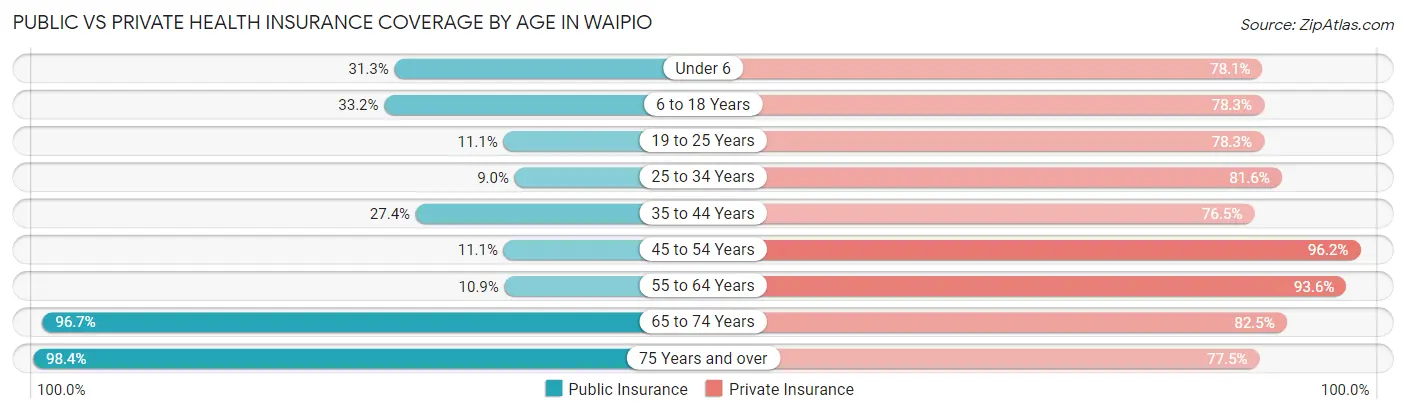
| Age Bracket | Public Insurance | Private Insurance |
| Under 6 | 220 (31.3%) | 548 (78.1%) |
| 6 to 18 Years | 472 (33.2%) | 1,113 (78.3%) |
| 19 to 25 Years | 87 (11.1%) | 614 (78.3%) |
| 25 to 34 Years | 137 (9.0%) | 1,241 (81.6%) |
| 35 to 44 Years | 323 (27.4%) | 903 (76.5%) |
| 45 to 54 Years | 140 (11.1%) | 1,219 (96.2%) |
| 55 to 64 Years | 157 (10.9%) | 1,348 (93.6%) |
| 65 to 74 Years | 1,495 (96.7%) | 1,276 (82.5%) |
| 75 Years and over | 989 (98.4%) | 779 (77.5%) |
| Total | 4,020 (37.0%) | 9,041 (83.2%) |
Disability Status by Sex by Age in Waipio
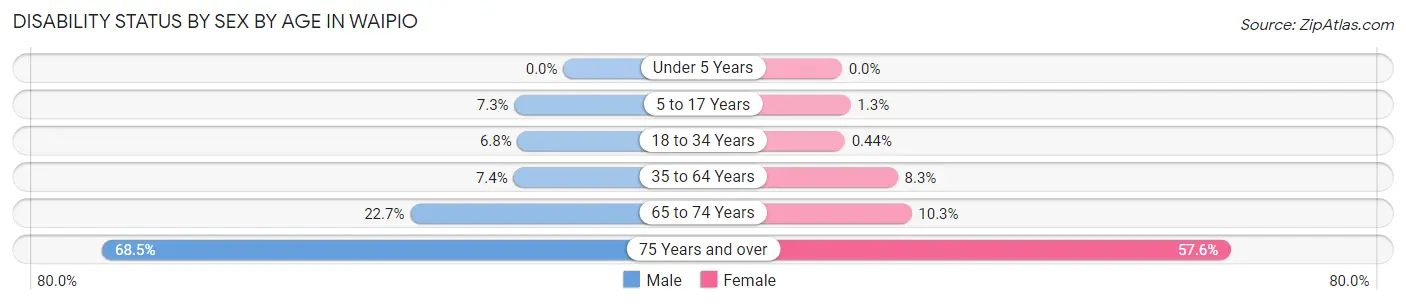
| Age Bracket | Male | Female |
| Under 5 Years | 0 (0.0%) | 0 (0.0%) |
| 5 to 17 Years | 58 (7.3%) | 8 (1.3%) |
| 18 to 34 Years | 86 (6.8%) | 5 (0.4%) |
| 35 to 64 Years | 132 (7.4%) | 174 (8.3%) |
| 65 to 74 Years | 171 (22.7%) | 82 (10.3%) |
| 75 Years and over | 276 (68.5%) | 347 (57.6%) |
Disability Class by Sex by Age in Waipio
Disability Class: Hearing Difficulty
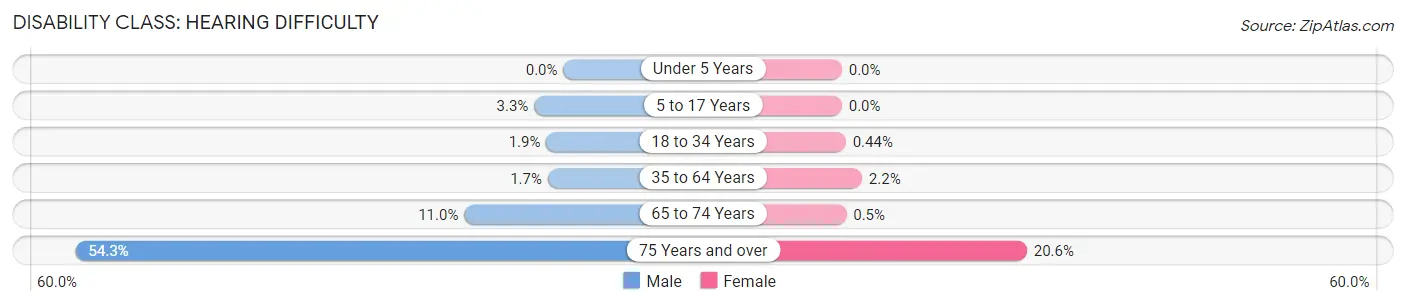
| Age Bracket | Male | Female |
| Under 5 Years | 0 (0.0%) | 0 (0.0%) |
| 5 to 17 Years | 26 (3.3%) | 0 (0.0%) |
| 18 to 34 Years | 24 (1.9%) | 5 (0.4%) |
| 35 to 64 Years | 31 (1.7%) | 47 (2.2%) |
| 65 to 74 Years | 83 (11.0%) | 4 (0.5%) |
| 75 Years and over | 219 (54.3%) | 124 (20.6%) |
Disability Class: Vision Difficulty
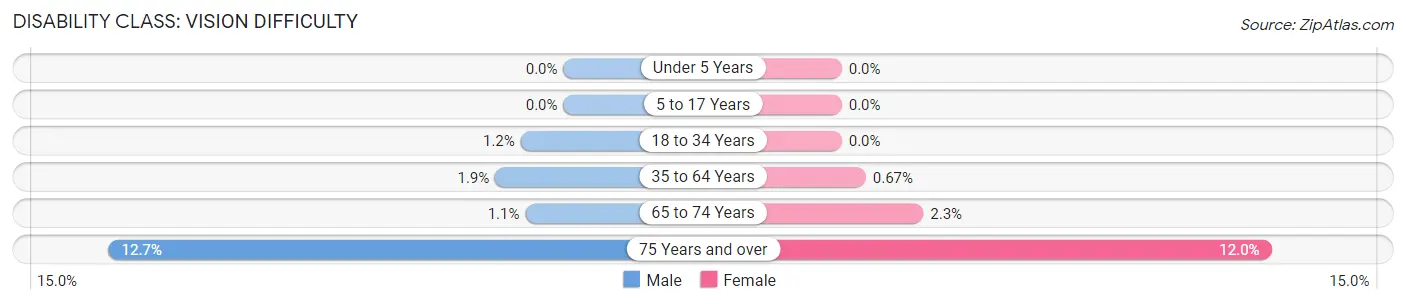
| Age Bracket | Male | Female |
| Under 5 Years | 0 (0.0%) | 0 (0.0%) |
| 5 to 17 Years | 0 (0.0%) | 0 (0.0%) |
| 18 to 34 Years | 15 (1.2%) | 0 (0.0%) |
| 35 to 64 Years | 34 (1.9%) | 14 (0.7%) |
| 65 to 74 Years | 8 (1.1%) | 18 (2.3%) |
| 75 Years and over | 51 (12.7%) | 72 (12.0%) |
Disability Class: Cognitive Difficulty
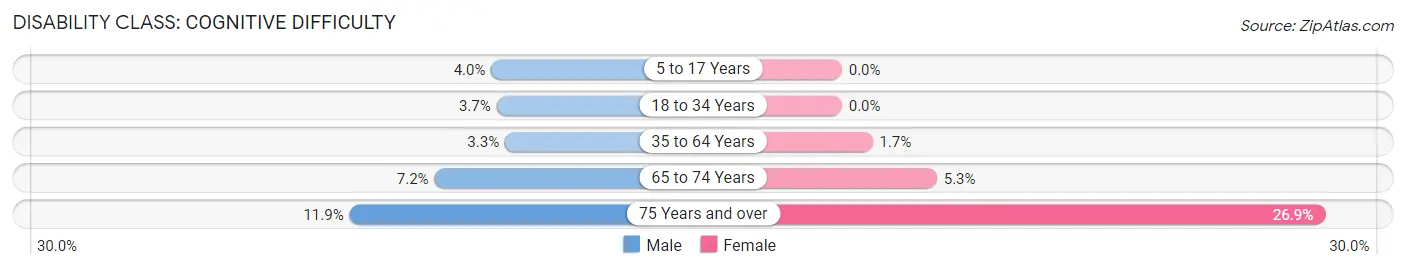
| Age Bracket | Male | Female |
| 5 to 17 Years | 32 (4.0%) | 0 (0.0%) |
| 18 to 34 Years | 47 (3.7%) | 0 (0.0%) |
| 35 to 64 Years | 58 (3.3%) | 36 (1.7%) |
| 65 to 74 Years | 54 (7.2%) | 42 (5.3%) |
| 75 Years and over | 48 (11.9%) | 162 (26.9%) |
Disability Class: Ambulatory Difficulty
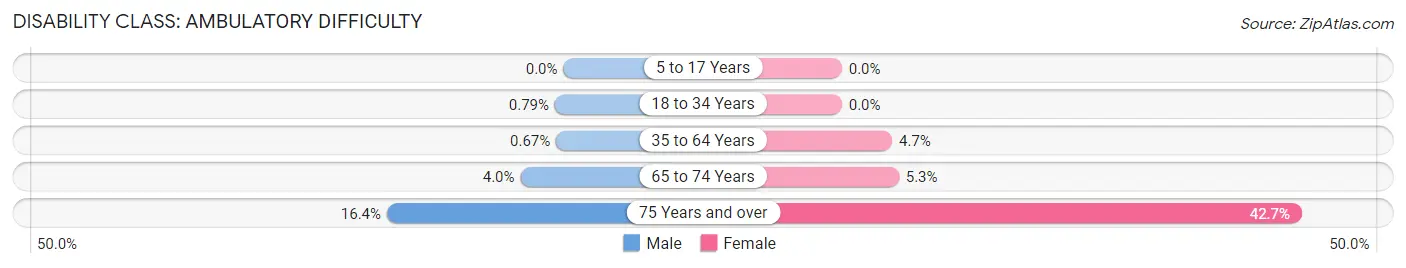
| Age Bracket | Male | Female |
| 5 to 17 Years | 0 (0.0%) | 0 (0.0%) |
| 18 to 34 Years | 10 (0.8%) | 0 (0.0%) |
| 35 to 64 Years | 12 (0.7%) | 98 (4.7%) |
| 65 to 74 Years | 30 (4.0%) | 42 (5.3%) |
| 75 Years and over | 66 (16.4%) | 257 (42.7%) |
Disability Class: Self-Care Difficulty
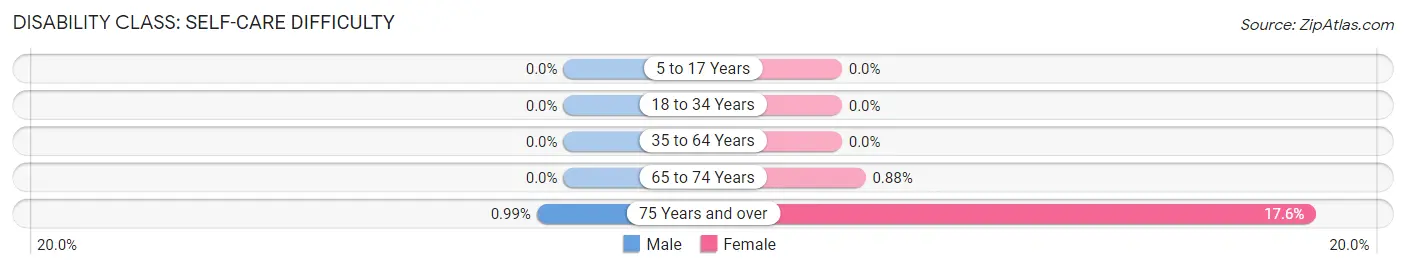
| Age Bracket | Male | Female |
| 5 to 17 Years | 0 (0.0%) | 0 (0.0%) |
| 18 to 34 Years | 0 (0.0%) | 0 (0.0%) |
| 35 to 64 Years | 0 (0.0%) | 0 (0.0%) |
| 65 to 74 Years | 0 (0.0%) | 7 (0.9%) |
| 75 Years and over | 4 (1.0%) | 106 (17.6%) |
Technology Access in Waipio
Computing Device Access in Waipio
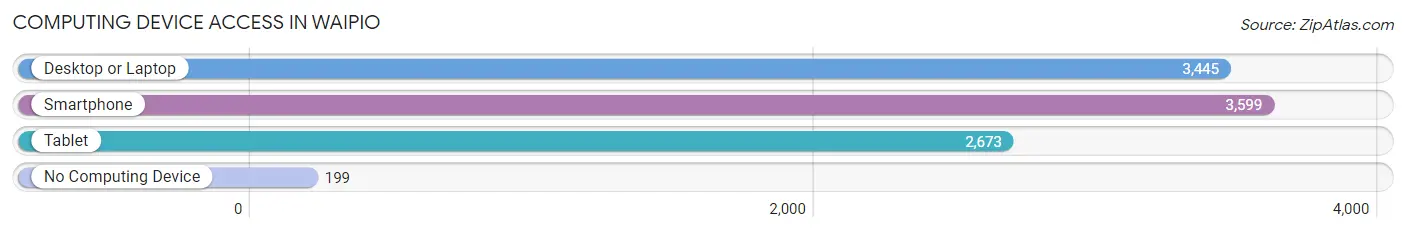
| Device Type | # Households | % Households |
| Desktop or Laptop | 3,445 | 84.1% |
| Smartphone | 3,599 | 87.8% |
| Tablet | 2,673 | 65.2% |
| No Computing Device | 199 | 4.9% |
| Total | 4,098 | 100.0% |
Internet Access in Waipio
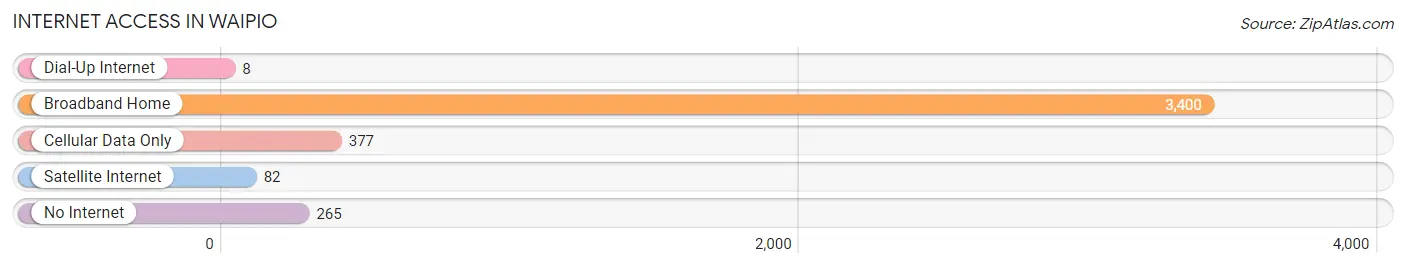
| Internet Type | # Households | % Households |
| Dial-Up Internet | 8 | 0.2% |
| Broadband Home | 3,400 | 83.0% |
| Cellular Data Only | 377 | 9.2% |
| Satellite Internet | 82 | 2.0% |
| No Internet | 265 | 6.5% |
| Total | 4,098 | 100.0% |
Waipio Summary
Waipio is a small town located on the island of Hawaii in the United States. It is situated in the North Hilo District of Hawaii County and is part of the Hilo Metropolitan Statistical Area. The town is located on the northern coast of the island, approximately 10 miles (16 km) south of Hilo. Waipio is known for its beautiful beaches, lush tropical forests, and stunning views of the Pacific Ocean.
Geography
Waipio is located on the northern coast of the island of Hawaii, approximately 10 miles (16 km) south of Hilo. The town is situated in the North Hilo District of Hawaii County and is part of the Hilo Metropolitan Statistical Area. Waipio is bordered by the Pacific Ocean to the east, the Wailuku River to the north, and the Waipio Valley to the south. The town is situated at an elevation of approximately 500 feet (152 m) above sea level.
The climate in Waipio is tropical and humid, with temperatures ranging from an average low of 65°F (18°C) in the winter to an average high of 85°F (29°C) in the summer. The town receives an average of about 60 inches (152 cm) of rain per year, with most of the precipitation occurring during the winter months.
Economy
The economy of Waipio is largely based on tourism and agriculture. The town is home to several resorts and hotels, as well as a variety of restaurants and shops. Agriculture is also an important part of the local economy, with the town’s fertile soil and abundant rainfall providing ideal conditions for growing a variety of crops, including coffee, macadamia nuts, and tropical fruits.
Demographics
As of the 2010 census, the population of Waipio was 1,845. The racial makeup of the town was 57.2% White, 0.7% African American, 0.3% Native American, 25.2% Asian, 0.2% Pacific Islander, and 16.4% from other races. The median household income in Waipio was $50,945, and the median family income was $58,945.
History
Waipio was first settled by Polynesian immigrants in the late 1700s. The town was originally known as “Kawaihae” and was a major port for the whaling industry in the 1800s. In the early 1900s, the town was renamed “Waipio” and became a popular tourist destination. The town was also home to a large sugar plantation, which operated until the late 1960s.
Today, Waipio is a popular tourist destination, known for its beautiful beaches, lush tropical forests, and stunning views of the Pacific Ocean. The town is also home to several resorts and hotels, as well as a variety of restaurants and shops. Agriculture is also an important part of the local economy, with the town’s fertile soil and abundant rainfall providing ideal conditions for growing a variety of crops, including coffee, macadamia nuts, and tropical fruits.
Common Questions
What is Per Capita Income in Waipio?
Per Capita income in Waipio is $44,826.
What is the Median Family Income in Waipio?
Median Family Income in Waipio is $109,519.
What is the Median Household income in Waipio?
Median Household Income in Waipio is $99,815.
What is Income or Wage Gap in Waipio?
Income or Wage Gap in Waipio is 32.4%.
Women in Waipio earn 67.6 cents for every dollar earned by a man.
What is Inequality or Gini Index in Waipio?
Inequality or Gini Index in Waipio is 0.40.
What is the Total Population of Waipio?
Total Population of Waipio is 11,138.
What is the Total Male Population of Waipio?
Total Male Population of Waipio is 5,412.
What is the Total Female Population of Waipio?
Total Female Population of Waipio is 5,726.
What is the Ratio of Males per 100 Females in Waipio?
There are 94.52 Males per 100 Females in Waipio.
What is the Ratio of Females per 100 Males in Waipio?
There are 105.80 Females per 100 Males in Waipio.
What is the Median Population Age in Waipio?
Median Population Age in Waipio is 42.6 Years.
What is the Average Family Size in Waipio
Average Family Size in Waipio is 3.3 People.
What is the Average Household Size in Waipio
Average Household Size in Waipio is 2.7 People.
How Large is the Labor Force in Waipio?
There are 6,009 People in the Labor Forcein in Waipio.
What is the Percentage of People in the Labor Force in Waipio?
64.2% of People are in the Labor Force in Waipio.
What is the Unemployment Rate in Waipio?
Unemployment Rate in Waipio is 2.6%.