Ewa Beach, HI Map & Demographics
Ewa Beach Map
Ewa Beach Overview
$32,284
PER CAPITA INCOME
$116,087
AVG FAMILY INCOME
$114,207
AVG HOUSEHOLD INCOME
26.3%
WAGE / INCOME GAP [ % ]
73.7¢/ $1
WAGE / INCOME GAP [ $ ]
$9,108
FAMILY INCOME DEFICIT
0.38
INEQUALITY / GINI INDEX
15,167
TOTAL POPULATION
7,887
MALE POPULATION
7,280
FEMALE POPULATION
108.34
MALES / 100 FEMALES
92.30
FEMALES / 100 MALES
40.1
MEDIAN AGE
4.5
AVG FAMILY SIZE
4.4
AVG HOUSEHOLD SIZE
7,996
LABOR FORCE [ PEOPLE ]
63.0%
PERCENT IN LABOR FORCE
4.2%
UNEMPLOYMENT RATE
Ewa Beach Zip Codes
Ewa Beach Area Codes
Income in Ewa Beach
Income Overview in Ewa Beach
Per Capita Income in Ewa Beach is $32,284, while median incomes of families and households are $116,087 and $114,207 respectively.
| Characteristic | Number | Measure |
| Per Capita Income | 15,167 | $32,284 |
| Median Family Income | 3,002 | $116,087 |
| Mean Family Income | 3,002 | $136,978 |
| Median Household Income | 3,415 | $114,207 |
| Mean Household Income | 3,415 | $134,521 |
| Income Deficit | 3,002 | $9,108 |
| Wage / Income Gap (%) | 15,167 | 26.33% |
| Wage / Income Gap ($) | 15,167 | 73.67¢ per $1 |
| Gini / Inequality Index | 15,167 | 0.38 |
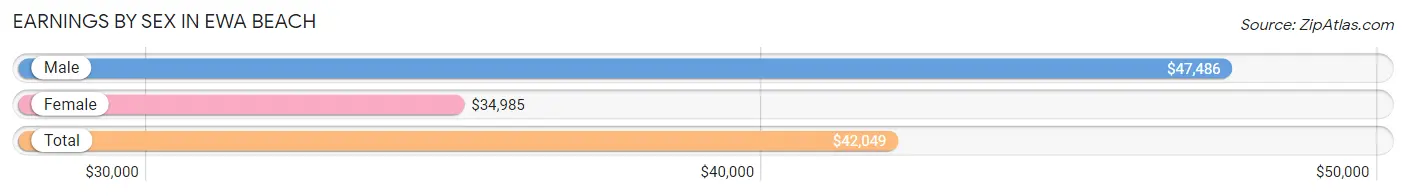
Earnings by Sex in Ewa Beach
Average Earnings in Ewa Beach are $42,049, $47,486 for men and $34,985 for women, a difference of 26.3%.
| Sex | Number | Average Earnings |
| Male | 4,282 (52.5%) | $47,486 |
| Female | 3,869 (47.5%) | $34,985 |
| Total | 8,151 (100.0%) | $42,049 |
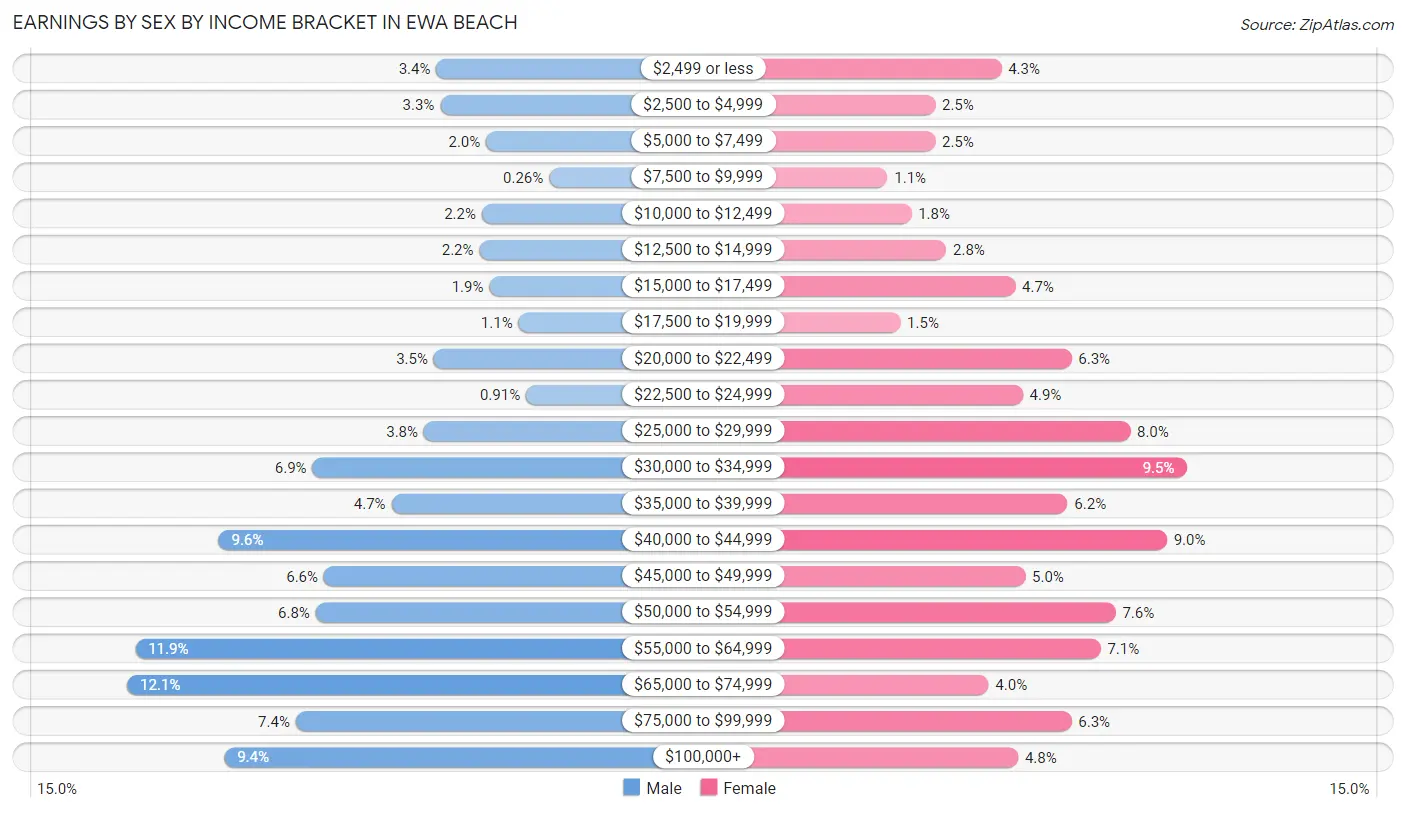
Earnings by Sex by Income Bracket in Ewa Beach
The most common earnings brackets in Ewa Beach are $65,000 to $74,999 for men (519 | 12.1%) and $30,000 to $34,999 for women (369 | 9.5%).
| Income | Male | Female |
| $2,499 or less | 147 (3.4%) | 168 (4.3%) |
| $2,500 to $4,999 | 142 (3.3%) | 96 (2.5%) |
| $5,000 to $7,499 | 87 (2.0%) | 96 (2.5%) |
| $7,500 to $9,999 | 11 (0.3%) | 44 (1.1%) |
| $10,000 to $12,499 | 92 (2.1%) | 70 (1.8%) |
| $12,500 to $14,999 | 95 (2.2%) | 108 (2.8%) |
| $15,000 to $17,499 | 83 (1.9%) | 183 (4.7%) |
| $17,500 to $19,999 | 48 (1.1%) | 58 (1.5%) |
| $20,000 to $22,499 | 150 (3.5%) | 244 (6.3%) |
| $22,500 to $24,999 | 39 (0.9%) | 191 (4.9%) |
| $25,000 to $29,999 | 162 (3.8%) | 308 (8.0%) |
| $30,000 to $34,999 | 296 (6.9%) | 369 (9.5%) |
| $35,000 to $39,999 | 201 (4.7%) | 240 (6.2%) |
| $40,000 to $44,999 | 409 (9.6%) | 348 (9.0%) |
| $45,000 to $49,999 | 282 (6.6%) | 194 (5.0%) |
| $50,000 to $54,999 | 292 (6.8%) | 292 (7.5%) |
| $55,000 to $64,999 | 509 (11.9%) | 276 (7.1%) |
| $65,000 to $74,999 | 519 (12.1%) | 154 (4.0%) |
| $75,000 to $99,999 | 316 (7.4%) | 244 (6.3%) |
| $100,000+ | 402 (9.4%) | 186 (4.8%) |
| Total | 4,282 (100.0%) | 3,869 (100.0%) |
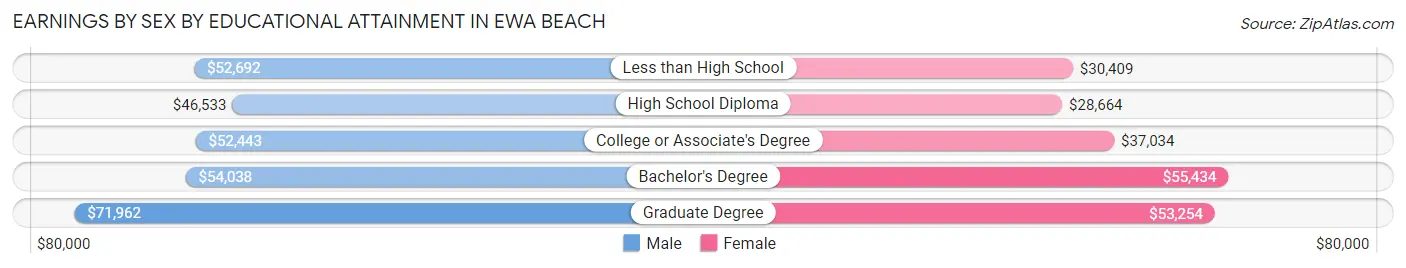
Earnings by Sex by Educational Attainment in Ewa Beach
Average earnings in Ewa Beach are $52,175 for men and $39,825 for women, a difference of 23.7%. Men with an educational attainment of graduate degree enjoy the highest average annual earnings of $71,962, while those with high school diploma education earn the least with $46,533. Women with an educational attainment of bachelor's degree earn the most with the average annual earnings of $55,434, while those with high school diploma education have the smallest earnings of $28,664.
| Educational Attainment | Male Income | Female Income |
| Less than High School | $52,692 | $30,409 |
| High School Diploma | $46,533 | $28,664 |
| College or Associate's Degree | $52,443 | $37,034 |
| Bachelor's Degree | $54,038 | $55,434 |
| Graduate Degree | $71,962 | $53,254 |
| Total | $52,175 | $39,825 |
Family Income in Ewa Beach
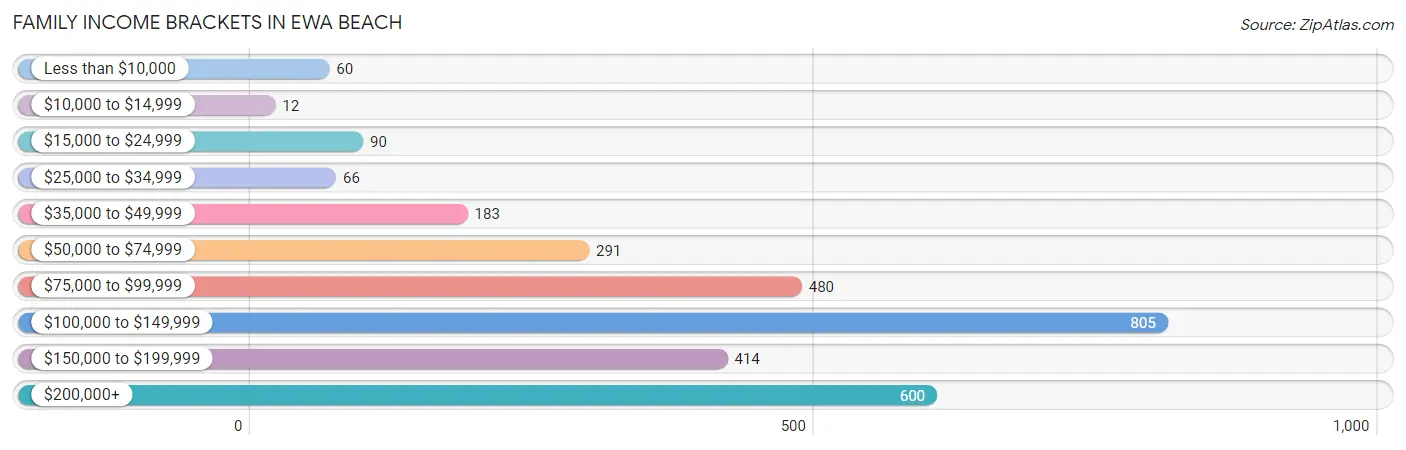
Family Income Brackets in Ewa Beach
According to the Ewa Beach family income data, there are 805 families falling into the $100,000 to $149,999 income range, which is the most common income bracket and makes up 26.8% of all families. Conversely, the $10,000 to $14,999 income bracket is the least frequent group with only 12 families (0.4%) belonging to this category.
| Income Bracket | # Families | % Families |
| Less than $10,000 | 60 | 2.0% |
| $10,000 to $14,999 | 12 | 0.4% |
| $15,000 to $24,999 | 90 | 3.0% |
| $25,000 to $34,999 | 66 | 2.2% |
| $35,000 to $49,999 | 183 | 6.1% |
| $50,000 to $74,999 | 291 | 9.7% |
| $75,000 to $99,999 | 480 | 16.0% |
| $100,000 to $149,999 | 805 | 26.8% |
| $150,000 to $199,999 | 414 | 13.8% |
| $200,000+ | 600 | 20.0% |
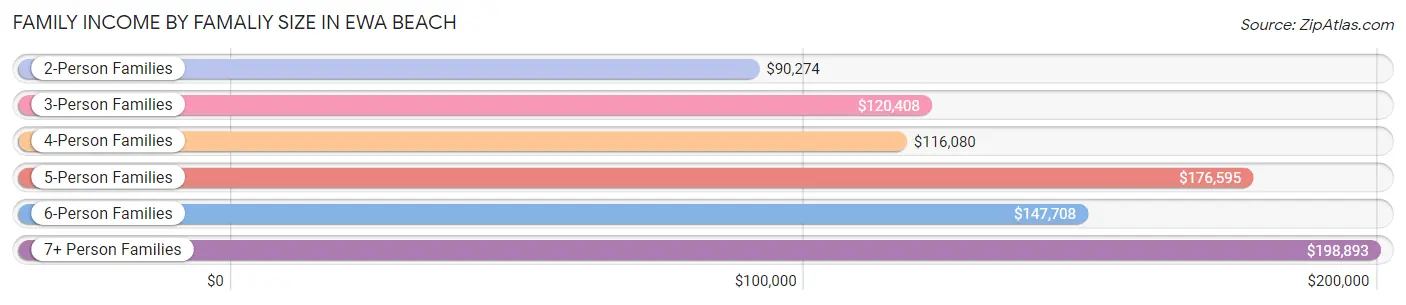
Family Income by Famaliy Size in Ewa Beach
7+ person families (433 | 14.4%) account for the highest median family income in Ewa Beach with $198,893 per family, while 2-person families (683 | 22.8%) have the highest median income of $45,137 per family member.
| Income Bracket | # Families | Median Income |
| 2-Person Families | 683 (22.8%) | $90,274 |
| 3-Person Families | 819 (27.3%) | $120,408 |
| 4-Person Families | 514 (17.1%) | $116,080 |
| 5-Person Families | 297 (9.9%) | $176,595 |
| 6-Person Families | 256 (8.5%) | $147,708 |
| 7+ Person Families | 433 (14.4%) | $198,893 |
| Total | 3,002 (100.0%) | $116,087 |
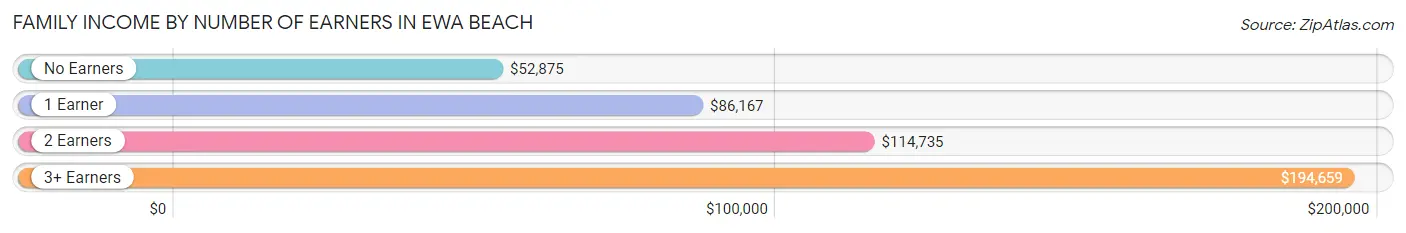
Family Income by Number of Earners in Ewa Beach
The median family income in Ewa Beach is $116,087, with families comprising 3+ earners (1,077) having the highest median family income of $194,659, while families with no earners (379) have the lowest median family income of $52,875, accounting for 35.9% and 12.6% of families, respectively.
| Number of Earners | # Families | Median Income |
| No Earners | 379 (12.6%) | $52,875 |
| 1 Earner | 820 (27.3%) | $86,167 |
| 2 Earners | 726 (24.2%) | $114,735 |
| 3+ Earners | 1,077 (35.9%) | $194,659 |
| Total | 3,002 (100.0%) | $116,087 |
Household Income in Ewa Beach
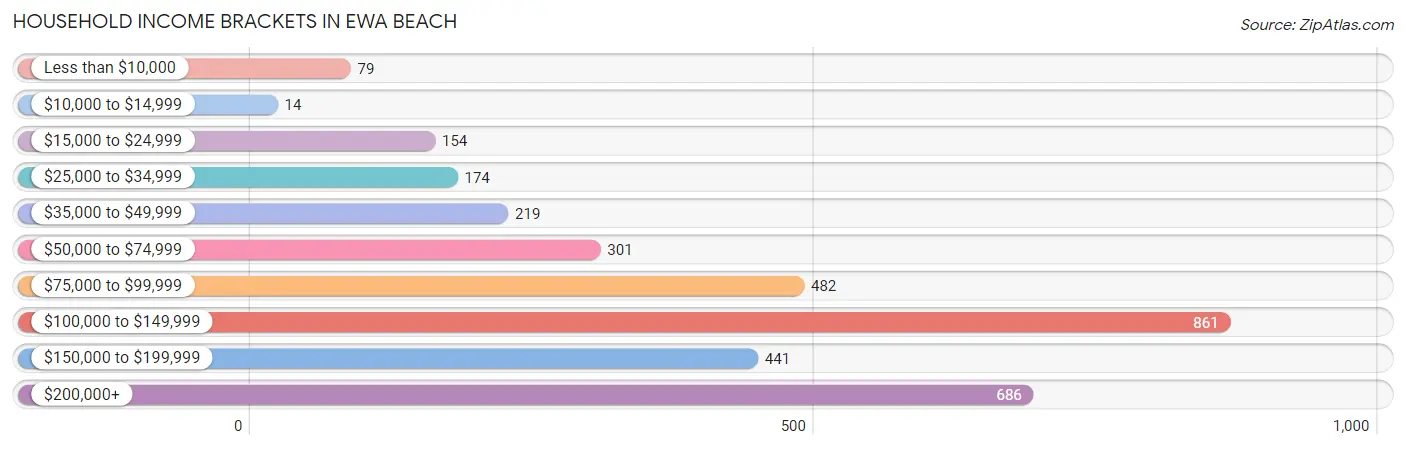
Household Income Brackets in Ewa Beach
With 861 households falling in the category, the $100,000 to $149,999 income range is the most frequent in Ewa Beach, accounting for 25.2% of all households. In contrast, only 14 households (0.4%) fall into the $10,000 to $14,999 income bracket, making it the least populous group.
| Income Bracket | # Households | % Households |
| Less than $10,000 | 79 | 2.3% |
| $10,000 to $14,999 | 14 | 0.4% |
| $15,000 to $24,999 | 154 | 4.5% |
| $25,000 to $34,999 | 174 | 5.1% |
| $35,000 to $49,999 | 219 | 6.4% |
| $50,000 to $74,999 | 301 | 8.8% |
| $75,000 to $99,999 | 482 | 14.1% |
| $100,000 to $149,999 | 861 | 25.2% |
| $150,000 to $199,999 | 441 | 12.9% |
| $200,000+ | 686 | 20.1% |
Household Income by Householder Age in Ewa Beach
The median household income in Ewa Beach is $114,207, with the highest median household income of $121,005 found in the 45 to 64 years age bracket for the primary householder. A total of 1,255 households (36.7%) fall into this category. Meanwhile, the 15 to 24 years age bracket for the primary householder has the lowest median household income of $0, with 29 households (0.9%) in this group.
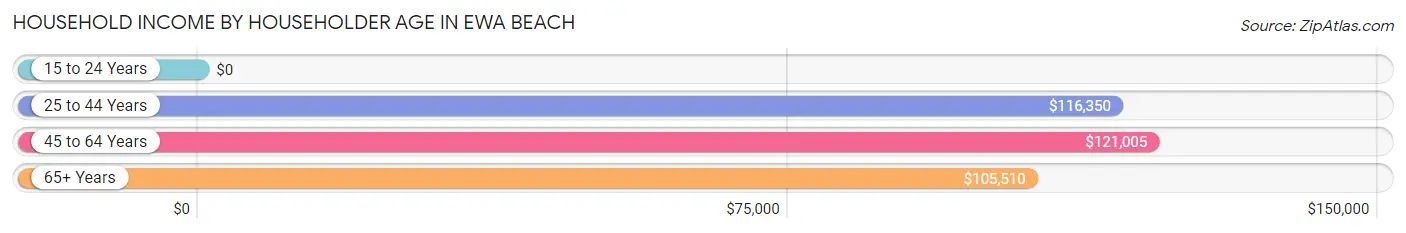
| Income Bracket | # Households | Median Income |
| 15 to 24 Years | 29 (0.9%) | $0 |
| 25 to 44 Years | 839 (24.6%) | $116,350 |
| 45 to 64 Years | 1,255 (36.7%) | $121,005 |
| 65+ Years | 1,292 (37.8%) | $105,510 |
| Total | 3,415 (100.0%) | $114,207 |
Poverty in Ewa Beach
Income Below Poverty by Sex and Age in Ewa Beach
With 6.4% poverty level for males and 6.5% for females among the residents of Ewa Beach, 16 and 17 year old males and 16 and 17 year old females are the most vulnerable to poverty, with 56 males (20.7%) and 24 females (16.3%) in their respective age groups living below the poverty level.
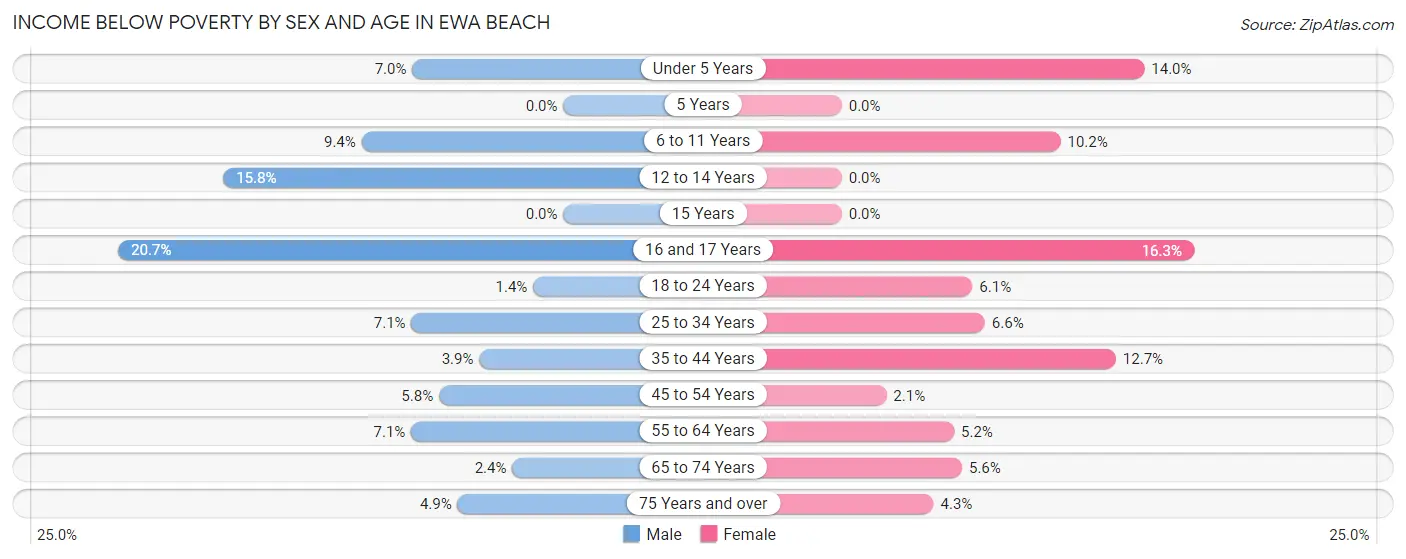
| Age Bracket | Male | Female |
| Under 5 Years | 23 (7.0%) | 32 (14.0%) |
| 5 Years | 0 (0.0%) | 0 (0.0%) |
| 6 to 11 Years | 32 (9.4%) | 54 (10.2%) |
| 12 to 14 Years | 74 (15.8%) | 0 (0.0%) |
| 15 Years | 0 (0.0%) | 0 (0.0%) |
| 16 and 17 Years | 56 (20.7%) | 24 (16.3%) |
| 18 to 24 Years | 9 (1.4%) | 43 (6.1%) |
| 25 to 34 Years | 83 (7.0%) | 65 (6.6%) |
| 35 to 44 Years | 47 (3.9%) | 109 (12.7%) |
| 45 to 54 Years | 46 (5.8%) | 17 (2.1%) |
| 55 to 64 Years | 85 (7.1%) | 50 (5.2%) |
| 65 to 74 Years | 18 (2.4%) | 40 (5.6%) |
| 75 Years and over | 26 (4.9%) | 37 (4.3%) |
| Total | 499 (6.4%) | 471 (6.5%) |
Income Above Poverty by Sex and Age in Ewa Beach
According to the poverty statistics in Ewa Beach, males aged 5 years and females aged 5 years are the age groups that are most secure financially, with 100.0% of males and 100.0% of females in these age groups living above the poverty line.
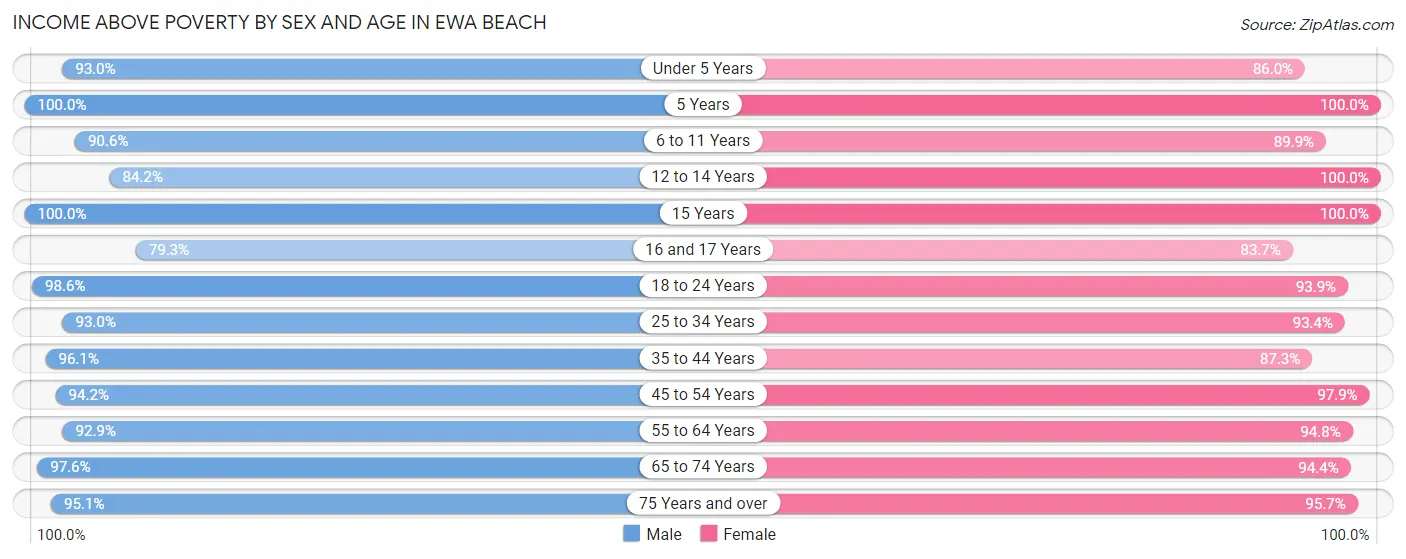
| Age Bracket | Male | Female |
| Under 5 Years | 305 (93.0%) | 196 (86.0%) |
| 5 Years | 20 (100.0%) | 46 (100.0%) |
| 6 to 11 Years | 310 (90.6%) | 478 (89.8%) |
| 12 to 14 Years | 395 (84.2%) | 295 (100.0%) |
| 15 Years | 107 (100.0%) | 77 (100.0%) |
| 16 and 17 Years | 215 (79.3%) | 123 (83.7%) |
| 18 to 24 Years | 634 (98.6%) | 666 (93.9%) |
| 25 to 34 Years | 1,094 (92.9%) | 914 (93.4%) |
| 35 to 44 Years | 1,158 (96.1%) | 748 (87.3%) |
| 45 to 54 Years | 751 (94.2%) | 806 (97.9%) |
| 55 to 64 Years | 1,119 (92.9%) | 909 (94.8%) |
| 65 to 74 Years | 740 (97.6%) | 677 (94.4%) |
| 75 Years and over | 503 (95.1%) | 832 (95.7%) |
| Total | 7,351 (93.6%) | 6,767 (93.5%) |
Income Below Poverty Among Married-Couple Families in Ewa Beach
The poverty statistics for married-couple families in Ewa Beach show that 9.0% or 169 of the total 1,883 families live below the poverty line. Families with 3 or 4 children have the highest poverty rate of 17.8%, comprising of 35 families. On the other hand, families with 5 or more children have the lowest poverty rate of 0.0%, which includes 0 families.
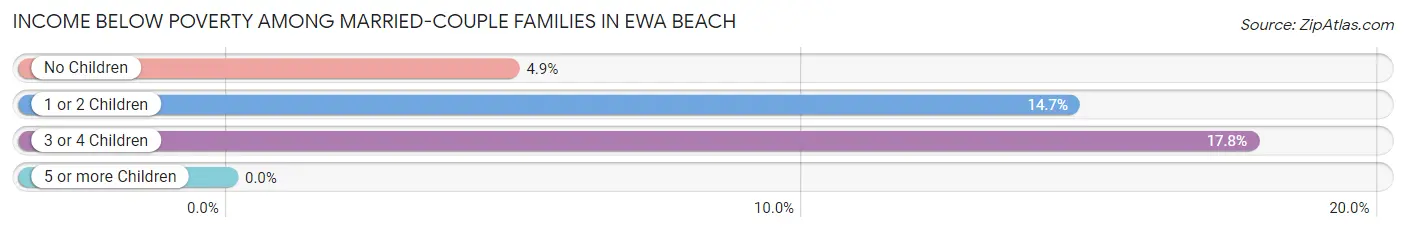
| Children | Above Poverty | Below Poverty |
| No Children | 1,029 (95.1%) | 53 (4.9%) |
| 1 or 2 Children | 472 (85.4%) | 81 (14.6%) |
| 3 or 4 Children | 162 (82.2%) | 35 (17.8%) |
| 5 or more Children | 51 (100.0%) | 0 (0.0%) |
| Total | 1,714 (91.0%) | 169 (9.0%) |
Income Below Poverty Among Single-Parent Households in Ewa Beach
| Children | Single Father | Single Mother |
| No Children | 0 (0.0%) | 0 (0.0%) |
| 1 or 2 Children | 0 (0.0%) | 0 (0.0%) |
| 3 or 4 Children | 0 (0.0%) | 0 (0.0%) |
| 5 or more Children | 0 (0.0%) | 0 (0.0%) |
| Total | 0 (0.0%) | 0 (0.0%) |
Income Below Poverty Among Married-Couple vs Single-Parent Households in Ewa Beach
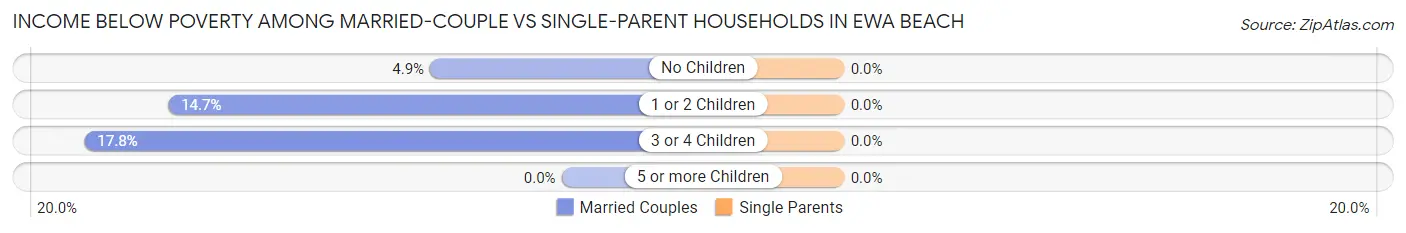
| Children | Married-Couple Families | Single-Parent Households |
| No Children | 53 (4.9%) | 0 (0.0%) |
| 1 or 2 Children | 81 (14.6%) | 0 (0.0%) |
| 3 or 4 Children | 35 (17.8%) | 0 (0.0%) |
| 5 or more Children | 0 (0.0%) | 0 (0.0%) |
| Total | 169 (9.0%) | 0 (0.0%) |
Race in Ewa Beach
The most populous races in Ewa Beach are Asian (8,253 | 54.4%), Two or more Races (4,182 | 27.6%), and Hawaiian / Pacific (1,754 | 11.6%).
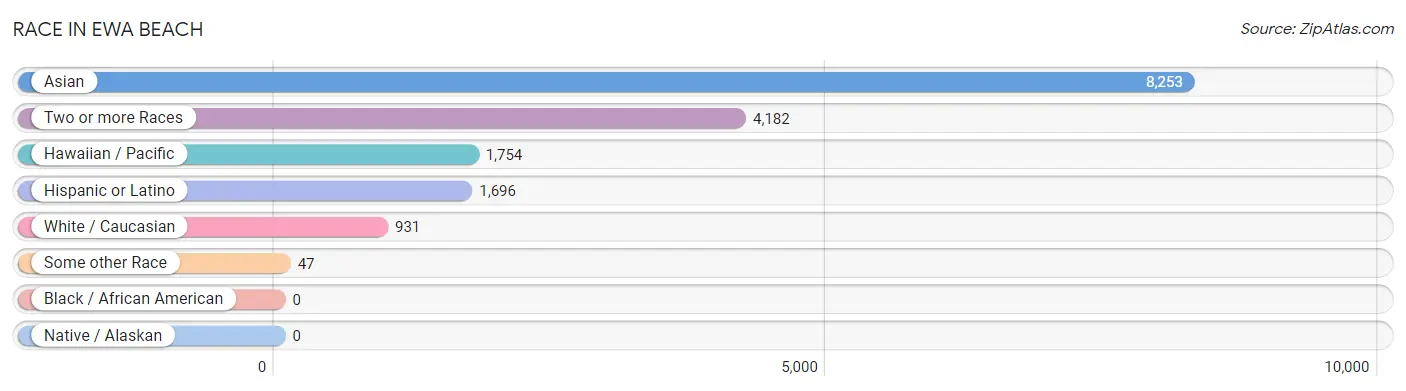
| Race | # Population | % Population |
| Asian | 8,253 | 54.4% |
| Black / African American | 0 | 0.0% |
| Hawaiian / Pacific | 1,754 | 11.6% |
| Hispanic or Latino | 1,696 | 11.2% |
| Native / Alaskan | 0 | 0.0% |
| White / Caucasian | 931 | 6.1% |
| Two or more Races | 4,182 | 27.6% |
| Some other Race | 47 | 0.3% |
| Total | 15,167 | 100.0% |
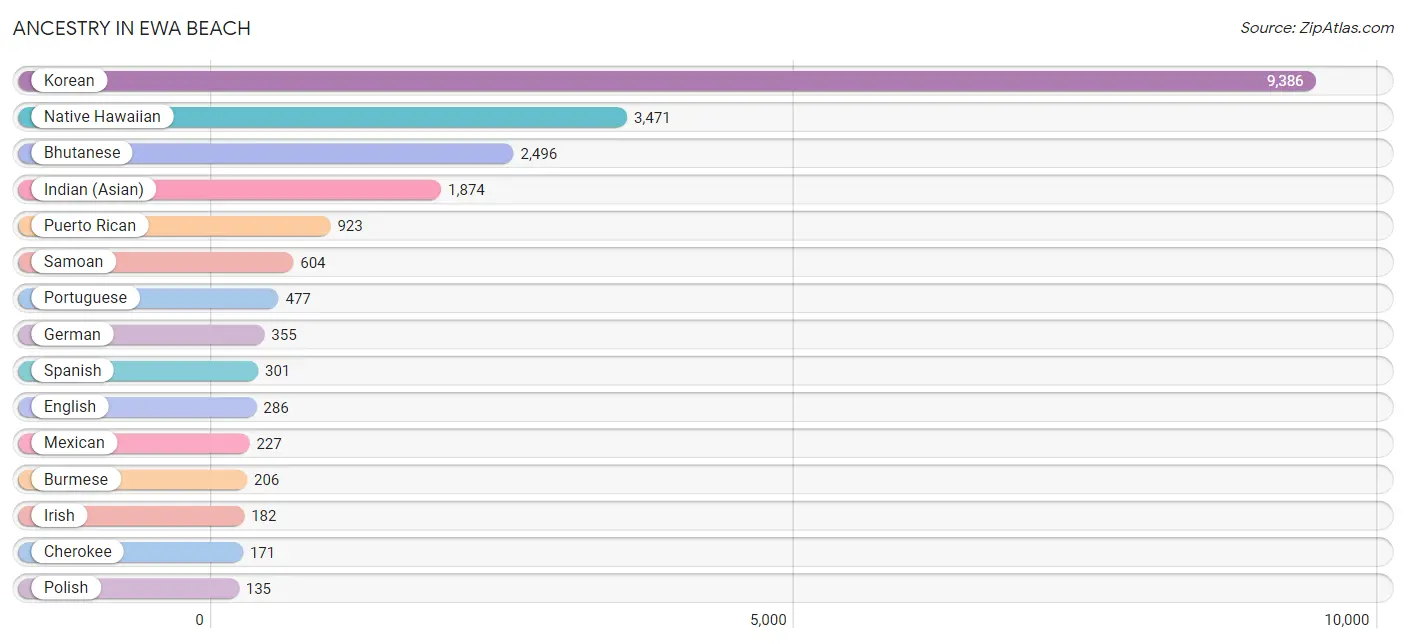
Ancestry in Ewa Beach
The most populous ancestries reported in Ewa Beach are Korean (9,386 | 61.9%), Native Hawaiian (3,471 | 22.9%), Bhutanese (2,496 | 16.5%), Indian (Asian) (1,874 | 12.4%), and Puerto Rican (923 | 6.1%), together accounting for 119.7% of all Ewa Beach residents.
| Ancestry | # Population | % Population |
| American | 29 | 0.2% |
| Bhutanese | 2,496 | 16.5% |
| Blackfeet | 31 | 0.2% |
| Burmese | 206 | 1.4% |
| Central American | 117 | 0.8% |
| Cherokee | 171 | 1.1% |
| Chinese | 94 | 0.6% |
| Chippewa | 52 | 0.3% |
| Cuban | 4 | 0.0% |
| Dutch | 23 | 0.2% |
| English | 286 | 1.9% |
| European | 73 | 0.5% |
| French | 80 | 0.5% |
| German | 355 | 2.3% |
| Guamanian / Chamorro | 75 | 0.5% |
| Guatemalan | 60 | 0.4% |
| Icelander | 10 | 0.1% |
| Indian (Asian) | 1,874 | 12.4% |
| Irish | 182 | 1.2% |
| Italian | 35 | 0.2% |
| Jamaican | 13 | 0.1% |
| Korean | 9,386 | 61.9% |
| Marshallese | 31 | 0.2% |
| Mexican | 227 | 1.5% |
| Native Hawaiian | 3,471 | 22.9% |
| Nicaraguan | 32 | 0.2% |
| Norwegian | 54 | 0.4% |
| Panamanian | 25 | 0.2% |
| Polish | 135 | 0.9% |
| Portuguese | 477 | 3.1% |
| Puerto Rican | 923 | 6.1% |
| Romanian | 8 | 0.1% |
| Samoan | 604 | 4.0% |
| Scotch-Irish | 6 | 0.0% |
| Scottish | 26 | 0.2% |
| Sioux | 10 | 0.1% |
| Spaniard | 106 | 0.7% |
| Spanish | 301 | 2.0% |
| Sri Lankan | 34 | 0.2% |
| Swedish | 54 | 0.4% |
| Thai | 22 | 0.2% |
| Tongan | 79 | 0.5% |
| Welsh | 108 | 0.7% | View All 43 Rows |
Immigrants in Ewa Beach
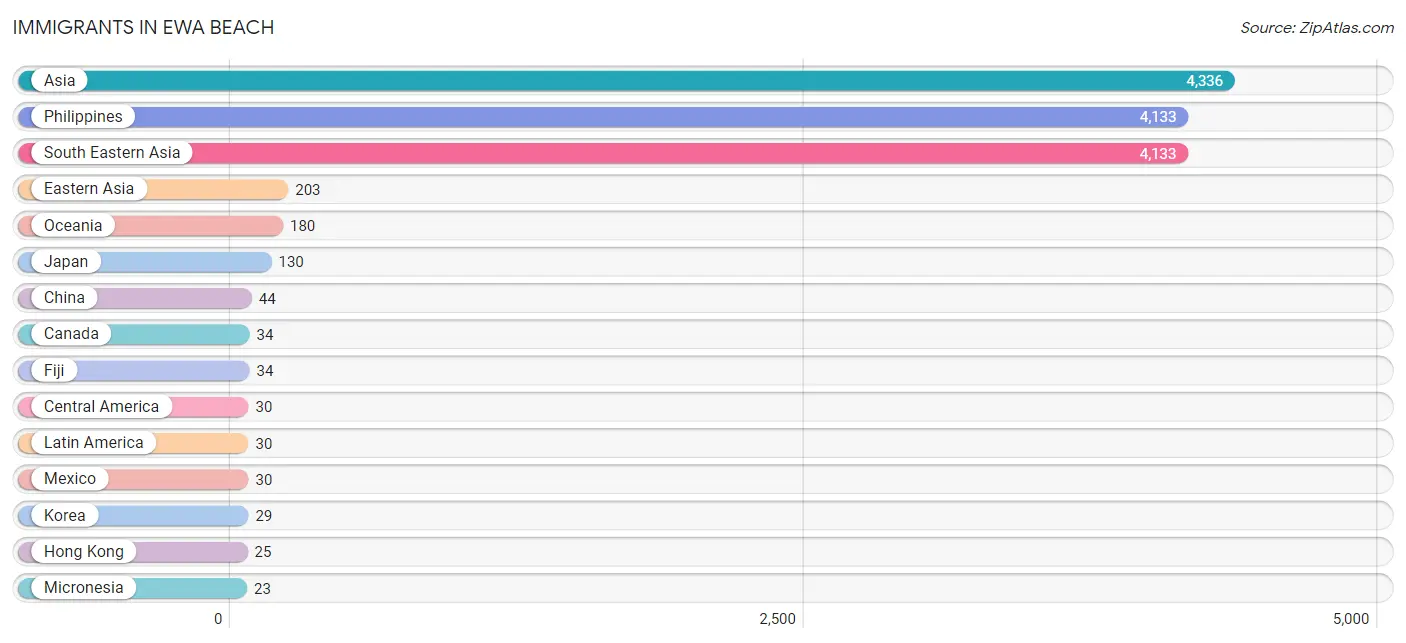
The most numerous immigrant groups reported in Ewa Beach came from Asia (4,336 | 28.6%), Philippines (4,133 | 27.3%), South Eastern Asia (4,133 | 27.3%), Eastern Asia (203 | 1.3%), and Oceania (180 | 1.2%), together accounting for 85.6% of all Ewa Beach residents.
| Immigration Origin | # Population | % Population |
| Asia | 4,336 | 28.6% |
| Canada | 34 | 0.2% |
| Central America | 30 | 0.2% |
| China | 44 | 0.3% |
| Eastern Asia | 203 | 1.3% |
| Fiji | 34 | 0.2% |
| Hong Kong | 25 | 0.2% |
| Japan | 130 | 0.9% |
| Korea | 29 | 0.2% |
| Latin America | 30 | 0.2% |
| Mexico | 30 | 0.2% |
| Micronesia | 23 | 0.2% |
| Oceania | 180 | 1.2% |
| Philippines | 4,133 | 27.3% |
| South Eastern Asia | 4,133 | 27.3% |
| Taiwan | 9 | 0.1% | View All 16 Rows |
Sex and Age in Ewa Beach
Sex and Age in Ewa Beach
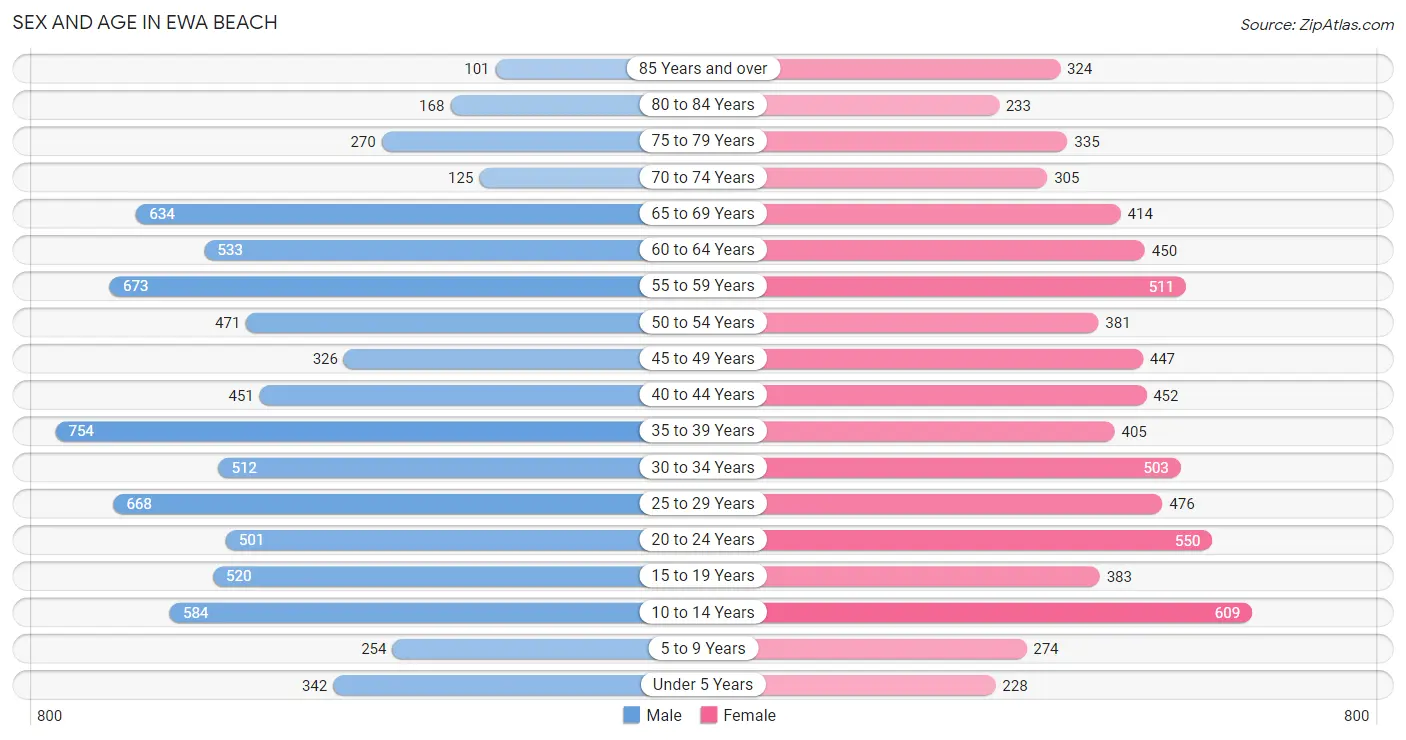
The most populous age groups in Ewa Beach are 35 to 39 Years (754 | 9.6%) for men and 10 to 14 Years (609 | 8.4%) for women.
| Age Bracket | Male | Female |
| Under 5 Years | 342 (4.3%) | 228 (3.1%) |
| 5 to 9 Years | 254 (3.2%) | 274 (3.8%) |
| 10 to 14 Years | 584 (7.4%) | 609 (8.4%) |
| 15 to 19 Years | 520 (6.6%) | 383 (5.3%) |
| 20 to 24 Years | 501 (6.4%) | 550 (7.5%) |
| 25 to 29 Years | 668 (8.5%) | 476 (6.5%) |
| 30 to 34 Years | 512 (6.5%) | 503 (6.9%) |
| 35 to 39 Years | 754 (9.6%) | 405 (5.6%) |
| 40 to 44 Years | 451 (5.7%) | 452 (6.2%) |
| 45 to 49 Years | 326 (4.1%) | 447 (6.1%) |
| 50 to 54 Years | 471 (6.0%) | 381 (5.2%) |
| 55 to 59 Years | 673 (8.5%) | 511 (7.0%) |
| 60 to 64 Years | 533 (6.8%) | 450 (6.2%) |
| 65 to 69 Years | 634 (8.0%) | 414 (5.7%) |
| 70 to 74 Years | 125 (1.6%) | 305 (4.2%) |
| 75 to 79 Years | 270 (3.4%) | 335 (4.6%) |
| 80 to 84 Years | 168 (2.1%) | 233 (3.2%) |
| 85 Years and over | 101 (1.3%) | 324 (4.4%) |
| Total | 7,887 (100.0%) | 7,280 (100.0%) |
Families and Households in Ewa Beach
Median Family Size in Ewa Beach
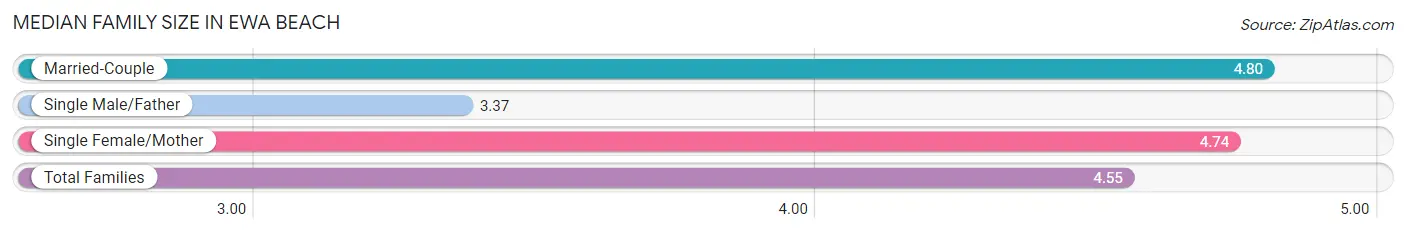
The median family size in Ewa Beach is 4.55 persons per family, with married-couple families (1,883 | 62.7%) accounting for the largest median family size of 4.8 persons per family. On the other hand, single male/father families (490 | 16.3%) represent the smallest median family size with 3.37 persons per family.
| Family Type | # Families | Family Size |
| Married-Couple | 1,883 (62.7%) | 4.80 |
| Single Male/Father | 490 (16.3%) | 3.37 |
| Single Female/Mother | 629 (20.9%) | 4.74 |
| Total Families | 3,002 (100.0%) | 4.55 |
Median Household Size in Ewa Beach
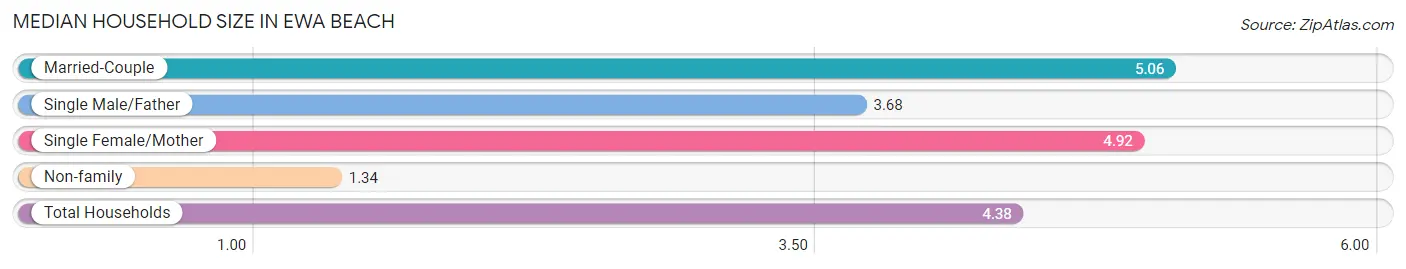
The median household size in Ewa Beach is 4.38 persons per household, with married-couple households (1,883 | 55.1%) accounting for the largest median household size of 5.06 persons per household. non-family households (413 | 12.1%) represent the smallest median household size with 1.34 persons per household.
| Household Type | # Households | Household Size |
| Married-Couple | 1,883 (55.1%) | 5.06 |
| Single Male/Father | 490 (14.3%) | 3.68 |
| Single Female/Mother | 629 (18.4%) | 4.92 |
| Non-family | 413 (12.1%) | 1.34 |
| Total Households | 3,415 (100.0%) | 4.38 |
Household Size by Marriage Status in Ewa Beach
Out of a total of 3,415 households in Ewa Beach, 3,002 (87.9%) are family households, while 413 (12.1%) are nonfamily households. The most numerous type of family households are 3-person households, comprising 750, and the most common type of nonfamily households are 1-person households, comprising 319.
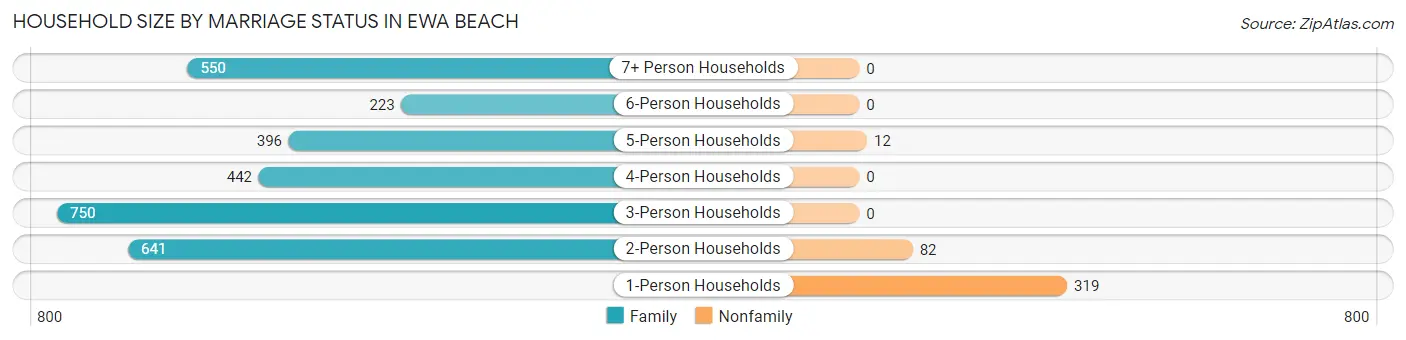
| Household Size | Family Households | Nonfamily Households |
| 1-Person Households | - | 319 (9.3%) |
| 2-Person Households | 641 (18.8%) | 82 (2.4%) |
| 3-Person Households | 750 (22.0%) | 0 (0.0%) |
| 4-Person Households | 442 (12.9%) | 0 (0.0%) |
| 5-Person Households | 396 (11.6%) | 12 (0.4%) |
| 6-Person Households | 223 (6.5%) | 0 (0.0%) |
| 7+ Person Households | 550 (16.1%) | 0 (0.0%) |
| Total | 3,002 (87.9%) | 413 (12.1%) |
Female Fertility in Ewa Beach
Fertility by Age in Ewa Beach
Average fertility rate in Ewa Beach is 80.0 births per 1,000 women. Women in the age bracket of 20 to 34 years have the highest fertility rate with 129.0 births per 1,000 women. Women in the age bracket of 20 to 34 years acount for 74.7% of all women with births.
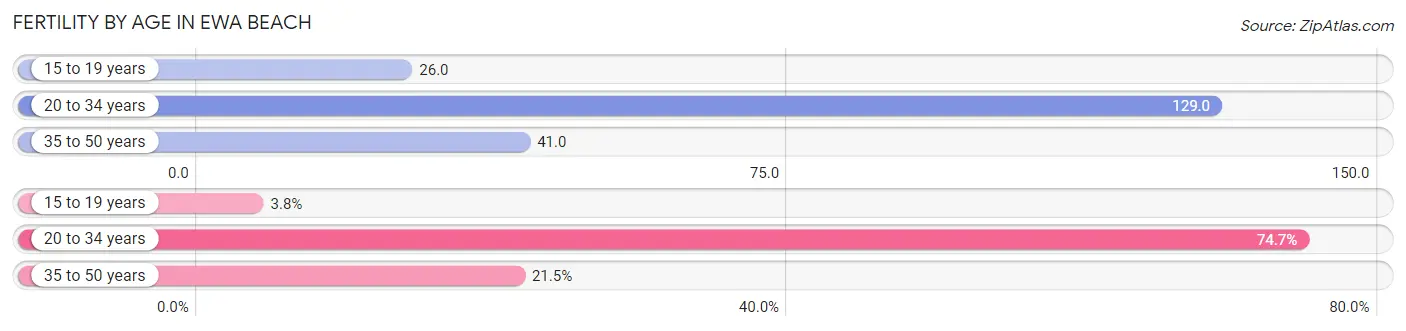
| Age Bracket | Women with Births | Births / 1,000 Women |
| 15 to 19 years | 10 (3.8%) | 26.0 |
| 20 to 34 years | 198 (74.7%) | 129.0 |
| 35 to 50 years | 57 (21.5%) | 41.0 |
| Total | 265 (100.0%) | 80.0 |
Fertility by Age by Marriage Status in Ewa Beach
49.4% of women with births (265) in Ewa Beach are married. The highest percentage of unmarried women with births falls into 15 to 19 years age bracket with 100.0% of them unmarried at the time of birth, while the lowest percentage of unmarried women with births belong to 20 to 34 years age bracket with 45.5% of them unmarried.
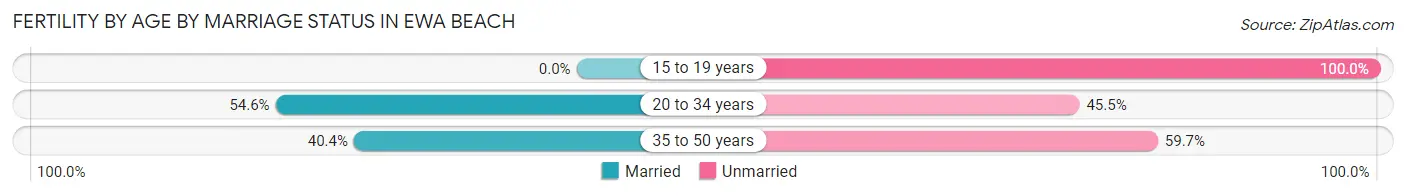
| Age Bracket | Married | Unmarried |
| 15 to 19 years | 0 (0.0%) | 10 (100.0%) |
| 20 to 34 years | 108 (54.5%) | 90 (45.5%) |
| 35 to 50 years | 23 (40.4%) | 34 (59.7%) |
| Total | 131 (49.4%) | 134 (50.6%) |
Fertility by Education in Ewa Beach
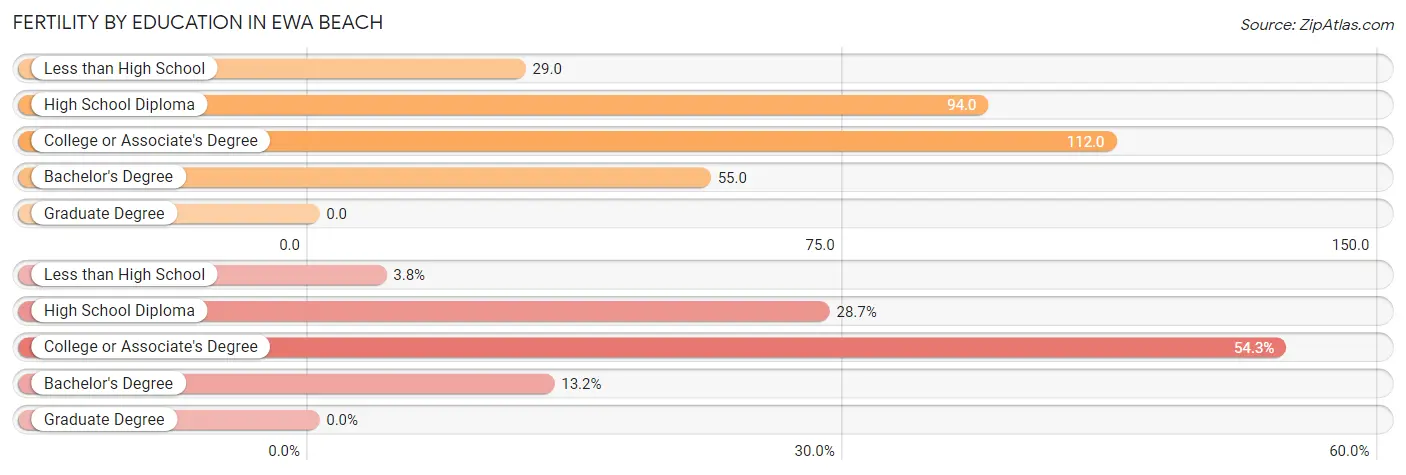
| Educational Attainment | Women with Births | Births / 1,000 Women |
| Less than High School | 10 (3.8%) | 29.0 |
| High School Diploma | 76 (28.7%) | 94.0 |
| College or Associate's Degree | 144 (54.3%) | 112.0 |
| Bachelor's Degree | 35 (13.2%) | 55.0 |
| Graduate Degree | 0 (0.0%) | 0.0 |
| Total | 265 (100.0%) | 80.0 |
Fertility by Education by Marriage Status in Ewa Beach
50.6% of women with births in Ewa Beach are unmarried. Women with the educational attainment of bachelor's degree are most likely to be married with 100.0% of them married at childbirth, while women with the educational attainment of less than high school are least likely to be married with 100.0% of them unmarried at childbirth.
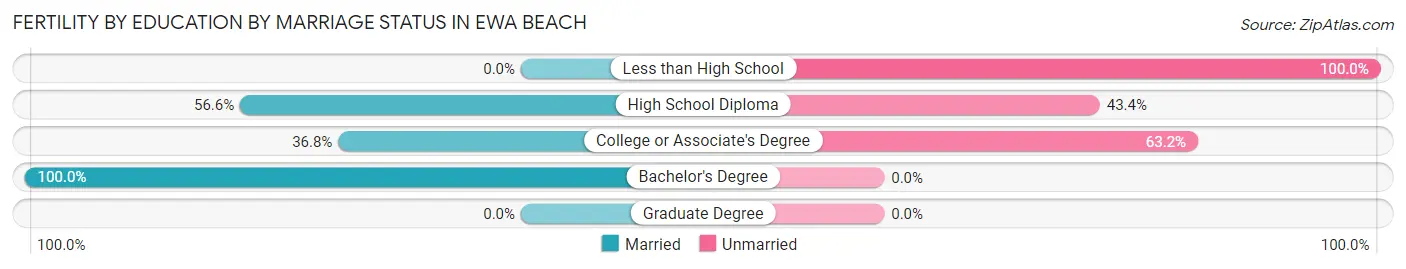
| Educational Attainment | Married | Unmarried |
| Less than High School | 0 (0.0%) | 10 (100.0%) |
| High School Diploma | 43 (56.6%) | 33 (43.4%) |
| College or Associate's Degree | 53 (36.8%) | 91 (63.2%) |
| Bachelor's Degree | 35 (100.0%) | 0 (0.0%) |
| Graduate Degree | 0 (0.0%) | 0 (0.0%) |
| Total | 131 (49.4%) | 134 (50.6%) |
Employment Characteristics in Ewa Beach
Employment by Class of Employer in Ewa Beach
Among the 7,415 employed individuals in Ewa Beach, private company employees (4,842 | 65.3%), state government employees (967 | 13.0%), and federal government employees (701 | 9.5%) make up the most common classes of employment.
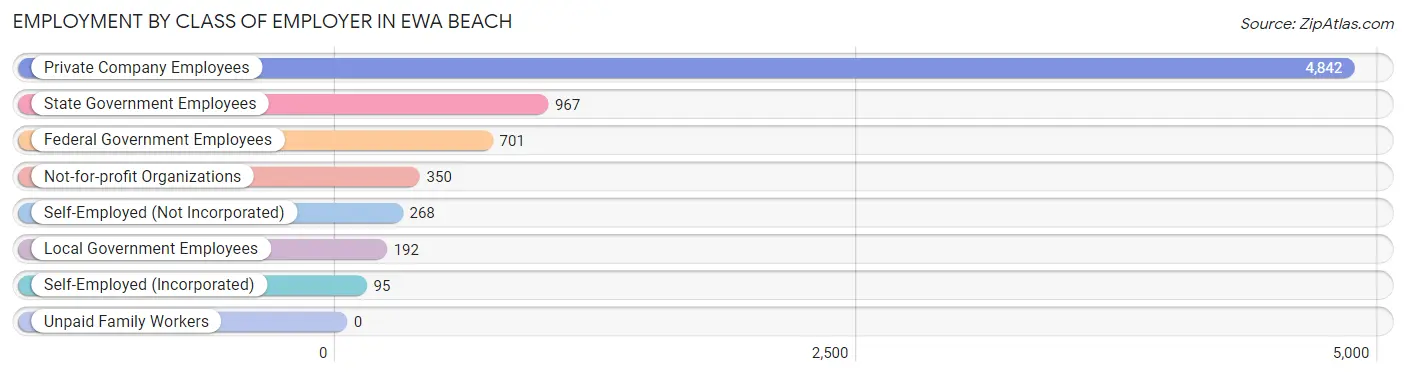
| Employer Class | # Employees | % Employees |
| Private Company Employees | 4,842 | 65.3% |
| Self-Employed (Incorporated) | 95 | 1.3% |
| Self-Employed (Not Incorporated) | 268 | 3.6% |
| Not-for-profit Organizations | 350 | 4.7% |
| Local Government Employees | 192 | 2.6% |
| State Government Employees | 967 | 13.0% |
| Federal Government Employees | 701 | 9.5% |
| Unpaid Family Workers | 0 | 0.0% |
| Total | 7,415 | 100.0% |
Employment Status by Age in Ewa Beach
According to the labor force statistics for Ewa Beach, out of the total population over 16 years of age (12,692), 63.0% or 7,996 individuals are in the labor force, with 4.2% or 336 of them unemployed. The age group with the highest labor force participation rate is 45 to 54 years, with 89.7% or 1,458 individuals in the labor force. Within the labor force, the 16 to 19 years age range has the highest percentage of unemployed individuals, with 27.9% or 73 of them being unemployed.
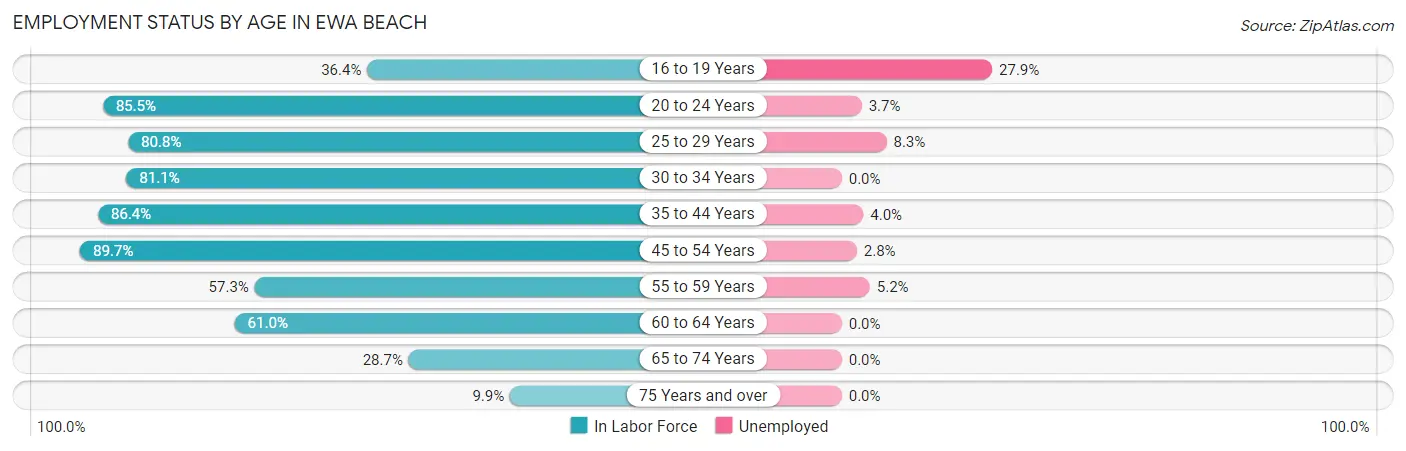
| Age Bracket | In Labor Force | Unemployed |
| 16 to 19 Years | 262 (36.4%) | 73 (27.9%) |
| 20 to 24 Years | 899 (85.5%) | 33 (3.7%) |
| 25 to 29 Years | 924 (80.8%) | 77 (8.3%) |
| 30 to 34 Years | 823 (81.1%) | 0 (0.0%) |
| 35 to 44 Years | 1,782 (86.4%) | 71 (4.0%) |
| 45 to 54 Years | 1,458 (89.7%) | 41 (2.8%) |
| 55 to 59 Years | 678 (57.3%) | 35 (5.2%) |
| 60 to 64 Years | 600 (61.0%) | 0 (0.0%) |
| 65 to 74 Years | 424 (28.7%) | 0 (0.0%) |
| 75 Years and over | 142 (9.9%) | 0 (0.0%) |
| Total | 7,996 (63.0%) | 336 (4.2%) |
Employment Status by Educational Attainment in Ewa Beach
According to labor force statistics for Ewa Beach, 78.2% of individuals (6,266) out of the total population between 25 and 64 years of age (8,013) are in the labor force, with 3.6% or 226 of them being unemployed. The group with the highest labor force participation rate are those with the educational attainment of bachelor's degree or higher, with 92.2% or 1,611 individuals in the labor force. Within the labor force, individuals with less than high school education have the highest percentage of unemployment, with 9.4% or 35 of them being unemployed.
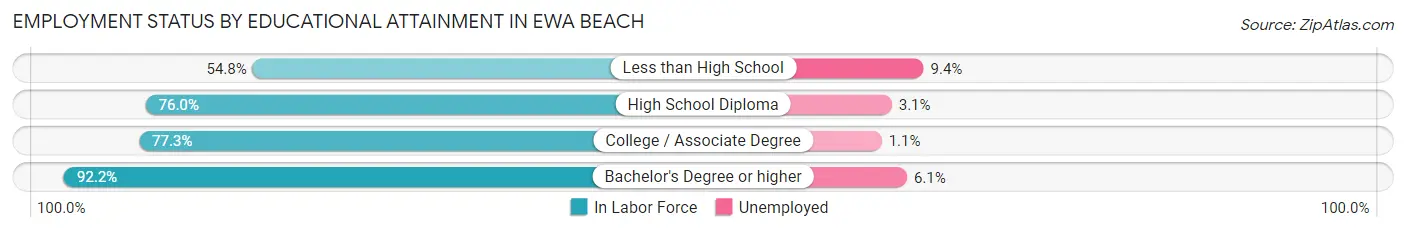
| Educational Attainment | In Labor Force | Unemployed |
| Less than High School | 374 (54.8%) | 64 (9.4%) |
| High School Diploma | 2,124 (76.0%) | 87 (3.1%) |
| College / Associate Degree | 2,155 (77.3%) | 31 (1.1%) |
| Bachelor's Degree or higher | 1,611 (92.2%) | 107 (6.1%) |
| Total | 6,266 (78.2%) | 288 (3.6%) |
Employment Occupations by Sex in Ewa Beach
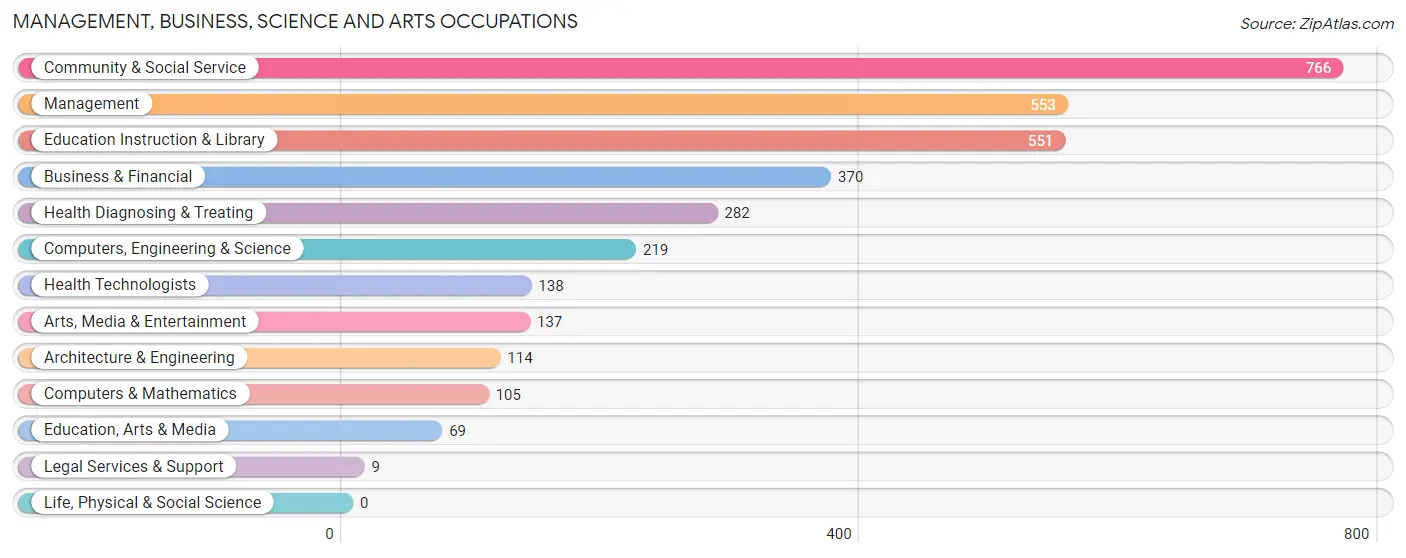
Management, Business, Science and Arts Occupations
The most common Management, Business, Science and Arts occupations in Ewa Beach are Community & Social Service (766 | 10.1%), Management (553 | 7.3%), Education Instruction & Library (551 | 7.3%), Business & Financial (370 | 4.9%), and Health Diagnosing & Treating (282 | 3.7%).
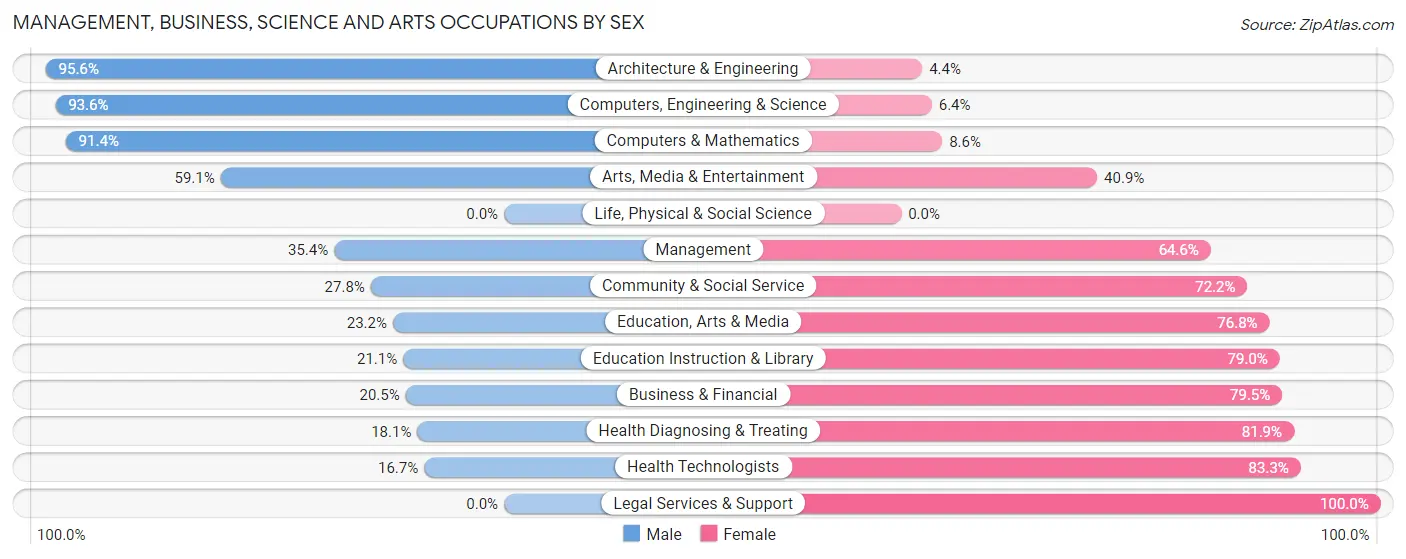
Management, Business, Science and Arts Occupations by Sex
Within the Management, Business, Science and Arts occupations in Ewa Beach, the most male-oriented occupations are Architecture & Engineering (95.6%), Computers, Engineering & Science (93.6%), and Computers & Mathematics (91.4%), while the most female-oriented occupations are Legal Services & Support (100.0%), Health Technologists (83.3%), and Health Diagnosing & Treating (81.9%).
| Occupation | Male | Female |
| Management | 196 (35.4%) | 357 (64.6%) |
| Business & Financial | 76 (20.5%) | 294 (79.5%) |
| Computers, Engineering & Science | 205 (93.6%) | 14 (6.4%) |
| Computers & Mathematics | 96 (91.4%) | 9 (8.6%) |
| Architecture & Engineering | 109 (95.6%) | 5 (4.4%) |
| Life, Physical & Social Science | 0 (0.0%) | 0 (0.0%) |
| Community & Social Service | 213 (27.8%) | 553 (72.2%) |
| Education, Arts & Media | 16 (23.2%) | 53 (76.8%) |
| Legal Services & Support | 0 (0.0%) | 9 (100.0%) |
| Education Instruction & Library | 116 (21.0%) | 435 (78.9%) |
| Arts, Media & Entertainment | 81 (59.1%) | 56 (40.9%) |
| Health Diagnosing & Treating | 51 (18.1%) | 231 (81.9%) |
| Health Technologists | 23 (16.7%) | 115 (83.3%) |
| Total (Category) | 741 (33.8%) | 1,449 (66.2%) |
| Total (Overall) | 3,871 (51.3%) | 3,680 (48.7%) |
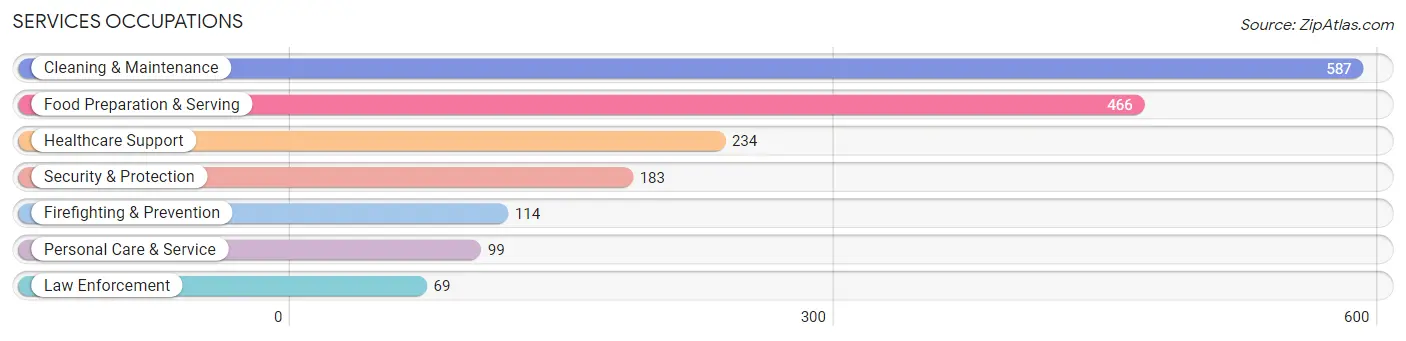
Services Occupations
The most common Services occupations in Ewa Beach are Cleaning & Maintenance (587 | 7.8%), Food Preparation & Serving (466 | 6.2%), Healthcare Support (234 | 3.1%), Security & Protection (183 | 2.4%), and Firefighting & Prevention (114 | 1.5%).
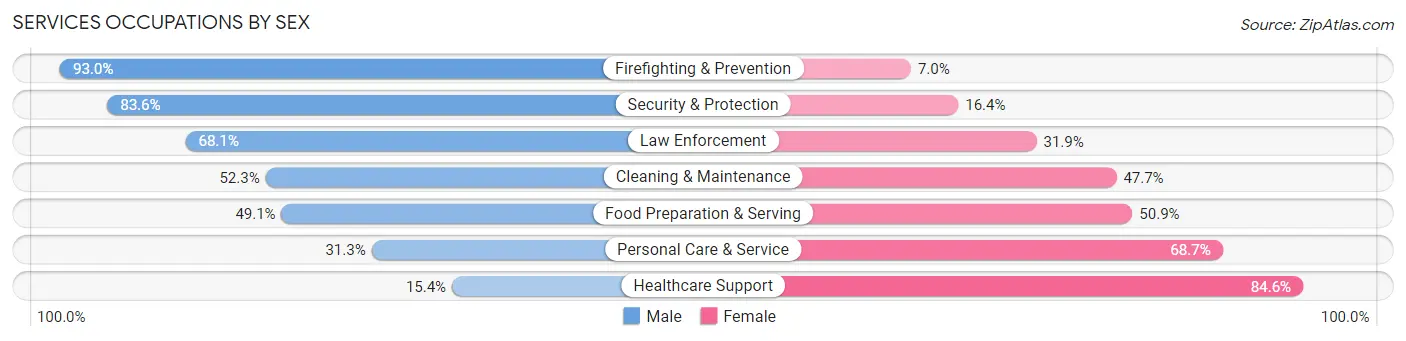
Services Occupations by Sex
Within the Services occupations in Ewa Beach, the most male-oriented occupations are Firefighting & Prevention (93.0%), Security & Protection (83.6%), and Law Enforcement (68.1%), while the most female-oriented occupations are Healthcare Support (84.6%), Personal Care & Service (68.7%), and Food Preparation & Serving (50.9%).
| Occupation | Male | Female |
| Healthcare Support | 36 (15.4%) | 198 (84.6%) |
| Security & Protection | 153 (83.6%) | 30 (16.4%) |
| Firefighting & Prevention | 106 (93.0%) | 8 (7.0%) |
| Law Enforcement | 47 (68.1%) | 22 (31.9%) |
| Food Preparation & Serving | 229 (49.1%) | 237 (50.9%) |
| Cleaning & Maintenance | 307 (52.3%) | 280 (47.7%) |
| Personal Care & Service | 31 (31.3%) | 68 (68.7%) |
| Total (Category) | 756 (48.2%) | 813 (51.8%) |
| Total (Overall) | 3,871 (51.3%) | 3,680 (48.7%) |
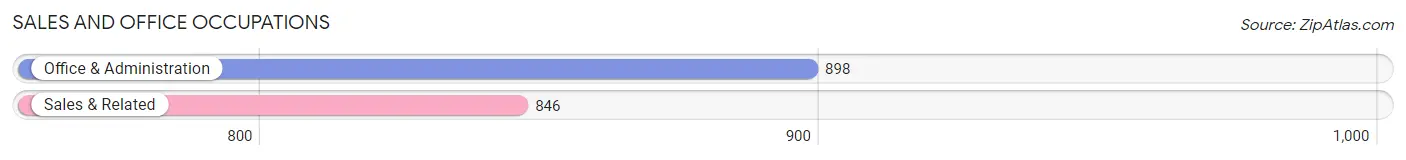
Sales and Office Occupations
The most common Sales and Office occupations in Ewa Beach are Office & Administration (898 | 11.9%), and Sales & Related (846 | 11.2%).
Sales and Office Occupations by Sex
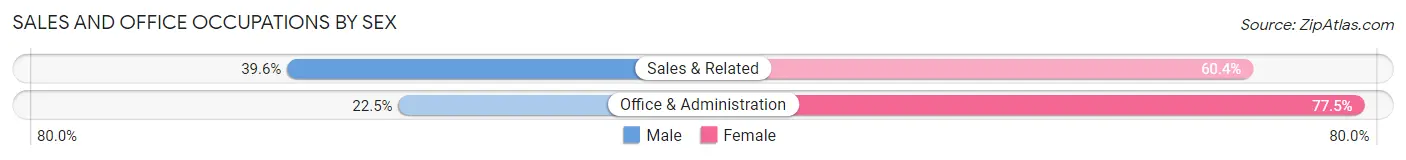
| Occupation | Male | Female |
| Sales & Related | 335 (39.6%) | 511 (60.4%) |
| Office & Administration | 202 (22.5%) | 696 (77.5%) |
| Total (Category) | 537 (30.8%) | 1,207 (69.2%) |
| Total (Overall) | 3,871 (51.3%) | 3,680 (48.7%) |
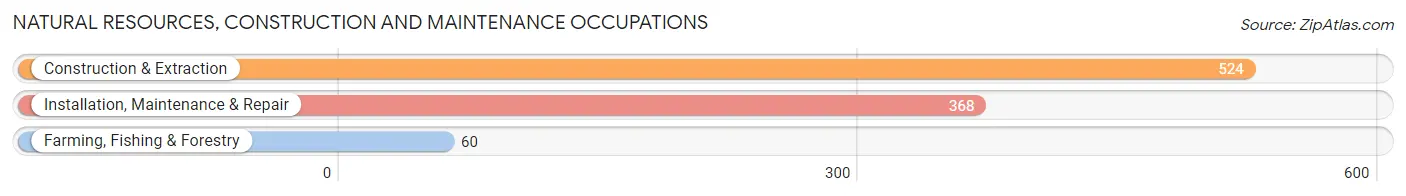
Natural Resources, Construction and Maintenance Occupations
The most common Natural Resources, Construction and Maintenance occupations in Ewa Beach are Construction & Extraction (524 | 6.9%), Installation, Maintenance & Repair (368 | 4.9%), and Farming, Fishing & Forestry (60 | 0.8%).
Natural Resources, Construction and Maintenance Occupations by Sex
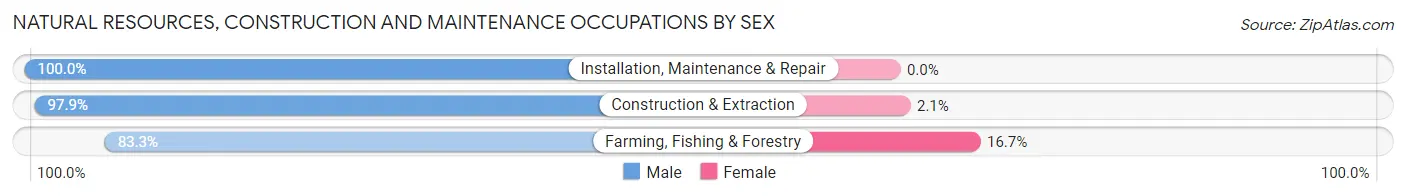
| Occupation | Male | Female |
| Farming, Fishing & Forestry | 50 (83.3%) | 10 (16.7%) |
| Construction & Extraction | 513 (97.9%) | 11 (2.1%) |
| Installation, Maintenance & Repair | 368 (100.0%) | 0 (0.0%) |
| Total (Category) | 931 (97.8%) | 21 (2.2%) |
| Total (Overall) | 3,871 (51.3%) | 3,680 (48.7%) |
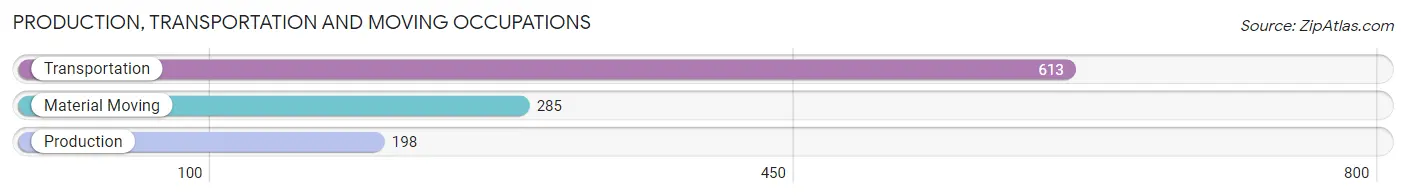
Production, Transportation and Moving Occupations
The most common Production, Transportation and Moving occupations in Ewa Beach are Transportation (613 | 8.1%), Material Moving (285 | 3.8%), and Production (198 | 2.6%).
Production, Transportation and Moving Occupations by Sex

| Occupation | Male | Female |
| Production | 88 (44.4%) | 110 (55.6%) |
| Transportation | 572 (93.3%) | 41 (6.7%) |
| Material Moving | 246 (86.3%) | 39 (13.7%) |
| Total (Category) | 906 (82.7%) | 190 (17.3%) |
| Total (Overall) | 3,871 (51.3%) | 3,680 (48.7%) |
Employment Industries by Sex in Ewa Beach
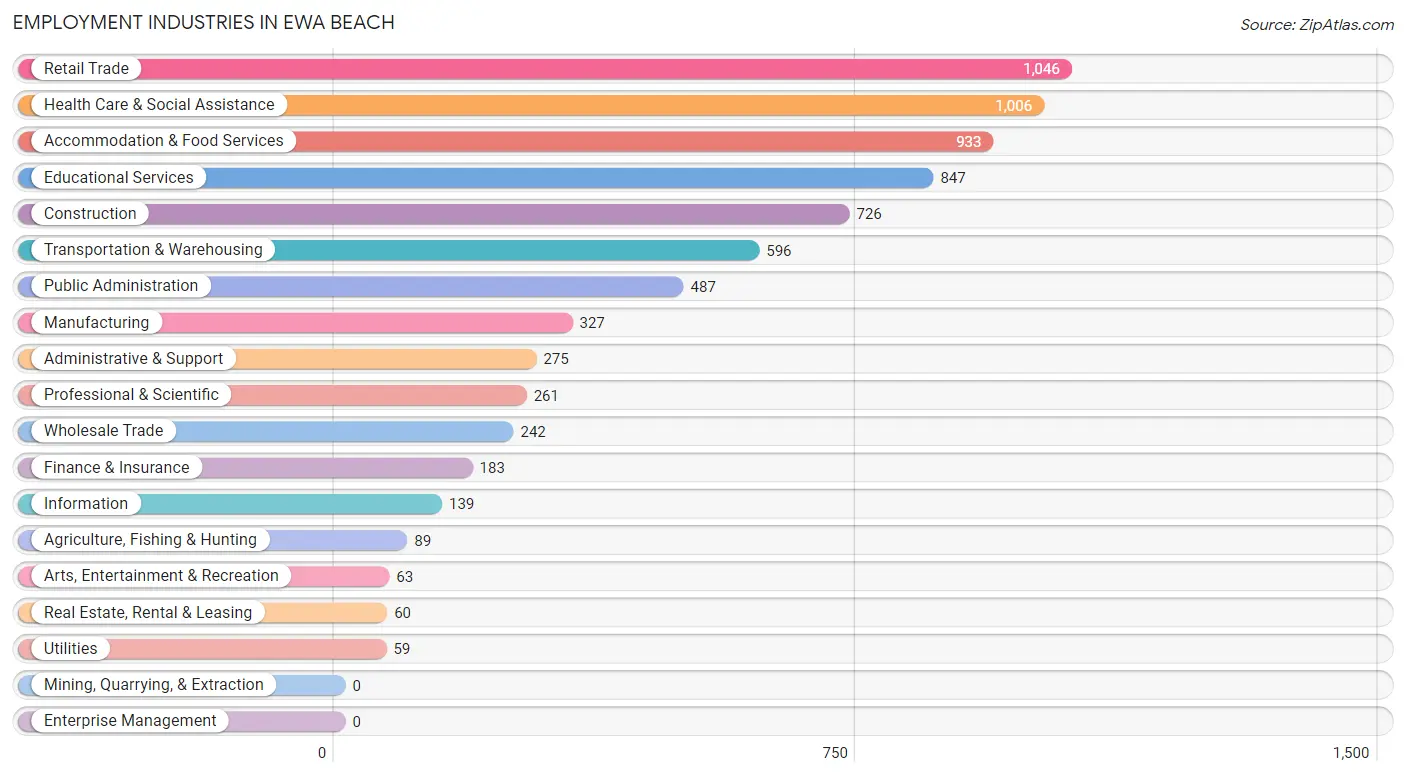
Employment Industries in Ewa Beach
The major employment industries in Ewa Beach include Retail Trade (1,046 | 13.9%), Health Care & Social Assistance (1,006 | 13.3%), Accommodation & Food Services (933 | 12.4%), Educational Services (847 | 11.2%), and Construction (726 | 9.6%).
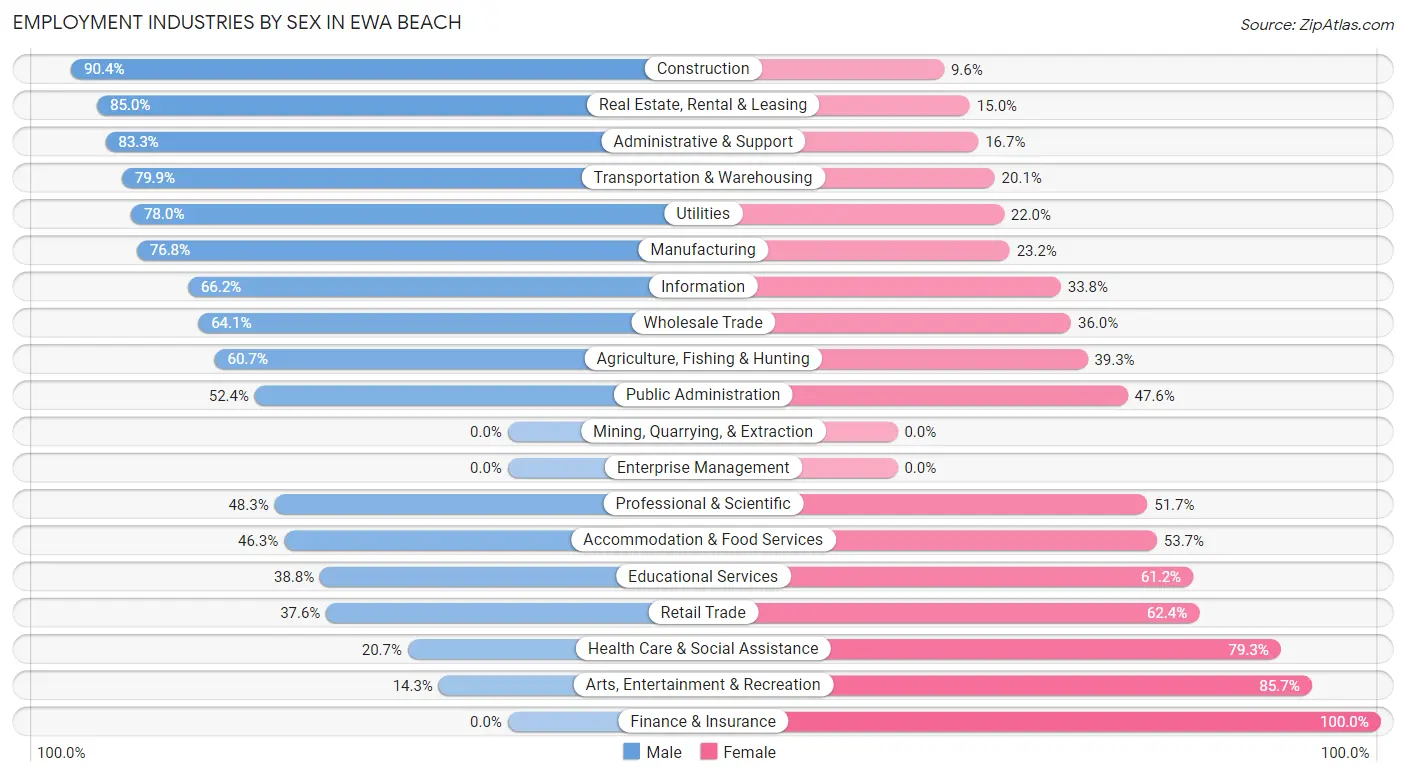
Employment Industries by Sex in Ewa Beach
The Ewa Beach industries that see more men than women are Construction (90.4%), Real Estate, Rental & Leasing (85.0%), and Administrative & Support (83.3%), whereas the industries that tend to have a higher number of women are Finance & Insurance (100.0%), Arts, Entertainment & Recreation (85.7%), and Health Care & Social Assistance (79.3%).
| Industry | Male | Female |
| Agriculture, Fishing & Hunting | 54 (60.7%) | 35 (39.3%) |
| Mining, Quarrying, & Extraction | 0 (0.0%) | 0 (0.0%) |
| Construction | 656 (90.4%) | 70 (9.6%) |
| Manufacturing | 251 (76.8%) | 76 (23.2%) |
| Wholesale Trade | 155 (64.0%) | 87 (35.9%) |
| Retail Trade | 393 (37.6%) | 653 (62.4%) |
| Transportation & Warehousing | 476 (79.9%) | 120 (20.1%) |
| Utilities | 46 (78.0%) | 13 (22.0%) |
| Information | 92 (66.2%) | 47 (33.8%) |
| Finance & Insurance | 0 (0.0%) | 183 (100.0%) |
| Real Estate, Rental & Leasing | 51 (85.0%) | 9 (15.0%) |
| Professional & Scientific | 126 (48.3%) | 135 (51.7%) |
| Enterprise Management | 0 (0.0%) | 0 (0.0%) |
| Administrative & Support | 229 (83.3%) | 46 (16.7%) |
| Educational Services | 329 (38.8%) | 518 (61.2%) |
| Health Care & Social Assistance | 208 (20.7%) | 798 (79.3%) |
| Arts, Entertainment & Recreation | 9 (14.3%) | 54 (85.7%) |
| Accommodation & Food Services | 432 (46.3%) | 501 (53.7%) |
| Public Administration | 255 (52.4%) | 232 (47.6%) |
| Total | 3,871 (51.3%) | 3,680 (48.7%) |
Education in Ewa Beach
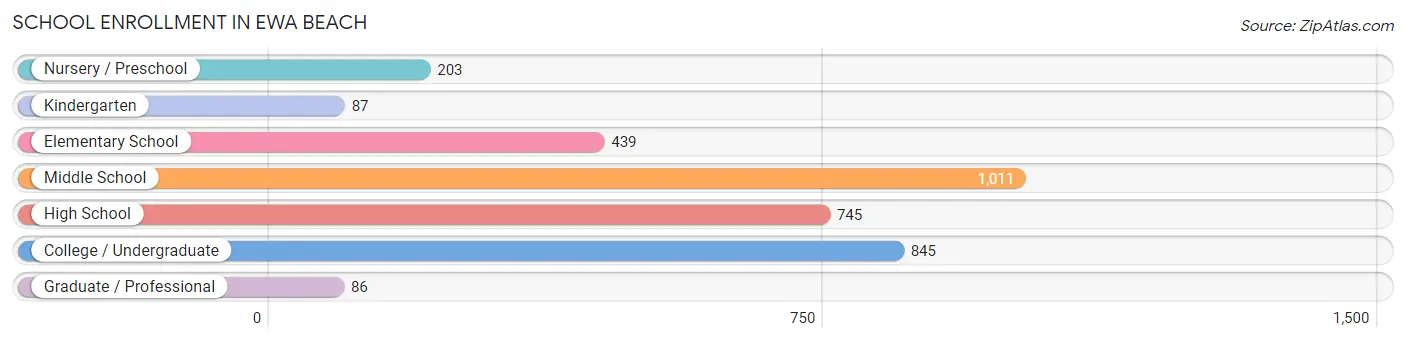
School Enrollment in Ewa Beach
The most common levels of schooling among the 3,416 students in Ewa Beach are middle school (1,011 | 29.6%), college / undergraduate (845 | 24.7%), and high school (745 | 21.8%).
| School Level | # Students | % Students |
| Nursery / Preschool | 203 | 5.9% |
| Kindergarten | 87 | 2.5% |
| Elementary School | 439 | 12.9% |
| Middle School | 1,011 | 29.6% |
| High School | 745 | 21.8% |
| College / Undergraduate | 845 | 24.7% |
| Graduate / Professional | 86 | 2.5% |
| Total | 3,416 | 100.0% |
School Enrollment by Age by Funding Source in Ewa Beach
Out of a total of 3,416 students who are enrolled in schools in Ewa Beach, 348 (10.2%) attend a private institution, while the remaining 3,068 (89.8%) are enrolled in public schools. The age group of 3 to 4 year olds has the highest likelihood of being enrolled in private schools, with 127 (75.6% in the age bracket) enrolled. Conversely, the age group of 18 to 19 year olds has the lowest likelihood of being enrolled in a private school, with 93 (100.0% in the age bracket) attending a public institution.
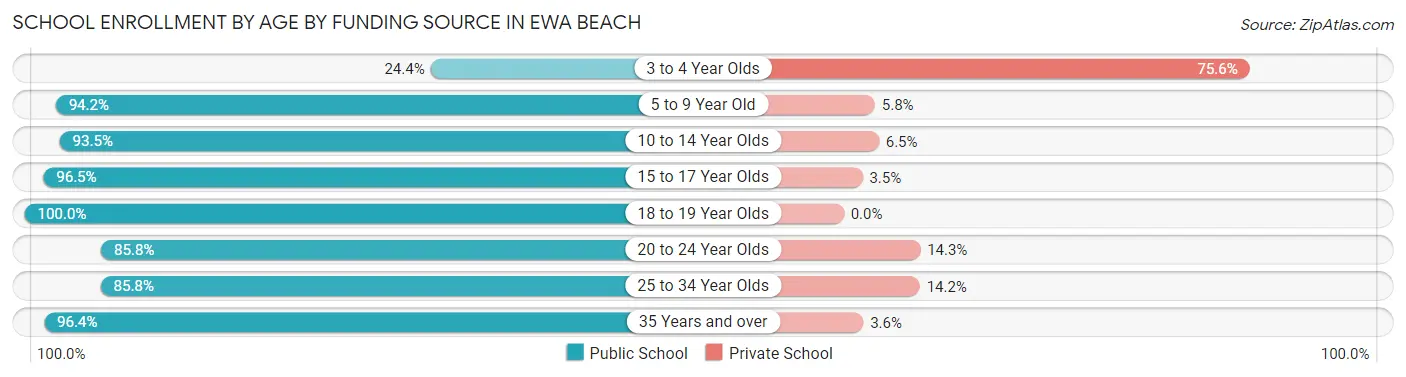
| Age Bracket | Public School | Private School |
| 3 to 4 Year Olds | 41 (24.4%) | 127 (75.6%) |
| 5 to 9 Year Old | 487 (94.2%) | 30 (5.8%) |
| 10 to 14 Year Olds | 1,115 (93.5%) | 78 (6.5%) |
| 15 to 17 Year Olds | 552 (96.5%) | 20 (3.5%) |
| 18 to 19 Year Olds | 93 (100.0%) | 0 (0.0%) |
| 20 to 24 Year Olds | 319 (85.8%) | 53 (14.2%) |
| 25 to 34 Year Olds | 194 (85.8%) | 32 (14.2%) |
| 35 Years and over | 265 (96.4%) | 10 (3.6%) |
| Total | 3,068 (89.8%) | 348 (10.2%) |
Educational Attainment by Field of Study in Ewa Beach
Business (562 | 24.7%), science & technology (391 | 17.2%), education (267 | 11.7%), arts & humanities (226 | 9.9%), and social sciences (177 | 7.8%) are the most common fields of study among 2,277 individuals in Ewa Beach who have obtained a bachelor's degree or higher.
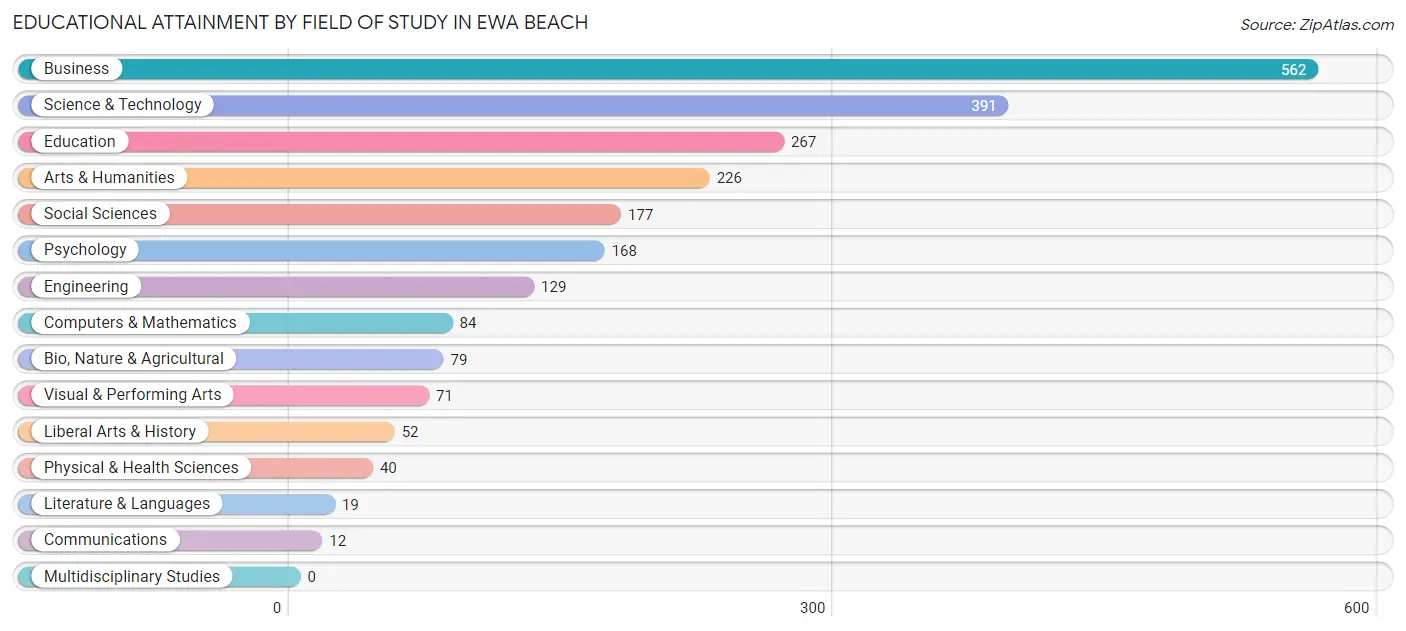
| Field of Study | # Graduates | % Graduates |
| Computers & Mathematics | 84 | 3.7% |
| Bio, Nature & Agricultural | 79 | 3.5% |
| Physical & Health Sciences | 40 | 1.8% |
| Psychology | 168 | 7.4% |
| Social Sciences | 177 | 7.8% |
| Engineering | 129 | 5.7% |
| Multidisciplinary Studies | 0 | 0.0% |
| Science & Technology | 391 | 17.2% |
| Business | 562 | 24.7% |
| Education | 267 | 11.7% |
| Literature & Languages | 19 | 0.8% |
| Liberal Arts & History | 52 | 2.3% |
| Visual & Performing Arts | 71 | 3.1% |
| Communications | 12 | 0.5% |
| Arts & Humanities | 226 | 9.9% |
| Total | 2,277 | 100.0% |
Transportation & Commute in Ewa Beach
Vehicle Availability by Sex in Ewa Beach
The most prevalent vehicle ownership categories in Ewa Beach are males with 5 or more vehicles (1,010, accounting for 25.8%) and females with 5 or more vehicles (1,068, making up 29.0%).
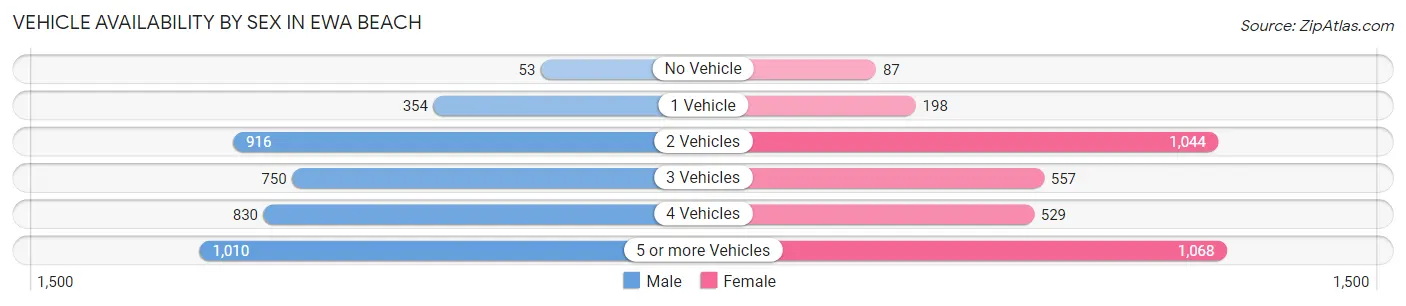
| Vehicles Available | Male | Female |
| No Vehicle | 53 (1.3%) | 87 (2.5%) |
| 1 Vehicle | 354 (9.0%) | 198 (5.7%) |
| 2 Vehicles | 916 (23.4%) | 1,044 (30.0%) |
| 3 Vehicles | 750 (19.2%) | 557 (16.0%) |
| 4 Vehicles | 830 (21.2%) | 529 (15.2%) |
| 5 or more Vehicles | 1,010 (25.8%) | 1,068 (30.7%) |
| Total | 3,913 (100.0%) | 3,483 (100.0%) |
Commute Time in Ewa Beach
The most frequently occuring commute durations in Ewa Beach are 30 to 34 minutes (1,560 commuters, 21.8%), 60 to 89 minutes (1,273 commuters, 17.8%), and 45 to 59 minutes (981 commuters, 13.7%).
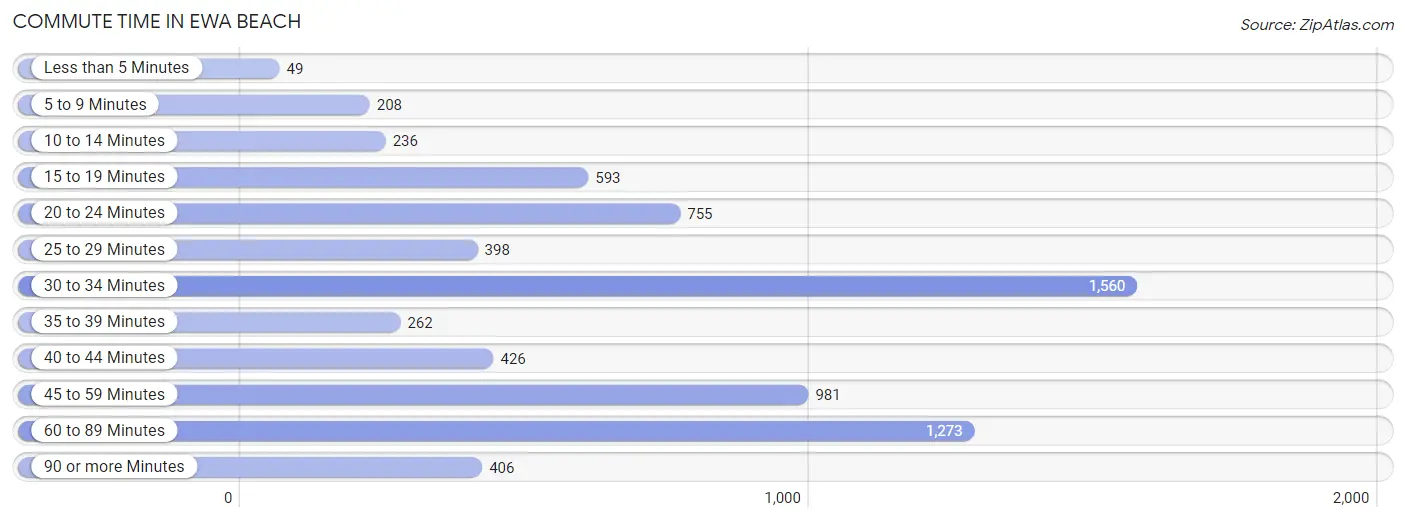
| Commute Time | # Commuters | % Commuters |
| Less than 5 Minutes | 49 | 0.7% |
| 5 to 9 Minutes | 208 | 2.9% |
| 10 to 14 Minutes | 236 | 3.3% |
| 15 to 19 Minutes | 593 | 8.3% |
| 20 to 24 Minutes | 755 | 10.6% |
| 25 to 29 Minutes | 398 | 5.6% |
| 30 to 34 Minutes | 1,560 | 21.8% |
| 35 to 39 Minutes | 262 | 3.7% |
| 40 to 44 Minutes | 426 | 6.0% |
| 45 to 59 Minutes | 981 | 13.7% |
| 60 to 89 Minutes | 1,273 | 17.8% |
| 90 or more Minutes | 406 | 5.7% |
Commute Time by Sex in Ewa Beach
The most common commute times in Ewa Beach are 30 to 34 minutes (938 commuters, 24.4%) for males and 30 to 34 minutes (622 commuters, 18.8%) for females.
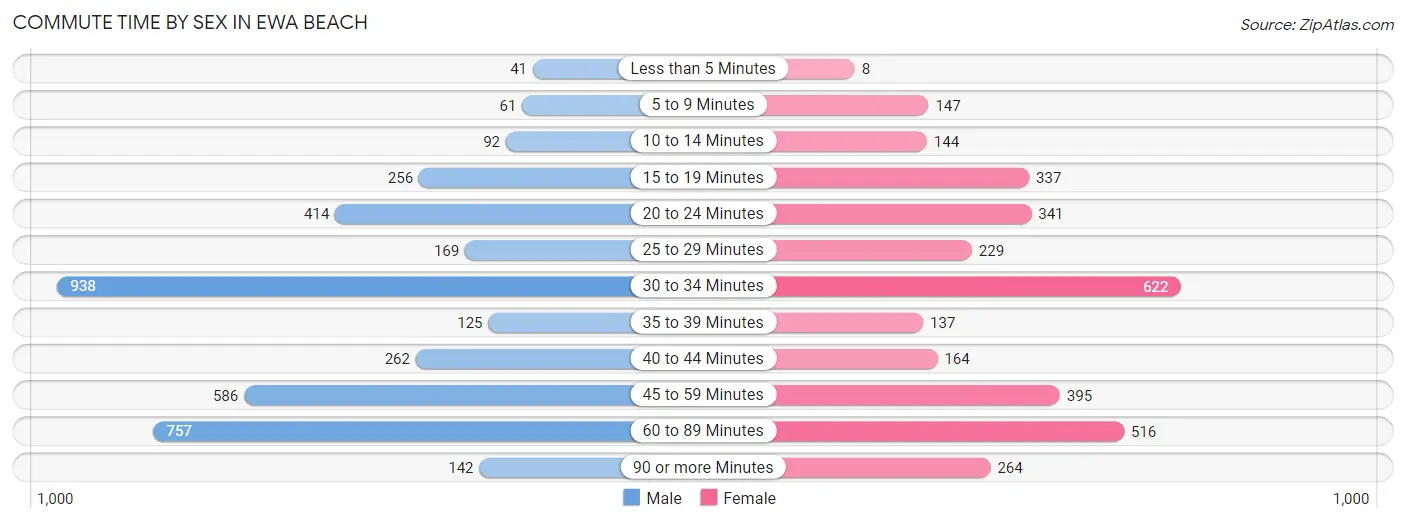
| Commute Time | Male | Female |
| Less than 5 Minutes | 41 (1.1%) | 8 (0.2%) |
| 5 to 9 Minutes | 61 (1.6%) | 147 (4.4%) |
| 10 to 14 Minutes | 92 (2.4%) | 144 (4.4%) |
| 15 to 19 Minutes | 256 (6.7%) | 337 (10.2%) |
| 20 to 24 Minutes | 414 (10.8%) | 341 (10.3%) |
| 25 to 29 Minutes | 169 (4.4%) | 229 (6.9%) |
| 30 to 34 Minutes | 938 (24.4%) | 622 (18.8%) |
| 35 to 39 Minutes | 125 (3.3%) | 137 (4.2%) |
| 40 to 44 Minutes | 262 (6.8%) | 164 (5.0%) |
| 45 to 59 Minutes | 586 (15.2%) | 395 (12.0%) |
| 60 to 89 Minutes | 757 (19.7%) | 516 (15.6%) |
| 90 or more Minutes | 142 (3.7%) | 264 (8.0%) |
Time of Departure to Work by Sex in Ewa Beach
The most frequent times of departure to work in Ewa Beach are 6:00 AM to 6:29 AM (876, 22.8%) for males and 6:30 AM to 6:59 AM (528, 16.0%) for females.
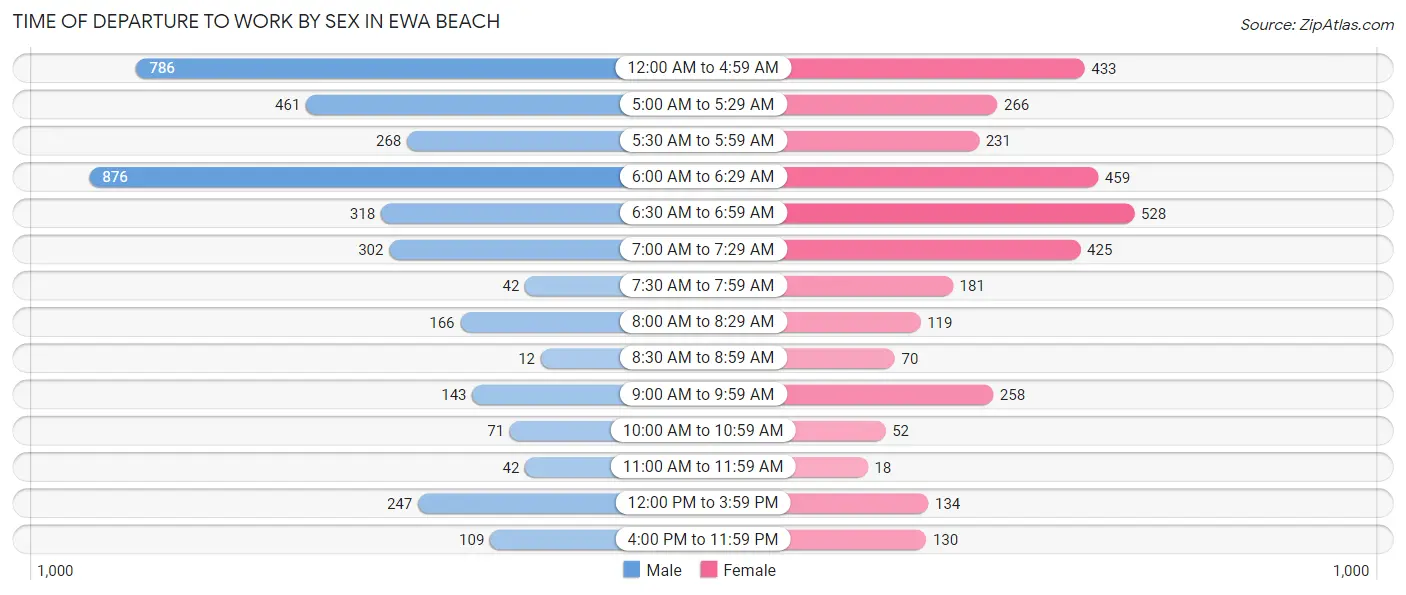
| Time of Departure | Male | Female |
| 12:00 AM to 4:59 AM | 786 (20.4%) | 433 (13.1%) |
| 5:00 AM to 5:29 AM | 461 (12.0%) | 266 (8.1%) |
| 5:30 AM to 5:59 AM | 268 (7.0%) | 231 (7.0%) |
| 6:00 AM to 6:29 AM | 876 (22.8%) | 459 (13.9%) |
| 6:30 AM to 6:59 AM | 318 (8.3%) | 528 (16.0%) |
| 7:00 AM to 7:29 AM | 302 (7.9%) | 425 (12.9%) |
| 7:30 AM to 7:59 AM | 42 (1.1%) | 181 (5.5%) |
| 8:00 AM to 8:29 AM | 166 (4.3%) | 119 (3.6%) |
| 8:30 AM to 8:59 AM | 12 (0.3%) | 70 (2.1%) |
| 9:00 AM to 9:59 AM | 143 (3.7%) | 258 (7.8%) |
| 10:00 AM to 10:59 AM | 71 (1.8%) | 52 (1.6%) |
| 11:00 AM to 11:59 AM | 42 (1.1%) | 18 (0.5%) |
| 12:00 PM to 3:59 PM | 247 (6.4%) | 134 (4.1%) |
| 4:00 PM to 11:59 PM | 109 (2.8%) | 130 (3.9%) |
| Total | 3,843 (100.0%) | 3,304 (100.0%) |
Housing Occupancy in Ewa Beach
Occupancy by Ownership in Ewa Beach
Of the total 3,415 dwellings in Ewa Beach, owner-occupied units account for 2,715 (79.5%), while renter-occupied units make up 700 (20.5%).
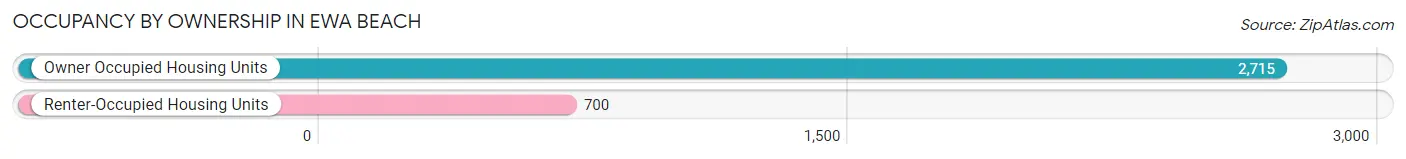
| Occupancy | # Housing Units | % Housing Units |
| Owner Occupied Housing Units | 2,715 | 79.5% |
| Renter-Occupied Housing Units | 700 | 20.5% |
| Total Occupied Housing Units | 3,415 | 100.0% |
Occupancy by Household Size in Ewa Beach
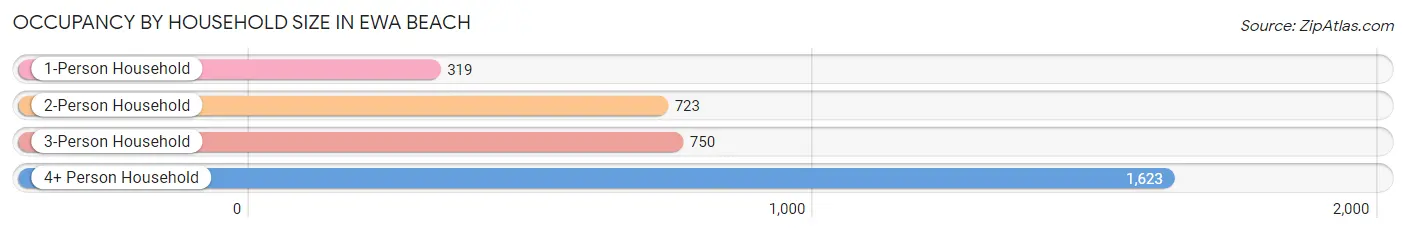
| Household Size | # Housing Units | % Housing Units |
| 1-Person Household | 319 | 9.3% |
| 2-Person Household | 723 | 21.2% |
| 3-Person Household | 750 | 22.0% |
| 4+ Person Household | 1,623 | 47.5% |
| Total Housing Units | 3,415 | 100.0% |
Occupancy by Ownership by Household Size in Ewa Beach
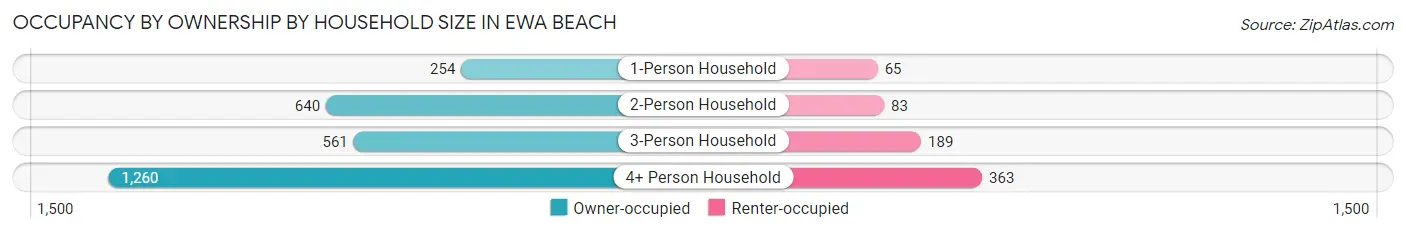
| Household Size | Owner-occupied | Renter-occupied |
| 1-Person Household | 254 (79.6%) | 65 (20.4%) |
| 2-Person Household | 640 (88.5%) | 83 (11.5%) |
| 3-Person Household | 561 (74.8%) | 189 (25.2%) |
| 4+ Person Household | 1,260 (77.6%) | 363 (22.4%) |
| Total Housing Units | 2,715 (79.5%) | 700 (20.5%) |
Occupancy by Educational Attainment in Ewa Beach
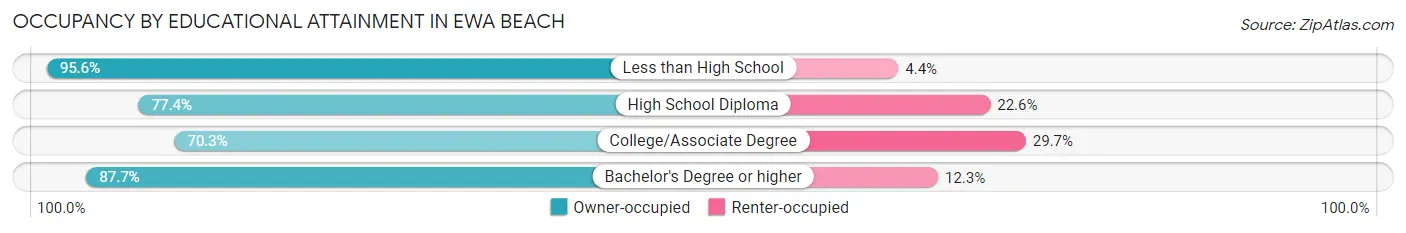
| Household Size | Owner-occupied | Renter-occupied |
| Less than High School | 369 (95.6%) | 17 (4.4%) |
| High School Diploma | 951 (77.4%) | 278 (22.6%) |
| College/Associate Degree | 744 (70.3%) | 314 (29.7%) |
| Bachelor's Degree or higher | 651 (87.7%) | 91 (12.3%) |
Occupancy by Age of Householder in Ewa Beach
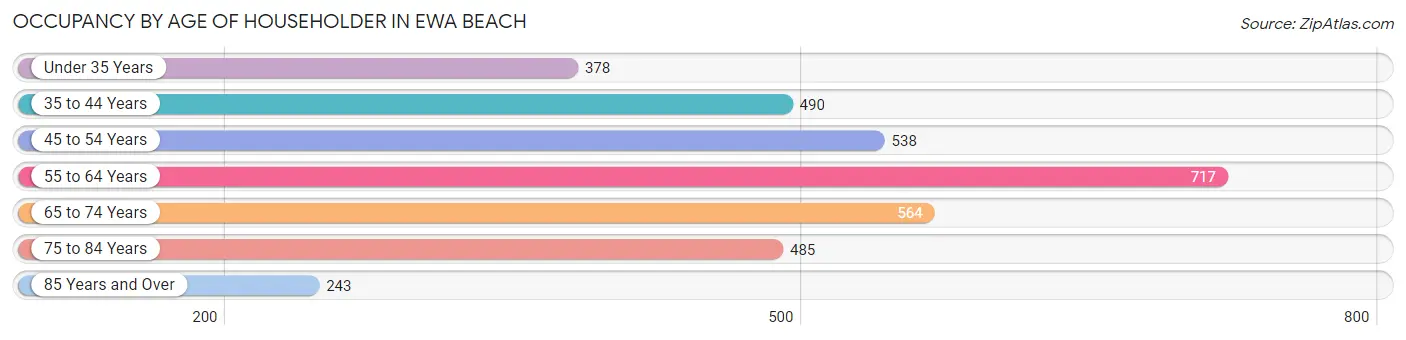
| Age Bracket | # Households | % Households |
| Under 35 Years | 378 | 11.1% |
| 35 to 44 Years | 490 | 14.3% |
| 45 to 54 Years | 538 | 15.8% |
| 55 to 64 Years | 717 | 21.0% |
| 65 to 74 Years | 564 | 16.5% |
| 75 to 84 Years | 485 | 14.2% |
| 85 Years and Over | 243 | 7.1% |
| Total | 3,415 | 100.0% |
Housing Finances in Ewa Beach
Median Income by Occupancy in Ewa Beach
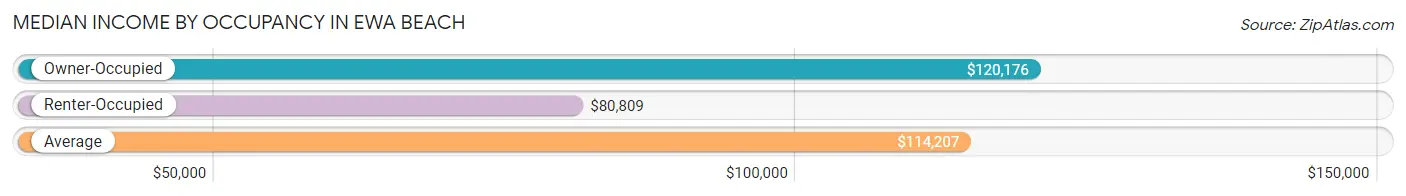
| Occupancy Type | # Households | Median Income |
| Owner-Occupied | 2,715 (79.5%) | $120,176 |
| Renter-Occupied | 700 (20.5%) | $80,809 |
| Average | 3,415 (100.0%) | $114,207 |
Occupancy by Householder Income Bracket in Ewa Beach
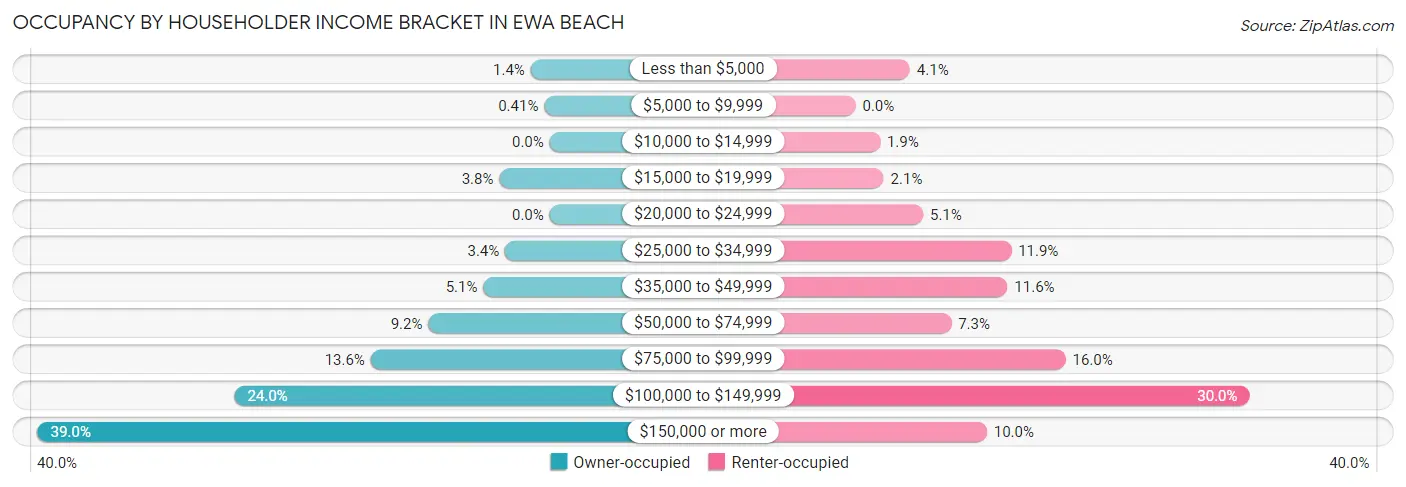
| Income Bracket | Owner-occupied | Renter-occupied |
| Less than $5,000 | 39 (1.4%) | 29 (4.1%) |
| $5,000 to $9,999 | 11 (0.4%) | 0 (0.0%) |
| $10,000 to $14,999 | 0 (0.0%) | 13 (1.9%) |
| $15,000 to $19,999 | 104 (3.8%) | 15 (2.1%) |
| $20,000 to $24,999 | 0 (0.0%) | 36 (5.1%) |
| $25,000 to $34,999 | 92 (3.4%) | 83 (11.9%) |
| $35,000 to $49,999 | 137 (5.1%) | 81 (11.6%) |
| $50,000 to $74,999 | 251 (9.2%) | 51 (7.3%) |
| $75,000 to $99,999 | 370 (13.6%) | 112 (16.0%) |
| $100,000 to $149,999 | 652 (24.0%) | 210 (30.0%) |
| $150,000 or more | 1,059 (39.0%) | 70 (10.0%) |
| Total | 2,715 (100.0%) | 700 (100.0%) |
Monthly Housing Cost Tiers in Ewa Beach
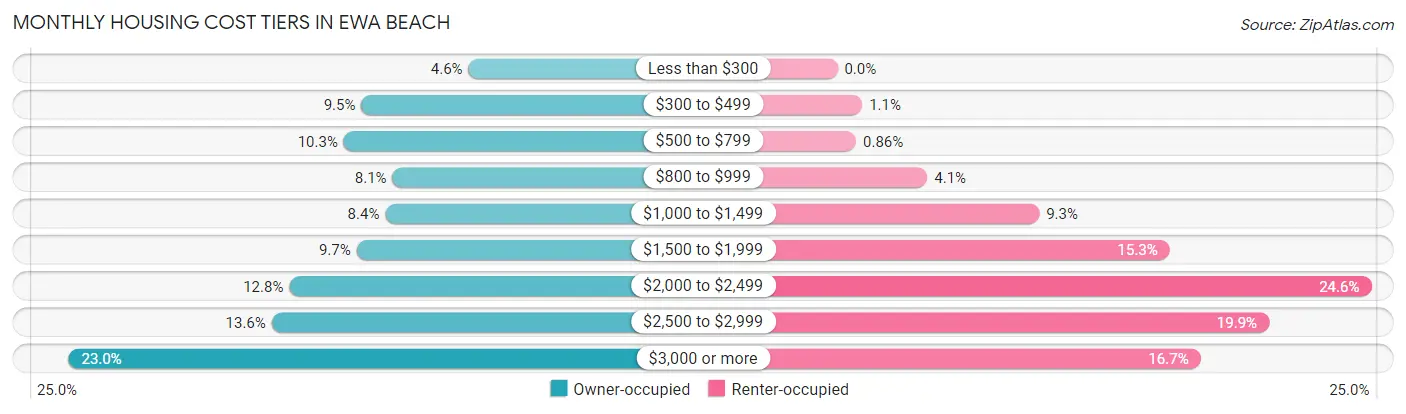
| Monthly Cost | Owner-occupied | Renter-occupied |
| Less than $300 | 124 (4.6%) | 0 (0.0%) |
| $300 to $499 | 258 (9.5%) | 8 (1.1%) |
| $500 to $799 | 280 (10.3%) | 6 (0.9%) |
| $800 to $999 | 219 (8.1%) | 29 (4.1%) |
| $1,000 to $1,499 | 228 (8.4%) | 65 (9.3%) |
| $1,500 to $1,999 | 264 (9.7%) | 107 (15.3%) |
| $2,000 to $2,499 | 348 (12.8%) | 172 (24.6%) |
| $2,500 to $2,999 | 370 (13.6%) | 139 (19.9%) |
| $3,000 or more | 624 (23.0%) | 117 (16.7%) |
| Total | 2,715 (100.0%) | 700 (100.0%) |
Physical Housing Characteristics in Ewa Beach
Housing Structures in Ewa Beach
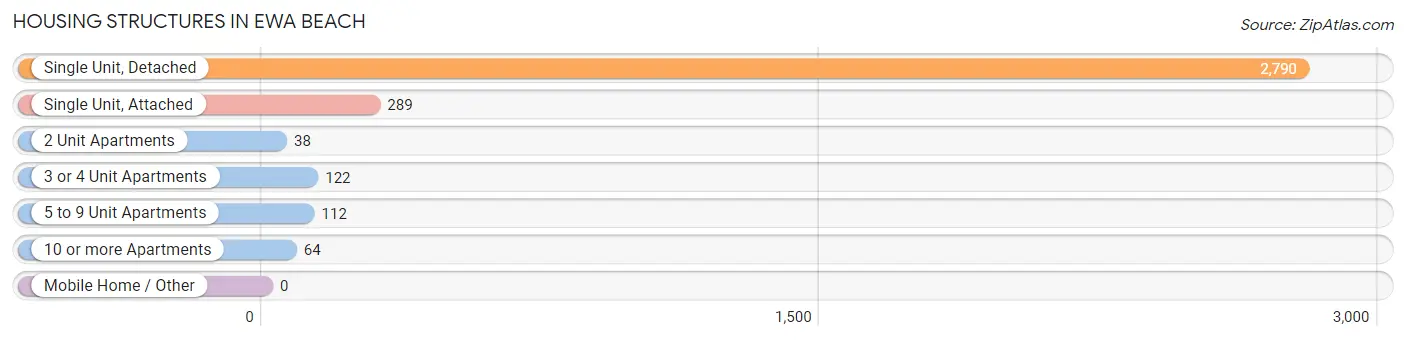
| Structure Type | # Housing Units | % Housing Units |
| Single Unit, Detached | 2,790 | 81.7% |
| Single Unit, Attached | 289 | 8.5% |
| 2 Unit Apartments | 38 | 1.1% |
| 3 or 4 Unit Apartments | 122 | 3.6% |
| 5 to 9 Unit Apartments | 112 | 3.3% |
| 10 or more Apartments | 64 | 1.9% |
| Mobile Home / Other | 0 | 0.0% |
| Total | 3,415 | 100.0% |
Housing Structures by Occupancy in Ewa Beach
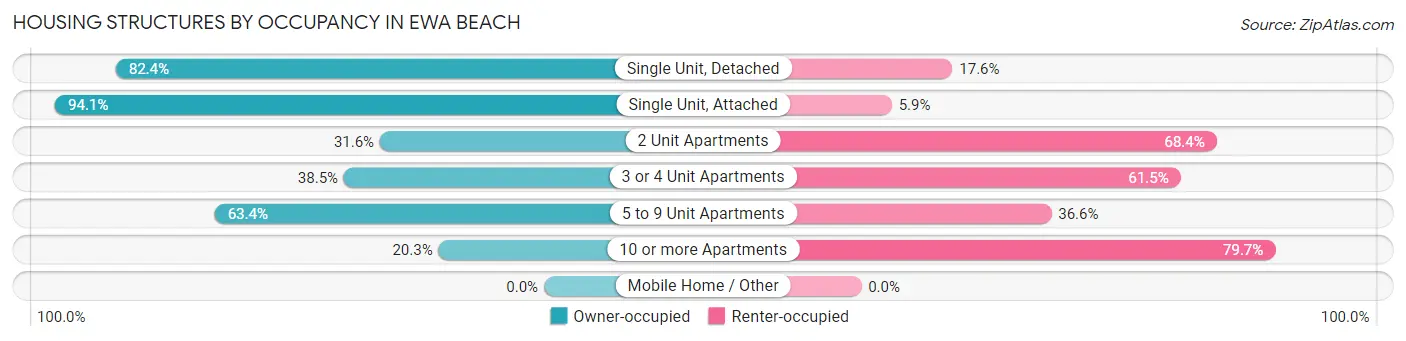
| Structure Type | Owner-occupied | Renter-occupied |
| Single Unit, Detached | 2,300 (82.4%) | 490 (17.6%) |
| Single Unit, Attached | 272 (94.1%) | 17 (5.9%) |
| 2 Unit Apartments | 12 (31.6%) | 26 (68.4%) |
| 3 or 4 Unit Apartments | 47 (38.5%) | 75 (61.5%) |
| 5 to 9 Unit Apartments | 71 (63.4%) | 41 (36.6%) |
| 10 or more Apartments | 13 (20.3%) | 51 (79.7%) |
| Mobile Home / Other | 0 (0.0%) | 0 (0.0%) |
| Total | 2,715 (79.5%) | 700 (20.5%) |
Housing Structures by Number of Rooms in Ewa Beach
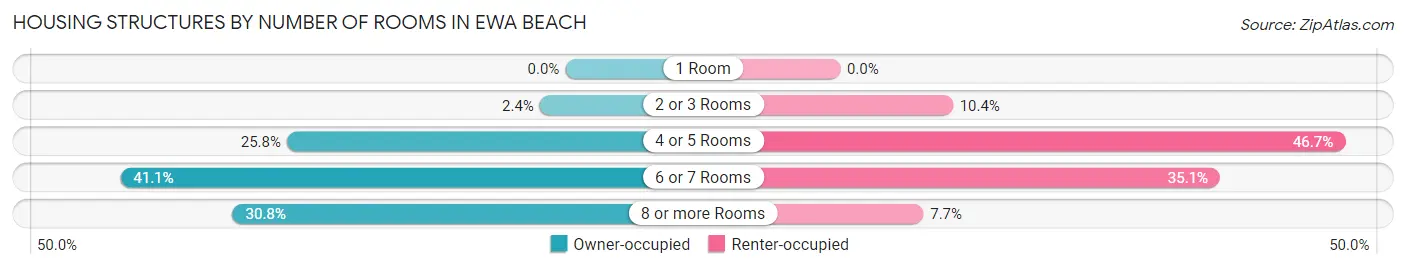
| Number of Rooms | Owner-occupied | Renter-occupied |
| 1 Room | 0 (0.0%) | 0 (0.0%) |
| 2 or 3 Rooms | 64 (2.4%) | 73 (10.4%) |
| 4 or 5 Rooms | 699 (25.8%) | 327 (46.7%) |
| 6 or 7 Rooms | 1,117 (41.1%) | 246 (35.1%) |
| 8 or more Rooms | 835 (30.8%) | 54 (7.7%) |
| Total | 2,715 (100.0%) | 700 (100.0%) |
Housing Structure by Heating Type in Ewa Beach
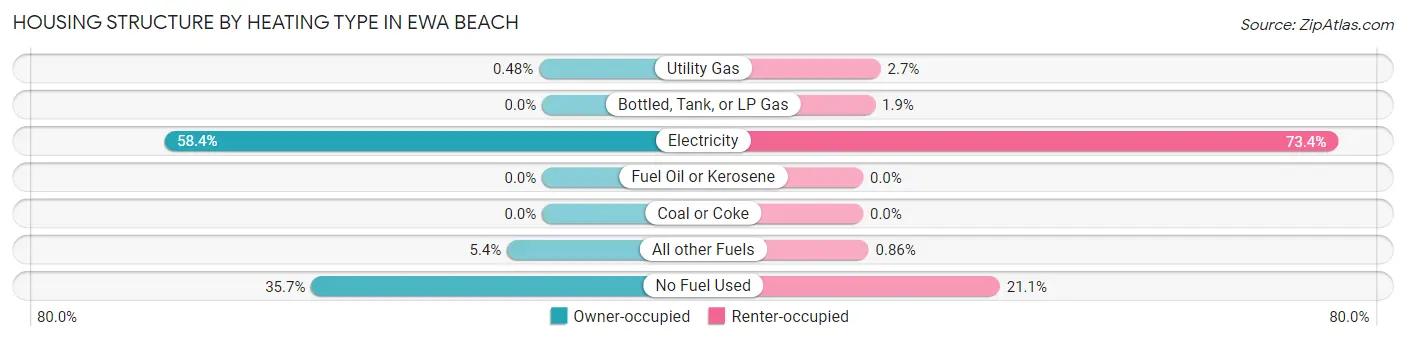
| Heating Type | Owner-occupied | Renter-occupied |
| Utility Gas | 13 (0.5%) | 19 (2.7%) |
| Bottled, Tank, or LP Gas | 0 (0.0%) | 13 (1.9%) |
| Electricity | 1,586 (58.4%) | 514 (73.4%) |
| Fuel Oil or Kerosene | 0 (0.0%) | 0 (0.0%) |
| Coal or Coke | 0 (0.0%) | 0 (0.0%) |
| All other Fuels | 147 (5.4%) | 6 (0.9%) |
| No Fuel Used | 969 (35.7%) | 148 (21.1%) |
| Total | 2,715 (100.0%) | 700 (100.0%) |
Household Vehicle Usage in Ewa Beach
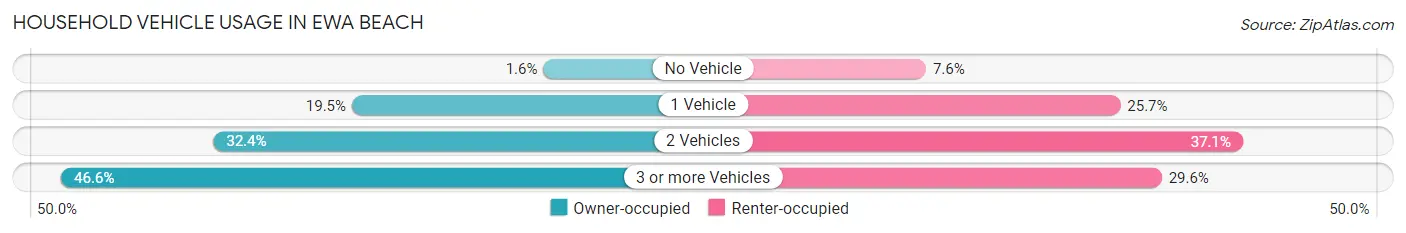
| Vehicles per Household | Owner-occupied | Renter-occupied |
| No Vehicle | 43 (1.6%) | 53 (7.6%) |
| 1 Vehicle | 528 (19.5%) | 180 (25.7%) |
| 2 Vehicles | 879 (32.4%) | 260 (37.1%) |
| 3 or more Vehicles | 1,265 (46.6%) | 207 (29.6%) |
| Total | 2,715 (100.0%) | 700 (100.0%) |
Real Estate & Mortgages in Ewa Beach
Real Estate and Mortgage Overview in Ewa Beach
| Characteristic | Without Mortgage | With Mortgage |
| Housing Units | 880 | 1,835 |
| Median Property Value | $645,300 | $648,800 |
| Median Household Income | $94,808 | $854 |
| Monthly Housing Costs | $544 | $624 |
| Real Estate Taxes | $2,011 | $75 |
Property Value by Mortgage Status in Ewa Beach
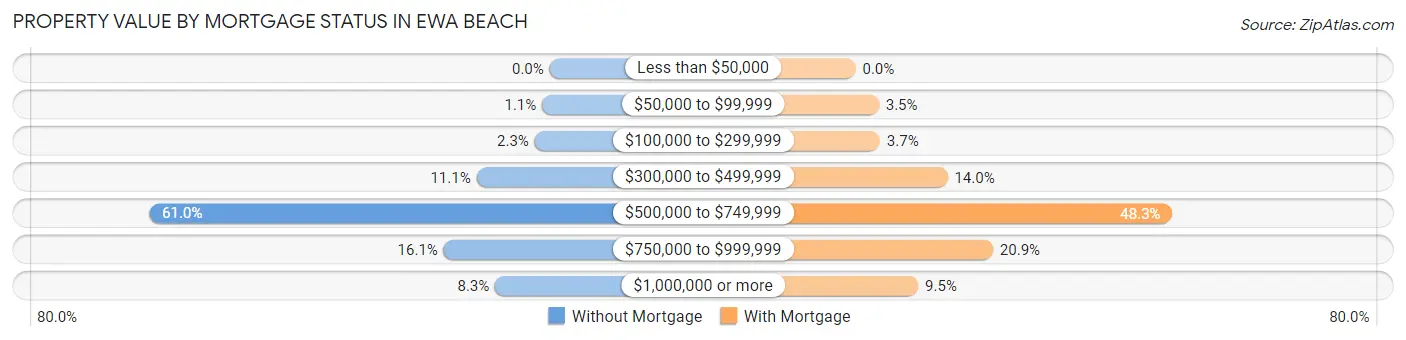
| Property Value | Without Mortgage | With Mortgage |
| Less than $50,000 | 0 (0.0%) | 0 (0.0%) |
| $50,000 to $99,999 | 10 (1.1%) | 65 (3.5%) |
| $100,000 to $299,999 | 20 (2.3%) | 68 (3.7%) |
| $300,000 to $499,999 | 98 (11.1%) | 257 (14.0%) |
| $500,000 to $749,999 | 537 (61.0%) | 886 (48.3%) |
| $750,000 to $999,999 | 142 (16.1%) | 384 (20.9%) |
| $1,000,000 or more | 73 (8.3%) | 175 (9.5%) |
| Total | 880 (100.0%) | 1,835 (100.0%) |
Household Income by Mortgage Status in Ewa Beach
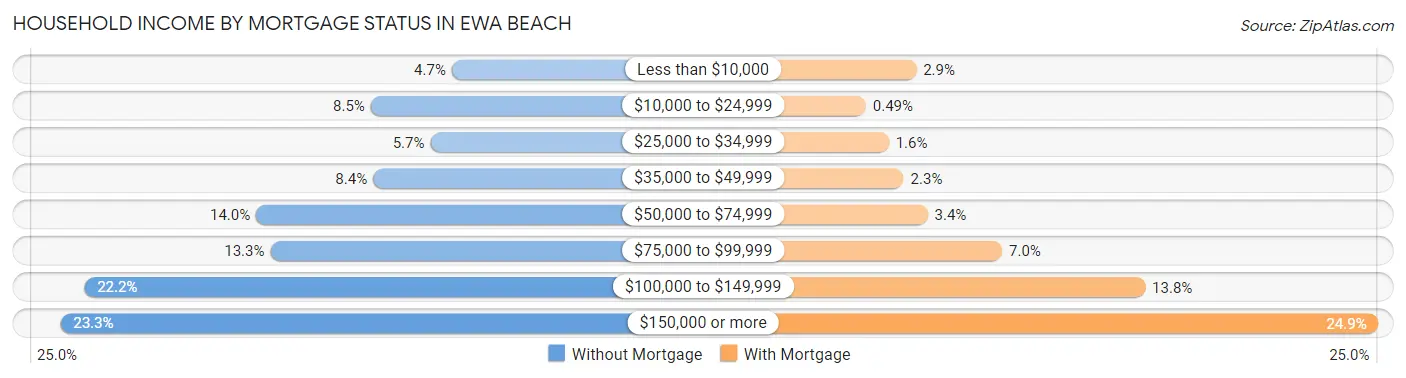
| Household Income | Without Mortgage | With Mortgage |
| Less than $10,000 | 41 (4.7%) | 53 (2.9%) |
| $10,000 to $24,999 | 75 (8.5%) | 9 (0.5%) |
| $25,000 to $34,999 | 50 (5.7%) | 29 (1.6%) |
| $35,000 to $49,999 | 74 (8.4%) | 42 (2.3%) |
| $50,000 to $74,999 | 123 (14.0%) | 63 (3.4%) |
| $75,000 to $99,999 | 117 (13.3%) | 128 (7.0%) |
| $100,000 to $149,999 | 195 (22.2%) | 253 (13.8%) |
| $150,000 or more | 205 (23.3%) | 457 (24.9%) |
| Total | 880 (100.0%) | 1,835 (100.0%) |
Property Value to Household Income Ratio in Ewa Beach
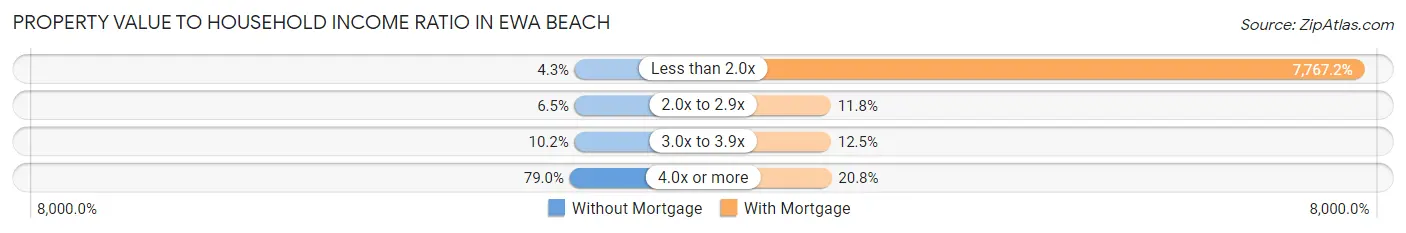
| Value-to-Income Ratio | Without Mortgage | With Mortgage |
| Less than 2.0x | 38 (4.3%) | 142,528 (7,767.2%) |
| 2.0x to 2.9x | 57 (6.5%) | 216 (11.8%) |
| 3.0x to 3.9x | 90 (10.2%) | 230 (12.5%) |
| 4.0x or more | 695 (79.0%) | 381 (20.8%) |
| Total | 880 (100.0%) | 1,835 (100.0%) |
Real Estate Taxes by Mortgage Status in Ewa Beach
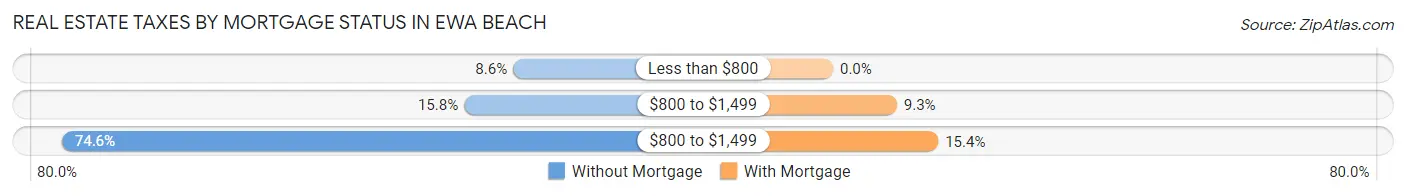
| Property Taxes | Without Mortgage | With Mortgage |
| Less than $800 | 76 (8.6%) | 0 (0.0%) |
| $800 to $1,499 | 139 (15.8%) | 171 (9.3%) |
| $800 to $1,499 | 656 (74.6%) | 282 (15.4%) |
| Total | 880 (100.0%) | 1,835 (100.0%) |
Health & Disability in Ewa Beach
Health Insurance Coverage by Age in Ewa Beach
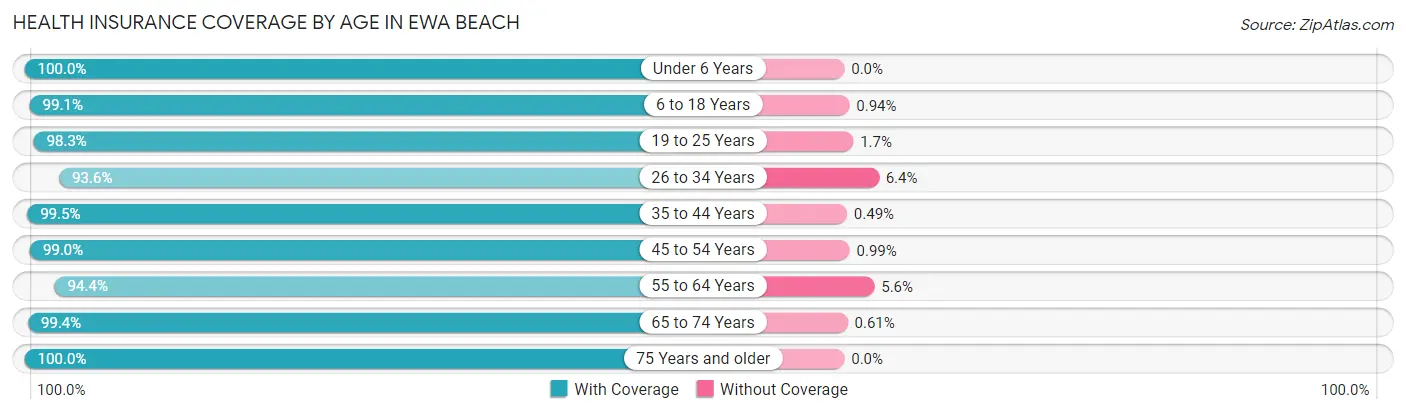
| Age Bracket | With Coverage | Without Coverage |
| Under 6 Years | 643 (100.0%) | 0 (0.0%) |
| 6 to 18 Years | 2,328 (99.1%) | 22 (0.9%) |
| 19 to 25 Years | 1,366 (98.3%) | 23 (1.7%) |
| 26 to 34 Years | 1,822 (93.6%) | 125 (6.4%) |
| 35 to 44 Years | 2,018 (99.5%) | 10 (0.5%) |
| 45 to 54 Years | 1,597 (99.0%) | 16 (1.0%) |
| 55 to 64 Years | 2,042 (94.4%) | 121 (5.6%) |
| 65 to 74 Years | 1,466 (99.4%) | 9 (0.6%) |
| 75 Years and older | 1,398 (100.0%) | 0 (0.0%) |
| Total | 14,680 (97.8%) | 326 (2.2%) |
Health Insurance Coverage by Citizenship Status in Ewa Beach
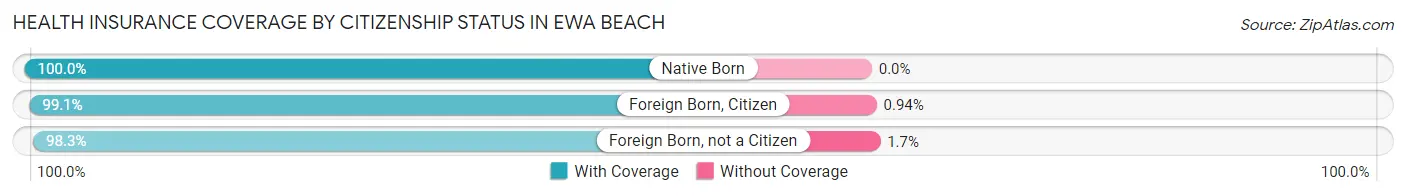
| Citizenship Status | With Coverage | Without Coverage |
| Native Born | 643 (100.0%) | 0 (0.0%) |
| Foreign Born, Citizen | 2,328 (99.1%) | 22 (0.9%) |
| Foreign Born, not a Citizen | 1,366 (98.3%) | 23 (1.7%) |
Health Insurance Coverage by Household Income in Ewa Beach
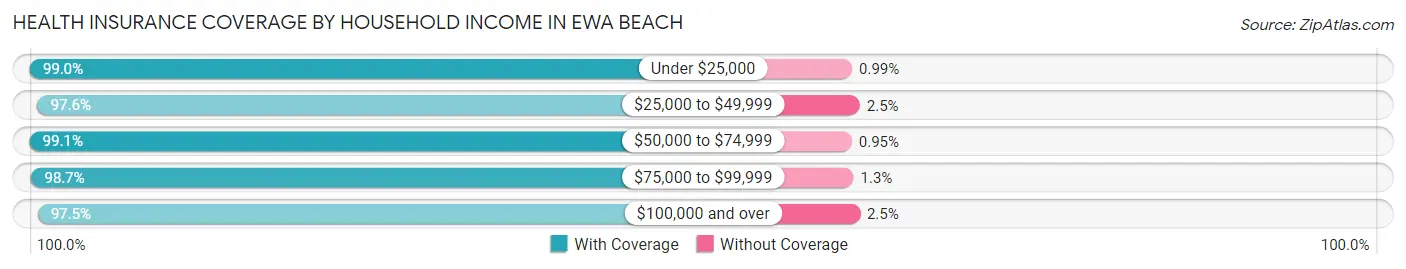
| Household Income | With Coverage | Without Coverage |
| Under $25,000 | 498 (99.0%) | 5 (1.0%) |
| $25,000 to $49,999 | 1,037 (97.6%) | 26 (2.5%) |
| $50,000 to $74,999 | 729 (99.1%) | 7 (0.9%) |
| $75,000 to $99,999 | 1,712 (98.7%) | 22 (1.3%) |
| $100,000 and over | 10,559 (97.5%) | 266 (2.5%) |
Public vs Private Health Insurance Coverage by Age in Ewa Beach
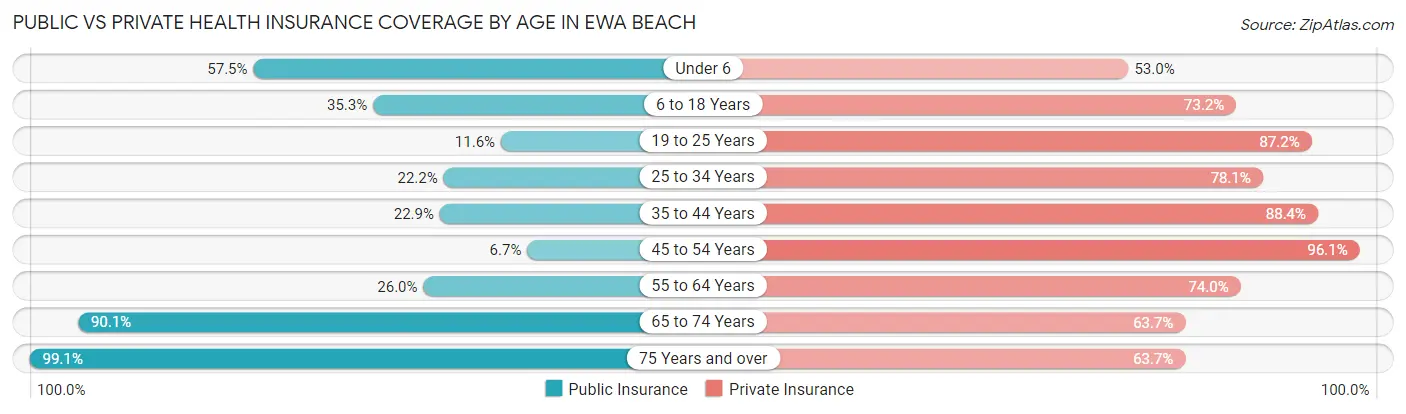
| Age Bracket | Public Insurance | Private Insurance |
| Under 6 | 370 (57.5%) | 341 (53.0%) |
| 6 to 18 Years | 830 (35.3%) | 1,720 (73.2%) |
| 19 to 25 Years | 161 (11.6%) | 1,211 (87.2%) |
| 25 to 34 Years | 433 (22.2%) | 1,521 (78.1%) |
| 35 to 44 Years | 465 (22.9%) | 1,792 (88.4%) |
| 45 to 54 Years | 108 (6.7%) | 1,550 (96.1%) |
| 55 to 64 Years | 562 (26.0%) | 1,601 (74.0%) |
| 65 to 74 Years | 1,329 (90.1%) | 940 (63.7%) |
| 75 Years and over | 1,385 (99.1%) | 891 (63.7%) |
| Total | 5,643 (37.6%) | 11,567 (77.1%) |
Disability Status by Sex by Age in Ewa Beach
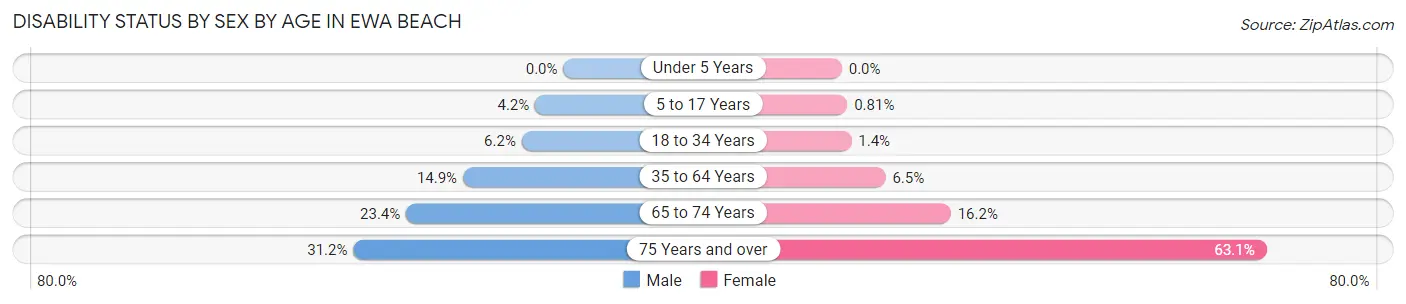
| Age Bracket | Male | Female |
| Under 5 Years | 0 (0.0%) | 0 (0.0%) |
| 5 to 17 Years | 51 (4.2%) | 9 (0.8%) |
| 18 to 34 Years | 108 (6.2%) | 24 (1.4%) |
| 35 to 64 Years | 472 (14.9%) | 171 (6.5%) |
| 65 to 74 Years | 177 (23.4%) | 116 (16.2%) |
| 75 Years and over | 165 (31.2%) | 548 (63.1%) |
Disability Class by Sex by Age in Ewa Beach
Disability Class: Hearing Difficulty
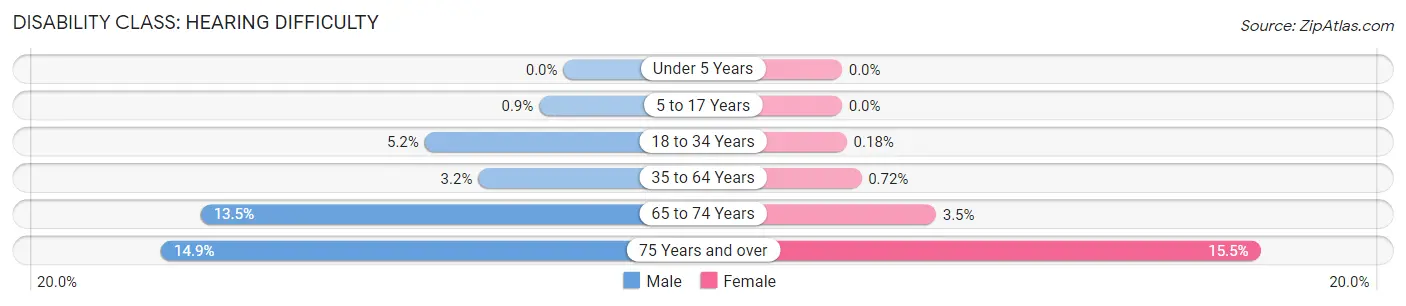
| Age Bracket | Male | Female |
| Under 5 Years | 0 (0.0%) | 0 (0.0%) |
| 5 to 17 Years | 11 (0.9%) | 0 (0.0%) |
| 18 to 34 Years | 90 (5.1%) | 3 (0.2%) |
| 35 to 64 Years | 100 (3.2%) | 19 (0.7%) |
| 65 to 74 Years | 102 (13.5%) | 25 (3.5%) |
| 75 Years and over | 79 (14.9%) | 135 (15.5%) |
Disability Class: Vision Difficulty
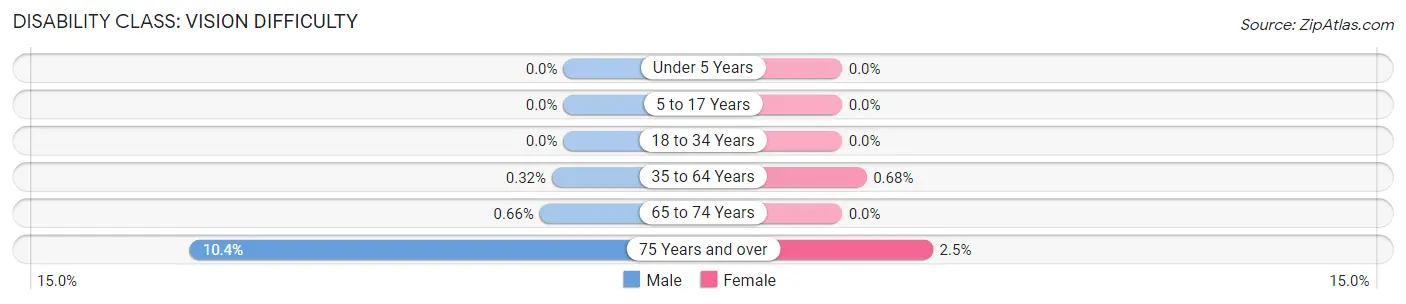
| Age Bracket | Male | Female |
| Under 5 Years | 0 (0.0%) | 0 (0.0%) |
| 5 to 17 Years | 0 (0.0%) | 0 (0.0%) |
| 18 to 34 Years | 0 (0.0%) | 0 (0.0%) |
| 35 to 64 Years | 10 (0.3%) | 18 (0.7%) |
| 65 to 74 Years | 5 (0.7%) | 0 (0.0%) |
| 75 Years and over | 55 (10.4%) | 22 (2.5%) |
Disability Class: Cognitive Difficulty
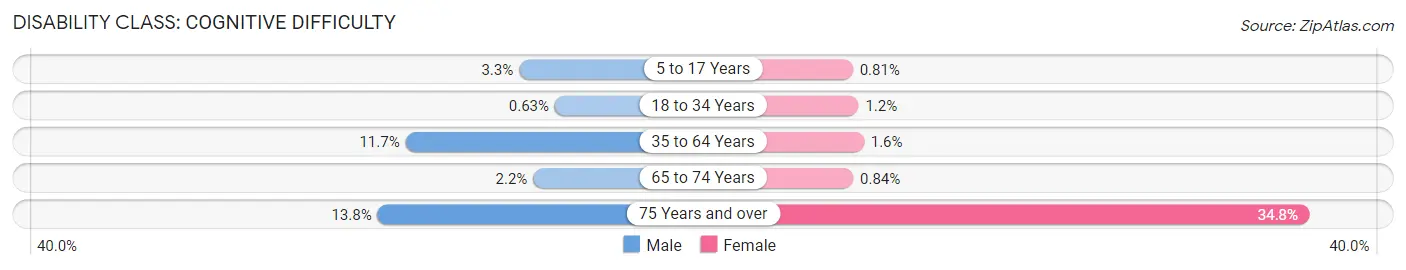
| Age Bracket | Male | Female |
| 5 to 17 Years | 40 (3.3%) | 9 (0.8%) |
| 18 to 34 Years | 11 (0.6%) | 21 (1.2%) |
| 35 to 64 Years | 371 (11.7%) | 43 (1.6%) |
| 65 to 74 Years | 17 (2.2%) | 6 (0.8%) |
| 75 Years and over | 73 (13.8%) | 302 (34.7%) |
Disability Class: Ambulatory Difficulty
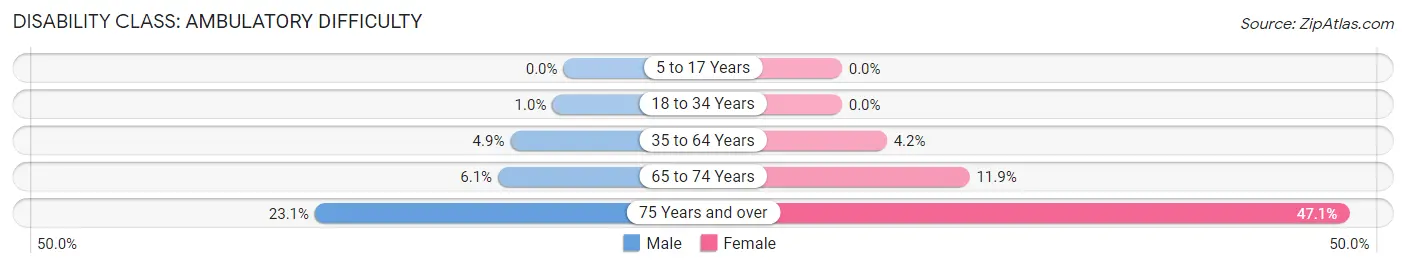
| Age Bracket | Male | Female |
| 5 to 17 Years | 0 (0.0%) | 0 (0.0%) |
| 18 to 34 Years | 18 (1.0%) | 0 (0.0%) |
| 35 to 64 Years | 156 (4.9%) | 110 (4.2%) |
| 65 to 74 Years | 46 (6.1%) | 85 (11.8%) |
| 75 Years and over | 122 (23.1%) | 409 (47.1%) |
Disability Class: Self-Care Difficulty
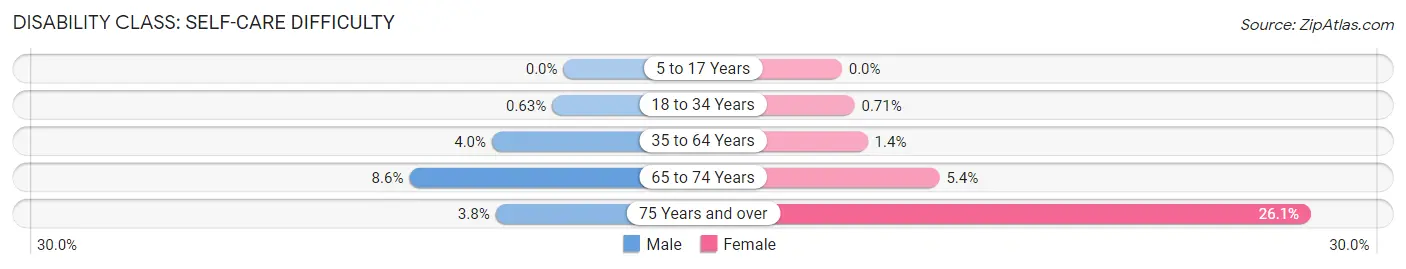
| Age Bracket | Male | Female |
| 5 to 17 Years | 0 (0.0%) | 0 (0.0%) |
| 18 to 34 Years | 11 (0.6%) | 12 (0.7%) |
| 35 to 64 Years | 126 (4.0%) | 38 (1.4%) |
| 65 to 74 Years | 65 (8.6%) | 39 (5.4%) |
| 75 Years and over | 20 (3.8%) | 227 (26.1%) |
Technology Access in Ewa Beach
Computing Device Access in Ewa Beach
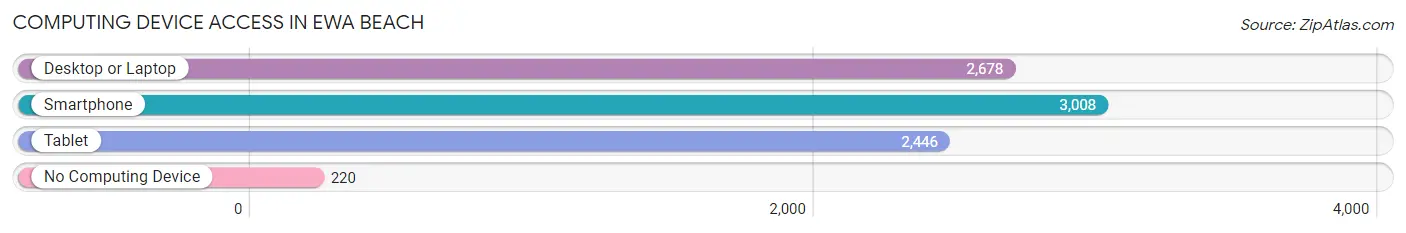
| Device Type | # Households | % Households |
| Desktop or Laptop | 2,678 | 78.4% |
| Smartphone | 3,008 | 88.1% |
| Tablet | 2,446 | 71.6% |
| No Computing Device | 220 | 6.4% |
| Total | 3,415 | 100.0% |
Internet Access in Ewa Beach
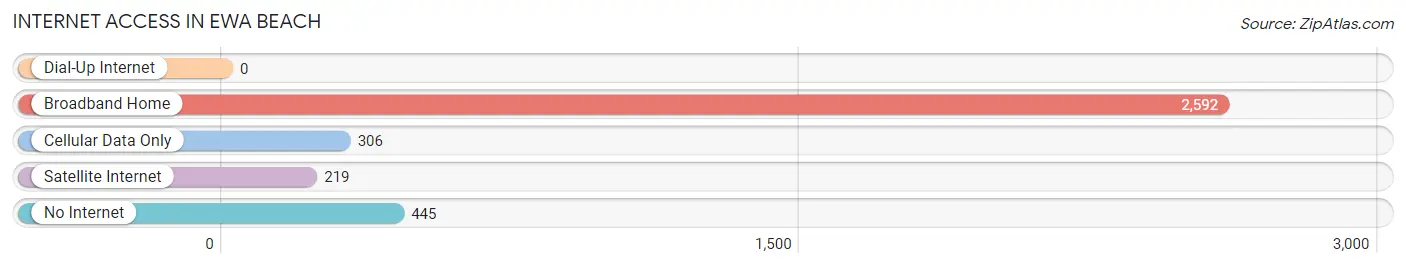
| Internet Type | # Households | % Households |
| Dial-Up Internet | 0 | 0.0% |
| Broadband Home | 2,592 | 75.9% |
| Cellular Data Only | 306 | 9.0% |
| Satellite Internet | 219 | 6.4% |
| No Internet | 445 | 13.0% |
| Total | 3,415 | 100.0% |
Ewa Beach Summary
Ewa Beach is a census-designated place (CDP) located in Honolulu County, Hawaii, United States. It is located on the southwestern coast of Oahu, approximately 15 miles (24 km) west of Honolulu. As of the 2010 Census, the CDP had a population of 14,955.
Geography
Ewa Beach is located at 21°19′50″N 158°2′17″W (21.330556, -158.038333). It is bordered to the north by Iroquois Point, to the east by Ewa Villages, to the south by Ewa Gentry, and to the west by the Pacific Ocean.
The total area of Ewa Beach is 4.7 square miles (12.2 km2), of which 4.3 square miles (11.2 km2) is land and 0.4 square miles (1.0 km2) (8.45%) is water.
History
Ewa Beach was originally a fishing village inhabited by Native Hawaiians. The area was known as "Ewa" which means "crooked" in Hawaiian. The name was given to the area because of the crooked shape of the shoreline.
In the late 19th century, the area was developed by sugar planters and became a popular vacation spot for wealthy families from Honolulu. The area was also home to a number of military installations, including the Ewa Marine Corps Air Station, which was established in 1941.
In the 1950s, the area began to experience rapid growth as the population of Honolulu increased. The area was annexed by the City and County of Honolulu in 1959.
Economy
Ewa Beach is home to a number of businesses, including retail stores, restaurants, and professional services. The area is also home to a number of military installations, including the Ewa Marine Corps Air Station, which is the largest employer in the area.
The area is also home to a number of tourist attractions, including the Ewa Beach Golf Course, the Ewa Beach Park, and the Ewa Beach Arboretum.
Demographics
As of the 2010 Census, there were 14,955 people, 4,945 households, and 3,845 families residing in the CDP. The population density was 3,213.3 people per square mile (1,241.2/km2). There were 5,093 housing units at an average density of 1,093.3 per square mile (422.3/km2). The racial makeup of the CDP was 24.2% White, 0.7% African American, 0.3% Native American, 37.2% Asian, 8.2% Pacific Islander, 0.7% from other races, and 28.7% from two or more races. Hispanic or Latino of any race were 11.2% of the population.
There were 4,945 households, out of which 37.2% had children under the age of 18 living with them, 54.2% were married couples living together, 14.2% had a female householder with no husband present, and 24.2% were non-families. 17.7% of all households were made up of individuals, and 5.2% had someone living alone who was 65 years of age or older. The average household size was 3.02 and the average family size was 3.41.
In the CDP, the population was spread out, with 25.7% under the age of 18, 8.7% from 18 to 24, 28.2% from 25 to 44, 27.2% from 45 to 64, and 10.2% who were 65 years of age or older. The median age was 36.7 years. For every 100 females, there were 99.2 males. For every 100 females age 18 and over, there were 97.2 males.
The median income for a household in the CDP was $71,818, and the median income for a family was $76,945. Males had a median income of $45,938 versus $37,813 for females. The per capita income for the CDP was $25,945. About 5.2% of families and 6.7% of the population were below the poverty line, including 8.2% of those under age 18 and 4.2% of those age 65 or over.
Common Questions
What is Per Capita Income in Ewa Beach?
Per Capita income in Ewa Beach is $32,284.
What is the Median Family Income in Ewa Beach?
Median Family Income in Ewa Beach is $116,087.
What is the Median Household income in Ewa Beach?
Median Household Income in Ewa Beach is $114,207.
What is Income or Wage Gap in Ewa Beach?
Income or Wage Gap in Ewa Beach is 26.3%.
Women in Ewa Beach earn 73.7 cents for every dollar earned by a man.
What is Family Income Deficit in Ewa Beach?
Family Income Deficit in Ewa Beach is $9,108.
Families that are below poverty line in Ewa Beach earn $9,108 less on average than the poverty threshold level.
What is Inequality or Gini Index in Ewa Beach?
Inequality or Gini Index in Ewa Beach is 0.38.
What is the Total Population of Ewa Beach?
Total Population of Ewa Beach is 15,167.
What is the Total Male Population of Ewa Beach?
Total Male Population of Ewa Beach is 7,887.
What is the Total Female Population of Ewa Beach?
Total Female Population of Ewa Beach is 7,280.
What is the Ratio of Males per 100 Females in Ewa Beach?
There are 108.34 Males per 100 Females in Ewa Beach.
What is the Ratio of Females per 100 Males in Ewa Beach?
There are 92.30 Females per 100 Males in Ewa Beach.
What is the Median Population Age in Ewa Beach?
Median Population Age in Ewa Beach is 40.1 Years.
What is the Average Family Size in Ewa Beach
Average Family Size in Ewa Beach is 4.5 People.
What is the Average Household Size in Ewa Beach
Average Household Size in Ewa Beach is 4.4 People.
How Large is the Labor Force in Ewa Beach?
There are 7,996 People in the Labor Forcein in Ewa Beach.
What is the Percentage of People in the Labor Force in Ewa Beach?
63.0% of People are in the Labor Force in Ewa Beach.
What is the Unemployment Rate in Ewa Beach?
Unemployment Rate in Ewa Beach is 4.2%.