Kapaa, HI Map & Demographics
Kapaa Map
Kapaa Overview
$39,074
PER CAPITA INCOME
$105,298
AVG FAMILY INCOME
$87,895
AVG HOUSEHOLD INCOME
31.5%
WAGE / INCOME GAP [ % ]
68.5¢/ $1
WAGE / INCOME GAP [ $ ]
0.42
INEQUALITY / GINI INDEX
10,846
TOTAL POPULATION
5,763
MALE POPULATION
5,083
FEMALE POPULATION
113.38
MALES / 100 FEMALES
88.20
FEMALES / 100 MALES
45.7
MEDIAN AGE
3.5
AVG FAMILY SIZE
3.1
AVG HOUSEHOLD SIZE
5,944
LABOR FORCE [ PEOPLE ]
65.0%
PERCENT IN LABOR FORCE
1.9%
UNEMPLOYMENT RATE
Kapaa Zip Codes
Kapaa Area Codes
Income in Kapaa
Income Overview in Kapaa
Per Capita Income in Kapaa is $39,074, while median incomes of families and households are $105,298 and $87,895 respectively.
| Characteristic | Number | Measure |
| Per Capita Income | 10,846 | $39,074 |
| Median Family Income | 2,417 | $105,298 |
| Mean Family Income | 2,417 | $121,298 |
| Median Household Income | 3,466 | $87,895 |
| Mean Household Income | 3,466 | $109,478 |
| Income Deficit | 2,417 | $0 |
| Wage / Income Gap (%) | 10,846 | 31.47% |
| Wage / Income Gap ($) | 10,846 | 68.53¢ per $1 |
| Gini / Inequality Index | 10,846 | 0.42 |
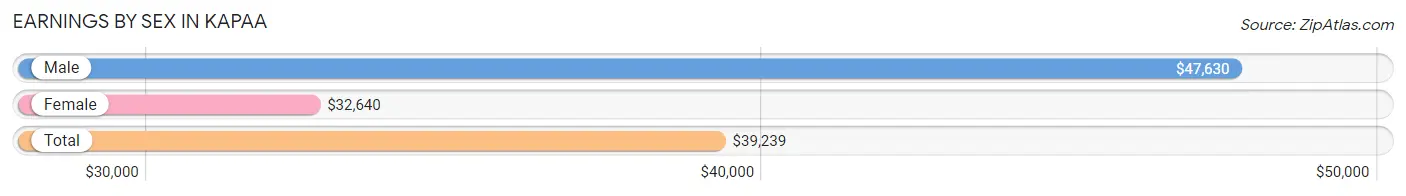
Earnings by Sex in Kapaa
Average Earnings in Kapaa are $39,239, $47,630 for men and $32,640 for women, a difference of 31.5%.
| Sex | Number | Average Earnings |
| Male | 3,169 (49.6%) | $47,630 |
| Female | 3,215 (50.4%) | $32,640 |
| Total | 6,384 (100.0%) | $39,239 |
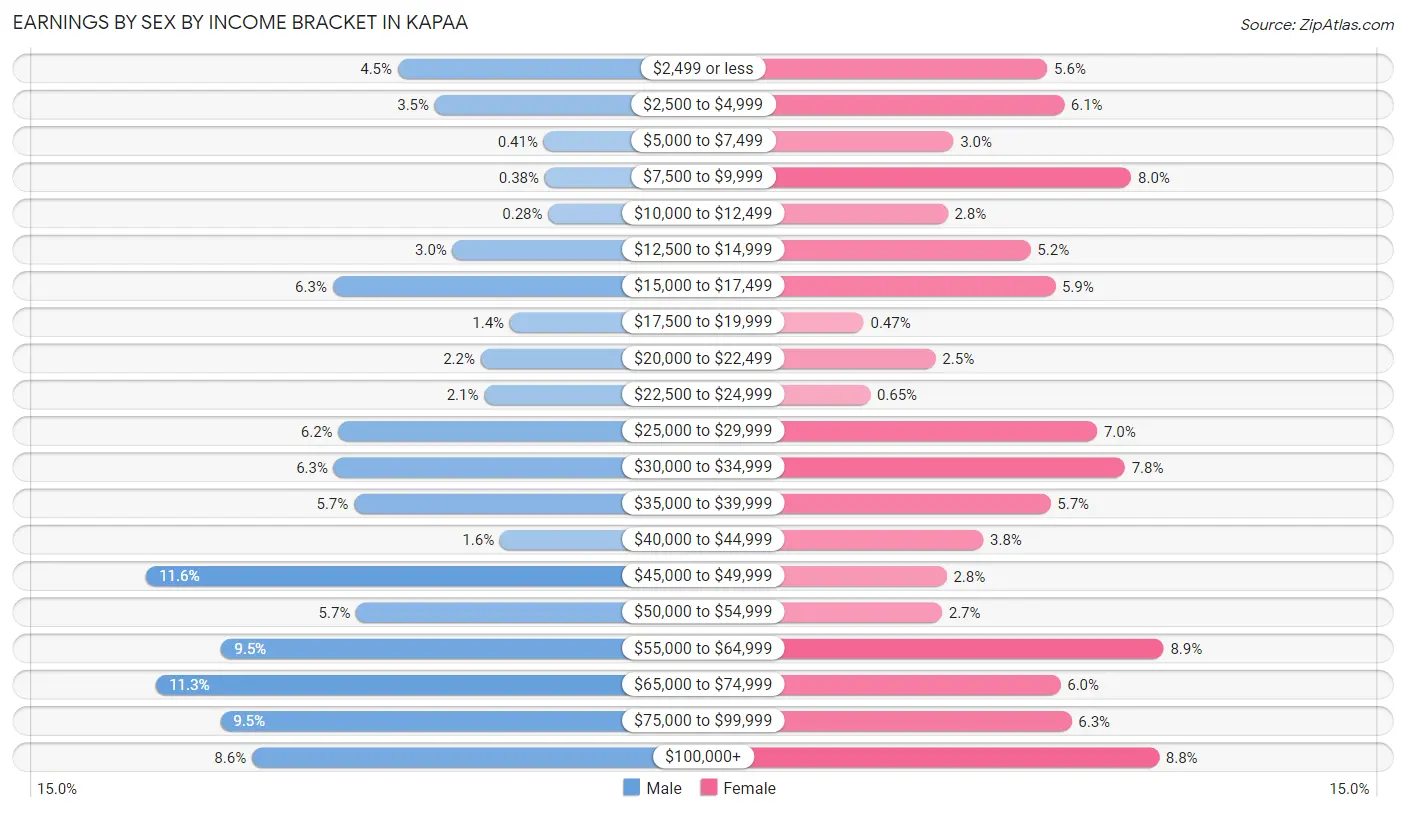
Earnings by Sex by Income Bracket in Kapaa
The most common earnings brackets in Kapaa are $45,000 to $49,999 for men (367 | 11.6%) and $55,000 to $64,999 for women (286 | 8.9%).
| Income | Male | Female |
| $2,499 or less | 143 (4.5%) | 181 (5.6%) |
| $2,500 to $4,999 | 110 (3.5%) | 196 (6.1%) |
| $5,000 to $7,499 | 13 (0.4%) | 96 (3.0%) |
| $7,500 to $9,999 | 12 (0.4%) | 257 (8.0%) |
| $10,000 to $12,499 | 9 (0.3%) | 91 (2.8%) |
| $12,500 to $14,999 | 94 (3.0%) | 166 (5.2%) |
| $15,000 to $17,499 | 201 (6.3%) | 188 (5.9%) |
| $17,500 to $19,999 | 43 (1.4%) | 15 (0.5%) |
| $20,000 to $22,499 | 69 (2.2%) | 80 (2.5%) |
| $22,500 to $24,999 | 66 (2.1%) | 21 (0.6%) |
| $25,000 to $29,999 | 196 (6.2%) | 226 (7.0%) |
| $30,000 to $34,999 | 200 (6.3%) | 251 (7.8%) |
| $35,000 to $39,999 | 182 (5.7%) | 184 (5.7%) |
| $40,000 to $44,999 | 52 (1.6%) | 123 (3.8%) |
| $45,000 to $49,999 | 367 (11.6%) | 90 (2.8%) |
| $50,000 to $54,999 | 180 (5.7%) | 86 (2.7%) |
| $55,000 to $64,999 | 300 (9.5%) | 286 (8.9%) |
| $65,000 to $74,999 | 358 (11.3%) | 193 (6.0%) |
| $75,000 to $99,999 | 301 (9.5%) | 203 (6.3%) |
| $100,000+ | 273 (8.6%) | 282 (8.8%) |
| Total | 3,169 (100.0%) | 3,215 (100.0%) |
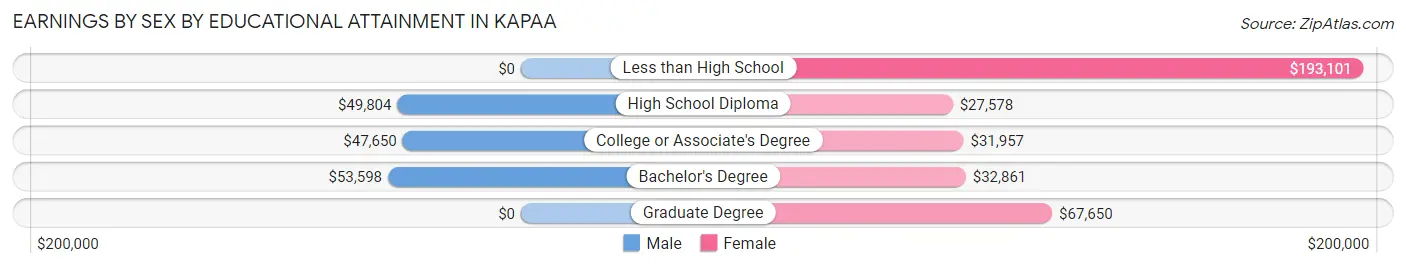
Earnings by Sex by Educational Attainment in Kapaa
Average earnings in Kapaa are $49,698 for men and $34,301 for women, a difference of 31.0%. Men with an educational attainment of bachelor's degree enjoy the highest average annual earnings of $53,598, while those with college or associate's degree education earn the least with $47,650. Women with an educational attainment of less than high school earn the most with the average annual earnings of $193,101, while those with high school diploma education have the smallest earnings of $27,578.
| Educational Attainment | Male Income | Female Income |
| Less than High School | - | - |
| High School Diploma | $49,804 | $27,578 |
| College or Associate's Degree | $47,650 | $31,957 |
| Bachelor's Degree | $53,598 | $32,861 |
| Graduate Degree | - | - |
| Total | $49,698 | $34,301 |
Family Income in Kapaa
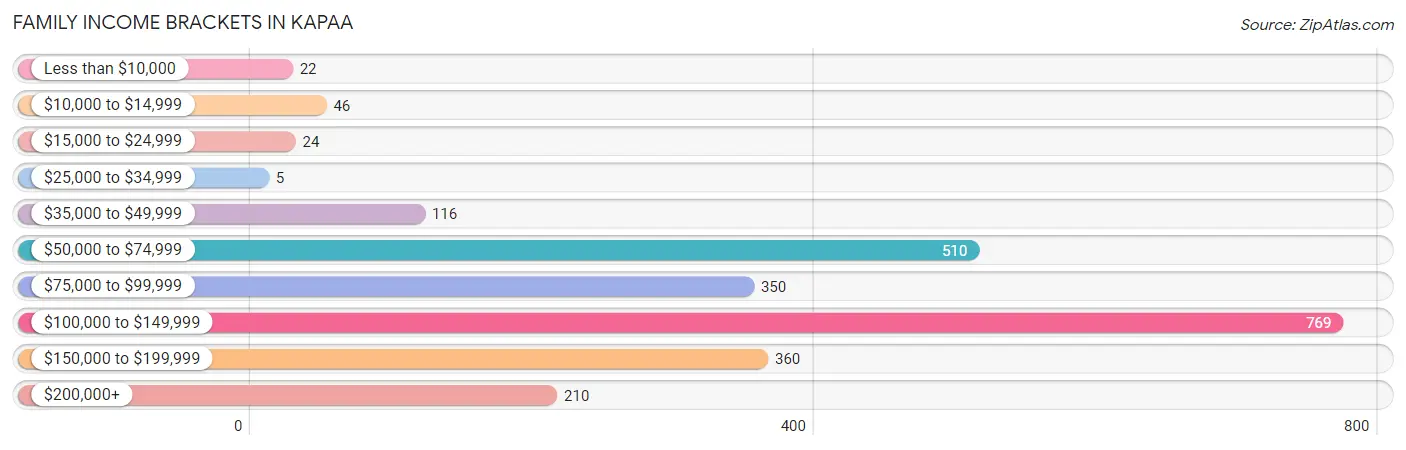
Family Income Brackets in Kapaa
According to the Kapaa family income data, there are 769 families falling into the $100,000 to $149,999 income range, which is the most common income bracket and makes up 31.8% of all families. Conversely, the $25,000 to $34,999 income bracket is the least frequent group with only 5 families (0.2%) belonging to this category.
| Income Bracket | # Families | % Families |
| Less than $10,000 | 22 | 0.9% |
| $10,000 to $14,999 | 46 | 1.9% |
| $15,000 to $24,999 | 24 | 1.0% |
| $25,000 to $34,999 | 5 | 0.2% |
| $35,000 to $49,999 | 116 | 4.8% |
| $50,000 to $74,999 | 510 | 21.1% |
| $75,000 to $99,999 | 350 | 14.5% |
| $100,000 to $149,999 | 769 | 31.8% |
| $150,000 to $199,999 | 360 | 14.9% |
| $200,000+ | 210 | 8.7% |
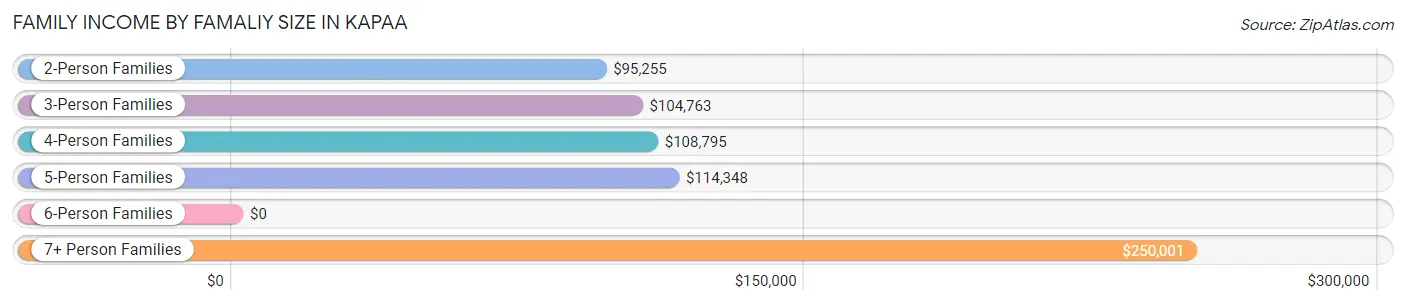
Family Income by Famaliy Size in Kapaa
7+ person families (82 | 3.4%) account for the highest median family income in Kapaa with $250,001 per family, while 2-person families (1,378 | 57.0%) have the highest median income of $47,628 per family member.
| Income Bracket | # Families | Median Income |
| 2-Person Families | 1,378 (57.0%) | $95,255 |
| 3-Person Families | 425 (17.6%) | $104,763 |
| 4-Person Families | 405 (16.8%) | $108,795 |
| 5-Person Families | 110 (4.5%) | $114,348 |
| 6-Person Families | 17 (0.7%) | $0 |
| 7+ Person Families | 82 (3.4%) | $250,001 |
| Total | 2,417 (100.0%) | $105,298 |
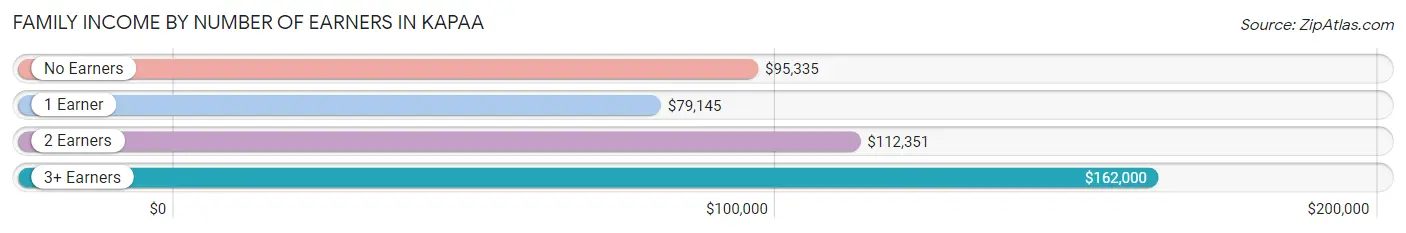
Family Income by Number of Earners in Kapaa
The median family income in Kapaa is $105,298, with families comprising 3+ earners (428) having the highest median family income of $162,000, while families with 1 earner (710) have the lowest median family income of $79,145, accounting for 17.7% and 29.4% of families, respectively.
| Number of Earners | # Families | Median Income |
| No Earners | 283 (11.7%) | $95,335 |
| 1 Earner | 710 (29.4%) | $79,145 |
| 2 Earners | 996 (41.2%) | $112,351 |
| 3+ Earners | 428 (17.7%) | $162,000 |
| Total | 2,417 (100.0%) | $105,298 |
Household Income in Kapaa
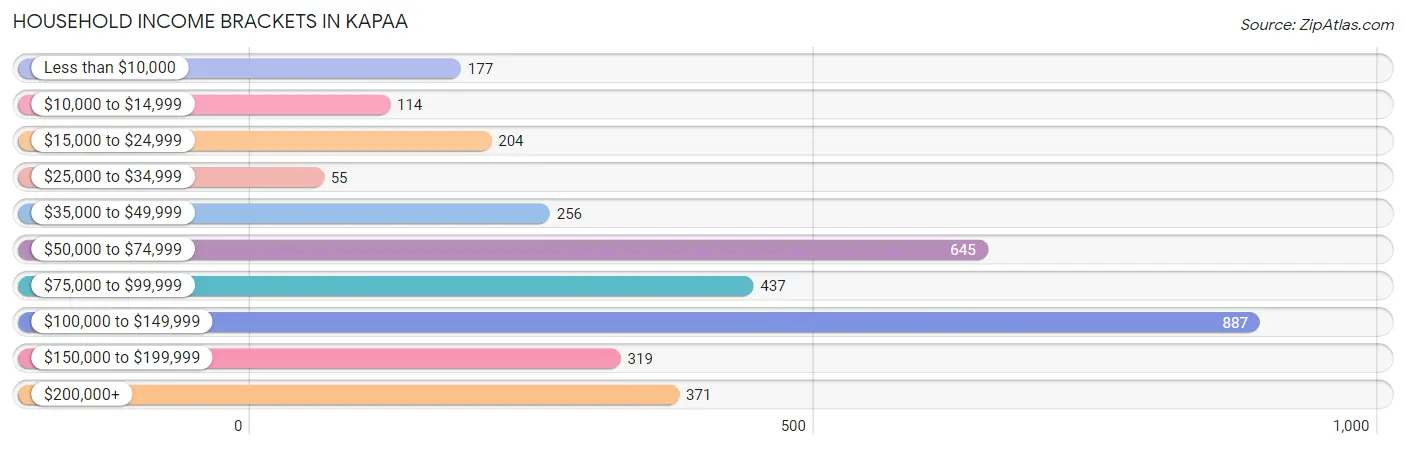
Household Income Brackets in Kapaa
With 887 households falling in the category, the $100,000 to $149,999 income range is the most frequent in Kapaa, accounting for 25.6% of all households. In contrast, only 55 households (1.6%) fall into the $25,000 to $34,999 income bracket, making it the least populous group.
| Income Bracket | # Households | % Households |
| Less than $10,000 | 177 | 5.1% |
| $10,000 to $14,999 | 114 | 3.3% |
| $15,000 to $24,999 | 204 | 5.9% |
| $25,000 to $34,999 | 55 | 1.6% |
| $35,000 to $49,999 | 256 | 7.4% |
| $50,000 to $74,999 | 645 | 18.6% |
| $75,000 to $99,999 | 437 | 12.6% |
| $100,000 to $149,999 | 887 | 25.6% |
| $150,000 to $199,999 | 319 | 9.2% |
| $200,000+ | 371 | 10.7% |
Household Income by Householder Age in Kapaa
The median household income in Kapaa is $87,895, with the highest median household income of $106,052 found in the 45 to 64 years age bracket for the primary householder. A total of 1,547 households (44.6%) fall into this category. Meanwhile, the 65+ years age bracket for the primary householder has the lowest median household income of $64,849, with 1,165 households (33.6%) in this group.
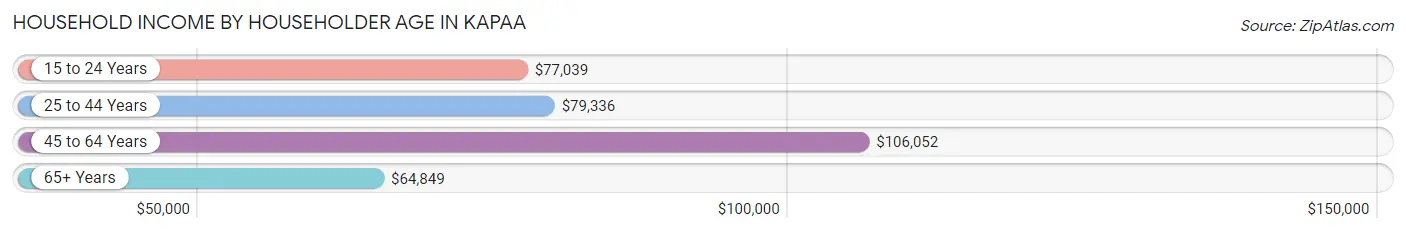
| Income Bracket | # Households | Median Income |
| 15 to 24 Years | 31 (0.9%) | $77,039 |
| 25 to 44 Years | 723 (20.9%) | $79,336 |
| 45 to 64 Years | 1,547 (44.6%) | $106,052 |
| 65+ Years | 1,165 (33.6%) | $64,849 |
| Total | 3,466 (100.0%) | $87,895 |
Poverty in Kapaa
Income Below Poverty by Sex and Age in Kapaa
With 3.7% poverty level for males and 8.7% for females among the residents of Kapaa, 16 and 17 year old males and 12 to 14 year old females are the most vulnerable to poverty, with 38 males (27.1%) and 21 females (70.0%) in their respective age groups living below the poverty level.
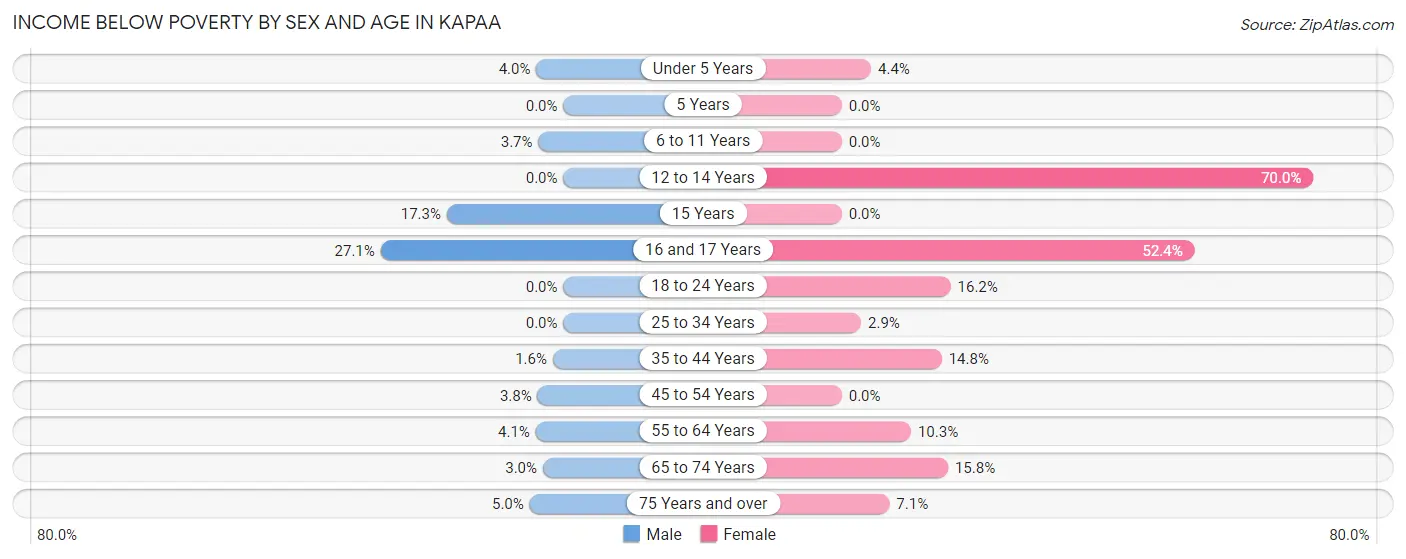
| Age Bracket | Male | Female |
| Under 5 Years | 8 (4.0%) | 9 (4.3%) |
| 5 Years | 0 (0.0%) | 0 (0.0%) |
| 6 to 11 Years | 23 (3.7%) | 0 (0.0%) |
| 12 to 14 Years | 0 (0.0%) | 21 (70.0%) |
| 15 Years | 18 (17.3%) | 0 (0.0%) |
| 16 and 17 Years | 38 (27.1%) | 11 (52.4%) |
| 18 to 24 Years | 0 (0.0%) | 48 (16.2%) |
| 25 to 34 Years | 0 (0.0%) | 18 (2.9%) |
| 35 to 44 Years | 14 (1.6%) | 111 (14.8%) |
| 45 to 54 Years | 35 (3.8%) | 0 (0.0%) |
| 55 to 64 Years | 39 (4.1%) | 65 (10.3%) |
| 65 to 74 Years | 14 (3.0%) | 114 (15.8%) |
| 75 Years and over | 21 (5.0%) | 40 (7.1%) |
| Total | 210 (3.7%) | 437 (8.7%) |
Income Above Poverty by Sex and Age in Kapaa
According to the poverty statistics in Kapaa, males aged 5 years and females aged 5 years are the age groups that are most secure financially, with 100.0% of males and 100.0% of females in these age groups living above the poverty line.
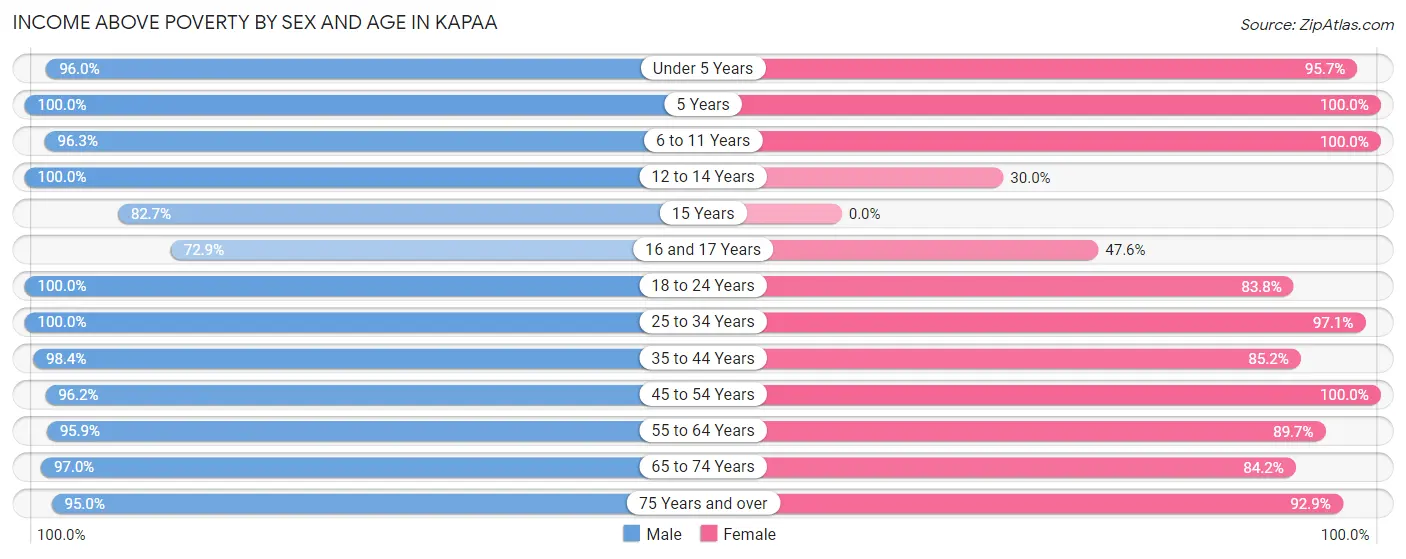
| Age Bracket | Male | Female |
| Under 5 Years | 191 (96.0%) | 198 (95.7%) |
| 5 Years | 75 (100.0%) | 48 (100.0%) |
| 6 to 11 Years | 597 (96.3%) | 216 (100.0%) |
| 12 to 14 Years | 138 (100.0%) | 9 (30.0%) |
| 15 Years | 86 (82.7%) | 0 (0.0%) |
| 16 and 17 Years | 102 (72.9%) | 10 (47.6%) |
| 18 to 24 Years | 286 (100.0%) | 249 (83.8%) |
| 25 to 34 Years | 543 (100.0%) | 610 (97.1%) |
| 35 to 44 Years | 875 (98.4%) | 637 (85.2%) |
| 45 to 54 Years | 880 (96.2%) | 878 (100.0%) |
| 55 to 64 Years | 910 (95.9%) | 568 (89.7%) |
| 65 to 74 Years | 447 (97.0%) | 609 (84.2%) |
| 75 Years and over | 398 (95.0%) | 526 (92.9%) |
| Total | 5,528 (96.3%) | 4,558 (91.2%) |
Income Below Poverty Among Married-Couple Families in Kapaa
The poverty statistics for married-couple families in Kapaa show that 1.0% or 17 of the total 1,634 families live below the poverty line. Families with no children have the highest poverty rate of 1.3%, comprising of 17 families. On the other hand, families with 1 or 2 children have the lowest poverty rate of 0.0%, which includes 0 families.
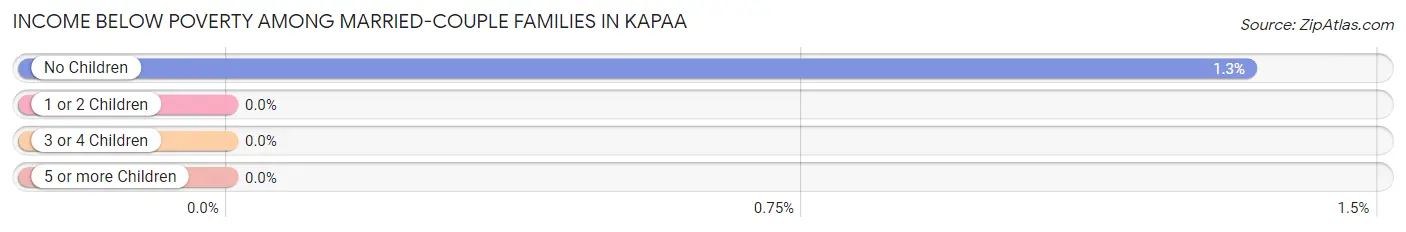
| Children | Above Poverty | Below Poverty |
| No Children | 1,264 (98.7%) | 17 (1.3%) |
| 1 or 2 Children | 250 (100.0%) | 0 (0.0%) |
| 3 or 4 Children | 71 (100.0%) | 0 (0.0%) |
| 5 or more Children | 32 (100.0%) | 0 (0.0%) |
| Total | 1,617 (99.0%) | 17 (1.0%) |
Income Below Poverty Among Single-Parent Households in Kapaa
According to the poverty data in Kapaa, 3.7% or 9 single-father households and 7.7% or 42 single-mother households are living below the poverty line. Among single-father households, those with 1 or 2 children have the highest poverty rate, with 9 households (13.2%) experiencing poverty. Likewise, among single-mother households, those with 3 or 4 children have the highest poverty rate, with 21 households (100.0%) falling below the poverty line.
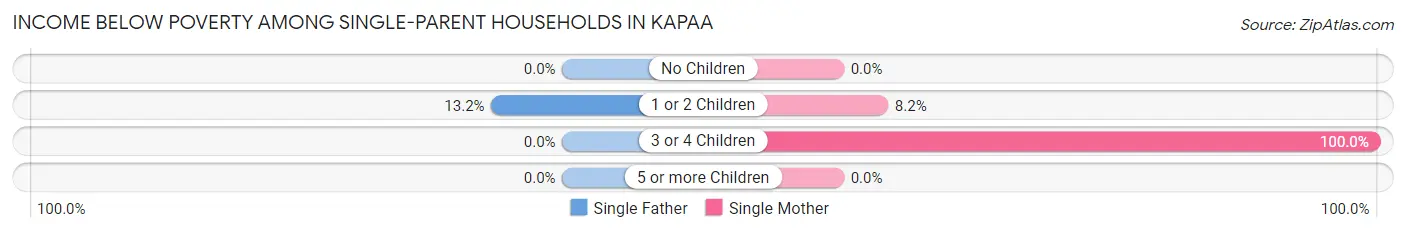
| Children | Single Father | Single Mother |
| No Children | 0 (0.0%) | 0 (0.0%) |
| 1 or 2 Children | 9 (13.2%) | 21 (8.2%) |
| 3 or 4 Children | 0 (0.0%) | 21 (100.0%) |
| 5 or more Children | 0 (0.0%) | 0 (0.0%) |
| Total | 9 (3.7%) | 42 (7.7%) |
Income Below Poverty Among Married-Couple vs Single-Parent Households in Kapaa
The poverty data for Kapaa shows that 17 of the married-couple family households (1.0%) and 51 of the single-parent households (6.5%) are living below the poverty level. Within the married-couple family households, those with no children have the highest poverty rate, with 17 households (1.3%) falling below the poverty line. Among the single-parent households, those with 3 or 4 children have the highest poverty rate, with 21 household (42.9%) living below poverty.
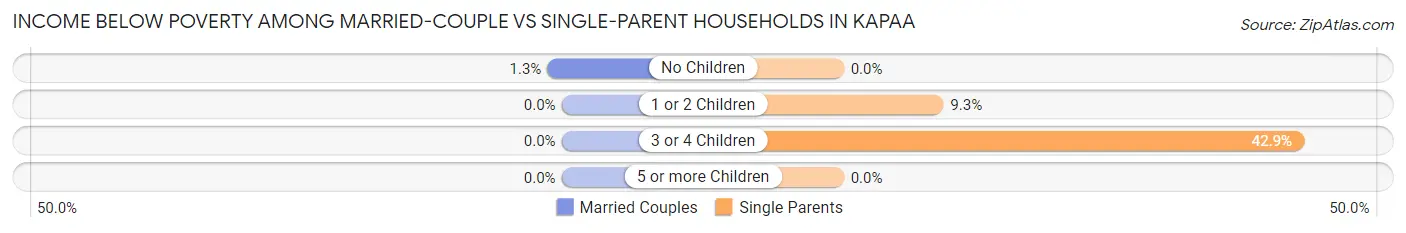
| Children | Married-Couple Families | Single-Parent Households |
| No Children | 17 (1.3%) | 0 (0.0%) |
| 1 or 2 Children | 0 (0.0%) | 30 (9.3%) |
| 3 or 4 Children | 0 (0.0%) | 21 (42.9%) |
| 5 or more Children | 0 (0.0%) | 0 (0.0%) |
| Total | 17 (1.0%) | 51 (6.5%) |
Race in Kapaa
The most populous races in Kapaa are Asian (3,670 | 33.8%), White / Caucasian (3,543 | 32.7%), and Two or more Races (2,309 | 21.3%).
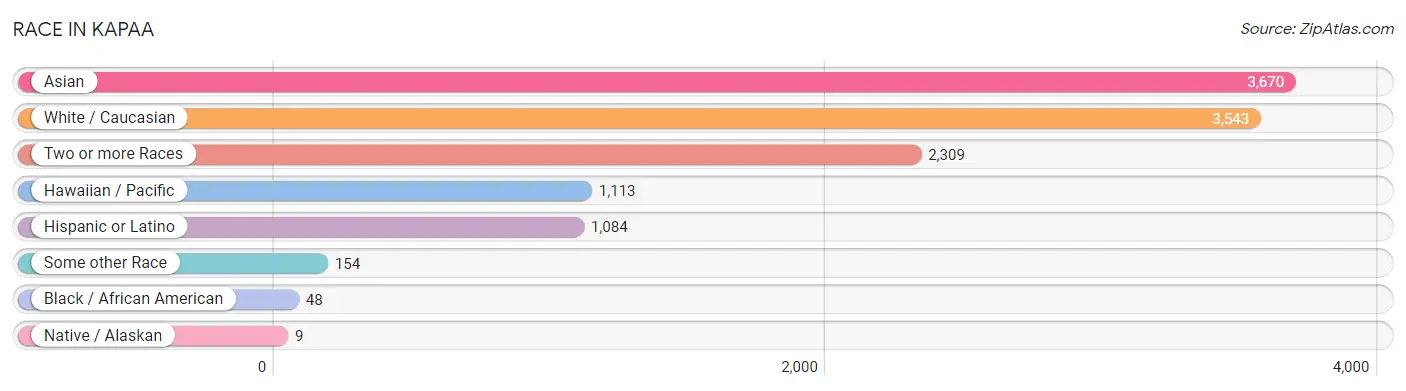
| Race | # Population | % Population |
| Asian | 3,670 | 33.8% |
| Black / African American | 48 | 0.4% |
| Hawaiian / Pacific | 1,113 | 10.3% |
| Hispanic or Latino | 1,084 | 10.0% |
| Native / Alaskan | 9 | 0.1% |
| White / Caucasian | 3,543 | 32.7% |
| Two or more Races | 2,309 | 21.3% |
| Some other Race | 154 | 1.4% |
| Total | 10,846 | 100.0% |
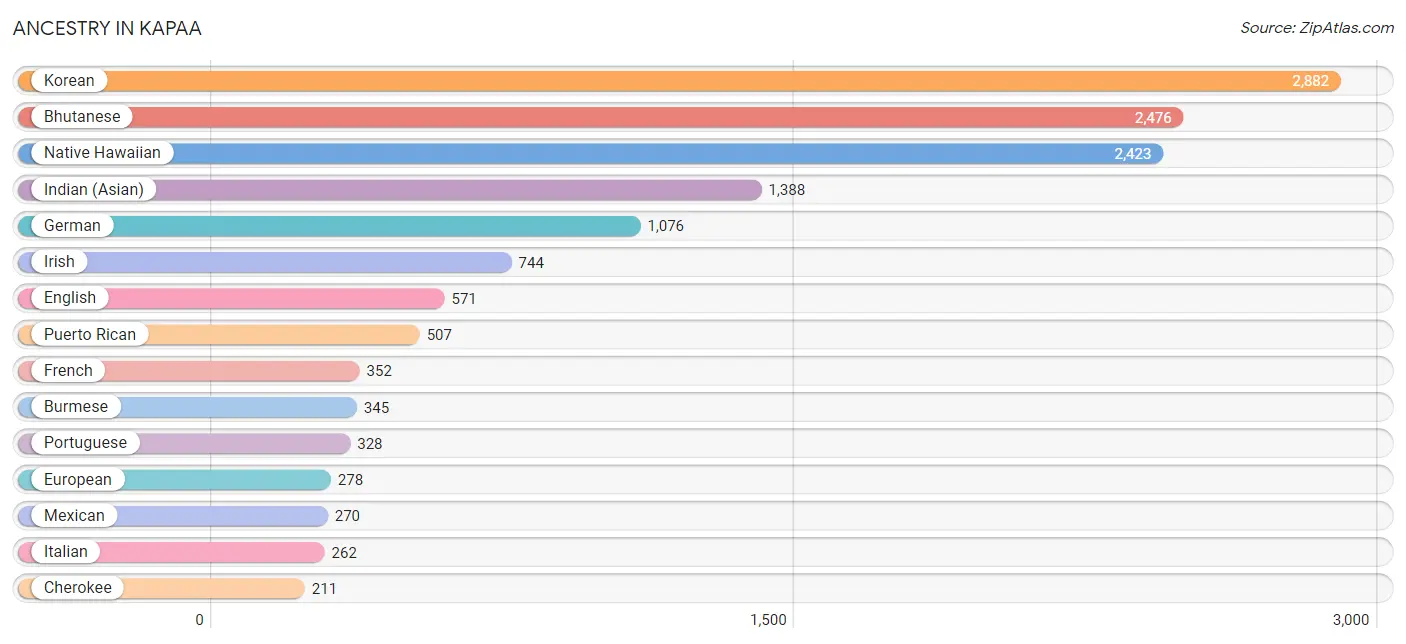
Ancestry in Kapaa
The most populous ancestries reported in Kapaa are Korean (2,882 | 26.6%), Bhutanese (2,476 | 22.8%), Native Hawaiian (2,423 | 22.3%), Indian (Asian) (1,388 | 12.8%), and German (1,076 | 9.9%), together accounting for 94.5% of all Kapaa residents.
| Ancestry | # Population | % Population |
| American | 34 | 0.3% |
| Arab | 29 | 0.3% |
| Bhutanese | 2,476 | 22.8% |
| British | 35 | 0.3% |
| Burmese | 345 | 3.2% |
| Cherokee | 211 | 1.9% |
| Chinese | 126 | 1.2% |
| Czech | 14 | 0.1% |
| Danish | 36 | 0.3% |
| Dutch | 106 | 1.0% |
| Eastern European | 20 | 0.2% |
| English | 571 | 5.3% |
| European | 278 | 2.6% |
| French | 352 | 3.3% |
| German | 1,076 | 9.9% |
| Indian (Asian) | 1,388 | 12.8% |
| Irish | 744 | 6.9% |
| Iroquois | 42 | 0.4% |
| Italian | 262 | 2.4% |
| Korean | 2,882 | 26.6% |
| Mexican | 270 | 2.5% |
| Native Hawaiian | 2,423 | 22.3% |
| Navajo | 9 | 0.1% |
| Northern European | 31 | 0.3% |
| Norwegian | 62 | 0.6% |
| Palestinian | 29 | 0.3% |
| Peruvian | 120 | 1.1% |
| Polish | 66 | 0.6% |
| Portuguese | 328 | 3.0% |
| Puerto Rican | 507 | 4.7% |
| Russian | 52 | 0.5% |
| Scandinavian | 159 | 1.5% |
| Scotch-Irish | 19 | 0.2% |
| Scottish | 133 | 1.2% |
| Sioux | 7 | 0.1% |
| South American | 120 | 1.1% |
| Spaniard | 187 | 1.7% |
| Swedish | 77 | 0.7% |
| Swiss | 61 | 0.6% |
| Thai | 23 | 0.2% |
| Ukrainian | 24 | 0.2% |
| Welsh | 57 | 0.5% | View All 42 Rows |
Immigrants in Kapaa
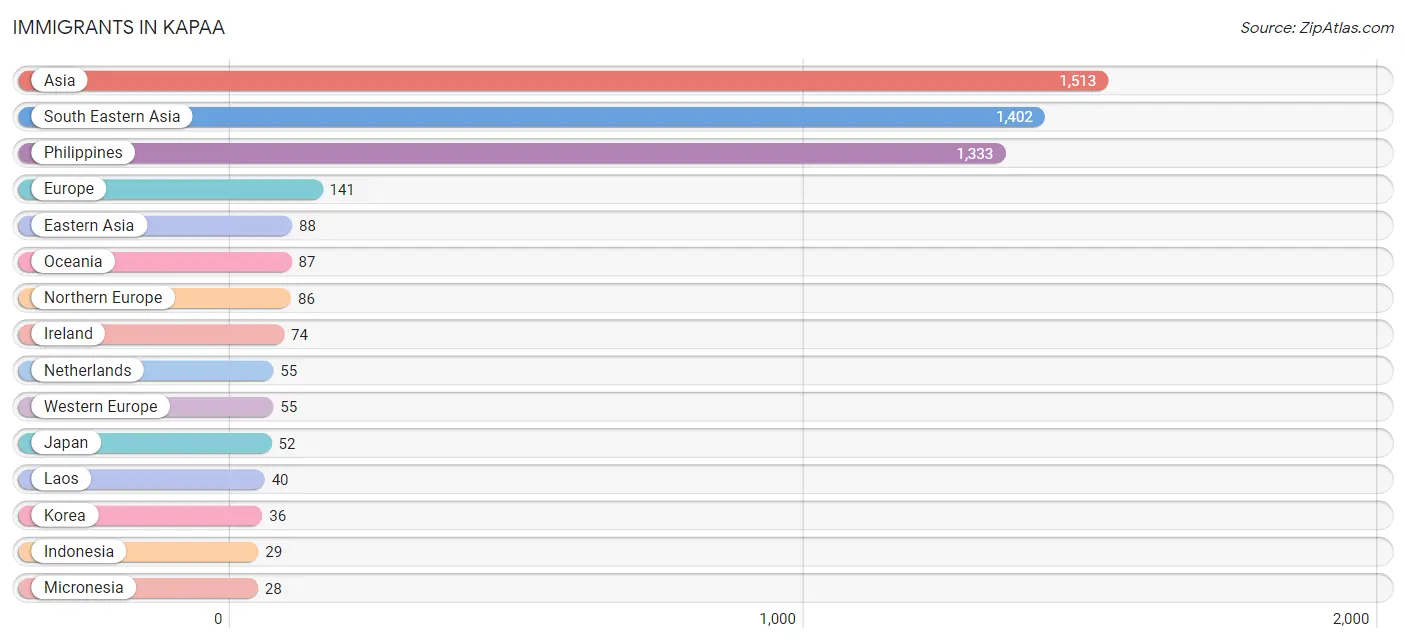
The most numerous immigrant groups reported in Kapaa came from Asia (1,513 | 14.0%), South Eastern Asia (1,402 | 12.9%), Philippines (1,333 | 12.3%), Europe (141 | 1.3%), and Eastern Asia (88 | 0.8%), together accounting for 41.3% of all Kapaa residents.
| Immigration Origin | # Population | % Population |
| Asia | 1,513 | 14.0% |
| Canada | 15 | 0.1% |
| Eastern Asia | 88 | 0.8% |
| England | 12 | 0.1% |
| Europe | 141 | 1.3% |
| India | 23 | 0.2% |
| Indonesia | 29 | 0.3% |
| Ireland | 74 | 0.7% |
| Japan | 52 | 0.5% |
| Korea | 36 | 0.3% |
| Laos | 40 | 0.4% |
| Micronesia | 28 | 0.3% |
| Netherlands | 55 | 0.5% |
| Northern Europe | 86 | 0.8% |
| Oceania | 87 | 0.8% |
| Philippines | 1,333 | 12.3% |
| South Central Asia | 23 | 0.2% |
| South Eastern Asia | 1,402 | 12.9% |
| Western Europe | 55 | 0.5% | View All 19 Rows |
Sex and Age in Kapaa
Sex and Age in Kapaa
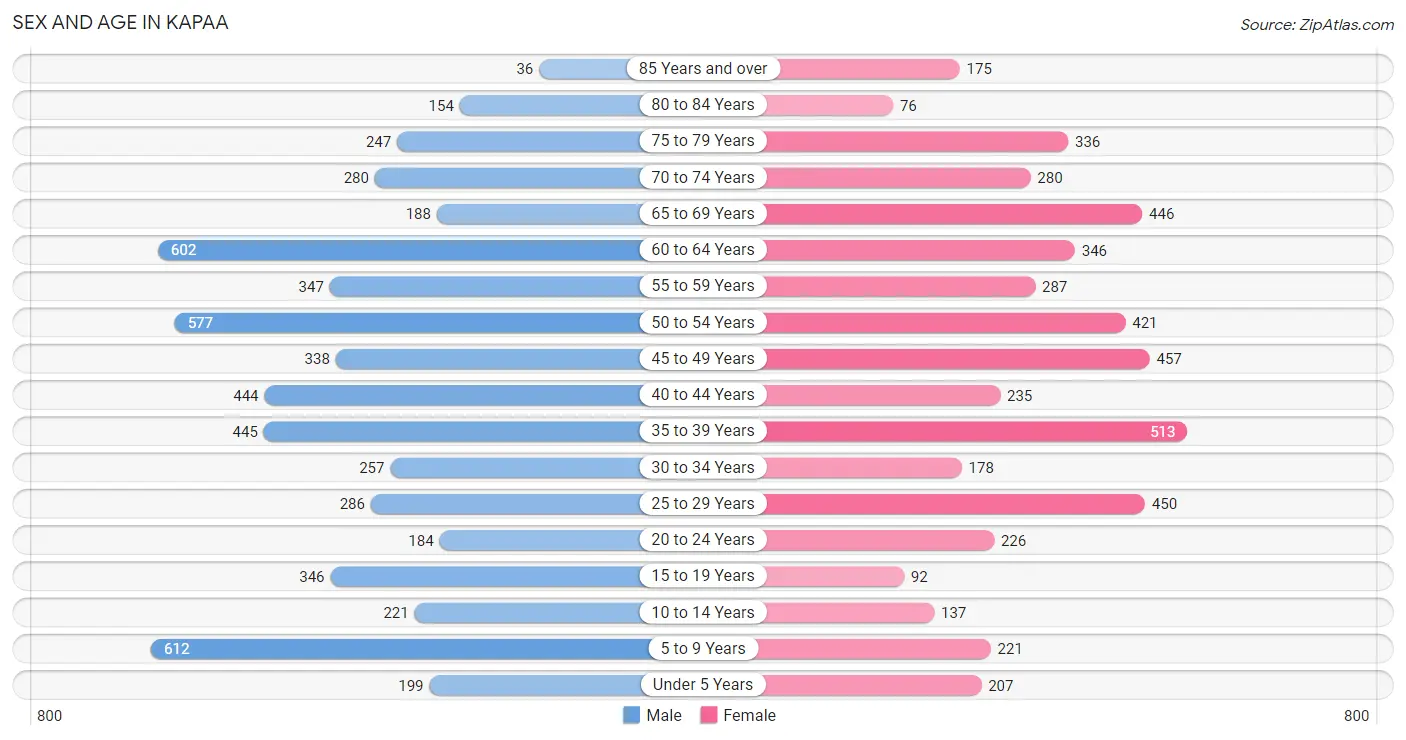
The most populous age groups in Kapaa are 5 to 9 Years (612 | 10.6%) for men and 35 to 39 Years (513 | 10.1%) for women.
| Age Bracket | Male | Female |
| Under 5 Years | 199 (3.5%) | 207 (4.1%) |
| 5 to 9 Years | 612 (10.6%) | 221 (4.3%) |
| 10 to 14 Years | 221 (3.8%) | 137 (2.7%) |
| 15 to 19 Years | 346 (6.0%) | 92 (1.8%) |
| 20 to 24 Years | 184 (3.2%) | 226 (4.4%) |
| 25 to 29 Years | 286 (5.0%) | 450 (8.8%) |
| 30 to 34 Years | 257 (4.5%) | 178 (3.5%) |
| 35 to 39 Years | 445 (7.7%) | 513 (10.1%) |
| 40 to 44 Years | 444 (7.7%) | 235 (4.6%) |
| 45 to 49 Years | 338 (5.9%) | 457 (9.0%) |
| 50 to 54 Years | 577 (10.0%) | 421 (8.3%) |
| 55 to 59 Years | 347 (6.0%) | 287 (5.7%) |
| 60 to 64 Years | 602 (10.4%) | 346 (6.8%) |
| 65 to 69 Years | 188 (3.3%) | 446 (8.8%) |
| 70 to 74 Years | 280 (4.9%) | 280 (5.5%) |
| 75 to 79 Years | 247 (4.3%) | 336 (6.6%) |
| 80 to 84 Years | 154 (2.7%) | 76 (1.5%) |
| 85 Years and over | 36 (0.6%) | 175 (3.4%) |
| Total | 5,763 (100.0%) | 5,083 (100.0%) |
Families and Households in Kapaa
Median Family Size in Kapaa
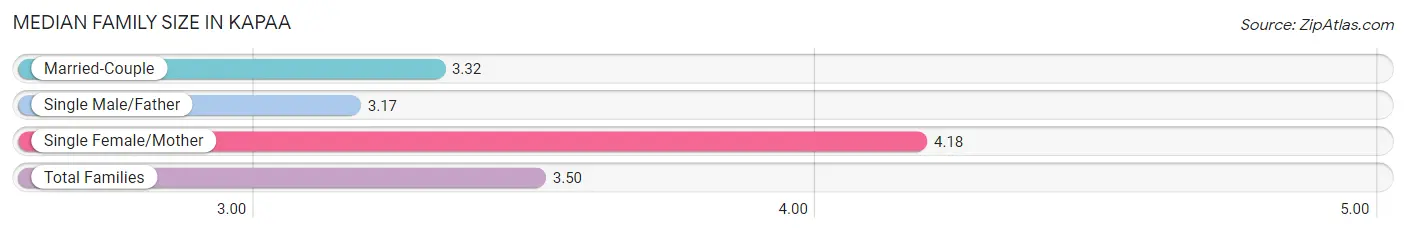
The median family size in Kapaa is 3.50 persons per family, with single female/mother families (543 | 22.5%) accounting for the largest median family size of 4.18 persons per family. On the other hand, single male/father families (240 | 9.9%) represent the smallest median family size with 3.17 persons per family.
| Family Type | # Families | Family Size |
| Married-Couple | 1,634 (67.6%) | 3.32 |
| Single Male/Father | 240 (9.9%) | 3.17 |
| Single Female/Mother | 543 (22.5%) | 4.18 |
| Total Families | 2,417 (100.0%) | 3.50 |
Median Household Size in Kapaa
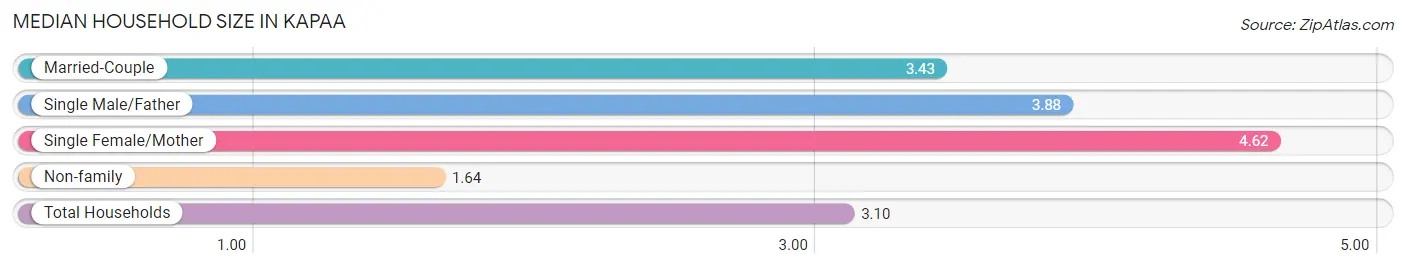
The median household size in Kapaa is 3.10 persons per household, with single female/mother households (543 | 15.7%) accounting for the largest median household size of 4.62 persons per household. non-family households (1,049 | 30.3%) represent the smallest median household size with 1.64 persons per household.
| Household Type | # Households | Household Size |
| Married-Couple | 1,634 (47.1%) | 3.43 |
| Single Male/Father | 240 (6.9%) | 3.88 |
| Single Female/Mother | 543 (15.7%) | 4.62 |
| Non-family | 1,049 (30.3%) | 1.64 |
| Total Households | 3,466 (100.0%) | 3.10 |
Household Size by Marriage Status in Kapaa
Out of a total of 3,466 households in Kapaa, 2,417 (69.7%) are family households, while 1,049 (30.3%) are nonfamily households. The most numerous type of family households are 2-person households, comprising 1,169, and the most common type of nonfamily households are 1-person households, comprising 684.
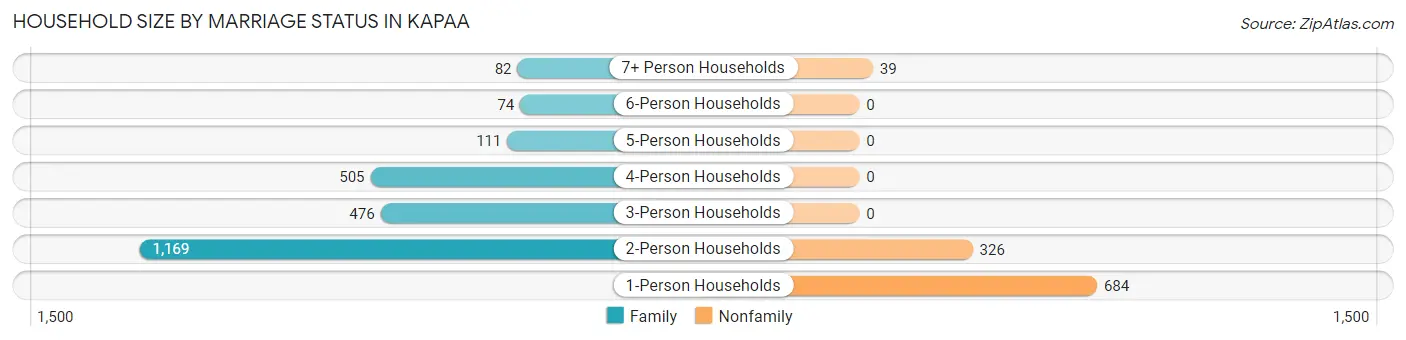
| Household Size | Family Households | Nonfamily Households |
| 1-Person Households | - | 684 (19.7%) |
| 2-Person Households | 1,169 (33.7%) | 326 (9.4%) |
| 3-Person Households | 476 (13.7%) | 0 (0.0%) |
| 4-Person Households | 505 (14.6%) | 0 (0.0%) |
| 5-Person Households | 111 (3.2%) | 0 (0.0%) |
| 6-Person Households | 74 (2.1%) | 0 (0.0%) |
| 7+ Person Households | 82 (2.4%) | 39 (1.1%) |
| Total | 2,417 (69.7%) | 1,049 (30.3%) |
Female Fertility in Kapaa
Fertility by Age in Kapaa
Average fertility rate in Kapaa is 11.0 births per 1,000 women. Women in the age bracket of 35 to 50 years have the highest fertility rate with 18.0 births per 1,000 women. Women in the age bracket of 35 to 50 years acount for 100.0% of all women with births.
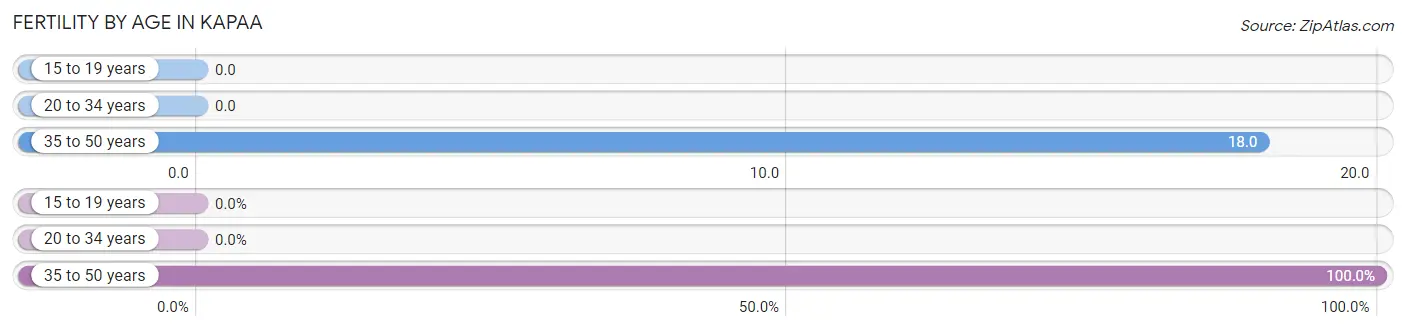
| Age Bracket | Women with Births | Births / 1,000 Women |
| 15 to 19 years | 0 (0.0%) | 0.0 |
| 20 to 34 years | 0 (0.0%) | 0.0 |
| 35 to 50 years | 26 (100.0%) | 18.0 |
| Total | 26 (100.0%) | 11.0 |
Fertility by Age by Marriage Status in Kapaa
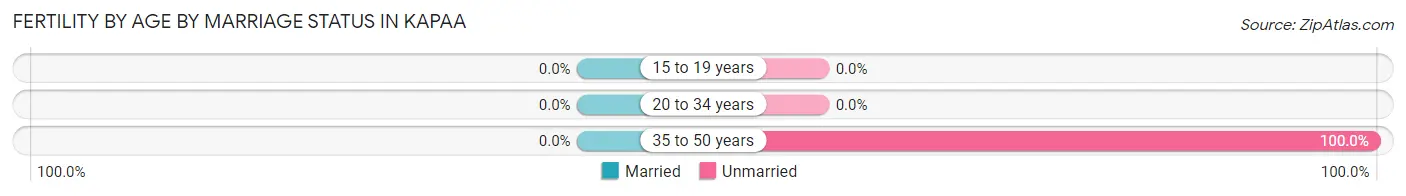
| Age Bracket | Married | Unmarried |
| 15 to 19 years | 0 (0.0%) | 0 (0.0%) |
| 20 to 34 years | 0 (0.0%) | 0 (0.0%) |
| 35 to 50 years | 0 (0.0%) | 26 (100.0%) |
| Total | 0 (0.0%) | 26 (100.0%) |
Fertility by Education in Kapaa
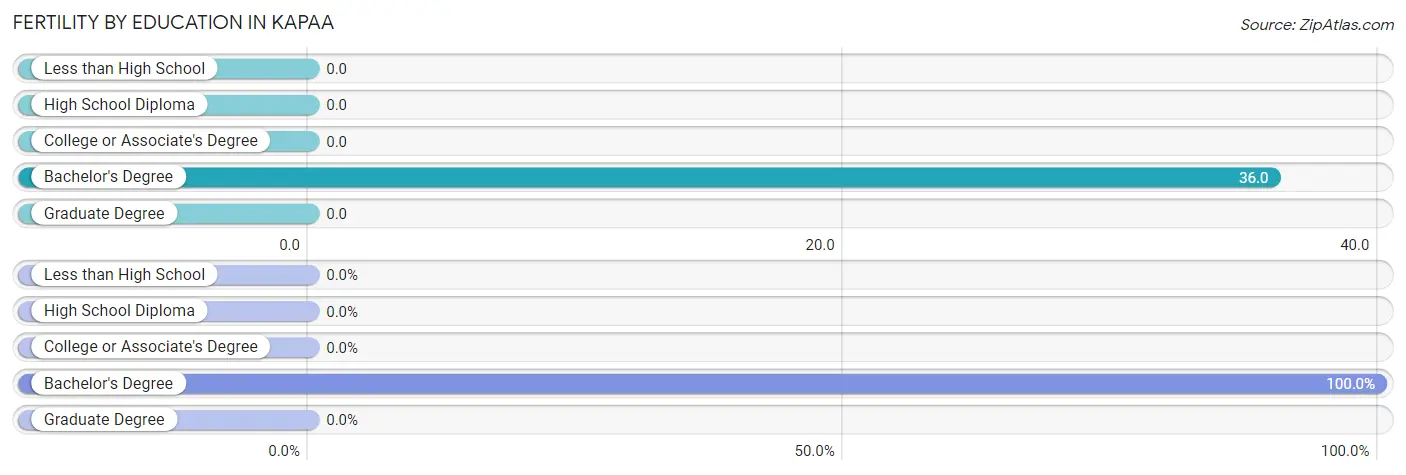
| Educational Attainment | Women with Births | Births / 1,000 Women |
| Less than High School | 0 (0.0%) | 0.0 |
| High School Diploma | 0 (0.0%) | 0.0 |
| College or Associate's Degree | 0 (0.0%) | 0.0 |
| Bachelor's Degree | 26 (100.0%) | 36.0 |
| Graduate Degree | 0 (0.0%) | 0.0 |
| Total | 26 (100.0%) | 11.0 |
Fertility by Education by Marriage Status in Kapaa
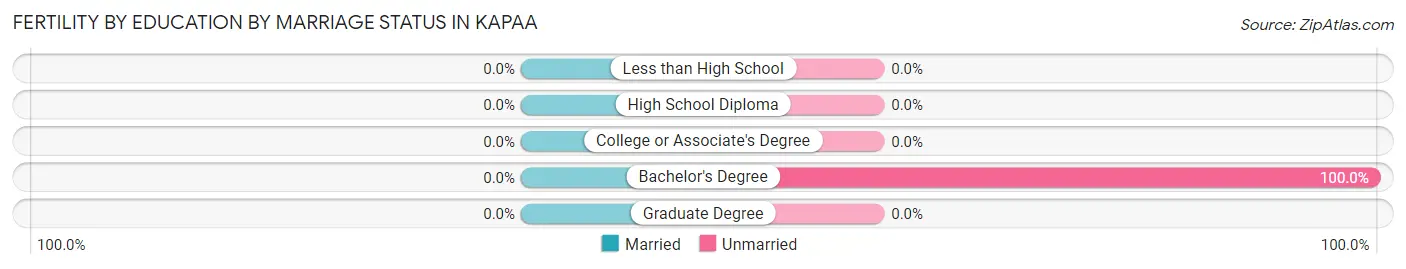
| Educational Attainment | Married | Unmarried |
| Less than High School | 0 (0.0%) | 0 (0.0%) |
| High School Diploma | 0 (0.0%) | 0 (0.0%) |
| College or Associate's Degree | 0 (0.0%) | 0 (0.0%) |
| Bachelor's Degree | 0 (0.0%) | 26 (100.0%) |
| Graduate Degree | 0 (0.0%) | 0 (0.0%) |
| Total | 0 (0.0%) | 26 (100.0%) |
Employment Characteristics in Kapaa
Employment by Class of Employer in Kapaa
Among the 5,660 employed individuals in Kapaa, private company employees (3,240 | 57.2%), self-employed (not incorporated) (699 | 12.3%), and state government employees (517 | 9.1%) make up the most common classes of employment.
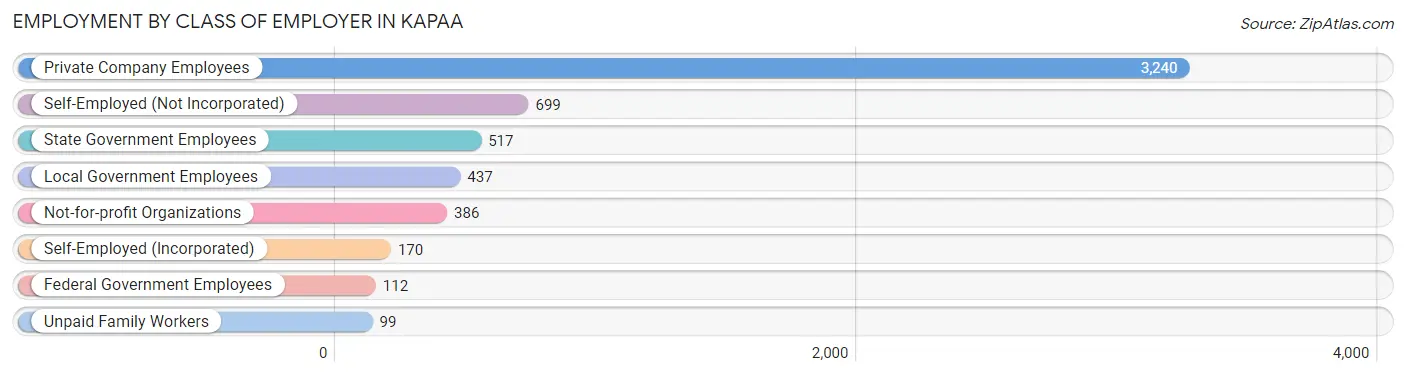
| Employer Class | # Employees | % Employees |
| Private Company Employees | 3,240 | 57.2% |
| Self-Employed (Incorporated) | 170 | 3.0% |
| Self-Employed (Not Incorporated) | 699 | 12.3% |
| Not-for-profit Organizations | 386 | 6.8% |
| Local Government Employees | 437 | 7.7% |
| State Government Employees | 517 | 9.1% |
| Federal Government Employees | 112 | 2.0% |
| Unpaid Family Workers | 99 | 1.8% |
| Total | 5,660 | 100.0% |
Employment Status by Age in Kapaa
According to the labor force statistics for Kapaa, out of the total population over 16 years of age (9,145), 65.0% or 5,944 individuals are in the labor force, with 1.9% or 113 of them unemployed. The age group with the highest labor force participation rate is 20 to 24 years, with 92.0% or 377 individuals in the labor force. Within the labor force, the 45 to 54 years age range has the highest percentage of unemployed individuals, with 4.2% or 66 of them being unemployed.
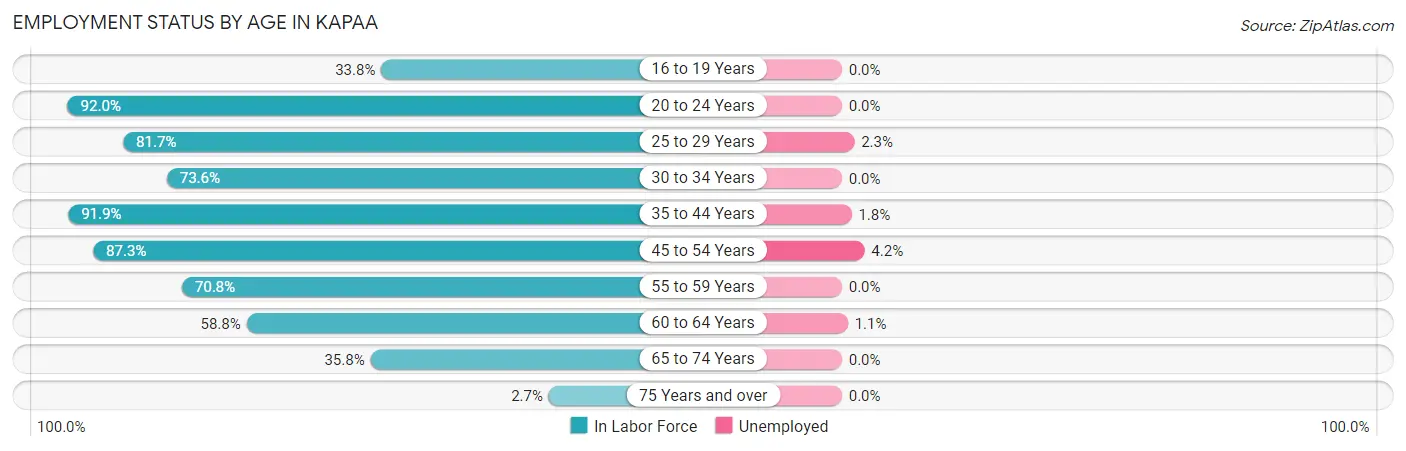
| Age Bracket | In Labor Force | Unemployed |
| 16 to 19 Years | 113 (33.8%) | 0 (0.0%) |
| 20 to 24 Years | 377 (92.0%) | 0 (0.0%) |
| 25 to 29 Years | 601 (81.7%) | 14 (2.3%) |
| 30 to 34 Years | 320 (73.6%) | 0 (0.0%) |
| 35 to 44 Years | 1,504 (91.9%) | 27 (1.8%) |
| 45 to 54 Years | 1,565 (87.3%) | 66 (4.2%) |
| 55 to 59 Years | 449 (70.8%) | 0 (0.0%) |
| 60 to 64 Years | 557 (58.8%) | 6 (1.1%) |
| 65 to 74 Years | 427 (35.8%) | 0 (0.0%) |
| 75 Years and over | 28 (2.7%) | 0 (0.0%) |
| Total | 5,944 (65.0%) | 113 (1.9%) |
Employment Status by Educational Attainment in Kapaa
According to labor force statistics for Kapaa, 80.8% of individuals (4,996) out of the total population between 25 and 64 years of age (6,183) are in the labor force, with 2.3% or 115 of them being unemployed. The group with the highest labor force participation rate are those with the educational attainment of bachelor's degree or higher, with 81.8% or 1,959 individuals in the labor force. Within the labor force, individuals with less than high school education have the highest percentage of unemployment, with 22.9% or 54 of them being unemployed.
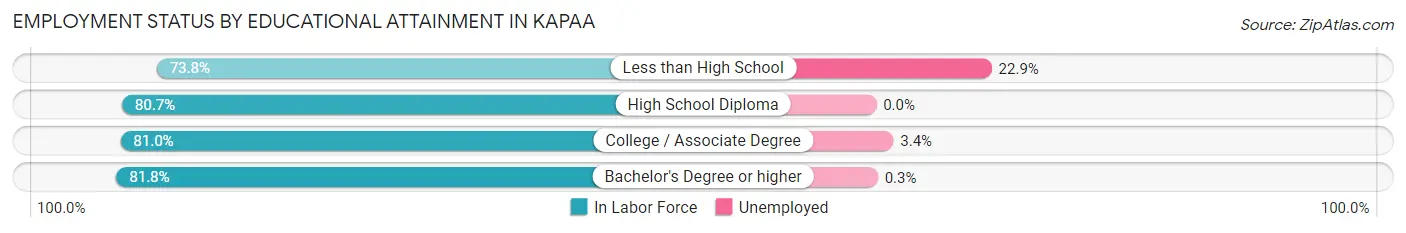
| Educational Attainment | In Labor Force | Unemployed |
| Less than High School | 236 (73.8%) | 73 (22.9%) |
| High School Diploma | 1,248 (80.7%) | 0 (0.0%) |
| College / Associate Degree | 1,557 (81.0%) | 65 (3.4%) |
| Bachelor's Degree or higher | 1,959 (81.8%) | 7 (0.3%) |
| Total | 4,996 (80.8%) | 142 (2.3%) |
Employment Occupations by Sex in Kapaa
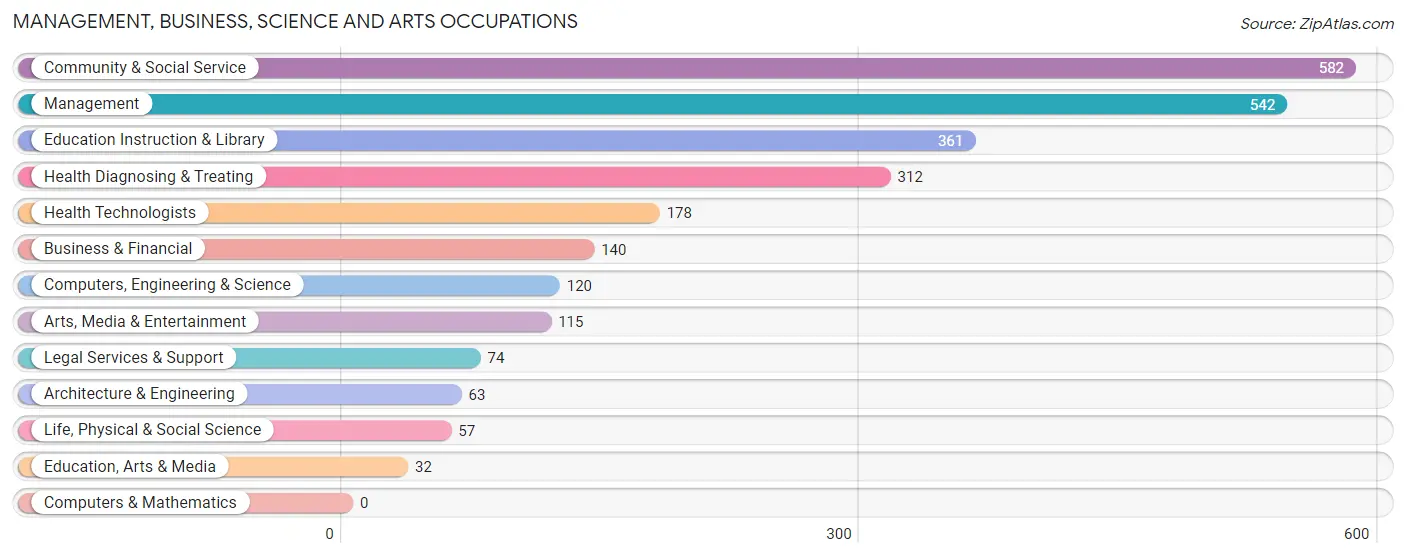
Management, Business, Science and Arts Occupations
The most common Management, Business, Science and Arts occupations in Kapaa are Community & Social Service (582 | 10.0%), Management (542 | 9.3%), Education Instruction & Library (361 | 6.2%), Health Diagnosing & Treating (312 | 5.3%), and Health Technologists (178 | 3.0%).
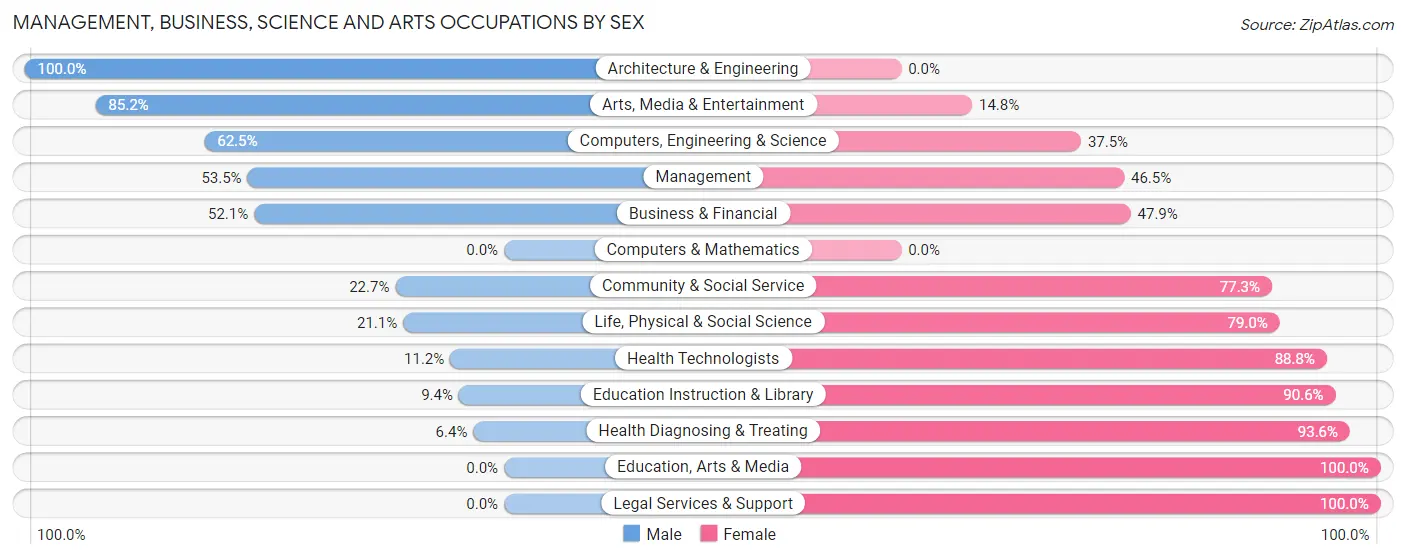
Management, Business, Science and Arts Occupations by Sex
Within the Management, Business, Science and Arts occupations in Kapaa, the most male-oriented occupations are Architecture & Engineering (100.0%), Arts, Media & Entertainment (85.2%), and Computers, Engineering & Science (62.5%), while the most female-oriented occupations are Education, Arts & Media (100.0%), Legal Services & Support (100.0%), and Health Diagnosing & Treating (93.6%).
| Occupation | Male | Female |
| Management | 290 (53.5%) | 252 (46.5%) |
| Business & Financial | 73 (52.1%) | 67 (47.9%) |
| Computers, Engineering & Science | 75 (62.5%) | 45 (37.5%) |
| Computers & Mathematics | 0 (0.0%) | 0 (0.0%) |
| Architecture & Engineering | 63 (100.0%) | 0 (0.0%) |
| Life, Physical & Social Science | 12 (21.0%) | 45 (78.9%) |
| Community & Social Service | 132 (22.7%) | 450 (77.3%) |
| Education, Arts & Media | 0 (0.0%) | 32 (100.0%) |
| Legal Services & Support | 0 (0.0%) | 74 (100.0%) |
| Education Instruction & Library | 34 (9.4%) | 327 (90.6%) |
| Arts, Media & Entertainment | 98 (85.2%) | 17 (14.8%) |
| Health Diagnosing & Treating | 20 (6.4%) | 292 (93.6%) |
| Health Technologists | 20 (11.2%) | 158 (88.8%) |
| Total (Category) | 590 (34.8%) | 1,106 (65.2%) |
| Total (Overall) | 2,817 (48.3%) | 3,013 (51.7%) |
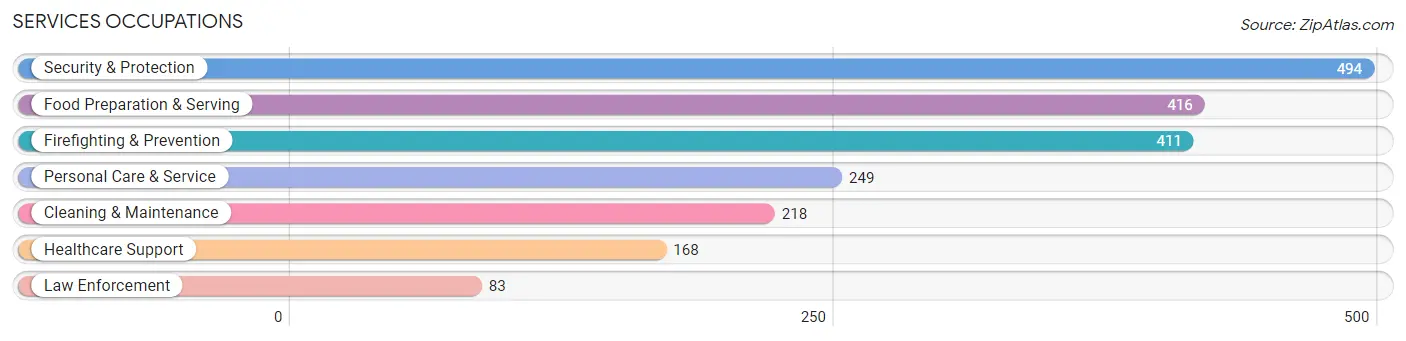
Services Occupations
The most common Services occupations in Kapaa are Security & Protection (494 | 8.5%), Food Preparation & Serving (416 | 7.1%), Firefighting & Prevention (411 | 7.0%), Personal Care & Service (249 | 4.3%), and Cleaning & Maintenance (218 | 3.7%).
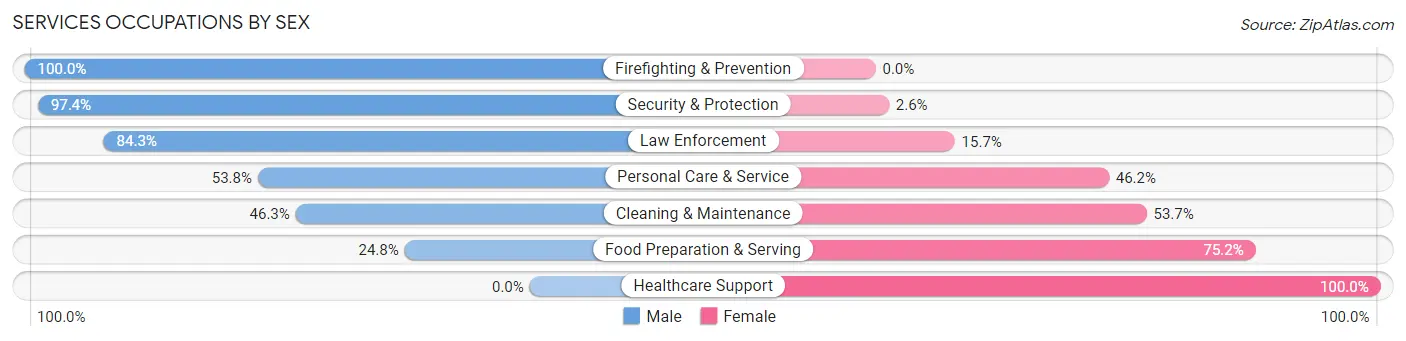
Services Occupations by Sex
Within the Services occupations in Kapaa, the most male-oriented occupations are Firefighting & Prevention (100.0%), Security & Protection (97.4%), and Law Enforcement (84.3%), while the most female-oriented occupations are Healthcare Support (100.0%), Food Preparation & Serving (75.2%), and Cleaning & Maintenance (53.7%).
| Occupation | Male | Female |
| Healthcare Support | 0 (0.0%) | 168 (100.0%) |
| Security & Protection | 481 (97.4%) | 13 (2.6%) |
| Firefighting & Prevention | 411 (100.0%) | 0 (0.0%) |
| Law Enforcement | 70 (84.3%) | 13 (15.7%) |
| Food Preparation & Serving | 103 (24.8%) | 313 (75.2%) |
| Cleaning & Maintenance | 101 (46.3%) | 117 (53.7%) |
| Personal Care & Service | 134 (53.8%) | 115 (46.2%) |
| Total (Category) | 819 (53.0%) | 726 (47.0%) |
| Total (Overall) | 2,817 (48.3%) | 3,013 (51.7%) |
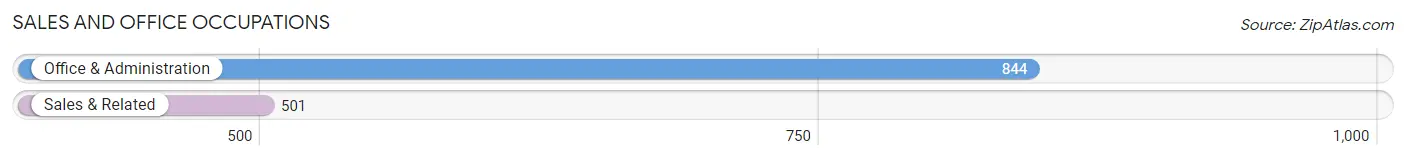
Sales and Office Occupations
The most common Sales and Office occupations in Kapaa are Office & Administration (844 | 14.5%), and Sales & Related (501 | 8.6%).
Sales and Office Occupations by Sex
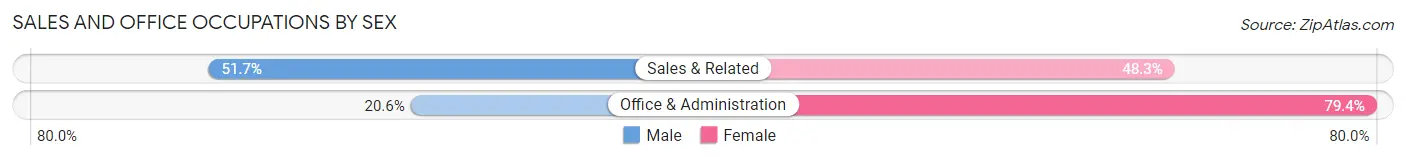
| Occupation | Male | Female |
| Sales & Related | 259 (51.7%) | 242 (48.3%) |
| Office & Administration | 174 (20.6%) | 670 (79.4%) |
| Total (Category) | 433 (32.2%) | 912 (67.8%) |
| Total (Overall) | 2,817 (48.3%) | 3,013 (51.7%) |
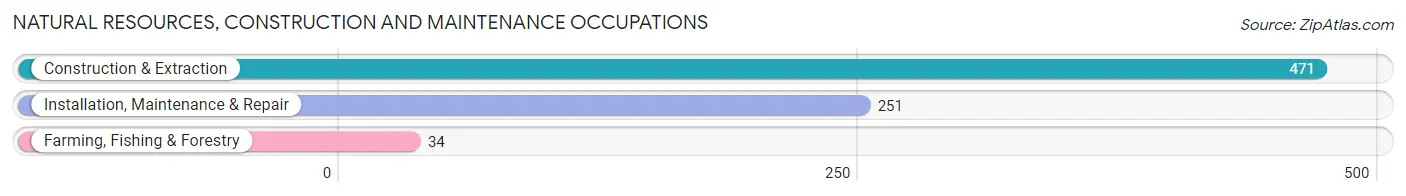
Natural Resources, Construction and Maintenance Occupations
The most common Natural Resources, Construction and Maintenance occupations in Kapaa are Construction & Extraction (471 | 8.1%), Installation, Maintenance & Repair (251 | 4.3%), and Farming, Fishing & Forestry (34 | 0.6%).
Natural Resources, Construction and Maintenance Occupations by Sex
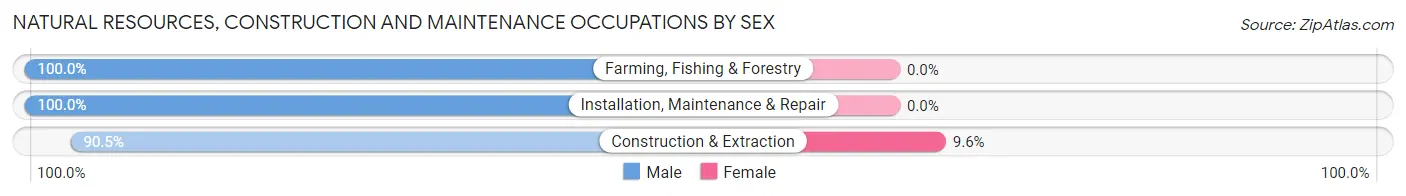
| Occupation | Male | Female |
| Farming, Fishing & Forestry | 34 (100.0%) | 0 (0.0%) |
| Construction & Extraction | 426 (90.4%) | 45 (9.6%) |
| Installation, Maintenance & Repair | 251 (100.0%) | 0 (0.0%) |
| Total (Category) | 711 (94.1%) | 45 (5.9%) |
| Total (Overall) | 2,817 (48.3%) | 3,013 (51.7%) |
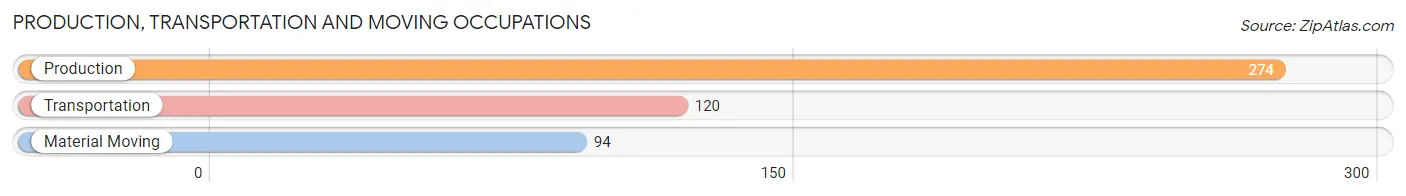
Production, Transportation and Moving Occupations
The most common Production, Transportation and Moving occupations in Kapaa are Production (274 | 4.7%), Transportation (120 | 2.1%), and Material Moving (94 | 1.6%).
Production, Transportation and Moving Occupations by Sex
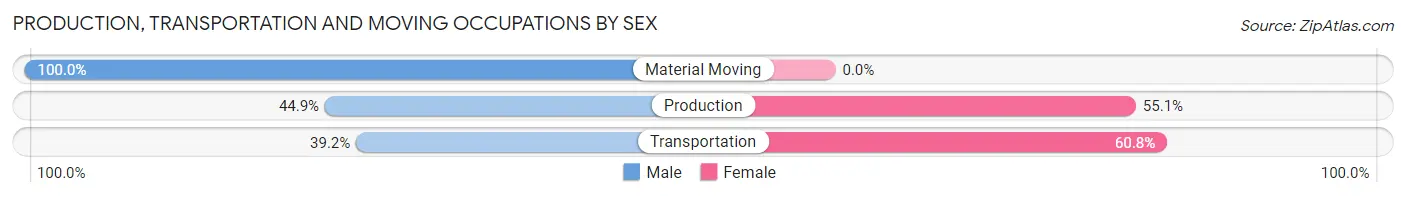
| Occupation | Male | Female |
| Production | 123 (44.9%) | 151 (55.1%) |
| Transportation | 47 (39.2%) | 73 (60.8%) |
| Material Moving | 94 (100.0%) | 0 (0.0%) |
| Total (Category) | 264 (54.1%) | 224 (45.9%) |
| Total (Overall) | 2,817 (48.3%) | 3,013 (51.7%) |
Employment Industries by Sex in Kapaa
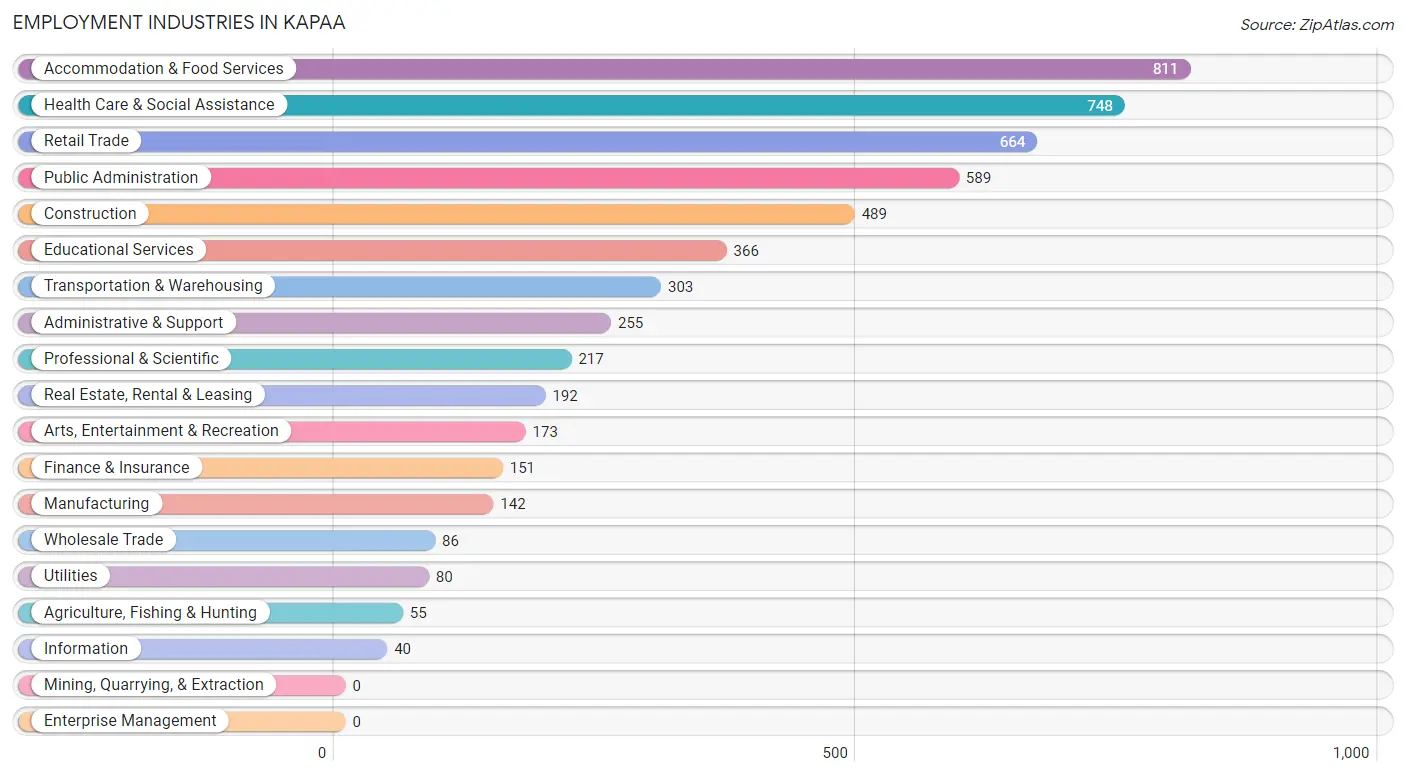
Employment Industries in Kapaa
The major employment industries in Kapaa include Accommodation & Food Services (811 | 13.9%), Health Care & Social Assistance (748 | 12.8%), Retail Trade (664 | 11.4%), Public Administration (589 | 10.1%), and Construction (489 | 8.4%).
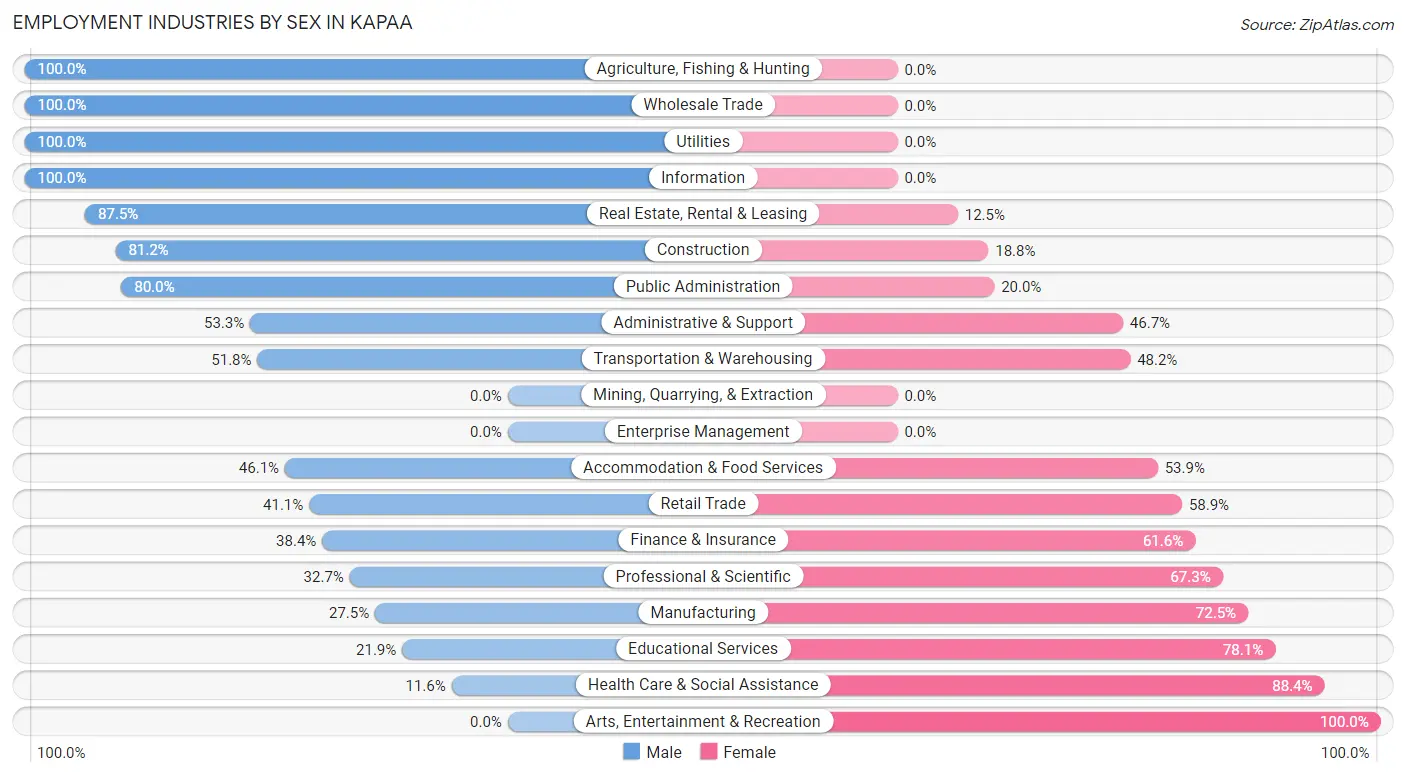
Employment Industries by Sex in Kapaa
The Kapaa industries that see more men than women are Agriculture, Fishing & Hunting (100.0%), Wholesale Trade (100.0%), and Utilities (100.0%), whereas the industries that tend to have a higher number of women are Arts, Entertainment & Recreation (100.0%), Health Care & Social Assistance (88.4%), and Educational Services (78.1%).
| Industry | Male | Female |
| Agriculture, Fishing & Hunting | 55 (100.0%) | 0 (0.0%) |
| Mining, Quarrying, & Extraction | 0 (0.0%) | 0 (0.0%) |
| Construction | 397 (81.2%) | 92 (18.8%) |
| Manufacturing | 39 (27.5%) | 103 (72.5%) |
| Wholesale Trade | 86 (100.0%) | 0 (0.0%) |
| Retail Trade | 273 (41.1%) | 391 (58.9%) |
| Transportation & Warehousing | 157 (51.8%) | 146 (48.2%) |
| Utilities | 80 (100.0%) | 0 (0.0%) |
| Information | 40 (100.0%) | 0 (0.0%) |
| Finance & Insurance | 58 (38.4%) | 93 (61.6%) |
| Real Estate, Rental & Leasing | 168 (87.5%) | 24 (12.5%) |
| Professional & Scientific | 71 (32.7%) | 146 (67.3%) |
| Enterprise Management | 0 (0.0%) | 0 (0.0%) |
| Administrative & Support | 136 (53.3%) | 119 (46.7%) |
| Educational Services | 80 (21.9%) | 286 (78.1%) |
| Health Care & Social Assistance | 87 (11.6%) | 661 (88.4%) |
| Arts, Entertainment & Recreation | 0 (0.0%) | 173 (100.0%) |
| Accommodation & Food Services | 374 (46.1%) | 437 (53.9%) |
| Public Administration | 471 (80.0%) | 118 (20.0%) |
| Total | 2,817 (48.3%) | 3,013 (51.7%) |
Education in Kapaa
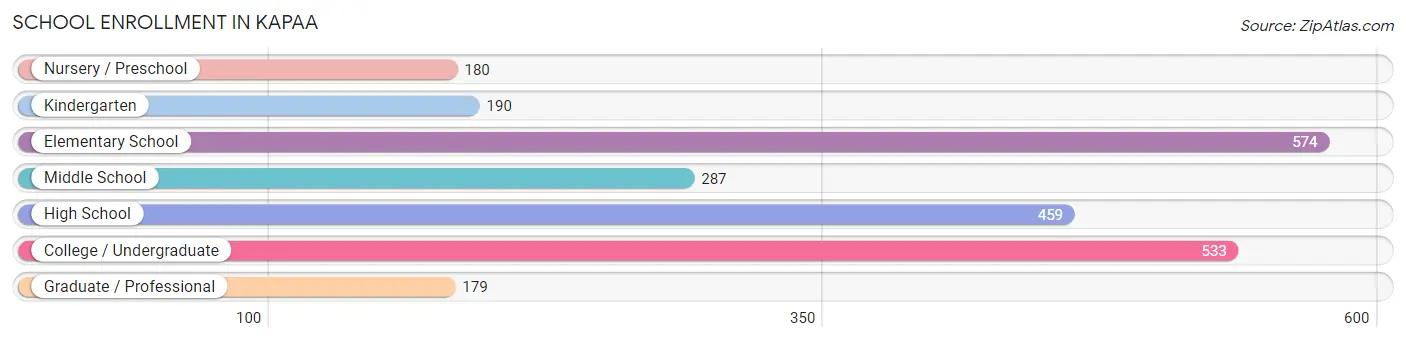
School Enrollment in Kapaa
The most common levels of schooling among the 2,402 students in Kapaa are elementary school (574 | 23.9%), college / undergraduate (533 | 22.2%), and high school (459 | 19.1%).
| School Level | # Students | % Students |
| Nursery / Preschool | 180 | 7.5% |
| Kindergarten | 190 | 7.9% |
| Elementary School | 574 | 23.9% |
| Middle School | 287 | 11.9% |
| High School | 459 | 19.1% |
| College / Undergraduate | 533 | 22.2% |
| Graduate / Professional | 179 | 7.4% |
| Total | 2,402 | 100.0% |
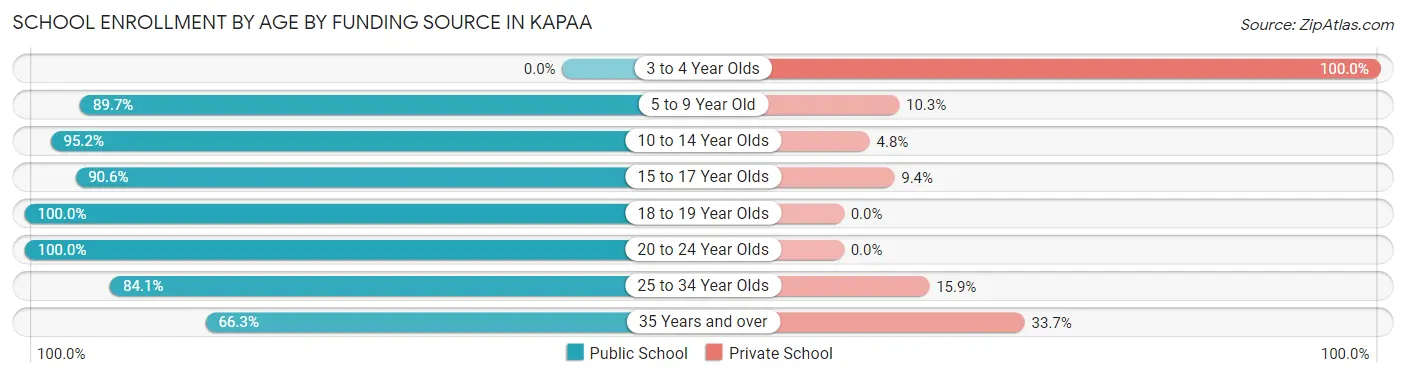
School Enrollment by Age by Funding Source in Kapaa
Out of a total of 2,402 students who are enrolled in schools in Kapaa, 411 (17.1%) attend a private institution, while the remaining 1,991 (82.9%) are enrolled in public schools. The age group of 3 to 4 year olds has the highest likelihood of being enrolled in private schools, with 170 (100.0% in the age bracket) enrolled. Conversely, the age group of 18 to 19 year olds has the lowest likelihood of being enrolled in a private school, with 153 (100.0% in the age bracket) attending a public institution.
| Age Bracket | Public School | Private School |
| 3 to 4 Year Olds | 0 (0.0%) | 170 (100.0%) |
| 5 to 9 Year Old | 661 (89.7%) | 76 (10.3%) |
| 10 to 14 Year Olds | 335 (95.2%) | 17 (4.8%) |
| 15 to 17 Year Olds | 240 (90.6%) | 25 (9.4%) |
| 18 to 19 Year Olds | 153 (100.0%) | 0 (0.0%) |
| 20 to 24 Year Olds | 267 (100.0%) | 0 (0.0%) |
| 25 to 34 Year Olds | 153 (84.1%) | 29 (15.9%) |
| 35 Years and over | 183 (66.3%) | 93 (33.7%) |
| Total | 1,991 (82.9%) | 411 (17.1%) |
Educational Attainment by Field of Study in Kapaa
Business (628 | 18.6%), science & technology (373 | 11.0%), education (326 | 9.6%), arts & humanities (303 | 8.9%), and social sciences (299 | 8.8%) are the most common fields of study among 3,384 individuals in Kapaa who have obtained a bachelor's degree or higher.
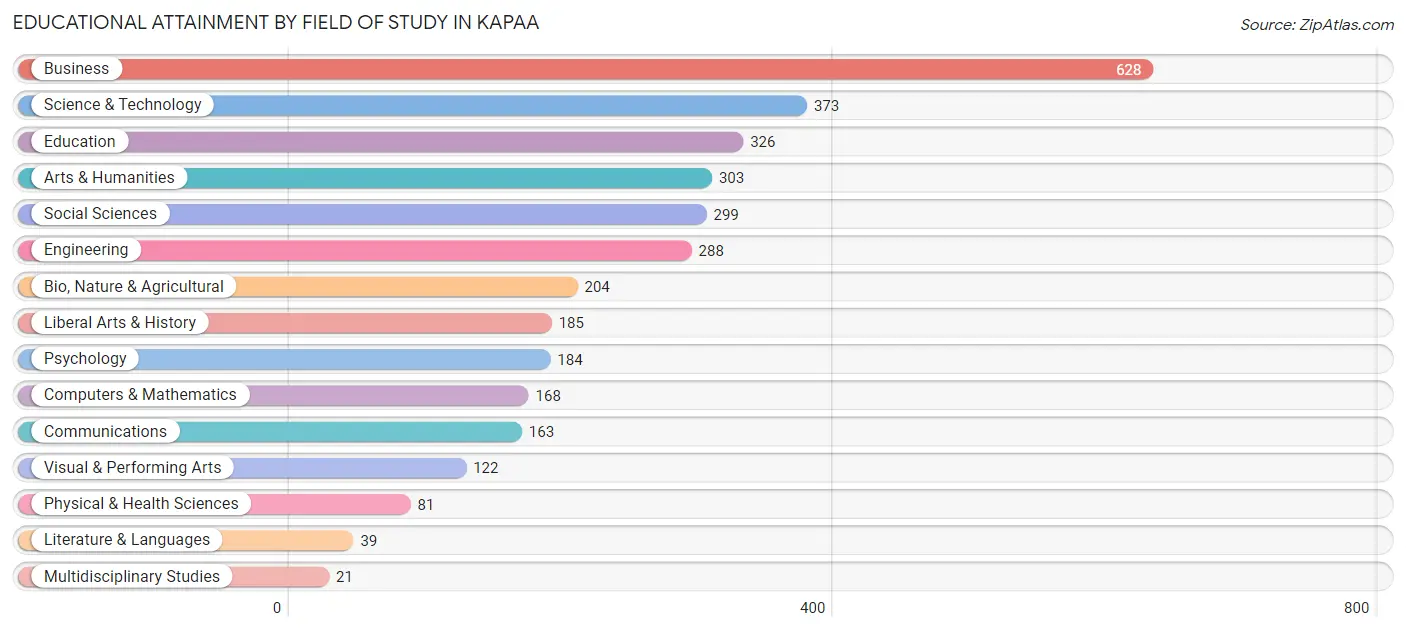
| Field of Study | # Graduates | % Graduates |
| Computers & Mathematics | 168 | 5.0% |
| Bio, Nature & Agricultural | 204 | 6.0% |
| Physical & Health Sciences | 81 | 2.4% |
| Psychology | 184 | 5.4% |
| Social Sciences | 299 | 8.8% |
| Engineering | 288 | 8.5% |
| Multidisciplinary Studies | 21 | 0.6% |
| Science & Technology | 373 | 11.0% |
| Business | 628 | 18.6% |
| Education | 326 | 9.6% |
| Literature & Languages | 39 | 1.1% |
| Liberal Arts & History | 185 | 5.5% |
| Visual & Performing Arts | 122 | 3.6% |
| Communications | 163 | 4.8% |
| Arts & Humanities | 303 | 8.9% |
| Total | 3,384 | 100.0% |
Transportation & Commute in Kapaa
Vehicle Availability by Sex in Kapaa
The most prevalent vehicle ownership categories in Kapaa are males with 4 vehicles (655, accounting for 23.6%) and females with 4 vehicles (775, making up 22.7%).
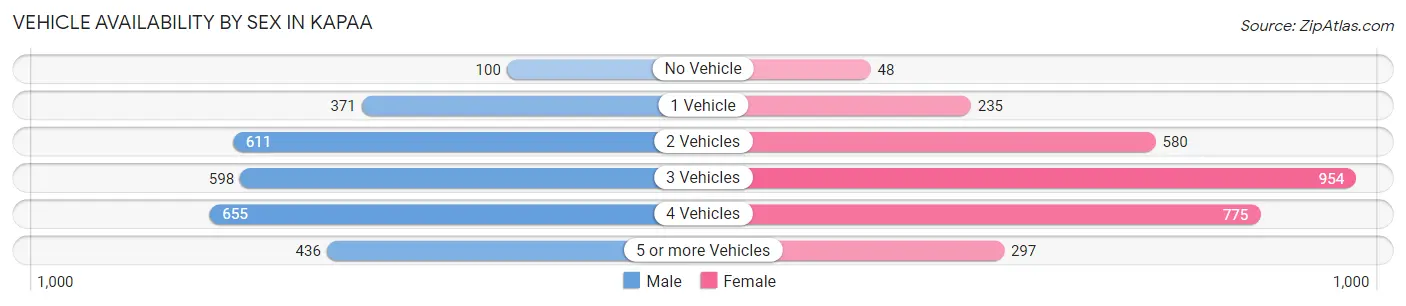
| Vehicles Available | Male | Female |
| No Vehicle | 100 (3.6%) | 48 (1.7%) |
| 1 Vehicle | 371 (13.4%) | 235 (8.1%) |
| 2 Vehicles | 611 (22.1%) | 580 (20.1%) |
| 3 Vehicles | 598 (21.6%) | 954 (33.0%) |
| 4 Vehicles | 655 (23.6%) | 775 (26.8%) |
| 5 or more Vehicles | 436 (15.7%) | 297 (10.3%) |
| Total | 2,771 (100.0%) | 2,889 (100.0%) |
Commute Time in Kapaa
The most frequently occuring commute durations in Kapaa are 20 to 24 minutes (1,090 commuters, 20.6%), 30 to 34 minutes (994 commuters, 18.8%), and 10 to 14 minutes (851 commuters, 16.1%).
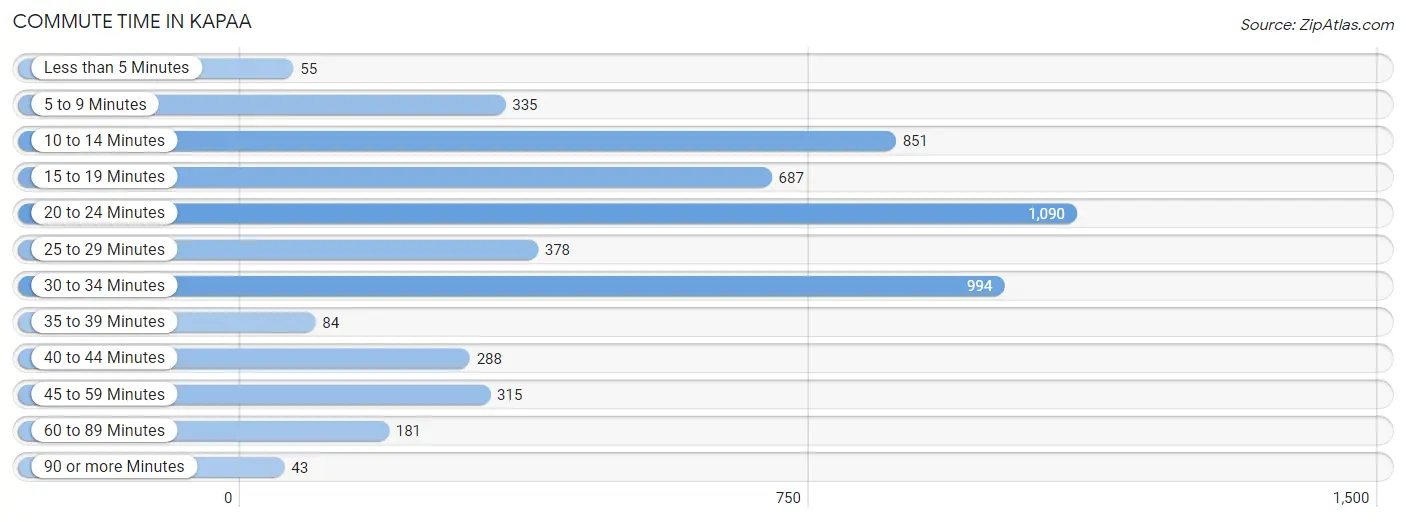
| Commute Time | # Commuters | % Commuters |
| Less than 5 Minutes | 55 | 1.0% |
| 5 to 9 Minutes | 335 | 6.3% |
| 10 to 14 Minutes | 851 | 16.1% |
| 15 to 19 Minutes | 687 | 13.0% |
| 20 to 24 Minutes | 1,090 | 20.6% |
| 25 to 29 Minutes | 378 | 7.1% |
| 30 to 34 Minutes | 994 | 18.8% |
| 35 to 39 Minutes | 84 | 1.6% |
| 40 to 44 Minutes | 288 | 5.4% |
| 45 to 59 Minutes | 315 | 5.9% |
| 60 to 89 Minutes | 181 | 3.4% |
| 90 or more Minutes | 43 | 0.8% |
Commute Time by Sex in Kapaa
The most common commute times in Kapaa are 20 to 24 minutes (725 commuters, 27.7%) for males and 10 to 14 minutes (593 commuters, 22.1%) for females.
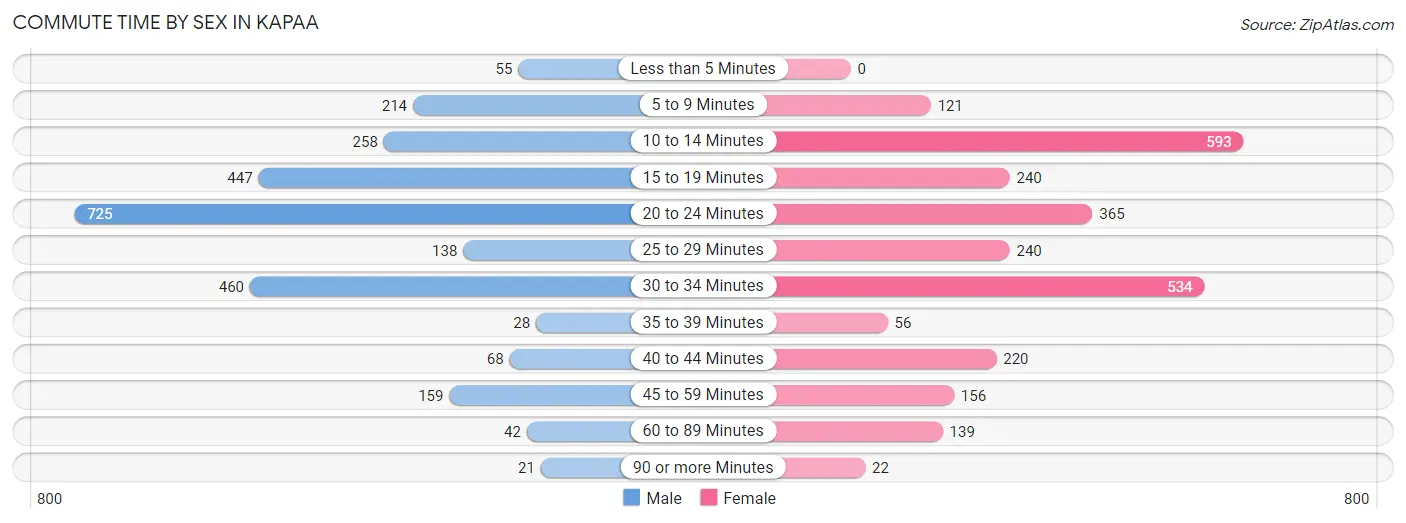
| Commute Time | Male | Female |
| Less than 5 Minutes | 55 (2.1%) | 0 (0.0%) |
| 5 to 9 Minutes | 214 (8.2%) | 121 (4.5%) |
| 10 to 14 Minutes | 258 (9.9%) | 593 (22.1%) |
| 15 to 19 Minutes | 447 (17.1%) | 240 (8.9%) |
| 20 to 24 Minutes | 725 (27.7%) | 365 (13.6%) |
| 25 to 29 Minutes | 138 (5.3%) | 240 (8.9%) |
| 30 to 34 Minutes | 460 (17.6%) | 534 (19.9%) |
| 35 to 39 Minutes | 28 (1.1%) | 56 (2.1%) |
| 40 to 44 Minutes | 68 (2.6%) | 220 (8.2%) |
| 45 to 59 Minutes | 159 (6.1%) | 156 (5.8%) |
| 60 to 89 Minutes | 42 (1.6%) | 139 (5.2%) |
| 90 or more Minutes | 21 (0.8%) | 22 (0.8%) |
Time of Departure to Work by Sex in Kapaa
The most frequent times of departure to work in Kapaa are 7:00 AM to 7:29 AM (716, 27.4%) for males and 7:00 AM to 7:29 AM (682, 25.4%) for females.
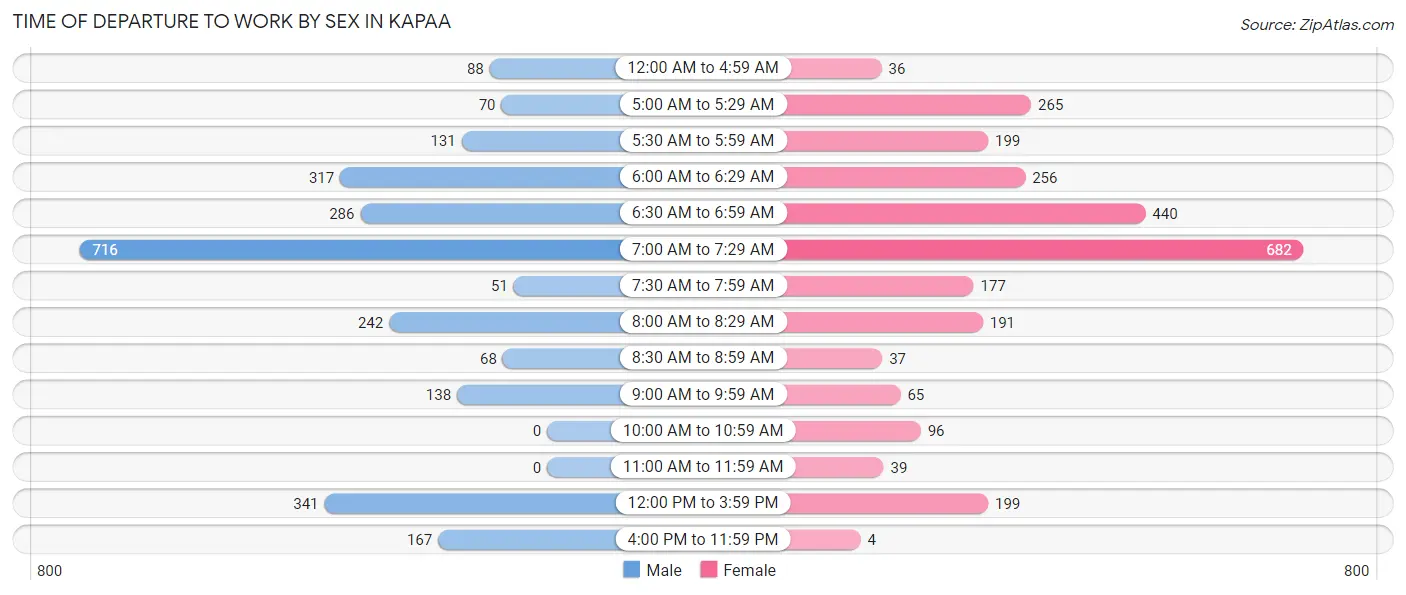
| Time of Departure | Male | Female |
| 12:00 AM to 4:59 AM | 88 (3.4%) | 36 (1.3%) |
| 5:00 AM to 5:29 AM | 70 (2.7%) | 265 (9.9%) |
| 5:30 AM to 5:59 AM | 131 (5.0%) | 199 (7.4%) |
| 6:00 AM to 6:29 AM | 317 (12.1%) | 256 (9.5%) |
| 6:30 AM to 6:59 AM | 286 (10.9%) | 440 (16.4%) |
| 7:00 AM to 7:29 AM | 716 (27.4%) | 682 (25.4%) |
| 7:30 AM to 7:59 AM | 51 (1.9%) | 177 (6.6%) |
| 8:00 AM to 8:29 AM | 242 (9.2%) | 191 (7.1%) |
| 8:30 AM to 8:59 AM | 68 (2.6%) | 37 (1.4%) |
| 9:00 AM to 9:59 AM | 138 (5.3%) | 65 (2.4%) |
| 10:00 AM to 10:59 AM | 0 (0.0%) | 96 (3.6%) |
| 11:00 AM to 11:59 AM | 0 (0.0%) | 39 (1.5%) |
| 12:00 PM to 3:59 PM | 341 (13.0%) | 199 (7.4%) |
| 4:00 PM to 11:59 PM | 167 (6.4%) | 4 (0.2%) |
| Total | 2,615 (100.0%) | 2,686 (100.0%) |
Housing Occupancy in Kapaa
Occupancy by Ownership in Kapaa
Of the total 3,466 dwellings in Kapaa, owner-occupied units account for 2,199 (63.4%), while renter-occupied units make up 1,267 (36.6%).
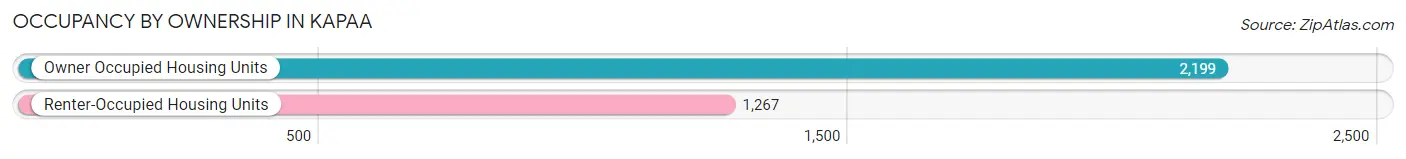
| Occupancy | # Housing Units | % Housing Units |
| Owner Occupied Housing Units | 2,199 | 63.4% |
| Renter-Occupied Housing Units | 1,267 | 36.6% |
| Total Occupied Housing Units | 3,466 | 100.0% |
Occupancy by Household Size in Kapaa
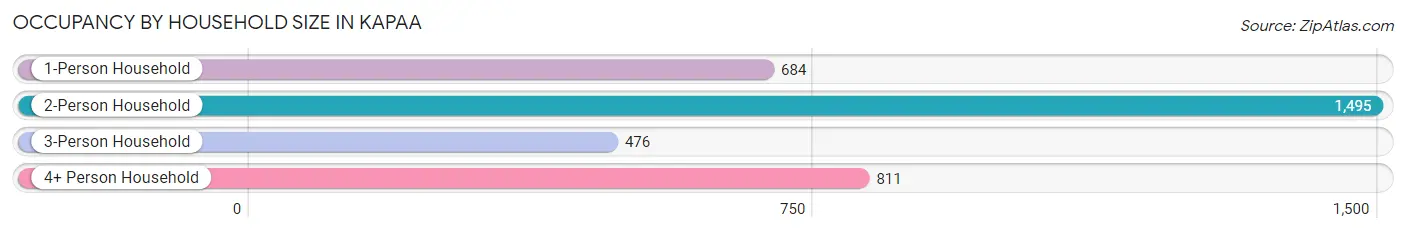
| Household Size | # Housing Units | % Housing Units |
| 1-Person Household | 684 | 19.7% |
| 2-Person Household | 1,495 | 43.1% |
| 3-Person Household | 476 | 13.7% |
| 4+ Person Household | 811 | 23.4% |
| Total Housing Units | 3,466 | 100.0% |
Occupancy by Ownership by Household Size in Kapaa
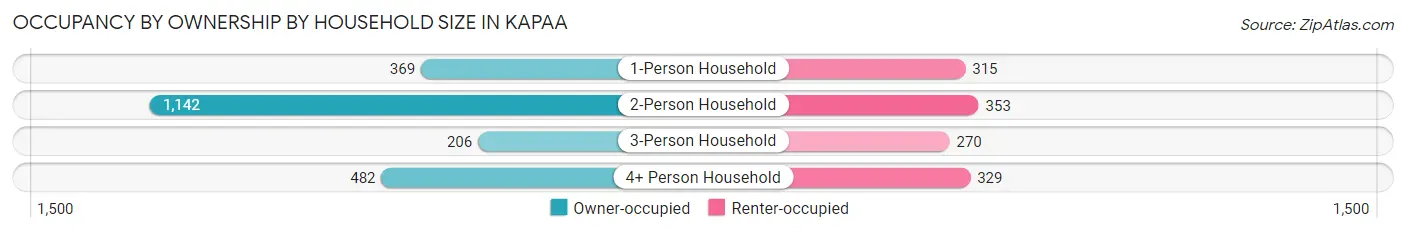
| Household Size | Owner-occupied | Renter-occupied |
| 1-Person Household | 369 (53.9%) | 315 (46.1%) |
| 2-Person Household | 1,142 (76.4%) | 353 (23.6%) |
| 3-Person Household | 206 (43.3%) | 270 (56.7%) |
| 4+ Person Household | 482 (59.4%) | 329 (40.6%) |
| Total Housing Units | 2,199 (63.4%) | 1,267 (36.6%) |
Occupancy by Educational Attainment in Kapaa
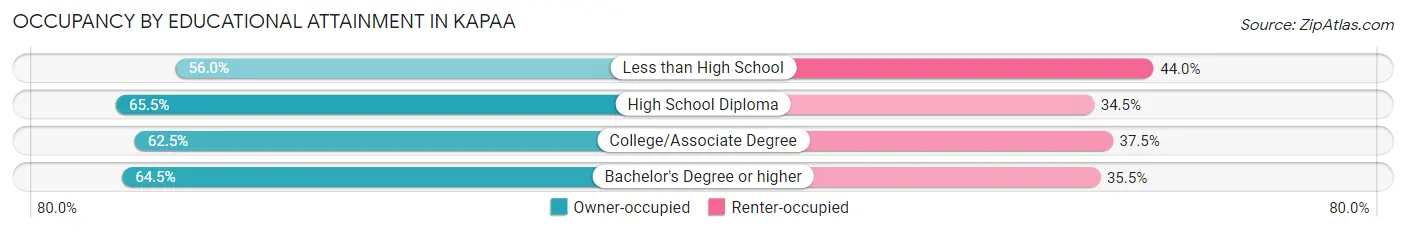
| Household Size | Owner-occupied | Renter-occupied |
| Less than High School | 116 (56.0%) | 91 (44.0%) |
| High School Diploma | 459 (65.5%) | 242 (34.5%) |
| College/Associate Degree | 810 (62.5%) | 486 (37.5%) |
| Bachelor's Degree or higher | 814 (64.5%) | 448 (35.5%) |
Occupancy by Age of Householder in Kapaa
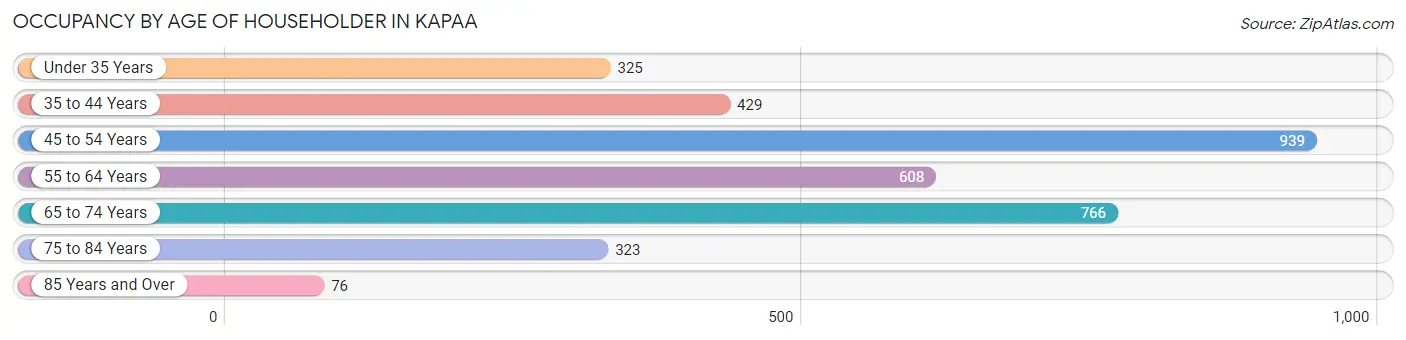
| Age Bracket | # Households | % Households |
| Under 35 Years | 325 | 9.4% |
| 35 to 44 Years | 429 | 12.4% |
| 45 to 54 Years | 939 | 27.1% |
| 55 to 64 Years | 608 | 17.5% |
| 65 to 74 Years | 766 | 22.1% |
| 75 to 84 Years | 323 | 9.3% |
| 85 Years and Over | 76 | 2.2% |
| Total | 3,466 | 100.0% |
Housing Finances in Kapaa
Median Income by Occupancy in Kapaa
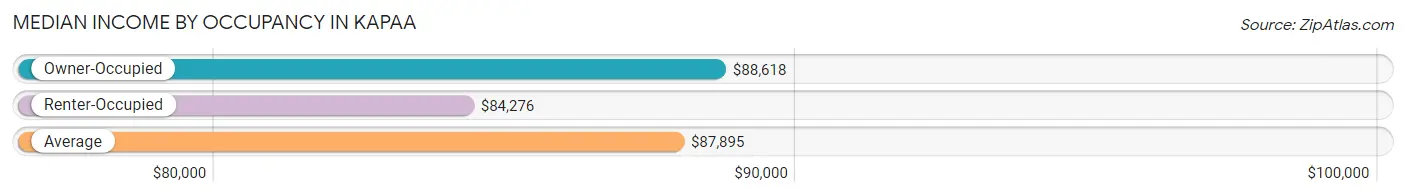
| Occupancy Type | # Households | Median Income |
| Owner-Occupied | 2,199 (63.4%) | $88,618 |
| Renter-Occupied | 1,267 (36.6%) | $84,276 |
| Average | 3,466 (100.0%) | $87,895 |
Occupancy by Householder Income Bracket in Kapaa
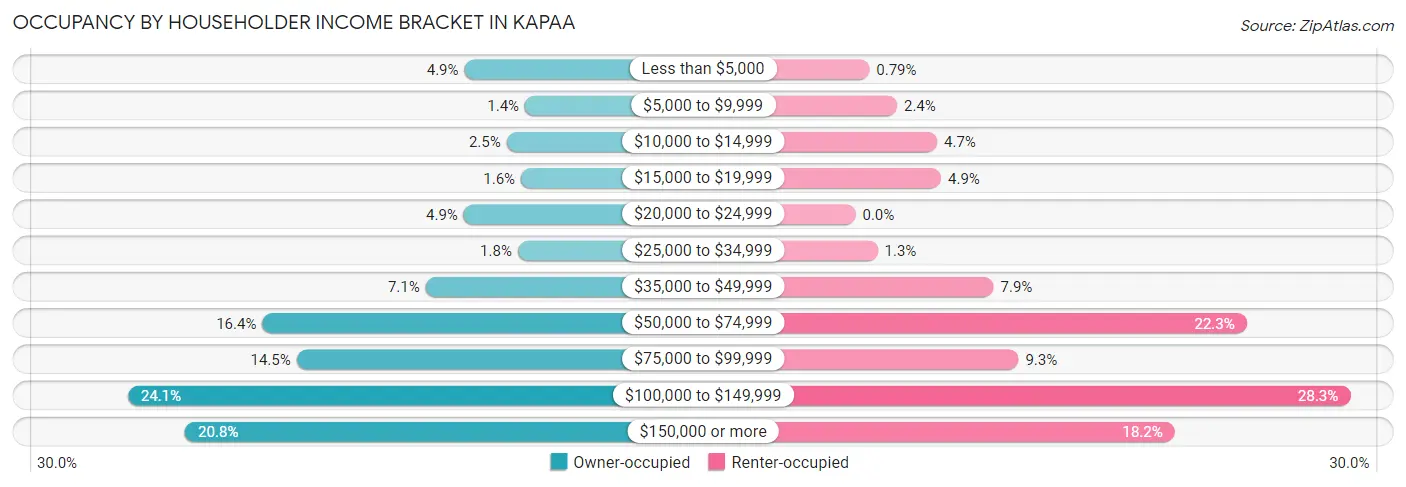
| Income Bracket | Owner-occupied | Renter-occupied |
| Less than $5,000 | 107 (4.9%) | 10 (0.8%) |
| $5,000 to $9,999 | 31 (1.4%) | 30 (2.4%) |
| $10,000 to $14,999 | 54 (2.5%) | 59 (4.7%) |
| $15,000 to $19,999 | 36 (1.6%) | 62 (4.9%) |
| $20,000 to $24,999 | 108 (4.9%) | 0 (0.0%) |
| $25,000 to $34,999 | 40 (1.8%) | 16 (1.3%) |
| $35,000 to $49,999 | 156 (7.1%) | 100 (7.9%) |
| $50,000 to $74,999 | 361 (16.4%) | 283 (22.3%) |
| $75,000 to $99,999 | 318 (14.5%) | 118 (9.3%) |
| $100,000 to $149,999 | 530 (24.1%) | 358 (28.3%) |
| $150,000 or more | 458 (20.8%) | 231 (18.2%) |
| Total | 2,199 (100.0%) | 1,267 (100.0%) |
Monthly Housing Cost Tiers in Kapaa
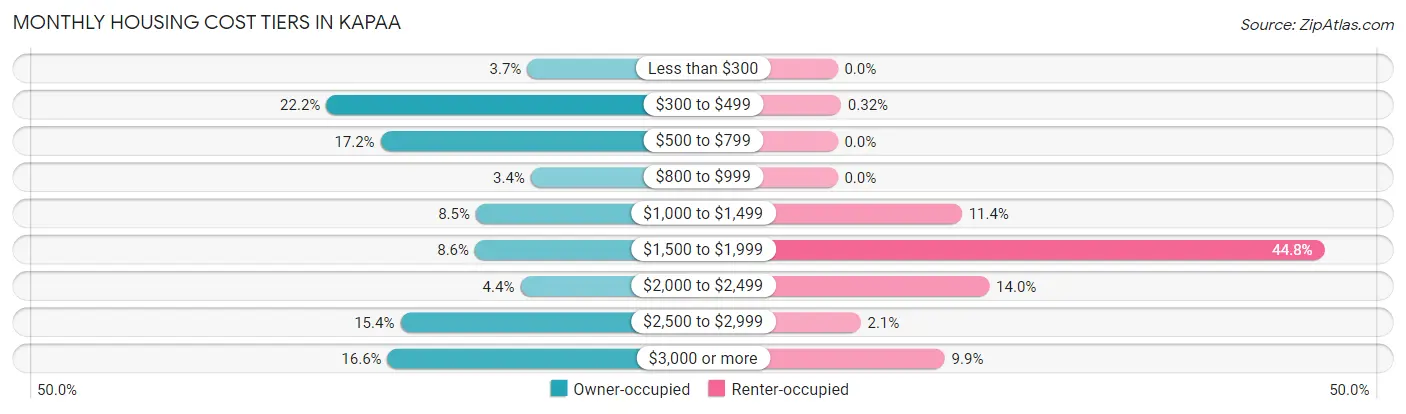
| Monthly Cost | Owner-occupied | Renter-occupied |
| Less than $300 | 82 (3.7%) | 0 (0.0%) |
| $300 to $499 | 489 (22.2%) | 4 (0.3%) |
| $500 to $799 | 379 (17.2%) | 0 (0.0%) |
| $800 to $999 | 75 (3.4%) | 0 (0.0%) |
| $1,000 to $1,499 | 186 (8.5%) | 145 (11.4%) |
| $1,500 to $1,999 | 188 (8.6%) | 568 (44.8%) |
| $2,000 to $2,499 | 96 (4.4%) | 177 (14.0%) |
| $2,500 to $2,999 | 339 (15.4%) | 27 (2.1%) |
| $3,000 or more | 365 (16.6%) | 125 (9.9%) |
| Total | 2,199 (100.0%) | 1,267 (100.0%) |
Physical Housing Characteristics in Kapaa
Housing Structures in Kapaa
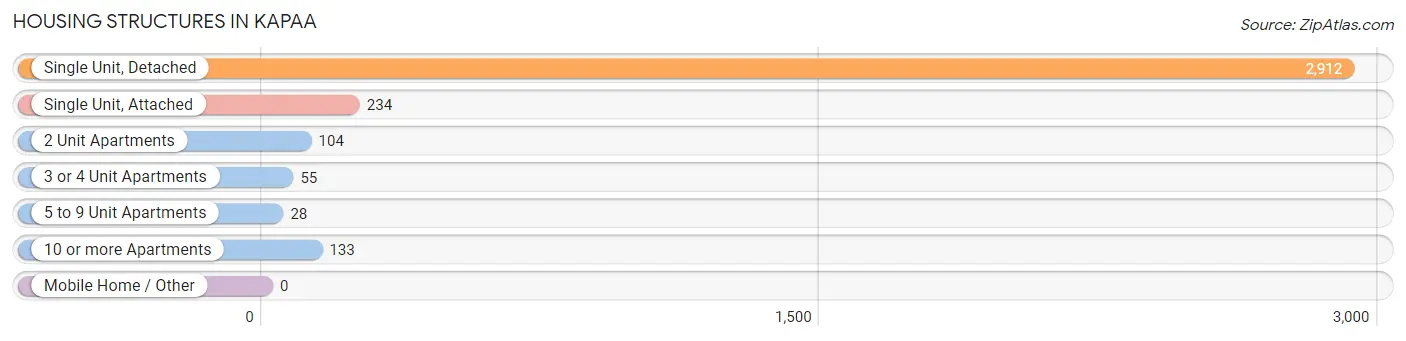
| Structure Type | # Housing Units | % Housing Units |
| Single Unit, Detached | 2,912 | 84.0% |
| Single Unit, Attached | 234 | 6.8% |
| 2 Unit Apartments | 104 | 3.0% |
| 3 or 4 Unit Apartments | 55 | 1.6% |
| 5 to 9 Unit Apartments | 28 | 0.8% |
| 10 or more Apartments | 133 | 3.8% |
| Mobile Home / Other | 0 | 0.0% |
| Total | 3,466 | 100.0% |
Housing Structures by Occupancy in Kapaa
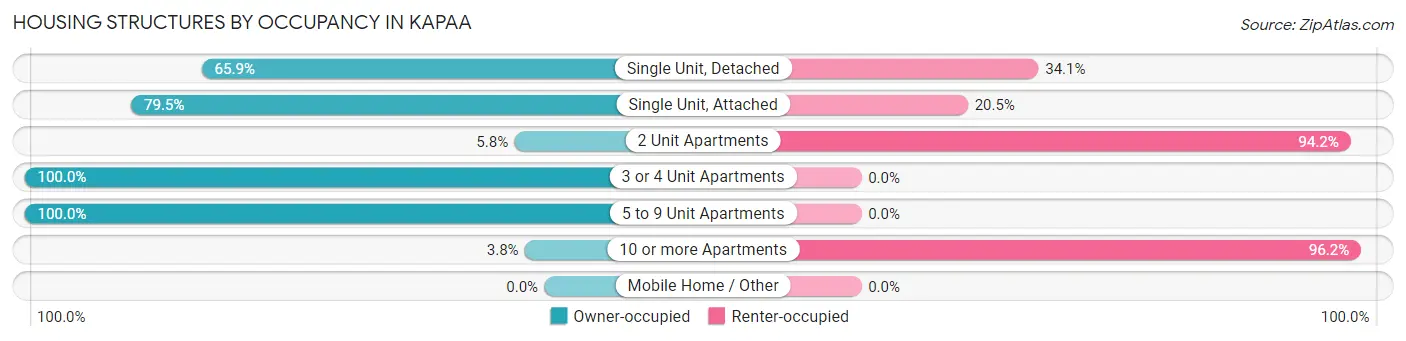
| Structure Type | Owner-occupied | Renter-occupied |
| Single Unit, Detached | 1,919 (65.9%) | 993 (34.1%) |
| Single Unit, Attached | 186 (79.5%) | 48 (20.5%) |
| 2 Unit Apartments | 6 (5.8%) | 98 (94.2%) |
| 3 or 4 Unit Apartments | 55 (100.0%) | 0 (0.0%) |
| 5 to 9 Unit Apartments | 28 (100.0%) | 0 (0.0%) |
| 10 or more Apartments | 5 (3.8%) | 128 (96.2%) |
| Mobile Home / Other | 0 (0.0%) | 0 (0.0%) |
| Total | 2,199 (63.4%) | 1,267 (36.6%) |
Housing Structures by Number of Rooms in Kapaa
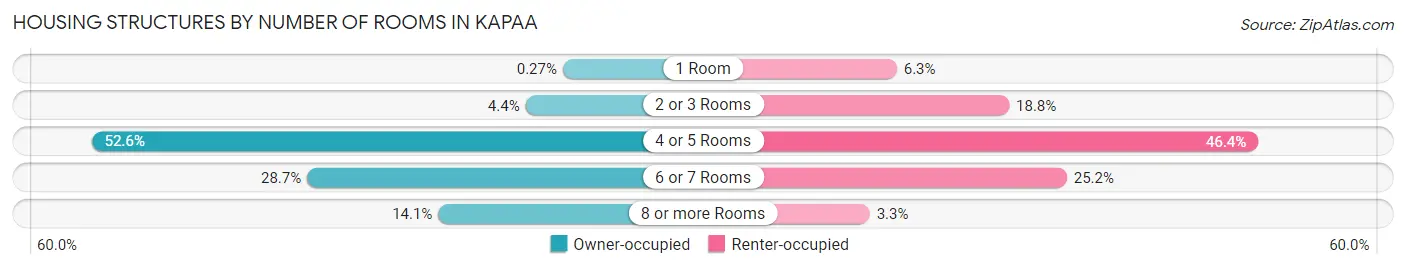
| Number of Rooms | Owner-occupied | Renter-occupied |
| 1 Room | 6 (0.3%) | 80 (6.3%) |
| 2 or 3 Rooms | 97 (4.4%) | 238 (18.8%) |
| 4 or 5 Rooms | 1,156 (52.6%) | 588 (46.4%) |
| 6 or 7 Rooms | 630 (28.6%) | 319 (25.2%) |
| 8 or more Rooms | 310 (14.1%) | 42 (3.3%) |
| Total | 2,199 (100.0%) | 1,267 (100.0%) |
Housing Structure by Heating Type in Kapaa
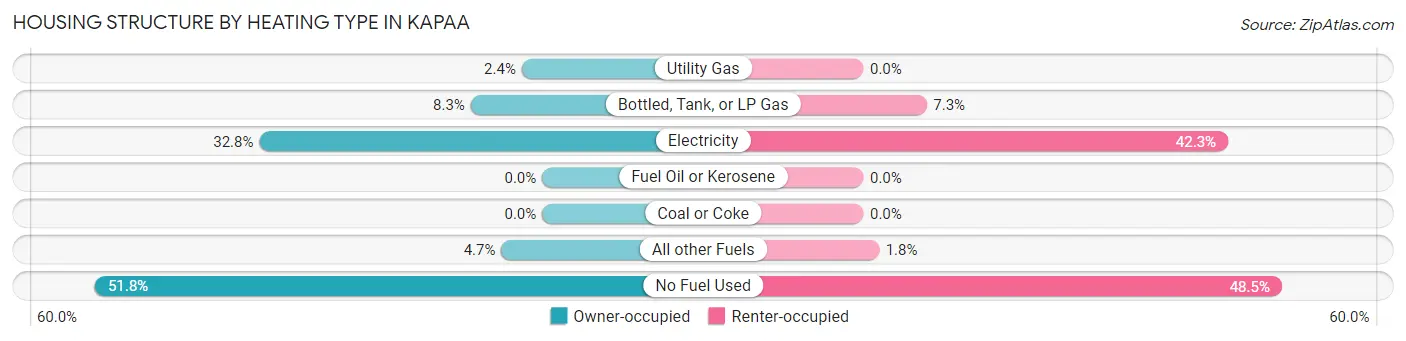
| Heating Type | Owner-occupied | Renter-occupied |
| Utility Gas | 52 (2.4%) | 0 (0.0%) |
| Bottled, Tank, or LP Gas | 182 (8.3%) | 93 (7.3%) |
| Electricity | 721 (32.8%) | 536 (42.3%) |
| Fuel Oil or Kerosene | 0 (0.0%) | 0 (0.0%) |
| Coal or Coke | 0 (0.0%) | 0 (0.0%) |
| All other Fuels | 104 (4.7%) | 23 (1.8%) |
| No Fuel Used | 1,140 (51.8%) | 615 (48.5%) |
| Total | 2,199 (100.0%) | 1,267 (100.0%) |
Household Vehicle Usage in Kapaa
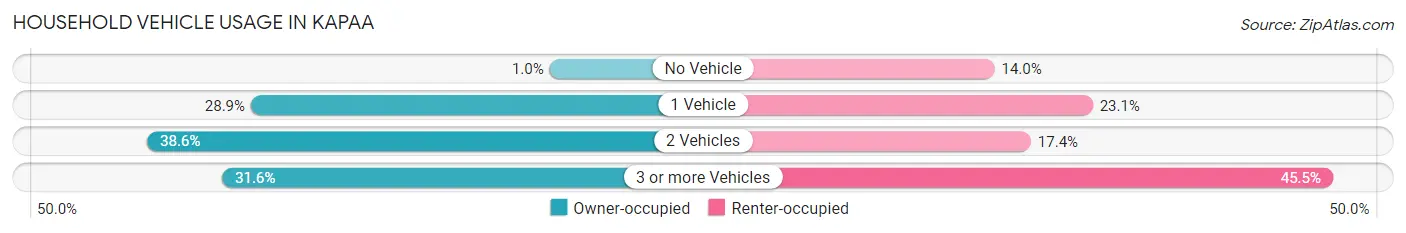
| Vehicles per Household | Owner-occupied | Renter-occupied |
| No Vehicle | 22 (1.0%) | 177 (14.0%) |
| 1 Vehicle | 635 (28.9%) | 293 (23.1%) |
| 2 Vehicles | 848 (38.6%) | 220 (17.4%) |
| 3 or more Vehicles | 694 (31.6%) | 577 (45.5%) |
| Total | 2,199 (100.0%) | 1,267 (100.0%) |
Real Estate & Mortgages in Kapaa
Real Estate and Mortgage Overview in Kapaa
| Characteristic | Without Mortgage | With Mortgage |
| Housing Units | 1,099 | 1,100 |
| Median Property Value | $708,800 | $680,400 |
| Median Household Income | $78,320 | $288 |
| Monthly Housing Costs | $518 | $365 |
| Real Estate Taxes | $1,153 | $27 |
Property Value by Mortgage Status in Kapaa
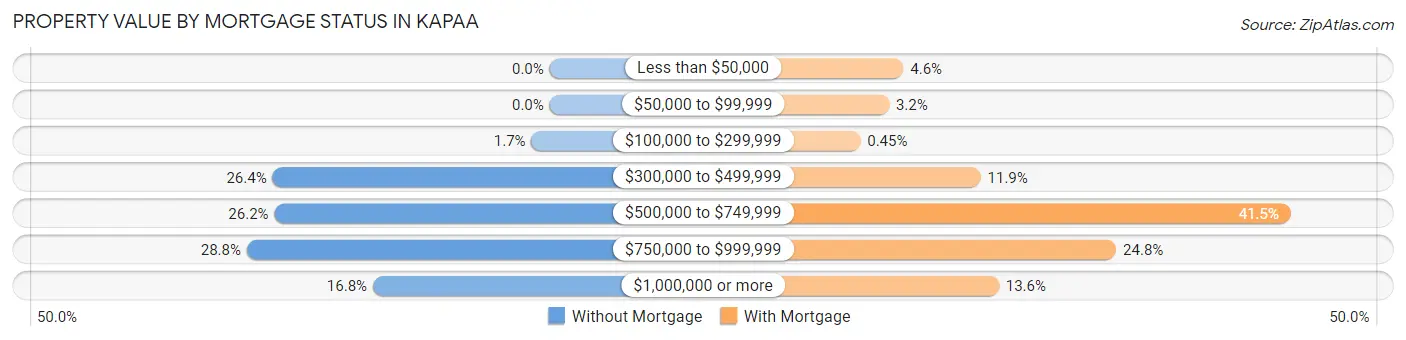
| Property Value | Without Mortgage | With Mortgage |
| Less than $50,000 | 0 (0.0%) | 50 (4.5%) |
| $50,000 to $99,999 | 0 (0.0%) | 35 (3.2%) |
| $100,000 to $299,999 | 19 (1.7%) | 5 (0.4%) |
| $300,000 to $499,999 | 290 (26.4%) | 131 (11.9%) |
| $500,000 to $749,999 | 288 (26.2%) | 456 (41.4%) |
| $750,000 to $999,999 | 317 (28.8%) | 273 (24.8%) |
| $1,000,000 or more | 185 (16.8%) | 150 (13.6%) |
| Total | 1,099 (100.0%) | 1,100 (100.0%) |
Household Income by Mortgage Status in Kapaa
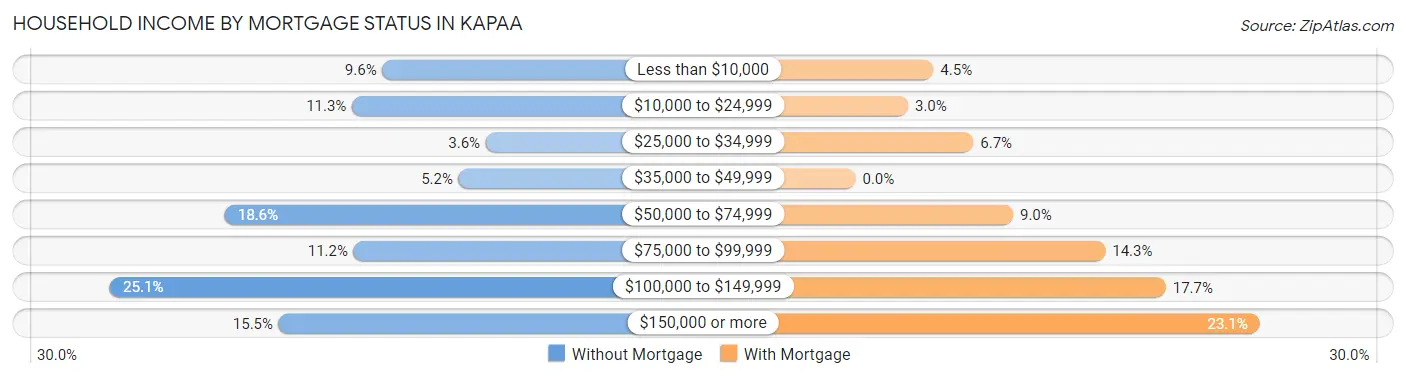
| Household Income | Without Mortgage | With Mortgage |
| Less than $10,000 | 105 (9.6%) | 49 (4.4%) |
| $10,000 to $24,999 | 124 (11.3%) | 33 (3.0%) |
| $25,000 to $34,999 | 40 (3.6%) | 74 (6.7%) |
| $35,000 to $49,999 | 57 (5.2%) | 0 (0.0%) |
| $50,000 to $74,999 | 204 (18.6%) | 99 (9.0%) |
| $75,000 to $99,999 | 123 (11.2%) | 157 (14.3%) |
| $100,000 to $149,999 | 276 (25.1%) | 195 (17.7%) |
| $150,000 or more | 170 (15.5%) | 254 (23.1%) |
| Total | 1,099 (100.0%) | 1,100 (100.0%) |
Property Value to Household Income Ratio in Kapaa
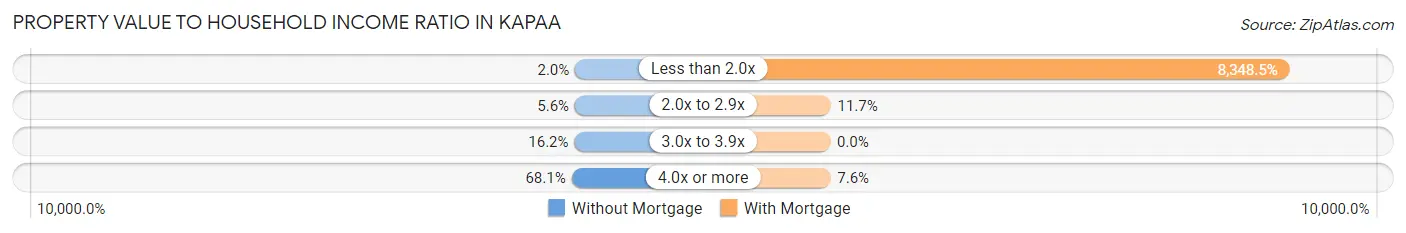
| Value-to-Income Ratio | Without Mortgage | With Mortgage |
| Less than 2.0x | 22 (2.0%) | 91,833 (8,348.4%) |
| 2.0x to 2.9x | 61 (5.6%) | 129 (11.7%) |
| 3.0x to 3.9x | 178 (16.2%) | 0 (0.0%) |
| 4.0x or more | 748 (68.1%) | 83 (7.5%) |
| Total | 1,099 (100.0%) | 1,100 (100.0%) |
Real Estate Taxes by Mortgage Status in Kapaa
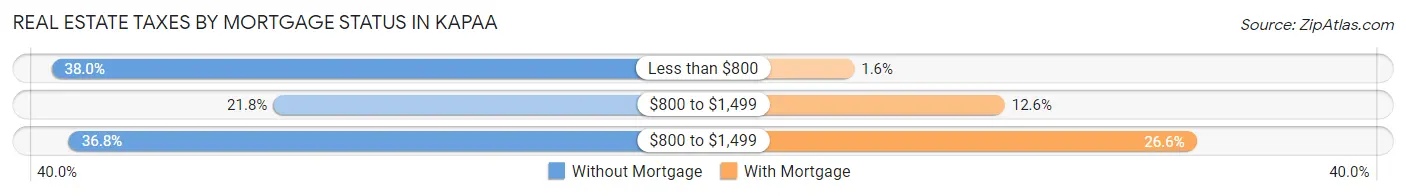
| Property Taxes | Without Mortgage | With Mortgage |
| Less than $800 | 418 (38.0%) | 17 (1.5%) |
| $800 to $1,499 | 240 (21.8%) | 138 (12.6%) |
| $800 to $1,499 | 404 (36.8%) | 292 (26.6%) |
| Total | 1,099 (100.0%) | 1,100 (100.0%) |
Health & Disability in Kapaa
Health Insurance Coverage by Age in Kapaa
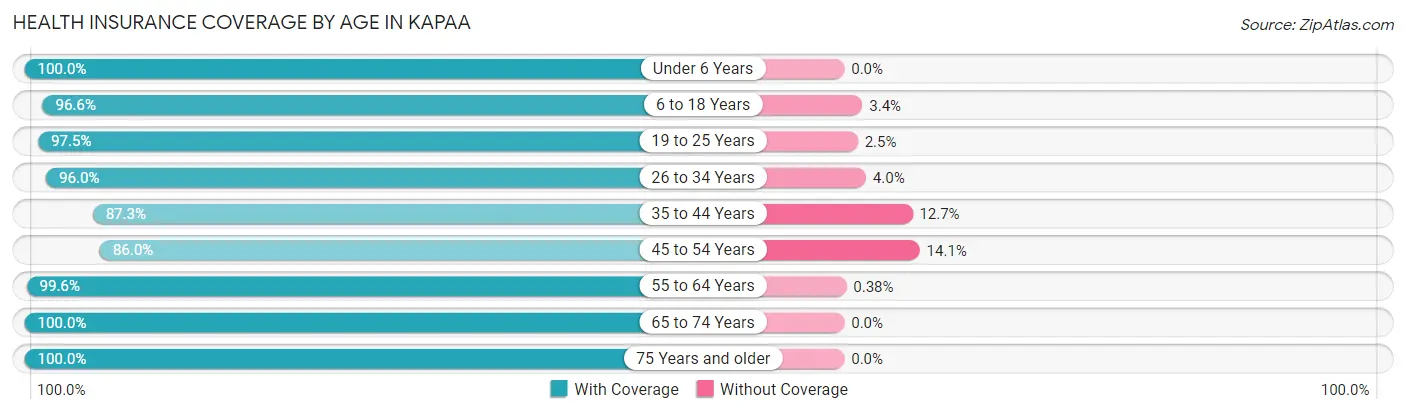
| Age Bracket | With Coverage | Without Coverage |
| Under 6 Years | 529 (100.0%) | 0 (0.0%) |
| 6 to 18 Years | 1,436 (96.6%) | 50 (3.4%) |
| 19 to 25 Years | 545 (97.5%) | 14 (2.5%) |
| 26 to 34 Years | 1,000 (96.0%) | 42 (4.0%) |
| 35 to 44 Years | 1,429 (87.3%) | 208 (12.7%) |
| 45 to 54 Years | 1,541 (86.0%) | 252 (14.1%) |
| 55 to 64 Years | 1,576 (99.6%) | 6 (0.4%) |
| 65 to 74 Years | 1,184 (100.0%) | 0 (0.0%) |
| 75 Years and older | 985 (100.0%) | 0 (0.0%) |
| Total | 10,225 (94.7%) | 572 (5.3%) |
Health Insurance Coverage by Citizenship Status in Kapaa
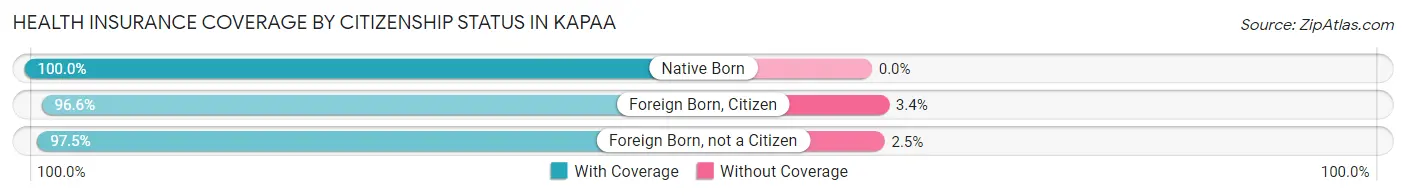
| Citizenship Status | With Coverage | Without Coverage |
| Native Born | 529 (100.0%) | 0 (0.0%) |
| Foreign Born, Citizen | 1,436 (96.6%) | 50 (3.4%) |
| Foreign Born, not a Citizen | 545 (97.5%) | 14 (2.5%) |
Health Insurance Coverage by Household Income in Kapaa
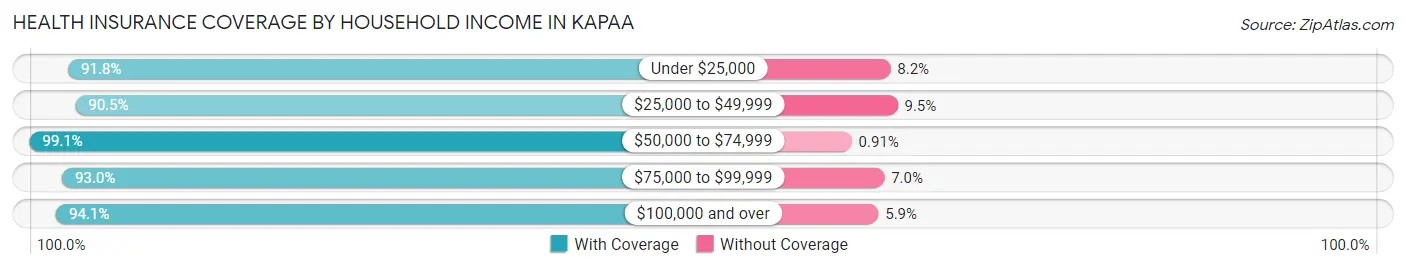
| Household Income | With Coverage | Without Coverage |
| Under $25,000 | 619 (91.8%) | 55 (8.2%) |
| $25,000 to $49,999 | 371 (90.5%) | 39 (9.5%) |
| $50,000 to $74,999 | 2,073 (99.1%) | 19 (0.9%) |
| $75,000 to $99,999 | 995 (93.0%) | 75 (7.0%) |
| $100,000 and over | 6,126 (94.1%) | 384 (5.9%) |
Public vs Private Health Insurance Coverage by Age in Kapaa
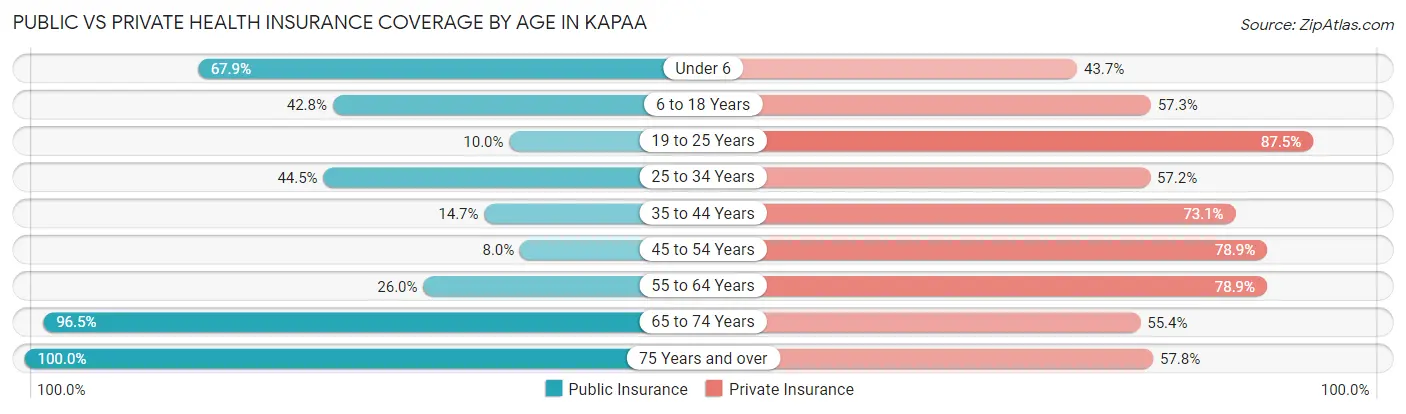
| Age Bracket | Public Insurance | Private Insurance |
| Under 6 | 359 (67.9%) | 231 (43.7%) |
| 6 to 18 Years | 636 (42.8%) | 852 (57.3%) |
| 19 to 25 Years | 56 (10.0%) | 489 (87.5%) |
| 25 to 34 Years | 464 (44.5%) | 596 (57.2%) |
| 35 to 44 Years | 240 (14.7%) | 1,196 (73.1%) |
| 45 to 54 Years | 144 (8.0%) | 1,415 (78.9%) |
| 55 to 64 Years | 411 (26.0%) | 1,248 (78.9%) |
| 65 to 74 Years | 1,143 (96.5%) | 656 (55.4%) |
| 75 Years and over | 985 (100.0%) | 569 (57.8%) |
| Total | 4,438 (41.1%) | 7,252 (67.2%) |
Disability Status by Sex by Age in Kapaa
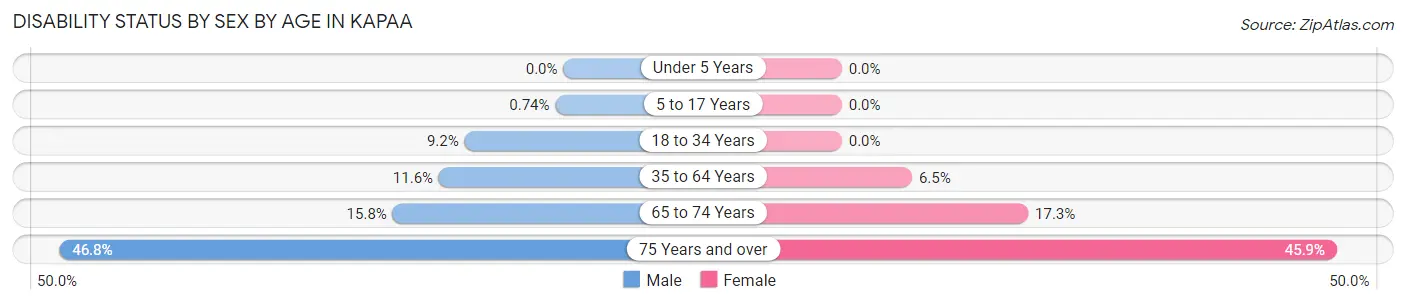
| Age Bracket | Male | Female |
| Under 5 Years | 0 (0.0%) | 0 (0.0%) |
| 5 to 17 Years | 8 (0.7%) | 0 (0.0%) |
| 18 to 34 Years | 76 (9.2%) | 0 (0.0%) |
| 35 to 64 Years | 318 (11.6%) | 147 (6.5%) |
| 65 to 74 Years | 73 (15.8%) | 125 (17.3%) |
| 75 Years and over | 196 (46.8%) | 260 (45.9%) |
Disability Class by Sex by Age in Kapaa
Disability Class: Hearing Difficulty
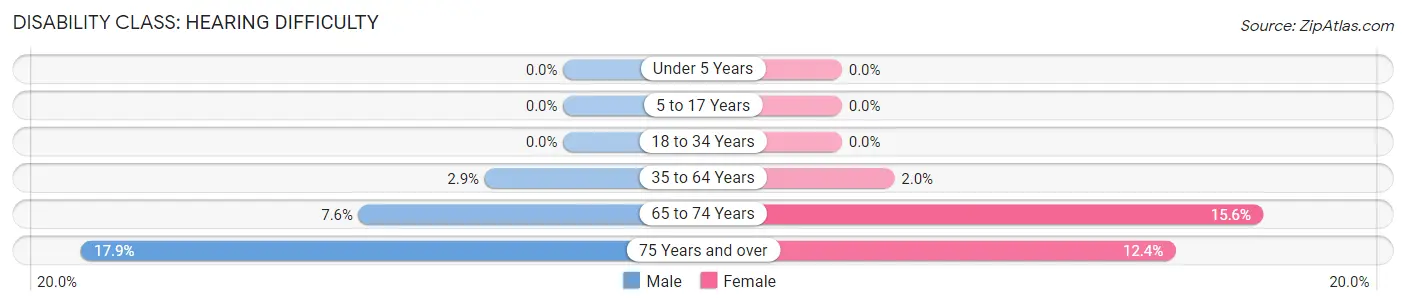
| Age Bracket | Male | Female |
| Under 5 Years | 0 (0.0%) | 0 (0.0%) |
| 5 to 17 Years | 0 (0.0%) | 0 (0.0%) |
| 18 to 34 Years | 0 (0.0%) | 0 (0.0%) |
| 35 to 64 Years | 80 (2.9%) | 44 (1.9%) |
| 65 to 74 Years | 35 (7.6%) | 113 (15.6%) |
| 75 Years and over | 75 (17.9%) | 70 (12.4%) |
Disability Class: Vision Difficulty
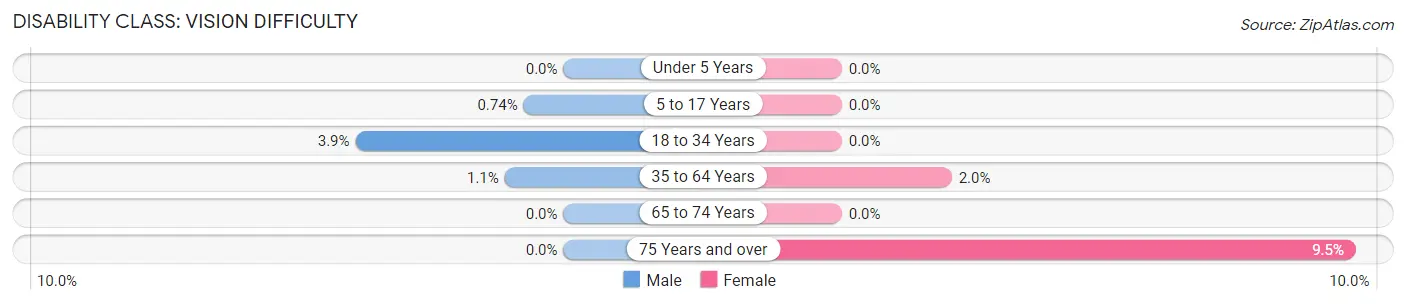
| Age Bracket | Male | Female |
| Under 5 Years | 0 (0.0%) | 0 (0.0%) |
| 5 to 17 Years | 8 (0.7%) | 0 (0.0%) |
| 18 to 34 Years | 32 (3.9%) | 0 (0.0%) |
| 35 to 64 Years | 30 (1.1%) | 46 (2.0%) |
| 65 to 74 Years | 0 (0.0%) | 0 (0.0%) |
| 75 Years and over | 0 (0.0%) | 54 (9.5%) |
Disability Class: Cognitive Difficulty
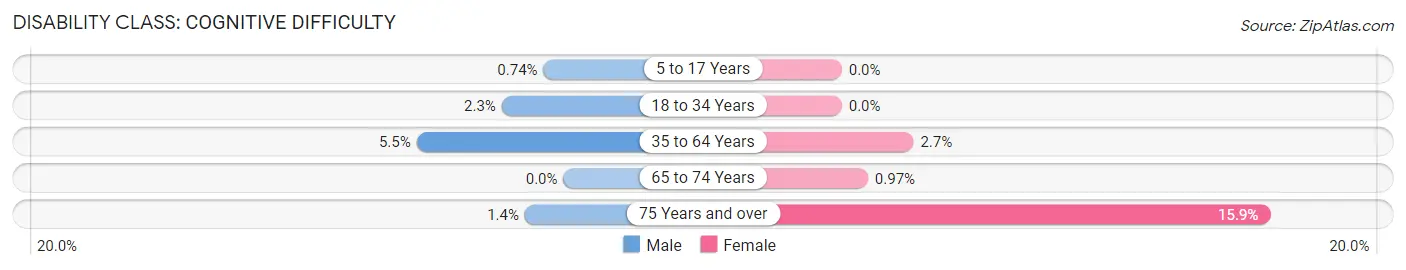
| Age Bracket | Male | Female |
| 5 to 17 Years | 8 (0.7%) | 0 (0.0%) |
| 18 to 34 Years | 19 (2.3%) | 0 (0.0%) |
| 35 to 64 Years | 150 (5.4%) | 60 (2.7%) |
| 65 to 74 Years | 0 (0.0%) | 7 (1.0%) |
| 75 Years and over | 6 (1.4%) | 90 (15.9%) |
Disability Class: Ambulatory Difficulty
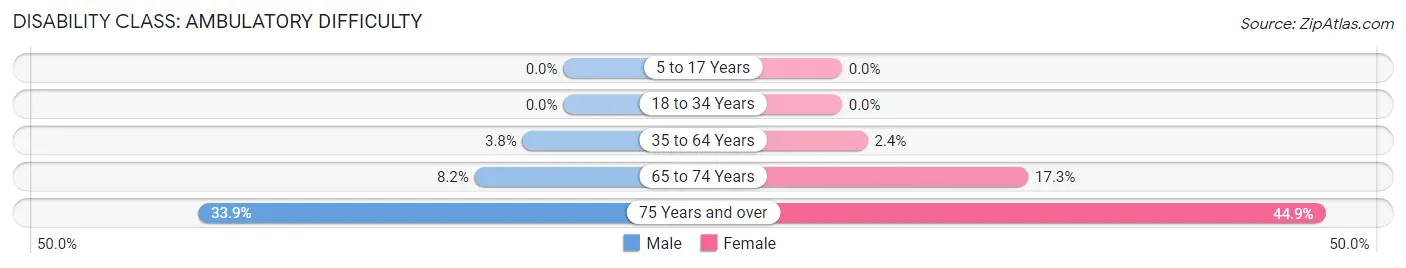
| Age Bracket | Male | Female |
| 5 to 17 Years | 0 (0.0%) | 0 (0.0%) |
| 18 to 34 Years | 0 (0.0%) | 0 (0.0%) |
| 35 to 64 Years | 104 (3.8%) | 54 (2.4%) |
| 65 to 74 Years | 38 (8.2%) | 125 (17.3%) |
| 75 Years and over | 142 (33.9%) | 254 (44.9%) |
Disability Class: Self-Care Difficulty
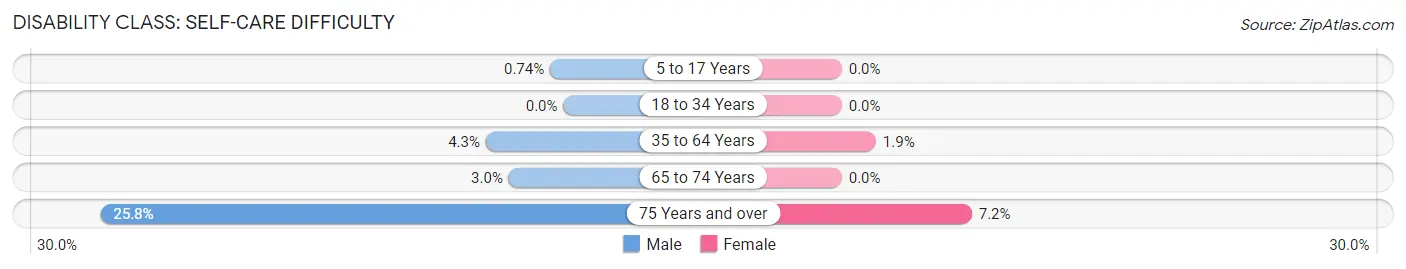
| Age Bracket | Male | Female |
| 5 to 17 Years | 8 (0.7%) | 0 (0.0%) |
| 18 to 34 Years | 0 (0.0%) | 0 (0.0%) |
| 35 to 64 Years | 119 (4.3%) | 43 (1.9%) |
| 65 to 74 Years | 14 (3.0%) | 0 (0.0%) |
| 75 Years and over | 108 (25.8%) | 41 (7.2%) |
Technology Access in Kapaa
Computing Device Access in Kapaa
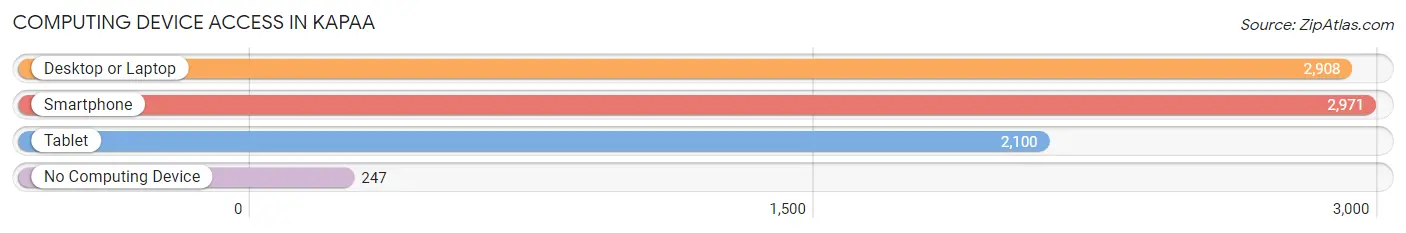
| Device Type | # Households | % Households |
| Desktop or Laptop | 2,908 | 83.9% |
| Smartphone | 2,971 | 85.7% |
| Tablet | 2,100 | 60.6% |
| No Computing Device | 247 | 7.1% |
| Total | 3,466 | 100.0% |
Internet Access in Kapaa
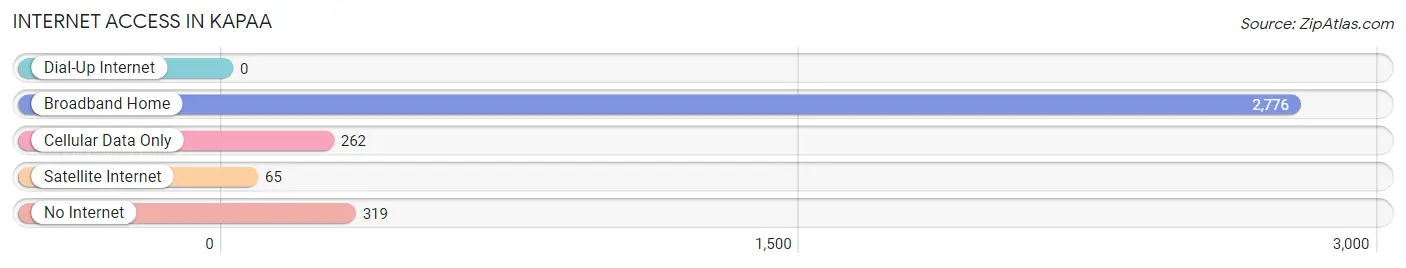
| Internet Type | # Households | % Households |
| Dial-Up Internet | 0 | 0.0% |
| Broadband Home | 2,776 | 80.1% |
| Cellular Data Only | 262 | 7.6% |
| Satellite Internet | 65 | 1.9% |
| No Internet | 319 | 9.2% |
| Total | 3,466 | 100.0% |
Kapaa Summary
Kapaa is a census-designated place (CDP) located on the east side of the Hawaiian island of Kauai. It is the largest town on the island and is the commercial and governmental center of the island. Kapaa is located on the east coast of Kauai, between the towns of Wailua and Anahola. The population of Kapaa was 10,699 at the 2010 census.
History
Kapaa was originally settled by Polynesian voyagers in the late 1700s. The area was known as Kapa’a, which means “solid” in Hawaiian. The town was established in the early 1800s and was a major port for the whaling industry. In the late 1800s, Kapaa was a major sugar-producing area. The town was also home to a large Chinese population, who worked in the sugar plantations.
In the early 1900s, Kapaa was a popular tourist destination. The town was home to several resorts, including the Coco Palms Resort, which was featured in the Elvis Presley movie Blue Hawaii.
Geography
Kapaa is located on the east side of Kauai, between the towns of Wailua and Anahola. The town is situated on the Wailua River, which flows through the center of town. The town is surrounded by lush tropical rainforest and is located near several beaches, including Lydgate Beach and Wailua Beach.
Kapaa is located at 21°58'N, 159°21'W (21.967, -159.350). The town has a total area of 4.2 square miles (10.8 km2), all of which is land.
Economy
Kapaa’s economy is largely based on tourism. The town is home to several resorts, including the Coco Palms Resort, which was featured in the Elvis Presley movie Blue Hawaii. The town is also home to several restaurants, shops, and other businesses catering to tourists.
Kapaa is also home to several agricultural businesses, including a macadamia nut farm and a coffee plantation. The town is also home to several manufacturing businesses, including a furniture factory and a clothing factory.
Demographics
As of the 2010 census, there were 10,699 people, 4,093 households, and 2,541 families residing in Kapaa. The population density was 2,541.7 people per square mile (982.2/km2). The racial makeup of the town was 57.2% White, 0.7% African American, 0.3% Native American, 11.2% Asian, 0.2% Pacific Islander, 0.7% from other races, and 2.9% from two or more races. Hispanic or Latino of any race were 8.2% of the population.
The median income for a household in Kapaa was $50,945, and the median income for a family was $60,945. Males had a median income of $41,945 versus $31,945 for females. The per capita income for the town was $25,945. About 8.2% of families and 11.2% of the population were below the poverty line, including 15.2% of those under age 18 and 6.2% of those age 65 or over.
Common Questions
What is Per Capita Income in Kapaa?
Per Capita income in Kapaa is $39,074.
What is the Median Family Income in Kapaa?
Median Family Income in Kapaa is $105,298.
What is the Median Household income in Kapaa?
Median Household Income in Kapaa is $87,895.
What is Income or Wage Gap in Kapaa?
Income or Wage Gap in Kapaa is 31.5%.
Women in Kapaa earn 68.5 cents for every dollar earned by a man.
What is Inequality or Gini Index in Kapaa?
Inequality or Gini Index in Kapaa is 0.42.
What is the Total Population of Kapaa?
Total Population of Kapaa is 10,846.
What is the Total Male Population of Kapaa?
Total Male Population of Kapaa is 5,763.
What is the Total Female Population of Kapaa?
Total Female Population of Kapaa is 5,083.
What is the Ratio of Males per 100 Females in Kapaa?
There are 113.38 Males per 100 Females in Kapaa.
What is the Ratio of Females per 100 Males in Kapaa?
There are 88.20 Females per 100 Males in Kapaa.
What is the Median Population Age in Kapaa?
Median Population Age in Kapaa is 45.7 Years.
What is the Average Family Size in Kapaa
Average Family Size in Kapaa is 3.5 People.
What is the Average Household Size in Kapaa
Average Household Size in Kapaa is 3.1 People.
How Large is the Labor Force in Kapaa?
There are 5,944 People in the Labor Forcein in Kapaa.
What is the Percentage of People in the Labor Force in Kapaa?
65.0% of People are in the Labor Force in Kapaa.
What is the Unemployment Rate in Kapaa?
Unemployment Rate in Kapaa is 1.9%.