Fort Chiswell, VA Map & Demographics
Fort Chiswell Map
Fort Chiswell Overview
$36,351
PER CAPITA INCOME
$83,475
AVG FAMILY INCOME
$69,700
AVG HOUSEHOLD INCOME
10.2%
WAGE / INCOME GAP [ % ]
89.8¢/ $1
WAGE / INCOME GAP [ $ ]
0.30
INEQUALITY / GINI INDEX
680
TOTAL POPULATION
347
MALE POPULATION
333
FEMALE POPULATION
104.20
MALES / 100 FEMALES
95.97
FEMALES / 100 MALES
49.1
MEDIAN AGE
2.7
AVG FAMILY SIZE
2.4
AVG HOUSEHOLD SIZE
421
LABOR FORCE [ PEOPLE ]
69.6%
PERCENT IN LABOR FORCE
Fort Chiswell Area Codes
Income in Fort Chiswell
Income Overview in Fort Chiswell
Per Capita Income in Fort Chiswell is $36,351, while median incomes of families and households are $83,475 and $69,700 respectively.
| Characteristic | Number | Measure |
| Per Capita Income | 680 | $36,351 |
| Median Family Income | 217 | $83,475 |
| Mean Family Income | 217 | $93,796 |
| Median Household Income | 280 | $69,700 |
| Mean Household Income | 280 | $83,659 |
| Income Deficit | 217 | $0 |
| Wage / Income Gap (%) | 680 | 10.23% |
| Wage / Income Gap ($) | 680 | 89.77¢ per $1 |
| Gini / Inequality Index | 680 | 0.30 |
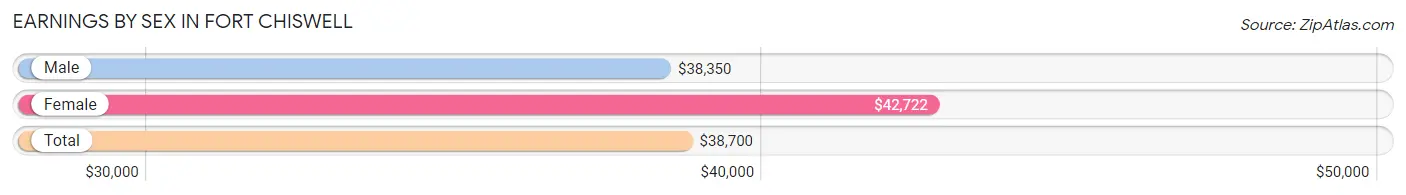
Earnings by Sex in Fort Chiswell
Average Earnings in Fort Chiswell are $38,700, $38,350 for men and $42,722 for women, a difference of 10.2%.
| Sex | Number | Average Earnings |
| Male | 216 (49.1%) | $38,350 |
| Female | 224 (50.9%) | $42,722 |
| Total | 440 (100.0%) | $38,700 |
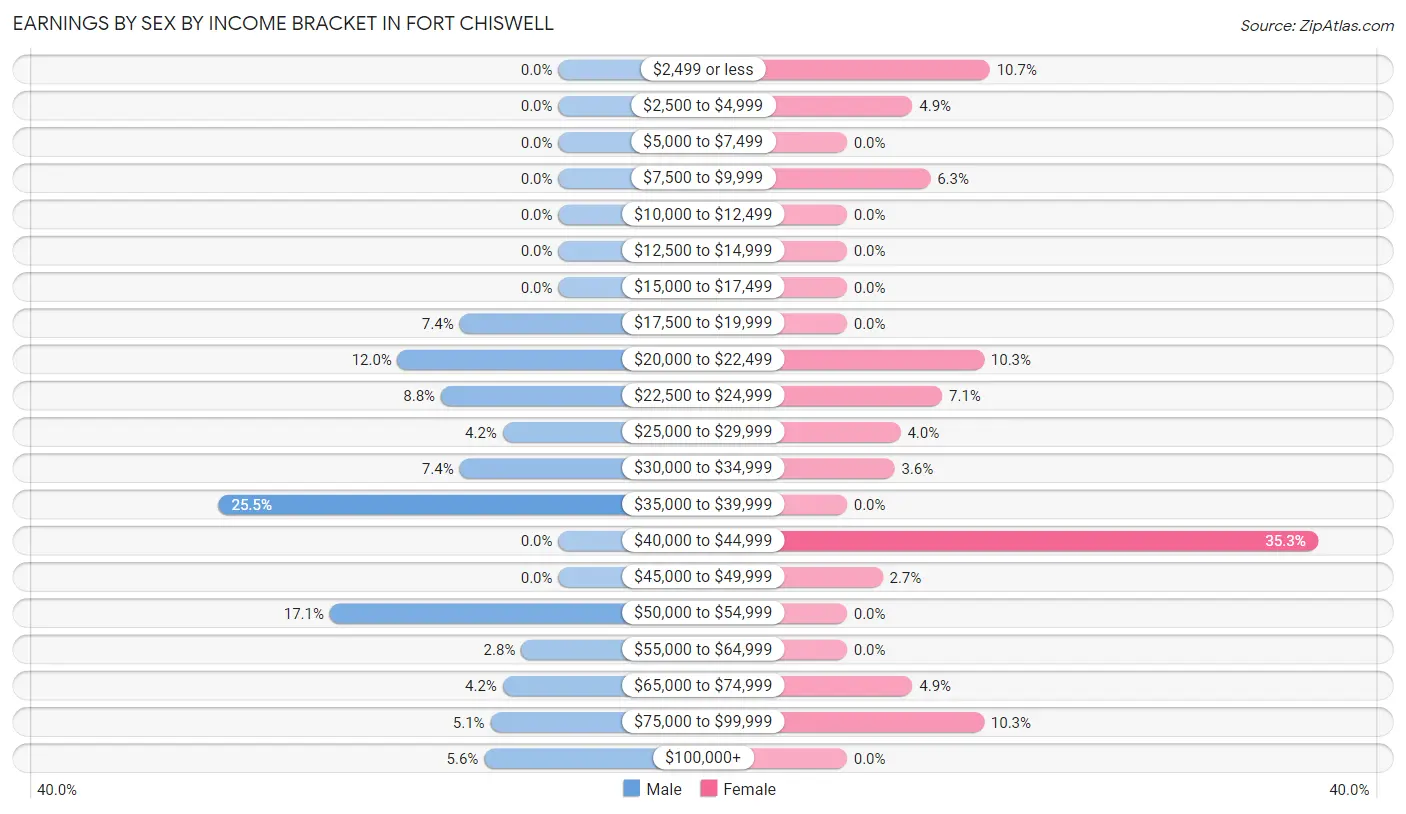
Earnings by Sex by Income Bracket in Fort Chiswell
The most common earnings brackets in Fort Chiswell are $35,000 to $39,999 for men (55 | 25.5%) and $40,000 to $44,999 for women (79 | 35.3%).
| Income | Male | Female |
| $2,499 or less | 0 (0.0%) | 24 (10.7%) |
| $2,500 to $4,999 | 0 (0.0%) | 11 (4.9%) |
| $5,000 to $7,499 | 0 (0.0%) | 0 (0.0%) |
| $7,500 to $9,999 | 0 (0.0%) | 14 (6.2%) |
| $10,000 to $12,499 | 0 (0.0%) | 0 (0.0%) |
| $12,500 to $14,999 | 0 (0.0%) | 0 (0.0%) |
| $15,000 to $17,499 | 0 (0.0%) | 0 (0.0%) |
| $17,500 to $19,999 | 16 (7.4%) | 0 (0.0%) |
| $20,000 to $22,499 | 26 (12.0%) | 23 (10.3%) |
| $22,500 to $24,999 | 19 (8.8%) | 16 (7.1%) |
| $25,000 to $29,999 | 9 (4.2%) | 9 (4.0%) |
| $30,000 to $34,999 | 16 (7.4%) | 8 (3.6%) |
| $35,000 to $39,999 | 55 (25.5%) | 0 (0.0%) |
| $40,000 to $44,999 | 0 (0.0%) | 79 (35.3%) |
| $45,000 to $49,999 | 0 (0.0%) | 6 (2.7%) |
| $50,000 to $54,999 | 37 (17.1%) | 0 (0.0%) |
| $55,000 to $64,999 | 6 (2.8%) | 0 (0.0%) |
| $65,000 to $74,999 | 9 (4.2%) | 11 (4.9%) |
| $75,000 to $99,999 | 11 (5.1%) | 23 (10.3%) |
| $100,000+ | 12 (5.6%) | 0 (0.0%) |
| Total | 216 (100.0%) | 224 (100.0%) |
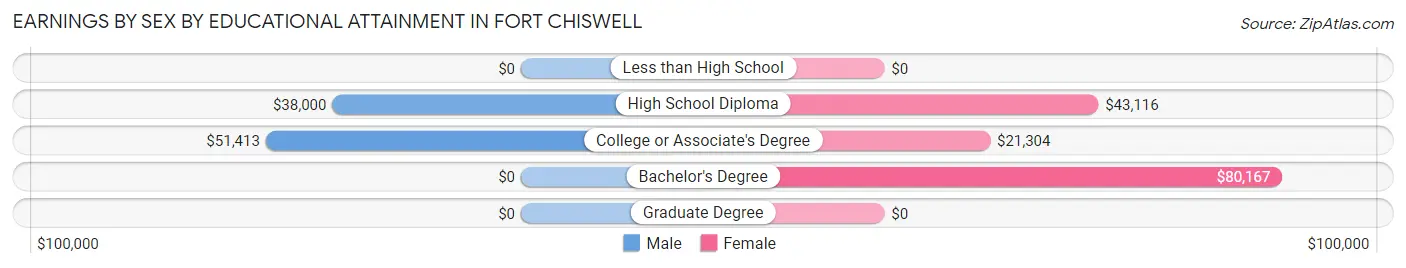
Earnings by Sex by Educational Attainment in Fort Chiswell
Average earnings in Fort Chiswell are $38,950 for men and $43,101 for women, a difference of 9.6%. Men with an educational attainment of college or associate's degree enjoy the highest average annual earnings of $51,413, while those with high school diploma education earn the least with $38,000. Women with an educational attainment of bachelor's degree earn the most with the average annual earnings of $80,167, while those with college or associate's degree education have the smallest earnings of $21,304.
| Educational Attainment | Male Income | Female Income |
| Less than High School | - | - |
| High School Diploma | $38,000 | $43,116 |
| College or Associate's Degree | $51,413 | $21,304 |
| Bachelor's Degree | - | - |
| Graduate Degree | - | - |
| Total | $38,950 | $43,101 |
Family Income in Fort Chiswell
Family Income Brackets in Fort Chiswell
According to the Fort Chiswell family income data, there are 64 families falling into the $50,000 to $74,999 income range, which is the most common income bracket and makes up 29.5% of all families.
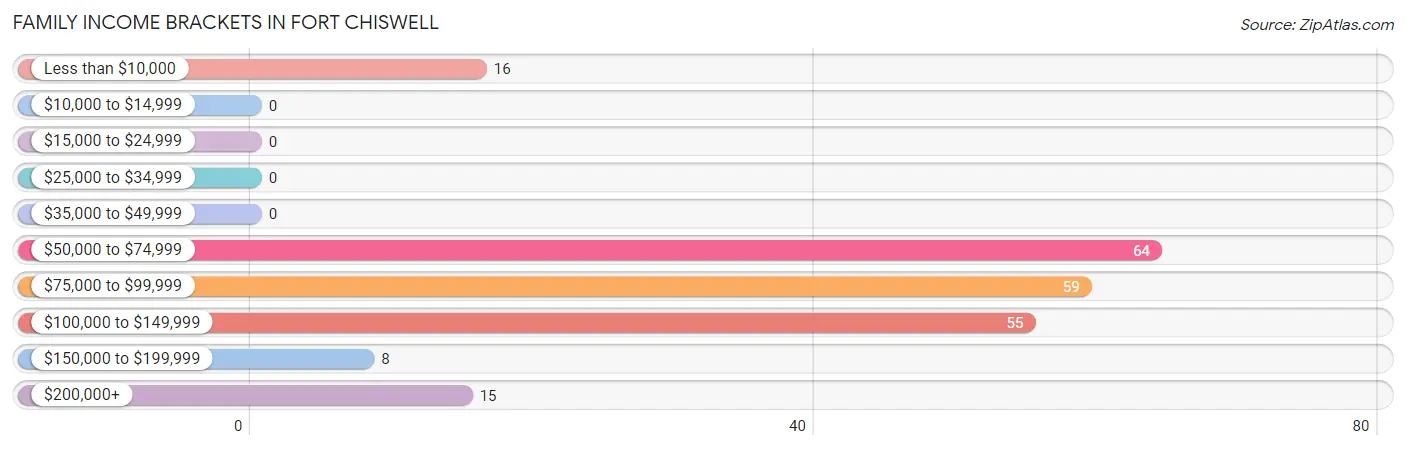
| Income Bracket | # Families | % Families |
| Less than $10,000 | 16 | 7.4% |
| $10,000 to $14,999 | 0 | 0.0% |
| $15,000 to $24,999 | 0 | 0.0% |
| $25,000 to $34,999 | 0 | 0.0% |
| $35,000 to $49,999 | 0 | 0.0% |
| $50,000 to $74,999 | 64 | 29.5% |
| $75,000 to $99,999 | 59 | 27.2% |
| $100,000 to $149,999 | 55 | 25.3% |
| $150,000 to $199,999 | 8 | 3.7% |
| $200,000+ | 15 | 6.9% |
Family Income by Famaliy Size in Fort Chiswell
2-person families (126 | 58.1%) account for the highest median family income in Fort Chiswell with $83,500 per family, while 2-person families (126 | 58.1%) have the highest median income of $41,750 per family member.
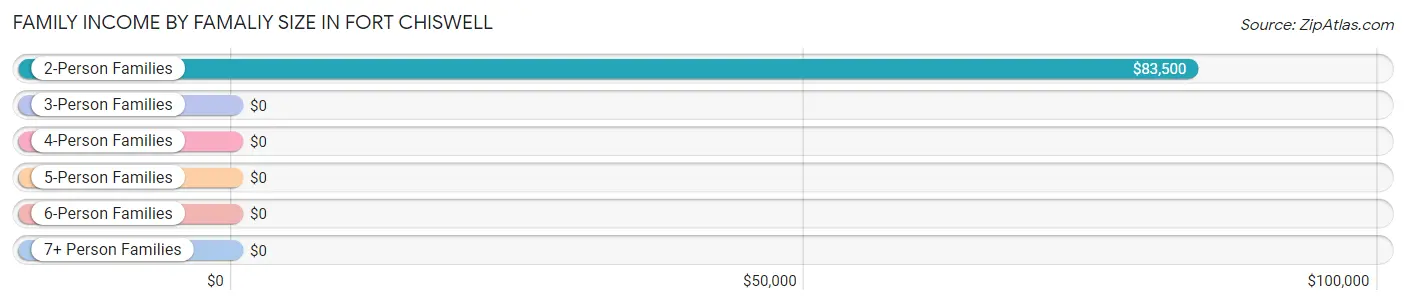
| Income Bracket | # Families | Median Income |
| 2-Person Families | 126 (58.1%) | $83,500 |
| 3-Person Families | 65 (29.9%) | $0 |
| 4-Person Families | 20 (9.2%) | $0 |
| 5-Person Families | 6 (2.8%) | $0 |
| 6-Person Families | 0 (0.0%) | $0 |
| 7+ Person Families | 0 (0.0%) | $0 |
| Total | 217 (100.0%) | $83,475 |
Family Income by Number of Earners in Fort Chiswell
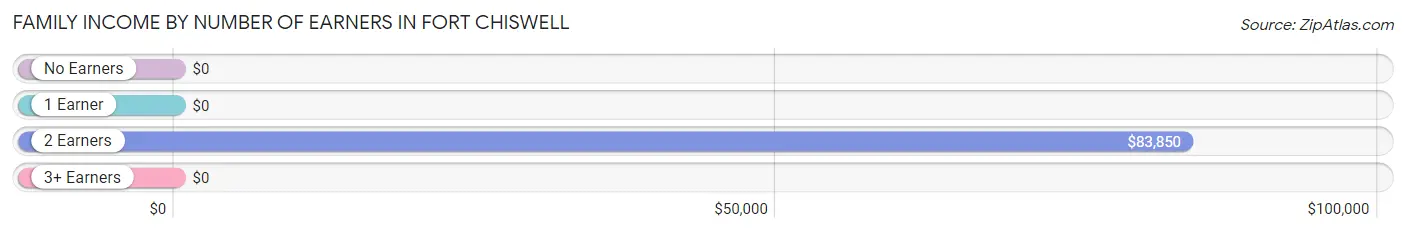
| Number of Earners | # Families | Median Income |
| No Earners | 16 (7.4%) | $0 |
| 1 Earner | 61 (28.1%) | $0 |
| 2 Earners | 134 (61.8%) | $83,850 |
| 3+ Earners | 6 (2.8%) | $0 |
| Total | 217 (100.0%) | $83,475 |
Household Income in Fort Chiswell
Household Income Brackets in Fort Chiswell
With 102 households falling in the category, the $50,000 to $74,999 income range is the most frequent in Fort Chiswell, accounting for 36.4% of all households.
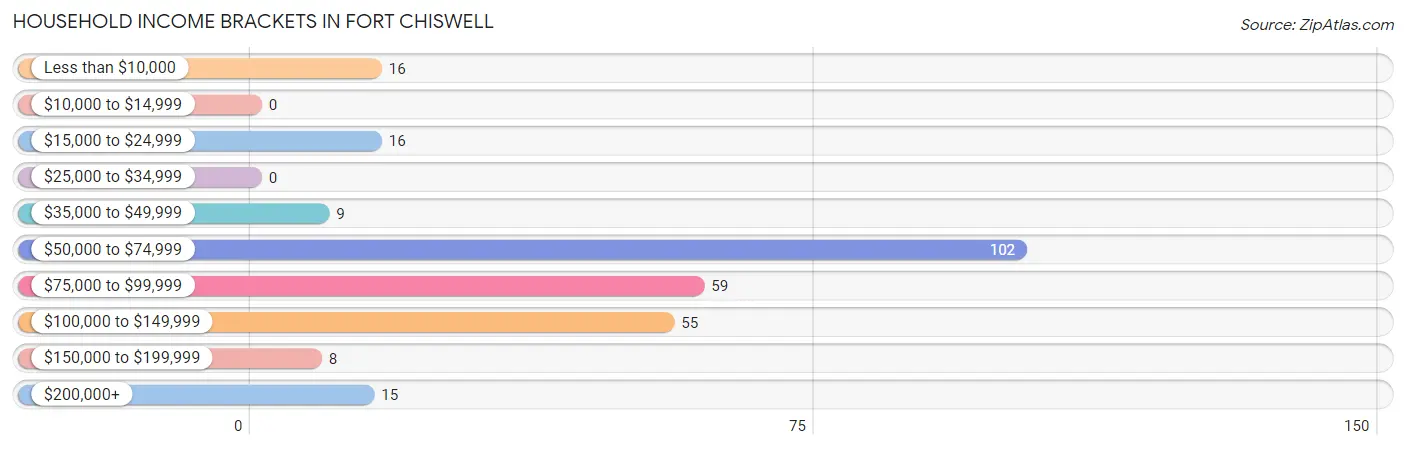
| Income Bracket | # Households | % Households |
| Less than $10,000 | 16 | 5.7% |
| $10,000 to $14,999 | 0 | 0.0% |
| $15,000 to $24,999 | 16 | 5.7% |
| $25,000 to $34,999 | 0 | 0.0% |
| $35,000 to $49,999 | 9 | 3.2% |
| $50,000 to $74,999 | 102 | 36.4% |
| $75,000 to $99,999 | 59 | 21.1% |
| $100,000 to $149,999 | 55 | 19.6% |
| $150,000 to $199,999 | 8 | 2.9% |
| $200,000+ | 15 | 5.4% |
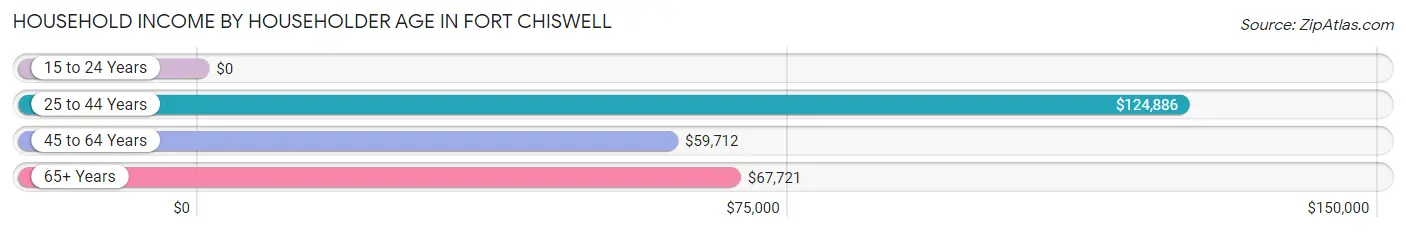
Household Income by Householder Age in Fort Chiswell
The median household income in Fort Chiswell is $69,700, with the highest median household income of $124,886 found in the 25 to 44 years age bracket for the primary householder. A total of 43 households (15.4%) fall into this category. Meanwhile, the 15 to 24 years age bracket for the primary householder has the lowest median household income of $0, with 8 households (2.9%) in this group.
| Income Bracket | # Households | Median Income |
| 15 to 24 Years | 8 (2.9%) | $0 |
| 25 to 44 Years | 43 (15.4%) | $124,886 |
| 45 to 64 Years | 142 (50.7%) | $59,712 |
| 65+ Years | 87 (31.1%) | $67,721 |
| Total | 280 (100.0%) | $69,700 |
Poverty in Fort Chiswell
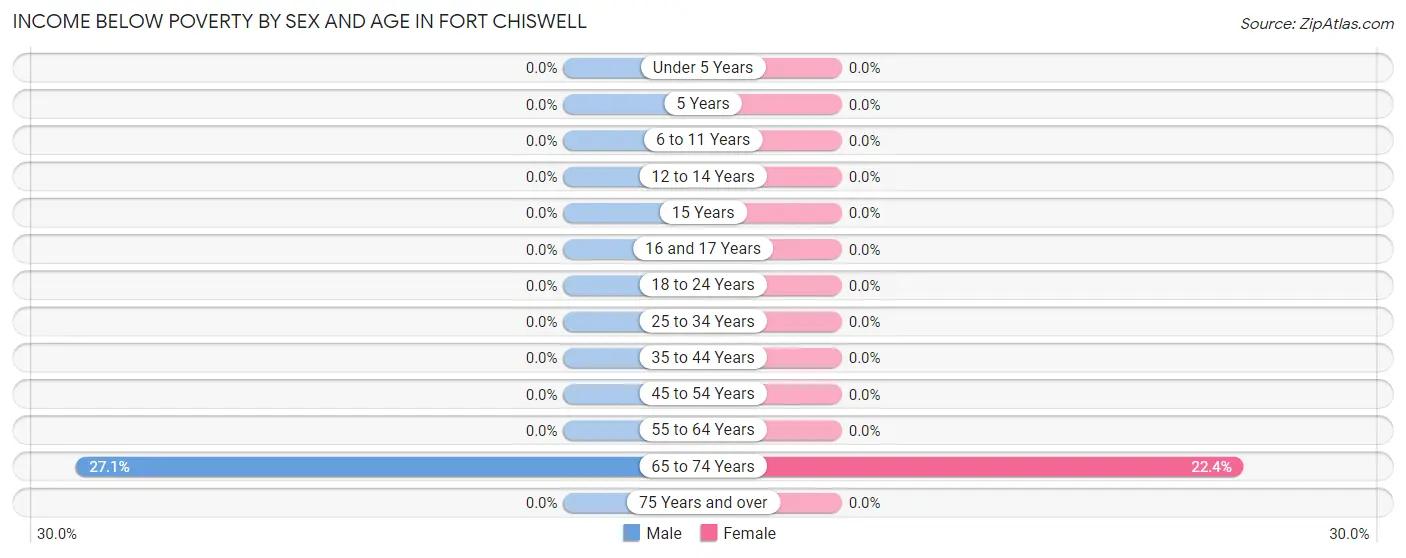
Income Below Poverty by Sex and Age in Fort Chiswell
With 4.6% poverty level for males and 5.3% for females among the residents of Fort Chiswell, 65 to 74 year old males and 65 to 74 year old females are the most vulnerable to poverty, with 16 males (27.1%) and 17 females (22.4%) in their respective age groups living below the poverty level.
| Age Bracket | Male | Female |
| Under 5 Years | 0 (0.0%) | 0 (0.0%) |
| 5 Years | 0 (0.0%) | 0 (0.0%) |
| 6 to 11 Years | 0 (0.0%) | 0 (0.0%) |
| 12 to 14 Years | 0 (0.0%) | 0 (0.0%) |
| 15 Years | 0 (0.0%) | 0 (0.0%) |
| 16 and 17 Years | 0 (0.0%) | 0 (0.0%) |
| 18 to 24 Years | 0 (0.0%) | 0 (0.0%) |
| 25 to 34 Years | 0 (0.0%) | 0 (0.0%) |
| 35 to 44 Years | 0 (0.0%) | 0 (0.0%) |
| 45 to 54 Years | 0 (0.0%) | 0 (0.0%) |
| 55 to 64 Years | 0 (0.0%) | 0 (0.0%) |
| 65 to 74 Years | 16 (27.1%) | 17 (22.4%) |
| 75 Years and over | 0 (0.0%) | 0 (0.0%) |
| Total | 16 (4.6%) | 17 (5.3%) |
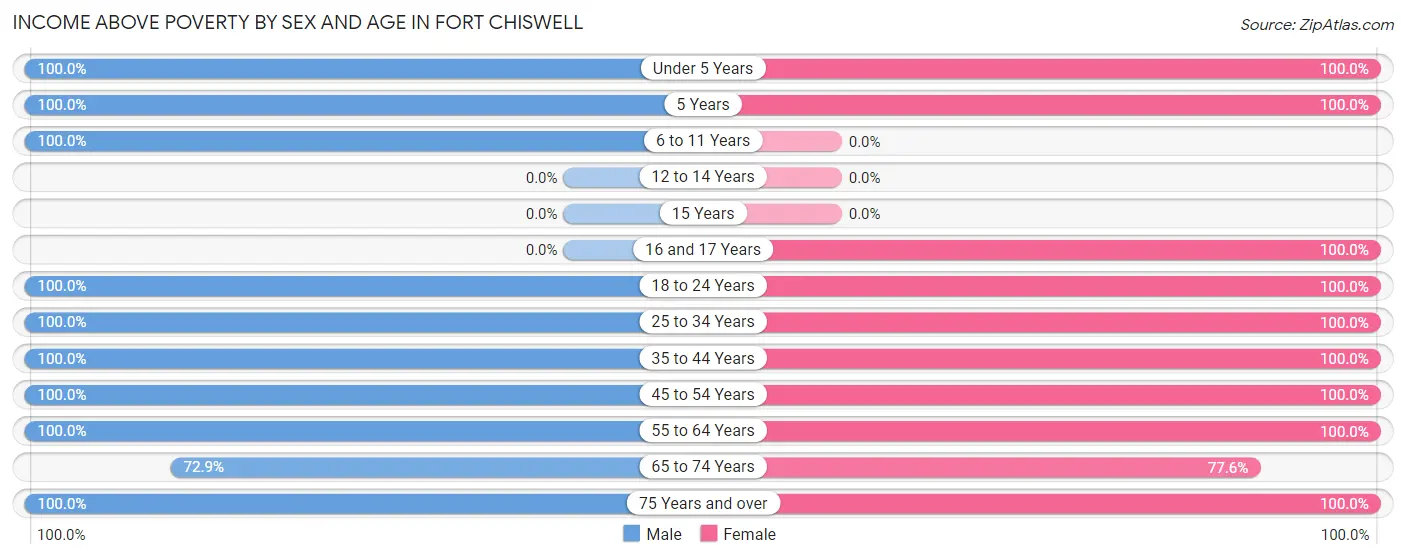
Income Above Poverty by Sex and Age in Fort Chiswell
According to the poverty statistics in Fort Chiswell, males aged under 5 years and females aged under 5 years are the age groups that are most secure financially, with 100.0% of males and 100.0% of females in these age groups living above the poverty line.
| Age Bracket | Male | Female |
| Under 5 Years | 15 (100.0%) | 12 (100.0%) |
| 5 Years | 14 (100.0%) | 7 (100.0%) |
| 6 to 11 Years | 15 (100.0%) | 0 (0.0%) |
| 12 to 14 Years | 0 (0.0%) | 0 (0.0%) |
| 15 Years | 0 (0.0%) | 0 (0.0%) |
| 16 and 17 Years | 0 (0.0%) | 10 (100.0%) |
| 18 to 24 Years | 24 (100.0%) | 14 (100.0%) |
| 25 to 34 Years | 12 (100.0%) | 44 (100.0%) |
| 35 to 44 Years | 31 (100.0%) | 75 (100.0%) |
| 45 to 54 Years | 115 (100.0%) | 33 (100.0%) |
| 55 to 64 Years | 34 (100.0%) | 40 (100.0%) |
| 65 to 74 Years | 43 (72.9%) | 59 (77.6%) |
| 75 Years and over | 28 (100.0%) | 10 (100.0%) |
| Total | 331 (95.4%) | 304 (94.7%) |
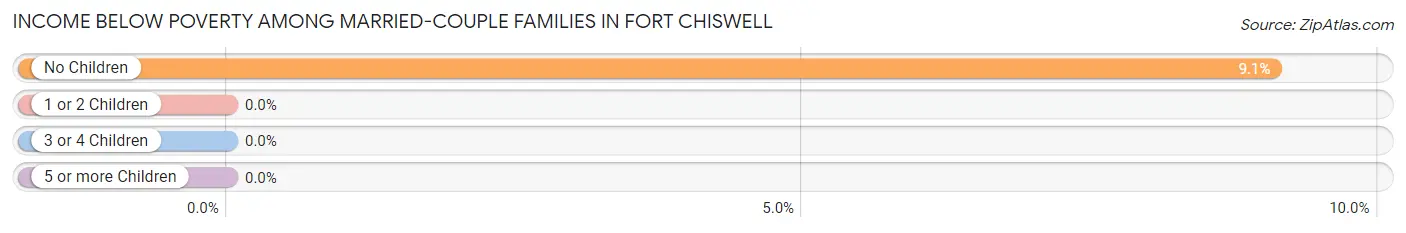
Income Below Poverty Among Married-Couple Families in Fort Chiswell
The poverty statistics for married-couple families in Fort Chiswell show that 7.4% or 16 of the total 217 families live below the poverty line. Families with no children have the highest poverty rate of 9.1%, comprising of 16 families. On the other hand, families with 1 or 2 children have the lowest poverty rate of 0.0%, which includes 0 families.
| Children | Above Poverty | Below Poverty |
| No Children | 160 (90.9%) | 16 (9.1%) |
| 1 or 2 Children | 41 (100.0%) | 0 (0.0%) |
| 3 or 4 Children | 0 (0.0%) | 0 (0.0%) |
| 5 or more Children | 0 (0.0%) | 0 (0.0%) |
| Total | 201 (92.6%) | 16 (7.4%) |
Income Below Poverty Among Single-Parent Households in Fort Chiswell
| Children | Single Father | Single Mother |
| No Children | 0 (0.0%) | 0 (0.0%) |
| 1 or 2 Children | 0 (0.0%) | 0 (0.0%) |
| 3 or 4 Children | 0 (0.0%) | 0 (0.0%) |
| 5 or more Children | 0 (0.0%) | 0 (0.0%) |
| Total | 0 (0.0%) | 0 (0.0%) |
Income Below Poverty Among Married-Couple vs Single-Parent Households in Fort Chiswell
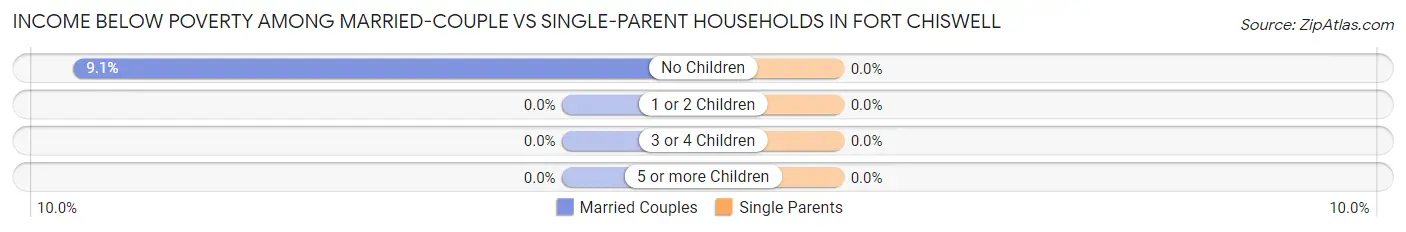
| Children | Married-Couple Families | Single-Parent Households |
| No Children | 16 (9.1%) | 0 (0.0%) |
| 1 or 2 Children | 0 (0.0%) | 0 (0.0%) |
| 3 or 4 Children | 0 (0.0%) | 0 (0.0%) |
| 5 or more Children | 0 (0.0%) | 0 (0.0%) |
| Total | 16 (7.4%) | 0 (0.0%) |
Race in Fort Chiswell
The most populous races in Fort Chiswell are , and White / Caucasian (680 | 100.0%).
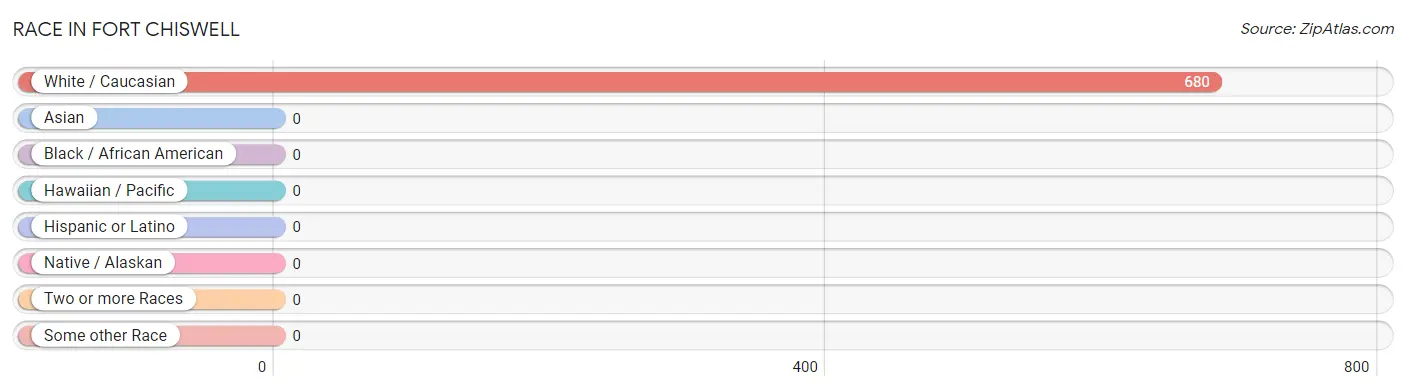
| Race | # Population | % Population |
| Asian | 0 | 0.0% |
| Black / African American | 0 | 0.0% |
| Hawaiian / Pacific | 0 | 0.0% |
| Hispanic or Latino | 0 | 0.0% |
| Native / Alaskan | 0 | 0.0% |
| White / Caucasian | 680 | 100.0% |
| Two or more Races | 0 | 0.0% |
| Some other Race | 0 | 0.0% |
| Total | 680 | 100.0% |
Ancestry in Fort Chiswell
The most populous ancestries reported in Fort Chiswell are German (155 | 22.8%), Irish (85 | 12.5%), American (76 | 11.2%), English (64 | 9.4%), and European (30 | 4.4%), together accounting for 60.3% of all Fort Chiswell residents.
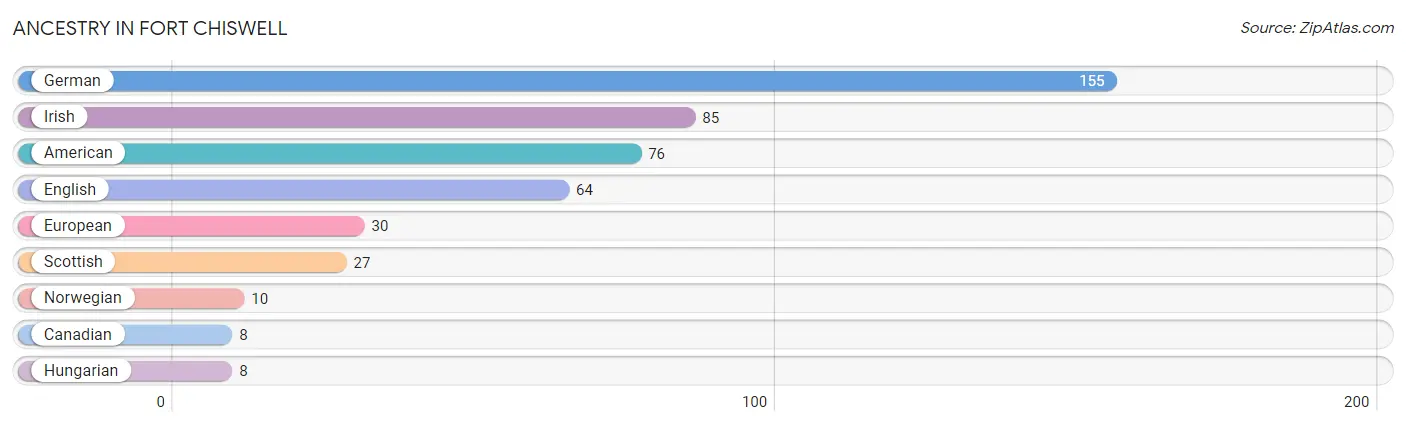
| Ancestry | # Population | % Population |
| American | 76 | 11.2% |
| Canadian | 8 | 1.2% |
| English | 64 | 9.4% |
| European | 30 | 4.4% |
| German | 155 | 22.8% |
| Hungarian | 8 | 1.2% |
| Irish | 85 | 12.5% |
| Norwegian | 10 | 1.5% |
| Scottish | 27 | 4.0% | View All 9 Rows |
Immigrants in Fort Chiswell

| Immigration Origin | # Population | % Population | View All 0 Rows |
Sex and Age in Fort Chiswell
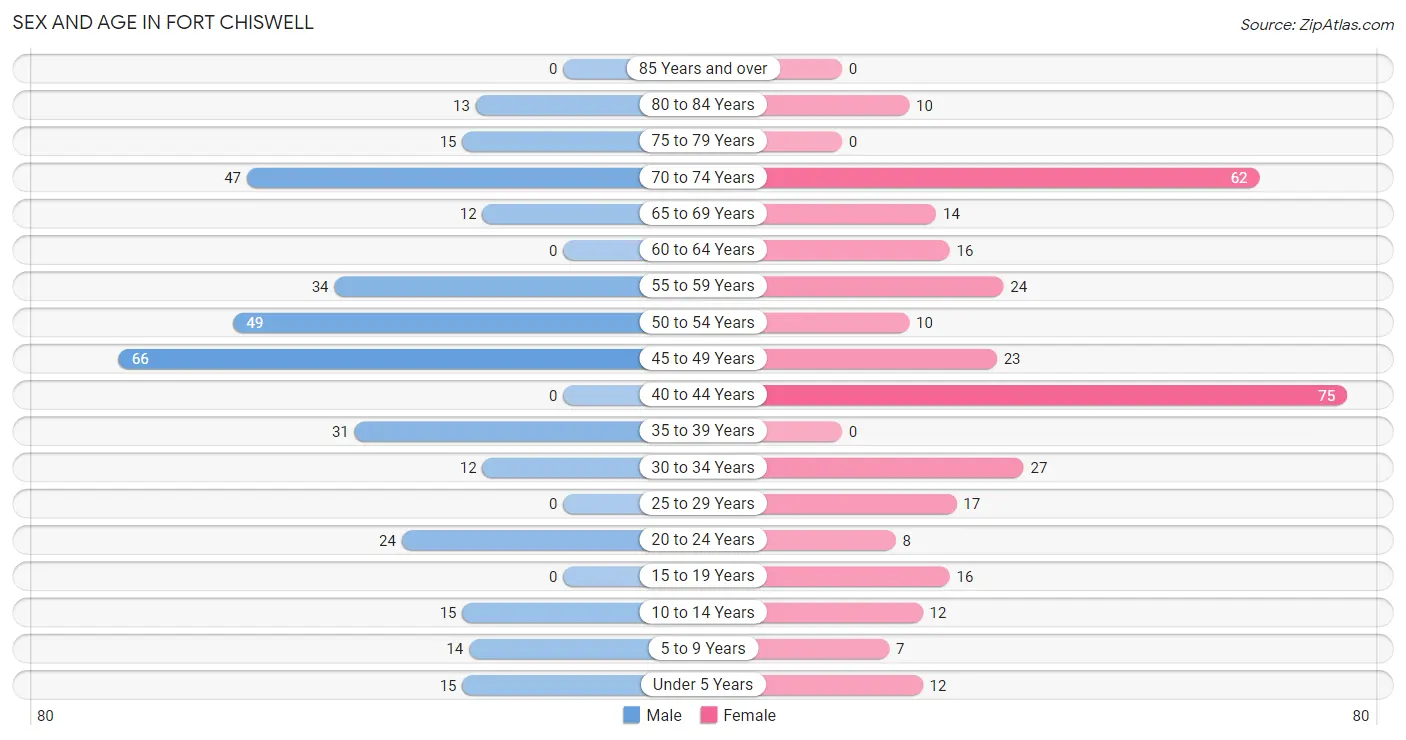
Sex and Age in Fort Chiswell
The most populous age groups in Fort Chiswell are 45 to 49 Years (66 | 19.0%) for men and 40 to 44 Years (75 | 22.5%) for women.
| Age Bracket | Male | Female |
| Under 5 Years | 15 (4.3%) | 12 (3.6%) |
| 5 to 9 Years | 14 (4.0%) | 7 (2.1%) |
| 10 to 14 Years | 15 (4.3%) | 12 (3.6%) |
| 15 to 19 Years | 0 (0.0%) | 16 (4.8%) |
| 20 to 24 Years | 24 (6.9%) | 8 (2.4%) |
| 25 to 29 Years | 0 (0.0%) | 17 (5.1%) |
| 30 to 34 Years | 12 (3.5%) | 27 (8.1%) |
| 35 to 39 Years | 31 (8.9%) | 0 (0.0%) |
| 40 to 44 Years | 0 (0.0%) | 75 (22.5%) |
| 45 to 49 Years | 66 (19.0%) | 23 (6.9%) |
| 50 to 54 Years | 49 (14.1%) | 10 (3.0%) |
| 55 to 59 Years | 34 (9.8%) | 24 (7.2%) |
| 60 to 64 Years | 0 (0.0%) | 16 (4.8%) |
| 65 to 69 Years | 12 (3.5%) | 14 (4.2%) |
| 70 to 74 Years | 47 (13.5%) | 62 (18.6%) |
| 75 to 79 Years | 15 (4.3%) | 0 (0.0%) |
| 80 to 84 Years | 13 (3.7%) | 10 (3.0%) |
| 85 Years and over | 0 (0.0%) | 0 (0.0%) |
| Total | 347 (100.0%) | 333 (100.0%) |
Families and Households in Fort Chiswell
Median Family Size in Fort Chiswell
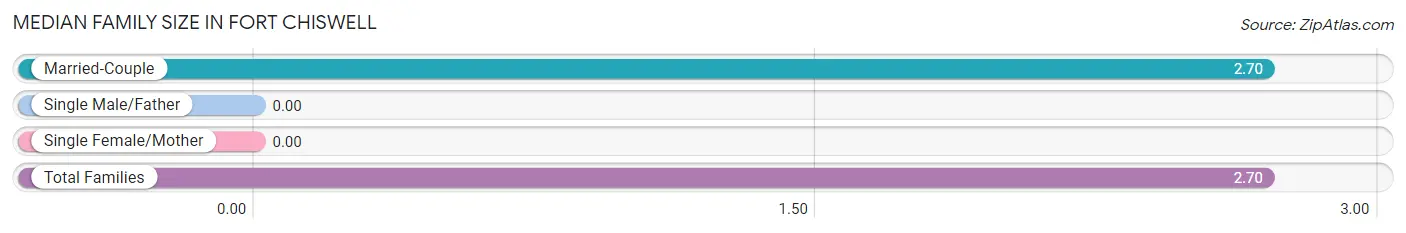
| Family Type | # Families | Family Size |
| Married-Couple | 217 (100.0%) | 2.70 |
| Single Male/Father | 0 (0.0%) | - |
| Single Female/Mother | 0 (0.0%) | - |
| Total Families | 217 (100.0%) | 2.70 |
Median Household Size in Fort Chiswell
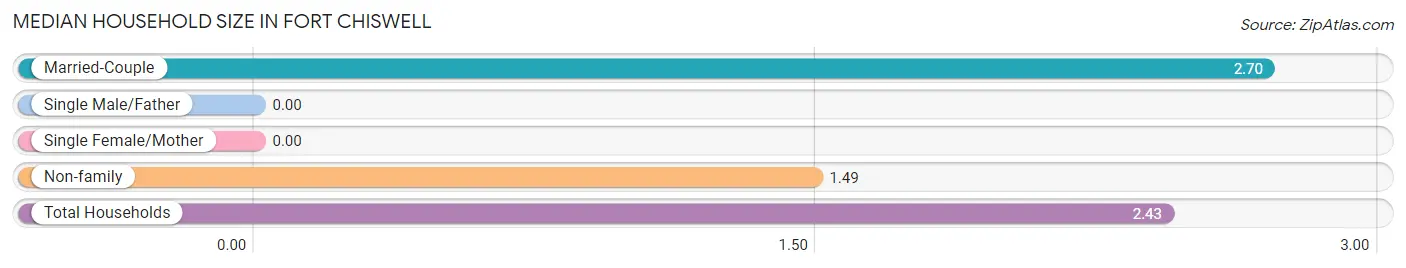
| Household Type | # Households | Household Size |
| Married-Couple | 217 (77.5%) | 2.70 |
| Single Male/Father | 0 (0.0%) | - |
| Single Female/Mother | 0 (0.0%) | - |
| Non-family | 63 (22.5%) | 1.49 |
| Total Households | 280 (100.0%) | 2.43 |
Household Size by Marriage Status in Fort Chiswell
Out of a total of 280 households in Fort Chiswell, 217 (77.5%) are family households, while 63 (22.5%) are nonfamily households. The most numerous type of family households are 2-person households, comprising 126, and the most common type of nonfamily households are 1-person households, comprising 42.
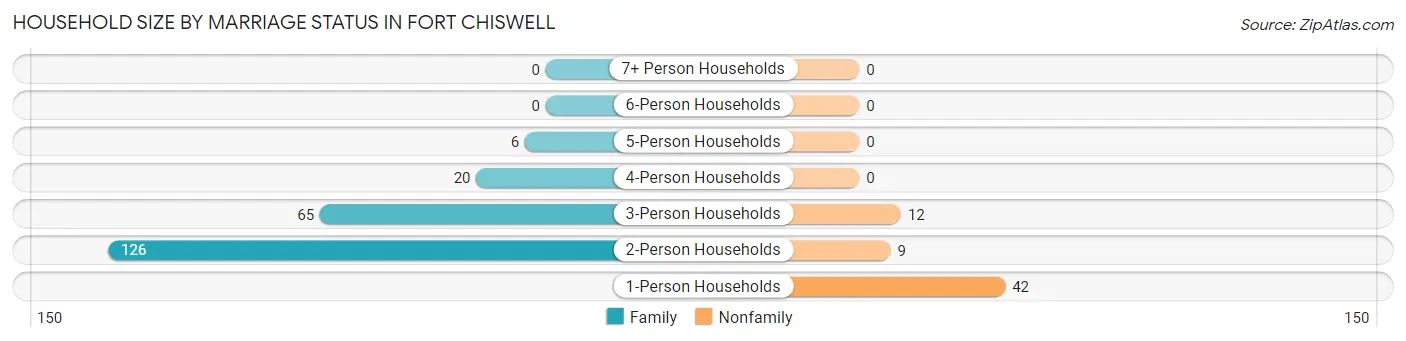
| Household Size | Family Households | Nonfamily Households |
| 1-Person Households | - | 42 (15.0%) |
| 2-Person Households | 126 (45.0%) | 9 (3.2%) |
| 3-Person Households | 65 (23.2%) | 12 (4.3%) |
| 4-Person Households | 20 (7.1%) | 0 (0.0%) |
| 5-Person Households | 6 (2.1%) | 0 (0.0%) |
| 6-Person Households | 0 (0.0%) | 0 (0.0%) |
| 7+ Person Households | 0 (0.0%) | 0 (0.0%) |
| Total | 217 (77.5%) | 63 (22.5%) |
Female Fertility in Fort Chiswell
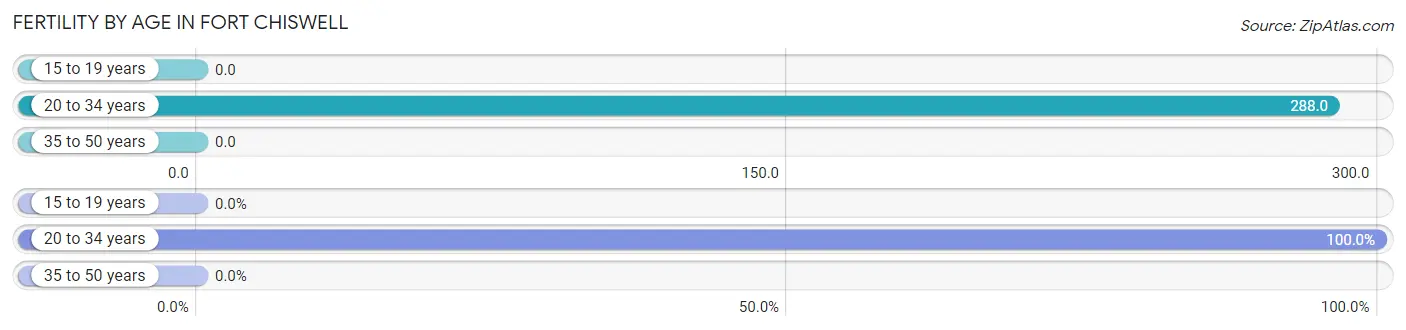
Fertility by Age in Fort Chiswell
Average fertility rate in Fort Chiswell is 90.0 births per 1,000 women. Women in the age bracket of 20 to 34 years have the highest fertility rate with 288.0 births per 1,000 women. Women in the age bracket of 20 to 34 years acount for 100.0% of all women with births.
| Age Bracket | Women with Births | Births / 1,000 Women |
| 15 to 19 years | 0 (0.0%) | 0.0 |
| 20 to 34 years | 15 (100.0%) | 288.0 |
| 35 to 50 years | 0 (0.0%) | 0.0 |
| Total | 15 (100.0%) | 90.0 |
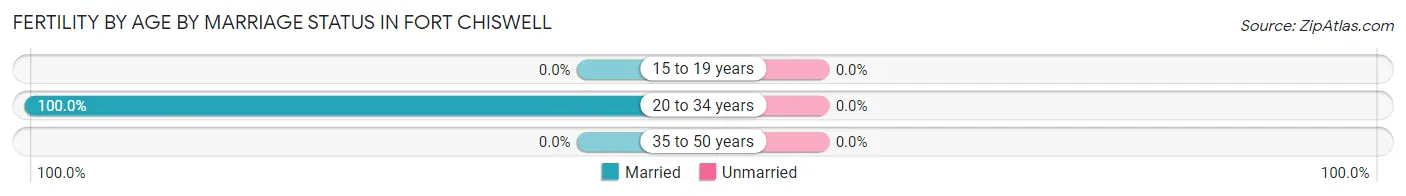
Fertility by Age by Marriage Status in Fort Chiswell
| Age Bracket | Married | Unmarried |
| 15 to 19 years | 0 (0.0%) | 0 (0.0%) |
| 20 to 34 years | 15 (100.0%) | 0 (0.0%) |
| 35 to 50 years | 0 (0.0%) | 0 (0.0%) |
| Total | 15 (100.0%) | 0 (0.0%) |
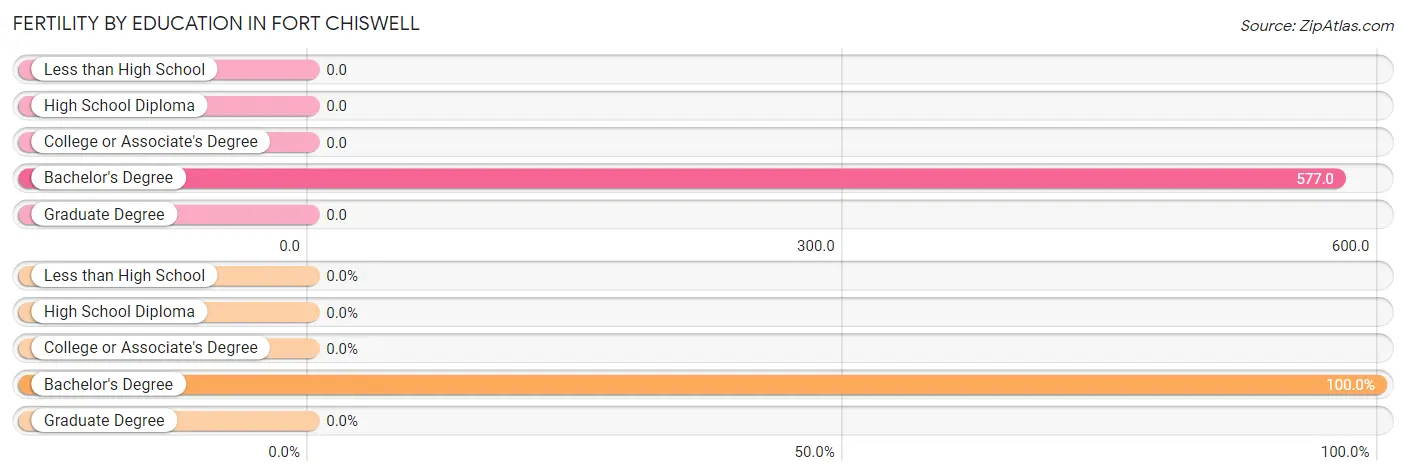
Fertility by Education in Fort Chiswell
| Educational Attainment | Women with Births | Births / 1,000 Women |
| Less than High School | 0 (0.0%) | 0.0 |
| High School Diploma | 0 (0.0%) | 0.0 |
| College or Associate's Degree | 0 (0.0%) | 0.0 |
| Bachelor's Degree | 15 (100.0%) | 577.0 |
| Graduate Degree | 0 (0.0%) | 0.0 |
| Total | 15 (100.0%) | 90.0 |
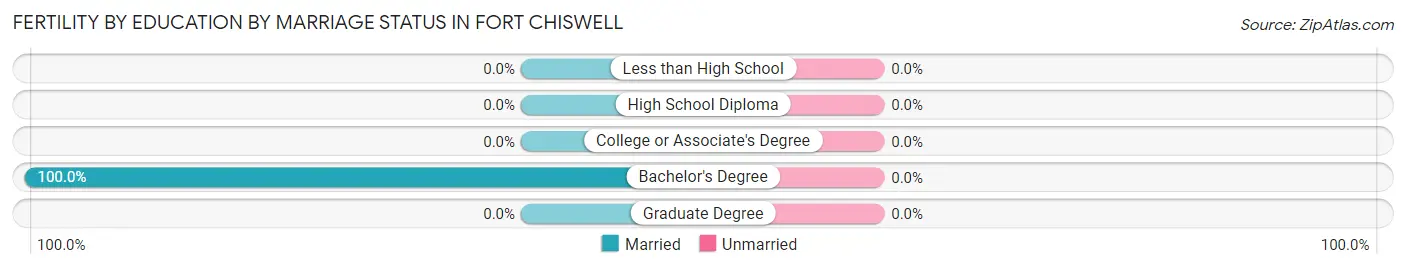
Fertility by Education by Marriage Status in Fort Chiswell
| Educational Attainment | Married | Unmarried |
| Less than High School | 0 (0.0%) | 0 (0.0%) |
| High School Diploma | 0 (0.0%) | 0 (0.0%) |
| College or Associate's Degree | 0 (0.0%) | 0 (0.0%) |
| Bachelor's Degree | 15 (100.0%) | 0 (0.0%) |
| Graduate Degree | 0 (0.0%) | 0 (0.0%) |
| Total | 15 (100.0%) | 0 (0.0%) |
Employment Characteristics in Fort Chiswell
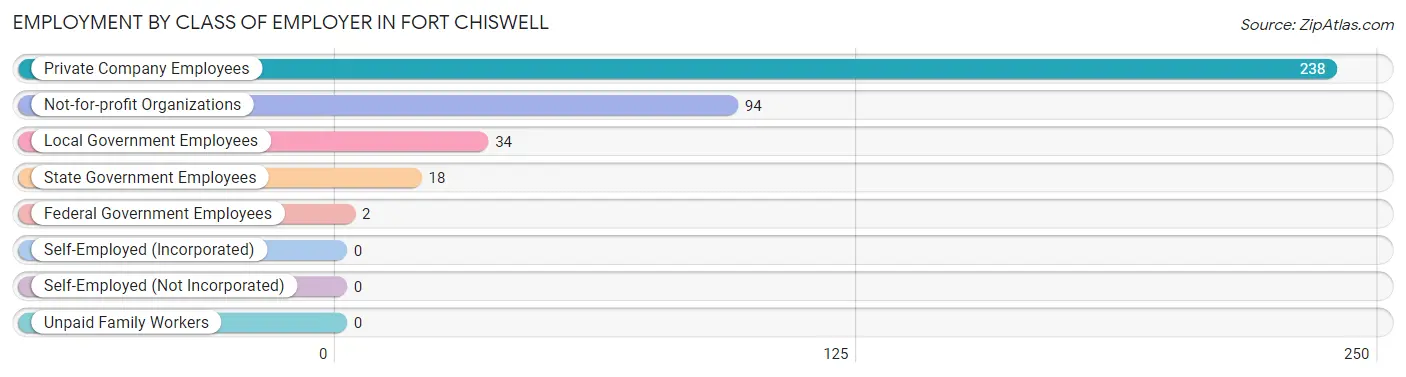
Employment by Class of Employer in Fort Chiswell
Among the 386 employed individuals in Fort Chiswell, private company employees (238 | 61.7%), not-for-profit organizations (94 | 24.3%), and local government employees (34 | 8.8%) make up the most common classes of employment.
| Employer Class | # Employees | % Employees |
| Private Company Employees | 238 | 61.7% |
| Self-Employed (Incorporated) | 0 | 0.0% |
| Self-Employed (Not Incorporated) | 0 | 0.0% |
| Not-for-profit Organizations | 94 | 24.3% |
| Local Government Employees | 34 | 8.8% |
| State Government Employees | 18 | 4.7% |
| Federal Government Employees | 2 | 0.5% |
| Unpaid Family Workers | 0 | 0.0% |
| Total | 386 | 100.0% |
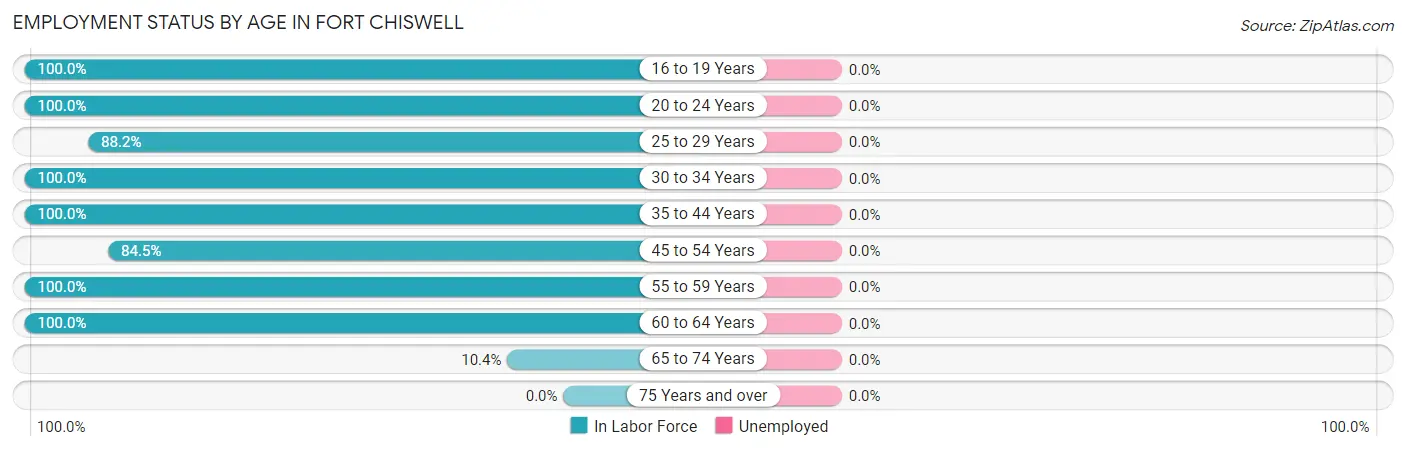
Employment Status by Age in Fort Chiswell
| Age Bracket | In Labor Force | Unemployed |
| 16 to 19 Years | 16 (100.0%) | 0 (0.0%) |
| 20 to 24 Years | 32 (100.0%) | 0 (0.0%) |
| 25 to 29 Years | 15 (88.2%) | 0 (0.0%) |
| 30 to 34 Years | 39 (100.0%) | 0 (0.0%) |
| 35 to 44 Years | 106 (100.0%) | 0 (0.0%) |
| 45 to 54 Years | 125 (84.5%) | 0 (0.0%) |
| 55 to 59 Years | 58 (100.0%) | 0 (0.0%) |
| 60 to 64 Years | 16 (100.0%) | 0 (0.0%) |
| 65 to 74 Years | 14 (10.4%) | 0 (0.0%) |
| 75 Years and over | 0 (0.0%) | 0 (0.0%) |
| Total | 421 (69.6%) | 0 (0.0%) |
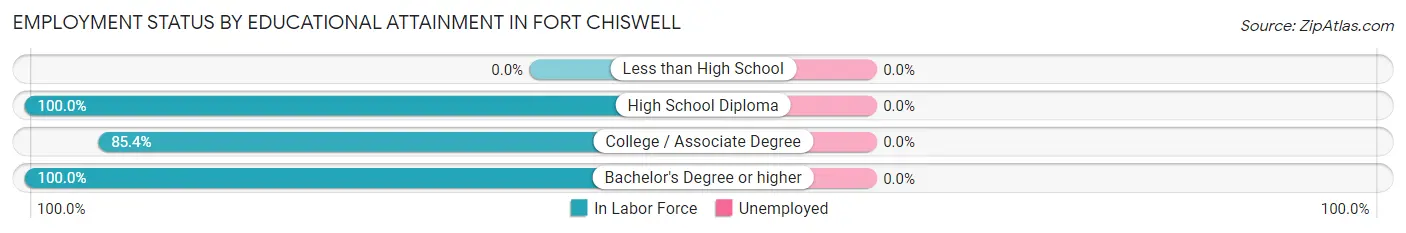
Employment Status by Educational Attainment in Fort Chiswell
| Educational Attainment | In Labor Force | Unemployed |
| Less than High School | 0 (0.0%) | 0 (0.0%) |
| High School Diploma | 169 (100.0%) | 0 (0.0%) |
| College / Associate Degree | 134 (85.4%) | 0 (0.0%) |
| Bachelor's Degree or higher | 56 (100.0%) | 0 (0.0%) |
| Total | 359 (93.5%) | 0 (0.0%) |
Employment Occupations by Sex in Fort Chiswell
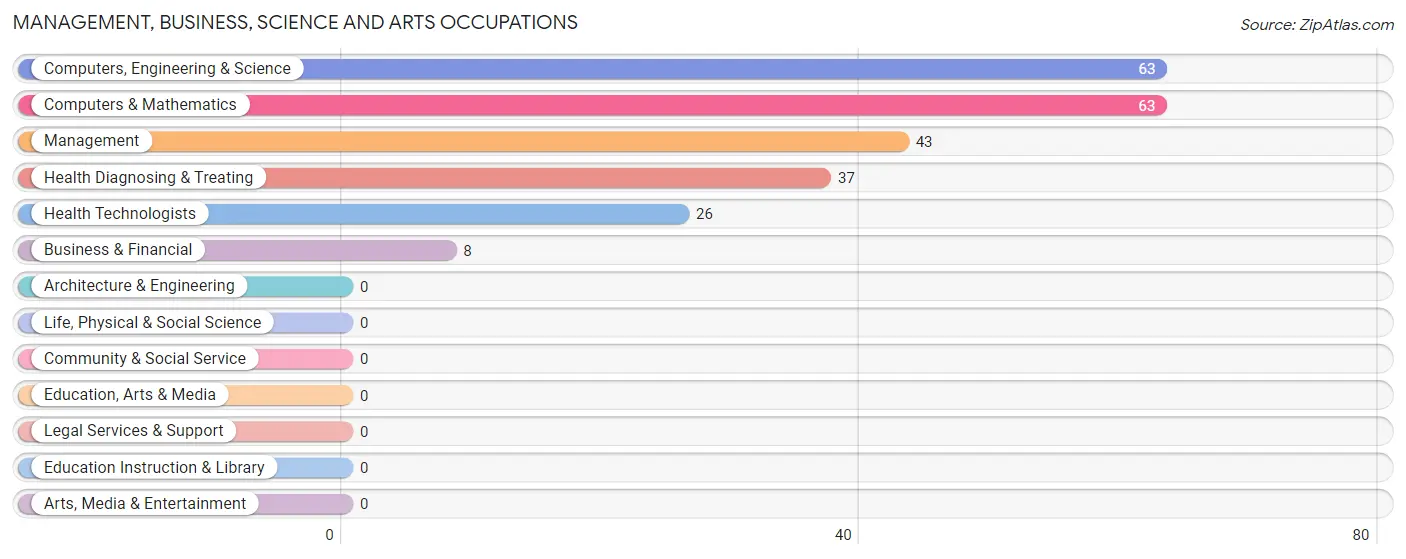
Management, Business, Science and Arts Occupations
The most common Management, Business, Science and Arts occupations in Fort Chiswell are Computers, Engineering & Science (63 | 15.0%), Computers & Mathematics (63 | 15.0%), Management (43 | 10.2%), Health Diagnosing & Treating (37 | 8.8%), and Health Technologists (26 | 6.2%).
Management, Business, Science and Arts Occupations by Sex
Within the Management, Business, Science and Arts occupations in Fort Chiswell, the most male-oriented occupations are Computers, Engineering & Science (77.8%), Computers & Mathematics (77.8%), and Health Technologists (42.3%), while the most female-oriented occupations are Business & Financial (100.0%), Management (79.1%), and Health Diagnosing & Treating (70.3%).
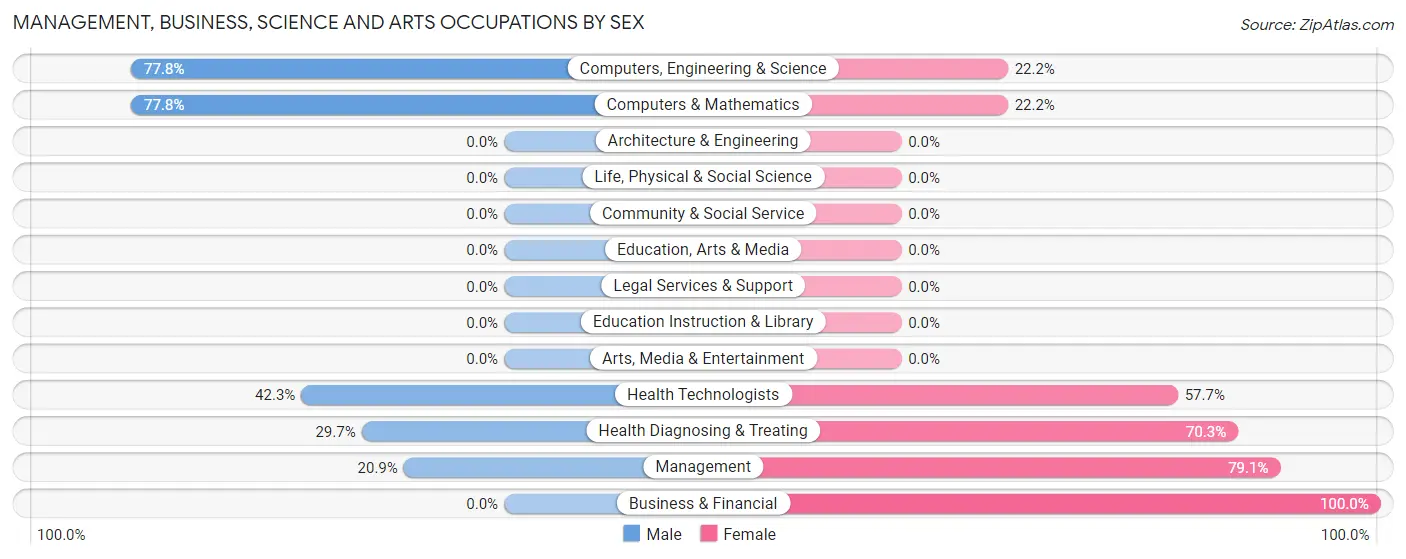
| Occupation | Male | Female |
| Management | 9 (20.9%) | 34 (79.1%) |
| Business & Financial | 0 (0.0%) | 8 (100.0%) |
| Computers, Engineering & Science | 49 (77.8%) | 14 (22.2%) |
| Computers & Mathematics | 49 (77.8%) | 14 (22.2%) |
| Architecture & Engineering | 0 (0.0%) | 0 (0.0%) |
| Life, Physical & Social Science | 0 (0.0%) | 0 (0.0%) |
| Community & Social Service | 0 (0.0%) | 0 (0.0%) |
| Education, Arts & Media | 0 (0.0%) | 0 (0.0%) |
| Legal Services & Support | 0 (0.0%) | 0 (0.0%) |
| Education Instruction & Library | 0 (0.0%) | 0 (0.0%) |
| Arts, Media & Entertainment | 0 (0.0%) | 0 (0.0%) |
| Health Diagnosing & Treating | 11 (29.7%) | 26 (70.3%) |
| Health Technologists | 11 (42.3%) | 15 (57.7%) |
| Total (Category) | 69 (45.7%) | 82 (54.3%) |
| Total (Overall) | 216 (51.3%) | 205 (48.7%) |
Services Occupations
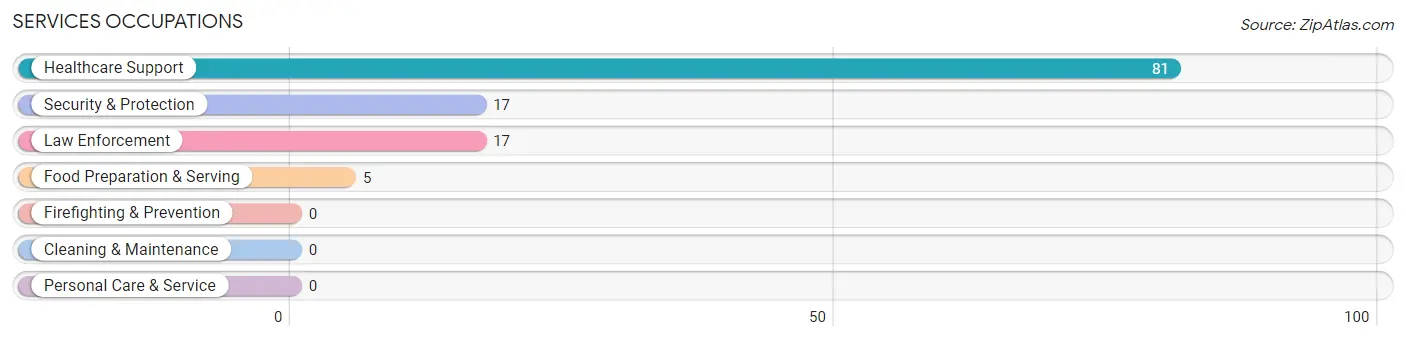
The most common Services occupations in Fort Chiswell are Healthcare Support (81 | 19.2%), Security & Protection (17 | 4.0%), Law Enforcement (17 | 4.0%), and Food Preparation & Serving (5 | 1.2%).
Services Occupations by Sex
Within the Services occupations in Fort Chiswell, the most male-oriented occupations are Security & Protection (100.0%), Law Enforcement (100.0%), and Healthcare Support (7.4%), while the most female-oriented occupations are Food Preparation & Serving (100.0%), and Healthcare Support (92.6%).
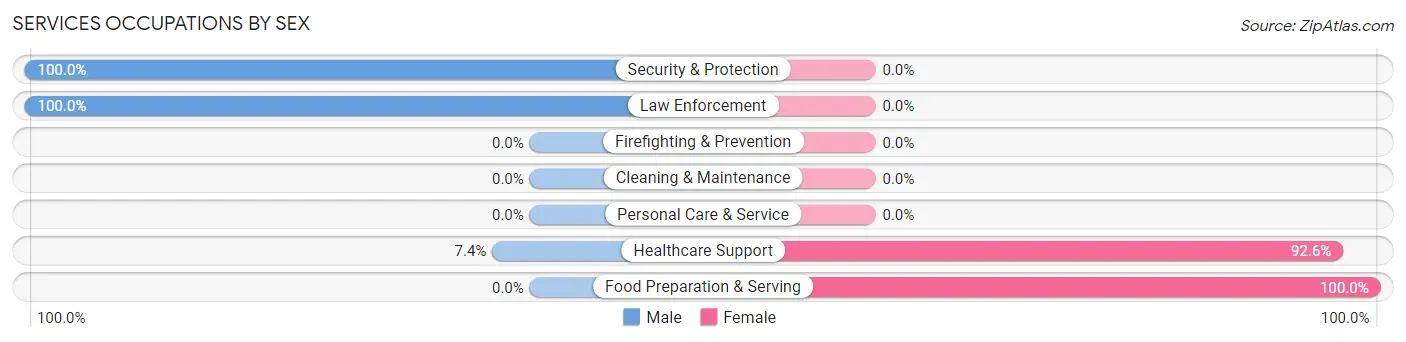
| Occupation | Male | Female |
| Healthcare Support | 6 (7.4%) | 75 (92.6%) |
| Security & Protection | 17 (100.0%) | 0 (0.0%) |
| Firefighting & Prevention | 0 (0.0%) | 0 (0.0%) |
| Law Enforcement | 17 (100.0%) | 0 (0.0%) |
| Food Preparation & Serving | 0 (0.0%) | 5 (100.0%) |
| Cleaning & Maintenance | 0 (0.0%) | 0 (0.0%) |
| Personal Care & Service | 0 (0.0%) | 0 (0.0%) |
| Total (Category) | 23 (22.3%) | 80 (77.7%) |
| Total (Overall) | 216 (51.3%) | 205 (48.7%) |
Sales and Office Occupations
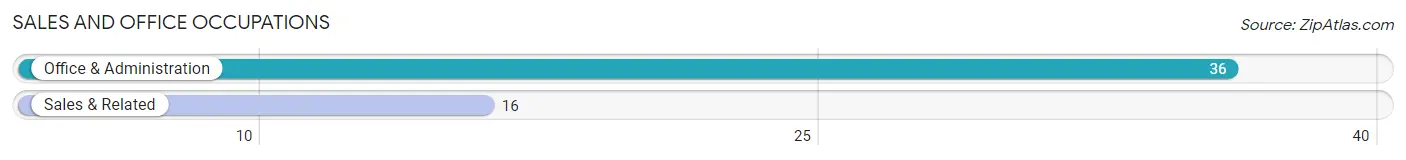
The most common Sales and Office occupations in Fort Chiswell are Office & Administration (36 | 8.6%), and Sales & Related (16 | 3.8%).
Sales and Office Occupations by Sex
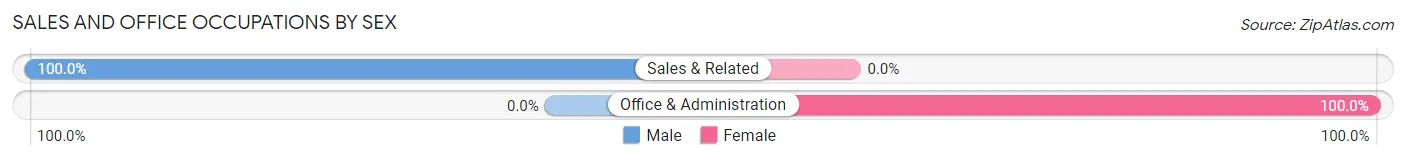
| Occupation | Male | Female |
| Sales & Related | 16 (100.0%) | 0 (0.0%) |
| Office & Administration | 0 (0.0%) | 36 (100.0%) |
| Total (Category) | 16 (30.8%) | 36 (69.2%) |
| Total (Overall) | 216 (51.3%) | 205 (48.7%) |
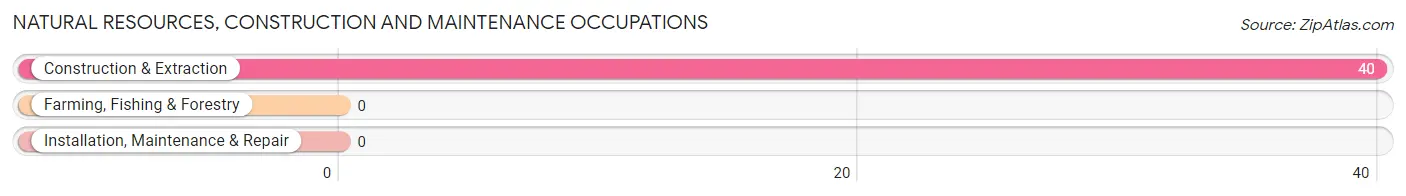
Natural Resources, Construction and Maintenance Occupations
The most common Natural Resources, Construction and Maintenance occupations in Fort Chiswell are , and Construction & Extraction (40 | 9.5%).
Natural Resources, Construction and Maintenance Occupations by Sex
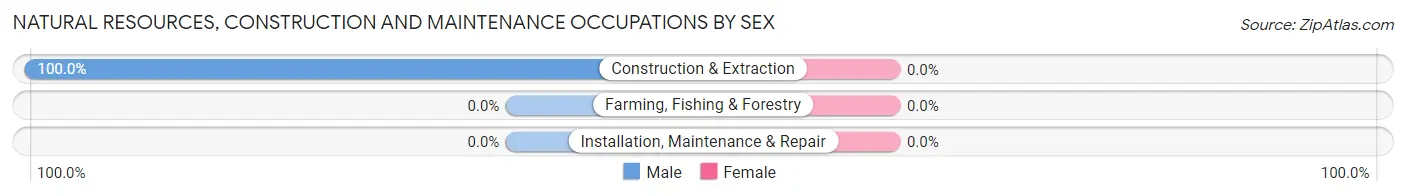
| Occupation | Male | Female |
| Farming, Fishing & Forestry | 0 (0.0%) | 0 (0.0%) |
| Construction & Extraction | 40 (100.0%) | 0 (0.0%) |
| Installation, Maintenance & Repair | 0 (0.0%) | 0 (0.0%) |
| Total (Category) | 40 (100.0%) | 0 (0.0%) |
| Total (Overall) | 216 (51.3%) | 205 (48.7%) |
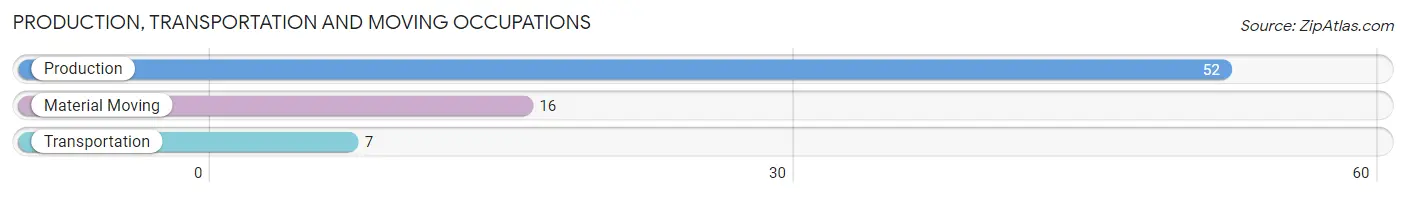
Production, Transportation and Moving Occupations
The most common Production, Transportation and Moving occupations in Fort Chiswell are Production (52 | 12.3%), Material Moving (16 | 3.8%), and Transportation (7 | 1.7%).
Production, Transportation and Moving Occupations by Sex
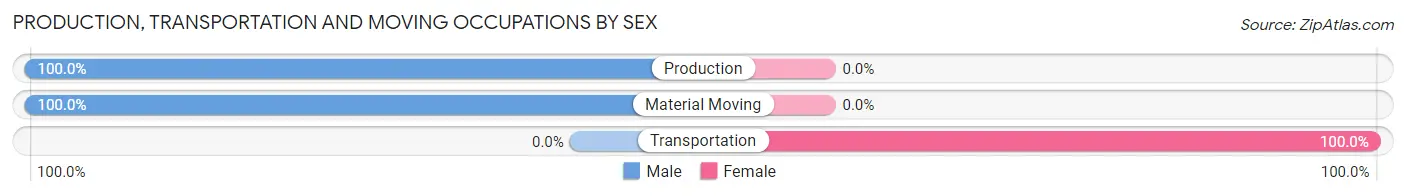
| Occupation | Male | Female |
| Production | 52 (100.0%) | 0 (0.0%) |
| Transportation | 0 (0.0%) | 7 (100.0%) |
| Material Moving | 16 (100.0%) | 0 (0.0%) |
| Total (Category) | 68 (90.7%) | 7 (9.3%) |
| Total (Overall) | 216 (51.3%) | 205 (48.7%) |
Employment Industries by Sex in Fort Chiswell
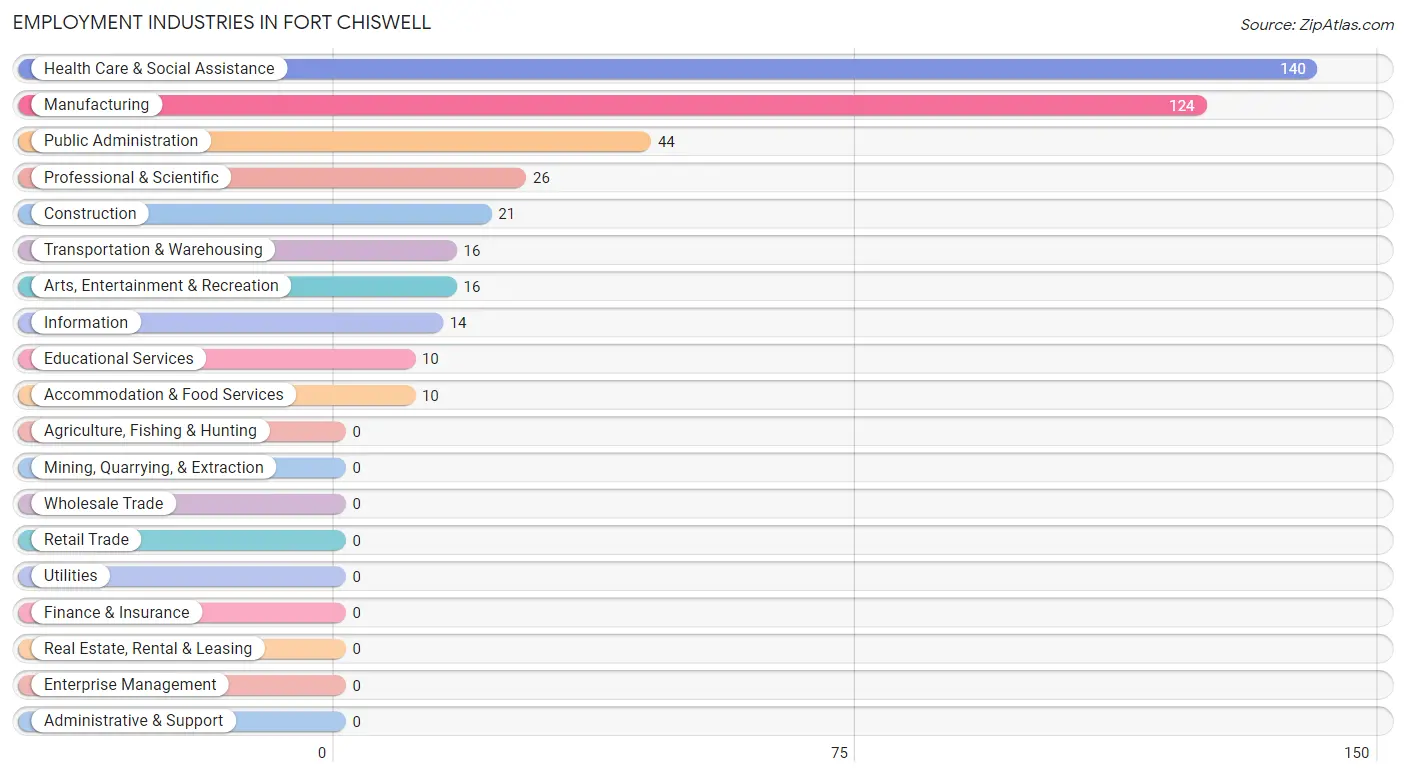
Employment Industries in Fort Chiswell
The major employment industries in Fort Chiswell include Health Care & Social Assistance (140 | 33.3%), Manufacturing (124 | 29.4%), Public Administration (44 | 10.4%), Professional & Scientific (26 | 6.2%), and Construction (21 | 5.0%).
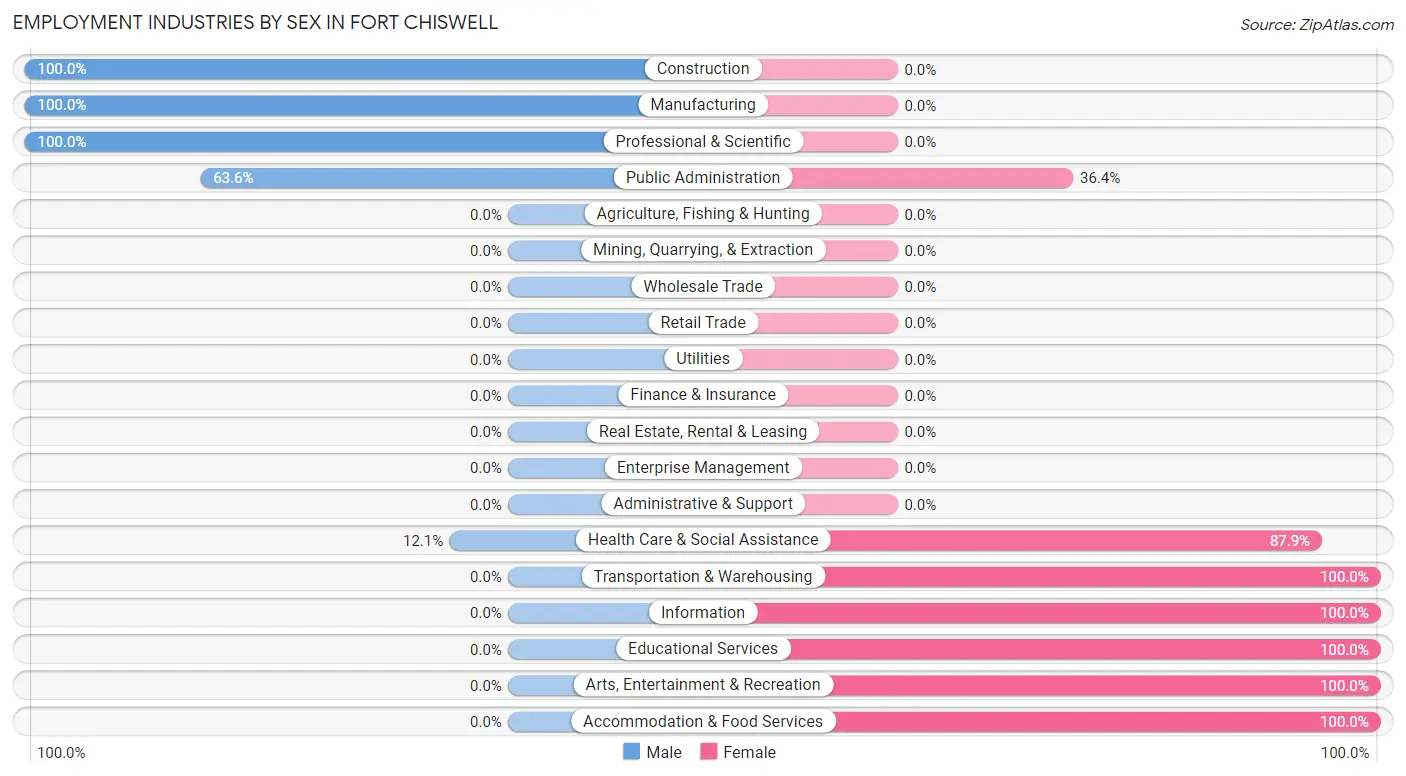
Employment Industries by Sex in Fort Chiswell
The Fort Chiswell industries that see more men than women are Construction (100.0%), Manufacturing (100.0%), and Professional & Scientific (100.0%), whereas the industries that tend to have a higher number of women are Transportation & Warehousing (100.0%), Information (100.0%), and Educational Services (100.0%).
| Industry | Male | Female |
| Agriculture, Fishing & Hunting | 0 (0.0%) | 0 (0.0%) |
| Mining, Quarrying, & Extraction | 0 (0.0%) | 0 (0.0%) |
| Construction | 21 (100.0%) | 0 (0.0%) |
| Manufacturing | 124 (100.0%) | 0 (0.0%) |
| Wholesale Trade | 0 (0.0%) | 0 (0.0%) |
| Retail Trade | 0 (0.0%) | 0 (0.0%) |
| Transportation & Warehousing | 0 (0.0%) | 16 (100.0%) |
| Utilities | 0 (0.0%) | 0 (0.0%) |
| Information | 0 (0.0%) | 14 (100.0%) |
| Finance & Insurance | 0 (0.0%) | 0 (0.0%) |
| Real Estate, Rental & Leasing | 0 (0.0%) | 0 (0.0%) |
| Professional & Scientific | 26 (100.0%) | 0 (0.0%) |
| Enterprise Management | 0 (0.0%) | 0 (0.0%) |
| Administrative & Support | 0 (0.0%) | 0 (0.0%) |
| Educational Services | 0 (0.0%) | 10 (100.0%) |
| Health Care & Social Assistance | 17 (12.1%) | 123 (87.9%) |
| Arts, Entertainment & Recreation | 0 (0.0%) | 16 (100.0%) |
| Accommodation & Food Services | 0 (0.0%) | 10 (100.0%) |
| Public Administration | 28 (63.6%) | 16 (36.4%) |
| Total | 216 (51.3%) | 205 (48.7%) |
Education in Fort Chiswell
School Enrollment in Fort Chiswell
The most common levels of schooling among the 95 students in Fort Chiswell are college / undergraduate (31 | 32.6%), high school (28 | 29.5%), and elementary school (15 | 15.8%).
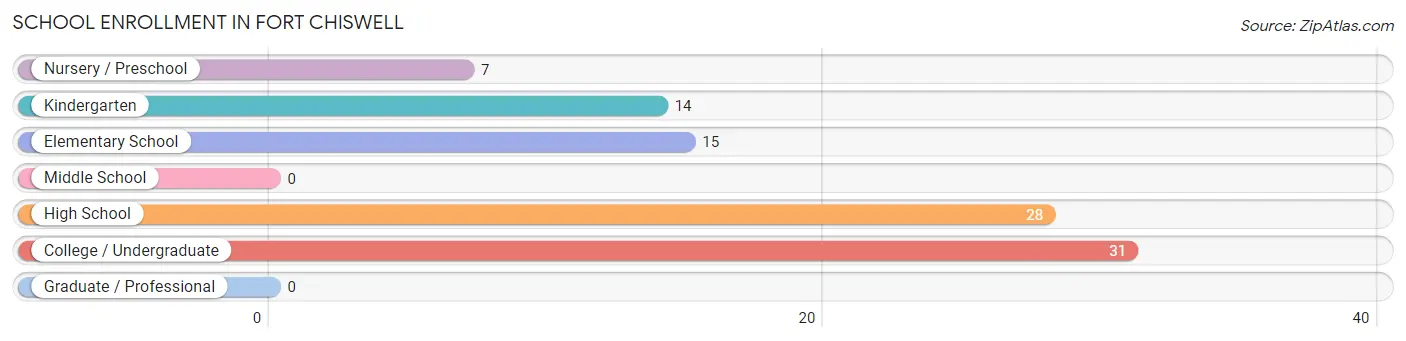
| School Level | # Students | % Students |
| Nursery / Preschool | 7 | 7.4% |
| Kindergarten | 14 | 14.7% |
| Elementary School | 15 | 15.8% |
| Middle School | 0 | 0.0% |
| High School | 28 | 29.5% |
| College / Undergraduate | 31 | 32.6% |
| Graduate / Professional | 0 | 0.0% |
| Total | 95 | 100.0% |
School Enrollment by Age by Funding Source in Fort Chiswell
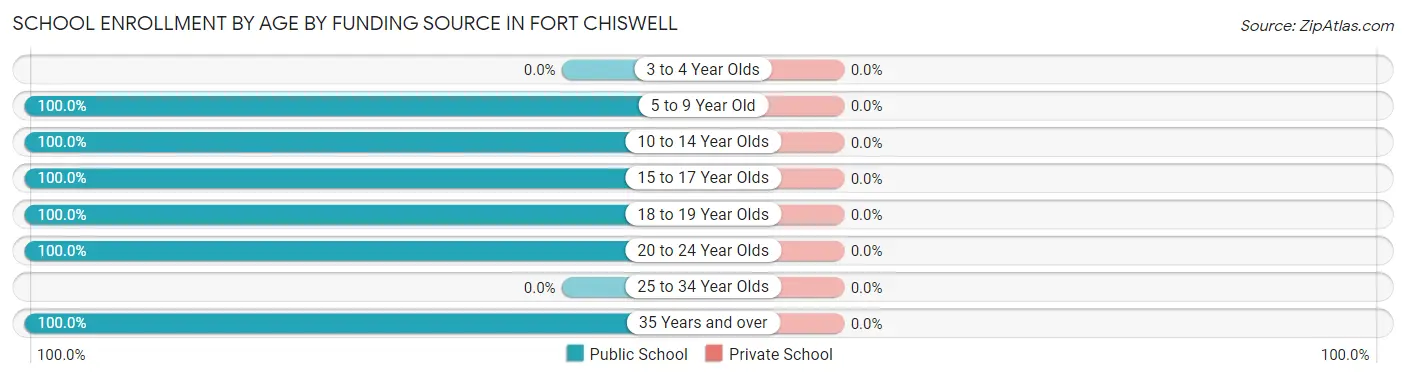
| Age Bracket | Public School | Private School |
| 3 to 4 Year Olds | 0 (0.0%) | 0 (0.0%) |
| 5 to 9 Year Old | 21 (100.0%) | 0 (0.0%) |
| 10 to 14 Year Olds | 27 (100.0%) | 0 (0.0%) |
| 15 to 17 Year Olds | 10 (100.0%) | 0 (0.0%) |
| 18 to 19 Year Olds | 6 (100.0%) | 0 (0.0%) |
| 20 to 24 Year Olds | 8 (100.0%) | 0 (0.0%) |
| 25 to 34 Year Olds | 0 (0.0%) | 0 (0.0%) |
| 35 Years and over | 23 (100.0%) | 0 (0.0%) |
| Total | 95 (100.0%) | 0 (0.0%) |
Educational Attainment by Field of Study in Fort Chiswell
Business (58 | 59.8%), science & technology (27 | 27.8%), and arts & humanities (12 | 12.4%) are the most common fields of study among 97 individuals in Fort Chiswell who have obtained a bachelor's degree or higher.
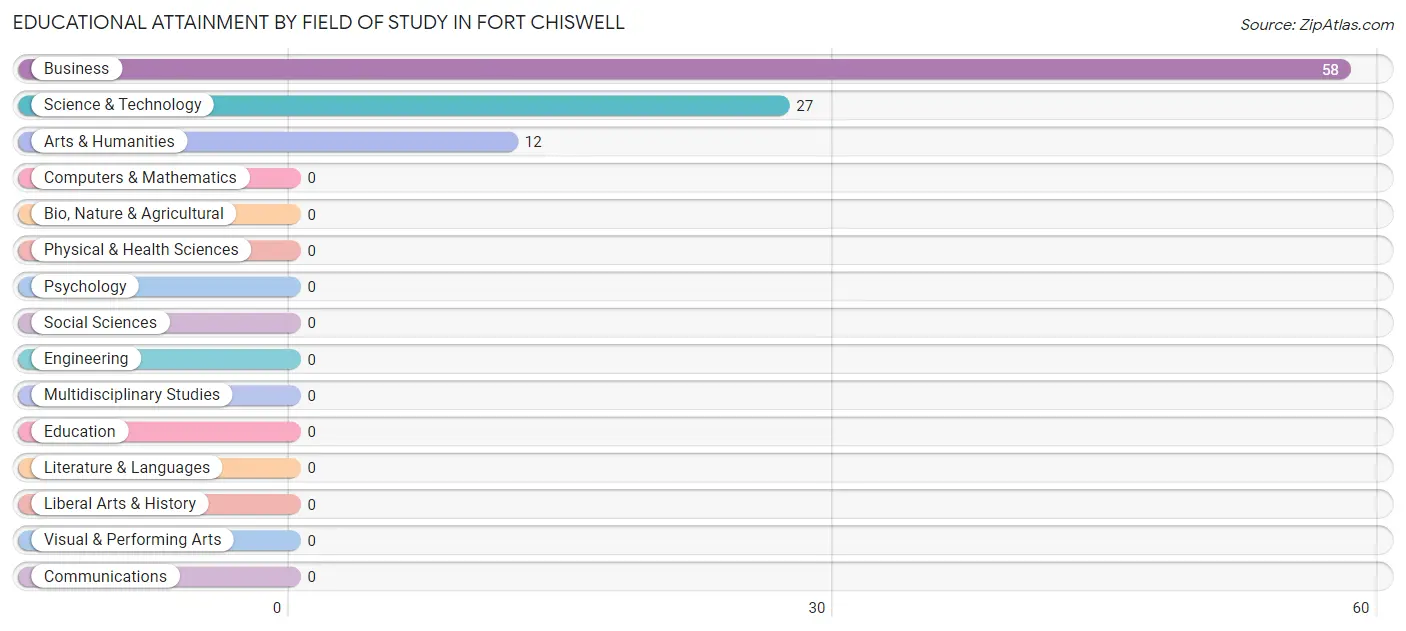
| Field of Study | # Graduates | % Graduates |
| Computers & Mathematics | 0 | 0.0% |
| Bio, Nature & Agricultural | 0 | 0.0% |
| Physical & Health Sciences | 0 | 0.0% |
| Psychology | 0 | 0.0% |
| Social Sciences | 0 | 0.0% |
| Engineering | 0 | 0.0% |
| Multidisciplinary Studies | 0 | 0.0% |
| Science & Technology | 27 | 27.8% |
| Business | 58 | 59.8% |
| Education | 0 | 0.0% |
| Literature & Languages | 0 | 0.0% |
| Liberal Arts & History | 0 | 0.0% |
| Visual & Performing Arts | 0 | 0.0% |
| Communications | 0 | 0.0% |
| Arts & Humanities | 12 | 12.4% |
| Total | 97 | 100.0% |
Transportation & Commute in Fort Chiswell
Vehicle Availability by Sex in Fort Chiswell
The most prevalent vehicle ownership categories in Fort Chiswell are males with 3 vehicles (138, accounting for 70.4%) and females with 3 vehicles (94, making up 72.6%).
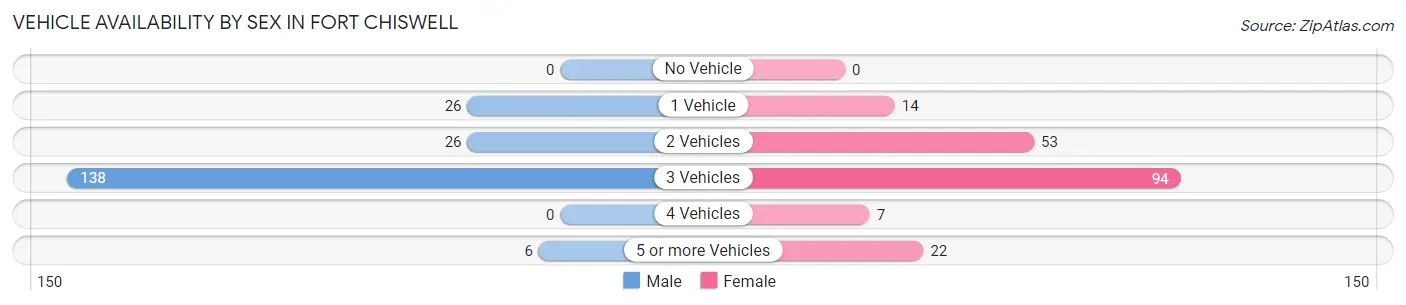
| Vehicles Available | Male | Female |
| No Vehicle | 0 (0.0%) | 0 (0.0%) |
| 1 Vehicle | 26 (13.3%) | 14 (7.4%) |
| 2 Vehicles | 26 (13.3%) | 53 (27.9%) |
| 3 Vehicles | 138 (70.4%) | 94 (49.5%) |
| 4 Vehicles | 0 (0.0%) | 7 (3.7%) |
| 5 or more Vehicles | 6 (3.1%) | 22 (11.6%) |
| Total | 196 (100.0%) | 190 (100.0%) |
Commute Time in Fort Chiswell
The most frequently occuring commute durations in Fort Chiswell are 25 to 29 minutes (111 commuters, 30.0%), 45 to 59 minutes (89 commuters, 24.0%), and 15 to 19 minutes (87 commuters, 23.5%).
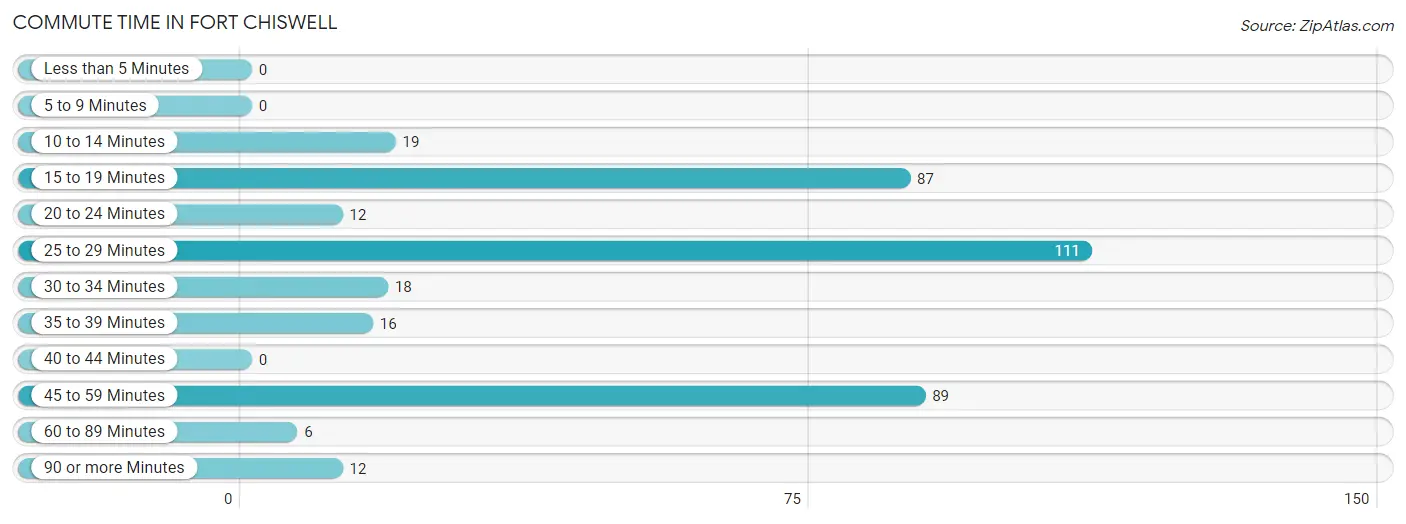
| Commute Time | # Commuters | % Commuters |
| Less than 5 Minutes | 0 | 0.0% |
| 5 to 9 Minutes | 0 | 0.0% |
| 10 to 14 Minutes | 19 | 5.1% |
| 15 to 19 Minutes | 87 | 23.5% |
| 20 to 24 Minutes | 12 | 3.2% |
| 25 to 29 Minutes | 111 | 30.0% |
| 30 to 34 Minutes | 18 | 4.9% |
| 35 to 39 Minutes | 16 | 4.3% |
| 40 to 44 Minutes | 0 | 0.0% |
| 45 to 59 Minutes | 89 | 24.0% |
| 60 to 89 Minutes | 6 | 1.6% |
| 90 or more Minutes | 12 | 3.2% |
Commute Time by Sex in Fort Chiswell
The most common commute times in Fort Chiswell are 25 to 29 minutes (111 commuters, 56.6%) for males and 45 to 59 minutes (87 commuters, 50.0%) for females.
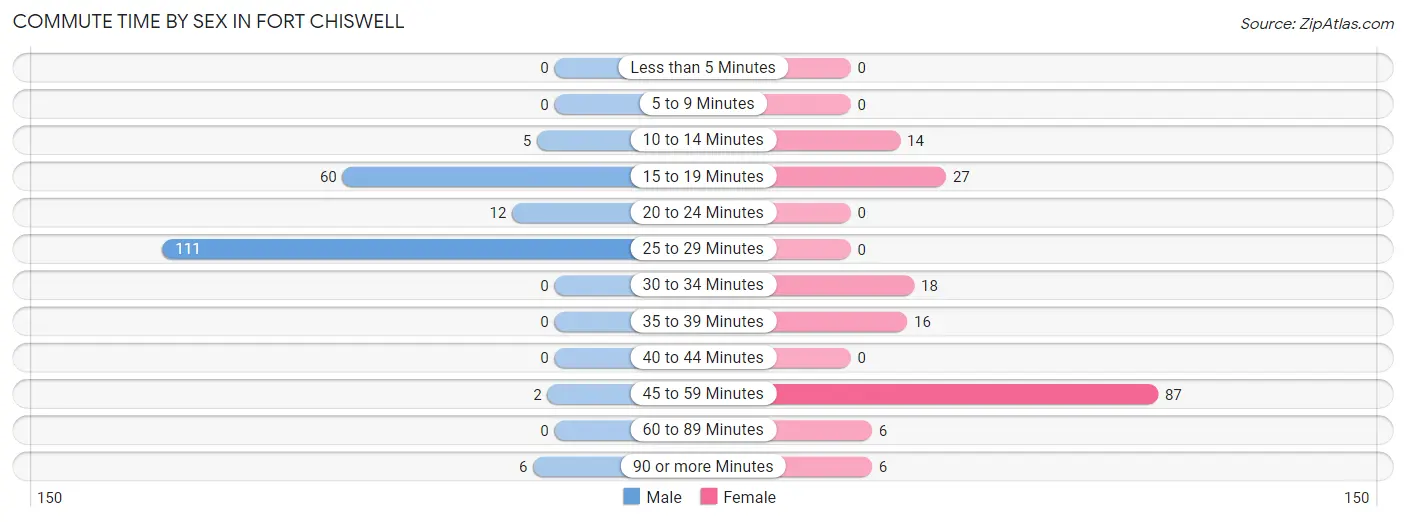
| Commute Time | Male | Female |
| Less than 5 Minutes | 0 (0.0%) | 0 (0.0%) |
| 5 to 9 Minutes | 0 (0.0%) | 0 (0.0%) |
| 10 to 14 Minutes | 5 (2.5%) | 14 (8.1%) |
| 15 to 19 Minutes | 60 (30.6%) | 27 (15.5%) |
| 20 to 24 Minutes | 12 (6.1%) | 0 (0.0%) |
| 25 to 29 Minutes | 111 (56.6%) | 0 (0.0%) |
| 30 to 34 Minutes | 0 (0.0%) | 18 (10.3%) |
| 35 to 39 Minutes | 0 (0.0%) | 16 (9.2%) |
| 40 to 44 Minutes | 0 (0.0%) | 0 (0.0%) |
| 45 to 59 Minutes | 2 (1.0%) | 87 (50.0%) |
| 60 to 89 Minutes | 0 (0.0%) | 6 (3.5%) |
| 90 or more Minutes | 6 (3.1%) | 6 (3.5%) |
Time of Departure to Work by Sex in Fort Chiswell
The most frequent times of departure to work in Fort Chiswell are 5:00 AM to 5:29 AM (85, 43.4%) for males and 12:00 AM to 4:59 AM (69, 39.7%) for females.
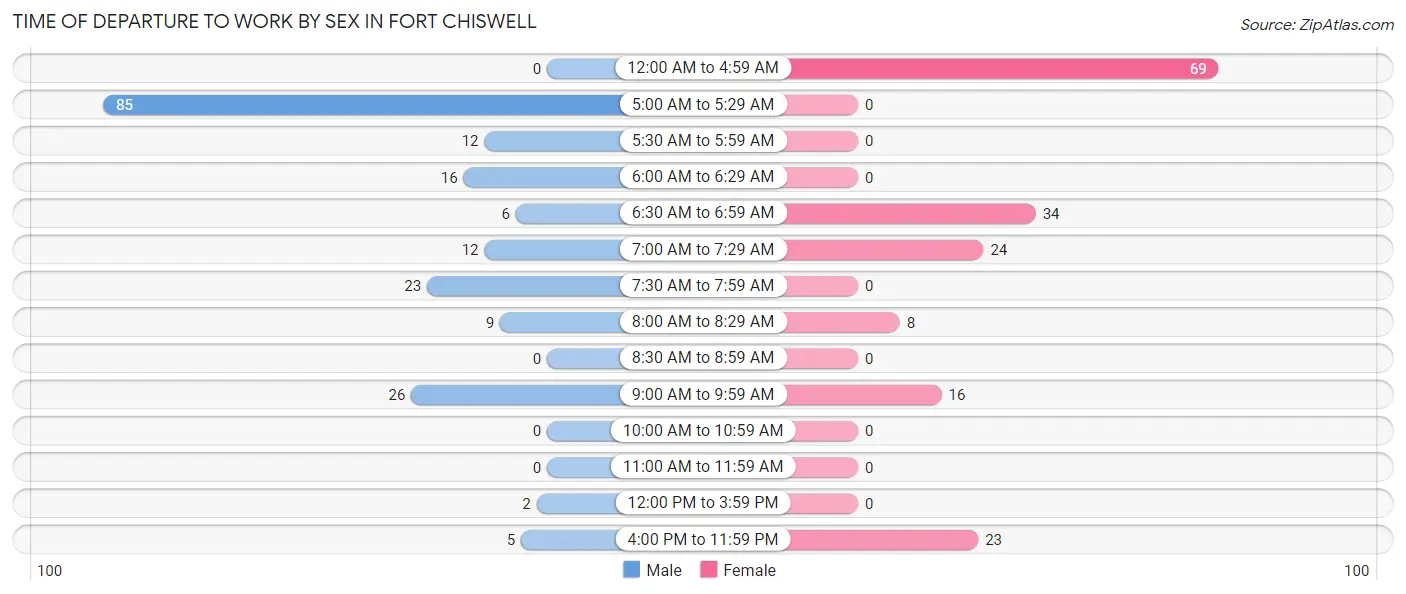
| Time of Departure | Male | Female |
| 12:00 AM to 4:59 AM | 0 (0.0%) | 69 (39.7%) |
| 5:00 AM to 5:29 AM | 85 (43.4%) | 0 (0.0%) |
| 5:30 AM to 5:59 AM | 12 (6.1%) | 0 (0.0%) |
| 6:00 AM to 6:29 AM | 16 (8.2%) | 0 (0.0%) |
| 6:30 AM to 6:59 AM | 6 (3.1%) | 34 (19.5%) |
| 7:00 AM to 7:29 AM | 12 (6.1%) | 24 (13.8%) |
| 7:30 AM to 7:59 AM | 23 (11.7%) | 0 (0.0%) |
| 8:00 AM to 8:29 AM | 9 (4.6%) | 8 (4.6%) |
| 8:30 AM to 8:59 AM | 0 (0.0%) | 0 (0.0%) |
| 9:00 AM to 9:59 AM | 26 (13.3%) | 16 (9.2%) |
| 10:00 AM to 10:59 AM | 0 (0.0%) | 0 (0.0%) |
| 11:00 AM to 11:59 AM | 0 (0.0%) | 0 (0.0%) |
| 12:00 PM to 3:59 PM | 2 (1.0%) | 0 (0.0%) |
| 4:00 PM to 11:59 PM | 5 (2.5%) | 23 (13.2%) |
| Total | 196 (100.0%) | 174 (100.0%) |
Housing Occupancy in Fort Chiswell
Occupancy by Ownership in Fort Chiswell
Of the total 280 dwellings in Fort Chiswell, owner-occupied units account for 272 (97.1%), while renter-occupied units make up 8 (2.9%).
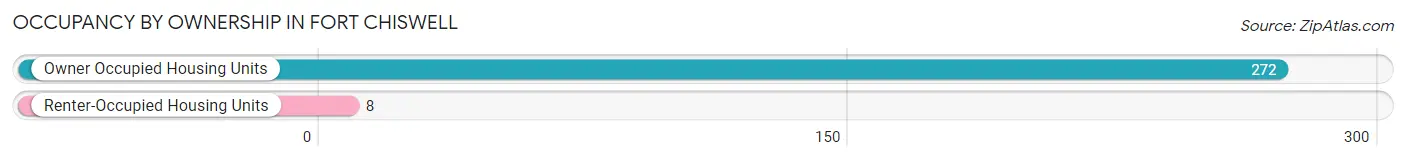
| Occupancy | # Housing Units | % Housing Units |
| Owner Occupied Housing Units | 272 | 97.1% |
| Renter-Occupied Housing Units | 8 | 2.9% |
| Total Occupied Housing Units | 280 | 100.0% |
Occupancy by Household Size in Fort Chiswell
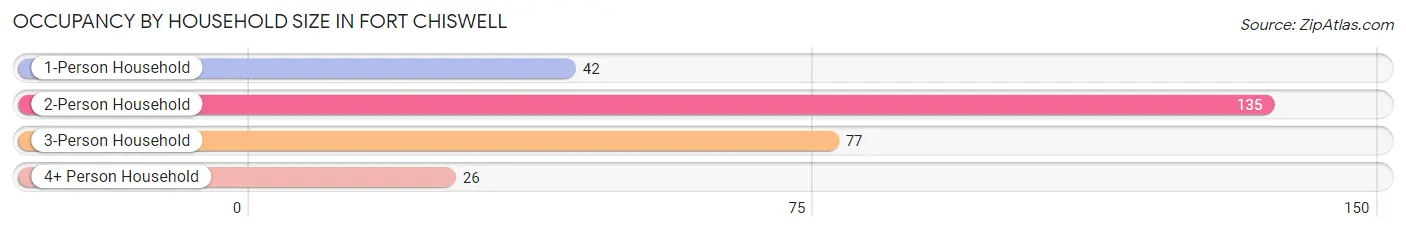
| Household Size | # Housing Units | % Housing Units |
| 1-Person Household | 42 | 15.0% |
| 2-Person Household | 135 | 48.2% |
| 3-Person Household | 77 | 27.5% |
| 4+ Person Household | 26 | 9.3% |
| Total Housing Units | 280 | 100.0% |
Occupancy by Ownership by Household Size in Fort Chiswell
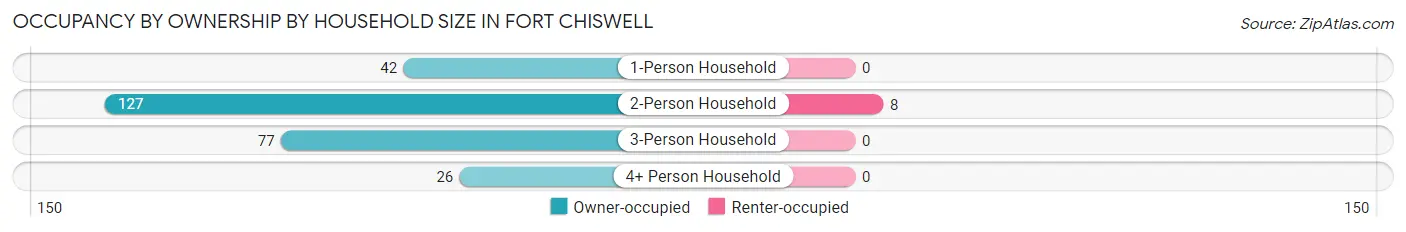
| Household Size | Owner-occupied | Renter-occupied |
| 1-Person Household | 42 (100.0%) | 0 (0.0%) |
| 2-Person Household | 127 (94.1%) | 8 (5.9%) |
| 3-Person Household | 77 (100.0%) | 0 (0.0%) |
| 4+ Person Household | 26 (100.0%) | 0 (0.0%) |
| Total Housing Units | 272 (97.1%) | 8 (2.9%) |
Occupancy by Educational Attainment in Fort Chiswell
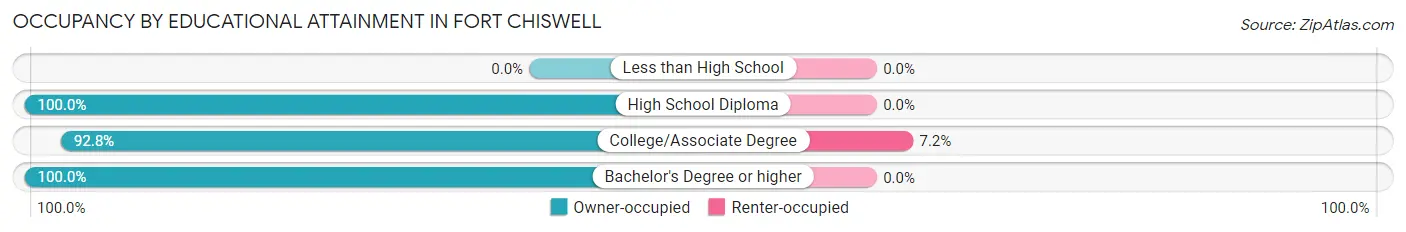
| Household Size | Owner-occupied | Renter-occupied |
| Less than High School | 0 (0.0%) | 0 (0.0%) |
| High School Diploma | 96 (100.0%) | 0 (0.0%) |
| College/Associate Degree | 103 (92.8%) | 8 (7.2%) |
| Bachelor's Degree or higher | 73 (100.0%) | 0 (0.0%) |
Occupancy by Age of Householder in Fort Chiswell
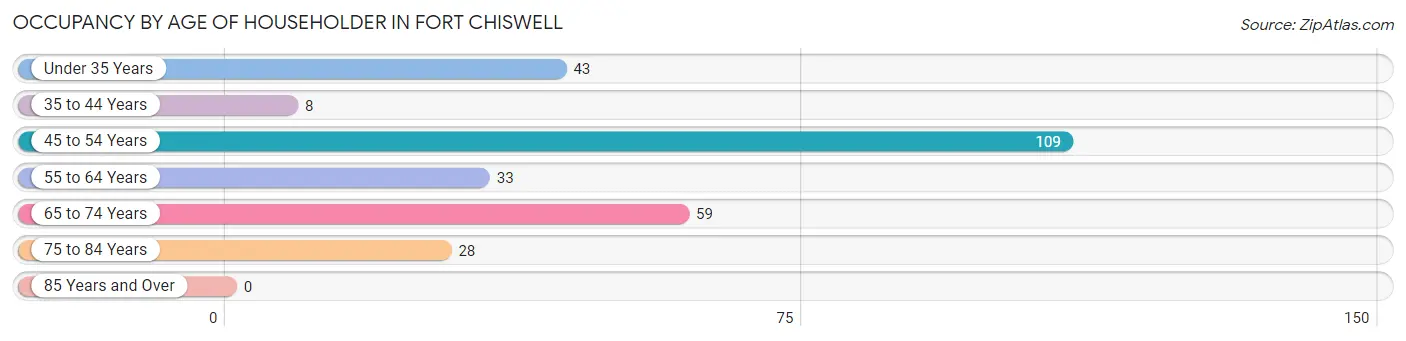
| Age Bracket | # Households | % Households |
| Under 35 Years | 43 | 15.4% |
| 35 to 44 Years | 8 | 2.9% |
| 45 to 54 Years | 109 | 38.9% |
| 55 to 64 Years | 33 | 11.8% |
| 65 to 74 Years | 59 | 21.1% |
| 75 to 84 Years | 28 | 10.0% |
| 85 Years and Over | 0 | 0.0% |
| Total | 280 | 100.0% |
Housing Finances in Fort Chiswell
Median Income by Occupancy in Fort Chiswell
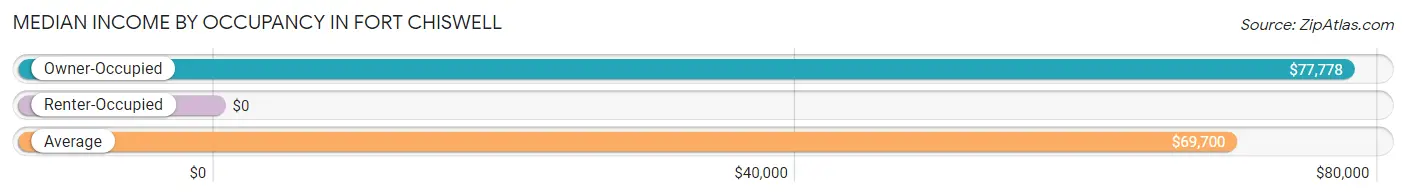
| Occupancy Type | # Households | Median Income |
| Owner-Occupied | 272 (97.1%) | $77,778 |
| Renter-Occupied | 8 (2.9%) | $0 |
| Average | 280 (100.0%) | $69,700 |
Occupancy by Householder Income Bracket in Fort Chiswell
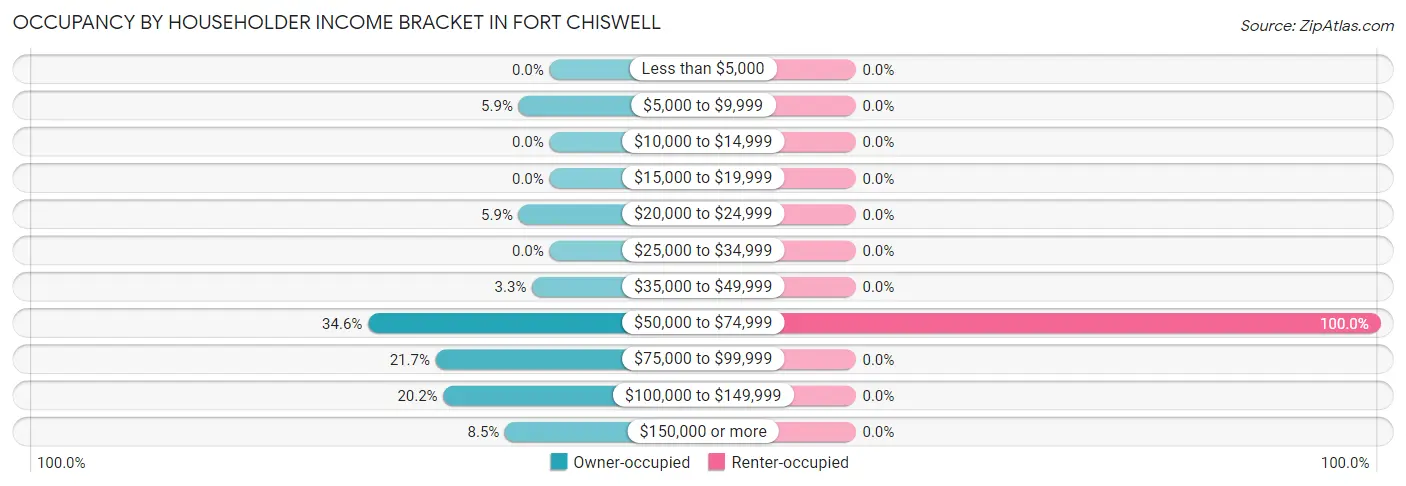
| Income Bracket | Owner-occupied | Renter-occupied |
| Less than $5,000 | 0 (0.0%) | 0 (0.0%) |
| $5,000 to $9,999 | 16 (5.9%) | 0 (0.0%) |
| $10,000 to $14,999 | 0 (0.0%) | 0 (0.0%) |
| $15,000 to $19,999 | 0 (0.0%) | 0 (0.0%) |
| $20,000 to $24,999 | 16 (5.9%) | 0 (0.0%) |
| $25,000 to $34,999 | 0 (0.0%) | 0 (0.0%) |
| $35,000 to $49,999 | 9 (3.3%) | 0 (0.0%) |
| $50,000 to $74,999 | 94 (34.6%) | 8 (100.0%) |
| $75,000 to $99,999 | 59 (21.7%) | 0 (0.0%) |
| $100,000 to $149,999 | 55 (20.2%) | 0 (0.0%) |
| $150,000 or more | 23 (8.5%) | 0 (0.0%) |
| Total | 272 (100.0%) | 8 (100.0%) |
Monthly Housing Cost Tiers in Fort Chiswell
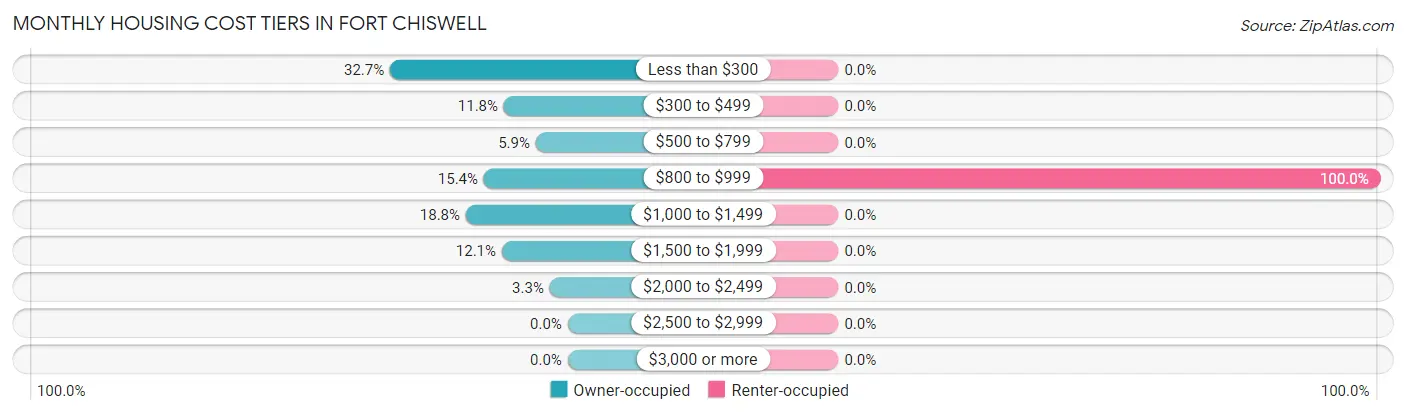
| Monthly Cost | Owner-occupied | Renter-occupied |
| Less than $300 | 89 (32.7%) | 0 (0.0%) |
| $300 to $499 | 32 (11.8%) | 0 (0.0%) |
| $500 to $799 | 16 (5.9%) | 0 (0.0%) |
| $800 to $999 | 42 (15.4%) | 8 (100.0%) |
| $1,000 to $1,499 | 51 (18.8%) | 0 (0.0%) |
| $1,500 to $1,999 | 33 (12.1%) | 0 (0.0%) |
| $2,000 to $2,499 | 9 (3.3%) | 0 (0.0%) |
| $2,500 to $2,999 | 0 (0.0%) | 0 (0.0%) |
| $3,000 or more | 0 (0.0%) | 0 (0.0%) |
| Total | 272 (100.0%) | 8 (100.0%) |
Physical Housing Characteristics in Fort Chiswell
Housing Structures in Fort Chiswell
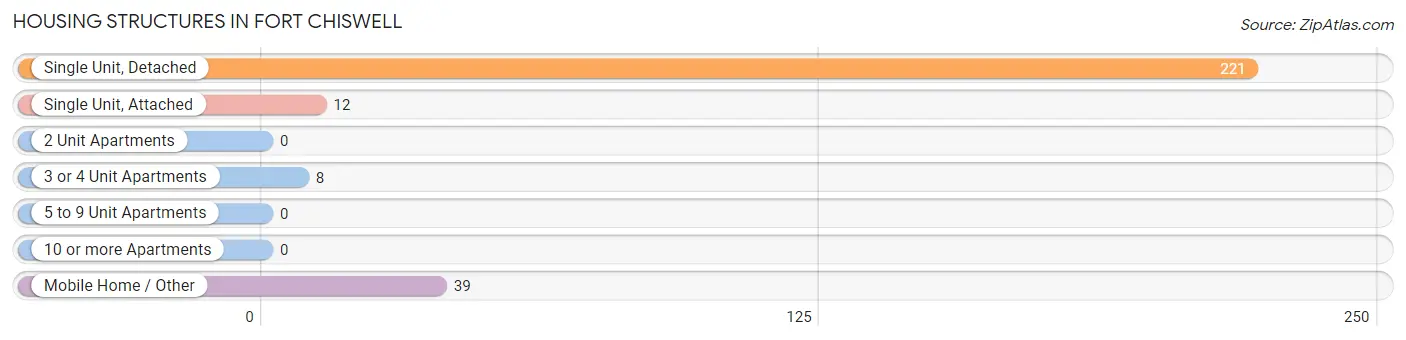
| Structure Type | # Housing Units | % Housing Units |
| Single Unit, Detached | 221 | 78.9% |
| Single Unit, Attached | 12 | 4.3% |
| 2 Unit Apartments | 0 | 0.0% |
| 3 or 4 Unit Apartments | 8 | 2.9% |
| 5 to 9 Unit Apartments | 0 | 0.0% |
| 10 or more Apartments | 0 | 0.0% |
| Mobile Home / Other | 39 | 13.9% |
| Total | 280 | 100.0% |
Housing Structures by Occupancy in Fort Chiswell
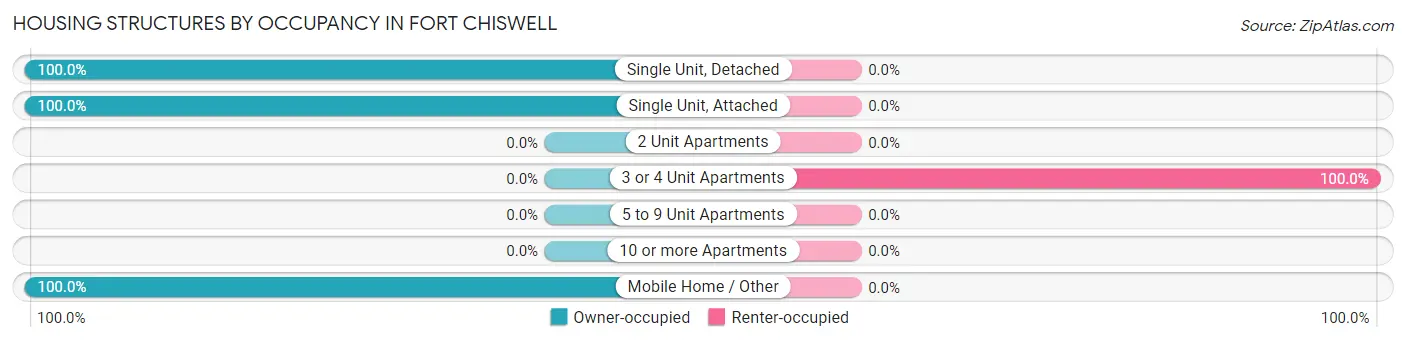
| Structure Type | Owner-occupied | Renter-occupied |
| Single Unit, Detached | 221 (100.0%) | 0 (0.0%) |
| Single Unit, Attached | 12 (100.0%) | 0 (0.0%) |
| 2 Unit Apartments | 0 (0.0%) | 0 (0.0%) |
| 3 or 4 Unit Apartments | 0 (0.0%) | 8 (100.0%) |
| 5 to 9 Unit Apartments | 0 (0.0%) | 0 (0.0%) |
| 10 or more Apartments | 0 (0.0%) | 0 (0.0%) |
| Mobile Home / Other | 39 (100.0%) | 0 (0.0%) |
| Total | 272 (97.1%) | 8 (2.9%) |
Housing Structures by Number of Rooms in Fort Chiswell
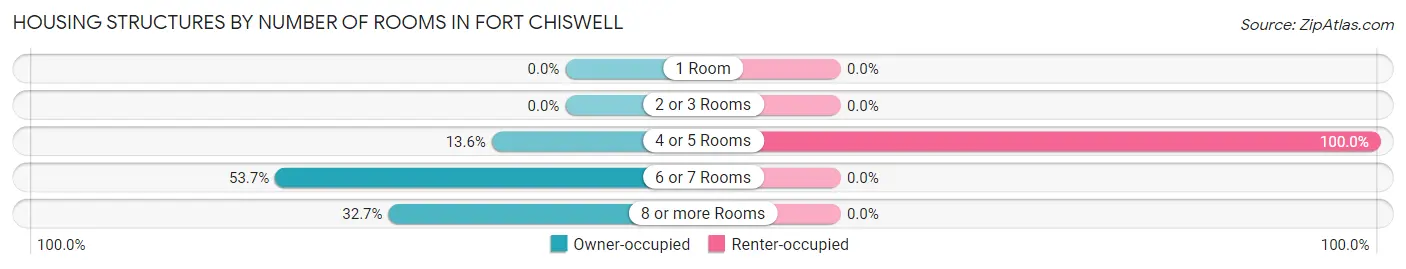
| Number of Rooms | Owner-occupied | Renter-occupied |
| 1 Room | 0 (0.0%) | 0 (0.0%) |
| 2 or 3 Rooms | 0 (0.0%) | 0 (0.0%) |
| 4 or 5 Rooms | 37 (13.6%) | 8 (100.0%) |
| 6 or 7 Rooms | 146 (53.7%) | 0 (0.0%) |
| 8 or more Rooms | 89 (32.7%) | 0 (0.0%) |
| Total | 272 (100.0%) | 8 (100.0%) |
Housing Structure by Heating Type in Fort Chiswell
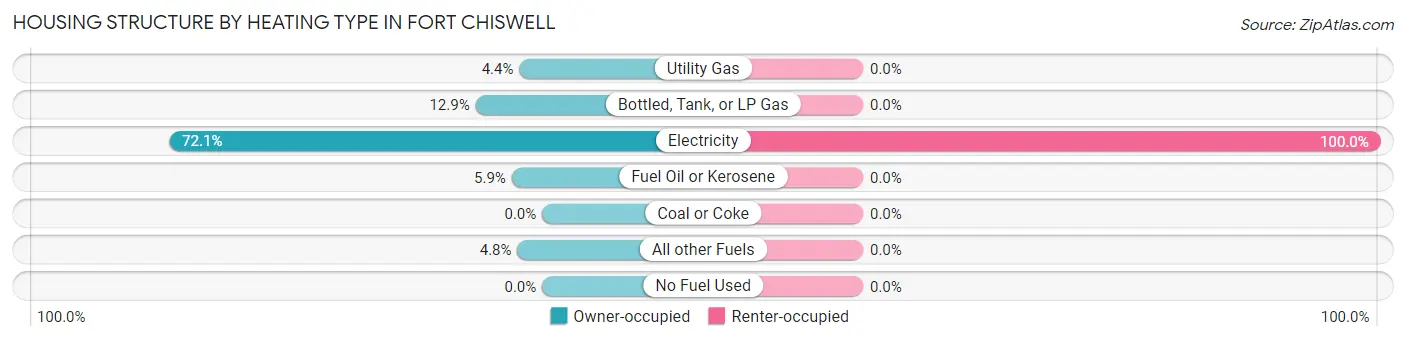
| Heating Type | Owner-occupied | Renter-occupied |
| Utility Gas | 12 (4.4%) | 0 (0.0%) |
| Bottled, Tank, or LP Gas | 35 (12.9%) | 0 (0.0%) |
| Electricity | 196 (72.1%) | 8 (100.0%) |
| Fuel Oil or Kerosene | 16 (5.9%) | 0 (0.0%) |
| Coal or Coke | 0 (0.0%) | 0 (0.0%) |
| All other Fuels | 13 (4.8%) | 0 (0.0%) |
| No Fuel Used | 0 (0.0%) | 0 (0.0%) |
| Total | 272 (100.0%) | 8 (100.0%) |
Household Vehicle Usage in Fort Chiswell
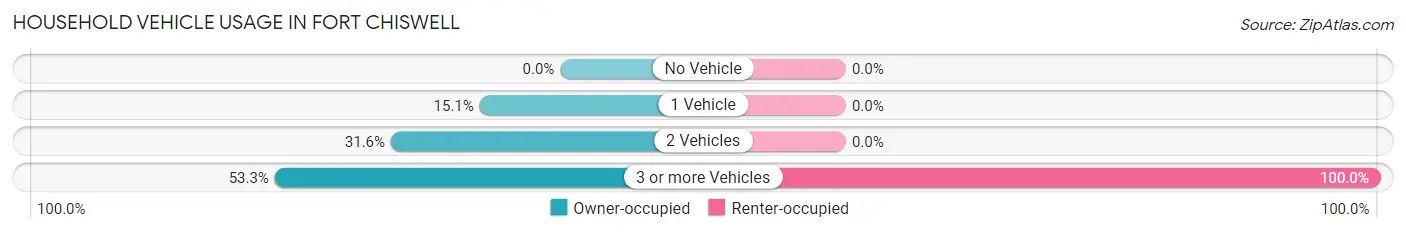
| Vehicles per Household | Owner-occupied | Renter-occupied |
| No Vehicle | 0 (0.0%) | 0 (0.0%) |
| 1 Vehicle | 41 (15.1%) | 0 (0.0%) |
| 2 Vehicles | 86 (31.6%) | 0 (0.0%) |
| 3 or more Vehicles | 145 (53.3%) | 8 (100.0%) |
| Total | 272 (100.0%) | 8 (100.0%) |
Real Estate & Mortgages in Fort Chiswell
Real Estate and Mortgage Overview in Fort Chiswell
| Characteristic | Without Mortgage | With Mortgage |
| Housing Units | 132 | 140 |
| Median Property Value | $113,500 | $266,700 |
| Median Household Income | $59,792 | $23 |
| Monthly Housing Costs | $221 | $0 |
| Real Estate Taxes | - | - |
Property Value by Mortgage Status in Fort Chiswell
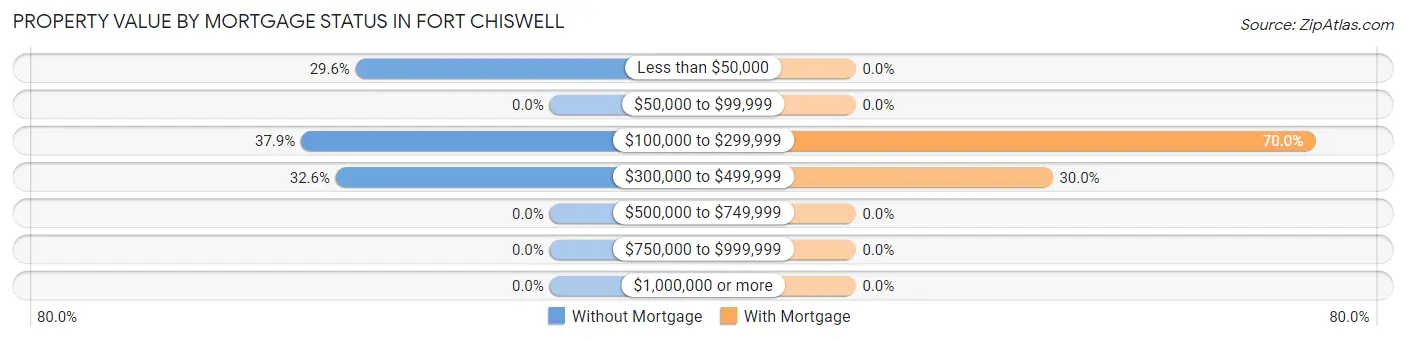
| Property Value | Without Mortgage | With Mortgage |
| Less than $50,000 | 39 (29.5%) | 0 (0.0%) |
| $50,000 to $99,999 | 0 (0.0%) | 0 (0.0%) |
| $100,000 to $299,999 | 50 (37.9%) | 98 (70.0%) |
| $300,000 to $499,999 | 43 (32.6%) | 42 (30.0%) |
| $500,000 to $749,999 | 0 (0.0%) | 0 (0.0%) |
| $750,000 to $999,999 | 0 (0.0%) | 0 (0.0%) |
| $1,000,000 or more | 0 (0.0%) | 0 (0.0%) |
| Total | 132 (100.0%) | 140 (100.0%) |
Household Income by Mortgage Status in Fort Chiswell
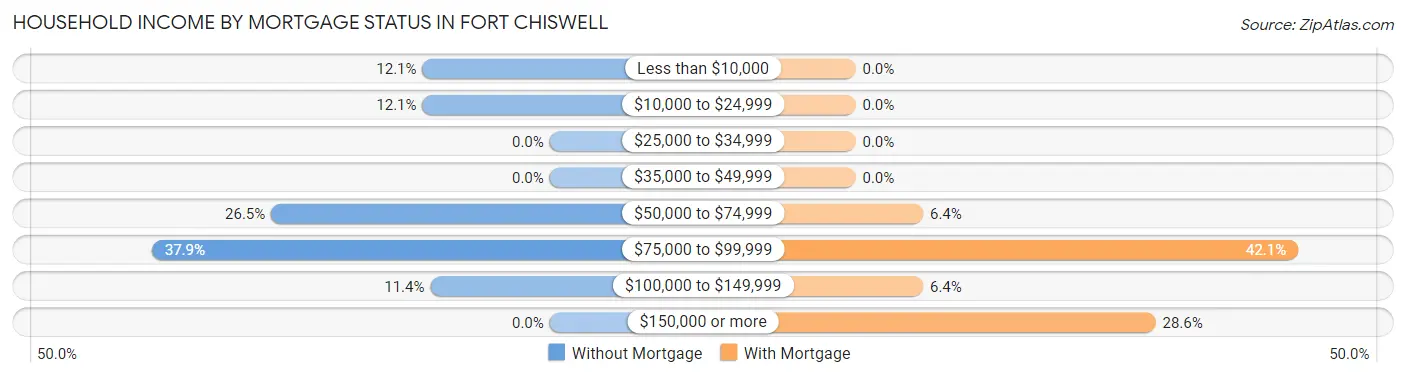
| Household Income | Without Mortgage | With Mortgage |
| Less than $10,000 | 16 (12.1%) | 0 (0.0%) |
| $10,000 to $24,999 | 16 (12.1%) | 0 (0.0%) |
| $25,000 to $34,999 | 0 (0.0%) | 0 (0.0%) |
| $35,000 to $49,999 | 0 (0.0%) | 0 (0.0%) |
| $50,000 to $74,999 | 35 (26.5%) | 9 (6.4%) |
| $75,000 to $99,999 | 50 (37.9%) | 59 (42.1%) |
| $100,000 to $149,999 | 15 (11.4%) | 9 (6.4%) |
| $150,000 or more | 0 (0.0%) | 40 (28.6%) |
| Total | 132 (100.0%) | 140 (100.0%) |
Property Value to Household Income Ratio in Fort Chiswell
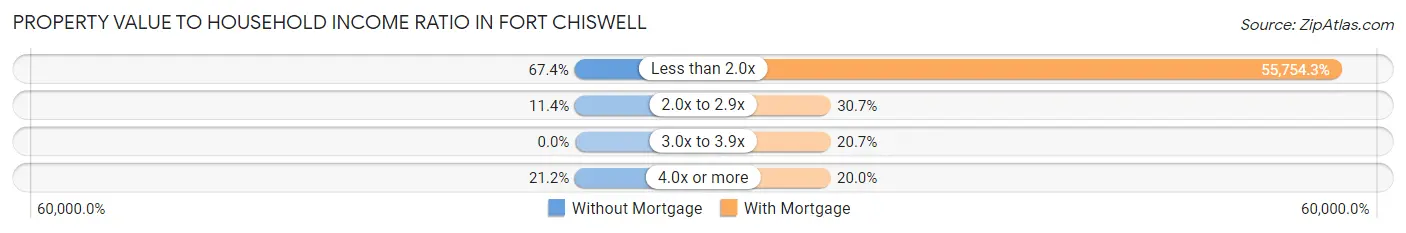
| Value-to-Income Ratio | Without Mortgage | With Mortgage |
| Less than 2.0x | 89 (67.4%) | 78,056 (55,754.3%) |
| 2.0x to 2.9x | 15 (11.4%) | 43 (30.7%) |
| 3.0x to 3.9x | 0 (0.0%) | 29 (20.7%) |
| 4.0x or more | 28 (21.2%) | 28 (20.0%) |
| Total | 132 (100.0%) | 140 (100.0%) |
Real Estate Taxes by Mortgage Status in Fort Chiswell
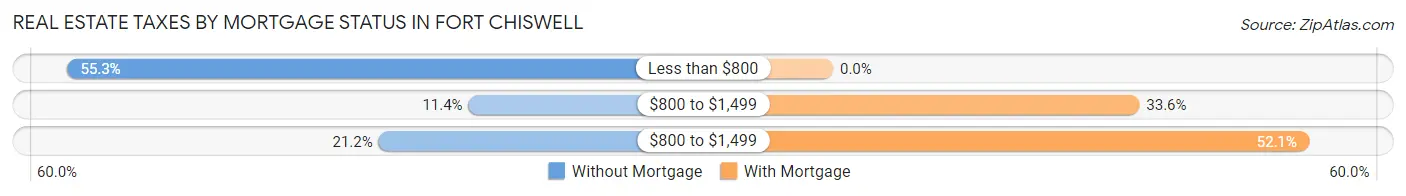
| Property Taxes | Without Mortgage | With Mortgage |
| Less than $800 | 73 (55.3%) | 0 (0.0%) |
| $800 to $1,499 | 15 (11.4%) | 47 (33.6%) |
| $800 to $1,499 | 28 (21.2%) | 73 (52.1%) |
| Total | 132 (100.0%) | 140 (100.0%) |
Health & Disability in Fort Chiswell
Health Insurance Coverage by Age in Fort Chiswell
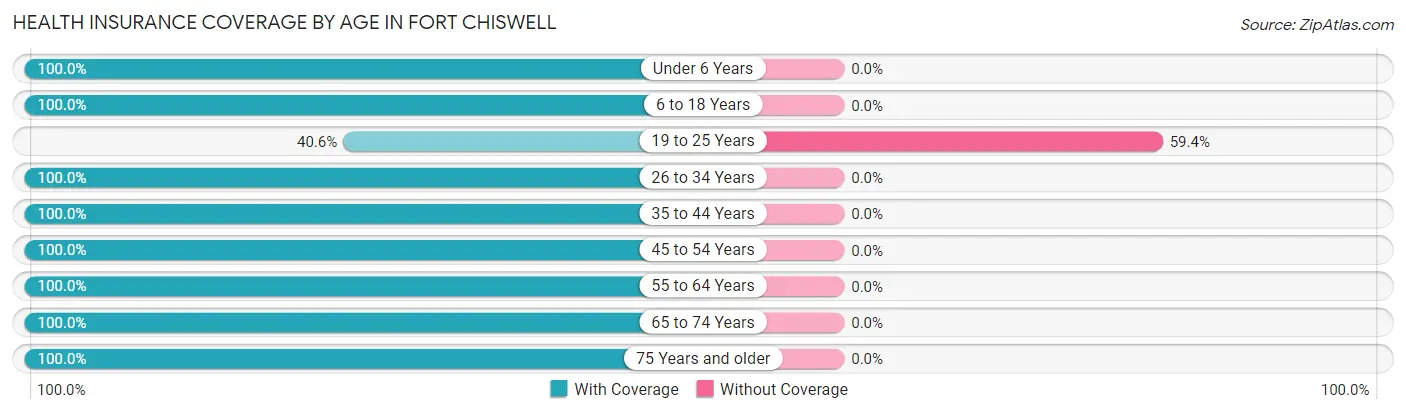
| Age Bracket | With Coverage | Without Coverage |
| Under 6 Years | 48 (100.0%) | 0 (0.0%) |
| 6 to 18 Years | 43 (100.0%) | 0 (0.0%) |
| 19 to 25 Years | 13 (40.6%) | 19 (59.4%) |
| 26 to 34 Years | 56 (100.0%) | 0 (0.0%) |
| 35 to 44 Years | 106 (100.0%) | 0 (0.0%) |
| 45 to 54 Years | 148 (100.0%) | 0 (0.0%) |
| 55 to 64 Years | 74 (100.0%) | 0 (0.0%) |
| 65 to 74 Years | 135 (100.0%) | 0 (0.0%) |
| 75 Years and older | 38 (100.0%) | 0 (0.0%) |
| Total | 661 (97.2%) | 19 (2.8%) |
Health Insurance Coverage by Citizenship Status in Fort Chiswell
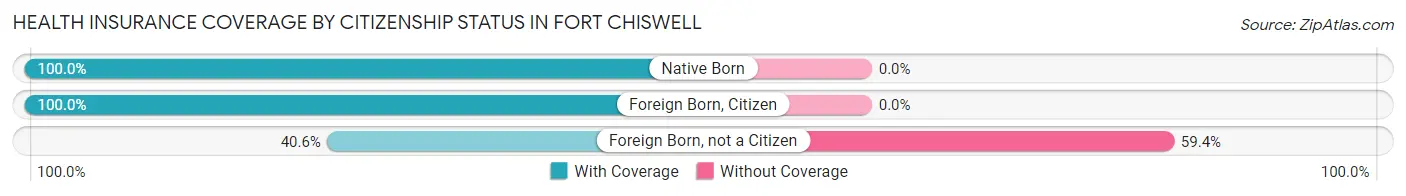
| Citizenship Status | With Coverage | Without Coverage |
| Native Born | 48 (100.0%) | 0 (0.0%) |
| Foreign Born, Citizen | 43 (100.0%) | 0 (0.0%) |
| Foreign Born, not a Citizen | 13 (40.6%) | 19 (59.4%) |
Health Insurance Coverage by Household Income in Fort Chiswell
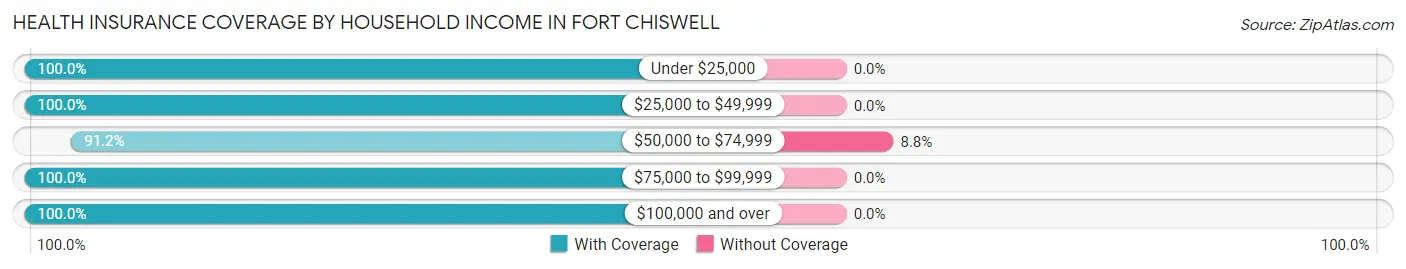
| Household Income | With Coverage | Without Coverage |
| Under $25,000 | 49 (100.0%) | 0 (0.0%) |
| $25,000 to $49,999 | 16 (100.0%) | 0 (0.0%) |
| $50,000 to $74,999 | 198 (91.2%) | 19 (8.8%) |
| $75,000 to $99,999 | 173 (100.0%) | 0 (0.0%) |
| $100,000 and over | 225 (100.0%) | 0 (0.0%) |
Public vs Private Health Insurance Coverage by Age in Fort Chiswell
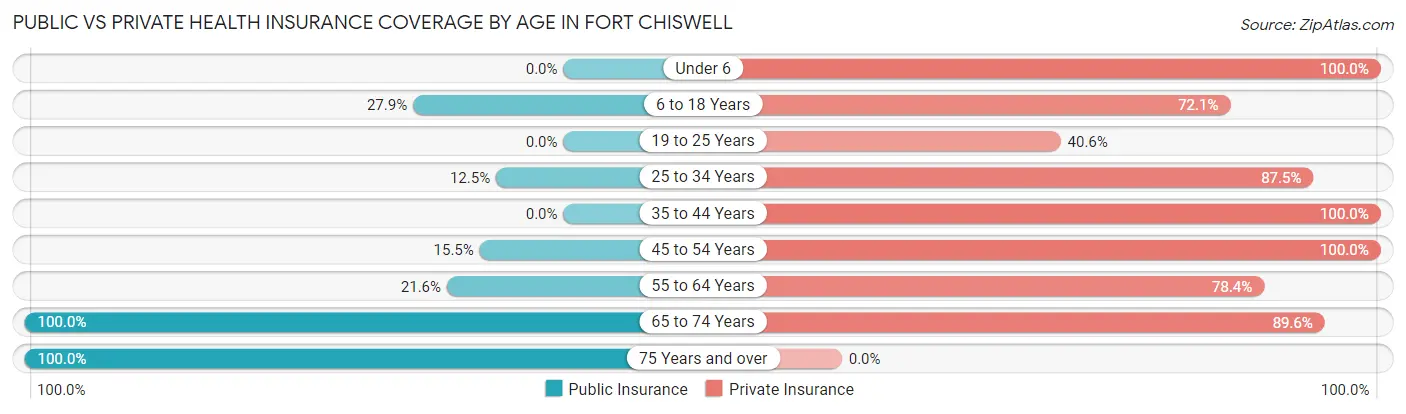
| Age Bracket | Public Insurance | Private Insurance |
| Under 6 | 0 (0.0%) | 48 (100.0%) |
| 6 to 18 Years | 12 (27.9%) | 31 (72.1%) |
| 19 to 25 Years | 0 (0.0%) | 13 (40.6%) |
| 25 to 34 Years | 7 (12.5%) | 49 (87.5%) |
| 35 to 44 Years | 0 (0.0%) | 106 (100.0%) |
| 45 to 54 Years | 23 (15.5%) | 148 (100.0%) |
| 55 to 64 Years | 16 (21.6%) | 58 (78.4%) |
| 65 to 74 Years | 135 (100.0%) | 121 (89.6%) |
| 75 Years and over | 38 (100.0%) | 0 (0.0%) |
| Total | 231 (34.0%) | 574 (84.4%) |
Disability Status by Sex by Age in Fort Chiswell
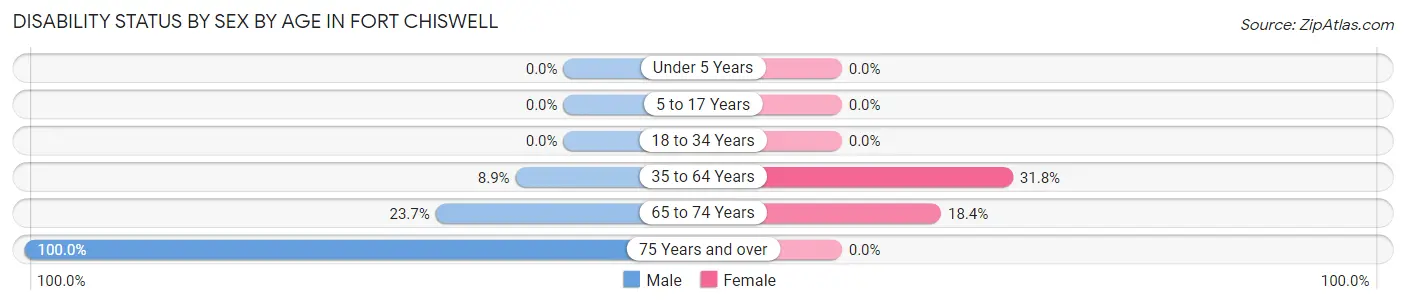
| Age Bracket | Male | Female |
| Under 5 Years | 0 (0.0%) | 0 (0.0%) |
| 5 to 17 Years | 0 (0.0%) | 0 (0.0%) |
| 18 to 34 Years | 0 (0.0%) | 0 (0.0%) |
| 35 to 64 Years | 16 (8.9%) | 47 (31.8%) |
| 65 to 74 Years | 14 (23.7%) | 14 (18.4%) |
| 75 Years and over | 28 (100.0%) | 0 (0.0%) |
Disability Class by Sex by Age in Fort Chiswell
Disability Class: Hearing Difficulty
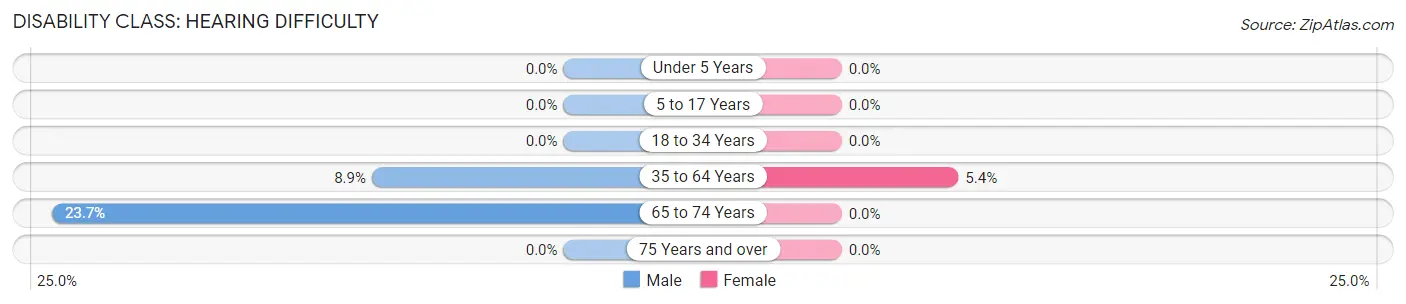
| Age Bracket | Male | Female |
| Under 5 Years | 0 (0.0%) | 0 (0.0%) |
| 5 to 17 Years | 0 (0.0%) | 0 (0.0%) |
| 18 to 34 Years | 0 (0.0%) | 0 (0.0%) |
| 35 to 64 Years | 16 (8.9%) | 8 (5.4%) |
| 65 to 74 Years | 14 (23.7%) | 0 (0.0%) |
| 75 Years and over | 0 (0.0%) | 0 (0.0%) |
Disability Class: Vision Difficulty
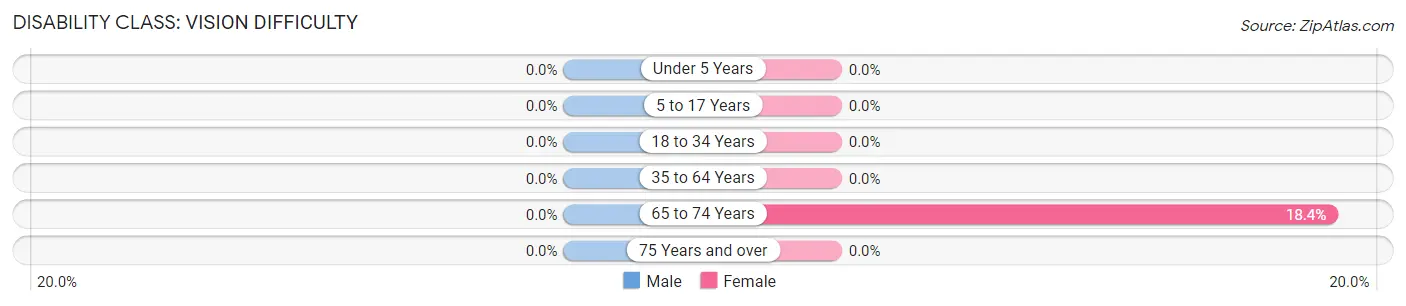
| Age Bracket | Male | Female |
| Under 5 Years | 0 (0.0%) | 0 (0.0%) |
| 5 to 17 Years | 0 (0.0%) | 0 (0.0%) |
| 18 to 34 Years | 0 (0.0%) | 0 (0.0%) |
| 35 to 64 Years | 0 (0.0%) | 0 (0.0%) |
| 65 to 74 Years | 0 (0.0%) | 14 (18.4%) |
| 75 Years and over | 0 (0.0%) | 0 (0.0%) |
Disability Class: Cognitive Difficulty
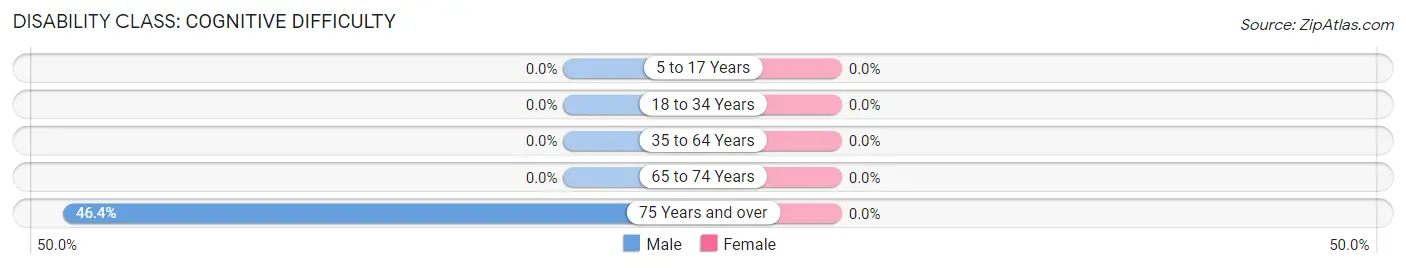
| Age Bracket | Male | Female |
| 5 to 17 Years | 0 (0.0%) | 0 (0.0%) |
| 18 to 34 Years | 0 (0.0%) | 0 (0.0%) |
| 35 to 64 Years | 0 (0.0%) | 0 (0.0%) |
| 65 to 74 Years | 0 (0.0%) | 0 (0.0%) |
| 75 Years and over | 13 (46.4%) | 0 (0.0%) |
Disability Class: Ambulatory Difficulty
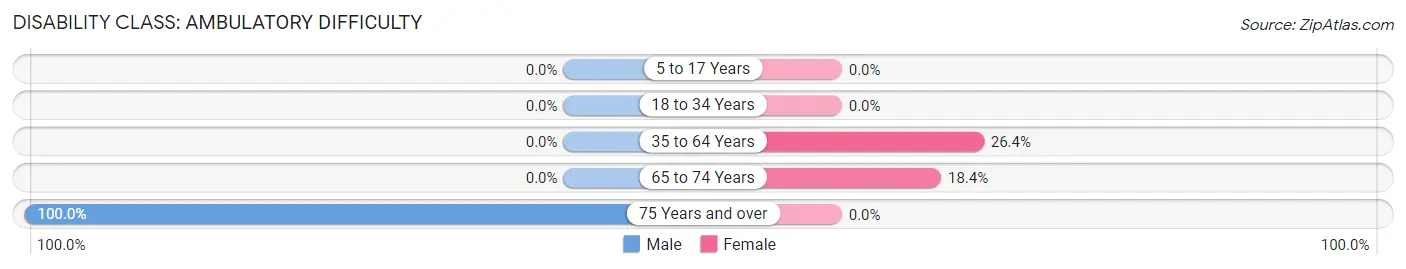
| Age Bracket | Male | Female |
| 5 to 17 Years | 0 (0.0%) | 0 (0.0%) |
| 18 to 34 Years | 0 (0.0%) | 0 (0.0%) |
| 35 to 64 Years | 0 (0.0%) | 39 (26.4%) |
| 65 to 74 Years | 0 (0.0%) | 14 (18.4%) |
| 75 Years and over | 28 (100.0%) | 0 (0.0%) |
Disability Class: Self-Care Difficulty
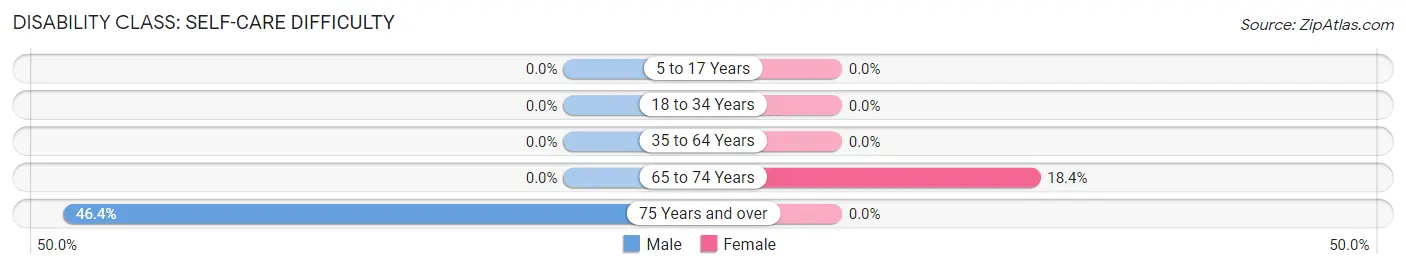
| Age Bracket | Male | Female |
| 5 to 17 Years | 0 (0.0%) | 0 (0.0%) |
| 18 to 34 Years | 0 (0.0%) | 0 (0.0%) |
| 35 to 64 Years | 0 (0.0%) | 0 (0.0%) |
| 65 to 74 Years | 0 (0.0%) | 14 (18.4%) |
| 75 Years and over | 13 (46.4%) | 0 (0.0%) |
Technology Access in Fort Chiswell
Computing Device Access in Fort Chiswell
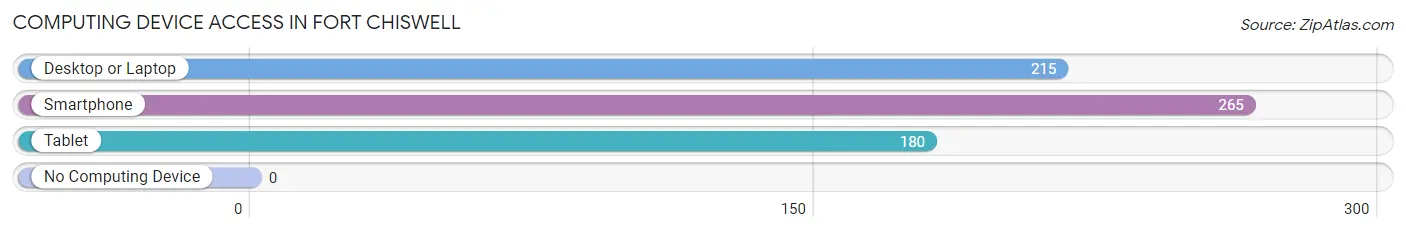
| Device Type | # Households | % Households |
| Desktop or Laptop | 215 | 76.8% |
| Smartphone | 265 | 94.6% |
| Tablet | 180 | 64.3% |
| No Computing Device | 0 | 0.0% |
| Total | 280 | 100.0% |
Internet Access in Fort Chiswell
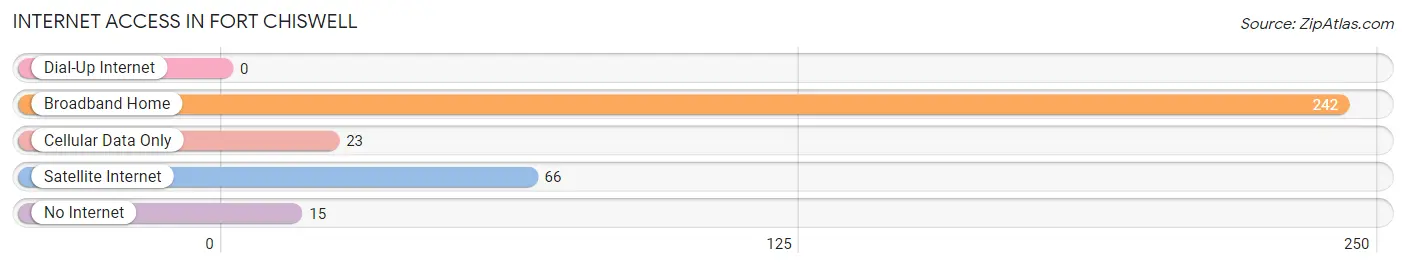
| Internet Type | # Households | % Households |
| Dial-Up Internet | 0 | 0.0% |
| Broadband Home | 242 | 86.4% |
| Cellular Data Only | 23 | 8.2% |
| Satellite Internet | 66 | 23.6% |
| No Internet | 15 | 5.4% |
| Total | 280 | 100.0% |
Fort Chiswell Summary
Fort Chiswell is a small unincorporated community located in Wythe County, Virginia. It is situated along the border of Virginia and West Virginia, and is part of the Blue Ridge Mountains. The town is named after a fort that was built in the area during the American Revolutionary War.
History
The area that is now Fort Chiswell was originally inhabited by the Cherokee and Shawnee Native American tribes. The first European settlers arrived in the area in the late 1700s. The town was named after a fort that was built in the area during the American Revolutionary War. The fort was named after Colonel Abraham Chiswell, who was a prominent figure in the area at the time.
The town was officially established in 1820, and it quickly became a popular stop for travelers on the Great Wagon Road. The town was also a major stop on the Virginia and Tennessee Railroad, which connected the town to other major cities in the region.
In the late 1800s, Fort Chiswell became a popular destination for tourists. The town was home to several resorts, including the Chiswell Springs Hotel, which was a popular destination for wealthy travelers.
The town was also home to several factories, including a woolen mill, a furniture factory, and a canning factory. These factories provided employment for many of the town’s residents.
Geography
Fort Chiswell is located in the Blue Ridge Mountains of southwestern Virginia. The town is situated along the border of Virginia and West Virginia, and is located about 30 miles south of Roanoke. The town is situated at an elevation of 1,890 feet above sea level.
The town is located in a valley that is surrounded by the Blue Ridge Mountains. The town is located near several rivers, including the New River, the Big Stony Creek, and the Little Stony Creek.
Economy
The economy of Fort Chiswell is largely based on tourism. The town is home to several resorts, including the Chiswell Springs Hotel, which is a popular destination for wealthy travelers. The town is also home to several factories, including a woolen mill, a furniture factory, and a canning factory.
The town is also home to several small businesses, including restaurants, shops, and other services. The town is also home to several farms, which produce a variety of crops, including corn, wheat, and hay.
Demographics
As of the 2010 census, the population of Fort Chiswell was 1,890. The town has a population density of 5.3 people per square mile. The median age of the town’s residents is 44.7 years.
The town is predominantly white, with 92.3% of the population identifying as white. The town also has a small African American population, with 4.2% of the population identifying as African American. The town also has a small Hispanic population, with 1.7% of the population identifying as Hispanic or Latino.
The median household income in Fort Chiswell is $37,917. The median home value in the town is $117,400. The town has a poverty rate of 16.3%.
Conclusion
Fort Chiswell is a small unincorporated community located in Wythe County, Virginia. The town is situated along the border of Virginia and West Virginia, and is part of the Blue Ridge Mountains. The town was named after a fort that was built in the area during the American Revolutionary War. The town’s economy is largely based on tourism, and it is home to several resorts, factories, and small businesses. The town has a population of 1,890, and the median household income is $37,917.
Common Questions
What is Per Capita Income in Fort Chiswell?
Per Capita income in Fort Chiswell is $36,351.
What is the Median Family Income in Fort Chiswell?
Median Family Income in Fort Chiswell is $83,475.
What is the Median Household income in Fort Chiswell?
Median Household Income in Fort Chiswell is $69,700.
What is Income or Wage Gap in Fort Chiswell?
Income or Wage Gap in Fort Chiswell is 10.2%.
Women in Fort Chiswell earn 89.8 cents for every dollar earned by a man.
What is Inequality or Gini Index in Fort Chiswell?
Inequality or Gini Index in Fort Chiswell is 0.30.
What is the Total Population of Fort Chiswell?
Total Population of Fort Chiswell is 680.
What is the Total Male Population of Fort Chiswell?
Total Male Population of Fort Chiswell is 347.
What is the Total Female Population of Fort Chiswell?
Total Female Population of Fort Chiswell is 333.
What is the Ratio of Males per 100 Females in Fort Chiswell?
There are 104.20 Males per 100 Females in Fort Chiswell.
What is the Ratio of Females per 100 Males in Fort Chiswell?
There are 95.97 Females per 100 Males in Fort Chiswell.
What is the Median Population Age in Fort Chiswell?
Median Population Age in Fort Chiswell is 49.1 Years.
What is the Average Family Size in Fort Chiswell
Average Family Size in Fort Chiswell is 2.7 People.
What is the Average Household Size in Fort Chiswell
Average Household Size in Fort Chiswell is 2.4 People.
How Large is the Labor Force in Fort Chiswell?
There are 421 People in the Labor Forcein in Fort Chiswell.
What is the Percentage of People in the Labor Force in Fort Chiswell?
69.6% of People are in the Labor Force in Fort Chiswell.