Selma, VA Map & Demographics
Selma Map
Selma Overview
$25,708
PER CAPITA INCOME
$68,317
AVG FAMILY INCOME
$58,750
AVG HOUSEHOLD INCOME
0.44
INEQUALITY / GINI INDEX
455
TOTAL POPULATION
199
MALE POPULATION
256
FEMALE POPULATION
77.73
MALES / 100 FEMALES
128.64
FEMALES / 100 MALES
34.8
MEDIAN AGE
3.6
AVG FAMILY SIZE
2.9
AVG HOUSEHOLD SIZE
177
LABOR FORCE [ PEOPLE ]
51.3%
PERCENT IN LABOR FORCE
Selma Zip Codes
Selma Area Codes
Income in Selma
Income Overview in Selma
Per Capita Income in Selma is $25,708, while median incomes of families and households are $68,317 and $58,750 respectively.
| Characteristic | Number | Measure |
| Per Capita Income | 455 | $25,708 |
| Median Family Income | 117 | $68,317 |
| Mean Family Income | 117 | $88,870 |
| Median Household Income | 155 | $58,750 |
| Mean Household Income | 155 | $73,290 |
| Income Deficit | 117 | $0 |
| Wage / Income Gap (%) | 455 | 0.00% |
| Wage / Income Gap ($) | 455 | 100.00¢ per $1 |
| Gini / Inequality Index | 455 | 0.44 |
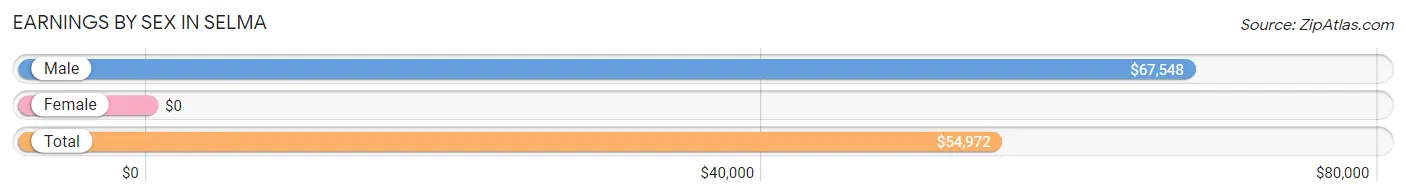
Earnings by Sex in Selma
| Sex | Number | Average Earnings |
| Male | 133 (75.1%) | $67,548 |
| Female | 44 (24.9%) | $0 |
| Total | 177 (100.0%) | $54,972 |
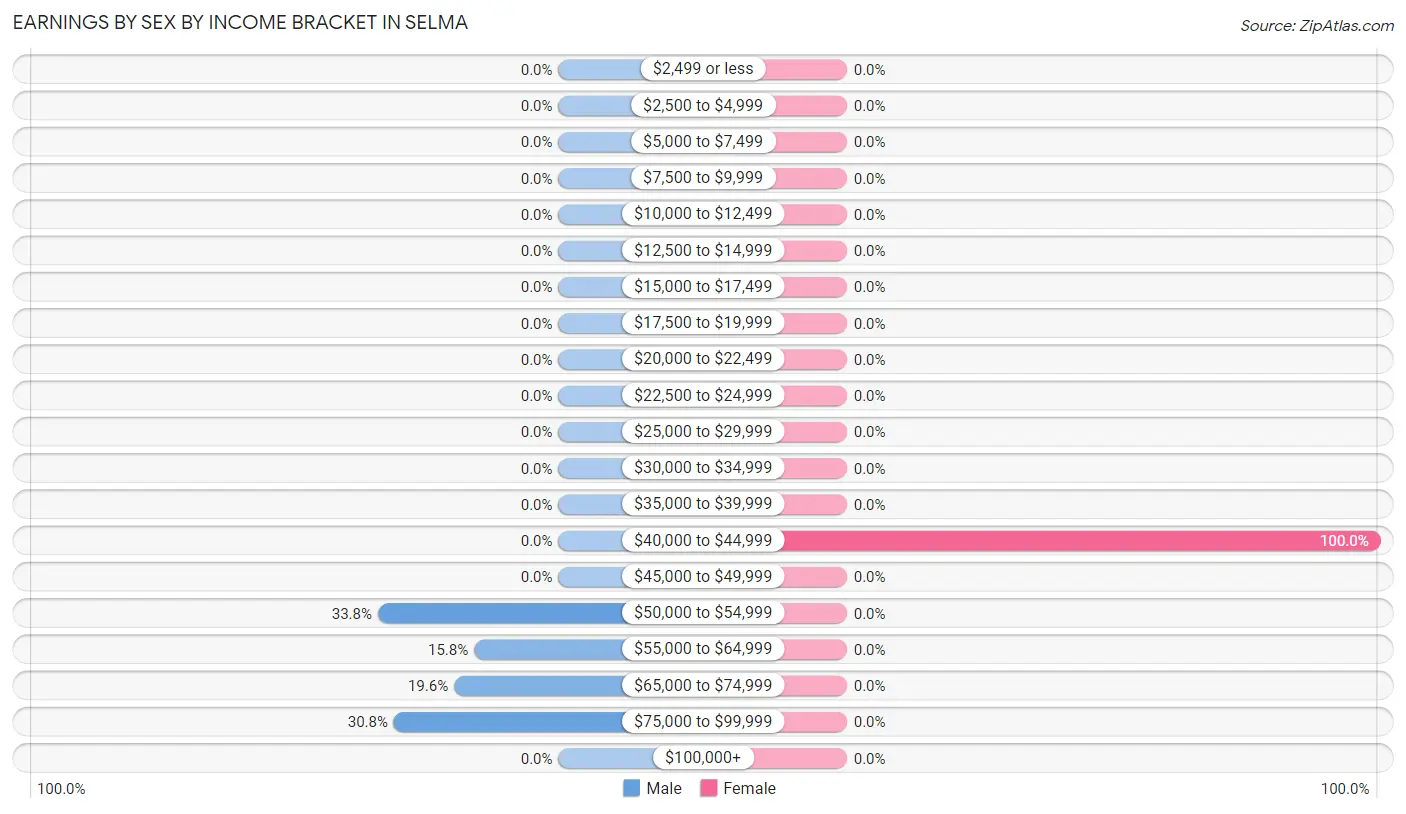
Earnings by Sex by Income Bracket in Selma
The most common earnings brackets in Selma are $50,000 to $54,999 for men (45 | 33.8%) and $40,000 to $44,999 for women (44 | 100.0%).
| Income | Male | Female |
| $2,499 or less | 0 (0.0%) | 0 (0.0%) |
| $2,500 to $4,999 | 0 (0.0%) | 0 (0.0%) |
| $5,000 to $7,499 | 0 (0.0%) | 0 (0.0%) |
| $7,500 to $9,999 | 0 (0.0%) | 0 (0.0%) |
| $10,000 to $12,499 | 0 (0.0%) | 0 (0.0%) |
| $12,500 to $14,999 | 0 (0.0%) | 0 (0.0%) |
| $15,000 to $17,499 | 0 (0.0%) | 0 (0.0%) |
| $17,500 to $19,999 | 0 (0.0%) | 0 (0.0%) |
| $20,000 to $22,499 | 0 (0.0%) | 0 (0.0%) |
| $22,500 to $24,999 | 0 (0.0%) | 0 (0.0%) |
| $25,000 to $29,999 | 0 (0.0%) | 0 (0.0%) |
| $30,000 to $34,999 | 0 (0.0%) | 0 (0.0%) |
| $35,000 to $39,999 | 0 (0.0%) | 0 (0.0%) |
| $40,000 to $44,999 | 0 (0.0%) | 44 (100.0%) |
| $45,000 to $49,999 | 0 (0.0%) | 0 (0.0%) |
| $50,000 to $54,999 | 45 (33.8%) | 0 (0.0%) |
| $55,000 to $64,999 | 21 (15.8%) | 0 (0.0%) |
| $65,000 to $74,999 | 26 (19.6%) | 0 (0.0%) |
| $75,000 to $99,999 | 41 (30.8%) | 0 (0.0%) |
| $100,000+ | 0 (0.0%) | 0 (0.0%) |
| Total | 133 (100.0%) | 44 (100.0%) |
Earnings by Sex by Educational Attainment in Selma
| Educational Attainment | Male Income | Female Income |
| Less than High School | - | - |
| High School Diploma | - | - |
| College or Associate's Degree | - | - |
| Bachelor's Degree | - | - |
| Graduate Degree | - | - |
| Total | $69,712 | $0 |
Family Income in Selma
Family Income Brackets in Selma
According to the Selma family income data, there are 47 families falling into the $50,000 to $74,999 income range, which is the most common income bracket and makes up 40.2% of all families.
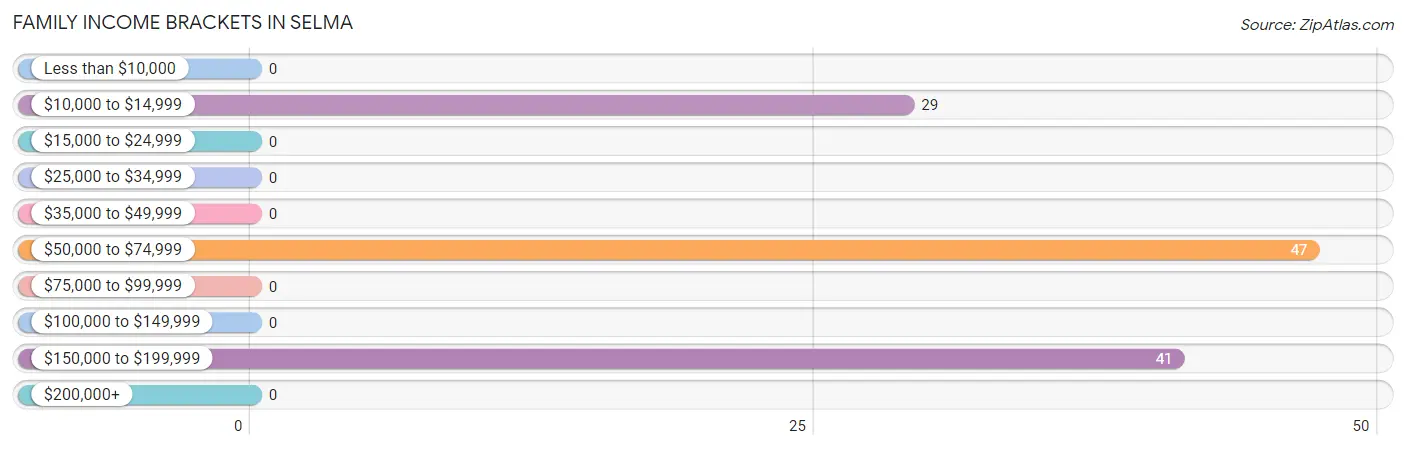
| Income Bracket | # Families | % Families |
| Less than $10,000 | 0 | 0.0% |
| $10,000 to $14,999 | 29 | 24.8% |
| $15,000 to $24,999 | 0 | 0.0% |
| $25,000 to $34,999 | 0 | 0.0% |
| $35,000 to $49,999 | 0 | 0.0% |
| $50,000 to $74,999 | 47 | 40.2% |
| $75,000 to $99,999 | 0 | 0.0% |
| $100,000 to $149,999 | 0 | 0.0% |
| $150,000 to $199,999 | 41 | 35.0% |
| $200,000+ | 0 | 0.0% |
Family Income by Famaliy Size in Selma
| Income Bracket | # Families | Median Income |
| 2-Person Families | 29 (24.8%) | $0 |
| 3-Person Families | 0 (0.0%) | $0 |
| 4-Person Families | 88 (75.2%) | $0 |
| 5-Person Families | 0 (0.0%) | $0 |
| 6-Person Families | 0 (0.0%) | $0 |
| 7+ Person Families | 0 (0.0%) | $0 |
| Total | 117 (100.0%) | $68,317 |
Family Income by Number of Earners in Selma
| Number of Earners | # Families | Median Income |
| No Earners | 29 (24.8%) | $0 |
| 1 Earner | 47 (40.2%) | $0 |
| 2 Earners | 0 (0.0%) | $0 |
| 3+ Earners | 41 (35.0%) | $0 |
| Total | 117 (100.0%) | $68,317 |
Household Income in Selma
Household Income Brackets in Selma
With 47 households falling in the category, the $50,000 to $74,999 income range is the most frequent in Selma, accounting for 30.3% of all households.
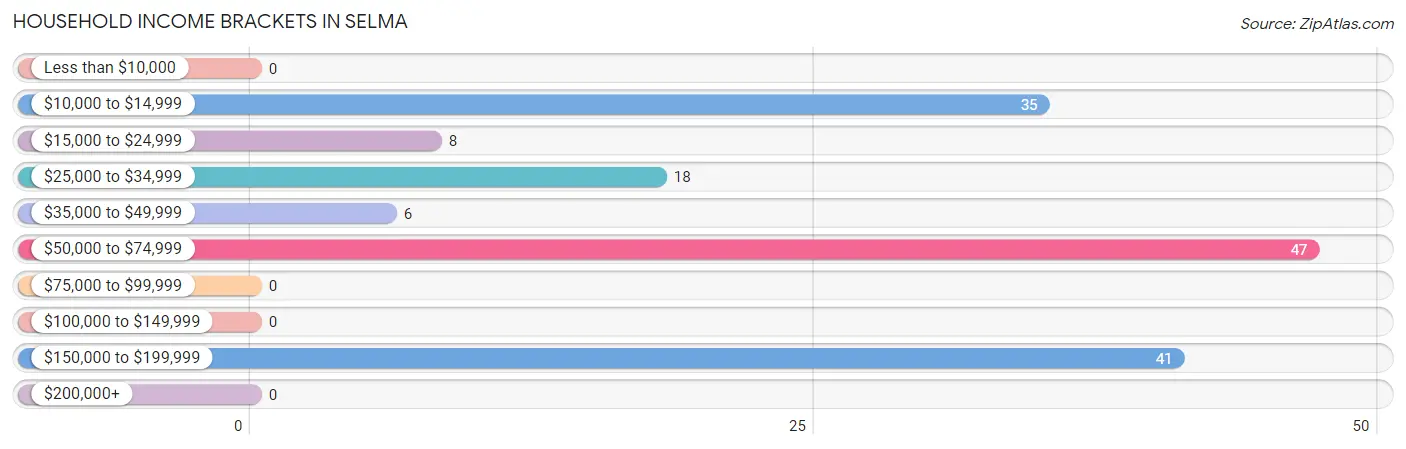
| Income Bracket | # Households | % Households |
| Less than $10,000 | 0 | 0.0% |
| $10,000 to $14,999 | 35 | 22.6% |
| $15,000 to $24,999 | 8 | 5.2% |
| $25,000 to $34,999 | 18 | 11.6% |
| $35,000 to $49,999 | 6 | 3.9% |
| $50,000 to $74,999 | 47 | 30.3% |
| $75,000 to $99,999 | 0 | 0.0% |
| $100,000 to $149,999 | 0 | 0.0% |
| $150,000 to $199,999 | 41 | 26.5% |
| $200,000+ | 0 | 0.0% |
Household Income by Householder Age in Selma
The median household income in Selma is $58,750, with the highest median household income of $28,194 found in the 65+ years age bracket for the primary householder. A total of 38 households (24.5%) fall into this category.
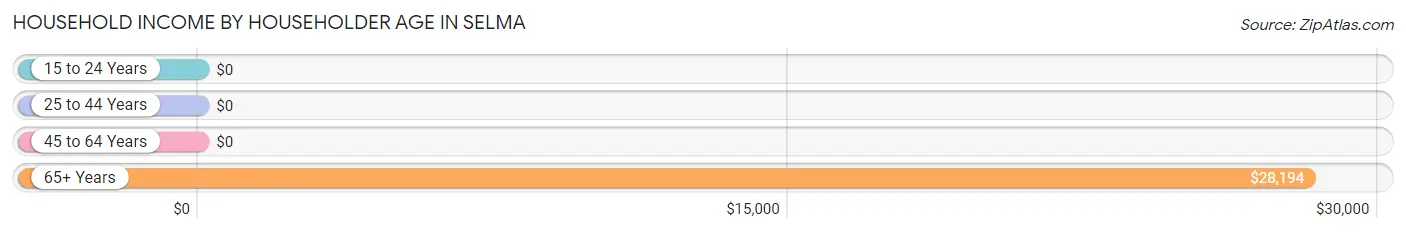
| Income Bracket | # Households | Median Income |
| 15 to 24 Years | 0 (0.0%) | $0 |
| 25 to 44 Years | 21 (13.6%) | $0 |
| 45 to 64 Years | 96 (61.9%) | $0 |
| 65+ Years | 38 (24.5%) | $28,194 |
| Total | 155 (100.0%) | $58,750 |
Poverty in Selma
Income Below Poverty by Sex and Age in Selma
With 14.6% poverty level for males and 14.1% for females among the residents of Selma, 55 to 64 year old males and 18 to 24 year old females are the most vulnerable to poverty, with 29 males (100.0%) and 30 females (100.0%) in their respective age groups living below the poverty level.
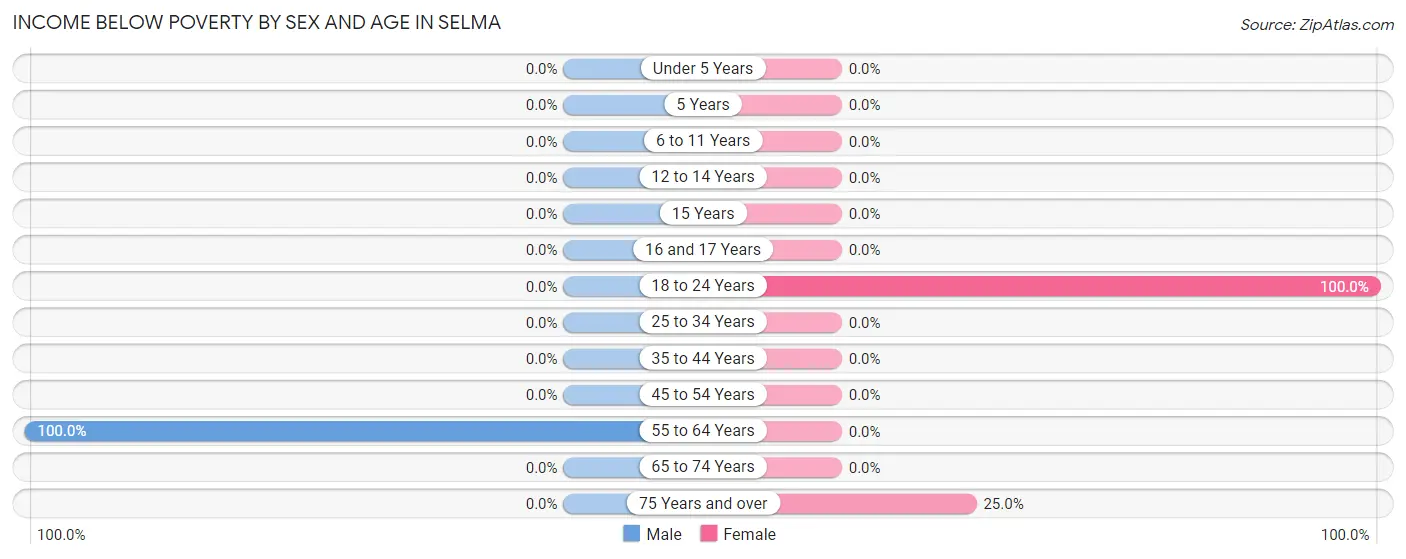
| Age Bracket | Male | Female |
| Under 5 Years | 0 (0.0%) | 0 (0.0%) |
| 5 Years | 0 (0.0%) | 0 (0.0%) |
| 6 to 11 Years | 0 (0.0%) | 0 (0.0%) |
| 12 to 14 Years | 0 (0.0%) | 0 (0.0%) |
| 15 Years | 0 (0.0%) | 0 (0.0%) |
| 16 and 17 Years | 0 (0.0%) | 0 (0.0%) |
| 18 to 24 Years | 0 (0.0%) | 30 (100.0%) |
| 25 to 34 Years | 0 (0.0%) | 0 (0.0%) |
| 35 to 44 Years | 0 (0.0%) | 0 (0.0%) |
| 45 to 54 Years | 0 (0.0%) | 0 (0.0%) |
| 55 to 64 Years | 29 (100.0%) | 0 (0.0%) |
| 65 to 74 Years | 0 (0.0%) | 0 (0.0%) |
| 75 Years and over | 0 (0.0%) | 6 (25.0%) |
| Total | 29 (14.6%) | 36 (14.1%) |
Income Above Poverty by Sex and Age in Selma
According to the poverty statistics in Selma, males aged 15 years and females aged under 5 years are the age groups that are most secure financially, with 100.0% of males and 100.0% of females in these age groups living above the poverty line.
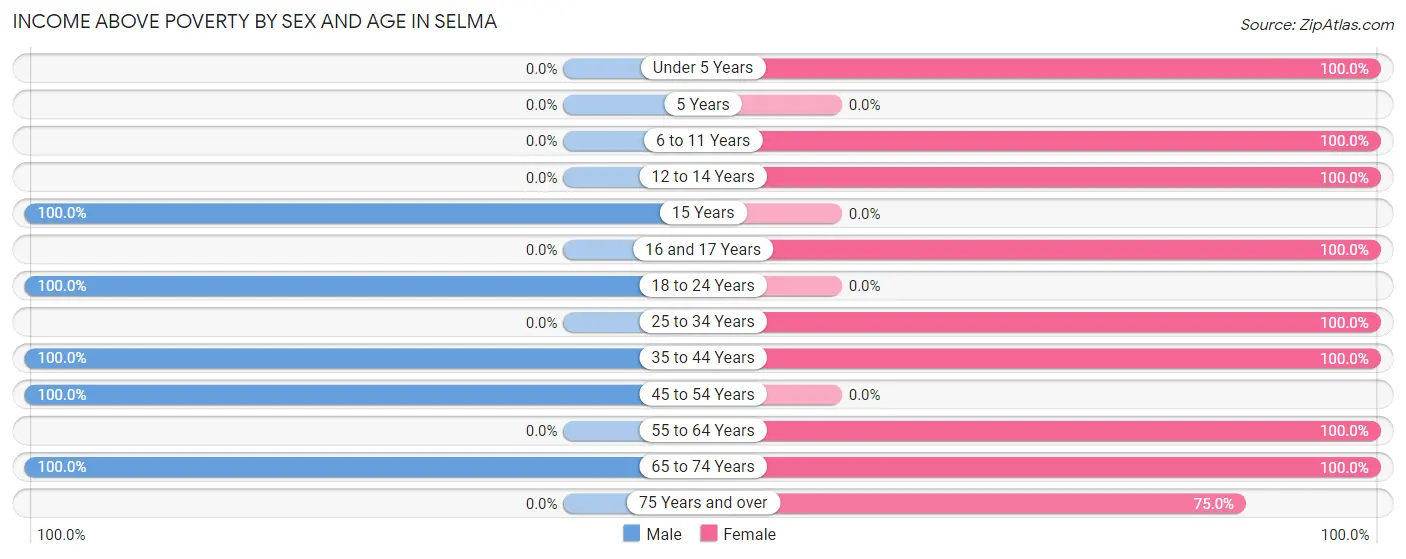
| Age Bracket | Male | Female |
| Under 5 Years | 0 (0.0%) | 16 (100.0%) |
| 5 Years | 0 (0.0%) | 0 (0.0%) |
| 6 to 11 Years | 0 (0.0%) | 25 (100.0%) |
| 12 to 14 Years | 0 (0.0%) | 38 (100.0%) |
| 15 Years | 31 (100.0%) | 0 (0.0%) |
| 16 and 17 Years | 0 (0.0%) | 26 (100.0%) |
| 18 to 24 Years | 45 (100.0%) | 0 (0.0%) |
| 25 to 34 Years | 0 (0.0%) | 21 (100.0%) |
| 35 to 44 Years | 21 (100.0%) | 44 (100.0%) |
| 45 to 54 Years | 67 (100.0%) | 0 (0.0%) |
| 55 to 64 Years | 0 (0.0%) | 24 (100.0%) |
| 65 to 74 Years | 6 (100.0%) | 8 (100.0%) |
| 75 Years and over | 0 (0.0%) | 18 (75.0%) |
| Total | 170 (85.4%) | 220 (85.9%) |
Income Below Poverty Among Married-Couple Families in Selma
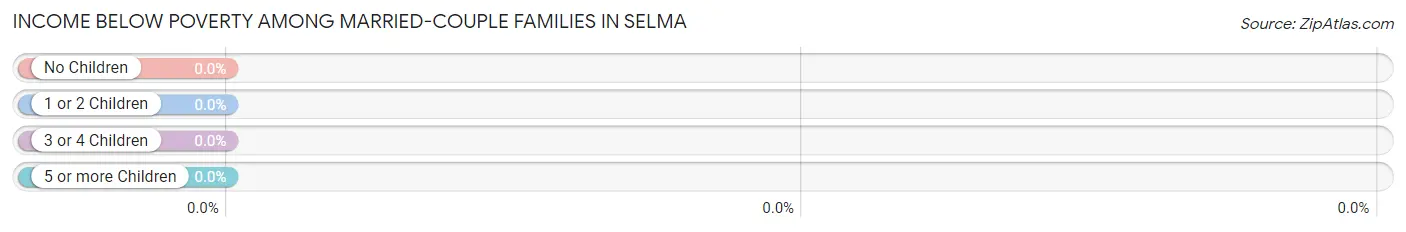
| Children | Above Poverty | Below Poverty |
| No Children | 0 (0.0%) | 0 (0.0%) |
| 1 or 2 Children | 88 (100.0%) | 0 (0.0%) |
| 3 or 4 Children | 0 (0.0%) | 0 (0.0%) |
| 5 or more Children | 0 (0.0%) | 0 (0.0%) |
| Total | 88 (100.0%) | 0 (0.0%) |
Income Below Poverty Among Single-Parent Households in Selma
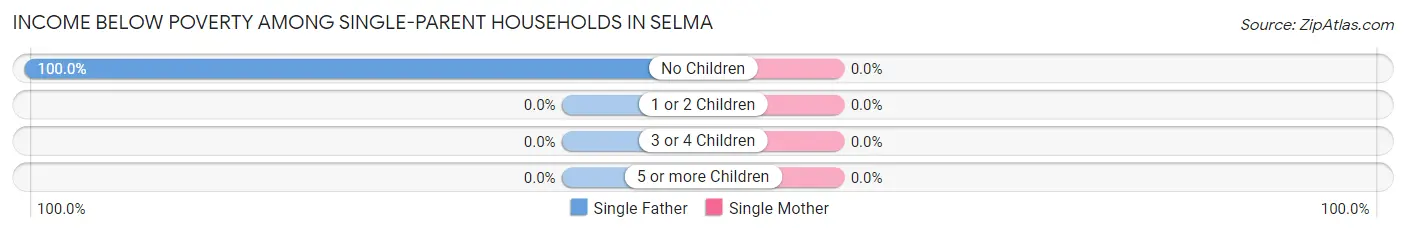
| Children | Single Father | Single Mother |
| No Children | 29 (100.0%) | 0 (0.0%) |
| 1 or 2 Children | 0 (0.0%) | 0 (0.0%) |
| 3 or 4 Children | 0 (0.0%) | 0 (0.0%) |
| 5 or more Children | 0 (0.0%) | 0 (0.0%) |
| Total | 29 (100.0%) | 0 (0.0%) |
Income Below Poverty Among Married-Couple vs Single-Parent Households in Selma
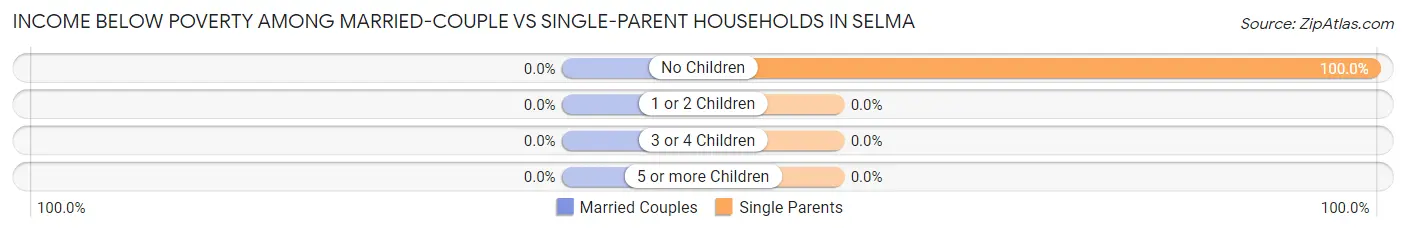
| Children | Married-Couple Families | Single-Parent Households |
| No Children | 0 (0.0%) | 29 (100.0%) |
| 1 or 2 Children | 0 (0.0%) | 0 (0.0%) |
| 3 or 4 Children | 0 (0.0%) | 0 (0.0%) |
| 5 or more Children | 0 (0.0%) | 0 (0.0%) |
| Total | 0 (0.0%) | 29 (100.0%) |
Race in Selma
The most populous races in Selma are , and White / Caucasian (455 | 100.0%).
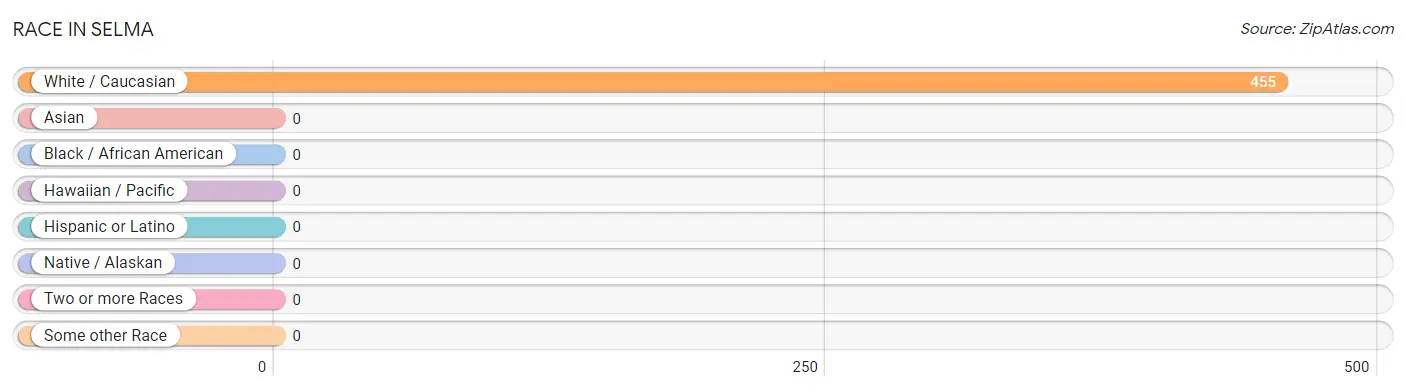
| Race | # Population | % Population |
| Asian | 0 | 0.0% |
| Black / African American | 0 | 0.0% |
| Hawaiian / Pacific | 0 | 0.0% |
| Hispanic or Latino | 0 | 0.0% |
| Native / Alaskan | 0 | 0.0% |
| White / Caucasian | 455 | 100.0% |
| Two or more Races | 0 | 0.0% |
| Some other Race | 0 | 0.0% |
| Total | 455 | 100.0% |
Ancestry in Selma
The most populous ancestries reported in Selma are Irish (91 | 20.0%), American (65 | 14.3%), English (18 | 4.0%), and German (6 | 1.3%), together accounting for 39.6% of all Selma residents.
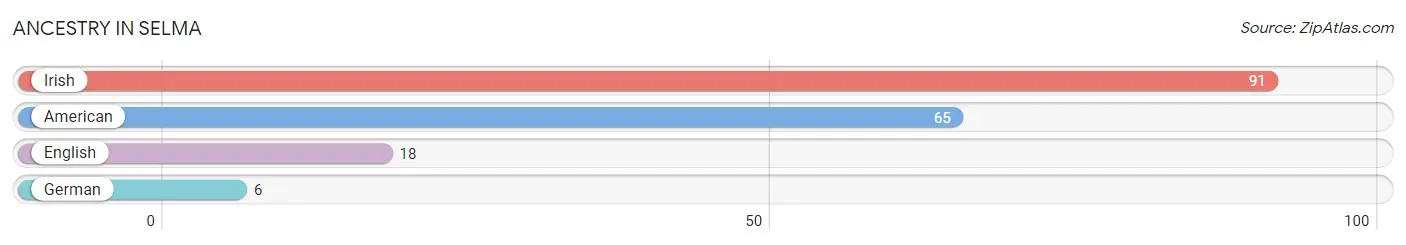
| Ancestry | # Population | % Population |
| American | 65 | 14.3% |
| English | 18 | 4.0% |
| German | 6 | 1.3% |
| Irish | 91 | 20.0% | View All 4 Rows |
Immigrants in Selma

| Immigration Origin | # Population | % Population | View All 0 Rows |
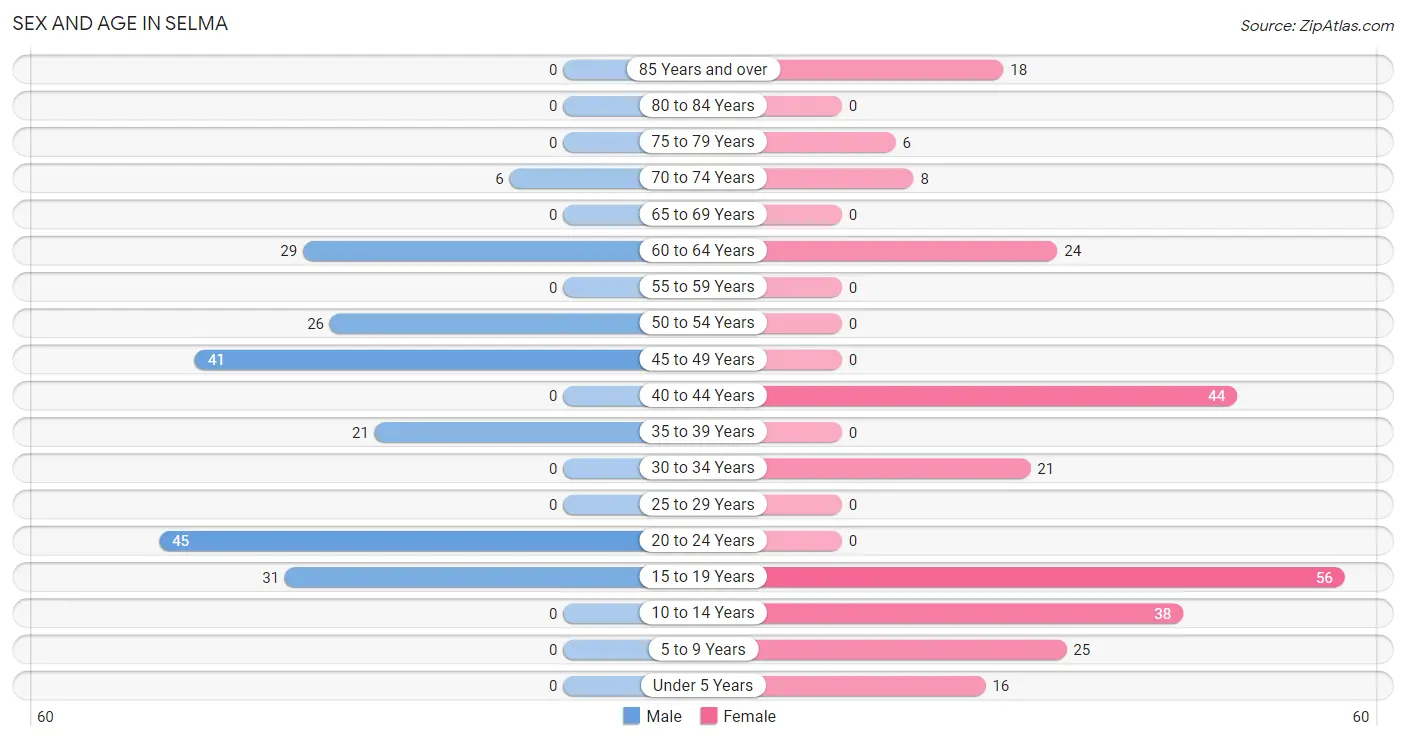
Sex and Age in Selma
Sex and Age in Selma
The most populous age groups in Selma are 20 to 24 Years (45 | 22.6%) for men and 15 to 19 Years (56 | 21.9%) for women.
| Age Bracket | Male | Female |
| Under 5 Years | 0 (0.0%) | 16 (6.2%) |
| 5 to 9 Years | 0 (0.0%) | 25 (9.8%) |
| 10 to 14 Years | 0 (0.0%) | 38 (14.8%) |
| 15 to 19 Years | 31 (15.6%) | 56 (21.9%) |
| 20 to 24 Years | 45 (22.6%) | 0 (0.0%) |
| 25 to 29 Years | 0 (0.0%) | 0 (0.0%) |
| 30 to 34 Years | 0 (0.0%) | 21 (8.2%) |
| 35 to 39 Years | 21 (10.5%) | 0 (0.0%) |
| 40 to 44 Years | 0 (0.0%) | 44 (17.2%) |
| 45 to 49 Years | 41 (20.6%) | 0 (0.0%) |
| 50 to 54 Years | 26 (13.1%) | 0 (0.0%) |
| 55 to 59 Years | 0 (0.0%) | 0 (0.0%) |
| 60 to 64 Years | 29 (14.6%) | 24 (9.4%) |
| 65 to 69 Years | 0 (0.0%) | 0 (0.0%) |
| 70 to 74 Years | 6 (3.0%) | 8 (3.1%) |
| 75 to 79 Years | 0 (0.0%) | 6 (2.3%) |
| 80 to 84 Years | 0 (0.0%) | 0 (0.0%) |
| 85 Years and over | 0 (0.0%) | 18 (7.0%) |
| Total | 199 (100.0%) | 256 (100.0%) |
Families and Households in Selma
Median Family Size in Selma
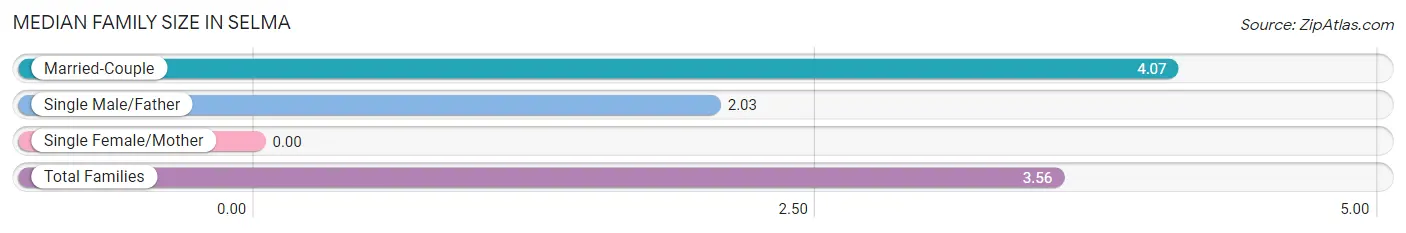
| Family Type | # Families | Family Size |
| Married-Couple | 88 (75.2%) | 4.07 |
| Single Male/Father | 29 (24.8%) | 2.03 |
| Single Female/Mother | 0 (0.0%) | - |
| Total Families | 117 (100.0%) | 3.56 |
Median Household Size in Selma
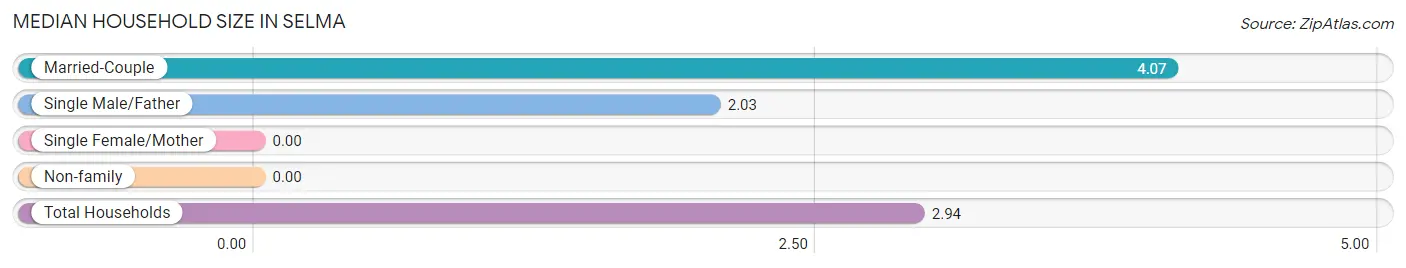
| Household Type | # Households | Household Size |
| Married-Couple | 88 (56.8%) | 4.07 |
| Single Male/Father | 29 (18.7%) | 2.03 |
| Single Female/Mother | 0 (0.0%) | - |
| Non-family | 38 (24.5%) | - |
| Total Households | 155 (100.0%) | 2.94 |
Household Size by Marriage Status in Selma
Out of a total of 155 households in Selma, 117 (75.5%) are family households, while 38 (24.5%) are nonfamily households. The most numerous type of family households are 4-person households, comprising 88, and the most common type of nonfamily households are 1-person households, comprising 38.
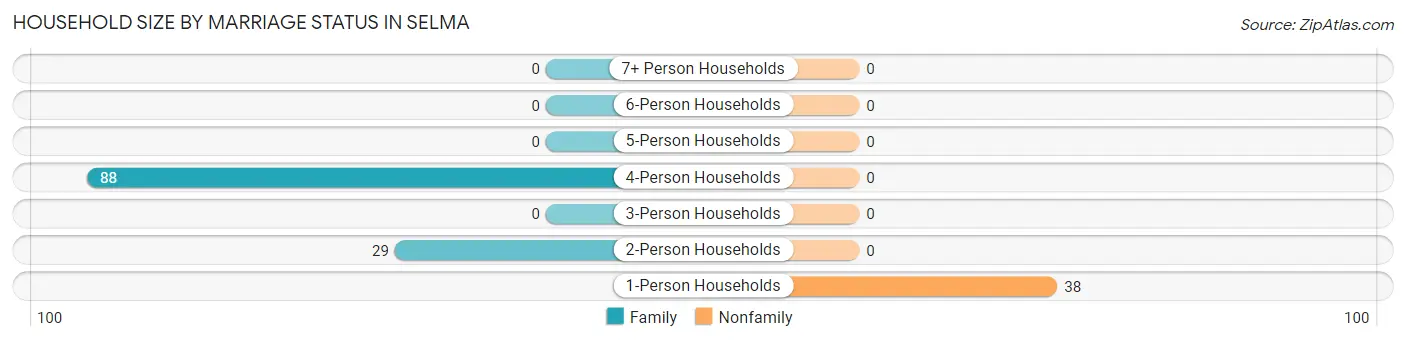
| Household Size | Family Households | Nonfamily Households |
| 1-Person Households | - | 38 (24.5%) |
| 2-Person Households | 29 (18.7%) | 0 (0.0%) |
| 3-Person Households | 0 (0.0%) | 0 (0.0%) |
| 4-Person Households | 88 (56.8%) | 0 (0.0%) |
| 5-Person Households | 0 (0.0%) | 0 (0.0%) |
| 6-Person Households | 0 (0.0%) | 0 (0.0%) |
| 7+ Person Households | 0 (0.0%) | 0 (0.0%) |
| Total | 117 (75.5%) | 38 (24.5%) |
Female Fertility in Selma
Fertility by Age in Selma
| Age Bracket | Women with Births | Births / 1,000 Women |
| 15 to 19 years | 0 (0.0%) | 0.0 |
| 20 to 34 years | 0 (0.0%) | 0.0 |
| 35 to 50 years | 0 (0.0%) | 0.0 |
| Total | 0 (0.0%) | 0.0 |
Fertility by Age by Marriage Status in Selma
| Age Bracket | Married | Unmarried |
| 15 to 19 years | 0 (0.0%) | 0 (0.0%) |
| 20 to 34 years | 0 (0.0%) | 0 (0.0%) |
| 35 to 50 years | 0 (0.0%) | 0 (0.0%) |
| Total | 0 (0.0%) | 0 (0.0%) |
Fertility by Education in Selma
| Educational Attainment | Women with Births | Births / 1,000 Women |
| Less than High School | 0 (0.0%) | 0.0 |
| High School Diploma | 0 (0.0%) | 0.0 |
| College or Associate's Degree | 0 (0.0%) | 0.0 |
| Bachelor's Degree | 0 (0.0%) | 0.0 |
| Graduate Degree | 0 (0.0%) | 0.0 |
| Total | 0 (0.0%) | 0.0 |
Fertility by Education by Marriage Status in Selma
| Educational Attainment | Married | Unmarried |
| Less than High School | 0 (0.0%) | 0 (0.0%) |
| High School Diploma | 0 (0.0%) | 0 (0.0%) |
| College or Associate's Degree | 0 (0.0%) | 0 (0.0%) |
| Bachelor's Degree | 0 (0.0%) | 0 (0.0%) |
| Graduate Degree | 0 (0.0%) | 0 (0.0%) |
| Total | 0 (0.0%) | 0 (0.0%) |
Employment Characteristics in Selma
Employment by Class of Employer in Selma
Among the 177 employed individuals in Selma, private company employees (112 | 63.3%), and federal government employees (65 | 36.7%) make up the most common classes of employment.
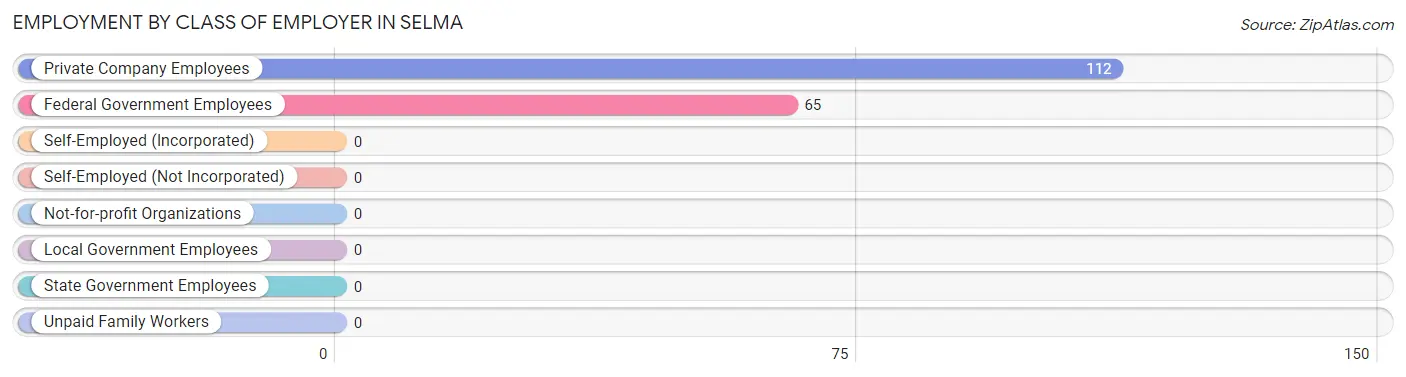
| Employer Class | # Employees | % Employees |
| Private Company Employees | 112 | 63.3% |
| Self-Employed (Incorporated) | 0 | 0.0% |
| Self-Employed (Not Incorporated) | 0 | 0.0% |
| Not-for-profit Organizations | 0 | 0.0% |
| Local Government Employees | 0 | 0.0% |
| State Government Employees | 0 | 0.0% |
| Federal Government Employees | 65 | 36.7% |
| Unpaid Family Workers | 0 | 0.0% |
| Total | 177 | 100.0% |
Employment Status by Age in Selma
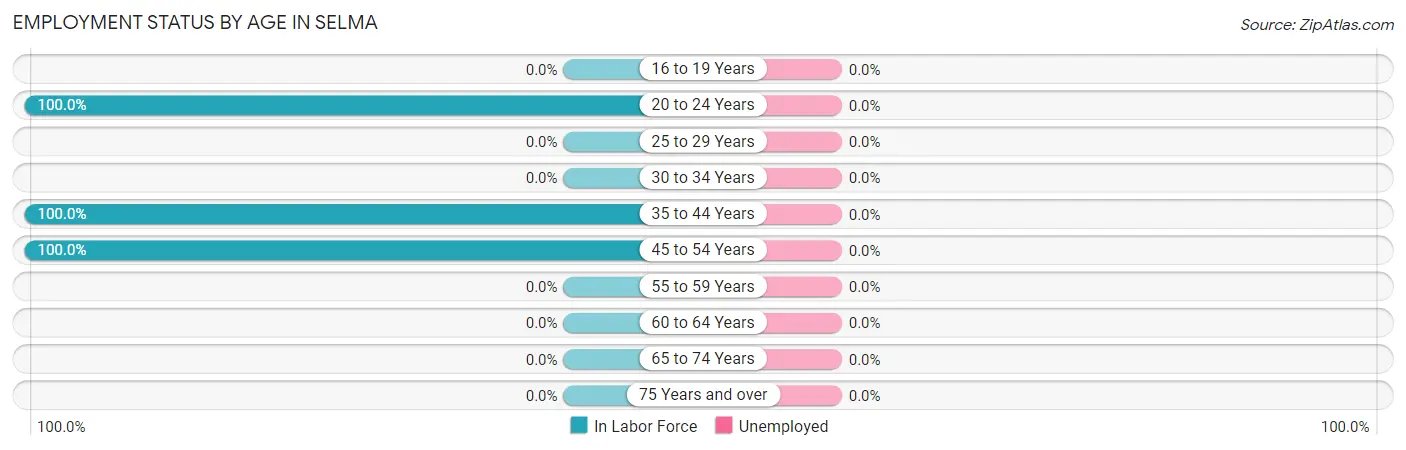
| Age Bracket | In Labor Force | Unemployed |
| 16 to 19 Years | 0 (0.0%) | 0 (0.0%) |
| 20 to 24 Years | 45 (100.0%) | 0 (0.0%) |
| 25 to 29 Years | 0 (0.0%) | 0 (0.0%) |
| 30 to 34 Years | 0 (0.0%) | 0 (0.0%) |
| 35 to 44 Years | 65 (100.0%) | 0 (0.0%) |
| 45 to 54 Years | 67 (100.0%) | 0 (0.0%) |
| 55 to 59 Years | 0 (0.0%) | 0 (0.0%) |
| 60 to 64 Years | 0 (0.0%) | 0 (0.0%) |
| 65 to 74 Years | 0 (0.0%) | 0 (0.0%) |
| 75 Years and over | 0 (0.0%) | 0 (0.0%) |
| Total | 177 (51.3%) | 0 (0.0%) |
Employment Status by Educational Attainment in Selma
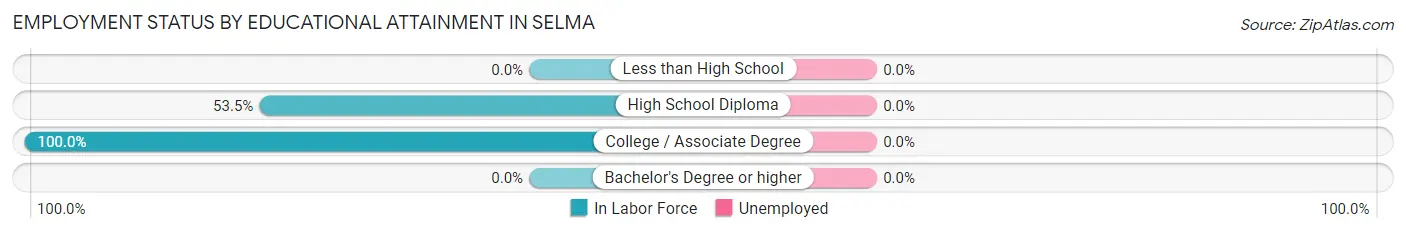
| Educational Attainment | In Labor Force | Unemployed |
| Less than High School | 0 (0.0%) | 0 (0.0%) |
| High School Diploma | 85 (53.5%) | 0 (0.0%) |
| College / Associate Degree | 47 (100.0%) | 0 (0.0%) |
| Bachelor's Degree or higher | 0 (0.0%) | 0 (0.0%) |
| Total | 132 (64.1%) | 0 (0.0%) |
Employment Occupations by Sex in Selma
Management, Business, Science and Arts Occupations
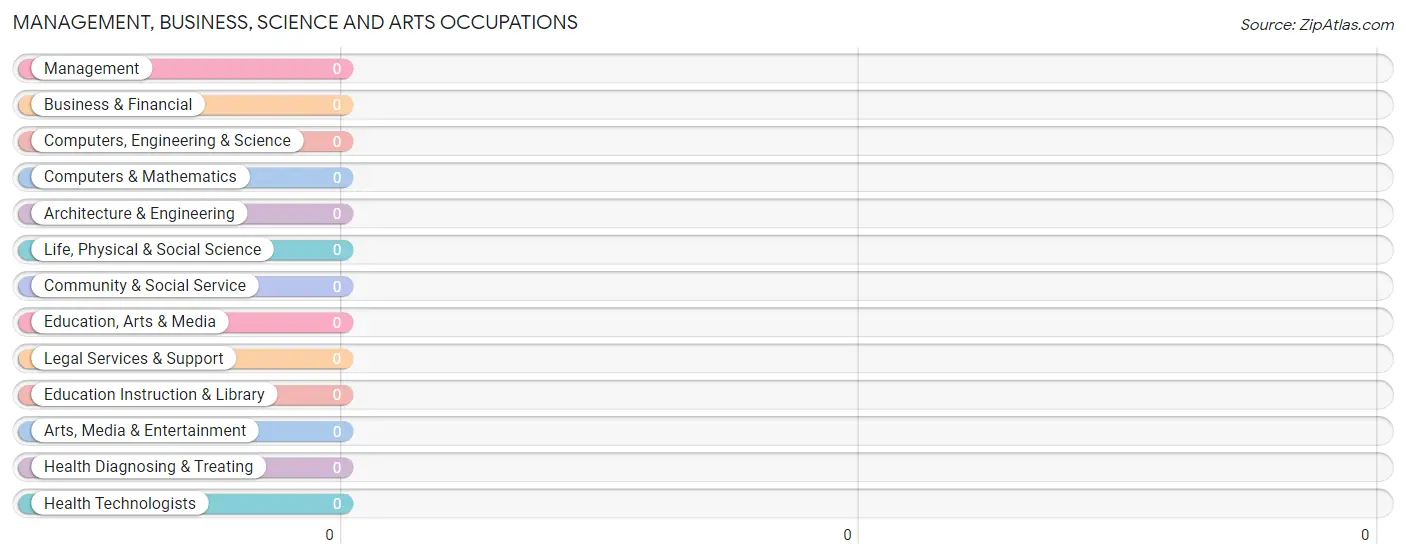
Management, Business, Science and Arts Occupations by Sex
| Occupation | Male | Female |
| Management | 0 (0.0%) | 0 (0.0%) |
| Business & Financial | 0 (0.0%) | 0 (0.0%) |
| Computers, Engineering & Science | 0 (0.0%) | 0 (0.0%) |
| Computers & Mathematics | 0 (0.0%) | 0 (0.0%) |
| Architecture & Engineering | 0 (0.0%) | 0 (0.0%) |
| Life, Physical & Social Science | 0 (0.0%) | 0 (0.0%) |
| Community & Social Service | 0 (0.0%) | 0 (0.0%) |
| Education, Arts & Media | 0 (0.0%) | 0 (0.0%) |
| Legal Services & Support | 0 (0.0%) | 0 (0.0%) |
| Education Instruction & Library | 0 (0.0%) | 0 (0.0%) |
| Arts, Media & Entertainment | 0 (0.0%) | 0 (0.0%) |
| Health Diagnosing & Treating | 0 (0.0%) | 0 (0.0%) |
| Health Technologists | 0 (0.0%) | 0 (0.0%) |
| Total (Category) | 0 (0.0%) | 0 (0.0%) |
| Total (Overall) | 112 (71.8%) | 44 (28.2%) |
Services Occupations
Services Occupations by Sex
| Occupation | Male | Female |
| Healthcare Support | 0 (0.0%) | 0 (0.0%) |
| Security & Protection | 0 (0.0%) | 0 (0.0%) |
| Firefighting & Prevention | 0 (0.0%) | 0 (0.0%) |
| Law Enforcement | 0 (0.0%) | 0 (0.0%) |
| Food Preparation & Serving | 0 (0.0%) | 0 (0.0%) |
| Cleaning & Maintenance | 0 (0.0%) | 0 (0.0%) |
| Personal Care & Service | 0 (0.0%) | 0 (0.0%) |
| Total (Category) | 0 (0.0%) | 0 (0.0%) |
| Total (Overall) | 112 (71.8%) | 44 (28.2%) |
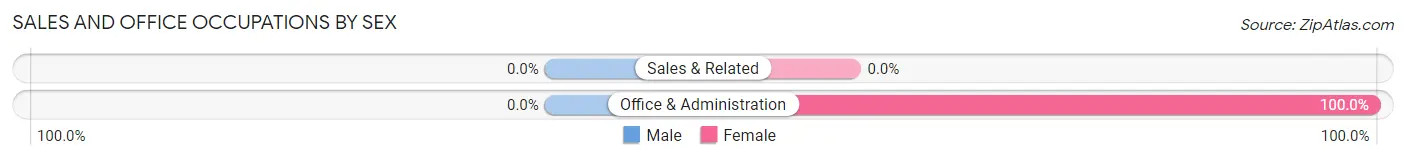
Sales and Office Occupations
The most common Sales and Office occupations in Selma are , and Office & Administration (44 | 28.2%).
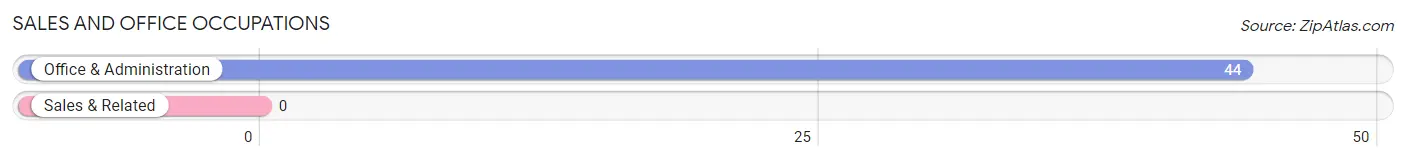
Sales and Office Occupations by Sex
| Occupation | Male | Female |
| Sales & Related | 0 (0.0%) | 0 (0.0%) |
| Office & Administration | 0 (0.0%) | 44 (100.0%) |
| Total (Category) | 0 (0.0%) | 44 (100.0%) |
| Total (Overall) | 112 (71.8%) | 44 (28.2%) |
Natural Resources, Construction and Maintenance Occupations
Natural Resources, Construction and Maintenance Occupations by Sex
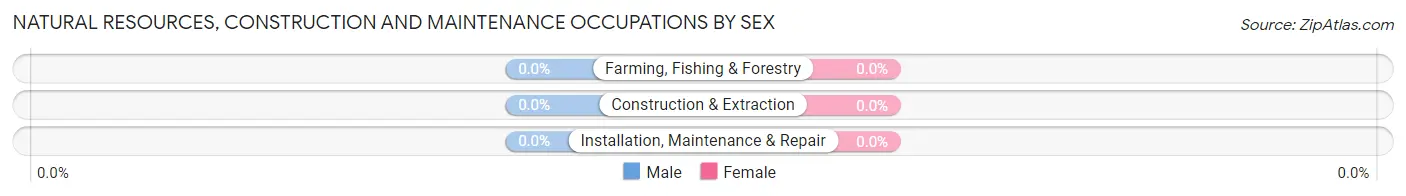
| Occupation | Male | Female |
| Farming, Fishing & Forestry | 0 (0.0%) | 0 (0.0%) |
| Construction & Extraction | 0 (0.0%) | 0 (0.0%) |
| Installation, Maintenance & Repair | 0 (0.0%) | 0 (0.0%) |
| Total (Category) | 0 (0.0%) | 0 (0.0%) |
| Total (Overall) | 112 (71.8%) | 44 (28.2%) |
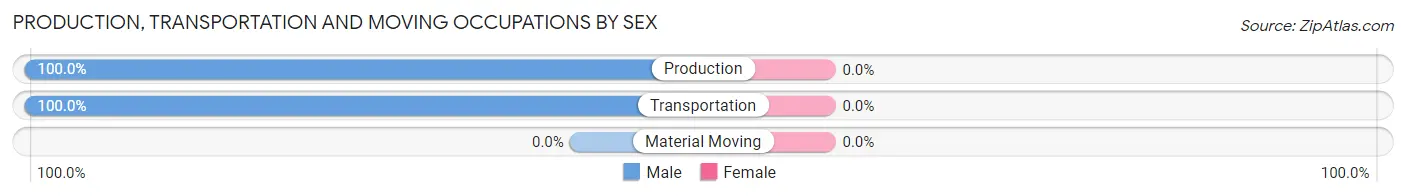
Production, Transportation and Moving Occupations
The most common Production, Transportation and Moving occupations in Selma are Production (67 | 42.9%), and Transportation (45 | 28.8%).
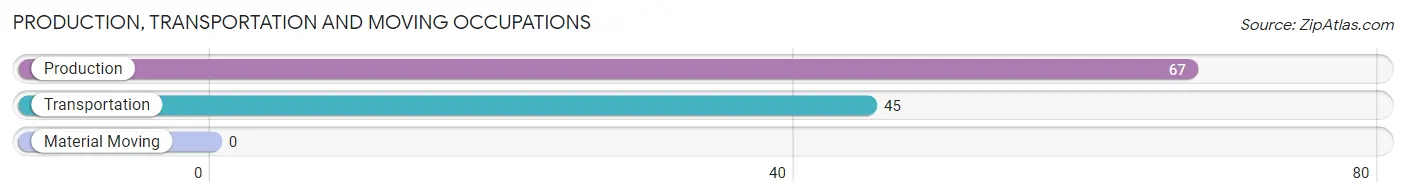
Production, Transportation and Moving Occupations by Sex
| Occupation | Male | Female |
| Production | 67 (100.0%) | 0 (0.0%) |
| Transportation | 45 (100.0%) | 0 (0.0%) |
| Material Moving | 0 (0.0%) | 0 (0.0%) |
| Total (Category) | 112 (100.0%) | 0 (0.0%) |
| Total (Overall) | 112 (71.8%) | 44 (28.2%) |
Employment Industries by Sex in Selma
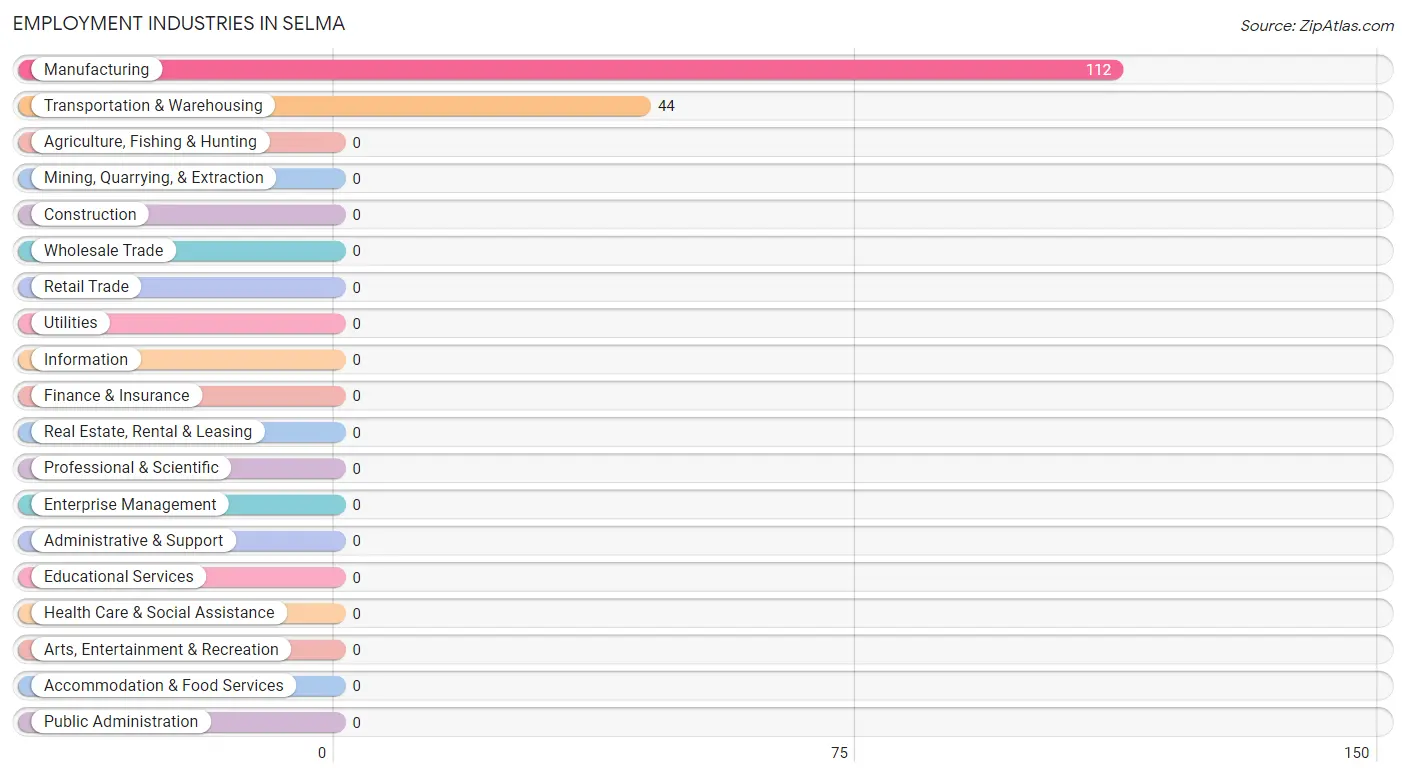
Employment Industries in Selma
The major employment industries in Selma include Manufacturing (112 | 71.8%), and Transportation & Warehousing (44 | 28.2%).
Employment Industries by Sex in Selma
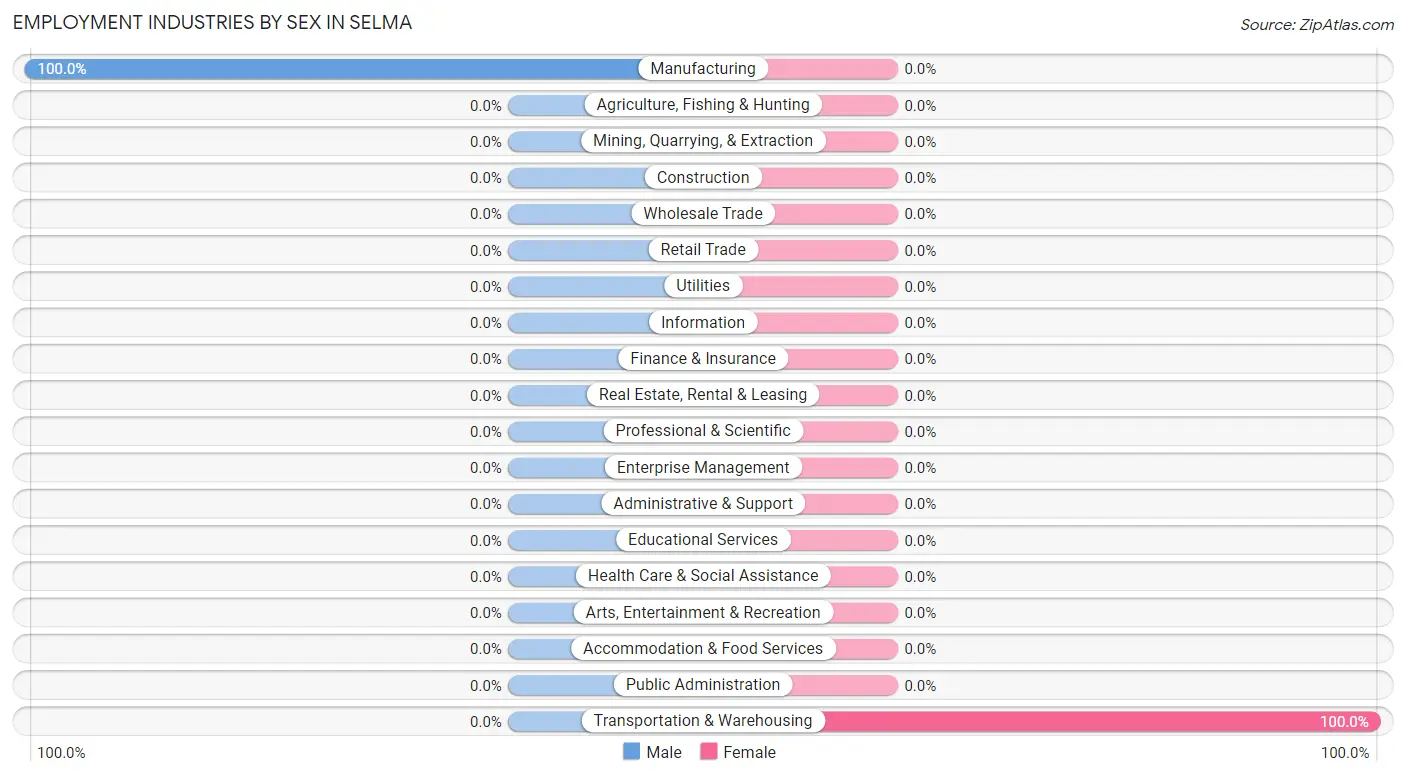
| Industry | Male | Female |
| Agriculture, Fishing & Hunting | 0 (0.0%) | 0 (0.0%) |
| Mining, Quarrying, & Extraction | 0 (0.0%) | 0 (0.0%) |
| Construction | 0 (0.0%) | 0 (0.0%) |
| Manufacturing | 112 (100.0%) | 0 (0.0%) |
| Wholesale Trade | 0 (0.0%) | 0 (0.0%) |
| Retail Trade | 0 (0.0%) | 0 (0.0%) |
| Transportation & Warehousing | 0 (0.0%) | 44 (100.0%) |
| Utilities | 0 (0.0%) | 0 (0.0%) |
| Information | 0 (0.0%) | 0 (0.0%) |
| Finance & Insurance | 0 (0.0%) | 0 (0.0%) |
| Real Estate, Rental & Leasing | 0 (0.0%) | 0 (0.0%) |
| Professional & Scientific | 0 (0.0%) | 0 (0.0%) |
| Enterprise Management | 0 (0.0%) | 0 (0.0%) |
| Administrative & Support | 0 (0.0%) | 0 (0.0%) |
| Educational Services | 0 (0.0%) | 0 (0.0%) |
| Health Care & Social Assistance | 0 (0.0%) | 0 (0.0%) |
| Arts, Entertainment & Recreation | 0 (0.0%) | 0 (0.0%) |
| Accommodation & Food Services | 0 (0.0%) | 0 (0.0%) |
| Public Administration | 0 (0.0%) | 0 (0.0%) |
| Total | 112 (71.8%) | 44 (28.2%) |
Education in Selma
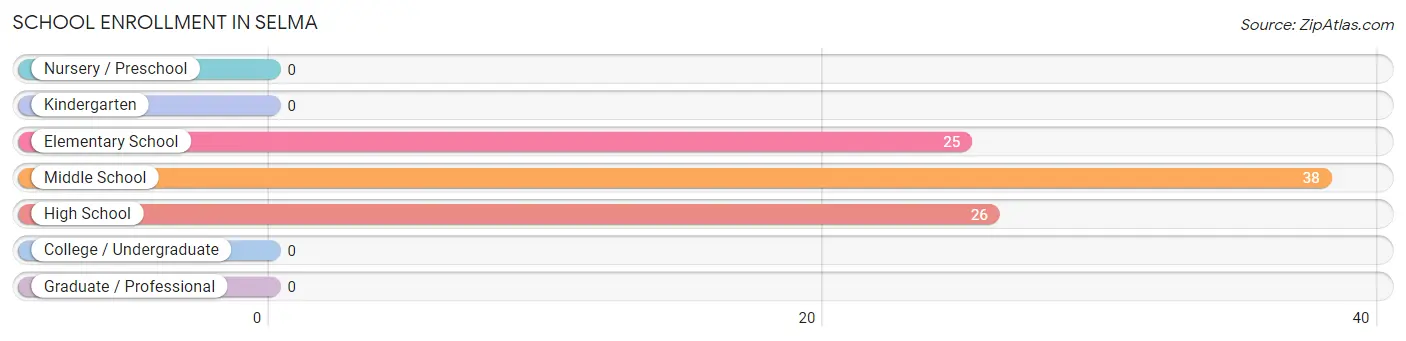
School Enrollment in Selma
The most common levels of schooling among the 89 students in Selma are middle school (38 | 42.7%), high school (26 | 29.2%), and elementary school (25 | 28.1%).
| School Level | # Students | % Students |
| Nursery / Preschool | 0 | 0.0% |
| Kindergarten | 0 | 0.0% |
| Elementary School | 25 | 28.1% |
| Middle School | 38 | 42.7% |
| High School | 26 | 29.2% |
| College / Undergraduate | 0 | 0.0% |
| Graduate / Professional | 0 | 0.0% |
| Total | 89 | 100.0% |
School Enrollment by Age by Funding Source in Selma
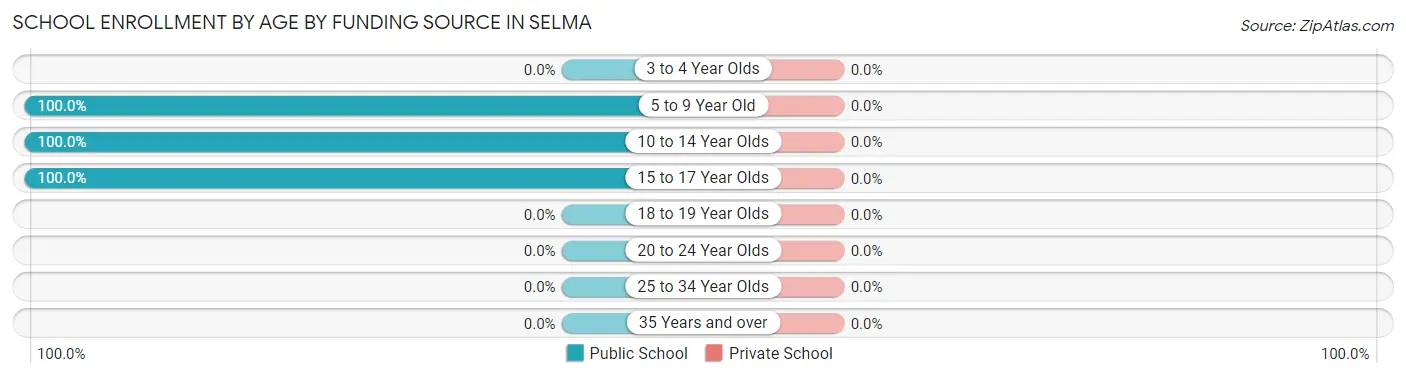
| Age Bracket | Public School | Private School |
| 3 to 4 Year Olds | 0 (0.0%) | 0 (0.0%) |
| 5 to 9 Year Old | 25 (100.0%) | 0 (0.0%) |
| 10 to 14 Year Olds | 38 (100.0%) | 0 (0.0%) |
| 15 to 17 Year Olds | 26 (100.0%) | 0 (0.0%) |
| 18 to 19 Year Olds | 0 (0.0%) | 0 (0.0%) |
| 20 to 24 Year Olds | 0 (0.0%) | 0 (0.0%) |
| 25 to 34 Year Olds | 0 (0.0%) | 0 (0.0%) |
| 35 Years and over | 0 (0.0%) | 0 (0.0%) |
| Total | 89 (100.0%) | 0 (0.0%) |
Educational Attainment by Field of Study in Selma
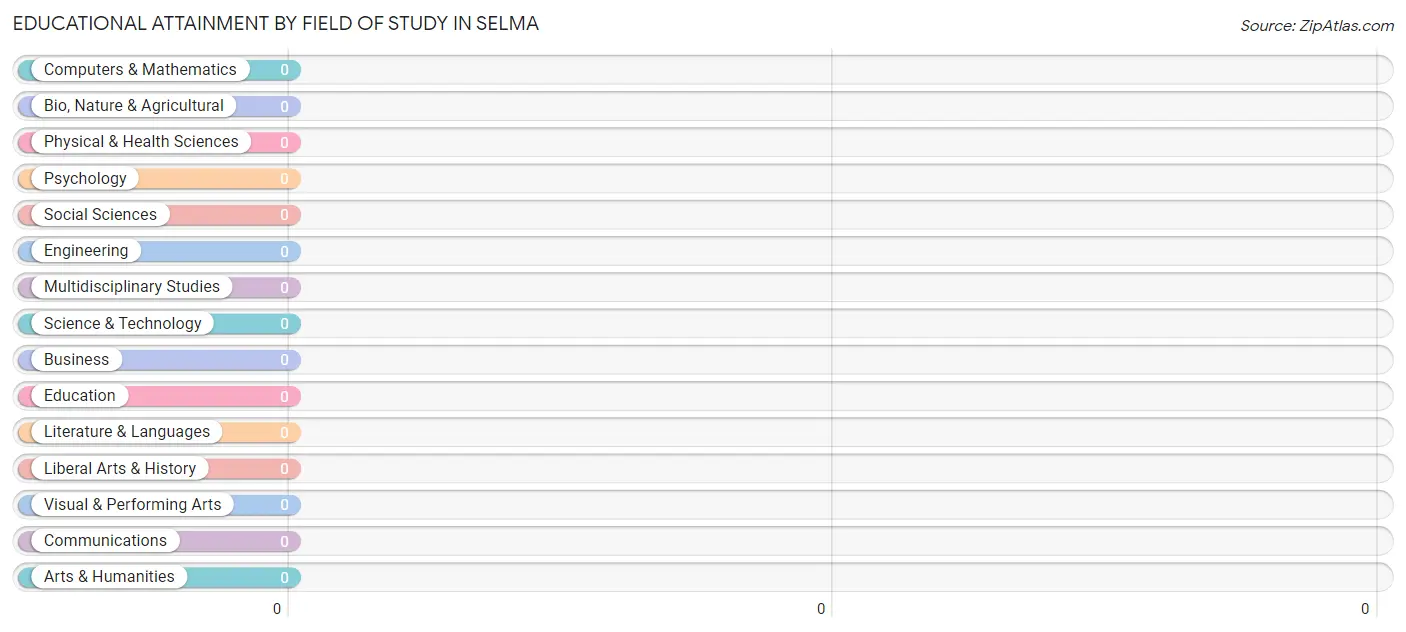
| Field of Study | # Graduates | % Graduates |
| Computers & Mathematics | 0 | 0.0% |
| Bio, Nature & Agricultural | 0 | 0.0% |
| Physical & Health Sciences | 0 | 0.0% |
| Psychology | 0 | 0.0% |
| Social Sciences | 0 | 0.0% |
| Engineering | 0 | 0.0% |
| Multidisciplinary Studies | 0 | 0.0% |
| Science & Technology | 0 | 0.0% |
| Business | 0 | 0.0% |
| Education | 0 | 0.0% |
| Literature & Languages | 0 | 0.0% |
| Liberal Arts & History | 0 | 0.0% |
| Visual & Performing Arts | 0 | 0.0% |
| Communications | 0 | 0.0% |
| Arts & Humanities | 0 | 0.0% |
| Total | 0 | 0.0% |
Transportation & Commute in Selma
Vehicle Availability by Sex in Selma
The most prevalent vehicle ownership categories in Selma are males with 5 or more vehicles (86, accounting for 64.7%) and females with 5 or more vehicles (44, making up 195.4%).
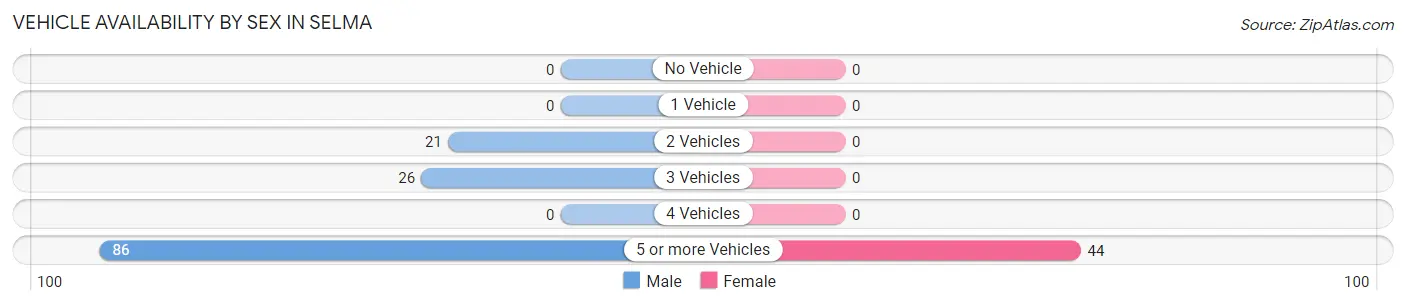
| Vehicles Available | Male | Female |
| No Vehicle | 0 (0.0%) | 0 (0.0%) |
| 1 Vehicle | 0 (0.0%) | 0 (0.0%) |
| 2 Vehicles | 21 (15.8%) | 0 (0.0%) |
| 3 Vehicles | 26 (19.6%) | 0 (0.0%) |
| 4 Vehicles | 0 (0.0%) | 0 (0.0%) |
| 5 or more Vehicles | 86 (64.7%) | 44 (100.0%) |
| Total | 133 (100.0%) | 44 (100.0%) |
Commute Time in Selma
The most frequently occuring commute durations in Selma are 10 to 14 minutes (86 commuters, 48.6%), 15 to 19 minutes (70 commuters, 39.6%), and 90 or more minutes (21 commuters, 11.9%).
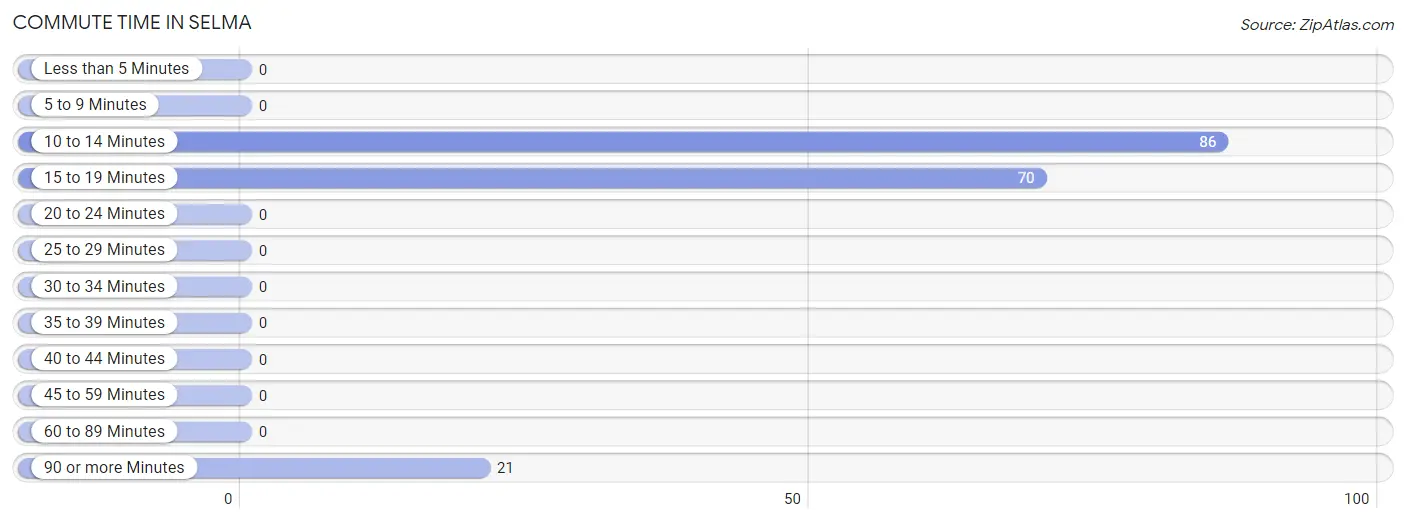
| Commute Time | # Commuters | % Commuters |
| Less than 5 Minutes | 0 | 0.0% |
| 5 to 9 Minutes | 0 | 0.0% |
| 10 to 14 Minutes | 86 | 48.6% |
| 15 to 19 Minutes | 70 | 39.6% |
| 20 to 24 Minutes | 0 | 0.0% |
| 25 to 29 Minutes | 0 | 0.0% |
| 30 to 34 Minutes | 0 | 0.0% |
| 35 to 39 Minutes | 0 | 0.0% |
| 40 to 44 Minutes | 0 | 0.0% |
| 45 to 59 Minutes | 0 | 0.0% |
| 60 to 89 Minutes | 0 | 0.0% |
| 90 or more Minutes | 21 | 11.9% |
Commute Time by Sex in Selma
The most common commute times in Selma are 10 to 14 minutes (86 commuters, 64.7%) for males and 15 to 19 minutes (44 commuters, 100.0%) for females.
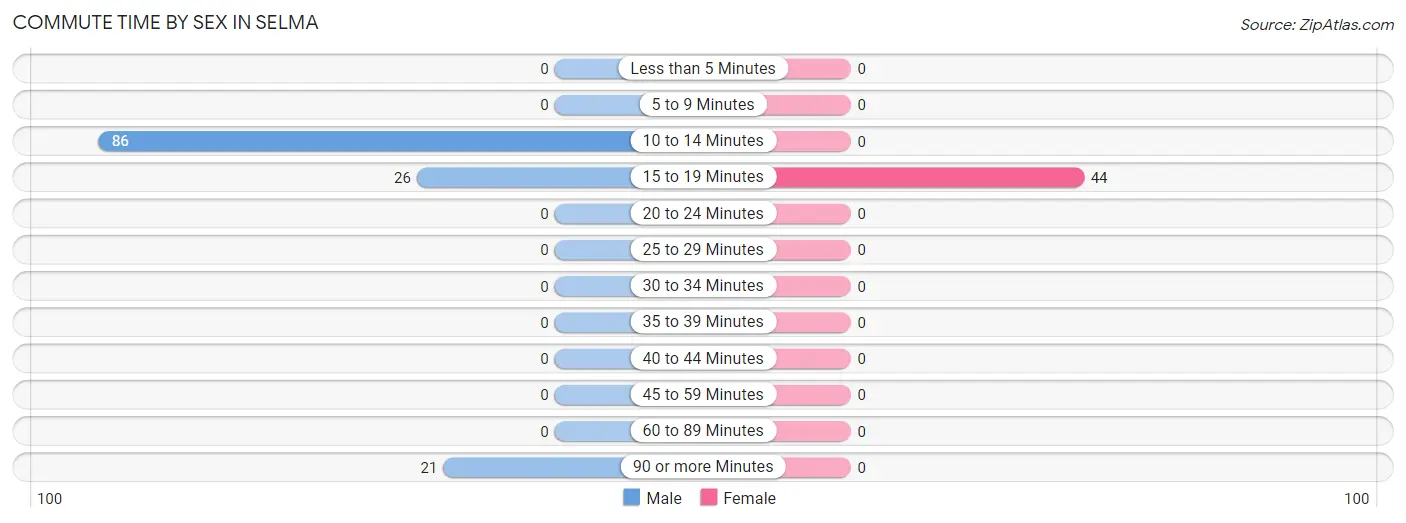
| Commute Time | Male | Female |
| Less than 5 Minutes | 0 (0.0%) | 0 (0.0%) |
| 5 to 9 Minutes | 0 (0.0%) | 0 (0.0%) |
| 10 to 14 Minutes | 86 (64.7%) | 0 (0.0%) |
| 15 to 19 Minutes | 26 (19.6%) | 44 (100.0%) |
| 20 to 24 Minutes | 0 (0.0%) | 0 (0.0%) |
| 25 to 29 Minutes | 0 (0.0%) | 0 (0.0%) |
| 30 to 34 Minutes | 0 (0.0%) | 0 (0.0%) |
| 35 to 39 Minutes | 0 (0.0%) | 0 (0.0%) |
| 40 to 44 Minutes | 0 (0.0%) | 0 (0.0%) |
| 45 to 59 Minutes | 0 (0.0%) | 0 (0.0%) |
| 60 to 89 Minutes | 0 (0.0%) | 0 (0.0%) |
| 90 or more Minutes | 21 (15.8%) | 0 (0.0%) |
Time of Departure to Work by Sex in Selma
The most frequent times of departure to work in Selma are 6:00 AM to 6:29 AM (92, 69.2%) for males and 8:30 AM to 8:59 AM (44, 100.0%) for females.
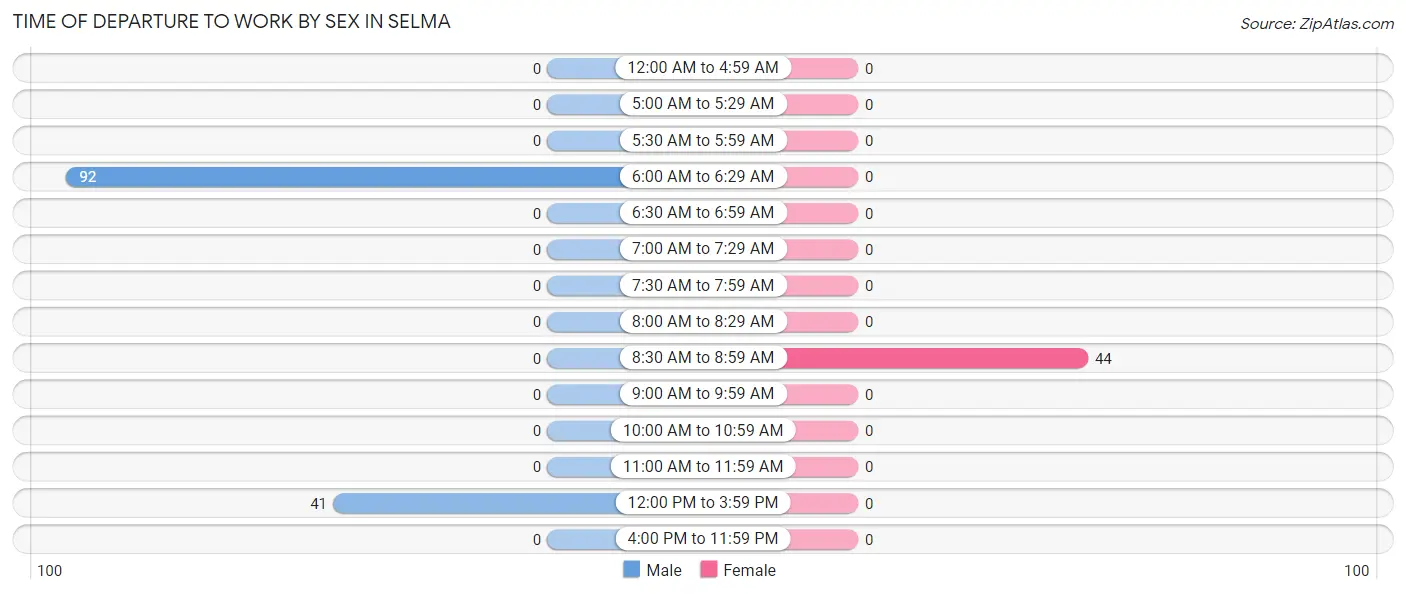
| Time of Departure | Male | Female |
| 12:00 AM to 4:59 AM | 0 (0.0%) | 0 (0.0%) |
| 5:00 AM to 5:29 AM | 0 (0.0%) | 0 (0.0%) |
| 5:30 AM to 5:59 AM | 0 (0.0%) | 0 (0.0%) |
| 6:00 AM to 6:29 AM | 92 (69.2%) | 0 (0.0%) |
| 6:30 AM to 6:59 AM | 0 (0.0%) | 0 (0.0%) |
| 7:00 AM to 7:29 AM | 0 (0.0%) | 0 (0.0%) |
| 7:30 AM to 7:59 AM | 0 (0.0%) | 0 (0.0%) |
| 8:00 AM to 8:29 AM | 0 (0.0%) | 0 (0.0%) |
| 8:30 AM to 8:59 AM | 0 (0.0%) | 44 (100.0%) |
| 9:00 AM to 9:59 AM | 0 (0.0%) | 0 (0.0%) |
| 10:00 AM to 10:59 AM | 0 (0.0%) | 0 (0.0%) |
| 11:00 AM to 11:59 AM | 0 (0.0%) | 0 (0.0%) |
| 12:00 PM to 3:59 PM | 41 (30.8%) | 0 (0.0%) |
| 4:00 PM to 11:59 PM | 0 (0.0%) | 0 (0.0%) |
| Total | 133 (100.0%) | 44 (100.0%) |
Housing Occupancy in Selma
Occupancy by Ownership in Selma
Of the total 155 dwellings in Selma, owner-occupied units account for 155 (100.0%), while renter-occupied units make up 0 (0.0%).
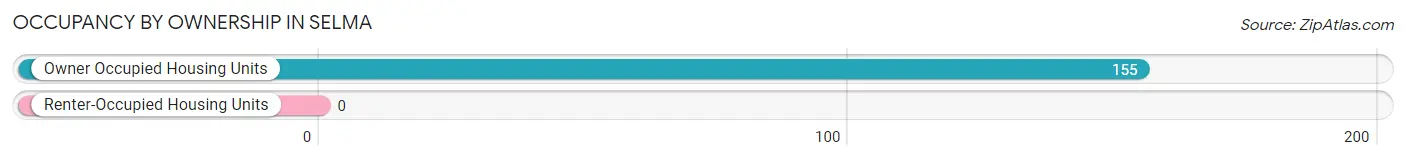
| Occupancy | # Housing Units | % Housing Units |
| Owner Occupied Housing Units | 155 | 100.0% |
| Renter-Occupied Housing Units | 0 | 0.0% |
| Total Occupied Housing Units | 155 | 100.0% |
Occupancy by Household Size in Selma
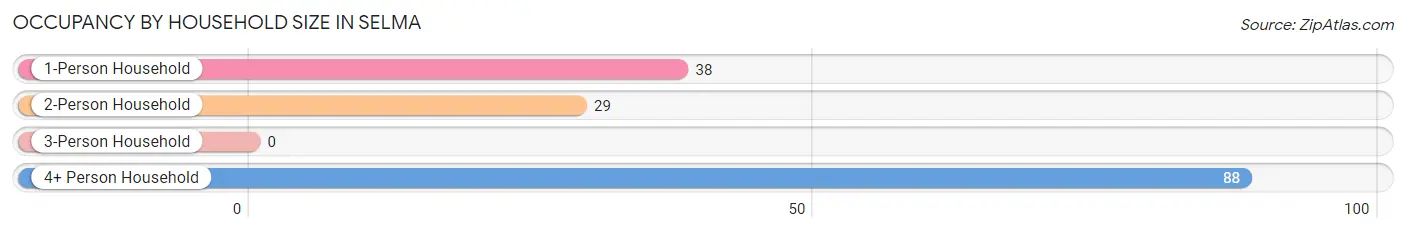
| Household Size | # Housing Units | % Housing Units |
| 1-Person Household | 38 | 24.5% |
| 2-Person Household | 29 | 18.7% |
| 3-Person Household | 0 | 0.0% |
| 4+ Person Household | 88 | 56.8% |
| Total Housing Units | 155 | 100.0% |
Occupancy by Ownership by Household Size in Selma
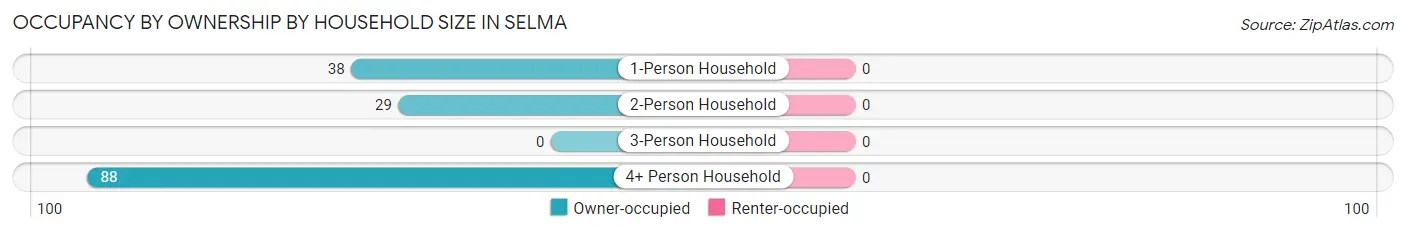
| Household Size | Owner-occupied | Renter-occupied |
| 1-Person Household | 38 (100.0%) | 0 (0.0%) |
| 2-Person Household | 29 (100.0%) | 0 (0.0%) |
| 3-Person Household | 0 (0.0%) | 0 (0.0%) |
| 4+ Person Household | 88 (100.0%) | 0 (0.0%) |
| Total Housing Units | 155 (100.0%) | 0 (0.0%) |
Occupancy by Educational Attainment in Selma
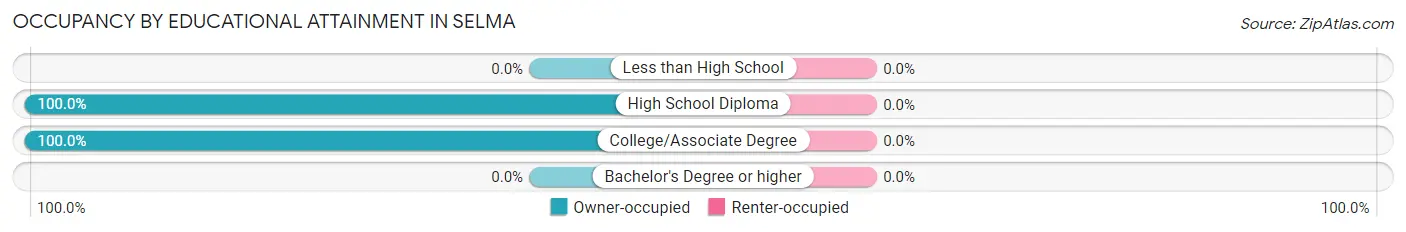
| Household Size | Owner-occupied | Renter-occupied |
| Less than High School | 0 (0.0%) | 0 (0.0%) |
| High School Diploma | 90 (100.0%) | 0 (0.0%) |
| College/Associate Degree | 65 (100.0%) | 0 (0.0%) |
| Bachelor's Degree or higher | 0 (0.0%) | 0 (0.0%) |
Occupancy by Age of Householder in Selma
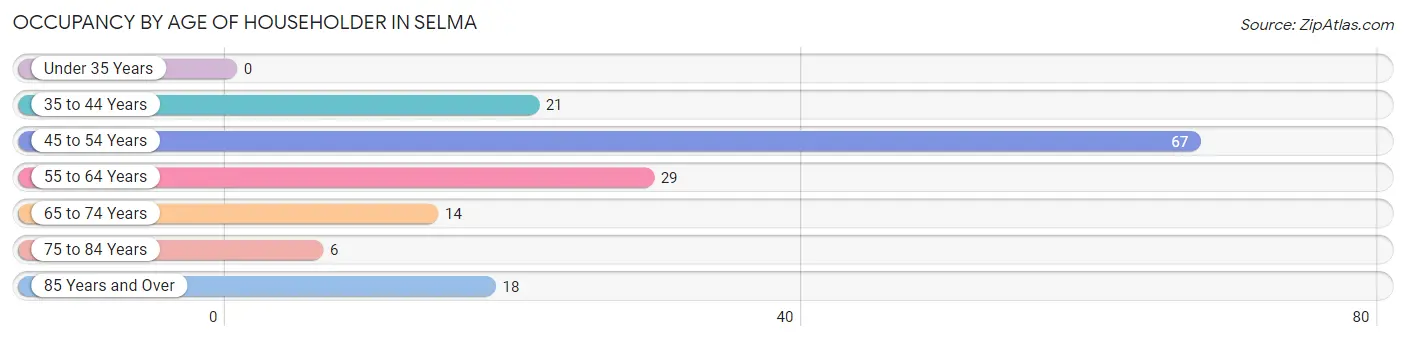
| Age Bracket | # Households | % Households |
| Under 35 Years | 0 | 0.0% |
| 35 to 44 Years | 21 | 13.6% |
| 45 to 54 Years | 67 | 43.2% |
| 55 to 64 Years | 29 | 18.7% |
| 65 to 74 Years | 14 | 9.0% |
| 75 to 84 Years | 6 | 3.9% |
| 85 Years and Over | 18 | 11.6% |
| Total | 155 | 100.0% |
Housing Finances in Selma
Median Income by Occupancy in Selma
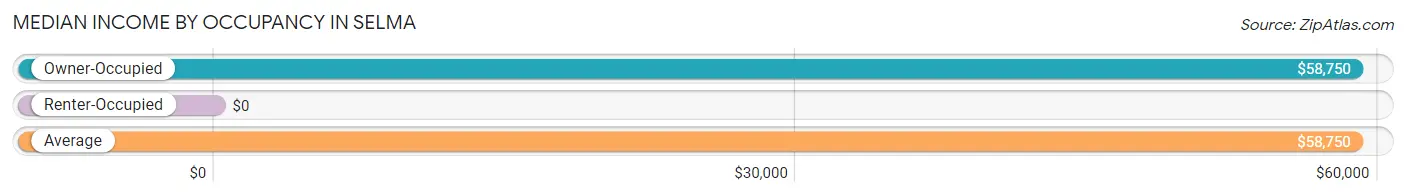
| Occupancy Type | # Households | Median Income |
| Owner-Occupied | 155 (100.0%) | $58,750 |
| Renter-Occupied | 0 (0.0%) | $0 |
| Average | 155 (100.0%) | $58,750 |
Occupancy by Householder Income Bracket in Selma
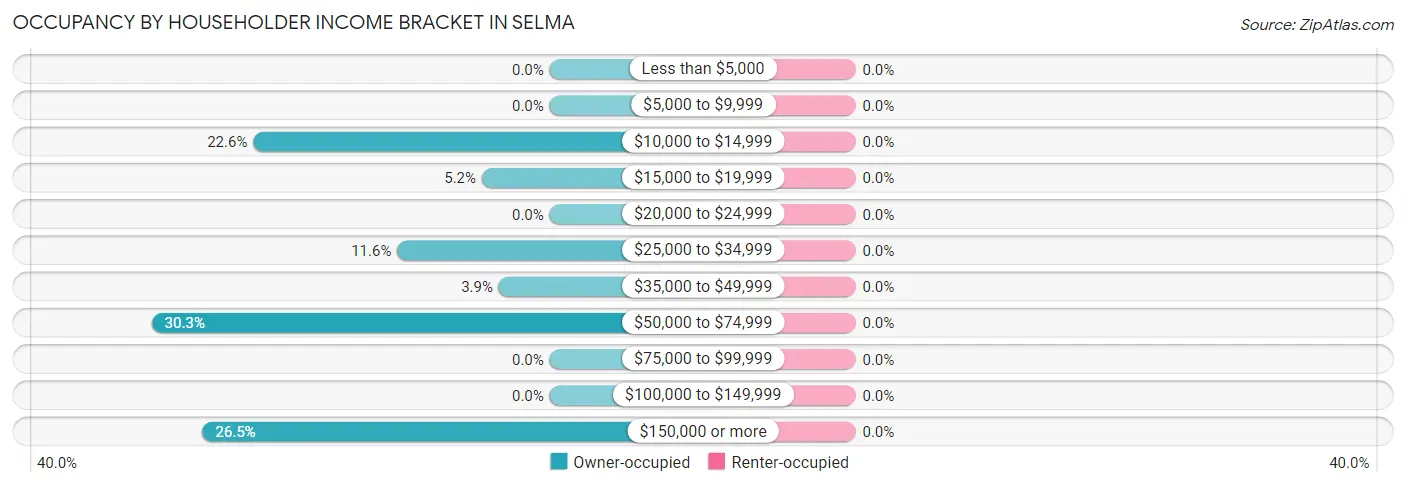
| Income Bracket | Owner-occupied | Renter-occupied |
| Less than $5,000 | 0 (0.0%) | 0 (0.0%) |
| $5,000 to $9,999 | 0 (0.0%) | 0 (0.0%) |
| $10,000 to $14,999 | 35 (22.6%) | 0 (0.0%) |
| $15,000 to $19,999 | 8 (5.2%) | 0 (0.0%) |
| $20,000 to $24,999 | 0 (0.0%) | 0 (0.0%) |
| $25,000 to $34,999 | 18 (11.6%) | 0 (0.0%) |
| $35,000 to $49,999 | 6 (3.9%) | 0 (0.0%) |
| $50,000 to $74,999 | 47 (30.3%) | 0 (0.0%) |
| $75,000 to $99,999 | 0 (0.0%) | 0 (0.0%) |
| $100,000 to $149,999 | 0 (0.0%) | 0 (0.0%) |
| $150,000 or more | 41 (26.5%) | 0 (0.0%) |
| Total | 155 (100.0%) | 0 (0.0%) |
Monthly Housing Cost Tiers in Selma
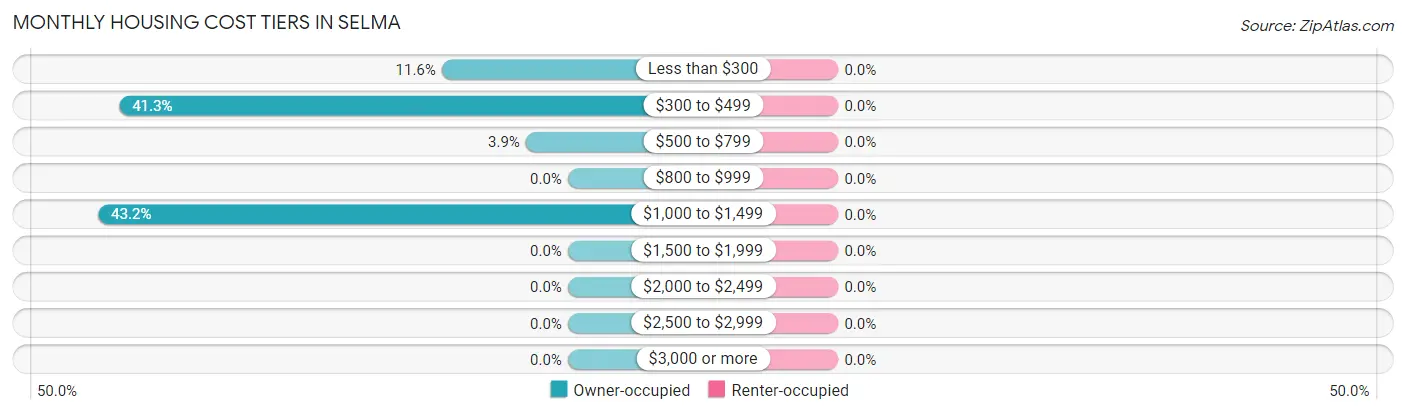
| Monthly Cost | Owner-occupied | Renter-occupied |
| Less than $300 | 18 (11.6%) | 0 (0.0%) |
| $300 to $499 | 64 (41.3%) | 0 (0.0%) |
| $500 to $799 | 6 (3.9%) | 0 (0.0%) |
| $800 to $999 | 0 (0.0%) | 0 (0.0%) |
| $1,000 to $1,499 | 67 (43.2%) | 0 (0.0%) |
| $1,500 to $1,999 | 0 (0.0%) | 0 (0.0%) |
| $2,000 to $2,499 | 0 (0.0%) | 0 (0.0%) |
| $2,500 to $2,999 | 0 (0.0%) | 0 (0.0%) |
| $3,000 or more | 0 (0.0%) | 0 (0.0%) |
| Total | 155 (100.0%) | 0 (0.0%) |
Physical Housing Characteristics in Selma
Housing Structures in Selma
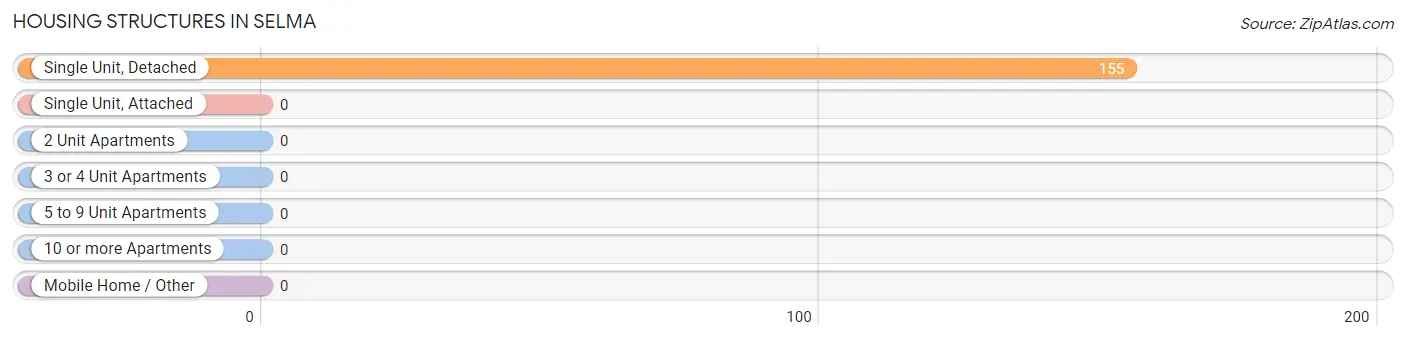
| Structure Type | # Housing Units | % Housing Units |
| Single Unit, Detached | 155 | 100.0% |
| Single Unit, Attached | 0 | 0.0% |
| 2 Unit Apartments | 0 | 0.0% |
| 3 or 4 Unit Apartments | 0 | 0.0% |
| 5 to 9 Unit Apartments | 0 | 0.0% |
| 10 or more Apartments | 0 | 0.0% |
| Mobile Home / Other | 0 | 0.0% |
| Total | 155 | 100.0% |
Housing Structures by Occupancy in Selma
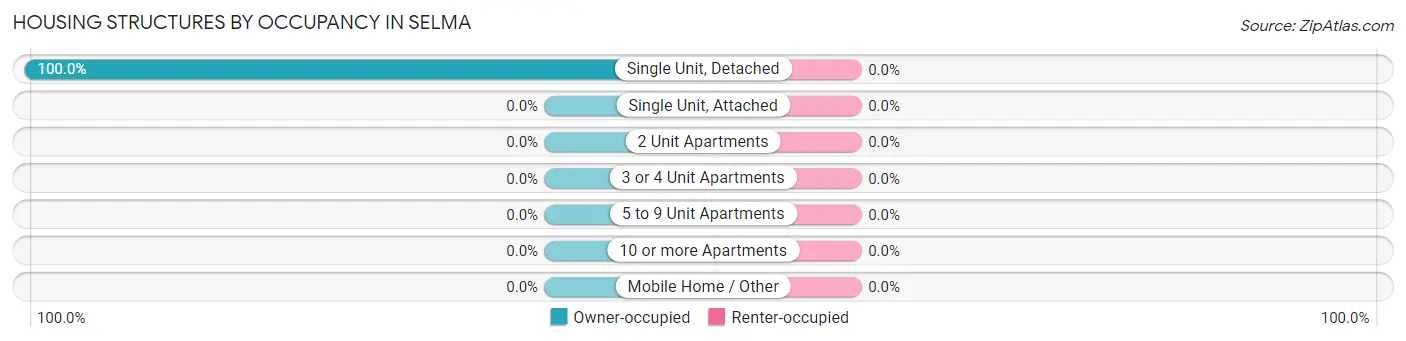
| Structure Type | Owner-occupied | Renter-occupied |
| Single Unit, Detached | 155 (100.0%) | 0 (0.0%) |
| Single Unit, Attached | 0 (0.0%) | 0 (0.0%) |
| 2 Unit Apartments | 0 (0.0%) | 0 (0.0%) |
| 3 or 4 Unit Apartments | 0 (0.0%) | 0 (0.0%) |
| 5 to 9 Unit Apartments | 0 (0.0%) | 0 (0.0%) |
| 10 or more Apartments | 0 (0.0%) | 0 (0.0%) |
| Mobile Home / Other | 0 (0.0%) | 0 (0.0%) |
| Total | 155 (100.0%) | 0 (0.0%) |
Housing Structures by Number of Rooms in Selma
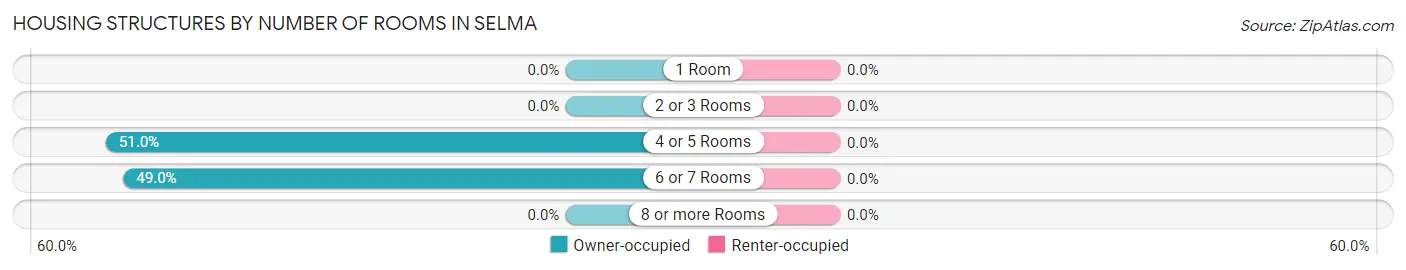
| Number of Rooms | Owner-occupied | Renter-occupied |
| 1 Room | 0 (0.0%) | 0 (0.0%) |
| 2 or 3 Rooms | 0 (0.0%) | 0 (0.0%) |
| 4 or 5 Rooms | 79 (51.0%) | 0 (0.0%) |
| 6 or 7 Rooms | 76 (49.0%) | 0 (0.0%) |
| 8 or more Rooms | 0 (0.0%) | 0 (0.0%) |
| Total | 155 (100.0%) | 0 (0.0%) |
Housing Structure by Heating Type in Selma
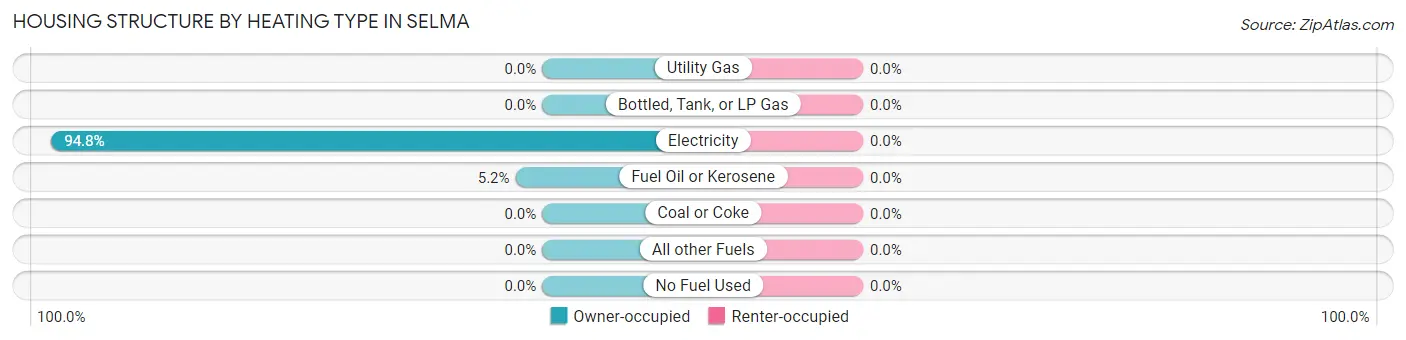
| Heating Type | Owner-occupied | Renter-occupied |
| Utility Gas | 0 (0.0%) | 0 (0.0%) |
| Bottled, Tank, or LP Gas | 0 (0.0%) | 0 (0.0%) |
| Electricity | 147 (94.8%) | 0 (0.0%) |
| Fuel Oil or Kerosene | 8 (5.2%) | 0 (0.0%) |
| Coal or Coke | 0 (0.0%) | 0 (0.0%) |
| All other Fuels | 0 (0.0%) | 0 (0.0%) |
| No Fuel Used | 0 (0.0%) | 0 (0.0%) |
| Total | 155 (100.0%) | 0 (0.0%) |
Household Vehicle Usage in Selma
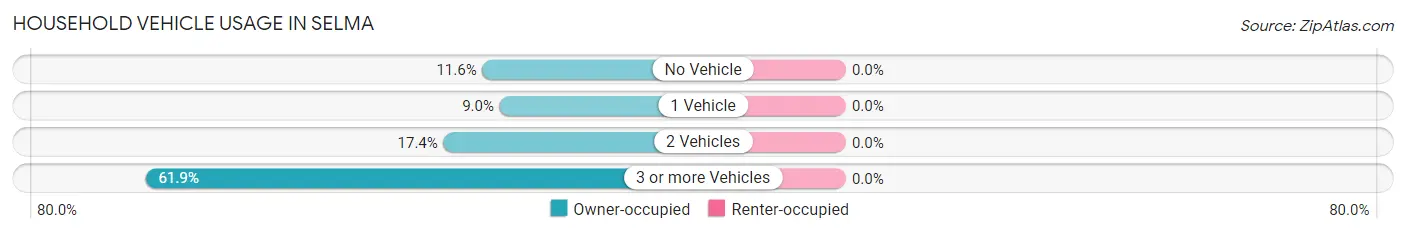
| Vehicles per Household | Owner-occupied | Renter-occupied |
| No Vehicle | 18 (11.6%) | 0 (0.0%) |
| 1 Vehicle | 14 (9.0%) | 0 (0.0%) |
| 2 Vehicles | 27 (17.4%) | 0 (0.0%) |
| 3 or more Vehicles | 96 (61.9%) | 0 (0.0%) |
| Total | 155 (100.0%) | 0 (0.0%) |
Real Estate & Mortgages in Selma
Real Estate and Mortgage Overview in Selma
| Characteristic | Without Mortgage | With Mortgage |
| Housing Units | 82 | 73 |
| Median Property Value | $87,000 | $105,600 |
| Median Household Income | $28,056 | $41 |
| Monthly Housing Costs | $340 | $0 |
| Real Estate Taxes | $703 | $0 |
Property Value by Mortgage Status in Selma
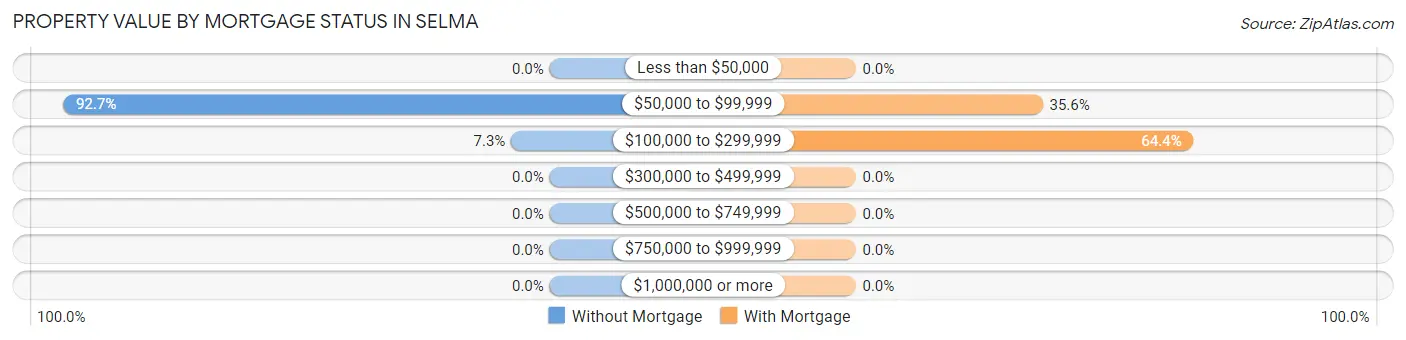
| Property Value | Without Mortgage | With Mortgage |
| Less than $50,000 | 0 (0.0%) | 0 (0.0%) |
| $50,000 to $99,999 | 76 (92.7%) | 26 (35.6%) |
| $100,000 to $299,999 | 6 (7.3%) | 47 (64.4%) |
| $300,000 to $499,999 | 0 (0.0%) | 0 (0.0%) |
| $500,000 to $749,999 | 0 (0.0%) | 0 (0.0%) |
| $750,000 to $999,999 | 0 (0.0%) | 0 (0.0%) |
| $1,000,000 or more | 0 (0.0%) | 0 (0.0%) |
| Total | 82 (100.0%) | 73 (100.0%) |
Household Income by Mortgage Status in Selma
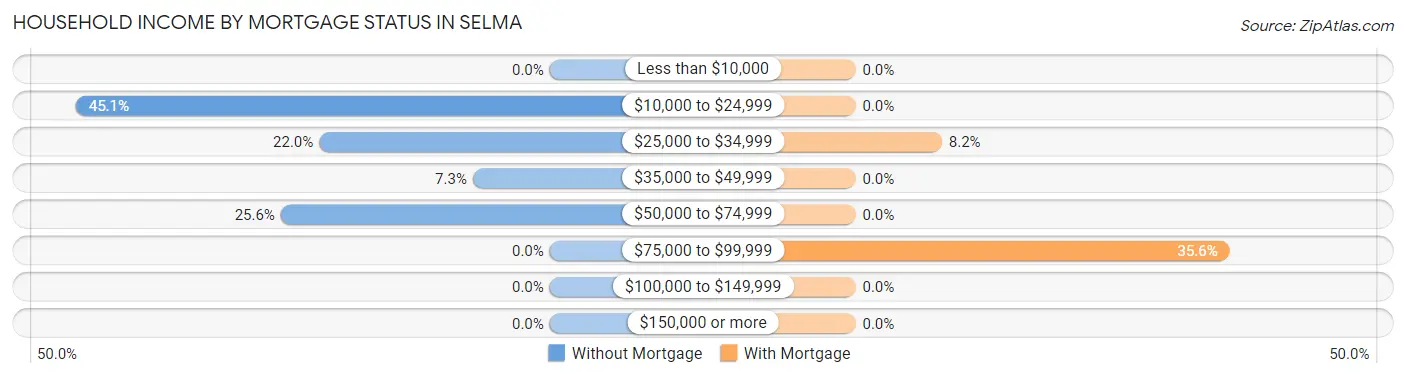
| Household Income | Without Mortgage | With Mortgage |
| Less than $10,000 | 0 (0.0%) | 0 (0.0%) |
| $10,000 to $24,999 | 37 (45.1%) | 0 (0.0%) |
| $25,000 to $34,999 | 18 (22.0%) | 6 (8.2%) |
| $35,000 to $49,999 | 6 (7.3%) | 0 (0.0%) |
| $50,000 to $74,999 | 21 (25.6%) | 0 (0.0%) |
| $75,000 to $99,999 | 0 (0.0%) | 26 (35.6%) |
| $100,000 to $149,999 | 0 (0.0%) | 0 (0.0%) |
| $150,000 or more | 0 (0.0%) | 0 (0.0%) |
| Total | 82 (100.0%) | 73 (100.0%) |
Property Value to Household Income Ratio in Selma
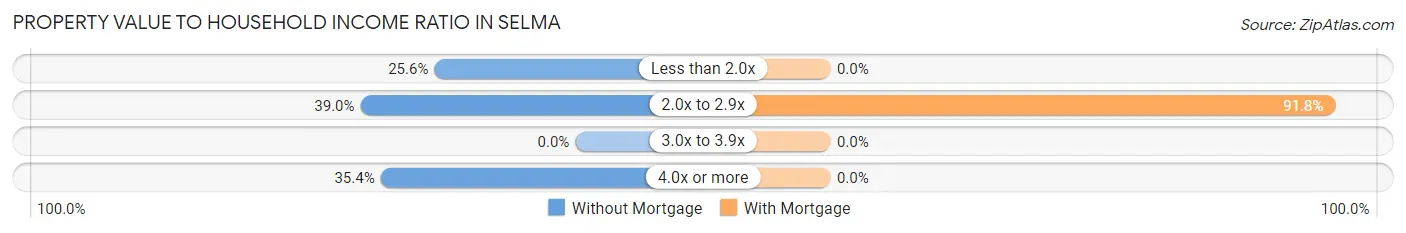
| Value-to-Income Ratio | Without Mortgage | With Mortgage |
| Less than 2.0x | 21 (25.6%) | 0 (0.0%) |
| 2.0x to 2.9x | 32 (39.0%) | 67 (91.8%) |
| 3.0x to 3.9x | 0 (0.0%) | 0 (0.0%) |
| 4.0x or more | 29 (35.4%) | 0 (0.0%) |
| Total | 82 (100.0%) | 73 (100.0%) |
Real Estate Taxes by Mortgage Status in Selma
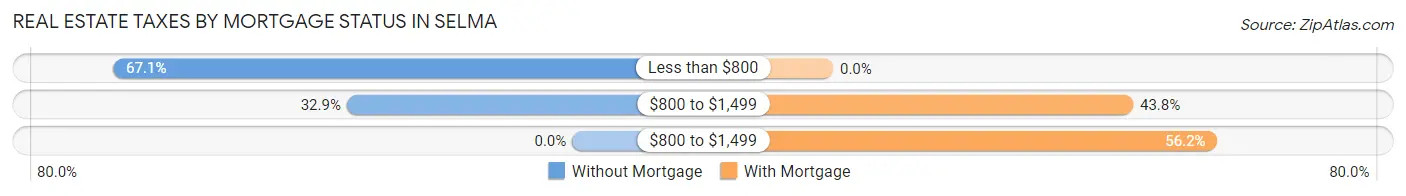
| Property Taxes | Without Mortgage | With Mortgage |
| Less than $800 | 55 (67.1%) | 0 (0.0%) |
| $800 to $1,499 | 27 (32.9%) | 32 (43.8%) |
| $800 to $1,499 | 0 (0.0%) | 41 (56.2%) |
| Total | 82 (100.0%) | 73 (100.0%) |
Health & Disability in Selma
Health Insurance Coverage by Age in Selma
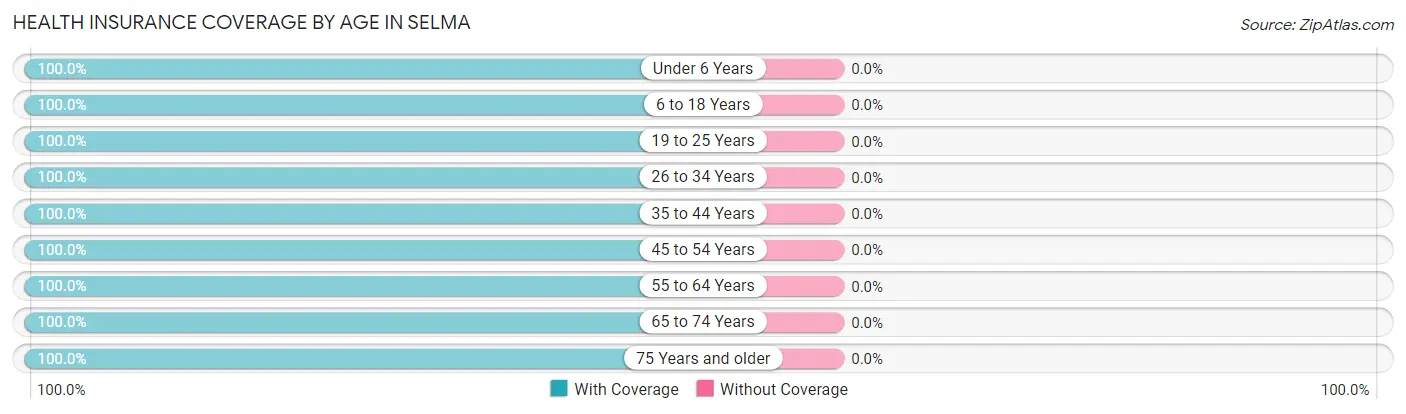
| Age Bracket | With Coverage | Without Coverage |
| Under 6 Years | 16 (100.0%) | 0 (0.0%) |
| 6 to 18 Years | 150 (100.0%) | 0 (0.0%) |
| 19 to 25 Years | 45 (100.0%) | 0 (0.0%) |
| 26 to 34 Years | 21 (100.0%) | 0 (0.0%) |
| 35 to 44 Years | 44 (100.0%) | 0 (0.0%) |
| 45 to 54 Years | 67 (100.0%) | 0 (0.0%) |
| 55 to 64 Years | 53 (100.0%) | 0 (0.0%) |
| 65 to 74 Years | 14 (100.0%) | 0 (0.0%) |
| 75 Years and older | 24 (100.0%) | 0 (0.0%) |
| Total | 434 (100.0%) | 0 (0.0%) |
Health Insurance Coverage by Citizenship Status in Selma
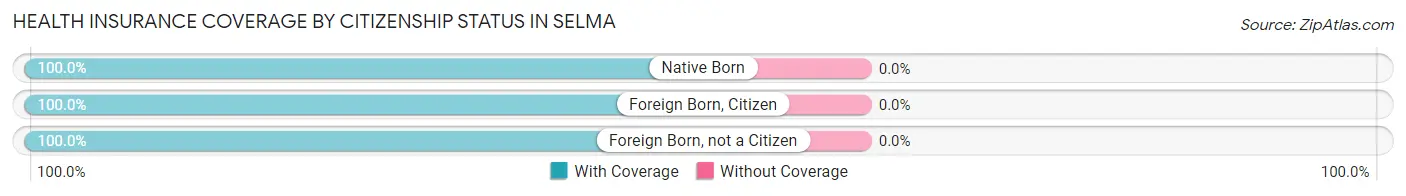
| Citizenship Status | With Coverage | Without Coverage |
| Native Born | 16 (100.0%) | 0 (0.0%) |
| Foreign Born, Citizen | 150 (100.0%) | 0 (0.0%) |
| Foreign Born, not a Citizen | 45 (100.0%) | 0 (0.0%) |
Health Insurance Coverage by Household Income in Selma
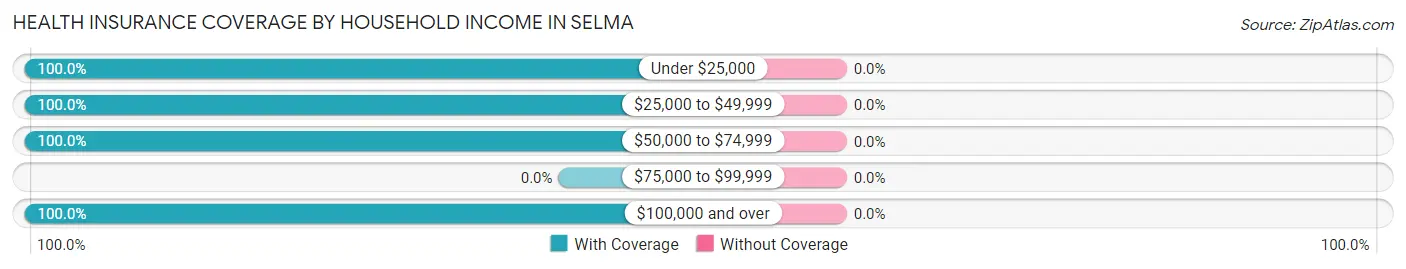
| Household Income | With Coverage | Without Coverage |
| Under $25,000 | 73 (100.0%) | 0 (0.0%) |
| $25,000 to $49,999 | 24 (100.0%) | 0 (0.0%) |
| $50,000 to $74,999 | 169 (100.0%) | 0 (0.0%) |
| $75,000 to $99,999 | 0 (0.0%) | 0 (0.0%) |
| $100,000 and over | 168 (100.0%) | 0 (0.0%) |
Public vs Private Health Insurance Coverage by Age in Selma
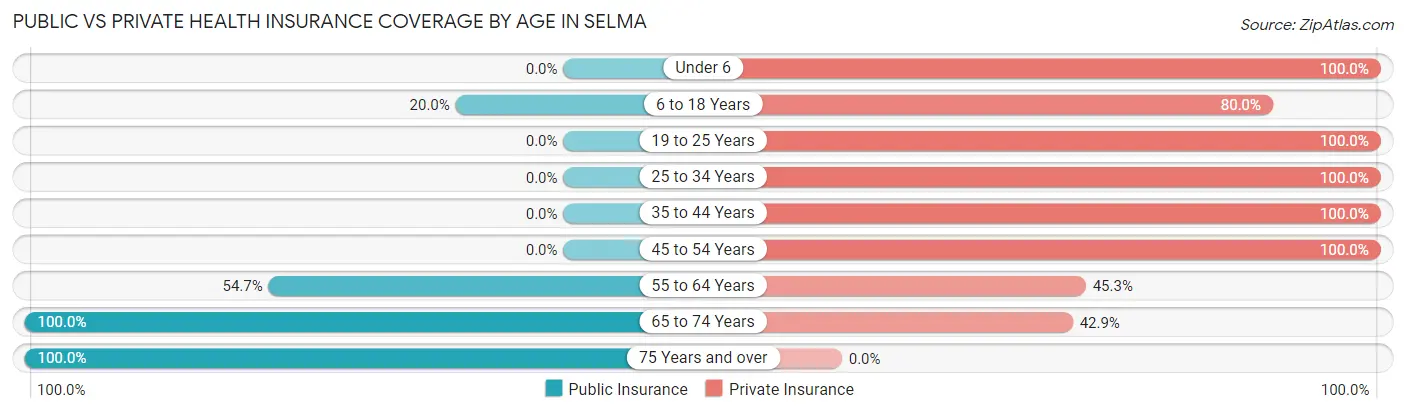
| Age Bracket | Public Insurance | Private Insurance |
| Under 6 | 0 (0.0%) | 16 (100.0%) |
| 6 to 18 Years | 30 (20.0%) | 120 (80.0%) |
| 19 to 25 Years | 0 (0.0%) | 45 (100.0%) |
| 25 to 34 Years | 0 (0.0%) | 21 (100.0%) |
| 35 to 44 Years | 0 (0.0%) | 44 (100.0%) |
| 45 to 54 Years | 0 (0.0%) | 67 (100.0%) |
| 55 to 64 Years | 29 (54.7%) | 24 (45.3%) |
| 65 to 74 Years | 14 (100.0%) | 6 (42.9%) |
| 75 Years and over | 24 (100.0%) | 0 (0.0%) |
| Total | 97 (22.4%) | 343 (79.0%) |
Disability Status by Sex by Age in Selma
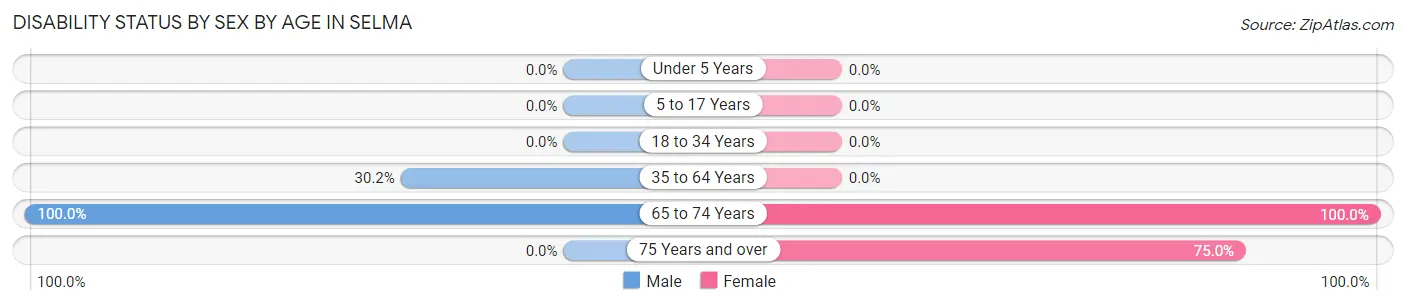
| Age Bracket | Male | Female |
| Under 5 Years | 0 (0.0%) | 0 (0.0%) |
| 5 to 17 Years | 0 (0.0%) | 0 (0.0%) |
| 18 to 34 Years | 0 (0.0%) | 0 (0.0%) |
| 35 to 64 Years | 29 (30.2%) | 0 (0.0%) |
| 65 to 74 Years | 6 (100.0%) | 8 (100.0%) |
| 75 Years and over | 0 (0.0%) | 18 (75.0%) |
Disability Class by Sex by Age in Selma
Disability Class: Hearing Difficulty
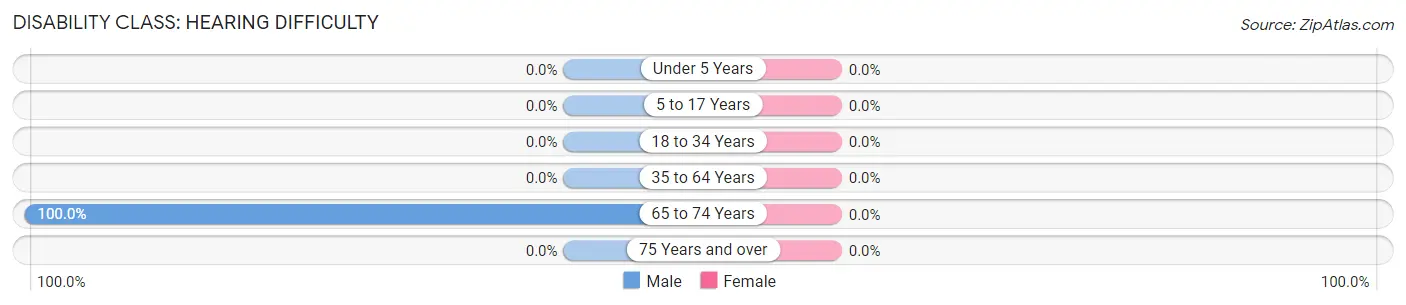
| Age Bracket | Male | Female |
| Under 5 Years | 0 (0.0%) | 0 (0.0%) |
| 5 to 17 Years | 0 (0.0%) | 0 (0.0%) |
| 18 to 34 Years | 0 (0.0%) | 0 (0.0%) |
| 35 to 64 Years | 0 (0.0%) | 0 (0.0%) |
| 65 to 74 Years | 6 (100.0%) | 0 (0.0%) |
| 75 Years and over | 0 (0.0%) | 0 (0.0%) |
Disability Class: Vision Difficulty
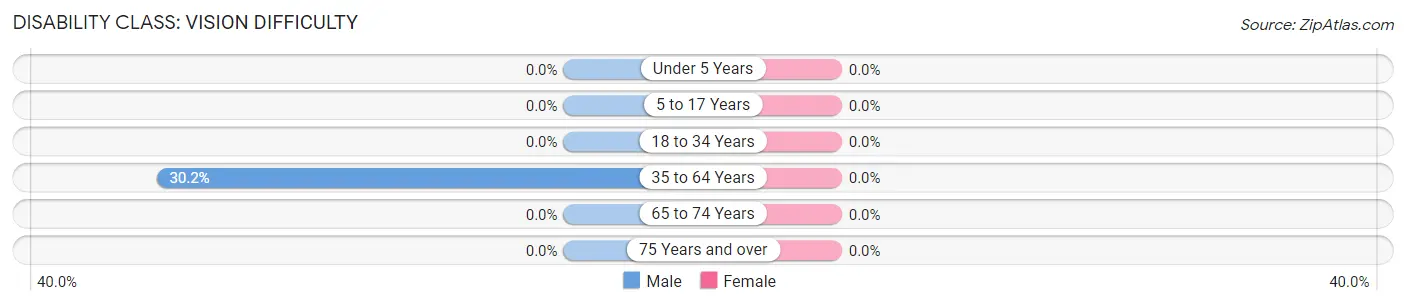
| Age Bracket | Male | Female |
| Under 5 Years | 0 (0.0%) | 0 (0.0%) |
| 5 to 17 Years | 0 (0.0%) | 0 (0.0%) |
| 18 to 34 Years | 0 (0.0%) | 0 (0.0%) |
| 35 to 64 Years | 29 (30.2%) | 0 (0.0%) |
| 65 to 74 Years | 0 (0.0%) | 0 (0.0%) |
| 75 Years and over | 0 (0.0%) | 0 (0.0%) |
Disability Class: Cognitive Difficulty

| Age Bracket | Male | Female |
| 5 to 17 Years | 0 (0.0%) | 0 (0.0%) |
| 18 to 34 Years | 0 (0.0%) | 0 (0.0%) |
| 35 to 64 Years | 0 (0.0%) | 0 (0.0%) |
| 65 to 74 Years | 0 (0.0%) | 0 (0.0%) |
| 75 Years and over | 0 (0.0%) | 0 (0.0%) |
Disability Class: Ambulatory Difficulty
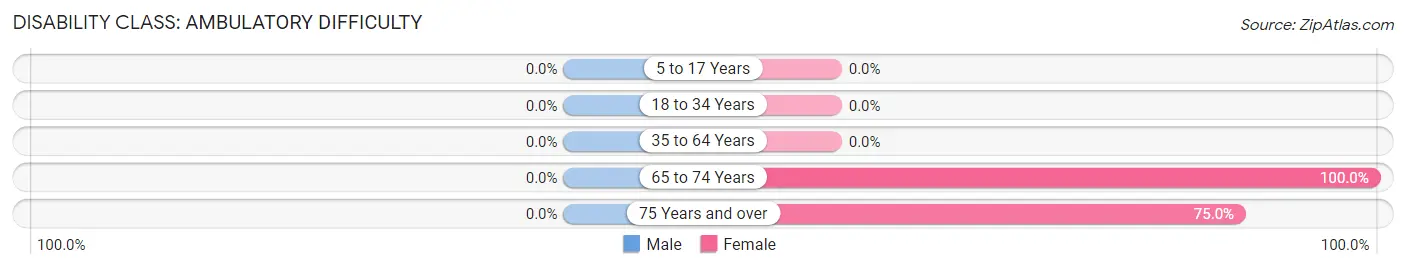
| Age Bracket | Male | Female |
| 5 to 17 Years | 0 (0.0%) | 0 (0.0%) |
| 18 to 34 Years | 0 (0.0%) | 0 (0.0%) |
| 35 to 64 Years | 0 (0.0%) | 0 (0.0%) |
| 65 to 74 Years | 0 (0.0%) | 8 (100.0%) |
| 75 Years and over | 0 (0.0%) | 18 (75.0%) |
Disability Class: Self-Care Difficulty
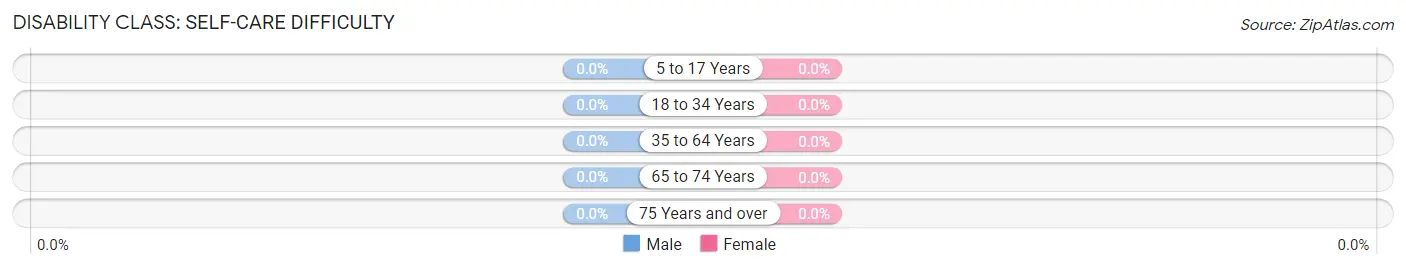
| Age Bracket | Male | Female |
| 5 to 17 Years | 0 (0.0%) | 0 (0.0%) |
| 18 to 34 Years | 0 (0.0%) | 0 (0.0%) |
| 35 to 64 Years | 0 (0.0%) | 0 (0.0%) |
| 65 to 74 Years | 0 (0.0%) | 0 (0.0%) |
| 75 Years and over | 0 (0.0%) | 0 (0.0%) |
Technology Access in Selma
Computing Device Access in Selma
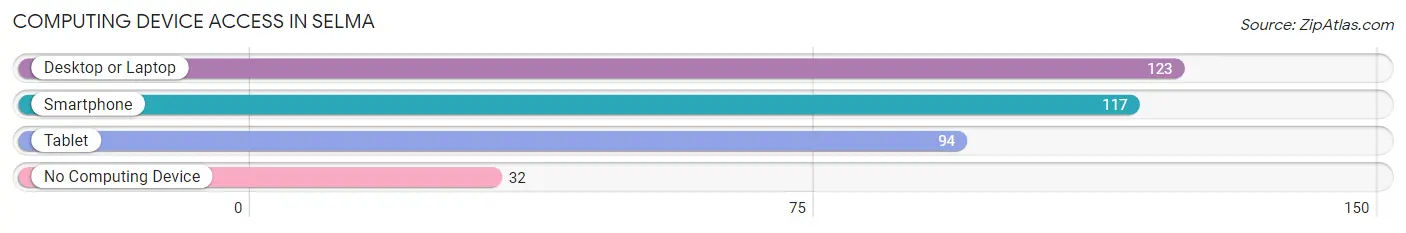
| Device Type | # Households | % Households |
| Desktop or Laptop | 123 | 79.3% |
| Smartphone | 117 | 75.5% |
| Tablet | 94 | 60.7% |
| No Computing Device | 32 | 20.6% |
| Total | 155 | 100.0% |
Internet Access in Selma
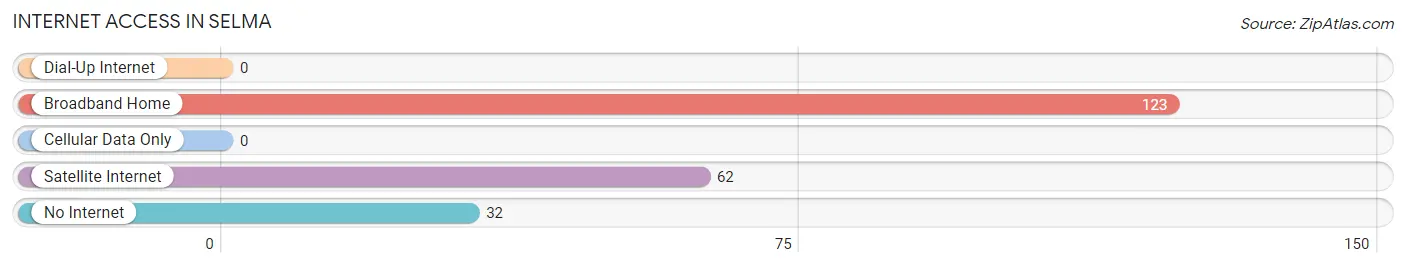
| Internet Type | # Households | % Households |
| Dial-Up Internet | 0 | 0.0% |
| Broadband Home | 123 | 79.3% |
| Cellular Data Only | 0 | 0.0% |
| Satellite Internet | 62 | 40.0% |
| No Internet | 32 | 20.6% |
| Total | 155 | 100.0% |
Selma Summary
Selma, Virginia is a small town located in the Shenandoah Valley of Virginia. It is situated in the northern part of Rockingham County, about 10 miles south of Harrisonburg. The town was founded in 1790 and has a population of about 1,000 people.
History
Selma was founded in 1790 by a group of settlers from Pennsylvania. The town was named after Selma, Alabama, which was the site of a major battle during the Civil War. The town was originally a farming community, but it soon became a center for the production of woolen goods. In the late 19th century, the town was home to several factories, including a woolen mill, a tannery, and a shoe factory.
The town was also home to a number of churches, including the First Presbyterian Church, which was founded in 1820. The town also had a number of schools, including the Selma Academy, which was founded in 1845.
Geography
Selma is located in the northern part of Rockingham County, about 10 miles south of Harrisonburg. The town is situated in the Shenandoah Valley, which is a large valley that runs through the Appalachian Mountains. The town is surrounded by rolling hills and is located near the North Fork of the Shenandoah River.
Economy
The economy of Selma is largely based on agriculture. The town is home to several farms, which produce a variety of crops, including corn, soybeans, wheat, and hay. The town is also home to a number of small businesses, including a grocery store, a hardware store, and a restaurant.
Demographics
As of the 2010 census, the population of Selma was 1,000 people. The town is predominantly white, with about 95% of the population being white. The median household income in Selma is $41,000, and the median home value is $150,000. The town has a low unemployment rate of 4.2%.
Conclusion
Selma, Virginia is a small town located in the Shenandoah Valley of Virginia. It was founded in 1790 and has a population of about 1,000 people. The town is largely based on agriculture, and it is home to several small businesses. The town is predominantly white, with a median household income of $41,000 and a median home value of $150,000. The town has a low unemployment rate of 4.2%.
Common Questions
What is Per Capita Income in Selma?
Per Capita income in Selma is $25,708.
What is the Median Family Income in Selma?
Median Family Income in Selma is $68,317.
What is the Median Household income in Selma?
Median Household Income in Selma is $58,750.
What is Inequality or Gini Index in Selma?
Inequality or Gini Index in Selma is 0.44.
What is the Total Population of Selma?
Total Population of Selma is 455.
What is the Total Male Population of Selma?
Total Male Population of Selma is 199.
What is the Total Female Population of Selma?
Total Female Population of Selma is 256.
What is the Ratio of Males per 100 Females in Selma?
There are 77.73 Males per 100 Females in Selma.
What is the Ratio of Females per 100 Males in Selma?
There are 128.64 Females per 100 Males in Selma.
What is the Median Population Age in Selma?
Median Population Age in Selma is 34.8 Years.
What is the Average Family Size in Selma
Average Family Size in Selma is 3.6 People.
What is the Average Household Size in Selma
Average Household Size in Selma is 2.9 People.
How Large is the Labor Force in Selma?
There are 177 People in the Labor Forcein in Selma.
What is the Percentage of People in the Labor Force in Selma?
51.3% of People are in the Labor Force in Selma.