Cities with the Highest Percentage of English Population in Iowa
RELATED REPORTS & OPTIONS
English
Iowa
Compare Cities
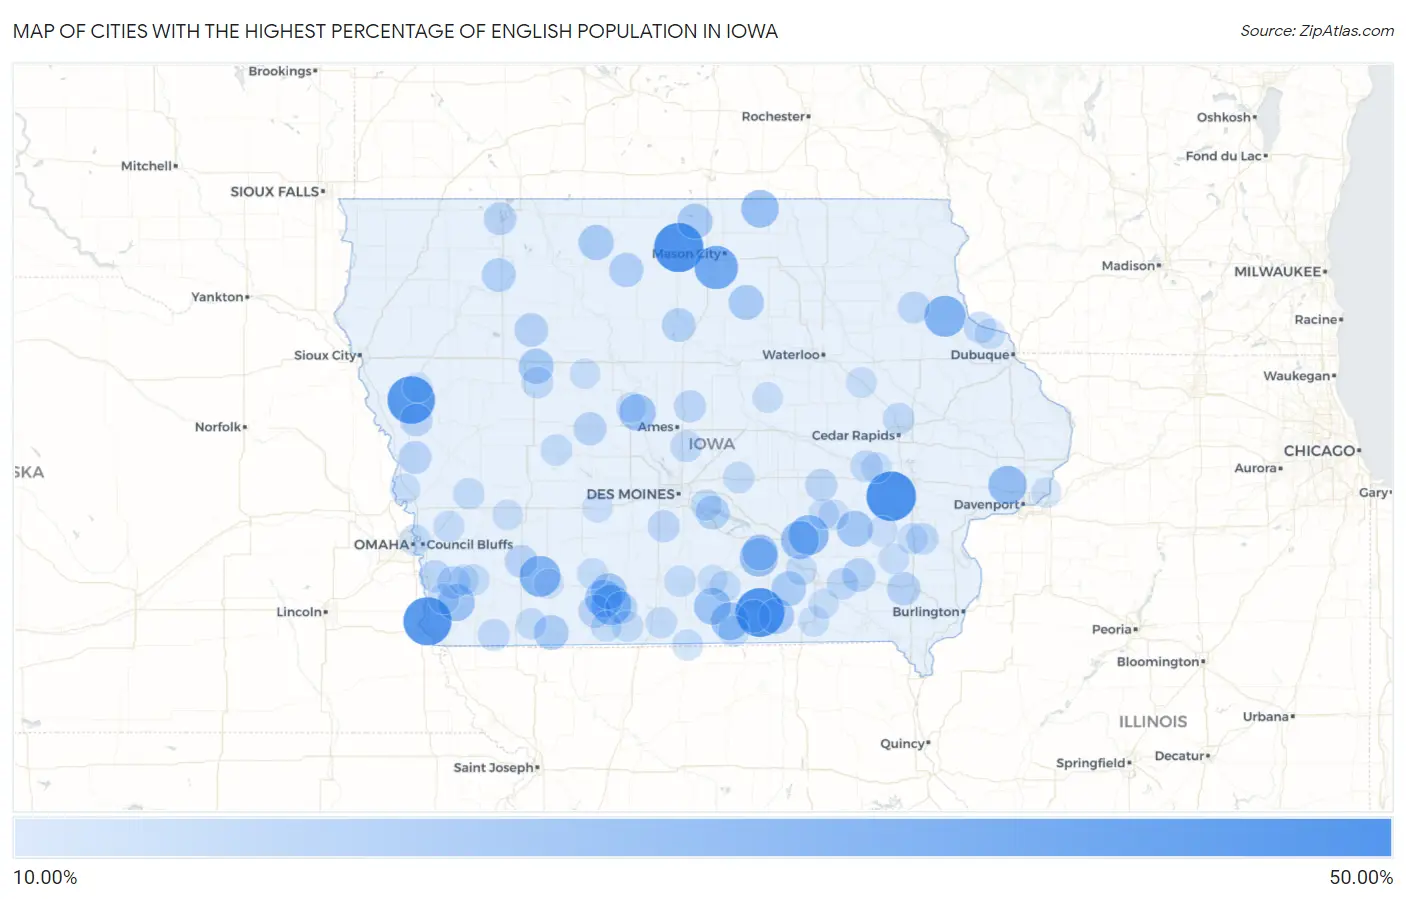
Map of Cities with the Highest Percentage of English Population in Iowa
0.00%
50.00%
Cities with the Highest Percentage of English Population in Iowa
| City | English | vs State | vs National | |
| 1. | Frytown | 48.57% | 9.23%(+39.3)#1 | 8.59%(+40.0)#260 |
| 2. | Miller | 48.08% | 9.23%(+38.8)#2 | 8.59%(+39.5)#267 |
| 3. | Rathbun | 47.37% | 9.23%(+38.1)#3 | 8.59%(+38.8)#281 |
| 4. | Percival | 46.15% | 9.23%(+36.9)#4 | 8.59%(+37.6)#303 |
| 5. | Rodney | 45.16% | 9.23%(+35.9)#5 | 8.59%(+36.6)#334 |
| 6. | Trenton | 38.57% | 9.23%(+29.3)#6 | 8.59%(+30.0)#527 |
| 7. | Burchinal | 38.10% | 9.23%(+28.9)#7 | 8.59%(+29.5)#552 |
| 8. | Garber | 34.30% | 9.23%(+25.1)#8 | 8.59%(+25.7)#731 |
| 9. | Carbon | 33.90% | 9.23%(+24.7)#9 | 8.59%(+25.3)#755 |
| 10. | Rose Hill | 32.20% | 9.23%(+23.0)#10 | 8.59%(+23.6)#874 |
| 11. | Tingley | 32.14% | 9.23%(+22.9)#11 | 8.59%(+23.6)#881 |
| 12. | Sperry | 31.68% | 9.23%(+22.5)#12 | 8.59%(+23.1)#916 |
| 13. | Maysville | 29.82% | 9.23%(+20.6)#13 | 8.59%(+21.2)#1,076 |
| 14. | Keomah Village | 29.31% | 9.23%(+20.1)#14 | 8.59%(+20.7)#1,139 |
| 15. | Hamilton | 29.27% | 9.23%(+20.0)#15 | 8.59%(+20.7)#1,148 |
| 16. | Promise City | 28.75% | 9.23%(+19.5)#16 | 8.59%(+20.2)#1,203 |
| 17. | Toeterville | 28.57% | 9.23%(+19.3)#17 | 8.59%(+20.0)#1,225 |
| 18. | Shannon City | 28.09% | 9.23%(+18.9)#18 | 8.59%(+19.5)#1,287 |
| 19. | Randolph | 27.44% | 9.23%(+18.2)#19 | 8.59%(+18.9)#1,360 |
| 20. | Millerton | 27.27% | 9.23%(+18.0)#20 | 8.59%(+18.7)#1,381 |
| 21. | Fraser | 26.83% | 9.23%(+17.6)#21 | 8.59%(+18.2)#1,437 |
| 22. | Harper | 25.81% | 9.23%(+16.6)#22 | 8.59%(+17.2)#1,588 |
| 23. | Arispe | 25.64% | 9.23%(+16.4)#23 | 8.59%(+17.1)#1,621 |
| 24. | Bussey | 25.36% | 9.23%(+16.1)#24 | 8.59%(+16.8)#1,675 |
| 25. | Udell | 25.00% | 9.23%(+15.8)#25 | 8.59%(+16.4)#1,736 |
| 26. | Lone Rock | 24.56% | 9.23%(+15.3)#26 | 8.59%(+16.0)#1,811 |
| 27. | Joice | 24.29% | 9.23%(+15.1)#27 | 8.59%(+15.7)#1,862 |
| 28. | Lytton | 24.09% | 9.23%(+14.9)#28 | 8.59%(+15.5)#1,904 |
| 29. | Aredale | 24.07% | 9.23%(+14.8)#29 | 8.59%(+15.5)#1,909 |
| 30. | Bedford | 24.01% | 9.23%(+14.8)#30 | 8.59%(+15.4)#1,924 |
| 31. | Blakesburg | 23.53% | 9.23%(+14.3)#31 | 8.59%(+14.9)#2,011 |
| 32. | St Benedict | 22.73% | 9.23%(+13.5)#32 | 8.59%(+14.1)#2,167 |
| 33. | Rossie | 22.08% | 9.23%(+12.8)#33 | 8.59%(+13.5)#2,308 |
| 34. | Swan | 22.03% | 9.23%(+12.8)#34 | 8.59%(+13.4)#2,315 |
| 35. | Galt | 22.00% | 9.23%(+12.8)#35 | 8.59%(+13.4)#2,333 |
| 36. | Varina | 21.88% | 9.23%(+12.6)#36 | 8.59%(+13.3)#2,364 |
| 37. | Maharishi Vedic City | 21.45% | 9.23%(+12.2)#37 | 8.59%(+12.9)#2,500 |
| 38. | Westwood | 21.43% | 9.23%(+12.2)#38 | 8.59%(+12.8)#2,510 |
| 39. | Jefferson | 21.03% | 9.23%(+11.8)#39 | 8.59%(+12.4)#2,629 |
| 40. | Mystic | 20.90% | 9.23%(+11.7)#40 | 8.59%(+12.3)#2,670 |
| 41. | Diagonal | 20.73% | 9.23%(+11.5)#41 | 8.59%(+12.1)#2,724 |
| 42. | Wahpeton | 20.60% | 9.23%(+11.4)#42 | 8.59%(+12.0)#2,766 |
| 43. | Pisgah | 20.56% | 9.23%(+11.3)#43 | 8.59%(+12.0)#2,778 |
| 44. | Castana | 20.34% | 9.23%(+11.1)#44 | 8.59%(+11.8)#2,846 |
| 45. | Malvern | 20.33% | 9.23%(+11.1)#45 | 8.59%(+11.7)#2,849 |
| 46. | Grant | 20.31% | 9.23%(+11.1)#46 | 8.59%(+11.7)#2,858 |
| 47. | Glenwood | 19.85% | 9.23%(+10.6)#47 | 8.59%(+11.3)#3,026 |
| 48. | Guernsey | 19.67% | 9.23%(+10.4)#48 | 8.59%(+11.1)#3,098 |
| 49. | Roland | 19.57% | 9.23%(+10.3)#49 | 8.59%(+11.0)#3,142 |
| 50. | Ellston | 19.44% | 9.23%(+10.2)#50 | 8.59%(+10.9)#3,209 |
| 51. | Martensdale | 19.34% | 9.23%(+10.1)#51 | 8.59%(+10.8)#3,255 |
| 52. | Volga | 19.26% | 9.23%(+10.0)#52 | 8.59%(+10.7)#3,286 |
| 53. | South Amana | 19.21% | 9.23%(+9.97)#53 | 8.59%(+10.6)#3,308 |
| 54. | Coin | 19.17% | 9.23%(+9.94)#54 | 8.59%(+10.6)#3,326 |
| 55. | Kent Estates | 19.13% | 9.23%(+9.90)#55 | 8.59%(+10.5)#3,343 |
| 56. | Cotter | 19.05% | 9.23%(+9.82)#56 | 8.59%(+10.5)#3,371 |
| 57. | Cambridge | 18.87% | 9.23%(+9.64)#57 | 8.59%(+10.3)#3,434 |
| 58. | North Buena Vista | 18.87% | 9.23%(+9.64)#58 | 8.59%(+10.3)#3,436 |
| 59. | Robins | 18.80% | 9.23%(+9.57)#59 | 8.59%(+10.2)#3,465 |
| 60. | Yetter | 18.75% | 9.23%(+9.52)#60 | 8.59%(+10.2)#3,485 |
| 61. | Batavia | 18.70% | 9.23%(+9.47)#61 | 8.59%(+10.1)#3,502 |
| 62. | Woodburn | 18.67% | 9.23%(+9.44)#62 | 8.59%(+10.1)#3,518 |
| 63. | Tennant | 18.64% | 9.23%(+9.41)#63 | 8.59%(+10.1)#3,532 |
| 64. | Carter Lake | 18.57% | 9.23%(+9.34)#64 | 8.59%(+9.98)#3,569 |
| 65. | Lambs Grove | 18.57% | 9.23%(+9.34)#65 | 8.59%(+9.98)#3,570 |
| 66. | Emerson | 18.50% | 9.23%(+9.27)#66 | 8.59%(+9.92)#3,598 |
| 67. | Coon Rapids | 18.43% | 9.23%(+9.20)#67 | 8.59%(+9.84)#3,623 |
| 68. | Leon | 18.28% | 9.23%(+9.05)#68 | 8.59%(+9.69)#3,717 |
| 69. | Kellerton | 18.22% | 9.23%(+8.99)#69 | 8.59%(+9.63)#3,753 |
| 70. | Bentley | 18.13% | 9.23%(+8.90)#70 | 8.59%(+9.54)#3,793 |
| 71. | Runnells | 18.04% | 9.23%(+8.81)#71 | 8.59%(+9.45)#3,844 |
| 72. | Chillicothe | 17.91% | 9.23%(+8.68)#72 | 8.59%(+9.32)#3,911 |
| 73. | New Market | 17.84% | 9.23%(+8.61)#73 | 8.59%(+9.25)#3,953 |
| 74. | Seymour | 17.74% | 9.23%(+8.51)#74 | 8.59%(+9.15)#4,015 |
| 75. | Creston | 17.70% | 9.23%(+8.47)#75 | 8.59%(+9.11)#4,039 |
| 76. | Lineville | 17.69% | 9.23%(+8.46)#76 | 8.59%(+9.10)#4,045 |
| 77. | Russell | 17.67% | 9.23%(+8.44)#77 | 8.59%(+9.08)#4,061 |
| 78. | Mount Ayr | 17.63% | 9.23%(+8.40)#78 | 8.59%(+9.04)#4,100 |
| 79. | Ainsworth | 17.54% | 9.23%(+8.31)#79 | 8.59%(+8.95)#4,142 |
| 80. | Brandon | 17.53% | 9.23%(+8.30)#80 | 8.59%(+8.94)#4,147 |
| 81. | Pilot Mound | 17.50% | 9.23%(+8.27)#81 | 8.59%(+8.91)#4,166 |
| 82. | Homestead | 17.46% | 9.23%(+8.23)#82 | 8.59%(+8.87)#4,198 |
| 83. | Bloomfield | 17.45% | 9.23%(+8.22)#83 | 8.59%(+8.87)#4,205 |
| 84. | Tabor | 17.45% | 9.23%(+8.22)#84 | 8.59%(+8.86)#4,208 |
| 85. | Coppock | 17.39% | 9.23%(+8.16)#85 | 8.59%(+8.80)#4,239 |
| 86. | Marne | 17.35% | 9.23%(+8.12)#86 | 8.59%(+8.76)#4,265 |
| 87. | Hastings | 17.32% | 9.23%(+8.09)#87 | 8.59%(+8.73)#4,281 |
| 88. | Balltown | 17.24% | 9.23%(+8.01)#88 | 8.59%(+8.65)#4,328 |
| 89. | Beaman | 17.21% | 9.23%(+7.98)#89 | 8.59%(+8.62)#4,343 |
| 90. | Keswick | 17.20% | 9.23%(+7.97)#90 | 8.59%(+8.62)#4,346 |
| 91. | Somers | 17.16% | 9.23%(+7.93)#91 | 8.59%(+8.58)#4,368 |
| 92. | Modale | 17.09% | 9.23%(+7.86)#92 | 8.59%(+8.51)#4,415 |
| 93. | West Chester | 16.96% | 9.23%(+7.73)#93 | 8.59%(+8.37)#4,496 |
| 94. | Thornburg | 16.95% | 9.23%(+7.72)#94 | 8.59%(+8.36)#4,508 |
| 95. | Stuart | 16.69% | 9.23%(+7.46)#95 | 8.59%(+8.10)#4,663 |
| 96. | Le Claire | 16.65% | 9.23%(+7.42)#96 | 8.59%(+8.06)#4,701 |
| 97. | Floris | 16.56% | 9.23%(+7.33)#97 | 8.59%(+7.97)#4,764 |
| 98. | Chariton | 16.54% | 9.23%(+7.30)#98 | 8.59%(+7.95)#4,779 |
| 99. | Corning | 16.46% | 9.23%(+7.23)#99 | 8.59%(+7.87)#4,831 |
| 100. | Oto | 16.25% | 9.23%(+7.02)#100 | 8.59%(+7.66)#4,980 |
Common Questions
What are the Top 10 Cities with the Highest Percentage of English Population in Iowa?
Top 10 Cities with the Highest Percentage of English Population in Iowa are:
What city has the Highest Percentage of English Population in Iowa?
Frytown has the Highest Percentage of English Population in Iowa with 48.57%.
What is the Percentage of English Population in the State of Iowa?
Percentage of English Population in Iowa is 9.23%.
What is the Percentage of English Population in the United States?
Percentage of English Population in the United States is 8.59%.