La Crosse, WI Map & Demographics
La Crosse Map
La Crosse Overview
$32,811
PER CAPITA INCOME
$76,566
AVG FAMILY INCOME
$51,836
AVG HOUSEHOLD INCOME
30.1%
WAGE / INCOME GAP [ % ]
69.9¢/ $1
WAGE / INCOME GAP [ $ ]
$7,855
FAMILY INCOME DEFICIT
0.47
INEQUALITY / GINI INDEX
52,043
TOTAL POPULATION
25,249
MALE POPULATION
26,794
FEMALE POPULATION
94.23
MALES / 100 FEMALES
106.12
FEMALES / 100 MALES
30.0
MEDIAN AGE
2.8
AVG FAMILY SIZE
2.1
AVG HOUSEHOLD SIZE
29,128
LABOR FORCE [ PEOPLE ]
64.2%
PERCENT IN LABOR FORCE
3.5%
UNEMPLOYMENT RATE
La Crosse Area Codes
Income in La Crosse
Income Overview in La Crosse
Per Capita Income in La Crosse is $32,811, while median incomes of families and households are $76,566 and $51,836 respectively.
| Characteristic | Number | Measure |
| Per Capita Income | 52,043 | $32,811 |
| Median Family Income | 9,414 | $76,566 |
| Mean Family Income | 9,414 | $98,659 |
| Median Household Income | 22,662 | $51,836 |
| Mean Household Income | 22,662 | $71,736 |
| Income Deficit | 9,414 | $7,855 |
| Wage / Income Gap (%) | 52,043 | 30.12% |
| Wage / Income Gap ($) | 52,043 | 69.88¢ per $1 |
| Gini / Inequality Index | 52,043 | 0.47 |
Earnings by Sex in La Crosse
Average Earnings in La Crosse are $26,926, $32,882 for men and $22,977 for women, a difference of 30.1%.
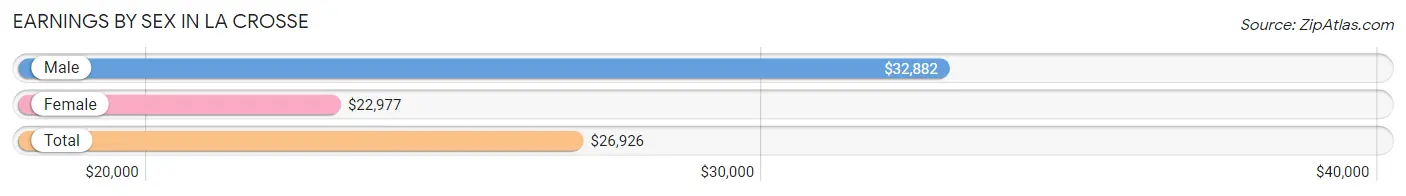
| Sex | Number | Average Earnings |
| Male | 16,299 (49.6%) | $32,882 |
| Female | 16,586 (50.4%) | $22,977 |
| Total | 32,885 (100.0%) | $26,926 |
Earnings by Sex by Income Bracket in La Crosse
The most common earnings brackets in La Crosse are $5,000 to $7,499 for men (1,426 | 8.7%) and $5,000 to $7,499 for women (1,300 | 7.8%).
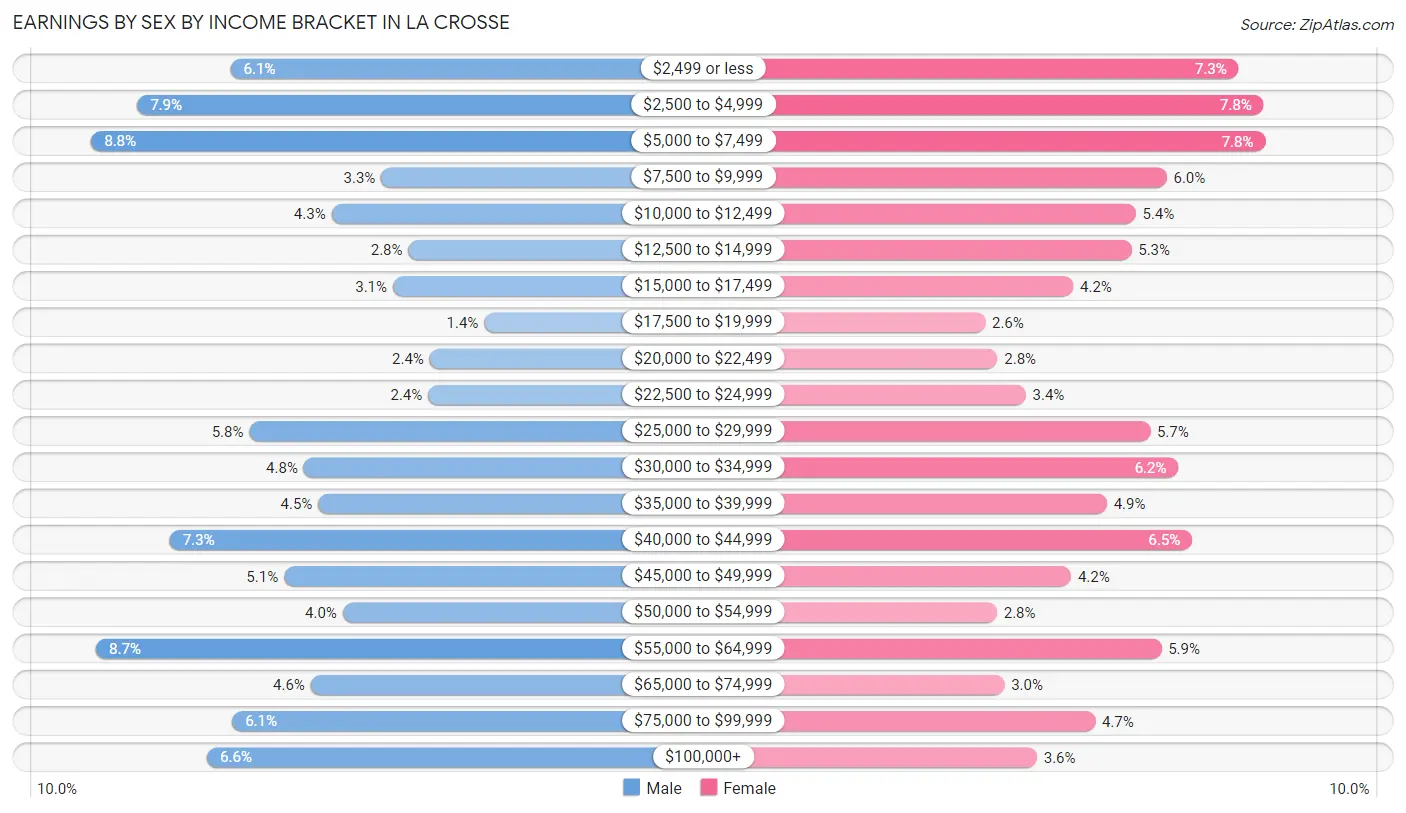
| Income | Male | Female |
| $2,499 or less | 1,001 (6.1%) | 1,218 (7.3%) |
| $2,500 to $4,999 | 1,286 (7.9%) | 1,295 (7.8%) |
| $5,000 to $7,499 | 1,426 (8.7%) | 1,300 (7.8%) |
| $7,500 to $9,999 | 541 (3.3%) | 993 (6.0%) |
| $10,000 to $12,499 | 692 (4.3%) | 897 (5.4%) |
| $12,500 to $14,999 | 458 (2.8%) | 884 (5.3%) |
| $15,000 to $17,499 | 505 (3.1%) | 704 (4.2%) |
| $17,500 to $19,999 | 227 (1.4%) | 429 (2.6%) |
| $20,000 to $22,499 | 392 (2.4%) | 467 (2.8%) |
| $22,500 to $24,999 | 398 (2.4%) | 556 (3.4%) |
| $25,000 to $29,999 | 943 (5.8%) | 942 (5.7%) |
| $30,000 to $34,999 | 777 (4.8%) | 1,030 (6.2%) |
| $35,000 to $39,999 | 733 (4.5%) | 807 (4.9%) |
| $40,000 to $44,999 | 1,186 (7.3%) | 1,073 (6.5%) |
| $45,000 to $49,999 | 837 (5.1%) | 696 (4.2%) |
| $50,000 to $54,999 | 659 (4.0%) | 466 (2.8%) |
| $55,000 to $64,999 | 1,412 (8.7%) | 977 (5.9%) |
| $65,000 to $74,999 | 757 (4.6%) | 489 (2.9%) |
| $75,000 to $99,999 | 996 (6.1%) | 772 (4.6%) |
| $100,000+ | 1,073 (6.6%) | 591 (3.6%) |
| Total | 16,299 (100.0%) | 16,586 (100.0%) |
Earnings by Sex by Educational Attainment in La Crosse
Average earnings in La Crosse are $45,219 for men and $39,589 for women, a difference of 12.4%. Men with an educational attainment of graduate degree enjoy the highest average annual earnings of $66,181, while those with less than high school education earn the least with $32,200. Women with an educational attainment of graduate degree earn the most with the average annual earnings of $61,094, while those with less than high school education have the smallest earnings of $15,290.
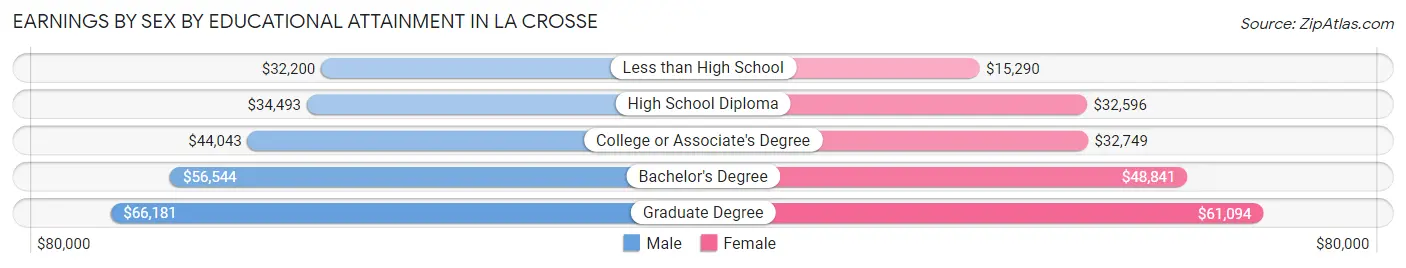
| Educational Attainment | Male Income | Female Income |
| Less than High School | $32,200 | $15,290 |
| High School Diploma | $34,493 | $32,596 |
| College or Associate's Degree | $44,043 | $32,749 |
| Bachelor's Degree | $56,544 | $48,841 |
| Graduate Degree | $66,181 | $61,094 |
| Total | $45,219 | $39,589 |
Family Income in La Crosse
Family Income Brackets in La Crosse
According to the La Crosse family income data, there are 1,892 families falling into the $50,000 to $74,999 income range, which is the most common income bracket and makes up 20.1% of all families. Conversely, the less than $10,000 income bracket is the least frequent group with only 132 families (1.4%) belonging to this category.
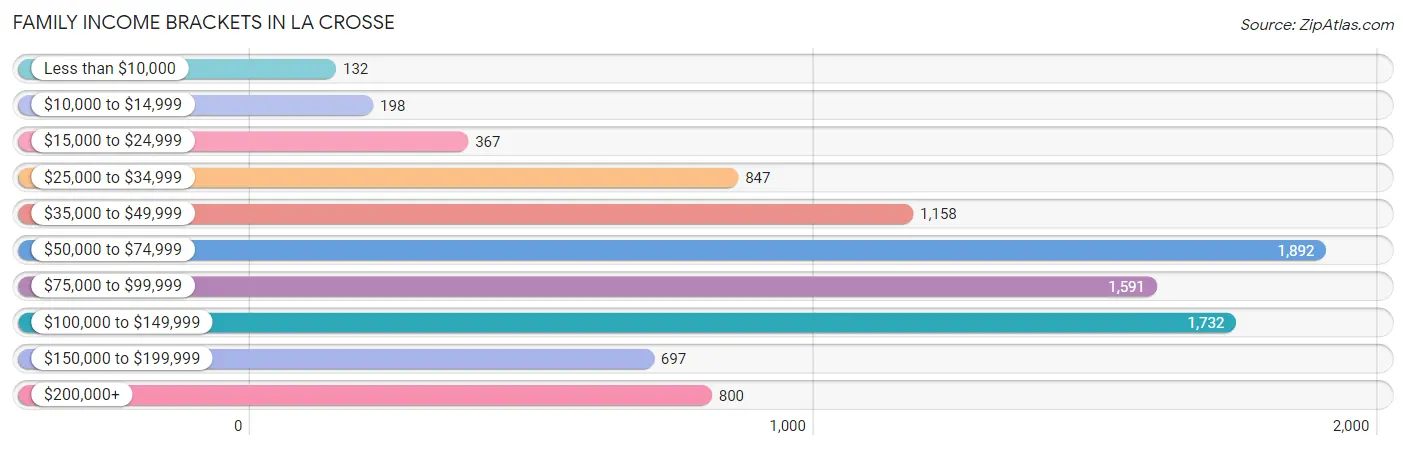
| Income Bracket | # Families | % Families |
| Less than $10,000 | 132 | 1.4% |
| $10,000 to $14,999 | 198 | 2.1% |
| $15,000 to $24,999 | 367 | 3.9% |
| $25,000 to $34,999 | 847 | 9.0% |
| $35,000 to $49,999 | 1,158 | 12.3% |
| $50,000 to $74,999 | 1,892 | 20.1% |
| $75,000 to $99,999 | 1,591 | 16.9% |
| $100,000 to $149,999 | 1,732 | 18.4% |
| $150,000 to $199,999 | 697 | 7.4% |
| $200,000+ | 800 | 8.5% |
Family Income by Famaliy Size in La Crosse
4-person families (1,507 | 16.0%) account for the highest median family income in La Crosse with $96,516 per family, while 2-person families (5,095 | 54.1%) have the highest median income of $33,882 per family member.
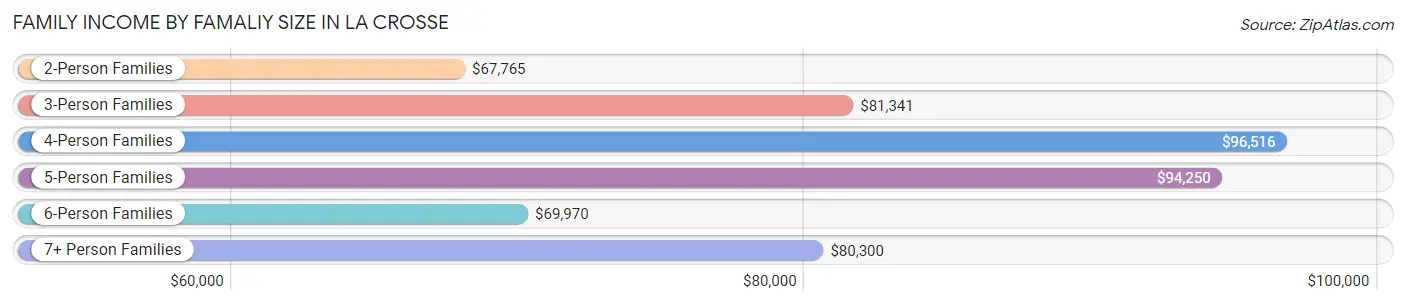
| Income Bracket | # Families | Median Income |
| 2-Person Families | 5,095 (54.1%) | $67,765 |
| 3-Person Families | 2,185 (23.2%) | $81,341 |
| 4-Person Families | 1,507 (16.0%) | $96,516 |
| 5-Person Families | 392 (4.2%) | $94,250 |
| 6-Person Families | 133 (1.4%) | $69,970 |
| 7+ Person Families | 102 (1.1%) | $80,300 |
| Total | 9,414 (100.0%) | $76,566 |
Family Income by Number of Earners in La Crosse
The median family income in La Crosse is $76,566, with families comprising 3+ earners (794) having the highest median family income of $99,293, while families with no earners (1,495) have the lowest median family income of $49,276, accounting for 8.4% and 15.9% of families, respectively.
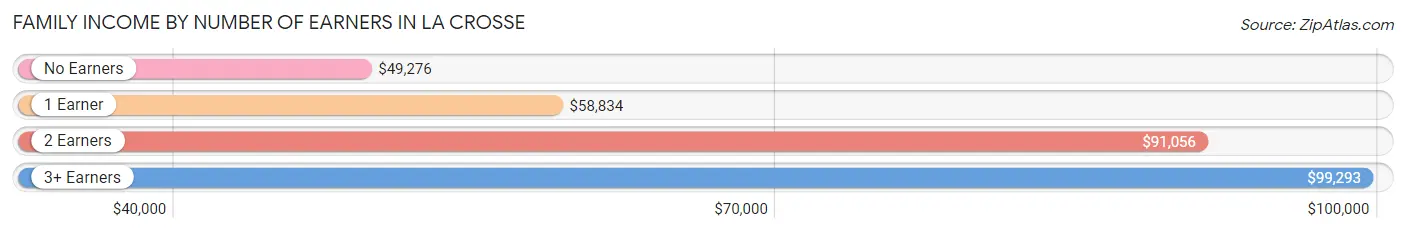
| Number of Earners | # Families | Median Income |
| No Earners | 1,495 (15.9%) | $49,276 |
| 1 Earner | 2,622 (27.9%) | $58,834 |
| 2 Earners | 4,503 (47.8%) | $91,056 |
| 3+ Earners | 794 (8.4%) | $99,293 |
| Total | 9,414 (100.0%) | $76,566 |
Household Income in La Crosse
Household Income Brackets in La Crosse
With 4,260 households falling in the category, the $50,000 to $74,999 income range is the most frequent in La Crosse, accounting for 18.8% of all households. In contrast, only 861 households (3.8%) fall into the $150,000 to $199,999 income bracket, making it the least populous group.
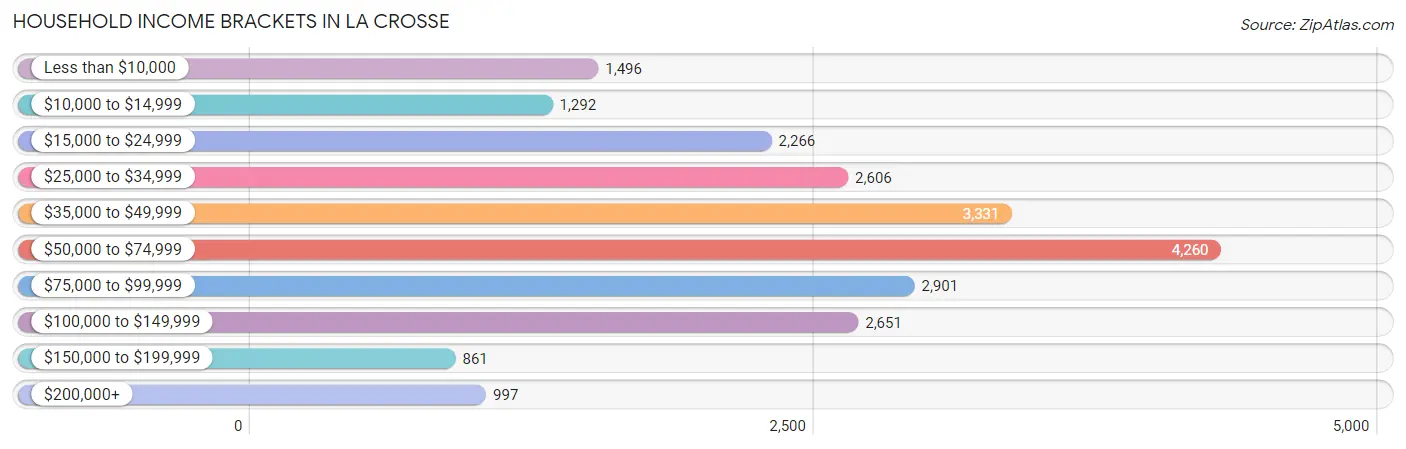
| Income Bracket | # Households | % Households |
| Less than $10,000 | 1,496 | 6.6% |
| $10,000 to $14,999 | 1,292 | 5.7% |
| $15,000 to $24,999 | 2,266 | 10.0% |
| $25,000 to $34,999 | 2,606 | 11.5% |
| $35,000 to $49,999 | 3,331 | 14.7% |
| $50,000 to $74,999 | 4,260 | 18.8% |
| $75,000 to $99,999 | 2,901 | 12.8% |
| $100,000 to $149,999 | 2,651 | 11.7% |
| $150,000 to $199,999 | 861 | 3.8% |
| $200,000+ | 997 | 4.4% |
Household Income by Householder Age in La Crosse
The median household income in La Crosse is $51,836, with the highest median household income of $65,950 found in the 25 to 44 years age bracket for the primary householder. A total of 7,258 households (32.0%) fall into this category. Meanwhile, the 15 to 24 years age bracket for the primary householder has the lowest median household income of $28,410, with 3,984 households (17.6%) in this group.
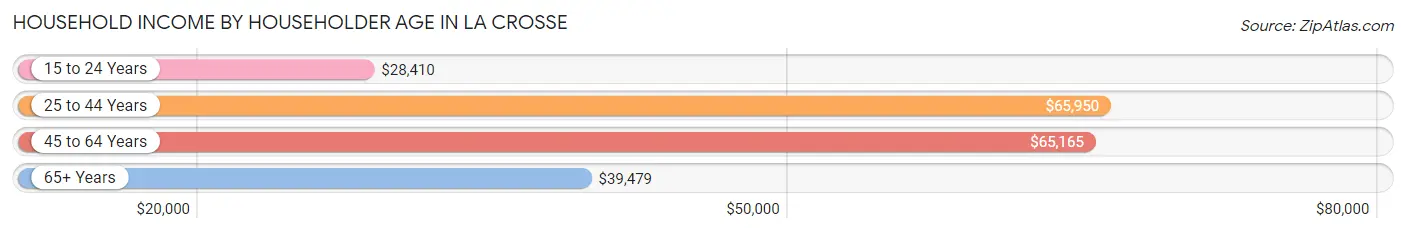
| Income Bracket | # Households | Median Income |
| 15 to 24 Years | 3,984 (17.6%) | $28,410 |
| 25 to 44 Years | 7,258 (32.0%) | $65,950 |
| 45 to 64 Years | 5,855 (25.8%) | $65,165 |
| 65+ Years | 5,565 (24.6%) | $39,479 |
| Total | 22,662 (100.0%) | $51,836 |
Poverty in La Crosse
Income Below Poverty by Sex and Age in La Crosse
With 19.6% poverty level for males and 22.4% for females among the residents of La Crosse, 18 to 24 year old males and 18 to 24 year old females are the most vulnerable to poverty, with 2,744 males (58.3%) and 3,322 females (56.1%) in their respective age groups living below the poverty level.
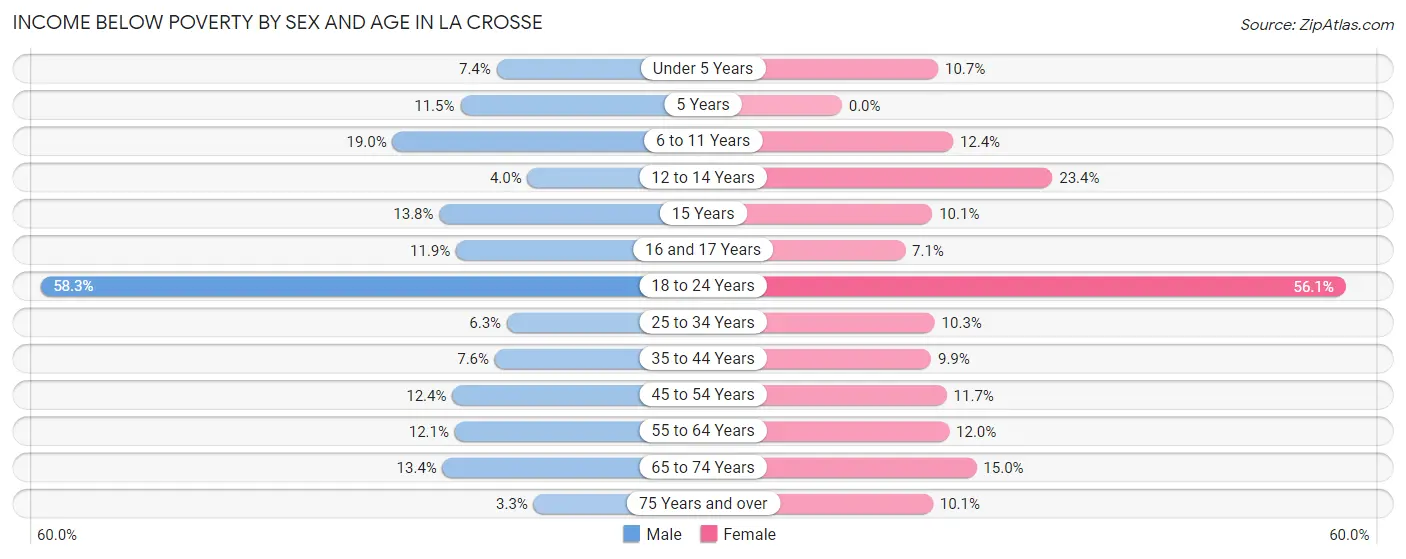
| Age Bracket | Male | Female |
| Under 5 Years | 76 (7.4%) | 124 (10.7%) |
| 5 Years | 21 (11.5%) | 0 (0.0%) |
| 6 to 11 Years | 238 (19.0%) | 121 (12.4%) |
| 12 to 14 Years | 25 (4.0%) | 192 (23.4%) |
| 15 Years | 33 (13.8%) | 15 (10.1%) |
| 16 and 17 Years | 32 (11.9%) | 44 (7.0%) |
| 18 to 24 Years | 2,744 (58.3%) | 3,322 (56.1%) |
| 25 to 34 Years | 256 (6.3%) | 373 (10.3%) |
| 35 to 44 Years | 201 (7.6%) | 245 (9.9%) |
| 45 to 54 Years | 264 (12.4%) | 230 (11.7%) |
| 55 to 64 Years | 315 (12.1%) | 277 (11.9%) |
| 65 to 74 Years | 288 (13.4%) | 370 (15.0%) |
| 75 Years and over | 41 (3.3%) | 210 (10.1%) |
| Total | 4,534 (19.6%) | 5,523 (22.4%) |
Income Above Poverty by Sex and Age in La Crosse
According to the poverty statistics in La Crosse, males aged 75 years and over and females aged 5 years are the age groups that are most secure financially, with 96.7% of males and 100.0% of females in these age groups living above the poverty line.
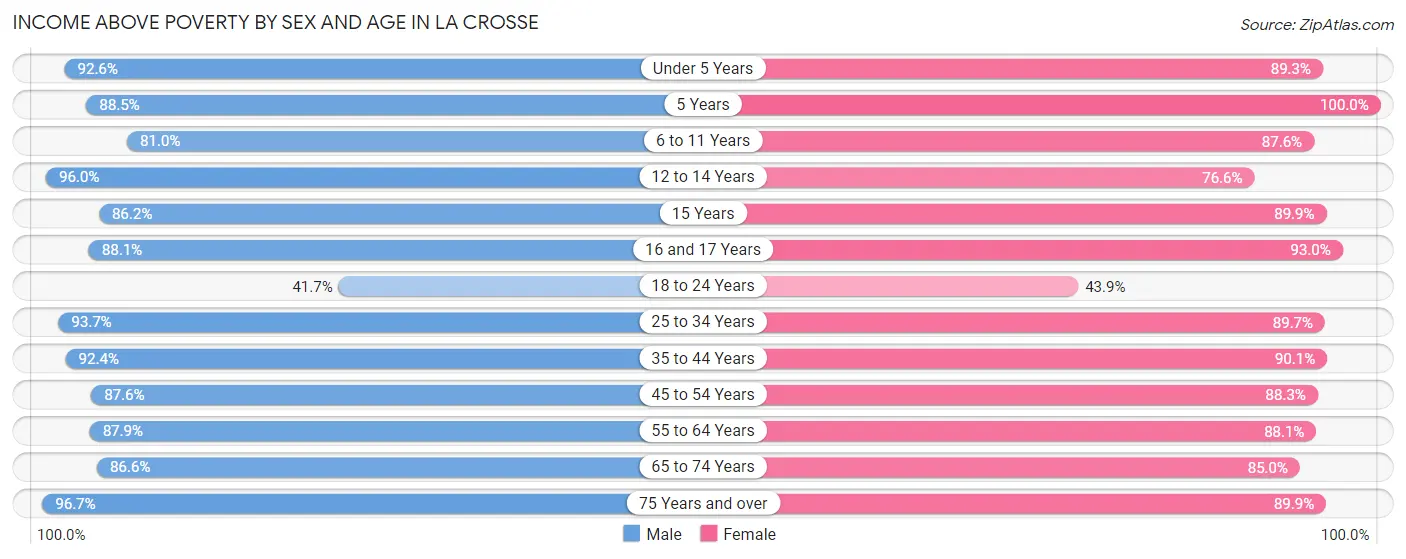
| Age Bracket | Male | Female |
| Under 5 Years | 947 (92.6%) | 1,033 (89.3%) |
| 5 Years | 162 (88.5%) | 163 (100.0%) |
| 6 to 11 Years | 1,013 (81.0%) | 856 (87.6%) |
| 12 to 14 Years | 602 (96.0%) | 627 (76.6%) |
| 15 Years | 206 (86.2%) | 134 (89.9%) |
| 16 and 17 Years | 236 (88.1%) | 580 (92.9%) |
| 18 to 24 Years | 1,966 (41.7%) | 2,599 (43.9%) |
| 25 to 34 Years | 3,820 (93.7%) | 3,233 (89.7%) |
| 35 to 44 Years | 2,435 (92.4%) | 2,221 (90.1%) |
| 45 to 54 Years | 1,870 (87.6%) | 1,739 (88.3%) |
| 55 to 64 Years | 2,290 (87.9%) | 2,041 (88.0%) |
| 65 to 74 Years | 1,855 (86.6%) | 2,098 (85.0%) |
| 75 Years and over | 1,202 (96.7%) | 1,863 (89.9%) |
| Total | 18,604 (80.4%) | 19,187 (77.6%) |
Income Below Poverty Among Married-Couple Families in La Crosse
The poverty statistics for married-couple families in La Crosse show that 2.5% or 160 of the total 6,340 families live below the poverty line. Families with no children have the highest poverty rate of 3.4%, comprising of 129 families. On the other hand, families with 5 or more children have the lowest poverty rate of 0.0%, which includes 0 families.
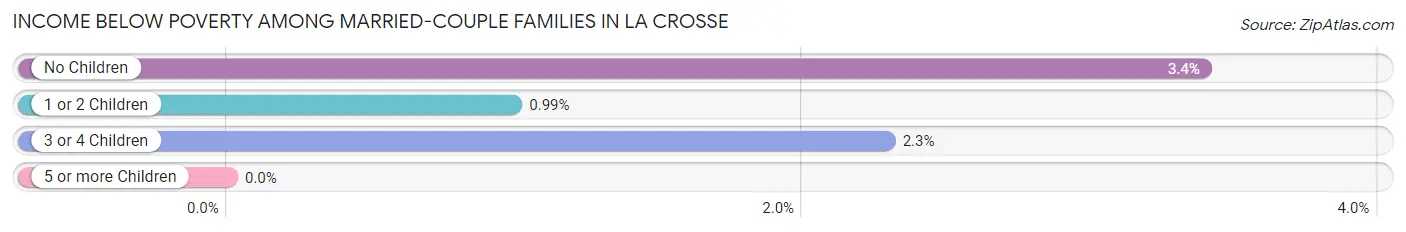
| Children | Above Poverty | Below Poverty |
| No Children | 3,676 (96.6%) | 129 (3.4%) |
| 1 or 2 Children | 1,994 (99.0%) | 20 (1.0%) |
| 3 or 4 Children | 469 (97.7%) | 11 (2.3%) |
| 5 or more Children | 41 (100.0%) | 0 (0.0%) |
| Total | 6,180 (97.5%) | 160 (2.5%) |
Income Below Poverty Among Single-Parent Households in La Crosse
According to the poverty data in La Crosse, 17.2% or 218 single-father households and 14.3% or 258 single-mother households are living below the poverty line. Among single-father households, those with 3 or 4 children have the highest poverty rate, with 20 households (40.0%) experiencing poverty. Likewise, among single-mother households, those with 3 or 4 children have the highest poverty rate, with 83 households (46.9%) falling below the poverty line.
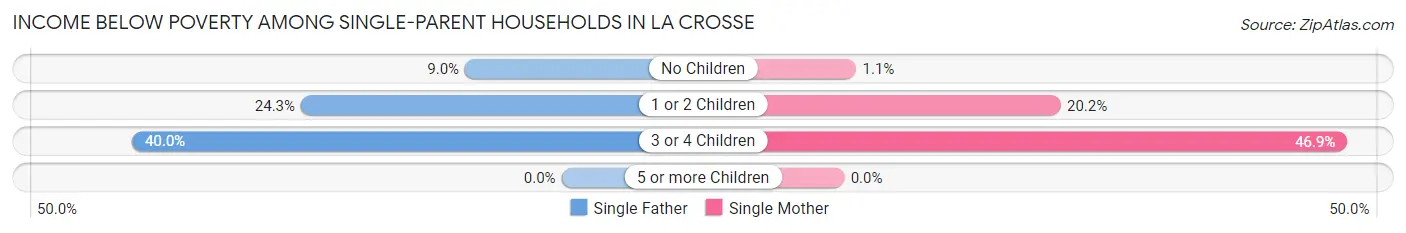
| Children | Single Father | Single Mother |
| No Children | 57 (9.0%) | 9 (1.1%) |
| 1 or 2 Children | 141 (24.3%) | 166 (20.2%) |
| 3 or 4 Children | 20 (40.0%) | 83 (46.9%) |
| 5 or more Children | 0 (0.0%) | 0 (0.0%) |
| Total | 218 (17.2%) | 258 (14.3%) |
Income Below Poverty Among Married-Couple vs Single-Parent Households in La Crosse
The poverty data for La Crosse shows that 160 of the married-couple family households (2.5%) and 476 of the single-parent households (15.5%) are living below the poverty level. Within the married-couple family households, those with no children have the highest poverty rate, with 129 households (3.4%) falling below the poverty line. Among the single-parent households, those with 3 or 4 children have the highest poverty rate, with 103 household (45.4%) living below poverty.
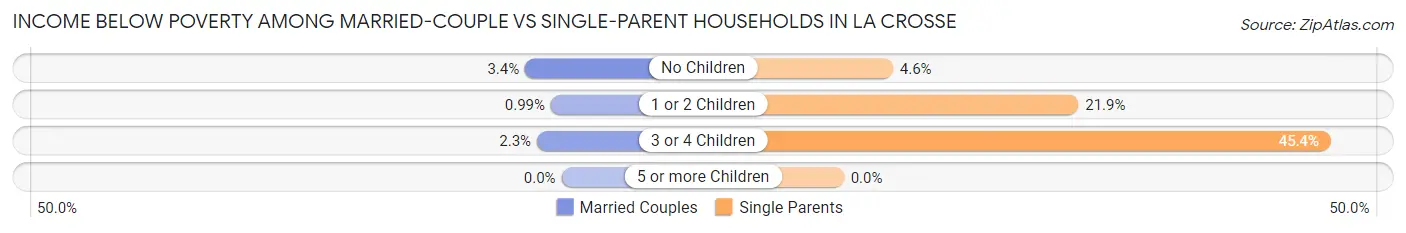
| Children | Married-Couple Families | Single-Parent Households |
| No Children | 129 (3.4%) | 66 (4.6%) |
| 1 or 2 Children | 20 (1.0%) | 307 (21.8%) |
| 3 or 4 Children | 11 (2.3%) | 103 (45.4%) |
| 5 or more Children | 0 (0.0%) | 0 (0.0%) |
| Total | 160 (2.5%) | 476 (15.5%) |
Race in La Crosse
The most populous races in La Crosse are White / Caucasian (46,480 | 89.3%), Asian (2,089 | 4.0%), and Two or more Races (1,886 | 3.6%).
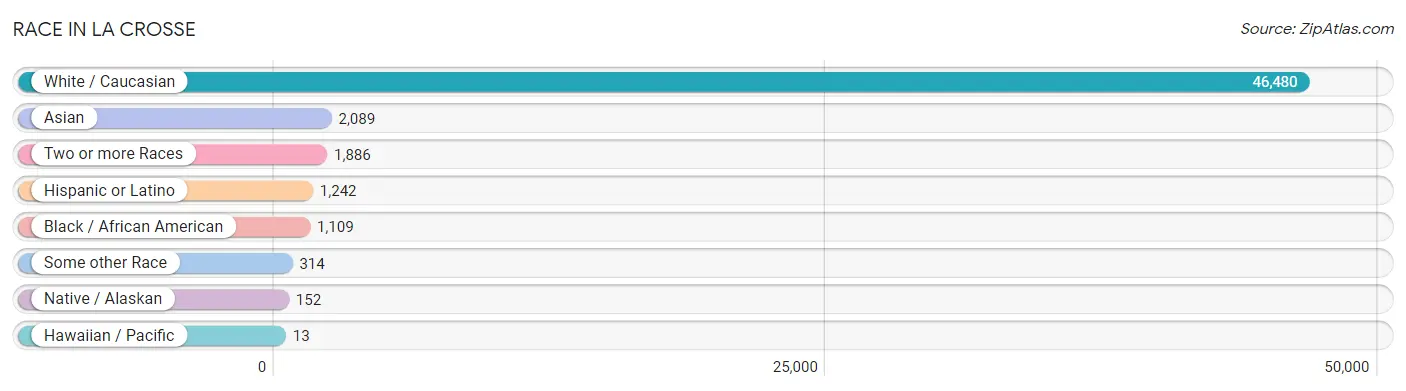
| Race | # Population | % Population |
| Asian | 2,089 | 4.0% |
| Black / African American | 1,109 | 2.1% |
| Hawaiian / Pacific | 13 | 0.0% |
| Hispanic or Latino | 1,242 | 2.4% |
| Native / Alaskan | 152 | 0.3% |
| White / Caucasian | 46,480 | 89.3% |
| Two or more Races | 1,886 | 3.6% |
| Some other Race | 314 | 0.6% |
| Total | 52,043 | 100.0% |
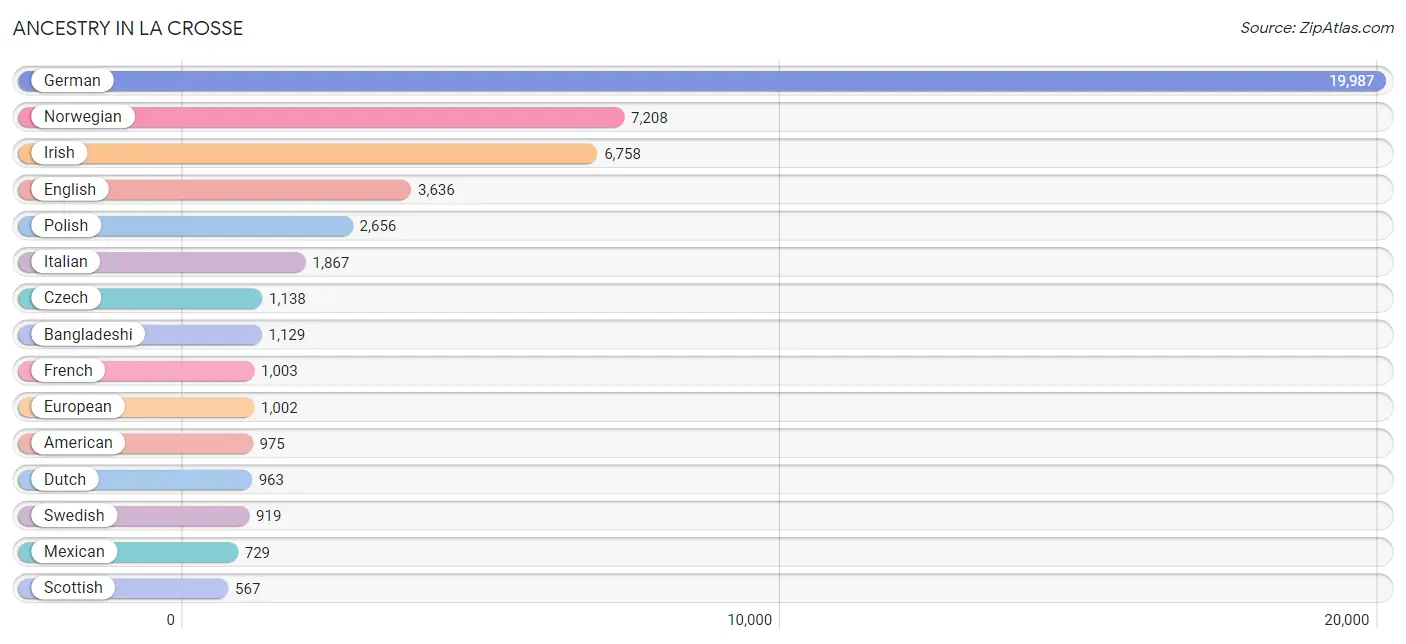
Ancestry in La Crosse
The most populous ancestries reported in La Crosse are German (19,987 | 38.4%), Norwegian (7,208 | 13.9%), Irish (6,758 | 13.0%), English (3,636 | 7.0%), and Polish (2,656 | 5.1%), together accounting for 77.3% of all La Crosse residents.
| Ancestry | # Population | % Population |
| African | 114 | 0.2% |
| Alsatian | 13 | 0.0% |
| American | 975 | 1.9% |
| Arab | 356 | 0.7% |
| Australian | 6 | 0.0% |
| Austrian | 132 | 0.3% |
| Bangladeshi | 1,129 | 2.2% |
| Belgian | 53 | 0.1% |
| Belizean | 9 | 0.0% |
| Bhutanese | 118 | 0.2% |
| Blackfeet | 3 | 0.0% |
| Brazilian | 31 | 0.1% |
| British | 225 | 0.4% |
| Bulgarian | 15 | 0.0% |
| Burmese | 104 | 0.2% |
| Canadian | 99 | 0.2% |
| Celtic | 38 | 0.1% |
| Central American | 132 | 0.3% |
| Cherokee | 114 | 0.2% |
| Chippewa | 80 | 0.2% |
| Choctaw | 4 | 0.0% |
| Colombian | 37 | 0.1% |
| Costa Rican | 9 | 0.0% |
| Croatian | 11 | 0.0% |
| Cuban | 76 | 0.2% |
| Czech | 1,138 | 2.2% |
| Czechoslovakian | 161 | 0.3% |
| Danish | 551 | 1.1% |
| Dutch | 963 | 1.8% |
| Eastern European | 118 | 0.2% |
| English | 3,636 | 7.0% |
| Ethiopian | 8 | 0.0% |
| European | 1,002 | 1.9% |
| Filipino | 4 | 0.0% |
| Finnish | 306 | 0.6% |
| French | 1,003 | 1.9% |
| French Canadian | 332 | 0.6% |
| German | 19,987 | 38.4% |
| Ghanaian | 7 | 0.0% |
| Greek | 61 | 0.1% |
| Guamanian / Chamorro | 5 | 0.0% |
| Guatemalan | 51 | 0.1% |
| Honduran | 28 | 0.1% |
| Hungarian | 54 | 0.1% |
| Icelander | 6 | 0.0% |
| Indian (Asian) | 348 | 0.7% |
| Irish | 6,758 | 13.0% |
| Iroquois | 3 | 0.0% |
| Italian | 1,867 | 3.6% |
| Korean | 359 | 0.7% |
| Laotian | 21 | 0.0% |
| Latvian | 9 | 0.0% |
| Lebanese | 175 | 0.3% |
| Lithuanian | 103 | 0.2% |
| Luxembourger | 68 | 0.1% |
| Macedonian | 14 | 0.0% |
| Malaysian | 21 | 0.0% |
| Menominee | 31 | 0.1% |
| Mexican | 729 | 1.4% |
| Native Hawaiian | 13 | 0.0% |
| Nicaraguan | 10 | 0.0% |
| Nigerian | 35 | 0.1% |
| Northern European | 91 | 0.2% |
| Norwegian | 7,208 | 13.9% |
| Panamanian | 34 | 0.1% |
| Pennsylvania German | 82 | 0.2% |
| Peruvian | 58 | 0.1% |
| Polish | 2,656 | 5.1% |
| Portuguese | 71 | 0.1% |
| Potawatomi | 6 | 0.0% |
| Puerto Rican | 123 | 0.2% |
| Romanian | 24 | 0.1% |
| Russian | 208 | 0.4% |
| Scandinavian | 385 | 0.7% |
| Scotch-Irish | 259 | 0.5% |
| Scottish | 567 | 1.1% |
| Serbian | 169 | 0.3% |
| Sioux | 19 | 0.0% |
| Slovak | 59 | 0.1% |
| Slovene | 67 | 0.1% |
| South American | 113 | 0.2% |
| Spaniard | 26 | 0.1% |
| Spanish | 17 | 0.0% |
| Sri Lankan | 71 | 0.1% |
| Subsaharan African | 157 | 0.3% |
| Swedish | 919 | 1.8% |
| Swiss | 346 | 0.7% |
| Syrian | 48 | 0.1% |
| Thai | 157 | 0.3% |
| Turkish | 8 | 0.0% |
| Ukrainian | 4 | 0.0% |
| Venezuelan | 18 | 0.0% |
| Vietnamese | 61 | 0.1% |
| Welsh | 115 | 0.2% |
| Yugoslavian | 97 | 0.2% |
| Yup'ik | 8 | 0.0% | View All 96 Rows |
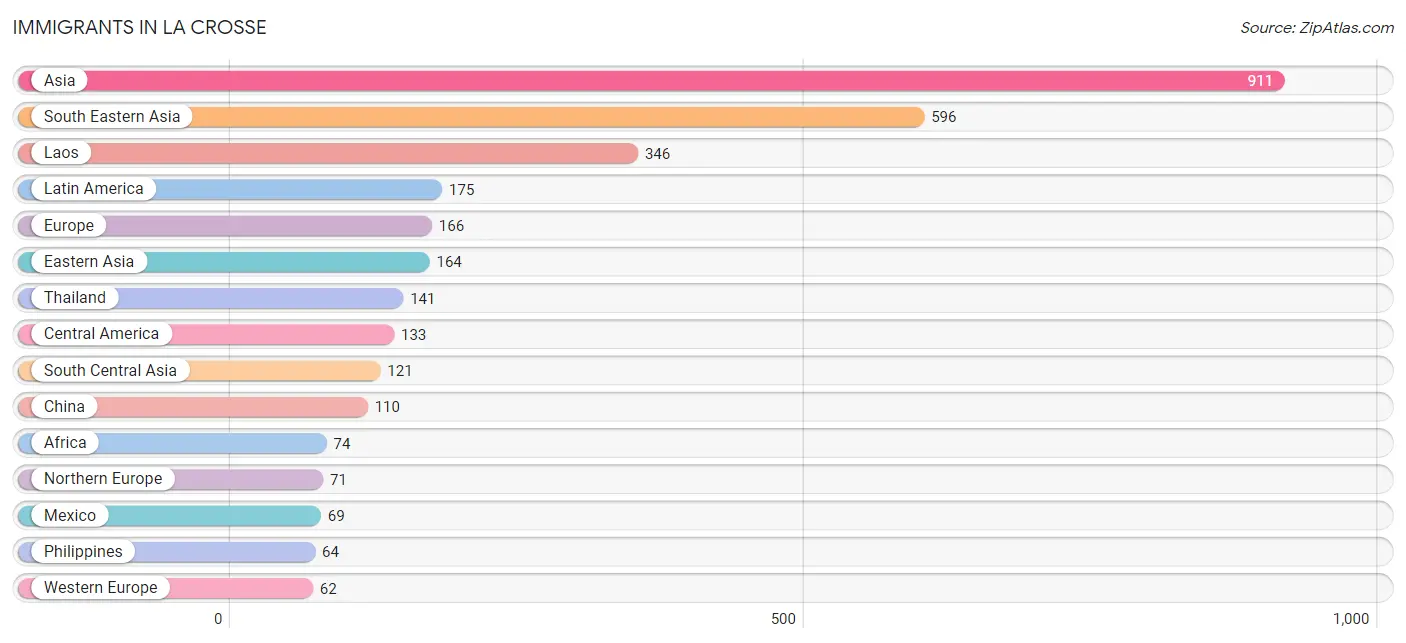
Immigrants in La Crosse
The most numerous immigrant groups reported in La Crosse came from Asia (911 | 1.8%), South Eastern Asia (596 | 1.1%), Laos (346 | 0.7%), Latin America (175 | 0.3%), and Europe (166 | 0.3%), together accounting for 4.2% of all La Crosse residents.
| Immigration Origin | # Population | % Population |
| Africa | 74 | 0.1% |
| Asia | 911 | 1.8% |
| Austria | 1 | 0.0% |
| Bangladesh | 61 | 0.1% |
| Belize | 9 | 0.0% |
| Bulgaria | 15 | 0.0% |
| Cambodia | 12 | 0.0% |
| Canada | 27 | 0.1% |
| Central America | 133 | 0.3% |
| China | 110 | 0.2% |
| Congo | 19 | 0.0% |
| Costa Rica | 9 | 0.0% |
| Eastern Africa | 32 | 0.1% |
| Eastern Asia | 164 | 0.3% |
| Eastern Europe | 33 | 0.1% |
| England | 15 | 0.0% |
| Ethiopia | 32 | 0.1% |
| Europe | 166 | 0.3% |
| Germany | 44 | 0.1% |
| Guatemala | 18 | 0.0% |
| Honduras | 28 | 0.1% |
| India | 60 | 0.1% |
| Indonesia | 12 | 0.0% |
| Jordan | 30 | 0.1% |
| Korea | 54 | 0.1% |
| Laos | 346 | 0.7% |
| Latin America | 175 | 0.3% |
| Mexico | 69 | 0.1% |
| Middle Africa | 19 | 0.0% |
| Netherlands | 7 | 0.0% |
| Nigeria | 15 | 0.0% |
| Northern Europe | 71 | 0.1% |
| Peru | 24 | 0.1% |
| Philippines | 64 | 0.1% |
| Romania | 10 | 0.0% |
| Russia | 4 | 0.0% |
| South Africa | 8 | 0.0% |
| South America | 42 | 0.1% |
| South Central Asia | 121 | 0.2% |
| South Eastern Asia | 596 | 1.1% |
| Switzerland | 10 | 0.0% |
| Taiwan | 12 | 0.0% |
| Thailand | 141 | 0.3% |
| Ukraine | 4 | 0.0% |
| Venezuela | 18 | 0.0% |
| Vietnam | 21 | 0.0% |
| Western Africa | 15 | 0.0% |
| Western Asia | 30 | 0.1% |
| Western Europe | 62 | 0.1% | View All 49 Rows |
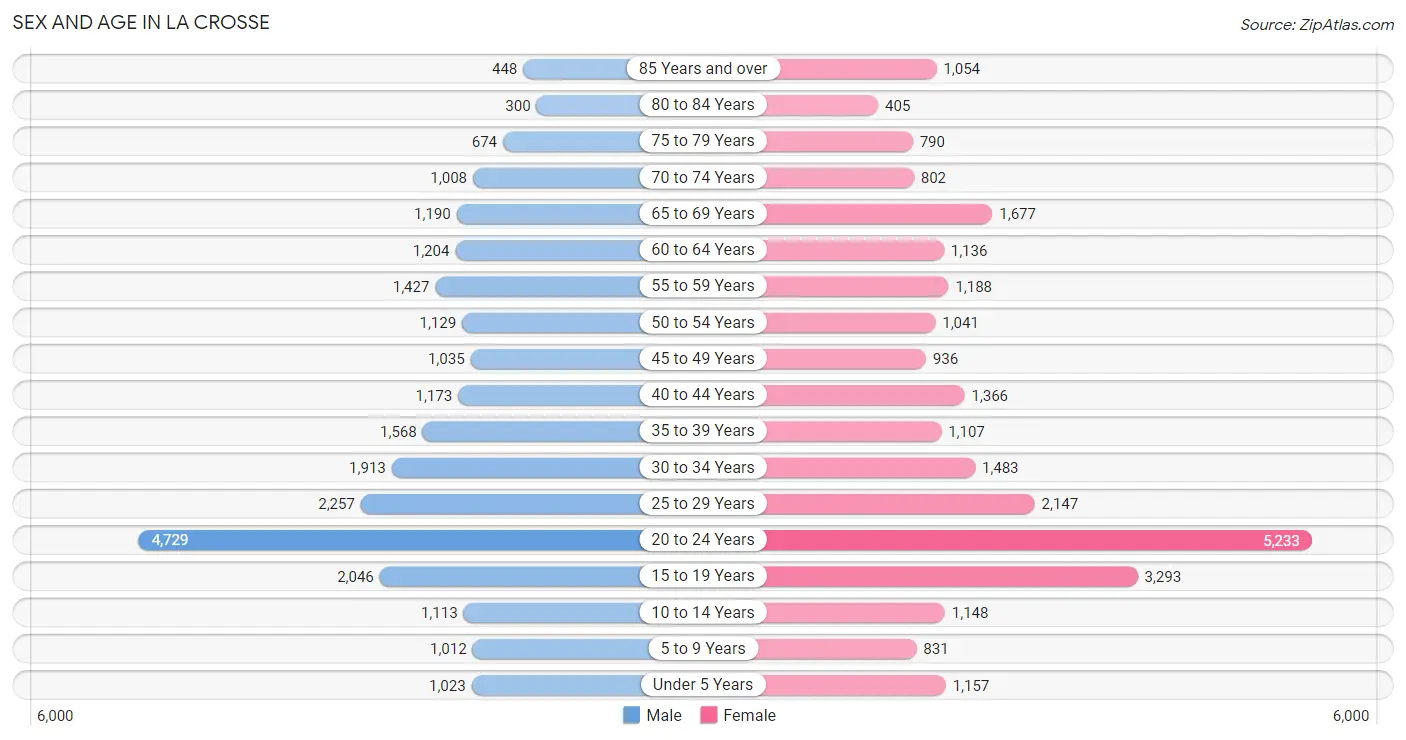
Sex and Age in La Crosse
Sex and Age in La Crosse
The most populous age groups in La Crosse are 20 to 24 Years (4,729 | 18.7%) for men and 20 to 24 Years (5,233 | 19.5%) for women.
| Age Bracket | Male | Female |
| Under 5 Years | 1,023 (4.1%) | 1,157 (4.3%) |
| 5 to 9 Years | 1,012 (4.0%) | 831 (3.1%) |
| 10 to 14 Years | 1,113 (4.4%) | 1,148 (4.3%) |
| 15 to 19 Years | 2,046 (8.1%) | 3,293 (12.3%) |
| 20 to 24 Years | 4,729 (18.7%) | 5,233 (19.5%) |
| 25 to 29 Years | 2,257 (8.9%) | 2,147 (8.0%) |
| 30 to 34 Years | 1,913 (7.6%) | 1,483 (5.5%) |
| 35 to 39 Years | 1,568 (6.2%) | 1,107 (4.1%) |
| 40 to 44 Years | 1,173 (4.6%) | 1,366 (5.1%) |
| 45 to 49 Years | 1,035 (4.1%) | 936 (3.5%) |
| 50 to 54 Years | 1,129 (4.5%) | 1,041 (3.9%) |
| 55 to 59 Years | 1,427 (5.7%) | 1,188 (4.4%) |
| 60 to 64 Years | 1,204 (4.8%) | 1,136 (4.2%) |
| 65 to 69 Years | 1,190 (4.7%) | 1,677 (6.3%) |
| 70 to 74 Years | 1,008 (4.0%) | 802 (3.0%) |
| 75 to 79 Years | 674 (2.7%) | 790 (2.9%) |
| 80 to 84 Years | 300 (1.2%) | 405 (1.5%) |
| 85 Years and over | 448 (1.8%) | 1,054 (3.9%) |
| Total | 25,249 (100.0%) | 26,794 (100.0%) |
Families and Households in La Crosse
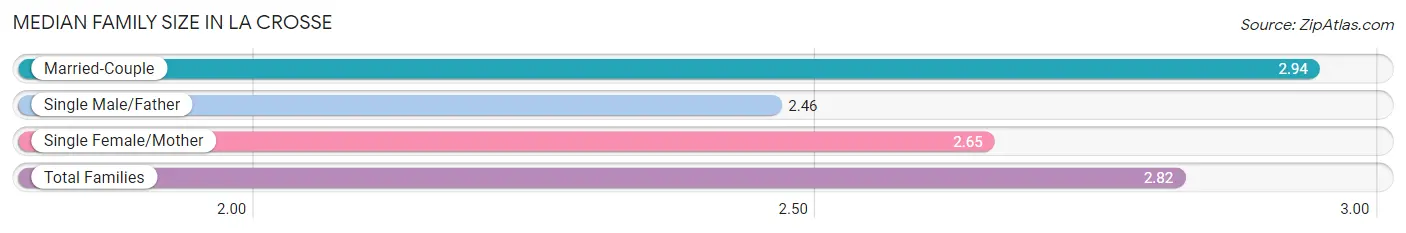
Median Family Size in La Crosse
The median family size in La Crosse is 2.82 persons per family, with married-couple families (6,340 | 67.3%) accounting for the largest median family size of 2.94 persons per family. On the other hand, single male/father families (1,265 | 13.4%) represent the smallest median family size with 2.46 persons per family.
| Family Type | # Families | Family Size |
| Married-Couple | 6,340 (67.3%) | 2.94 |
| Single Male/Father | 1,265 (13.4%) | 2.46 |
| Single Female/Mother | 1,809 (19.2%) | 2.65 |
| Total Families | 9,414 (100.0%) | 2.82 |
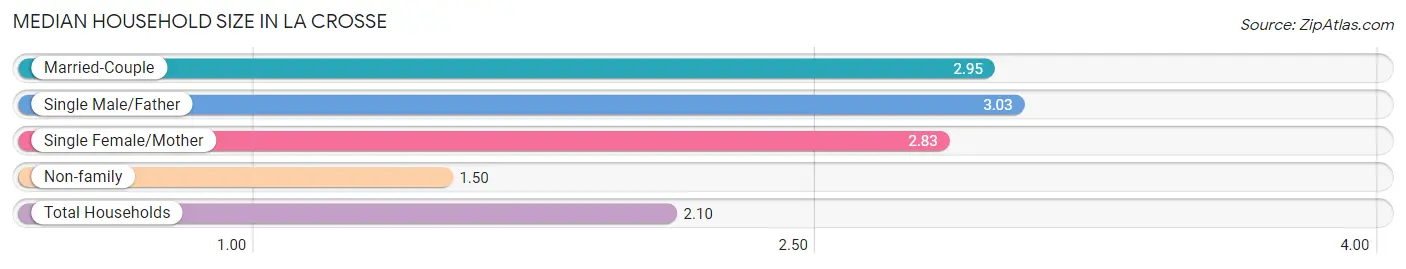
Median Household Size in La Crosse
The median household size in La Crosse is 2.10 persons per household, with single male/father households (1,265 | 5.6%) accounting for the largest median household size of 3.03 persons per household. non-family households (13,248 | 58.5%) represent the smallest median household size with 1.50 persons per household.
| Household Type | # Households | Household Size |
| Married-Couple | 6,340 (28.0%) | 2.95 |
| Single Male/Father | 1,265 (5.6%) | 3.03 |
| Single Female/Mother | 1,809 (8.0%) | 2.83 |
| Non-family | 13,248 (58.5%) | 1.50 |
| Total Households | 22,662 (100.0%) | 2.10 |
Household Size by Marriage Status in La Crosse
Out of a total of 22,662 households in La Crosse, 9,414 (41.5%) are family households, while 13,248 (58.5%) are nonfamily households. The most numerous type of family households are 2-person households, comprising 4,594, and the most common type of nonfamily households are 1-person households, comprising 9,255.
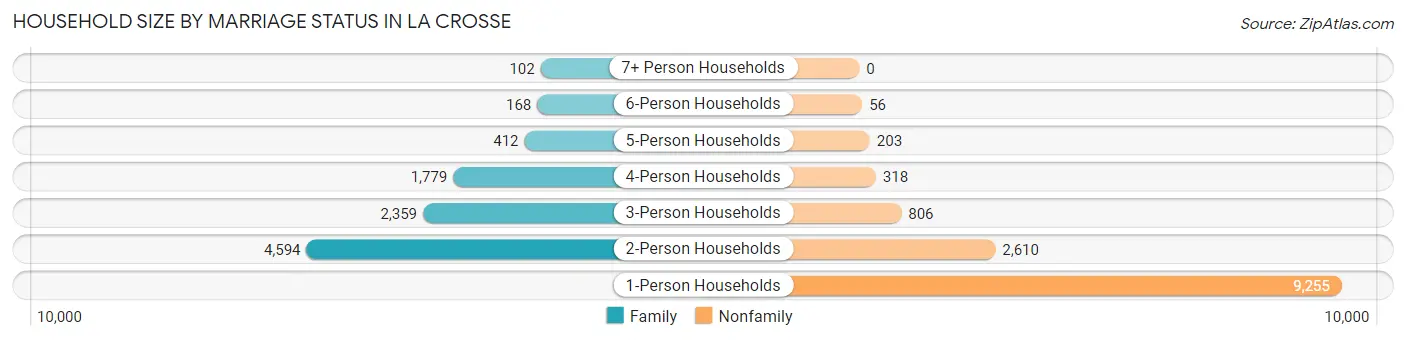
| Household Size | Family Households | Nonfamily Households |
| 1-Person Households | - | 9,255 (40.8%) |
| 2-Person Households | 4,594 (20.3%) | 2,610 (11.5%) |
| 3-Person Households | 2,359 (10.4%) | 806 (3.6%) |
| 4-Person Households | 1,779 (7.9%) | 318 (1.4%) |
| 5-Person Households | 412 (1.8%) | 203 (0.9%) |
| 6-Person Households | 168 (0.7%) | 56 (0.3%) |
| 7+ Person Households | 102 (0.4%) | 0 (0.0%) |
| Total | 9,414 (41.5%) | 13,248 (58.5%) |
Female Fertility in La Crosse
Fertility by Age in La Crosse
Average fertility rate in La Crosse is 32.0 births per 1,000 women. Women in the age bracket of 35 to 50 years have the highest fertility rate with 55.0 births per 1,000 women. Women in the age bracket of 20 to 34 years acount for 61.3% of all women with births.
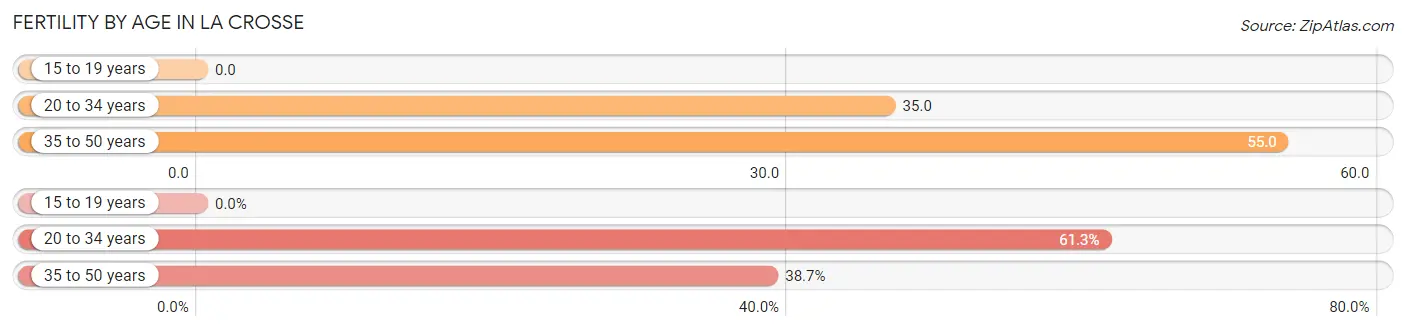
| Age Bracket | Women with Births | Births / 1,000 Women |
| 15 to 19 years | 0 (0.0%) | 0.0 |
| 20 to 34 years | 312 (61.3%) | 35.0 |
| 35 to 50 years | 197 (38.7%) | 55.0 |
| Total | 509 (100.0%) | 32.0 |
Fertility by Age by Marriage Status in La Crosse
83.5% of women with births (509) in La Crosse are married. The highest percentage of unmarried women with births falls into 20 to 34 years age bracket with 18.6% of them unmarried at the time of birth, while the lowest percentage of unmarried women with births belong to 35 to 50 years age bracket with 13.2% of them unmarried.
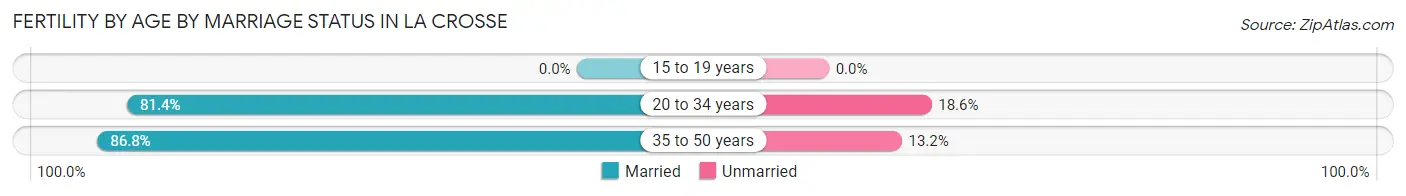
| Age Bracket | Married | Unmarried |
| 15 to 19 years | 0 (0.0%) | 0 (0.0%) |
| 20 to 34 years | 254 (81.4%) | 58 (18.6%) |
| 35 to 50 years | 171 (86.8%) | 26 (13.2%) |
| Total | 425 (83.5%) | 84 (16.5%) |
Fertility by Education in La Crosse
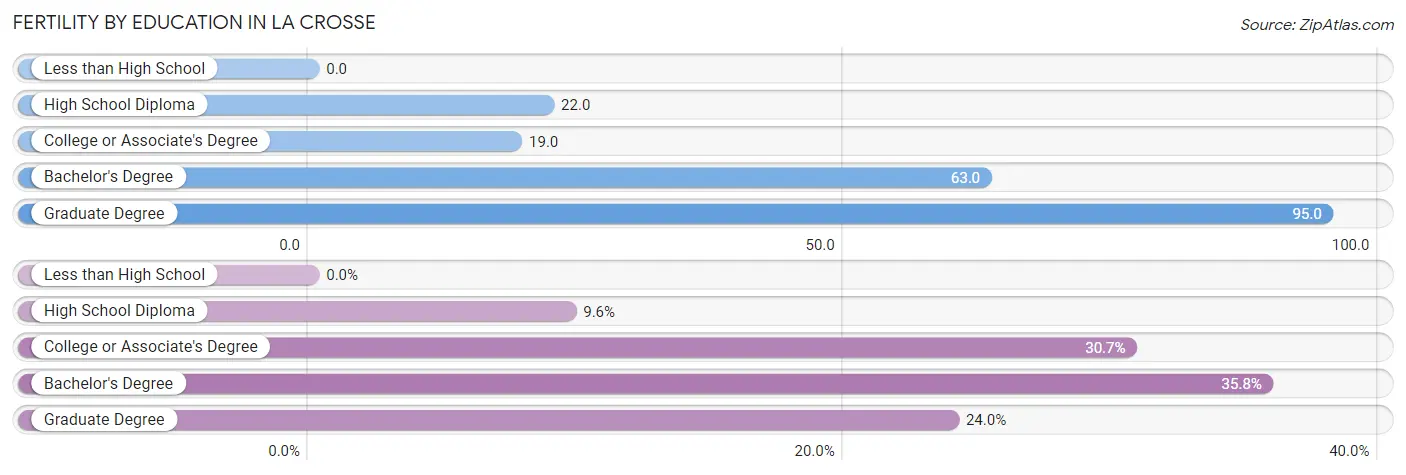
| Educational Attainment | Women with Births | Births / 1,000 Women |
| Less than High School | 0 (0.0%) | 0.0 |
| High School Diploma | 49 (9.6%) | 22.0 |
| College or Associate's Degree | 156 (30.6%) | 19.0 |
| Bachelor's Degree | 182 (35.8%) | 63.0 |
| Graduate Degree | 122 (24.0%) | 95.0 |
| Total | 509 (100.0%) | 32.0 |
Fertility by Education by Marriage Status in La Crosse
16.5% of women with births in La Crosse are unmarried. Women with the educational attainment of graduate degree are most likely to be married with 95.1% of them married at childbirth, while women with the educational attainment of college or associate's degree are least likely to be married with 28.8% of them unmarried at childbirth.
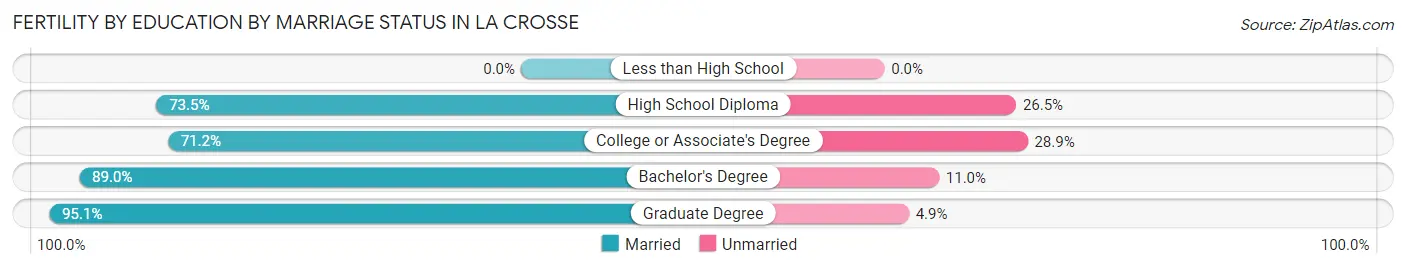
| Educational Attainment | Married | Unmarried |
| Less than High School | 0 (0.0%) | 0 (0.0%) |
| High School Diploma | 36 (73.5%) | 13 (26.5%) |
| College or Associate's Degree | 111 (71.2%) | 45 (28.8%) |
| Bachelor's Degree | 162 (89.0%) | 20 (11.0%) |
| Graduate Degree | 116 (95.1%) | 6 (4.9%) |
| Total | 425 (83.5%) | 84 (16.5%) |
Employment Characteristics in La Crosse
Employment by Class of Employer in La Crosse
Among the 27,447 employed individuals in La Crosse, private company employees (18,494 | 67.4%), not-for-profit organizations (4,011 | 14.6%), and state government employees (1,492 | 5.4%) make up the most common classes of employment.
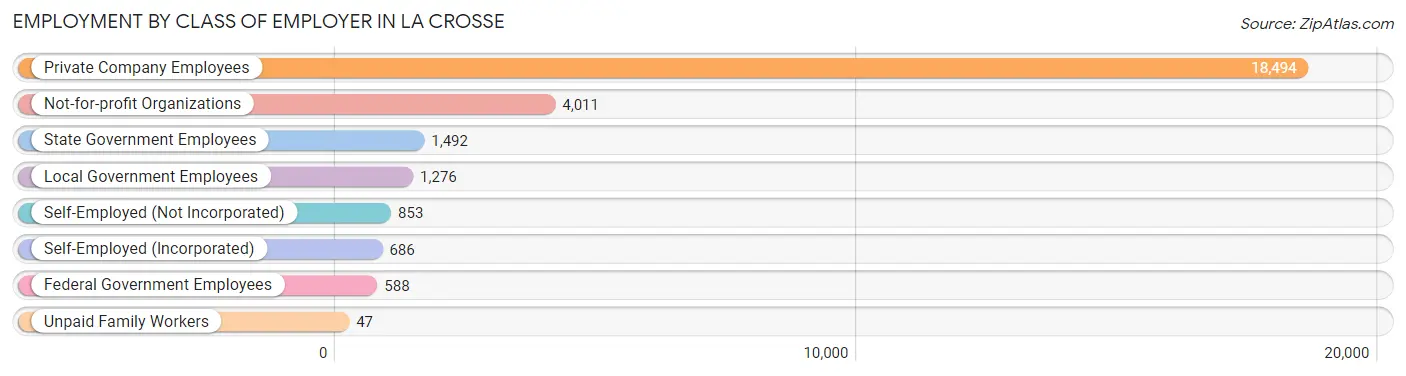
| Employer Class | # Employees | % Employees |
| Private Company Employees | 18,494 | 67.4% |
| Self-Employed (Incorporated) | 686 | 2.5% |
| Self-Employed (Not Incorporated) | 853 | 3.1% |
| Not-for-profit Organizations | 4,011 | 14.6% |
| Local Government Employees | 1,276 | 4.6% |
| State Government Employees | 1,492 | 5.4% |
| Federal Government Employees | 588 | 2.1% |
| Unpaid Family Workers | 47 | 0.2% |
| Total | 27,447 | 100.0% |
Employment Status by Age in La Crosse
According to the labor force statistics for La Crosse, out of the total population over 16 years of age (45,370), 64.2% or 29,128 individuals are in the labor force, with 3.5% or 1,019 of them unemployed. The age group with the highest labor force participation rate is 35 to 44 years, with 89.6% or 4,672 individuals in the labor force. Within the labor force, the 16 to 19 years age range has the highest percentage of unemployed individuals, with 10.8% or 264 of them being unemployed.
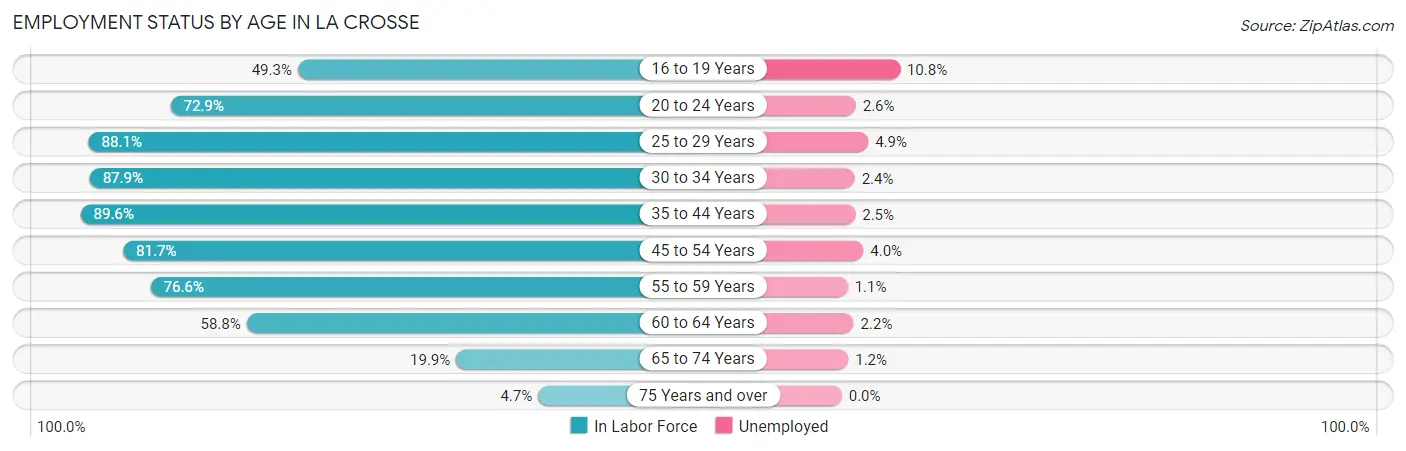
| Age Bracket | In Labor Force | Unemployed |
| 16 to 19 Years | 2,440 (49.3%) | 264 (10.8%) |
| 20 to 24 Years | 7,262 (72.9%) | 189 (2.6%) |
| 25 to 29 Years | 3,880 (88.1%) | 190 (4.9%) |
| 30 to 34 Years | 2,985 (87.9%) | 72 (2.4%) |
| 35 to 44 Years | 4,672 (89.6%) | 117 (2.5%) |
| 45 to 54 Years | 3,383 (81.7%) | 135 (4.0%) |
| 55 to 59 Years | 2,003 (76.6%) | 22 (1.1%) |
| 60 to 64 Years | 1,376 (58.8%) | 30 (2.2%) |
| 65 to 74 Years | 931 (19.9%) | 11 (1.2%) |
| 75 Years and over | 173 (4.7%) | 0 (0.0%) |
| Total | 29,128 (64.2%) | 1,019 (3.5%) |
Employment Status by Educational Attainment in La Crosse
According to labor force statistics for La Crosse, 82.8% of individuals (18,307) out of the total population between 25 and 64 years of age (22,110) are in the labor force, with 3.1% or 568 of them being unemployed. The group with the highest labor force participation rate are those with the educational attainment of bachelor's degree or higher, with 89.9% or 7,508 individuals in the labor force. Within the labor force, individuals with less than high school education have the highest percentage of unemployment, with 19.9% or 73 of them being unemployed.
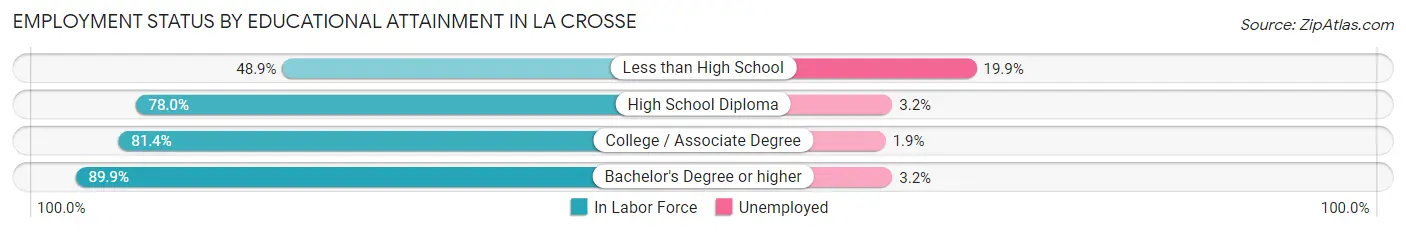
| Educational Attainment | In Labor Force | Unemployed |
| Less than High School | 367 (48.9%) | 149 (19.9%) |
| High School Diploma | 3,902 (78.0%) | 160 (3.2%) |
| College / Associate Degree | 6,517 (81.4%) | 152 (1.9%) |
| Bachelor's Degree or higher | 7,508 (89.9%) | 267 (3.2%) |
| Total | 18,307 (82.8%) | 685 (3.1%) |
Employment Occupations by Sex in La Crosse
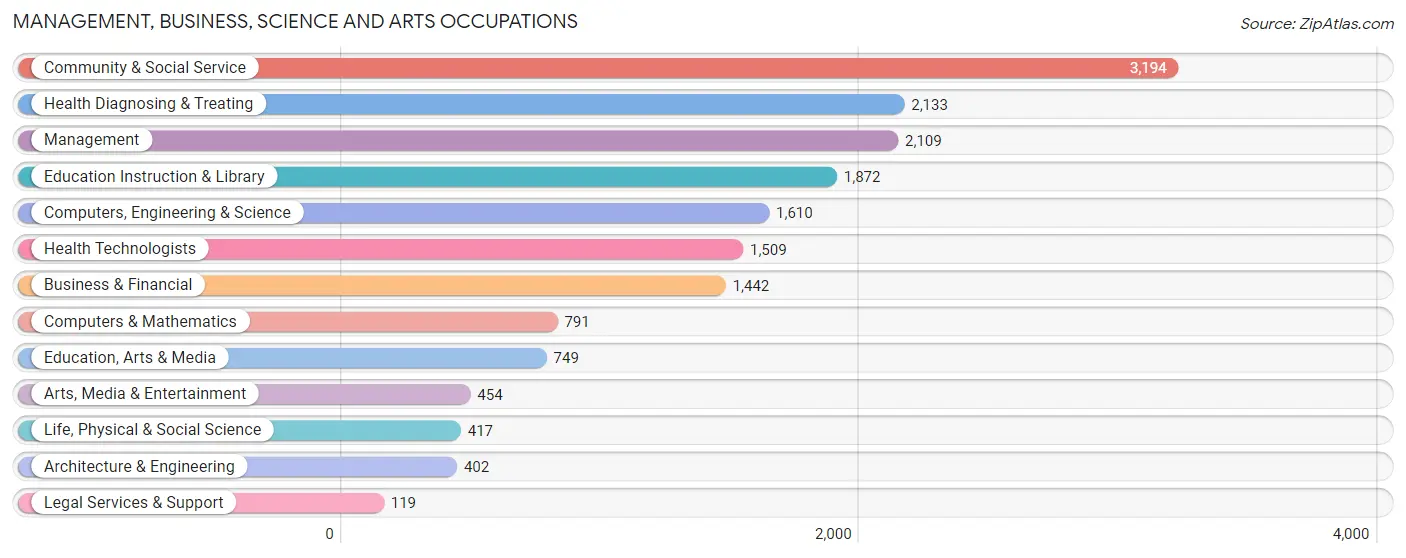
Management, Business, Science and Arts Occupations
The most common Management, Business, Science and Arts occupations in La Crosse are Community & Social Service (3,194 | 11.4%), Health Diagnosing & Treating (2,133 | 7.6%), Management (2,109 | 7.5%), Education Instruction & Library (1,872 | 6.7%), and Computers, Engineering & Science (1,610 | 5.8%).
Management, Business, Science and Arts Occupations by Sex
Within the Management, Business, Science and Arts occupations in La Crosse, the most male-oriented occupations are Architecture & Engineering (87.8%), Computers & Mathematics (78.4%), and Computers, Engineering & Science (76.0%), while the most female-oriented occupations are Education, Arts & Media (71.7%), Health Diagnosing & Treating (68.7%), and Arts, Media & Entertainment (68.1%).
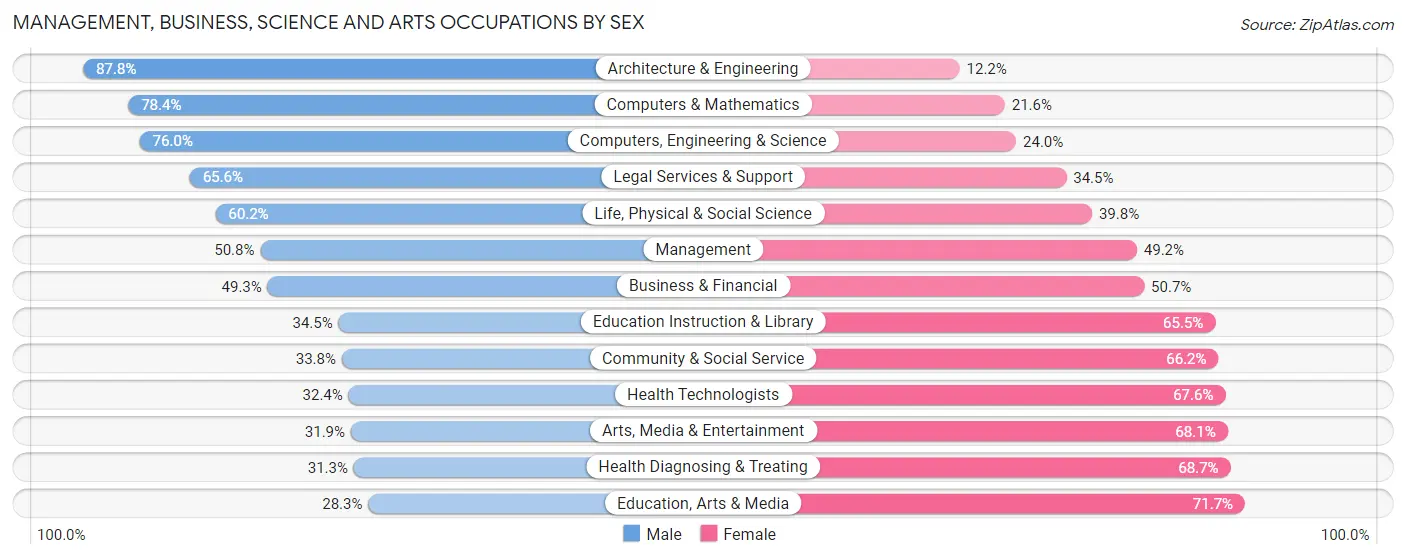
| Occupation | Male | Female |
| Management | 1,072 (50.8%) | 1,037 (49.2%) |
| Business & Financial | 711 (49.3%) | 731 (50.7%) |
| Computers, Engineering & Science | 1,224 (76.0%) | 386 (24.0%) |
| Computers & Mathematics | 620 (78.4%) | 171 (21.6%) |
| Architecture & Engineering | 353 (87.8%) | 49 (12.2%) |
| Life, Physical & Social Science | 251 (60.2%) | 166 (39.8%) |
| Community & Social Service | 1,081 (33.8%) | 2,113 (66.2%) |
| Education, Arts & Media | 212 (28.3%) | 537 (71.7%) |
| Legal Services & Support | 78 (65.5%) | 41 (34.4%) |
| Education Instruction & Library | 646 (34.5%) | 1,226 (65.5%) |
| Arts, Media & Entertainment | 145 (31.9%) | 309 (68.1%) |
| Health Diagnosing & Treating | 668 (31.3%) | 1,465 (68.7%) |
| Health Technologists | 489 (32.4%) | 1,020 (67.6%) |
| Total (Category) | 4,756 (45.4%) | 5,732 (54.6%) |
| Total (Overall) | 13,513 (48.3%) | 14,444 (51.7%) |
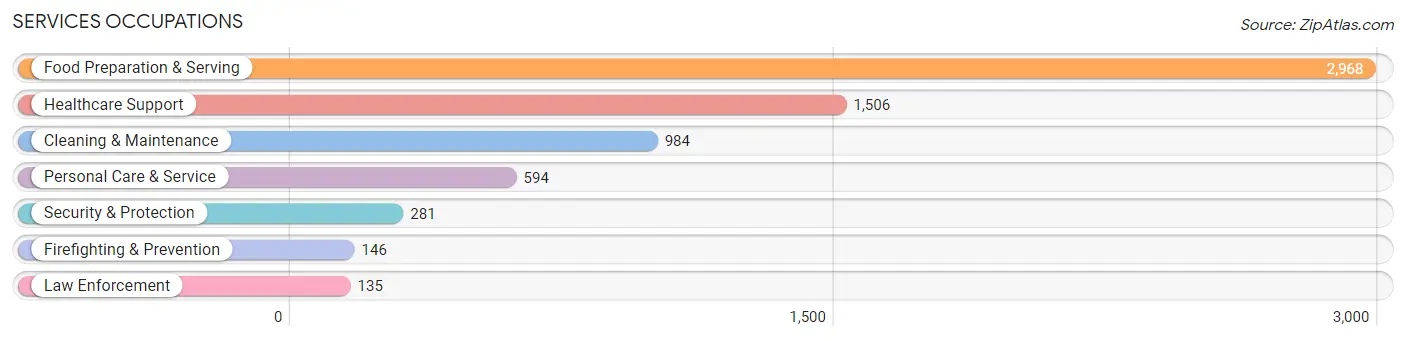
Services Occupations
The most common Services occupations in La Crosse are Food Preparation & Serving (2,968 | 10.6%), Healthcare Support (1,506 | 5.4%), Cleaning & Maintenance (984 | 3.5%), Personal Care & Service (594 | 2.1%), and Security & Protection (281 | 1.0%).
Services Occupations by Sex
Within the Services occupations in La Crosse, the most male-oriented occupations are Law Enforcement (74.8%), Cleaning & Maintenance (62.5%), and Security & Protection (52.0%), while the most female-oriented occupations are Healthcare Support (88.9%), Personal Care & Service (78.8%), and Firefighting & Prevention (69.2%).
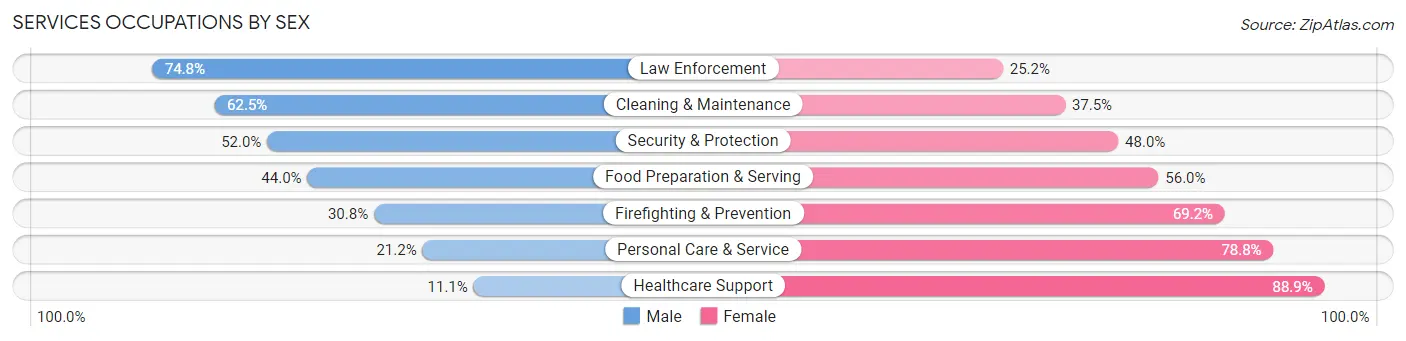
| Occupation | Male | Female |
| Healthcare Support | 167 (11.1%) | 1,339 (88.9%) |
| Security & Protection | 146 (52.0%) | 135 (48.0%) |
| Firefighting & Prevention | 45 (30.8%) | 101 (69.2%) |
| Law Enforcement | 101 (74.8%) | 34 (25.2%) |
| Food Preparation & Serving | 1,306 (44.0%) | 1,662 (56.0%) |
| Cleaning & Maintenance | 615 (62.5%) | 369 (37.5%) |
| Personal Care & Service | 126 (21.2%) | 468 (78.8%) |
| Total (Category) | 2,360 (37.3%) | 3,973 (62.7%) |
| Total (Overall) | 13,513 (48.3%) | 14,444 (51.7%) |
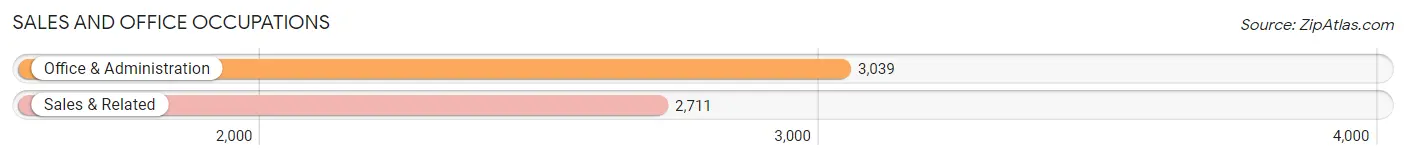
Sales and Office Occupations
The most common Sales and Office occupations in La Crosse are Office & Administration (3,039 | 10.9%), and Sales & Related (2,711 | 9.7%).
Sales and Office Occupations by Sex
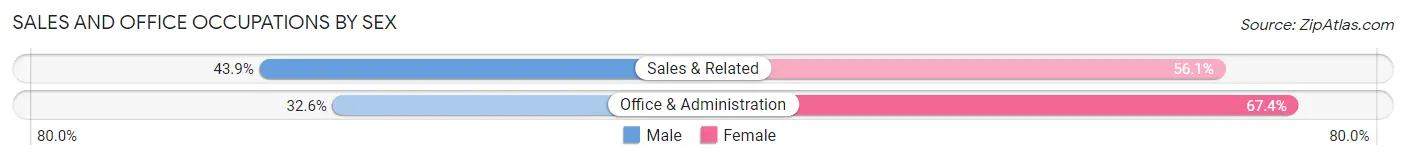
| Occupation | Male | Female |
| Sales & Related | 1,189 (43.9%) | 1,522 (56.1%) |
| Office & Administration | 991 (32.6%) | 2,048 (67.4%) |
| Total (Category) | 2,180 (37.9%) | 3,570 (62.1%) |
| Total (Overall) | 13,513 (48.3%) | 14,444 (51.7%) |
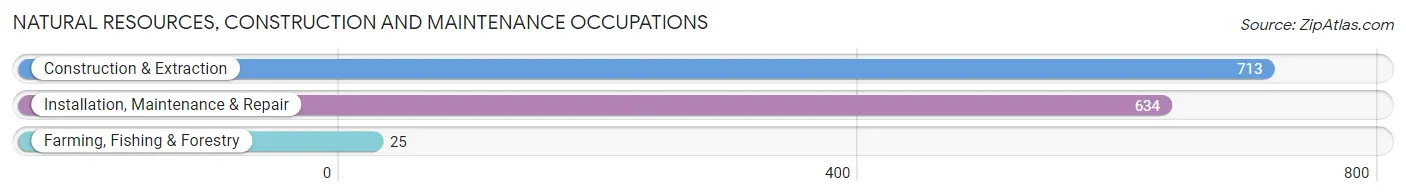
Natural Resources, Construction and Maintenance Occupations
The most common Natural Resources, Construction and Maintenance occupations in La Crosse are Construction & Extraction (713 | 2.5%), Installation, Maintenance & Repair (634 | 2.3%), and Farming, Fishing & Forestry (25 | 0.1%).
Natural Resources, Construction and Maintenance Occupations by Sex
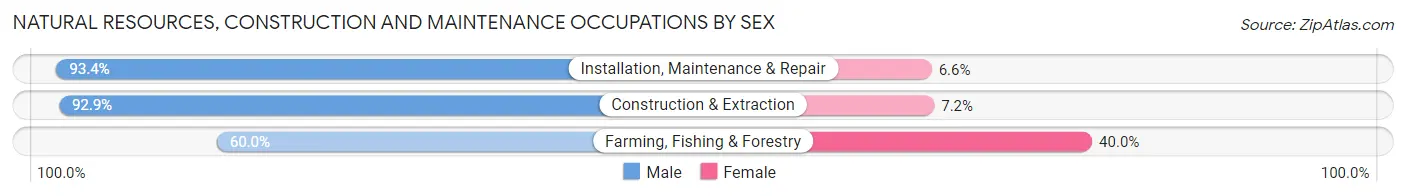
| Occupation | Male | Female |
| Farming, Fishing & Forestry | 15 (60.0%) | 10 (40.0%) |
| Construction & Extraction | 662 (92.8%) | 51 (7.1%) |
| Installation, Maintenance & Repair | 592 (93.4%) | 42 (6.6%) |
| Total (Category) | 1,269 (92.5%) | 103 (7.5%) |
| Total (Overall) | 13,513 (48.3%) | 14,444 (51.7%) |
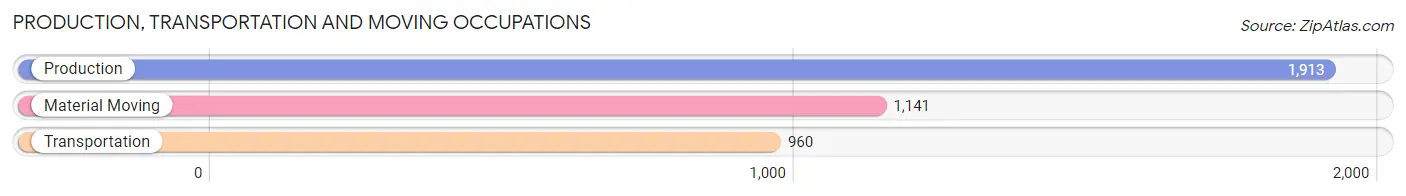
Production, Transportation and Moving Occupations
The most common Production, Transportation and Moving occupations in La Crosse are Production (1,913 | 6.8%), Material Moving (1,141 | 4.1%), and Transportation (960 | 3.4%).
Production, Transportation and Moving Occupations by Sex
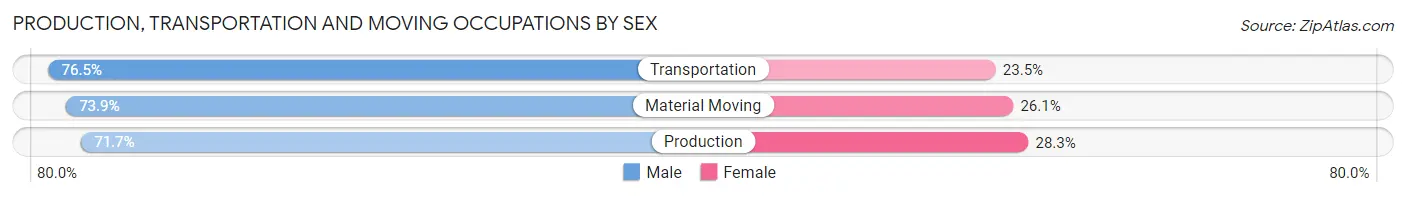
| Occupation | Male | Female |
| Production | 1,371 (71.7%) | 542 (28.3%) |
| Transportation | 734 (76.5%) | 226 (23.5%) |
| Material Moving | 843 (73.9%) | 298 (26.1%) |
| Total (Category) | 2,948 (73.4%) | 1,066 (26.6%) |
| Total (Overall) | 13,513 (48.3%) | 14,444 (51.7%) |
Employment Industries by Sex in La Crosse
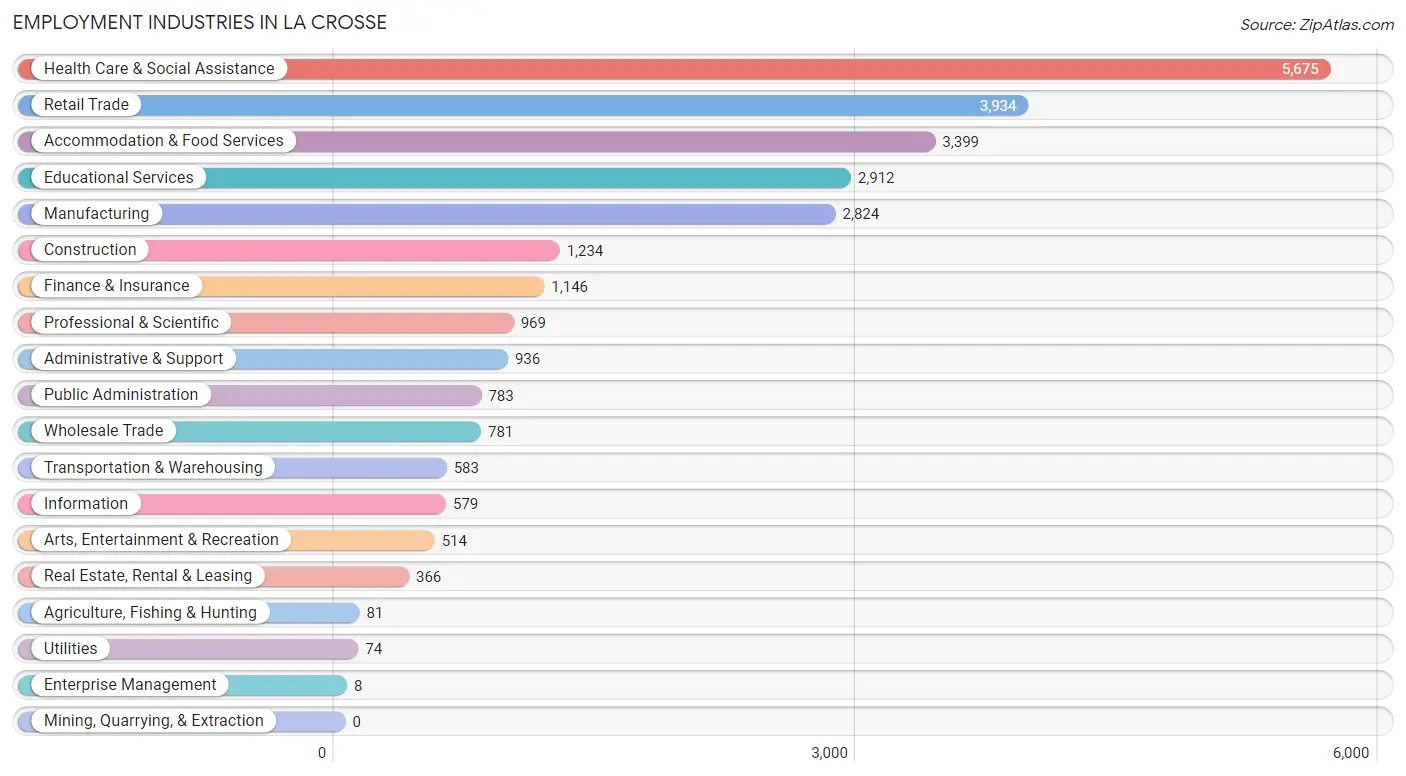
Employment Industries in La Crosse
The major employment industries in La Crosse include Health Care & Social Assistance (5,675 | 20.3%), Retail Trade (3,934 | 14.1%), Accommodation & Food Services (3,399 | 12.2%), Educational Services (2,912 | 10.4%), and Manufacturing (2,824 | 10.1%).
Employment Industries by Sex in La Crosse
The La Crosse industries that see more men than women are Construction (87.2%), Manufacturing (74.2%), and Utilities (73.0%), whereas the industries that tend to have a higher number of women are Enterprise Management (100.0%), Health Care & Social Assistance (75.1%), and Arts, Entertainment & Recreation (67.5%).
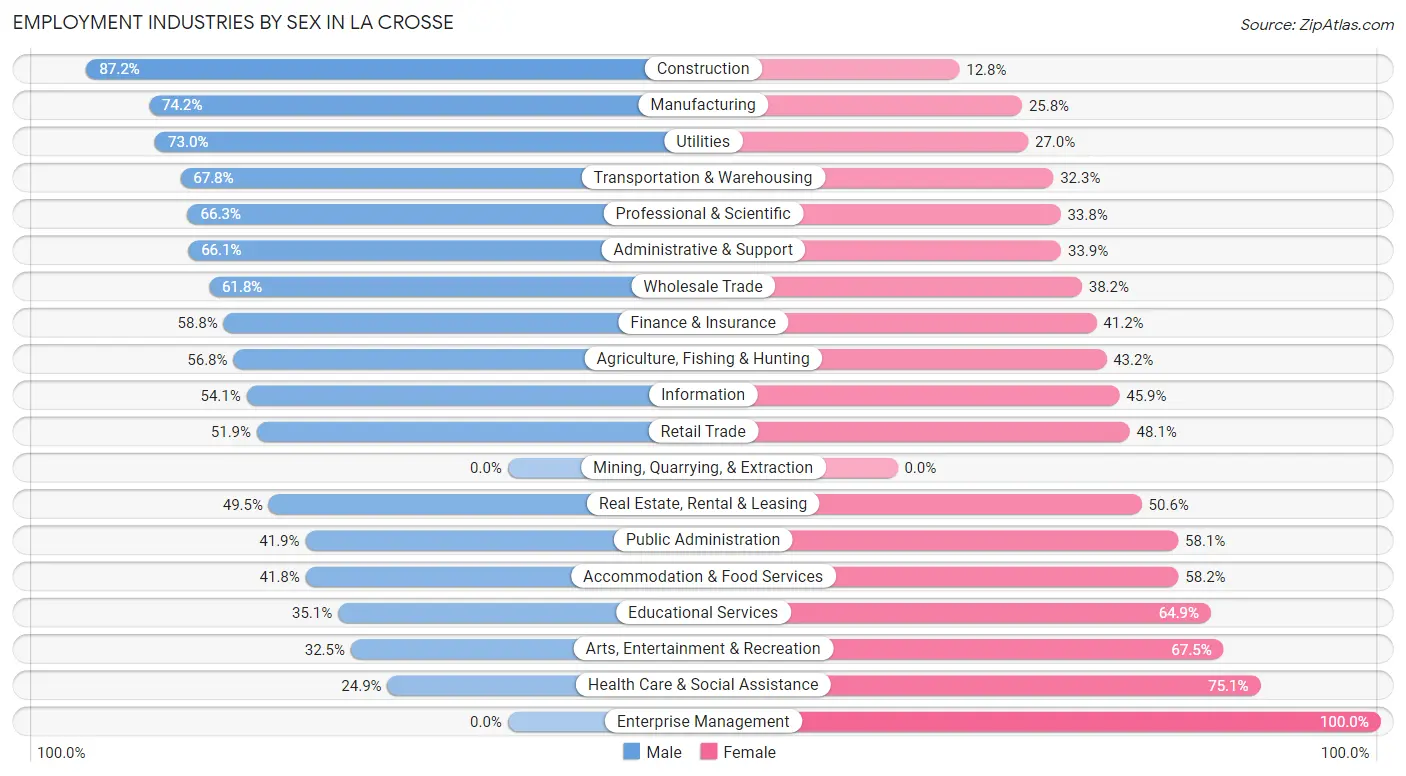
| Industry | Male | Female |
| Agriculture, Fishing & Hunting | 46 (56.8%) | 35 (43.2%) |
| Mining, Quarrying, & Extraction | 0 (0.0%) | 0 (0.0%) |
| Construction | 1,076 (87.2%) | 158 (12.8%) |
| Manufacturing | 2,096 (74.2%) | 728 (25.8%) |
| Wholesale Trade | 483 (61.8%) | 298 (38.2%) |
| Retail Trade | 2,043 (51.9%) | 1,891 (48.1%) |
| Transportation & Warehousing | 395 (67.7%) | 188 (32.3%) |
| Utilities | 54 (73.0%) | 20 (27.0%) |
| Information | 313 (54.1%) | 266 (45.9%) |
| Finance & Insurance | 674 (58.8%) | 472 (41.2%) |
| Real Estate, Rental & Leasing | 181 (49.4%) | 185 (50.5%) |
| Professional & Scientific | 642 (66.2%) | 327 (33.8%) |
| Enterprise Management | 0 (0.0%) | 8 (100.0%) |
| Administrative & Support | 619 (66.1%) | 317 (33.9%) |
| Educational Services | 1,023 (35.1%) | 1,889 (64.9%) |
| Health Care & Social Assistance | 1,413 (24.9%) | 4,262 (75.1%) |
| Arts, Entertainment & Recreation | 167 (32.5%) | 347 (67.5%) |
| Accommodation & Food Services | 1,422 (41.8%) | 1,977 (58.2%) |
| Public Administration | 328 (41.9%) | 455 (58.1%) |
| Total | 13,513 (48.3%) | 14,444 (51.7%) |
Education in La Crosse
School Enrollment in La Crosse
The most common levels of schooling among the 17,707 students in La Crosse are college / undergraduate (10,742 | 60.7%), high school (1,835 | 10.4%), and middle school (1,718 | 9.7%).
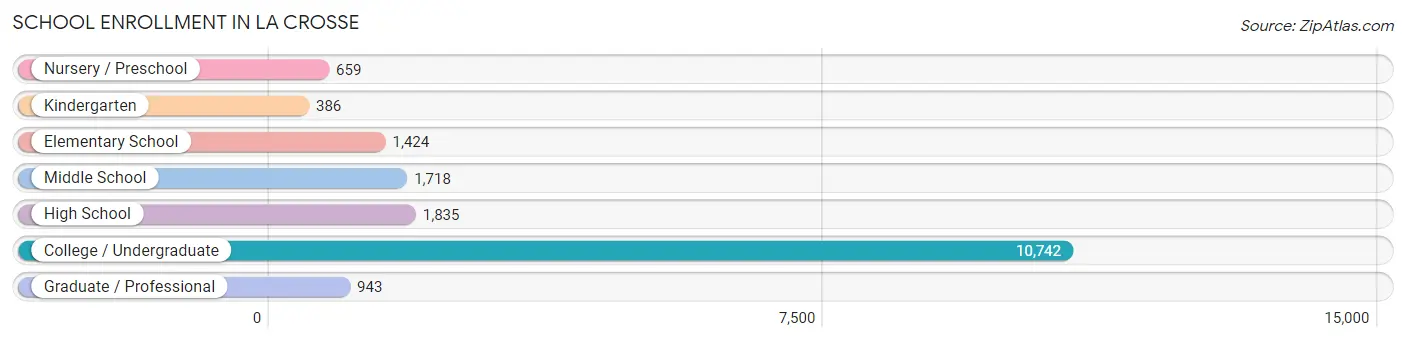
| School Level | # Students | % Students |
| Nursery / Preschool | 659 | 3.7% |
| Kindergarten | 386 | 2.2% |
| Elementary School | 1,424 | 8.0% |
| Middle School | 1,718 | 9.7% |
| High School | 1,835 | 10.4% |
| College / Undergraduate | 10,742 | 60.7% |
| Graduate / Professional | 943 | 5.3% |
| Total | 17,707 | 100.0% |
School Enrollment by Age by Funding Source in La Crosse
Out of a total of 17,707 students who are enrolled in schools in La Crosse, 2,036 (11.5%) attend a private institution, while the remaining 15,671 (88.5%) are enrolled in public schools. The age group of 25 to 34 year olds has the highest likelihood of being enrolled in private schools, with 176 (18.7% in the age bracket) enrolled. Conversely, the age group of 18 to 19 year olds has the lowest likelihood of being enrolled in a private school, with 3,434 (92.1% in the age bracket) attending a public institution.
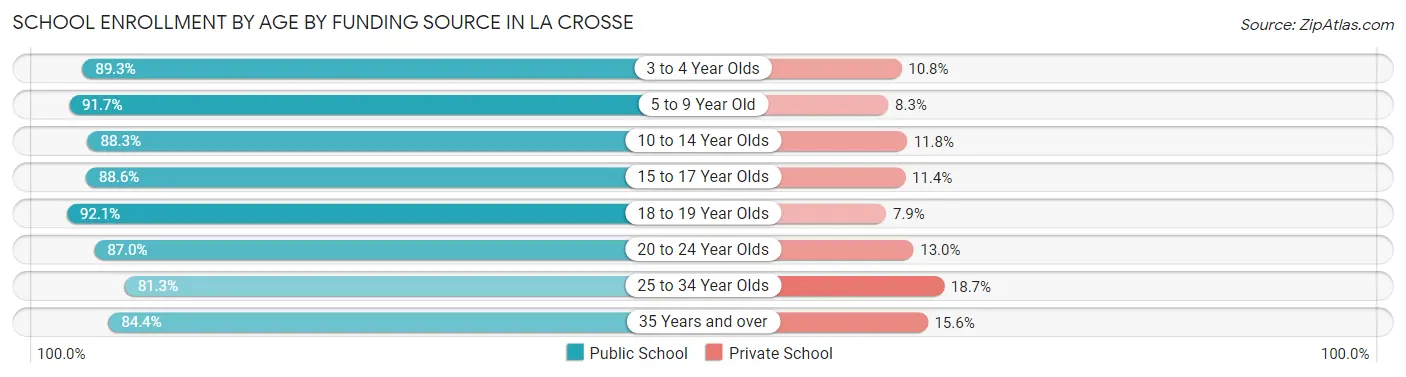
| Age Bracket | Public School | Private School |
| 3 to 4 Year Olds | 465 (89.2%) | 56 (10.7%) |
| 5 to 9 Year Old | 1,581 (91.7%) | 143 (8.3%) |
| 10 to 14 Year Olds | 1,976 (88.2%) | 263 (11.7%) |
| 15 to 17 Year Olds | 1,124 (88.6%) | 145 (11.4%) |
| 18 to 19 Year Olds | 3,434 (92.1%) | 294 (7.9%) |
| 20 to 24 Year Olds | 5,954 (87.0%) | 887 (13.0%) |
| 25 to 34 Year Olds | 767 (81.3%) | 176 (18.7%) |
| 35 Years and over | 373 (84.4%) | 69 (15.6%) |
| Total | 15,671 (88.5%) | 2,036 (11.5%) |
Educational Attainment by Field of Study in La Crosse
Business (1,905 | 15.9%), education (1,593 | 13.3%), science & technology (1,335 | 11.1%), bio, nature & agricultural (1,219 | 10.2%), and social sciences (1,016 | 8.5%) are the most common fields of study among 12,000 individuals in La Crosse who have obtained a bachelor's degree or higher.
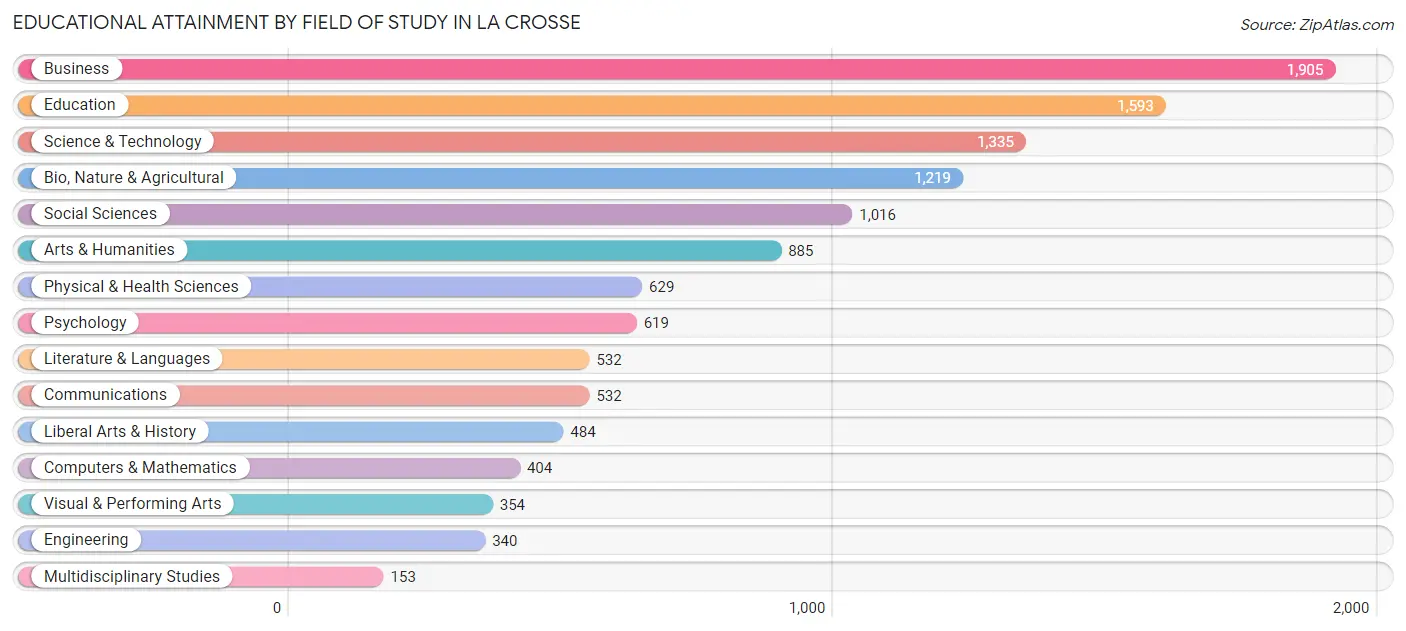
| Field of Study | # Graduates | % Graduates |
| Computers & Mathematics | 404 | 3.4% |
| Bio, Nature & Agricultural | 1,219 | 10.2% |
| Physical & Health Sciences | 629 | 5.2% |
| Psychology | 619 | 5.2% |
| Social Sciences | 1,016 | 8.5% |
| Engineering | 340 | 2.8% |
| Multidisciplinary Studies | 153 | 1.3% |
| Science & Technology | 1,335 | 11.1% |
| Business | 1,905 | 15.9% |
| Education | 1,593 | 13.3% |
| Literature & Languages | 532 | 4.4% |
| Liberal Arts & History | 484 | 4.0% |
| Visual & Performing Arts | 354 | 2.9% |
| Communications | 532 | 4.4% |
| Arts & Humanities | 885 | 7.4% |
| Total | 12,000 | 100.0% |
Transportation & Commute in La Crosse
Vehicle Availability by Sex in La Crosse
The most prevalent vehicle ownership categories in La Crosse are males with 2 vehicles (5,763, accounting for 45.1%) and females with 2 vehicles (5,841, making up 43.6%).
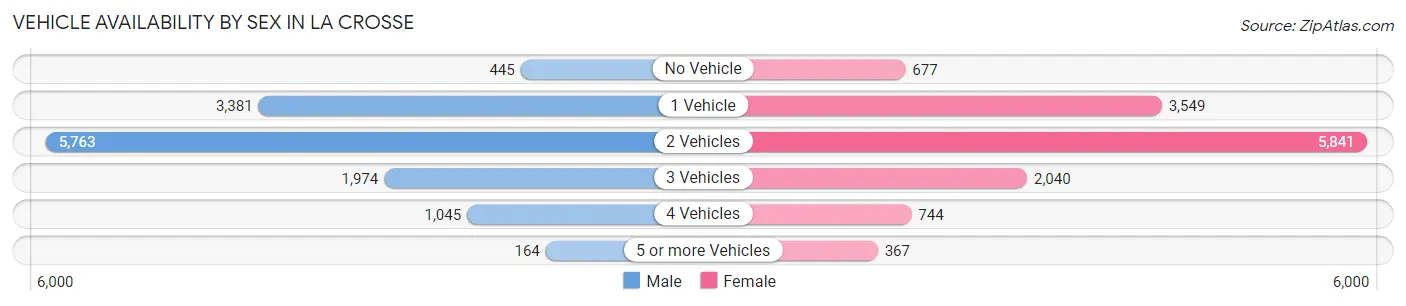
| Vehicles Available | Male | Female |
| No Vehicle | 445 (3.5%) | 677 (5.1%) |
| 1 Vehicle | 3,381 (26.5%) | 3,549 (26.9%) |
| 2 Vehicles | 5,763 (45.1%) | 5,841 (44.2%) |
| 3 Vehicles | 1,974 (15.5%) | 2,040 (15.4%) |
| 4 Vehicles | 1,045 (8.2%) | 744 (5.6%) |
| 5 or more Vehicles | 164 (1.3%) | 367 (2.8%) |
| Total | 12,772 (100.0%) | 13,218 (100.0%) |
Commute Time in La Crosse
The most frequently occuring commute durations in La Crosse are 10 to 14 minutes (6,321 commuters, 25.0%), 5 to 9 minutes (5,801 commuters, 22.9%), and 15 to 19 minutes (4,780 commuters, 18.9%).
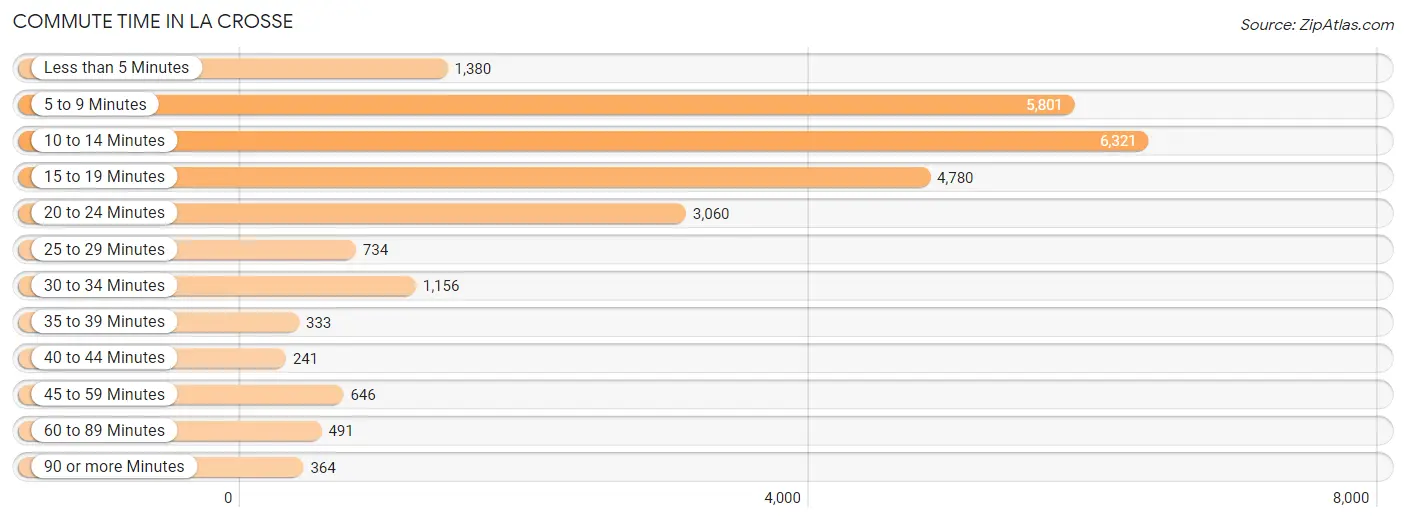
| Commute Time | # Commuters | % Commuters |
| Less than 5 Minutes | 1,380 | 5.4% |
| 5 to 9 Minutes | 5,801 | 22.9% |
| 10 to 14 Minutes | 6,321 | 25.0% |
| 15 to 19 Minutes | 4,780 | 18.9% |
| 20 to 24 Minutes | 3,060 | 12.1% |
| 25 to 29 Minutes | 734 | 2.9% |
| 30 to 34 Minutes | 1,156 | 4.6% |
| 35 to 39 Minutes | 333 | 1.3% |
| 40 to 44 Minutes | 241 | 0.9% |
| 45 to 59 Minutes | 646 | 2.5% |
| 60 to 89 Minutes | 491 | 1.9% |
| 90 or more Minutes | 364 | 1.4% |
Commute Time by Sex in La Crosse
The most common commute times in La Crosse are 10 to 14 minutes (3,230 commuters, 25.7%) for males and 5 to 9 minutes (3,204 commuters, 25.2%) for females.
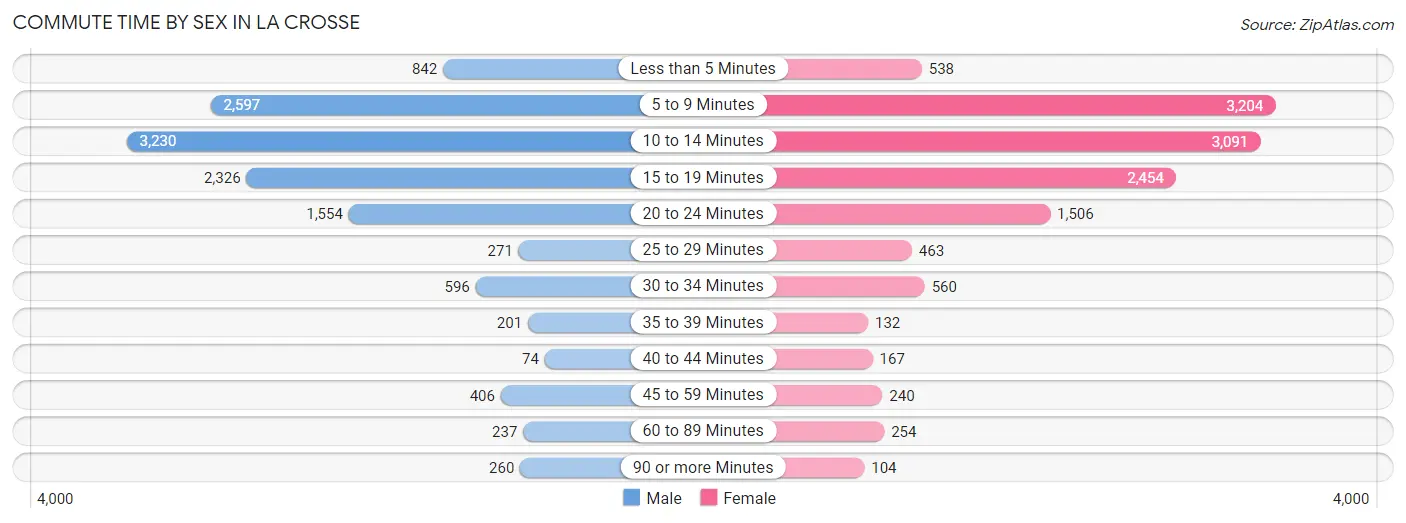
| Commute Time | Male | Female |
| Less than 5 Minutes | 842 (6.7%) | 538 (4.2%) |
| 5 to 9 Minutes | 2,597 (20.6%) | 3,204 (25.2%) |
| 10 to 14 Minutes | 3,230 (25.7%) | 3,091 (24.3%) |
| 15 to 19 Minutes | 2,326 (18.5%) | 2,454 (19.3%) |
| 20 to 24 Minutes | 1,554 (12.3%) | 1,506 (11.8%) |
| 25 to 29 Minutes | 271 (2.1%) | 463 (3.6%) |
| 30 to 34 Minutes | 596 (4.7%) | 560 (4.4%) |
| 35 to 39 Minutes | 201 (1.6%) | 132 (1.0%) |
| 40 to 44 Minutes | 74 (0.6%) | 167 (1.3%) |
| 45 to 59 Minutes | 406 (3.2%) | 240 (1.9%) |
| 60 to 89 Minutes | 237 (1.9%) | 254 (2.0%) |
| 90 or more Minutes | 260 (2.1%) | 104 (0.8%) |
Time of Departure to Work by Sex in La Crosse
The most frequent times of departure to work in La Crosse are 7:30 AM to 7:59 AM (1,944, 15.4%) for males and 7:30 AM to 7:59 AM (2,156, 17.0%) for females.
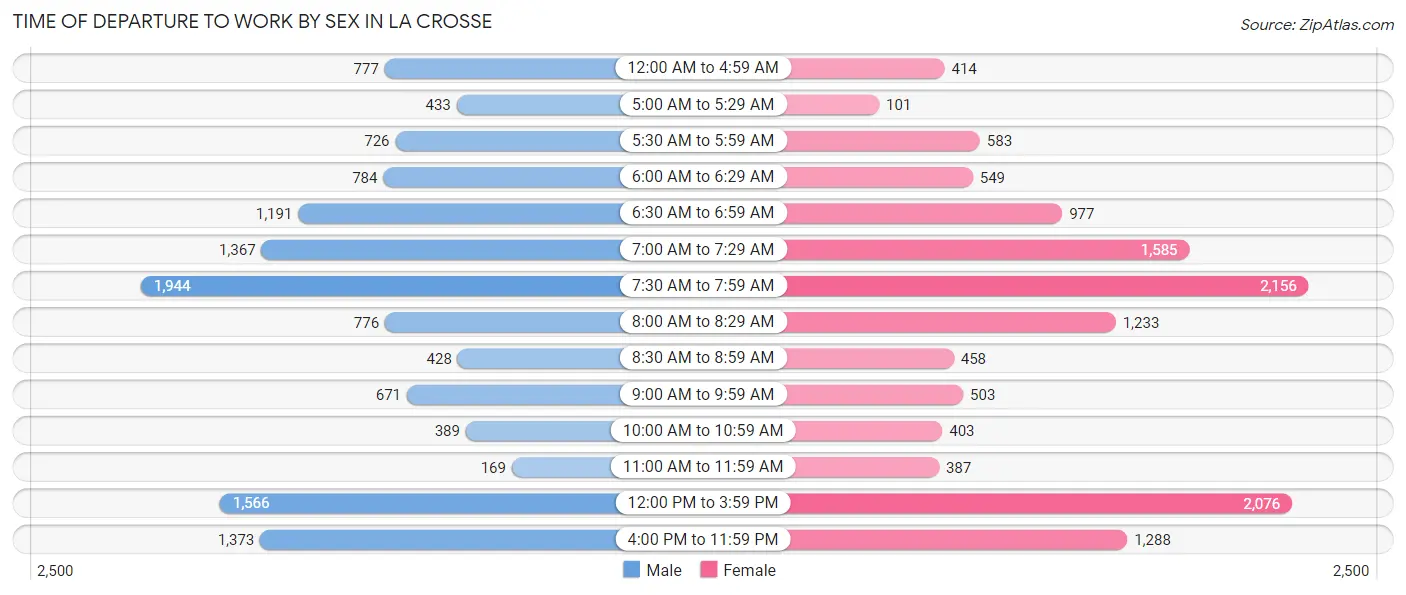
| Time of Departure | Male | Female |
| 12:00 AM to 4:59 AM | 777 (6.2%) | 414 (3.3%) |
| 5:00 AM to 5:29 AM | 433 (3.4%) | 101 (0.8%) |
| 5:30 AM to 5:59 AM | 726 (5.8%) | 583 (4.6%) |
| 6:00 AM to 6:29 AM | 784 (6.2%) | 549 (4.3%) |
| 6:30 AM to 6:59 AM | 1,191 (9.5%) | 977 (7.7%) |
| 7:00 AM to 7:29 AM | 1,367 (10.8%) | 1,585 (12.5%) |
| 7:30 AM to 7:59 AM | 1,944 (15.4%) | 2,156 (17.0%) |
| 8:00 AM to 8:29 AM | 776 (6.2%) | 1,233 (9.7%) |
| 8:30 AM to 8:59 AM | 428 (3.4%) | 458 (3.6%) |
| 9:00 AM to 9:59 AM | 671 (5.3%) | 503 (4.0%) |
| 10:00 AM to 10:59 AM | 389 (3.1%) | 403 (3.2%) |
| 11:00 AM to 11:59 AM | 169 (1.3%) | 387 (3.0%) |
| 12:00 PM to 3:59 PM | 1,566 (12.4%) | 2,076 (16.3%) |
| 4:00 PM to 11:59 PM | 1,373 (10.9%) | 1,288 (10.1%) |
| Total | 12,594 (100.0%) | 12,713 (100.0%) |
Housing Occupancy in La Crosse
Occupancy by Ownership in La Crosse
Of the total 22,662 dwellings in La Crosse, owner-occupied units account for 10,491 (46.3%), while renter-occupied units make up 12,171 (53.7%).
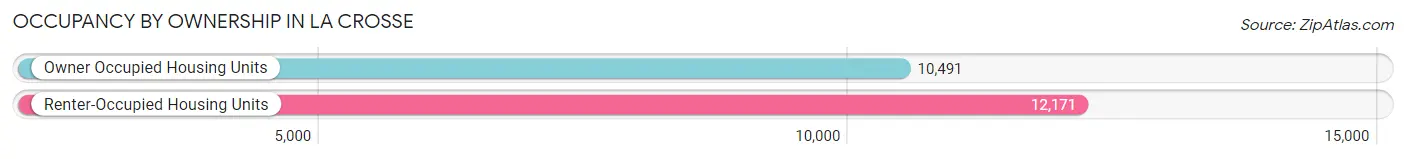
| Occupancy | # Housing Units | % Housing Units |
| Owner Occupied Housing Units | 10,491 | 46.3% |
| Renter-Occupied Housing Units | 12,171 | 53.7% |
| Total Occupied Housing Units | 22,662 | 100.0% |
Occupancy by Household Size in La Crosse
| Household Size | # Housing Units | % Housing Units |
| 1-Person Household | 9,255 | 40.8% |
| 2-Person Household | 7,204 | 31.8% |
| 3-Person Household | 3,165 | 14.0% |
| 4+ Person Household | 3,038 | 13.4% |
| Total Housing Units | 22,662 | 100.0% |
Occupancy by Ownership by Household Size in La Crosse
| Household Size | Owner-occupied | Renter-occupied |
| 1-Person Household | 3,284 (35.5%) | 5,971 (64.5%) |
| 2-Person Household | 3,896 (54.1%) | 3,308 (45.9%) |
| 3-Person Household | 1,595 (50.4%) | 1,570 (49.6%) |
| 4+ Person Household | 1,716 (56.5%) | 1,322 (43.5%) |
| Total Housing Units | 10,491 (46.3%) | 12,171 (53.7%) |
Occupancy by Educational Attainment in La Crosse
| Household Size | Owner-occupied | Renter-occupied |
| Less than High School | 236 (25.5%) | 690 (74.5%) |
| High School Diploma | 2,370 (47.1%) | 2,660 (52.9%) |
| College/Associate Degree | 3,597 (39.2%) | 5,586 (60.8%) |
| Bachelor's Degree or higher | 4,288 (57.0%) | 3,235 (43.0%) |
Occupancy by Age of Householder in La Crosse
| Age Bracket | # Households | % Households |
| Under 35 Years | 8,075 | 35.6% |
| 35 to 44 Years | 3,167 | 14.0% |
| 45 to 54 Years | 2,534 | 11.2% |
| 55 to 64 Years | 3,321 | 14.6% |
| 65 to 74 Years | 3,027 | 13.4% |
| 75 to 84 Years | 1,458 | 6.4% |
| 85 Years and Over | 1,080 | 4.8% |
| Total | 22,662 | 100.0% |
Housing Finances in La Crosse
Median Income by Occupancy in La Crosse
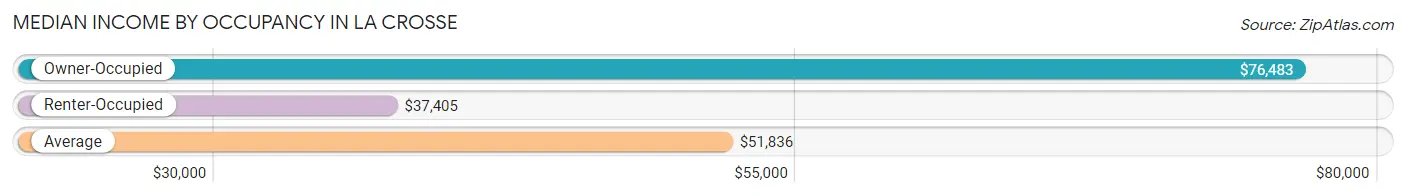
| Occupancy Type | # Households | Median Income |
| Owner-Occupied | 10,491 (46.3%) | $76,483 |
| Renter-Occupied | 12,171 (53.7%) | $37,405 |
| Average | 22,662 (100.0%) | $51,836 |
Occupancy by Householder Income Bracket in La Crosse
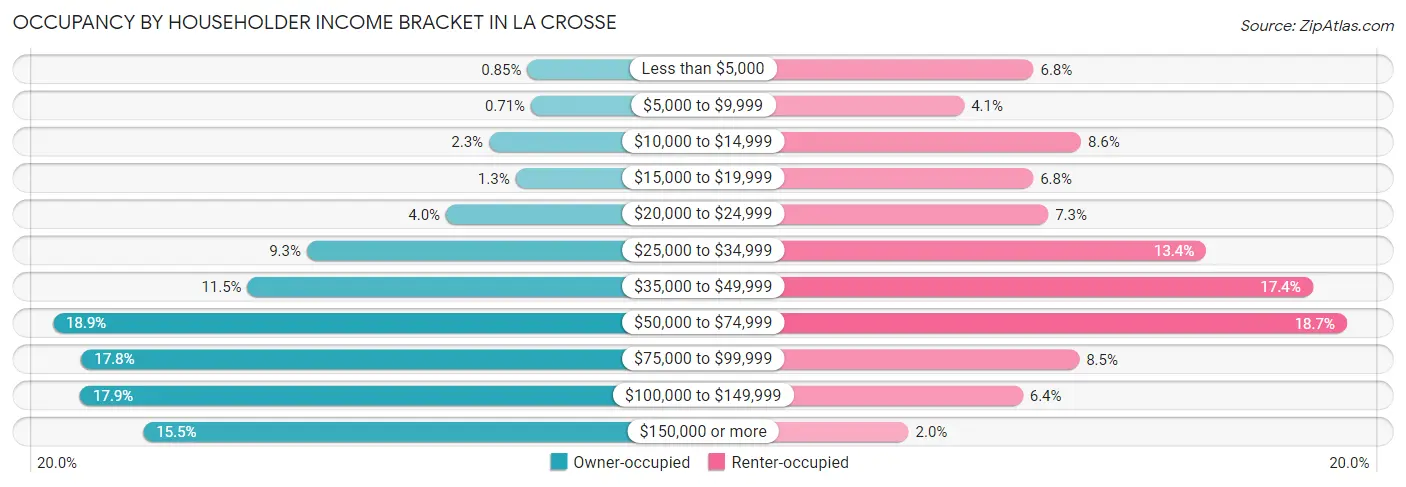
| Income Bracket | Owner-occupied | Renter-occupied |
| Less than $5,000 | 89 (0.9%) | 825 (6.8%) |
| $5,000 to $9,999 | 75 (0.7%) | 504 (4.1%) |
| $10,000 to $14,999 | 242 (2.3%) | 1,046 (8.6%) |
| $15,000 to $19,999 | 136 (1.3%) | 824 (6.8%) |
| $20,000 to $24,999 | 414 (4.0%) | 893 (7.3%) |
| $25,000 to $34,999 | 970 (9.2%) | 1,625 (13.4%) |
| $35,000 to $49,999 | 1,207 (11.5%) | 2,119 (17.4%) |
| $50,000 to $74,999 | 1,985 (18.9%) | 2,277 (18.7%) |
| $75,000 to $99,999 | 1,872 (17.8%) | 1,037 (8.5%) |
| $100,000 to $149,999 | 1,877 (17.9%) | 775 (6.4%) |
| $150,000 or more | 1,624 (15.5%) | 246 (2.0%) |
| Total | 10,491 (100.0%) | 12,171 (100.0%) |
Monthly Housing Cost Tiers in La Crosse
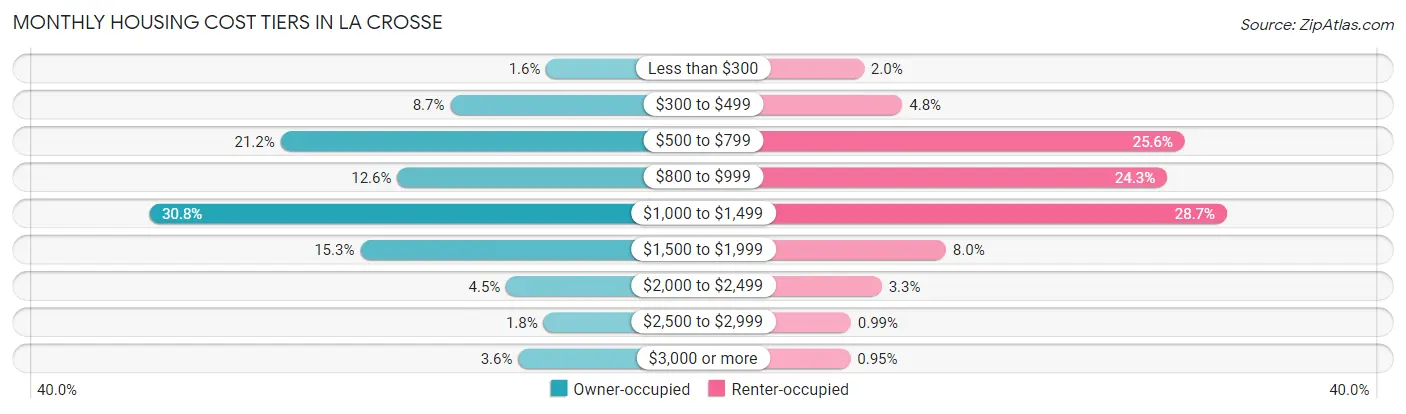
| Monthly Cost | Owner-occupied | Renter-occupied |
| Less than $300 | 166 (1.6%) | 237 (1.9%) |
| $300 to $499 | 907 (8.6%) | 582 (4.8%) |
| $500 to $799 | 2,219 (21.1%) | 3,113 (25.6%) |
| $800 to $999 | 1,317 (12.6%) | 2,955 (24.3%) |
| $1,000 to $1,499 | 3,235 (30.8%) | 3,491 (28.7%) |
| $1,500 to $1,999 | 1,603 (15.3%) | 973 (8.0%) |
| $2,000 to $2,499 | 475 (4.5%) | 397 (3.3%) |
| $2,500 to $2,999 | 187 (1.8%) | 120 (1.0%) |
| $3,000 or more | 382 (3.6%) | 116 (0.9%) |
| Total | 10,491 (100.0%) | 12,171 (100.0%) |
Physical Housing Characteristics in La Crosse
Housing Structures in La Crosse
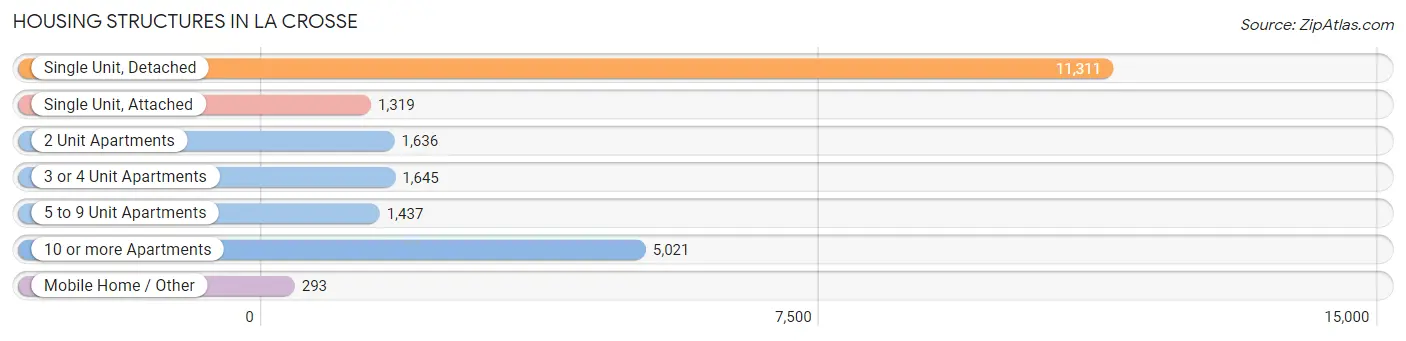
| Structure Type | # Housing Units | % Housing Units |
| Single Unit, Detached | 11,311 | 49.9% |
| Single Unit, Attached | 1,319 | 5.8% |
| 2 Unit Apartments | 1,636 | 7.2% |
| 3 or 4 Unit Apartments | 1,645 | 7.3% |
| 5 to 9 Unit Apartments | 1,437 | 6.3% |
| 10 or more Apartments | 5,021 | 22.2% |
| Mobile Home / Other | 293 | 1.3% |
| Total | 22,662 | 100.0% |
Housing Structures by Occupancy in La Crosse
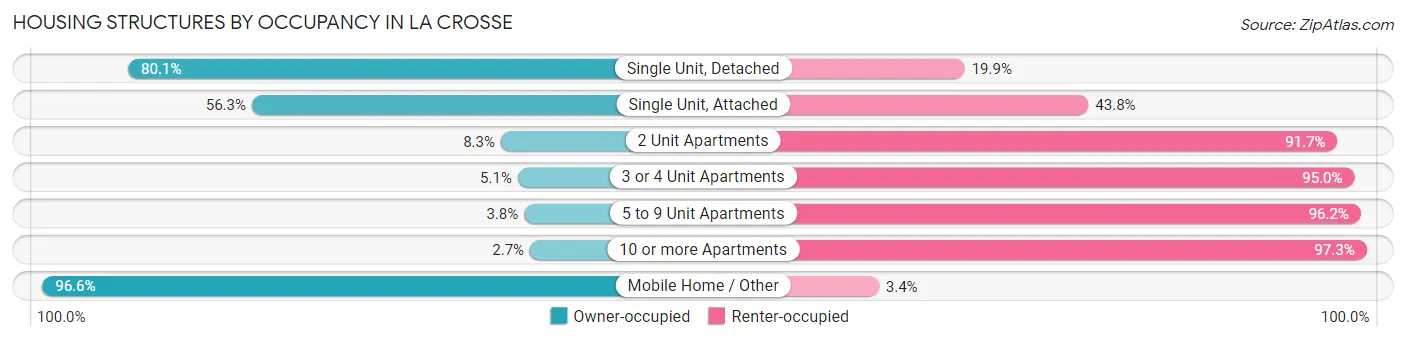
| Structure Type | Owner-occupied | Renter-occupied |
| Single Unit, Detached | 9,056 (80.1%) | 2,255 (19.9%) |
| Single Unit, Attached | 742 (56.2%) | 577 (43.8%) |
| 2 Unit Apartments | 136 (8.3%) | 1,500 (91.7%) |
| 3 or 4 Unit Apartments | 83 (5.1%) | 1,562 (95.0%) |
| 5 to 9 Unit Apartments | 55 (3.8%) | 1,382 (96.2%) |
| 10 or more Apartments | 136 (2.7%) | 4,885 (97.3%) |
| Mobile Home / Other | 283 (96.6%) | 10 (3.4%) |
| Total | 10,491 (46.3%) | 12,171 (53.7%) |
Housing Structures by Number of Rooms in La Crosse
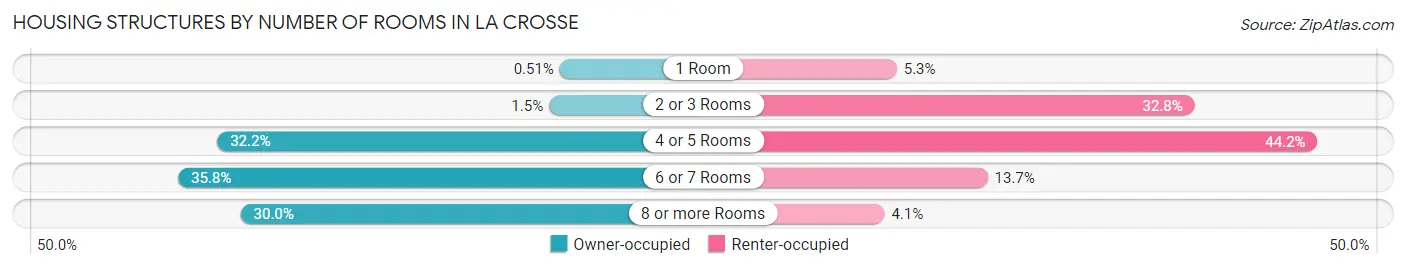
| Number of Rooms | Owner-occupied | Renter-occupied |
| 1 Room | 53 (0.5%) | 640 (5.3%) |
| 2 or 3 Rooms | 157 (1.5%) | 3,992 (32.8%) |
| 4 or 5 Rooms | 3,376 (32.2%) | 5,375 (44.2%) |
| 6 or 7 Rooms | 3,756 (35.8%) | 1,663 (13.7%) |
| 8 or more Rooms | 3,149 (30.0%) | 501 (4.1%) |
| Total | 10,491 (100.0%) | 12,171 (100.0%) |
Housing Structure by Heating Type in La Crosse
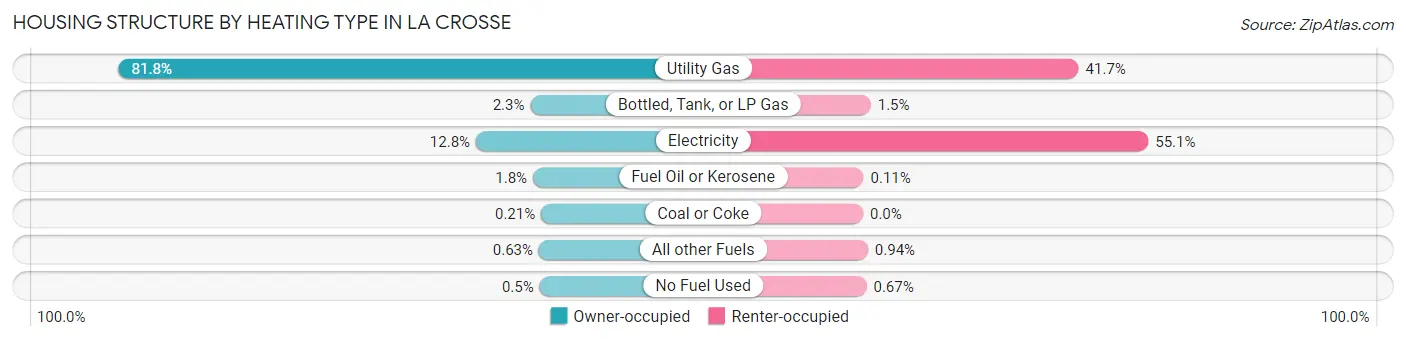
| Heating Type | Owner-occupied | Renter-occupied |
| Utility Gas | 8,584 (81.8%) | 5,070 (41.7%) |
| Bottled, Tank, or LP Gas | 239 (2.3%) | 183 (1.5%) |
| Electricity | 1,342 (12.8%) | 6,709 (55.1%) |
| Fuel Oil or Kerosene | 186 (1.8%) | 13 (0.1%) |
| Coal or Coke | 22 (0.2%) | 0 (0.0%) |
| All other Fuels | 66 (0.6%) | 114 (0.9%) |
| No Fuel Used | 52 (0.5%) | 82 (0.7%) |
| Total | 10,491 (100.0%) | 12,171 (100.0%) |
Household Vehicle Usage in La Crosse
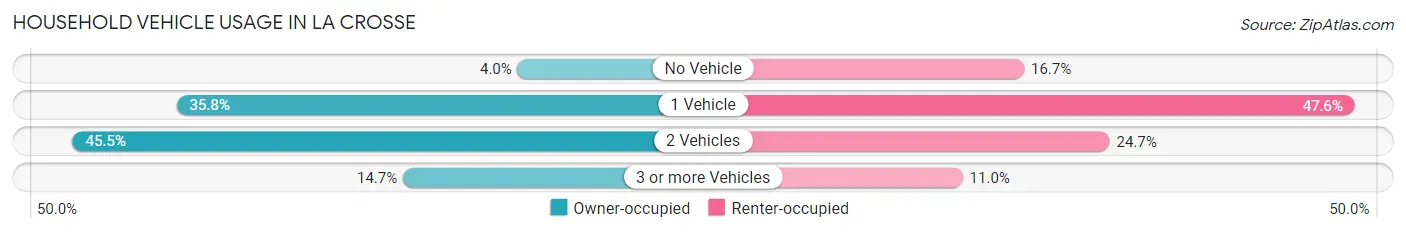
| Vehicles per Household | Owner-occupied | Renter-occupied |
| No Vehicle | 418 (4.0%) | 2,035 (16.7%) |
| 1 Vehicle | 3,758 (35.8%) | 5,792 (47.6%) |
| 2 Vehicles | 4,776 (45.5%) | 3,006 (24.7%) |
| 3 or more Vehicles | 1,539 (14.7%) | 1,338 (11.0%) |
| Total | 10,491 (100.0%) | 12,171 (100.0%) |
Real Estate & Mortgages in La Crosse
Real Estate and Mortgage Overview in La Crosse
| Characteristic | Without Mortgage | With Mortgage |
| Housing Units | 4,145 | 6,346 |
| Median Property Value | $187,600 | $180,800 |
| Median Household Income | $57,591 | $1,121 |
| Monthly Housing Costs | $623 | $382 |
| Real Estate Taxes | $4,069 | $0 |
Property Value by Mortgage Status in La Crosse
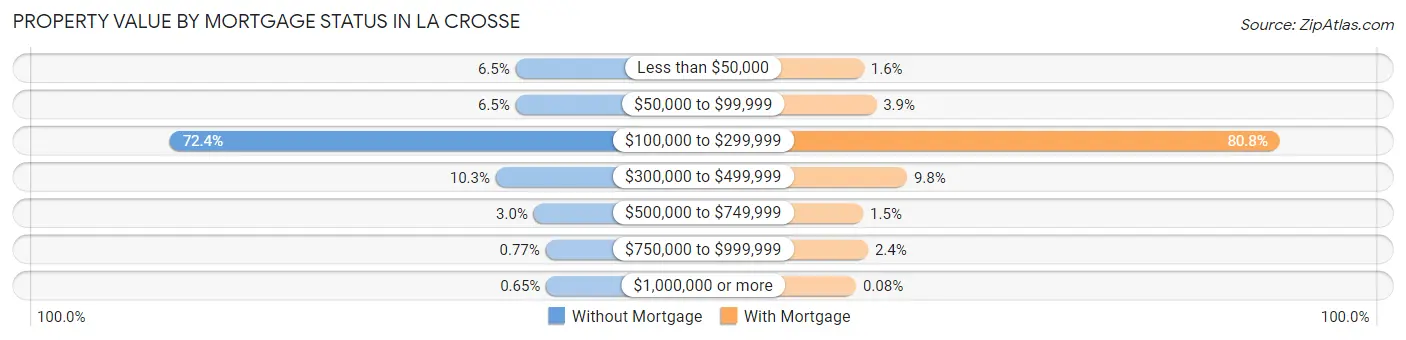
| Property Value | Without Mortgage | With Mortgage |
| Less than $50,000 | 269 (6.5%) | 100 (1.6%) |
| $50,000 to $99,999 | 268 (6.5%) | 250 (3.9%) |
| $100,000 to $299,999 | 2,999 (72.4%) | 5,127 (80.8%) |
| $300,000 to $499,999 | 425 (10.2%) | 622 (9.8%) |
| $500,000 to $749,999 | 125 (3.0%) | 92 (1.5%) |
| $750,000 to $999,999 | 32 (0.8%) | 150 (2.4%) |
| $1,000,000 or more | 27 (0.6%) | 5 (0.1%) |
| Total | 4,145 (100.0%) | 6,346 (100.0%) |
Household Income by Mortgage Status in La Crosse
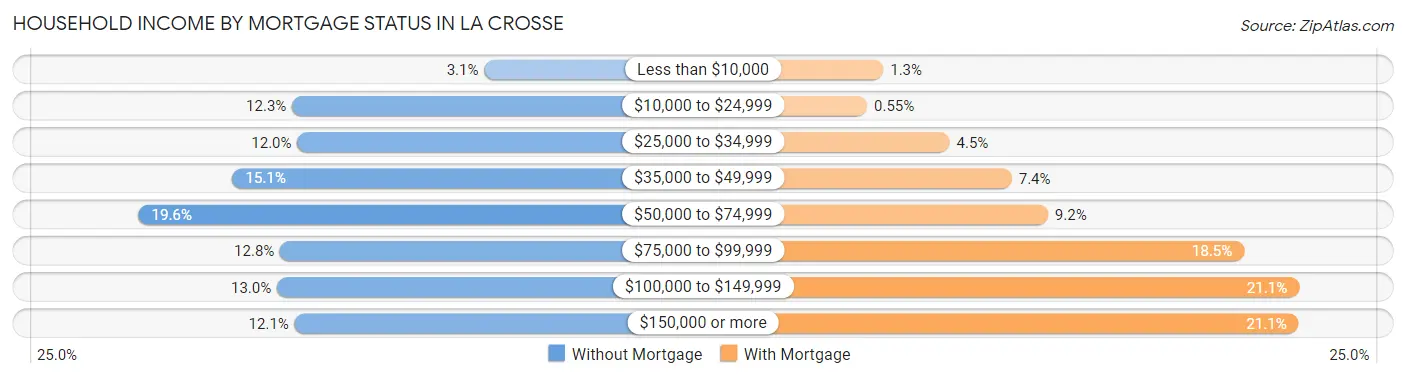
| Household Income | Without Mortgage | With Mortgage |
| Less than $10,000 | 129 (3.1%) | 84 (1.3%) |
| $10,000 to $24,999 | 508 (12.3%) | 35 (0.5%) |
| $25,000 to $34,999 | 498 (12.0%) | 284 (4.5%) |
| $35,000 to $49,999 | 626 (15.1%) | 472 (7.4%) |
| $50,000 to $74,999 | 811 (19.6%) | 581 (9.2%) |
| $75,000 to $99,999 | 532 (12.8%) | 1,174 (18.5%) |
| $100,000 to $149,999 | 538 (13.0%) | 1,340 (21.1%) |
| $150,000 or more | 503 (12.1%) | 1,339 (21.1%) |
| Total | 4,145 (100.0%) | 6,346 (100.0%) |
Property Value to Household Income Ratio in La Crosse
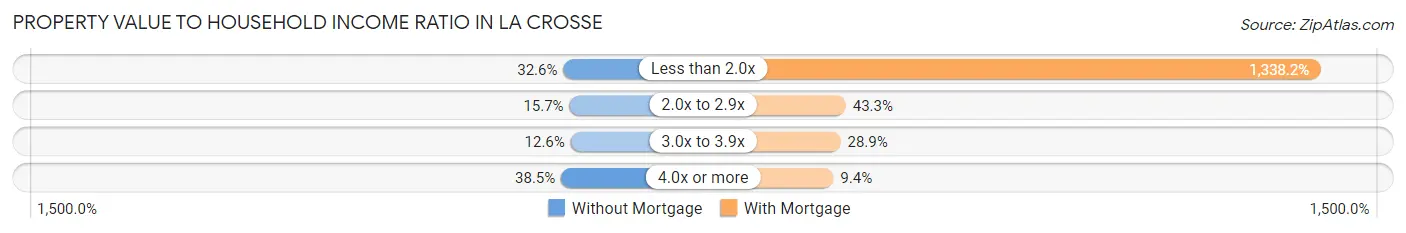
| Value-to-Income Ratio | Without Mortgage | With Mortgage |
| Less than 2.0x | 1,350 (32.6%) | 84,925 (1,338.2%) |
| 2.0x to 2.9x | 651 (15.7%) | 2,745 (43.3%) |
| 3.0x to 3.9x | 522 (12.6%) | 1,836 (28.9%) |
| 4.0x or more | 1,596 (38.5%) | 598 (9.4%) |
| Total | 4,145 (100.0%) | 6,346 (100.0%) |
Real Estate Taxes by Mortgage Status in La Crosse
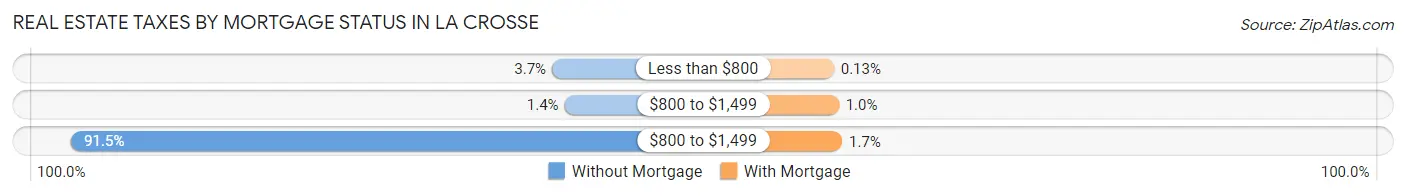
| Property Taxes | Without Mortgage | With Mortgage |
| Less than $800 | 153 (3.7%) | 8 (0.1%) |
| $800 to $1,499 | 58 (1.4%) | 66 (1.0%) |
| $800 to $1,499 | 3,793 (91.5%) | 105 (1.7%) |
| Total | 4,145 (100.0%) | 6,346 (100.0%) |
Health & Disability in La Crosse
Health Insurance Coverage by Age in La Crosse
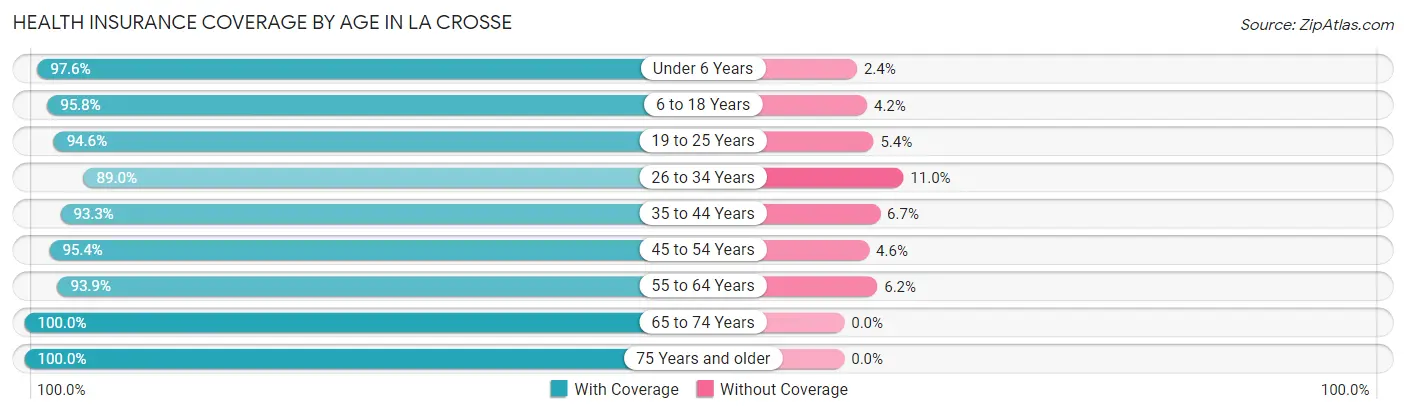
| Age Bracket | With Coverage | Without Coverage |
| Under 6 Years | 2,475 (97.6%) | 60 (2.4%) |
| 6 to 18 Years | 6,280 (95.8%) | 278 (4.2%) |
| 19 to 25 Years | 12,708 (94.6%) | 731 (5.4%) |
| 26 to 34 Years | 5,844 (89.0%) | 724 (11.0%) |
| 35 to 44 Years | 4,744 (93.3%) | 340 (6.7%) |
| 45 to 54 Years | 3,904 (95.4%) | 190 (4.6%) |
| 55 to 64 Years | 4,620 (93.9%) | 303 (6.1%) |
| 65 to 74 Years | 4,611 (100.0%) | 0 (0.0%) |
| 75 Years and older | 3,316 (100.0%) | 0 (0.0%) |
| Total | 48,502 (94.9%) | 2,626 (5.1%) |
Health Insurance Coverage by Citizenship Status in La Crosse
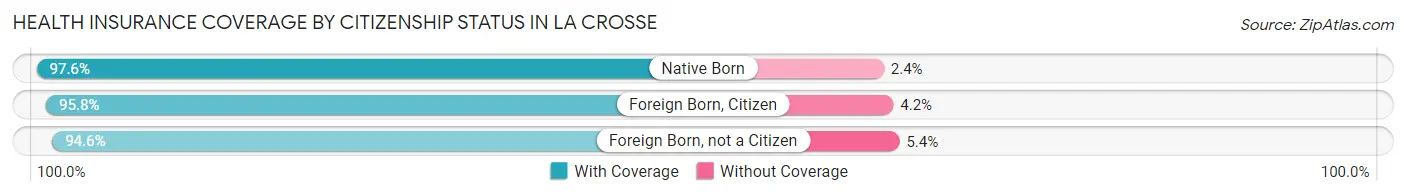
| Citizenship Status | With Coverage | Without Coverage |
| Native Born | 2,475 (97.6%) | 60 (2.4%) |
| Foreign Born, Citizen | 6,280 (95.8%) | 278 (4.2%) |
| Foreign Born, not a Citizen | 12,708 (94.6%) | 731 (5.4%) |
Health Insurance Coverage by Household Income in La Crosse
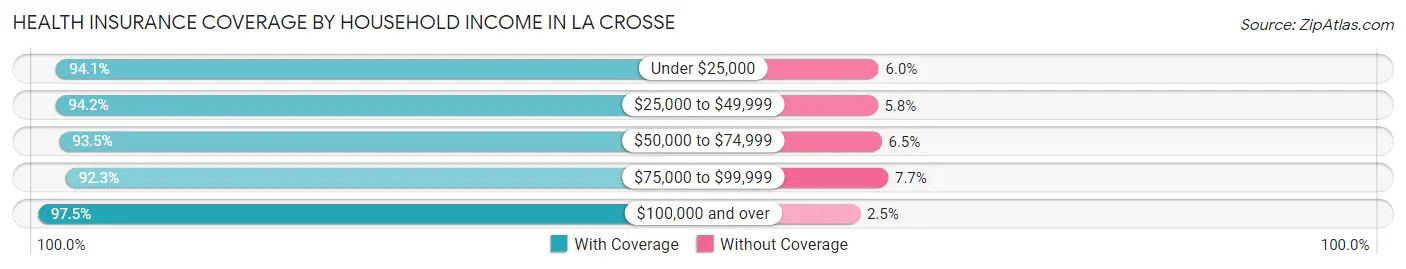
| Household Income | With Coverage | Without Coverage |
| Under $25,000 | 7,498 (94.1%) | 474 (5.9%) |
| $25,000 to $49,999 | 9,645 (94.2%) | 590 (5.8%) |
| $50,000 to $74,999 | 8,541 (93.5%) | 595 (6.5%) |
| $75,000 to $99,999 | 6,995 (92.3%) | 586 (7.7%) |
| $100,000 and over | 12,152 (97.5%) | 309 (2.5%) |
Public vs Private Health Insurance Coverage by Age in La Crosse
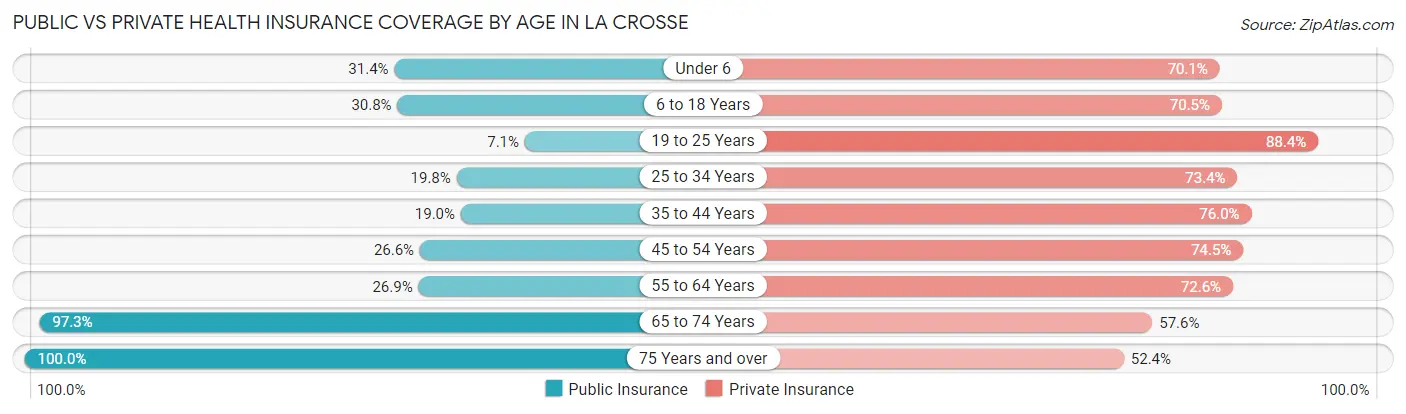
| Age Bracket | Public Insurance | Private Insurance |
| Under 6 | 795 (31.4%) | 1,778 (70.1%) |
| 6 to 18 Years | 2,019 (30.8%) | 4,626 (70.5%) |
| 19 to 25 Years | 960 (7.1%) | 11,882 (88.4%) |
| 25 to 34 Years | 1,301 (19.8%) | 4,823 (73.4%) |
| 35 to 44 Years | 967 (19.0%) | 3,865 (76.0%) |
| 45 to 54 Years | 1,090 (26.6%) | 3,050 (74.5%) |
| 55 to 64 Years | 1,324 (26.9%) | 3,574 (72.6%) |
| 65 to 74 Years | 4,484 (97.3%) | 2,658 (57.6%) |
| 75 Years and over | 3,316 (100.0%) | 1,736 (52.3%) |
| Total | 16,256 (31.8%) | 37,992 (74.3%) |
Disability Status by Sex by Age in La Crosse
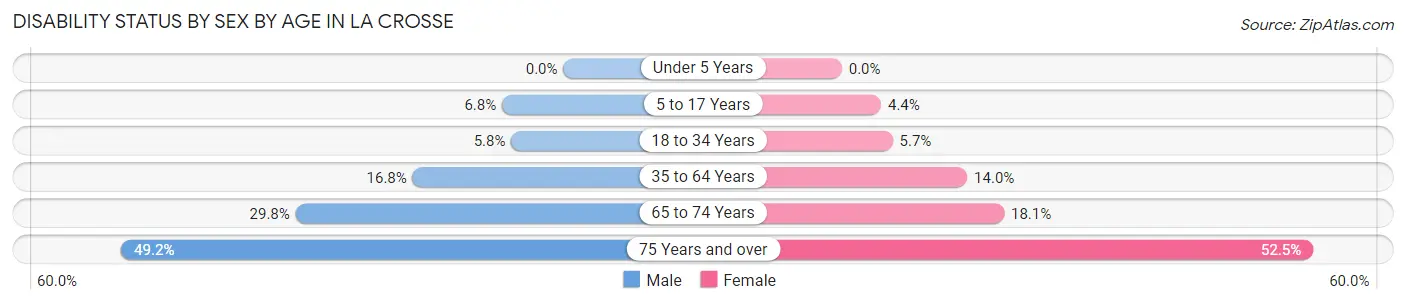
| Age Bracket | Male | Female |
| Under 5 Years | 0 (0.0%) | 0 (0.0%) |
| 5 to 17 Years | 179 (6.8%) | 120 (4.4%) |
| 18 to 34 Years | 591 (5.8%) | 643 (5.7%) |
| 35 to 64 Years | 1,234 (16.8%) | 943 (14.0%) |
| 65 to 74 Years | 639 (29.8%) | 446 (18.1%) |
| 75 Years and over | 612 (49.2%) | 1,088 (52.5%) |
Disability Class by Sex by Age in La Crosse
Disability Class: Hearing Difficulty
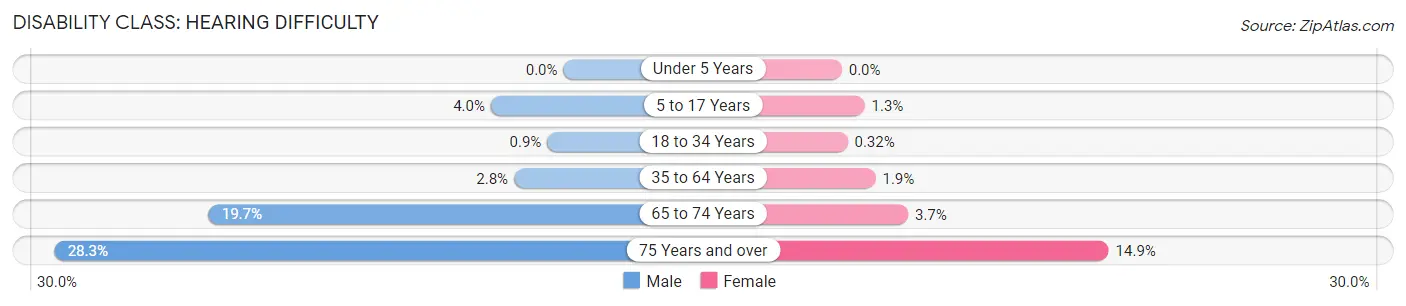
| Age Bracket | Male | Female |
| Under 5 Years | 0 (0.0%) | 0 (0.0%) |
| 5 to 17 Years | 106 (4.0%) | 35 (1.3%) |
| 18 to 34 Years | 92 (0.9%) | 36 (0.3%) |
| 35 to 64 Years | 202 (2.8%) | 127 (1.9%) |
| 65 to 74 Years | 423 (19.7%) | 91 (3.7%) |
| 75 Years and over | 352 (28.3%) | 308 (14.9%) |
Disability Class: Vision Difficulty
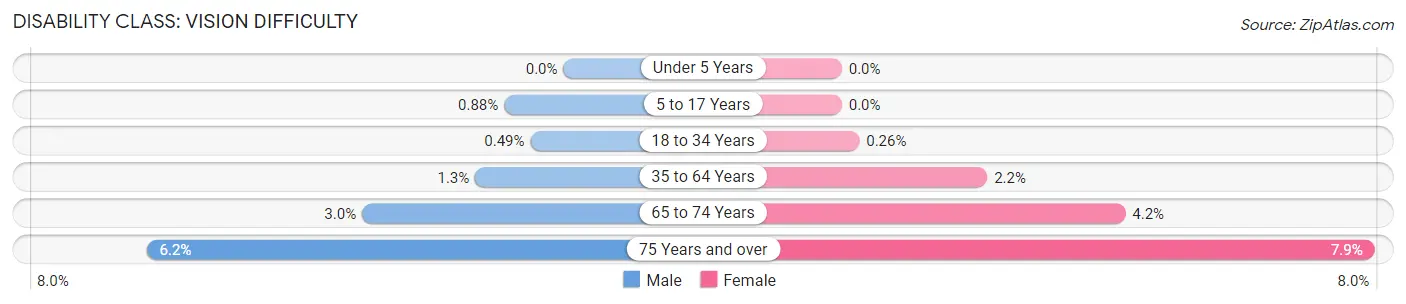
| Age Bracket | Male | Female |
| Under 5 Years | 0 (0.0%) | 0 (0.0%) |
| 5 to 17 Years | 23 (0.9%) | 0 (0.0%) |
| 18 to 34 Years | 50 (0.5%) | 29 (0.3%) |
| 35 to 64 Years | 96 (1.3%) | 146 (2.2%) |
| 65 to 74 Years | 64 (3.0%) | 104 (4.2%) |
| 75 Years and over | 77 (6.2%) | 164 (7.9%) |
Disability Class: Cognitive Difficulty
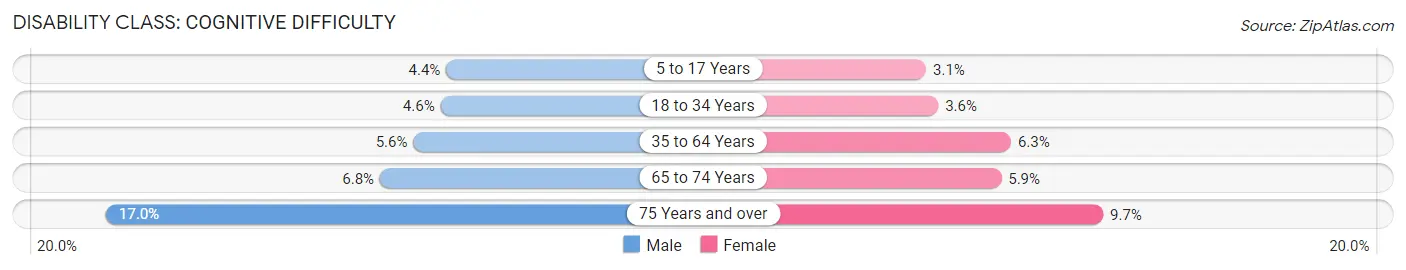
| Age Bracket | Male | Female |
| 5 to 17 Years | 114 (4.3%) | 86 (3.1%) |
| 18 to 34 Years | 465 (4.6%) | 406 (3.6%) |
| 35 to 64 Years | 409 (5.6%) | 424 (6.3%) |
| 65 to 74 Years | 146 (6.8%) | 146 (5.9%) |
| 75 Years and over | 211 (17.0%) | 201 (9.7%) |
Disability Class: Ambulatory Difficulty
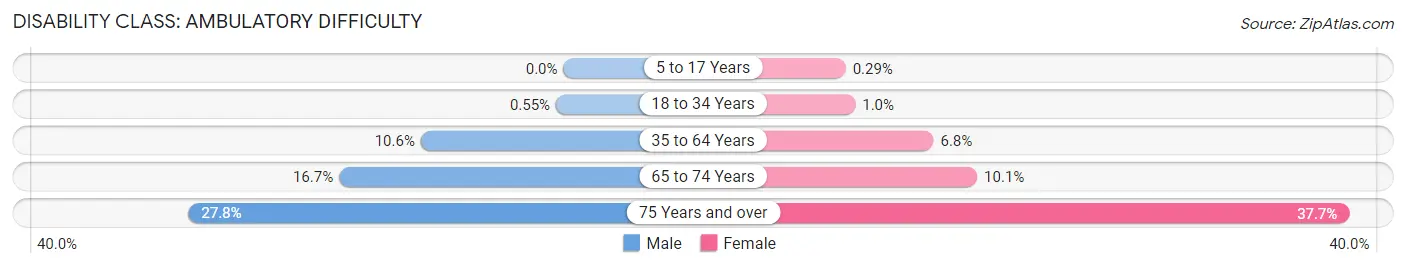
| Age Bracket | Male | Female |
| 5 to 17 Years | 0 (0.0%) | 8 (0.3%) |
| 18 to 34 Years | 56 (0.5%) | 114 (1.0%) |
| 35 to 64 Years | 778 (10.6%) | 460 (6.8%) |
| 65 to 74 Years | 357 (16.7%) | 248 (10.1%) |
| 75 Years and over | 346 (27.8%) | 781 (37.7%) |
Disability Class: Self-Care Difficulty
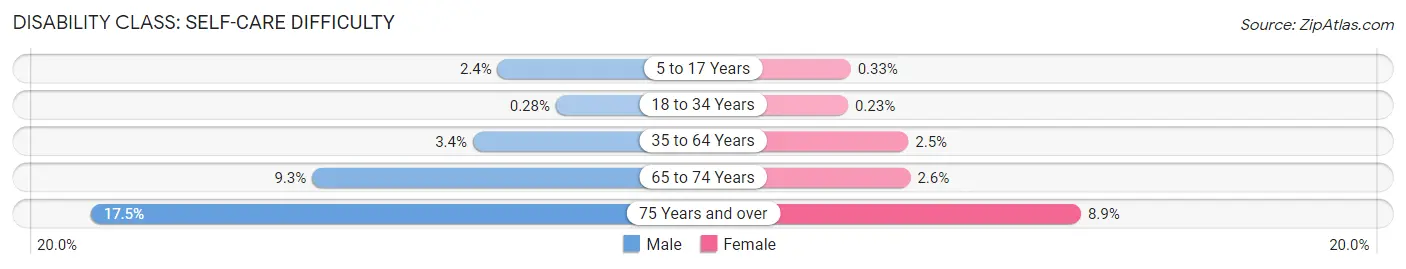
| Age Bracket | Male | Female |
| 5 to 17 Years | 64 (2.4%) | 9 (0.3%) |
| 18 to 34 Years | 29 (0.3%) | 26 (0.2%) |
| 35 to 64 Years | 247 (3.4%) | 167 (2.5%) |
| 65 to 74 Years | 200 (9.3%) | 63 (2.5%) |
| 75 Years and over | 218 (17.5%) | 184 (8.9%) |
Technology Access in La Crosse
Computing Device Access in La Crosse
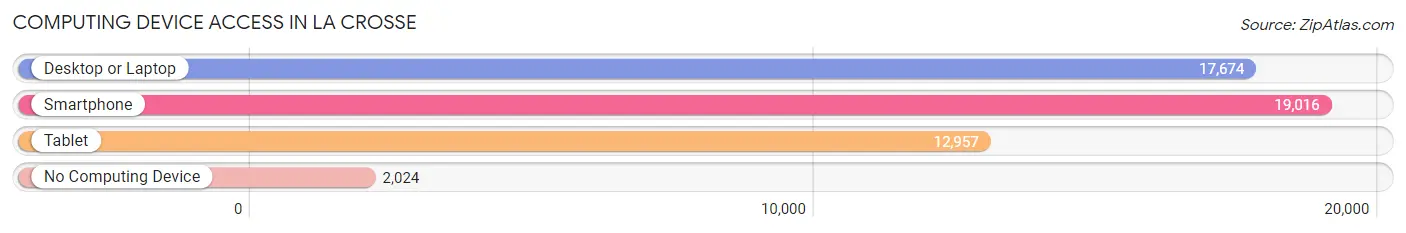
| Device Type | # Households | % Households |
| Desktop or Laptop | 17,674 | 78.0% |
| Smartphone | 19,016 | 83.9% |
| Tablet | 12,957 | 57.2% |
| No Computing Device | 2,024 | 8.9% |
| Total | 22,662 | 100.0% |
Internet Access in La Crosse
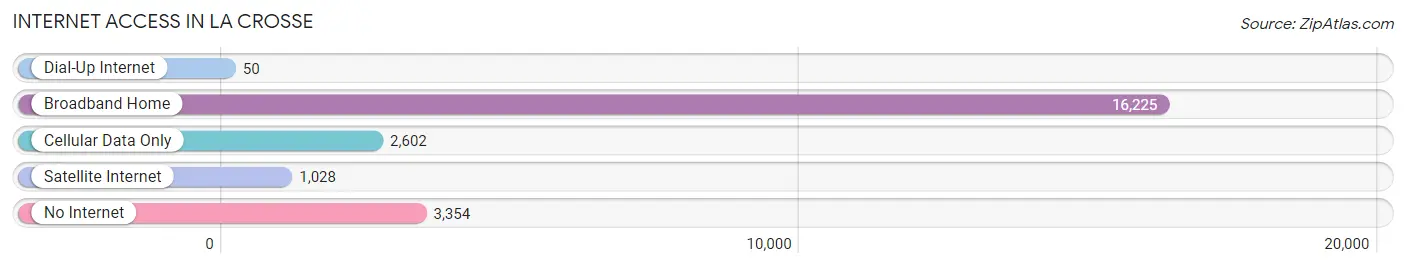
| Internet Type | # Households | % Households |
| Dial-Up Internet | 50 | 0.2% |
| Broadband Home | 16,225 | 71.6% |
| Cellular Data Only | 2,602 | 11.5% |
| Satellite Internet | 1,028 | 4.5% |
| No Internet | 3,354 | 14.8% |
| Total | 22,662 | 100.0% |
La Crosse Summary
La Crosse, Wisconsin is a city located in the southwestern corner of the state, along the Mississippi River. It is the county seat of La Crosse County and is the largest city on Wisconsin’s western border. The city is home to the University of Wisconsin-La Crosse, Viterbo University, and Western Technical College. La Crosse is known for its vibrant downtown, its many parks and trails, and its diverse cultural and recreational opportunities.
History
The area that is now La Crosse was first inhabited by the Ho-Chunk Native American tribe. The first European settlers arrived in the area in the early 1800s, and the city was officially founded in 1841. The city was named after the game of lacrosse, which was popular among the Native Americans in the area.
In the late 1800s, La Crosse became an important transportation hub, with the Mississippi River providing access to the Great Lakes and the railroads connecting the city to the rest of the country. The city also became a major center for the lumber industry, with several sawmills located in the area.
In the early 1900s, La Crosse experienced a period of rapid growth, with the population increasing from just over 10,000 in 1900 to over 30,000 by 1920. This growth was largely due to the city’s booming lumber industry and its location on the Mississippi River.
Geography
La Crosse is located in the southwestern corner of Wisconsin, along the Mississippi River. The city is situated on a series of bluffs overlooking the river, and is surrounded by rolling hills and wooded areas. The city is located about 90 miles from Minneapolis, Minnesota, and about 200 miles from Chicago, Illinois.
The city has a total area of 24.2 square miles, of which 23.7 square miles is land and 0.5 square miles is water. The city is divided into four distinct neighborhoods: Downtown, Northside, Southside, and Westside.
Economy
La Crosse’s economy is largely based on healthcare, education, and manufacturing. The city is home to several major healthcare providers, including Gundersen Health System, Mayo Clinic Health System, and Franciscan Skemp Healthcare. The city is also home to the University of Wisconsin-La Crosse, Viterbo University, and Western Technical College.
Manufacturing is also an important part of the city’s economy, with several major employers in the area. These include Trane, a manufacturer of heating and cooling systems; La Crosse Footwear, a manufacturer of shoes and boots; and La Crosse Technology, a manufacturer of electronic products.
Demographics
As of the 2020 census, La Crosse had a population of 51,818. The city has a median age of 33.7 years, with 24.3% of the population under the age of 18 and 13.2% over the age of 65. The city is majority white (86.2%), with smaller percentages of African American (5.2%), Asian (3.2%), and Hispanic or Latino (3.1%) residents.
The median household income in La Crosse is $50,845, and the median home value is $179,400. The city has a poverty rate of 15.2%, with 18.3% of children under the age of 18 living in poverty.
La Crosse is a vibrant and diverse city with a rich history and a bright future. The city is home to a variety of industries, educational institutions, and cultural attractions, making it an ideal place to live, work, and play.
Common Questions
What is Per Capita Income in La Crosse?
Per Capita income in La Crosse is $32,811.
What is the Median Family Income in La Crosse?
Median Family Income in La Crosse is $76,566.
What is the Median Household income in La Crosse?
Median Household Income in La Crosse is $51,836.
What is Income or Wage Gap in La Crosse?
Income or Wage Gap in La Crosse is 30.1%.
Women in La Crosse earn 69.9 cents for every dollar earned by a man.
What is Family Income Deficit in La Crosse?
Family Income Deficit in La Crosse is $7,855.
Families that are below poverty line in La Crosse earn $7,855 less on average than the poverty threshold level.
What is Inequality or Gini Index in La Crosse?
Inequality or Gini Index in La Crosse is 0.47.
What is the Total Population of La Crosse?
Total Population of La Crosse is 52,043.
What is the Total Male Population of La Crosse?
Total Male Population of La Crosse is 25,249.
What is the Total Female Population of La Crosse?
Total Female Population of La Crosse is 26,794.
What is the Ratio of Males per 100 Females in La Crosse?
There are 94.23 Males per 100 Females in La Crosse.
What is the Ratio of Females per 100 Males in La Crosse?
There are 106.12 Females per 100 Males in La Crosse.
What is the Median Population Age in La Crosse?
Median Population Age in La Crosse is 30.0 Years.
What is the Average Family Size in La Crosse
Average Family Size in La Crosse is 2.8 People.
What is the Average Household Size in La Crosse
Average Household Size in La Crosse is 2.1 People.
How Large is the Labor Force in La Crosse?
There are 29,128 People in the Labor Forcein in La Crosse.
What is the Percentage of People in the Labor Force in La Crosse?
64.2% of People are in the Labor Force in La Crosse.
What is the Unemployment Rate in La Crosse?
Unemployment Rate in La Crosse is 3.5%.