Haltom City, TX Map & Demographics
Haltom City Map
Haltom City Overview
$26,581
PER CAPITA INCOME
$65,333
AVG FAMILY INCOME
$57,649
AVG HOUSEHOLD INCOME
30.8%
WAGE / INCOME GAP [ % ]
69.2¢/ $1
WAGE / INCOME GAP [ $ ]
$12,198
FAMILY INCOME DEFICIT
0.40
INEQUALITY / GINI INDEX
45,771
TOTAL POPULATION
22,631
MALE POPULATION
23,140
FEMALE POPULATION
97.80
MALES / 100 FEMALES
102.25
FEMALES / 100 MALES
34.6
MEDIAN AGE
3.4
AVG FAMILY SIZE
2.8
AVG HOUSEHOLD SIZE
23,212
LABOR FORCE [ PEOPLE ]
66.3%
PERCENT IN LABOR FORCE
3.8%
UNEMPLOYMENT RATE
Haltom City Zip Codes
Income in Haltom City
Income Overview in Haltom City
Per Capita Income in Haltom City is $26,581, while median incomes of families and households are $65,333 and $57,649 respectively.
| Characteristic | Number | Measure |
| Per Capita Income | 45,771 | $26,581 |
| Median Family Income | 11,165 | $65,333 |
| Mean Family Income | 11,165 | $79,487 |
| Median Household Income | 16,532 | $57,649 |
| Mean Household Income | 16,532 | $70,995 |
| Income Deficit | 11,165 | $12,198 |
| Wage / Income Gap (%) | 45,771 | 30.79% |
| Wage / Income Gap ($) | 45,771 | 69.21¢ per $1 |
| Gini / Inequality Index | 45,771 | 0.40 |
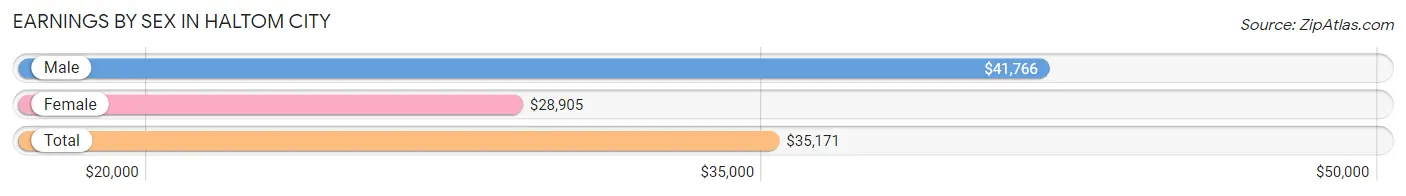
Earnings by Sex in Haltom City
Average Earnings in Haltom City are $35,171, $41,766 for men and $28,905 for women, a difference of 30.8%.
| Sex | Number | Average Earnings |
| Male | 13,745 (57.7%) | $41,766 |
| Female | 10,064 (42.3%) | $28,905 |
| Total | 23,809 (100.0%) | $35,171 |
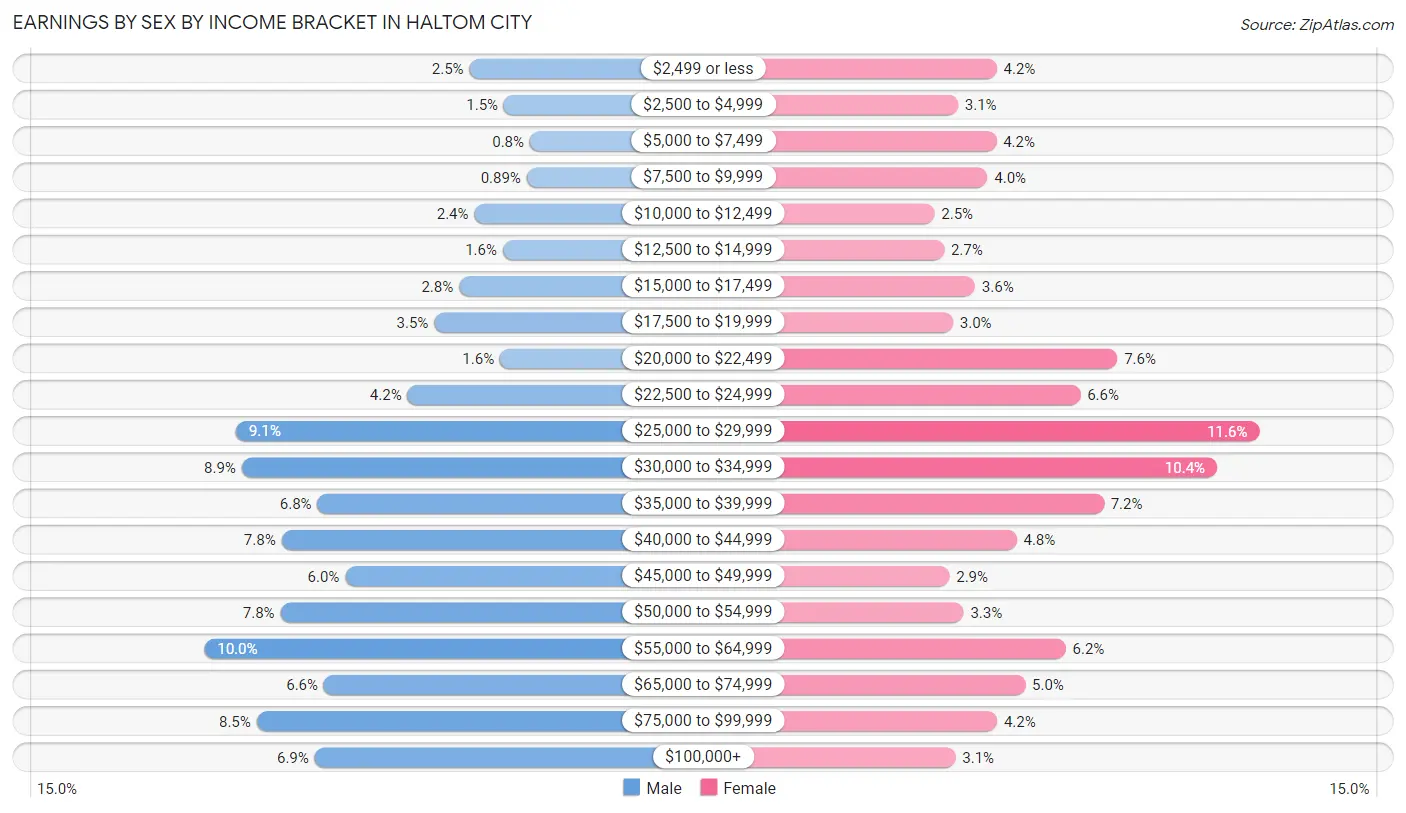
Earnings by Sex by Income Bracket in Haltom City
The most common earnings brackets in Haltom City are $55,000 to $64,999 for men (1,368 | 10.0%) and $25,000 to $29,999 for women (1,166 | 11.6%).
| Income | Male | Female |
| $2,499 or less | 344 (2.5%) | 424 (4.2%) |
| $2,500 to $4,999 | 210 (1.5%) | 314 (3.1%) |
| $5,000 to $7,499 | 110 (0.8%) | 423 (4.2%) |
| $7,500 to $9,999 | 122 (0.9%) | 398 (4.0%) |
| $10,000 to $12,499 | 324 (2.4%) | 248 (2.5%) |
| $12,500 to $14,999 | 215 (1.6%) | 275 (2.7%) |
| $15,000 to $17,499 | 384 (2.8%) | 362 (3.6%) |
| $17,500 to $19,999 | 480 (3.5%) | 300 (3.0%) |
| $20,000 to $22,499 | 225 (1.6%) | 765 (7.6%) |
| $22,500 to $24,999 | 583 (4.2%) | 660 (6.6%) |
| $25,000 to $29,999 | 1,245 (9.1%) | 1,166 (11.6%) |
| $30,000 to $34,999 | 1,223 (8.9%) | 1,047 (10.4%) |
| $35,000 to $39,999 | 930 (6.8%) | 727 (7.2%) |
| $40,000 to $44,999 | 1,070 (7.8%) | 480 (4.8%) |
| $45,000 to $49,999 | 824 (6.0%) | 290 (2.9%) |
| $50,000 to $54,999 | 1,074 (7.8%) | 330 (3.3%) |
| $55,000 to $64,999 | 1,368 (10.0%) | 619 (6.1%) |
| $65,000 to $74,999 | 906 (6.6%) | 504 (5.0%) |
| $75,000 to $99,999 | 1,166 (8.5%) | 425 (4.2%) |
| $100,000+ | 942 (6.9%) | 307 (3.0%) |
| Total | 13,745 (100.0%) | 10,064 (100.0%) |
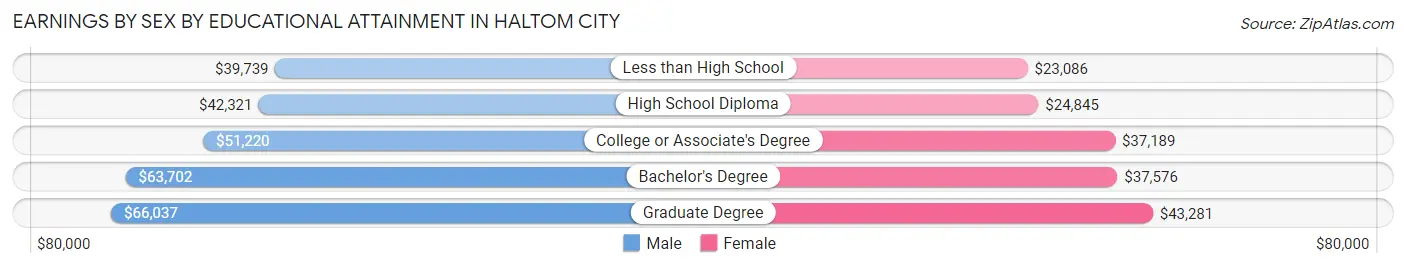
Earnings by Sex by Educational Attainment in Haltom City
Average earnings in Haltom City are $45,697 for men and $30,363 for women, a difference of 33.6%. Men with an educational attainment of graduate degree enjoy the highest average annual earnings of $66,037, while those with less than high school education earn the least with $39,739. Women with an educational attainment of graduate degree earn the most with the average annual earnings of $43,281, while those with less than high school education have the smallest earnings of $23,086.
| Educational Attainment | Male Income | Female Income |
| Less than High School | $39,739 | $23,086 |
| High School Diploma | $42,321 | $24,845 |
| College or Associate's Degree | $51,220 | $37,189 |
| Bachelor's Degree | $63,702 | $37,576 |
| Graduate Degree | $66,037 | $43,281 |
| Total | $45,697 | $30,363 |
Family Income in Haltom City
Family Income Brackets in Haltom City
According to the Haltom City family income data, there are 2,680 families falling into the $50,000 to $74,999 income range, which is the most common income bracket and makes up 24.0% of all families. Conversely, the $10,000 to $14,999 income bracket is the least frequent group with only 167 families (1.5%) belonging to this category.
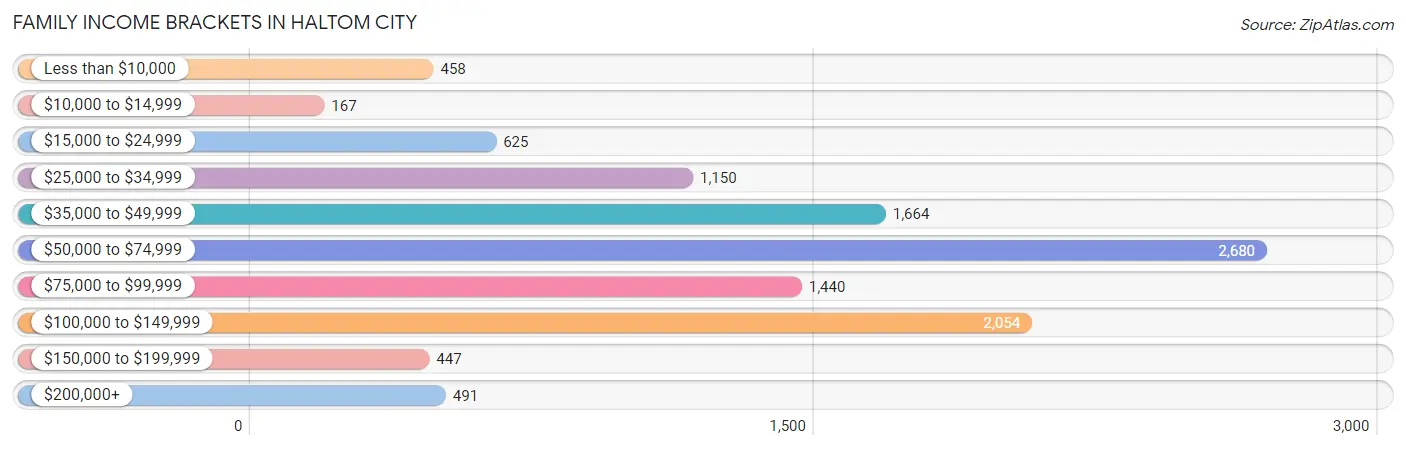
| Income Bracket | # Families | % Families |
| Less than $10,000 | 458 | 4.1% |
| $10,000 to $14,999 | 167 | 1.5% |
| $15,000 to $24,999 | 625 | 5.6% |
| $25,000 to $34,999 | 1,150 | 10.3% |
| $35,000 to $49,999 | 1,664 | 14.9% |
| $50,000 to $74,999 | 2,680 | 24.0% |
| $75,000 to $99,999 | 1,440 | 12.9% |
| $100,000 to $149,999 | 2,054 | 18.4% |
| $150,000 to $199,999 | 447 | 4.0% |
| $200,000+ | 491 | 4.4% |
Family Income by Famaliy Size in Haltom City
6-person families (616 | 5.5%) account for the highest median family income in Haltom City with $103,108 per family, while 2-person families (4,745 | 42.5%) have the highest median income of $31,636 per family member.
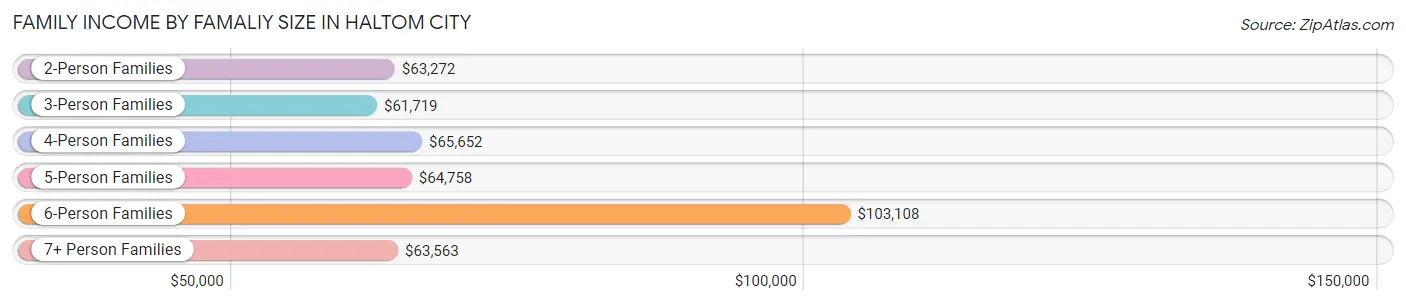
| Income Bracket | # Families | Median Income |
| 2-Person Families | 4,745 (42.5%) | $63,272 |
| 3-Person Families | 2,654 (23.8%) | $61,719 |
| 4-Person Families | 1,729 (15.5%) | $65,652 |
| 5-Person Families | 1,198 (10.7%) | $64,758 |
| 6-Person Families | 616 (5.5%) | $103,108 |
| 7+ Person Families | 223 (2.0%) | $63,563 |
| Total | 11,165 (100.0%) | $65,333 |
Family Income by Number of Earners in Haltom City
The median family income in Haltom City is $65,333, with families comprising 3+ earners (1,373) having the highest median family income of $115,938, while families with no earners (1,227) have the lowest median family income of $29,209, accounting for 12.3% and 11.0% of families, respectively.
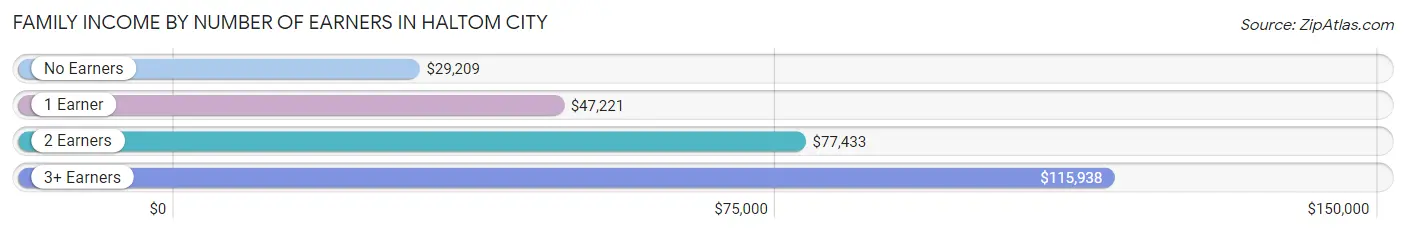
| Number of Earners | # Families | Median Income |
| No Earners | 1,227 (11.0%) | $29,209 |
| 1 Earner | 4,192 (37.6%) | $47,221 |
| 2 Earners | 4,373 (39.2%) | $77,433 |
| 3+ Earners | 1,373 (12.3%) | $115,938 |
| Total | 11,165 (100.0%) | $65,333 |
Household Income in Haltom City
Household Income Brackets in Haltom City
With 3,786 households falling in the category, the $50,000 to $74,999 income range is the most frequent in Haltom City, accounting for 22.9% of all households. In contrast, only 446 households (2.7%) fall into the $10,000 to $14,999 income bracket, making it the least populous group.
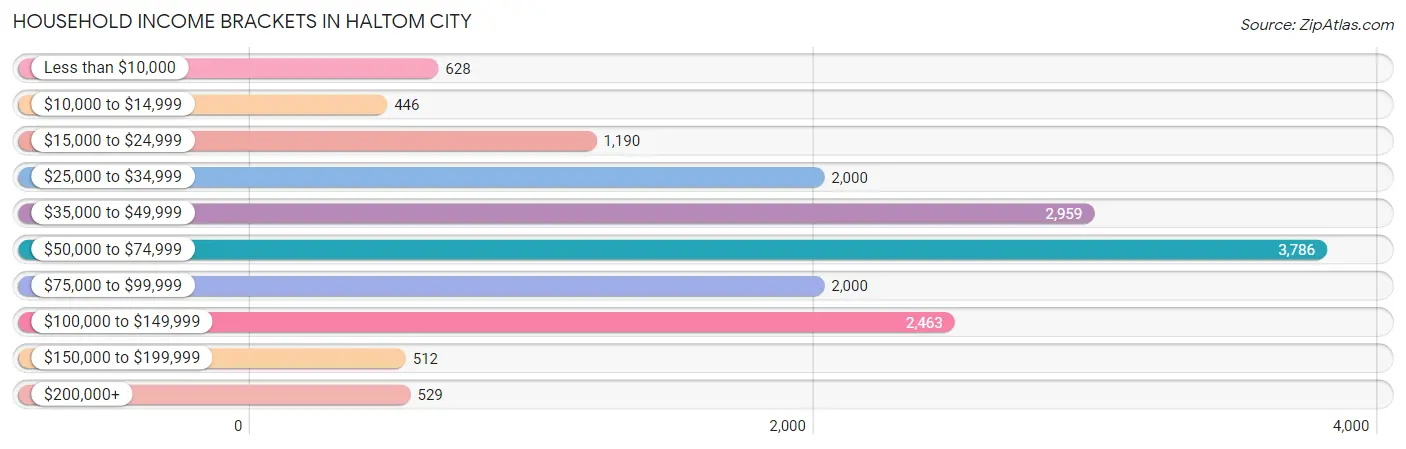
| Income Bracket | # Households | % Households |
| Less than $10,000 | 628 | 3.8% |
| $10,000 to $14,999 | 446 | 2.7% |
| $15,000 to $24,999 | 1,190 | 7.2% |
| $25,000 to $34,999 | 2,000 | 12.1% |
| $35,000 to $49,999 | 2,959 | 17.9% |
| $50,000 to $74,999 | 3,786 | 22.9% |
| $75,000 to $99,999 | 2,000 | 12.1% |
| $100,000 to $149,999 | 2,463 | 14.9% |
| $150,000 to $199,999 | 512 | 3.1% |
| $200,000+ | 529 | 3.2% |
Household Income by Householder Age in Haltom City
The median household income in Haltom City is $57,649, with the highest median household income of $67,460 found in the 45 to 64 years age bracket for the primary householder. A total of 5,962 households (36.1%) fall into this category. Meanwhile, the 15 to 24 years age bracket for the primary householder has the lowest median household income of $44,534, with 689 households (4.2%) in this group.
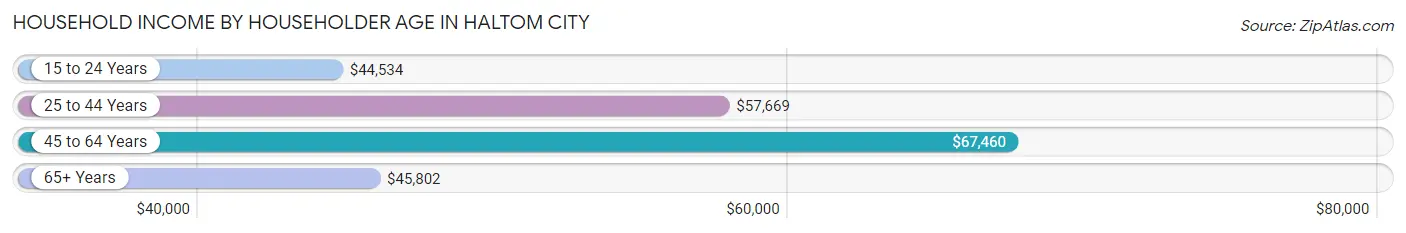
| Income Bracket | # Households | Median Income |
| 15 to 24 Years | 689 (4.2%) | $44,534 |
| 25 to 44 Years | 6,515 (39.4%) | $57,669 |
| 45 to 64 Years | 5,962 (36.1%) | $67,460 |
| 65+ Years | 3,366 (20.4%) | $45,802 |
| Total | 16,532 (100.0%) | $57,649 |
Poverty in Haltom City
Income Below Poverty by Sex and Age in Haltom City
With 10.6% poverty level for males and 17.0% for females among the residents of Haltom City, 6 to 11 year old males and 5 year old females are the most vulnerable to poverty, with 666 males (36.4%) and 67 females (45.3%) in their respective age groups living below the poverty level.
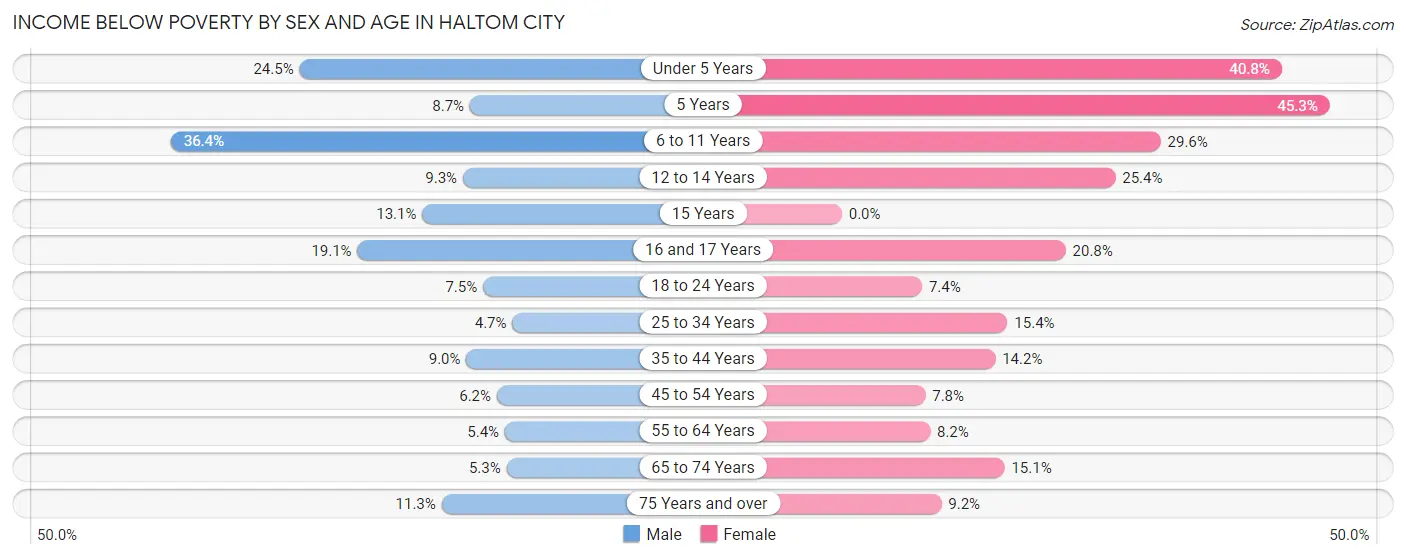
| Age Bracket | Male | Female |
| Under 5 Years | 313 (24.5%) | 720 (40.8%) |
| 5 Years | 15 (8.7%) | 67 (45.3%) |
| 6 to 11 Years | 666 (36.4%) | 758 (29.6%) |
| 12 to 14 Years | 77 (9.3%) | 348 (25.4%) |
| 15 Years | 50 (13.1%) | 0 (0.0%) |
| 16 and 17 Years | 99 (19.1%) | 141 (20.8%) |
| 18 to 24 Years | 165 (7.4%) | 149 (7.4%) |
| 25 to 34 Years | 184 (4.7%) | 492 (15.4%) |
| 35 to 44 Years | 327 (9.0%) | 504 (14.2%) |
| 45 to 54 Years | 186 (6.2%) | 194 (7.7%) |
| 55 to 64 Years | 125 (5.4%) | 163 (8.2%) |
| 65 to 74 Years | 87 (5.3%) | 252 (15.1%) |
| 75 Years and over | 91 (11.3%) | 118 (9.2%) |
| Total | 2,385 (10.6%) | 3,906 (17.0%) |
Income Above Poverty by Sex and Age in Haltom City
According to the poverty statistics in Haltom City, males aged 25 to 34 years and females aged 15 years are the age groups that are most secure financially, with 95.3% of males and 100.0% of females in these age groups living above the poverty line.
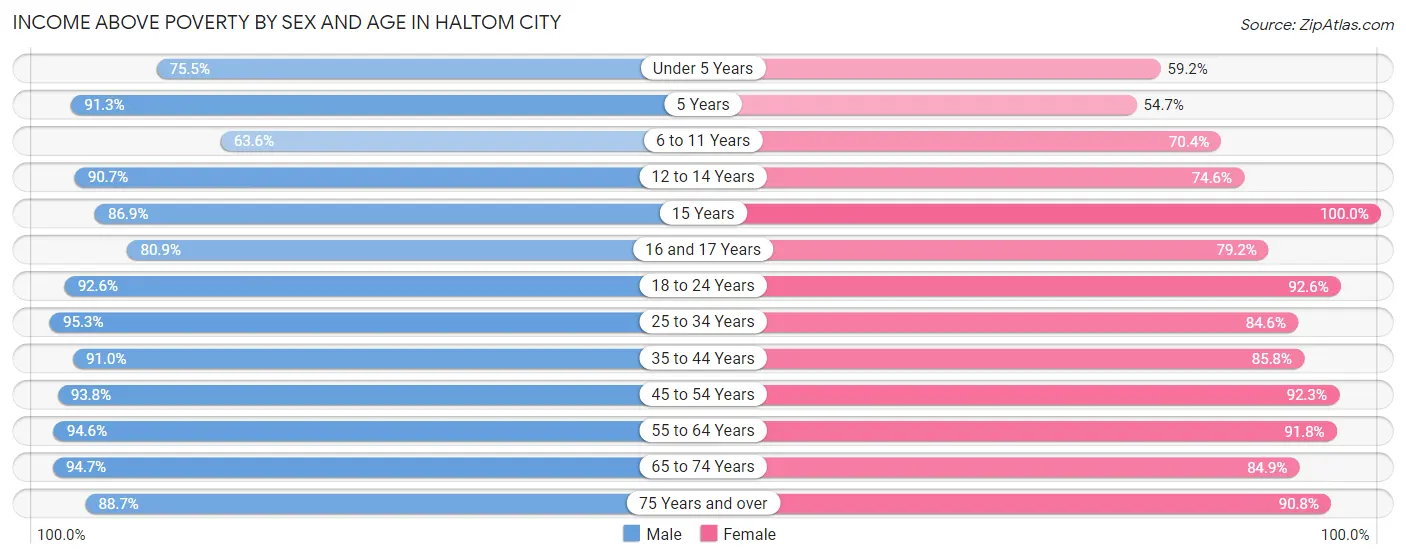
| Age Bracket | Male | Female |
| Under 5 Years | 965 (75.5%) | 1,044 (59.2%) |
| 5 Years | 158 (91.3%) | 81 (54.7%) |
| 6 to 11 Years | 1,162 (63.6%) | 1,804 (70.4%) |
| 12 to 14 Years | 749 (90.7%) | 1,023 (74.6%) |
| 15 Years | 332 (86.9%) | 332 (100.0%) |
| 16 and 17 Years | 419 (80.9%) | 538 (79.2%) |
| 18 to 24 Years | 2,049 (92.5%) | 1,855 (92.6%) |
| 25 to 34 Years | 3,709 (95.3%) | 2,710 (84.6%) |
| 35 to 44 Years | 3,308 (91.0%) | 3,036 (85.8%) |
| 45 to 54 Years | 2,830 (93.8%) | 2,310 (92.2%) |
| 55 to 64 Years | 2,183 (94.6%) | 1,828 (91.8%) |
| 65 to 74 Years | 1,565 (94.7%) | 1,417 (84.9%) |
| 75 Years and over | 714 (88.7%) | 1,159 (90.8%) |
| Total | 20,143 (89.4%) | 19,137 (83.1%) |
Income Below Poverty Among Married-Couple Families in Haltom City
The poverty statistics for married-couple families in Haltom City show that 5.1% or 362 of the total 7,073 families live below the poverty line. Families with 5 or more children have the highest poverty rate of 88.6%, comprising of 70 families. On the other hand, families with no children have the lowest poverty rate of 3.4%, which includes 127 families.
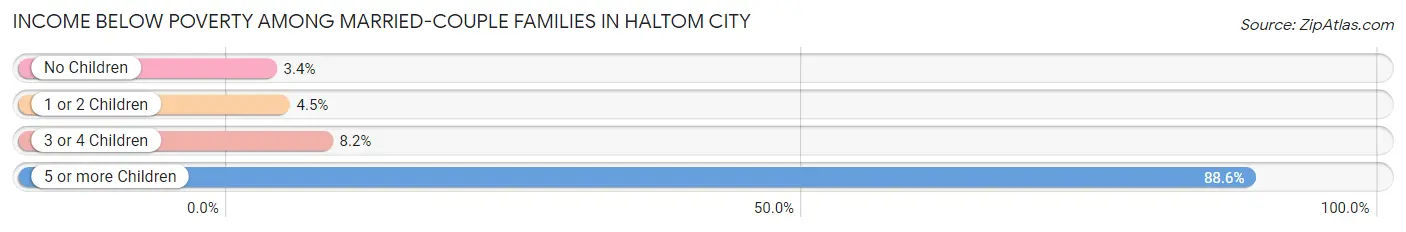
| Children | Above Poverty | Below Poverty |
| No Children | 3,649 (96.6%) | 127 (3.4%) |
| 1 or 2 Children | 2,551 (95.5%) | 120 (4.5%) |
| 3 or 4 Children | 502 (91.8%) | 45 (8.2%) |
| 5 or more Children | 9 (11.4%) | 70 (88.6%) |
| Total | 6,711 (94.9%) | 362 (5.1%) |
Income Below Poverty Among Single-Parent Households in Haltom City
According to the poverty data in Haltom City, 8.5% or 94 single-father households and 23.6% or 705 single-mother households are living below the poverty line. Among single-father households, those with 5 or more children have the highest poverty rate, with 13 households (100.0%) experiencing poverty. Likewise, among single-mother households, those with 3 or 4 children have the highest poverty rate, with 340 households (63.0%) falling below the poverty line.
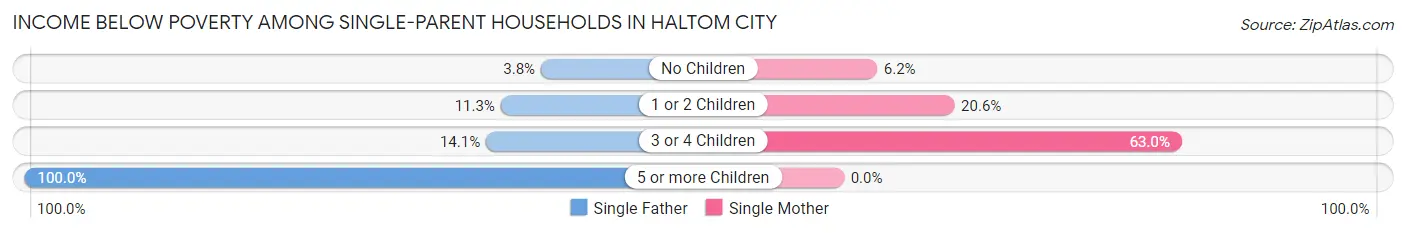
| Children | Single Father | Single Mother |
| No Children | 23 (3.8%) | 59 (6.2%) |
| 1 or 2 Children | 49 (11.3%) | 306 (20.6%) |
| 3 or 4 Children | 9 (14.1%) | 340 (63.0%) |
| 5 or more Children | 13 (100.0%) | 0 (0.0%) |
| Total | 94 (8.5%) | 705 (23.6%) |
Income Below Poverty Among Married-Couple vs Single-Parent Households in Haltom City
The poverty data for Haltom City shows that 362 of the married-couple family households (5.1%) and 799 of the single-parent households (19.5%) are living below the poverty level. Within the married-couple family households, those with 5 or more children have the highest poverty rate, with 70 households (88.6%) falling below the poverty line. Among the single-parent households, those with 5 or more children have the highest poverty rate, with 13 household (100.0%) living below poverty.
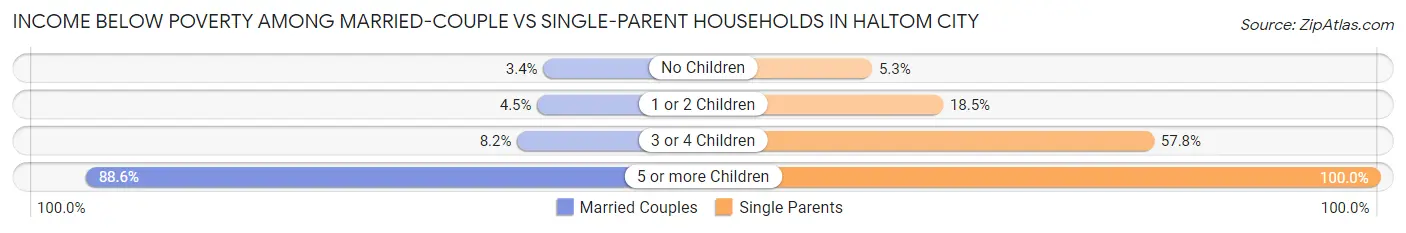
| Children | Married-Couple Families | Single-Parent Households |
| No Children | 127 (3.4%) | 82 (5.3%) |
| 1 or 2 Children | 120 (4.5%) | 355 (18.5%) |
| 3 or 4 Children | 45 (8.2%) | 349 (57.8%) |
| 5 or more Children | 70 (88.6%) | 13 (100.0%) |
| Total | 362 (5.1%) | 799 (19.5%) |
Race in Haltom City
The most populous races in Haltom City are White / Caucasian (23,889 | 52.2%), Hispanic or Latino (20,524 | 44.8%), and Some other Race (8,931 | 19.5%).
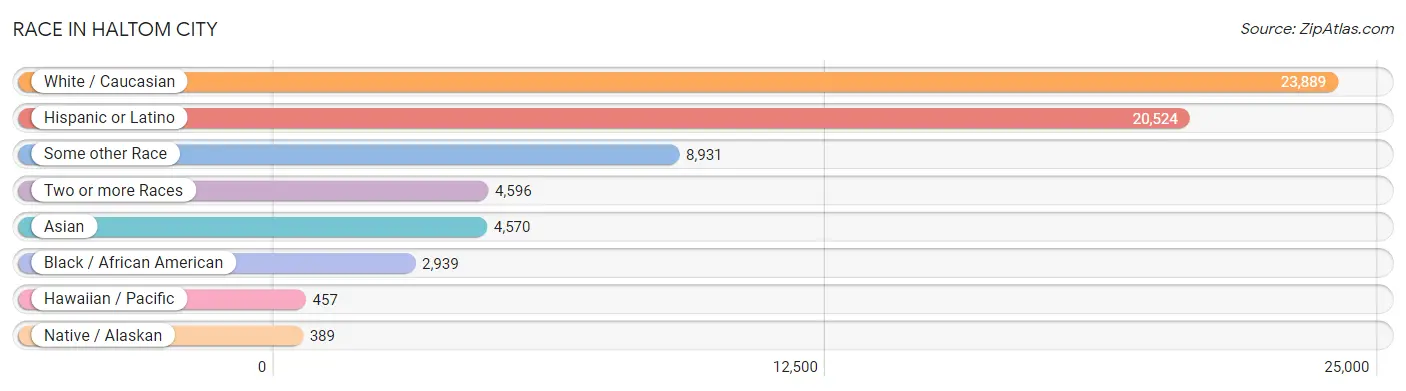
| Race | # Population | % Population |
| Asian | 4,570 | 10.0% |
| Black / African American | 2,939 | 6.4% |
| Hawaiian / Pacific | 457 | 1.0% |
| Hispanic or Latino | 20,524 | 44.8% |
| Native / Alaskan | 389 | 0.9% |
| White / Caucasian | 23,889 | 52.2% |
| Two or more Races | 4,596 | 10.0% |
| Some other Race | 8,931 | 19.5% |
| Total | 45,771 | 100.0% |
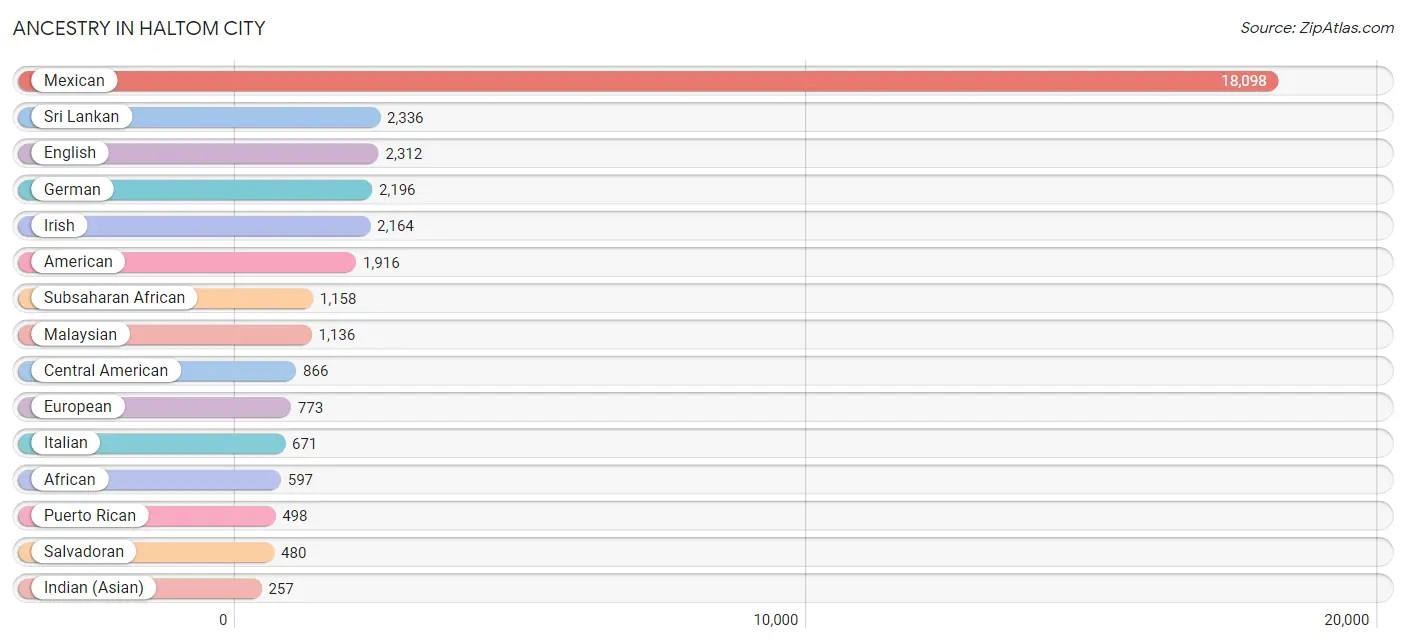
Ancestry in Haltom City
The most populous ancestries reported in Haltom City are Mexican (18,098 | 39.5%), Sri Lankan (2,336 | 5.1%), English (2,312 | 5.1%), German (2,196 | 4.8%), and Irish (2,164 | 4.7%), together accounting for 59.2% of all Haltom City residents.
| Ancestry | # Population | % Population |
| African | 597 | 1.3% |
| American | 1,916 | 4.2% |
| Arab | 187 | 0.4% |
| Argentinean | 57 | 0.1% |
| Austrian | 28 | 0.1% |
| Bhutanese | 41 | 0.1% |
| British | 87 | 0.2% |
| Burmese | 192 | 0.4% |
| Central American | 866 | 1.9% |
| Central American Indian | 5 | 0.0% |
| Cherokee | 27 | 0.1% |
| Chickasaw | 7 | 0.0% |
| Choctaw | 7 | 0.0% |
| Colombian | 62 | 0.1% |
| Comanche | 19 | 0.0% |
| Creek | 9 | 0.0% |
| Cuban | 135 | 0.3% |
| Czech | 90 | 0.2% |
| Czechoslovakian | 157 | 0.3% |
| Dutch | 13 | 0.0% |
| Egyptian | 107 | 0.2% |
| English | 2,312 | 5.1% |
| European | 773 | 1.7% |
| Filipino | 65 | 0.1% |
| French | 178 | 0.4% |
| French American Indian | 5 | 0.0% |
| French Canadian | 55 | 0.1% |
| German | 2,196 | 4.8% |
| Greek | 89 | 0.2% |
| Guamanian / Chamorro | 30 | 0.1% |
| Guatemalan | 154 | 0.3% |
| Haitian | 106 | 0.2% |
| Honduran | 107 | 0.2% |
| Hungarian | 37 | 0.1% |
| Indian (Asian) | 257 | 0.6% |
| Indonesian | 20 | 0.0% |
| Irish | 2,164 | 4.7% |
| Italian | 671 | 1.5% |
| Japanese | 52 | 0.1% |
| Kenyan | 67 | 0.2% |
| Korean | 157 | 0.3% |
| Lebanese | 21 | 0.1% |
| Liberian | 50 | 0.1% |
| Malaysian | 1,136 | 2.5% |
| Mexican | 18,098 | 39.5% |
| Mexican American Indian | 15 | 0.0% |
| Moroccan | 36 | 0.1% |
| Native Hawaiian | 192 | 0.4% |
| Nicaraguan | 96 | 0.2% |
| Norwegian | 243 | 0.5% |
| Pakistani | 125 | 0.3% |
| Panamanian | 29 | 0.1% |
| Polish | 157 | 0.3% |
| Portuguese | 6 | 0.0% |
| Puerto Rican | 498 | 1.1% |
| Russian | 36 | 0.1% |
| Salvadoran | 480 | 1.1% |
| Samoan | 33 | 0.1% |
| Scandinavian | 59 | 0.1% |
| Scotch-Irish | 247 | 0.5% |
| Scottish | 130 | 0.3% |
| Seminole | 5 | 0.0% |
| Serbian | 76 | 0.2% |
| Slavic | 131 | 0.3% |
| Slovak | 57 | 0.1% |
| South American | 119 | 0.3% |
| Spaniard | 232 | 0.5% |
| Spanish | 192 | 0.4% |
| Sri Lankan | 2,336 | 5.1% |
| Subsaharan African | 1,158 | 2.5% |
| Swedish | 164 | 0.4% |
| Thai | 218 | 0.5% |
| Ugandan | 150 | 0.3% |
| Vietnamese | 93 | 0.2% |
| Welsh | 112 | 0.2% |
| Yugoslavian | 32 | 0.1% | View All 76 Rows |
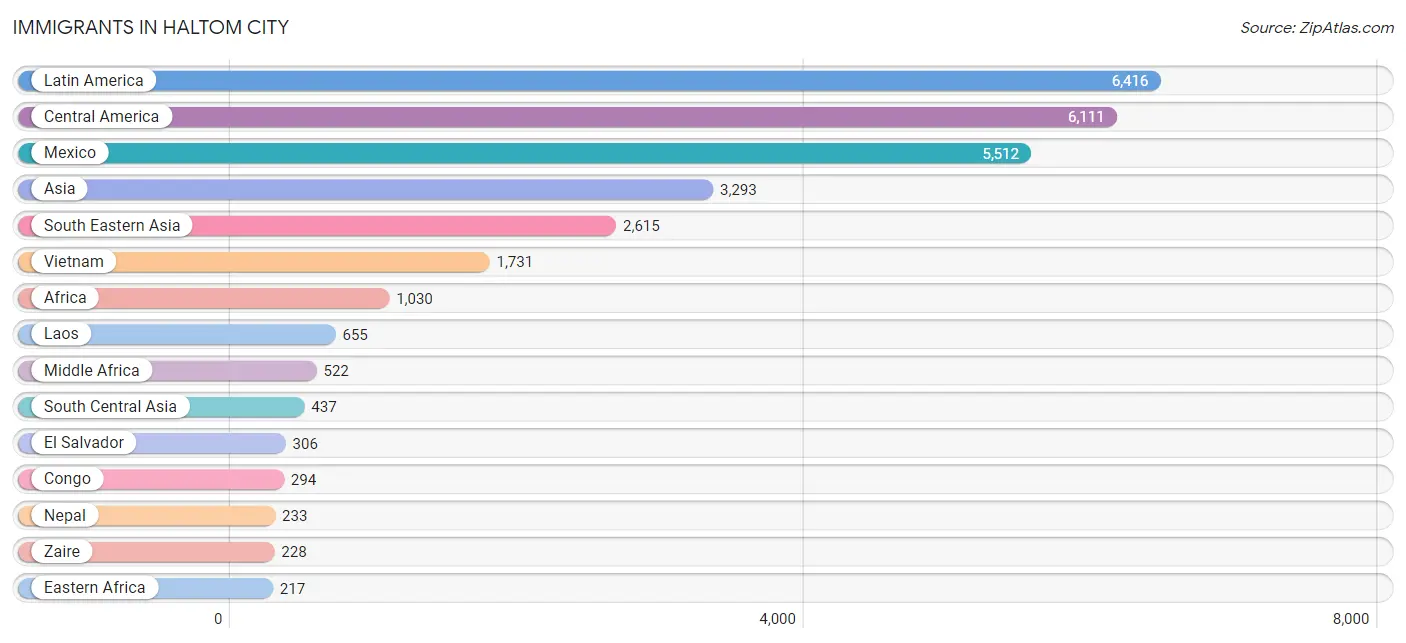
Immigrants in Haltom City
The most numerous immigrant groups reported in Haltom City came from Latin America (6,416 | 14.0%), Central America (6,111 | 13.4%), Mexico (5,512 | 12.0%), Asia (3,293 | 7.2%), and South Eastern Asia (2,615 | 5.7%), together accounting for 52.3% of all Haltom City residents.
| Immigration Origin | # Population | % Population |
| Africa | 1,030 | 2.2% |
| Argentina | 105 | 0.2% |
| Asia | 3,293 | 7.2% |
| Bangladesh | 93 | 0.2% |
| Cambodia | 65 | 0.1% |
| Caribbean | 109 | 0.2% |
| Central America | 6,111 | 13.4% |
| China | 60 | 0.1% |
| Colombia | 62 | 0.1% |
| Congo | 294 | 0.6% |
| Cuba | 90 | 0.2% |
| Dominican Republic | 19 | 0.0% |
| Eastern Africa | 217 | 0.5% |
| Eastern Asia | 193 | 0.4% |
| Egypt | 86 | 0.2% |
| El Salvador | 306 | 0.7% |
| Europe | 30 | 0.1% |
| Germany | 16 | 0.0% |
| Greece | 14 | 0.0% |
| Guatemala | 72 | 0.2% |
| Honduras | 107 | 0.2% |
| Kenya | 67 | 0.2% |
| Korea | 133 | 0.3% |
| Laos | 655 | 1.4% |
| Latin America | 6,416 | 14.0% |
| Liberia | 50 | 0.1% |
| Mexico | 5,512 | 12.0% |
| Micronesia | 186 | 0.4% |
| Middle Africa | 522 | 1.1% |
| Morocco | 36 | 0.1% |
| Nepal | 233 | 0.5% |
| Nicaragua | 96 | 0.2% |
| Northern Africa | 166 | 0.4% |
| Oceania | 197 | 0.4% |
| Panama | 18 | 0.0% |
| Peru | 29 | 0.1% |
| Philippines | 59 | 0.1% |
| South Africa | 5 | 0.0% |
| South America | 196 | 0.4% |
| South Central Asia | 437 | 0.9% |
| South Eastern Asia | 2,615 | 5.7% |
| Southern Europe | 14 | 0.0% |
| Sri Lanka | 44 | 0.1% |
| Taiwan | 21 | 0.1% |
| Thailand | 85 | 0.2% |
| Turkey | 13 | 0.0% |
| Uganda | 150 | 0.3% |
| Vietnam | 1,731 | 3.8% |
| Western Africa | 50 | 0.1% |
| Western Asia | 30 | 0.1% |
| Western Europe | 16 | 0.0% |
| Zaire | 228 | 0.5% | View All 52 Rows |
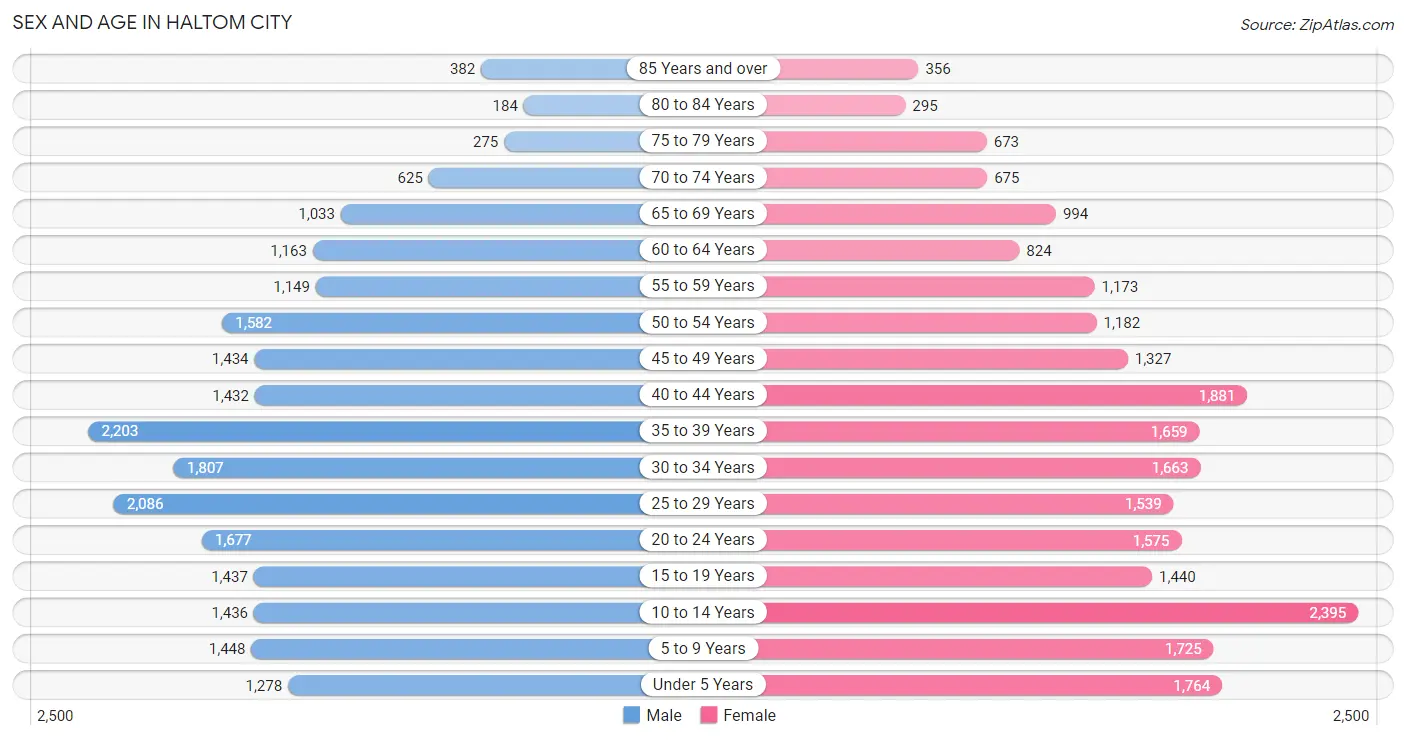
Sex and Age in Haltom City
Sex and Age in Haltom City
The most populous age groups in Haltom City are 35 to 39 Years (2,203 | 9.7%) for men and 10 to 14 Years (2,395 | 10.3%) for women.
| Age Bracket | Male | Female |
| Under 5 Years | 1,278 (5.7%) | 1,764 (7.6%) |
| 5 to 9 Years | 1,448 (6.4%) | 1,725 (7.4%) |
| 10 to 14 Years | 1,436 (6.4%) | 2,395 (10.3%) |
| 15 to 19 Years | 1,437 (6.4%) | 1,440 (6.2%) |
| 20 to 24 Years | 1,677 (7.4%) | 1,575 (6.8%) |
| 25 to 29 Years | 2,086 (9.2%) | 1,539 (6.7%) |
| 30 to 34 Years | 1,807 (8.0%) | 1,663 (7.2%) |
| 35 to 39 Years | 2,203 (9.7%) | 1,659 (7.2%) |
| 40 to 44 Years | 1,432 (6.3%) | 1,881 (8.1%) |
| 45 to 49 Years | 1,434 (6.3%) | 1,327 (5.7%) |
| 50 to 54 Years | 1,582 (7.0%) | 1,182 (5.1%) |
| 55 to 59 Years | 1,149 (5.1%) | 1,173 (5.1%) |
| 60 to 64 Years | 1,163 (5.1%) | 824 (3.6%) |
| 65 to 69 Years | 1,033 (4.6%) | 994 (4.3%) |
| 70 to 74 Years | 625 (2.8%) | 675 (2.9%) |
| 75 to 79 Years | 275 (1.2%) | 673 (2.9%) |
| 80 to 84 Years | 184 (0.8%) | 295 (1.3%) |
| 85 Years and over | 382 (1.7%) | 356 (1.5%) |
| Total | 22,631 (100.0%) | 23,140 (100.0%) |
Families and Households in Haltom City
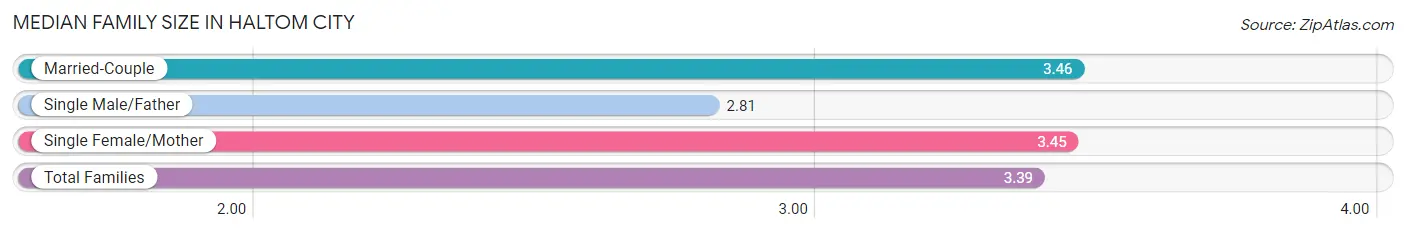
Median Family Size in Haltom City
The median family size in Haltom City is 3.39 persons per family, with married-couple families (7,073 | 63.3%) accounting for the largest median family size of 3.46 persons per family. On the other hand, single male/father families (1,110 | 9.9%) represent the smallest median family size with 2.81 persons per family.
| Family Type | # Families | Family Size |
| Married-Couple | 7,073 (63.3%) | 3.46 |
| Single Male/Father | 1,110 (9.9%) | 2.81 |
| Single Female/Mother | 2,982 (26.7%) | 3.45 |
| Total Families | 11,165 (100.0%) | 3.39 |
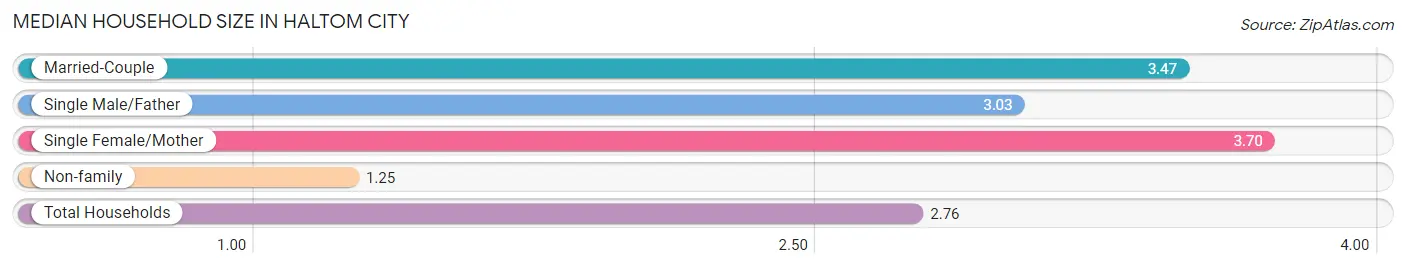
Median Household Size in Haltom City
The median household size in Haltom City is 2.76 persons per household, with single female/mother households (2,982 | 18.0%) accounting for the largest median household size of 3.7 persons per household. non-family households (5,367 | 32.5%) represent the smallest median household size with 1.25 persons per household.
| Household Type | # Households | Household Size |
| Married-Couple | 7,073 (42.8%) | 3.47 |
| Single Male/Father | 1,110 (6.7%) | 3.03 |
| Single Female/Mother | 2,982 (18.0%) | 3.70 |
| Non-family | 5,367 (32.5%) | 1.25 |
| Total Households | 16,532 (100.0%) | 2.76 |
Household Size by Marriage Status in Haltom City
Out of a total of 16,532 households in Haltom City, 11,165 (67.5%) are family households, while 5,367 (32.5%) are nonfamily households. The most numerous type of family households are 2-person households, comprising 4,356, and the most common type of nonfamily households are 1-person households, comprising 4,312.
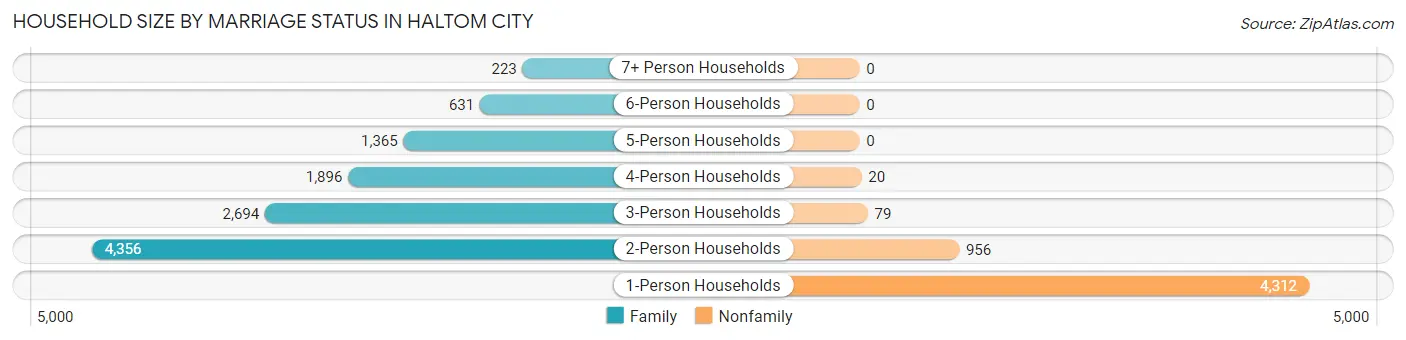
| Household Size | Family Households | Nonfamily Households |
| 1-Person Households | - | 4,312 (26.1%) |
| 2-Person Households | 4,356 (26.4%) | 956 (5.8%) |
| 3-Person Households | 2,694 (16.3%) | 79 (0.5%) |
| 4-Person Households | 1,896 (11.5%) | 20 (0.1%) |
| 5-Person Households | 1,365 (8.3%) | 0 (0.0%) |
| 6-Person Households | 631 (3.8%) | 0 (0.0%) |
| 7+ Person Households | 223 (1.3%) | 0 (0.0%) |
| Total | 11,165 (67.5%) | 5,367 (32.5%) |
Female Fertility in Haltom City
Fertility by Age in Haltom City
Average fertility rate in Haltom City is 49.0 births per 1,000 women. Women in the age bracket of 20 to 34 years have the highest fertility rate with 78.0 births per 1,000 women. Women in the age bracket of 20 to 34 years acount for 65.5% of all women with births.
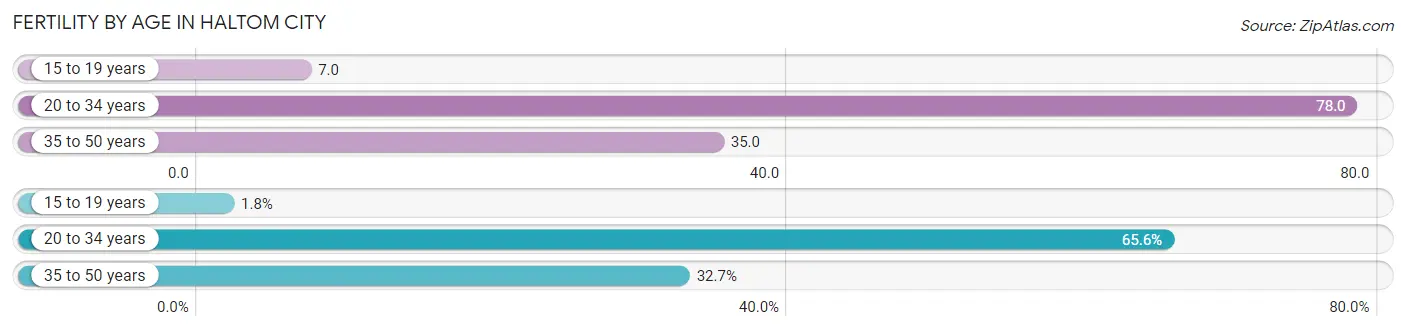
| Age Bracket | Women with Births | Births / 1,000 Women |
| 15 to 19 years | 10 (1.8%) | 7.0 |
| 20 to 34 years | 371 (65.5%) | 78.0 |
| 35 to 50 years | 185 (32.7%) | 35.0 |
| Total | 566 (100.0%) | 49.0 |
Fertility by Age by Marriage Status in Haltom City
82.9% of women with births (566) in Haltom City are married. The highest percentage of unmarried women with births falls into 15 to 19 years age bracket with 100.0% of them unmarried at the time of birth, while the lowest percentage of unmarried women with births belong to 20 to 34 years age bracket with 12.4% of them unmarried.
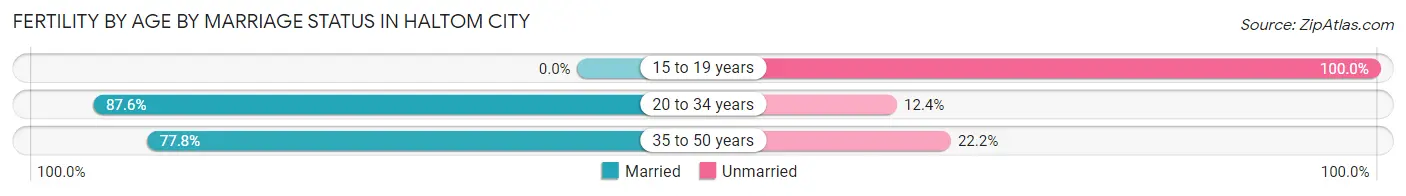
| Age Bracket | Married | Unmarried |
| 15 to 19 years | 0 (0.0%) | 10 (100.0%) |
| 20 to 34 years | 325 (87.6%) | 46 (12.4%) |
| 35 to 50 years | 144 (77.8%) | 41 (22.2%) |
| Total | 469 (82.9%) | 97 (17.1%) |
Fertility by Education in Haltom City
Average fertility rate in Haltom City is 49.0 births per 1,000 women. Women with the education attainment of bachelor's degree have the highest fertility rate of 137.0 births per 1,000 women, while women with the education attainment of high school diploma have the lowest fertility at 16.0 births per 1,000 women. Women with the education attainment of college or associate's degree represent 33.6% of all women with births.
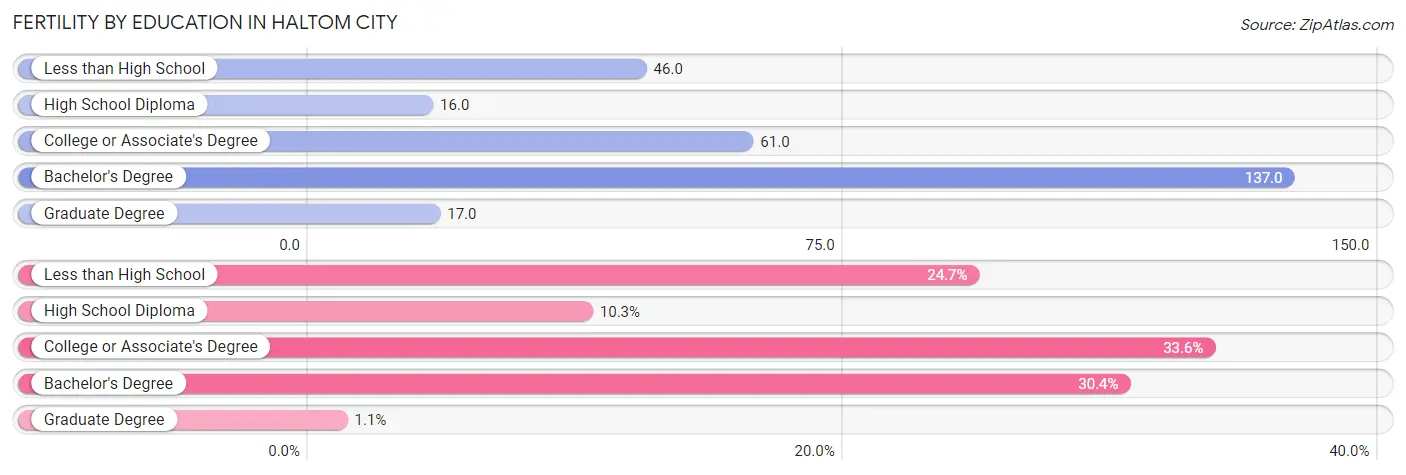
| Educational Attainment | Women with Births | Births / 1,000 Women |
| Less than High School | 140 (24.7%) | 46.0 |
| High School Diploma | 58 (10.2%) | 16.0 |
| College or Associate's Degree | 190 (33.6%) | 61.0 |
| Bachelor's Degree | 172 (30.4%) | 137.0 |
| Graduate Degree | 6 (1.1%) | 17.0 |
| Total | 566 (100.0%) | 49.0 |
Fertility by Education by Marriage Status in Haltom City
17.1% of women with births in Haltom City are unmarried. Women with the educational attainment of graduate degree are most likely to be married with 100.0% of them married at childbirth, while women with the educational attainment of high school diploma are least likely to be married with 48.3% of them unmarried at childbirth.
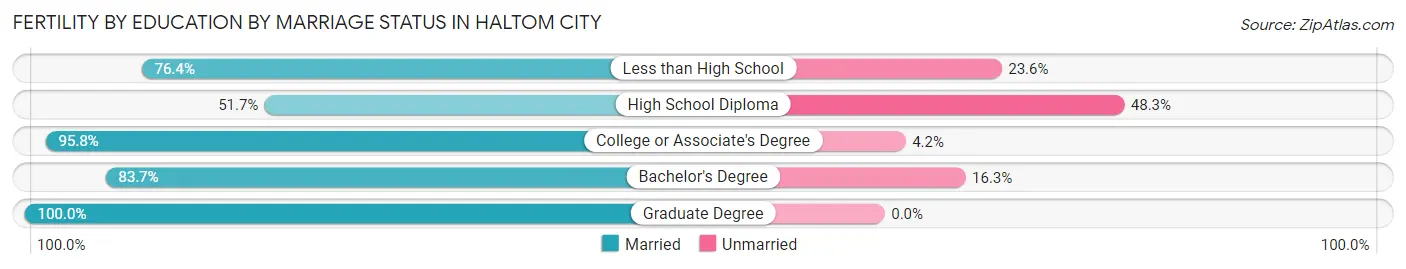
| Educational Attainment | Married | Unmarried |
| Less than High School | 107 (76.4%) | 33 (23.6%) |
| High School Diploma | 30 (51.7%) | 28 (48.3%) |
| College or Associate's Degree | 182 (95.8%) | 8 (4.2%) |
| Bachelor's Degree | 144 (83.7%) | 28 (16.3%) |
| Graduate Degree | 6 (100.0%) | 0 (0.0%) |
| Total | 469 (82.9%) | 97 (17.1%) |
Employment Characteristics in Haltom City
Employment by Class of Employer in Haltom City
Among the 22,081 employed individuals in Haltom City, private company employees (17,010 | 77.0%), self-employed (not incorporated) (1,881 | 8.5%), and local government employees (1,205 | 5.5%) make up the most common classes of employment.
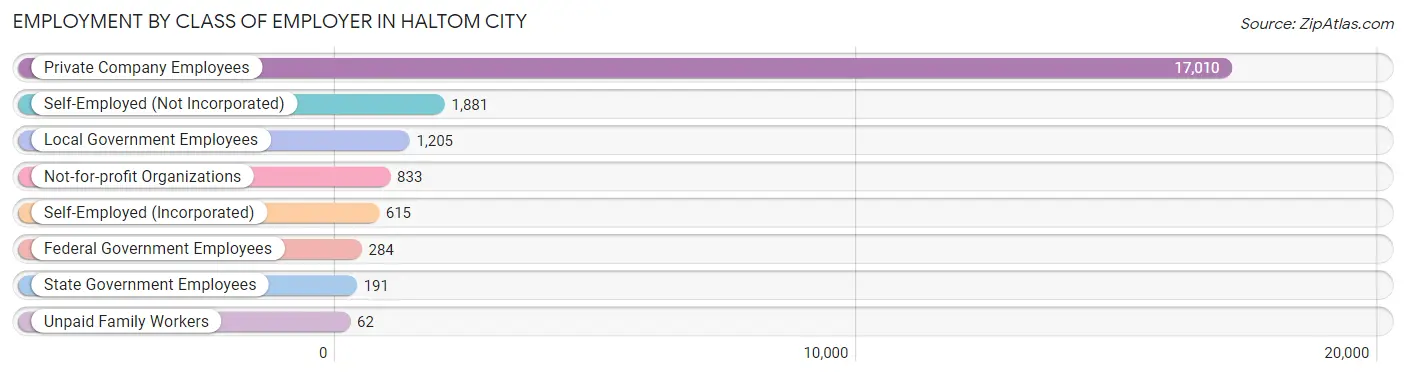
| Employer Class | # Employees | % Employees |
| Private Company Employees | 17,010 | 77.0% |
| Self-Employed (Incorporated) | 615 | 2.8% |
| Self-Employed (Not Incorporated) | 1,881 | 8.5% |
| Not-for-profit Organizations | 833 | 3.8% |
| Local Government Employees | 1,205 | 5.5% |
| State Government Employees | 191 | 0.9% |
| Federal Government Employees | 284 | 1.3% |
| Unpaid Family Workers | 62 | 0.3% |
| Total | 22,081 | 100.0% |
Employment Status by Age in Haltom City
According to the labor force statistics for Haltom City, out of the total population over 16 years of age (35,011), 66.3% or 23,212 individuals are in the labor force, with 3.8% or 882 of them unemployed. The age group with the highest labor force participation rate is 25 to 29 years, with 83.6% or 3,030 individuals in the labor force. Within the labor force, the 16 to 19 years age range has the highest percentage of unemployed individuals, with 24.5% or 156 of them being unemployed.
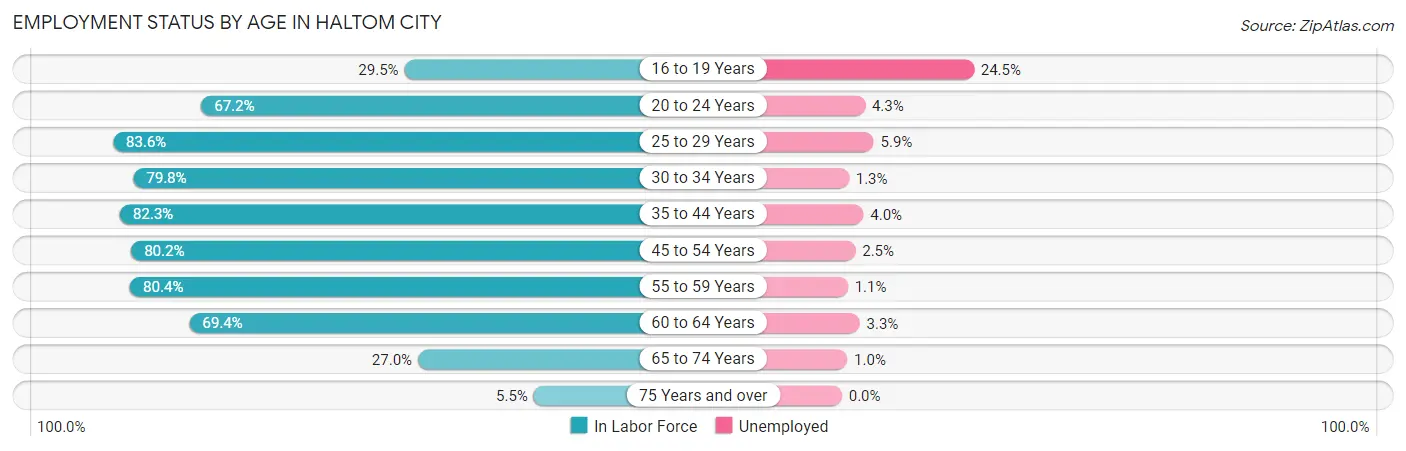
| Age Bracket | In Labor Force | Unemployed |
| 16 to 19 Years | 638 (29.5%) | 156 (24.5%) |
| 20 to 24 Years | 2,185 (67.2%) | 94 (4.3%) |
| 25 to 29 Years | 3,030 (83.6%) | 179 (5.9%) |
| 30 to 34 Years | 2,769 (79.8%) | 36 (1.3%) |
| 35 to 44 Years | 5,905 (82.3%) | 236 (4.0%) |
| 45 to 54 Years | 4,431 (80.2%) | 111 (2.5%) |
| 55 to 59 Years | 1,867 (80.4%) | 21 (1.1%) |
| 60 to 64 Years | 1,379 (69.4%) | 46 (3.3%) |
| 65 to 74 Years | 898 (27.0%) | 9 (1.0%) |
| 75 Years and over | 119 (5.5%) | 0 (0.0%) |
| Total | 23,212 (66.3%) | 882 (3.8%) |
Employment Status by Educational Attainment in Haltom City
According to labor force statistics for Haltom City, 80.4% of individuals (19,380) out of the total population between 25 and 64 years of age (24,104) are in the labor force, with 3.2% or 620 of them being unemployed. The group with the highest labor force participation rate are those with the educational attainment of bachelor's degree or higher, with 91.9% or 2,752 individuals in the labor force. Within the labor force, individuals with high school diploma education have the highest percentage of unemployment, with 4.4% or 327 of them being unemployed.
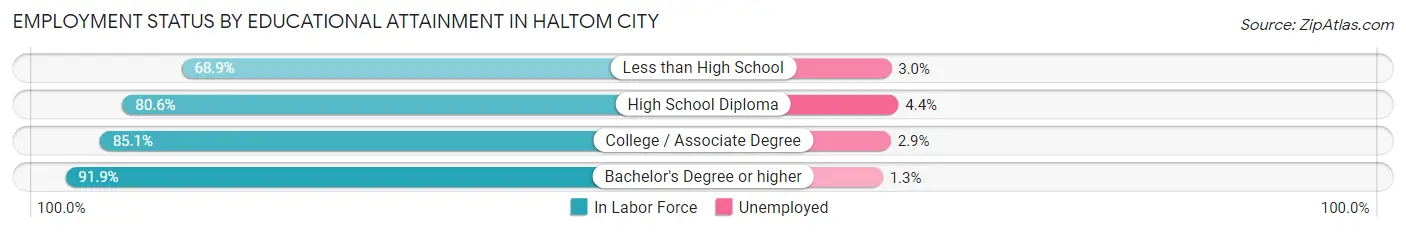
| Educational Attainment | In Labor Force | Unemployed |
| Less than High School | 3,896 (68.9%) | 170 (3.0%) |
| High School Diploma | 7,423 (80.6%) | 405 (4.4%) |
| College / Associate Degree | 5,314 (85.1%) | 181 (2.9%) |
| Bachelor's Degree or higher | 2,752 (91.9%) | 39 (1.3%) |
| Total | 19,380 (80.4%) | 771 (3.2%) |
Employment Occupations by Sex in Haltom City
Management, Business, Science and Arts Occupations
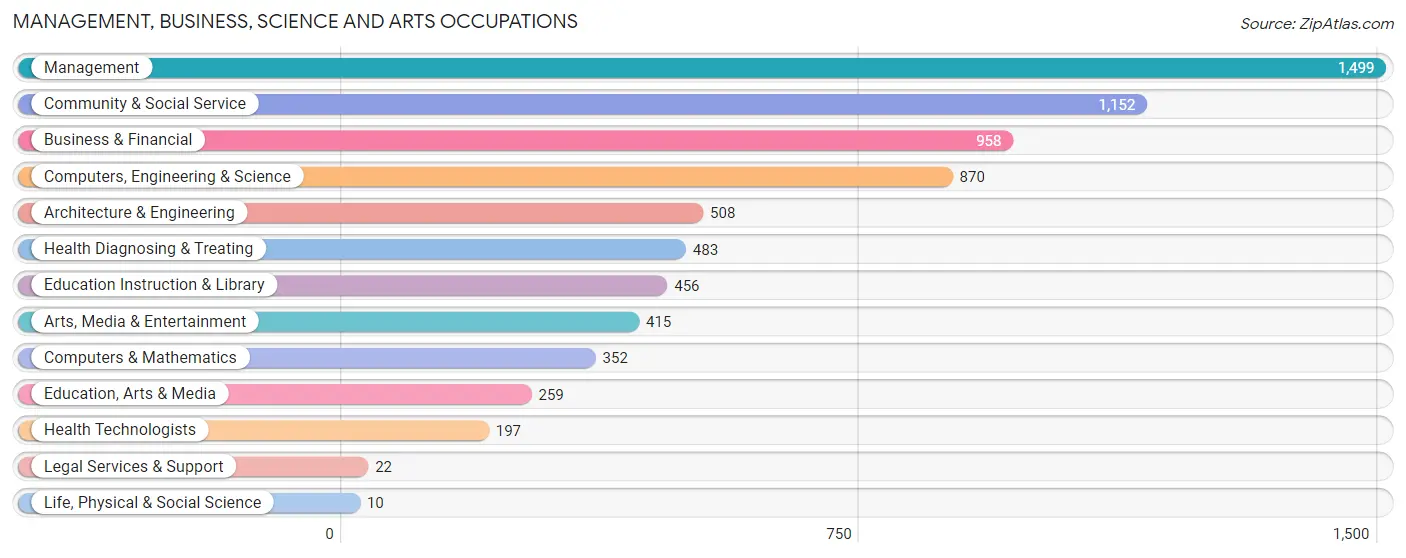
The most common Management, Business, Science and Arts occupations in Haltom City are Management (1,499 | 6.7%), Community & Social Service (1,152 | 5.2%), Business & Financial (958 | 4.3%), Computers, Engineering & Science (870 | 3.9%), and Architecture & Engineering (508 | 2.3%).
Management, Business, Science and Arts Occupations by Sex
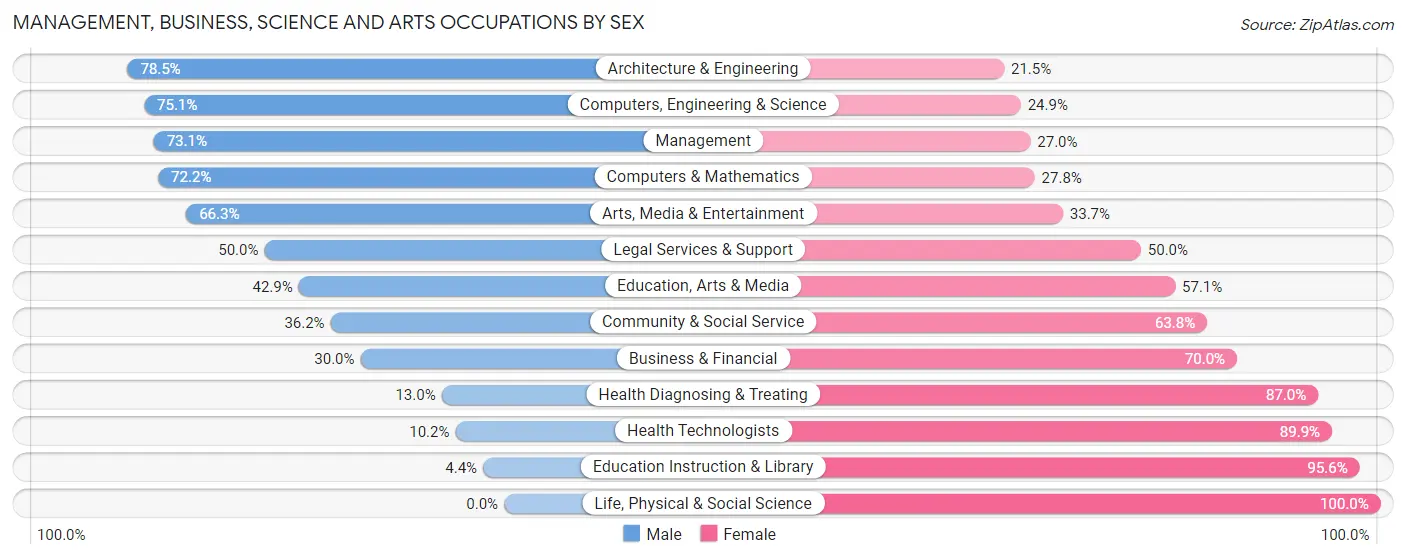
Within the Management, Business, Science and Arts occupations in Haltom City, the most male-oriented occupations are Architecture & Engineering (78.5%), Computers, Engineering & Science (75.1%), and Management (73.1%), while the most female-oriented occupations are Life, Physical & Social Science (100.0%), Education Instruction & Library (95.6%), and Health Technologists (89.8%).
| Occupation | Male | Female |
| Management | 1,095 (73.1%) | 404 (27.0%) |
| Business & Financial | 287 (30.0%) | 671 (70.0%) |
| Computers, Engineering & Science | 653 (75.1%) | 217 (24.9%) |
| Computers & Mathematics | 254 (72.2%) | 98 (27.8%) |
| Architecture & Engineering | 399 (78.5%) | 109 (21.5%) |
| Life, Physical & Social Science | 0 (0.0%) | 10 (100.0%) |
| Community & Social Service | 417 (36.2%) | 735 (63.8%) |
| Education, Arts & Media | 111 (42.9%) | 148 (57.1%) |
| Legal Services & Support | 11 (50.0%) | 11 (50.0%) |
| Education Instruction & Library | 20 (4.4%) | 436 (95.6%) |
| Arts, Media & Entertainment | 275 (66.3%) | 140 (33.7%) |
| Health Diagnosing & Treating | 63 (13.0%) | 420 (87.0%) |
| Health Technologists | 20 (10.2%) | 177 (89.8%) |
| Total (Category) | 2,515 (50.7%) | 2,447 (49.3%) |
| Total (Overall) | 12,939 (58.0%) | 9,359 (42.0%) |
Services Occupations
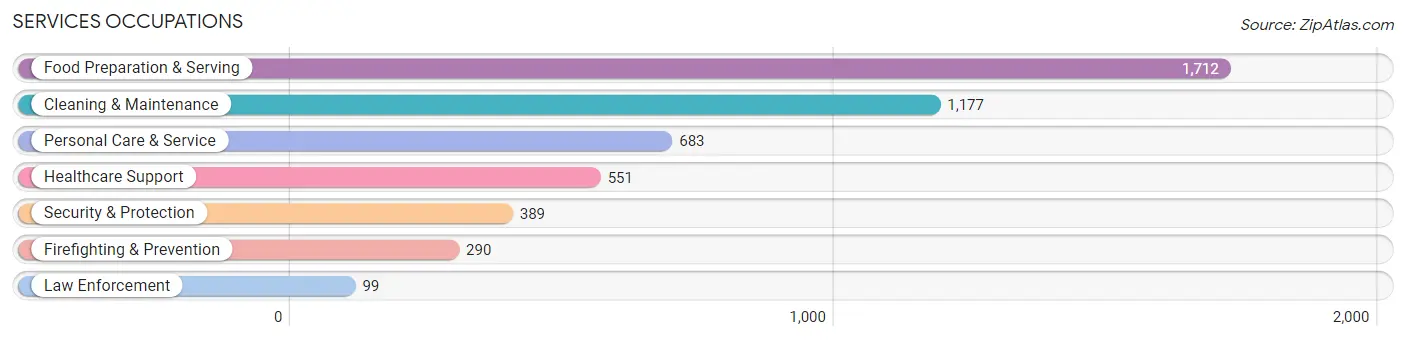
The most common Services occupations in Haltom City are Food Preparation & Serving (1,712 | 7.7%), Cleaning & Maintenance (1,177 | 5.3%), Personal Care & Service (683 | 3.1%), Healthcare Support (551 | 2.5%), and Security & Protection (389 | 1.7%).
Services Occupations by Sex
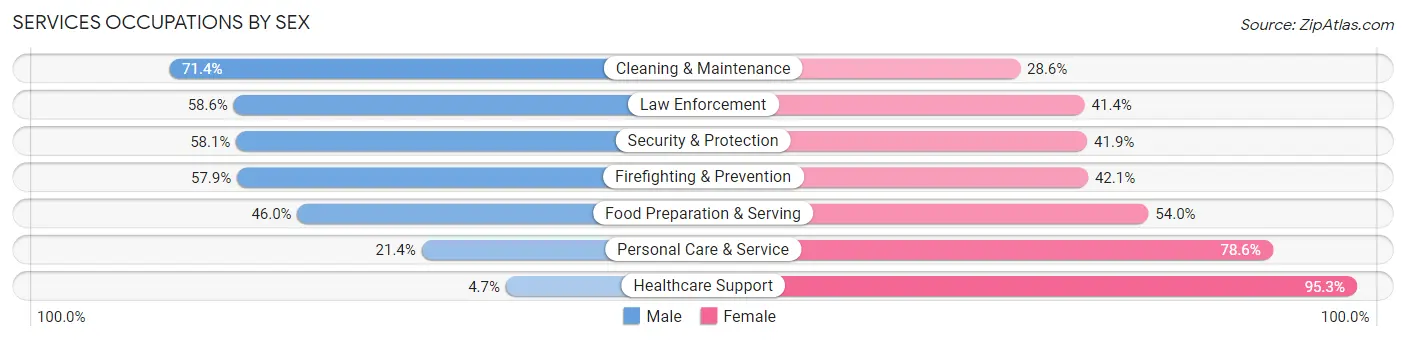
Within the Services occupations in Haltom City, the most male-oriented occupations are Cleaning & Maintenance (71.4%), Law Enforcement (58.6%), and Security & Protection (58.1%), while the most female-oriented occupations are Healthcare Support (95.3%), Personal Care & Service (78.6%), and Food Preparation & Serving (54.0%).
| Occupation | Male | Female |
| Healthcare Support | 26 (4.7%) | 525 (95.3%) |
| Security & Protection | 226 (58.1%) | 163 (41.9%) |
| Firefighting & Prevention | 168 (57.9%) | 122 (42.1%) |
| Law Enforcement | 58 (58.6%) | 41 (41.4%) |
| Food Preparation & Serving | 787 (46.0%) | 925 (54.0%) |
| Cleaning & Maintenance | 840 (71.4%) | 337 (28.6%) |
| Personal Care & Service | 146 (21.4%) | 537 (78.6%) |
| Total (Category) | 2,025 (44.9%) | 2,487 (55.1%) |
| Total (Overall) | 12,939 (58.0%) | 9,359 (42.0%) |
Sales and Office Occupations
The most common Sales and Office occupations in Haltom City are Office & Administration (3,240 | 14.5%), and Sales & Related (1,922 | 8.6%).
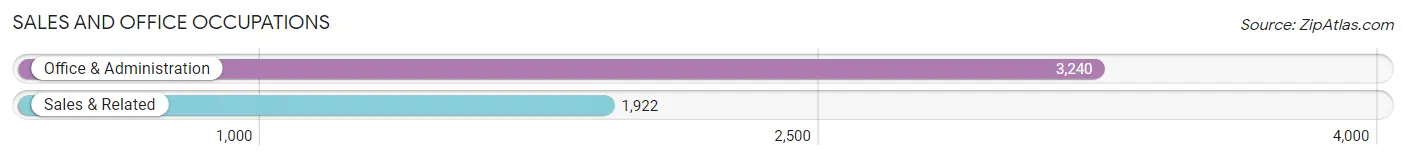
Sales and Office Occupations by Sex
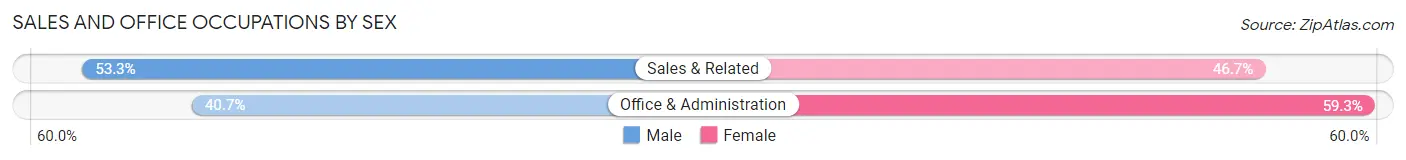
| Occupation | Male | Female |
| Sales & Related | 1,025 (53.3%) | 897 (46.7%) |
| Office & Administration | 1,318 (40.7%) | 1,922 (59.3%) |
| Total (Category) | 2,343 (45.4%) | 2,819 (54.6%) |
| Total (Overall) | 12,939 (58.0%) | 9,359 (42.0%) |
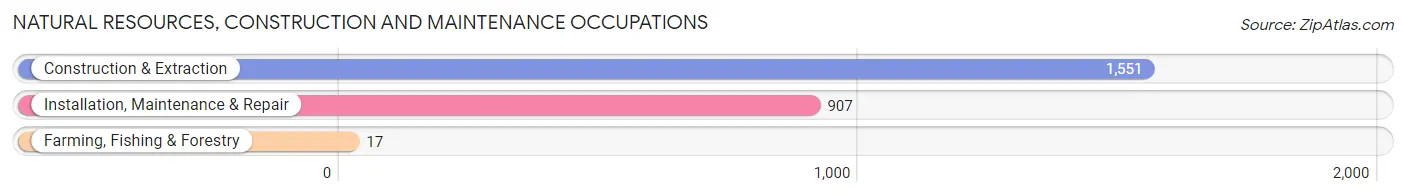
Natural Resources, Construction and Maintenance Occupations
The most common Natural Resources, Construction and Maintenance occupations in Haltom City are Construction & Extraction (1,551 | 7.0%), Installation, Maintenance & Repair (907 | 4.1%), and Farming, Fishing & Forestry (17 | 0.1%).
Natural Resources, Construction and Maintenance Occupations by Sex
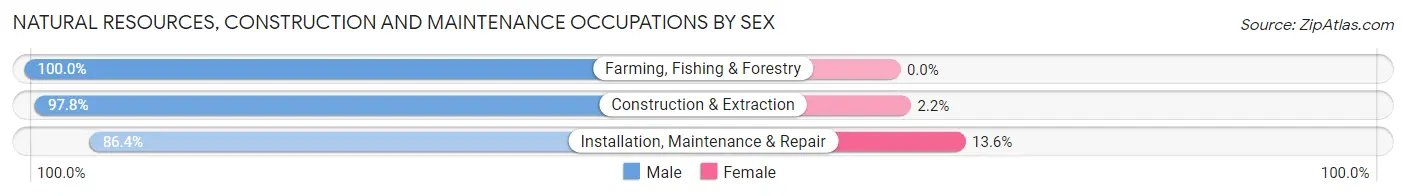
| Occupation | Male | Female |
| Farming, Fishing & Forestry | 17 (100.0%) | 0 (0.0%) |
| Construction & Extraction | 1,517 (97.8%) | 34 (2.2%) |
| Installation, Maintenance & Repair | 784 (86.4%) | 123 (13.6%) |
| Total (Category) | 2,318 (93.7%) | 157 (6.3%) |
| Total (Overall) | 12,939 (58.0%) | 9,359 (42.0%) |
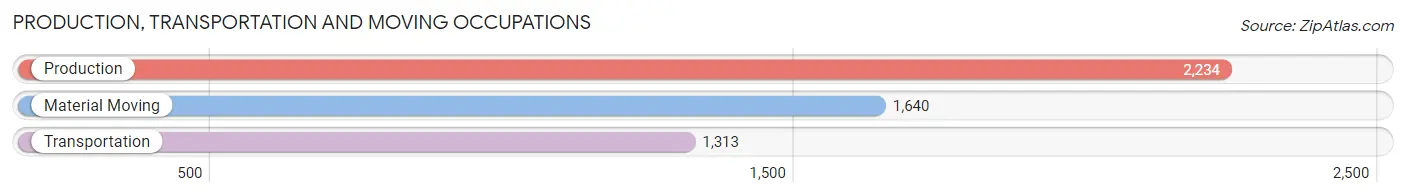
Production, Transportation and Moving Occupations
The most common Production, Transportation and Moving occupations in Haltom City are Production (2,234 | 10.0%), Material Moving (1,640 | 7.3%), and Transportation (1,313 | 5.9%).
Production, Transportation and Moving Occupations by Sex
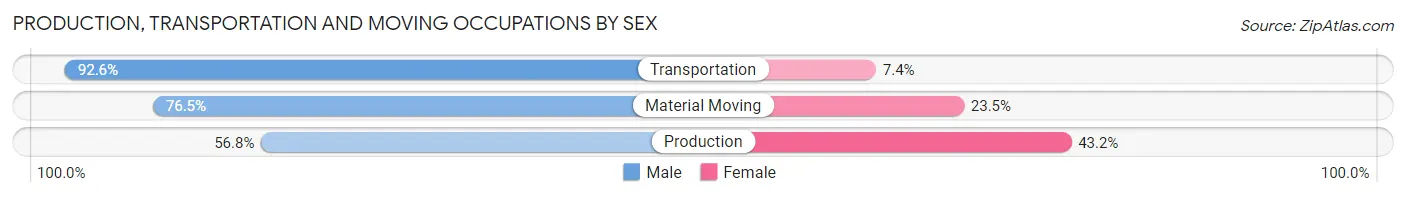
| Occupation | Male | Female |
| Production | 1,268 (56.8%) | 966 (43.2%) |
| Transportation | 1,216 (92.6%) | 97 (7.4%) |
| Material Moving | 1,254 (76.5%) | 386 (23.5%) |
| Total (Category) | 3,738 (72.1%) | 1,449 (27.9%) |
| Total (Overall) | 12,939 (58.0%) | 9,359 (42.0%) |
Employment Industries by Sex in Haltom City
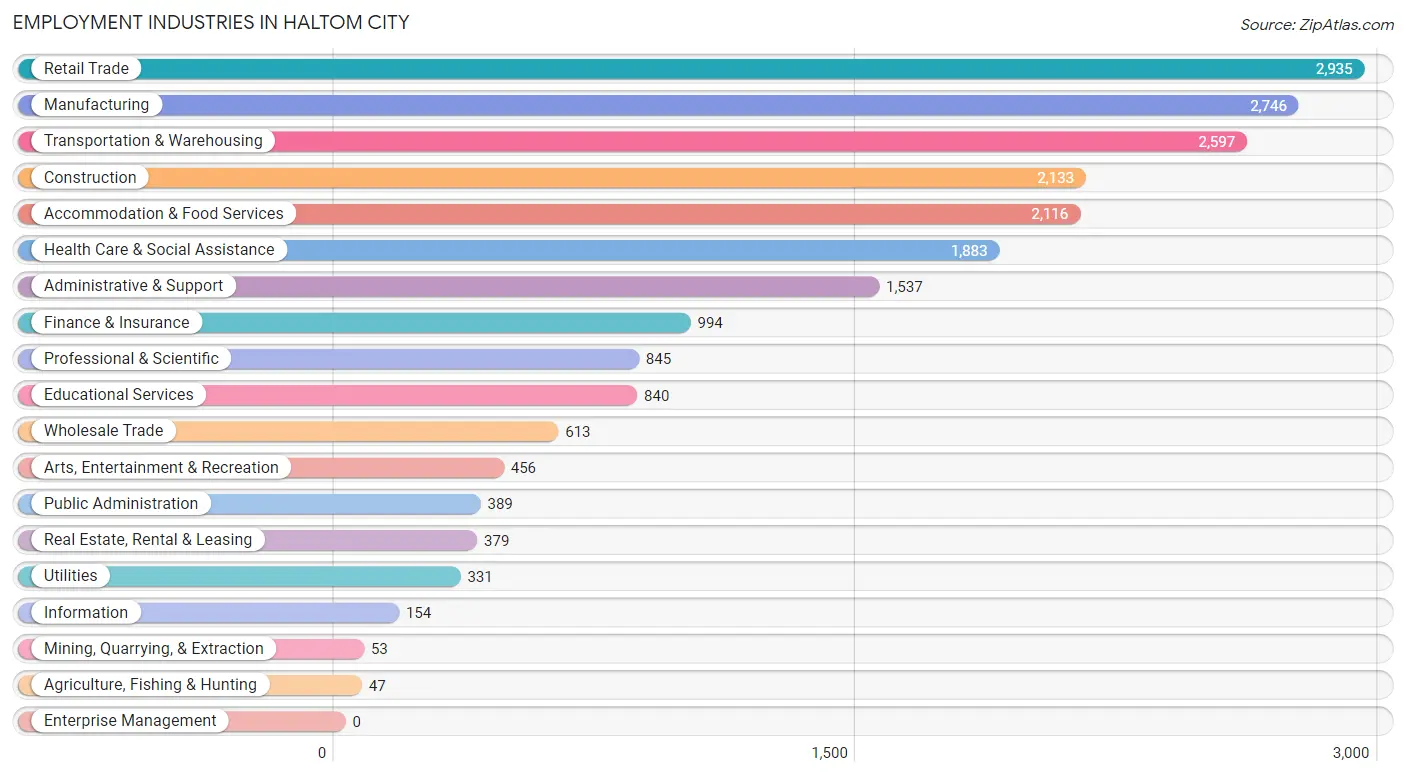
Employment Industries in Haltom City
The major employment industries in Haltom City include Retail Trade (2,935 | 13.2%), Manufacturing (2,746 | 12.3%), Transportation & Warehousing (2,597 | 11.7%), Construction (2,133 | 9.6%), and Accommodation & Food Services (2,116 | 9.5%).
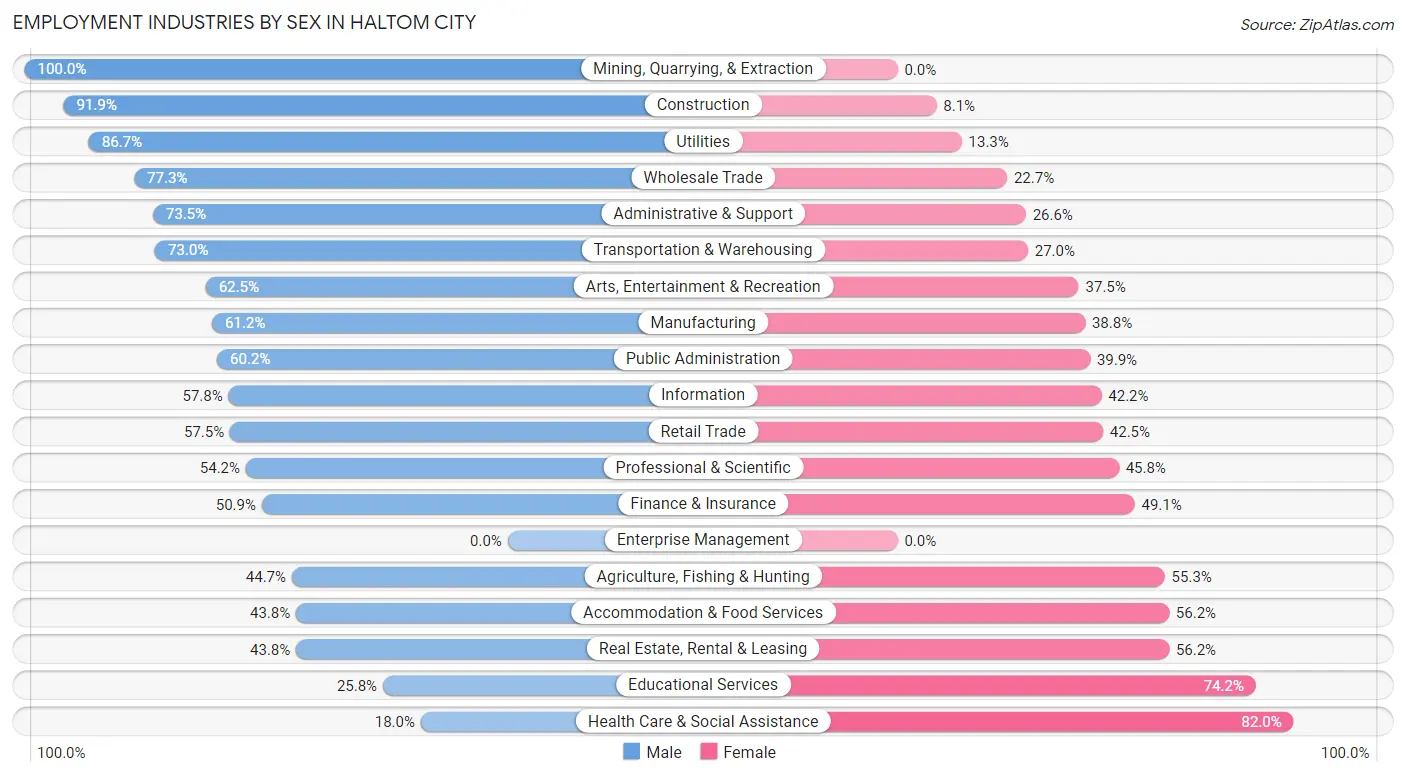
Employment Industries by Sex in Haltom City
The Haltom City industries that see more men than women are Mining, Quarrying, & Extraction (100.0%), Construction (91.9%), and Utilities (86.7%), whereas the industries that tend to have a higher number of women are Health Care & Social Assistance (82.0%), Educational Services (74.2%), and Real Estate, Rental & Leasing (56.2%).
| Industry | Male | Female |
| Agriculture, Fishing & Hunting | 21 (44.7%) | 26 (55.3%) |
| Mining, Quarrying, & Extraction | 53 (100.0%) | 0 (0.0%) |
| Construction | 1,961 (91.9%) | 172 (8.1%) |
| Manufacturing | 1,680 (61.2%) | 1,066 (38.8%) |
| Wholesale Trade | 474 (77.3%) | 139 (22.7%) |
| Retail Trade | 1,687 (57.5%) | 1,248 (42.5%) |
| Transportation & Warehousing | 1,896 (73.0%) | 701 (27.0%) |
| Utilities | 287 (86.7%) | 44 (13.3%) |
| Information | 89 (57.8%) | 65 (42.2%) |
| Finance & Insurance | 506 (50.9%) | 488 (49.1%) |
| Real Estate, Rental & Leasing | 166 (43.8%) | 213 (56.2%) |
| Professional & Scientific | 458 (54.2%) | 387 (45.8%) |
| Enterprise Management | 0 (0.0%) | 0 (0.0%) |
| Administrative & Support | 1,129 (73.5%) | 408 (26.6%) |
| Educational Services | 217 (25.8%) | 623 (74.2%) |
| Health Care & Social Assistance | 339 (18.0%) | 1,544 (82.0%) |
| Arts, Entertainment & Recreation | 285 (62.5%) | 171 (37.5%) |
| Accommodation & Food Services | 927 (43.8%) | 1,189 (56.2%) |
| Public Administration | 234 (60.2%) | 155 (39.9%) |
| Total | 12,939 (58.0%) | 9,359 (42.0%) |
Education in Haltom City
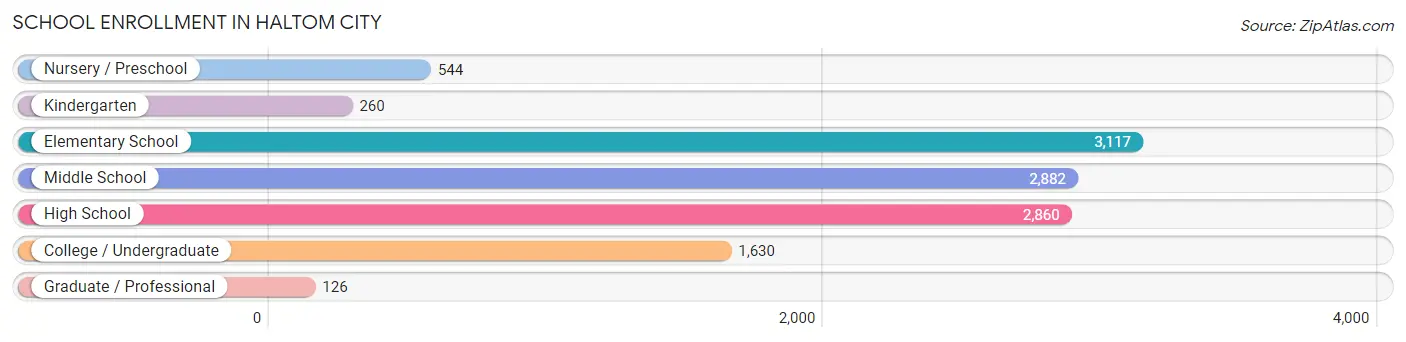
School Enrollment in Haltom City
The most common levels of schooling among the 11,419 students in Haltom City are elementary school (3,117 | 27.3%), middle school (2,882 | 25.2%), and high school (2,860 | 25.1%).
| School Level | # Students | % Students |
| Nursery / Preschool | 544 | 4.8% |
| Kindergarten | 260 | 2.3% |
| Elementary School | 3,117 | 27.3% |
| Middle School | 2,882 | 25.2% |
| High School | 2,860 | 25.1% |
| College / Undergraduate | 1,630 | 14.3% |
| Graduate / Professional | 126 | 1.1% |
| Total | 11,419 | 100.0% |
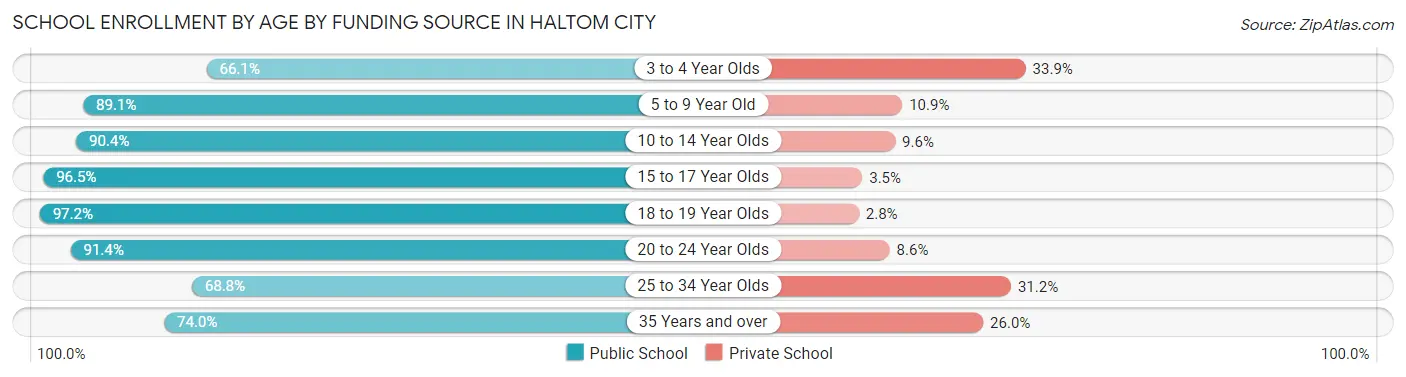
School Enrollment by Age by Funding Source in Haltom City
Out of a total of 11,419 students who are enrolled in schools in Haltom City, 1,279 (11.2%) attend a private institution, while the remaining 10,140 (88.8%) are enrolled in public schools. The age group of 3 to 4 year olds has the highest likelihood of being enrolled in private schools, with 140 (33.9% in the age bracket) enrolled. Conversely, the age group of 18 to 19 year olds has the lowest likelihood of being enrolled in a private school, with 378 (97.2% in the age bracket) attending a public institution.
| Age Bracket | Public School | Private School |
| 3 to 4 Year Olds | 273 (66.1%) | 140 (33.9%) |
| 5 to 9 Year Old | 2,760 (89.1%) | 338 (10.9%) |
| 10 to 14 Year Olds | 3,367 (90.4%) | 357 (9.6%) |
| 15 to 17 Year Olds | 1,809 (96.5%) | 65 (3.5%) |
| 18 to 19 Year Olds | 378 (97.2%) | 11 (2.8%) |
| 20 to 24 Year Olds | 854 (91.4%) | 80 (8.6%) |
| 25 to 34 Year Olds | 433 (68.8%) | 196 (31.2%) |
| 35 Years and over | 265 (74.0%) | 93 (26.0%) |
| Total | 10,140 (88.8%) | 1,279 (11.2%) |
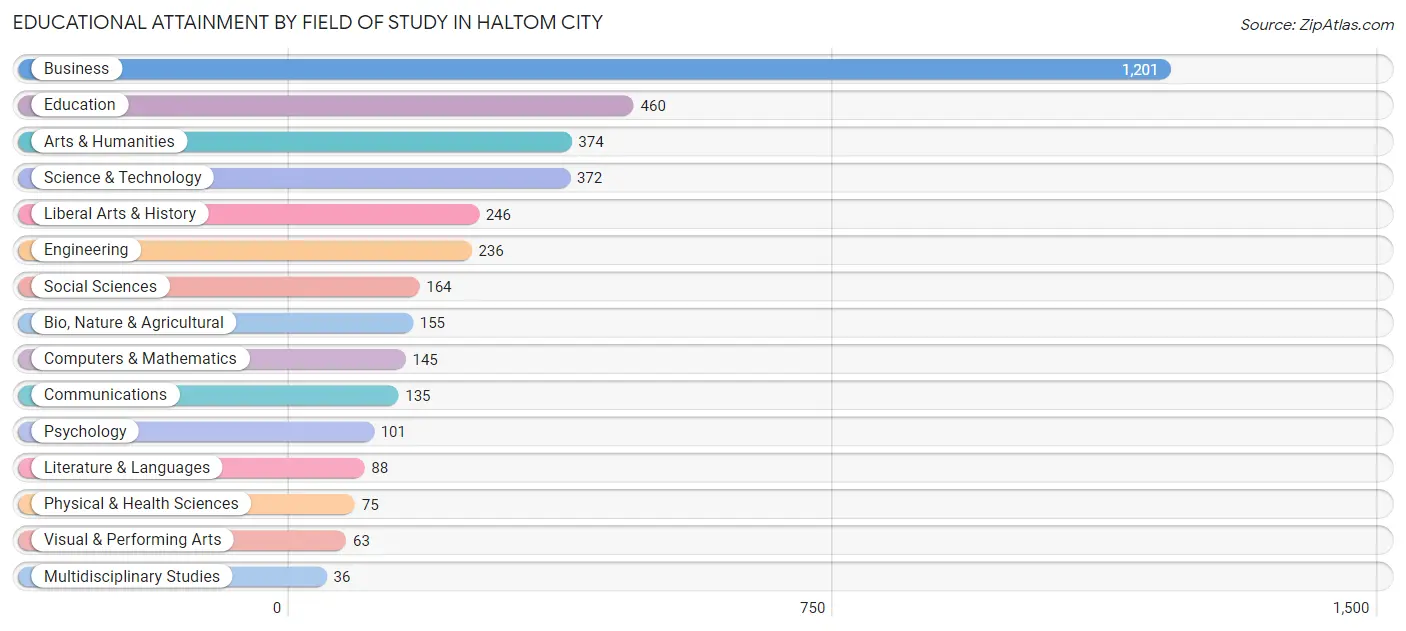
Educational Attainment by Field of Study in Haltom City
Business (1,201 | 31.2%), education (460 | 11.9%), arts & humanities (374 | 9.7%), science & technology (372 | 9.7%), and liberal arts & history (246 | 6.4%) are the most common fields of study among 3,851 individuals in Haltom City who have obtained a bachelor's degree or higher.
| Field of Study | # Graduates | % Graduates |
| Computers & Mathematics | 145 | 3.8% |
| Bio, Nature & Agricultural | 155 | 4.0% |
| Physical & Health Sciences | 75 | 1.9% |
| Psychology | 101 | 2.6% |
| Social Sciences | 164 | 4.3% |
| Engineering | 236 | 6.1% |
| Multidisciplinary Studies | 36 | 0.9% |
| Science & Technology | 372 | 9.7% |
| Business | 1,201 | 31.2% |
| Education | 460 | 11.9% |
| Literature & Languages | 88 | 2.3% |
| Liberal Arts & History | 246 | 6.4% |
| Visual & Performing Arts | 63 | 1.6% |
| Communications | 135 | 3.5% |
| Arts & Humanities | 374 | 9.7% |
| Total | 3,851 | 100.0% |
Transportation & Commute in Haltom City
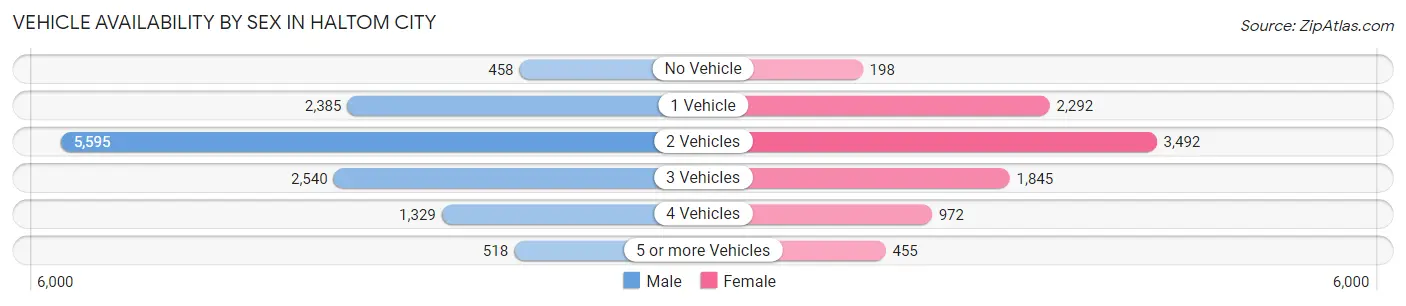
Vehicle Availability by Sex in Haltom City
The most prevalent vehicle ownership categories in Haltom City are males with 2 vehicles (5,595, accounting for 43.6%) and females with 2 vehicles (3,492, making up 60.5%).
| Vehicles Available | Male | Female |
| No Vehicle | 458 (3.6%) | 198 (2.1%) |
| 1 Vehicle | 2,385 (18.6%) | 2,292 (24.8%) |
| 2 Vehicles | 5,595 (43.6%) | 3,492 (37.7%) |
| 3 Vehicles | 2,540 (19.8%) | 1,845 (19.9%) |
| 4 Vehicles | 1,329 (10.4%) | 972 (10.5%) |
| 5 or more Vehicles | 518 (4.0%) | 455 (4.9%) |
| Total | 12,825 (100.0%) | 9,254 (100.0%) |
Commute Time in Haltom City
The most frequently occuring commute durations in Haltom City are 20 to 24 minutes (3,528 commuters, 17.1%), 15 to 19 minutes (3,291 commuters, 16.0%), and 30 to 34 minutes (3,275 commuters, 15.9%).
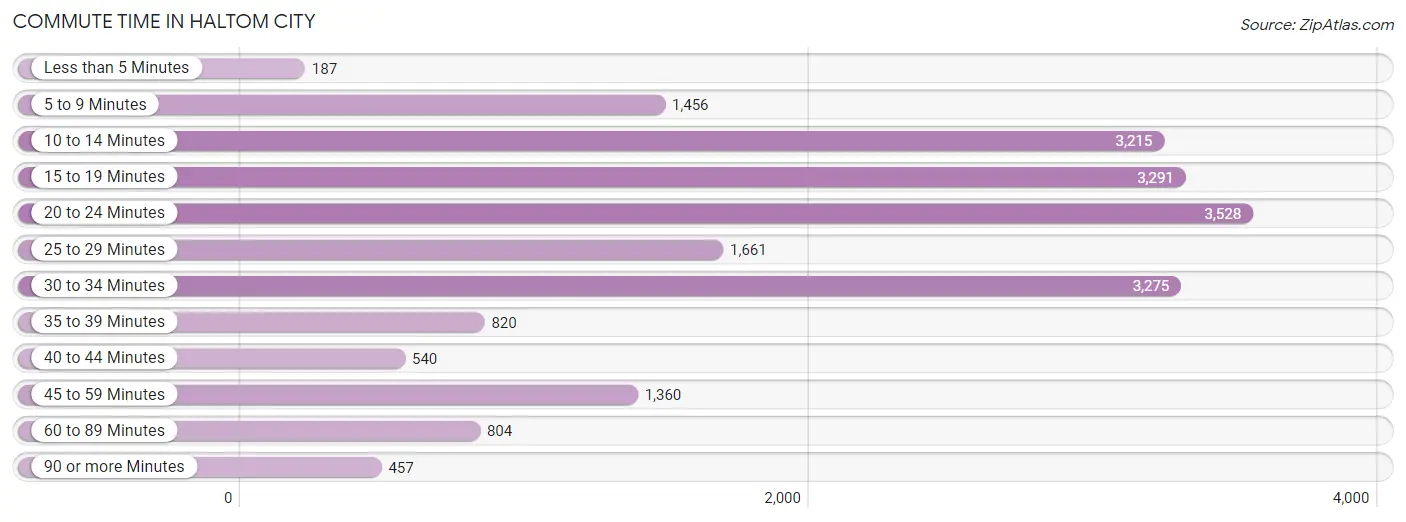
| Commute Time | # Commuters | % Commuters |
| Less than 5 Minutes | 187 | 0.9% |
| 5 to 9 Minutes | 1,456 | 7.1% |
| 10 to 14 Minutes | 3,215 | 15.6% |
| 15 to 19 Minutes | 3,291 | 16.0% |
| 20 to 24 Minutes | 3,528 | 17.1% |
| 25 to 29 Minutes | 1,661 | 8.1% |
| 30 to 34 Minutes | 3,275 | 15.9% |
| 35 to 39 Minutes | 820 | 4.0% |
| 40 to 44 Minutes | 540 | 2.6% |
| 45 to 59 Minutes | 1,360 | 6.6% |
| 60 to 89 Minutes | 804 | 3.9% |
| 90 or more Minutes | 457 | 2.2% |
Commute Time by Sex in Haltom City
The most common commute times in Haltom City are 20 to 24 minutes (2,377 commuters, 19.5%) for males and 10 to 14 minutes (1,714 commuters, 20.3%) for females.
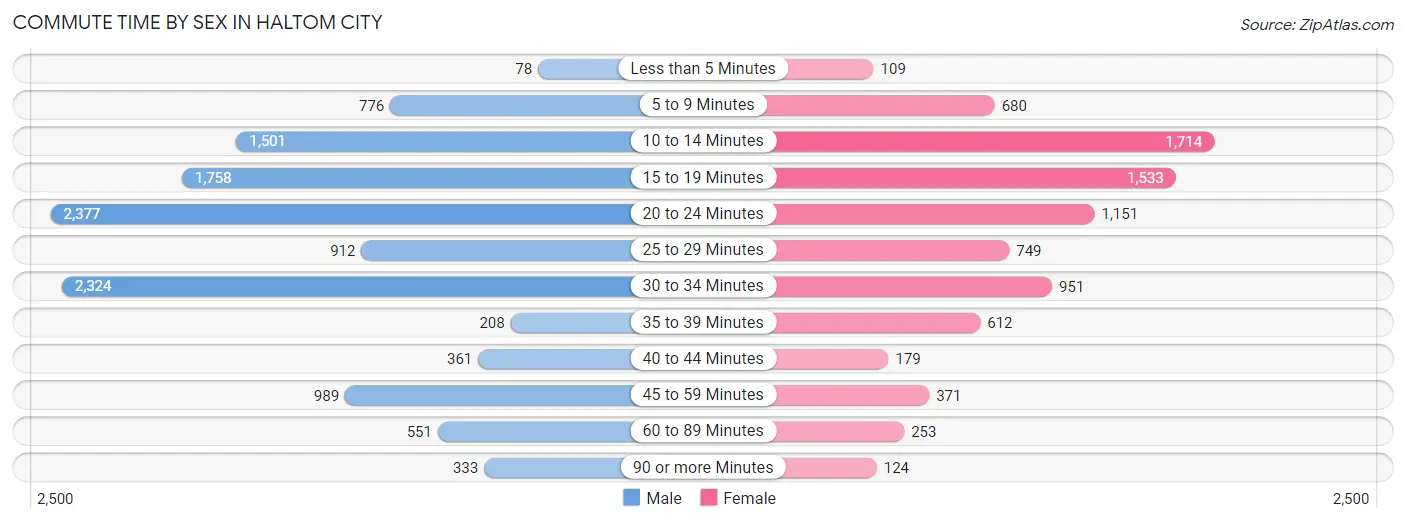
| Commute Time | Male | Female |
| Less than 5 Minutes | 78 (0.6%) | 109 (1.3%) |
| 5 to 9 Minutes | 776 (6.4%) | 680 (8.1%) |
| 10 to 14 Minutes | 1,501 (12.3%) | 1,714 (20.3%) |
| 15 to 19 Minutes | 1,758 (14.4%) | 1,533 (18.2%) |
| 20 to 24 Minutes | 2,377 (19.5%) | 1,151 (13.7%) |
| 25 to 29 Minutes | 912 (7.5%) | 749 (8.9%) |
| 30 to 34 Minutes | 2,324 (19.1%) | 951 (11.3%) |
| 35 to 39 Minutes | 208 (1.7%) | 612 (7.3%) |
| 40 to 44 Minutes | 361 (3.0%) | 179 (2.1%) |
| 45 to 59 Minutes | 989 (8.1%) | 371 (4.4%) |
| 60 to 89 Minutes | 551 (4.5%) | 253 (3.0%) |
| 90 or more Minutes | 333 (2.7%) | 124 (1.5%) |
Time of Departure to Work by Sex in Haltom City
The most frequent times of departure to work in Haltom City are 7:00 AM to 7:29 AM (1,820, 15.0%) for males and 7:30 AM to 7:59 AM (1,218, 14.5%) for females.
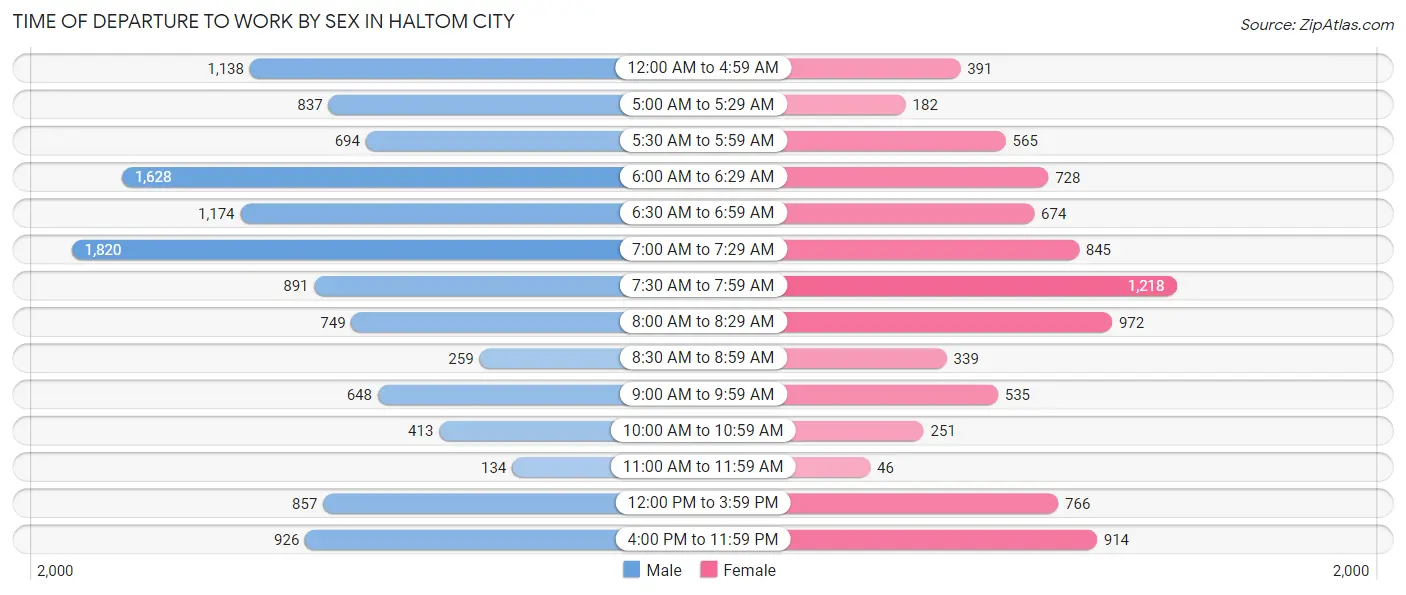
| Time of Departure | Male | Female |
| 12:00 AM to 4:59 AM | 1,138 (9.3%) | 391 (4.6%) |
| 5:00 AM to 5:29 AM | 837 (6.9%) | 182 (2.2%) |
| 5:30 AM to 5:59 AM | 694 (5.7%) | 565 (6.7%) |
| 6:00 AM to 6:29 AM | 1,628 (13.4%) | 728 (8.6%) |
| 6:30 AM to 6:59 AM | 1,174 (9.7%) | 674 (8.0%) |
| 7:00 AM to 7:29 AM | 1,820 (15.0%) | 845 (10.0%) |
| 7:30 AM to 7:59 AM | 891 (7.3%) | 1,218 (14.5%) |
| 8:00 AM to 8:29 AM | 749 (6.2%) | 972 (11.5%) |
| 8:30 AM to 8:59 AM | 259 (2.1%) | 339 (4.0%) |
| 9:00 AM to 9:59 AM | 648 (5.3%) | 535 (6.4%) |
| 10:00 AM to 10:59 AM | 413 (3.4%) | 251 (3.0%) |
| 11:00 AM to 11:59 AM | 134 (1.1%) | 46 (0.5%) |
| 12:00 PM to 3:59 PM | 857 (7.0%) | 766 (9.1%) |
| 4:00 PM to 11:59 PM | 926 (7.6%) | 914 (10.8%) |
| Total | 12,168 (100.0%) | 8,426 (100.0%) |
Housing Occupancy in Haltom City
Occupancy by Ownership in Haltom City
Of the total 16,532 dwellings in Haltom City, owner-occupied units account for 8,643 (52.3%), while renter-occupied units make up 7,889 (47.7%).
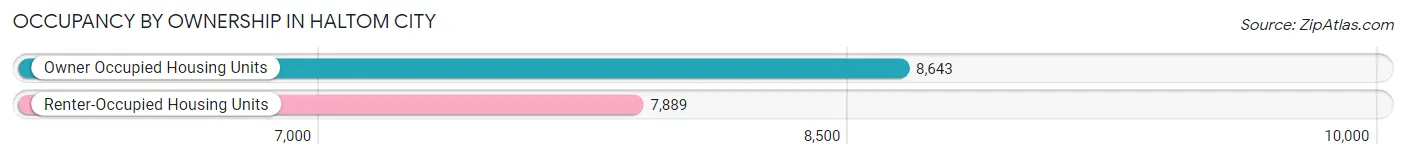
| Occupancy | # Housing Units | % Housing Units |
| Owner Occupied Housing Units | 8,643 | 52.3% |
| Renter-Occupied Housing Units | 7,889 | 47.7% |
| Total Occupied Housing Units | 16,532 | 100.0% |
Occupancy by Household Size in Haltom City
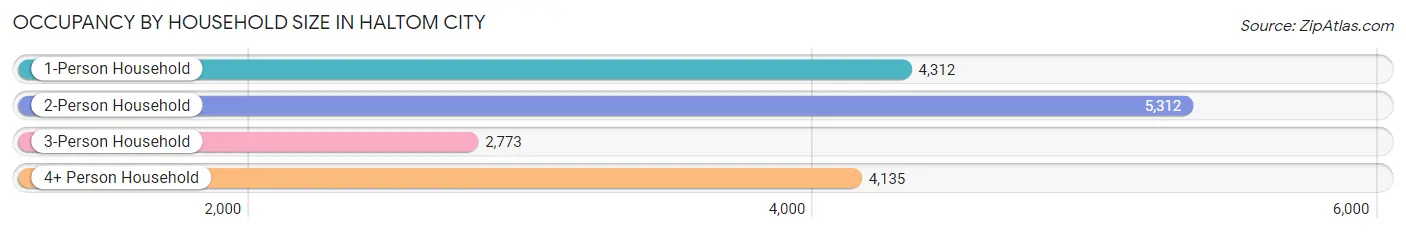
| Household Size | # Housing Units | % Housing Units |
| 1-Person Household | 4,312 | 26.1% |
| 2-Person Household | 5,312 | 32.1% |
| 3-Person Household | 2,773 | 16.8% |
| 4+ Person Household | 4,135 | 25.0% |
| Total Housing Units | 16,532 | 100.0% |
Occupancy by Ownership by Household Size in Haltom City
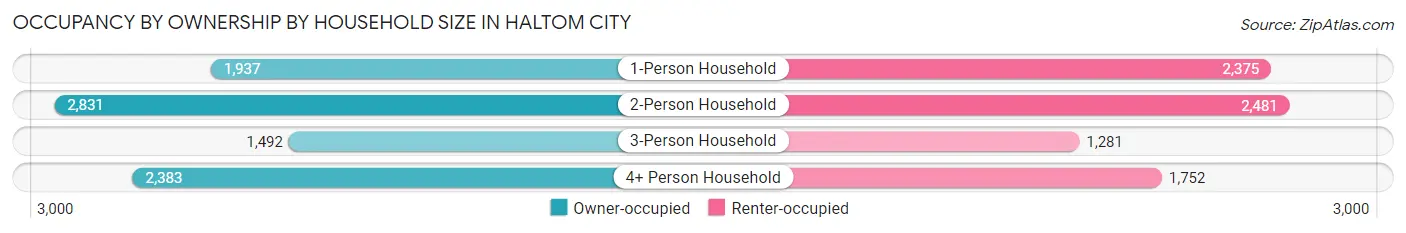
| Household Size | Owner-occupied | Renter-occupied |
| 1-Person Household | 1,937 (44.9%) | 2,375 (55.1%) |
| 2-Person Household | 2,831 (53.3%) | 2,481 (46.7%) |
| 3-Person Household | 1,492 (53.8%) | 1,281 (46.2%) |
| 4+ Person Household | 2,383 (57.6%) | 1,752 (42.4%) |
| Total Housing Units | 8,643 (52.3%) | 7,889 (47.7%) |
Occupancy by Educational Attainment in Haltom City
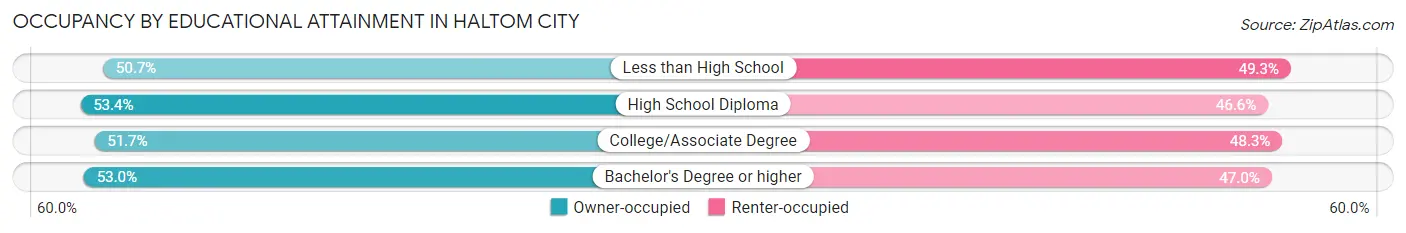
| Household Size | Owner-occupied | Renter-occupied |
| Less than High School | 1,900 (50.7%) | 1,849 (49.3%) |
| High School Diploma | 3,279 (53.4%) | 2,864 (46.6%) |
| College/Associate Degree | 2,175 (51.7%) | 2,031 (48.3%) |
| Bachelor's Degree or higher | 1,289 (53.0%) | 1,145 (47.0%) |
Occupancy by Age of Householder in Haltom City
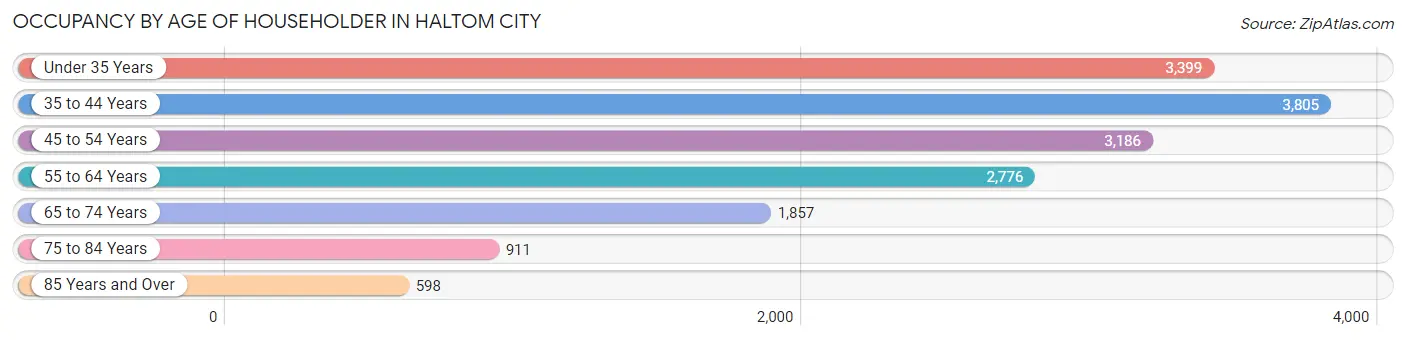
| Age Bracket | # Households | % Households |
| Under 35 Years | 3,399 | 20.6% |
| 35 to 44 Years | 3,805 | 23.0% |
| 45 to 54 Years | 3,186 | 19.3% |
| 55 to 64 Years | 2,776 | 16.8% |
| 65 to 74 Years | 1,857 | 11.2% |
| 75 to 84 Years | 911 | 5.5% |
| 85 Years and Over | 598 | 3.6% |
| Total | 16,532 | 100.0% |
Housing Finances in Haltom City
Median Income by Occupancy in Haltom City
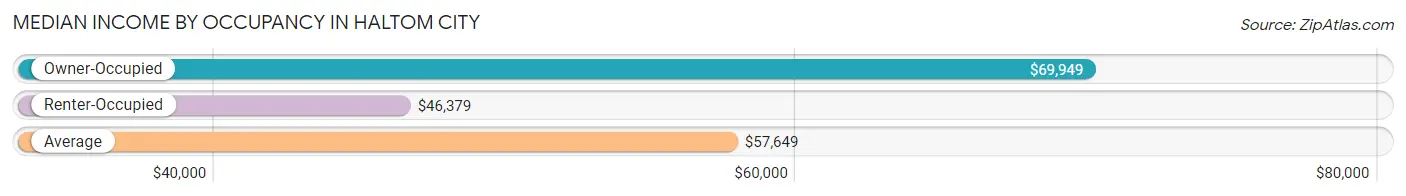
| Occupancy Type | # Households | Median Income |
| Owner-Occupied | 8,643 (52.3%) | $69,949 |
| Renter-Occupied | 7,889 (47.7%) | $46,379 |
| Average | 16,532 (100.0%) | $57,649 |
Occupancy by Householder Income Bracket in Haltom City
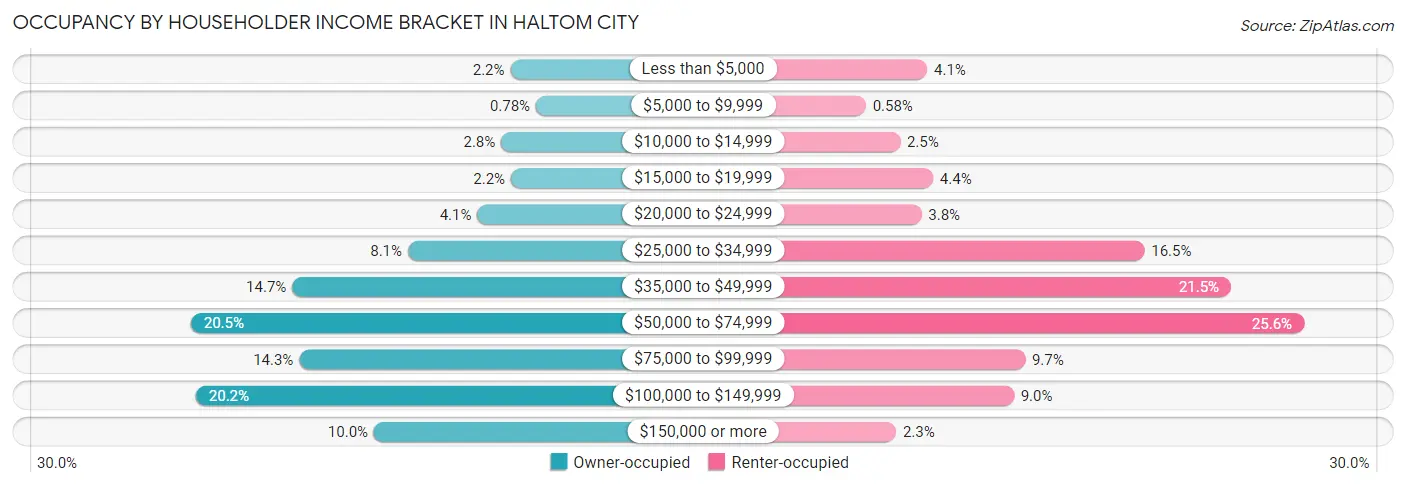
| Income Bracket | Owner-occupied | Renter-occupied |
| Less than $5,000 | 194 (2.2%) | 323 (4.1%) |
| $5,000 to $9,999 | 67 (0.8%) | 46 (0.6%) |
| $10,000 to $14,999 | 239 (2.8%) | 200 (2.5%) |
| $15,000 to $19,999 | 191 (2.2%) | 349 (4.4%) |
| $20,000 to $24,999 | 357 (4.1%) | 297 (3.8%) |
| $25,000 to $34,999 | 700 (8.1%) | 1,302 (16.5%) |
| $35,000 to $49,999 | 1,271 (14.7%) | 1,692 (21.4%) |
| $50,000 to $74,999 | 1,772 (20.5%) | 2,021 (25.6%) |
| $75,000 to $99,999 | 1,237 (14.3%) | 764 (9.7%) |
| $100,000 to $149,999 | 1,747 (20.2%) | 713 (9.0%) |
| $150,000 or more | 868 (10.0%) | 182 (2.3%) |
| Total | 8,643 (100.0%) | 7,889 (100.0%) |
Monthly Housing Cost Tiers in Haltom City
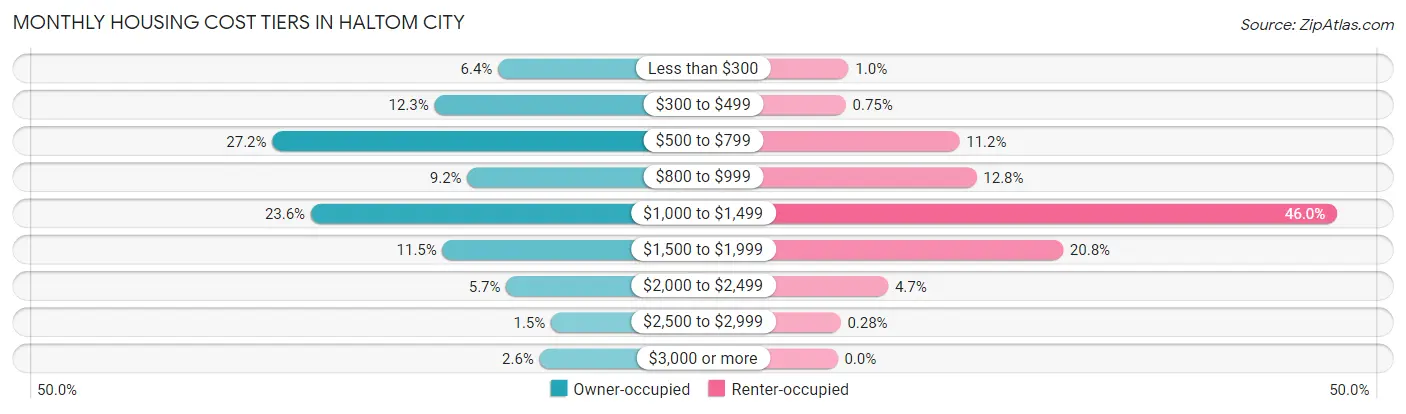
| Monthly Cost | Owner-occupied | Renter-occupied |
| Less than $300 | 553 (6.4%) | 80 (1.0%) |
| $300 to $499 | 1,060 (12.3%) | 59 (0.7%) |
| $500 to $799 | 2,350 (27.2%) | 885 (11.2%) |
| $800 to $999 | 798 (9.2%) | 1,009 (12.8%) |
| $1,000 to $1,499 | 2,043 (23.6%) | 3,629 (46.0%) |
| $1,500 to $1,999 | 996 (11.5%) | 1,638 (20.8%) |
| $2,000 to $2,499 | 488 (5.7%) | 367 (4.6%) |
| $2,500 to $2,999 | 132 (1.5%) | 22 (0.3%) |
| $3,000 or more | 223 (2.6%) | 0 (0.0%) |
| Total | 8,643 (100.0%) | 7,889 (100.0%) |
Physical Housing Characteristics in Haltom City
Housing Structures in Haltom City
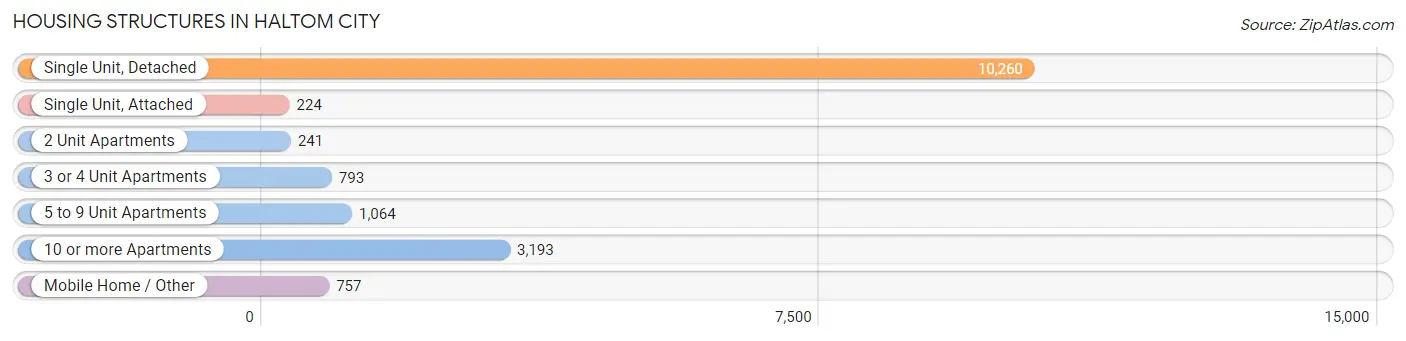
| Structure Type | # Housing Units | % Housing Units |
| Single Unit, Detached | 10,260 | 62.1% |
| Single Unit, Attached | 224 | 1.3% |
| 2 Unit Apartments | 241 | 1.5% |
| 3 or 4 Unit Apartments | 793 | 4.8% |
| 5 to 9 Unit Apartments | 1,064 | 6.4% |
| 10 or more Apartments | 3,193 | 19.3% |
| Mobile Home / Other | 757 | 4.6% |
| Total | 16,532 | 100.0% |
Housing Structures by Occupancy in Haltom City
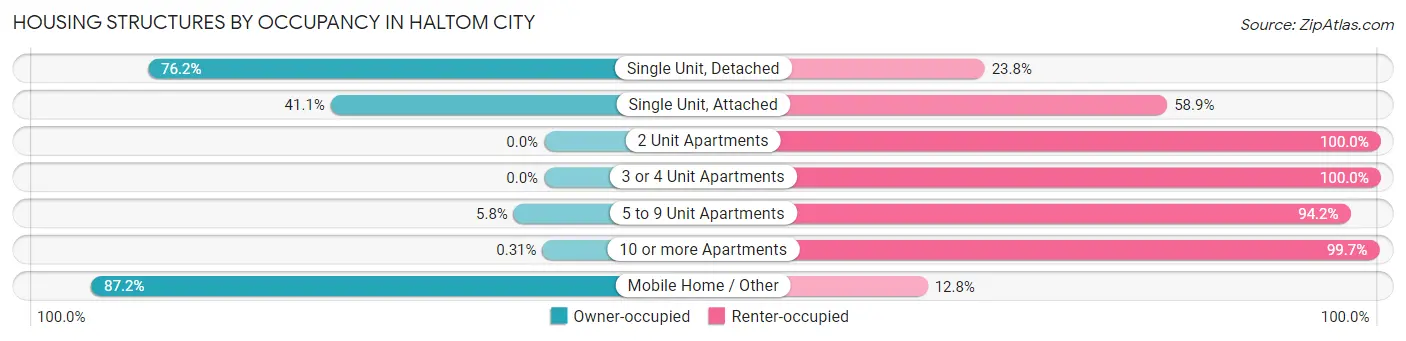
| Structure Type | Owner-occupied | Renter-occupied |
| Single Unit, Detached | 7,819 (76.2%) | 2,441 (23.8%) |
| Single Unit, Attached | 92 (41.1%) | 132 (58.9%) |
| 2 Unit Apartments | 0 (0.0%) | 241 (100.0%) |
| 3 or 4 Unit Apartments | 0 (0.0%) | 793 (100.0%) |
| 5 to 9 Unit Apartments | 62 (5.8%) | 1,002 (94.2%) |
| 10 or more Apartments | 10 (0.3%) | 3,183 (99.7%) |
| Mobile Home / Other | 660 (87.2%) | 97 (12.8%) |
| Total | 8,643 (52.3%) | 7,889 (47.7%) |
Housing Structures by Number of Rooms in Haltom City
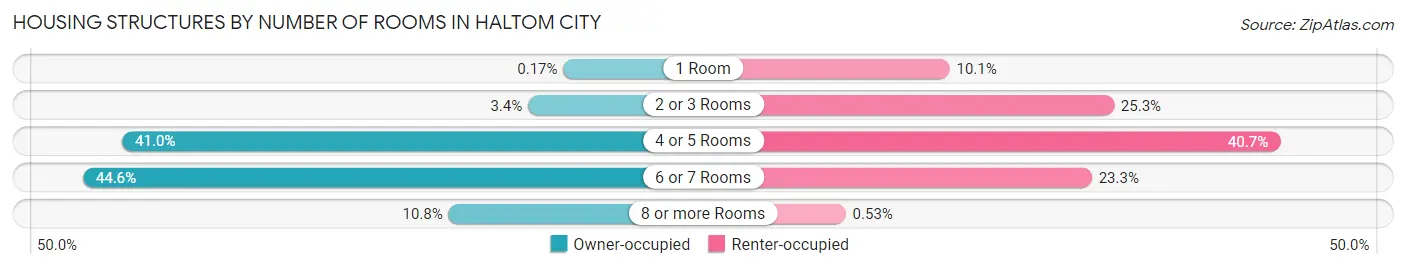
| Number of Rooms | Owner-occupied | Renter-occupied |
| 1 Room | 15 (0.2%) | 800 (10.1%) |
| 2 or 3 Rooms | 297 (3.4%) | 1,999 (25.3%) |
| 4 or 5 Rooms | 3,542 (41.0%) | 3,211 (40.7%) |
| 6 or 7 Rooms | 3,856 (44.6%) | 1,837 (23.3%) |
| 8 or more Rooms | 933 (10.8%) | 42 (0.5%) |
| Total | 8,643 (100.0%) | 7,889 (100.0%) |
Housing Structure by Heating Type in Haltom City
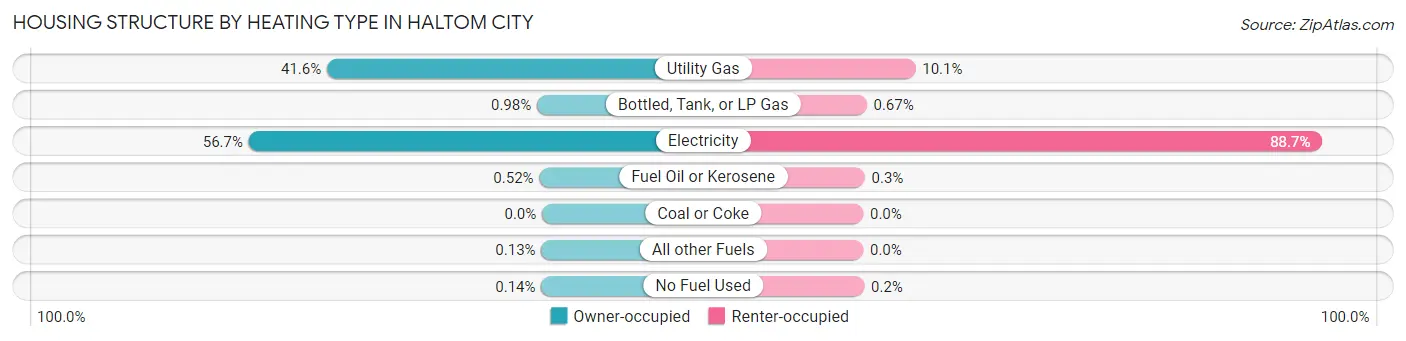
| Heating Type | Owner-occupied | Renter-occupied |
| Utility Gas | 3,591 (41.5%) | 796 (10.1%) |
| Bottled, Tank, or LP Gas | 85 (1.0%) | 53 (0.7%) |
| Electricity | 4,899 (56.7%) | 7,000 (88.7%) |
| Fuel Oil or Kerosene | 45 (0.5%) | 24 (0.3%) |
| Coal or Coke | 0 (0.0%) | 0 (0.0%) |
| All other Fuels | 11 (0.1%) | 0 (0.0%) |
| No Fuel Used | 12 (0.1%) | 16 (0.2%) |
| Total | 8,643 (100.0%) | 7,889 (100.0%) |
Household Vehicle Usage in Haltom City
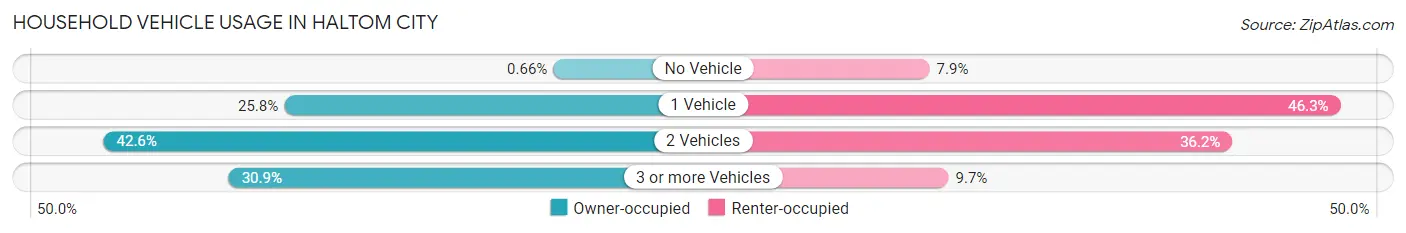
| Vehicles per Household | Owner-occupied | Renter-occupied |
| No Vehicle | 57 (0.7%) | 624 (7.9%) |
| 1 Vehicle | 2,228 (25.8%) | 3,649 (46.3%) |
| 2 Vehicles | 3,684 (42.6%) | 2,852 (36.1%) |
| 3 or more Vehicles | 2,674 (30.9%) | 764 (9.7%) |
| Total | 8,643 (100.0%) | 7,889 (100.0%) |
Real Estate & Mortgages in Haltom City
Real Estate and Mortgage Overview in Haltom City
| Characteristic | Without Mortgage | With Mortgage |
| Housing Units | 4,719 | 3,924 |
| Median Property Value | $167,000 | $187,200 |
| Median Household Income | $60,829 | $542 |
| Monthly Housing Costs | $568 | $210 |
| Real Estate Taxes | $2,165 | $41 |
Property Value by Mortgage Status in Haltom City
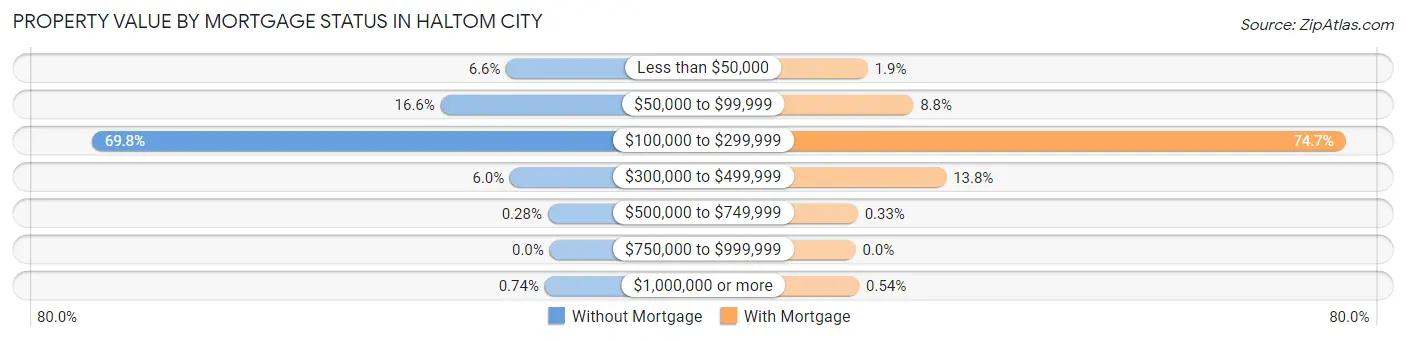
| Property Value | Without Mortgage | With Mortgage |
| Less than $50,000 | 311 (6.6%) | 73 (1.9%) |
| $50,000 to $99,999 | 784 (16.6%) | 345 (8.8%) |
| $100,000 to $299,999 | 3,292 (69.8%) | 2,930 (74.7%) |
| $300,000 to $499,999 | 284 (6.0%) | 542 (13.8%) |
| $500,000 to $749,999 | 13 (0.3%) | 13 (0.3%) |
| $750,000 to $999,999 | 0 (0.0%) | 0 (0.0%) |
| $1,000,000 or more | 35 (0.7%) | 21 (0.5%) |
| Total | 4,719 (100.0%) | 3,924 (100.0%) |
Household Income by Mortgage Status in Haltom City
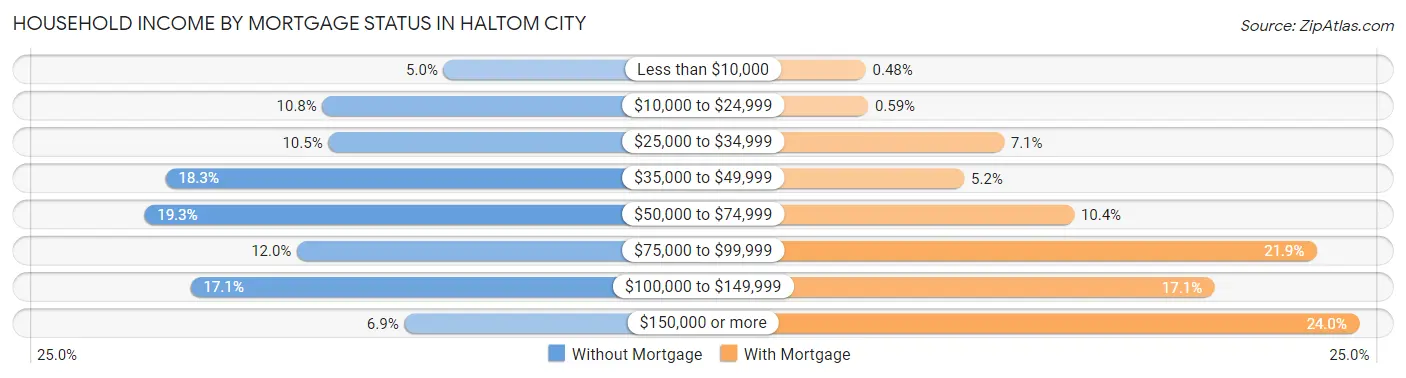
| Household Income | Without Mortgage | With Mortgage |
| Less than $10,000 | 238 (5.0%) | 19 (0.5%) |
| $10,000 to $24,999 | 510 (10.8%) | 23 (0.6%) |
| $25,000 to $34,999 | 497 (10.5%) | 277 (7.1%) |
| $35,000 to $49,999 | 863 (18.3%) | 203 (5.2%) |
| $50,000 to $74,999 | 911 (19.3%) | 408 (10.4%) |
| $75,000 to $99,999 | 567 (12.0%) | 861 (21.9%) |
| $100,000 to $149,999 | 807 (17.1%) | 670 (17.1%) |
| $150,000 or more | 326 (6.9%) | 940 (24.0%) |
| Total | 4,719 (100.0%) | 3,924 (100.0%) |
Property Value to Household Income Ratio in Haltom City
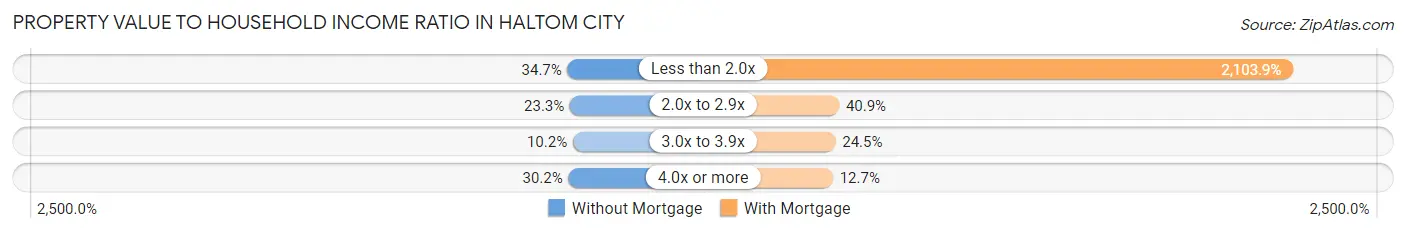
| Value-to-Income Ratio | Without Mortgage | With Mortgage |
| Less than 2.0x | 1,635 (34.6%) | 82,557 (2,103.9%) |
| 2.0x to 2.9x | 1,099 (23.3%) | 1,605 (40.9%) |
| 3.0x to 3.9x | 483 (10.2%) | 960 (24.5%) |
| 4.0x or more | 1,426 (30.2%) | 500 (12.7%) |
| Total | 4,719 (100.0%) | 3,924 (100.0%) |
Real Estate Taxes by Mortgage Status in Haltom City
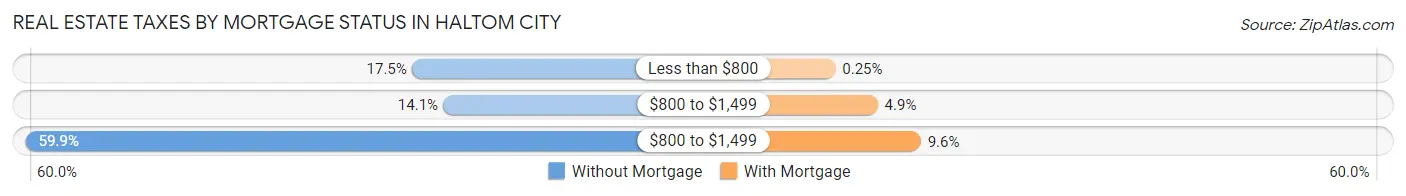
| Property Taxes | Without Mortgage | With Mortgage |
| Less than $800 | 825 (17.5%) | 10 (0.3%) |
| $800 to $1,499 | 663 (14.1%) | 192 (4.9%) |
| $800 to $1,499 | 2,826 (59.9%) | 377 (9.6%) |
| Total | 4,719 (100.0%) | 3,924 (100.0%) |
Health & Disability in Haltom City
Health Insurance Coverage by Age in Haltom City
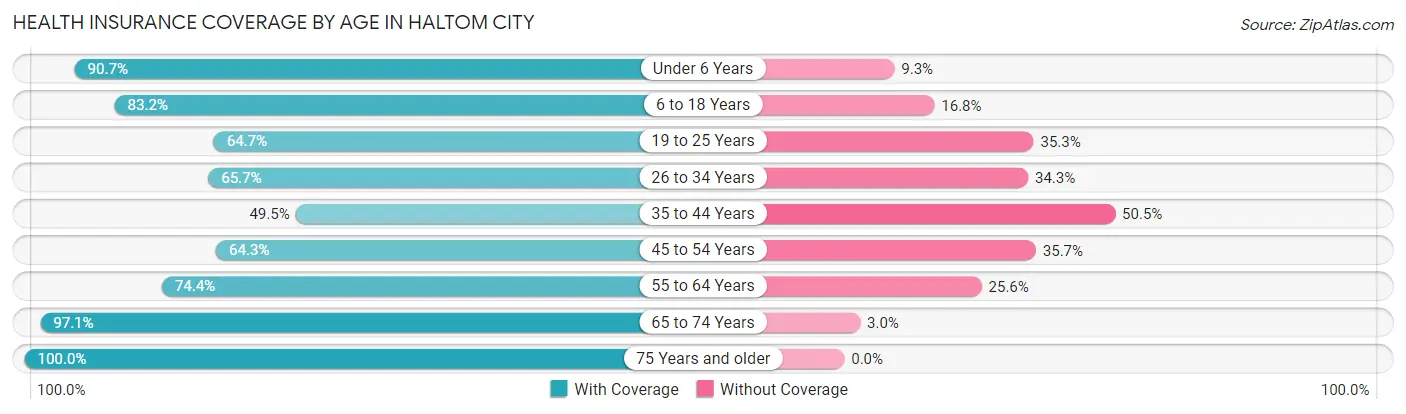
| Age Bracket | With Coverage | Without Coverage |
| Under 6 Years | 3,049 (90.7%) | 314 (9.3%) |
| 6 to 18 Years | 7,664 (83.2%) | 1,547 (16.8%) |
| 19 to 25 Years | 2,848 (64.7%) | 1,553 (35.3%) |
| 26 to 34 Years | 4,105 (65.7%) | 2,139 (34.3%) |
| 35 to 44 Years | 3,551 (49.5%) | 3,624 (50.5%) |
| 45 to 54 Years | 3,548 (64.3%) | 1,972 (35.7%) |
| 55 to 64 Years | 3,198 (74.4%) | 1,101 (25.6%) |
| 65 to 74 Years | 3,223 (97.1%) | 98 (2.9%) |
| 75 Years and older | 2,082 (100.0%) | 0 (0.0%) |
| Total | 33,268 (72.9%) | 12,348 (27.1%) |
Health Insurance Coverage by Citizenship Status in Haltom City
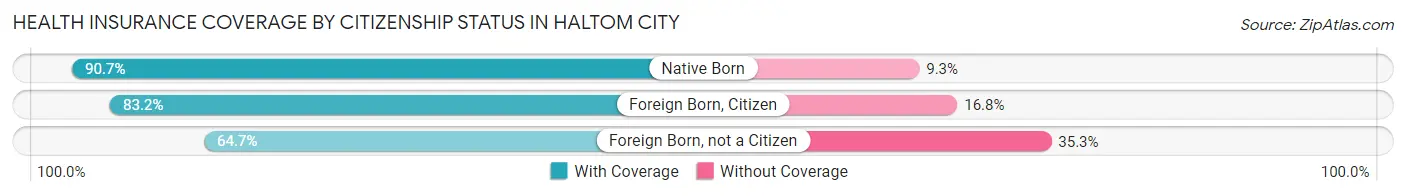
| Citizenship Status | With Coverage | Without Coverage |
| Native Born | 3,049 (90.7%) | 314 (9.3%) |
| Foreign Born, Citizen | 7,664 (83.2%) | 1,547 (16.8%) |
| Foreign Born, not a Citizen | 2,848 (64.7%) | 1,553 (35.3%) |
Health Insurance Coverage by Household Income in Haltom City
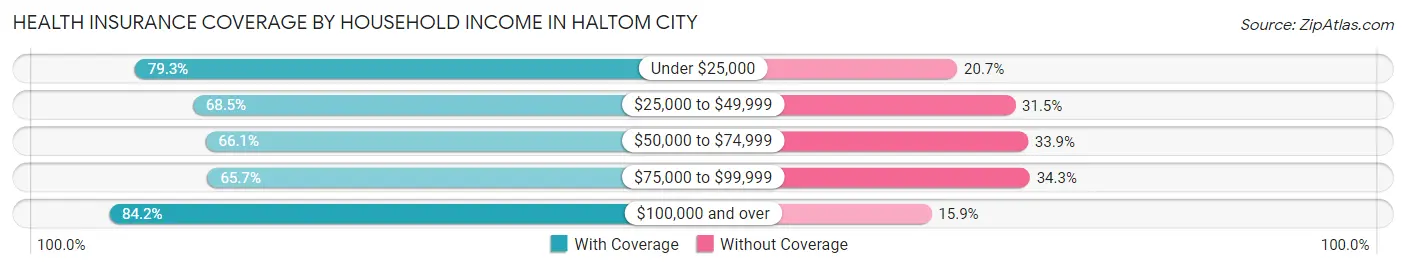
| Household Income | With Coverage | Without Coverage |
| Under $25,000 | 4,029 (79.3%) | 1,050 (20.7%) |
| $25,000 to $49,999 | 8,344 (68.5%) | 3,843 (31.5%) |
| $50,000 to $74,999 | 6,787 (66.1%) | 3,484 (33.9%) |
| $75,000 to $99,999 | 3,946 (65.7%) | 2,057 (34.3%) |
| $100,000 and over | 10,159 (84.2%) | 1,913 (15.9%) |
Public vs Private Health Insurance Coverage by Age in Haltom City
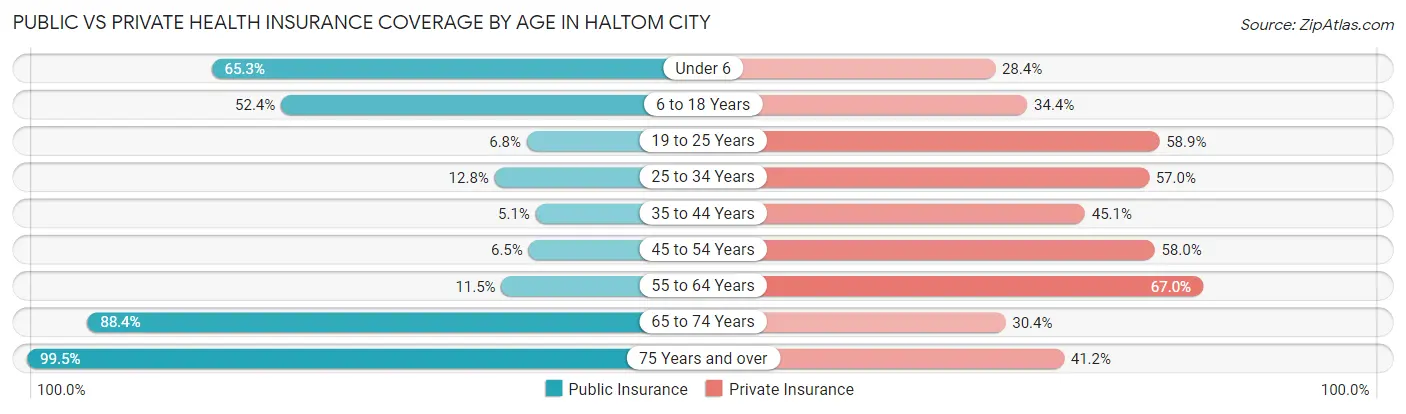
| Age Bracket | Public Insurance | Private Insurance |
| Under 6 | 2,196 (65.3%) | 956 (28.4%) |
| 6 to 18 Years | 4,826 (52.4%) | 3,169 (34.4%) |
| 19 to 25 Years | 298 (6.8%) | 2,593 (58.9%) |
| 25 to 34 Years | 796 (12.8%) | 3,557 (57.0%) |
| 35 to 44 Years | 368 (5.1%) | 3,237 (45.1%) |
| 45 to 54 Years | 356 (6.5%) | 3,204 (58.0%) |
| 55 to 64 Years | 494 (11.5%) | 2,881 (67.0%) |
| 65 to 74 Years | 2,934 (88.3%) | 1,008 (30.3%) |
| 75 Years and over | 2,072 (99.5%) | 858 (41.2%) |
| Total | 14,340 (31.4%) | 21,463 (47.0%) |
Disability Status by Sex by Age in Haltom City
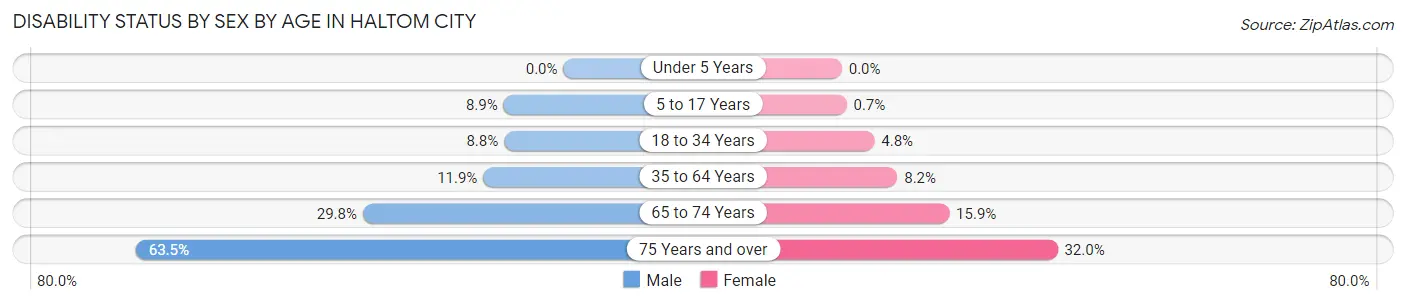
| Age Bracket | Male | Female |
| Under 5 Years | 0 (0.0%) | 0 (0.0%) |
| 5 to 17 Years | 336 (8.9%) | 36 (0.7%) |
| 18 to 34 Years | 533 (8.8%) | 252 (4.8%) |
| 35 to 64 Years | 1,066 (11.9%) | 662 (8.2%) |
| 65 to 74 Years | 492 (29.8%) | 266 (15.9%) |
| 75 Years and over | 511 (63.5%) | 409 (32.0%) |
Disability Class by Sex by Age in Haltom City
Disability Class: Hearing Difficulty
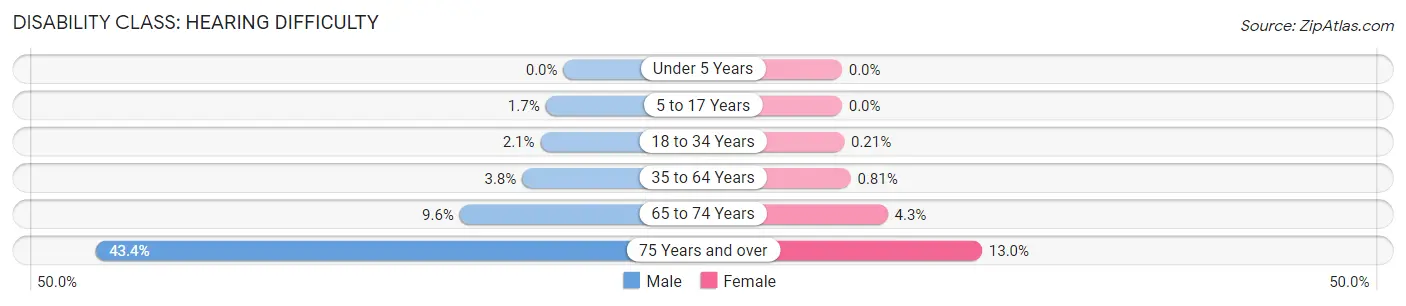
| Age Bracket | Male | Female |
| Under 5 Years | 0 (0.0%) | 0 (0.0%) |
| 5 to 17 Years | 63 (1.7%) | 0 (0.0%) |
| 18 to 34 Years | 129 (2.1%) | 11 (0.2%) |
| 35 to 64 Years | 343 (3.8%) | 65 (0.8%) |
| 65 to 74 Years | 159 (9.6%) | 71 (4.3%) |
| 75 Years and over | 349 (43.3%) | 166 (13.0%) |
Disability Class: Vision Difficulty
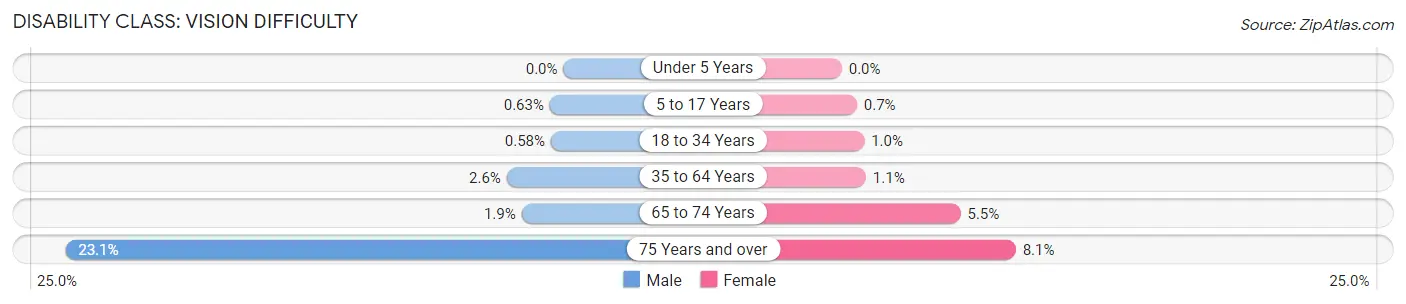
| Age Bracket | Male | Female |
| Under 5 Years | 0 (0.0%) | 0 (0.0%) |
| 5 to 17 Years | 24 (0.6%) | 36 (0.7%) |
| 18 to 34 Years | 35 (0.6%) | 54 (1.0%) |
| 35 to 64 Years | 236 (2.6%) | 90 (1.1%) |
| 65 to 74 Years | 32 (1.9%) | 92 (5.5%) |
| 75 Years and over | 186 (23.1%) | 103 (8.1%) |
Disability Class: Cognitive Difficulty
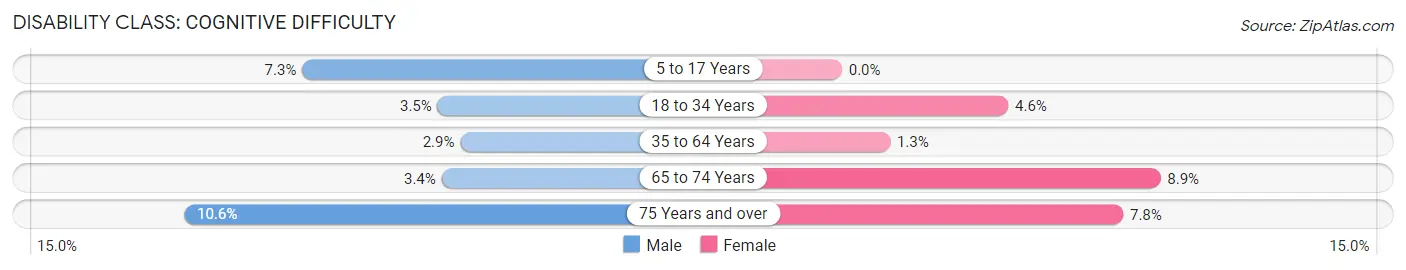
| Age Bracket | Male | Female |
| 5 to 17 Years | 275 (7.3%) | 0 (0.0%) |
| 18 to 34 Years | 212 (3.5%) | 241 (4.6%) |
| 35 to 64 Years | 257 (2.9%) | 108 (1.3%) |
| 65 to 74 Years | 56 (3.4%) | 148 (8.9%) |
| 75 Years and over | 85 (10.6%) | 100 (7.8%) |
Disability Class: Ambulatory Difficulty
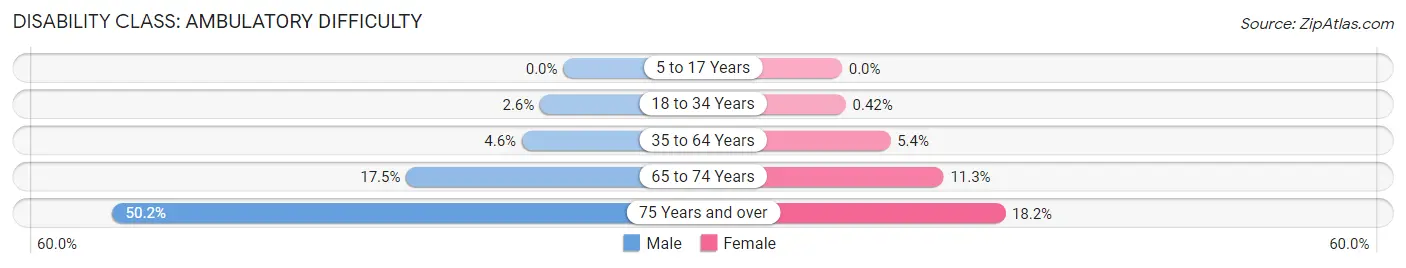
| Age Bracket | Male | Female |
| 5 to 17 Years | 0 (0.0%) | 0 (0.0%) |
| 18 to 34 Years | 157 (2.6%) | 22 (0.4%) |
| 35 to 64 Years | 413 (4.6%) | 433 (5.4%) |
| 65 to 74 Years | 289 (17.5%) | 189 (11.3%) |
| 75 Years and over | 404 (50.2%) | 232 (18.2%) |
Disability Class: Self-Care Difficulty
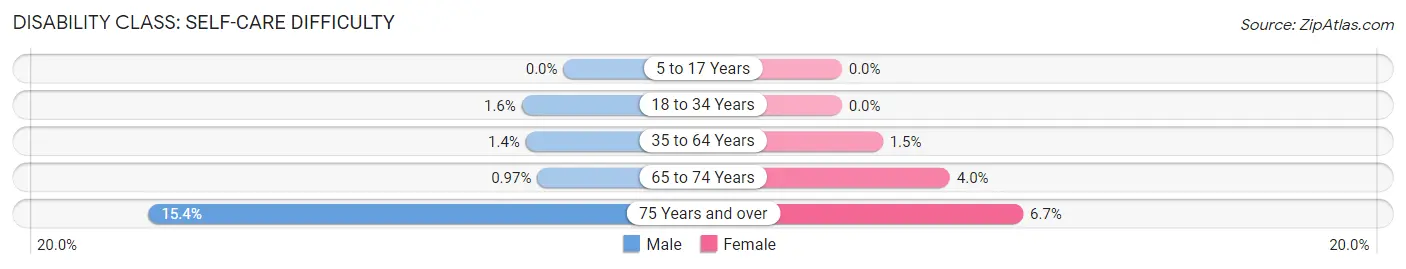
| Age Bracket | Male | Female |
| 5 to 17 Years | 0 (0.0%) | 0 (0.0%) |
| 18 to 34 Years | 94 (1.5%) | 0 (0.0%) |
| 35 to 64 Years | 125 (1.4%) | 122 (1.5%) |
| 65 to 74 Years | 16 (1.0%) | 67 (4.0%) |
| 75 Years and over | 124 (15.4%) | 86 (6.7%) |
Technology Access in Haltom City
Computing Device Access in Haltom City
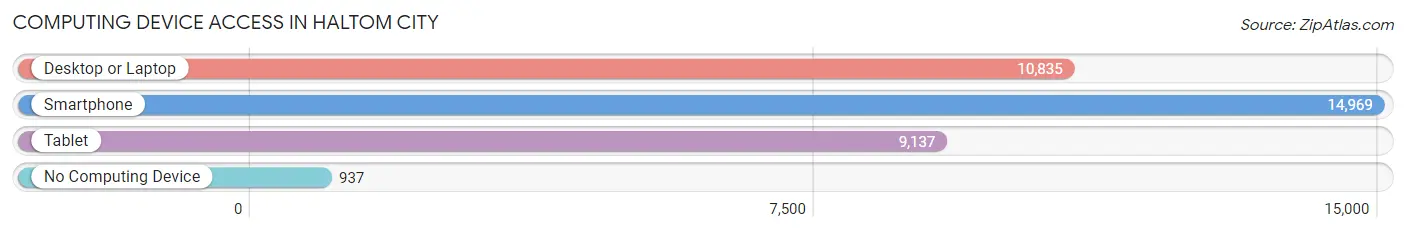
| Device Type | # Households | % Households |
| Desktop or Laptop | 10,835 | 65.5% |
| Smartphone | 14,969 | 90.5% |
| Tablet | 9,137 | 55.3% |
| No Computing Device | 937 | 5.7% |
| Total | 16,532 | 100.0% |
Internet Access in Haltom City
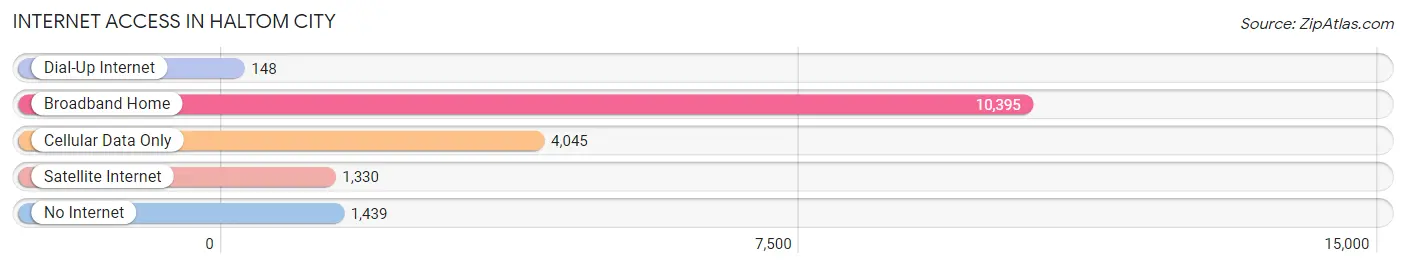
| Internet Type | # Households | % Households |
| Dial-Up Internet | 148 | 0.9% |
| Broadband Home | 10,395 | 62.9% |
| Cellular Data Only | 4,045 | 24.5% |
| Satellite Internet | 1,330 | 8.1% |
| No Internet | 1,439 | 8.7% |
| Total | 16,532 | 100.0% |
Haltom City Summary
Haltom City is a city located in Tarrant County, Texas, United States. It is part of the Dallas-Fort Worth-Arlington metropolitan area. The population was 42,409 at the 2010 census.
History
Haltom City was founded in 1949 by William Haltom, a local rancher and businessman. The city was named after him. The city was incorporated in 1953 and has grown steadily since then.
Geography
Haltom City is located at 32°48'17" North, 97°17'45" West (32.804722, -97.295833). It is situated in the northeast corner of Tarrant County, approximately 10 miles from downtown Fort Worth. The city is bordered by Watauga to the north, North Richland Hills to the east, Richland Hills to the south, and Fort Worth to the west.
The city has a total area of 8.3 square miles, all of which is land. The terrain is mostly flat, with some rolling hills in the western part of the city.
Economy
Haltom City is home to a variety of businesses, including manufacturing, retail, and service industries. The city is also home to several large employers, including Bell Helicopter, Lockheed Martin, and the University of Texas at Arlington.
The median household income in Haltom City is $45,845, and the median family income is $54,845. The per capita income is $22,845.
Demographics
As of the 2010 census, there were 42,409 people, 16,845 households, and 11,845 families residing in the city. The population density was 5,093.3 people per square mile. The racial makeup of the city was 68.2% White, 11.3% African American, 0.7% Native American, 5.2% Asian, 0.1% Pacific Islander, 11.7% from other races, and 3.0% from two or more races. Hispanic or Latino of any race were 24.3% of the population.
The median age in Haltom City is 33.7 years. About 24.3% of residents are under the age of 18, and 11.2% are 65 years of age or older. The gender makeup of the city is 48.7% male and 51.3% female.
Conclusion
Haltom City is a city located in Tarrant County, Texas, United States. It is part of the Dallas-Fort Worth-Arlington metropolitan area. The population was 42,409 at the 2010 census. The city was founded in 1949 by William Haltom, a local rancher and businessman. The city is bordered by Watauga to the north, North Richland Hills to the east, Richland Hills to the south, and Fort Worth to the west. The city has a variety of businesses, including manufacturing, retail, and service industries. The median household income in Haltom City is $45,845, and the median family income is $54,845. The racial makeup of the city is 68.2% White, 11.3% African American, 0.7% Native American, 5.2% Asian, 0.1% Pacific Islander, 11.7% from other races, and 3.0% from two or more races. The median age in Haltom City is 33.7 years.
Common Questions
What is Per Capita Income in Haltom City?
Per Capita income in Haltom City is $26,581.
What is the Median Family Income in Haltom City?
Median Family Income in Haltom City is $65,333.
What is the Median Household income in Haltom City?
Median Household Income in Haltom City is $57,649.
What is Income or Wage Gap in Haltom City?
Income or Wage Gap in Haltom City is 30.8%.
Women in Haltom City earn 69.2 cents for every dollar earned by a man.
What is Family Income Deficit in Haltom City?
Family Income Deficit in Haltom City is $12,198.
Families that are below poverty line in Haltom City earn $12,198 less on average than the poverty threshold level.
What is Inequality or Gini Index in Haltom City?
Inequality or Gini Index in Haltom City is 0.40.
What is the Total Population of Haltom City?
Total Population of Haltom City is 45,771.
What is the Total Male Population of Haltom City?
Total Male Population of Haltom City is 22,631.
What is the Total Female Population of Haltom City?
Total Female Population of Haltom City is 23,140.
What is the Ratio of Males per 100 Females in Haltom City?
There are 97.80 Males per 100 Females in Haltom City.
What is the Ratio of Females per 100 Males in Haltom City?
There are 102.25 Females per 100 Males in Haltom City.
What is the Median Population Age in Haltom City?
Median Population Age in Haltom City is 34.6 Years.
What is the Average Family Size in Haltom City
Average Family Size in Haltom City is 3.4 People.
What is the Average Household Size in Haltom City
Average Household Size in Haltom City is 2.8 People.
How Large is the Labor Force in Haltom City?
There are 23,212 People in the Labor Forcein in Haltom City.
What is the Percentage of People in the Labor Force in Haltom City?
66.3% of People are in the Labor Force in Haltom City.
What is the Unemployment Rate in Haltom City?
Unemployment Rate in Haltom City is 3.8%.