Wausau, WI Map & Demographics
Wausau Map
Wausau Overview
$34,641
PER CAPITA INCOME
$79,015
AVG FAMILY INCOME
$59,259
AVG HOUSEHOLD INCOME
18.5%
WAGE / INCOME GAP [ % ]
81.5¢/ $1
WAGE / INCOME GAP [ $ ]
$11,463
FAMILY INCOME DEFICIT
0.45
INEQUALITY / GINI INDEX
39,906
TOTAL POPULATION
19,524
MALE POPULATION
20,382
FEMALE POPULATION
95.79
MALES / 100 FEMALES
104.39
FEMALES / 100 MALES
38.6
MEDIAN AGE
3.0
AVG FAMILY SIZE
2.2
AVG HOUSEHOLD SIZE
20,591
LABOR FORCE [ PEOPLE ]
63.9%
PERCENT IN LABOR FORCE
4.5%
UNEMPLOYMENT RATE
Wausau Area Codes
Income in Wausau
Income Overview in Wausau
Per Capita Income in Wausau is $34,641, while median incomes of families and households are $79,015 and $59,259 respectively.
| Characteristic | Number | Measure |
| Per Capita Income | 39,906 | $34,641 |
| Median Family Income | 9,424 | $79,015 |
| Mean Family Income | 9,424 | $97,037 |
| Median Household Income | 17,300 | $59,259 |
| Mean Household Income | 17,300 | $78,497 |
| Income Deficit | 9,424 | $11,463 |
| Wage / Income Gap (%) | 39,906 | 18.45% |
| Wage / Income Gap ($) | 39,906 | 81.55¢ per $1 |
| Gini / Inequality Index | 39,906 | 0.45 |
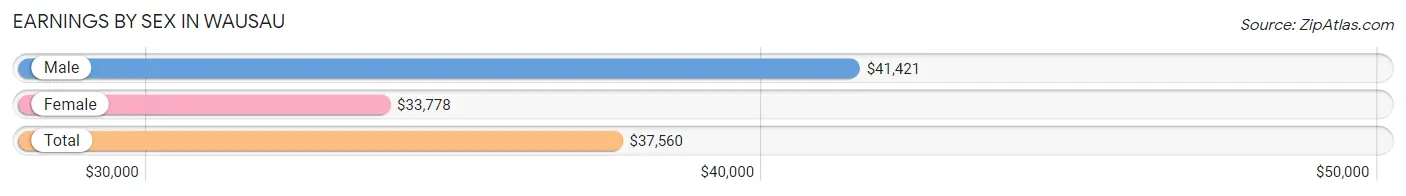
Earnings by Sex in Wausau
Average Earnings in Wausau are $37,560, $41,421 for men and $33,778 for women, a difference of 18.4%.
| Sex | Number | Average Earnings |
| Male | 11,278 (52.0%) | $41,421 |
| Female | 10,415 (48.0%) | $33,778 |
| Total | 21,693 (100.0%) | $37,560 |
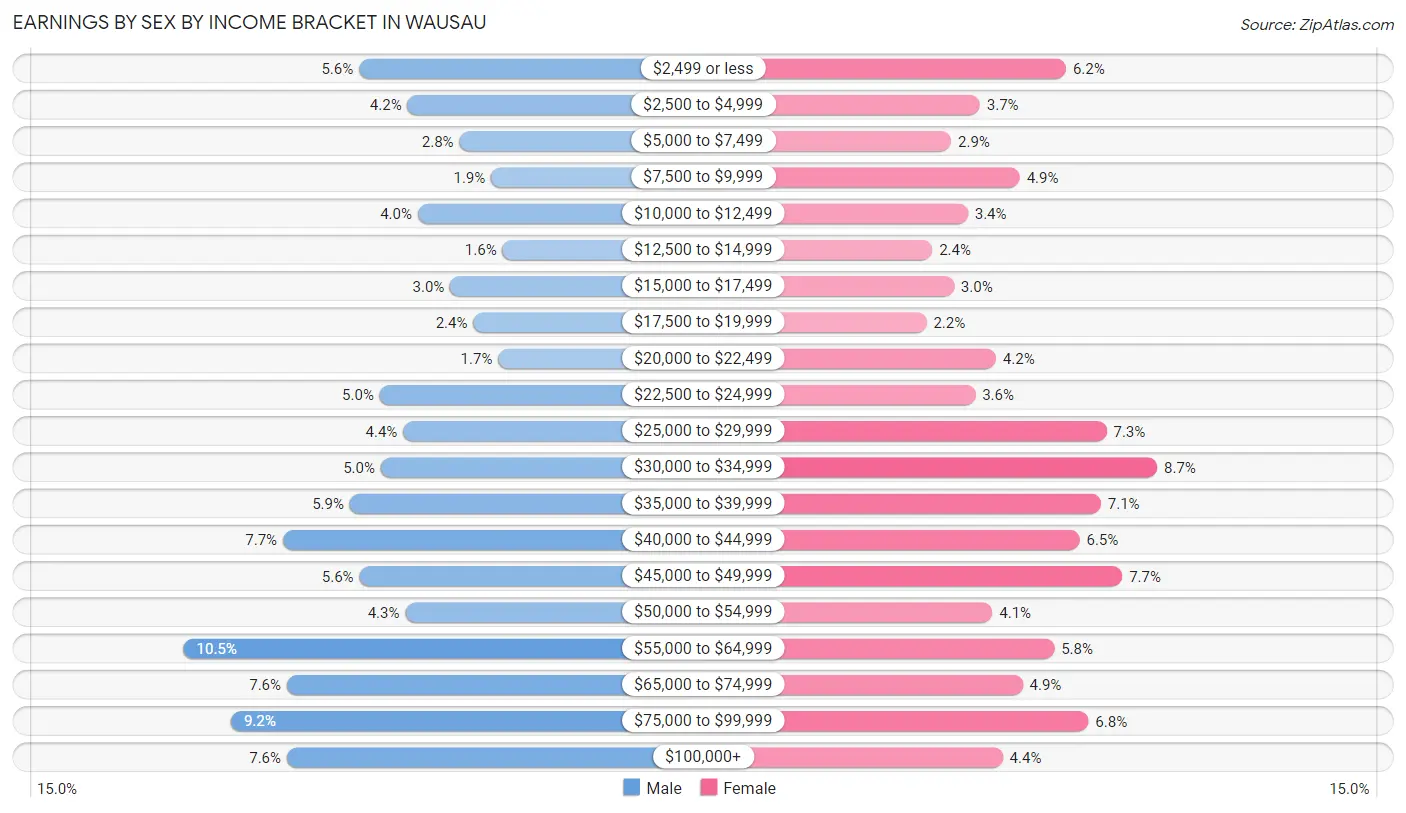
Earnings by Sex by Income Bracket in Wausau
The most common earnings brackets in Wausau are $55,000 to $64,999 for men (1,188 | 10.5%) and $30,000 to $34,999 for women (908 | 8.7%).
| Income | Male | Female |
| $2,499 or less | 632 (5.6%) | 642 (6.2%) |
| $2,500 to $4,999 | 478 (4.2%) | 390 (3.7%) |
| $5,000 to $7,499 | 314 (2.8%) | 305 (2.9%) |
| $7,500 to $9,999 | 213 (1.9%) | 506 (4.9%) |
| $10,000 to $12,499 | 445 (4.0%) | 354 (3.4%) |
| $12,500 to $14,999 | 177 (1.6%) | 250 (2.4%) |
| $15,000 to $17,499 | 343 (3.0%) | 313 (3.0%) |
| $17,500 to $19,999 | 269 (2.4%) | 233 (2.2%) |
| $20,000 to $22,499 | 191 (1.7%) | 436 (4.2%) |
| $22,500 to $24,999 | 566 (5.0%) | 376 (3.6%) |
| $25,000 to $29,999 | 492 (4.4%) | 760 (7.3%) |
| $30,000 to $34,999 | 563 (5.0%) | 908 (8.7%) |
| $35,000 to $39,999 | 661 (5.9%) | 744 (7.1%) |
| $40,000 to $44,999 | 873 (7.7%) | 681 (6.5%) |
| $45,000 to $49,999 | 630 (5.6%) | 806 (7.7%) |
| $50,000 to $54,999 | 485 (4.3%) | 426 (4.1%) |
| $55,000 to $64,999 | 1,188 (10.5%) | 607 (5.8%) |
| $65,000 to $74,999 | 860 (7.6%) | 515 (4.9%) |
| $75,000 to $99,999 | 1,038 (9.2%) | 707 (6.8%) |
| $100,000+ | 860 (7.6%) | 456 (4.4%) |
| Total | 11,278 (100.0%) | 10,415 (100.0%) |
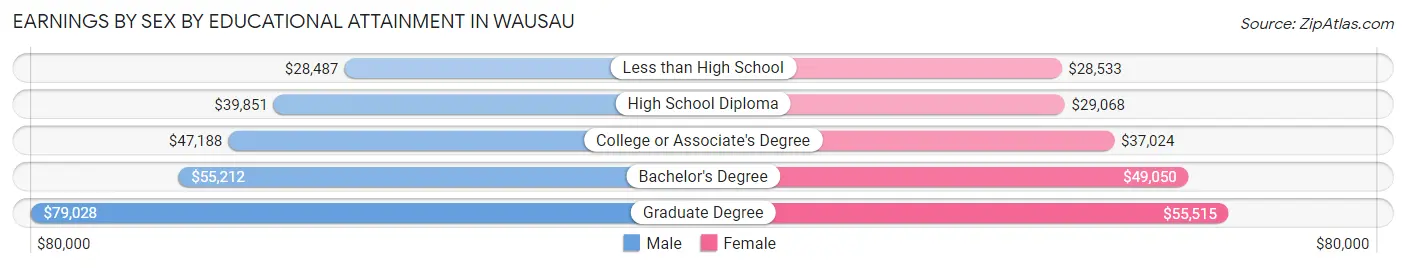
Earnings by Sex by Educational Attainment in Wausau
Average earnings in Wausau are $46,388 for men and $38,234 for women, a difference of 17.6%. Men with an educational attainment of graduate degree enjoy the highest average annual earnings of $79,028, while those with less than high school education earn the least with $28,487. Women with an educational attainment of graduate degree earn the most with the average annual earnings of $55,515, while those with less than high school education have the smallest earnings of $28,533.
| Educational Attainment | Male Income | Female Income |
| Less than High School | $28,487 | $28,533 |
| High School Diploma | $39,851 | $29,068 |
| College or Associate's Degree | $47,188 | $37,024 |
| Bachelor's Degree | $55,212 | $49,050 |
| Graduate Degree | $79,028 | $55,515 |
| Total | $46,388 | $38,234 |
Family Income in Wausau
Family Income Brackets in Wausau
According to the Wausau family income data, there are 1,979 families falling into the $75,000 to $99,999 income range, which is the most common income bracket and makes up 21.0% of all families. Conversely, the $10,000 to $14,999 income bracket is the least frequent group with only 104 families (1.1%) belonging to this category.
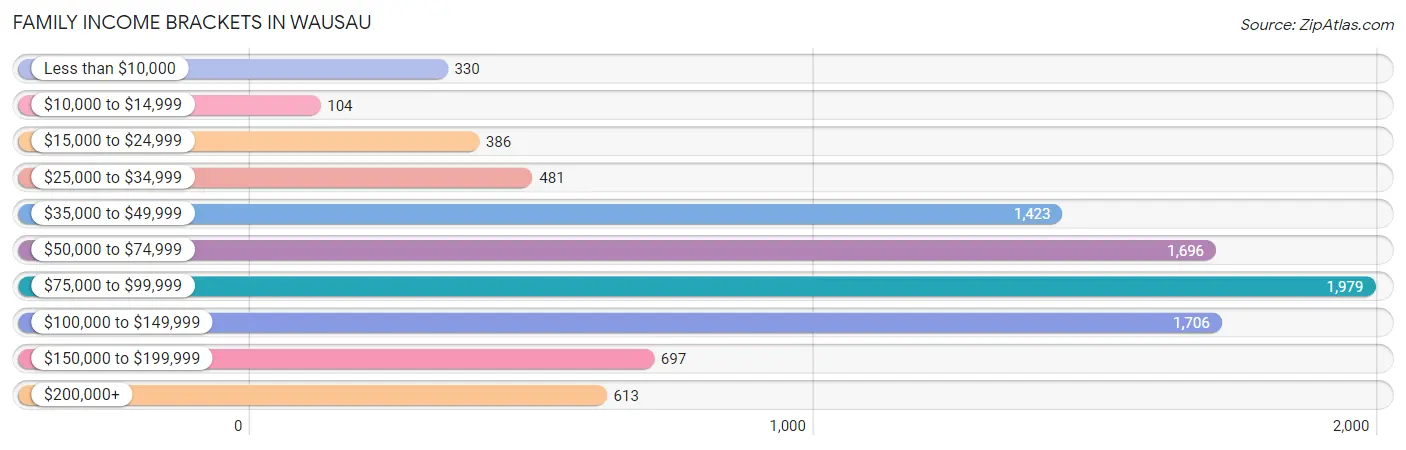
| Income Bracket | # Families | % Families |
| Less than $10,000 | 330 | 3.5% |
| $10,000 to $14,999 | 104 | 1.1% |
| $15,000 to $24,999 | 386 | 4.1% |
| $25,000 to $34,999 | 481 | 5.1% |
| $35,000 to $49,999 | 1,423 | 15.1% |
| $50,000 to $74,999 | 1,696 | 18.0% |
| $75,000 to $99,999 | 1,979 | 21.0% |
| $100,000 to $149,999 | 1,706 | 18.1% |
| $150,000 to $199,999 | 697 | 7.4% |
| $200,000+ | 613 | 6.5% |
Family Income by Famaliy Size in Wausau
7+ person families (140 | 1.5%) account for the highest median family income in Wausau with $97,500 per family, while 2-person families (5,100 | 54.1%) have the highest median income of $34,672 per family member.
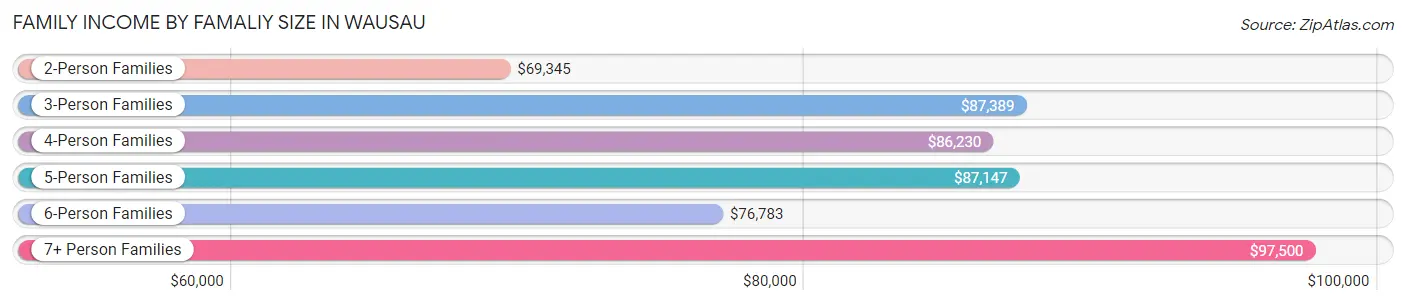
| Income Bracket | # Families | Median Income |
| 2-Person Families | 5,100 (54.1%) | $69,345 |
| 3-Person Families | 1,892 (20.1%) | $87,389 |
| 4-Person Families | 1,288 (13.7%) | $86,230 |
| 5-Person Families | 487 (5.2%) | $87,147 |
| 6-Person Families | 517 (5.5%) | $76,783 |
| 7+ Person Families | 140 (1.5%) | $97,500 |
| Total | 9,424 (100.0%) | $79,015 |
Family Income by Number of Earners in Wausau
The median family income in Wausau is $79,015, with families comprising 3+ earners (925) having the highest median family income of $116,128, while families with no earners (1,328) have the lowest median family income of $50,588, accounting for 9.8% and 14.1% of families, respectively.
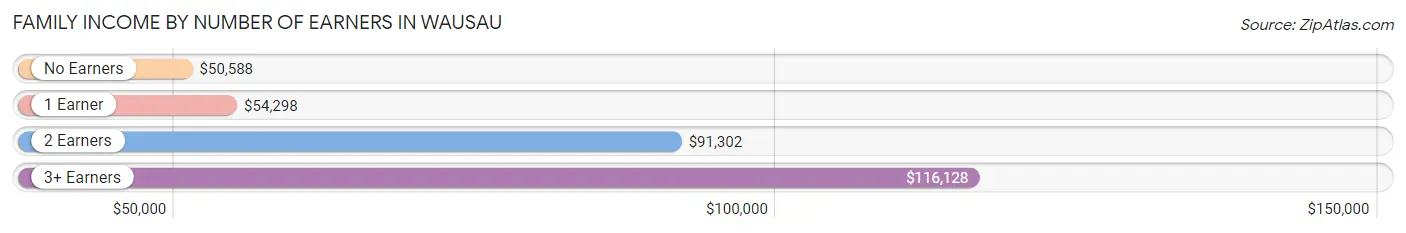
| Number of Earners | # Families | Median Income |
| No Earners | 1,328 (14.1%) | $50,588 |
| 1 Earner | 3,075 (32.6%) | $54,298 |
| 2 Earners | 4,096 (43.5%) | $91,302 |
| 3+ Earners | 925 (9.8%) | $116,128 |
| Total | 9,424 (100.0%) | $79,015 |
Household Income in Wausau
Household Income Brackets in Wausau
With 3,062 households falling in the category, the $50,000 to $74,999 income range is the most frequent in Wausau, accounting for 17.7% of all households. In contrast, only 796 households (4.6%) fall into the less than $10,000 income bracket, making it the least populous group.
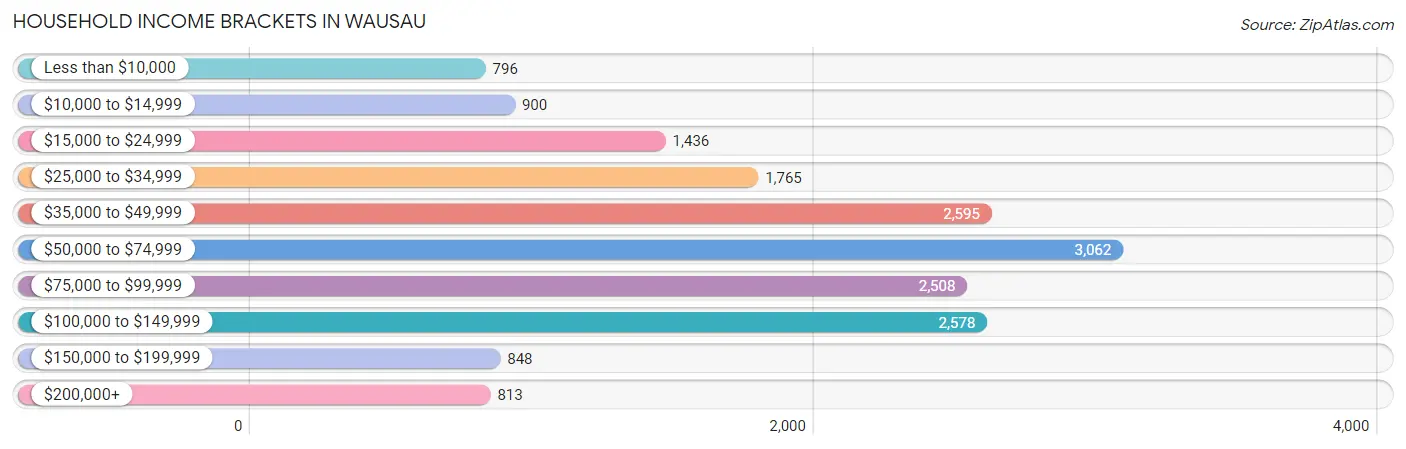
| Income Bracket | # Households | % Households |
| Less than $10,000 | 796 | 4.6% |
| $10,000 to $14,999 | 900 | 5.2% |
| $15,000 to $24,999 | 1,436 | 8.3% |
| $25,000 to $34,999 | 1,765 | 10.2% |
| $35,000 to $49,999 | 2,595 | 15.0% |
| $50,000 to $74,999 | 3,062 | 17.7% |
| $75,000 to $99,999 | 2,508 | 14.5% |
| $100,000 to $149,999 | 2,578 | 14.9% |
| $150,000 to $199,999 | 848 | 4.9% |
| $200,000+ | 813 | 4.7% |
Household Income by Householder Age in Wausau
The median household income in Wausau is $59,259, with the highest median household income of $68,732 found in the 45 to 64 years age bracket for the primary householder. A total of 5,305 households (30.7%) fall into this category. Meanwhile, the 15 to 24 years age bracket for the primary householder has the lowest median household income of $38,793, with 897 households (5.2%) in this group.
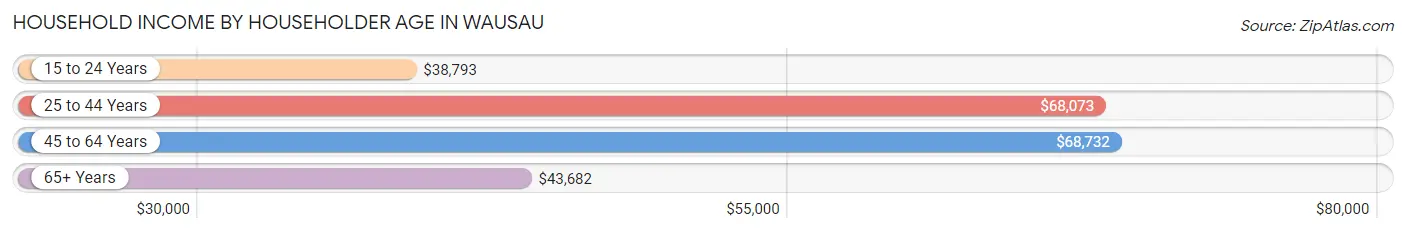
| Income Bracket | # Households | Median Income |
| 15 to 24 Years | 897 (5.2%) | $38,793 |
| 25 to 44 Years | 6,066 (35.1%) | $68,073 |
| 45 to 64 Years | 5,305 (30.7%) | $68,732 |
| 65+ Years | 5,032 (29.1%) | $43,682 |
| Total | 17,300 (100.0%) | $59,259 |
Poverty in Wausau
Income Below Poverty by Sex and Age in Wausau
With 13.6% poverty level for males and 12.8% for females among the residents of Wausau, 15 year old males and 15 year old females are the most vulnerable to poverty, with 83 males (41.5%) and 65 females (29.0%) in their respective age groups living below the poverty level.
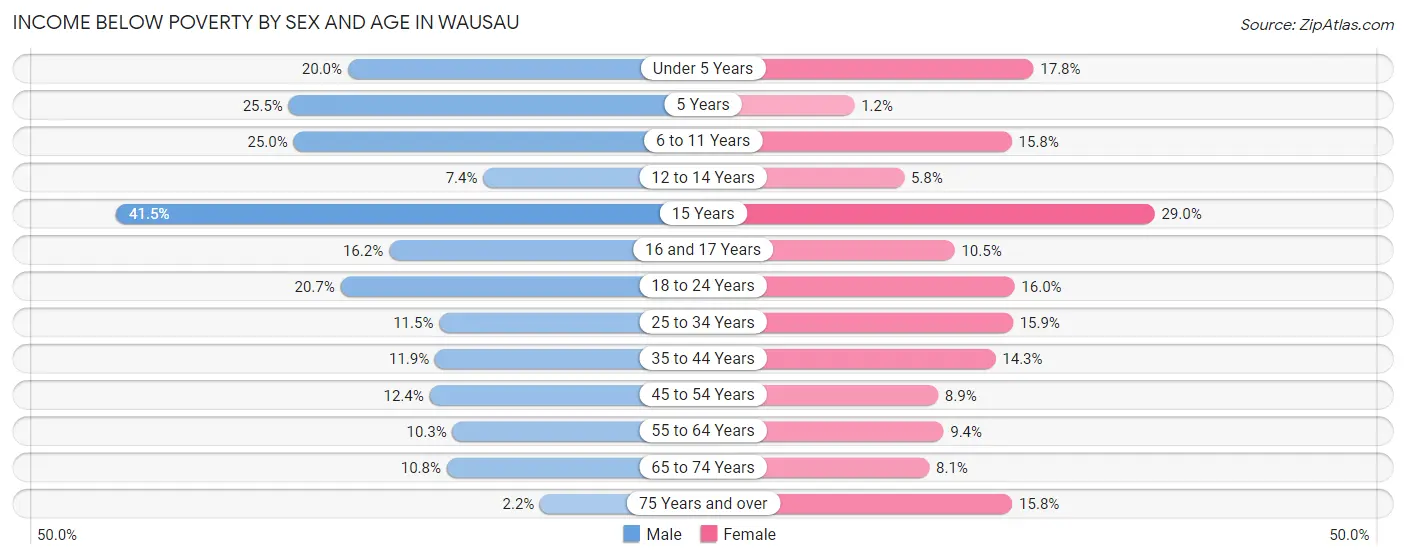
| Age Bracket | Male | Female |
| Under 5 Years | 200 (20.0%) | 236 (17.8%) |
| 5 Years | 39 (25.5%) | 4 (1.1%) |
| 6 to 11 Years | 346 (25.0%) | 201 (15.8%) |
| 12 to 14 Years | 60 (7.4%) | 47 (5.8%) |
| 15 Years | 83 (41.5%) | 65 (29.0%) |
| 16 and 17 Years | 88 (16.2%) | 64 (10.5%) |
| 18 to 24 Years | 357 (20.7%) | 252 (16.0%) |
| 25 to 34 Years | 356 (11.5%) | 389 (15.9%) |
| 35 to 44 Years | 308 (11.9%) | 407 (14.2%) |
| 45 to 54 Years | 268 (12.4%) | 176 (8.9%) |
| 55 to 64 Years | 243 (10.3%) | 241 (9.4%) |
| 65 to 74 Years | 221 (10.8%) | 163 (8.1%) |
| 75 Years and over | 21 (2.1%) | 298 (15.8%) |
| Total | 2,590 (13.6%) | 2,543 (12.8%) |
Income Above Poverty by Sex and Age in Wausau
According to the poverty statistics in Wausau, males aged 75 years and over and females aged 5 years are the age groups that are most secure financially, with 97.9% of males and 98.9% of females in these age groups living above the poverty line.
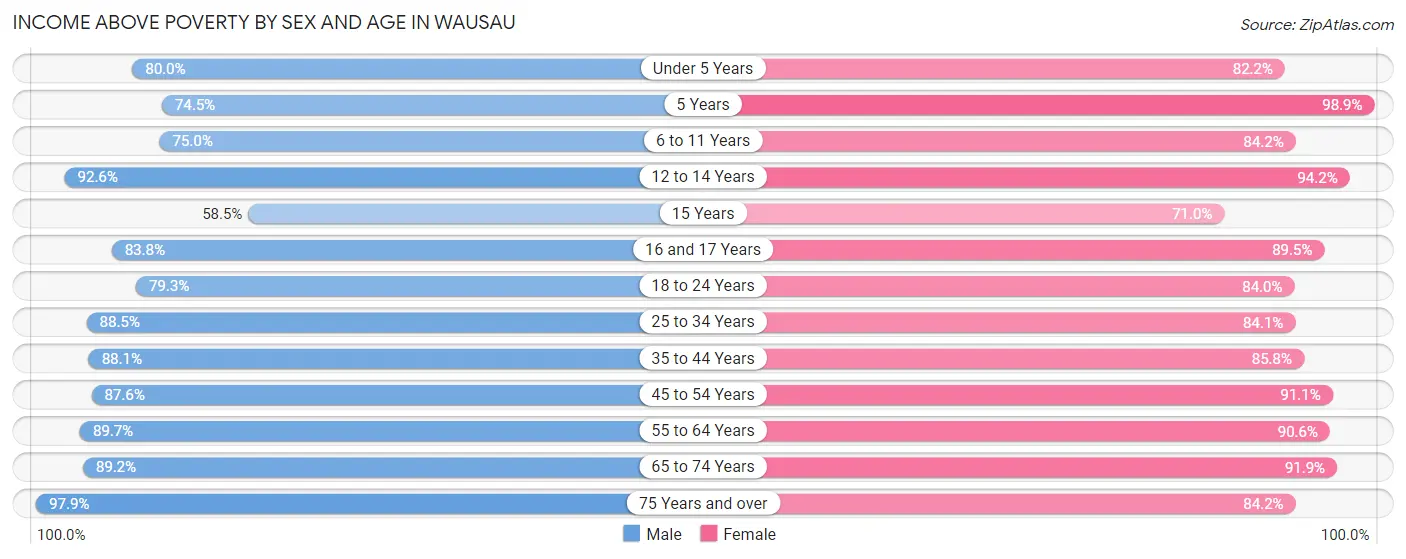
| Age Bracket | Male | Female |
| Under 5 Years | 800 (80.0%) | 1,091 (82.2%) |
| 5 Years | 114 (74.5%) | 343 (98.9%) |
| 6 to 11 Years | 1,036 (75.0%) | 1,074 (84.2%) |
| 12 to 14 Years | 748 (92.6%) | 767 (94.2%) |
| 15 Years | 117 (58.5%) | 159 (71.0%) |
| 16 and 17 Years | 456 (83.8%) | 548 (89.5%) |
| 18 to 24 Years | 1,369 (79.3%) | 1,321 (84.0%) |
| 25 to 34 Years | 2,733 (88.5%) | 2,063 (84.1%) |
| 35 to 44 Years | 2,277 (88.1%) | 2,449 (85.8%) |
| 45 to 54 Years | 1,889 (87.6%) | 1,797 (91.1%) |
| 55 to 64 Years | 2,120 (89.7%) | 2,318 (90.6%) |
| 65 to 74 Years | 1,821 (89.2%) | 1,850 (91.9%) |
| 75 Years and over | 957 (97.9%) | 1,587 (84.2%) |
| Total | 16,437 (86.4%) | 17,367 (87.2%) |
Income Below Poverty Among Married-Couple Families in Wausau
The poverty statistics for married-couple families in Wausau show that 2.6% or 172 of the total 6,707 families live below the poverty line. Families with 5 or more children have the highest poverty rate of 30.0%, comprising of 12 families. On the other hand, families with no children have the lowest poverty rate of 1.9%, which includes 78 families.
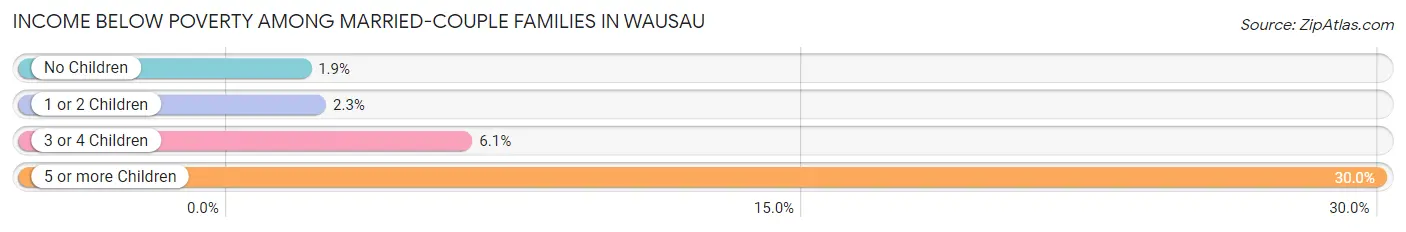
| Children | Above Poverty | Below Poverty |
| No Children | 4,002 (98.1%) | 78 (1.9%) |
| 1 or 2 Children | 1,953 (97.7%) | 46 (2.3%) |
| 3 or 4 Children | 552 (93.9%) | 36 (6.1%) |
| 5 or more Children | 28 (70.0%) | 12 (30.0%) |
| Total | 6,535 (97.4%) | 172 (2.6%) |
Income Below Poverty Among Single-Parent Households in Wausau
According to the poverty data in Wausau, 30.4% or 265 single-father households and 15.5% or 286 single-mother households are living below the poverty line. Among single-father households, those with 5 or more children have the highest poverty rate, with 1 households (100.0%) experiencing poverty. Likewise, among single-mother households, those with 3 or 4 children have the highest poverty rate, with 87 households (51.2%) falling below the poverty line.
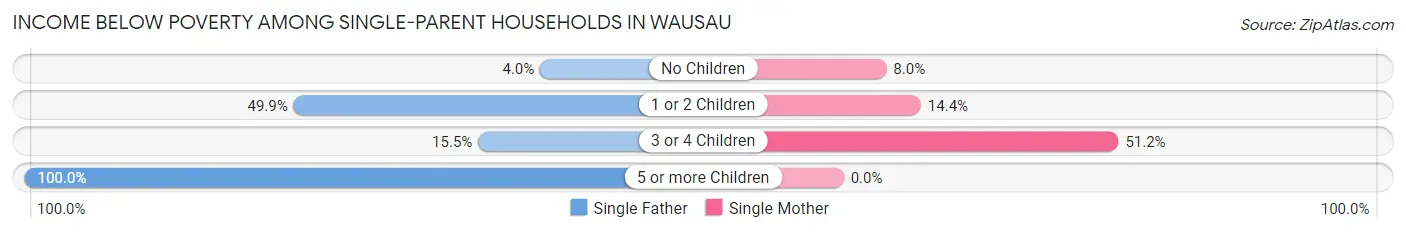
| Children | Single Father | Single Mother |
| No Children | 13 (4.0%) | 36 (8.0%) |
| 1 or 2 Children | 242 (49.9%) | 163 (14.4%) |
| 3 or 4 Children | 9 (15.5%) | 87 (51.2%) |
| 5 or more Children | 1 (100.0%) | 0 (0.0%) |
| Total | 265 (30.4%) | 286 (15.5%) |
Income Below Poverty Among Married-Couple vs Single-Parent Households in Wausau
The poverty data for Wausau shows that 172 of the married-couple family households (2.6%) and 551 of the single-parent households (20.3%) are living below the poverty level. Within the married-couple family households, those with 5 or more children have the highest poverty rate, with 12 households (30.0%) falling below the poverty line. Among the single-parent households, those with 3 or 4 children have the highest poverty rate, with 96 household (42.1%) living below poverty.
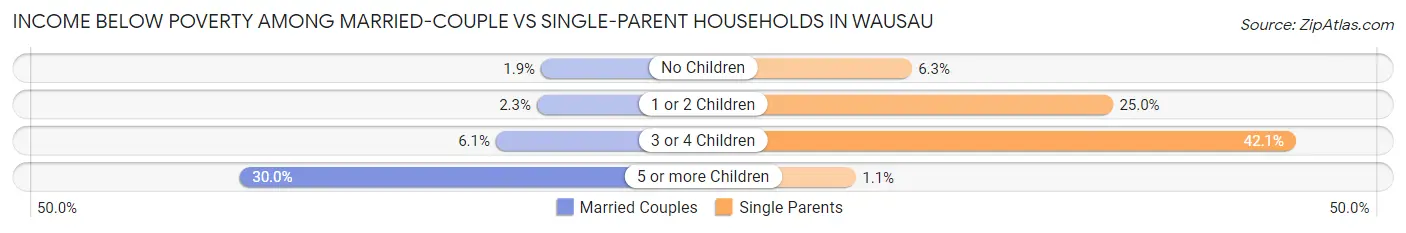
| Children | Married-Couple Families | Single-Parent Households |
| No Children | 78 (1.9%) | 49 (6.3%) |
| 1 or 2 Children | 46 (2.3%) | 405 (25.0%) |
| 3 or 4 Children | 36 (6.1%) | 96 (42.1%) |
| 5 or more Children | 12 (30.0%) | 1 (1.1%) |
| Total | 172 (2.6%) | 551 (20.3%) |
Race in Wausau
The most populous races in Wausau are White / Caucasian (32,706 | 82.0%), Asian (4,322 | 10.8%), and Hispanic or Latino (1,881 | 4.7%).
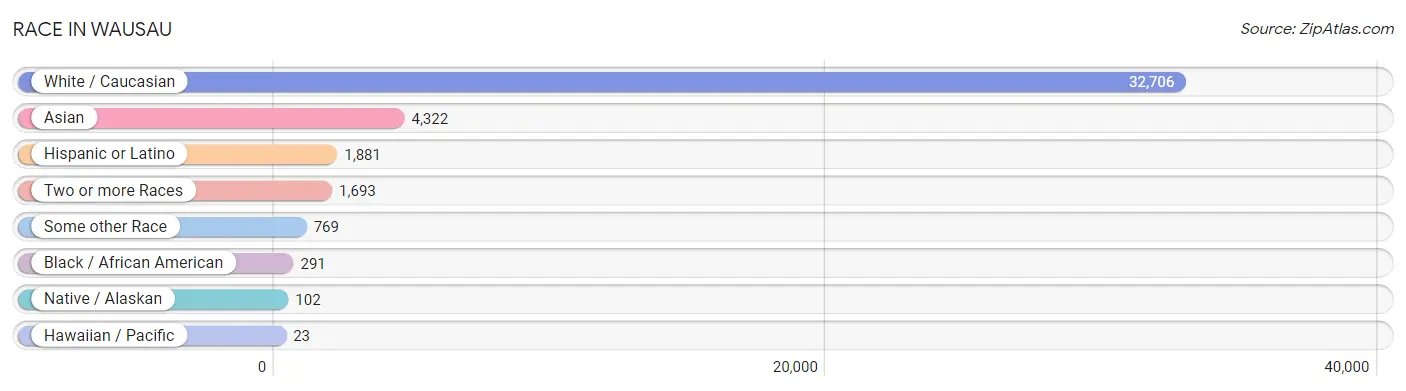
| Race | # Population | % Population |
| Asian | 4,322 | 10.8% |
| Black / African American | 291 | 0.7% |
| Hawaiian / Pacific | 23 | 0.1% |
| Hispanic or Latino | 1,881 | 4.7% |
| Native / Alaskan | 102 | 0.3% |
| White / Caucasian | 32,706 | 82.0% |
| Two or more Races | 1,693 | 4.2% |
| Some other Race | 769 | 1.9% |
| Total | 39,906 | 100.0% |
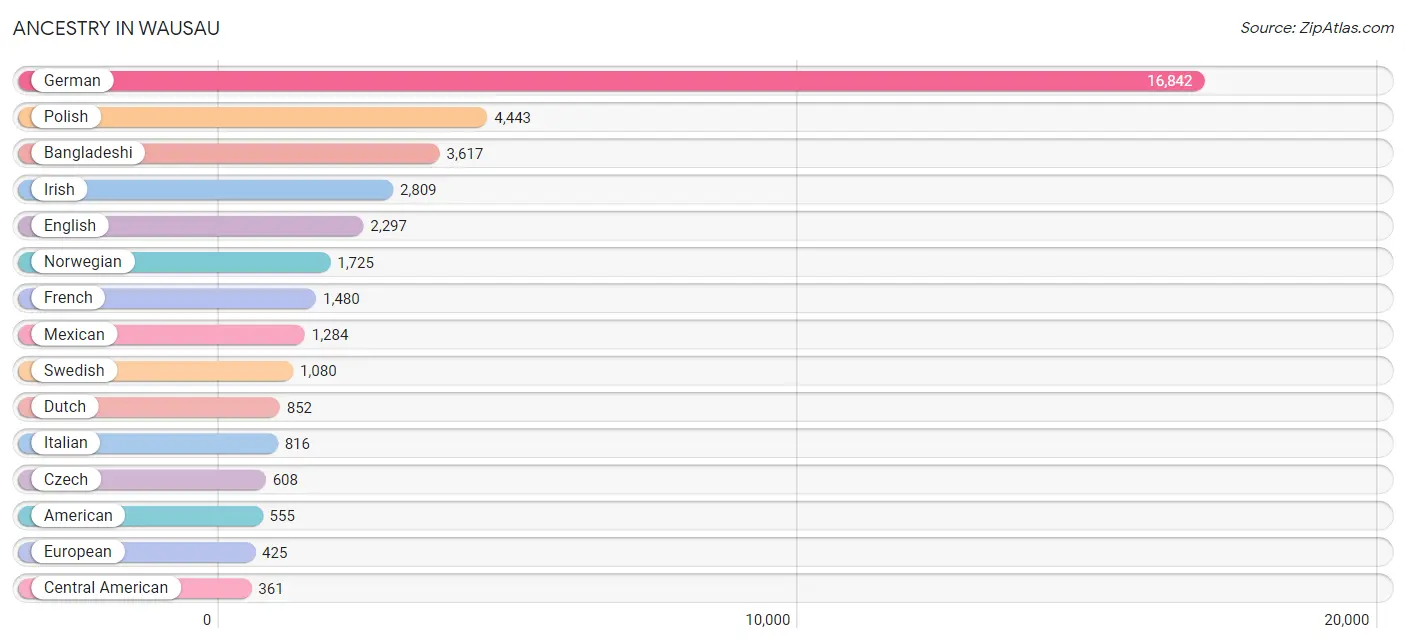
Ancestry in Wausau
The most populous ancestries reported in Wausau are German (16,842 | 42.2%), Polish (4,443 | 11.1%), Bangladeshi (3,617 | 9.1%), Irish (2,809 | 7.0%), and English (2,297 | 5.8%), together accounting for 75.2% of all Wausau residents.
| Ancestry | # Population | % Population |
| African | 180 | 0.4% |
| Alaska Native | 7 | 0.0% |
| American | 555 | 1.4% |
| Arab | 45 | 0.1% |
| Austrian | 154 | 0.4% |
| Bangladeshi | 3,617 | 9.1% |
| Belgian | 79 | 0.2% |
| Bhutanese | 22 | 0.1% |
| Blackfeet | 2 | 0.0% |
| Brazilian | 17 | 0.0% |
| British | 86 | 0.2% |
| Bulgarian | 6 | 0.0% |
| Burmese | 32 | 0.1% |
| Canadian | 39 | 0.1% |
| Celtic | 9 | 0.0% |
| Central American | 361 | 0.9% |
| Cherokee | 17 | 0.0% |
| Cheyenne | 30 | 0.1% |
| Chippewa | 210 | 0.5% |
| Choctaw | 4 | 0.0% |
| Colombian | 10 | 0.0% |
| Comanche | 22 | 0.1% |
| Costa Rican | 9 | 0.0% |
| Croatian | 57 | 0.1% |
| Cuban | 13 | 0.0% |
| Czech | 608 | 1.5% |
| Czechoslovakian | 59 | 0.2% |
| Danish | 192 | 0.5% |
| Dutch | 852 | 2.1% |
| Eastern European | 44 | 0.1% |
| English | 2,297 | 5.8% |
| Estonian | 3 | 0.0% |
| European | 425 | 1.1% |
| Finnish | 154 | 0.4% |
| French | 1,480 | 3.7% |
| French American Indian | 13 | 0.0% |
| French Canadian | 237 | 0.6% |
| German | 16,842 | 42.2% |
| Greek | 111 | 0.3% |
| Hungarian | 91 | 0.2% |
| Indian (Asian) | 148 | 0.4% |
| Irish | 2,809 | 7.0% |
| Iroquois | 27 | 0.1% |
| Italian | 816 | 2.0% |
| Jamaican | 50 | 0.1% |
| Japanese | 129 | 0.3% |
| Jordanian | 8 | 0.0% |
| Korean | 73 | 0.2% |
| Latvian | 45 | 0.1% |
| Lebanese | 9 | 0.0% |
| Lithuanian | 17 | 0.0% |
| Luxembourger | 38 | 0.1% |
| Malaysian | 202 | 0.5% |
| Menominee | 7 | 0.0% |
| Mexican | 1,284 | 3.2% |
| Mexican American Indian | 34 | 0.1% |
| Native Hawaiian | 22 | 0.1% |
| Navajo | 58 | 0.2% |
| Nicaraguan | 326 | 0.8% |
| Northern European | 56 | 0.1% |
| Norwegian | 1,725 | 4.3% |
| Pakistani | 78 | 0.2% |
| Palestinian | 12 | 0.0% |
| Paraguayan | 15 | 0.0% |
| Polish | 4,443 | 11.1% |
| Portuguese | 29 | 0.1% |
| Pueblo | 7 | 0.0% |
| Puerto Rican | 97 | 0.2% |
| Romanian | 9 | 0.0% |
| Russian | 245 | 0.6% |
| Salvadoran | 26 | 0.1% |
| Scandinavian | 107 | 0.3% |
| Scotch-Irish | 161 | 0.4% |
| Scottish | 347 | 0.9% |
| Slavic | 119 | 0.3% |
| Slovak | 59 | 0.2% |
| Slovene | 19 | 0.1% |
| South American | 25 | 0.1% |
| Spaniard | 55 | 0.1% |
| Spanish | 15 | 0.0% |
| Sri Lankan | 178 | 0.4% |
| Subsaharan African | 180 | 0.4% |
| Swedish | 1,080 | 2.7% |
| Swiss | 244 | 0.6% |
| Thai | 338 | 0.9% |
| Welsh | 121 | 0.3% | View All 86 Rows |
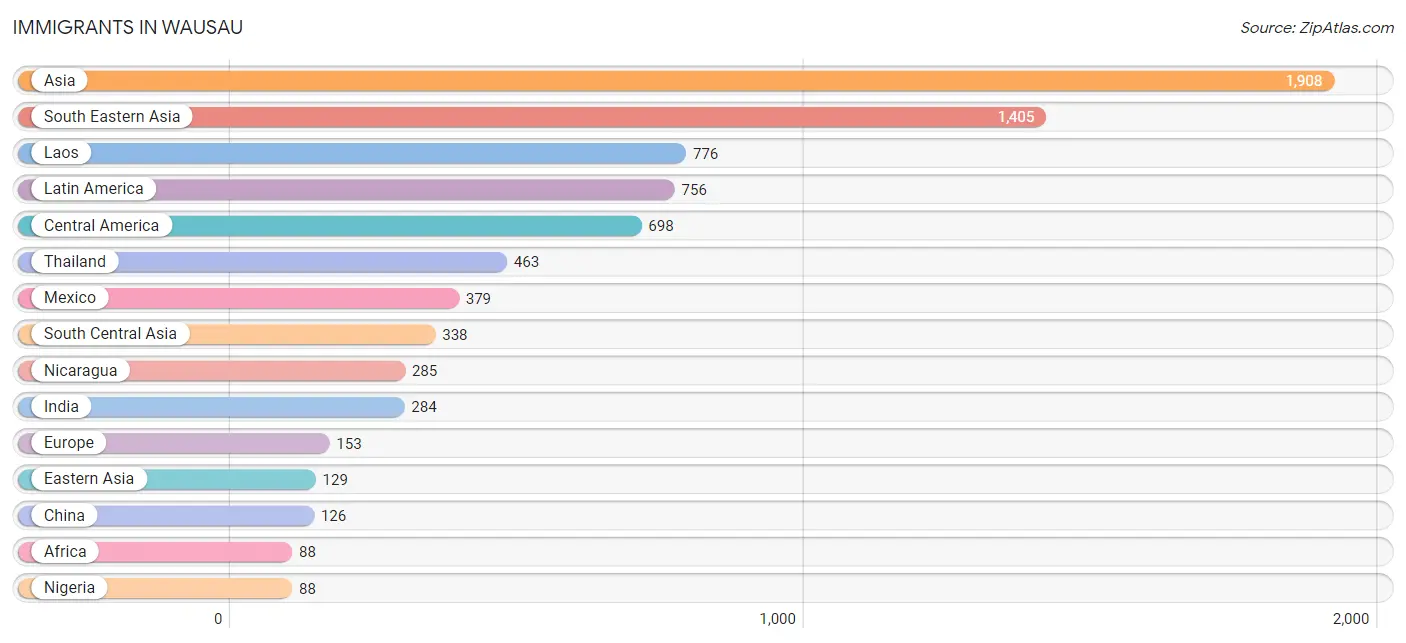
Immigrants in Wausau
The most numerous immigrant groups reported in Wausau came from Asia (1,908 | 4.8%), South Eastern Asia (1,405 | 3.5%), Laos (776 | 1.9%), Latin America (756 | 1.9%), and Central America (698 | 1.8%), together accounting for 13.9% of all Wausau residents.
| Immigration Origin | # Population | % Population |
| Afghanistan | 48 | 0.1% |
| Africa | 88 | 0.2% |
| Asia | 1,908 | 4.8% |
| Brazil | 33 | 0.1% |
| Cambodia | 30 | 0.1% |
| Canada | 78 | 0.2% |
| Central America | 698 | 1.8% |
| China | 126 | 0.3% |
| Colombia | 10 | 0.0% |
| Costa Rica | 9 | 0.0% |
| Eastern Asia | 129 | 0.3% |
| Eastern Europe | 76 | 0.2% |
| England | 5 | 0.0% |
| Europe | 153 | 0.4% |
| Germany | 57 | 0.1% |
| India | 284 | 0.7% |
| Kazakhstan | 6 | 0.0% |
| Korea | 3 | 0.0% |
| Laos | 776 | 1.9% |
| Latin America | 756 | 1.9% |
| Malaysia | 5 | 0.0% |
| Mexico | 379 | 0.9% |
| Nicaragua | 285 | 0.7% |
| Nigeria | 88 | 0.2% |
| Northern Europe | 20 | 0.1% |
| Panama | 25 | 0.1% |
| Philippines | 14 | 0.0% |
| Poland | 35 | 0.1% |
| Russia | 41 | 0.1% |
| Singapore | 36 | 0.1% |
| South America | 58 | 0.2% |
| South Central Asia | 338 | 0.9% |
| South Eastern Asia | 1,405 | 3.5% |
| Syria | 8 | 0.0% |
| Thailand | 463 | 1.2% |
| Vietnam | 81 | 0.2% |
| Western Africa | 88 | 0.2% |
| Western Asia | 24 | 0.1% |
| Western Europe | 57 | 0.1% | View All 39 Rows |
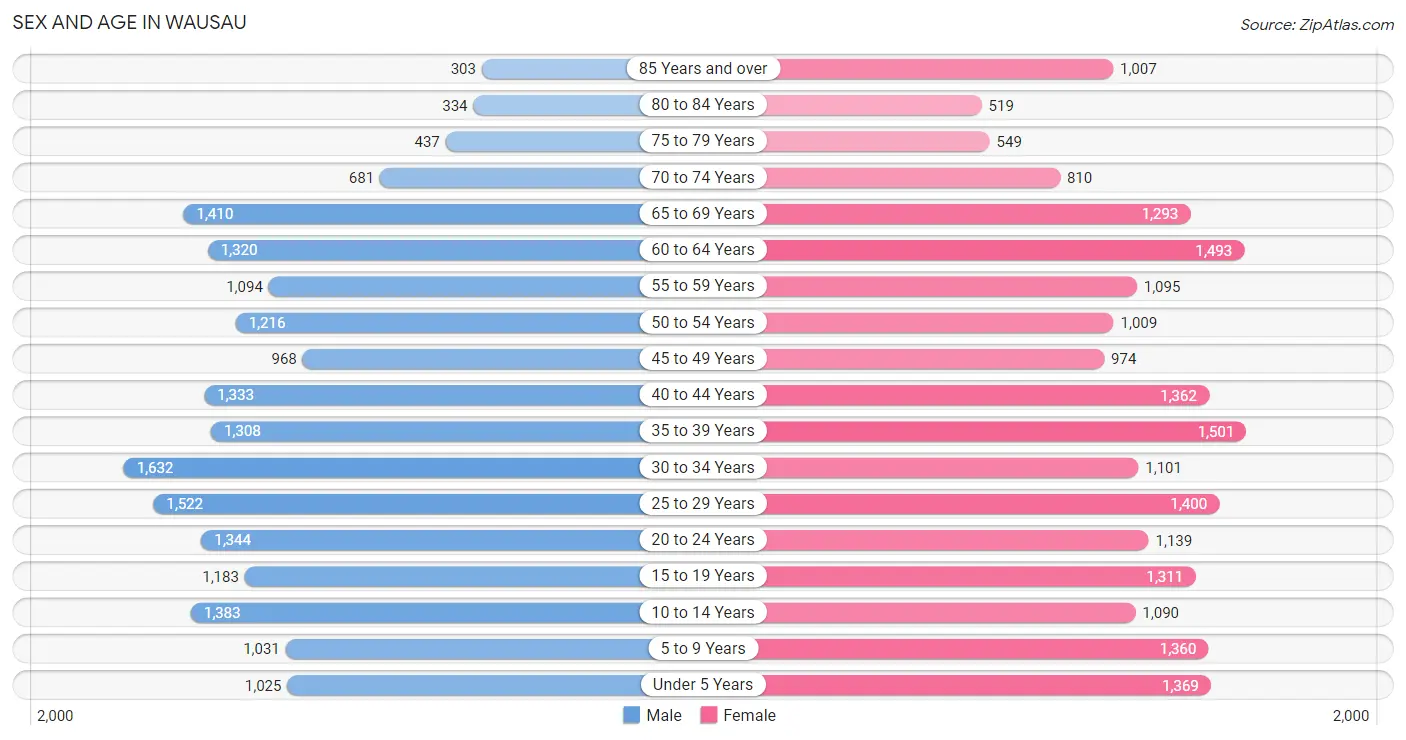
Sex and Age in Wausau
Sex and Age in Wausau
The most populous age groups in Wausau are 30 to 34 Years (1,632 | 8.4%) for men and 35 to 39 Years (1,501 | 7.4%) for women.
| Age Bracket | Male | Female |
| Under 5 Years | 1,025 (5.2%) | 1,369 (6.7%) |
| 5 to 9 Years | 1,031 (5.3%) | 1,360 (6.7%) |
| 10 to 14 Years | 1,383 (7.1%) | 1,090 (5.3%) |
| 15 to 19 Years | 1,183 (6.1%) | 1,311 (6.4%) |
| 20 to 24 Years | 1,344 (6.9%) | 1,139 (5.6%) |
| 25 to 29 Years | 1,522 (7.8%) | 1,400 (6.9%) |
| 30 to 34 Years | 1,632 (8.4%) | 1,101 (5.4%) |
| 35 to 39 Years | 1,308 (6.7%) | 1,501 (7.4%) |
| 40 to 44 Years | 1,333 (6.8%) | 1,362 (6.7%) |
| 45 to 49 Years | 968 (5.0%) | 974 (4.8%) |
| 50 to 54 Years | 1,216 (6.2%) | 1,009 (5.0%) |
| 55 to 59 Years | 1,094 (5.6%) | 1,095 (5.4%) |
| 60 to 64 Years | 1,320 (6.8%) | 1,493 (7.3%) |
| 65 to 69 Years | 1,410 (7.2%) | 1,293 (6.3%) |
| 70 to 74 Years | 681 (3.5%) | 810 (4.0%) |
| 75 to 79 Years | 437 (2.2%) | 549 (2.7%) |
| 80 to 84 Years | 334 (1.7%) | 519 (2.5%) |
| 85 Years and over | 303 (1.5%) | 1,007 (4.9%) |
| Total | 19,524 (100.0%) | 20,382 (100.0%) |
Families and Households in Wausau
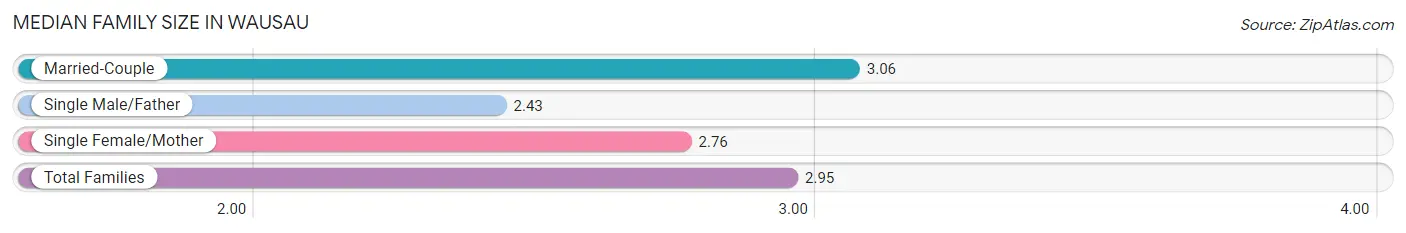
Median Family Size in Wausau
The median family size in Wausau is 2.95 persons per family, with married-couple families (6,707 | 71.2%) accounting for the largest median family size of 3.06 persons per family. On the other hand, single male/father families (871 | 9.2%) represent the smallest median family size with 2.43 persons per family.
| Family Type | # Families | Family Size |
| Married-Couple | 6,707 (71.2%) | 3.06 |
| Single Male/Father | 871 (9.2%) | 2.43 |
| Single Female/Mother | 1,846 (19.6%) | 2.76 |
| Total Families | 9,424 (100.0%) | 2.95 |
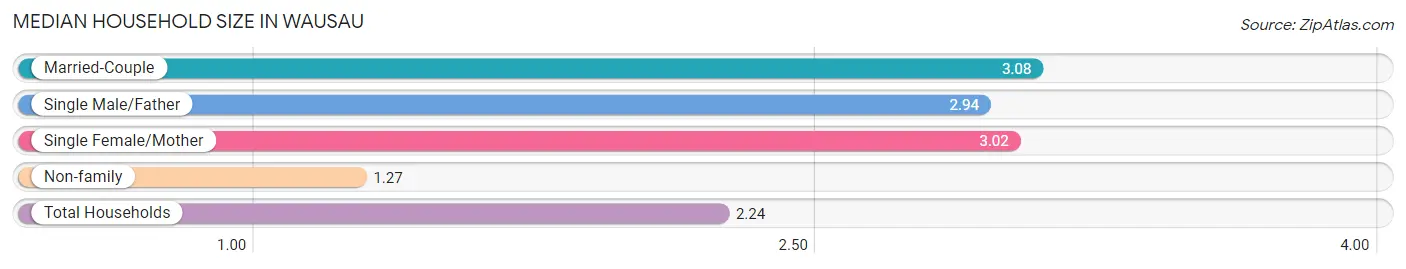
Median Household Size in Wausau
The median household size in Wausau is 2.24 persons per household, with married-couple households (6,707 | 38.8%) accounting for the largest median household size of 3.08 persons per household. non-family households (7,876 | 45.5%) represent the smallest median household size with 1.27 persons per household.
| Household Type | # Households | Household Size |
| Married-Couple | 6,707 (38.8%) | 3.08 |
| Single Male/Father | 871 (5.0%) | 2.94 |
| Single Female/Mother | 1,846 (10.7%) | 3.02 |
| Non-family | 7,876 (45.5%) | 1.27 |
| Total Households | 17,300 (100.0%) | 2.24 |
Household Size by Marriage Status in Wausau
Out of a total of 17,300 households in Wausau, 9,424 (54.5%) are family households, while 7,876 (45.5%) are nonfamily households. The most numerous type of family households are 2-person households, comprising 4,688, and the most common type of nonfamily households are 1-person households, comprising 6,182.
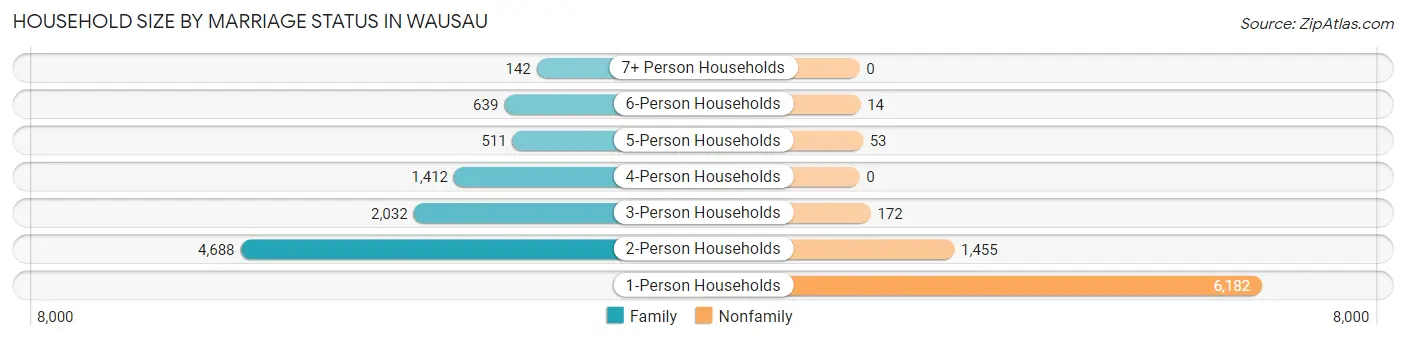
| Household Size | Family Households | Nonfamily Households |
| 1-Person Households | - | 6,182 (35.7%) |
| 2-Person Households | 4,688 (27.1%) | 1,455 (8.4%) |
| 3-Person Households | 2,032 (11.7%) | 172 (1.0%) |
| 4-Person Households | 1,412 (8.2%) | 0 (0.0%) |
| 5-Person Households | 511 (2.9%) | 53 (0.3%) |
| 6-Person Households | 639 (3.7%) | 14 (0.1%) |
| 7+ Person Households | 142 (0.8%) | 0 (0.0%) |
| Total | 9,424 (54.5%) | 7,876 (45.5%) |
Female Fertility in Wausau
Fertility by Age in Wausau
Average fertility rate in Wausau is 61.0 births per 1,000 women. Women in the age bracket of 20 to 34 years have the highest fertility rate with 91.0 births per 1,000 women. Women in the age bracket of 20 to 34 years acount for 60.6% of all women with births.
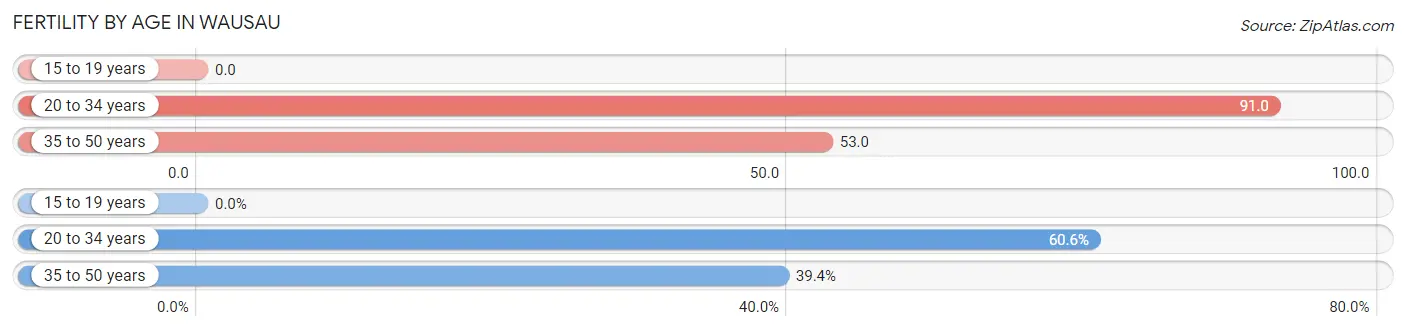
| Age Bracket | Women with Births | Births / 1,000 Women |
| 15 to 19 years | 0 (0.0%) | 0.0 |
| 20 to 34 years | 332 (60.6%) | 91.0 |
| 35 to 50 years | 216 (39.4%) | 53.0 |
| Total | 548 (100.0%) | 61.0 |
Fertility by Age by Marriage Status in Wausau
60.0% of women with births (548) in Wausau are married. The highest percentage of unmarried women with births falls into 20 to 34 years age bracket with 49.7% of them unmarried at the time of birth, while the lowest percentage of unmarried women with births belong to 35 to 50 years age bracket with 25.0% of them unmarried.
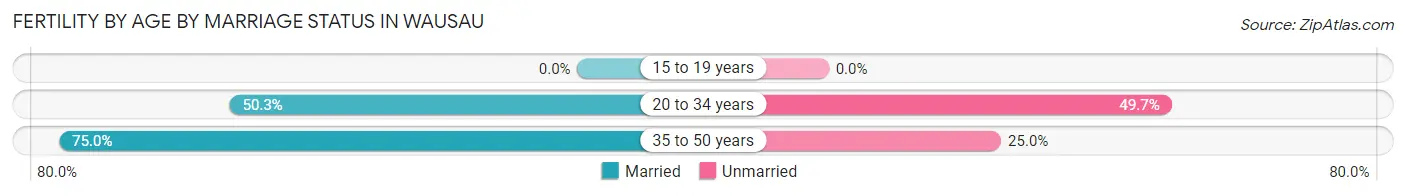
| Age Bracket | Married | Unmarried |
| 15 to 19 years | 0 (0.0%) | 0 (0.0%) |
| 20 to 34 years | 167 (50.3%) | 165 (49.7%) |
| 35 to 50 years | 162 (75.0%) | 54 (25.0%) |
| Total | 329 (60.0%) | 219 (40.0%) |
Fertility by Education in Wausau
Average fertility rate in Wausau is 61.0 births per 1,000 women. Women with the education attainment of college or associate's degree have the highest fertility rate of 95.0 births per 1,000 women, while women with the education attainment of bachelor's degree have the lowest fertility at 32.0 births per 1,000 women. Women with the education attainment of college or associate's degree represent 50.4% of all women with births.
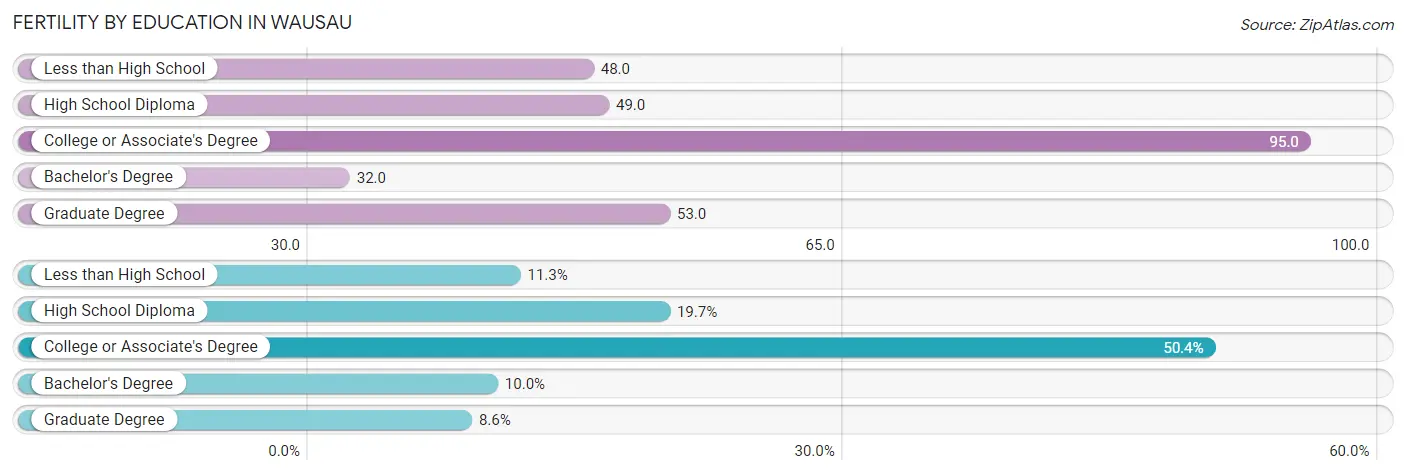
| Educational Attainment | Women with Births | Births / 1,000 Women |
| Less than High School | 62 (11.3%) | 48.0 |
| High School Diploma | 108 (19.7%) | 49.0 |
| College or Associate's Degree | 276 (50.4%) | 95.0 |
| Bachelor's Degree | 55 (10.0%) | 32.0 |
| Graduate Degree | 47 (8.6%) | 53.0 |
| Total | 548 (100.0%) | 61.0 |
Fertility by Education by Marriage Status in Wausau
40.0% of women with births in Wausau are unmarried. Women with the educational attainment of graduate degree are most likely to be married with 100.0% of them married at childbirth, while women with the educational attainment of high school diploma are least likely to be married with 50.9% of them unmarried at childbirth.
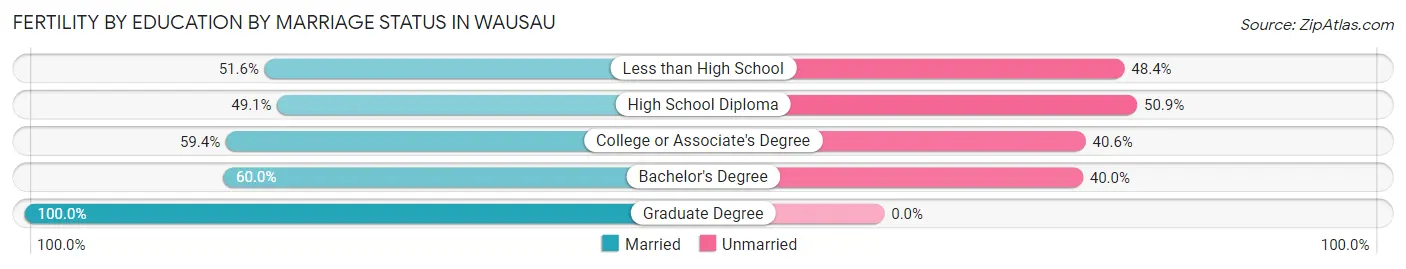
| Educational Attainment | Married | Unmarried |
| Less than High School | 32 (51.6%) | 30 (48.4%) |
| High School Diploma | 53 (49.1%) | 55 (50.9%) |
| College or Associate's Degree | 164 (59.4%) | 112 (40.6%) |
| Bachelor's Degree | 33 (60.0%) | 22 (40.0%) |
| Graduate Degree | 47 (100.0%) | 0 (0.0%) |
| Total | 329 (60.0%) | 219 (40.0%) |
Employment Characteristics in Wausau
Employment by Class of Employer in Wausau
Among the 19,335 employed individuals in Wausau, private company employees (14,090 | 72.9%), not-for-profit organizations (1,602 | 8.3%), and local government employees (1,294 | 6.7%) make up the most common classes of employment.
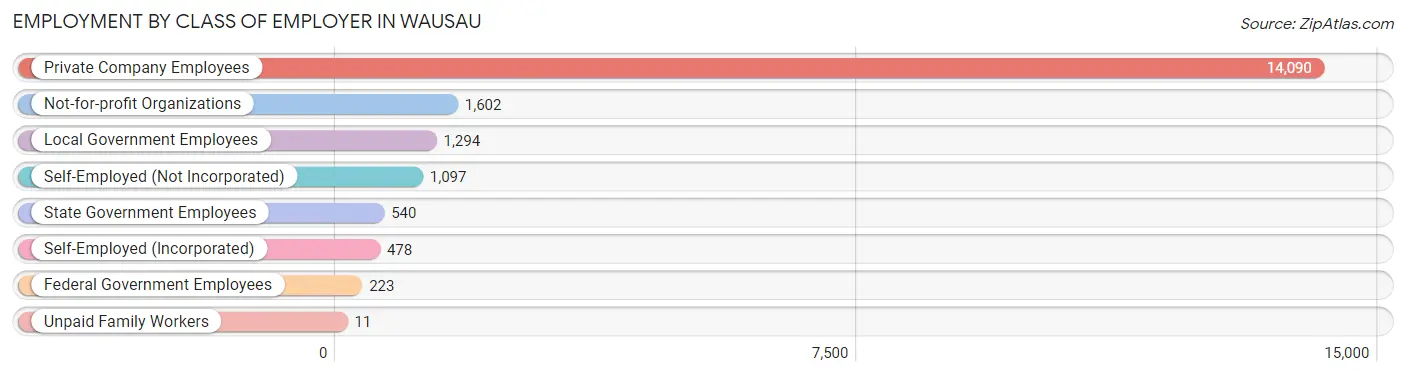
| Employer Class | # Employees | % Employees |
| Private Company Employees | 14,090 | 72.9% |
| Self-Employed (Incorporated) | 478 | 2.5% |
| Self-Employed (Not Incorporated) | 1,097 | 5.7% |
| Not-for-profit Organizations | 1,602 | 8.3% |
| Local Government Employees | 1,294 | 6.7% |
| State Government Employees | 540 | 2.8% |
| Federal Government Employees | 223 | 1.1% |
| Unpaid Family Workers | 11 | 0.1% |
| Total | 19,335 | 100.0% |
Employment Status by Age in Wausau
According to the labor force statistics for Wausau, out of the total population over 16 years of age (32,224), 63.9% or 20,591 individuals are in the labor force, with 4.5% or 927 of them unemployed. The age group with the highest labor force participation rate is 25 to 29 years, with 86.6% or 2,530 individuals in the labor force. Within the labor force, the 16 to 19 years age range has the highest percentage of unemployed individuals, with 15.4% or 191 of them being unemployed.
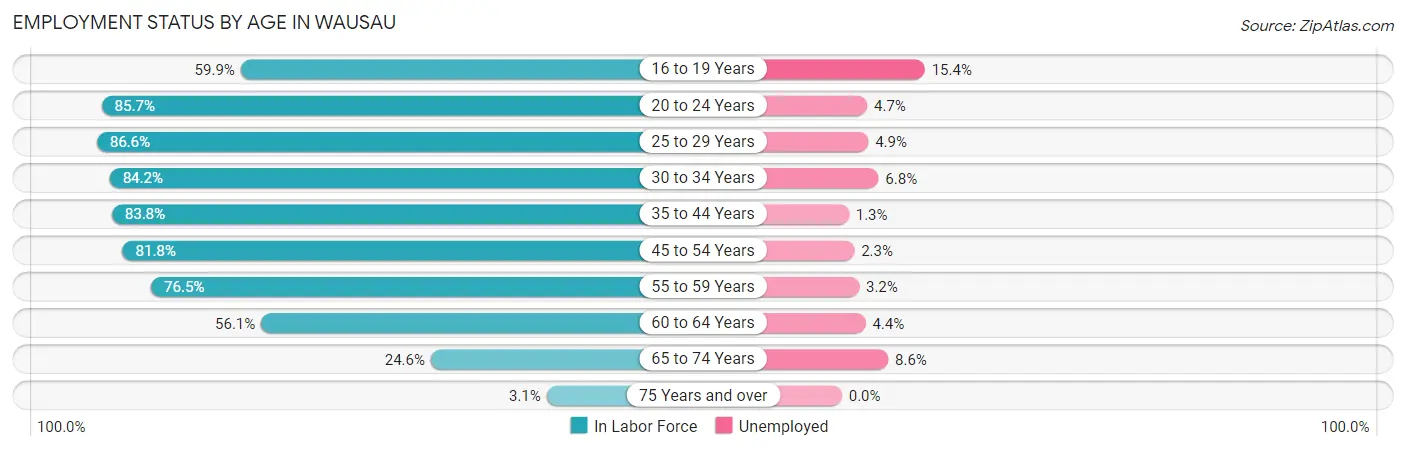
| Age Bracket | In Labor Force | Unemployed |
| 16 to 19 Years | 1,240 (59.9%) | 191 (15.4%) |
| 20 to 24 Years | 2,128 (85.7%) | 100 (4.7%) |
| 25 to 29 Years | 2,530 (86.6%) | 124 (4.9%) |
| 30 to 34 Years | 2,301 (84.2%) | 156 (6.8%) |
| 35 to 44 Years | 4,612 (83.8%) | 60 (1.3%) |
| 45 to 54 Years | 3,409 (81.8%) | 78 (2.3%) |
| 55 to 59 Years | 1,675 (76.5%) | 54 (3.2%) |
| 60 to 64 Years | 1,578 (56.1%) | 69 (4.4%) |
| 65 to 74 Years | 1,032 (24.6%) | 89 (8.6%) |
| 75 Years and over | 98 (3.1%) | 0 (0.0%) |
| Total | 20,591 (63.9%) | 927 (4.5%) |
Employment Status by Educational Attainment in Wausau
According to labor force statistics for Wausau, 79.2% of individuals (16,100) out of the total population between 25 and 64 years of age (20,328) are in the labor force, with 3.4% or 547 of them being unemployed. The group with the highest labor force participation rate are those with the educational attainment of bachelor's degree or higher, with 89.3% or 5,784 individuals in the labor force. Within the labor force, individuals with less than high school education have the highest percentage of unemployment, with 11.8% or 106 of them being unemployed.
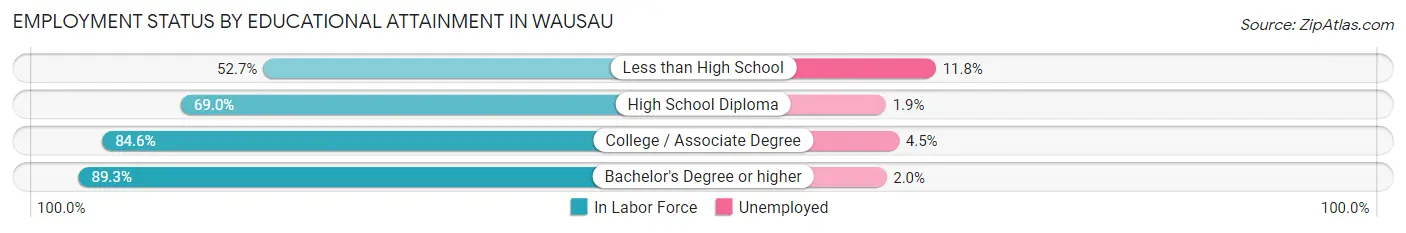
| Educational Attainment | In Labor Force | Unemployed |
| Less than High School | 895 (52.7%) | 200 (11.8%) |
| High School Diploma | 3,769 (69.0%) | 104 (1.9%) |
| College / Associate Degree | 5,660 (84.6%) | 301 (4.5%) |
| Bachelor's Degree or higher | 5,784 (89.3%) | 130 (2.0%) |
| Total | 16,100 (79.2%) | 691 (3.4%) |
Employment Occupations by Sex in Wausau
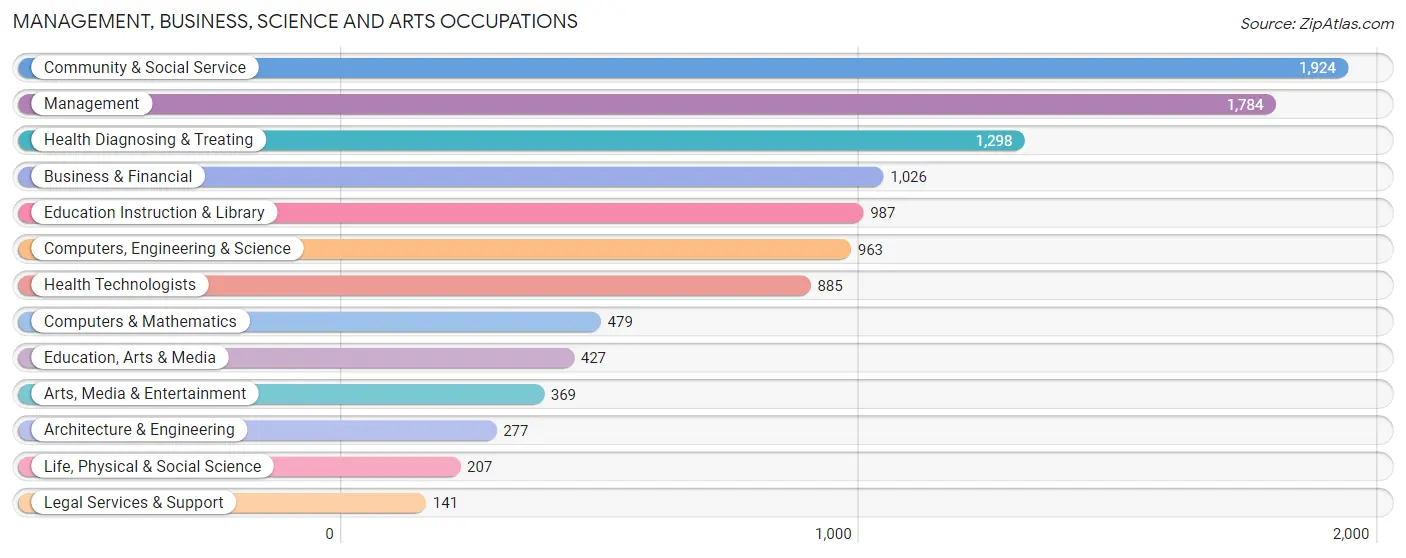
Management, Business, Science and Arts Occupations
The most common Management, Business, Science and Arts occupations in Wausau are Community & Social Service (1,924 | 9.8%), Management (1,784 | 9.1%), Health Diagnosing & Treating (1,298 | 6.6%), Business & Financial (1,026 | 5.2%), and Education Instruction & Library (987 | 5.0%).
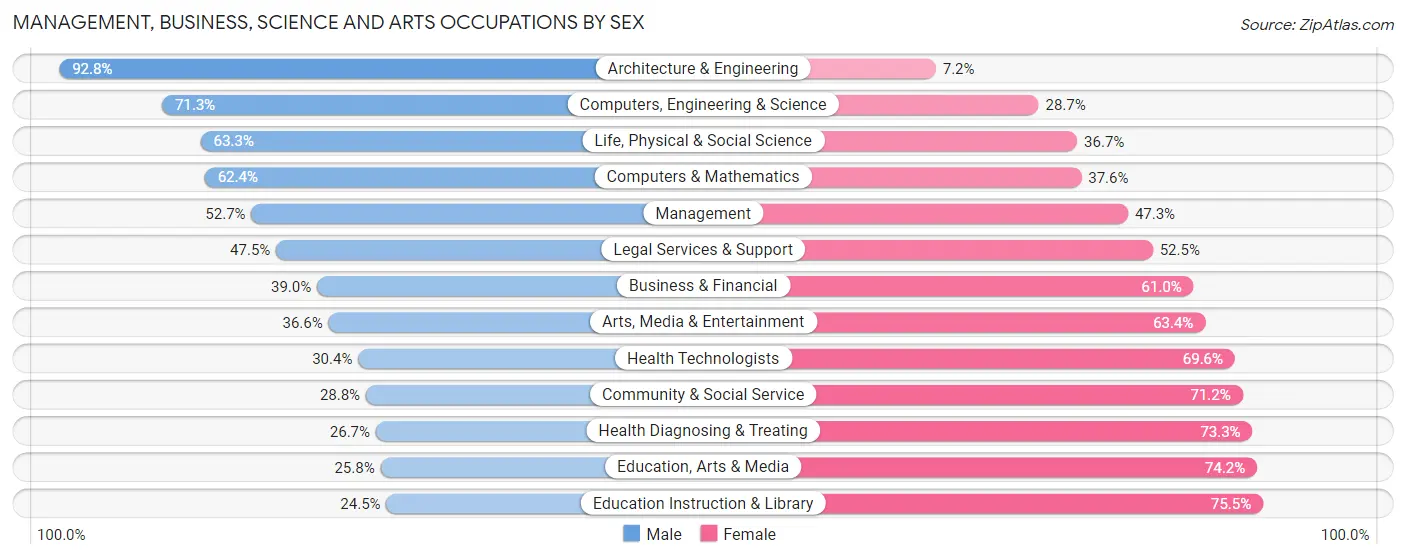
Management, Business, Science and Arts Occupations by Sex
Within the Management, Business, Science and Arts occupations in Wausau, the most male-oriented occupations are Architecture & Engineering (92.8%), Computers, Engineering & Science (71.3%), and Life, Physical & Social Science (63.3%), while the most female-oriented occupations are Education Instruction & Library (75.5%), Education, Arts & Media (74.2%), and Health Diagnosing & Treating (73.3%).
| Occupation | Male | Female |
| Management | 940 (52.7%) | 844 (47.3%) |
| Business & Financial | 400 (39.0%) | 626 (61.0%) |
| Computers, Engineering & Science | 687 (71.3%) | 276 (28.7%) |
| Computers & Mathematics | 299 (62.4%) | 180 (37.6%) |
| Architecture & Engineering | 257 (92.8%) | 20 (7.2%) |
| Life, Physical & Social Science | 131 (63.3%) | 76 (36.7%) |
| Community & Social Service | 554 (28.8%) | 1,370 (71.2%) |
| Education, Arts & Media | 110 (25.8%) | 317 (74.2%) |
| Legal Services & Support | 67 (47.5%) | 74 (52.5%) |
| Education Instruction & Library | 242 (24.5%) | 745 (75.5%) |
| Arts, Media & Entertainment | 135 (36.6%) | 234 (63.4%) |
| Health Diagnosing & Treating | 347 (26.7%) | 951 (73.3%) |
| Health Technologists | 269 (30.4%) | 616 (69.6%) |
| Total (Category) | 2,928 (41.9%) | 4,067 (58.1%) |
| Total (Overall) | 10,001 (50.8%) | 9,681 (49.2%) |
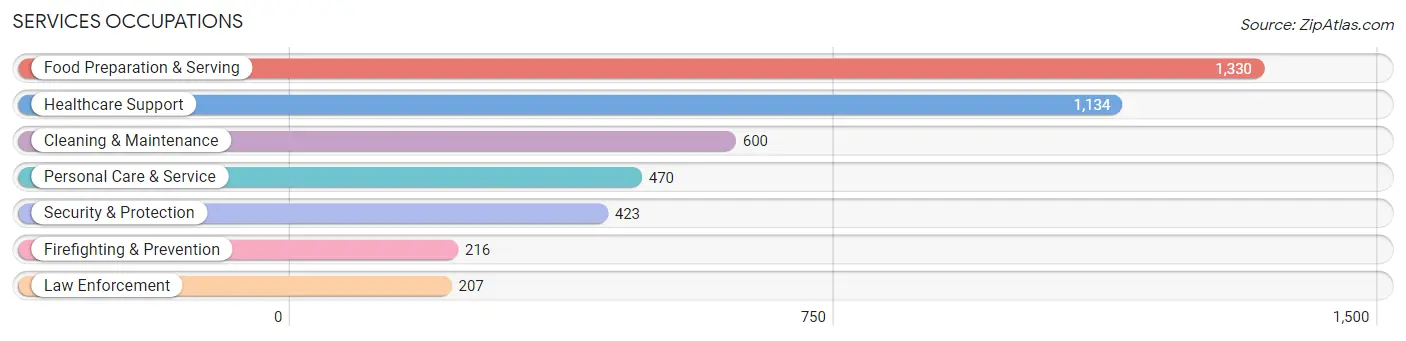
Services Occupations
The most common Services occupations in Wausau are Food Preparation & Serving (1,330 | 6.8%), Healthcare Support (1,134 | 5.8%), Cleaning & Maintenance (600 | 3.0%), Personal Care & Service (470 | 2.4%), and Security & Protection (423 | 2.1%).
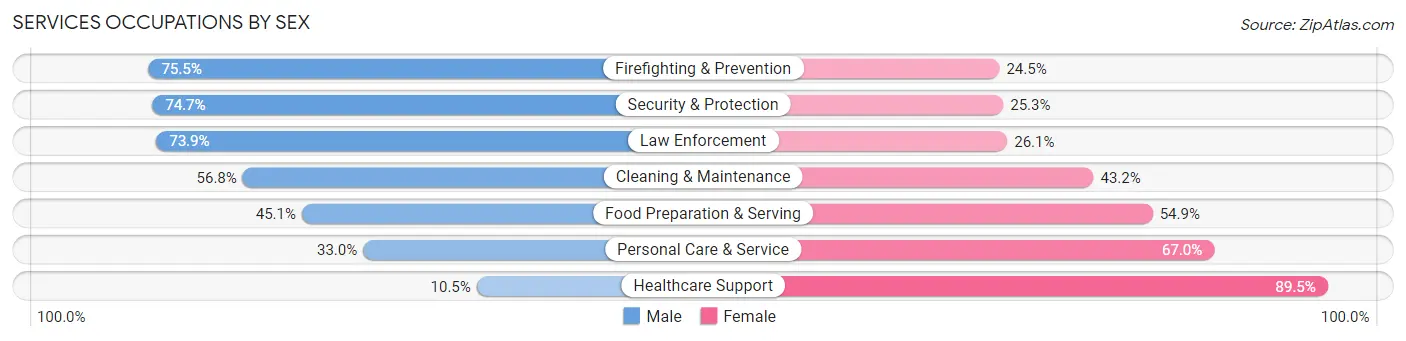
Services Occupations by Sex
Within the Services occupations in Wausau, the most male-oriented occupations are Firefighting & Prevention (75.5%), Security & Protection (74.7%), and Law Enforcement (73.9%), while the most female-oriented occupations are Healthcare Support (89.5%), Personal Care & Service (67.0%), and Food Preparation & Serving (54.9%).
| Occupation | Male | Female |
| Healthcare Support | 119 (10.5%) | 1,015 (89.5%) |
| Security & Protection | 316 (74.7%) | 107 (25.3%) |
| Firefighting & Prevention | 163 (75.5%) | 53 (24.5%) |
| Law Enforcement | 153 (73.9%) | 54 (26.1%) |
| Food Preparation & Serving | 600 (45.1%) | 730 (54.9%) |
| Cleaning & Maintenance | 341 (56.8%) | 259 (43.2%) |
| Personal Care & Service | 155 (33.0%) | 315 (67.0%) |
| Total (Category) | 1,531 (38.7%) | 2,426 (61.3%) |
| Total (Overall) | 10,001 (50.8%) | 9,681 (49.2%) |
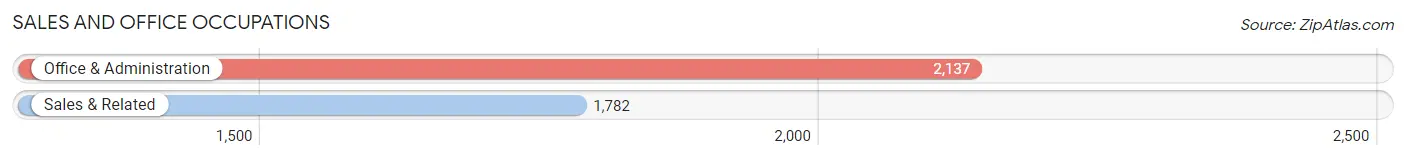
Sales and Office Occupations
The most common Sales and Office occupations in Wausau are Office & Administration (2,137 | 10.9%), and Sales & Related (1,782 | 9.0%).
Sales and Office Occupations by Sex
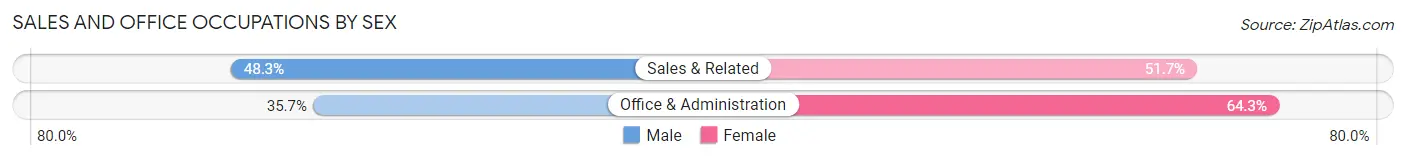
| Occupation | Male | Female |
| Sales & Related | 860 (48.3%) | 922 (51.7%) |
| Office & Administration | 762 (35.7%) | 1,375 (64.3%) |
| Total (Category) | 1,622 (41.4%) | 2,297 (58.6%) |
| Total (Overall) | 10,001 (50.8%) | 9,681 (49.2%) |
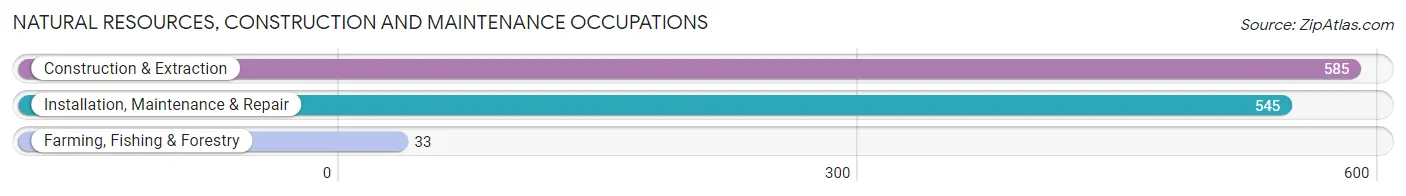
Natural Resources, Construction and Maintenance Occupations
The most common Natural Resources, Construction and Maintenance occupations in Wausau are Construction & Extraction (585 | 3.0%), Installation, Maintenance & Repair (545 | 2.8%), and Farming, Fishing & Forestry (33 | 0.2%).
Natural Resources, Construction and Maintenance Occupations by Sex
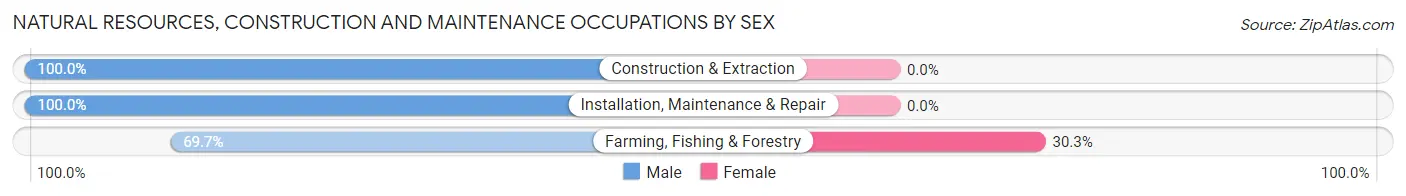
| Occupation | Male | Female |
| Farming, Fishing & Forestry | 23 (69.7%) | 10 (30.3%) |
| Construction & Extraction | 585 (100.0%) | 0 (0.0%) |
| Installation, Maintenance & Repair | 545 (100.0%) | 0 (0.0%) |
| Total (Category) | 1,153 (99.1%) | 10 (0.9%) |
| Total (Overall) | 10,001 (50.8%) | 9,681 (49.2%) |
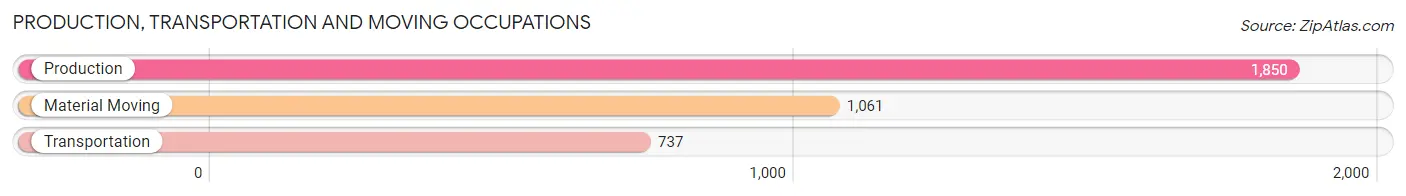
Production, Transportation and Moving Occupations
The most common Production, Transportation and Moving occupations in Wausau are Production (1,850 | 9.4%), Material Moving (1,061 | 5.4%), and Transportation (737 | 3.7%).
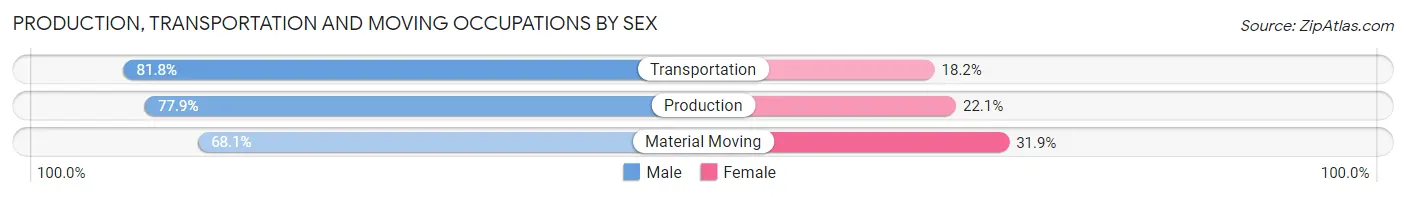
Production, Transportation and Moving Occupations by Sex
| Occupation | Male | Female |
| Production | 1,441 (77.9%) | 409 (22.1%) |
| Transportation | 603 (81.8%) | 134 (18.2%) |
| Material Moving | 723 (68.1%) | 338 (31.9%) |
| Total (Category) | 2,767 (75.8%) | 881 (24.1%) |
| Total (Overall) | 10,001 (50.8%) | 9,681 (49.2%) |
Employment Industries by Sex in Wausau
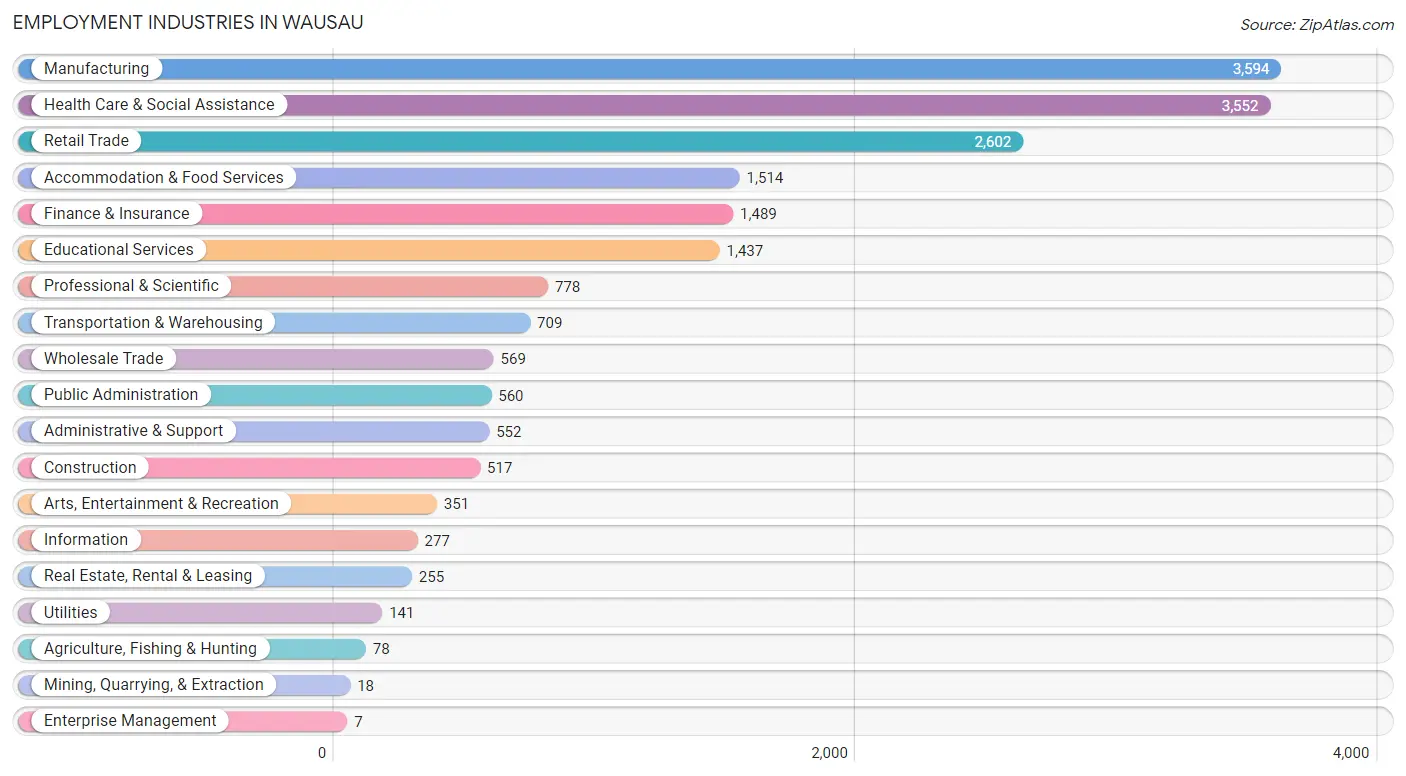
Employment Industries in Wausau
The major employment industries in Wausau include Manufacturing (3,594 | 18.3%), Health Care & Social Assistance (3,552 | 18.0%), Retail Trade (2,602 | 13.2%), Accommodation & Food Services (1,514 | 7.7%), and Finance & Insurance (1,489 | 7.6%).
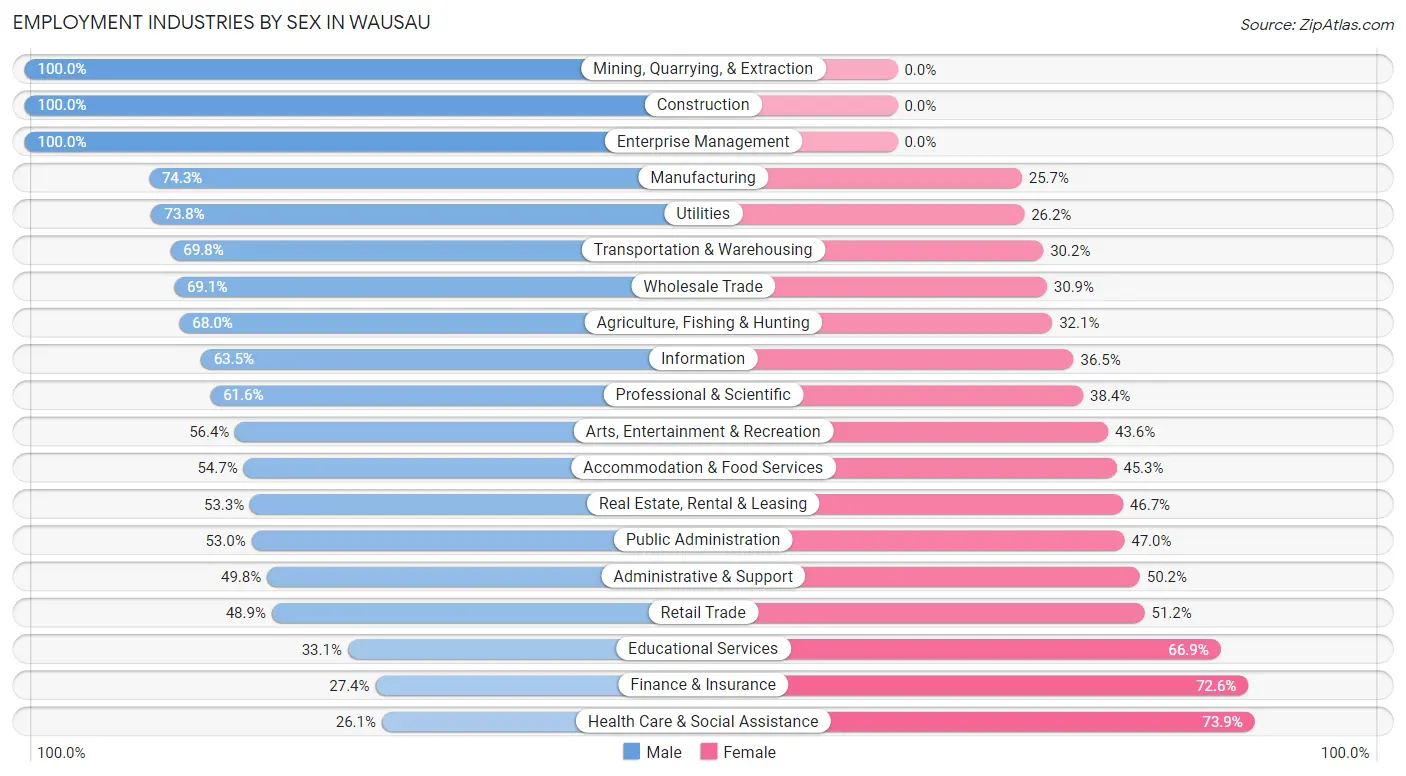
Employment Industries by Sex in Wausau
The Wausau industries that see more men than women are Mining, Quarrying, & Extraction (100.0%), Construction (100.0%), and Enterprise Management (100.0%), whereas the industries that tend to have a higher number of women are Health Care & Social Assistance (73.9%), Finance & Insurance (72.6%), and Educational Services (66.9%).
| Industry | Male | Female |
| Agriculture, Fishing & Hunting | 53 (67.9%) | 25 (32.1%) |
| Mining, Quarrying, & Extraction | 18 (100.0%) | 0 (0.0%) |
| Construction | 517 (100.0%) | 0 (0.0%) |
| Manufacturing | 2,669 (74.3%) | 925 (25.7%) |
| Wholesale Trade | 393 (69.1%) | 176 (30.9%) |
| Retail Trade | 1,271 (48.8%) | 1,331 (51.1%) |
| Transportation & Warehousing | 495 (69.8%) | 214 (30.2%) |
| Utilities | 104 (73.8%) | 37 (26.2%) |
| Information | 176 (63.5%) | 101 (36.5%) |
| Finance & Insurance | 408 (27.4%) | 1,081 (72.6%) |
| Real Estate, Rental & Leasing | 136 (53.3%) | 119 (46.7%) |
| Professional & Scientific | 479 (61.6%) | 299 (38.4%) |
| Enterprise Management | 7 (100.0%) | 0 (0.0%) |
| Administrative & Support | 275 (49.8%) | 277 (50.2%) |
| Educational Services | 476 (33.1%) | 961 (66.9%) |
| Health Care & Social Assistance | 926 (26.1%) | 2,626 (73.9%) |
| Arts, Entertainment & Recreation | 198 (56.4%) | 153 (43.6%) |
| Accommodation & Food Services | 828 (54.7%) | 686 (45.3%) |
| Public Administration | 297 (53.0%) | 263 (47.0%) |
| Total | 10,001 (50.8%) | 9,681 (49.2%) |
Education in Wausau
School Enrollment in Wausau
The most common levels of schooling among the 8,400 students in Wausau are elementary school (1,998 | 23.8%), middle school (1,982 | 23.6%), and high school (1,809 | 21.5%).
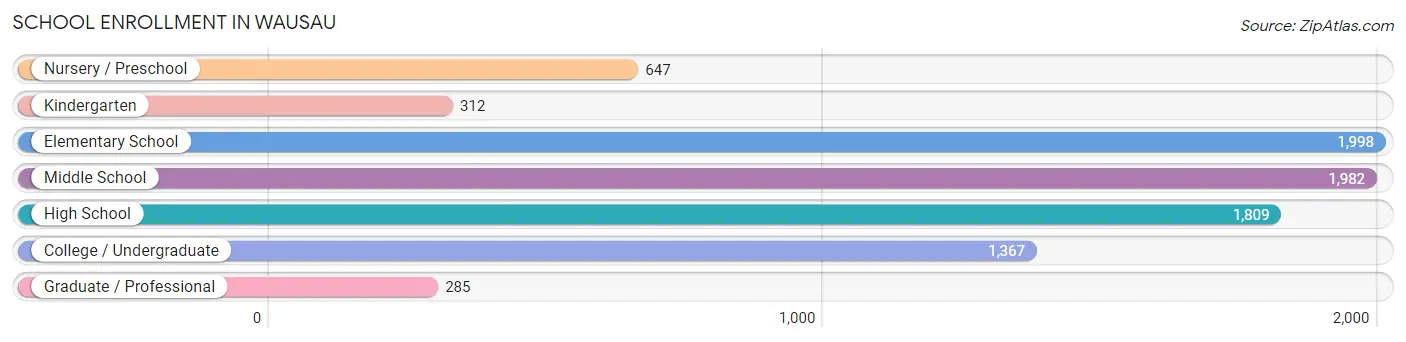
| School Level | # Students | % Students |
| Nursery / Preschool | 647 | 7.7% |
| Kindergarten | 312 | 3.7% |
| Elementary School | 1,998 | 23.8% |
| Middle School | 1,982 | 23.6% |
| High School | 1,809 | 21.5% |
| College / Undergraduate | 1,367 | 16.3% |
| Graduate / Professional | 285 | 3.4% |
| Total | 8,400 | 100.0% |
School Enrollment by Age by Funding Source in Wausau
Out of a total of 8,400 students who are enrolled in schools in Wausau, 1,092 (13.0%) attend a private institution, while the remaining 7,308 (87.0%) are enrolled in public schools. The age group of 3 to 4 year olds has the highest likelihood of being enrolled in private schools, with 100 (31.6% in the age bracket) enrolled. Conversely, the age group of 20 to 24 year olds has the lowest likelihood of being enrolled in a private school, with 399 (93.4% in the age bracket) attending a public institution.
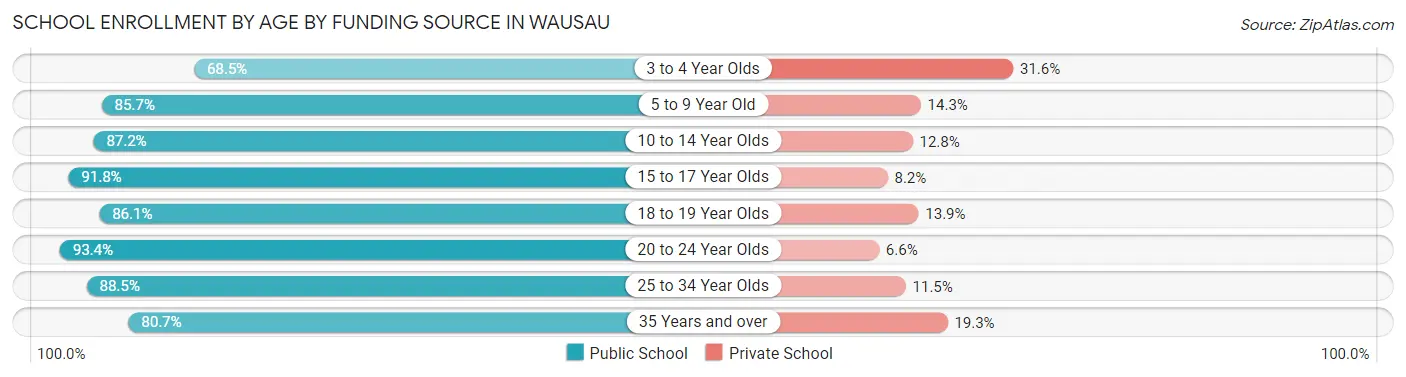
| Age Bracket | Public School | Private School |
| 3 to 4 Year Olds | 217 (68.4%) | 100 (31.6%) |
| 5 to 9 Year Old | 2,025 (85.7%) | 339 (14.3%) |
| 10 to 14 Year Olds | 2,065 (87.2%) | 304 (12.8%) |
| 15 to 17 Year Olds | 1,371 (91.8%) | 122 (8.2%) |
| 18 to 19 Year Olds | 421 (86.1%) | 68 (13.9%) |
| 20 to 24 Year Olds | 399 (93.4%) | 28 (6.6%) |
| 25 to 34 Year Olds | 544 (88.5%) | 71 (11.5%) |
| 35 Years and over | 263 (80.7%) | 63 (19.3%) |
| Total | 7,308 (87.0%) | 1,092 (13.0%) |
Educational Attainment by Field of Study in Wausau
Business (1,699 | 17.4%), education (1,413 | 14.5%), science & technology (958 | 9.8%), bio, nature & agricultural (875 | 9.0%), and arts & humanities (637 | 6.5%) are the most common fields of study among 9,768 individuals in Wausau who have obtained a bachelor's degree or higher.
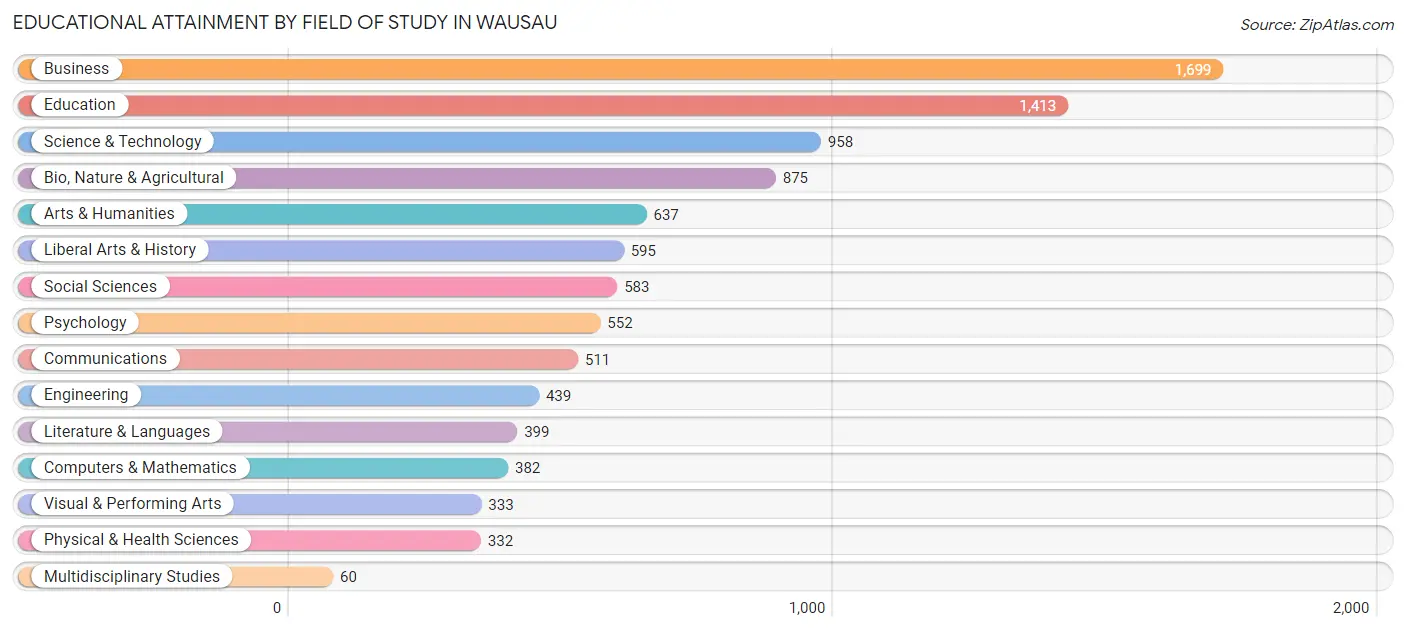
| Field of Study | # Graduates | % Graduates |
| Computers & Mathematics | 382 | 3.9% |
| Bio, Nature & Agricultural | 875 | 9.0% |
| Physical & Health Sciences | 332 | 3.4% |
| Psychology | 552 | 5.7% |
| Social Sciences | 583 | 6.0% |
| Engineering | 439 | 4.5% |
| Multidisciplinary Studies | 60 | 0.6% |
| Science & Technology | 958 | 9.8% |
| Business | 1,699 | 17.4% |
| Education | 1,413 | 14.5% |
| Literature & Languages | 399 | 4.1% |
| Liberal Arts & History | 595 | 6.1% |
| Visual & Performing Arts | 333 | 3.4% |
| Communications | 511 | 5.2% |
| Arts & Humanities | 637 | 6.5% |
| Total | 9,768 | 100.0% |
Transportation & Commute in Wausau
Vehicle Availability by Sex in Wausau
The most prevalent vehicle ownership categories in Wausau are males with 2 vehicles (4,736, accounting for 48.0%) and females with 2 vehicles (4,345, making up 50.5%).
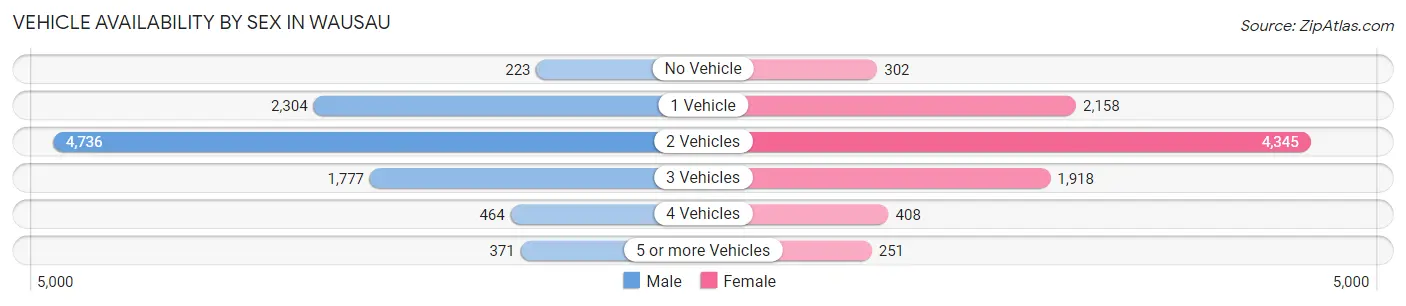
| Vehicles Available | Male | Female |
| No Vehicle | 223 (2.3%) | 302 (3.2%) |
| 1 Vehicle | 2,304 (23.3%) | 2,158 (23.0%) |
| 2 Vehicles | 4,736 (48.0%) | 4,345 (46.3%) |
| 3 Vehicles | 1,777 (18.0%) | 1,918 (20.4%) |
| 4 Vehicles | 464 (4.7%) | 408 (4.3%) |
| 5 or more Vehicles | 371 (3.8%) | 251 (2.7%) |
| Total | 9,875 (100.0%) | 9,382 (100.0%) |
Commute Time in Wausau
The most frequently occuring commute durations in Wausau are 15 to 19 minutes (4,303 commuters, 24.7%), 10 to 14 minutes (4,230 commuters, 24.2%), and 5 to 9 minutes (3,502 commuters, 20.1%).
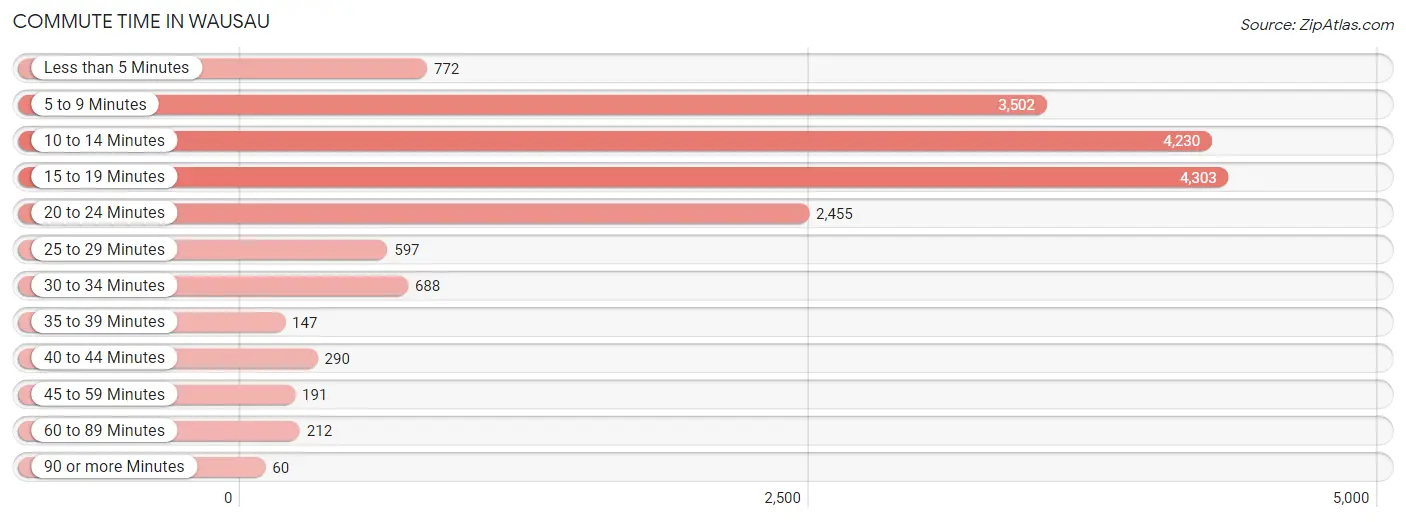
| Commute Time | # Commuters | % Commuters |
| Less than 5 Minutes | 772 | 4.4% |
| 5 to 9 Minutes | 3,502 | 20.1% |
| 10 to 14 Minutes | 4,230 | 24.2% |
| 15 to 19 Minutes | 4,303 | 24.7% |
| 20 to 24 Minutes | 2,455 | 14.1% |
| 25 to 29 Minutes | 597 | 3.4% |
| 30 to 34 Minutes | 688 | 3.9% |
| 35 to 39 Minutes | 147 | 0.8% |
| 40 to 44 Minutes | 290 | 1.7% |
| 45 to 59 Minutes | 191 | 1.1% |
| 60 to 89 Minutes | 212 | 1.2% |
| 90 or more Minutes | 60 | 0.3% |
Commute Time by Sex in Wausau
The most common commute times in Wausau are 15 to 19 minutes (2,424 commuters, 26.5%) for males and 10 to 14 minutes (2,482 commuters, 30.0%) for females.
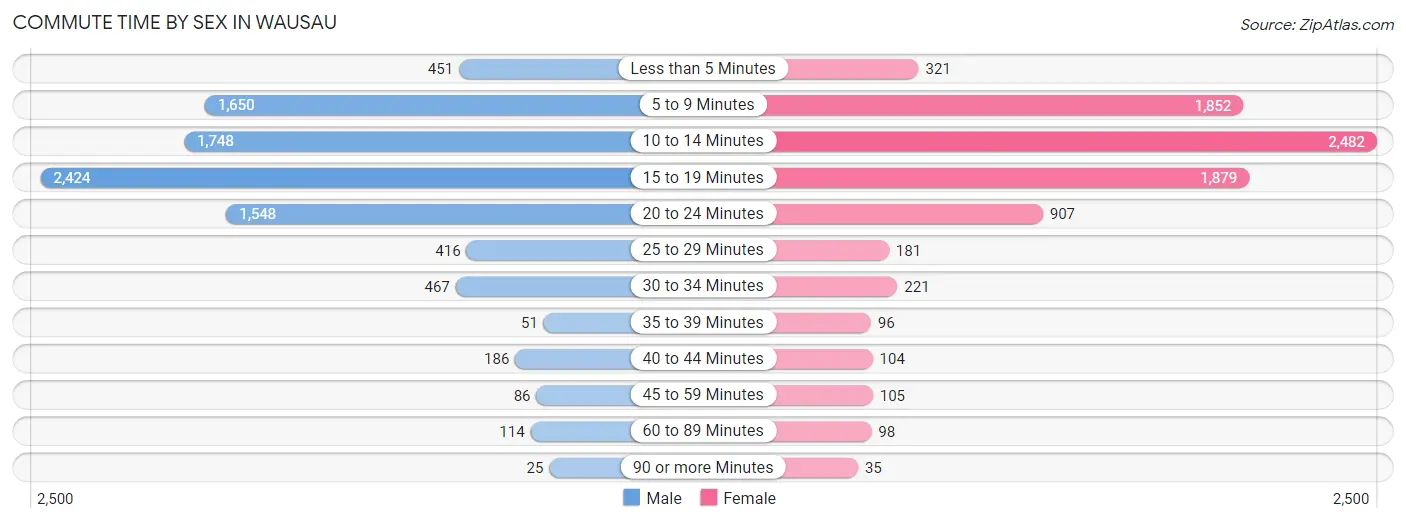
| Commute Time | Male | Female |
| Less than 5 Minutes | 451 (4.9%) | 321 (3.9%) |
| 5 to 9 Minutes | 1,650 (18.0%) | 1,852 (22.4%) |
| 10 to 14 Minutes | 1,748 (19.1%) | 2,482 (30.0%) |
| 15 to 19 Minutes | 2,424 (26.5%) | 1,879 (22.7%) |
| 20 to 24 Minutes | 1,548 (16.9%) | 907 (11.0%) |
| 25 to 29 Minutes | 416 (4.5%) | 181 (2.2%) |
| 30 to 34 Minutes | 467 (5.1%) | 221 (2.7%) |
| 35 to 39 Minutes | 51 (0.6%) | 96 (1.2%) |
| 40 to 44 Minutes | 186 (2.0%) | 104 (1.3%) |
| 45 to 59 Minutes | 86 (0.9%) | 105 (1.3%) |
| 60 to 89 Minutes | 114 (1.2%) | 98 (1.2%) |
| 90 or more Minutes | 25 (0.3%) | 35 (0.4%) |
Time of Departure to Work by Sex in Wausau
The most frequent times of departure to work in Wausau are 7:30 AM to 7:59 AM (1,224, 13.4%) for males and 7:30 AM to 7:59 AM (1,430, 17.3%) for females.
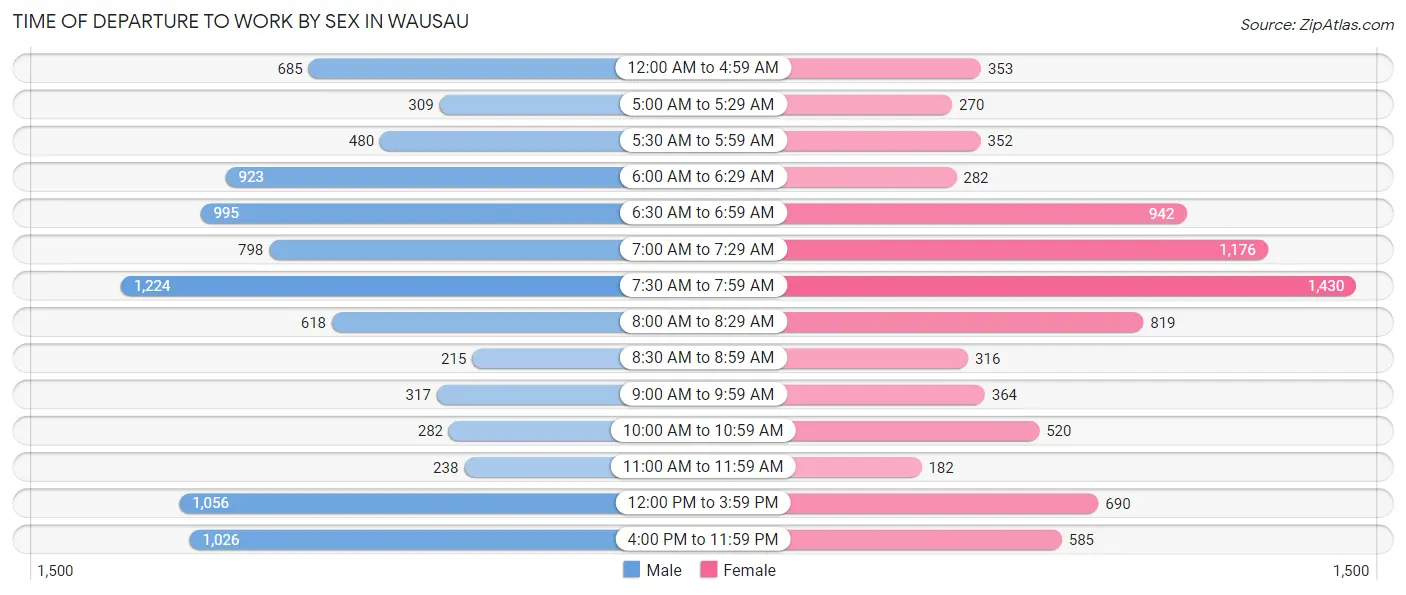
| Time of Departure | Male | Female |
| 12:00 AM to 4:59 AM | 685 (7.5%) | 353 (4.3%) |
| 5:00 AM to 5:29 AM | 309 (3.4%) | 270 (3.3%) |
| 5:30 AM to 5:59 AM | 480 (5.2%) | 352 (4.3%) |
| 6:00 AM to 6:29 AM | 923 (10.1%) | 282 (3.4%) |
| 6:30 AM to 6:59 AM | 995 (10.9%) | 942 (11.4%) |
| 7:00 AM to 7:29 AM | 798 (8.7%) | 1,176 (14.2%) |
| 7:30 AM to 7:59 AM | 1,224 (13.4%) | 1,430 (17.3%) |
| 8:00 AM to 8:29 AM | 618 (6.7%) | 819 (9.9%) |
| 8:30 AM to 8:59 AM | 215 (2.4%) | 316 (3.8%) |
| 9:00 AM to 9:59 AM | 317 (3.5%) | 364 (4.4%) |
| 10:00 AM to 10:59 AM | 282 (3.1%) | 520 (6.3%) |
| 11:00 AM to 11:59 AM | 238 (2.6%) | 182 (2.2%) |
| 12:00 PM to 3:59 PM | 1,056 (11.5%) | 690 (8.3%) |
| 4:00 PM to 11:59 PM | 1,026 (11.2%) | 585 (7.1%) |
| Total | 9,166 (100.0%) | 8,281 (100.0%) |
Housing Occupancy in Wausau
Occupancy by Ownership in Wausau
Of the total 17,300 dwellings in Wausau, owner-occupied units account for 10,174 (58.8%), while renter-occupied units make up 7,126 (41.2%).
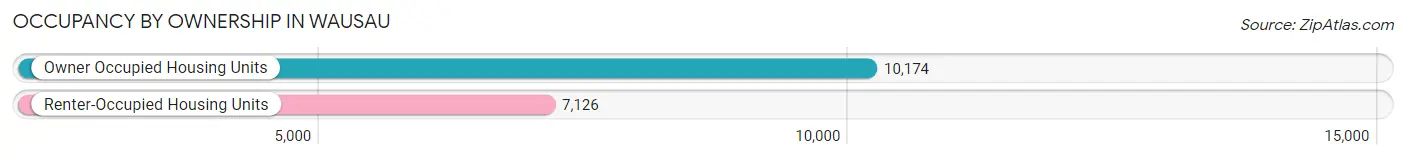
| Occupancy | # Housing Units | % Housing Units |
| Owner Occupied Housing Units | 10,174 | 58.8% |
| Renter-Occupied Housing Units | 7,126 | 41.2% |
| Total Occupied Housing Units | 17,300 | 100.0% |
Occupancy by Household Size in Wausau
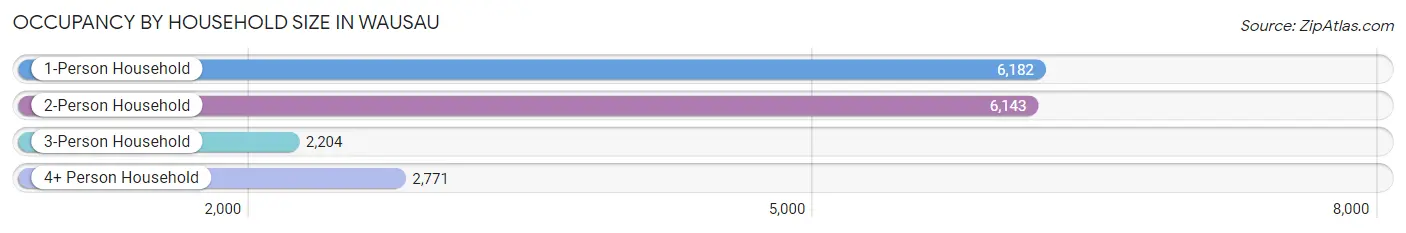
| Household Size | # Housing Units | % Housing Units |
| 1-Person Household | 6,182 | 35.7% |
| 2-Person Household | 6,143 | 35.5% |
| 3-Person Household | 2,204 | 12.7% |
| 4+ Person Household | 2,771 | 16.0% |
| Total Housing Units | 17,300 | 100.0% |
Occupancy by Ownership by Household Size in Wausau
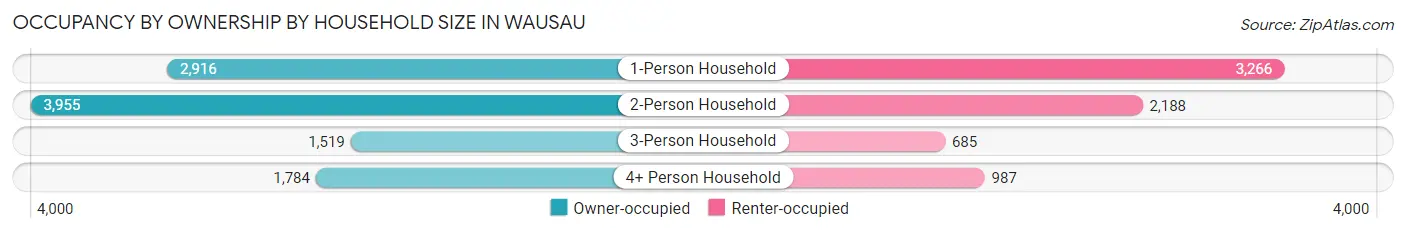
| Household Size | Owner-occupied | Renter-occupied |
| 1-Person Household | 2,916 (47.2%) | 3,266 (52.8%) |
| 2-Person Household | 3,955 (64.4%) | 2,188 (35.6%) |
| 3-Person Household | 1,519 (68.9%) | 685 (31.1%) |
| 4+ Person Household | 1,784 (64.4%) | 987 (35.6%) |
| Total Housing Units | 10,174 (58.8%) | 7,126 (41.2%) |
Occupancy by Educational Attainment in Wausau
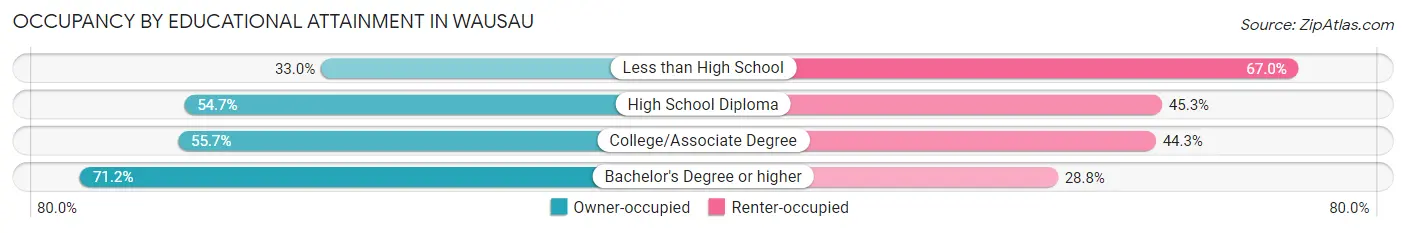
| Household Size | Owner-occupied | Renter-occupied |
| Less than High School | 388 (33.0%) | 788 (67.0%) |
| High School Diploma | 2,545 (54.7%) | 2,109 (45.3%) |
| College/Associate Degree | 3,318 (55.7%) | 2,643 (44.3%) |
| Bachelor's Degree or higher | 3,923 (71.2%) | 1,586 (28.8%) |
Occupancy by Age of Householder in Wausau
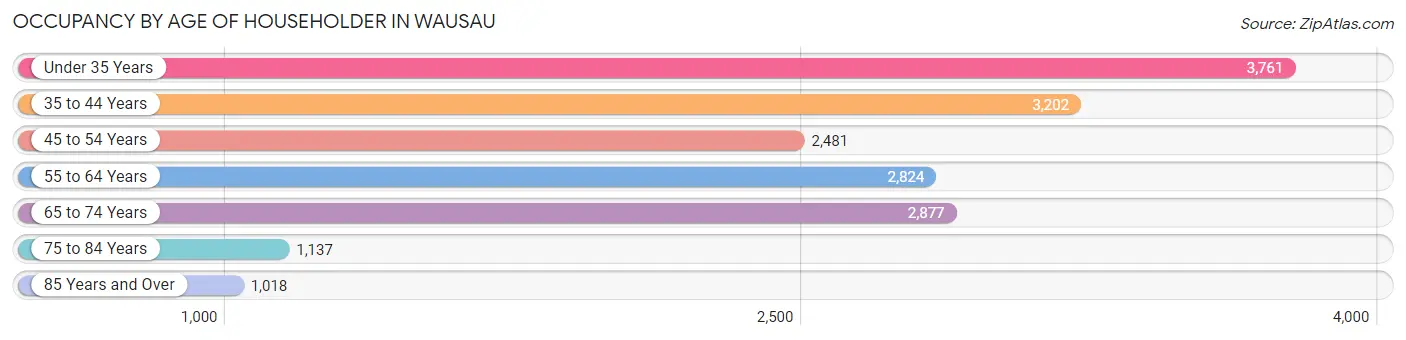
| Age Bracket | # Households | % Households |
| Under 35 Years | 3,761 | 21.7% |
| 35 to 44 Years | 3,202 | 18.5% |
| 45 to 54 Years | 2,481 | 14.3% |
| 55 to 64 Years | 2,824 | 16.3% |
| 65 to 74 Years | 2,877 | 16.6% |
| 75 to 84 Years | 1,137 | 6.6% |
| 85 Years and Over | 1,018 | 5.9% |
| Total | 17,300 | 100.0% |
Housing Finances in Wausau
Median Income by Occupancy in Wausau
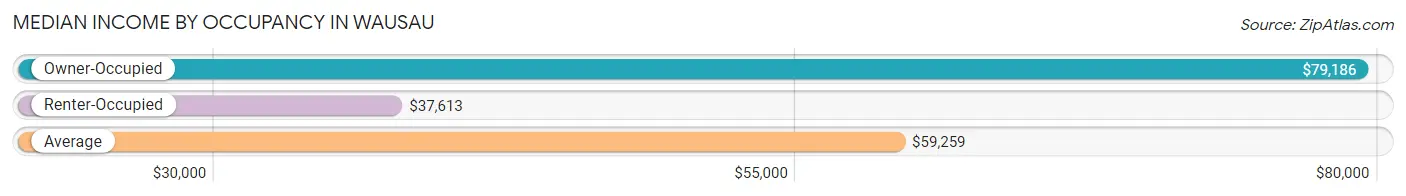
| Occupancy Type | # Households | Median Income |
| Owner-Occupied | 10,174 (58.8%) | $79,186 |
| Renter-Occupied | 7,126 (41.2%) | $37,613 |
| Average | 17,300 (100.0%) | $59,259 |
Occupancy by Householder Income Bracket in Wausau
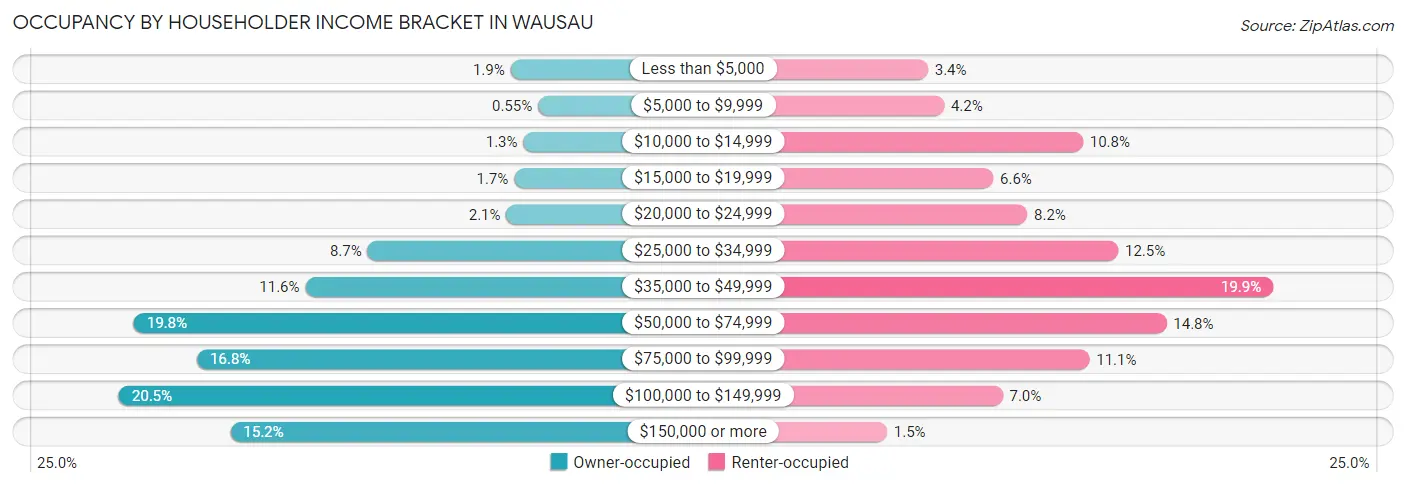
| Income Bracket | Owner-occupied | Renter-occupied |
| Less than $5,000 | 189 (1.9%) | 245 (3.4%) |
| $5,000 to $9,999 | 56 (0.5%) | 300 (4.2%) |
| $10,000 to $14,999 | 127 (1.3%) | 771 (10.8%) |
| $15,000 to $19,999 | 172 (1.7%) | 467 (6.6%) |
| $20,000 to $24,999 | 210 (2.1%) | 582 (8.2%) |
| $25,000 to $34,999 | 882 (8.7%) | 891 (12.5%) |
| $35,000 to $49,999 | 1,183 (11.6%) | 1,417 (19.9%) |
| $50,000 to $74,999 | 2,014 (19.8%) | 1,055 (14.8%) |
| $75,000 to $99,999 | 1,708 (16.8%) | 793 (11.1%) |
| $100,000 to $149,999 | 2,087 (20.5%) | 499 (7.0%) |
| $150,000 or more | 1,546 (15.2%) | 106 (1.5%) |
| Total | 10,174 (100.0%) | 7,126 (100.0%) |
Monthly Housing Cost Tiers in Wausau
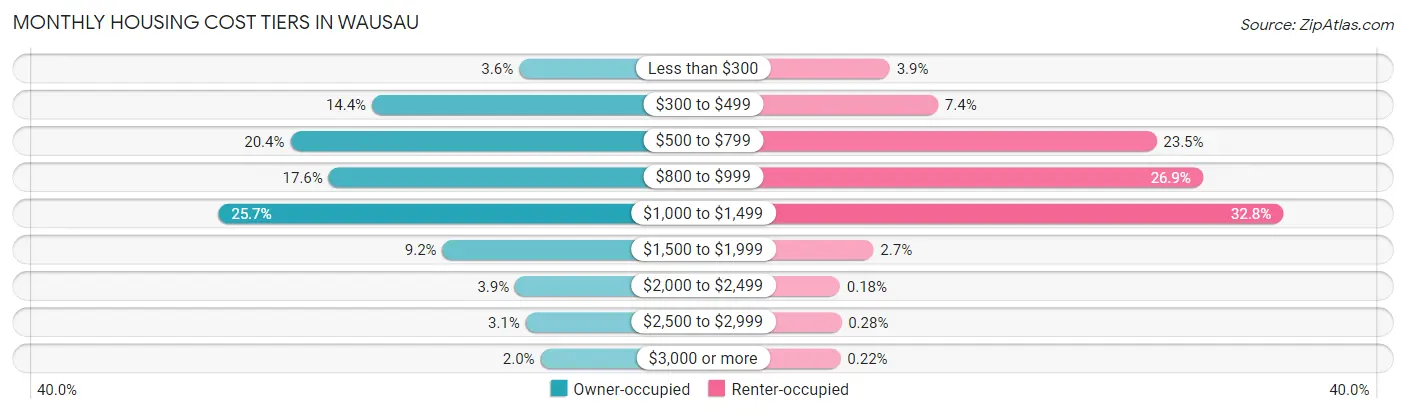
| Monthly Cost | Owner-occupied | Renter-occupied |
| Less than $300 | 365 (3.6%) | 274 (3.8%) |
| $300 to $499 | 1,467 (14.4%) | 527 (7.4%) |
| $500 to $799 | 2,079 (20.4%) | 1,674 (23.5%) |
| $800 to $999 | 1,792 (17.6%) | 1,917 (26.9%) |
| $1,000 to $1,499 | 2,618 (25.7%) | 2,339 (32.8%) |
| $1,500 to $1,999 | 939 (9.2%) | 189 (2.6%) |
| $2,000 to $2,499 | 395 (3.9%) | 13 (0.2%) |
| $2,500 to $2,999 | 315 (3.1%) | 20 (0.3%) |
| $3,000 or more | 204 (2.0%) | 16 (0.2%) |
| Total | 10,174 (100.0%) | 7,126 (100.0%) |
Physical Housing Characteristics in Wausau
Housing Structures in Wausau
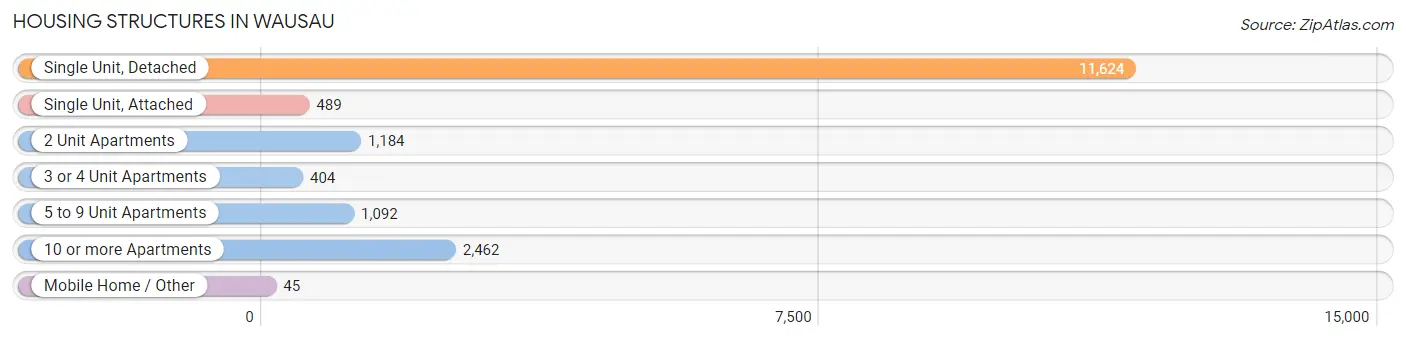
| Structure Type | # Housing Units | % Housing Units |
| Single Unit, Detached | 11,624 | 67.2% |
| Single Unit, Attached | 489 | 2.8% |
| 2 Unit Apartments | 1,184 | 6.8% |
| 3 or 4 Unit Apartments | 404 | 2.3% |
| 5 to 9 Unit Apartments | 1,092 | 6.3% |
| 10 or more Apartments | 2,462 | 14.2% |
| Mobile Home / Other | 45 | 0.3% |
| Total | 17,300 | 100.0% |
Housing Structures by Occupancy in Wausau
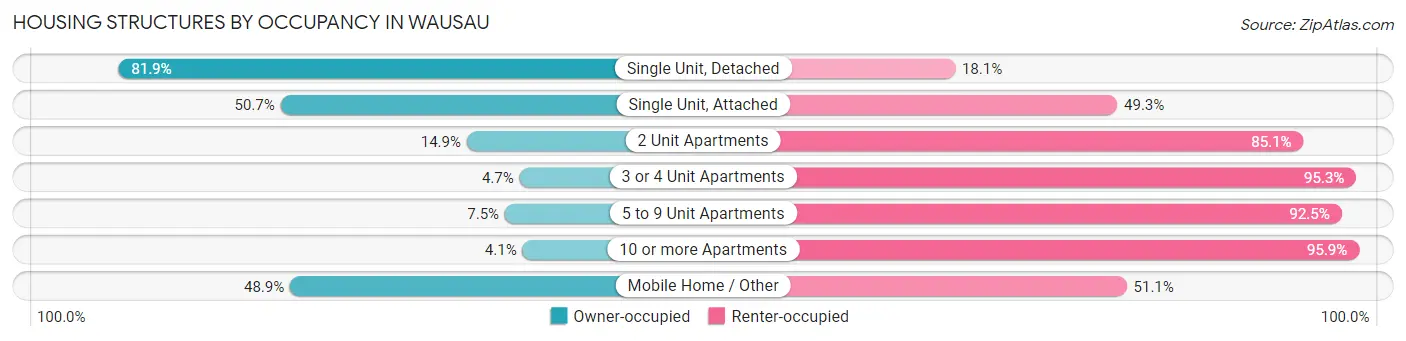
| Structure Type | Owner-occupied | Renter-occupied |
| Single Unit, Detached | 9,525 (81.9%) | 2,099 (18.1%) |
| Single Unit, Attached | 248 (50.7%) | 241 (49.3%) |
| 2 Unit Apartments | 176 (14.9%) | 1,008 (85.1%) |
| 3 or 4 Unit Apartments | 19 (4.7%) | 385 (95.3%) |
| 5 to 9 Unit Apartments | 82 (7.5%) | 1,010 (92.5%) |
| 10 or more Apartments | 102 (4.1%) | 2,360 (95.9%) |
| Mobile Home / Other | 22 (48.9%) | 23 (51.1%) |
| Total | 10,174 (58.8%) | 7,126 (41.2%) |
Housing Structures by Number of Rooms in Wausau
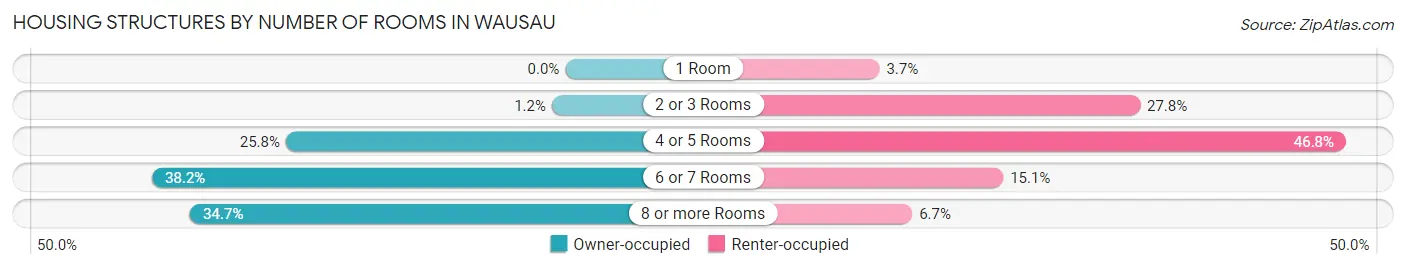
| Number of Rooms | Owner-occupied | Renter-occupied |
| 1 Room | 0 (0.0%) | 261 (3.7%) |
| 2 or 3 Rooms | 126 (1.2%) | 1,978 (27.8%) |
| 4 or 5 Rooms | 2,629 (25.8%) | 3,334 (46.8%) |
| 6 or 7 Rooms | 3,889 (38.2%) | 1,076 (15.1%) |
| 8 or more Rooms | 3,530 (34.7%) | 477 (6.7%) |
| Total | 10,174 (100.0%) | 7,126 (100.0%) |
Housing Structure by Heating Type in Wausau
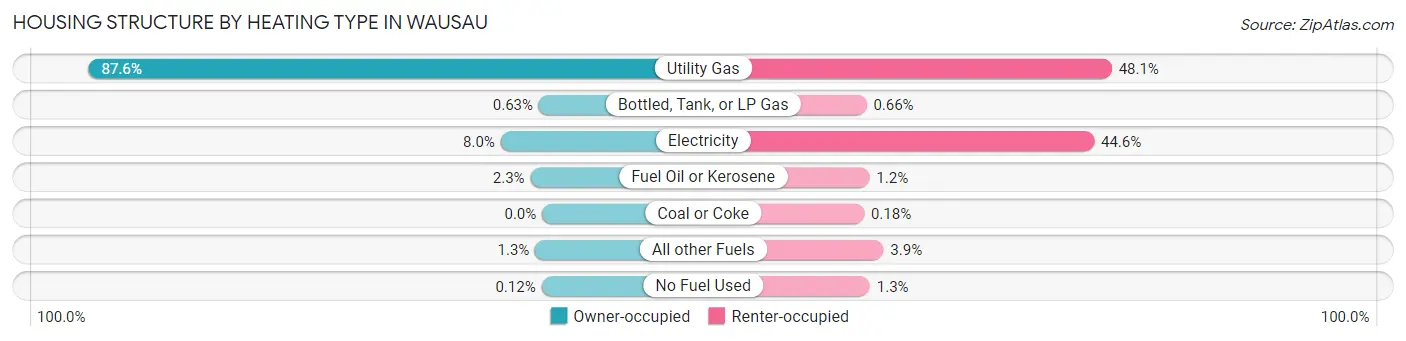
| Heating Type | Owner-occupied | Renter-occupied |
| Utility Gas | 8,917 (87.6%) | 3,424 (48.0%) |
| Bottled, Tank, or LP Gas | 64 (0.6%) | 47 (0.7%) |
| Electricity | 815 (8.0%) | 3,181 (44.6%) |
| Fuel Oil or Kerosene | 230 (2.3%) | 88 (1.2%) |
| Coal or Coke | 0 (0.0%) | 13 (0.2%) |
| All other Fuels | 136 (1.3%) | 280 (3.9%) |
| No Fuel Used | 12 (0.1%) | 93 (1.3%) |
| Total | 10,174 (100.0%) | 7,126 (100.0%) |
Household Vehicle Usage in Wausau
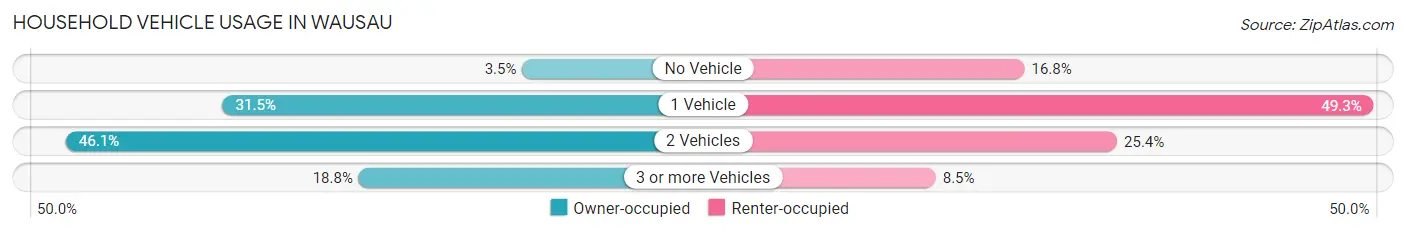
| Vehicles per Household | Owner-occupied | Renter-occupied |
| No Vehicle | 360 (3.5%) | 1,195 (16.8%) |
| 1 Vehicle | 3,206 (31.5%) | 3,516 (49.3%) |
| 2 Vehicles | 4,694 (46.1%) | 1,811 (25.4%) |
| 3 or more Vehicles | 1,914 (18.8%) | 604 (8.5%) |
| Total | 10,174 (100.0%) | 7,126 (100.0%) |
Real Estate & Mortgages in Wausau
Real Estate and Mortgage Overview in Wausau
| Characteristic | Without Mortgage | With Mortgage |
| Housing Units | 4,262 | 5,912 |
| Median Property Value | $141,900 | $150,100 |
| Median Household Income | $63,598 | $1,092 |
| Monthly Housing Costs | $537 | $204 |
| Real Estate Taxes | $2,838 | $32 |
Property Value by Mortgage Status in Wausau
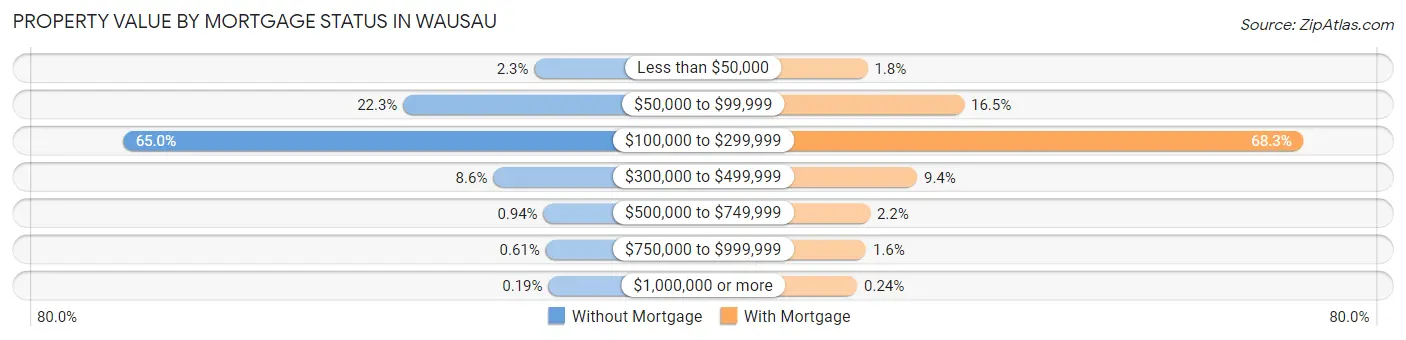
| Property Value | Without Mortgage | With Mortgage |
| Less than $50,000 | 99 (2.3%) | 107 (1.8%) |
| $50,000 to $99,999 | 951 (22.3%) | 977 (16.5%) |
| $100,000 to $299,999 | 2,772 (65.0%) | 4,036 (68.3%) |
| $300,000 to $499,999 | 366 (8.6%) | 554 (9.4%) |
| $500,000 to $749,999 | 40 (0.9%) | 130 (2.2%) |
| $750,000 to $999,999 | 26 (0.6%) | 94 (1.6%) |
| $1,000,000 or more | 8 (0.2%) | 14 (0.2%) |
| Total | 4,262 (100.0%) | 5,912 (100.0%) |
Household Income by Mortgage Status in Wausau
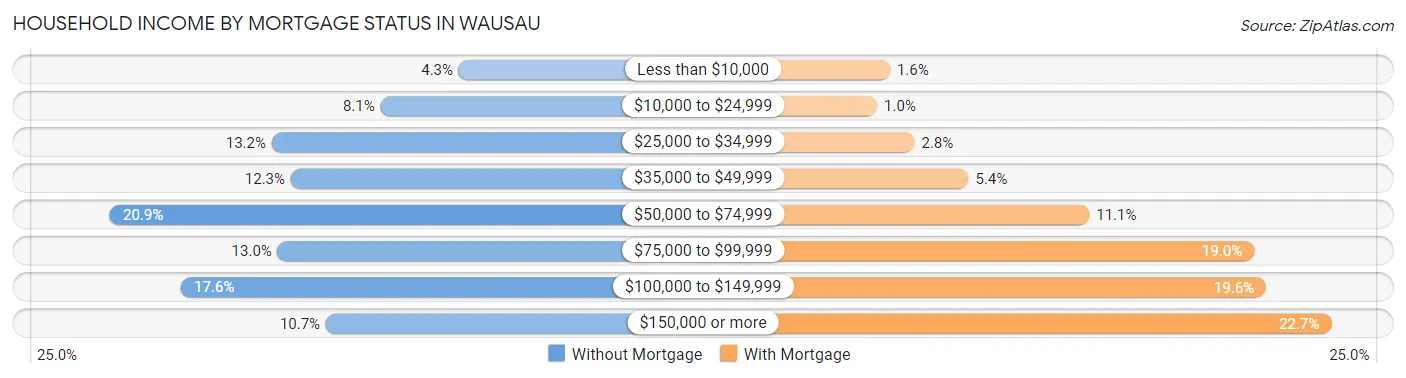
| Household Income | Without Mortgage | With Mortgage |
| Less than $10,000 | 184 (4.3%) | 97 (1.6%) |
| $10,000 to $24,999 | 343 (8.1%) | 61 (1.0%) |
| $25,000 to $34,999 | 564 (13.2%) | 166 (2.8%) |
| $35,000 to $49,999 | 525 (12.3%) | 318 (5.4%) |
| $50,000 to $74,999 | 892 (20.9%) | 658 (11.1%) |
| $75,000 to $99,999 | 552 (13.0%) | 1,122 (19.0%) |
| $100,000 to $149,999 | 748 (17.5%) | 1,156 (19.6%) |
| $150,000 or more | 454 (10.6%) | 1,339 (22.7%) |
| Total | 4,262 (100.0%) | 5,912 (100.0%) |
Property Value to Household Income Ratio in Wausau
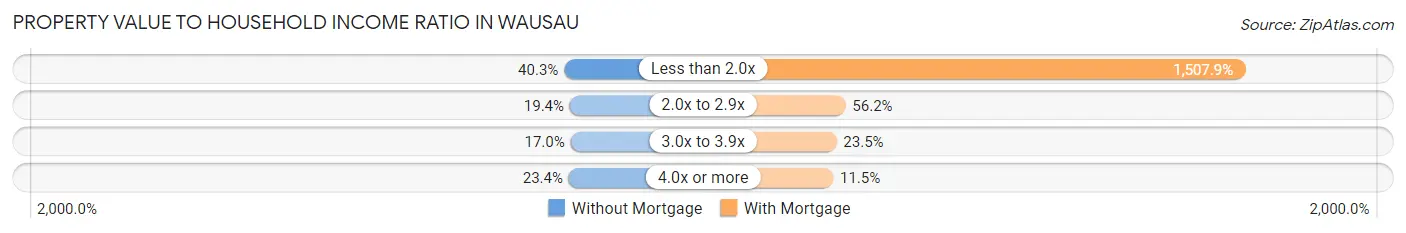
| Value-to-Income Ratio | Without Mortgage | With Mortgage |
| Less than 2.0x | 1,716 (40.3%) | 89,148 (1,507.9%) |
| 2.0x to 2.9x | 827 (19.4%) | 3,324 (56.2%) |
| 3.0x to 3.9x | 723 (17.0%) | 1,390 (23.5%) |
| 4.0x or more | 996 (23.4%) | 677 (11.5%) |
| Total | 4,262 (100.0%) | 5,912 (100.0%) |
Real Estate Taxes by Mortgage Status in Wausau
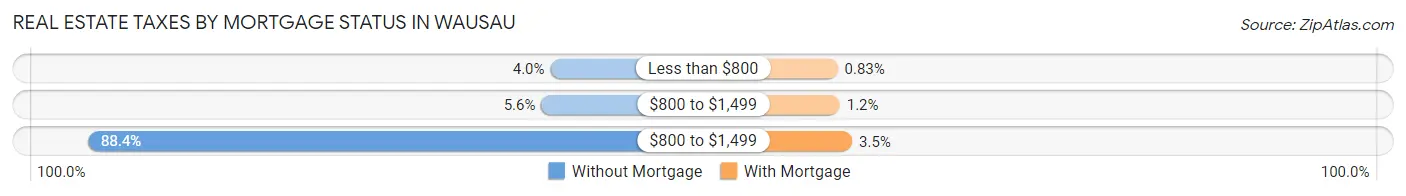
| Property Taxes | Without Mortgage | With Mortgage |
| Less than $800 | 169 (4.0%) | 49 (0.8%) |
| $800 to $1,499 | 240 (5.6%) | 73 (1.2%) |
| $800 to $1,499 | 3,769 (88.4%) | 206 (3.5%) |
| Total | 4,262 (100.0%) | 5,912 (100.0%) |
Health & Disability in Wausau
Health Insurance Coverage by Age in Wausau
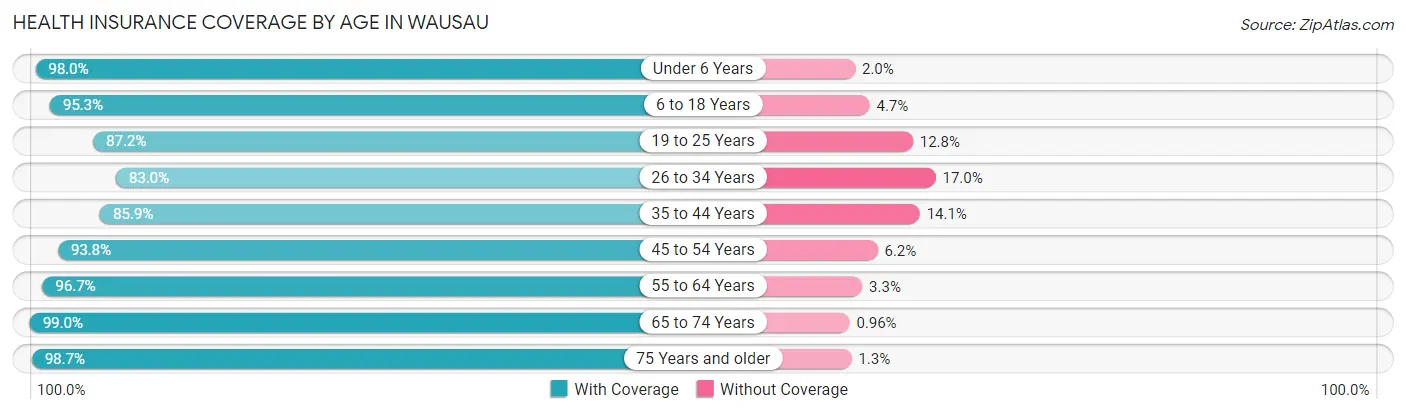
| Age Bracket | With Coverage | Without Coverage |
| Under 6 Years | 2,836 (98.0%) | 58 (2.0%) |
| 6 to 18 Years | 6,008 (95.3%) | 297 (4.7%) |
| 19 to 25 Years | 3,181 (87.2%) | 466 (12.8%) |
| 26 to 34 Years | 4,057 (83.0%) | 832 (17.0%) |
| 35 to 44 Years | 4,676 (85.9%) | 765 (14.1%) |
| 45 to 54 Years | 3,874 (93.8%) | 256 (6.2%) |
| 55 to 64 Years | 4,758 (96.7%) | 164 (3.3%) |
| 65 to 74 Years | 4,016 (99.0%) | 39 (1.0%) |
| 75 Years and older | 2,825 (98.7%) | 38 (1.3%) |
| Total | 36,231 (92.5%) | 2,915 (7.4%) |
Health Insurance Coverage by Citizenship Status in Wausau
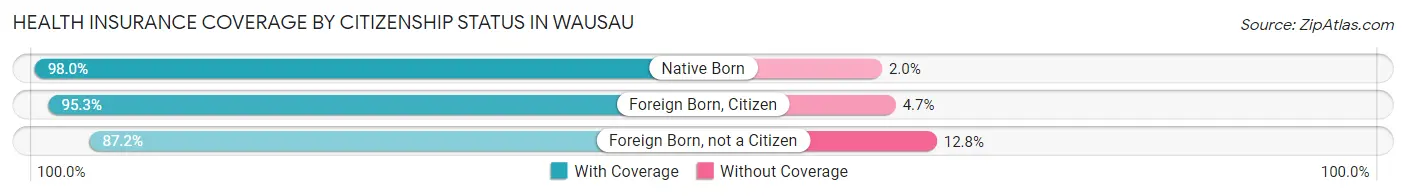
| Citizenship Status | With Coverage | Without Coverage |
| Native Born | 2,836 (98.0%) | 58 (2.0%) |
| Foreign Born, Citizen | 6,008 (95.3%) | 297 (4.7%) |
| Foreign Born, not a Citizen | 3,181 (87.2%) | 466 (12.8%) |
Health Insurance Coverage by Household Income in Wausau
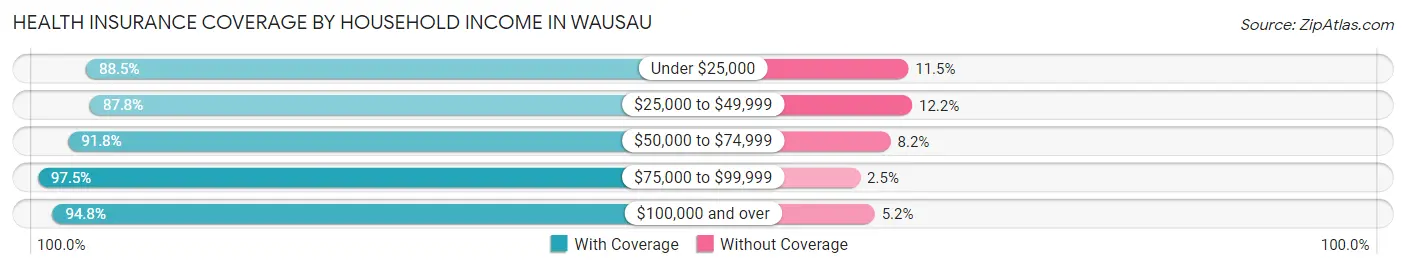
| Household Income | With Coverage | Without Coverage |
| Under $25,000 | 4,321 (88.5%) | 563 (11.5%) |
| $25,000 to $49,999 | 6,693 (87.8%) | 933 (12.2%) |
| $50,000 to $74,999 | 6,253 (91.8%) | 559 (8.2%) |
| $75,000 to $99,999 | 6,438 (97.5%) | 165 (2.5%) |
| $100,000 and over | 12,231 (94.8%) | 677 (5.2%) |
Public vs Private Health Insurance Coverage by Age in Wausau
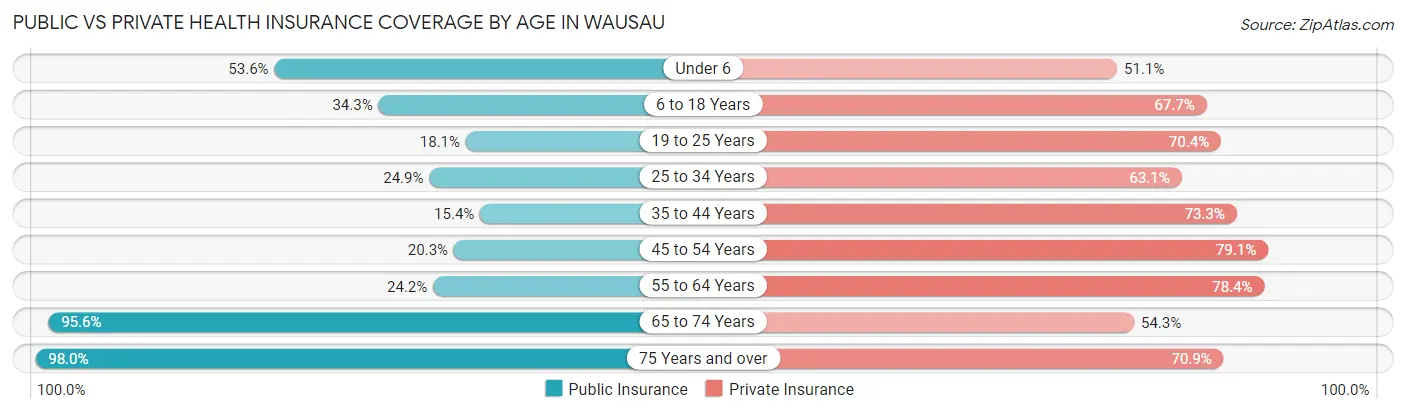
| Age Bracket | Public Insurance | Private Insurance |
| Under 6 | 1,552 (53.6%) | 1,479 (51.1%) |
| 6 to 18 Years | 2,163 (34.3%) | 4,270 (67.7%) |
| 19 to 25 Years | 660 (18.1%) | 2,567 (70.4%) |
| 25 to 34 Years | 1,217 (24.9%) | 3,083 (63.1%) |
| 35 to 44 Years | 840 (15.4%) | 3,988 (73.3%) |
| 45 to 54 Years | 839 (20.3%) | 3,267 (79.1%) |
| 55 to 64 Years | 1,190 (24.2%) | 3,861 (78.4%) |
| 65 to 74 Years | 3,877 (95.6%) | 2,200 (54.2%) |
| 75 Years and over | 2,806 (98.0%) | 2,029 (70.9%) |
| Total | 15,144 (38.7%) | 26,744 (68.3%) |
Disability Status by Sex by Age in Wausau
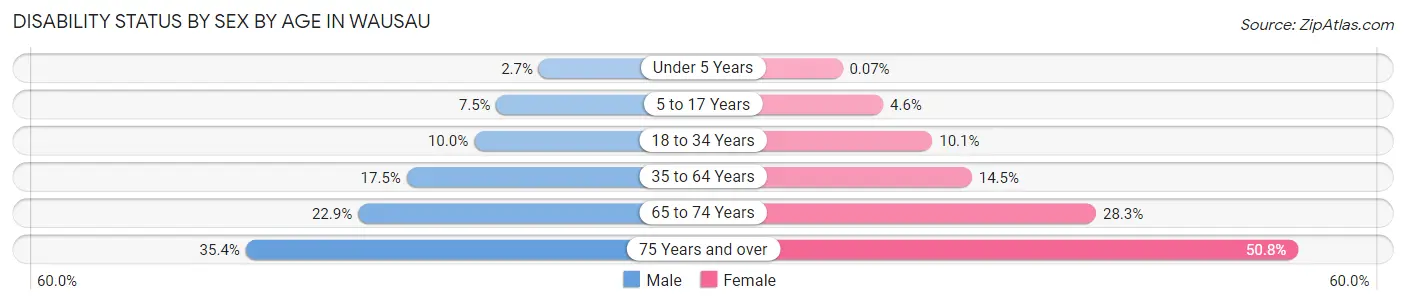
| Age Bracket | Male | Female |
| Under 5 Years | 28 (2.7%) | 1 (0.1%) |
| 5 to 17 Years | 235 (7.4%) | 151 (4.6%) |
| 18 to 34 Years | 482 (10.0%) | 409 (10.1%) |
| 35 to 64 Years | 1,240 (17.4%) | 1,070 (14.5%) |
| 65 to 74 Years | 467 (22.9%) | 570 (28.3%) |
| 75 Years and over | 346 (35.4%) | 958 (50.8%) |
Disability Class by Sex by Age in Wausau
Disability Class: Hearing Difficulty
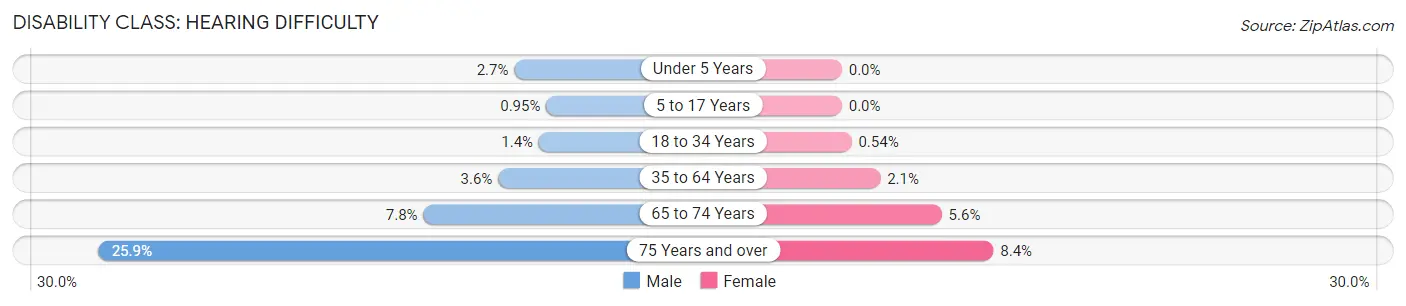
| Age Bracket | Male | Female |
| Under 5 Years | 28 (2.7%) | 0 (0.0%) |
| 5 to 17 Years | 30 (0.9%) | 0 (0.0%) |
| 18 to 34 Years | 66 (1.4%) | 22 (0.5%) |
| 35 to 64 Years | 258 (3.6%) | 158 (2.1%) |
| 65 to 74 Years | 159 (7.8%) | 112 (5.6%) |
| 75 Years and over | 253 (25.9%) | 159 (8.4%) |
Disability Class: Vision Difficulty
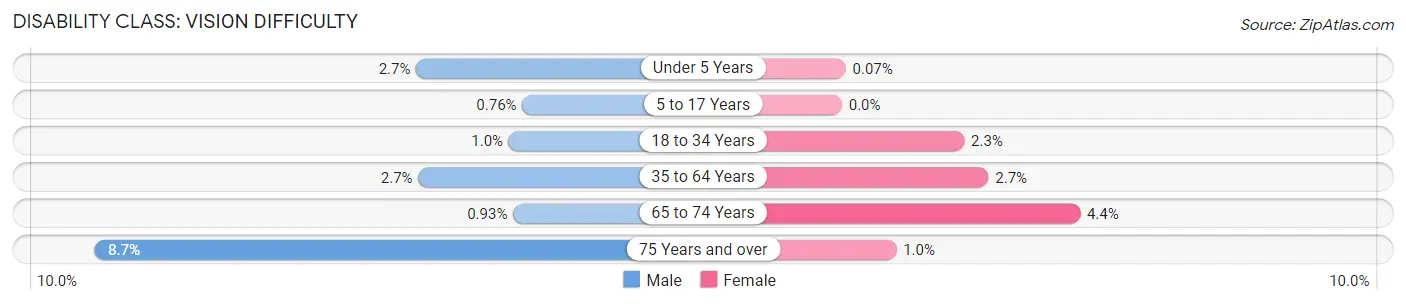
| Age Bracket | Male | Female |
| Under 5 Years | 28 (2.7%) | 1 (0.1%) |
| 5 to 17 Years | 24 (0.8%) | 0 (0.0%) |
| 18 to 34 Years | 49 (1.0%) | 92 (2.3%) |
| 35 to 64 Years | 191 (2.7%) | 201 (2.7%) |
| 65 to 74 Years | 19 (0.9%) | 89 (4.4%) |
| 75 Years and over | 85 (8.7%) | 19 (1.0%) |
Disability Class: Cognitive Difficulty
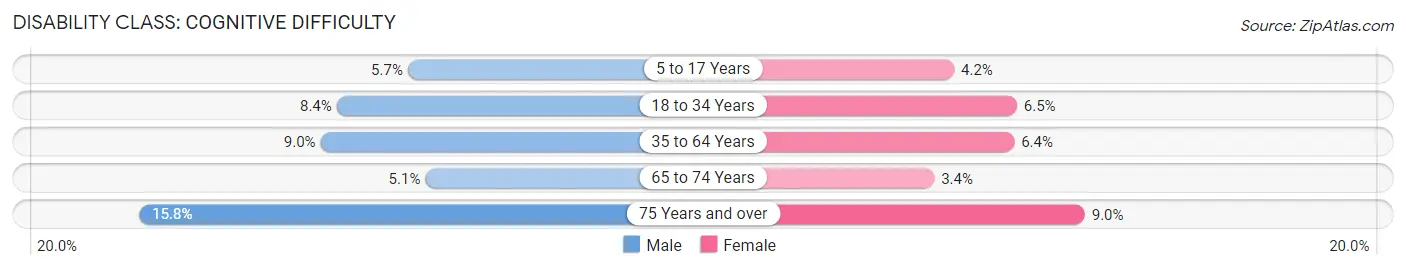
| Age Bracket | Male | Female |
| 5 to 17 Years | 181 (5.7%) | 137 (4.2%) |
| 18 to 34 Years | 406 (8.4%) | 264 (6.5%) |
| 35 to 64 Years | 638 (9.0%) | 473 (6.4%) |
| 65 to 74 Years | 104 (5.1%) | 69 (3.4%) |
| 75 Years and over | 154 (15.8%) | 170 (9.0%) |
Disability Class: Ambulatory Difficulty
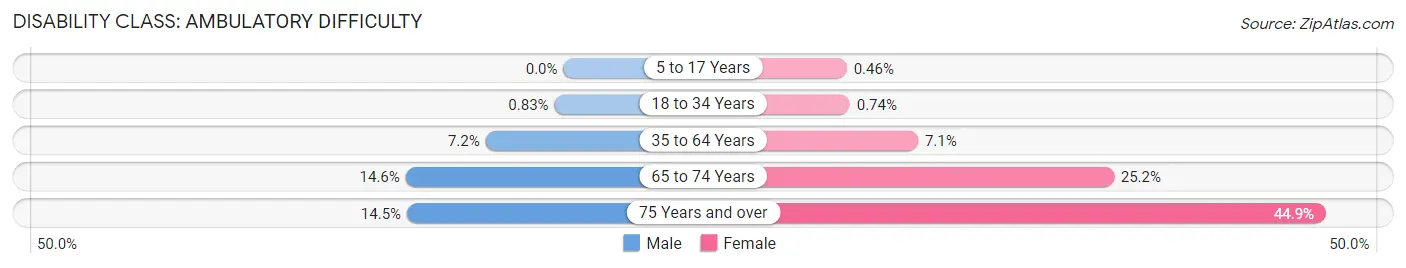
| Age Bracket | Male | Female |
| 5 to 17 Years | 0 (0.0%) | 15 (0.5%) |
| 18 to 34 Years | 40 (0.8%) | 30 (0.7%) |
| 35 to 64 Years | 513 (7.2%) | 522 (7.1%) |
| 65 to 74 Years | 299 (14.6%) | 508 (25.2%) |
| 75 Years and over | 142 (14.5%) | 847 (44.9%) |
Disability Class: Self-Care Difficulty
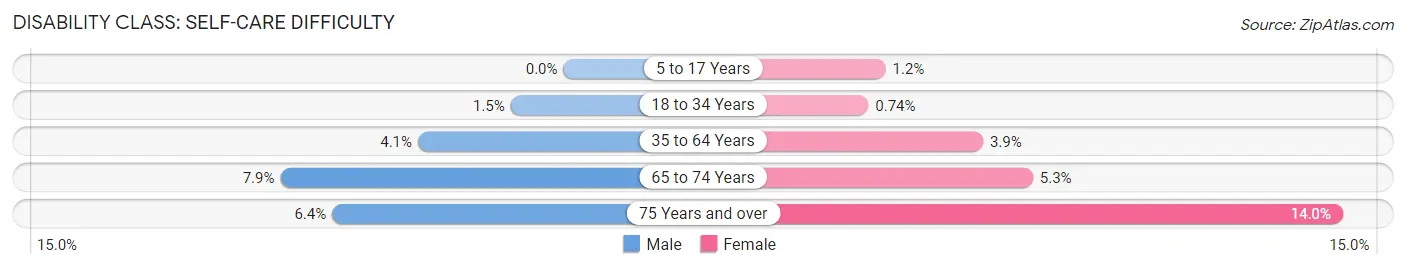
| Age Bracket | Male | Female |
| 5 to 17 Years | 0 (0.0%) | 40 (1.2%) |
| 18 to 34 Years | 71 (1.5%) | 30 (0.7%) |
| 35 to 64 Years | 288 (4.1%) | 290 (3.9%) |
| 65 to 74 Years | 161 (7.9%) | 107 (5.3%) |
| 75 Years and over | 63 (6.4%) | 263 (14.0%) |
Technology Access in Wausau
Computing Device Access in Wausau
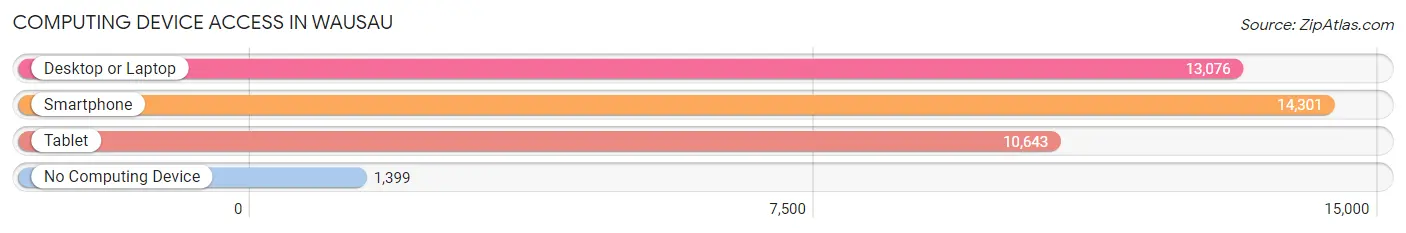
| Device Type | # Households | % Households |
| Desktop or Laptop | 13,076 | 75.6% |
| Smartphone | 14,301 | 82.7% |
| Tablet | 10,643 | 61.5% |
| No Computing Device | 1,399 | 8.1% |
| Total | 17,300 | 100.0% |
Internet Access in Wausau
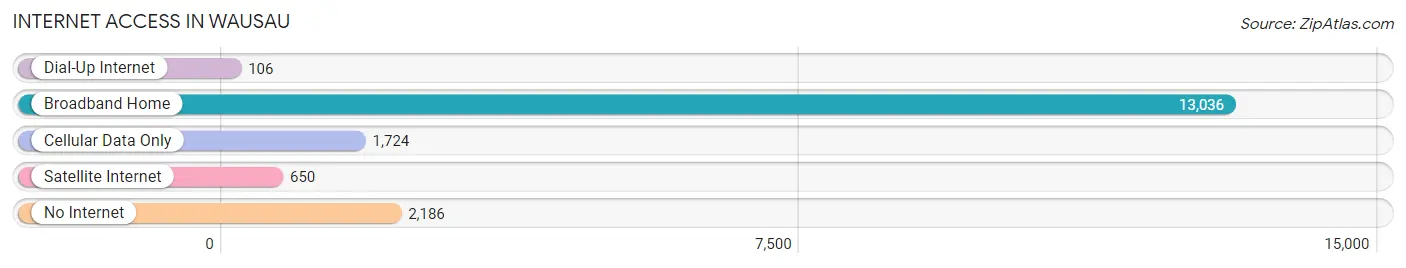
| Internet Type | # Households | % Households |
| Dial-Up Internet | 106 | 0.6% |
| Broadband Home | 13,036 | 75.3% |
| Cellular Data Only | 1,724 | 10.0% |
| Satellite Internet | 650 | 3.8% |
| No Internet | 2,186 | 12.6% |
| Total | 17,300 | 100.0% |
Wausau Summary
Wausau, Wisconsin is a city located in Marathon County in the north-central part of the state. It is the county seat and the largest city in the county. The city is situated on the Wisconsin River and is home to a population of approximately 39,000 people.
History
The area that is now Wausau was first inhabited by the Ojibwe people, who called the area “Wausau”, which means “far away” in their language. The first European settlers arrived in the area in the early 1800s, and the city was officially founded in 1848. The city was named after the Ojibwe word for “far away”.
In the late 1800s, Wausau became an important lumbering center, and the city’s economy was largely based on the lumber industry. The city also became a major railroad hub, and the Wisconsin Central Railroad was built through the city in 1871.
In the early 1900s, Wausau began to diversify its economy, and the city became a major center for manufacturing. The city’s economy was further diversified in the 1950s and 1960s, when the city became a major center for paper production.
Geography
Wausau is located in Marathon County in the north-central part of Wisconsin. The city is situated on the Wisconsin River, and is surrounded by the towns of Rib Mountain, Schofield, Weston, and Rothschild. The city covers an area of approximately 24 square miles, and has an elevation of 1,068 feet.
The city has a humid continental climate, with cold winters and warm summers. The average annual temperature is around 40 degrees Fahrenheit, and the average annual precipitation is around 33 inches.
Economy
Wausau’s economy is largely based on manufacturing, healthcare, and retail. The city is home to several major employers, including Aspirus Wausau Hospital, Wausau Paper, and Wausau Insurance. The city is also home to several major retail stores, including Walmart, Target, and Kohl’s.
The city’s unemployment rate is around 4.2%, which is lower than the national average. The median household income in Wausau is around $50,000, which is slightly higher than the national average.
Demographics
As of the 2010 census, Wausau had a population of 39,106 people. The racial makeup of the city was 94.2% White, 1.3% African American, 0.7% Native American, 1.2% Asian, 0.1% Pacific Islander, 1.2% from other races, and 1.4% from two or more races. Hispanic or Latino of any race were 3.2% of the population.
The median age in Wausau is 38.2 years, and the city has a gender ratio of 51.2% female and 48.8% male. The median household income in Wausau is $50,000, and the median home value is $133,000.
Conclusion
Wausau, Wisconsin is a city located in Marathon County in the north-central part of the state. It is the county seat and the largest city in the county. The city is situated on the Wisconsin River and is home to a population of approximately 39,000 people. The city’s economy is largely based on manufacturing, healthcare, and retail, and the city has a median household income of around $50,000. The city has a humid continental climate, with cold winters and warm summers. Wausau is a diverse city, with a population that is 94.2% White, 1.3% African American, 0.7% Native American, 1.2% Asian, 0.1% Pacific Islander, 1.2% from other races, and 1.4% from two or more races.
Common Questions
What is Per Capita Income in Wausau?
Per Capita income in Wausau is $34,641.
What is the Median Family Income in Wausau?
Median Family Income in Wausau is $79,015.
What is the Median Household income in Wausau?
Median Household Income in Wausau is $59,259.
What is Income or Wage Gap in Wausau?
Income or Wage Gap in Wausau is 18.5%.
Women in Wausau earn 81.5 cents for every dollar earned by a man.
What is Family Income Deficit in Wausau?
Family Income Deficit in Wausau is $11,463.
Families that are below poverty line in Wausau earn $11,463 less on average than the poverty threshold level.
What is Inequality or Gini Index in Wausau?
Inequality or Gini Index in Wausau is 0.45.
What is the Total Population of Wausau?
Total Population of Wausau is 39,906.
What is the Total Male Population of Wausau?
Total Male Population of Wausau is 19,524.
What is the Total Female Population of Wausau?
Total Female Population of Wausau is 20,382.
What is the Ratio of Males per 100 Females in Wausau?
There are 95.79 Males per 100 Females in Wausau.
What is the Ratio of Females per 100 Males in Wausau?
There are 104.39 Females per 100 Males in Wausau.
What is the Median Population Age in Wausau?
Median Population Age in Wausau is 38.6 Years.
What is the Average Family Size in Wausau
Average Family Size in Wausau is 3.0 People.
What is the Average Household Size in Wausau
Average Household Size in Wausau is 2.2 People.
How Large is the Labor Force in Wausau?
There are 20,591 People in the Labor Forcein in Wausau.
What is the Percentage of People in the Labor Force in Wausau?
63.9% of People are in the Labor Force in Wausau.
What is the Unemployment Rate in Wausau?
Unemployment Rate in Wausau is 4.5%.