Appleton, WI Map & Demographics
Appleton Map
Appleton Overview
$45,469
PER CAPITA INCOME
$94,234
AVG FAMILY INCOME
$75,469
AVG HOUSEHOLD INCOME
25.9%
WAGE / INCOME GAP [ % ]
74.1¢/ $1
WAGE / INCOME GAP [ $ ]
$9,301
FAMILY INCOME DEFICIT
0.49
INEQUALITY / GINI INDEX
75,133
TOTAL POPULATION
37,554
MALE POPULATION
37,579
FEMALE POPULATION
99.93
MALES / 100 FEMALES
100.07
FEMALES / 100 MALES
36.5
MEDIAN AGE
3.0
AVG FAMILY SIZE
2.4
AVG HOUSEHOLD SIZE
42,034
LABOR FORCE [ PEOPLE ]
70.4%
PERCENT IN LABOR FORCE
3.9%
UNEMPLOYMENT RATE
Appleton Area Codes
Income in Appleton
Income Overview in Appleton
Per Capita Income in Appleton is $45,469, while median incomes of families and households are $94,234 and $75,469 respectively.
| Characteristic | Number | Measure |
| Per Capita Income | 75,133 | $45,469 |
| Median Family Income | 18,656 | $94,234 |
| Mean Family Income | 18,656 | $116,445 |
| Median Household Income | 30,580 | $75,469 |
| Mean Household Income | 30,580 | $109,957 |
| Income Deficit | 18,656 | $9,301 |
| Wage / Income Gap (%) | 75,133 | 25.90% |
| Wage / Income Gap ($) | 75,133 | 74.10¢ per $1 |
| Gini / Inequality Index | 75,133 | 0.49 |
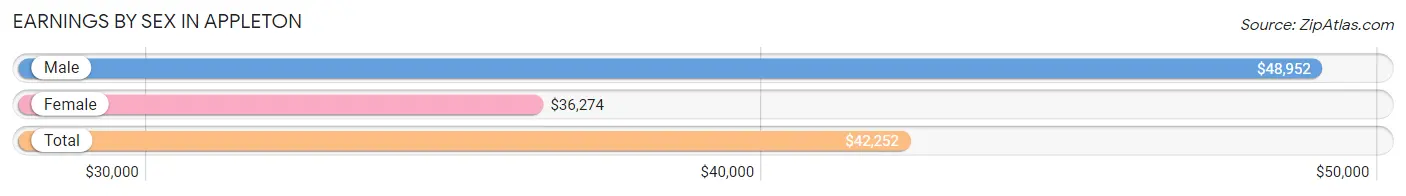
Earnings by Sex in Appleton
Average Earnings in Appleton are $42,252, $48,952 for men and $36,274 for women, a difference of 25.9%.
| Sex | Number | Average Earnings |
| Male | 22,929 (51.5%) | $48,952 |
| Female | 21,580 (48.5%) | $36,274 |
| Total | 44,509 (100.0%) | $42,252 |
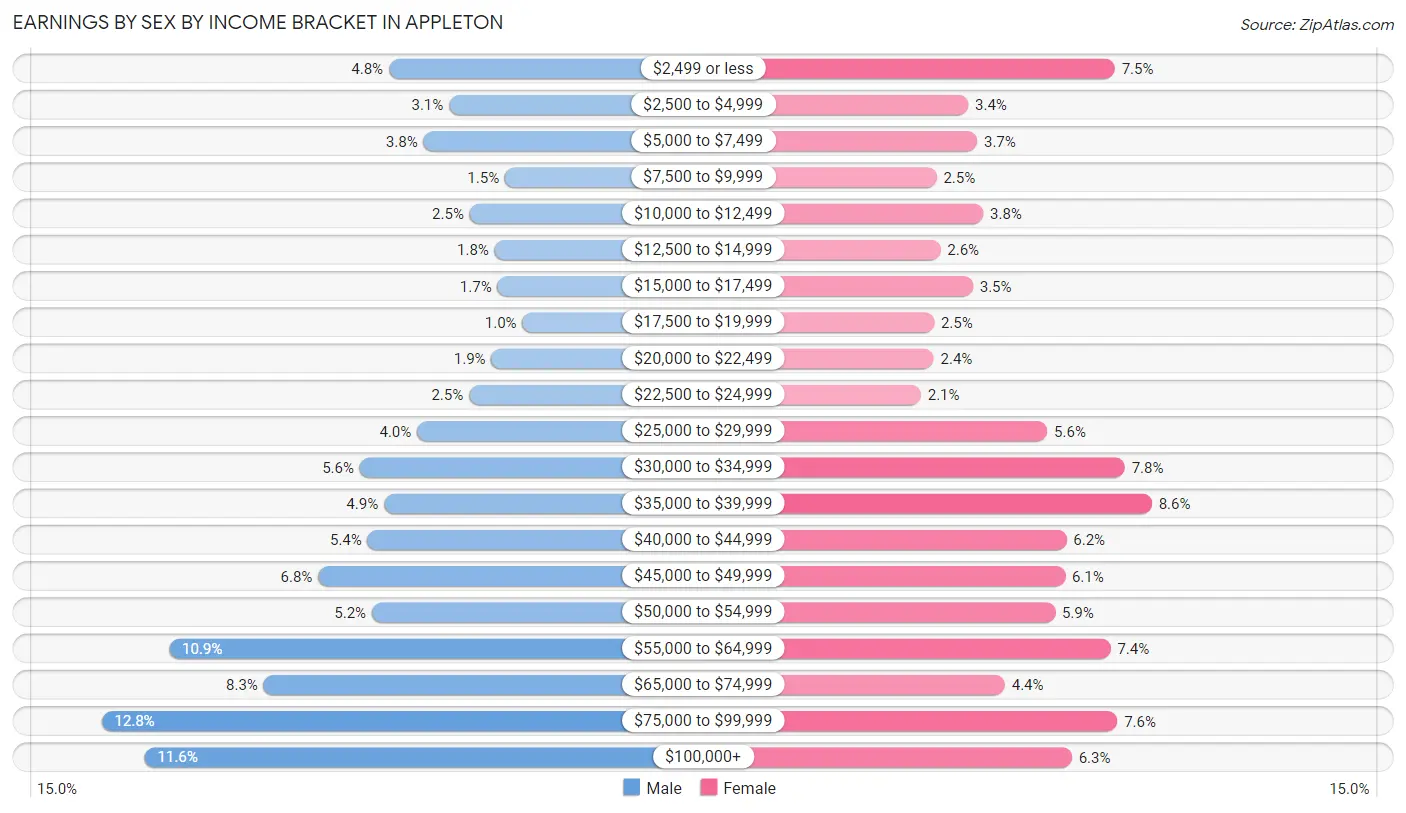
Earnings by Sex by Income Bracket in Appleton
The most common earnings brackets in Appleton are $75,000 to $99,999 for men (2,944 | 12.8%) and $35,000 to $39,999 for women (1,850 | 8.6%).
| Income | Male | Female |
| $2,499 or less | 1,091 (4.8%) | 1,625 (7.5%) |
| $2,500 to $4,999 | 703 (3.1%) | 735 (3.4%) |
| $5,000 to $7,499 | 870 (3.8%) | 790 (3.7%) |
| $7,500 to $9,999 | 344 (1.5%) | 543 (2.5%) |
| $10,000 to $12,499 | 571 (2.5%) | 826 (3.8%) |
| $12,500 to $14,999 | 410 (1.8%) | 568 (2.6%) |
| $15,000 to $17,499 | 391 (1.7%) | 764 (3.5%) |
| $17,500 to $19,999 | 231 (1.0%) | 529 (2.5%) |
| $20,000 to $22,499 | 432 (1.9%) | 526 (2.4%) |
| $22,500 to $24,999 | 575 (2.5%) | 448 (2.1%) |
| $25,000 to $29,999 | 910 (4.0%) | 1,215 (5.6%) |
| $30,000 to $34,999 | 1,279 (5.6%) | 1,685 (7.8%) |
| $35,000 to $39,999 | 1,124 (4.9%) | 1,850 (8.6%) |
| $40,000 to $44,999 | 1,230 (5.4%) | 1,331 (6.2%) |
| $45,000 to $49,999 | 1,548 (6.8%) | 1,323 (6.1%) |
| $50,000 to $54,999 | 1,201 (5.2%) | 1,262 (5.9%) |
| $55,000 to $64,999 | 2,509 (10.9%) | 1,598 (7.4%) |
| $65,000 to $74,999 | 1,899 (8.3%) | 958 (4.4%) |
| $75,000 to $99,999 | 2,944 (12.8%) | 1,641 (7.6%) |
| $100,000+ | 2,667 (11.6%) | 1,363 (6.3%) |
| Total | 22,929 (100.0%) | 21,580 (100.0%) |
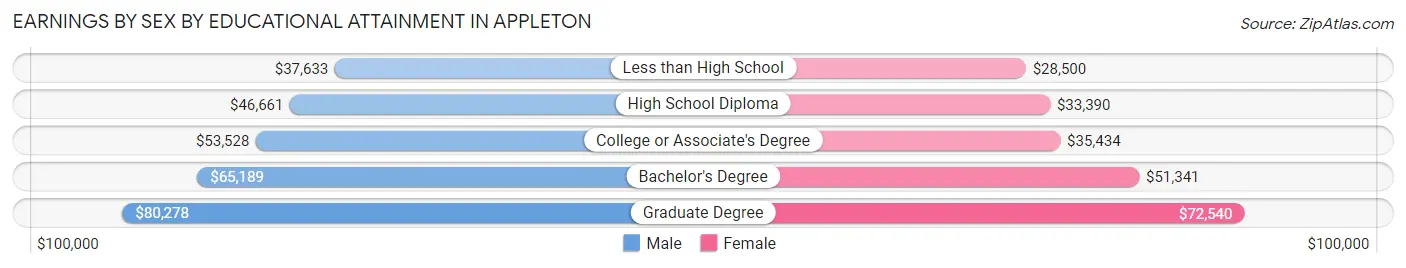
Earnings by Sex by Educational Attainment in Appleton
Average earnings in Appleton are $55,442 for men and $40,974 for women, a difference of 26.1%. Men with an educational attainment of graduate degree enjoy the highest average annual earnings of $80,278, while those with less than high school education earn the least with $37,633. Women with an educational attainment of graduate degree earn the most with the average annual earnings of $72,540, while those with less than high school education have the smallest earnings of $28,500.
| Educational Attainment | Male Income | Female Income |
| Less than High School | $37,633 | $28,500 |
| High School Diploma | $46,661 | $33,390 |
| College or Associate's Degree | $53,528 | $35,434 |
| Bachelor's Degree | $65,189 | $51,341 |
| Graduate Degree | $80,278 | $72,540 |
| Total | $55,442 | $40,974 |
Family Income in Appleton
Family Income Brackets in Appleton
According to the Appleton family income data, there are 4,907 families falling into the $100,000 to $149,999 income range, which is the most common income bracket and makes up 26.3% of all families. Conversely, the less than $10,000 income bracket is the least frequent group with only 261 families (1.4%) belonging to this category.
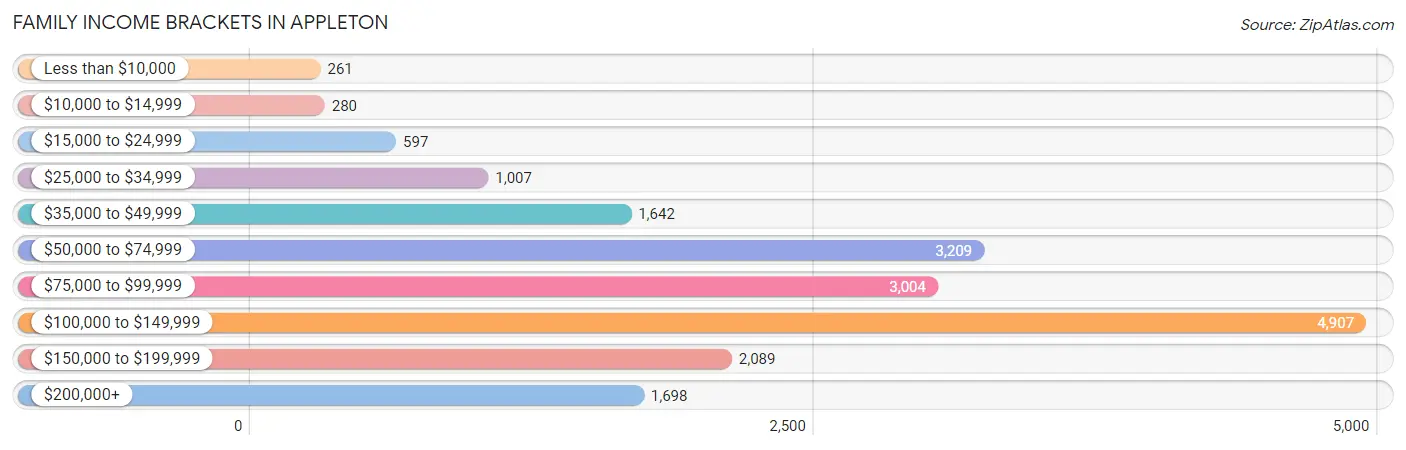
| Income Bracket | # Families | % Families |
| Less than $10,000 | 261 | 1.4% |
| $10,000 to $14,999 | 280 | 1.5% |
| $15,000 to $24,999 | 597 | 3.2% |
| $25,000 to $34,999 | 1,007 | 5.4% |
| $35,000 to $49,999 | 1,642 | 8.8% |
| $50,000 to $74,999 | 3,209 | 17.2% |
| $75,000 to $99,999 | 3,004 | 16.1% |
| $100,000 to $149,999 | 4,907 | 26.3% |
| $150,000 to $199,999 | 2,089 | 11.2% |
| $200,000+ | 1,698 | 9.1% |
Family Income by Famaliy Size in Appleton
5-person families (1,412 | 7.6%) account for the highest median family income in Appleton with $114,167 per family, while 2-person families (9,280 | 49.7%) have the highest median income of $40,544 per family member.
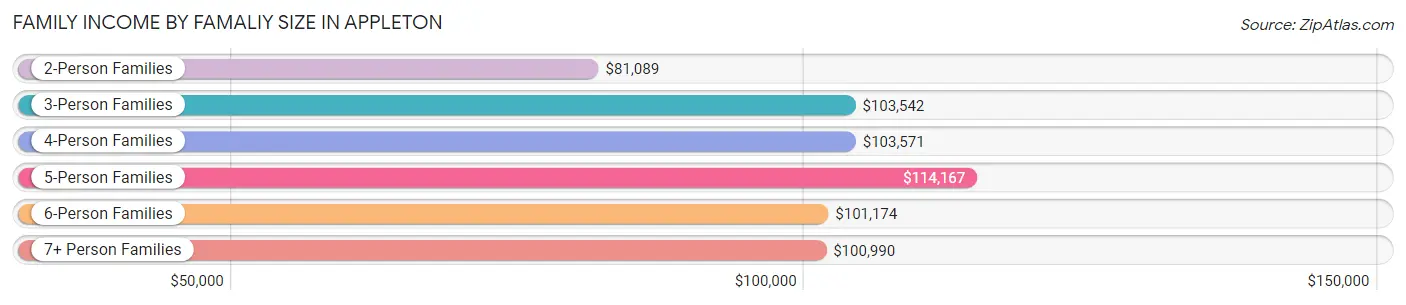
| Income Bracket | # Families | Median Income |
| 2-Person Families | 9,280 (49.7%) | $81,089 |
| 3-Person Families | 3,500 (18.8%) | $103,542 |
| 4-Person Families | 3,612 (19.4%) | $103,571 |
| 5-Person Families | 1,412 (7.6%) | $114,167 |
| 6-Person Families | 695 (3.7%) | $101,174 |
| 7+ Person Families | 157 (0.8%) | $100,990 |
| Total | 18,656 (100.0%) | $94,234 |
Family Income by Number of Earners in Appleton
The median family income in Appleton is $94,234, with families comprising 3+ earners (2,363) having the highest median family income of $138,931, while families with 1 earner (5,387) have the lowest median family income of $58,959, accounting for 12.7% and 28.9% of families, respectively.
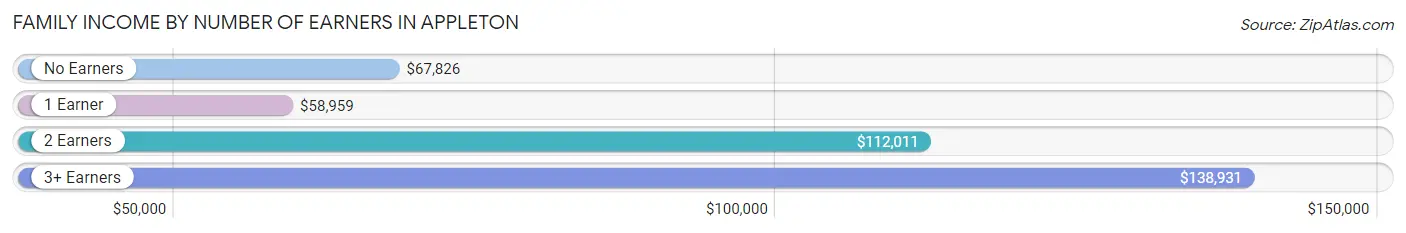
| Number of Earners | # Families | Median Income |
| No Earners | 2,444 (13.1%) | $67,826 |
| 1 Earner | 5,387 (28.9%) | $58,959 |
| 2 Earners | 8,462 (45.4%) | $112,011 |
| 3+ Earners | 2,363 (12.7%) | $138,931 |
| Total | 18,656 (100.0%) | $94,234 |
Household Income in Appleton
Household Income Brackets in Appleton
With 6,116 households falling in the category, the $100,000 to $149,999 income range is the most frequent in Appleton, accounting for 20.0% of all households. In contrast, only 887 households (2.9%) fall into the less than $10,000 income bracket, making it the least populous group.
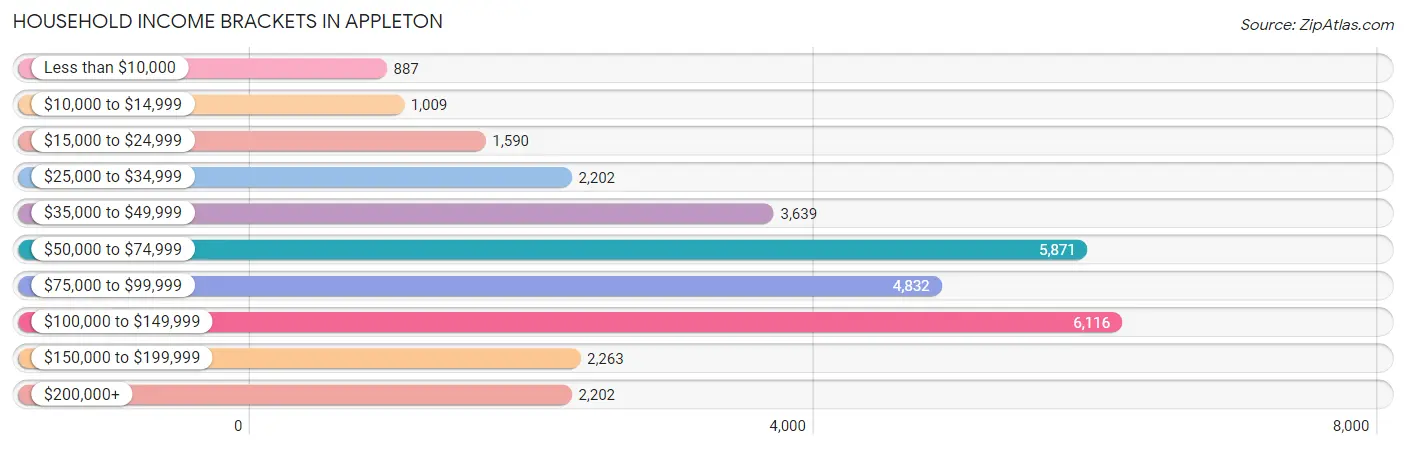
| Income Bracket | # Households | % Households |
| Less than $10,000 | 887 | 2.9% |
| $10,000 to $14,999 | 1,009 | 3.3% |
| $15,000 to $24,999 | 1,590 | 5.2% |
| $25,000 to $34,999 | 2,202 | 7.2% |
| $35,000 to $49,999 | 3,639 | 11.9% |
| $50,000 to $74,999 | 5,871 | 19.2% |
| $75,000 to $99,999 | 4,832 | 15.8% |
| $100,000 to $149,999 | 6,116 | 20.0% |
| $150,000 to $199,999 | 2,263 | 7.4% |
| $200,000+ | 2,202 | 7.2% |
Household Income by Householder Age in Appleton
The median household income in Appleton is $75,469, with the highest median household income of $86,576 found in the 45 to 64 years age bracket for the primary householder. A total of 10,726 households (35.1%) fall into this category. Meanwhile, the 65+ years age bracket for the primary householder has the lowest median household income of $53,951, with 7,395 households (24.2%) in this group.
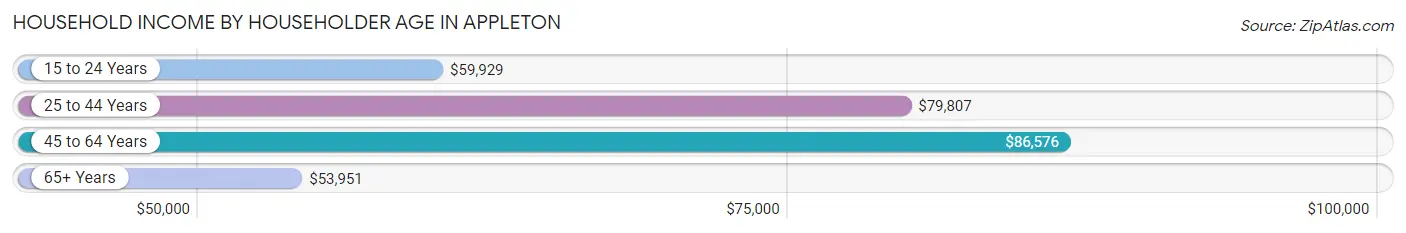
| Income Bracket | # Households | Median Income |
| 15 to 24 Years | 1,348 (4.4%) | $59,929 |
| 25 to 44 Years | 11,111 (36.3%) | $79,807 |
| 45 to 64 Years | 10,726 (35.1%) | $86,576 |
| 65+ Years | 7,395 (24.2%) | $53,951 |
| Total | 30,580 (100.0%) | $75,469 |
Poverty in Appleton
Income Below Poverty by Sex and Age in Appleton
With 8.2% poverty level for males and 9.4% for females among the residents of Appleton, 15 year old males and 18 to 24 year old females are the most vulnerable to poverty, with 116 males (17.1%) and 568 females (17.4%) in their respective age groups living below the poverty level.
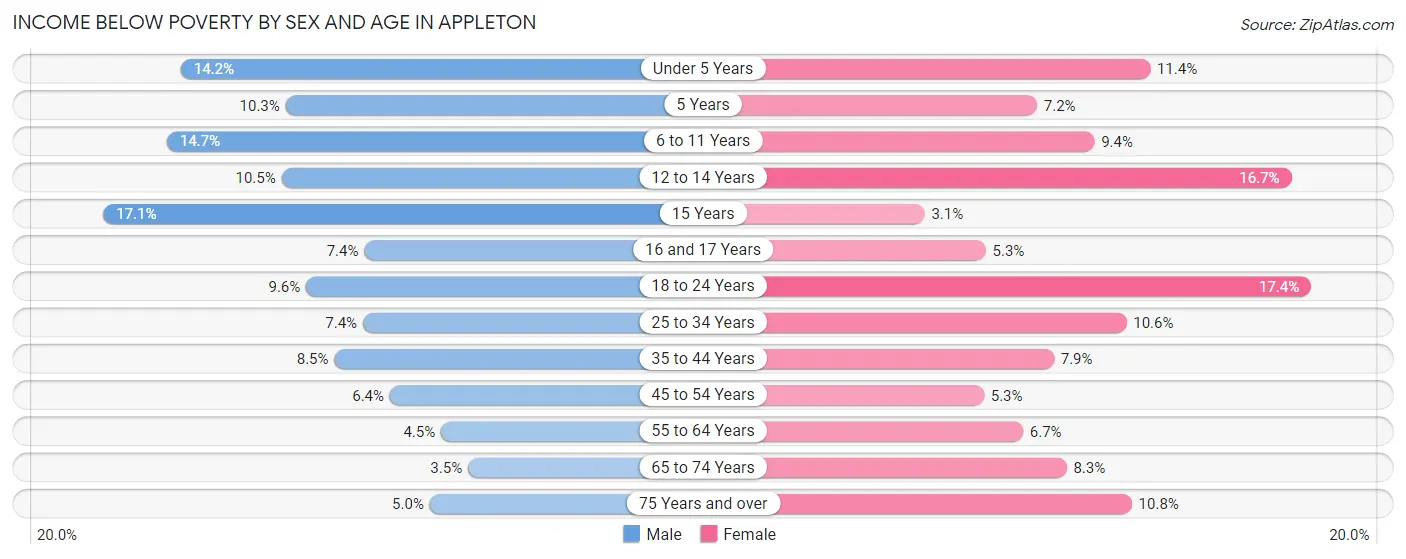
| Age Bracket | Male | Female |
| Under 5 Years | 336 (14.2%) | 266 (11.4%) |
| 5 Years | 46 (10.3%) | 32 (7.2%) |
| 6 to 11 Years | 424 (14.7%) | 255 (9.4%) |
| 12 to 14 Years | 157 (10.5%) | 213 (16.7%) |
| 15 Years | 116 (17.1%) | 15 (3.1%) |
| 16 and 17 Years | 85 (7.4%) | 48 (5.3%) |
| 18 to 24 Years | 259 (9.6%) | 568 (17.4%) |
| 25 to 34 Years | 428 (7.4%) | 557 (10.6%) |
| 35 to 44 Years | 422 (8.5%) | 375 (7.9%) |
| 45 to 54 Years | 302 (6.4%) | 234 (5.3%) |
| 55 to 64 Years | 199 (4.5%) | 303 (6.7%) |
| 65 to 74 Years | 105 (3.5%) | 279 (8.3%) |
| 75 Years and over | 91 (5.0%) | 291 (10.8%) |
| Total | 2,970 (8.2%) | 3,436 (9.4%) |
Income Above Poverty by Sex and Age in Appleton
According to the poverty statistics in Appleton, males aged 65 to 74 years and females aged 15 years are the age groups that are most secure financially, with 96.5% of males and 96.9% of females in these age groups living above the poverty line.
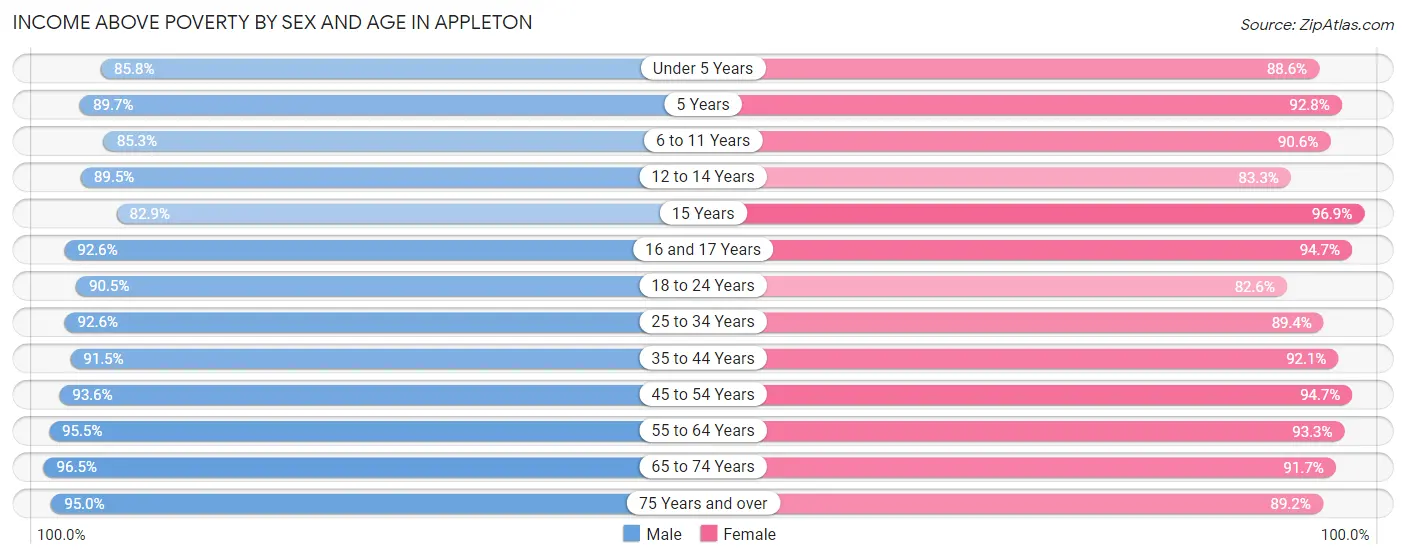
| Age Bracket | Male | Female |
| Under 5 Years | 2,030 (85.8%) | 2,060 (88.6%) |
| 5 Years | 400 (89.7%) | 410 (92.8%) |
| 6 to 11 Years | 2,457 (85.3%) | 2,466 (90.6%) |
| 12 to 14 Years | 1,344 (89.5%) | 1,063 (83.3%) |
| 15 Years | 563 (82.9%) | 474 (96.9%) |
| 16 and 17 Years | 1,065 (92.6%) | 851 (94.7%) |
| 18 to 24 Years | 2,453 (90.4%) | 2,693 (82.6%) |
| 25 to 34 Years | 5,324 (92.6%) | 4,718 (89.4%) |
| 35 to 44 Years | 4,543 (91.5%) | 4,388 (92.1%) |
| 45 to 54 Years | 4,385 (93.6%) | 4,205 (94.7%) |
| 55 to 64 Years | 4,187 (95.5%) | 4,203 (93.3%) |
| 65 to 74 Years | 2,864 (96.5%) | 3,065 (91.7%) |
| 75 Years and over | 1,745 (95.0%) | 2,413 (89.2%) |
| Total | 33,360 (91.8%) | 33,009 (90.6%) |
Income Below Poverty Among Married-Couple Families in Appleton
The poverty statistics for married-couple families in Appleton show that 2.7% or 395 of the total 14,417 families live below the poverty line. Families with 5 or more children have the highest poverty rate of 30.6%, comprising of 22 families. On the other hand, families with no children have the lowest poverty rate of 0.9%, which includes 74 families.
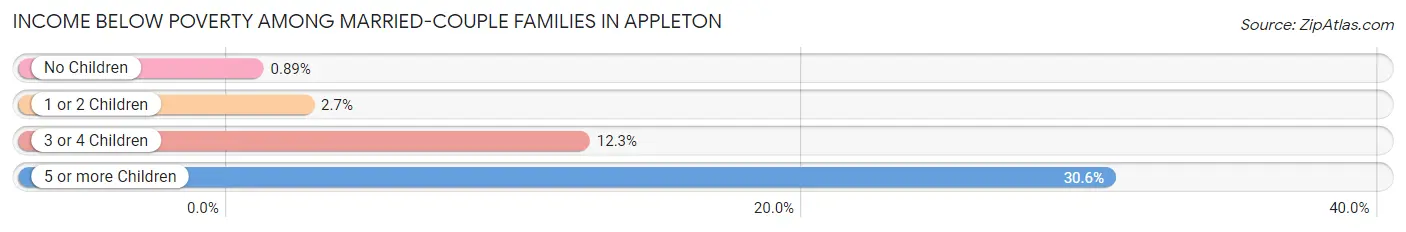
| Children | Above Poverty | Below Poverty |
| No Children | 8,258 (99.1%) | 74 (0.9%) |
| 1 or 2 Children | 4,439 (97.4%) | 121 (2.6%) |
| 3 or 4 Children | 1,275 (87.7%) | 178 (12.2%) |
| 5 or more Children | 50 (69.4%) | 22 (30.6%) |
| Total | 14,022 (97.3%) | 395 (2.7%) |
Income Below Poverty Among Single-Parent Households in Appleton
According to the poverty data in Appleton, 12.8% or 179 single-father households and 18.6% or 527 single-mother households are living below the poverty line. Among single-father households, those with 3 or 4 children have the highest poverty rate, with 84 households (48.0%) experiencing poverty. Likewise, among single-mother households, those with 3 or 4 children have the highest poverty rate, with 106 households (24.4%) falling below the poverty line.
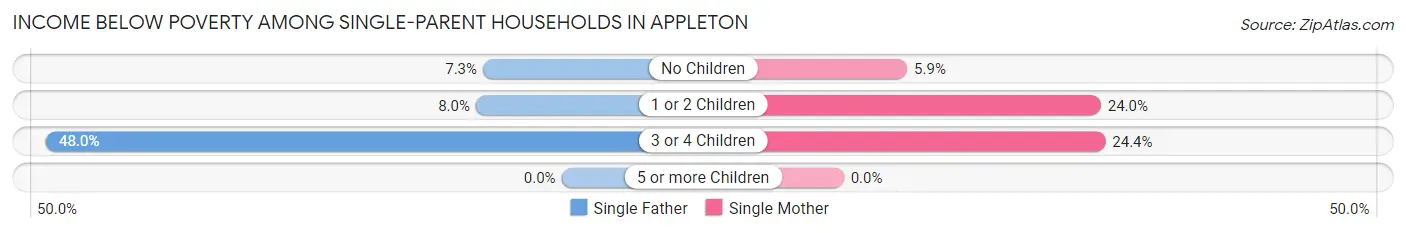
| Children | Single Father | Single Mother |
| No Children | 32 (7.3%) | 50 (5.9%) |
| 1 or 2 Children | 63 (8.0%) | 371 (23.9%) |
| 3 or 4 Children | 84 (48.0%) | 106 (24.4%) |
| 5 or more Children | 0 (0.0%) | 0 (0.0%) |
| Total | 179 (12.8%) | 527 (18.6%) |
Income Below Poverty Among Married-Couple vs Single-Parent Households in Appleton
The poverty data for Appleton shows that 395 of the married-couple family households (2.7%) and 706 of the single-parent households (16.7%) are living below the poverty level. Within the married-couple family households, those with 5 or more children have the highest poverty rate, with 22 households (30.6%) falling below the poverty line. Among the single-parent households, those with 3 or 4 children have the highest poverty rate, with 190 household (31.1%) living below poverty.
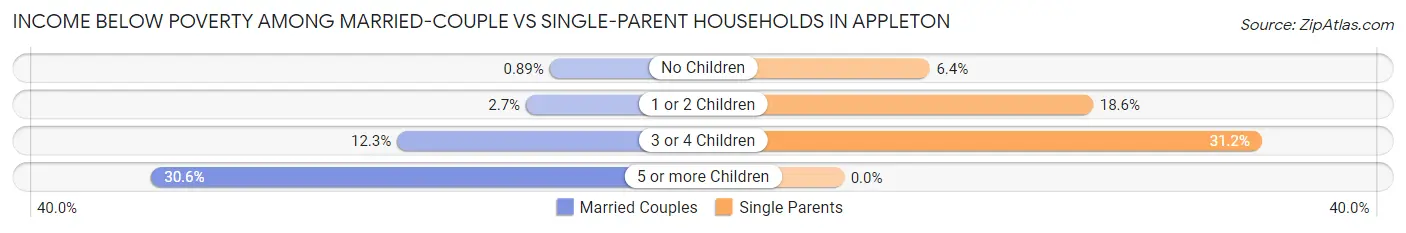
| Children | Married-Couple Families | Single-Parent Households |
| No Children | 74 (0.9%) | 82 (6.4%) |
| 1 or 2 Children | 121 (2.6%) | 434 (18.6%) |
| 3 or 4 Children | 178 (12.2%) | 190 (31.1%) |
| 5 or more Children | 22 (30.6%) | 0 (0.0%) |
| Total | 395 (2.7%) | 706 (16.7%) |
Race in Appleton
The most populous races in Appleton are White / Caucasian (62,055 | 82.6%), Hispanic or Latino (4,831 | 6.4%), and Two or more Races (4,750 | 6.3%).
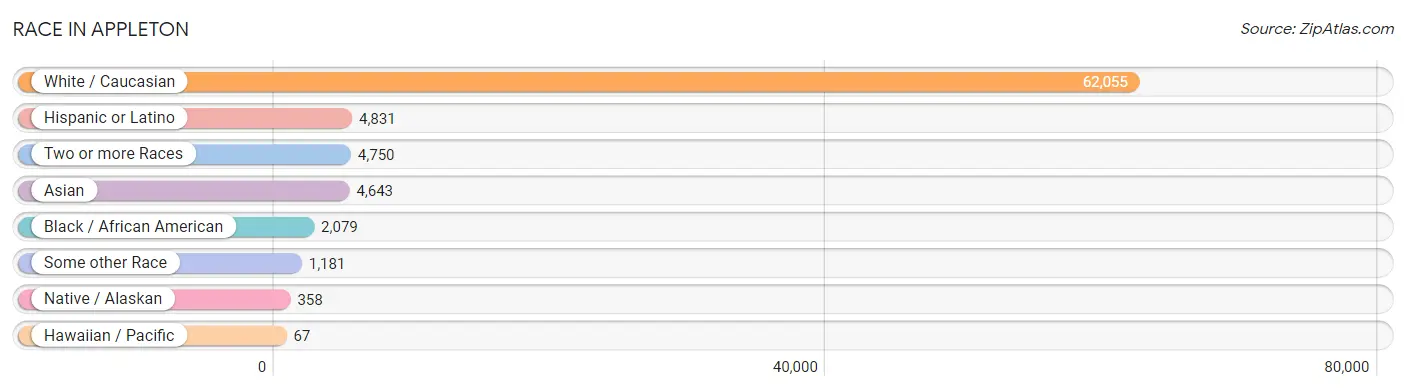
| Race | # Population | % Population |
| Asian | 4,643 | 6.2% |
| Black / African American | 2,079 | 2.8% |
| Hawaiian / Pacific | 67 | 0.1% |
| Hispanic or Latino | 4,831 | 6.4% |
| Native / Alaskan | 358 | 0.5% |
| White / Caucasian | 62,055 | 82.6% |
| Two or more Races | 4,750 | 6.3% |
| Some other Race | 1,181 | 1.6% |
| Total | 75,133 | 100.0% |
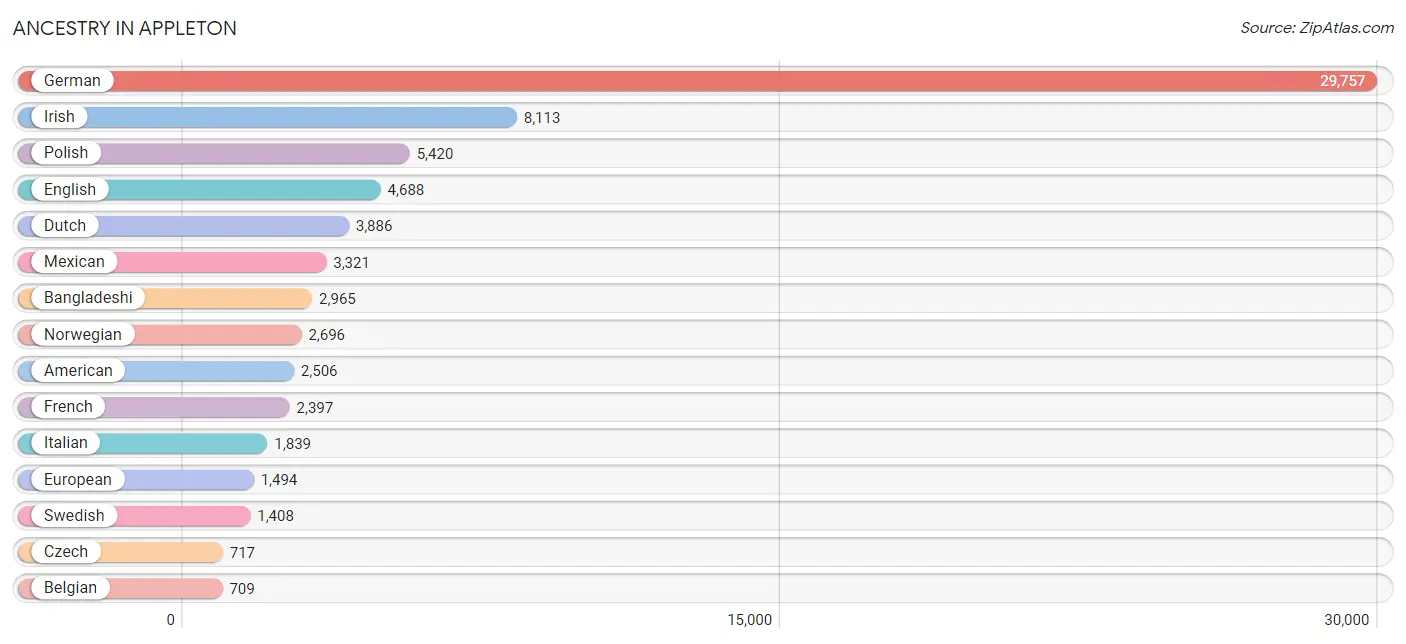
Ancestry in Appleton
The most populous ancestries reported in Appleton are German (29,757 | 39.6%), Irish (8,113 | 10.8%), Polish (5,420 | 7.2%), English (4,688 | 6.2%), and Dutch (3,886 | 5.2%), together accounting for 69.0% of all Appleton residents.
| Ancestry | # Population | % Population |
| African | 28 | 0.0% |
| American | 2,506 | 3.3% |
| Arab | 156 | 0.2% |
| Argentinean | 16 | 0.0% |
| Armenian | 8 | 0.0% |
| Austrian | 214 | 0.3% |
| Bangladeshi | 2,965 | 4.0% |
| Belgian | 709 | 0.9% |
| Bhutanese | 95 | 0.1% |
| Brazilian | 6 | 0.0% |
| British | 323 | 0.4% |
| Burmese | 244 | 0.3% |
| Cambodian | 14 | 0.0% |
| Canadian | 157 | 0.2% |
| Central American | 491 | 0.6% |
| Central American Indian | 13 | 0.0% |
| Cherokee | 64 | 0.1% |
| Chippewa | 148 | 0.2% |
| Colombian | 70 | 0.1% |
| Costa Rican | 17 | 0.0% |
| Creek | 6 | 0.0% |
| Croatian | 195 | 0.3% |
| Cuban | 46 | 0.1% |
| Czech | 717 | 0.9% |
| Czechoslovakian | 62 | 0.1% |
| Danish | 477 | 0.6% |
| Dominican | 52 | 0.1% |
| Dutch | 3,886 | 5.2% |
| Eastern European | 278 | 0.4% |
| Ecuadorian | 38 | 0.1% |
| English | 4,688 | 6.2% |
| Ethiopian | 29 | 0.0% |
| European | 1,494 | 2.0% |
| Filipino | 9 | 0.0% |
| Finnish | 466 | 0.6% |
| French | 2,397 | 3.2% |
| French American Indian | 7 | 0.0% |
| French Canadian | 550 | 0.7% |
| German | 29,757 | 39.6% |
| Greek | 163 | 0.2% |
| Guatemalan | 326 | 0.4% |
| Haitian | 9 | 0.0% |
| Honduran | 106 | 0.1% |
| Hungarian | 255 | 0.3% |
| Indian (Asian) | 492 | 0.6% |
| Iraqi | 43 | 0.1% |
| Irish | 8,113 | 10.8% |
| Iroquois | 216 | 0.3% |
| Italian | 1,839 | 2.5% |
| Jamaican | 21 | 0.0% |
| Japanese | 114 | 0.2% |
| Korean | 441 | 0.6% |
| Laotian | 9 | 0.0% |
| Latvian | 8 | 0.0% |
| Lebanese | 105 | 0.1% |
| Liberian | 7 | 0.0% |
| Lithuanian | 142 | 0.2% |
| Lumbee | 10 | 0.0% |
| Luxembourger | 33 | 0.0% |
| Macedonian | 20 | 0.0% |
| Malaysian | 217 | 0.3% |
| Menominee | 134 | 0.2% |
| Mexican | 3,321 | 4.4% |
| Mexican American Indian | 18 | 0.0% |
| Native Hawaiian | 107 | 0.1% |
| Nigerian | 19 | 0.0% |
| Northern European | 56 | 0.1% |
| Norwegian | 2,696 | 3.6% |
| Pakistani | 11 | 0.0% |
| Palestinian | 8 | 0.0% |
| Panamanian | 3 | 0.0% |
| Pennsylvania German | 10 | 0.0% |
| Polish | 5,420 | 7.2% |
| Portuguese | 41 | 0.1% |
| Potawatomi | 30 | 0.0% |
| Puerto Rican | 351 | 0.5% |
| Romanian | 69 | 0.1% |
| Russian | 290 | 0.4% |
| Salvadoran | 39 | 0.1% |
| Scandinavian | 542 | 0.7% |
| Scotch-Irish | 218 | 0.3% |
| Scottish | 605 | 0.8% |
| Serbian | 26 | 0.0% |
| Slavic | 13 | 0.0% |
| Slovak | 108 | 0.1% |
| Slovene | 38 | 0.1% |
| South American | 151 | 0.2% |
| South American Indian | 16 | 0.0% |
| Spaniard | 228 | 0.3% |
| Spanish | 65 | 0.1% |
| Sri Lankan | 150 | 0.2% |
| Subsaharan African | 310 | 0.4% |
| Swedish | 1,408 | 1.9% |
| Swiss | 290 | 0.4% |
| Thai | 548 | 0.7% |
| Turkish | 35 | 0.1% |
| Ukrainian | 136 | 0.2% |
| Venezuelan | 27 | 0.0% |
| Vietnamese | 16 | 0.0% |
| Welsh | 218 | 0.3% |
| Yugoslavian | 46 | 0.1% | View All 101 Rows |
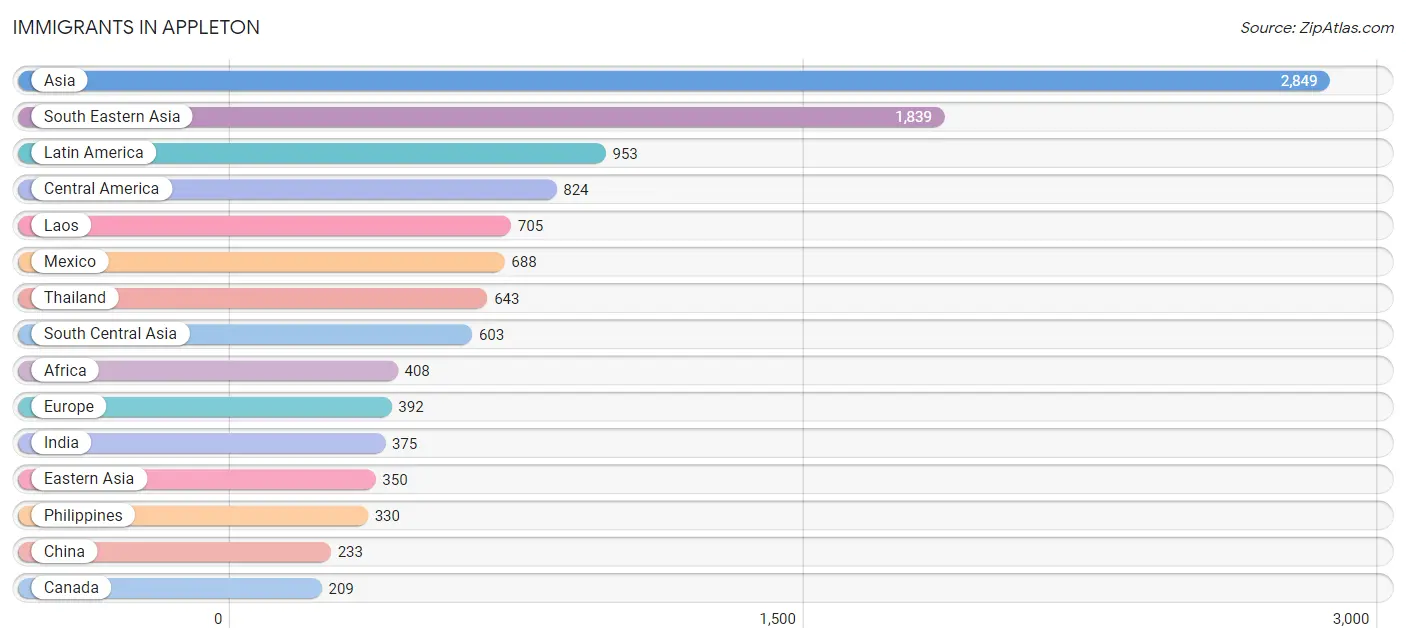
Immigrants in Appleton
The most numerous immigrant groups reported in Appleton came from Asia (2,849 | 3.8%), South Eastern Asia (1,839 | 2.5%), Latin America (953 | 1.3%), Central America (824 | 1.1%), and Laos (705 | 0.9%), together accounting for 9.6% of all Appleton residents.
| Immigration Origin | # Population | % Population |
| Africa | 408 | 0.5% |
| Asia | 2,849 | 3.8% |
| Australia | 107 | 0.1% |
| Austria | 13 | 0.0% |
| Bangladesh | 16 | 0.0% |
| Belarus | 23 | 0.0% |
| Brazil | 12 | 0.0% |
| Cameroon | 17 | 0.0% |
| Canada | 209 | 0.3% |
| Caribbean | 26 | 0.0% |
| Central America | 824 | 1.1% |
| China | 233 | 0.3% |
| Colombia | 49 | 0.1% |
| Congo | 12 | 0.0% |
| Costa Rica | 17 | 0.0% |
| Croatia | 21 | 0.0% |
| Cuba | 1 | 0.0% |
| Czechoslovakia | 8 | 0.0% |
| Eastern Africa | 150 | 0.2% |
| Eastern Asia | 350 | 0.5% |
| Eastern Europe | 101 | 0.1% |
| Ecuador | 15 | 0.0% |
| El Salvador | 39 | 0.1% |
| England | 102 | 0.1% |
| Ethiopia | 29 | 0.0% |
| Europe | 392 | 0.5% |
| France | 18 | 0.0% |
| Germany | 80 | 0.1% |
| Greece | 7 | 0.0% |
| Guatemala | 80 | 0.1% |
| Haiti | 4 | 0.0% |
| Hong Kong | 65 | 0.1% |
| Hungary | 16 | 0.0% |
| India | 375 | 0.5% |
| Indonesia | 5 | 0.0% |
| Italy | 9 | 0.0% |
| Jamaica | 21 | 0.0% |
| Japan | 10 | 0.0% |
| Korea | 107 | 0.1% |
| Laos | 705 | 0.9% |
| Latin America | 953 | 1.3% |
| Liberia | 7 | 0.0% |
| Malaysia | 9 | 0.0% |
| Mexico | 688 | 0.9% |
| Middle Africa | 184 | 0.2% |
| Nepal | 181 | 0.2% |
| Netherlands | 26 | 0.0% |
| Nigeria | 19 | 0.0% |
| Northern Europe | 131 | 0.2% |
| Oceania | 107 | 0.1% |
| Pakistan | 31 | 0.0% |
| Philippines | 330 | 0.4% |
| Russia | 29 | 0.0% |
| Serbia | 4 | 0.0% |
| South Africa | 17 | 0.0% |
| South America | 103 | 0.1% |
| South Central Asia | 603 | 0.8% |
| South Eastern Asia | 1,839 | 2.5% |
| Southern Europe | 16 | 0.0% |
| Switzerland | 7 | 0.0% |
| Taiwan | 9 | 0.0% |
| Thailand | 643 | 0.9% |
| Turkey | 57 | 0.1% |
| Venezuela | 27 | 0.0% |
| Vietnam | 147 | 0.2% |
| Western Africa | 57 | 0.1% |
| Western Asia | 57 | 0.1% |
| Western Europe | 144 | 0.2% |
| Zaire | 155 | 0.2% | View All 69 Rows |
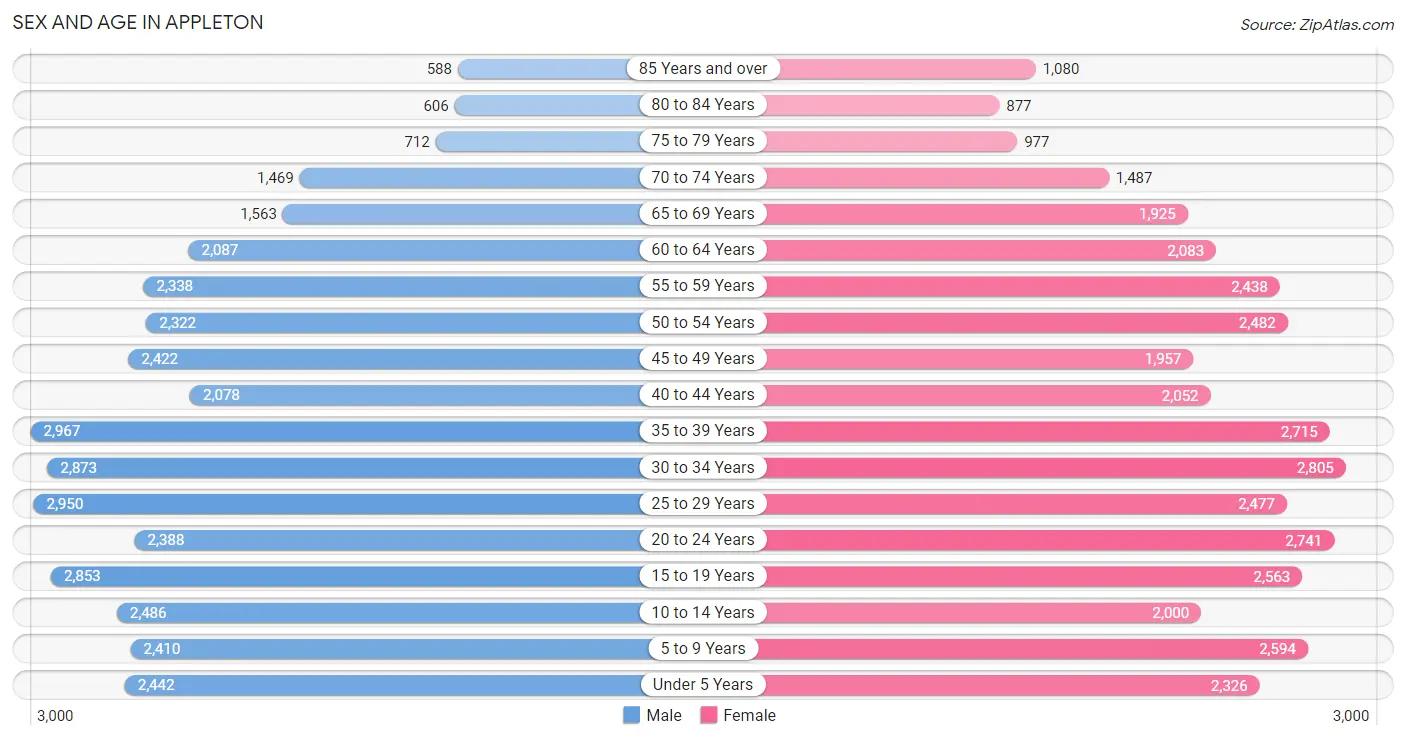
Sex and Age in Appleton
Sex and Age in Appleton
The most populous age groups in Appleton are 35 to 39 Years (2,967 | 7.9%) for men and 30 to 34 Years (2,805 | 7.5%) for women.
| Age Bracket | Male | Female |
| Under 5 Years | 2,442 (6.5%) | 2,326 (6.2%) |
| 5 to 9 Years | 2,410 (6.4%) | 2,594 (6.9%) |
| 10 to 14 Years | 2,486 (6.6%) | 2,000 (5.3%) |
| 15 to 19 Years | 2,853 (7.6%) | 2,563 (6.8%) |
| 20 to 24 Years | 2,388 (6.4%) | 2,741 (7.3%) |
| 25 to 29 Years | 2,950 (7.9%) | 2,477 (6.6%) |
| 30 to 34 Years | 2,873 (7.6%) | 2,805 (7.5%) |
| 35 to 39 Years | 2,967 (7.9%) | 2,715 (7.2%) |
| 40 to 44 Years | 2,078 (5.5%) | 2,052 (5.5%) |
| 45 to 49 Years | 2,422 (6.5%) | 1,957 (5.2%) |
| 50 to 54 Years | 2,322 (6.2%) | 2,482 (6.6%) |
| 55 to 59 Years | 2,338 (6.2%) | 2,438 (6.5%) |
| 60 to 64 Years | 2,087 (5.6%) | 2,083 (5.5%) |
| 65 to 69 Years | 1,563 (4.2%) | 1,925 (5.1%) |
| 70 to 74 Years | 1,469 (3.9%) | 1,487 (4.0%) |
| 75 to 79 Years | 712 (1.9%) | 977 (2.6%) |
| 80 to 84 Years | 606 (1.6%) | 877 (2.3%) |
| 85 Years and over | 588 (1.6%) | 1,080 (2.9%) |
| Total | 37,554 (100.0%) | 37,579 (100.0%) |
Families and Households in Appleton
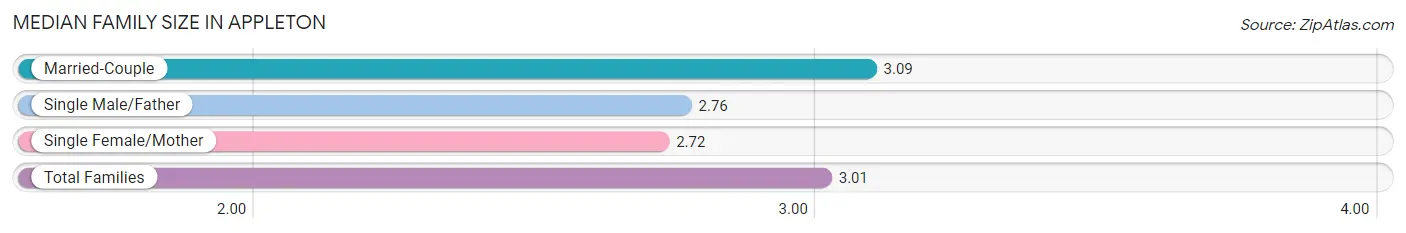
Median Family Size in Appleton
The median family size in Appleton is 3.01 persons per family, with married-couple families (14,417 | 77.3%) accounting for the largest median family size of 3.09 persons per family. On the other hand, single female/mother families (2,838 | 15.2%) represent the smallest median family size with 2.72 persons per family.
| Family Type | # Families | Family Size |
| Married-Couple | 14,417 (77.3%) | 3.09 |
| Single Male/Father | 1,401 (7.5%) | 2.76 |
| Single Female/Mother | 2,838 (15.2%) | 2.72 |
| Total Families | 18,656 (100.0%) | 3.01 |
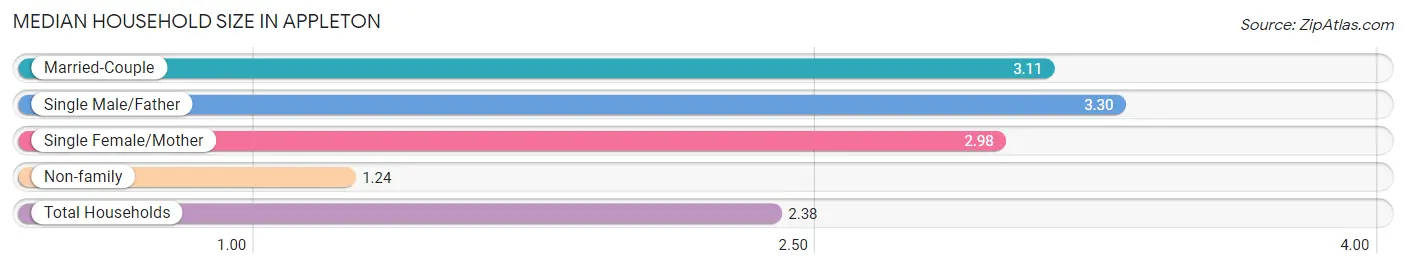
Median Household Size in Appleton
The median household size in Appleton is 2.38 persons per household, with single male/father households (1,401 | 4.6%) accounting for the largest median household size of 3.3 persons per household. non-family households (11,924 | 39.0%) represent the smallest median household size with 1.24 persons per household.
| Household Type | # Households | Household Size |
| Married-Couple | 14,417 (47.1%) | 3.11 |
| Single Male/Father | 1,401 (4.6%) | 3.30 |
| Single Female/Mother | 2,838 (9.3%) | 2.98 |
| Non-family | 11,924 (39.0%) | 1.24 |
| Total Households | 30,580 (100.0%) | 2.38 |
Household Size by Marriage Status in Appleton
Out of a total of 30,580 households in Appleton, 18,656 (61.0%) are family households, while 11,924 (39.0%) are nonfamily households. The most numerous type of family households are 2-person households, comprising 8,710, and the most common type of nonfamily households are 1-person households, comprising 9,685.
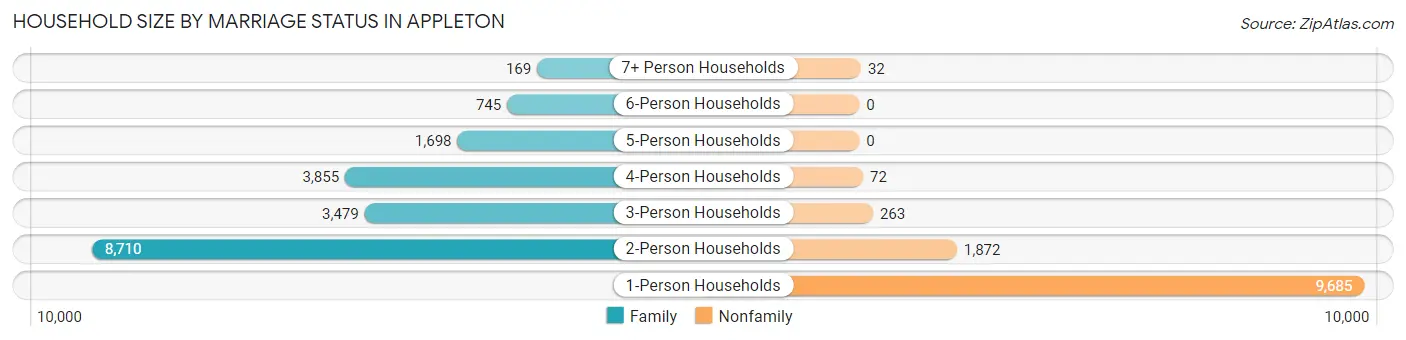
| Household Size | Family Households | Nonfamily Households |
| 1-Person Households | - | 9,685 (31.7%) |
| 2-Person Households | 8,710 (28.5%) | 1,872 (6.1%) |
| 3-Person Households | 3,479 (11.4%) | 263 (0.9%) |
| 4-Person Households | 3,855 (12.6%) | 72 (0.2%) |
| 5-Person Households | 1,698 (5.6%) | 0 (0.0%) |
| 6-Person Households | 745 (2.4%) | 0 (0.0%) |
| 7+ Person Households | 169 (0.5%) | 32 (0.1%) |
| Total | 18,656 (61.0%) | 11,924 (39.0%) |
Female Fertility in Appleton
Fertility by Age in Appleton
Average fertility rate in Appleton is 73.0 births per 1,000 women. Women in the age bracket of 20 to 34 years have the highest fertility rate with 109.0 births per 1,000 women. Women in the age bracket of 20 to 34 years acount for 67.7% of all women with births.
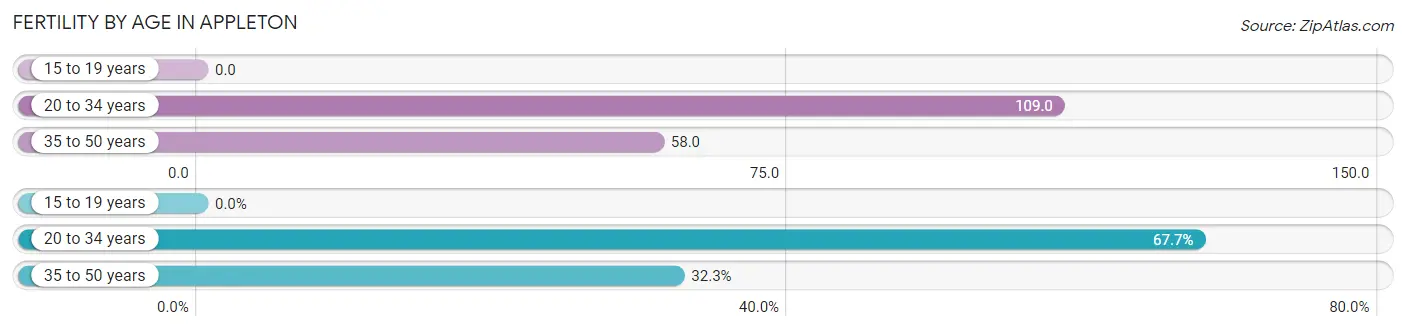
| Age Bracket | Women with Births | Births / 1,000 Women |
| 15 to 19 years | 0 (0.0%) | 0.0 |
| 20 to 34 years | 873 (67.7%) | 109.0 |
| 35 to 50 years | 417 (32.3%) | 58.0 |
| Total | 1,290 (100.0%) | 73.0 |
Fertility by Age by Marriage Status in Appleton
64.5% of women with births (1,290) in Appleton are married. The highest percentage of unmarried women with births falls into 20 to 34 years age bracket with 36.3% of them unmarried at the time of birth, while the lowest percentage of unmarried women with births belong to 35 to 50 years age bracket with 33.8% of them unmarried.
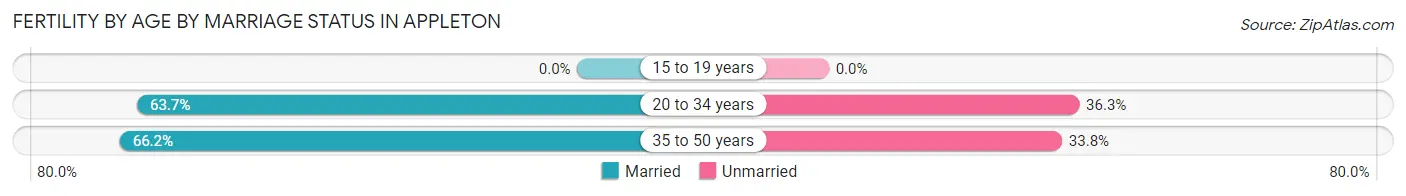
| Age Bracket | Married | Unmarried |
| 15 to 19 years | 0 (0.0%) | 0 (0.0%) |
| 20 to 34 years | 556 (63.7%) | 317 (36.3%) |
| 35 to 50 years | 276 (66.2%) | 141 (33.8%) |
| Total | 832 (64.5%) | 458 (35.5%) |
Fertility by Education in Appleton
Average fertility rate in Appleton is 73.0 births per 1,000 women. Women with the education attainment of less than high school have the highest fertility rate of 91.0 births per 1,000 women, while women with the education attainment of high school diploma have the lowest fertility at 42.0 births per 1,000 women. Women with the education attainment of college or associate's degree represent 34.6% of all women with births.
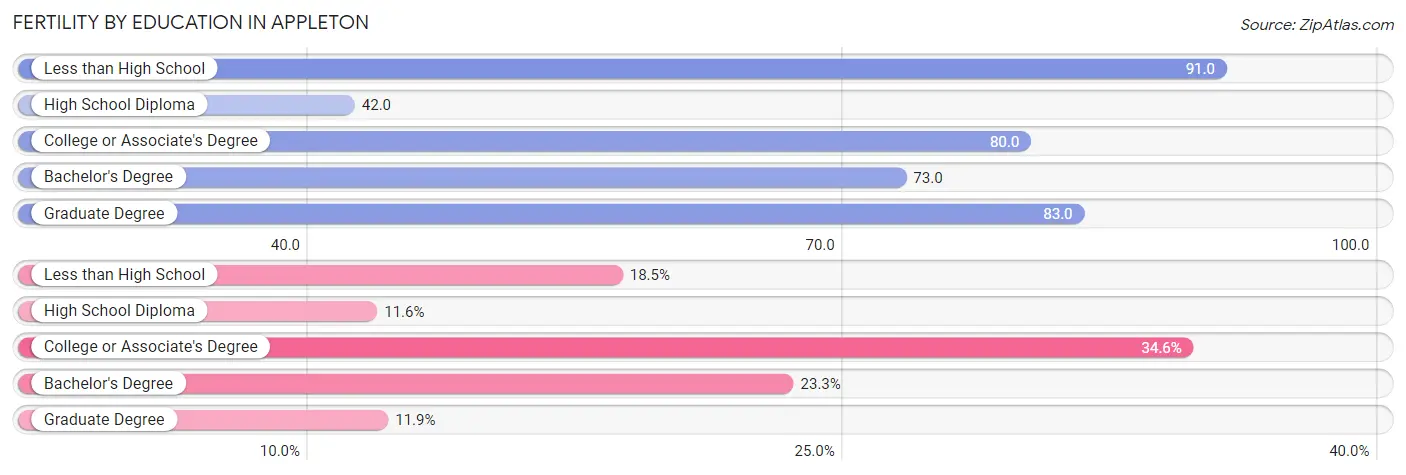
| Educational Attainment | Women with Births | Births / 1,000 Women |
| Less than High School | 239 (18.5%) | 91.0 |
| High School Diploma | 150 (11.6%) | 42.0 |
| College or Associate's Degree | 446 (34.6%) | 80.0 |
| Bachelor's Degree | 301 (23.3%) | 73.0 |
| Graduate Degree | 154 (11.9%) | 83.0 |
| Total | 1,290 (100.0%) | 73.0 |
Fertility by Education by Marriage Status in Appleton
35.5% of women with births in Appleton are unmarried. Women with the educational attainment of graduate degree are most likely to be married with 94.8% of them married at childbirth, while women with the educational attainment of less than high school are least likely to be married with 84.9% of them unmarried at childbirth.
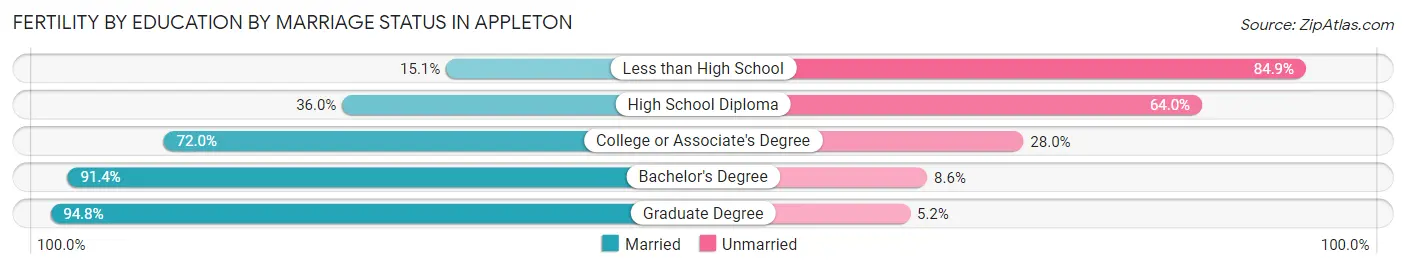
| Educational Attainment | Married | Unmarried |
| Less than High School | 36 (15.1%) | 203 (84.9%) |
| High School Diploma | 54 (36.0%) | 96 (64.0%) |
| College or Associate's Degree | 321 (72.0%) | 125 (28.0%) |
| Bachelor's Degree | 275 (91.4%) | 26 (8.6%) |
| Graduate Degree | 146 (94.8%) | 8 (5.2%) |
| Total | 832 (64.5%) | 458 (35.5%) |
Employment Characteristics in Appleton
Employment by Class of Employer in Appleton
Among the 39,881 employed individuals in Appleton, private company employees (29,630 | 74.3%), not-for-profit organizations (4,392 | 11.0%), and local government employees (2,304 | 5.8%) make up the most common classes of employment.
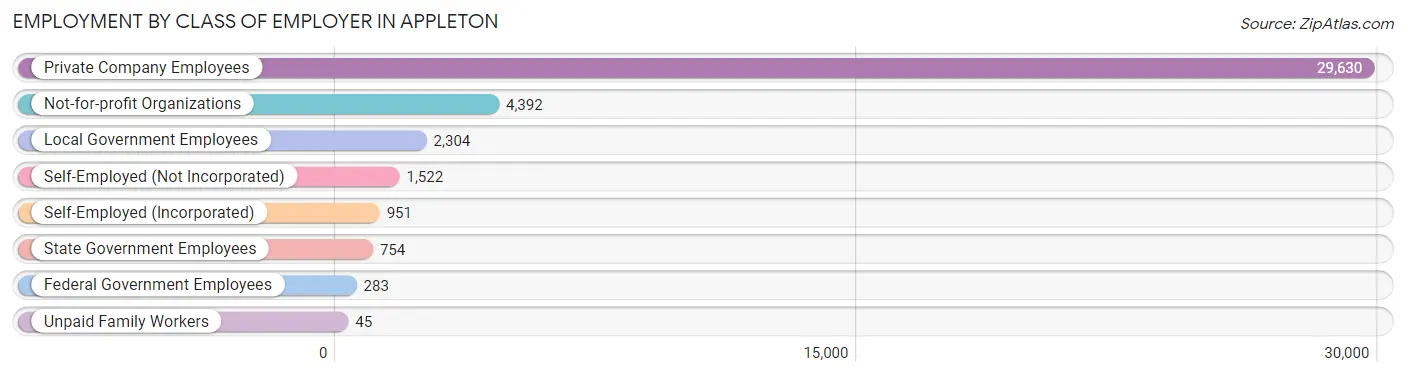
| Employer Class | # Employees | % Employees |
| Private Company Employees | 29,630 | 74.3% |
| Self-Employed (Incorporated) | 951 | 2.4% |
| Self-Employed (Not Incorporated) | 1,522 | 3.8% |
| Not-for-profit Organizations | 4,392 | 11.0% |
| Local Government Employees | 2,304 | 5.8% |
| State Government Employees | 754 | 1.9% |
| Federal Government Employees | 283 | 0.7% |
| Unpaid Family Workers | 45 | 0.1% |
| Total | 39,881 | 100.0% |
Employment Status by Age in Appleton
According to the labor force statistics for Appleton, out of the total population over 16 years of age (59,707), 70.4% or 42,034 individuals are in the labor force, with 3.9% or 1,639 of them unemployed. The age group with the highest labor force participation rate is 25 to 29 years, with 92.8% or 5,036 individuals in the labor force. Within the labor force, the 20 to 24 years age range has the highest percentage of unemployed individuals, with 7.0% or 282 of them being unemployed.
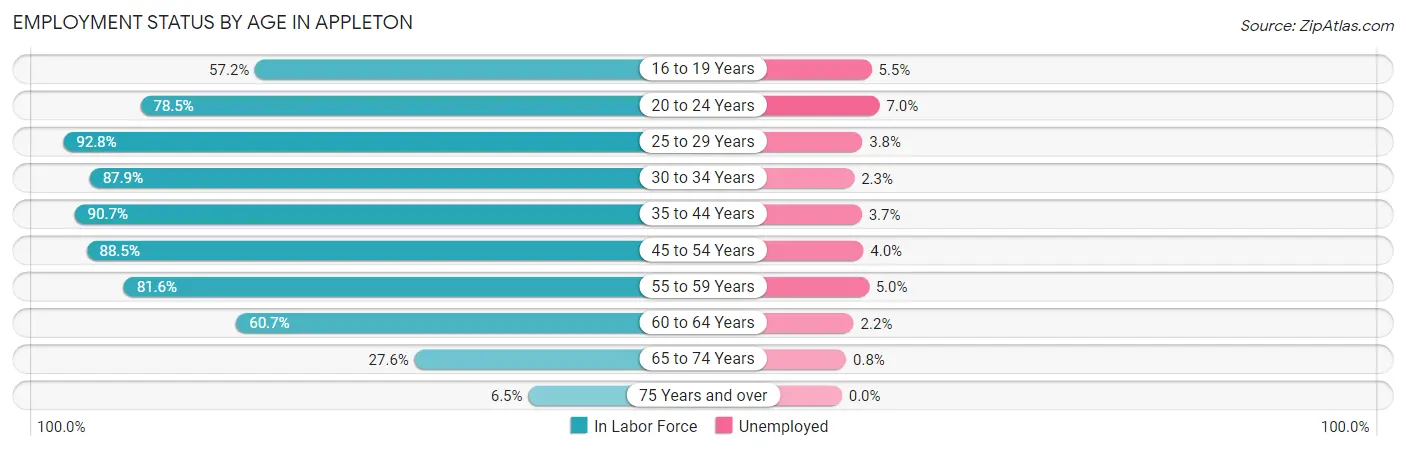
| Age Bracket | In Labor Force | Unemployed |
| 16 to 19 Years | 2,430 (57.2%) | 134 (5.5%) |
| 20 to 24 Years | 4,026 (78.5%) | 282 (7.0%) |
| 25 to 29 Years | 5,036 (92.8%) | 191 (3.8%) |
| 30 to 34 Years | 4,991 (87.9%) | 115 (2.3%) |
| 35 to 44 Years | 8,899 (90.7%) | 329 (3.7%) |
| 45 to 54 Years | 8,127 (88.5%) | 325 (4.0%) |
| 55 to 59 Years | 3,897 (81.6%) | 195 (5.0%) |
| 60 to 64 Years | 2,531 (60.7%) | 56 (2.2%) |
| 65 to 74 Years | 1,779 (27.6%) | 14 (0.8%) |
| 75 Years and over | 315 (6.5%) | 0 (0.0%) |
| Total | 42,034 (70.4%) | 1,639 (3.9%) |
Employment Status by Educational Attainment in Appleton
According to labor force statistics for Appleton, 85.7% of individuals (33,462) out of the total population between 25 and 64 years of age (39,046) are in the labor force, with 3.6% or 1,205 of them being unemployed. The group with the highest labor force participation rate are those with the educational attainment of bachelor's degree or higher, with 90.9% or 13,659 individuals in the labor force. Within the labor force, individuals with less than high school education have the highest percentage of unemployment, with 6.6% or 108 of them being unemployed.
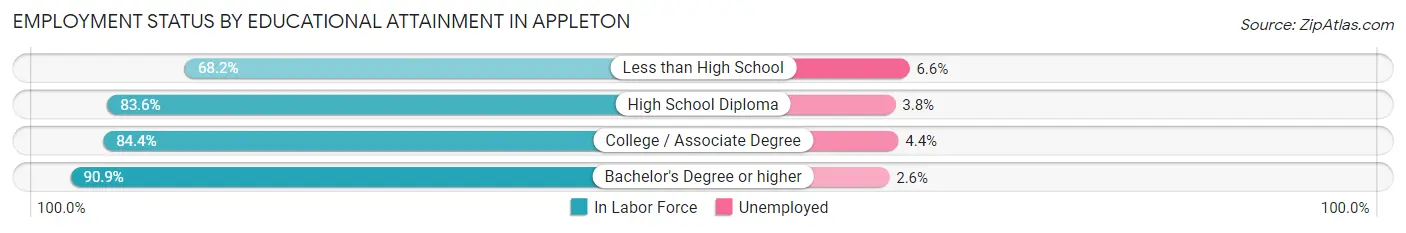
| Educational Attainment | In Labor Force | Unemployed |
| Less than High School | 1,637 (68.2%) | 158 (6.6%) |
| High School Diploma | 7,122 (83.6%) | 324 (3.8%) |
| College / Associate Degree | 11,057 (84.4%) | 576 (4.4%) |
| Bachelor's Degree or higher | 13,659 (90.9%) | 391 (2.6%) |
| Total | 33,462 (85.7%) | 1,406 (3.6%) |
Employment Occupations by Sex in Appleton
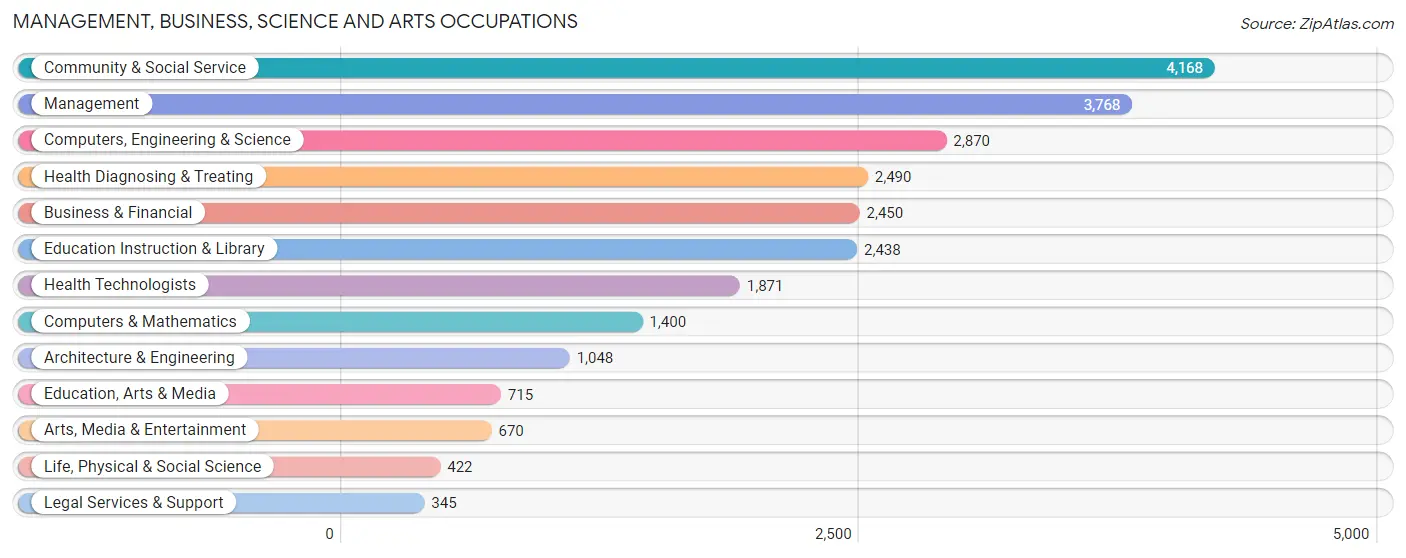
Management, Business, Science and Arts Occupations
The most common Management, Business, Science and Arts occupations in Appleton are Community & Social Service (4,168 | 10.3%), Management (3,768 | 9.3%), Computers, Engineering & Science (2,870 | 7.1%), Health Diagnosing & Treating (2,490 | 6.2%), and Business & Financial (2,450 | 6.1%).
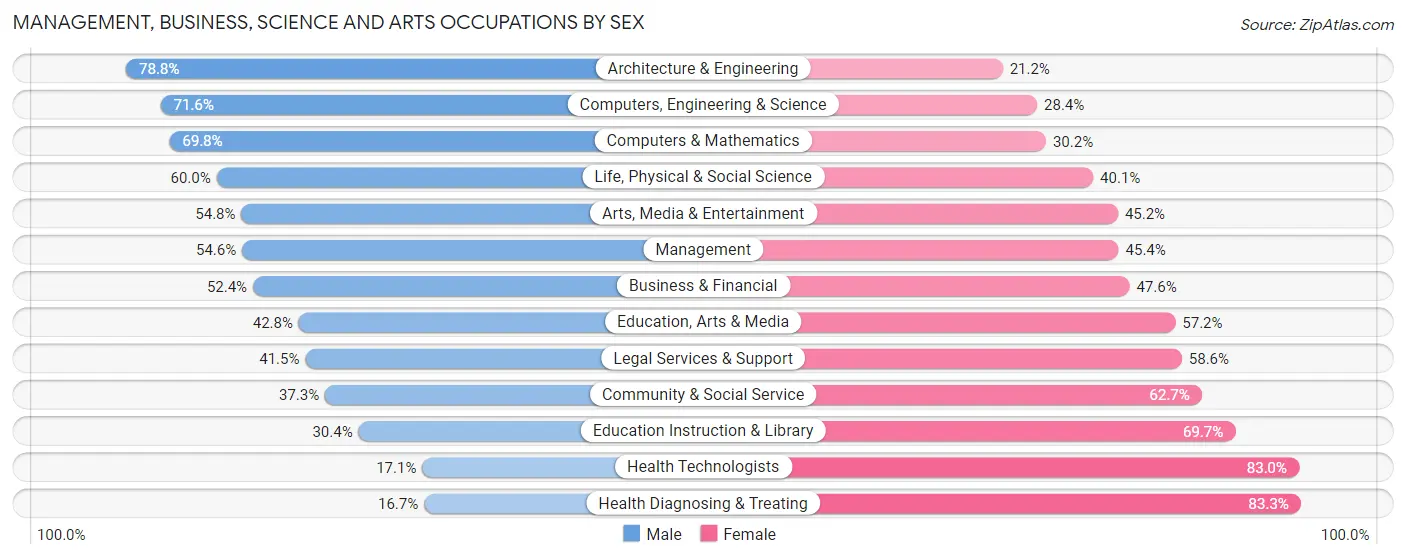
Management, Business, Science and Arts Occupations by Sex
Within the Management, Business, Science and Arts occupations in Appleton, the most male-oriented occupations are Architecture & Engineering (78.8%), Computers, Engineering & Science (71.6%), and Computers & Mathematics (69.8%), while the most female-oriented occupations are Health Diagnosing & Treating (83.3%), Health Technologists (83.0%), and Education Instruction & Library (69.7%).
| Occupation | Male | Female |
| Management | 2,059 (54.6%) | 1,709 (45.4%) |
| Business & Financial | 1,283 (52.4%) | 1,167 (47.6%) |
| Computers, Engineering & Science | 2,056 (71.6%) | 814 (28.4%) |
| Computers & Mathematics | 977 (69.8%) | 423 (30.2%) |
| Architecture & Engineering | 826 (78.8%) | 222 (21.2%) |
| Life, Physical & Social Science | 253 (60.0%) | 169 (40.1%) |
| Community & Social Service | 1,556 (37.3%) | 2,612 (62.7%) |
| Education, Arts & Media | 306 (42.8%) | 409 (57.2%) |
| Legal Services & Support | 143 (41.4%) | 202 (58.6%) |
| Education Instruction & Library | 740 (30.3%) | 1,698 (69.7%) |
| Arts, Media & Entertainment | 367 (54.8%) | 303 (45.2%) |
| Health Diagnosing & Treating | 415 (16.7%) | 2,075 (83.3%) |
| Health Technologists | 319 (17.1%) | 1,552 (83.0%) |
| Total (Category) | 7,369 (46.8%) | 8,377 (53.2%) |
| Total (Overall) | 20,926 (51.9%) | 19,416 (48.1%) |
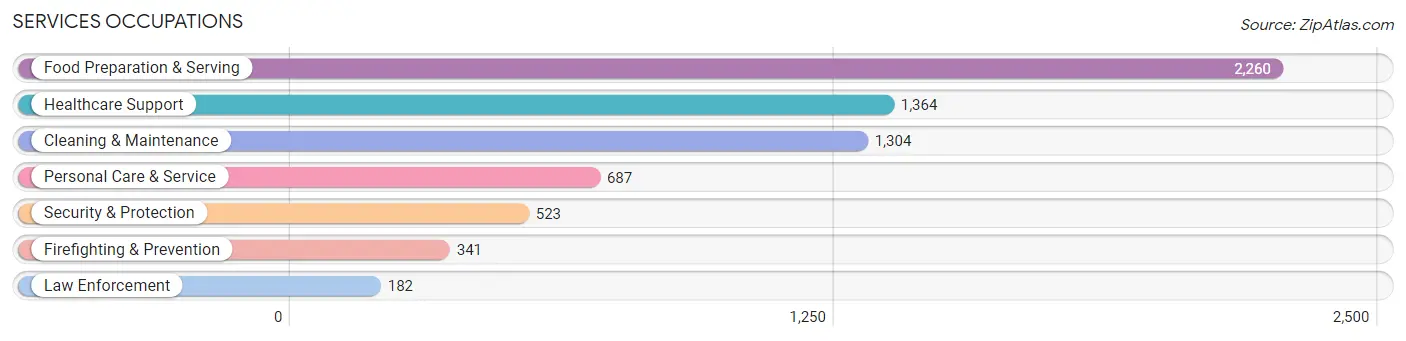
Services Occupations
The most common Services occupations in Appleton are Food Preparation & Serving (2,260 | 5.6%), Healthcare Support (1,364 | 3.4%), Cleaning & Maintenance (1,304 | 3.2%), Personal Care & Service (687 | 1.7%), and Security & Protection (523 | 1.3%).
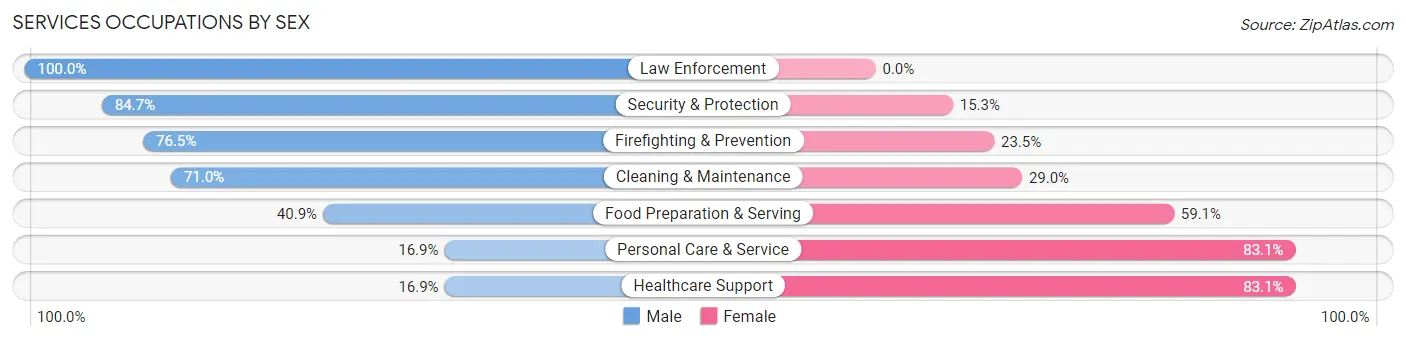
Services Occupations by Sex
Within the Services occupations in Appleton, the most male-oriented occupations are Law Enforcement (100.0%), Security & Protection (84.7%), and Firefighting & Prevention (76.5%), while the most female-oriented occupations are Healthcare Support (83.1%), Personal Care & Service (83.1%), and Food Preparation & Serving (59.1%).
| Occupation | Male | Female |
| Healthcare Support | 230 (16.9%) | 1,134 (83.1%) |
| Security & Protection | 443 (84.7%) | 80 (15.3%) |
| Firefighting & Prevention | 261 (76.5%) | 80 (23.5%) |
| Law Enforcement | 182 (100.0%) | 0 (0.0%) |
| Food Preparation & Serving | 925 (40.9%) | 1,335 (59.1%) |
| Cleaning & Maintenance | 926 (71.0%) | 378 (29.0%) |
| Personal Care & Service | 116 (16.9%) | 571 (83.1%) |
| Total (Category) | 2,640 (43.0%) | 3,498 (57.0%) |
| Total (Overall) | 20,926 (51.9%) | 19,416 (48.1%) |
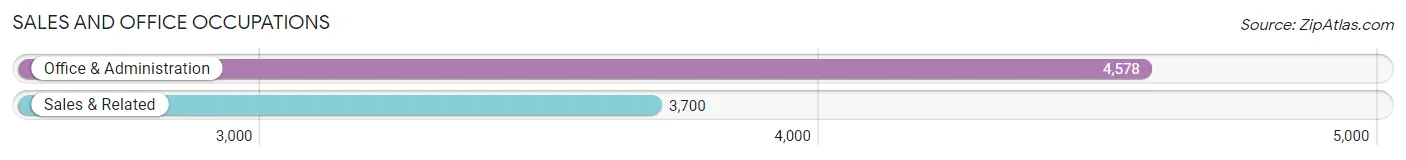
Sales and Office Occupations
The most common Sales and Office occupations in Appleton are Office & Administration (4,578 | 11.4%), and Sales & Related (3,700 | 9.2%).
Sales and Office Occupations by Sex
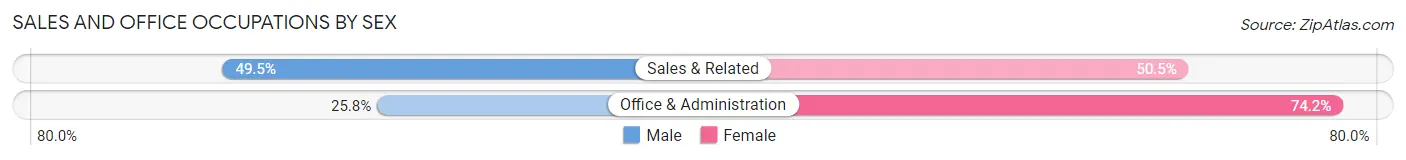
| Occupation | Male | Female |
| Sales & Related | 1,833 (49.5%) | 1,867 (50.5%) |
| Office & Administration | 1,180 (25.8%) | 3,398 (74.2%) |
| Total (Category) | 3,013 (36.4%) | 5,265 (63.6%) |
| Total (Overall) | 20,926 (51.9%) | 19,416 (48.1%) |
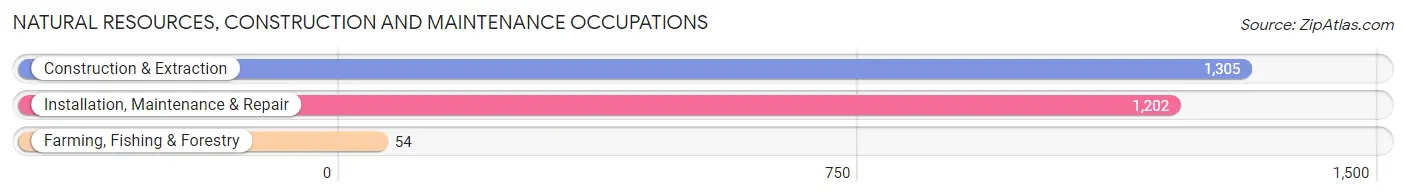
Natural Resources, Construction and Maintenance Occupations
The most common Natural Resources, Construction and Maintenance occupations in Appleton are Construction & Extraction (1,305 | 3.2%), Installation, Maintenance & Repair (1,202 | 3.0%), and Farming, Fishing & Forestry (54 | 0.1%).
Natural Resources, Construction and Maintenance Occupations by Sex
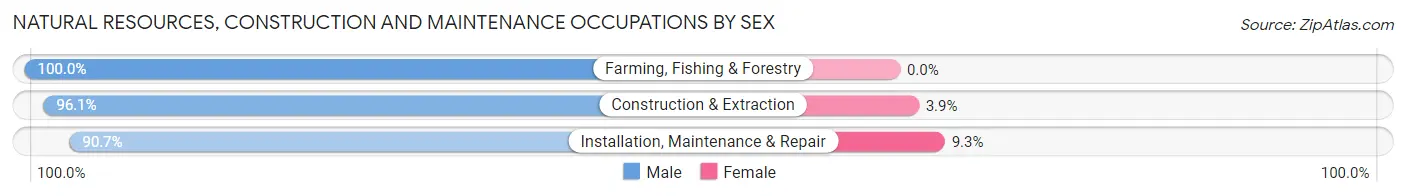
| Occupation | Male | Female |
| Farming, Fishing & Forestry | 54 (100.0%) | 0 (0.0%) |
| Construction & Extraction | 1,254 (96.1%) | 51 (3.9%) |
| Installation, Maintenance & Repair | 1,090 (90.7%) | 112 (9.3%) |
| Total (Category) | 2,398 (93.6%) | 163 (6.4%) |
| Total (Overall) | 20,926 (51.9%) | 19,416 (48.1%) |
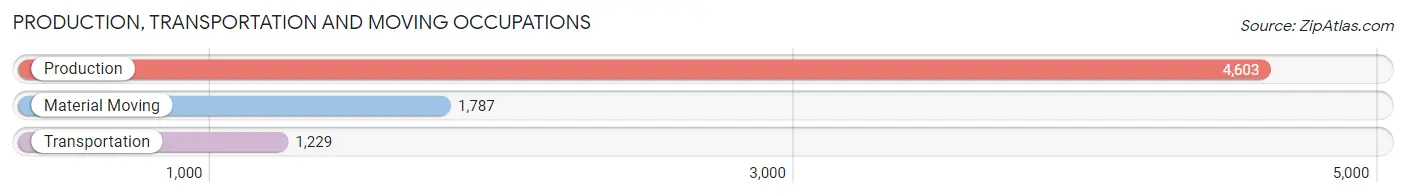
Production, Transportation and Moving Occupations
The most common Production, Transportation and Moving occupations in Appleton are Production (4,603 | 11.4%), Material Moving (1,787 | 4.4%), and Transportation (1,229 | 3.0%).
Production, Transportation and Moving Occupations by Sex
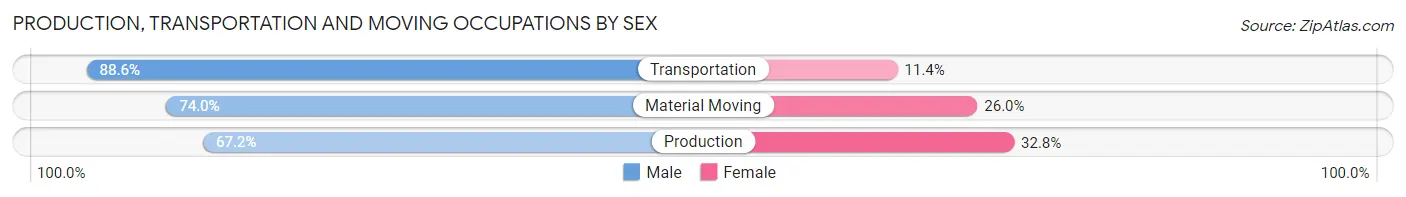
| Occupation | Male | Female |
| Production | 3,095 (67.2%) | 1,508 (32.8%) |
| Transportation | 1,089 (88.6%) | 140 (11.4%) |
| Material Moving | 1,322 (74.0%) | 465 (26.0%) |
| Total (Category) | 5,506 (72.3%) | 2,113 (27.7%) |
| Total (Overall) | 20,926 (51.9%) | 19,416 (48.1%) |
Employment Industries by Sex in Appleton
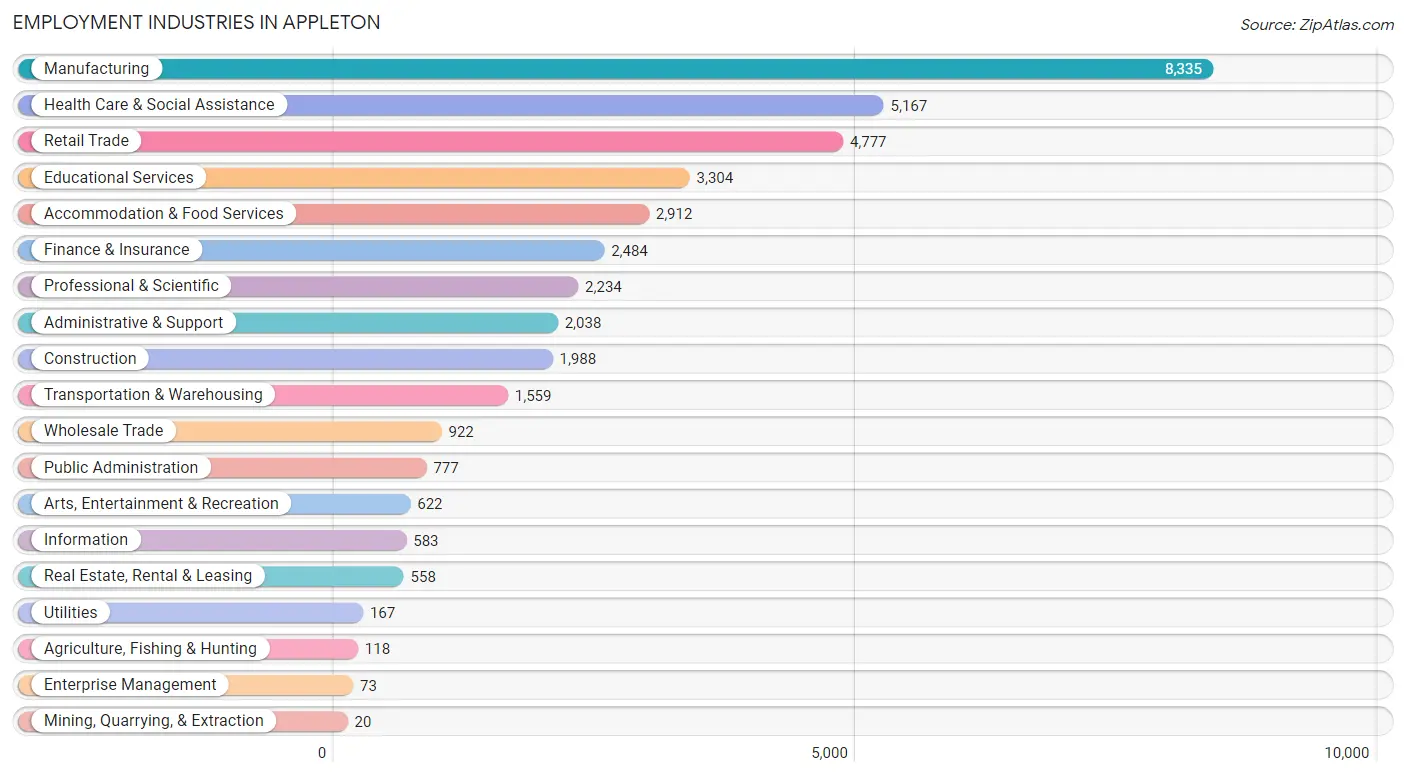
Employment Industries in Appleton
The major employment industries in Appleton include Manufacturing (8,335 | 20.7%), Health Care & Social Assistance (5,167 | 12.8%), Retail Trade (4,777 | 11.8%), Educational Services (3,304 | 8.2%), and Accommodation & Food Services (2,912 | 7.2%).
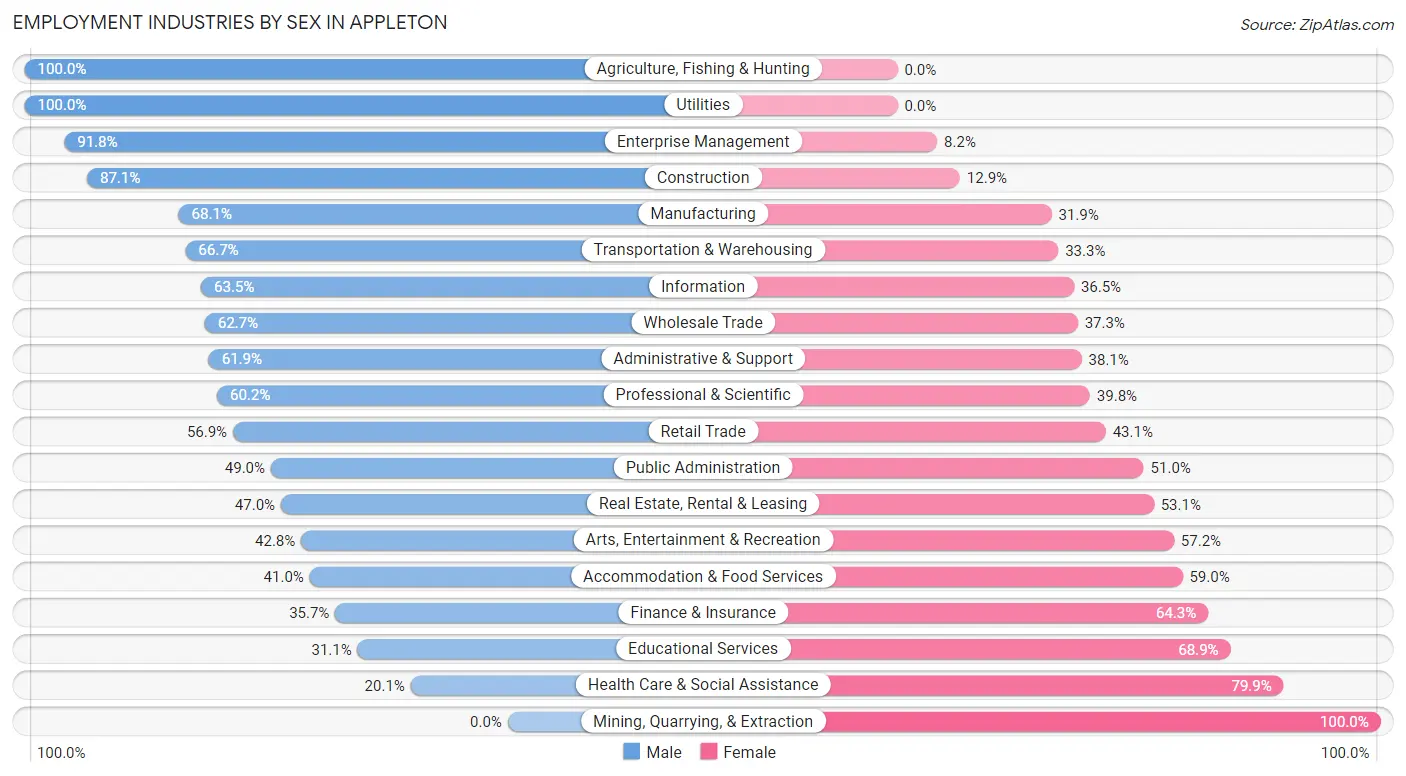
Employment Industries by Sex in Appleton
The Appleton industries that see more men than women are Agriculture, Fishing & Hunting (100.0%), Utilities (100.0%), and Enterprise Management (91.8%), whereas the industries that tend to have a higher number of women are Mining, Quarrying, & Extraction (100.0%), Health Care & Social Assistance (79.9%), and Educational Services (68.9%).
| Industry | Male | Female |
| Agriculture, Fishing & Hunting | 118 (100.0%) | 0 (0.0%) |
| Mining, Quarrying, & Extraction | 0 (0.0%) | 20 (100.0%) |
| Construction | 1,731 (87.1%) | 257 (12.9%) |
| Manufacturing | 5,676 (68.1%) | 2,659 (31.9%) |
| Wholesale Trade | 578 (62.7%) | 344 (37.3%) |
| Retail Trade | 2,717 (56.9%) | 2,060 (43.1%) |
| Transportation & Warehousing | 1,040 (66.7%) | 519 (33.3%) |
| Utilities | 167 (100.0%) | 0 (0.0%) |
| Information | 370 (63.5%) | 213 (36.5%) |
| Finance & Insurance | 887 (35.7%) | 1,597 (64.3%) |
| Real Estate, Rental & Leasing | 262 (46.9%) | 296 (53.0%) |
| Professional & Scientific | 1,344 (60.2%) | 890 (39.8%) |
| Enterprise Management | 67 (91.8%) | 6 (8.2%) |
| Administrative & Support | 1,261 (61.9%) | 777 (38.1%) |
| Educational Services | 1,027 (31.1%) | 2,277 (68.9%) |
| Health Care & Social Assistance | 1,038 (20.1%) | 4,129 (79.9%) |
| Arts, Entertainment & Recreation | 266 (42.8%) | 356 (57.2%) |
| Accommodation & Food Services | 1,194 (41.0%) | 1,718 (59.0%) |
| Public Administration | 381 (49.0%) | 396 (51.0%) |
| Total | 20,926 (51.9%) | 19,416 (48.1%) |
Education in Appleton
School Enrollment in Appleton
The most common levels of schooling among the 18,725 students in Appleton are high school (4,411 | 23.6%), college / undergraduate (4,179 | 22.3%), and elementary school (3,939 | 21.0%).
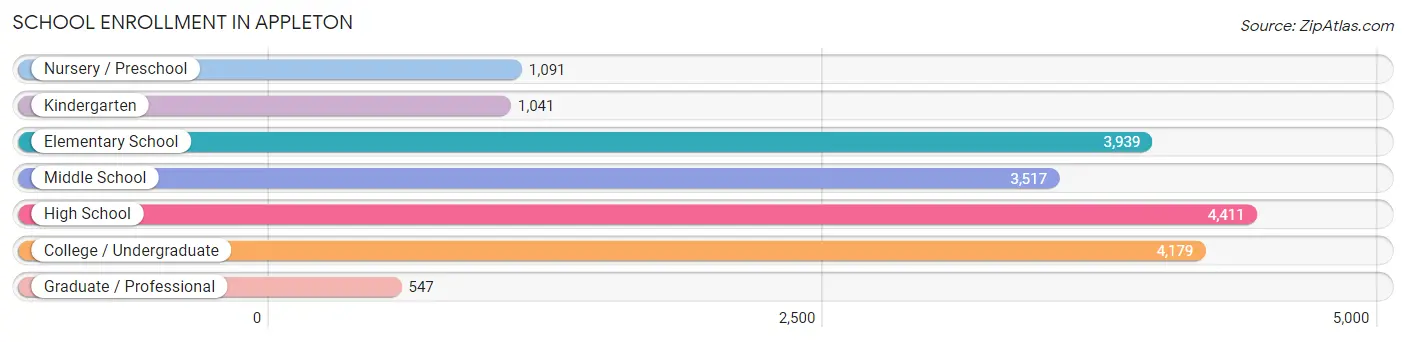
| School Level | # Students | % Students |
| Nursery / Preschool | 1,091 | 5.8% |
| Kindergarten | 1,041 | 5.6% |
| Elementary School | 3,939 | 21.0% |
| Middle School | 3,517 | 18.8% |
| High School | 4,411 | 23.6% |
| College / Undergraduate | 4,179 | 22.3% |
| Graduate / Professional | 547 | 2.9% |
| Total | 18,725 | 100.0% |
School Enrollment by Age by Funding Source in Appleton
Out of a total of 18,725 students who are enrolled in schools in Appleton, 3,820 (20.4%) attend a private institution, while the remaining 14,905 (79.6%) are enrolled in public schools. The age group of 18 to 19 year olds has the highest likelihood of being enrolled in private schools, with 819 (44.8% in the age bracket) enrolled. Conversely, the age group of 15 to 17 year olds has the lowest likelihood of being enrolled in a private school, with 2,884 (91.8% in the age bracket) attending a public institution.
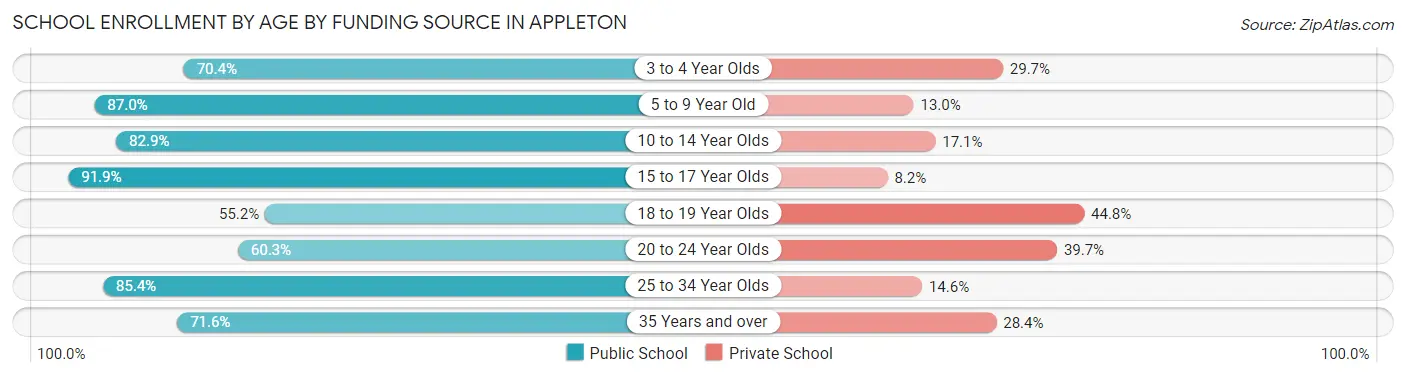
| Age Bracket | Public School | Private School |
| 3 to 4 Year Olds | 617 (70.4%) | 260 (29.6%) |
| 5 to 9 Year Old | 4,174 (87.0%) | 624 (13.0%) |
| 10 to 14 Year Olds | 3,608 (82.9%) | 742 (17.1%) |
| 15 to 17 Year Olds | 2,884 (91.8%) | 256 (8.2%) |
| 18 to 19 Year Olds | 1,010 (55.2%) | 819 (44.8%) |
| 20 to 24 Year Olds | 1,059 (60.3%) | 698 (39.7%) |
| 25 to 34 Year Olds | 890 (85.4%) | 152 (14.6%) |
| 35 Years and over | 667 (71.6%) | 265 (28.4%) |
| Total | 14,905 (79.6%) | 3,820 (20.4%) |
Educational Attainment by Field of Study in Appleton
Business (3,892 | 19.2%), education (2,658 | 13.1%), science & technology (2,026 | 10.0%), engineering (1,541 | 7.6%), and arts & humanities (1,419 | 7.0%) are the most common fields of study among 20,248 individuals in Appleton who have obtained a bachelor's degree or higher.
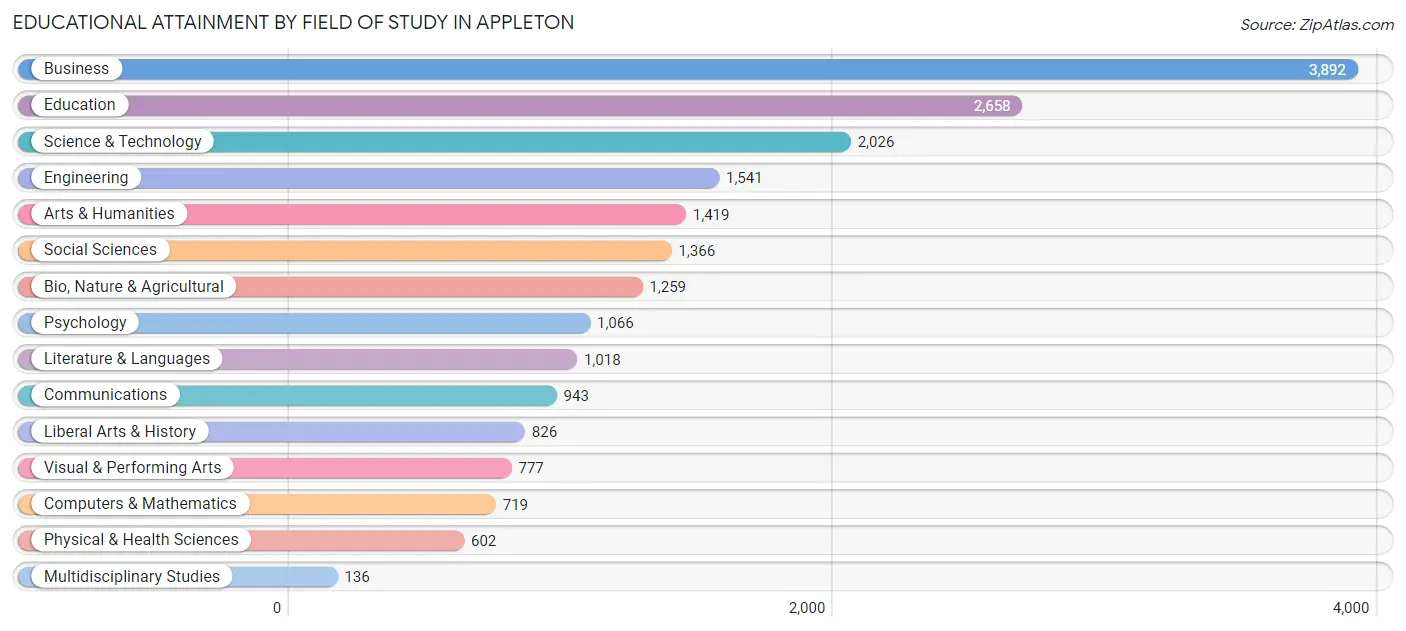
| Field of Study | # Graduates | % Graduates |
| Computers & Mathematics | 719 | 3.5% |
| Bio, Nature & Agricultural | 1,259 | 6.2% |
| Physical & Health Sciences | 602 | 3.0% |
| Psychology | 1,066 | 5.3% |
| Social Sciences | 1,366 | 6.8% |
| Engineering | 1,541 | 7.6% |
| Multidisciplinary Studies | 136 | 0.7% |
| Science & Technology | 2,026 | 10.0% |
| Business | 3,892 | 19.2% |
| Education | 2,658 | 13.1% |
| Literature & Languages | 1,018 | 5.0% |
| Liberal Arts & History | 826 | 4.1% |
| Visual & Performing Arts | 777 | 3.8% |
| Communications | 943 | 4.7% |
| Arts & Humanities | 1,419 | 7.0% |
| Total | 20,248 | 100.0% |
Transportation & Commute in Appleton
Vehicle Availability by Sex in Appleton
The most prevalent vehicle ownership categories in Appleton are males with 2 vehicles (10,257, accounting for 50.4%) and females with 2 vehicles (9,467, making up 54.6%).
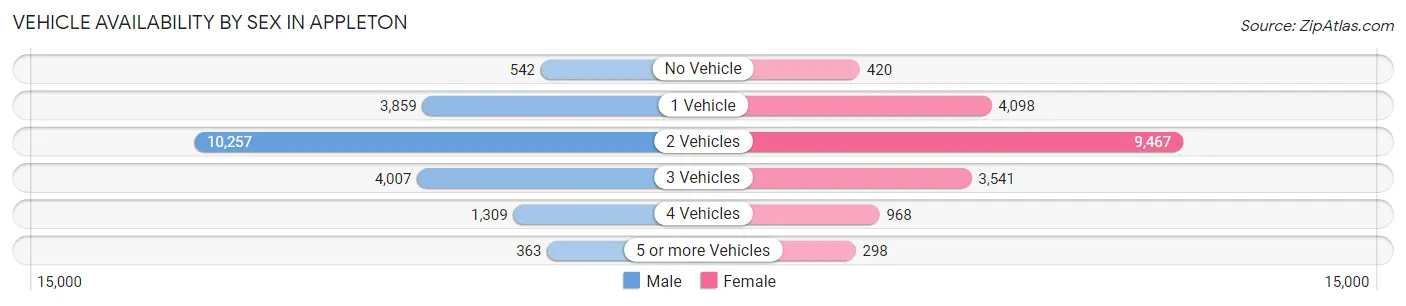
| Vehicles Available | Male | Female |
| No Vehicle | 542 (2.7%) | 420 (2.2%) |
| 1 Vehicle | 3,859 (19.0%) | 4,098 (21.8%) |
| 2 Vehicles | 10,257 (50.4%) | 9,467 (50.4%) |
| 3 Vehicles | 4,007 (19.7%) | 3,541 (18.8%) |
| 4 Vehicles | 1,309 (6.4%) | 968 (5.1%) |
| 5 or more Vehicles | 363 (1.8%) | 298 (1.6%) |
| Total | 20,337 (100.0%) | 18,792 (100.0%) |
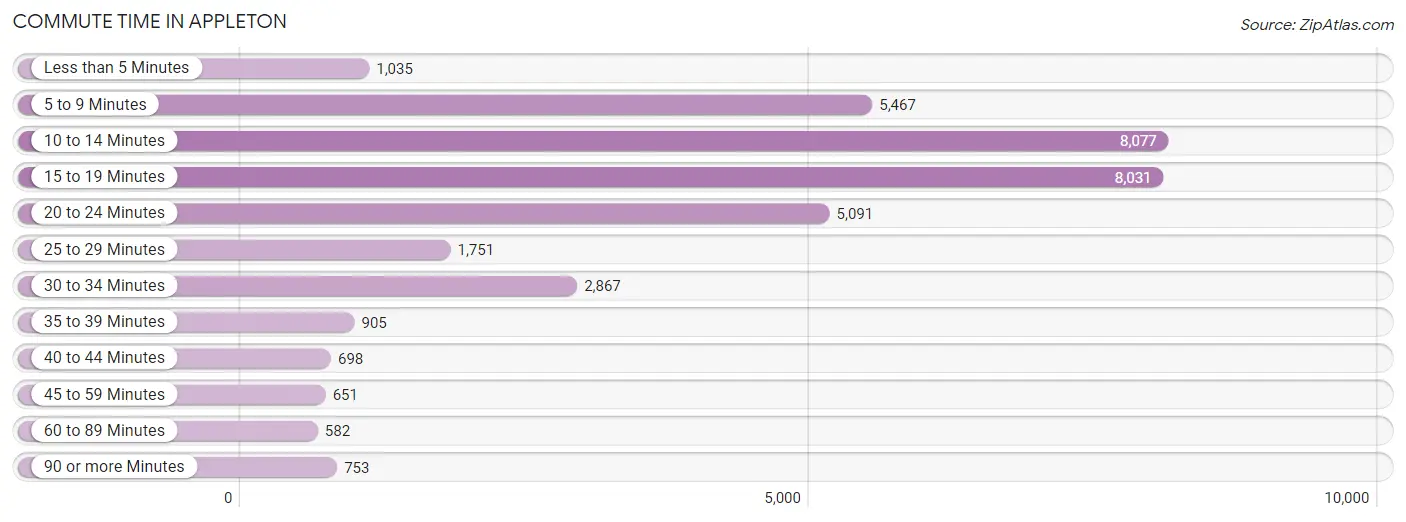
Commute Time in Appleton
The most frequently occuring commute durations in Appleton are 10 to 14 minutes (8,077 commuters, 22.5%), 15 to 19 minutes (8,031 commuters, 22.4%), and 5 to 9 minutes (5,467 commuters, 15.2%).
| Commute Time | # Commuters | % Commuters |
| Less than 5 Minutes | 1,035 | 2.9% |
| 5 to 9 Minutes | 5,467 | 15.2% |
| 10 to 14 Minutes | 8,077 | 22.5% |
| 15 to 19 Minutes | 8,031 | 22.4% |
| 20 to 24 Minutes | 5,091 | 14.2% |
| 25 to 29 Minutes | 1,751 | 4.9% |
| 30 to 34 Minutes | 2,867 | 8.0% |
| 35 to 39 Minutes | 905 | 2.5% |
| 40 to 44 Minutes | 698 | 1.9% |
| 45 to 59 Minutes | 651 | 1.8% |
| 60 to 89 Minutes | 582 | 1.6% |
| 90 or more Minutes | 753 | 2.1% |
Commute Time by Sex in Appleton
The most common commute times in Appleton are 15 to 19 minutes (4,215 commuters, 22.6%) for males and 10 to 14 minutes (4,231 commuters, 24.5%) for females.
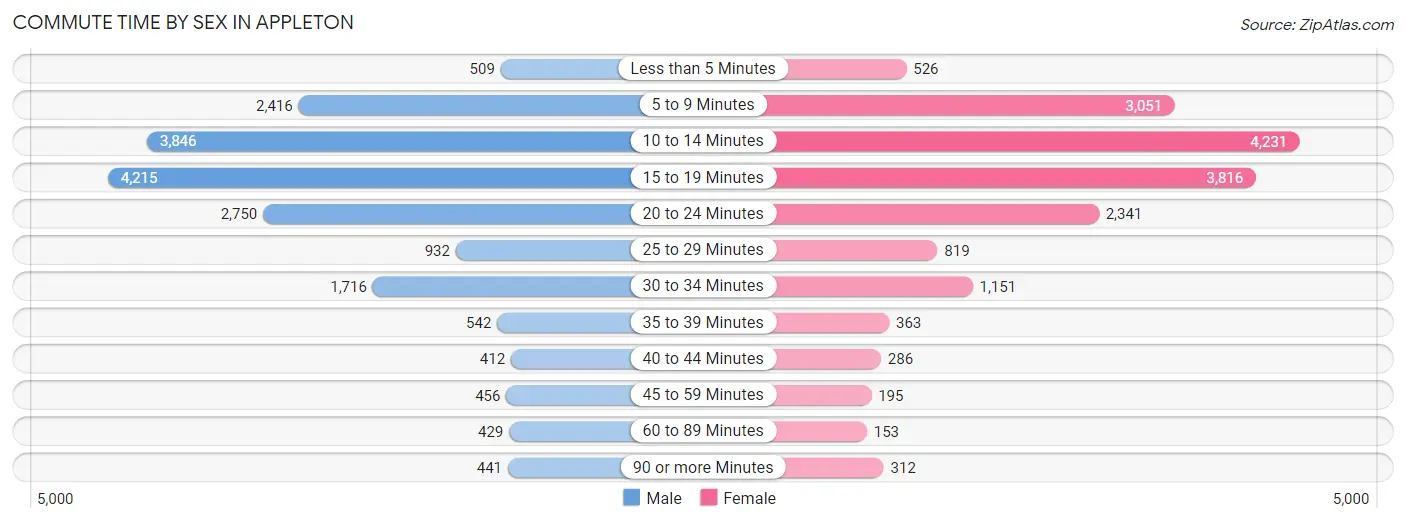
| Commute Time | Male | Female |
| Less than 5 Minutes | 509 (2.7%) | 526 (3.0%) |
| 5 to 9 Minutes | 2,416 (12.9%) | 3,051 (17.7%) |
| 10 to 14 Minutes | 3,846 (20.6%) | 4,231 (24.5%) |
| 15 to 19 Minutes | 4,215 (22.6%) | 3,816 (22.1%) |
| 20 to 24 Minutes | 2,750 (14.7%) | 2,341 (13.6%) |
| 25 to 29 Minutes | 932 (5.0%) | 819 (4.8%) |
| 30 to 34 Minutes | 1,716 (9.2%) | 1,151 (6.7%) |
| 35 to 39 Minutes | 542 (2.9%) | 363 (2.1%) |
| 40 to 44 Minutes | 412 (2.2%) | 286 (1.7%) |
| 45 to 59 Minutes | 456 (2.4%) | 195 (1.1%) |
| 60 to 89 Minutes | 429 (2.3%) | 153 (0.9%) |
| 90 or more Minutes | 441 (2.4%) | 312 (1.8%) |
Time of Departure to Work by Sex in Appleton
The most frequent times of departure to work in Appleton are 7:00 AM to 7:29 AM (2,467, 13.2%) for males and 7:00 AM to 7:29 AM (3,117, 18.1%) for females.
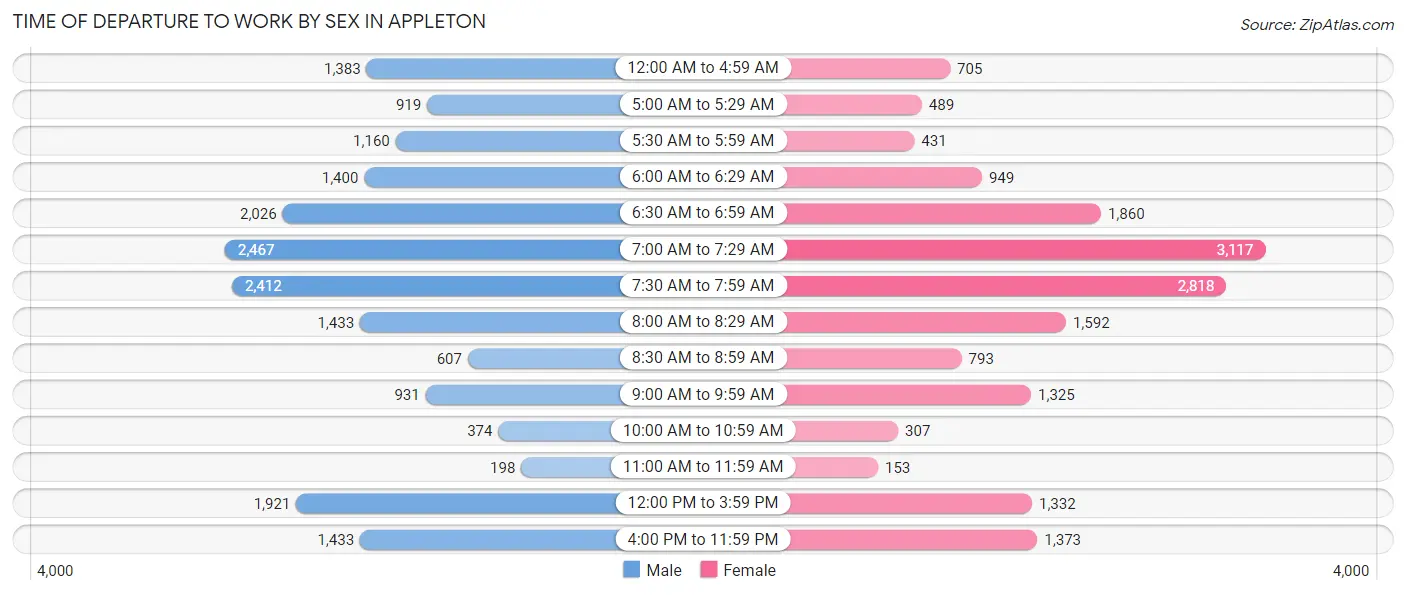
| Time of Departure | Male | Female |
| 12:00 AM to 4:59 AM | 1,383 (7.4%) | 705 (4.1%) |
| 5:00 AM to 5:29 AM | 919 (4.9%) | 489 (2.8%) |
| 5:30 AM to 5:59 AM | 1,160 (6.2%) | 431 (2.5%) |
| 6:00 AM to 6:29 AM | 1,400 (7.5%) | 949 (5.5%) |
| 6:30 AM to 6:59 AM | 2,026 (10.9%) | 1,860 (10.8%) |
| 7:00 AM to 7:29 AM | 2,467 (13.2%) | 3,117 (18.1%) |
| 7:30 AM to 7:59 AM | 2,412 (12.9%) | 2,818 (16.3%) |
| 8:00 AM to 8:29 AM | 1,433 (7.7%) | 1,592 (9.2%) |
| 8:30 AM to 8:59 AM | 607 (3.3%) | 793 (4.6%) |
| 9:00 AM to 9:59 AM | 931 (5.0%) | 1,325 (7.7%) |
| 10:00 AM to 10:59 AM | 374 (2.0%) | 307 (1.8%) |
| 11:00 AM to 11:59 AM | 198 (1.1%) | 153 (0.9%) |
| 12:00 PM to 3:59 PM | 1,921 (10.3%) | 1,332 (7.7%) |
| 4:00 PM to 11:59 PM | 1,433 (7.7%) | 1,373 (8.0%) |
| Total | 18,664 (100.0%) | 17,244 (100.0%) |
Housing Occupancy in Appleton
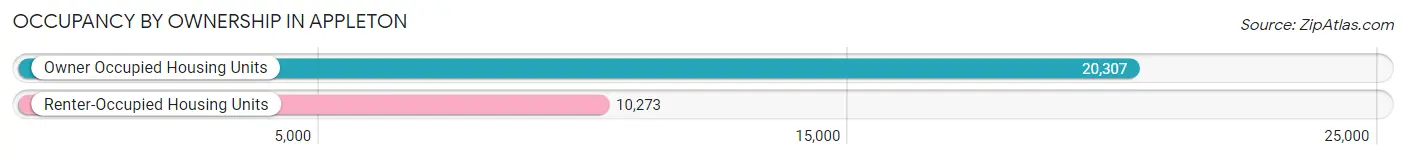
Occupancy by Ownership in Appleton
Of the total 30,580 dwellings in Appleton, owner-occupied units account for 20,307 (66.4%), while renter-occupied units make up 10,273 (33.6%).
| Occupancy | # Housing Units | % Housing Units |
| Owner Occupied Housing Units | 20,307 | 66.4% |
| Renter-Occupied Housing Units | 10,273 | 33.6% |
| Total Occupied Housing Units | 30,580 | 100.0% |
Occupancy by Household Size in Appleton
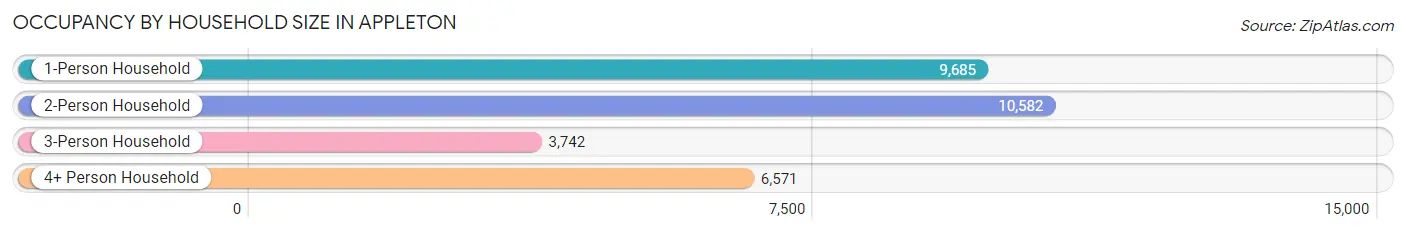
| Household Size | # Housing Units | % Housing Units |
| 1-Person Household | 9,685 | 31.7% |
| 2-Person Household | 10,582 | 34.6% |
| 3-Person Household | 3,742 | 12.2% |
| 4+ Person Household | 6,571 | 21.5% |
| Total Housing Units | 30,580 | 100.0% |
Occupancy by Ownership by Household Size in Appleton
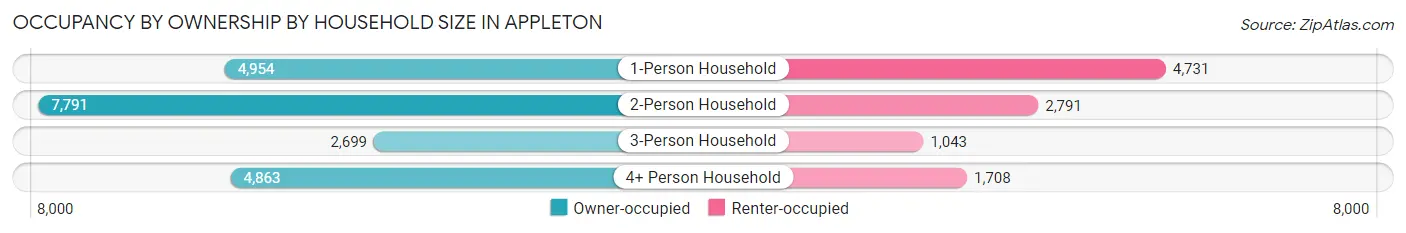
| Household Size | Owner-occupied | Renter-occupied |
| 1-Person Household | 4,954 (51.1%) | 4,731 (48.8%) |
| 2-Person Household | 7,791 (73.6%) | 2,791 (26.4%) |
| 3-Person Household | 2,699 (72.1%) | 1,043 (27.9%) |
| 4+ Person Household | 4,863 (74.0%) | 1,708 (26.0%) |
| Total Housing Units | 20,307 (66.4%) | 10,273 (33.6%) |
Occupancy by Educational Attainment in Appleton
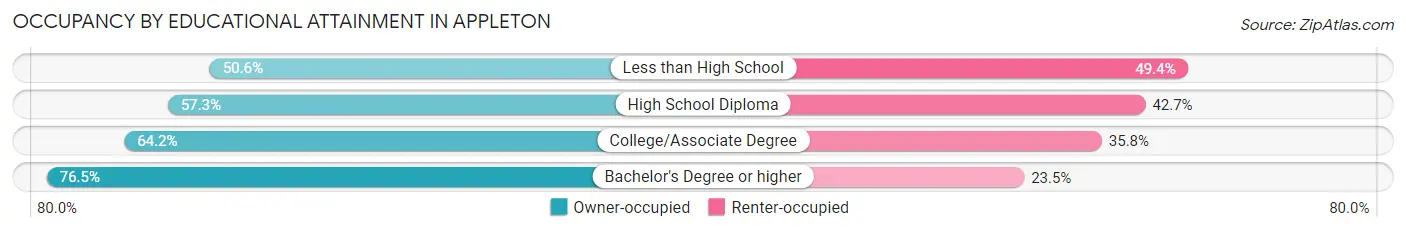
| Household Size | Owner-occupied | Renter-occupied |
| Less than High School | 799 (50.6%) | 779 (49.4%) |
| High School Diploma | 4,230 (57.3%) | 3,154 (42.7%) |
| College/Associate Degree | 6,589 (64.2%) | 3,674 (35.8%) |
| Bachelor's Degree or higher | 8,689 (76.5%) | 2,666 (23.5%) |
Occupancy by Age of Householder in Appleton
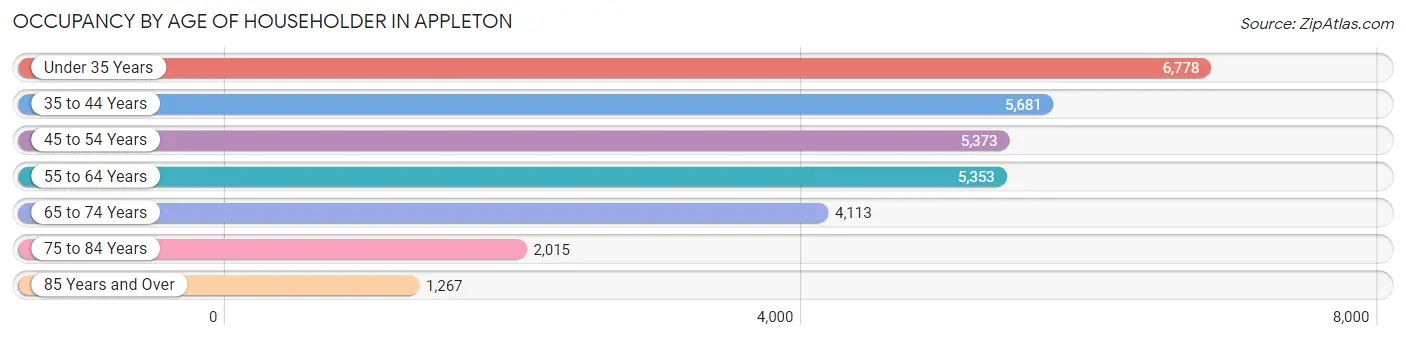
| Age Bracket | # Households | % Households |
| Under 35 Years | 6,778 | 22.2% |
| 35 to 44 Years | 5,681 | 18.6% |
| 45 to 54 Years | 5,373 | 17.6% |
| 55 to 64 Years | 5,353 | 17.5% |
| 65 to 74 Years | 4,113 | 13.5% |
| 75 to 84 Years | 2,015 | 6.6% |
| 85 Years and Over | 1,267 | 4.1% |
| Total | 30,580 | 100.0% |
Housing Finances in Appleton
Median Income by Occupancy in Appleton
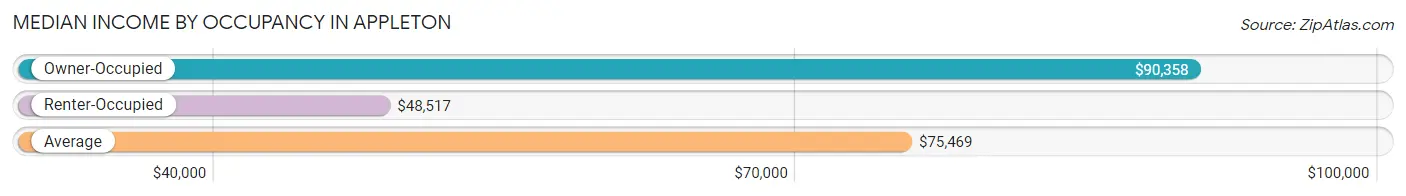
| Occupancy Type | # Households | Median Income |
| Owner-Occupied | 20,307 (66.4%) | $90,358 |
| Renter-Occupied | 10,273 (33.6%) | $48,517 |
| Average | 30,580 (100.0%) | $75,469 |
Occupancy by Householder Income Bracket in Appleton
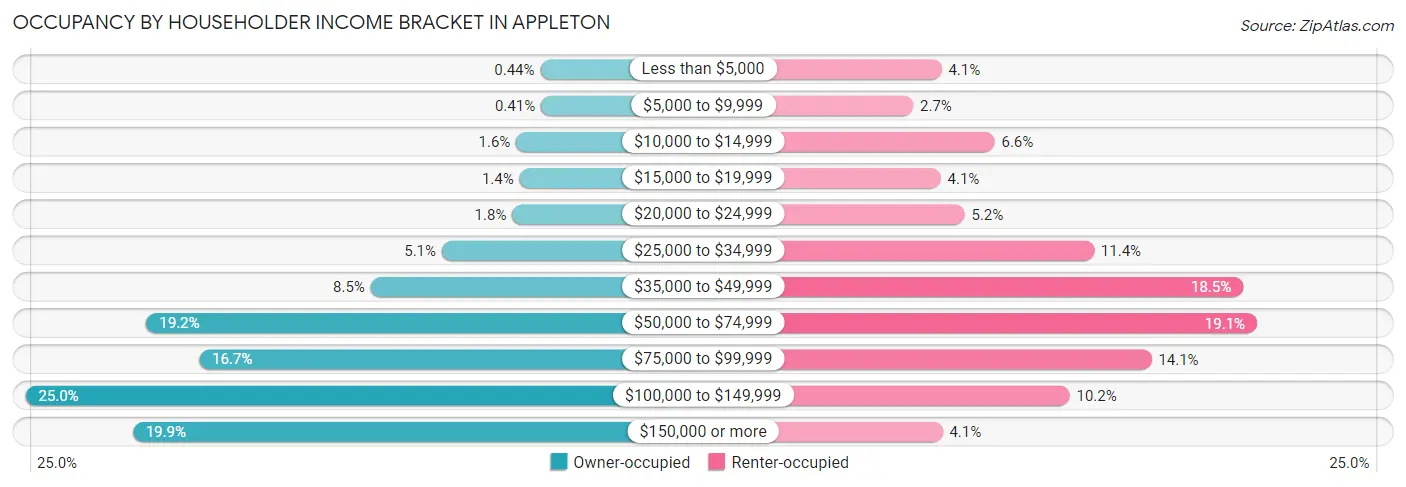
| Income Bracket | Owner-occupied | Renter-occupied |
| Less than $5,000 | 90 (0.4%) | 420 (4.1%) |
| $5,000 to $9,999 | 83 (0.4%) | 281 (2.7%) |
| $10,000 to $14,999 | 323 (1.6%) | 680 (6.6%) |
| $15,000 to $19,999 | 290 (1.4%) | 416 (4.1%) |
| $20,000 to $24,999 | 362 (1.8%) | 533 (5.2%) |
| $25,000 to $34,999 | 1,042 (5.1%) | 1,166 (11.4%) |
| $35,000 to $49,999 | 1,730 (8.5%) | 1,895 (18.4%) |
| $50,000 to $74,999 | 3,899 (19.2%) | 1,963 (19.1%) |
| $75,000 to $99,999 | 3,389 (16.7%) | 1,447 (14.1%) |
| $100,000 to $149,999 | 5,069 (25.0%) | 1,047 (10.2%) |
| $150,000 or more | 4,030 (19.9%) | 425 (4.1%) |
| Total | 20,307 (100.0%) | 10,273 (100.0%) |
Monthly Housing Cost Tiers in Appleton
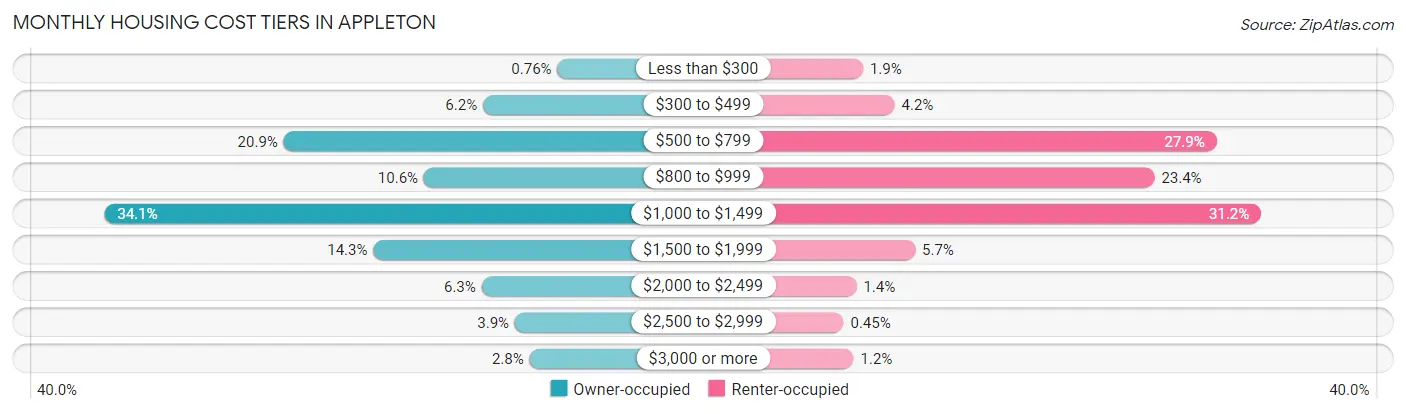
| Monthly Cost | Owner-occupied | Renter-occupied |
| Less than $300 | 154 (0.8%) | 193 (1.9%) |
| $300 to $499 | 1,267 (6.2%) | 433 (4.2%) |
| $500 to $799 | 4,249 (20.9%) | 2,868 (27.9%) |
| $800 to $999 | 2,151 (10.6%) | 2,399 (23.4%) |
| $1,000 to $1,499 | 6,930 (34.1%) | 3,205 (31.2%) |
| $1,500 to $1,999 | 2,907 (14.3%) | 588 (5.7%) |
| $2,000 to $2,499 | 1,288 (6.3%) | 144 (1.4%) |
| $2,500 to $2,999 | 790 (3.9%) | 46 (0.4%) |
| $3,000 or more | 571 (2.8%) | 122 (1.2%) |
| Total | 20,307 (100.0%) | 10,273 (100.0%) |
Physical Housing Characteristics in Appleton
Housing Structures in Appleton
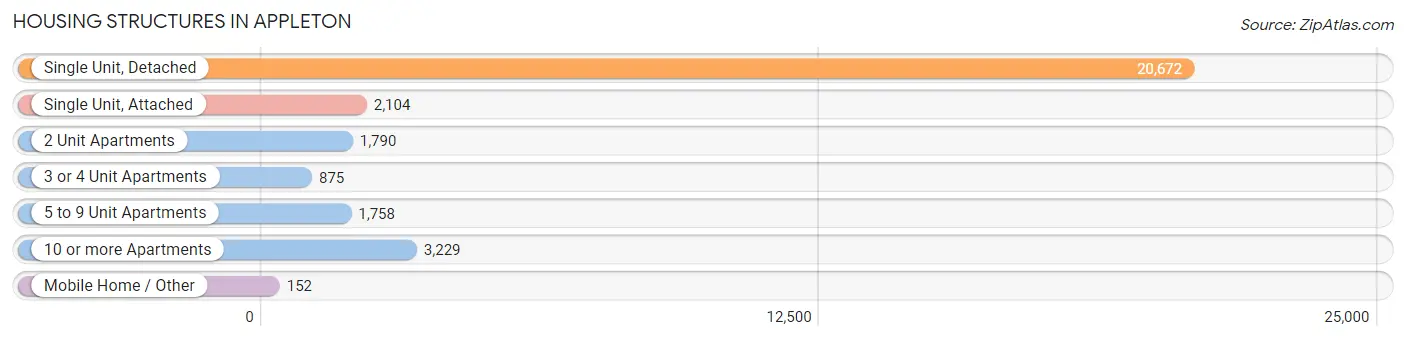
| Structure Type | # Housing Units | % Housing Units |
| Single Unit, Detached | 20,672 | 67.6% |
| Single Unit, Attached | 2,104 | 6.9% |
| 2 Unit Apartments | 1,790 | 5.9% |
| 3 or 4 Unit Apartments | 875 | 2.9% |
| 5 to 9 Unit Apartments | 1,758 | 5.8% |
| 10 or more Apartments | 3,229 | 10.6% |
| Mobile Home / Other | 152 | 0.5% |
| Total | 30,580 | 100.0% |
Housing Structures by Occupancy in Appleton
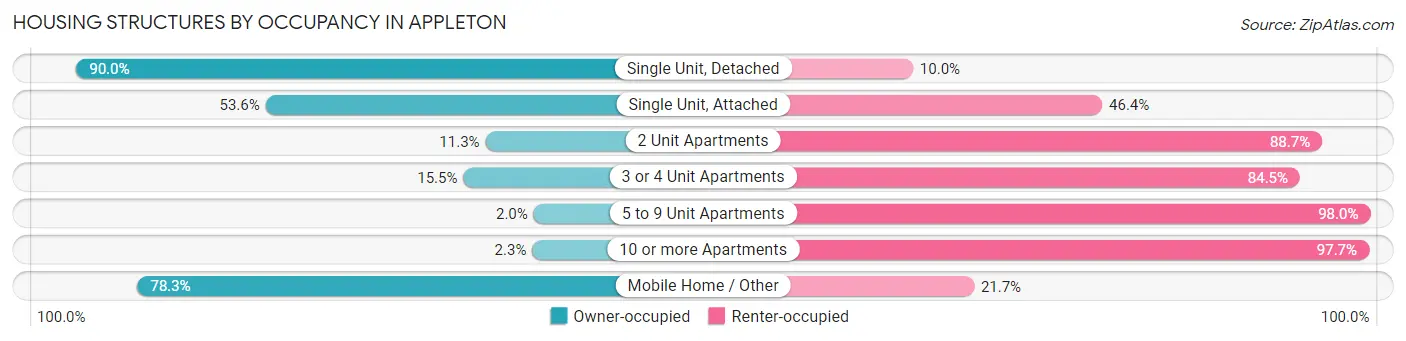
| Structure Type | Owner-occupied | Renter-occupied |
| Single Unit, Detached | 18,614 (90.0%) | 2,058 (10.0%) |
| Single Unit, Attached | 1,128 (53.6%) | 976 (46.4%) |
| 2 Unit Apartments | 202 (11.3%) | 1,588 (88.7%) |
| 3 or 4 Unit Apartments | 136 (15.5%) | 739 (84.5%) |
| 5 to 9 Unit Apartments | 35 (2.0%) | 1,723 (98.0%) |
| 10 or more Apartments | 73 (2.3%) | 3,156 (97.7%) |
| Mobile Home / Other | 119 (78.3%) | 33 (21.7%) |
| Total | 20,307 (66.4%) | 10,273 (33.6%) |
Housing Structures by Number of Rooms in Appleton
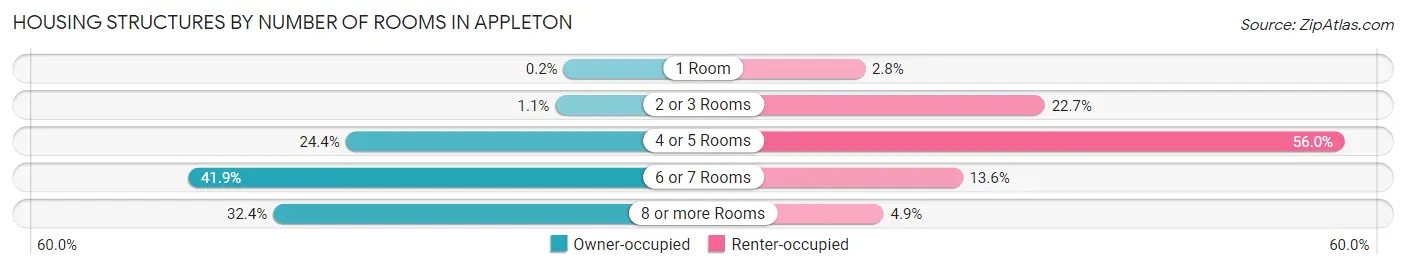
| Number of Rooms | Owner-occupied | Renter-occupied |
| 1 Room | 41 (0.2%) | 286 (2.8%) |
| 2 or 3 Rooms | 226 (1.1%) | 2,335 (22.7%) |
| 4 or 5 Rooms | 4,951 (24.4%) | 5,757 (56.0%) |
| 6 or 7 Rooms | 8,503 (41.9%) | 1,397 (13.6%) |
| 8 or more Rooms | 6,586 (32.4%) | 498 (4.9%) |
| Total | 20,307 (100.0%) | 10,273 (100.0%) |
Housing Structure by Heating Type in Appleton
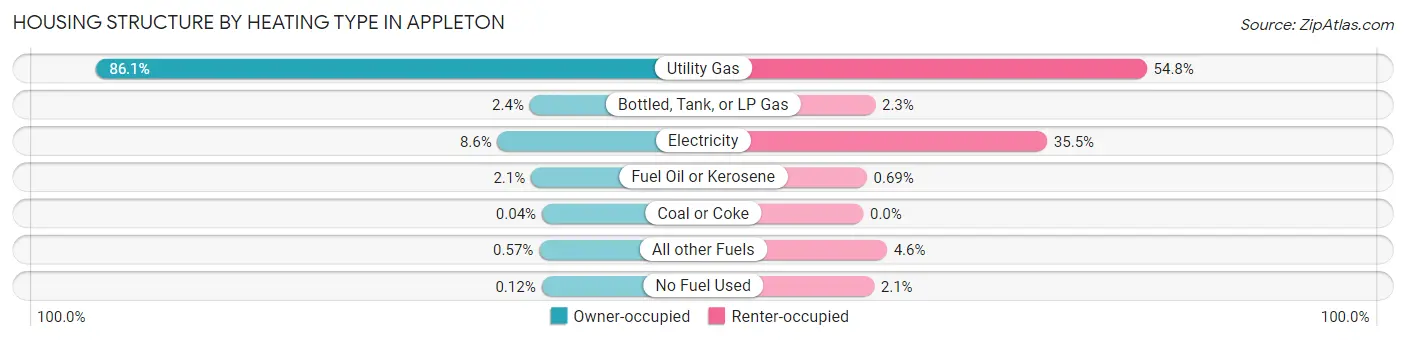
| Heating Type | Owner-occupied | Renter-occupied |
| Utility Gas | 17,490 (86.1%) | 5,630 (54.8%) |
| Bottled, Tank, or LP Gas | 486 (2.4%) | 238 (2.3%) |
| Electricity | 1,748 (8.6%) | 3,650 (35.5%) |
| Fuel Oil or Kerosene | 435 (2.1%) | 71 (0.7%) |
| Coal or Coke | 8 (0.0%) | 0 (0.0%) |
| All other Fuels | 116 (0.6%) | 470 (4.6%) |
| No Fuel Used | 24 (0.1%) | 214 (2.1%) |
| Total | 20,307 (100.0%) | 10,273 (100.0%) |
Household Vehicle Usage in Appleton
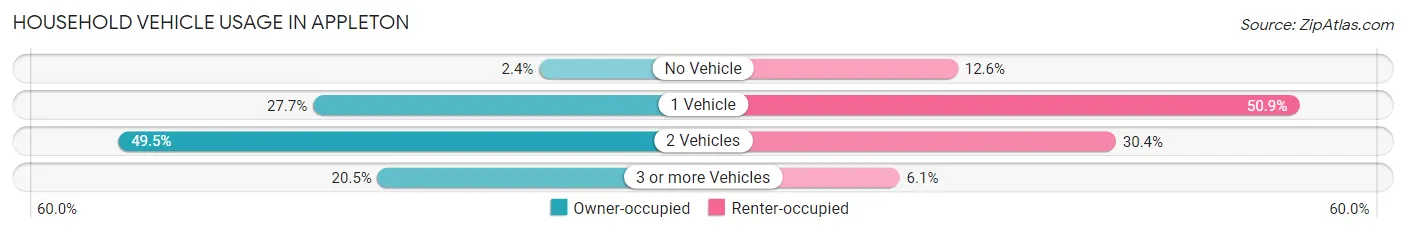
| Vehicles per Household | Owner-occupied | Renter-occupied |
| No Vehicle | 479 (2.4%) | 1,299 (12.6%) |
| 1 Vehicle | 5,623 (27.7%) | 5,226 (50.9%) |
| 2 Vehicles | 10,053 (49.5%) | 3,118 (30.3%) |
| 3 or more Vehicles | 4,152 (20.4%) | 630 (6.1%) |
| Total | 20,307 (100.0%) | 10,273 (100.0%) |
Real Estate & Mortgages in Appleton
Real Estate and Mortgage Overview in Appleton
| Characteristic | Without Mortgage | With Mortgage |
| Housing Units | 6,885 | 13,422 |
| Median Property Value | $194,400 | $190,800 |
| Median Household Income | $73,986 | $2,937 |
| Monthly Housing Costs | $624 | $549 |
| Real Estate Taxes | $3,487 | $83 |
Property Value by Mortgage Status in Appleton
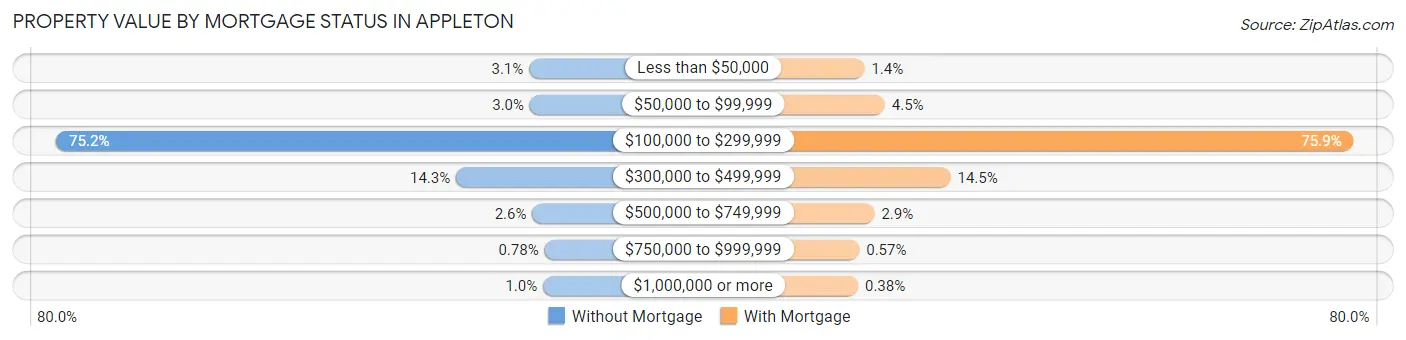
| Property Value | Without Mortgage | With Mortgage |
| Less than $50,000 | 215 (3.1%) | 182 (1.4%) |
| $50,000 to $99,999 | 207 (3.0%) | 598 (4.5%) |
| $100,000 to $299,999 | 5,177 (75.2%) | 10,183 (75.9%) |
| $300,000 to $499,999 | 981 (14.2%) | 1,944 (14.5%) |
| $500,000 to $749,999 | 182 (2.6%) | 387 (2.9%) |
| $750,000 to $999,999 | 54 (0.8%) | 77 (0.6%) |
| $1,000,000 or more | 69 (1.0%) | 51 (0.4%) |
| Total | 6,885 (100.0%) | 13,422 (100.0%) |
Household Income by Mortgage Status in Appleton
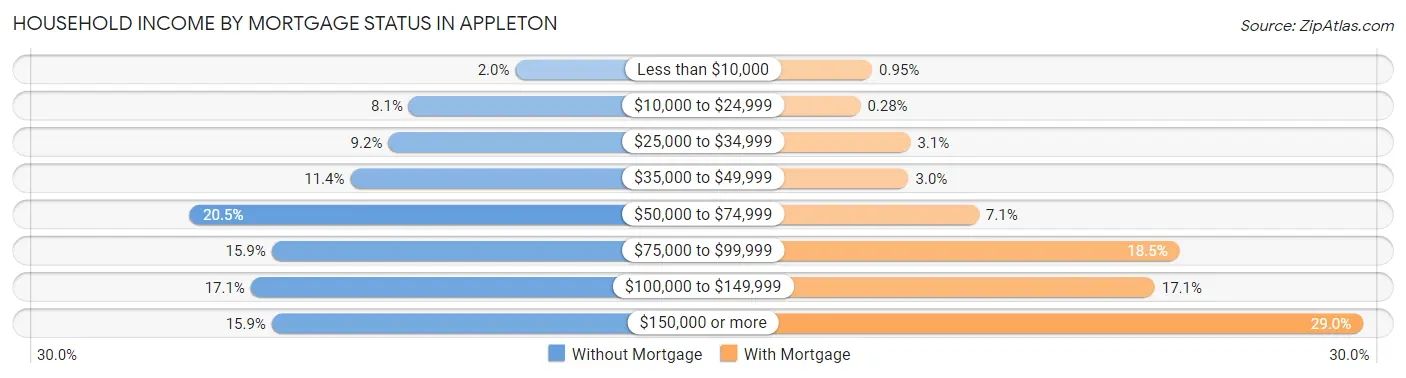
| Household Income | Without Mortgage | With Mortgage |
| Less than $10,000 | 135 (2.0%) | 128 (0.9%) |
| $10,000 to $24,999 | 554 (8.1%) | 38 (0.3%) |
| $25,000 to $34,999 | 635 (9.2%) | 421 (3.1%) |
| $35,000 to $49,999 | 784 (11.4%) | 407 (3.0%) |
| $50,000 to $74,999 | 1,414 (20.5%) | 946 (7.0%) |
| $75,000 to $99,999 | 1,094 (15.9%) | 2,485 (18.5%) |
| $100,000 to $149,999 | 1,176 (17.1%) | 2,295 (17.1%) |
| $150,000 or more | 1,093 (15.9%) | 3,893 (29.0%) |
| Total | 6,885 (100.0%) | 13,422 (100.0%) |
Property Value to Household Income Ratio in Appleton
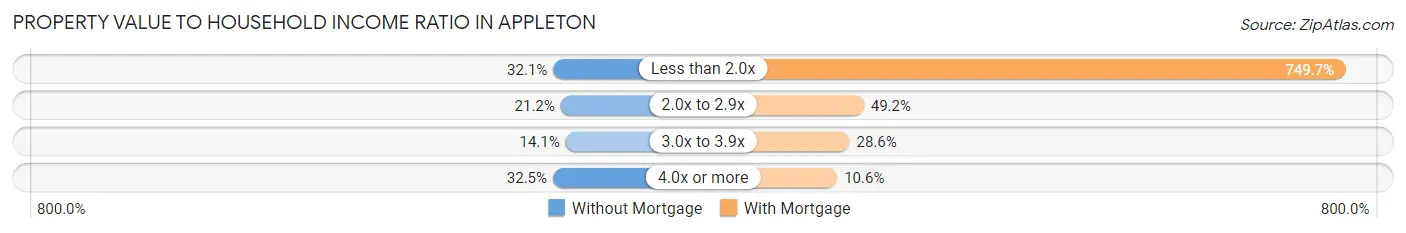
| Value-to-Income Ratio | Without Mortgage | With Mortgage |
| Less than 2.0x | 2,208 (32.1%) | 100,625 (749.7%) |
| 2.0x to 2.9x | 1,462 (21.2%) | 6,601 (49.2%) |
| 3.0x to 3.9x | 973 (14.1%) | 3,838 (28.6%) |
| 4.0x or more | 2,237 (32.5%) | 1,422 (10.6%) |
| Total | 6,885 (100.0%) | 13,422 (100.0%) |
Real Estate Taxes by Mortgage Status in Appleton
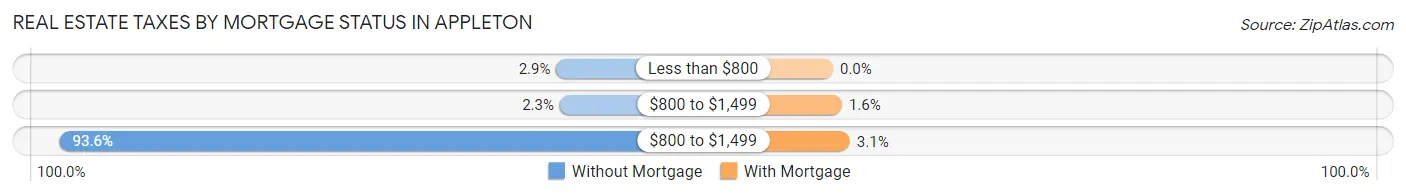
| Property Taxes | Without Mortgage | With Mortgage |
| Less than $800 | 198 (2.9%) | 0 (0.0%) |
| $800 to $1,499 | 155 (2.2%) | 219 (1.6%) |
| $800 to $1,499 | 6,444 (93.6%) | 414 (3.1%) |
| Total | 6,885 (100.0%) | 13,422 (100.0%) |
Health & Disability in Appleton
Health Insurance Coverage by Age in Appleton
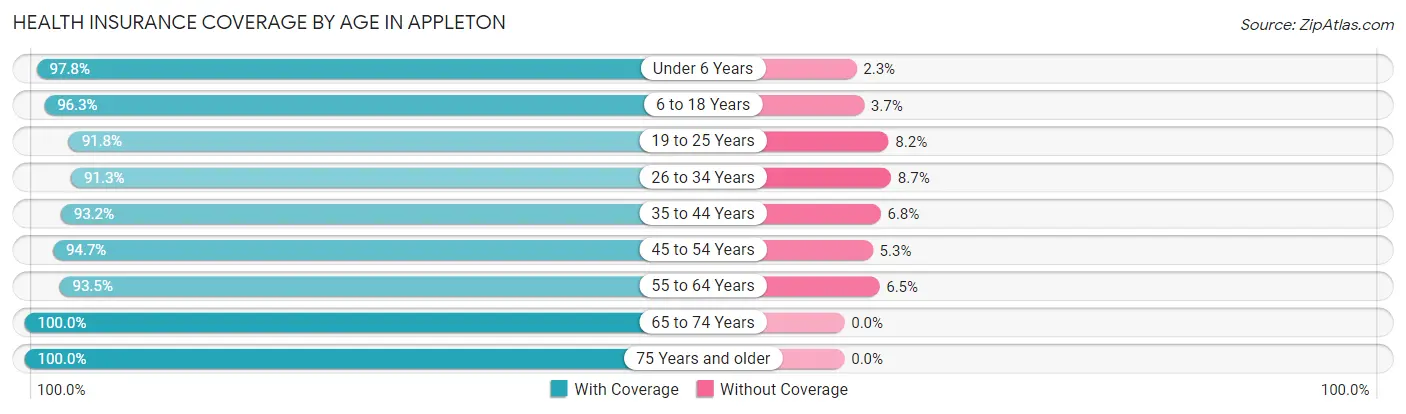
| Age Bracket | With Coverage | Without Coverage |
| Under 6 Years | 5,560 (97.8%) | 128 (2.2%) |
| 6 to 18 Years | 12,539 (96.3%) | 477 (3.7%) |
| 19 to 25 Years | 6,392 (91.8%) | 573 (8.2%) |
| 26 to 34 Years | 9,166 (91.3%) | 872 (8.7%) |
| 35 to 44 Years | 9,070 (93.2%) | 658 (6.8%) |
| 45 to 54 Years | 8,643 (94.7%) | 483 (5.3%) |
| 55 to 64 Years | 8,312 (93.5%) | 580 (6.5%) |
| 65 to 74 Years | 6,313 (100.0%) | 0 (0.0%) |
| 75 Years and older | 4,540 (100.0%) | 0 (0.0%) |
| Total | 70,535 (94.9%) | 3,771 (5.1%) |
Health Insurance Coverage by Citizenship Status in Appleton
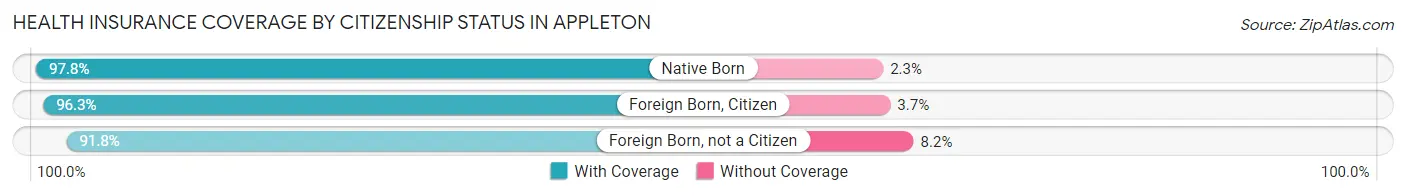
| Citizenship Status | With Coverage | Without Coverage |
| Native Born | 5,560 (97.8%) | 128 (2.2%) |
| Foreign Born, Citizen | 12,539 (96.3%) | 477 (3.7%) |
| Foreign Born, not a Citizen | 6,392 (91.8%) | 573 (8.2%) |
Health Insurance Coverage by Household Income in Appleton
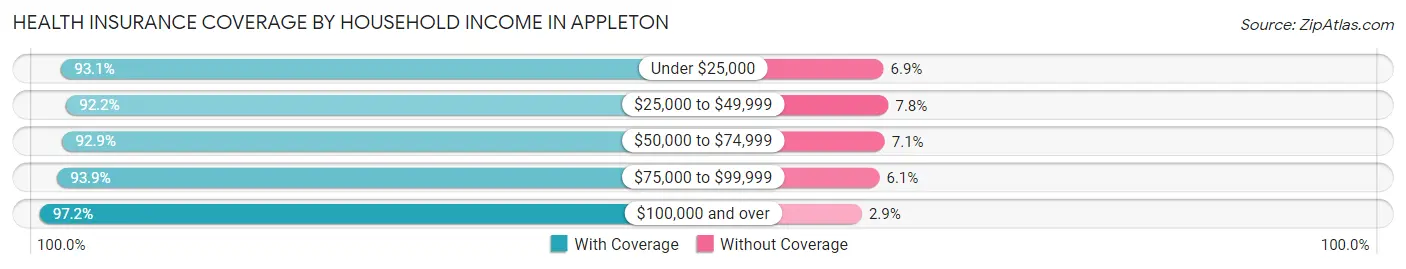
| Household Income | With Coverage | Without Coverage |
| Under $25,000 | 4,785 (93.1%) | 354 (6.9%) |
| $25,000 to $49,999 | 9,955 (92.2%) | 845 (7.8%) |
| $50,000 to $74,999 | 11,394 (92.9%) | 875 (7.1%) |
| $75,000 to $99,999 | 11,591 (93.9%) | 757 (6.1%) |
| $100,000 and over | 31,113 (97.2%) | 913 (2.9%) |
Public vs Private Health Insurance Coverage by Age in Appleton
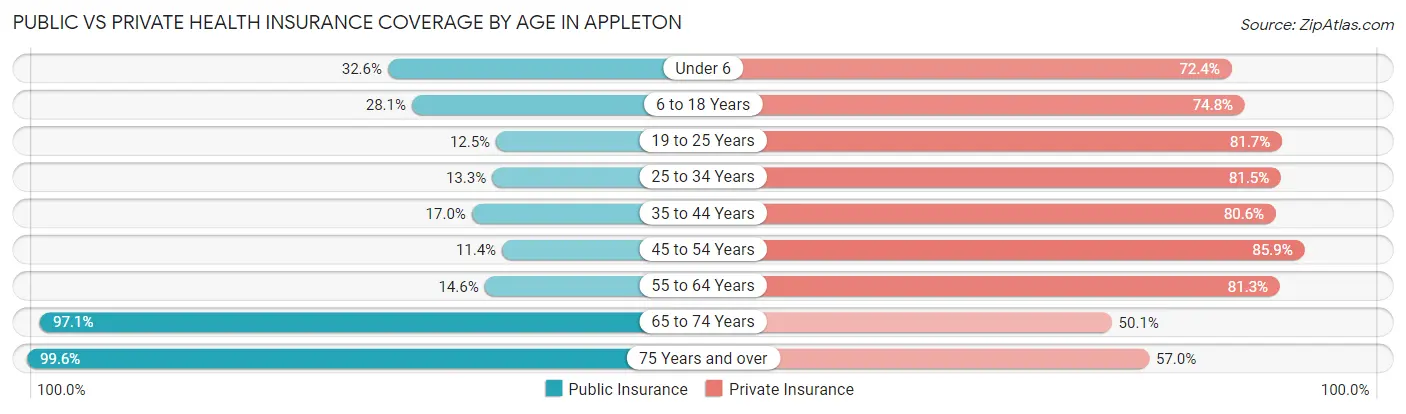
| Age Bracket | Public Insurance | Private Insurance |
| Under 6 | 1,854 (32.6%) | 4,116 (72.4%) |
| 6 to 18 Years | 3,661 (28.1%) | 9,738 (74.8%) |
| 19 to 25 Years | 871 (12.5%) | 5,692 (81.7%) |
| 25 to 34 Years | 1,330 (13.3%) | 8,185 (81.5%) |
| 35 to 44 Years | 1,656 (17.0%) | 7,839 (80.6%) |
| 45 to 54 Years | 1,040 (11.4%) | 7,838 (85.9%) |
| 55 to 64 Years | 1,302 (14.6%) | 7,230 (81.3%) |
| 65 to 74 Years | 6,132 (97.1%) | 3,162 (50.1%) |
| 75 Years and over | 4,520 (99.6%) | 2,589 (57.0%) |
| Total | 22,366 (30.1%) | 56,389 (75.9%) |
Disability Status by Sex by Age in Appleton
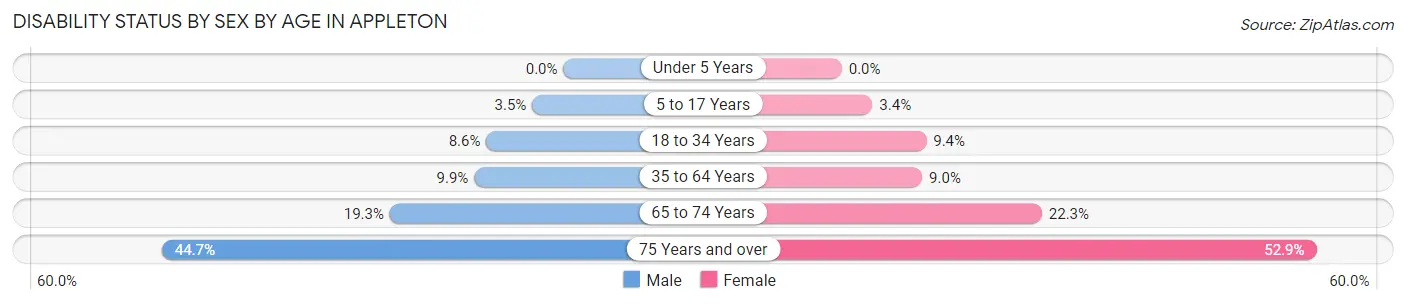
| Age Bracket | Male | Female |
| Under 5 Years | 0 (0.0%) | 0 (0.0%) |
| 5 to 17 Years | 233 (3.5%) | 204 (3.4%) |
| 18 to 34 Years | 779 (8.6%) | 861 (9.4%) |
| 35 to 64 Years | 1,394 (9.9%) | 1,227 (8.9%) |
| 65 to 74 Years | 574 (19.3%) | 745 (22.3%) |
| 75 Years and over | 821 (44.7%) | 1,429 (52.8%) |
Disability Class by Sex by Age in Appleton
Disability Class: Hearing Difficulty
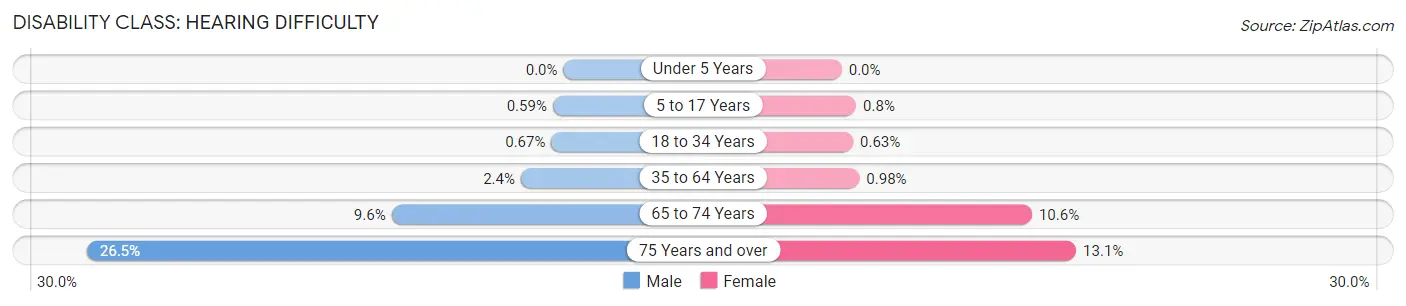
| Age Bracket | Male | Female |
| Under 5 Years | 0 (0.0%) | 0 (0.0%) |
| 5 to 17 Years | 40 (0.6%) | 48 (0.8%) |
| 18 to 34 Years | 61 (0.7%) | 58 (0.6%) |
| 35 to 64 Years | 332 (2.4%) | 134 (1.0%) |
| 65 to 74 Years | 284 (9.6%) | 354 (10.6%) |
| 75 Years and over | 487 (26.5%) | 353 (13.1%) |
Disability Class: Vision Difficulty
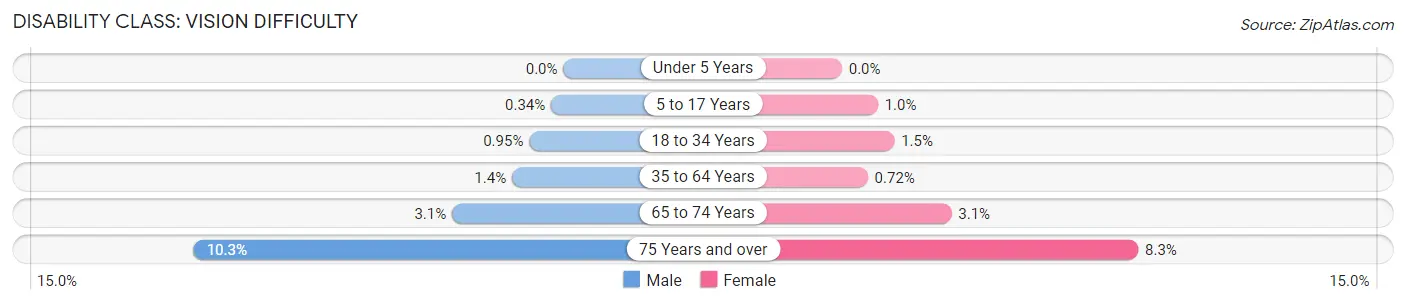
| Age Bracket | Male | Female |
| Under 5 Years | 0 (0.0%) | 0 (0.0%) |
| 5 to 17 Years | 23 (0.3%) | 60 (1.0%) |
| 18 to 34 Years | 86 (0.9%) | 134 (1.5%) |
| 35 to 64 Years | 201 (1.4%) | 99 (0.7%) |
| 65 to 74 Years | 92 (3.1%) | 102 (3.0%) |
| 75 Years and over | 189 (10.3%) | 223 (8.3%) |
Disability Class: Cognitive Difficulty
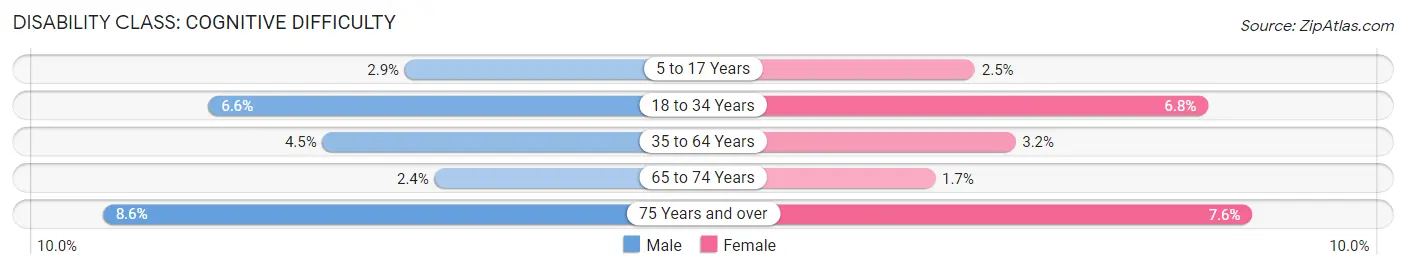
| Age Bracket | Male | Female |
| 5 to 17 Years | 198 (2.9%) | 148 (2.5%) |
| 18 to 34 Years | 599 (6.6%) | 622 (6.8%) |
| 35 to 64 Years | 627 (4.5%) | 441 (3.2%) |
| 65 to 74 Years | 71 (2.4%) | 58 (1.7%) |
| 75 Years and over | 157 (8.6%) | 206 (7.6%) |
Disability Class: Ambulatory Difficulty
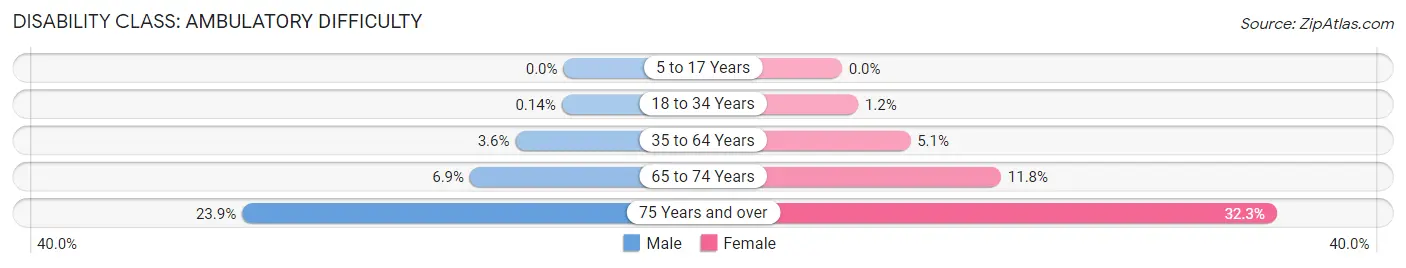
| Age Bracket | Male | Female |
| 5 to 17 Years | 0 (0.0%) | 0 (0.0%) |
| 18 to 34 Years | 13 (0.1%) | 110 (1.2%) |
| 35 to 64 Years | 501 (3.6%) | 697 (5.1%) |
| 65 to 74 Years | 206 (6.9%) | 395 (11.8%) |
| 75 Years and over | 438 (23.9%) | 873 (32.3%) |
Disability Class: Self-Care Difficulty
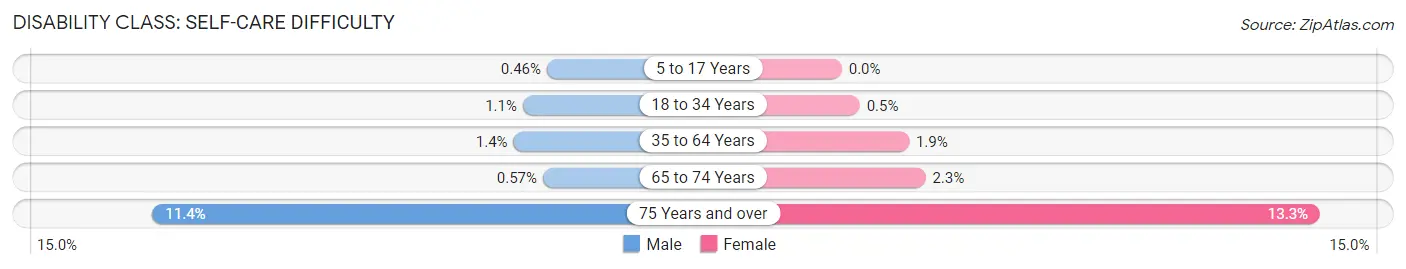
| Age Bracket | Male | Female |
| 5 to 17 Years | 31 (0.5%) | 0 (0.0%) |
| 18 to 34 Years | 103 (1.1%) | 46 (0.5%) |
| 35 to 64 Years | 195 (1.4%) | 256 (1.9%) |
| 65 to 74 Years | 17 (0.6%) | 78 (2.3%) |
| 75 Years and over | 210 (11.4%) | 360 (13.3%) |
Technology Access in Appleton
Computing Device Access in Appleton
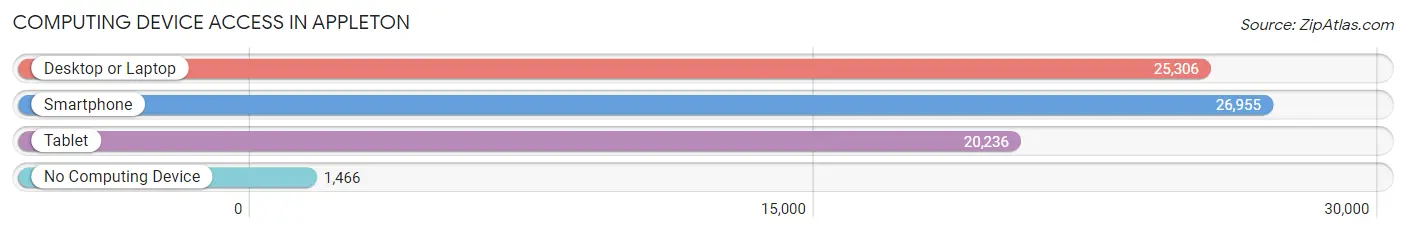
| Device Type | # Households | % Households |
| Desktop or Laptop | 25,306 | 82.8% |
| Smartphone | 26,955 | 88.1% |
| Tablet | 20,236 | 66.2% |
| No Computing Device | 1,466 | 4.8% |
| Total | 30,580 | 100.0% |
Internet Access in Appleton
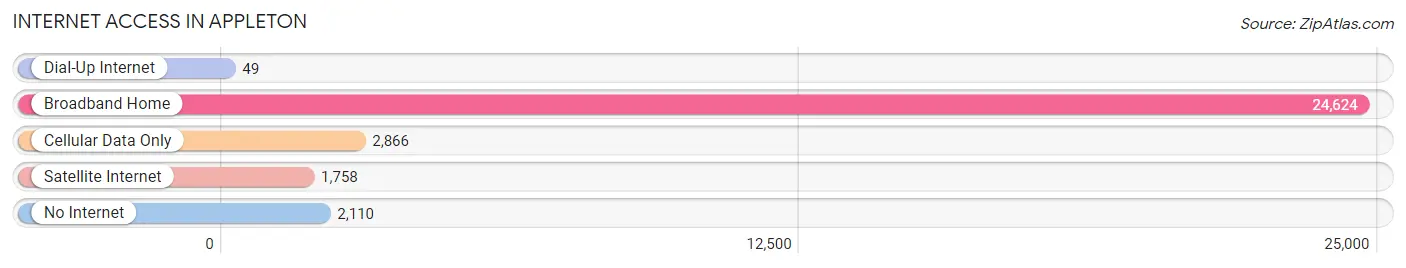
| Internet Type | # Households | % Households |
| Dial-Up Internet | 49 | 0.2% |
| Broadband Home | 24,624 | 80.5% |
| Cellular Data Only | 2,866 | 9.4% |
| Satellite Internet | 1,758 | 5.8% |
| No Internet | 2,110 | 6.9% |
| Total | 30,580 | 100.0% |
Appleton Summary
Appleton, Wisconsin is a city located in Outagamie County, Wisconsin, United States. It is situated on the Fox River, 30 miles southwest of Green Bay and 100 miles north of Milwaukee. As of the 2010 census, the population of Appleton was 72,623, making it the largest city in the county.
History
Appleton was founded in 1847 by Amos Storey, a New Englander who had moved to the area in 1844. Storey named the city after his hometown of Appleton, Maine. The city was incorporated in 1853 and was the first city in Outagamie County.
In the late 19th century, Appleton was a major center of the paper industry, with several paper mills located in the city. The city was also home to the first hydroelectric central station in the world, which was built in 1882.
In the early 20th century, Appleton was a major center of the automobile industry, with several car manufacturers located in the city. The city was also home to the first commercial radio station in the United States, which was established in 1922.
Geography
Appleton is located at 44°18'N 88°24'W (44.30, -88.40). According to the United States Census Bureau, the city has a total area of 24.2 square miles (62.7 km2), of which, 23.9 square miles (61.8 km2) is land and 0.3 square miles (0.8 km2) is water.
The Fox River runs through the city, and is a major source of recreation for the area. The city is also home to several parks, including Memorial Park, Telulah Park, and Pierce Park.
Economy
Appleton's economy is largely based on the paper industry, with several paper mills located in the city. The city is also home to several technology companies, including Appleton Papers, Inc., and Plexus Corporation.
The city is also home to several retail stores, including the Fox River Mall, which is the largest shopping mall in the Fox Valley region.
Demographics
As of the 2010 census, there were 72,623 people, 28,945 households, and 17,945 families residing in the city. The population density was 3,037.2 people per square mile (1,174.2/km2). There were 30,717 housing units at an average density of 1,285.2 per square mile (495.2/km2). The racial makeup of the city was 90.2% White, 2.7% African American, 0.7% Native American, 3.7% Asian, 0.7% from other races, and 2.1% from two or more races. Hispanic or Latino of any race were 2.7% of the population.
Appleton is home to a large number of immigrants, with the largest groups being from Mexico, India, and Laos. The city also has a large population of Hmong Americans.
The median income for a household in the city was $45,945, and the median income for a family was $56,945. The per capita income for the city was $24,945. About 5.2% of families and 8.2% of the population were below the poverty line, including 10.2% of those under age 18 and 6.2% of those age 65 or over.
Common Questions
What is Per Capita Income in Appleton?
Per Capita income in Appleton is $45,469.
What is the Median Family Income in Appleton?
Median Family Income in Appleton is $94,234.
What is the Median Household income in Appleton?
Median Household Income in Appleton is $75,469.
What is Income or Wage Gap in Appleton?
Income or Wage Gap in Appleton is 25.9%.
Women in Appleton earn 74.1 cents for every dollar earned by a man.
What is Family Income Deficit in Appleton?
Family Income Deficit in Appleton is $9,301.
Families that are below poverty line in Appleton earn $9,301 less on average than the poverty threshold level.
What is Inequality or Gini Index in Appleton?
Inequality or Gini Index in Appleton is 0.49.
What is the Total Population of Appleton?
Total Population of Appleton is 75,133.
What is the Total Male Population of Appleton?
Total Male Population of Appleton is 37,554.
What is the Total Female Population of Appleton?
Total Female Population of Appleton is 37,579.
What is the Ratio of Males per 100 Females in Appleton?
There are 99.93 Males per 100 Females in Appleton.
What is the Ratio of Females per 100 Males in Appleton?
There are 100.07 Females per 100 Males in Appleton.
What is the Median Population Age in Appleton?
Median Population Age in Appleton is 36.5 Years.
What is the Average Family Size in Appleton
Average Family Size in Appleton is 3.0 People.
What is the Average Household Size in Appleton
Average Household Size in Appleton is 2.4 People.
How Large is the Labor Force in Appleton?
There are 42,034 People in the Labor Forcein in Appleton.
What is the Percentage of People in the Labor Force in Appleton?
70.4% of People are in the Labor Force in Appleton.
What is the Unemployment Rate in Appleton?
Unemployment Rate in Appleton is 3.9%.