Woonsocket, RI Map & Demographics
Woonsocket Map
Woonsocket Overview
$29,142
PER CAPITA INCOME
$64,192
AVG FAMILY INCOME
$54,398
AVG HOUSEHOLD INCOME
27.8%
WAGE / INCOME GAP [ % ]
72.2¢/ $1
WAGE / INCOME GAP [ $ ]
$10,968
FAMILY INCOME DEFICIT
0.45
INEQUALITY / GINI INDEX
43,029
TOTAL POPULATION
21,062
MALE POPULATION
21,967
FEMALE POPULATION
95.88
MALES / 100 FEMALES
104.30
FEMALES / 100 MALES
35.3
MEDIAN AGE
3.2
AVG FAMILY SIZE
2.5
AVG HOUSEHOLD SIZE
21,383
LABOR FORCE [ PEOPLE ]
62.9%
PERCENT IN LABOR FORCE
8.9%
UNEMPLOYMENT RATE
Woonsocket Zip Codes
Woonsocket Area Codes
Income in Woonsocket
Income Overview in Woonsocket
Per Capita Income in Woonsocket is $29,142, while median incomes of families and households are $64,192 and $54,398 respectively.
| Characteristic | Number | Measure |
| Per Capita Income | 43,029 | $29,142 |
| Median Family Income | 9,909 | $64,192 |
| Mean Family Income | 9,909 | $82,565 |
| Median Household Income | 16,972 | $54,398 |
| Mean Household Income | 16,972 | $71,565 |
| Income Deficit | 9,909 | $10,968 |
| Wage / Income Gap (%) | 43,029 | 27.77% |
| Wage / Income Gap ($) | 43,029 | 72.23¢ per $1 |
| Gini / Inequality Index | 43,029 | 0.45 |
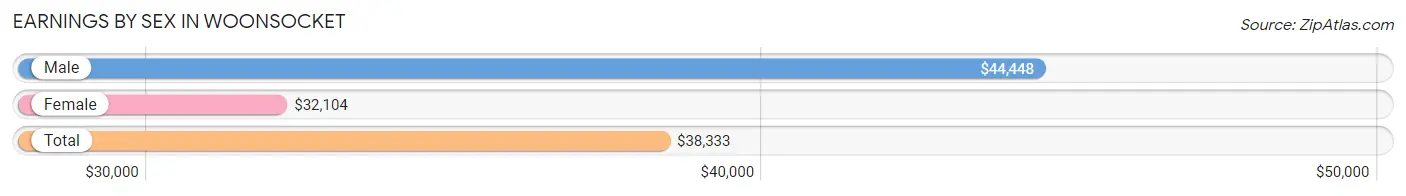
Earnings by Sex in Woonsocket
Average Earnings in Woonsocket are $38,333, $44,448 for men and $32,104 for women, a difference of 27.8%.
| Sex | Number | Average Earnings |
| Male | 10,911 (51.1%) | $44,448 |
| Female | 10,452 (48.9%) | $32,104 |
| Total | 21,363 (100.0%) | $38,333 |
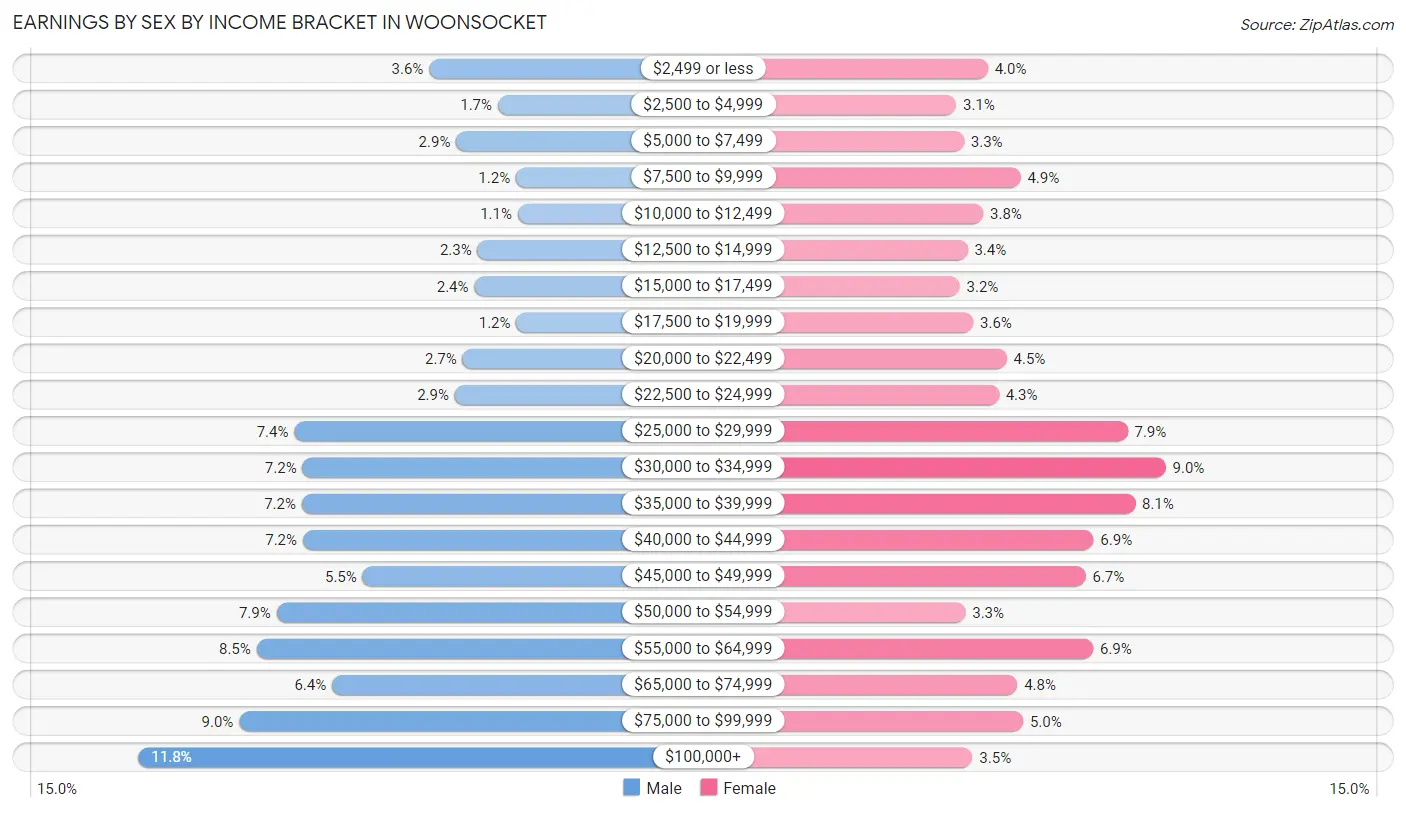
Earnings by Sex by Income Bracket in Woonsocket
The most common earnings brackets in Woonsocket are $100,000+ for men (1,288 | 11.8%) and $30,000 to $34,999 for women (937 | 9.0%).
| Income | Male | Female |
| $2,499 or less | 396 (3.6%) | 414 (4.0%) |
| $2,500 to $4,999 | 186 (1.7%) | 321 (3.1%) |
| $5,000 to $7,499 | 313 (2.9%) | 344 (3.3%) |
| $7,500 to $9,999 | 130 (1.2%) | 510 (4.9%) |
| $10,000 to $12,499 | 124 (1.1%) | 400 (3.8%) |
| $12,500 to $14,999 | 248 (2.3%) | 354 (3.4%) |
| $15,000 to $17,499 | 258 (2.4%) | 331 (3.2%) |
| $17,500 to $19,999 | 129 (1.2%) | 371 (3.5%) |
| $20,000 to $22,499 | 294 (2.7%) | 469 (4.5%) |
| $22,500 to $24,999 | 318 (2.9%) | 446 (4.3%) |
| $25,000 to $29,999 | 810 (7.4%) | 825 (7.9%) |
| $30,000 to $34,999 | 785 (7.2%) | 937 (9.0%) |
| $35,000 to $39,999 | 787 (7.2%) | 847 (8.1%) |
| $40,000 to $44,999 | 783 (7.2%) | 724 (6.9%) |
| $45,000 to $49,999 | 600 (5.5%) | 701 (6.7%) |
| $50,000 to $54,999 | 864 (7.9%) | 348 (3.3%) |
| $55,000 to $64,999 | 925 (8.5%) | 723 (6.9%) |
| $65,000 to $74,999 | 694 (6.4%) | 501 (4.8%) |
| $75,000 to $99,999 | 979 (9.0%) | 517 (5.0%) |
| $100,000+ | 1,288 (11.8%) | 369 (3.5%) |
| Total | 10,911 (100.0%) | 10,452 (100.0%) |
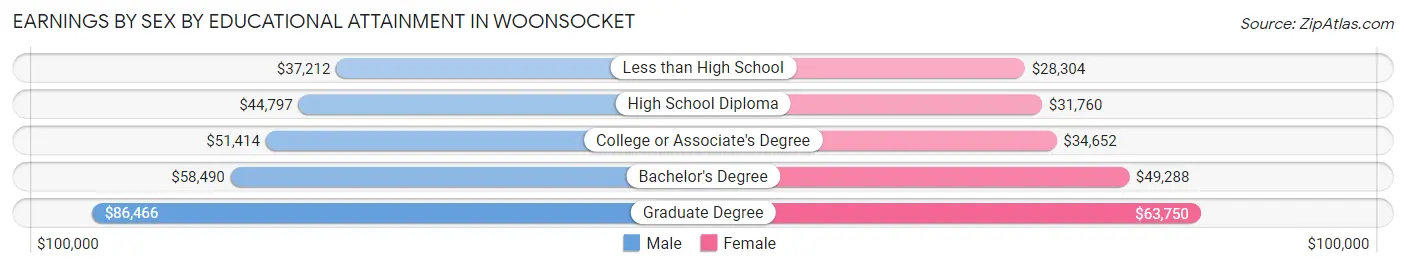
Earnings by Sex by Educational Attainment in Woonsocket
Average earnings in Woonsocket are $47,652 for men and $35,493 for women, a difference of 25.5%. Men with an educational attainment of graduate degree enjoy the highest average annual earnings of $86,466, while those with less than high school education earn the least with $37,212. Women with an educational attainment of graduate degree earn the most with the average annual earnings of $63,750, while those with less than high school education have the smallest earnings of $28,304.
| Educational Attainment | Male Income | Female Income |
| Less than High School | $37,212 | $28,304 |
| High School Diploma | $44,797 | $31,760 |
| College or Associate's Degree | $51,414 | $34,652 |
| Bachelor's Degree | $58,490 | $49,288 |
| Graduate Degree | $86,466 | $63,750 |
| Total | $47,652 | $35,493 |
Family Income in Woonsocket
Family Income Brackets in Woonsocket
According to the Woonsocket family income data, there are 2,012 families falling into the $50,000 to $74,999 income range, which is the most common income bracket and makes up 20.3% of all families. Conversely, the $10,000 to $14,999 income bracket is the least frequent group with only 188 families (1.9%) belonging to this category.
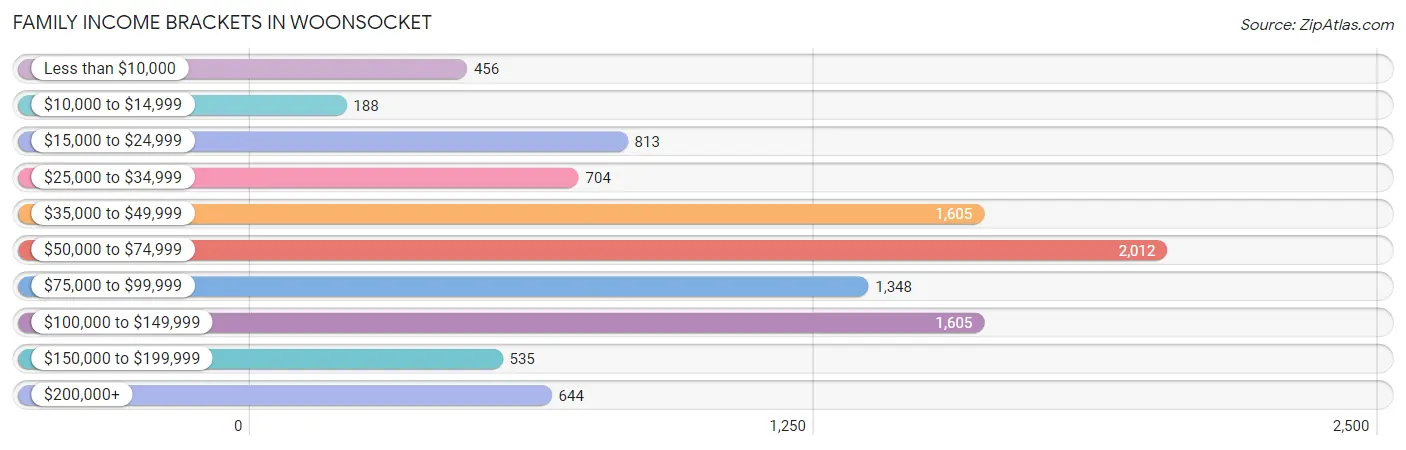
| Income Bracket | # Families | % Families |
| Less than $10,000 | 456 | 4.6% |
| $10,000 to $14,999 | 188 | 1.9% |
| $15,000 to $24,999 | 813 | 8.2% |
| $25,000 to $34,999 | 704 | 7.1% |
| $35,000 to $49,999 | 1,605 | 16.2% |
| $50,000 to $74,999 | 2,012 | 20.3% |
| $75,000 to $99,999 | 1,348 | 13.6% |
| $100,000 to $149,999 | 1,605 | 16.2% |
| $150,000 to $199,999 | 535 | 5.4% |
| $200,000+ | 644 | 6.5% |
Family Income by Famaliy Size in Woonsocket
5-person families (981 | 9.9%) account for the highest median family income in Woonsocket with $80,362 per family, while 2-person families (4,474 | 45.2%) have the highest median income of $30,052 per family member.
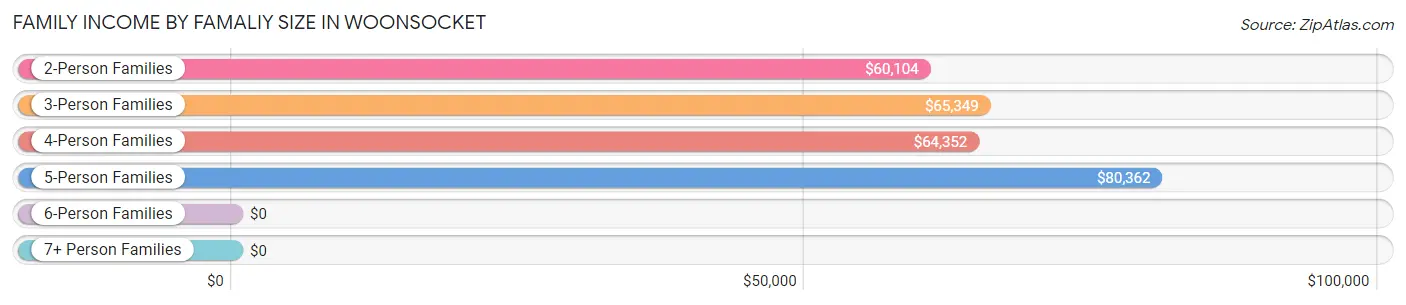
| Income Bracket | # Families | Median Income |
| 2-Person Families | 4,474 (45.2%) | $60,104 |
| 3-Person Families | 2,298 (23.2%) | $65,349 |
| 4-Person Families | 1,658 (16.7%) | $64,352 |
| 5-Person Families | 981 (9.9%) | $80,362 |
| 6-Person Families | 337 (3.4%) | $0 |
| 7+ Person Families | 161 (1.6%) | $0 |
| Total | 9,909 (100.0%) | $64,192 |
Family Income by Number of Earners in Woonsocket
The median family income in Woonsocket is $64,192, with families comprising 3+ earners (1,105) having the highest median family income of $134,150, while families with no earners (1,276) have the lowest median family income of $26,793, accounting for 11.2% and 12.9% of families, respectively.
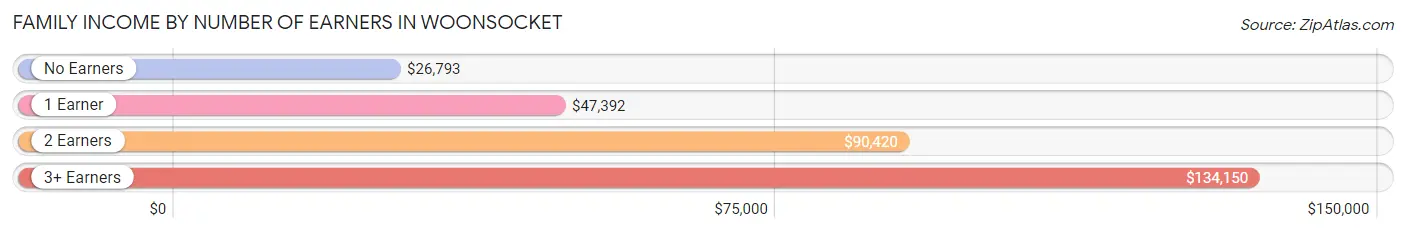
| Number of Earners | # Families | Median Income |
| No Earners | 1,276 (12.9%) | $26,793 |
| 1 Earner | 4,175 (42.1%) | $47,392 |
| 2 Earners | 3,353 (33.8%) | $90,420 |
| 3+ Earners | 1,105 (11.2%) | $134,150 |
| Total | 9,909 (100.0%) | $64,192 |
Household Income in Woonsocket
Household Income Brackets in Woonsocket
With 3,089 households falling in the category, the $50,000 to $74,999 income range is the most frequent in Woonsocket, accounting for 18.2% of all households. In contrast, only 662 households (3.9%) fall into the $150,000 to $199,999 income bracket, making it the least populous group.
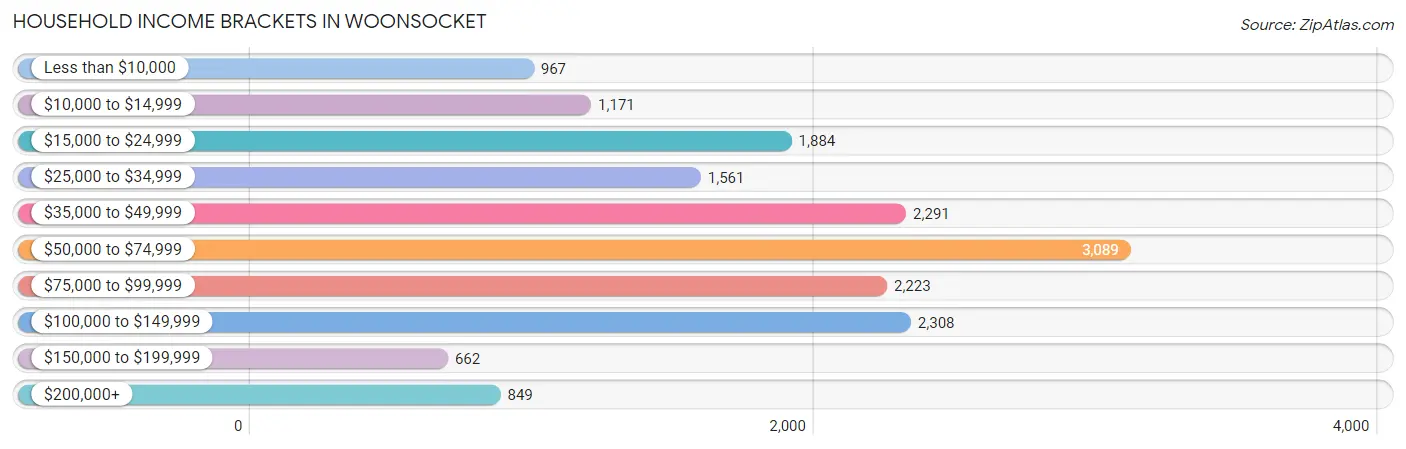
| Income Bracket | # Households | % Households |
| Less than $10,000 | 967 | 5.7% |
| $10,000 to $14,999 | 1,171 | 6.9% |
| $15,000 to $24,999 | 1,884 | 11.1% |
| $25,000 to $34,999 | 1,561 | 9.2% |
| $35,000 to $49,999 | 2,291 | 13.5% |
| $50,000 to $74,999 | 3,089 | 18.2% |
| $75,000 to $99,999 | 2,223 | 13.1% |
| $100,000 to $149,999 | 2,308 | 13.6% |
| $150,000 to $199,999 | 662 | 3.9% |
| $200,000+ | 849 | 5.0% |
Household Income by Householder Age in Woonsocket
The median household income in Woonsocket is $54,398, with the highest median household income of $62,328 found in the 45 to 64 years age bracket for the primary householder. A total of 6,278 households (37.0%) fall into this category. Meanwhile, the 65+ years age bracket for the primary householder has the lowest median household income of $33,610, with 3,745 households (22.1%) in this group.
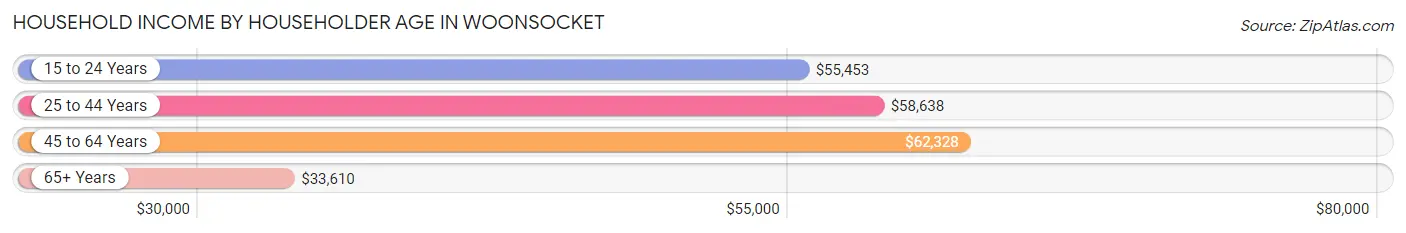
| Income Bracket | # Households | Median Income |
| 15 to 24 Years | 423 (2.5%) | $55,453 |
| 25 to 44 Years | 6,526 (38.5%) | $58,638 |
| 45 to 64 Years | 6,278 (37.0%) | $62,328 |
| 65+ Years | 3,745 (22.1%) | $33,610 |
| Total | 16,972 (100.0%) | $54,398 |
Poverty in Woonsocket
Income Below Poverty by Sex and Age in Woonsocket
With 17.3% poverty level for males and 21.0% for females among the residents of Woonsocket, 5 year old males and 6 to 11 year old females are the most vulnerable to poverty, with 130 males (49.8%) and 703 females (45.8%) in their respective age groups living below the poverty level.
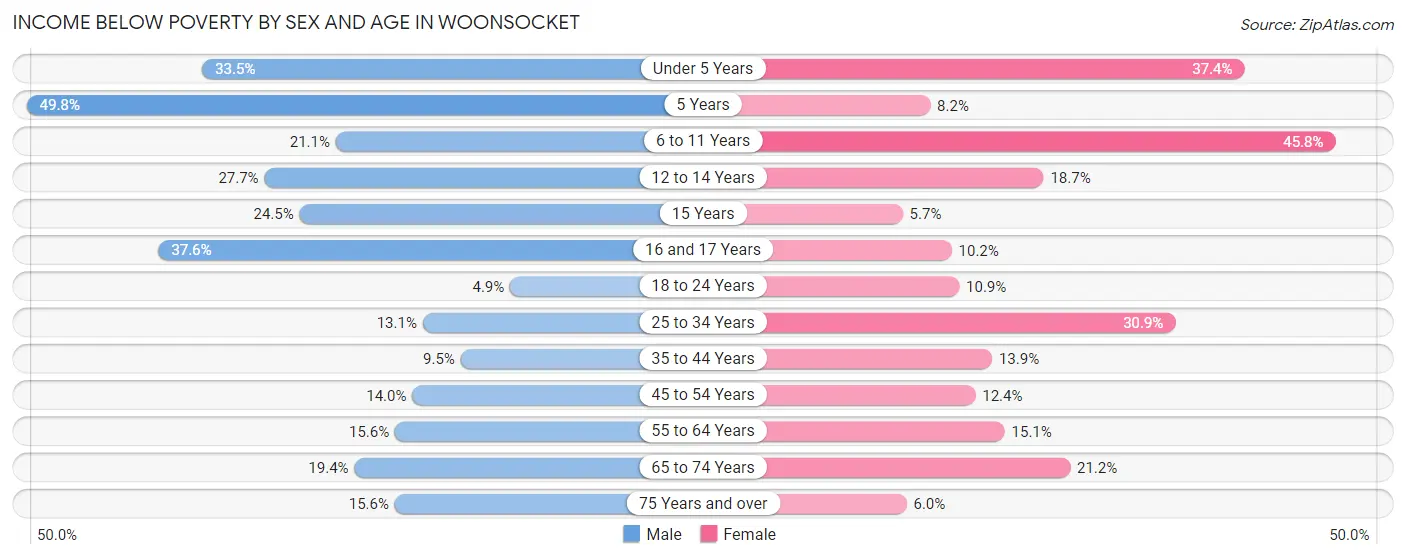
| Age Bracket | Male | Female |
| Under 5 Years | 575 (33.5%) | 662 (37.4%) |
| 5 Years | 130 (49.8%) | 10 (8.2%) |
| 6 to 11 Years | 347 (21.1%) | 703 (45.8%) |
| 12 to 14 Years | 225 (27.7%) | 91 (18.7%) |
| 15 Years | 71 (24.5%) | 13 (5.7%) |
| 16 and 17 Years | 183 (37.6%) | 55 (10.2%) |
| 18 to 24 Years | 69 (4.9%) | 182 (10.9%) |
| 25 to 34 Years | 547 (13.1%) | 1,203 (30.9%) |
| 35 to 44 Years | 226 (9.5%) | 367 (13.9%) |
| 45 to 54 Years | 352 (14.0%) | 320 (12.4%) |
| 55 to 64 Years | 382 (15.6%) | 438 (15.1%) |
| 65 to 74 Years | 335 (19.4%) | 395 (21.2%) |
| 75 Years and over | 144 (15.6%) | 79 (6.0%) |
| Total | 3,586 (17.3%) | 4,518 (21.0%) |
Income Above Poverty by Sex and Age in Woonsocket
According to the poverty statistics in Woonsocket, males aged 18 to 24 years and females aged 15 years are the age groups that are most secure financially, with 95.1% of males and 94.4% of females in these age groups living above the poverty line.
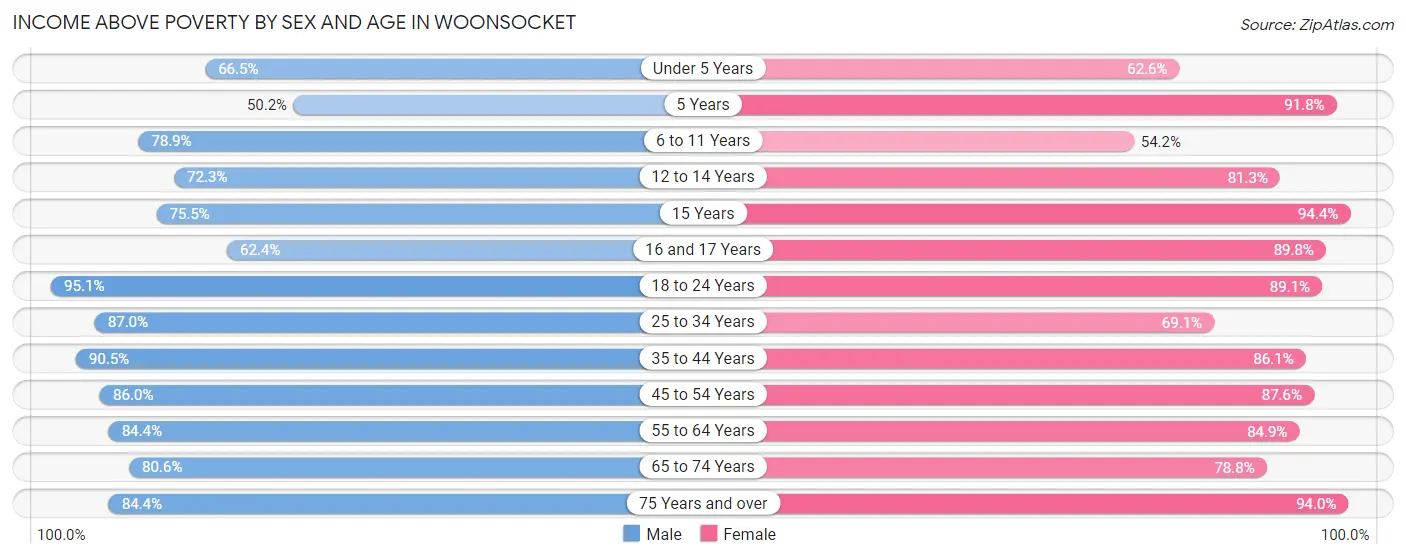
| Age Bracket | Male | Female |
| Under 5 Years | 1,140 (66.5%) | 1,110 (62.6%) |
| 5 Years | 131 (50.2%) | 112 (91.8%) |
| 6 to 11 Years | 1,296 (78.9%) | 832 (54.2%) |
| 12 to 14 Years | 586 (72.3%) | 395 (81.3%) |
| 15 Years | 219 (75.5%) | 217 (94.4%) |
| 16 and 17 Years | 304 (62.4%) | 485 (89.8%) |
| 18 to 24 Years | 1,328 (95.1%) | 1,489 (89.1%) |
| 25 to 34 Years | 3,643 (87.0%) | 2,685 (69.1%) |
| 35 to 44 Years | 2,146 (90.5%) | 2,266 (86.1%) |
| 45 to 54 Years | 2,158 (86.0%) | 2,263 (87.6%) |
| 55 to 64 Years | 2,064 (84.4%) | 2,460 (84.9%) |
| 65 to 74 Years | 1,393 (80.6%) | 1,470 (78.8%) |
| 75 Years and over | 777 (84.4%) | 1,236 (94.0%) |
| Total | 17,185 (82.7%) | 17,020 (79.0%) |
Income Below Poverty Among Married-Couple Families in Woonsocket
The poverty statistics for married-couple families in Woonsocket show that 4.7% or 261 of the total 5,589 families live below the poverty line. Families with 3 or 4 children have the highest poverty rate of 27.1%, comprising of 119 families. On the other hand, families with 1 or 2 children have the lowest poverty rate of 1.0%, which includes 17 families.
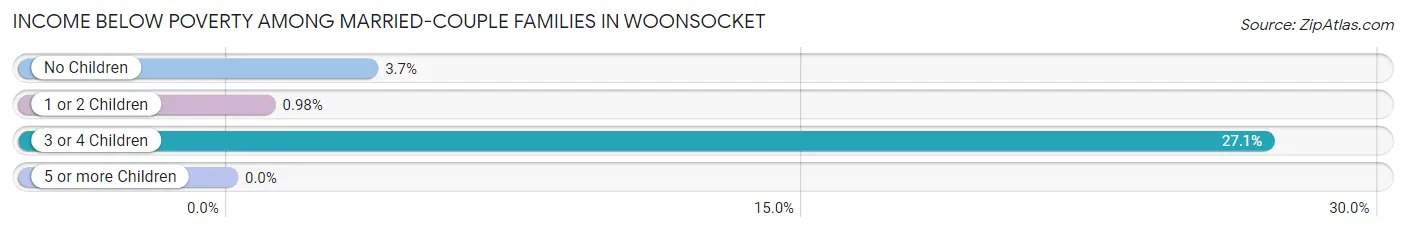
| Children | Above Poverty | Below Poverty |
| No Children | 3,294 (96.3%) | 125 (3.7%) |
| 1 or 2 Children | 1,713 (99.0%) | 17 (1.0%) |
| 3 or 4 Children | 321 (73.0%) | 119 (27.1%) |
| 5 or more Children | 0 (0.0%) | 0 (0.0%) |
| Total | 5,328 (95.3%) | 261 (4.7%) |
Income Below Poverty Among Single-Parent Households in Woonsocket
According to the poverty data in Woonsocket, 12.1% or 119 single-father households and 29.5% or 984 single-mother households are living below the poverty line. Among single-father households, those with 3 or 4 children have the highest poverty rate, with 63 households (92.6%) experiencing poverty. Likewise, among single-mother households, those with 3 or 4 children have the highest poverty rate, with 368 households (56.0%) falling below the poverty line.
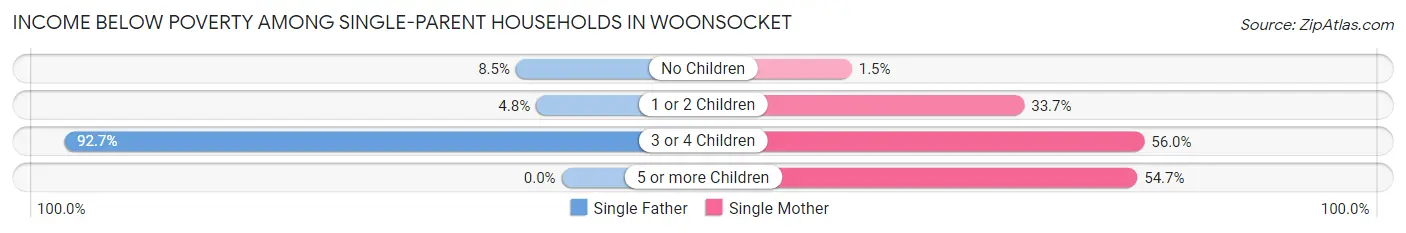
| Children | Single Father | Single Mother |
| No Children | 28 (8.5%) | 14 (1.5%) |
| 1 or 2 Children | 28 (4.8%) | 567 (33.7%) |
| 3 or 4 Children | 63 (92.6%) | 368 (56.0%) |
| 5 or more Children | 0 (0.0%) | 35 (54.7%) |
| Total | 119 (12.1%) | 984 (29.5%) |
Income Below Poverty Among Married-Couple vs Single-Parent Households in Woonsocket
The poverty data for Woonsocket shows that 261 of the married-couple family households (4.7%) and 1,103 of the single-parent households (25.5%) are living below the poverty level. Within the married-couple family households, those with 3 or 4 children have the highest poverty rate, with 119 households (27.1%) falling below the poverty line. Among the single-parent households, those with 3 or 4 children have the highest poverty rate, with 431 household (59.5%) living below poverty.
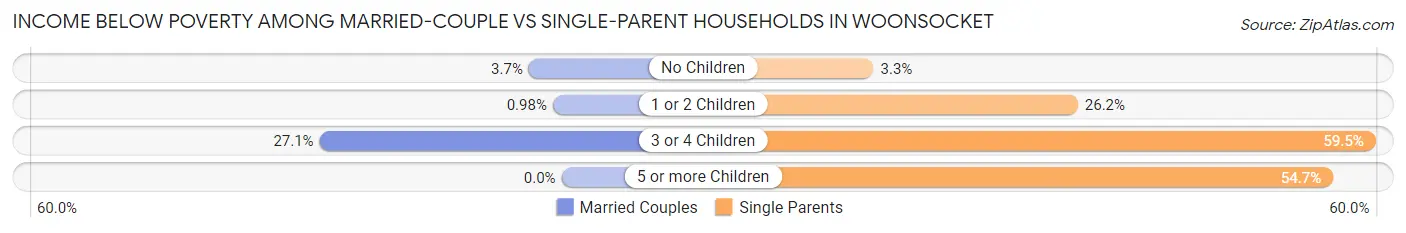
| Children | Married-Couple Families | Single-Parent Households |
| No Children | 125 (3.7%) | 42 (3.3%) |
| 1 or 2 Children | 17 (1.0%) | 595 (26.2%) |
| 3 or 4 Children | 119 (27.1%) | 431 (59.5%) |
| 5 or more Children | 0 (0.0%) | 35 (54.7%) |
| Total | 261 (4.7%) | 1,103 (25.5%) |
Race in Woonsocket
The most populous races in Woonsocket are White / Caucasian (26,675 | 62.0%), Hispanic or Latino (10,367 | 24.1%), and Two or more Races (6,637 | 15.4%).
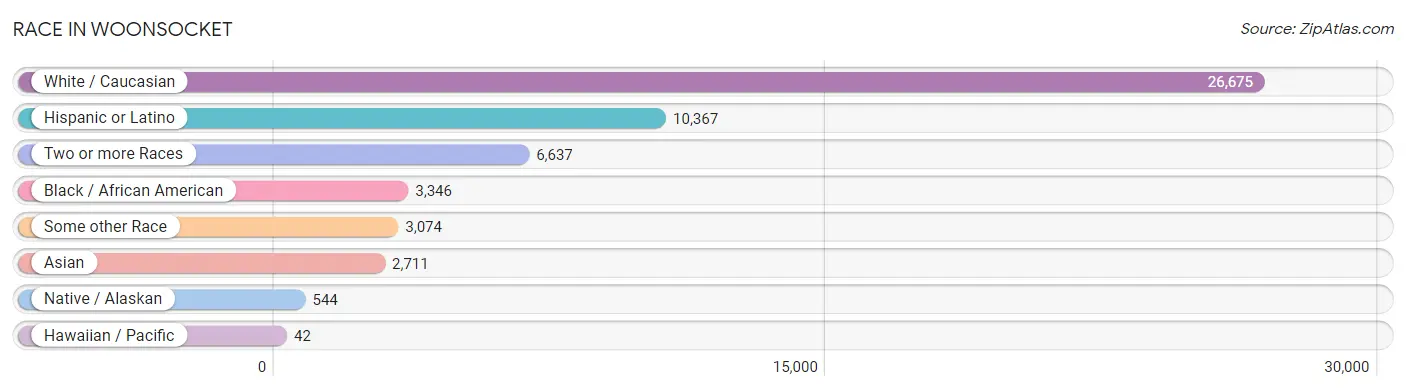
| Race | # Population | % Population |
| Asian | 2,711 | 6.3% |
| Black / African American | 3,346 | 7.8% |
| Hawaiian / Pacific | 42 | 0.1% |
| Hispanic or Latino | 10,367 | 24.1% |
| Native / Alaskan | 544 | 1.3% |
| White / Caucasian | 26,675 | 62.0% |
| Two or more Races | 6,637 | 15.4% |
| Some other Race | 3,074 | 7.1% |
| Total | 43,029 | 100.0% |
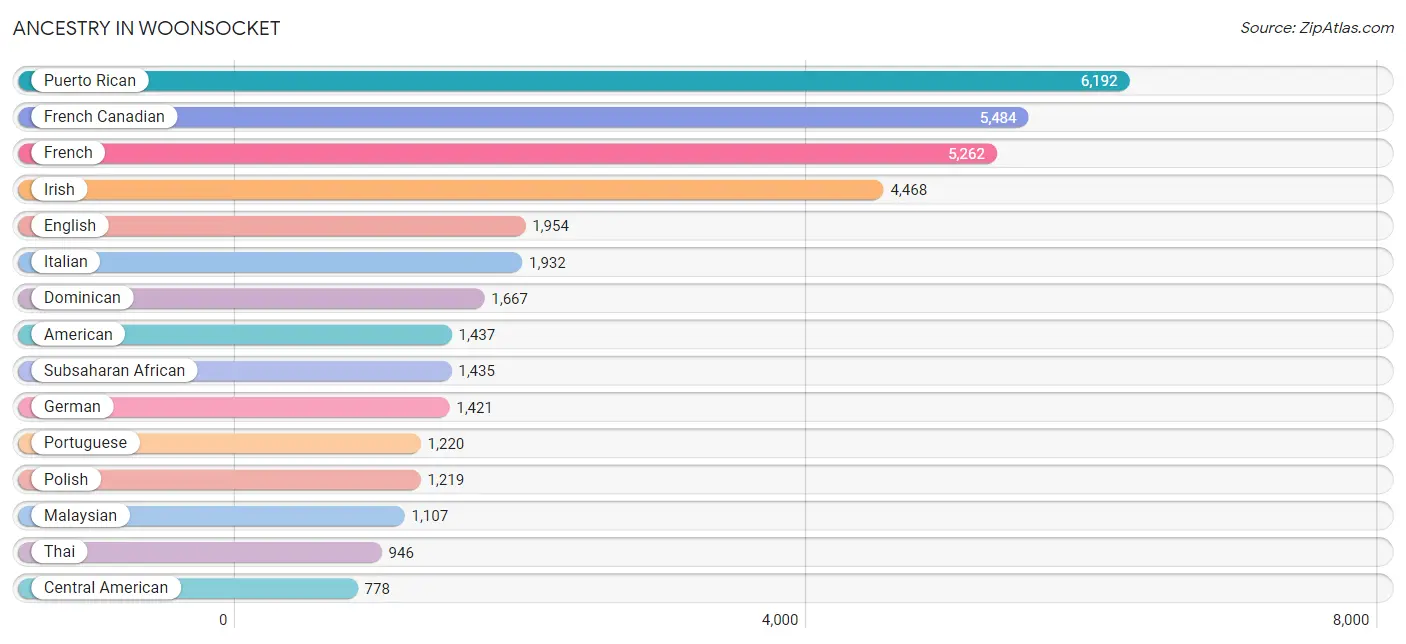
Ancestry in Woonsocket
The most populous ancestries reported in Woonsocket are Puerto Rican (6,192 | 14.4%), French Canadian (5,484 | 12.7%), French (5,262 | 12.2%), Irish (4,468 | 10.4%), and English (1,954 | 4.5%), together accounting for 54.3% of all Woonsocket residents.
| Ancestry | # Population | % Population |
| African | 533 | 1.2% |
| Albanian | 159 | 0.4% |
| Alsatian | 9 | 0.0% |
| American | 1,437 | 3.3% |
| Arab | 416 | 1.0% |
| Armenian | 56 | 0.1% |
| Austrian | 2 | 0.0% |
| Basque | 7 | 0.0% |
| Belgian | 18 | 0.0% |
| Bhutanese | 54 | 0.1% |
| Blackfeet | 58 | 0.1% |
| Bolivian | 123 | 0.3% |
| Brazilian | 404 | 0.9% |
| British | 27 | 0.1% |
| British West Indian | 42 | 0.1% |
| Burmese | 35 | 0.1% |
| Cajun | 8 | 0.0% |
| Canadian | 237 | 0.5% |
| Cape Verdean | 545 | 1.3% |
| Central American | 778 | 1.8% |
| Central American Indian | 442 | 1.0% |
| Cherokee | 92 | 0.2% |
| Colombian | 345 | 0.8% |
| Costa Rican | 49 | 0.1% |
| Cree | 14 | 0.0% |
| Cuban | 20 | 0.1% |
| Czech | 29 | 0.1% |
| Danish | 12 | 0.0% |
| Dominican | 1,667 | 3.9% |
| Dutch | 60 | 0.1% |
| Eastern European | 13 | 0.0% |
| English | 1,954 | 4.5% |
| European | 122 | 0.3% |
| French | 5,262 | 12.2% |
| French Canadian | 5,484 | 12.7% |
| German | 1,421 | 3.3% |
| Greek | 4 | 0.0% |
| Guatemalan | 279 | 0.6% |
| Haitian | 28 | 0.1% |
| Honduran | 177 | 0.4% |
| Icelander | 37 | 0.1% |
| Indian (Asian) | 99 | 0.2% |
| Irish | 4,468 | 10.4% |
| Iroquois | 74 | 0.2% |
| Italian | 1,932 | 4.5% |
| Japanese | 500 | 1.2% |
| Korean | 180 | 0.4% |
| Lebanese | 119 | 0.3% |
| Liberian | 80 | 0.2% |
| Lithuanian | 45 | 0.1% |
| Malaysian | 1,107 | 2.6% |
| Mexican | 466 | 1.1% |
| Moroccan | 55 | 0.1% |
| Native Hawaiian | 42 | 0.1% |
| Nicaraguan | 41 | 0.1% |
| Nigerian | 28 | 0.1% |
| Northern European | 16 | 0.0% |
| Norwegian | 37 | 0.1% |
| Pakistani | 4 | 0.0% |
| Panamanian | 23 | 0.1% |
| Polish | 1,219 | 2.8% |
| Portuguese | 1,220 | 2.8% |
| Puerto Rican | 6,192 | 14.4% |
| Romanian | 184 | 0.4% |
| Russian | 115 | 0.3% |
| Salvadoran | 209 | 0.5% |
| Scandinavian | 42 | 0.1% |
| Scotch-Irish | 97 | 0.2% |
| Scottish | 496 | 1.1% |
| Senegalese | 135 | 0.3% |
| Sierra Leonean | 19 | 0.0% |
| South African | 83 | 0.2% |
| South American | 696 | 1.6% |
| Spaniard | 25 | 0.1% |
| Spanish | 160 | 0.4% |
| Sri Lankan | 71 | 0.2% |
| Subsaharan African | 1,435 | 3.3% |
| Swedish | 357 | 0.8% |
| Syrian | 153 | 0.4% |
| Thai | 946 | 2.2% |
| Ukrainian | 138 | 0.3% |
| Uruguayan | 2 | 0.0% |
| Venezuelan | 226 | 0.5% |
| Vietnamese | 14 | 0.0% |
| Welsh | 26 | 0.1% |
| West Indian | 2 | 0.0% | View All 86 Rows |
Immigrants in Woonsocket
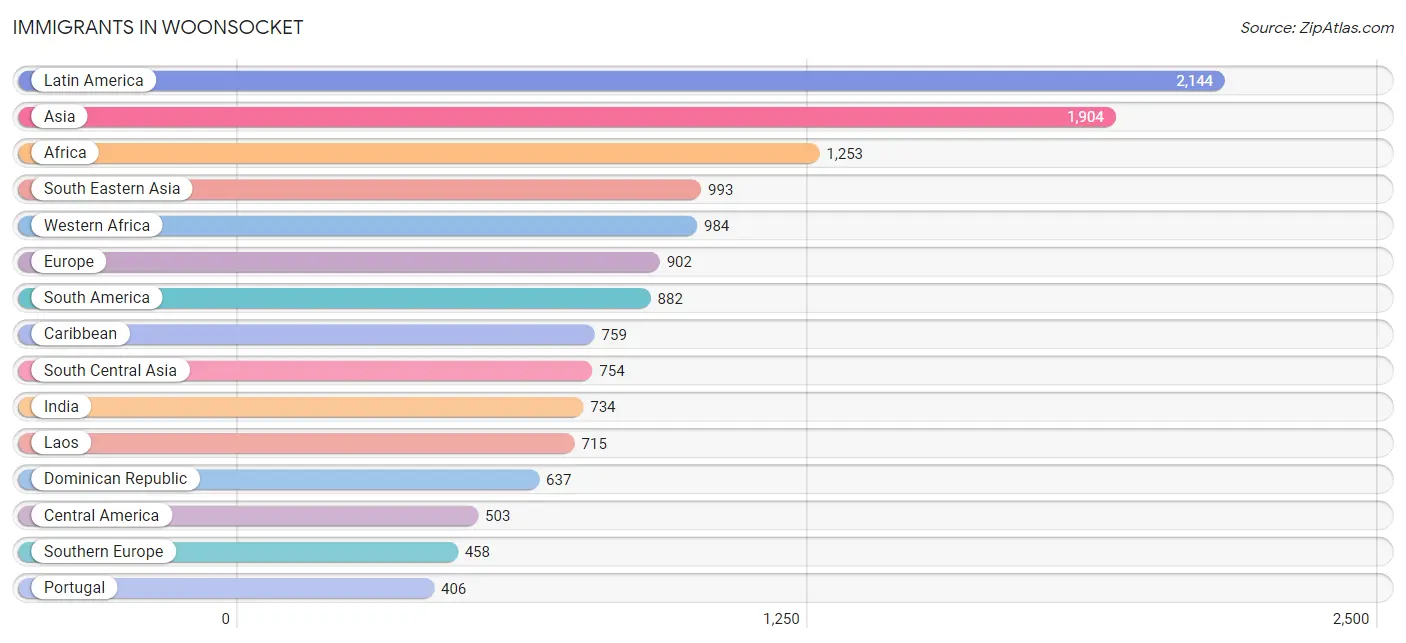
The most numerous immigrant groups reported in Woonsocket came from Latin America (2,144 | 5.0%), Asia (1,904 | 4.4%), Africa (1,253 | 2.9%), South Eastern Asia (993 | 2.3%), and Western Africa (984 | 2.3%), together accounting for 16.9% of all Woonsocket residents.
| Immigration Origin | # Population | % Population |
| Africa | 1,253 | 2.9% |
| Albania | 144 | 0.3% |
| Asia | 1,904 | 4.4% |
| Azores | 6 | 0.0% |
| Bangladesh | 14 | 0.0% |
| Brazil | 394 | 0.9% |
| Bulgaria | 18 | 0.0% |
| Cabo Verde | 379 | 0.9% |
| Cambodia | 104 | 0.2% |
| Canada | 89 | 0.2% |
| Caribbean | 759 | 1.8% |
| Central America | 503 | 1.2% |
| China | 15 | 0.0% |
| Colombia | 208 | 0.5% |
| Costa Rica | 26 | 0.1% |
| Dominican Republic | 637 | 1.5% |
| Eastern Africa | 3 | 0.0% |
| Eastern Asia | 45 | 0.1% |
| Eastern Europe | 354 | 0.8% |
| Ecuador | 8 | 0.0% |
| El Salvador | 84 | 0.2% |
| England | 52 | 0.1% |
| Europe | 902 | 2.1% |
| France | 6 | 0.0% |
| Germany | 12 | 0.0% |
| Guatemala | 27 | 0.1% |
| Haiti | 122 | 0.3% |
| Honduras | 34 | 0.1% |
| India | 734 | 1.7% |
| Indonesia | 10 | 0.0% |
| Italy | 4 | 0.0% |
| Korea | 30 | 0.1% |
| Laos | 715 | 1.7% |
| Latin America | 2,144 | 5.0% |
| Lebanon | 36 | 0.1% |
| Liberia | 211 | 0.5% |
| Mexico | 289 | 0.7% |
| Middle Africa | 3 | 0.0% |
| Morocco | 27 | 0.1% |
| Nicaragua | 20 | 0.1% |
| Nigeria | 40 | 0.1% |
| North Macedonia | 7 | 0.0% |
| Northern Africa | 73 | 0.2% |
| Northern Europe | 72 | 0.2% |
| Pakistan | 6 | 0.0% |
| Panama | 23 | 0.1% |
| Philippines | 77 | 0.2% |
| Poland | 97 | 0.2% |
| Portugal | 406 | 0.9% |
| Romania | 19 | 0.0% |
| Russia | 49 | 0.1% |
| Senegal | 246 | 0.6% |
| South America | 882 | 2.1% |
| South Central Asia | 754 | 1.8% |
| South Eastern Asia | 993 | 2.3% |
| Southern Europe | 458 | 1.1% |
| Spain | 48 | 0.1% |
| Syria | 76 | 0.2% |
| Thailand | 4 | 0.0% |
| Ukraine | 12 | 0.0% |
| Uruguay | 2 | 0.0% |
| Venezuela | 270 | 0.6% |
| Vietnam | 83 | 0.2% |
| Western Africa | 984 | 2.3% |
| Western Asia | 112 | 0.3% |
| Western Europe | 18 | 0.0% |
| Zimbabwe | 3 | 0.0% | View All 67 Rows |
Sex and Age in Woonsocket
Sex and Age in Woonsocket
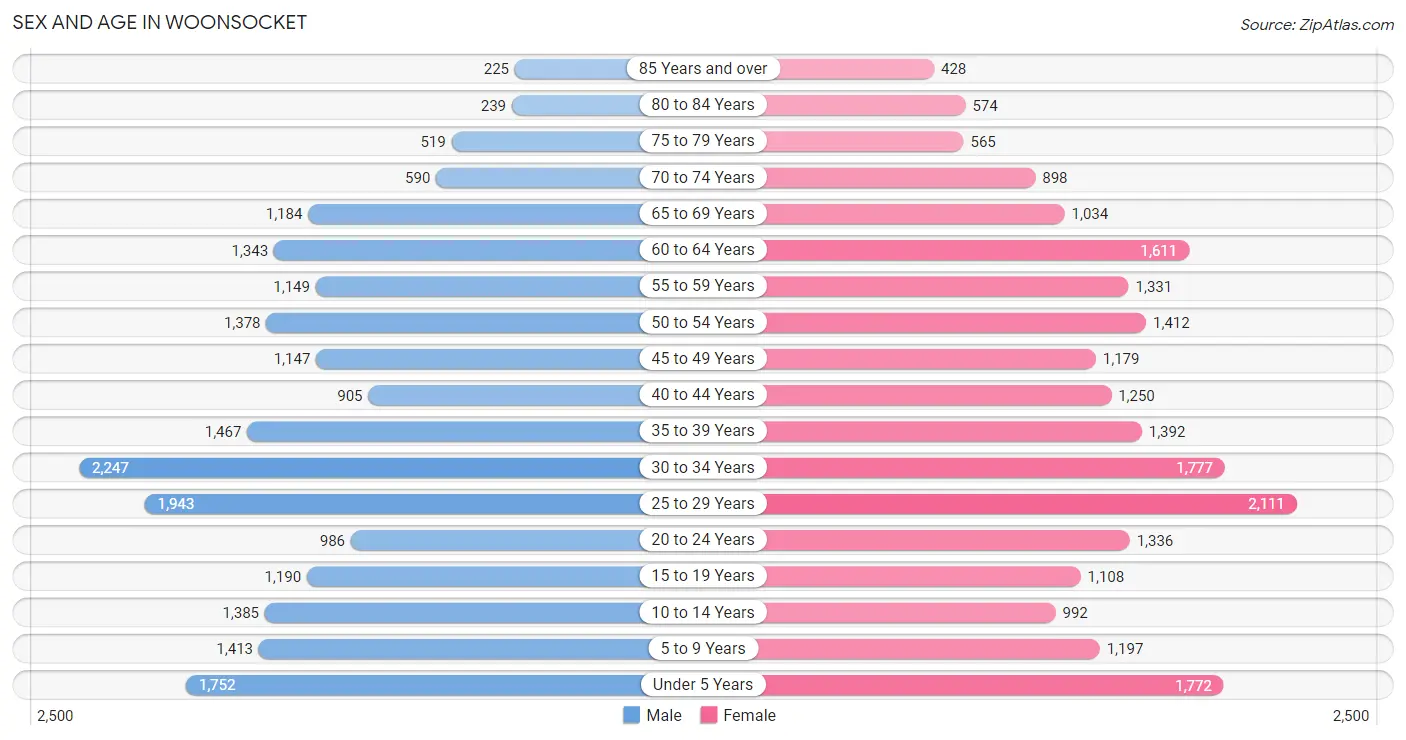
The most populous age groups in Woonsocket are 30 to 34 Years (2,247 | 10.7%) for men and 25 to 29 Years (2,111 | 9.6%) for women.
| Age Bracket | Male | Female |
| Under 5 Years | 1,752 (8.3%) | 1,772 (8.1%) |
| 5 to 9 Years | 1,413 (6.7%) | 1,197 (5.4%) |
| 10 to 14 Years | 1,385 (6.6%) | 992 (4.5%) |
| 15 to 19 Years | 1,190 (5.7%) | 1,108 (5.0%) |
| 20 to 24 Years | 986 (4.7%) | 1,336 (6.1%) |
| 25 to 29 Years | 1,943 (9.2%) | 2,111 (9.6%) |
| 30 to 34 Years | 2,247 (10.7%) | 1,777 (8.1%) |
| 35 to 39 Years | 1,467 (7.0%) | 1,392 (6.3%) |
| 40 to 44 Years | 905 (4.3%) | 1,250 (5.7%) |
| 45 to 49 Years | 1,147 (5.4%) | 1,179 (5.4%) |
| 50 to 54 Years | 1,378 (6.5%) | 1,412 (6.4%) |
| 55 to 59 Years | 1,149 (5.5%) | 1,331 (6.1%) |
| 60 to 64 Years | 1,343 (6.4%) | 1,611 (7.3%) |
| 65 to 69 Years | 1,184 (5.6%) | 1,034 (4.7%) |
| 70 to 74 Years | 590 (2.8%) | 898 (4.1%) |
| 75 to 79 Years | 519 (2.5%) | 565 (2.6%) |
| 80 to 84 Years | 239 (1.1%) | 574 (2.6%) |
| 85 Years and over | 225 (1.1%) | 428 (1.9%) |
| Total | 21,062 (100.0%) | 21,967 (100.0%) |
Families and Households in Woonsocket
Median Family Size in Woonsocket
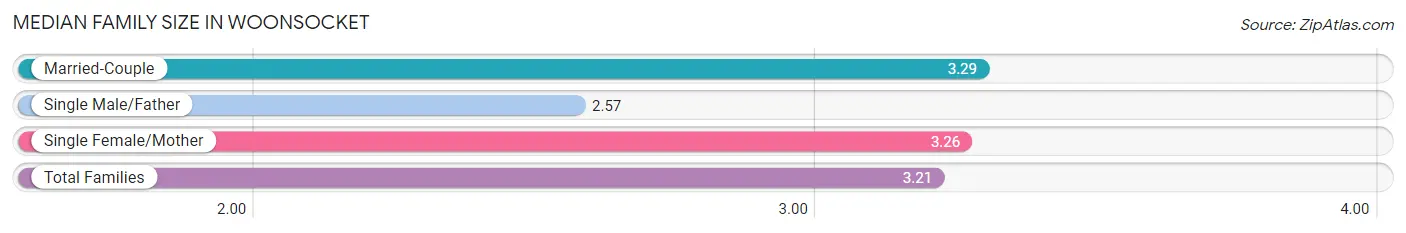
The median family size in Woonsocket is 3.21 persons per family, with married-couple families (5,589 | 56.4%) accounting for the largest median family size of 3.29 persons per family. On the other hand, single male/father families (986 | 10.0%) represent the smallest median family size with 2.57 persons per family.
| Family Type | # Families | Family Size |
| Married-Couple | 5,589 (56.4%) | 3.29 |
| Single Male/Father | 986 (10.0%) | 2.57 |
| Single Female/Mother | 3,334 (33.7%) | 3.26 |
| Total Families | 9,909 (100.0%) | 3.21 |
Median Household Size in Woonsocket
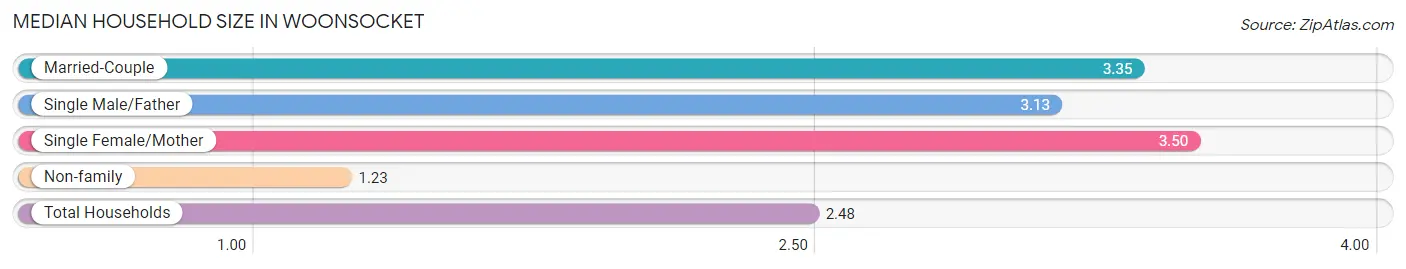
The median household size in Woonsocket is 2.48 persons per household, with single female/mother households (3,334 | 19.6%) accounting for the largest median household size of 3.5 persons per household. non-family households (7,063 | 41.6%) represent the smallest median household size with 1.23 persons per household.
| Household Type | # Households | Household Size |
| Married-Couple | 5,589 (32.9%) | 3.35 |
| Single Male/Father | 986 (5.8%) | 3.13 |
| Single Female/Mother | 3,334 (19.6%) | 3.50 |
| Non-family | 7,063 (41.6%) | 1.23 |
| Total Households | 16,972 (100.0%) | 2.48 |
Household Size by Marriage Status in Woonsocket
Out of a total of 16,972 households in Woonsocket, 9,909 (58.4%) are family households, while 7,063 (41.6%) are nonfamily households. The most numerous type of family households are 2-person households, comprising 3,872, and the most common type of nonfamily households are 1-person households, comprising 5,669.
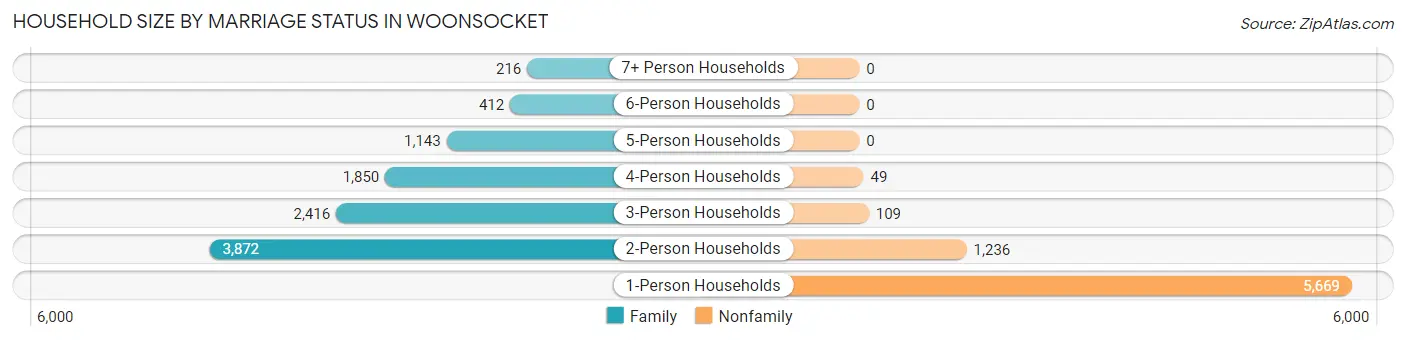
| Household Size | Family Households | Nonfamily Households |
| 1-Person Households | - | 5,669 (33.4%) |
| 2-Person Households | 3,872 (22.8%) | 1,236 (7.3%) |
| 3-Person Households | 2,416 (14.2%) | 109 (0.6%) |
| 4-Person Households | 1,850 (10.9%) | 49 (0.3%) |
| 5-Person Households | 1,143 (6.7%) | 0 (0.0%) |
| 6-Person Households | 412 (2.4%) | 0 (0.0%) |
| 7+ Person Households | 216 (1.3%) | 0 (0.0%) |
| Total | 9,909 (58.4%) | 7,063 (41.6%) |
Female Fertility in Woonsocket
Fertility by Age in Woonsocket
Average fertility rate in Woonsocket is 55.0 births per 1,000 women. Women in the age bracket of 20 to 34 years have the highest fertility rate with 71.0 births per 1,000 women. Women in the age bracket of 20 to 34 years acount for 65.8% of all women with births.
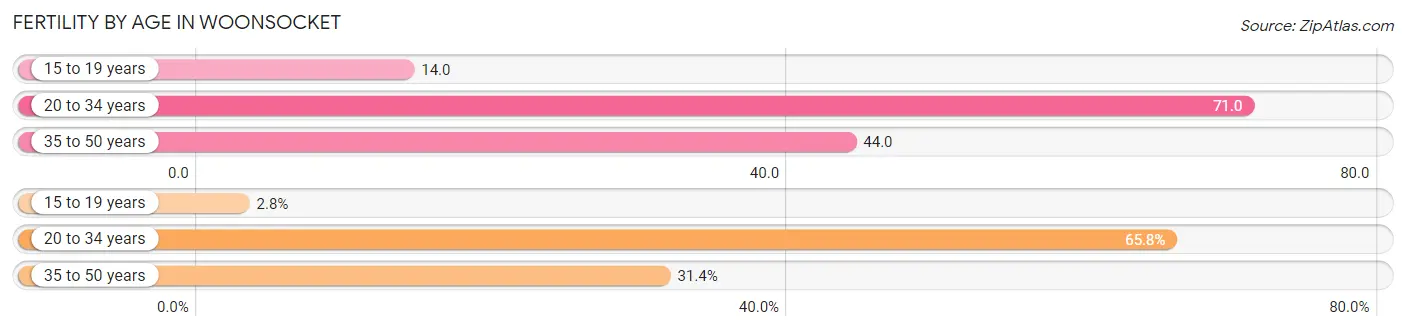
| Age Bracket | Women with Births | Births / 1,000 Women |
| 15 to 19 years | 16 (2.8%) | 14.0 |
| 20 to 34 years | 373 (65.8%) | 71.0 |
| 35 to 50 years | 178 (31.4%) | 44.0 |
| Total | 567 (100.0%) | 55.0 |
Fertility by Age by Marriage Status in Woonsocket
58.0% of women with births (567) in Woonsocket are married. The highest percentage of unmarried women with births falls into 15 to 19 years age bracket with 100.0% of them unmarried at the time of birth, while the lowest percentage of unmarried women with births belong to 20 to 34 years age bracket with 38.6% of them unmarried.
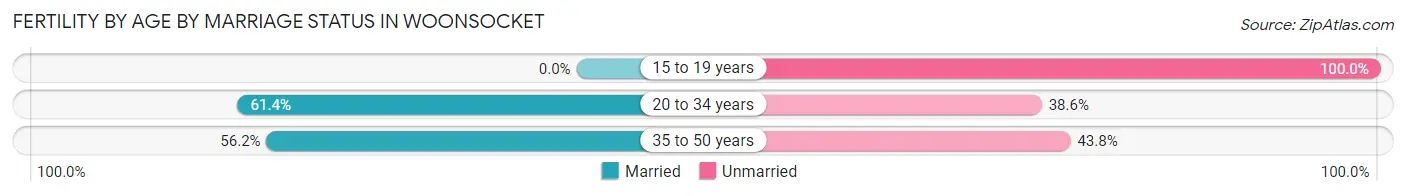
| Age Bracket | Married | Unmarried |
| 15 to 19 years | 0 (0.0%) | 16 (100.0%) |
| 20 to 34 years | 229 (61.4%) | 144 (38.6%) |
| 35 to 50 years | 100 (56.2%) | 78 (43.8%) |
| Total | 329 (58.0%) | 238 (42.0%) |
Fertility by Education in Woonsocket
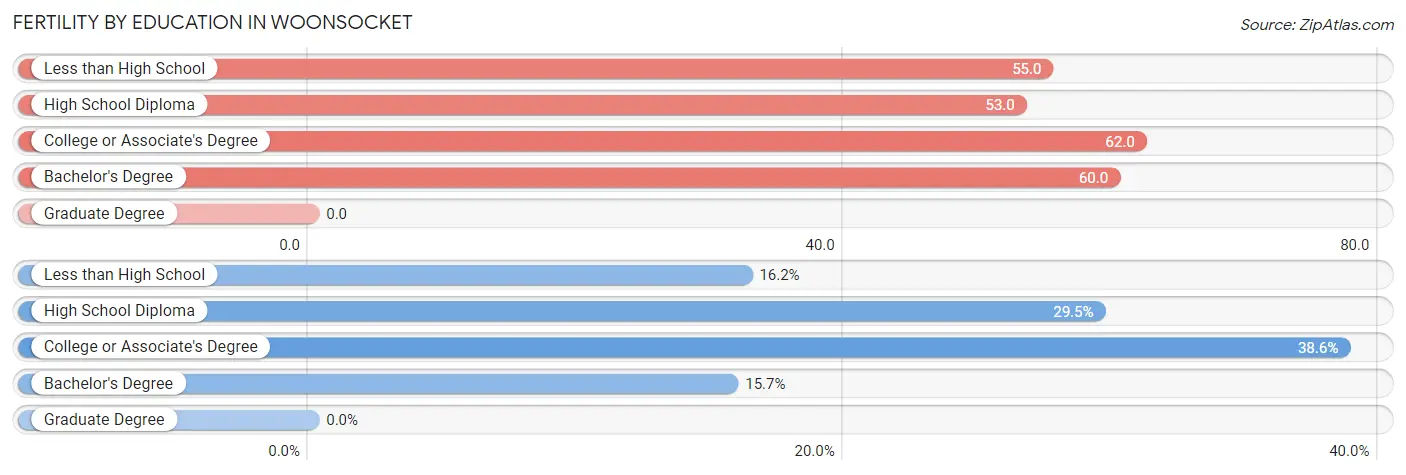
| Educational Attainment | Women with Births | Births / 1,000 Women |
| Less than High School | 92 (16.2%) | 55.0 |
| High School Diploma | 167 (29.4%) | 53.0 |
| College or Associate's Degree | 219 (38.6%) | 62.0 |
| Bachelor's Degree | 89 (15.7%) | 60.0 |
| Graduate Degree | 0 (0.0%) | 0.0 |
| Total | 567 (100.0%) | 55.0 |
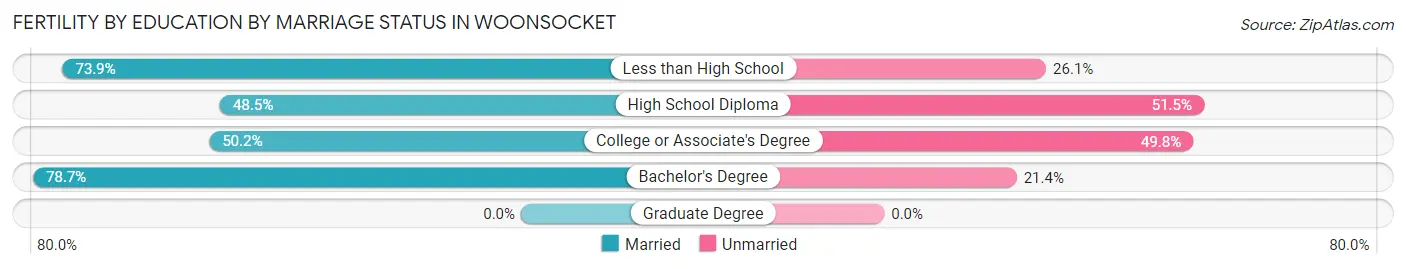
Fertility by Education by Marriage Status in Woonsocket
42.0% of women with births in Woonsocket are unmarried. Women with the educational attainment of bachelor's degree are most likely to be married with 78.6% of them married at childbirth, while women with the educational attainment of high school diploma are least likely to be married with 51.5% of them unmarried at childbirth.
| Educational Attainment | Married | Unmarried |
| Less than High School | 68 (73.9%) | 24 (26.1%) |
| High School Diploma | 81 (48.5%) | 86 (51.5%) |
| College or Associate's Degree | 110 (50.2%) | 109 (49.8%) |
| Bachelor's Degree | 70 (78.6%) | 19 (21.3%) |
| Graduate Degree | 0 (0.0%) | 0 (0.0%) |
| Total | 329 (58.0%) | 238 (42.0%) |
Employment Characteristics in Woonsocket
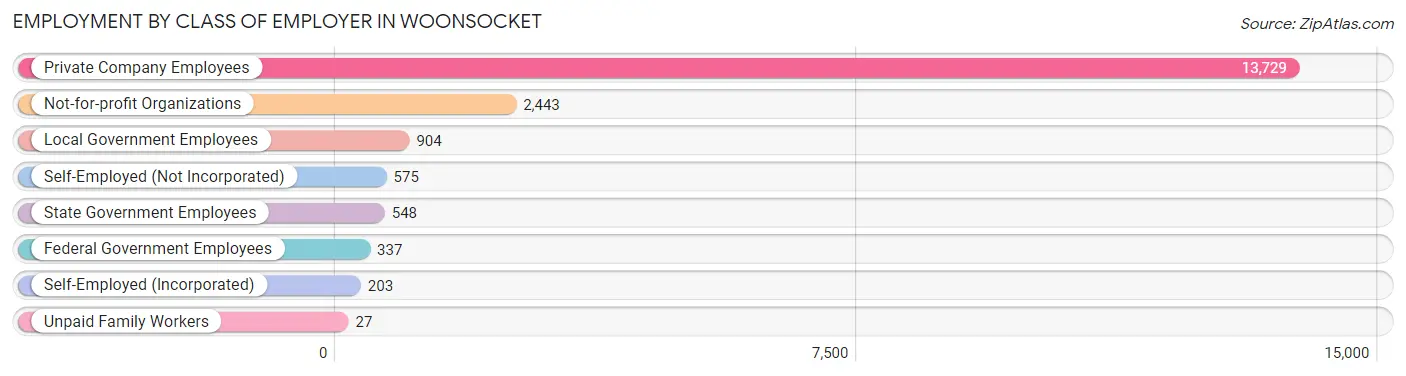
Employment by Class of Employer in Woonsocket
Among the 18,766 employed individuals in Woonsocket, private company employees (13,729 | 73.2%), not-for-profit organizations (2,443 | 13.0%), and local government employees (904 | 4.8%) make up the most common classes of employment.
| Employer Class | # Employees | % Employees |
| Private Company Employees | 13,729 | 73.2% |
| Self-Employed (Incorporated) | 203 | 1.1% |
| Self-Employed (Not Incorporated) | 575 | 3.1% |
| Not-for-profit Organizations | 2,443 | 13.0% |
| Local Government Employees | 904 | 4.8% |
| State Government Employees | 548 | 2.9% |
| Federal Government Employees | 337 | 1.8% |
| Unpaid Family Workers | 27 | 0.1% |
| Total | 18,766 | 100.0% |
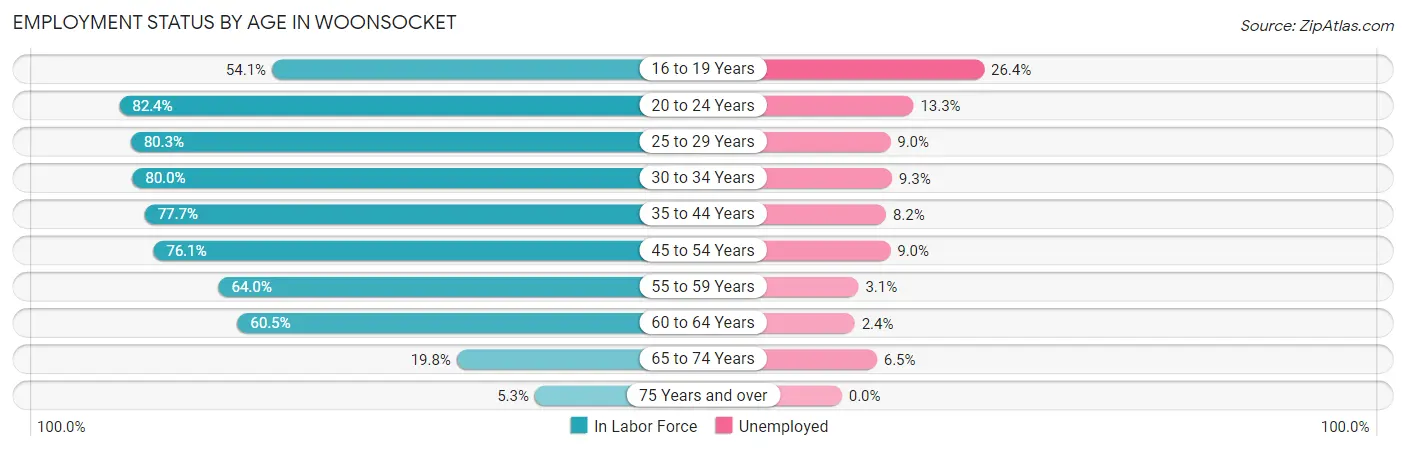
Employment Status by Age in Woonsocket
According to the labor force statistics for Woonsocket, out of the total population over 16 years of age (33,996), 62.9% or 21,383 individuals are in the labor force, with 8.9% or 1,903 of them unemployed. The age group with the highest labor force participation rate is 20 to 24 years, with 82.4% or 1,913 individuals in the labor force. Within the labor force, the 16 to 19 years age range has the highest percentage of unemployed individuals, with 26.4% or 254 of them being unemployed.
| Age Bracket | In Labor Force | Unemployed |
| 16 to 19 Years | 961 (54.1%) | 254 (26.4%) |
| 20 to 24 Years | 1,913 (82.4%) | 254 (13.3%) |
| 25 to 29 Years | 3,255 (80.3%) | 293 (9.0%) |
| 30 to 34 Years | 3,219 (80.0%) | 299 (9.3%) |
| 35 to 44 Years | 3,896 (77.7%) | 319 (8.2%) |
| 45 to 54 Years | 3,893 (76.1%) | 350 (9.0%) |
| 55 to 59 Years | 1,587 (64.0%) | 49 (3.1%) |
| 60 to 64 Years | 1,787 (60.5%) | 43 (2.4%) |
| 65 to 74 Years | 734 (19.8%) | 48 (6.5%) |
| 75 Years and over | 135 (5.3%) | 0 (0.0%) |
| Total | 21,383 (62.9%) | 1,903 (8.9%) |
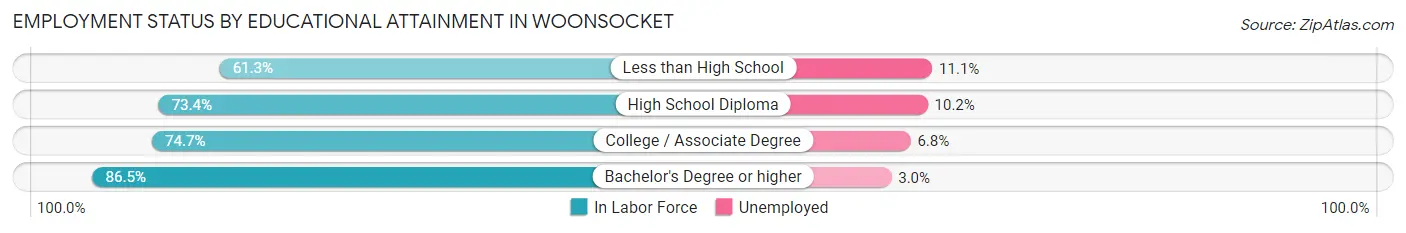
Employment Status by Educational Attainment in Woonsocket
According to labor force statistics for Woonsocket, 74.6% of individuals (17,637) out of the total population between 25 and 64 years of age (23,642) are in the labor force, with 7.7% or 1,358 of them being unemployed. The group with the highest labor force participation rate are those with the educational attainment of bachelor's degree or higher, with 86.5% or 4,088 individuals in the labor force. Within the labor force, individuals with less than high school education have the highest percentage of unemployment, with 11.1% or 240 of them being unemployed.
| Educational Attainment | In Labor Force | Unemployed |
| Less than High School | 2,163 (61.3%) | 392 (11.1%) |
| High School Diploma | 6,256 (73.4%) | 869 (10.2%) |
| College / Associate Degree | 5,127 (74.7%) | 467 (6.8%) |
| Bachelor's Degree or higher | 4,088 (86.5%) | 142 (3.0%) |
| Total | 17,637 (74.6%) | 1,820 (7.7%) |
Employment Occupations by Sex in Woonsocket
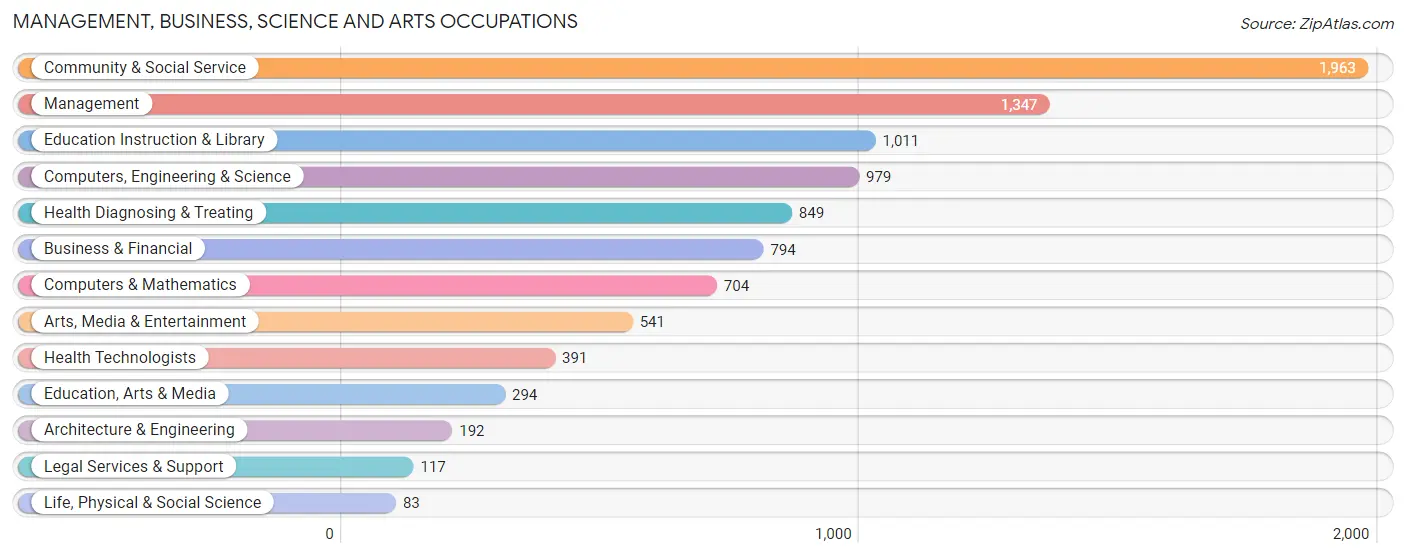
Management, Business, Science and Arts Occupations
The most common Management, Business, Science and Arts occupations in Woonsocket are Community & Social Service (1,963 | 10.1%), Management (1,347 | 6.9%), Education Instruction & Library (1,011 | 5.2%), Computers, Engineering & Science (979 | 5.0%), and Health Diagnosing & Treating (849 | 4.4%).
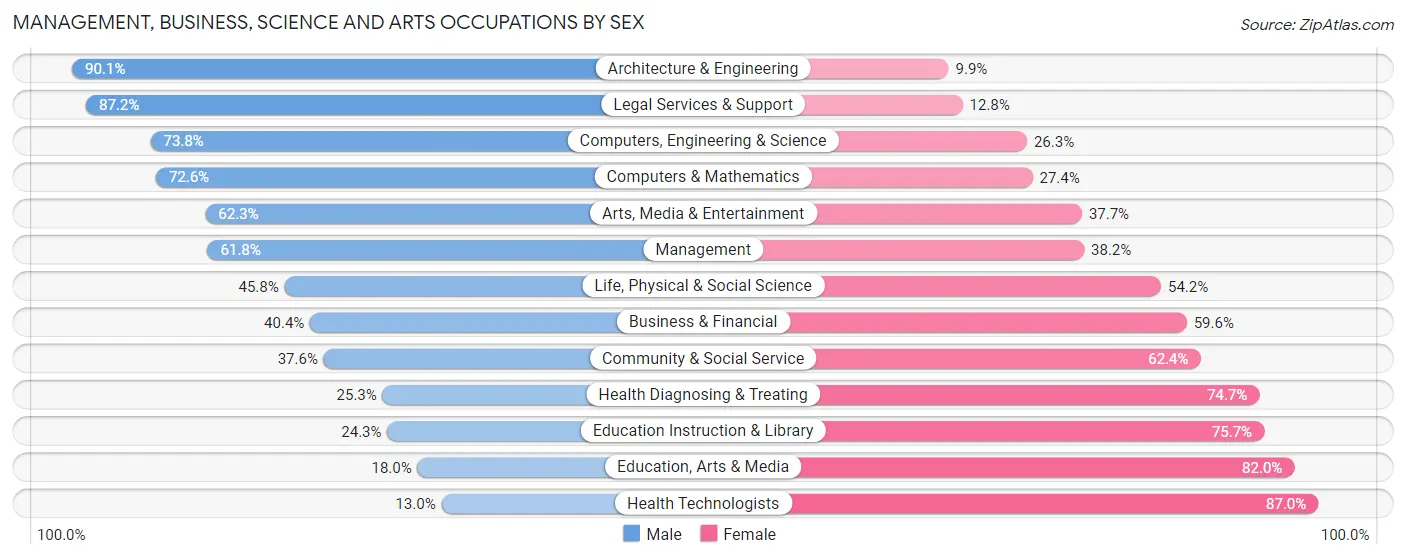
Management, Business, Science and Arts Occupations by Sex
Within the Management, Business, Science and Arts occupations in Woonsocket, the most male-oriented occupations are Architecture & Engineering (90.1%), Legal Services & Support (87.2%), and Computers, Engineering & Science (73.8%), while the most female-oriented occupations are Health Technologists (87.0%), Education, Arts & Media (82.0%), and Education Instruction & Library (75.7%).
| Occupation | Male | Female |
| Management | 833 (61.8%) | 514 (38.2%) |
| Business & Financial | 321 (40.4%) | 473 (59.6%) |
| Computers, Engineering & Science | 722 (73.8%) | 257 (26.3%) |
| Computers & Mathematics | 511 (72.6%) | 193 (27.4%) |
| Architecture & Engineering | 173 (90.1%) | 19 (9.9%) |
| Life, Physical & Social Science | 38 (45.8%) | 45 (54.2%) |
| Community & Social Service | 738 (37.6%) | 1,225 (62.4%) |
| Education, Arts & Media | 53 (18.0%) | 241 (82.0%) |
| Legal Services & Support | 102 (87.2%) | 15 (12.8%) |
| Education Instruction & Library | 246 (24.3%) | 765 (75.7%) |
| Arts, Media & Entertainment | 337 (62.3%) | 204 (37.7%) |
| Health Diagnosing & Treating | 215 (25.3%) | 634 (74.7%) |
| Health Technologists | 51 (13.0%) | 340 (87.0%) |
| Total (Category) | 2,829 (47.7%) | 3,103 (52.3%) |
| Total (Overall) | 10,058 (51.7%) | 9,399 (48.3%) |
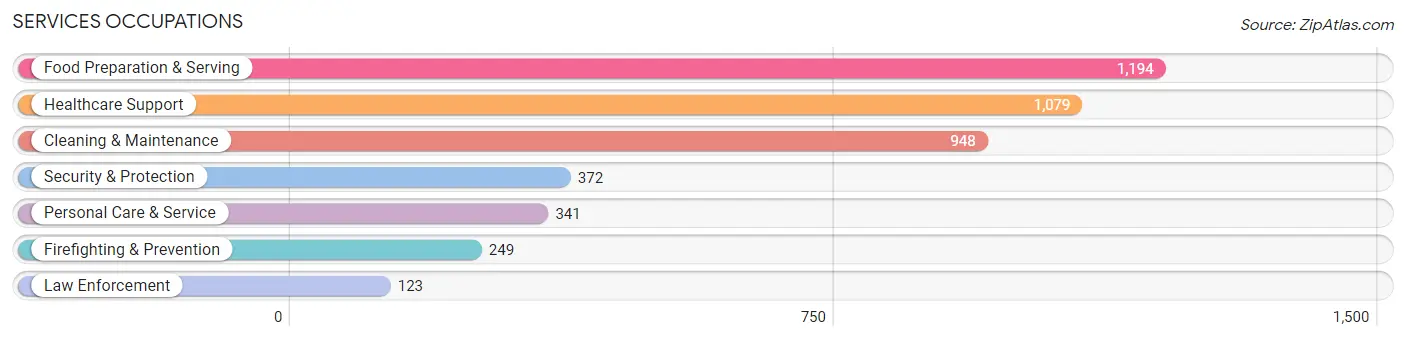
Services Occupations
The most common Services occupations in Woonsocket are Food Preparation & Serving (1,194 | 6.1%), Healthcare Support (1,079 | 5.6%), Cleaning & Maintenance (948 | 4.9%), Security & Protection (372 | 1.9%), and Personal Care & Service (341 | 1.8%).
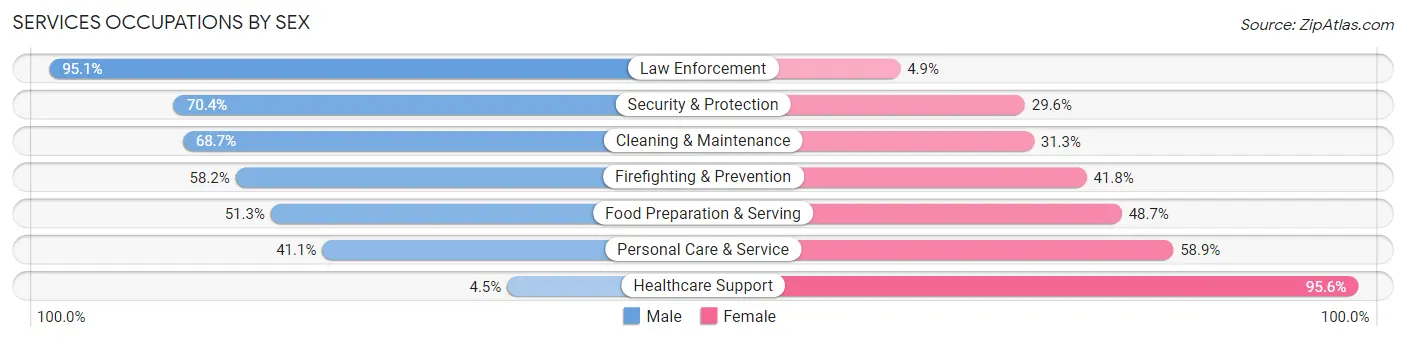
Services Occupations by Sex
Within the Services occupations in Woonsocket, the most male-oriented occupations are Law Enforcement (95.1%), Security & Protection (70.4%), and Cleaning & Maintenance (68.7%), while the most female-oriented occupations are Healthcare Support (95.6%), Personal Care & Service (58.9%), and Food Preparation & Serving (48.7%).
| Occupation | Male | Female |
| Healthcare Support | 48 (4.4%) | 1,031 (95.6%) |
| Security & Protection | 262 (70.4%) | 110 (29.6%) |
| Firefighting & Prevention | 145 (58.2%) | 104 (41.8%) |
| Law Enforcement | 117 (95.1%) | 6 (4.9%) |
| Food Preparation & Serving | 612 (51.3%) | 582 (48.7%) |
| Cleaning & Maintenance | 651 (68.7%) | 297 (31.3%) |
| Personal Care & Service | 140 (41.1%) | 201 (58.9%) |
| Total (Category) | 1,713 (43.5%) | 2,221 (56.5%) |
| Total (Overall) | 10,058 (51.7%) | 9,399 (48.3%) |
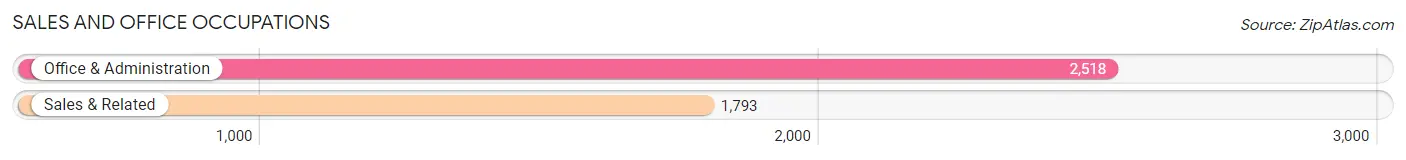
Sales and Office Occupations
The most common Sales and Office occupations in Woonsocket are Office & Administration (2,518 | 12.9%), and Sales & Related (1,793 | 9.2%).
Sales and Office Occupations by Sex
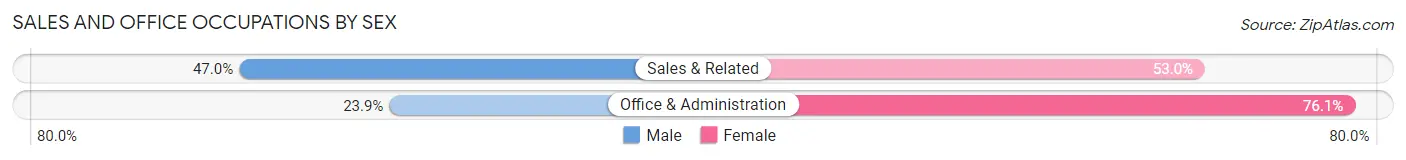
| Occupation | Male | Female |
| Sales & Related | 843 (47.0%) | 950 (53.0%) |
| Office & Administration | 602 (23.9%) | 1,916 (76.1%) |
| Total (Category) | 1,445 (33.5%) | 2,866 (66.5%) |
| Total (Overall) | 10,058 (51.7%) | 9,399 (48.3%) |
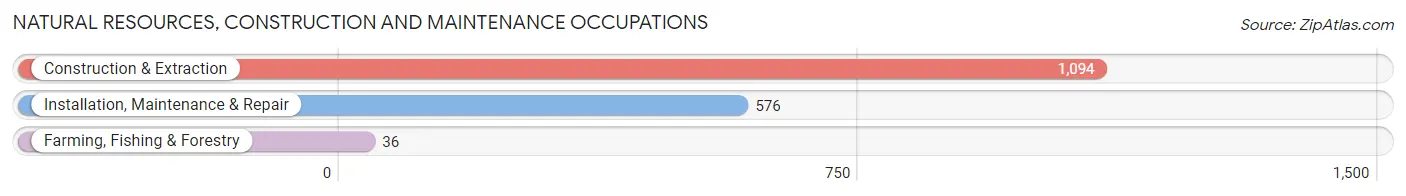
Natural Resources, Construction and Maintenance Occupations
The most common Natural Resources, Construction and Maintenance occupations in Woonsocket are Construction & Extraction (1,094 | 5.6%), Installation, Maintenance & Repair (576 | 3.0%), and Farming, Fishing & Forestry (36 | 0.2%).
Natural Resources, Construction and Maintenance Occupations by Sex
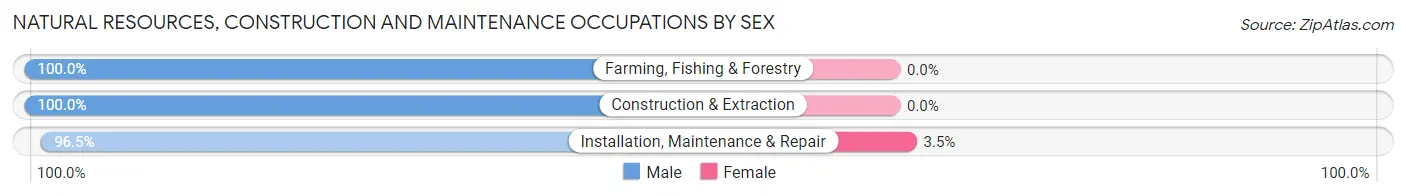
| Occupation | Male | Female |
| Farming, Fishing & Forestry | 36 (100.0%) | 0 (0.0%) |
| Construction & Extraction | 1,094 (100.0%) | 0 (0.0%) |
| Installation, Maintenance & Repair | 556 (96.5%) | 20 (3.5%) |
| Total (Category) | 1,686 (98.8%) | 20 (1.2%) |
| Total (Overall) | 10,058 (51.7%) | 9,399 (48.3%) |
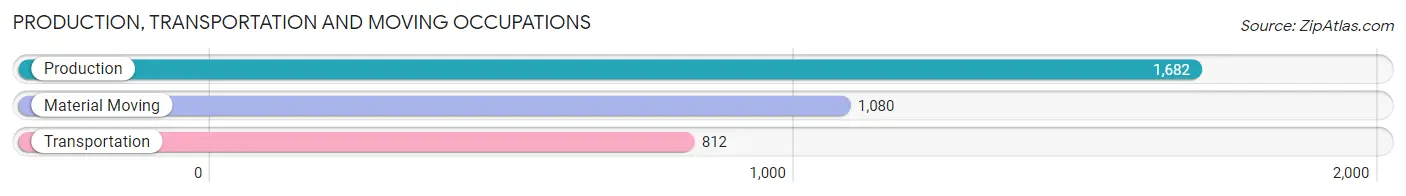
Production, Transportation and Moving Occupations
The most common Production, Transportation and Moving occupations in Woonsocket are Production (1,682 | 8.6%), Material Moving (1,080 | 5.6%), and Transportation (812 | 4.2%).
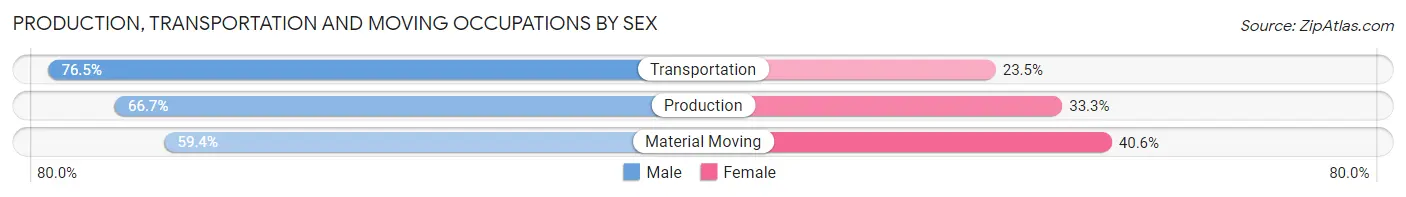
Production, Transportation and Moving Occupations by Sex
| Occupation | Male | Female |
| Production | 1,122 (66.7%) | 560 (33.3%) |
| Transportation | 621 (76.5%) | 191 (23.5%) |
| Material Moving | 642 (59.4%) | 438 (40.6%) |
| Total (Category) | 2,385 (66.7%) | 1,189 (33.3%) |
| Total (Overall) | 10,058 (51.7%) | 9,399 (48.3%) |
Employment Industries by Sex in Woonsocket
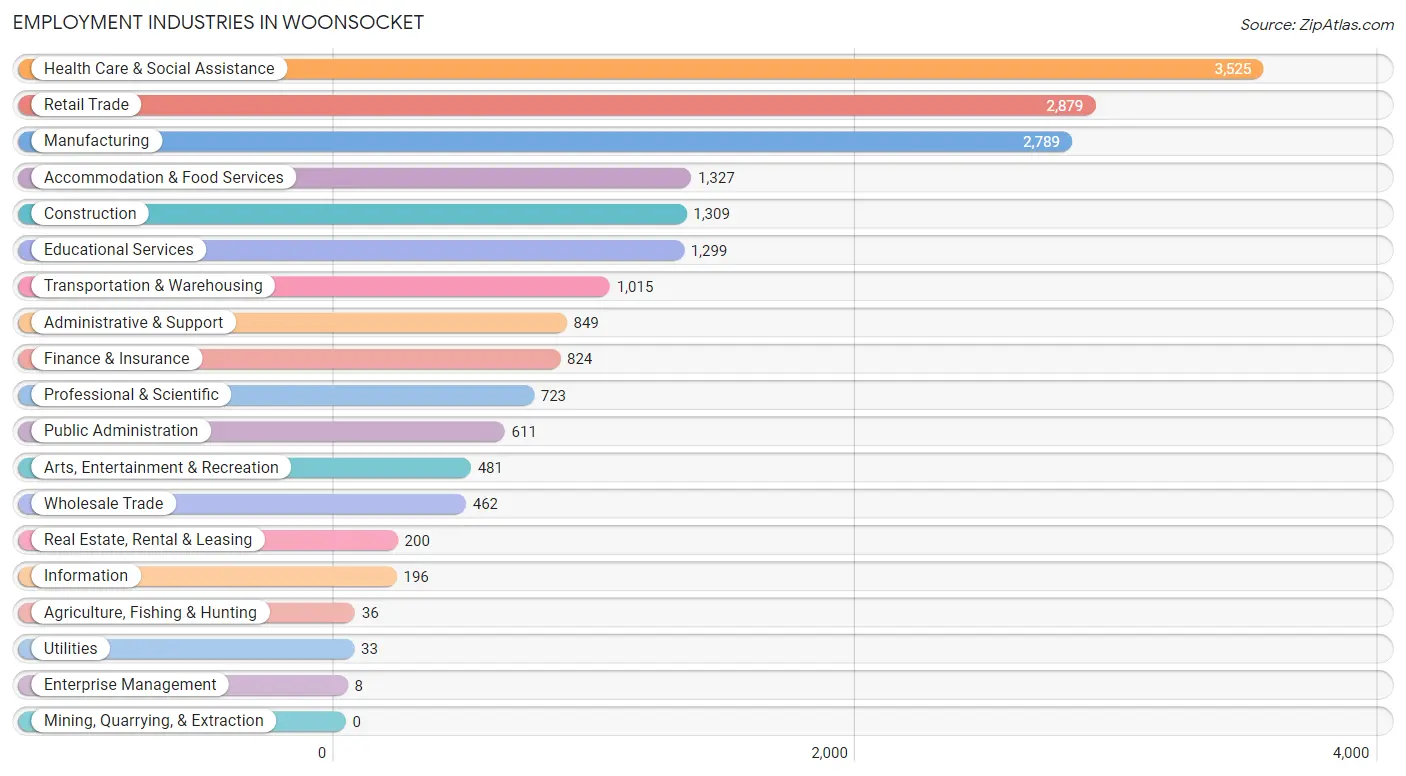
Employment Industries in Woonsocket
The major employment industries in Woonsocket include Health Care & Social Assistance (3,525 | 18.1%), Retail Trade (2,879 | 14.8%), Manufacturing (2,789 | 14.3%), Accommodation & Food Services (1,327 | 6.8%), and Construction (1,309 | 6.7%).
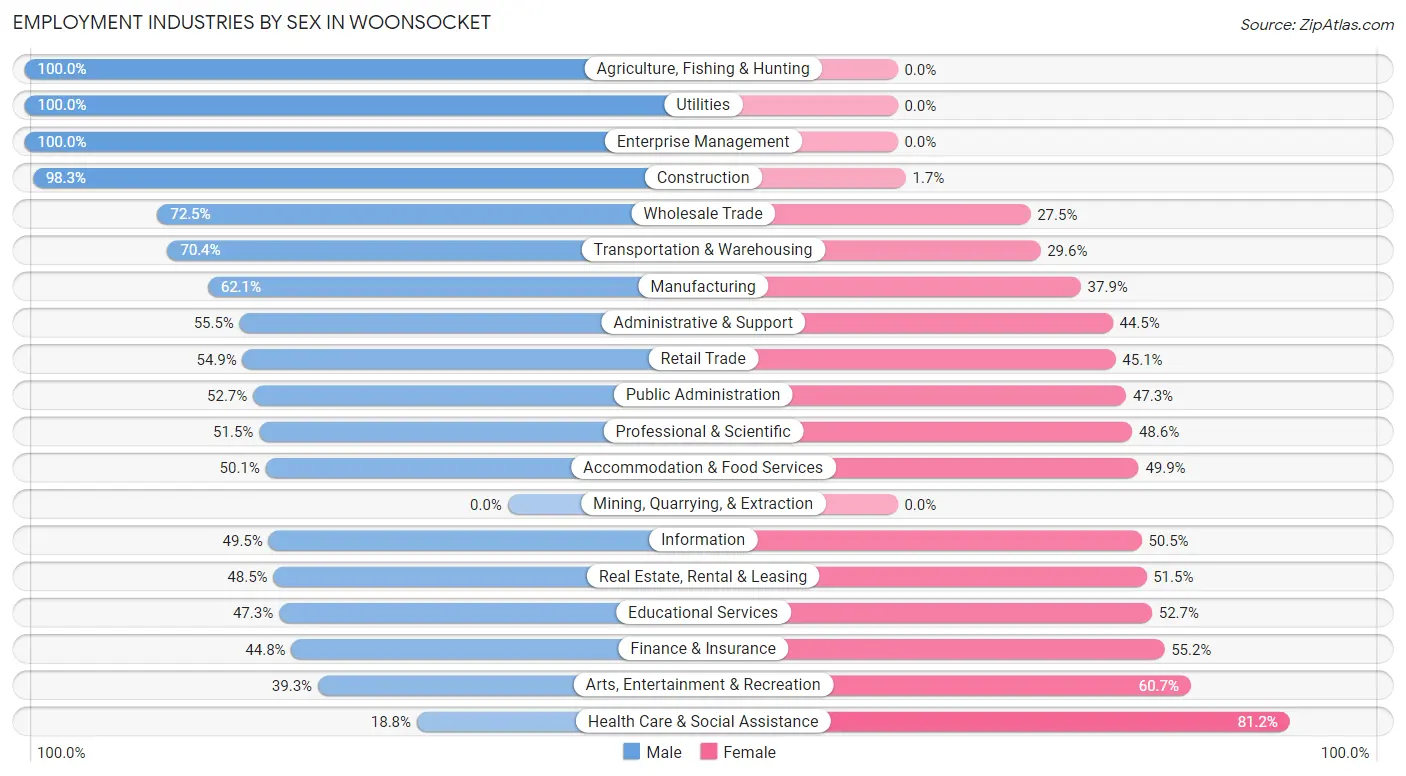
Employment Industries by Sex in Woonsocket
The Woonsocket industries that see more men than women are Agriculture, Fishing & Hunting (100.0%), Utilities (100.0%), and Enterprise Management (100.0%), whereas the industries that tend to have a higher number of women are Health Care & Social Assistance (81.2%), Arts, Entertainment & Recreation (60.7%), and Finance & Insurance (55.2%).
| Industry | Male | Female |
| Agriculture, Fishing & Hunting | 36 (100.0%) | 0 (0.0%) |
| Mining, Quarrying, & Extraction | 0 (0.0%) | 0 (0.0%) |
| Construction | 1,287 (98.3%) | 22 (1.7%) |
| Manufacturing | 1,731 (62.1%) | 1,058 (37.9%) |
| Wholesale Trade | 335 (72.5%) | 127 (27.5%) |
| Retail Trade | 1,580 (54.9%) | 1,299 (45.1%) |
| Transportation & Warehousing | 715 (70.4%) | 300 (29.6%) |
| Utilities | 33 (100.0%) | 0 (0.0%) |
| Information | 97 (49.5%) | 99 (50.5%) |
| Finance & Insurance | 369 (44.8%) | 455 (55.2%) |
| Real Estate, Rental & Leasing | 97 (48.5%) | 103 (51.5%) |
| Professional & Scientific | 372 (51.4%) | 351 (48.5%) |
| Enterprise Management | 8 (100.0%) | 0 (0.0%) |
| Administrative & Support | 471 (55.5%) | 378 (44.5%) |
| Educational Services | 615 (47.3%) | 684 (52.7%) |
| Health Care & Social Assistance | 663 (18.8%) | 2,862 (81.2%) |
| Arts, Entertainment & Recreation | 189 (39.3%) | 292 (60.7%) |
| Accommodation & Food Services | 665 (50.1%) | 662 (49.9%) |
| Public Administration | 322 (52.7%) | 289 (47.3%) |
| Total | 10,058 (51.7%) | 9,399 (48.3%) |
Education in Woonsocket
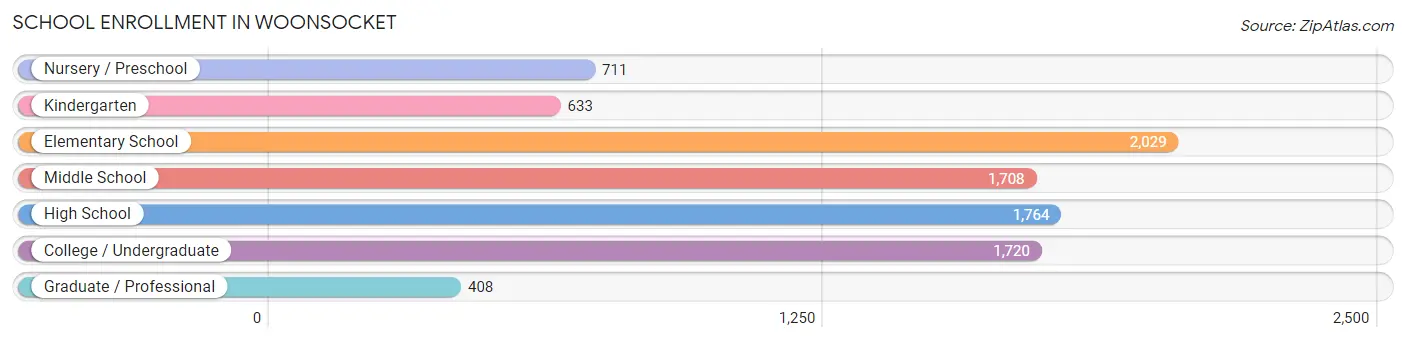
School Enrollment in Woonsocket
The most common levels of schooling among the 8,973 students in Woonsocket are elementary school (2,029 | 22.6%), high school (1,764 | 19.7%), and college / undergraduate (1,720 | 19.2%).
| School Level | # Students | % Students |
| Nursery / Preschool | 711 | 7.9% |
| Kindergarten | 633 | 7.0% |
| Elementary School | 2,029 | 22.6% |
| Middle School | 1,708 | 19.0% |
| High School | 1,764 | 19.7% |
| College / Undergraduate | 1,720 | 19.2% |
| Graduate / Professional | 408 | 4.5% |
| Total | 8,973 | 100.0% |
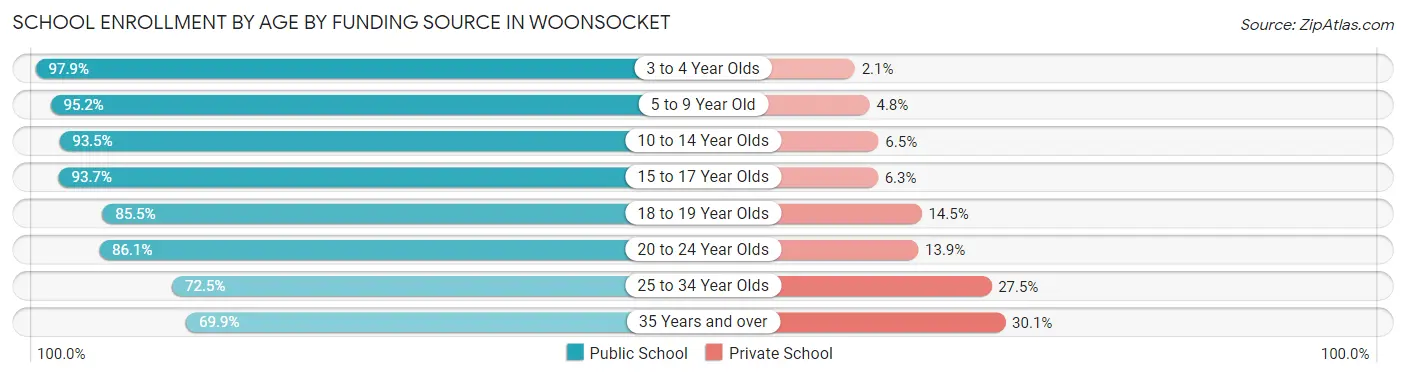
School Enrollment by Age by Funding Source in Woonsocket
Out of a total of 8,973 students who are enrolled in schools in Woonsocket, 879 (9.8%) attend a private institution, while the remaining 8,094 (90.2%) are enrolled in public schools. The age group of 35 years and over has the highest likelihood of being enrolled in private schools, with 114 (30.1% in the age bracket) enrolled. Conversely, the age group of 3 to 4 year olds has the lowest likelihood of being enrolled in a private school, with 619 (97.9% in the age bracket) attending a public institution.
| Age Bracket | Public School | Private School |
| 3 to 4 Year Olds | 619 (97.9%) | 13 (2.1%) |
| 5 to 9 Year Old | 2,193 (95.2%) | 111 (4.8%) |
| 10 to 14 Year Olds | 2,125 (93.5%) | 147 (6.5%) |
| 15 to 17 Year Olds | 1,314 (93.7%) | 89 (6.3%) |
| 18 to 19 Year Olds | 366 (85.5%) | 62 (14.5%) |
| 20 to 24 Year Olds | 559 (86.1%) | 90 (13.9%) |
| 25 to 34 Year Olds | 657 (72.5%) | 249 (27.5%) |
| 35 Years and over | 265 (69.9%) | 114 (30.1%) |
| Total | 8,094 (90.2%) | 879 (9.8%) |
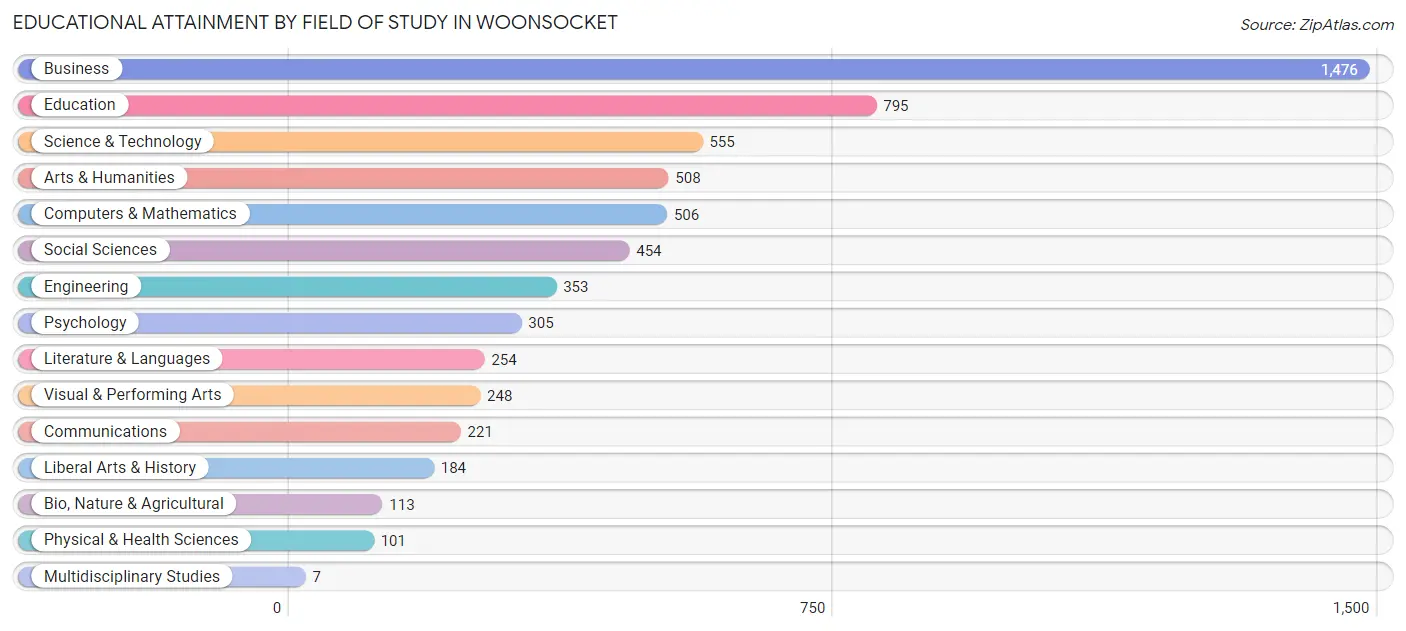
Educational Attainment by Field of Study in Woonsocket
Business (1,476 | 24.3%), education (795 | 13.1%), science & technology (555 | 9.1%), arts & humanities (508 | 8.4%), and computers & mathematics (506 | 8.3%) are the most common fields of study among 6,080 individuals in Woonsocket who have obtained a bachelor's degree or higher.
| Field of Study | # Graduates | % Graduates |
| Computers & Mathematics | 506 | 8.3% |
| Bio, Nature & Agricultural | 113 | 1.9% |
| Physical & Health Sciences | 101 | 1.7% |
| Psychology | 305 | 5.0% |
| Social Sciences | 454 | 7.5% |
| Engineering | 353 | 5.8% |
| Multidisciplinary Studies | 7 | 0.1% |
| Science & Technology | 555 | 9.1% |
| Business | 1,476 | 24.3% |
| Education | 795 | 13.1% |
| Literature & Languages | 254 | 4.2% |
| Liberal Arts & History | 184 | 3.0% |
| Visual & Performing Arts | 248 | 4.1% |
| Communications | 221 | 3.6% |
| Arts & Humanities | 508 | 8.4% |
| Total | 6,080 | 100.0% |
Transportation & Commute in Woonsocket
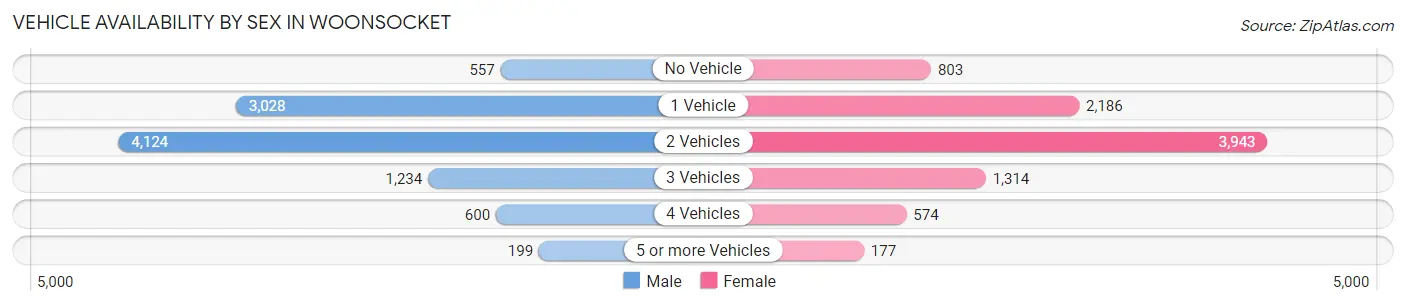
Vehicle Availability by Sex in Woonsocket
The most prevalent vehicle ownership categories in Woonsocket are males with 2 vehicles (4,124, accounting for 42.3%) and females with 2 vehicles (3,943, making up 45.8%).
| Vehicles Available | Male | Female |
| No Vehicle | 557 (5.7%) | 803 (8.9%) |
| 1 Vehicle | 3,028 (31.1%) | 2,186 (24.3%) |
| 2 Vehicles | 4,124 (42.3%) | 3,943 (43.8%) |
| 3 Vehicles | 1,234 (12.7%) | 1,314 (14.6%) |
| 4 Vehicles | 600 (6.2%) | 574 (6.4%) |
| 5 or more Vehicles | 199 (2.0%) | 177 (2.0%) |
| Total | 9,742 (100.0%) | 8,997 (100.0%) |
Commute Time in Woonsocket
The most frequently occuring commute durations in Woonsocket are 30 to 34 minutes (2,967 commuters, 16.5%), 15 to 19 minutes (2,388 commuters, 13.3%), and 20 to 24 minutes (2,109 commuters, 11.7%).
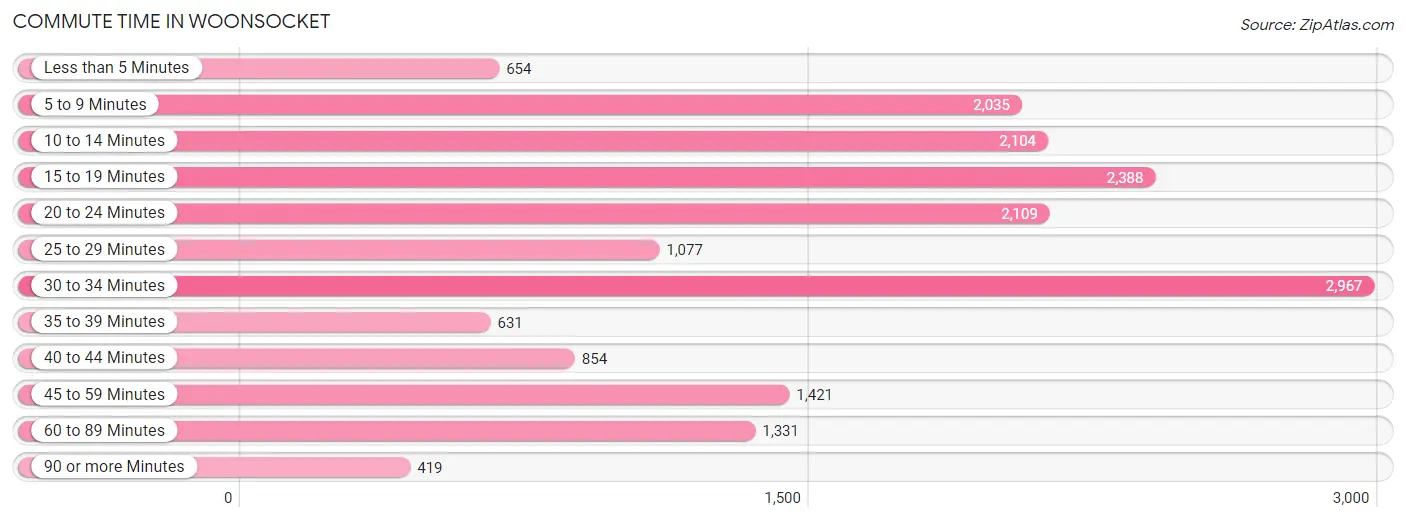
| Commute Time | # Commuters | % Commuters |
| Less than 5 Minutes | 654 | 3.6% |
| 5 to 9 Minutes | 2,035 | 11.3% |
| 10 to 14 Minutes | 2,104 | 11.7% |
| 15 to 19 Minutes | 2,388 | 13.3% |
| 20 to 24 Minutes | 2,109 | 11.7% |
| 25 to 29 Minutes | 1,077 | 6.0% |
| 30 to 34 Minutes | 2,967 | 16.5% |
| 35 to 39 Minutes | 631 | 3.5% |
| 40 to 44 Minutes | 854 | 4.8% |
| 45 to 59 Minutes | 1,421 | 7.9% |
| 60 to 89 Minutes | 1,331 | 7.4% |
| 90 or more Minutes | 419 | 2.3% |
Commute Time by Sex in Woonsocket
The most common commute times in Woonsocket are 30 to 34 minutes (1,665 commuters, 17.8%) for males and 30 to 34 minutes (1,302 commuters, 15.0%) for females.
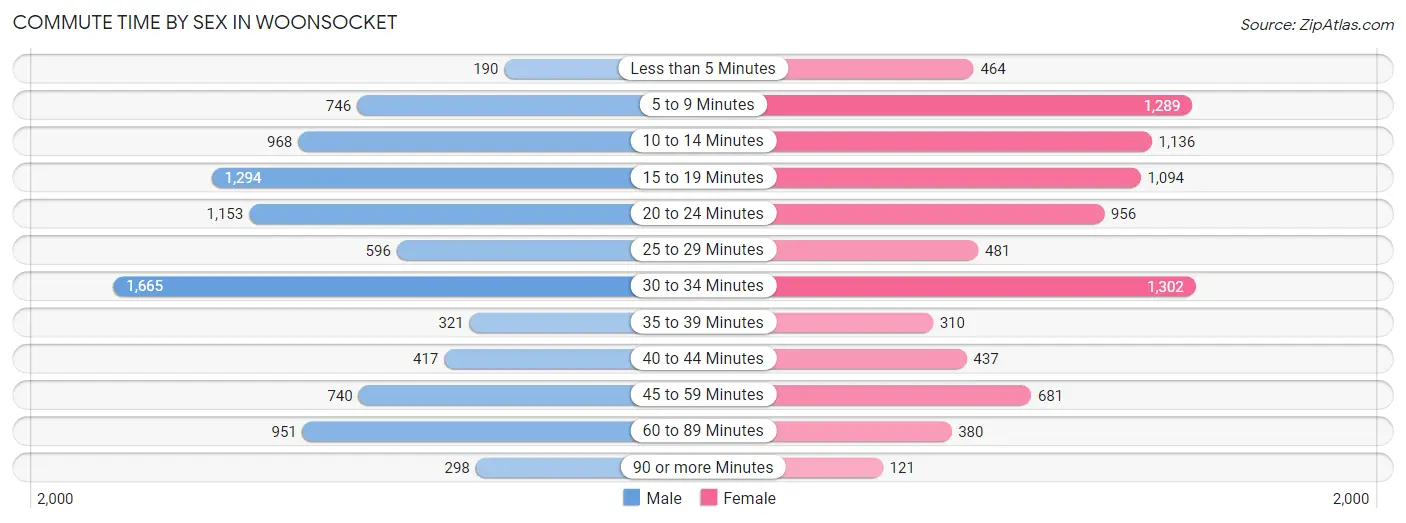
| Commute Time | Male | Female |
| Less than 5 Minutes | 190 (2.0%) | 464 (5.4%) |
| 5 to 9 Minutes | 746 (8.0%) | 1,289 (14.9%) |
| 10 to 14 Minutes | 968 (10.4%) | 1,136 (13.1%) |
| 15 to 19 Minutes | 1,294 (13.9%) | 1,094 (12.7%) |
| 20 to 24 Minutes | 1,153 (12.3%) | 956 (11.1%) |
| 25 to 29 Minutes | 596 (6.4%) | 481 (5.6%) |
| 30 to 34 Minutes | 1,665 (17.8%) | 1,302 (15.0%) |
| 35 to 39 Minutes | 321 (3.4%) | 310 (3.6%) |
| 40 to 44 Minutes | 417 (4.5%) | 437 (5.1%) |
| 45 to 59 Minutes | 740 (7.9%) | 681 (7.9%) |
| 60 to 89 Minutes | 951 (10.2%) | 380 (4.4%) |
| 90 or more Minutes | 298 (3.2%) | 121 (1.4%) |
Time of Departure to Work by Sex in Woonsocket
The most frequent times of departure to work in Woonsocket are 12:00 PM to 3:59 PM (1,249, 13.4%) for males and 8:00 AM to 8:29 AM (1,214, 14.0%) for females.
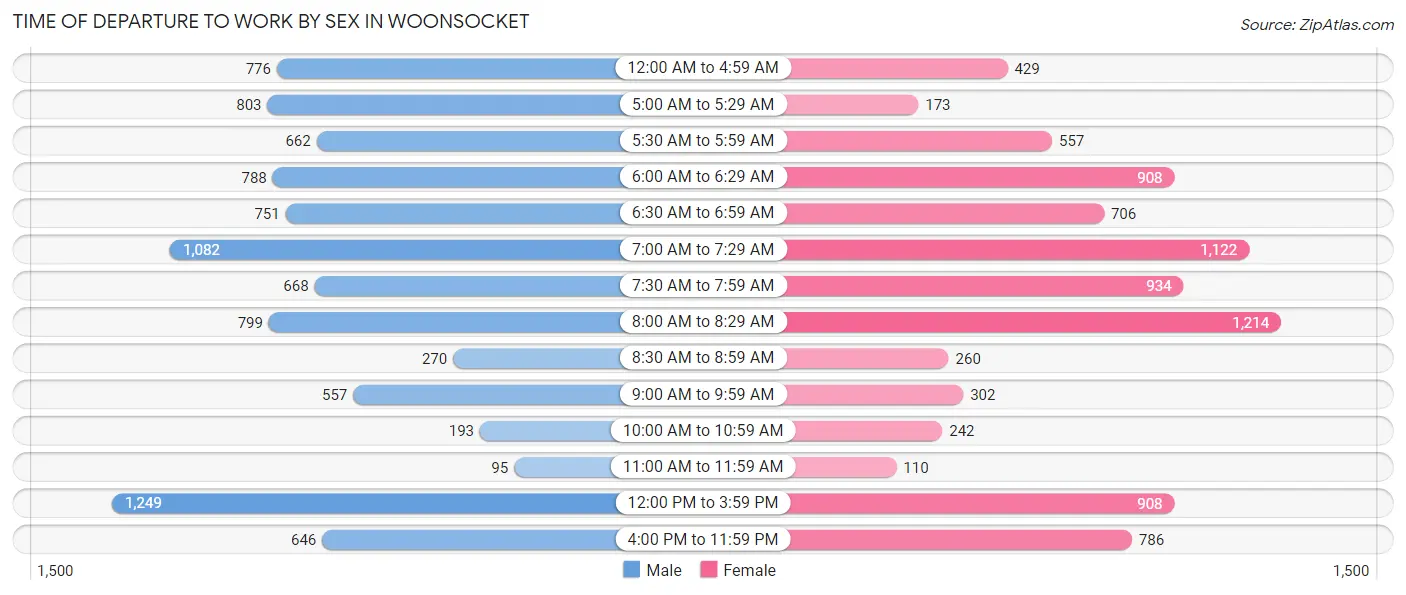
| Time of Departure | Male | Female |
| 12:00 AM to 4:59 AM | 776 (8.3%) | 429 (5.0%) |
| 5:00 AM to 5:29 AM | 803 (8.6%) | 173 (2.0%) |
| 5:30 AM to 5:59 AM | 662 (7.1%) | 557 (6.4%) |
| 6:00 AM to 6:29 AM | 788 (8.4%) | 908 (10.5%) |
| 6:30 AM to 6:59 AM | 751 (8.0%) | 706 (8.2%) |
| 7:00 AM to 7:29 AM | 1,082 (11.6%) | 1,122 (13.0%) |
| 7:30 AM to 7:59 AM | 668 (7.1%) | 934 (10.8%) |
| 8:00 AM to 8:29 AM | 799 (8.6%) | 1,214 (14.0%) |
| 8:30 AM to 8:59 AM | 270 (2.9%) | 260 (3.0%) |
| 9:00 AM to 9:59 AM | 557 (6.0%) | 302 (3.5%) |
| 10:00 AM to 10:59 AM | 193 (2.1%) | 242 (2.8%) |
| 11:00 AM to 11:59 AM | 95 (1.0%) | 110 (1.3%) |
| 12:00 PM to 3:59 PM | 1,249 (13.4%) | 908 (10.5%) |
| 4:00 PM to 11:59 PM | 646 (6.9%) | 786 (9.1%) |
| Total | 9,339 (100.0%) | 8,651 (100.0%) |
Housing Occupancy in Woonsocket
Occupancy by Ownership in Woonsocket
Of the total 16,972 dwellings in Woonsocket, owner-occupied units account for 6,450 (38.0%), while renter-occupied units make up 10,522 (62.0%).
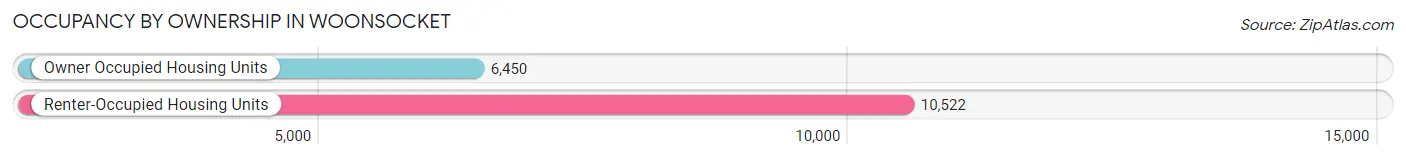
| Occupancy | # Housing Units | % Housing Units |
| Owner Occupied Housing Units | 6,450 | 38.0% |
| Renter-Occupied Housing Units | 10,522 | 62.0% |
| Total Occupied Housing Units | 16,972 | 100.0% |
Occupancy by Household Size in Woonsocket
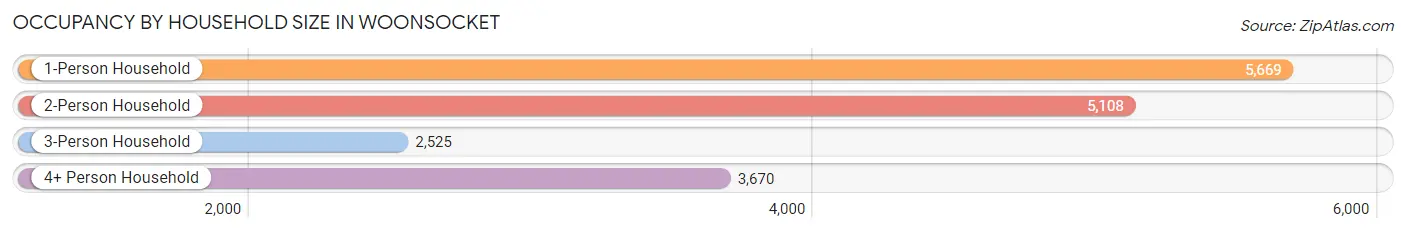
| Household Size | # Housing Units | % Housing Units |
| 1-Person Household | 5,669 | 33.4% |
| 2-Person Household | 5,108 | 30.1% |
| 3-Person Household | 2,525 | 14.9% |
| 4+ Person Household | 3,670 | 21.6% |
| Total Housing Units | 16,972 | 100.0% |
Occupancy by Ownership by Household Size in Woonsocket
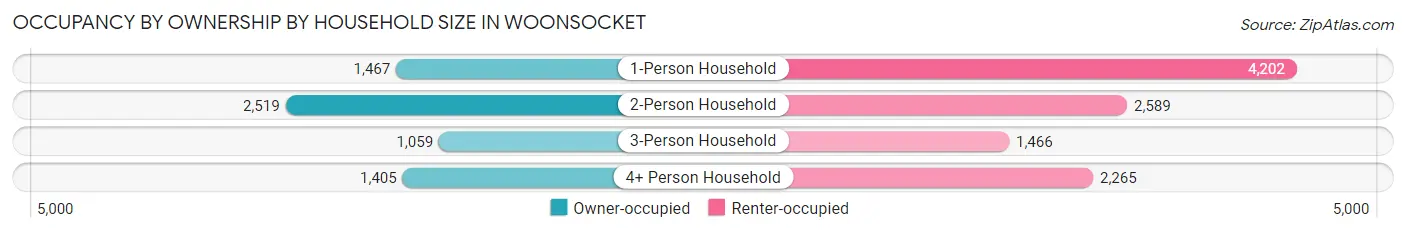
| Household Size | Owner-occupied | Renter-occupied |
| 1-Person Household | 1,467 (25.9%) | 4,202 (74.1%) |
| 2-Person Household | 2,519 (49.3%) | 2,589 (50.7%) |
| 3-Person Household | 1,059 (41.9%) | 1,466 (58.1%) |
| 4+ Person Household | 1,405 (38.3%) | 2,265 (61.7%) |
| Total Housing Units | 6,450 (38.0%) | 10,522 (62.0%) |
Occupancy by Educational Attainment in Woonsocket
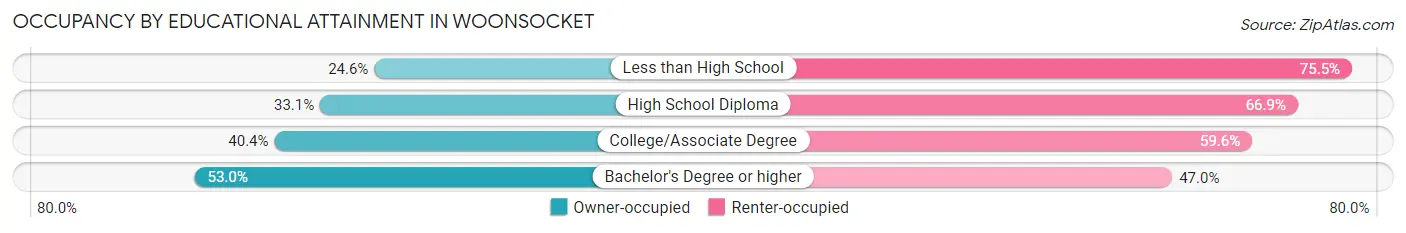
| Household Size | Owner-occupied | Renter-occupied |
| Less than High School | 611 (24.5%) | 1,878 (75.4%) |
| High School Diploma | 1,980 (33.1%) | 3,994 (66.9%) |
| College/Associate Degree | 2,089 (40.4%) | 3,083 (59.6%) |
| Bachelor's Degree or higher | 1,770 (53.0%) | 1,567 (47.0%) |
Occupancy by Age of Householder in Woonsocket
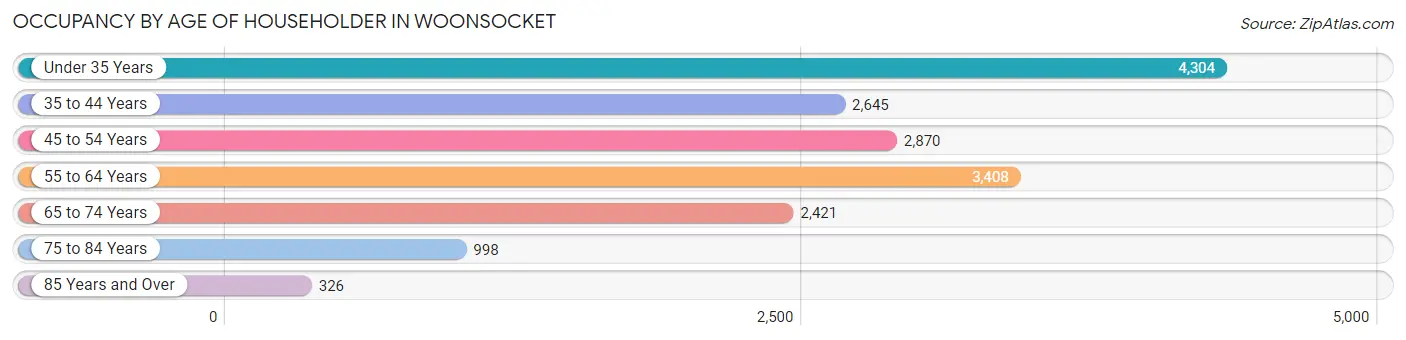
| Age Bracket | # Households | % Households |
| Under 35 Years | 4,304 | 25.4% |
| 35 to 44 Years | 2,645 | 15.6% |
| 45 to 54 Years | 2,870 | 16.9% |
| 55 to 64 Years | 3,408 | 20.1% |
| 65 to 74 Years | 2,421 | 14.3% |
| 75 to 84 Years | 998 | 5.9% |
| 85 Years and Over | 326 | 1.9% |
| Total | 16,972 | 100.0% |
Housing Finances in Woonsocket
Median Income by Occupancy in Woonsocket
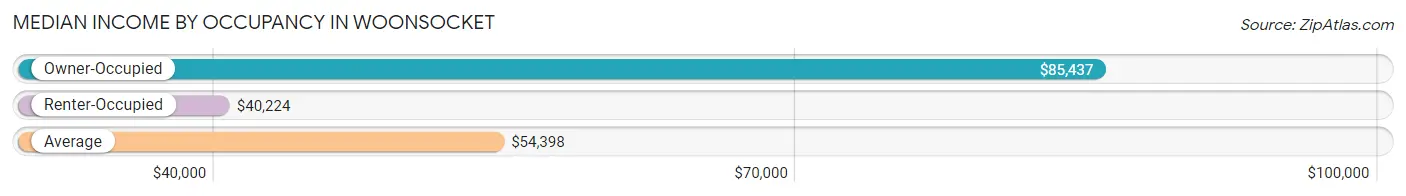
| Occupancy Type | # Households | Median Income |
| Owner-Occupied | 6,450 (38.0%) | $85,437 |
| Renter-Occupied | 10,522 (62.0%) | $40,224 |
| Average | 16,972 (100.0%) | $54,398 |
Occupancy by Householder Income Bracket in Woonsocket
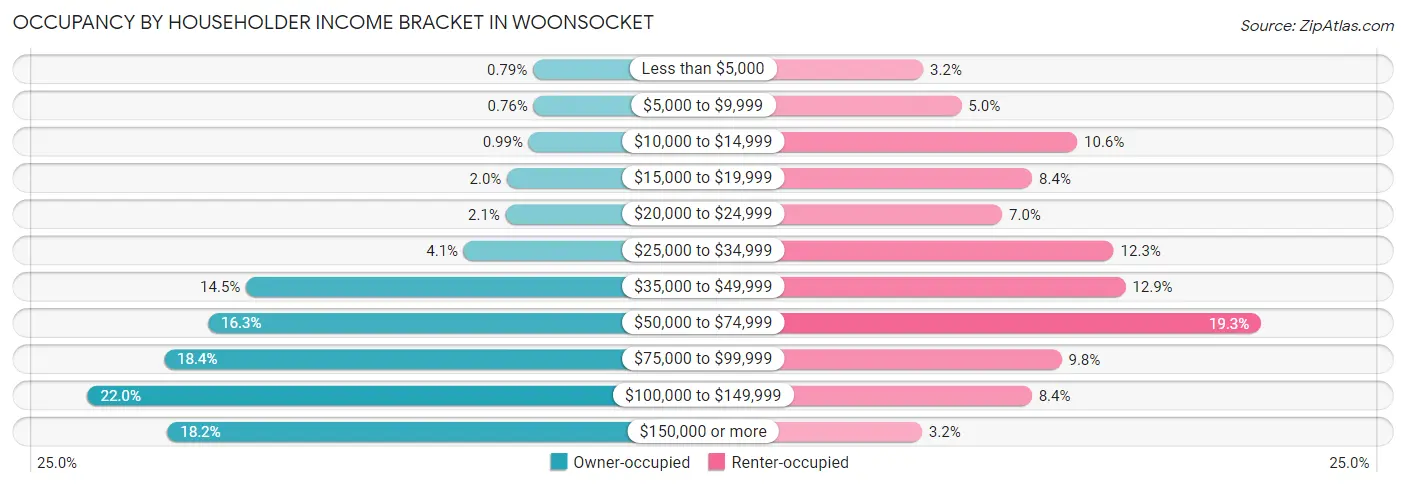
| Income Bracket | Owner-occupied | Renter-occupied |
| Less than $5,000 | 51 (0.8%) | 339 (3.2%) |
| $5,000 to $9,999 | 49 (0.8%) | 530 (5.0%) |
| $10,000 to $14,999 | 64 (1.0%) | 1,110 (10.5%) |
| $15,000 to $19,999 | 130 (2.0%) | 885 (8.4%) |
| $20,000 to $24,999 | 135 (2.1%) | 734 (7.0%) |
| $25,000 to $34,999 | 263 (4.1%) | 1,293 (12.3%) |
| $35,000 to $49,999 | 932 (14.4%) | 1,352 (12.9%) |
| $50,000 to $74,999 | 1,049 (16.3%) | 2,032 (19.3%) |
| $75,000 to $99,999 | 1,184 (18.4%) | 1,032 (9.8%) |
| $100,000 to $149,999 | 1,419 (22.0%) | 883 (8.4%) |
| $150,000 or more | 1,174 (18.2%) | 332 (3.2%) |
| Total | 6,450 (100.0%) | 10,522 (100.0%) |
Monthly Housing Cost Tiers in Woonsocket
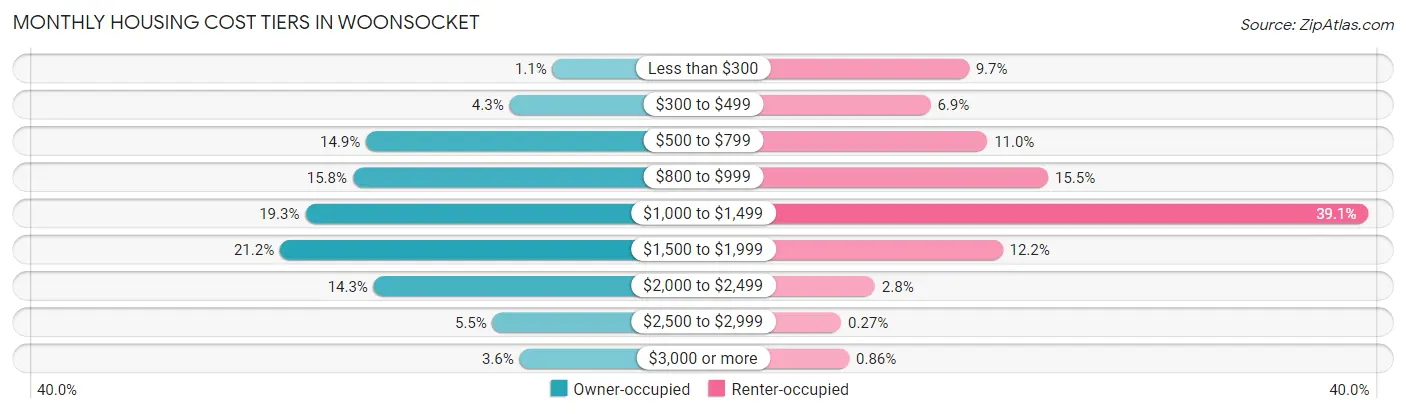
| Monthly Cost | Owner-occupied | Renter-occupied |
| Less than $300 | 72 (1.1%) | 1,018 (9.7%) |
| $300 to $499 | 277 (4.3%) | 721 (6.9%) |
| $500 to $799 | 958 (14.8%) | 1,161 (11.0%) |
| $800 to $999 | 1,021 (15.8%) | 1,632 (15.5%) |
| $1,000 to $1,499 | 1,247 (19.3%) | 4,113 (39.1%) |
| $1,500 to $1,999 | 1,367 (21.2%) | 1,280 (12.2%) |
| $2,000 to $2,499 | 922 (14.3%) | 290 (2.8%) |
| $2,500 to $2,999 | 357 (5.5%) | 28 (0.3%) |
| $3,000 or more | 229 (3.5%) | 90 (0.9%) |
| Total | 6,450 (100.0%) | 10,522 (100.0%) |
Physical Housing Characteristics in Woonsocket
Housing Structures in Woonsocket
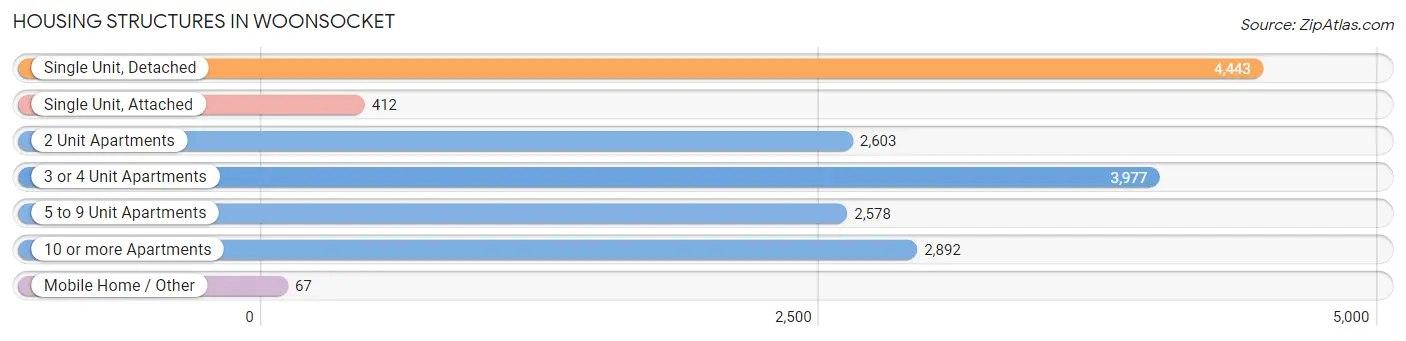
| Structure Type | # Housing Units | % Housing Units |
| Single Unit, Detached | 4,443 | 26.2% |
| Single Unit, Attached | 412 | 2.4% |
| 2 Unit Apartments | 2,603 | 15.3% |
| 3 or 4 Unit Apartments | 3,977 | 23.4% |
| 5 to 9 Unit Apartments | 2,578 | 15.2% |
| 10 or more Apartments | 2,892 | 17.0% |
| Mobile Home / Other | 67 | 0.4% |
| Total | 16,972 | 100.0% |
Housing Structures by Occupancy in Woonsocket
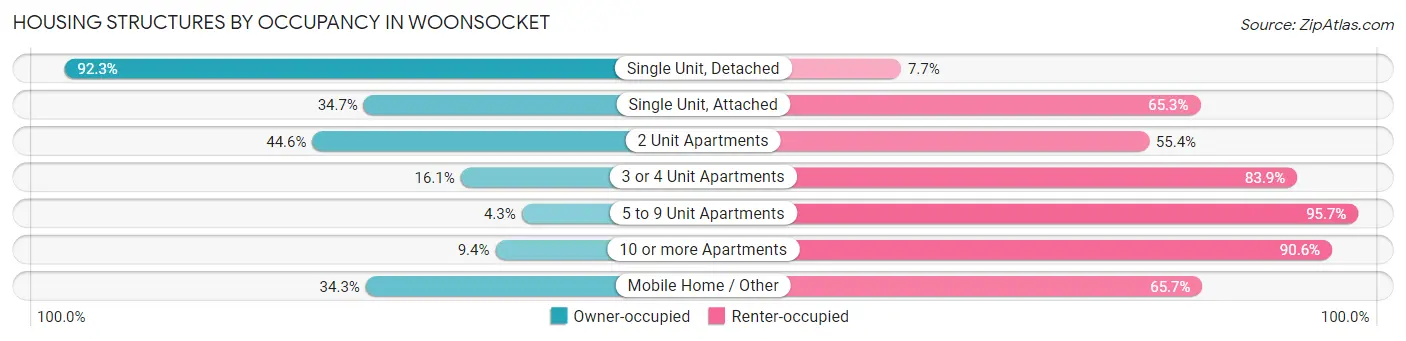
| Structure Type | Owner-occupied | Renter-occupied |
| Single Unit, Detached | 4,102 (92.3%) | 341 (7.7%) |
| Single Unit, Attached | 143 (34.7%) | 269 (65.3%) |
| 2 Unit Apartments | 1,161 (44.6%) | 1,442 (55.4%) |
| 3 or 4 Unit Apartments | 639 (16.1%) | 3,338 (83.9%) |
| 5 to 9 Unit Apartments | 111 (4.3%) | 2,467 (95.7%) |
| 10 or more Apartments | 271 (9.4%) | 2,621 (90.6%) |
| Mobile Home / Other | 23 (34.3%) | 44 (65.7%) |
| Total | 6,450 (38.0%) | 10,522 (62.0%) |
Housing Structures by Number of Rooms in Woonsocket
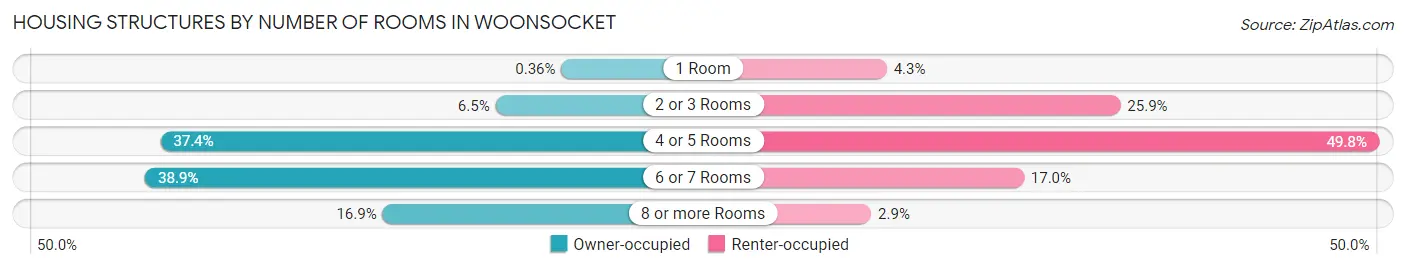
| Number of Rooms | Owner-occupied | Renter-occupied |
| 1 Room | 23 (0.4%) | 456 (4.3%) |
| 2 or 3 Rooms | 416 (6.5%) | 2,729 (25.9%) |
| 4 or 5 Rooms | 2,415 (37.4%) | 5,243 (49.8%) |
| 6 or 7 Rooms | 2,506 (38.9%) | 1,790 (17.0%) |
| 8 or more Rooms | 1,090 (16.9%) | 304 (2.9%) |
| Total | 6,450 (100.0%) | 10,522 (100.0%) |
Housing Structure by Heating Type in Woonsocket
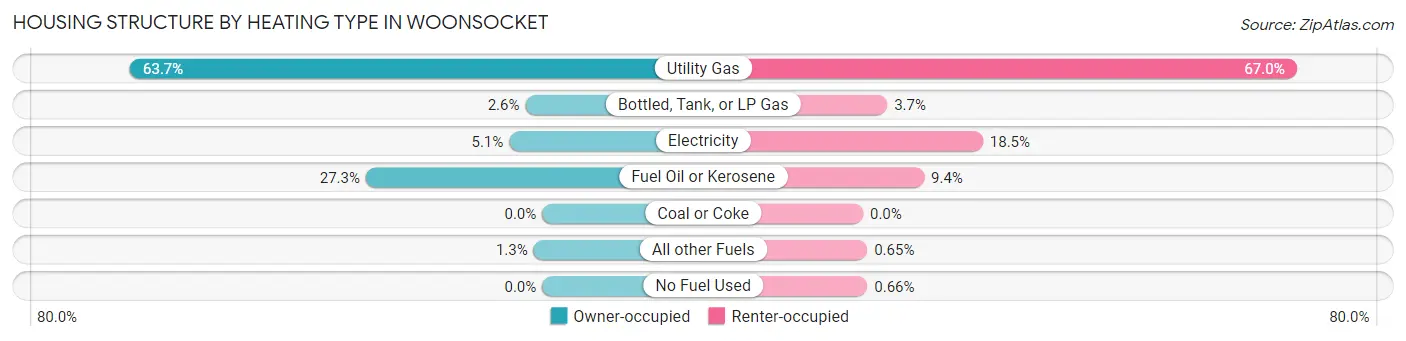
| Heating Type | Owner-occupied | Renter-occupied |
| Utility Gas | 4,110 (63.7%) | 7,050 (67.0%) |
| Bottled, Tank, or LP Gas | 168 (2.6%) | 393 (3.7%) |
| Electricity | 329 (5.1%) | 1,949 (18.5%) |
| Fuel Oil or Kerosene | 1,758 (27.3%) | 993 (9.4%) |
| Coal or Coke | 0 (0.0%) | 0 (0.0%) |
| All other Fuels | 85 (1.3%) | 68 (0.6%) |
| No Fuel Used | 0 (0.0%) | 69 (0.7%) |
| Total | 6,450 (100.0%) | 10,522 (100.0%) |
Household Vehicle Usage in Woonsocket
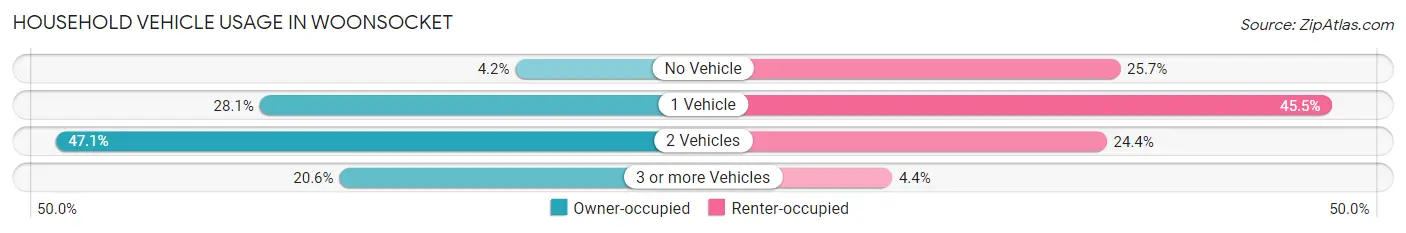
| Vehicles per Household | Owner-occupied | Renter-occupied |
| No Vehicle | 270 (4.2%) | 2,703 (25.7%) |
| 1 Vehicle | 1,810 (28.1%) | 4,787 (45.5%) |
| 2 Vehicles | 3,040 (47.1%) | 2,570 (24.4%) |
| 3 or more Vehicles | 1,330 (20.6%) | 462 (4.4%) |
| Total | 6,450 (100.0%) | 10,522 (100.0%) |
Real Estate & Mortgages in Woonsocket
Real Estate and Mortgage Overview in Woonsocket
| Characteristic | Without Mortgage | With Mortgage |
| Housing Units | 2,309 | 4,141 |
| Median Property Value | $233,700 | $246,000 |
| Median Household Income | $70,114 | $895 |
| Monthly Housing Costs | $790 | $209 |
| Real Estate Taxes | $3,898 | $69 |
Property Value by Mortgage Status in Woonsocket
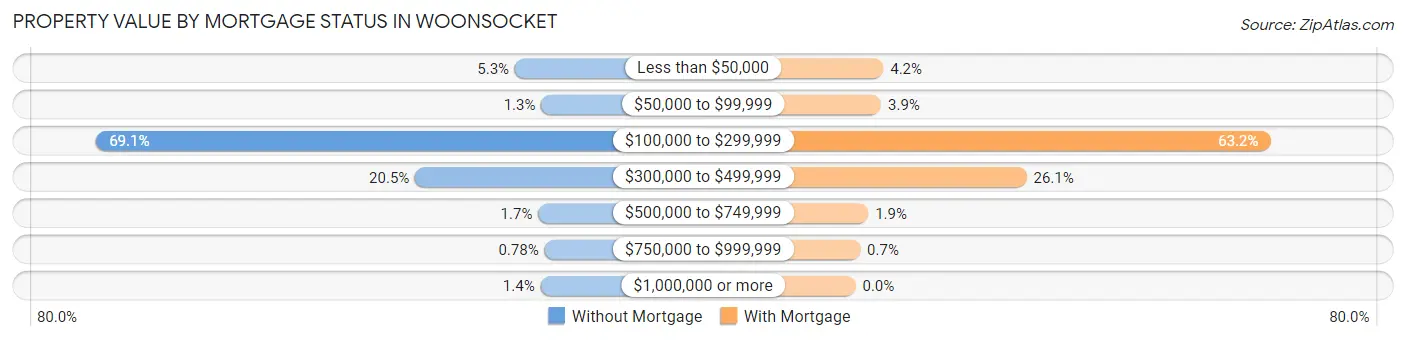
| Property Value | Without Mortgage | With Mortgage |
| Less than $50,000 | 122 (5.3%) | 175 (4.2%) |
| $50,000 to $99,999 | 29 (1.3%) | 161 (3.9%) |
| $100,000 to $299,999 | 1,595 (69.1%) | 2,617 (63.2%) |
| $300,000 to $499,999 | 473 (20.5%) | 1,079 (26.1%) |
| $500,000 to $749,999 | 40 (1.7%) | 80 (1.9%) |
| $750,000 to $999,999 | 18 (0.8%) | 29 (0.7%) |
| $1,000,000 or more | 32 (1.4%) | 0 (0.0%) |
| Total | 2,309 (100.0%) | 4,141 (100.0%) |
Household Income by Mortgage Status in Woonsocket
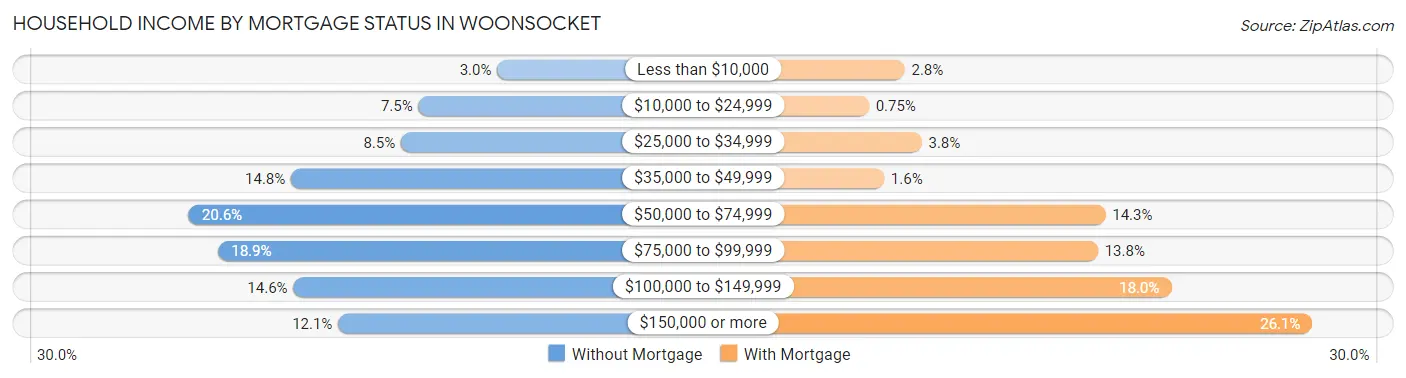
| Household Income | Without Mortgage | With Mortgage |
| Less than $10,000 | 69 (3.0%) | 116 (2.8%) |
| $10,000 to $24,999 | 173 (7.5%) | 31 (0.7%) |
| $25,000 to $34,999 | 196 (8.5%) | 156 (3.8%) |
| $35,000 to $49,999 | 341 (14.8%) | 67 (1.6%) |
| $50,000 to $74,999 | 476 (20.6%) | 591 (14.3%) |
| $75,000 to $99,999 | 437 (18.9%) | 573 (13.8%) |
| $100,000 to $149,999 | 338 (14.6%) | 747 (18.0%) |
| $150,000 or more | 279 (12.1%) | 1,081 (26.1%) |
| Total | 2,309 (100.0%) | 4,141 (100.0%) |
Property Value to Household Income Ratio in Woonsocket
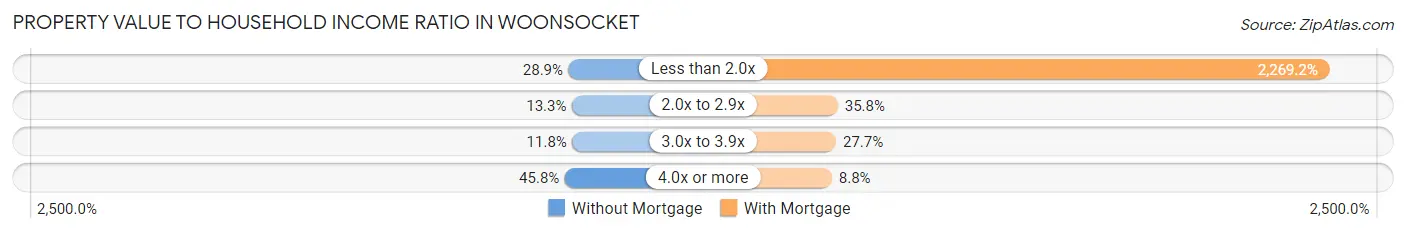
| Value-to-Income Ratio | Without Mortgage | With Mortgage |
| Less than 2.0x | 668 (28.9%) | 93,967 (2,269.2%) |
| 2.0x to 2.9x | 306 (13.3%) | 1,481 (35.8%) |
| 3.0x to 3.9x | 272 (11.8%) | 1,148 (27.7%) |
| 4.0x or more | 1,057 (45.8%) | 366 (8.8%) |
| Total | 2,309 (100.0%) | 4,141 (100.0%) |
Real Estate Taxes by Mortgage Status in Woonsocket
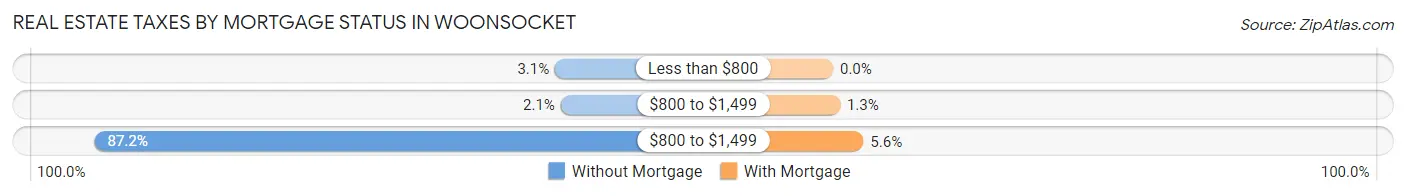
| Property Taxes | Without Mortgage | With Mortgage |
| Less than $800 | 72 (3.1%) | 0 (0.0%) |
| $800 to $1,499 | 48 (2.1%) | 52 (1.3%) |
| $800 to $1,499 | 2,014 (87.2%) | 230 (5.6%) |
| Total | 2,309 (100.0%) | 4,141 (100.0%) |
Health & Disability in Woonsocket
Health Insurance Coverage by Age in Woonsocket
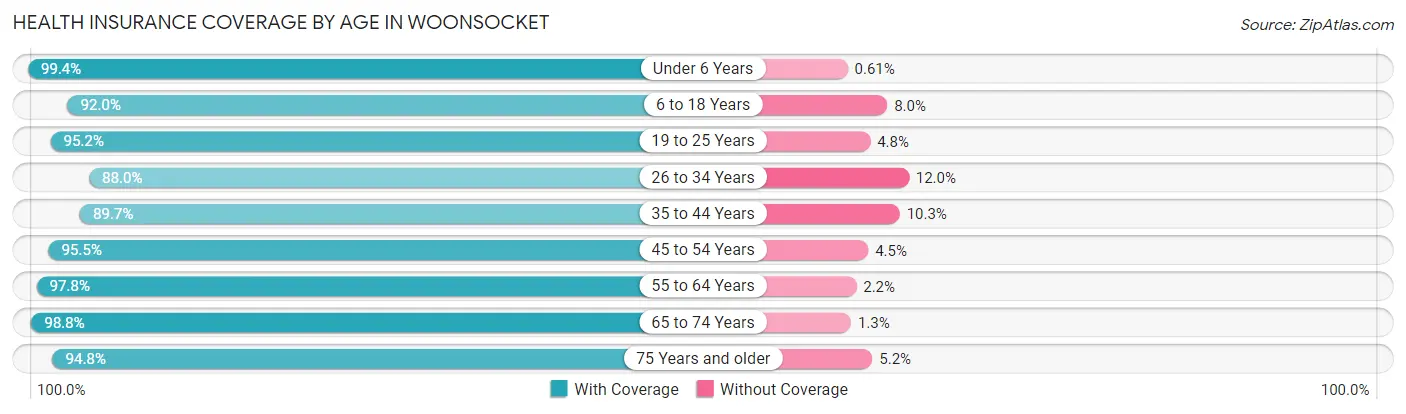
| Age Bracket | With Coverage | Without Coverage |
| Under 6 Years | 3,883 (99.4%) | 24 (0.6%) |
| 6 to 18 Years | 5,984 (92.0%) | 520 (8.0%) |
| 19 to 25 Years | 3,070 (95.2%) | 156 (4.8%) |
| 26 to 34 Years | 6,646 (88.0%) | 909 (12.0%) |
| 35 to 44 Years | 4,488 (89.7%) | 517 (10.3%) |
| 45 to 54 Years | 4,866 (95.5%) | 227 (4.5%) |
| 55 to 64 Years | 5,225 (97.8%) | 119 (2.2%) |
| 65 to 74 Years | 3,548 (98.8%) | 45 (1.3%) |
| 75 Years and older | 2,119 (94.8%) | 117 (5.2%) |
| Total | 39,829 (93.8%) | 2,634 (6.2%) |
Health Insurance Coverage by Citizenship Status in Woonsocket
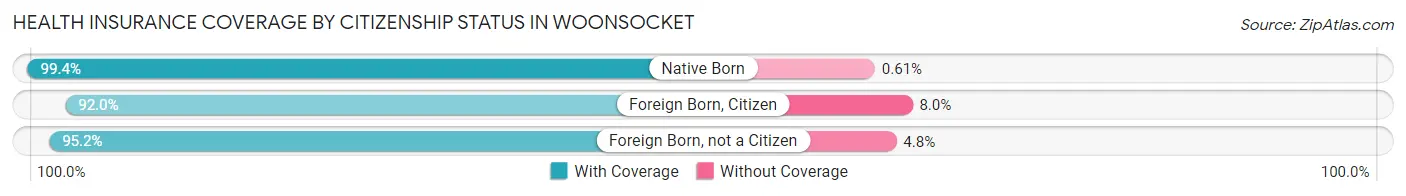
| Citizenship Status | With Coverage | Without Coverage |
| Native Born | 3,883 (99.4%) | 24 (0.6%) |
| Foreign Born, Citizen | 5,984 (92.0%) | 520 (8.0%) |
| Foreign Born, not a Citizen | 3,070 (95.2%) | 156 (4.8%) |
Health Insurance Coverage by Household Income in Woonsocket
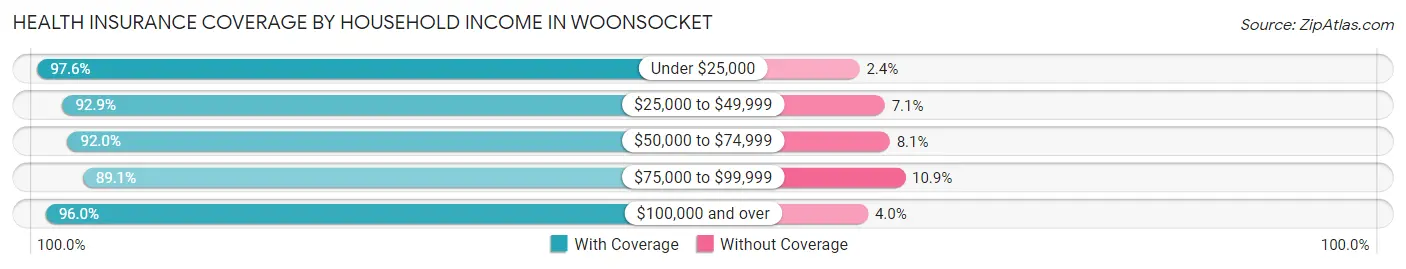
| Household Income | With Coverage | Without Coverage |
| Under $25,000 | 6,472 (97.6%) | 157 (2.4%) |
| $25,000 to $49,999 | 8,778 (92.9%) | 671 (7.1%) |
| $50,000 to $74,999 | 7,120 (91.9%) | 623 (8.1%) |
| $75,000 to $99,999 | 5,798 (89.1%) | 710 (10.9%) |
| $100,000 and over | 11,365 (96.0%) | 469 (4.0%) |
Public vs Private Health Insurance Coverage by Age in Woonsocket
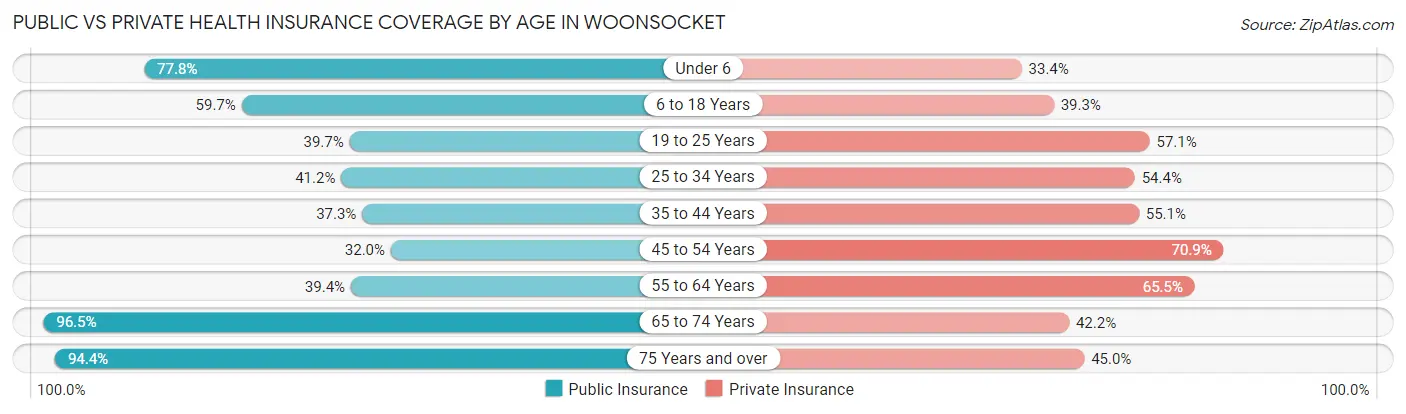
| Age Bracket | Public Insurance | Private Insurance |
| Under 6 | 3,040 (77.8%) | 1,304 (33.4%) |
| 6 to 18 Years | 3,884 (59.7%) | 2,558 (39.3%) |
| 19 to 25 Years | 1,280 (39.7%) | 1,843 (57.1%) |
| 25 to 34 Years | 3,115 (41.2%) | 4,108 (54.4%) |
| 35 to 44 Years | 1,869 (37.3%) | 2,759 (55.1%) |
| 45 to 54 Years | 1,631 (32.0%) | 3,609 (70.9%) |
| 55 to 64 Years | 2,107 (39.4%) | 3,501 (65.5%) |
| 65 to 74 Years | 3,468 (96.5%) | 1,515 (42.2%) |
| 75 Years and over | 2,110 (94.4%) | 1,006 (45.0%) |
| Total | 22,504 (53.0%) | 22,203 (52.3%) |
Disability Status by Sex by Age in Woonsocket
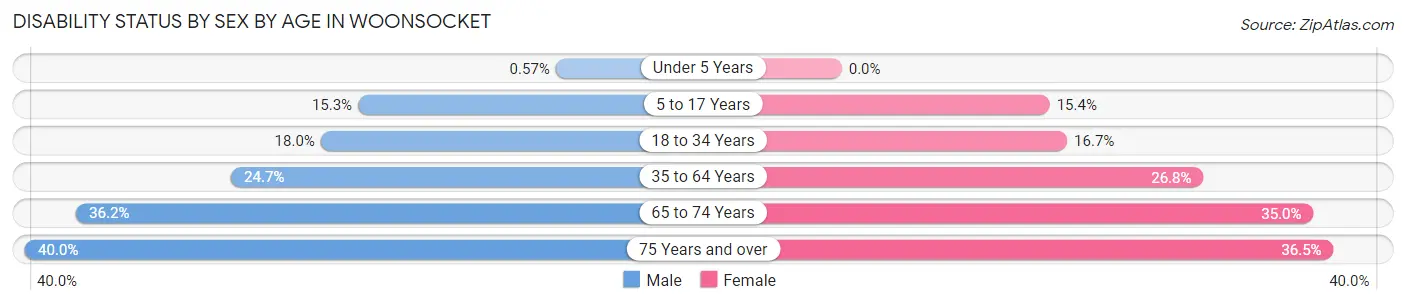
| Age Bracket | Male | Female |
| Under 5 Years | 10 (0.6%) | 0 (0.0%) |
| 5 to 17 Years | 545 (15.2%) | 457 (15.4%) |
| 18 to 34 Years | 1,005 (18.0%) | 930 (16.7%) |
| 35 to 64 Years | 1,807 (24.7%) | 2,178 (26.8%) |
| 65 to 74 Years | 625 (36.2%) | 653 (35.0%) |
| 75 Years and over | 368 (40.0%) | 480 (36.5%) |
Disability Class by Sex by Age in Woonsocket
Disability Class: Hearing Difficulty
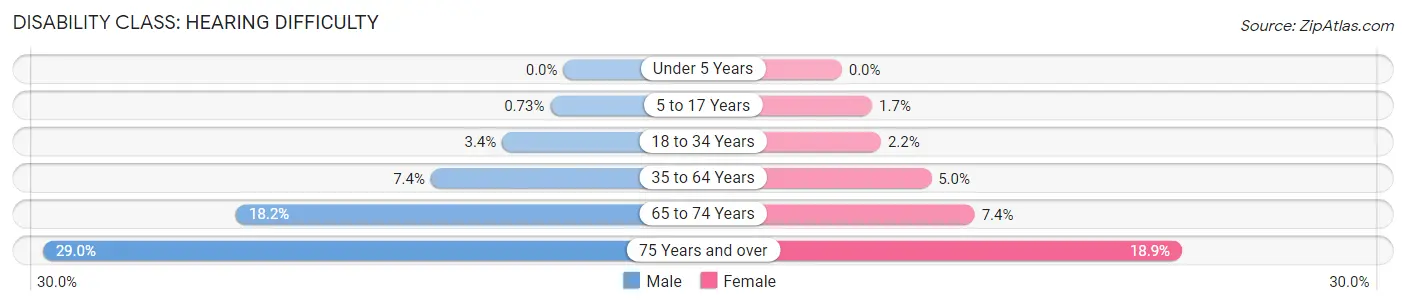
| Age Bracket | Male | Female |
| Under 5 Years | 0 (0.0%) | 0 (0.0%) |
| 5 to 17 Years | 26 (0.7%) | 50 (1.7%) |
| 18 to 34 Years | 190 (3.4%) | 121 (2.2%) |
| 35 to 64 Years | 541 (7.4%) | 404 (5.0%) |
| 65 to 74 Years | 315 (18.2%) | 138 (7.4%) |
| 75 Years and over | 267 (29.0%) | 249 (18.9%) |
Disability Class: Vision Difficulty
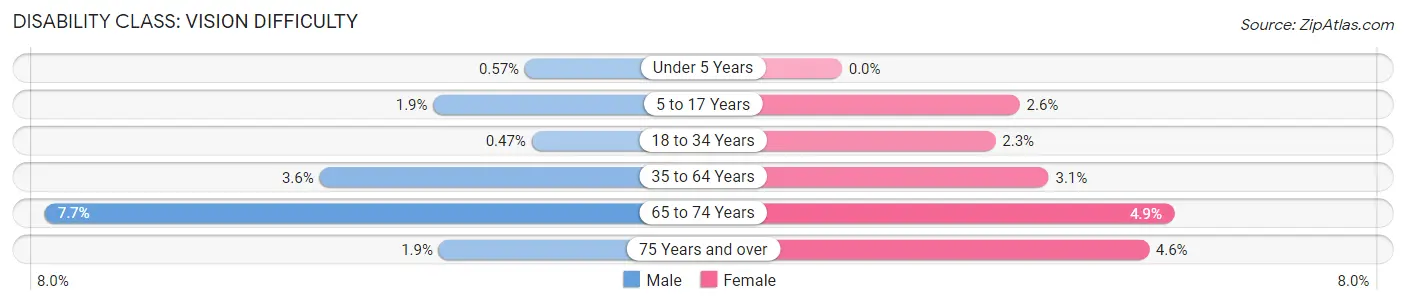
| Age Bracket | Male | Female |
| Under 5 Years | 10 (0.6%) | 0 (0.0%) |
| 5 to 17 Years | 69 (1.9%) | 78 (2.6%) |
| 18 to 34 Years | 26 (0.5%) | 127 (2.3%) |
| 35 to 64 Years | 265 (3.6%) | 249 (3.1%) |
| 65 to 74 Years | 133 (7.7%) | 92 (4.9%) |
| 75 Years and over | 17 (1.8%) | 60 (4.6%) |
Disability Class: Cognitive Difficulty
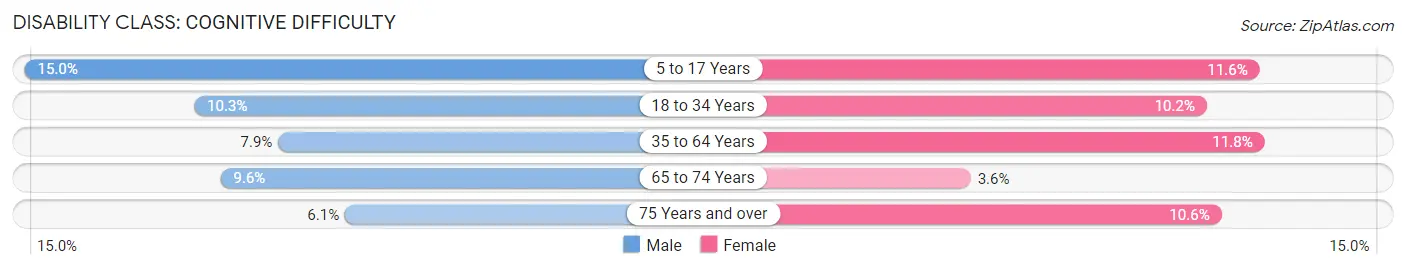
| Age Bracket | Male | Female |
| 5 to 17 Years | 536 (15.0%) | 344 (11.6%) |
| 18 to 34 Years | 573 (10.3%) | 565 (10.2%) |
| 35 to 64 Years | 582 (7.9%) | 955 (11.8%) |
| 65 to 74 Years | 165 (9.6%) | 67 (3.6%) |
| 75 Years and over | 56 (6.1%) | 139 (10.6%) |
Disability Class: Ambulatory Difficulty
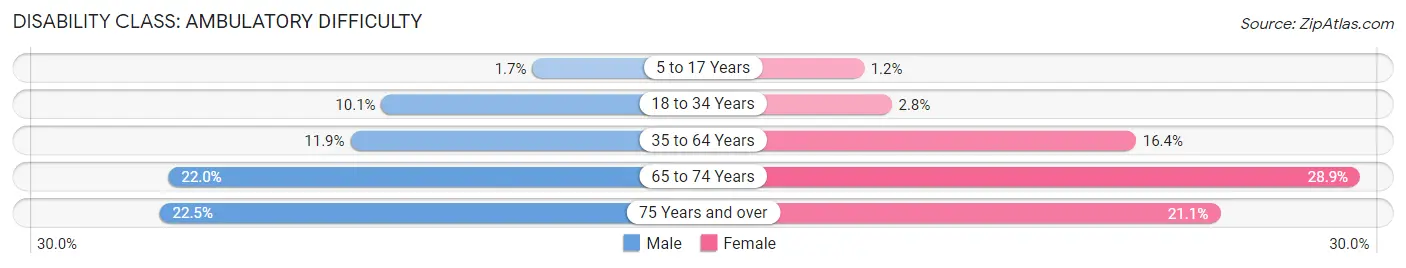
| Age Bracket | Male | Female |
| 5 to 17 Years | 62 (1.7%) | 36 (1.2%) |
| 18 to 34 Years | 565 (10.1%) | 154 (2.8%) |
| 35 to 64 Years | 869 (11.9%) | 1,328 (16.4%) |
| 65 to 74 Years | 380 (22.0%) | 538 (28.8%) |
| 75 Years and over | 207 (22.5%) | 277 (21.1%) |
Disability Class: Self-Care Difficulty
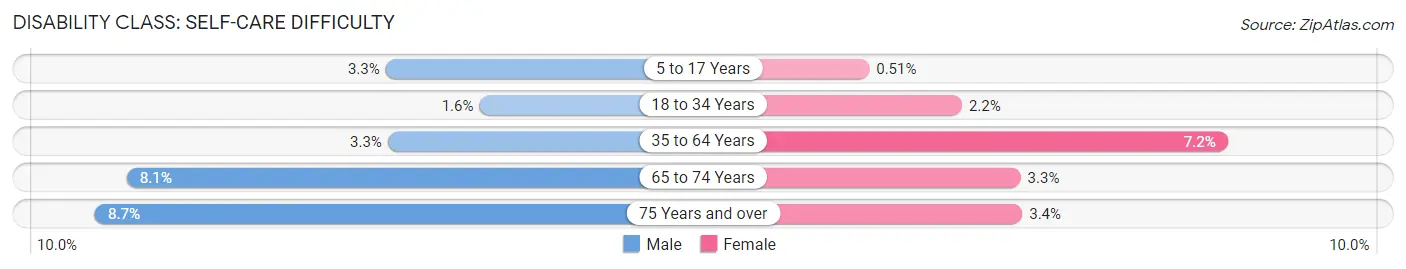
| Age Bracket | Male | Female |
| 5 to 17 Years | 118 (3.3%) | 15 (0.5%) |
| 18 to 34 Years | 87 (1.6%) | 124 (2.2%) |
| 35 to 64 Years | 239 (3.3%) | 581 (7.2%) |
| 65 to 74 Years | 140 (8.1%) | 62 (3.3%) |
| 75 Years and over | 80 (8.7%) | 44 (3.4%) |
Technology Access in Woonsocket
Computing Device Access in Woonsocket
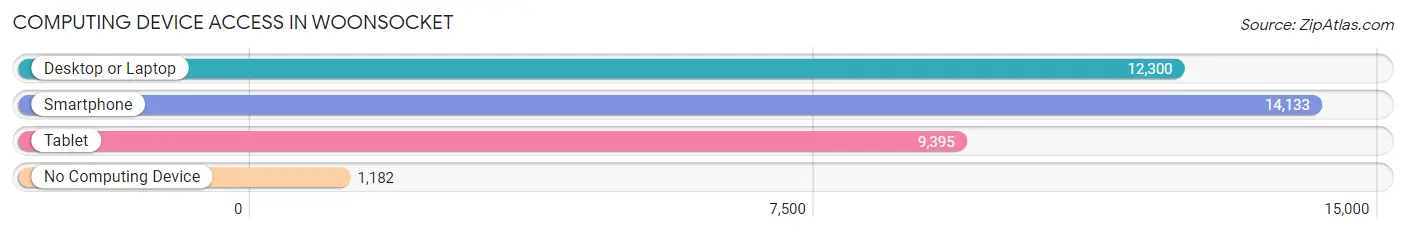
| Device Type | # Households | % Households |
| Desktop or Laptop | 12,300 | 72.5% |
| Smartphone | 14,133 | 83.3% |
| Tablet | 9,395 | 55.4% |
| No Computing Device | 1,182 | 7.0% |
| Total | 16,972 | 100.0% |
Internet Access in Woonsocket
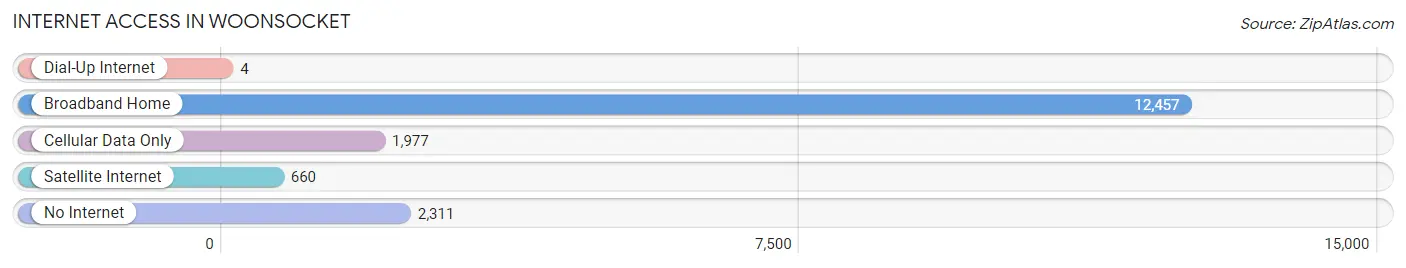
| Internet Type | # Households | % Households |
| Dial-Up Internet | 4 | 0.0% |
| Broadband Home | 12,457 | 73.4% |
| Cellular Data Only | 1,977 | 11.7% |
| Satellite Internet | 660 | 3.9% |
| No Internet | 2,311 | 13.6% |
| Total | 16,972 | 100.0% |
Woonsocket Summary
Woonsocket, Rhode Island is a city located in Providence County, Rhode Island. It is the sixth largest city in the state, with a population of 41,186 as of the 2010 census. The city is situated on the Blackstone River, and is part of the Providence metropolitan area.
History
The area that is now Woonsocket was originally inhabited by the Nipmuc tribe, who called the area “Quinsigamond”. The first European settlers arrived in the area in 1661, and the town was officially incorporated in 1867. The city was named after the Woonsocket Falls, which were named after the Woonsocket tribe, a branch of the Nipmuc.
The city was an important industrial center in the 19th and 20th centuries, with the first cotton mill being built in 1810. The city was also home to several other mills, including the Woonsocket Cotton Mill, which was the largest cotton mill in the world at the time. The city was also home to several other industries, including the American Woolen Company, which was the largest woolen mill in the world.
Geography
Woonsocket is located in northern Rhode Island, in Providence County. It is situated on the Blackstone River, and is bordered by the towns of Cumberland, North Smithfield, and Lincoln. The city has a total area of 11.3 square miles, of which 11.2 square miles is land and 0.1 square miles is water.
The city is located in a hilly region, with the highest point being the summit of Woonsocket Hill, which is located at an elevation of 545 feet. The city is also home to several parks, including the Woonsocket Greenway, which is a 4.5 mile long linear park that follows the Blackstone River.
Economy
Woonsocket’s economy is largely based on manufacturing and services. The city is home to several large companies, including CVS Health, which is the largest pharmacy chain in the United States. The city is also home to several other companies, including the American Woolen Company, which is a manufacturer of woolen fabrics.
The city is also home to several educational institutions, including the Community College of Rhode Island, which is the state’s only public two-year college. The city is also home to several hospitals, including Landmark Medical Center, which is the largest hospital in the city.
Demographics
As of the 2010 census, the population of Woonsocket was 41,186. The racial makeup of the city was 79.2% White, 8.3% African American, 0.4% Native American, 1.2% Asian, 0.1% Pacific Islander, 8.3% from other races, and 2.5% from two or more races. Hispanic or Latino of any race were 16.3% of the population.
The median income for a household in the city was $37,837, and the median income for a family was $45,945. The per capita income for the city was $19,945. About 14.3% of families and 17.2% of the population were below the poverty line, including 25.2% of those under age 18 and 11.2% of those age 65 or over.
Woonsocket is a city with a rich history and a diverse population. It is home to several large companies, educational institutions, and hospitals, and is an important part of the Providence metropolitan area. The city has a strong economy and a vibrant culture, and is a great place to live and work.
Common Questions
What is Per Capita Income in Woonsocket?
Per Capita income in Woonsocket is $29,142.
What is the Median Family Income in Woonsocket?
Median Family Income in Woonsocket is $64,192.
What is the Median Household income in Woonsocket?
Median Household Income in Woonsocket is $54,398.
What is Income or Wage Gap in Woonsocket?
Income or Wage Gap in Woonsocket is 27.8%.
Women in Woonsocket earn 72.2 cents for every dollar earned by a man.
What is Family Income Deficit in Woonsocket?
Family Income Deficit in Woonsocket is $10,968.
Families that are below poverty line in Woonsocket earn $10,968 less on average than the poverty threshold level.
What is Inequality or Gini Index in Woonsocket?
Inequality or Gini Index in Woonsocket is 0.45.
What is the Total Population of Woonsocket?
Total Population of Woonsocket is 43,029.
What is the Total Male Population of Woonsocket?
Total Male Population of Woonsocket is 21,062.
What is the Total Female Population of Woonsocket?
Total Female Population of Woonsocket is 21,967.
What is the Ratio of Males per 100 Females in Woonsocket?
There are 95.88 Males per 100 Females in Woonsocket.
What is the Ratio of Females per 100 Males in Woonsocket?
There are 104.30 Females per 100 Males in Woonsocket.
What is the Median Population Age in Woonsocket?
Median Population Age in Woonsocket is 35.3 Years.
What is the Average Family Size in Woonsocket
Average Family Size in Woonsocket is 3.2 People.
What is the Average Household Size in Woonsocket
Average Household Size in Woonsocket is 2.5 People.
How Large is the Labor Force in Woonsocket?
There are 21,383 People in the Labor Forcein in Woonsocket.
What is the Percentage of People in the Labor Force in Woonsocket?
62.9% of People are in the Labor Force in Woonsocket.
What is the Unemployment Rate in Woonsocket?
Unemployment Rate in Woonsocket is 8.9%.