Thornton, CO Map & Demographics
Thornton Map
Thornton Overview
$38,876
PER CAPITA INCOME
$106,963
AVG FAMILY INCOME
$95,064
AVG HOUSEHOLD INCOME
28.8%
WAGE / INCOME GAP [ % ]
71.2¢/ $1
WAGE / INCOME GAP [ $ ]
$11,625
FAMILY INCOME DEFICIT
0.37
INEQUALITY / GINI INDEX
141,799
TOTAL POPULATION
71,197
MALE POPULATION
70,602
FEMALE POPULATION
100.84
MALES / 100 FEMALES
99.16
FEMALES / 100 MALES
33.7
MEDIAN AGE
3.4
AVG FAMILY SIZE
2.9
AVG HOUSEHOLD SIZE
80,413
LABOR FORCE [ PEOPLE ]
74.3%
PERCENT IN LABOR FORCE
4.6%
UNEMPLOYMENT RATE
Thornton Zip Codes
Income in Thornton
Income Overview in Thornton
Per Capita Income in Thornton is $38,876, while median incomes of families and households are $106,963 and $95,064 respectively.
| Characteristic | Number | Measure |
| Per Capita Income | 141,799 | $38,876 |
| Median Family Income | 34,603 | $106,963 |
| Mean Family Income | 34,603 | $122,918 |
| Median Household Income | 48,466 | $95,064 |
| Mean Household Income | 48,466 | $111,717 |
| Income Deficit | 34,603 | $11,625 |
| Wage / Income Gap (%) | 141,799 | 28.76% |
| Wage / Income Gap ($) | 141,799 | 71.24¢ per $1 |
| Gini / Inequality Index | 141,799 | 0.37 |
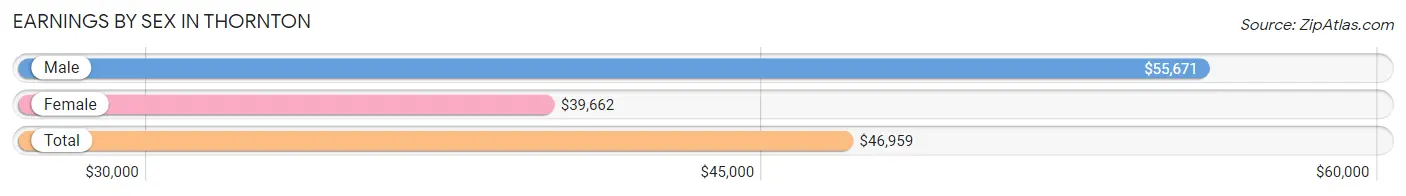
Earnings by Sex in Thornton
Average Earnings in Thornton are $46,959, $55,671 for men and $39,662 for women, a difference of 28.8%.
| Sex | Number | Average Earnings |
| Male | 44,555 (53.6%) | $55,671 |
| Female | 38,550 (46.4%) | $39,662 |
| Total | 83,105 (100.0%) | $46,959 |
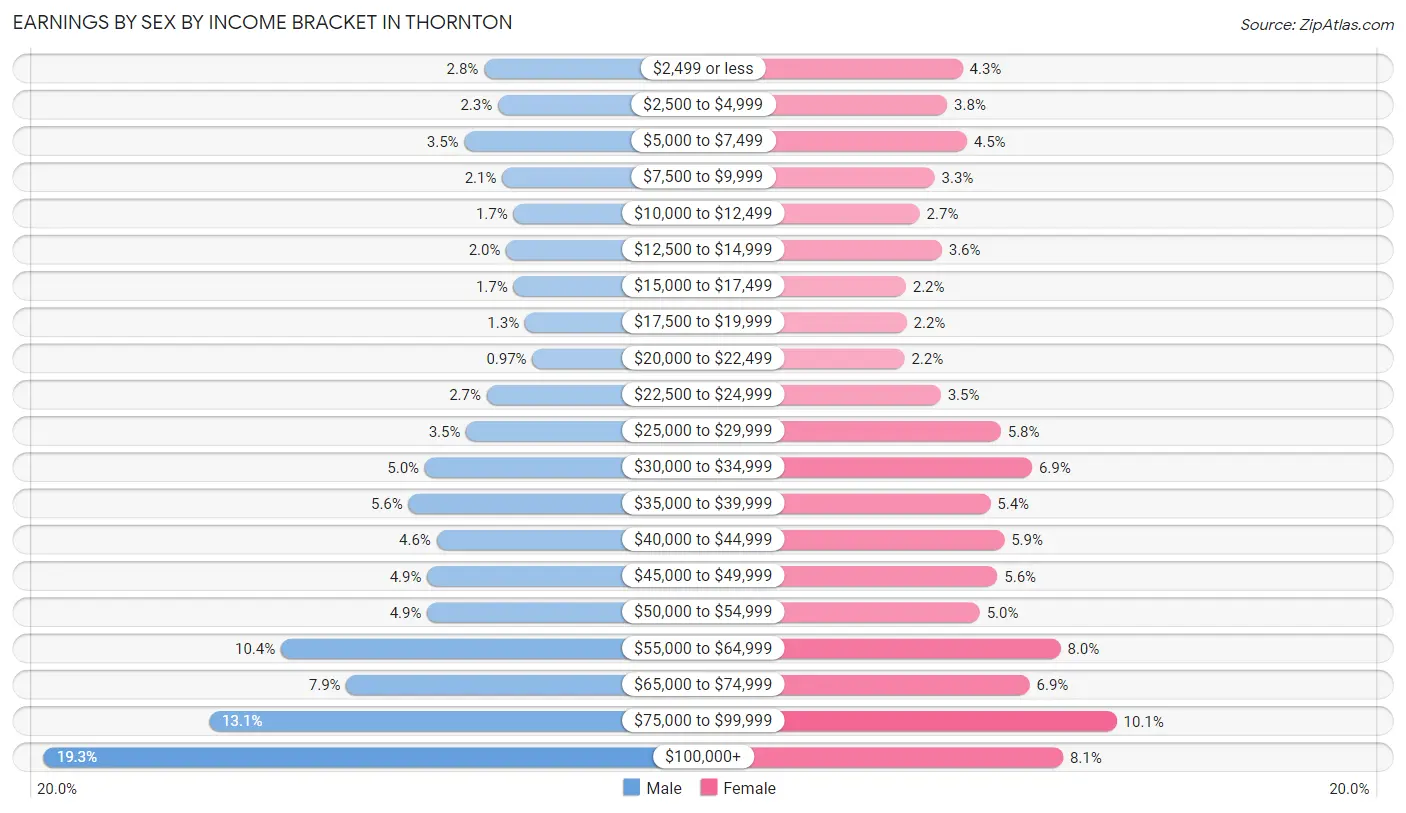
Earnings by Sex by Income Bracket in Thornton
The most common earnings brackets in Thornton are $100,000+ for men (8,591 | 19.3%) and $75,000 to $99,999 for women (3,899 | 10.1%).
| Income | Male | Female |
| $2,499 or less | 1,239 (2.8%) | 1,673 (4.3%) |
| $2,500 to $4,999 | 1,007 (2.3%) | 1,448 (3.8%) |
| $5,000 to $7,499 | 1,567 (3.5%) | 1,736 (4.5%) |
| $7,500 to $9,999 | 935 (2.1%) | 1,270 (3.3%) |
| $10,000 to $12,499 | 750 (1.7%) | 1,052 (2.7%) |
| $12,500 to $14,999 | 868 (1.9%) | 1,373 (3.6%) |
| $15,000 to $17,499 | 750 (1.7%) | 852 (2.2%) |
| $17,500 to $19,999 | 555 (1.3%) | 863 (2.2%) |
| $20,000 to $22,499 | 430 (1.0%) | 833 (2.2%) |
| $22,500 to $24,999 | 1,193 (2.7%) | 1,357 (3.5%) |
| $25,000 to $29,999 | 1,538 (3.5%) | 2,223 (5.8%) |
| $30,000 to $34,999 | 2,228 (5.0%) | 2,675 (6.9%) |
| $35,000 to $39,999 | 2,500 (5.6%) | 2,073 (5.4%) |
| $40,000 to $44,999 | 2,031 (4.6%) | 2,275 (5.9%) |
| $45,000 to $49,999 | 2,187 (4.9%) | 2,175 (5.6%) |
| $50,000 to $54,999 | 2,187 (4.9%) | 1,921 (5.0%) |
| $55,000 to $64,999 | 4,631 (10.4%) | 3,086 (8.0%) |
| $65,000 to $74,999 | 3,536 (7.9%) | 2,642 (6.9%) |
| $75,000 to $99,999 | 5,832 (13.1%) | 3,899 (10.1%) |
| $100,000+ | 8,591 (19.3%) | 3,124 (8.1%) |
| Total | 44,555 (100.0%) | 38,550 (100.0%) |
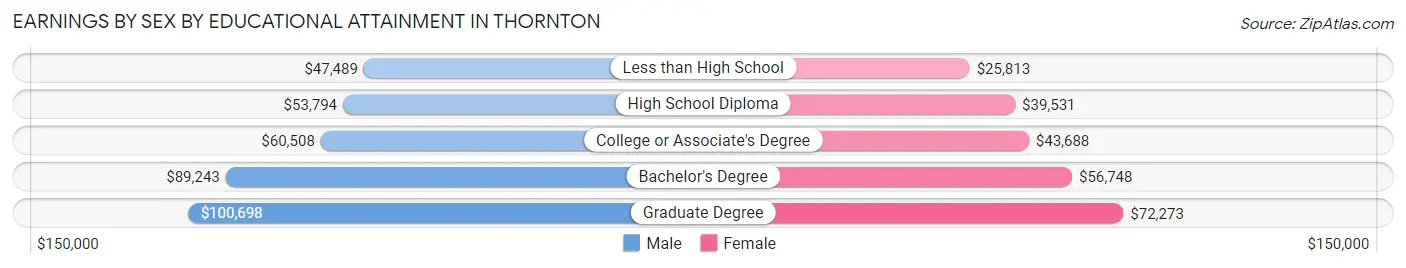
Earnings by Sex by Educational Attainment in Thornton
Average earnings in Thornton are $61,686 for men and $46,187 for women, a difference of 25.1%. Men with an educational attainment of graduate degree enjoy the highest average annual earnings of $100,698, while those with less than high school education earn the least with $47,489. Women with an educational attainment of graduate degree earn the most with the average annual earnings of $72,273, while those with less than high school education have the smallest earnings of $25,813.
| Educational Attainment | Male Income | Female Income |
| Less than High School | $47,489 | $25,813 |
| High School Diploma | $53,794 | $39,531 |
| College or Associate's Degree | $60,508 | $43,688 |
| Bachelor's Degree | $89,243 | $56,748 |
| Graduate Degree | $100,698 | $72,273 |
| Total | $61,686 | $46,187 |
Family Income in Thornton
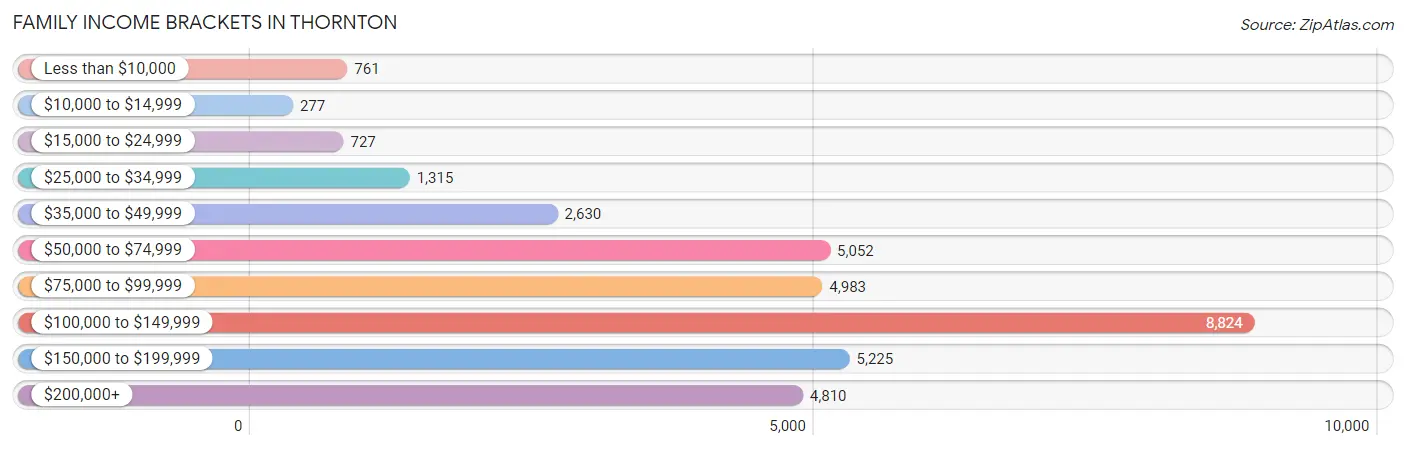
Family Income Brackets in Thornton
According to the Thornton family income data, there are 8,824 families falling into the $100,000 to $149,999 income range, which is the most common income bracket and makes up 25.5% of all families. Conversely, the $10,000 to $14,999 income bracket is the least frequent group with only 277 families (0.8%) belonging to this category.
| Income Bracket | # Families | % Families |
| Less than $10,000 | 761 | 2.2% |
| $10,000 to $14,999 | 277 | 0.8% |
| $15,000 to $24,999 | 727 | 2.1% |
| $25,000 to $34,999 | 1,315 | 3.8% |
| $35,000 to $49,999 | 2,630 | 7.6% |
| $50,000 to $74,999 | 5,052 | 14.6% |
| $75,000 to $99,999 | 4,983 | 14.4% |
| $100,000 to $149,999 | 8,824 | 25.5% |
| $150,000 to $199,999 | 5,225 | 15.1% |
| $200,000+ | 4,810 | 13.9% |
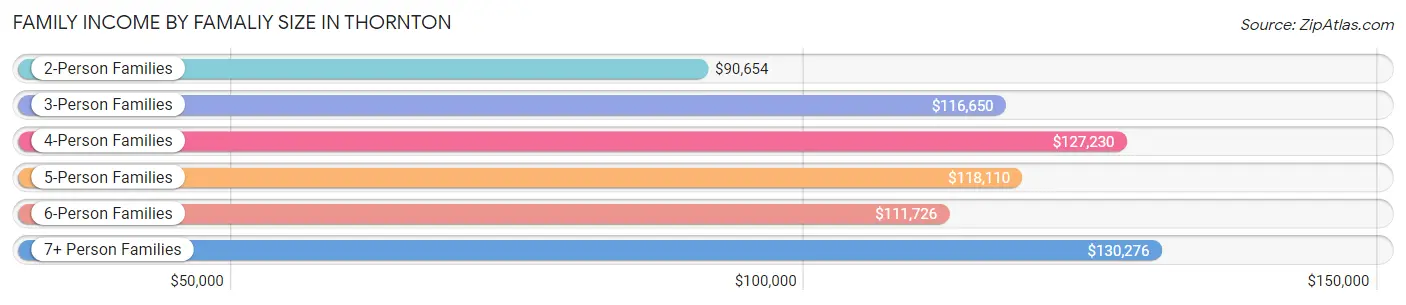
Family Income by Famaliy Size in Thornton
7+ person families (627 | 1.8%) account for the highest median family income in Thornton with $130,276 per family, while 2-person families (13,040 | 37.7%) have the highest median income of $45,327 per family member.
| Income Bracket | # Families | Median Income |
| 2-Person Families | 13,040 (37.7%) | $90,654 |
| 3-Person Families | 8,387 (24.2%) | $116,650 |
| 4-Person Families | 6,999 (20.2%) | $127,230 |
| 5-Person Families | 3,487 (10.1%) | $118,110 |
| 6-Person Families | 2,063 (6.0%) | $111,726 |
| 7+ Person Families | 627 (1.8%) | $130,276 |
| Total | 34,603 (100.0%) | $106,963 |
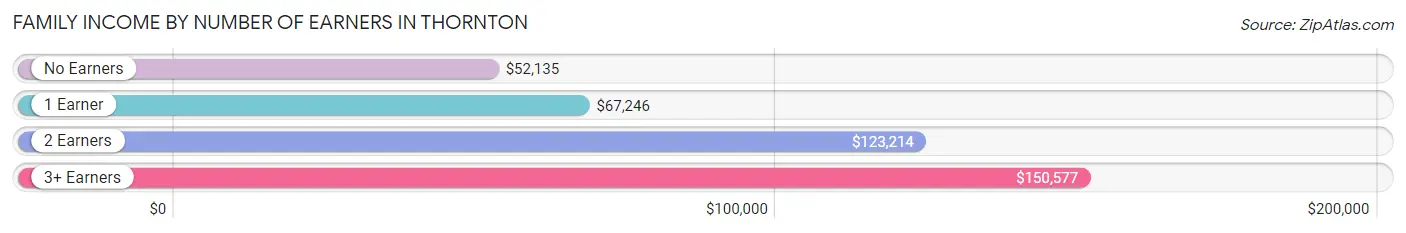
Family Income by Number of Earners in Thornton
The median family income in Thornton is $106,963, with families comprising 3+ earners (5,892) having the highest median family income of $150,577, while families with no earners (2,526) have the lowest median family income of $52,135, accounting for 17.0% and 7.3% of families, respectively.
| Number of Earners | # Families | Median Income |
| No Earners | 2,526 (7.3%) | $52,135 |
| 1 Earner | 9,375 (27.1%) | $67,246 |
| 2 Earners | 16,810 (48.6%) | $123,214 |
| 3+ Earners | 5,892 (17.0%) | $150,577 |
| Total | 34,603 (100.0%) | $106,963 |
Household Income in Thornton
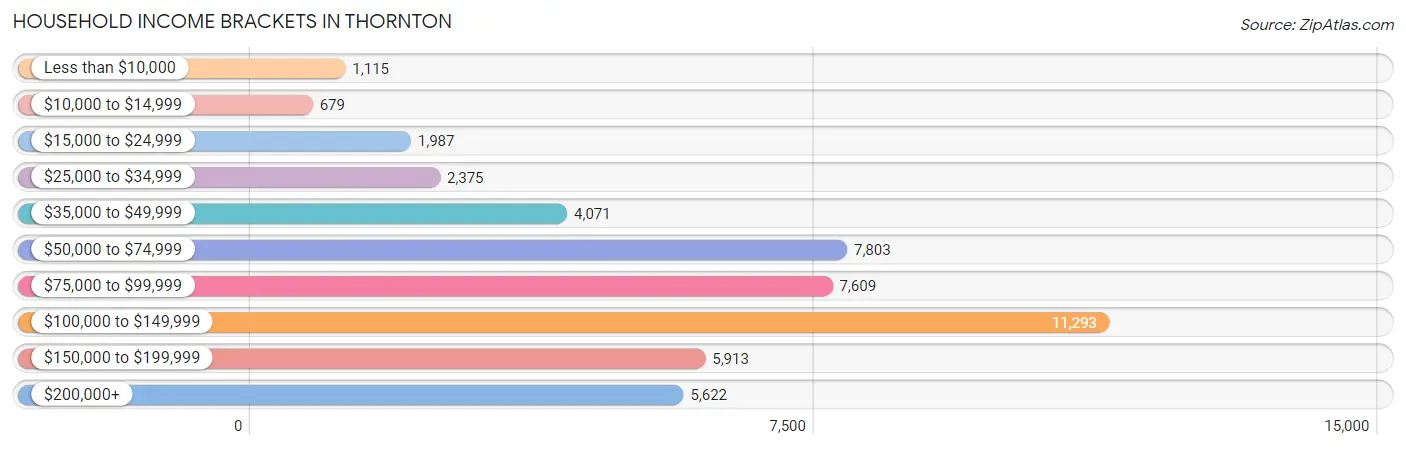
Household Income Brackets in Thornton
With 11,293 households falling in the category, the $100,000 to $149,999 income range is the most frequent in Thornton, accounting for 23.3% of all households. In contrast, only 679 households (1.4%) fall into the $10,000 to $14,999 income bracket, making it the least populous group.
| Income Bracket | # Households | % Households |
| Less than $10,000 | 1,115 | 2.3% |
| $10,000 to $14,999 | 679 | 1.4% |
| $15,000 to $24,999 | 1,987 | 4.1% |
| $25,000 to $34,999 | 2,375 | 4.9% |
| $35,000 to $49,999 | 4,071 | 8.4% |
| $50,000 to $74,999 | 7,803 | 16.1% |
| $75,000 to $99,999 | 7,609 | 15.7% |
| $100,000 to $149,999 | 11,293 | 23.3% |
| $150,000 to $199,999 | 5,913 | 12.2% |
| $200,000+ | 5,622 | 11.6% |
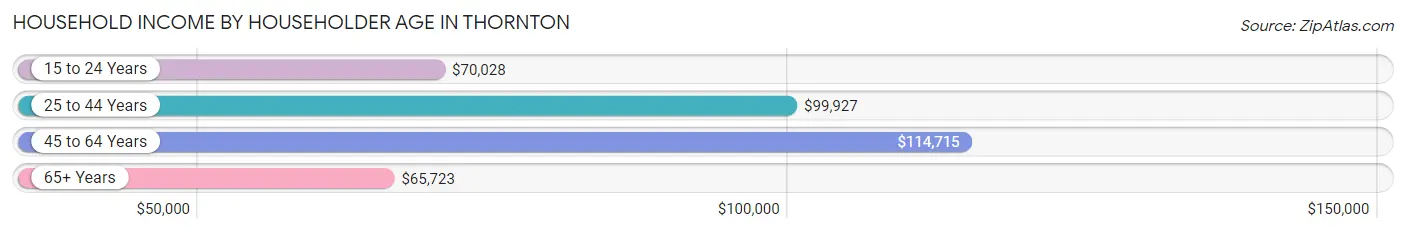
Household Income by Householder Age in Thornton
The median household income in Thornton is $95,064, with the highest median household income of $114,715 found in the 45 to 64 years age bracket for the primary householder. A total of 17,601 households (36.3%) fall into this category. Meanwhile, the 65+ years age bracket for the primary householder has the lowest median household income of $65,723, with 8,337 households (17.2%) in this group.
| Income Bracket | # Households | Median Income |
| 15 to 24 Years | 2,001 (4.1%) | $70,028 |
| 25 to 44 Years | 20,527 (42.3%) | $99,927 |
| 45 to 64 Years | 17,601 (36.3%) | $114,715 |
| 65+ Years | 8,337 (17.2%) | $65,723 |
| Total | 48,466 (100.0%) | $95,064 |
Poverty in Thornton
Income Below Poverty by Sex and Age in Thornton
With 7.0% poverty level for males and 8.9% for females among the residents of Thornton, 16 and 17 year old males and 15 year old females are the most vulnerable to poverty, with 441 males (19.4%) and 195 females (18.1%) in their respective age groups living below the poverty level.
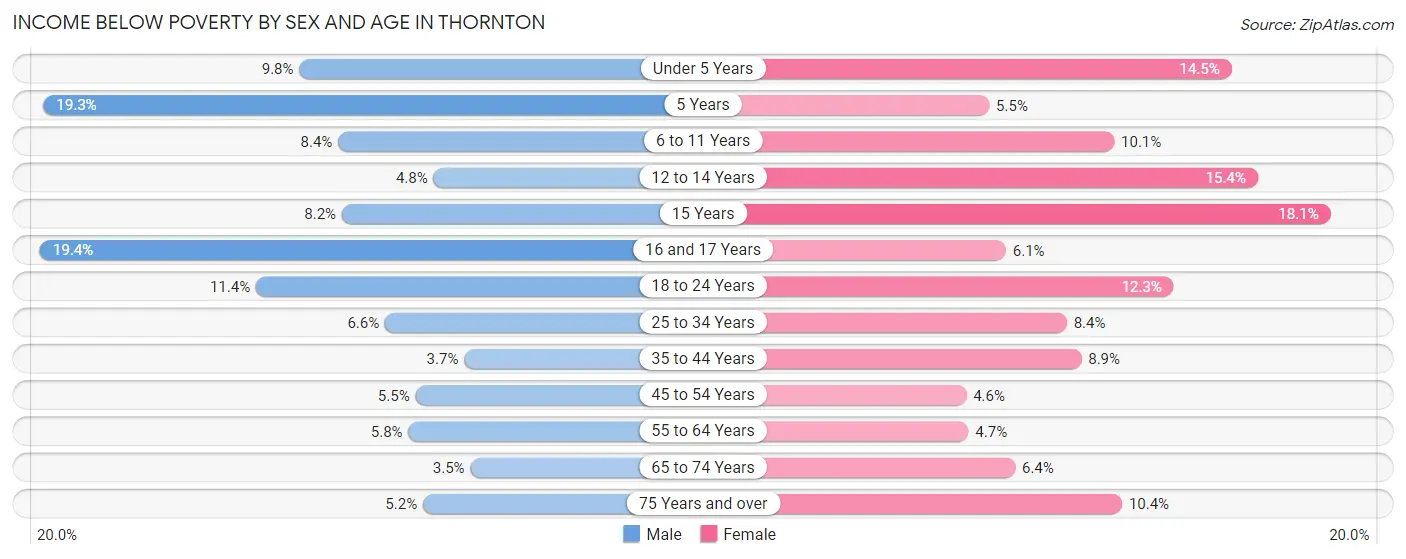
| Age Bracket | Male | Female |
| Under 5 Years | 476 (9.8%) | 672 (14.5%) |
| 5 Years | 170 (19.3%) | 41 (5.5%) |
| 6 to 11 Years | 487 (8.4%) | 645 (10.1%) |
| 12 to 14 Years | 196 (4.8%) | 512 (15.4%) |
| 15 Years | 88 (8.2%) | 195 (18.1%) |
| 16 and 17 Years | 441 (19.4%) | 113 (6.1%) |
| 18 to 24 Years | 782 (11.4%) | 860 (12.3%) |
| 25 to 34 Years | 784 (6.6%) | 888 (8.4%) |
| 35 to 44 Years | 398 (3.7%) | 997 (8.9%) |
| 45 to 54 Years | 512 (5.5%) | 396 (4.6%) |
| 55 to 64 Years | 384 (5.8%) | 318 (4.7%) |
| 65 to 74 Years | 142 (3.5%) | 331 (6.4%) |
| 75 Years and over | 108 (5.2%) | 272 (10.4%) |
| Total | 4,968 (7.0%) | 6,240 (8.9%) |
Income Above Poverty by Sex and Age in Thornton
According to the poverty statistics in Thornton, males aged 65 to 74 years and females aged 45 to 54 years are the age groups that are most secure financially, with 96.6% of males and 95.4% of females in these age groups living above the poverty line.
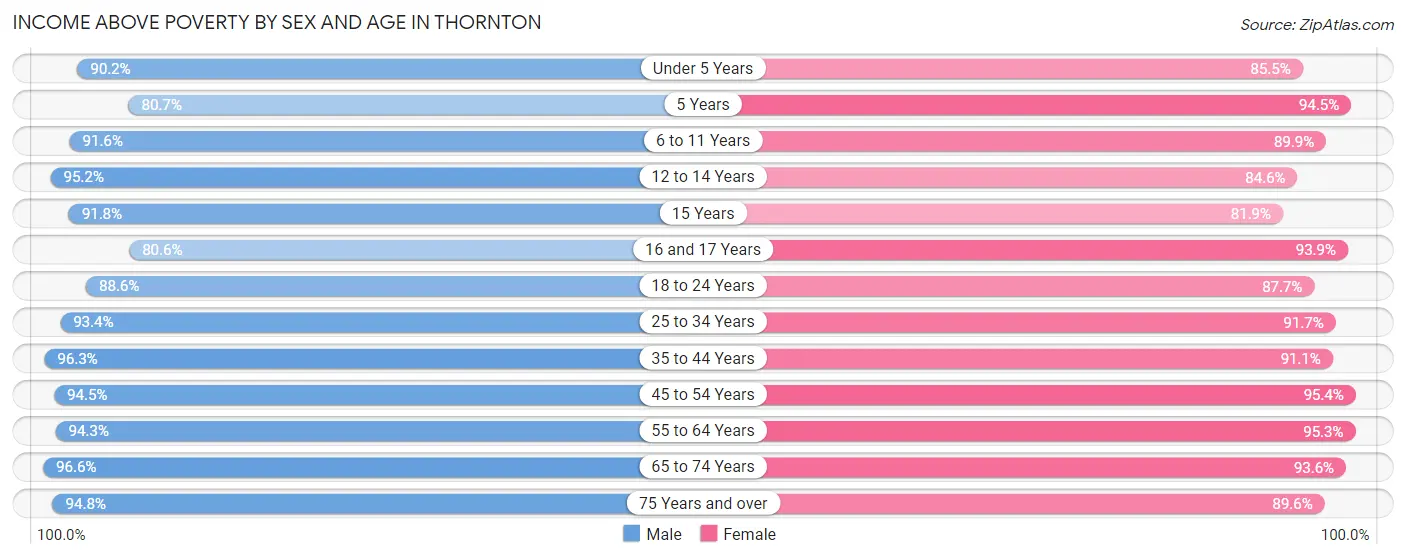
| Age Bracket | Male | Female |
| Under 5 Years | 4,379 (90.2%) | 3,971 (85.5%) |
| 5 Years | 711 (80.7%) | 709 (94.5%) |
| 6 to 11 Years | 5,340 (91.6%) | 5,734 (89.9%) |
| 12 to 14 Years | 3,868 (95.2%) | 2,803 (84.6%) |
| 15 Years | 983 (91.8%) | 880 (81.9%) |
| 16 and 17 Years | 1,829 (80.6%) | 1,743 (93.9%) |
| 18 to 24 Years | 6,074 (88.6%) | 6,118 (87.7%) |
| 25 to 34 Years | 11,063 (93.4%) | 9,752 (91.6%) |
| 35 to 44 Years | 10,424 (96.3%) | 10,215 (91.1%) |
| 45 to 54 Years | 8,817 (94.5%) | 8,172 (95.4%) |
| 55 to 64 Years | 6,300 (94.3%) | 6,443 (95.3%) |
| 65 to 74 Years | 3,968 (96.6%) | 4,815 (93.6%) |
| 75 Years and over | 1,965 (94.8%) | 2,343 (89.6%) |
| Total | 65,721 (93.0%) | 63,698 (91.1%) |
Income Below Poverty Among Married-Couple Families in Thornton
The poverty statistics for married-couple families in Thornton show that 3.0% or 781 of the total 26,341 families live below the poverty line. Families with 5 or more children have the highest poverty rate of 15.0%, comprising of 17 families. On the other hand, families with 1 or 2 children have the lowest poverty rate of 1.0%, which includes 111 families.
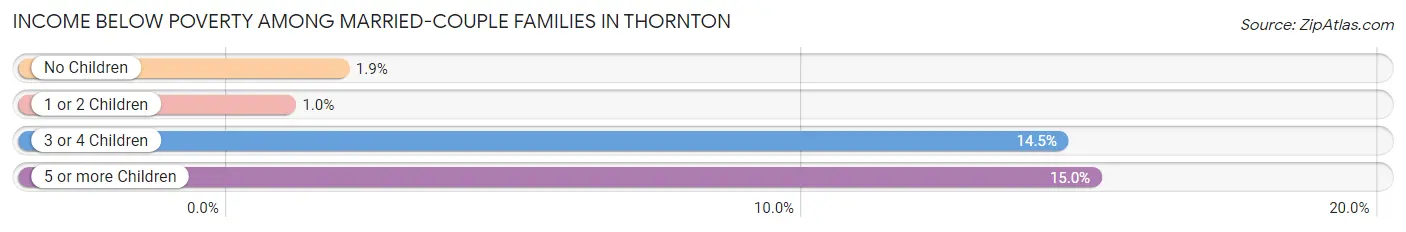
| Children | Above Poverty | Below Poverty |
| No Children | 12,018 (98.1%) | 237 (1.9%) |
| 1 or 2 Children | 10,986 (99.0%) | 111 (1.0%) |
| 3 or 4 Children | 2,460 (85.5%) | 416 (14.5%) |
| 5 or more Children | 96 (85.0%) | 17 (15.0%) |
| Total | 25,560 (97.0%) | 781 (3.0%) |
Income Below Poverty Among Single-Parent Households in Thornton
According to the poverty data in Thornton, 9.8% or 294 single-father households and 14.7% or 777 single-mother households are living below the poverty line. Among single-father households, those with 5 or more children have the highest poverty rate, with 74 households (100.0%) experiencing poverty. Likewise, among single-mother households, those with 5 or more children have the highest poverty rate, with 9 households (100.0%) falling below the poverty line.
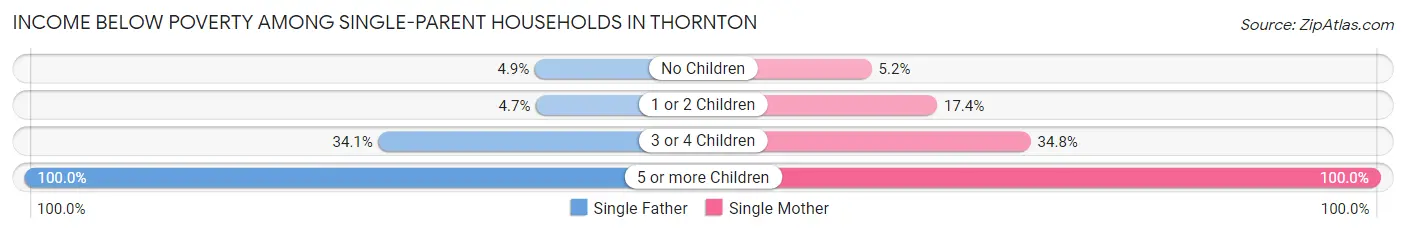
| Children | Single Father | Single Mother |
| No Children | 42 (4.9%) | 96 (5.2%) |
| 1 or 2 Children | 84 (4.7%) | 517 (17.4%) |
| 3 or 4 Children | 94 (34.1%) | 155 (34.8%) |
| 5 or more Children | 74 (100.0%) | 9 (100.0%) |
| Total | 294 (9.8%) | 777 (14.7%) |
Income Below Poverty Among Married-Couple vs Single-Parent Households in Thornton
The poverty data for Thornton shows that 781 of the married-couple family households (3.0%) and 1,071 of the single-parent households (13.0%) are living below the poverty level. Within the married-couple family households, those with 5 or more children have the highest poverty rate, with 17 households (15.0%) falling below the poverty line. Among the single-parent households, those with 5 or more children have the highest poverty rate, with 83 household (100.0%) living below poverty.
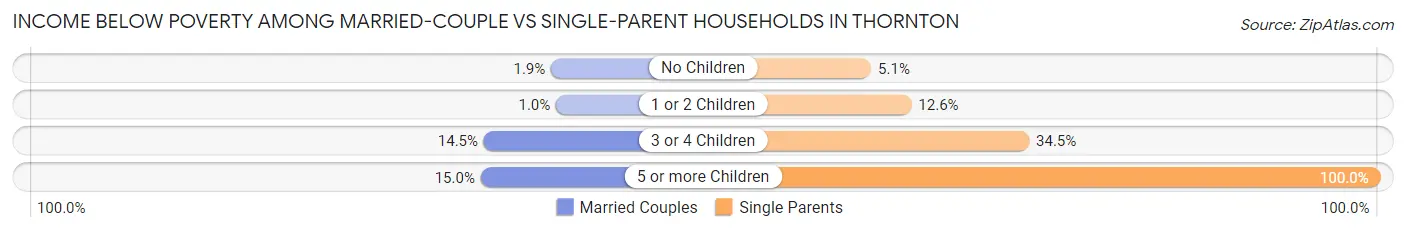
| Children | Married-Couple Families | Single-Parent Households |
| No Children | 237 (1.9%) | 138 (5.1%) |
| 1 or 2 Children | 111 (1.0%) | 601 (12.6%) |
| 3 or 4 Children | 416 (14.5%) | 249 (34.5%) |
| 5 or more Children | 17 (15.0%) | 83 (100.0%) |
| Total | 781 (3.0%) | 1,071 (13.0%) |
Race in Thornton
The most populous races in Thornton are White / Caucasian (96,021 | 67.7%), Hispanic or Latino (52,923 | 37.3%), and Two or more Races (22,122 | 15.6%).
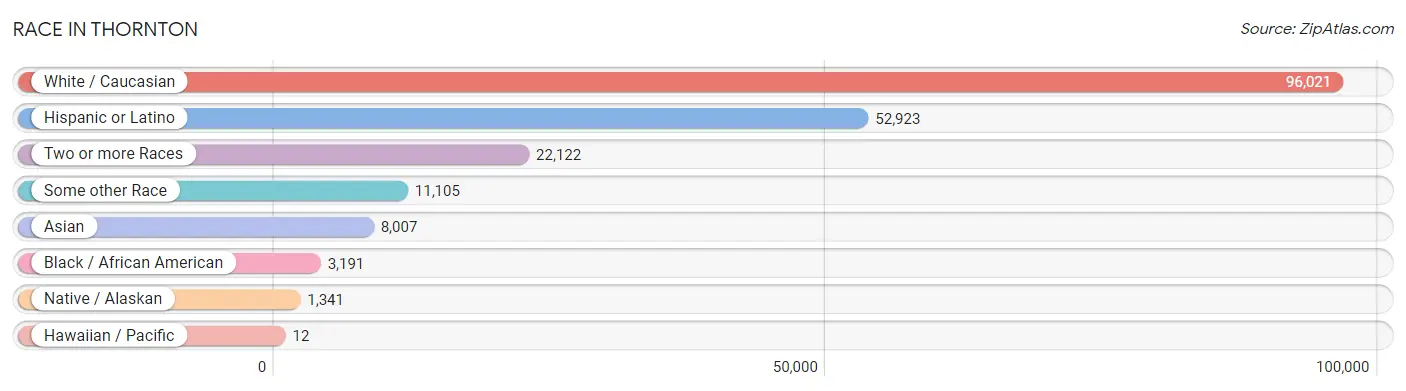
| Race | # Population | % Population |
| Asian | 8,007 | 5.7% |
| Black / African American | 3,191 | 2.2% |
| Hawaiian / Pacific | 12 | 0.0% |
| Hispanic or Latino | 52,923 | 37.3% |
| Native / Alaskan | 1,341 | 0.9% |
| White / Caucasian | 96,021 | 67.7% |
| Two or more Races | 22,122 | 15.6% |
| Some other Race | 11,105 | 7.8% |
| Total | 141,799 | 100.0% |
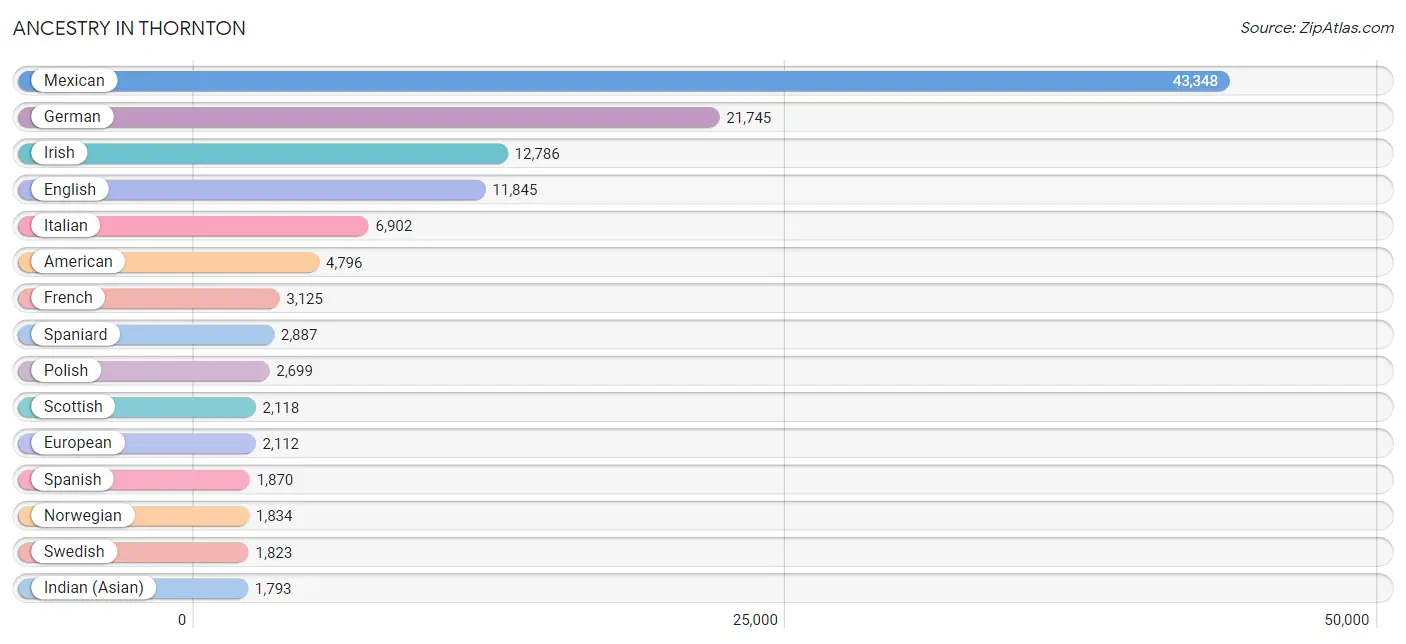
Ancestry in Thornton
The most populous ancestries reported in Thornton are Mexican (43,348 | 30.6%), German (21,745 | 15.3%), Irish (12,786 | 9.0%), English (11,845 | 8.4%), and Italian (6,902 | 4.9%), together accounting for 68.2% of all Thornton residents.
| Ancestry | # Population | % Population |
| Afghan | 723 | 0.5% |
| African | 73 | 0.1% |
| Albanian | 26 | 0.0% |
| Alsatian | 14 | 0.0% |
| American | 4,796 | 3.4% |
| Apache | 370 | 0.3% |
| Arab | 448 | 0.3% |
| Arapaho | 117 | 0.1% |
| Argentinean | 123 | 0.1% |
| Armenian | 61 | 0.0% |
| Australian | 191 | 0.1% |
| Austrian | 120 | 0.1% |
| Bahamian | 5 | 0.0% |
| Bangladeshi | 1,060 | 0.7% |
| Basque | 14 | 0.0% |
| Belgian | 77 | 0.1% |
| Belizean | 9 | 0.0% |
| Bhutanese | 585 | 0.4% |
| Blackfeet | 254 | 0.2% |
| Brazilian | 52 | 0.0% |
| British | 529 | 0.4% |
| Bulgarian | 26 | 0.0% |
| Burmese | 493 | 0.4% |
| Canadian | 315 | 0.2% |
| Carpatho Rusyn | 12 | 0.0% |
| Central American | 1,029 | 0.7% |
| Central American Indian | 267 | 0.2% |
| Cherokee | 771 | 0.5% |
| Cheyenne | 29 | 0.0% |
| Chickasaw | 70 | 0.1% |
| Chilean | 29 | 0.0% |
| Chippewa | 6 | 0.0% |
| Choctaw | 109 | 0.1% |
| Colombian | 257 | 0.2% |
| Cree | 10 | 0.0% |
| Croatian | 142 | 0.1% |
| Cuban | 117 | 0.1% |
| Czech | 735 | 0.5% |
| Czechoslovakian | 73 | 0.1% |
| Danish | 629 | 0.4% |
| Dominican | 315 | 0.2% |
| Dutch | 1,397 | 1.0% |
| Eastern European | 217 | 0.2% |
| Ecuadorian | 118 | 0.1% |
| Egyptian | 64 | 0.1% |
| English | 11,845 | 8.4% |
| Ethiopian | 188 | 0.1% |
| European | 2,112 | 1.5% |
| Filipino | 38 | 0.0% |
| Finnish | 198 | 0.1% |
| French | 3,125 | 2.2% |
| French American Indian | 3 | 0.0% |
| French Canadian | 265 | 0.2% |
| German | 21,745 | 15.3% |
| Greek | 332 | 0.2% |
| Guatemalan | 254 | 0.2% |
| Guyanese | 13 | 0.0% |
| Honduran | 92 | 0.1% |
| Hopi | 29 | 0.0% |
| Hungarian | 338 | 0.2% |
| Indian (Asian) | 1,793 | 1.3% |
| Inupiat | 15 | 0.0% |
| Iranian | 132 | 0.1% |
| Iraqi | 18 | 0.0% |
| Irish | 12,786 | 9.0% |
| Iroquois | 70 | 0.1% |
| Italian | 6,902 | 4.9% |
| Jamaican | 27 | 0.0% |
| Japanese | 541 | 0.4% |
| Korean | 1,426 | 1.0% |
| Laotian | 102 | 0.1% |
| Latvian | 152 | 0.1% |
| Lebanese | 147 | 0.1% |
| Lithuanian | 282 | 0.2% |
| Luxembourger | 5 | 0.0% |
| Malaysian | 475 | 0.3% |
| Maltese | 45 | 0.0% |
| Mexican | 43,348 | 30.6% |
| Mexican American Indian | 276 | 0.2% |
| Mongolian | 10 | 0.0% |
| Native Hawaiian | 100 | 0.1% |
| Navajo | 221 | 0.2% |
| Nigerian | 310 | 0.2% |
| Northern European | 244 | 0.2% |
| Norwegian | 1,834 | 1.3% |
| Pakistani | 226 | 0.2% |
| Panamanian | 76 | 0.1% |
| Pennsylvania German | 41 | 0.0% |
| Peruvian | 106 | 0.1% |
| Polish | 2,699 | 1.9% |
| Portuguese | 957 | 0.7% |
| Potawatomi | 18 | 0.0% |
| Pueblo | 189 | 0.1% |
| Puerto Rican | 661 | 0.5% |
| Romanian | 46 | 0.0% |
| Russian | 996 | 0.7% |
| Salvadoran | 607 | 0.4% |
| Samoan | 65 | 0.1% |
| Scandinavian | 837 | 0.6% |
| Scotch-Irish | 971 | 0.7% |
| Scottish | 2,118 | 1.5% |
| Serbian | 19 | 0.0% |
| Sioux | 220 | 0.2% |
| Slavic | 68 | 0.1% |
| Slovak | 393 | 0.3% |
| Slovene | 75 | 0.1% |
| South African | 26 | 0.0% |
| South American | 649 | 0.5% |
| Spaniard | 2,887 | 2.0% |
| Spanish | 1,870 | 1.3% |
| Spanish American | 88 | 0.1% |
| Spanish American Indian | 93 | 0.1% |
| Sri Lankan | 1,506 | 1.1% |
| Subsaharan African | 638 | 0.4% |
| Swedish | 1,823 | 1.3% |
| Swiss | 194 | 0.1% |
| Syrian | 10 | 0.0% |
| Thai | 1,253 | 0.9% |
| Turkish | 99 | 0.1% |
| Ukrainian | 316 | 0.2% |
| Ute | 285 | 0.2% |
| Venezuelan | 16 | 0.0% |
| Vietnamese | 6 | 0.0% |
| Welsh | 557 | 0.4% |
| Yugoslavian | 76 | 0.1% |
| Yup'ik | 15 | 0.0% | View All 126 Rows |
Immigrants in Thornton
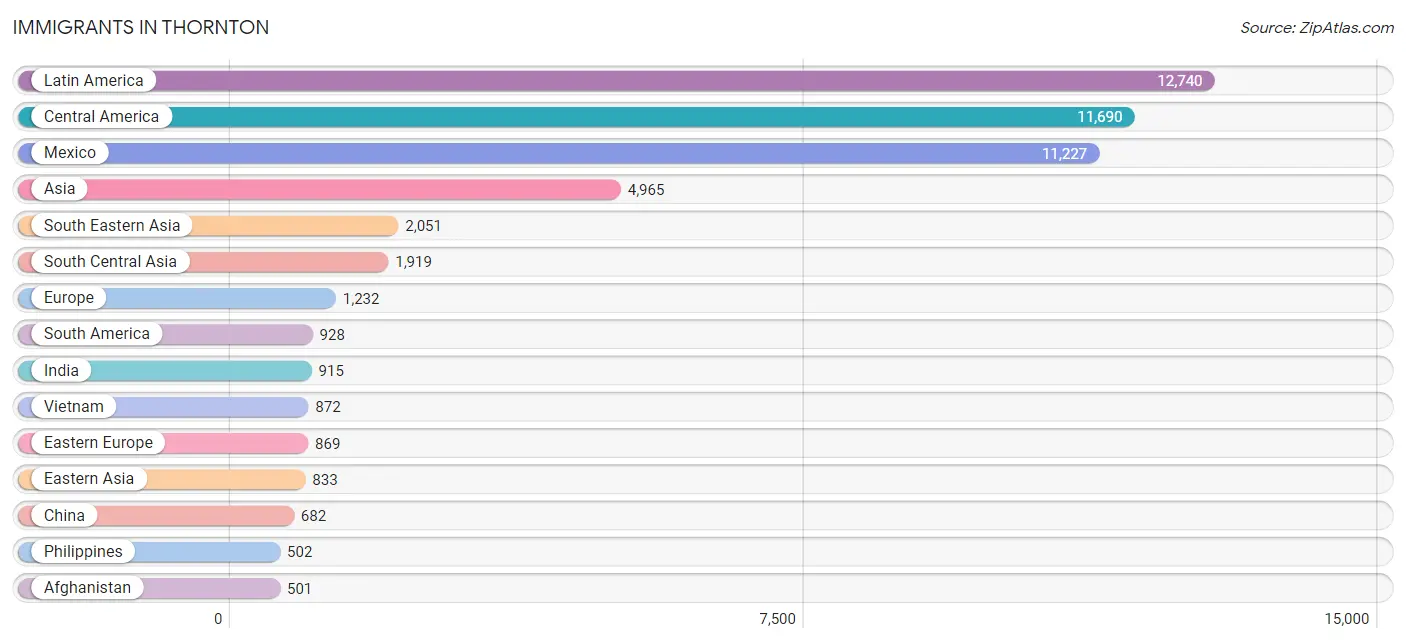
The most numerous immigrant groups reported in Thornton came from Latin America (12,740 | 9.0%), Central America (11,690 | 8.2%), Mexico (11,227 | 7.9%), Asia (4,965 | 3.5%), and South Eastern Asia (2,051 | 1.5%), together accounting for 30.1% of all Thornton residents.
| Immigration Origin | # Population | % Population |
| Afghanistan | 501 | 0.4% |
| Africa | 480 | 0.3% |
| Albania | 11 | 0.0% |
| Argentina | 29 | 0.0% |
| Asia | 4,965 | 3.5% |
| Australia | 105 | 0.1% |
| Austria | 5 | 0.0% |
| Bahamas | 5 | 0.0% |
| Bangladesh | 6 | 0.0% |
| Belarus | 12 | 0.0% |
| Bosnia and Herzegovina | 58 | 0.0% |
| Brazil | 475 | 0.3% |
| Bulgaria | 26 | 0.0% |
| Cambodia | 164 | 0.1% |
| Cameroon | 5 | 0.0% |
| Canada | 301 | 0.2% |
| Caribbean | 122 | 0.1% |
| Central America | 11,690 | 8.2% |
| Chile | 19 | 0.0% |
| China | 682 | 0.5% |
| Colombia | 141 | 0.1% |
| Cuba | 23 | 0.0% |
| Czechoslovakia | 9 | 0.0% |
| Dominican Republic | 94 | 0.1% |
| Eastern Africa | 249 | 0.2% |
| Eastern Asia | 833 | 0.6% |
| Eastern Europe | 869 | 0.6% |
| Ecuador | 187 | 0.1% |
| El Salvador | 373 | 0.3% |
| England | 50 | 0.0% |
| Eritrea | 68 | 0.1% |
| Ethiopia | 162 | 0.1% |
| Europe | 1,232 | 0.9% |
| France | 25 | 0.0% |
| Germany | 149 | 0.1% |
| Ghana | 34 | 0.0% |
| Greece | 10 | 0.0% |
| Guatemala | 90 | 0.1% |
| Hong Kong | 16 | 0.0% |
| Hungary | 12 | 0.0% |
| India | 915 | 0.6% |
| Indonesia | 93 | 0.1% |
| Iran | 79 | 0.1% |
| Iraq | 57 | 0.0% |
| Ireland | 48 | 0.0% |
| Israel | 32 | 0.0% |
| Italy | 16 | 0.0% |
| Japan | 2 | 0.0% |
| Kazakhstan | 16 | 0.0% |
| Korea | 149 | 0.1% |
| Laos | 264 | 0.2% |
| Latin America | 12,740 | 9.0% |
| Lithuania | 10 | 0.0% |
| Malaysia | 35 | 0.0% |
| Mexico | 11,227 | 7.9% |
| Middle Africa | 5 | 0.0% |
| Morocco | 30 | 0.0% |
| Nepal | 187 | 0.1% |
| Netherlands | 12 | 0.0% |
| Nigeria | 113 | 0.1% |
| Northern Africa | 46 | 0.0% |
| Northern Europe | 126 | 0.1% |
| Oceania | 105 | 0.1% |
| Pakistan | 32 | 0.0% |
| Peru | 69 | 0.1% |
| Philippines | 502 | 0.4% |
| Poland | 333 | 0.2% |
| Romania | 37 | 0.0% |
| Russia | 194 | 0.1% |
| Scotland | 5 | 0.0% |
| Singapore | 15 | 0.0% |
| South Africa | 26 | 0.0% |
| South America | 928 | 0.6% |
| South Central Asia | 1,919 | 1.3% |
| South Eastern Asia | 2,051 | 1.5% |
| Southern Europe | 46 | 0.0% |
| Sri Lanka | 138 | 0.1% |
| Taiwan | 83 | 0.1% |
| Thailand | 106 | 0.1% |
| Turkey | 35 | 0.0% |
| Ukraine | 34 | 0.0% |
| Venezuela | 2 | 0.0% |
| Vietnam | 872 | 0.6% |
| Western Africa | 147 | 0.1% |
| Western Asia | 162 | 0.1% |
| Western Europe | 191 | 0.1% | View All 86 Rows |
Sex and Age in Thornton
Sex and Age in Thornton
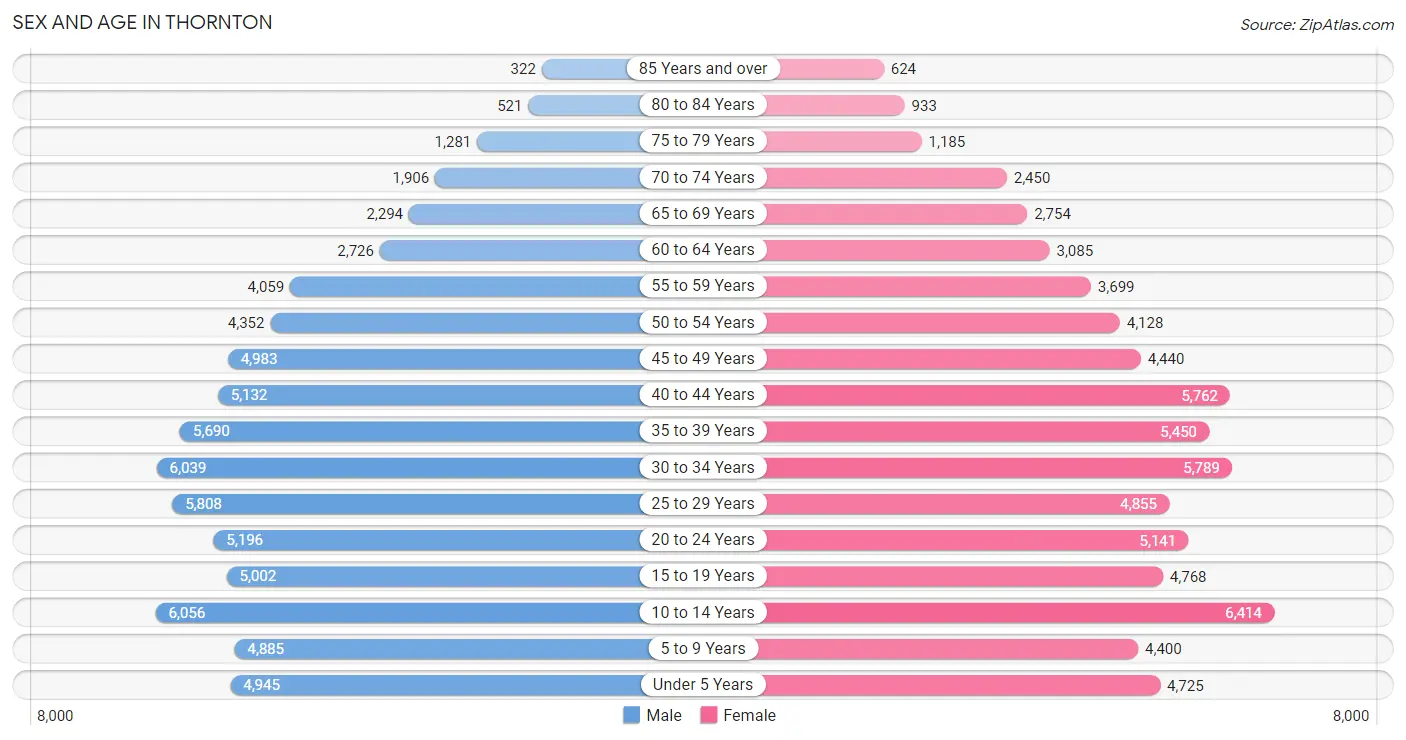
The most populous age groups in Thornton are 10 to 14 Years (6,056 | 8.5%) for men and 10 to 14 Years (6,414 | 9.1%) for women.
| Age Bracket | Male | Female |
| Under 5 Years | 4,945 (7.0%) | 4,725 (6.7%) |
| 5 to 9 Years | 4,885 (6.9%) | 4,400 (6.2%) |
| 10 to 14 Years | 6,056 (8.5%) | 6,414 (9.1%) |
| 15 to 19 Years | 5,002 (7.0%) | 4,768 (6.8%) |
| 20 to 24 Years | 5,196 (7.3%) | 5,141 (7.3%) |
| 25 to 29 Years | 5,808 (8.2%) | 4,855 (6.9%) |
| 30 to 34 Years | 6,039 (8.5%) | 5,789 (8.2%) |
| 35 to 39 Years | 5,690 (8.0%) | 5,450 (7.7%) |
| 40 to 44 Years | 5,132 (7.2%) | 5,762 (8.2%) |
| 45 to 49 Years | 4,983 (7.0%) | 4,440 (6.3%) |
| 50 to 54 Years | 4,352 (6.1%) | 4,128 (5.9%) |
| 55 to 59 Years | 4,059 (5.7%) | 3,699 (5.2%) |
| 60 to 64 Years | 2,726 (3.8%) | 3,085 (4.4%) |
| 65 to 69 Years | 2,294 (3.2%) | 2,754 (3.9%) |
| 70 to 74 Years | 1,906 (2.7%) | 2,450 (3.5%) |
| 75 to 79 Years | 1,281 (1.8%) | 1,185 (1.7%) |
| 80 to 84 Years | 521 (0.7%) | 933 (1.3%) |
| 85 Years and over | 322 (0.4%) | 624 (0.9%) |
| Total | 71,197 (100.0%) | 70,602 (100.0%) |
Families and Households in Thornton
Median Family Size in Thornton
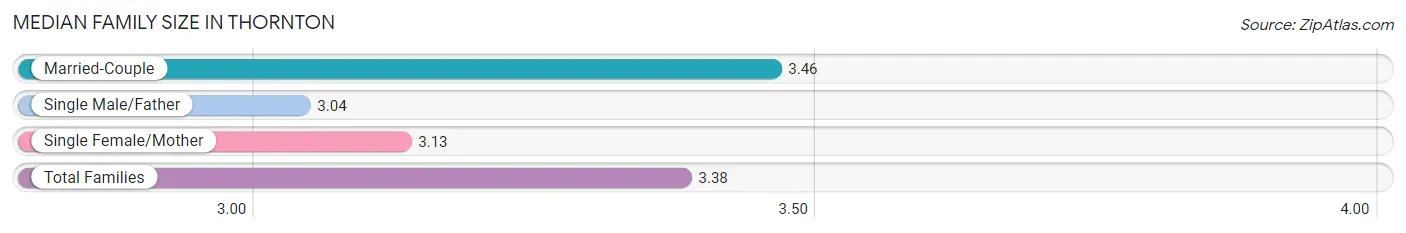
The median family size in Thornton is 3.38 persons per family, with married-couple families (26,341 | 76.1%) accounting for the largest median family size of 3.46 persons per family. On the other hand, single male/father families (2,995 | 8.7%) represent the smallest median family size with 3.04 persons per family.
| Family Type | # Families | Family Size |
| Married-Couple | 26,341 (76.1%) | 3.46 |
| Single Male/Father | 2,995 (8.7%) | 3.04 |
| Single Female/Mother | 5,267 (15.2%) | 3.13 |
| Total Families | 34,603 (100.0%) | 3.38 |
Median Household Size in Thornton
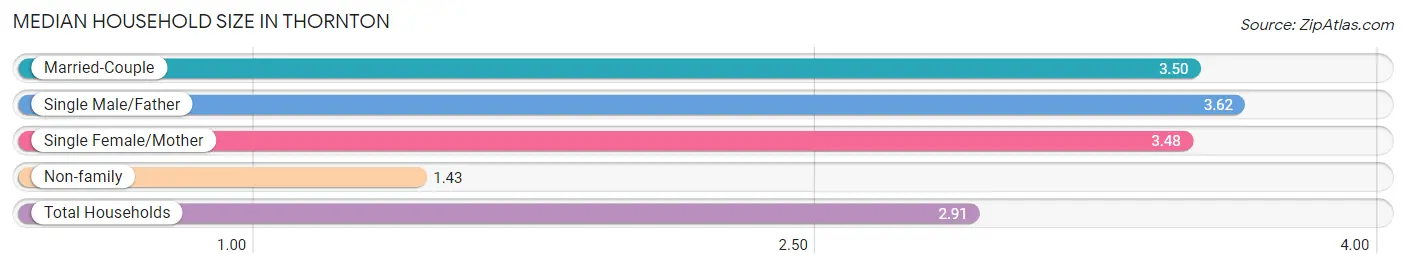
The median household size in Thornton is 2.91 persons per household, with single male/father households (2,995 | 6.2%) accounting for the largest median household size of 3.62 persons per household. non-family households (13,863 | 28.6%) represent the smallest median household size with 1.43 persons per household.
| Household Type | # Households | Household Size |
| Married-Couple | 26,341 (54.3%) | 3.50 |
| Single Male/Father | 2,995 (6.2%) | 3.62 |
| Single Female/Mother | 5,267 (10.9%) | 3.48 |
| Non-family | 13,863 (28.6%) | 1.43 |
| Total Households | 48,466 (100.0%) | 2.91 |
Household Size by Marriage Status in Thornton
Out of a total of 48,466 households in Thornton, 34,603 (71.4%) are family households, while 13,863 (28.6%) are nonfamily households. The most numerous type of family households are 2-person households, comprising 11,169, and the most common type of nonfamily households are 1-person households, comprising 9,957.
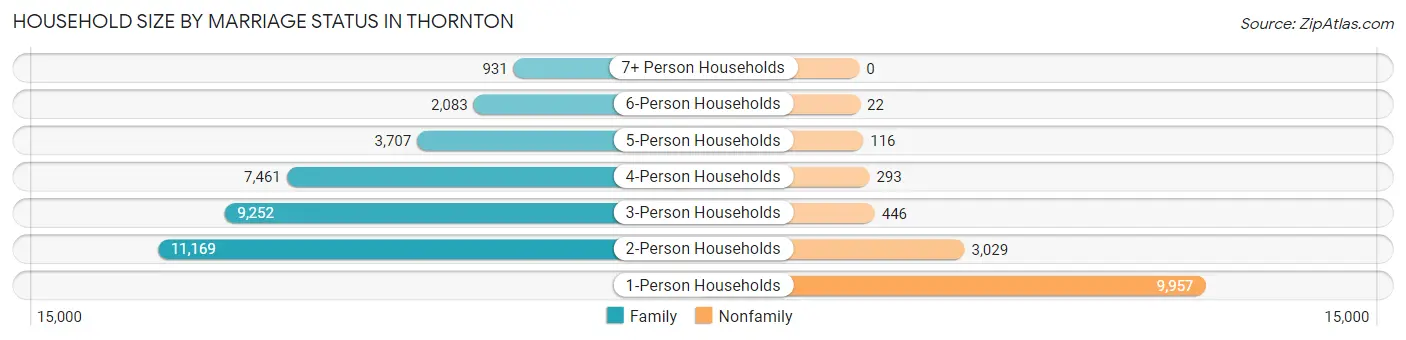
| Household Size | Family Households | Nonfamily Households |
| 1-Person Households | - | 9,957 (20.5%) |
| 2-Person Households | 11,169 (23.1%) | 3,029 (6.2%) |
| 3-Person Households | 9,252 (19.1%) | 446 (0.9%) |
| 4-Person Households | 7,461 (15.4%) | 293 (0.6%) |
| 5-Person Households | 3,707 (7.6%) | 116 (0.2%) |
| 6-Person Households | 2,083 (4.3%) | 22 (0.1%) |
| 7+ Person Households | 931 (1.9%) | 0 (0.0%) |
| Total | 34,603 (71.4%) | 13,863 (28.6%) |
Female Fertility in Thornton
Fertility by Age in Thornton
Average fertility rate in Thornton is 50.0 births per 1,000 women. Women in the age bracket of 20 to 34 years have the highest fertility rate with 94.0 births per 1,000 women. Women in the age bracket of 20 to 34 years acount for 80.3% of all women with births.
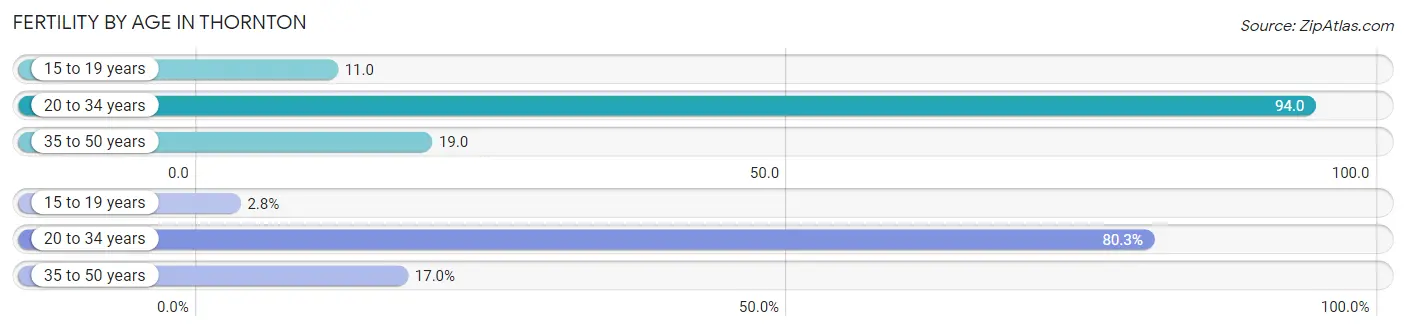
| Age Bracket | Women with Births | Births / 1,000 Women |
| 15 to 19 years | 51 (2.8%) | 11.0 |
| 20 to 34 years | 1,487 (80.3%) | 94.0 |
| 35 to 50 years | 314 (17.0%) | 19.0 |
| Total | 1,852 (100.0%) | 50.0 |
Fertility by Age by Marriage Status in Thornton
77.6% of women with births (1,852) in Thornton are married. The highest percentage of unmarried women with births falls into 35 to 50 years age bracket with 34.1% of them unmarried at the time of birth, while the lowest percentage of unmarried women with births belong to 15 to 19 years age bracket with 0.0% of them unmarried.
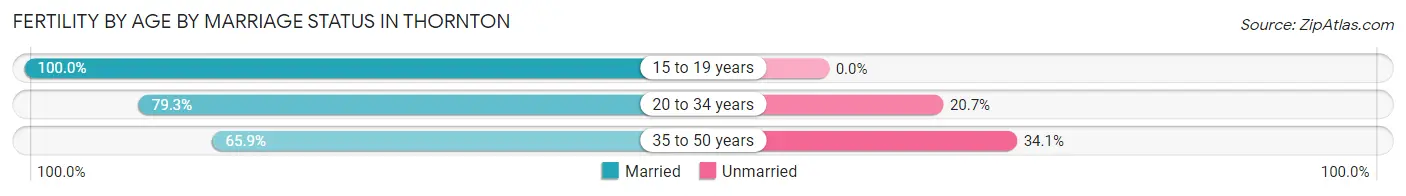
| Age Bracket | Married | Unmarried |
| 15 to 19 years | 51 (100.0%) | 0 (0.0%) |
| 20 to 34 years | 1,179 (79.3%) | 308 (20.7%) |
| 35 to 50 years | 207 (65.9%) | 107 (34.1%) |
| Total | 1,437 (77.6%) | 415 (22.4%) |
Fertility by Education in Thornton
Average fertility rate in Thornton is 50.0 births per 1,000 women. Women with the education attainment of bachelor's degree have the highest fertility rate of 76.0 births per 1,000 women, while women with the education attainment of graduate degree have the lowest fertility at 16.0 births per 1,000 women. Women with the education attainment of bachelor's degree represent 31.9% of all women with births.
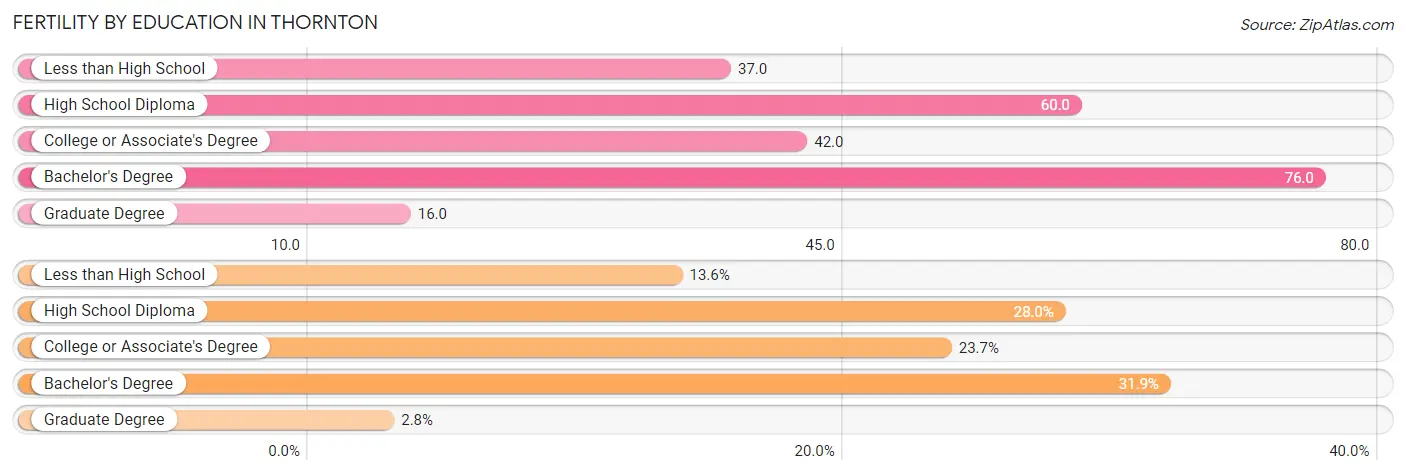
| Educational Attainment | Women with Births | Births / 1,000 Women |
| Less than High School | 252 (13.6%) | 37.0 |
| High School Diploma | 518 (28.0%) | 60.0 |
| College or Associate's Degree | 439 (23.7%) | 42.0 |
| Bachelor's Degree | 591 (31.9%) | 76.0 |
| Graduate Degree | 52 (2.8%) | 16.0 |
| Total | 1,852 (100.0%) | 50.0 |
Fertility by Education by Marriage Status in Thornton
22.4% of women with births in Thornton are unmarried. Women with the educational attainment of graduate degree are most likely to be married with 100.0% of them married at childbirth, while women with the educational attainment of high school diploma are least likely to be married with 35.7% of them unmarried at childbirth.
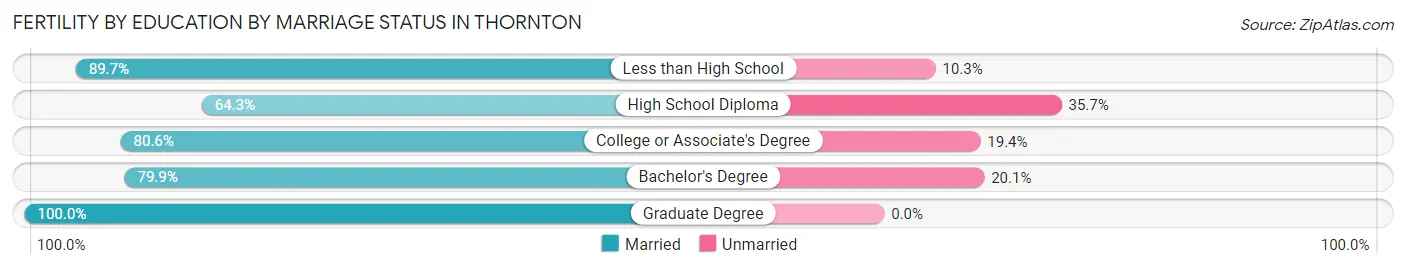
| Educational Attainment | Married | Unmarried |
| Less than High School | 226 (89.7%) | 26 (10.3%) |
| High School Diploma | 333 (64.3%) | 185 (35.7%) |
| College or Associate's Degree | 354 (80.6%) | 85 (19.4%) |
| Bachelor's Degree | 472 (79.9%) | 119 (20.1%) |
| Graduate Degree | 52 (100.0%) | 0 (0.0%) |
| Total | 1,437 (77.6%) | 415 (22.4%) |
Employment Characteristics in Thornton
Employment by Class of Employer in Thornton
Among the 75,769 employed individuals in Thornton, private company employees (53,729 | 70.9%), local government employees (5,829 | 7.7%), and not-for-profit organizations (5,086 | 6.7%) make up the most common classes of employment.
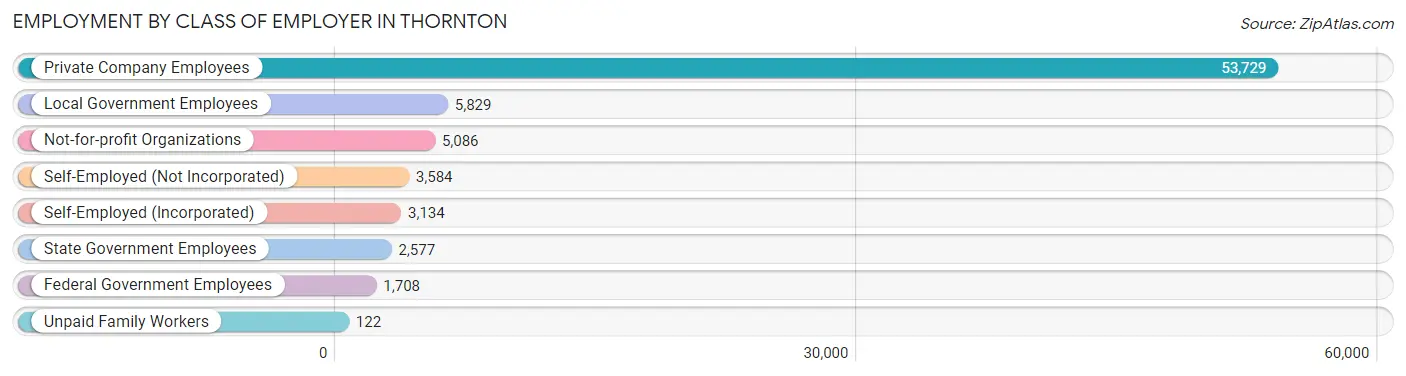
| Employer Class | # Employees | % Employees |
| Private Company Employees | 53,729 | 70.9% |
| Self-Employed (Incorporated) | 3,134 | 4.1% |
| Self-Employed (Not Incorporated) | 3,584 | 4.7% |
| Not-for-profit Organizations | 5,086 | 6.7% |
| Local Government Employees | 5,829 | 7.7% |
| State Government Employees | 2,577 | 3.4% |
| Federal Government Employees | 1,708 | 2.2% |
| Unpaid Family Workers | 122 | 0.2% |
| Total | 75,769 | 100.0% |
Employment Status by Age in Thornton
According to the labor force statistics for Thornton, out of the total population over 16 years of age (108,228), 74.3% or 80,413 individuals are in the labor force, with 4.6% or 3,699 of them unemployed. The age group with the highest labor force participation rate is 25 to 29 years, with 89.4% or 9,533 individuals in the labor force. Within the labor force, the 16 to 19 years age range has the highest percentage of unemployed individuals, with 20.6% or 767 of them being unemployed.
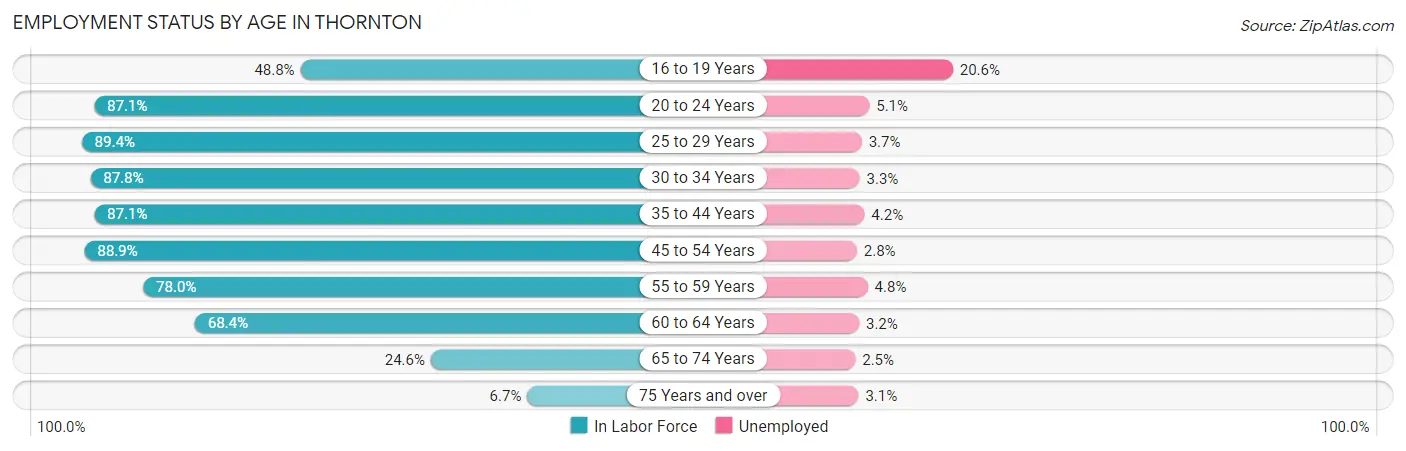
| Age Bracket | In Labor Force | Unemployed |
| 16 to 19 Years | 3,721 (48.8%) | 767 (20.6%) |
| 20 to 24 Years | 9,004 (87.1%) | 459 (5.1%) |
| 25 to 29 Years | 9,533 (89.4%) | 353 (3.7%) |
| 30 to 34 Years | 10,385 (87.8%) | 343 (3.3%) |
| 35 to 44 Years | 19,192 (87.1%) | 806 (4.2%) |
| 45 to 54 Years | 15,916 (88.9%) | 446 (2.8%) |
| 55 to 59 Years | 6,051 (78.0%) | 290 (4.8%) |
| 60 to 64 Years | 3,975 (68.4%) | 127 (3.2%) |
| 65 to 74 Years | 2,313 (24.6%) | 58 (2.5%) |
| 75 Years and over | 326 (6.7%) | 10 (3.1%) |
| Total | 80,413 (74.3%) | 3,699 (4.6%) |
Employment Status by Educational Attainment in Thornton
According to labor force statistics for Thornton, 85.6% of individuals (65,053) out of the total population between 25 and 64 years of age (75,997) are in the labor force, with 3.6% or 2,342 of them being unemployed. The group with the highest labor force participation rate are those with the educational attainment of bachelor's degree or higher, with 92.4% or 22,287 individuals in the labor force. Within the labor force, individuals with high school diploma education have the highest percentage of unemployment, with 7.2% or 1,182 of them being unemployed.
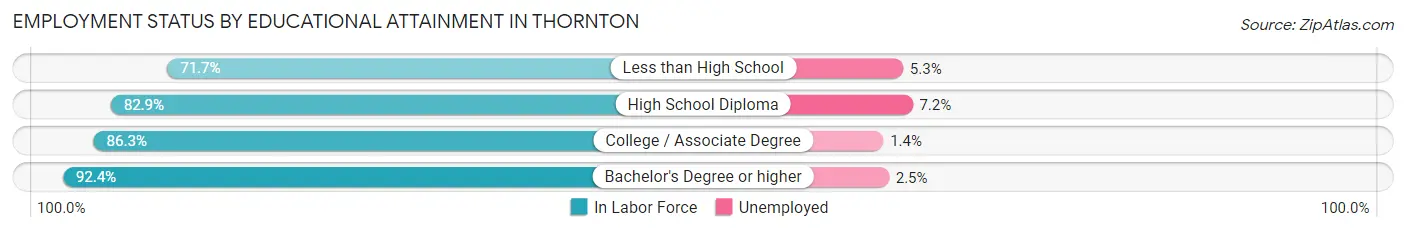
| Educational Attainment | In Labor Force | Unemployed |
| Less than High School | 6,573 (71.7%) | 486 (5.3%) |
| High School Diploma | 16,418 (82.9%) | 1,426 (7.2%) |
| College / Associate Degree | 19,767 (86.3%) | 321 (1.4%) |
| Bachelor's Degree or higher | 22,287 (92.4%) | 603 (2.5%) |
| Total | 65,053 (85.6%) | 2,736 (3.6%) |
Employment Occupations by Sex in Thornton
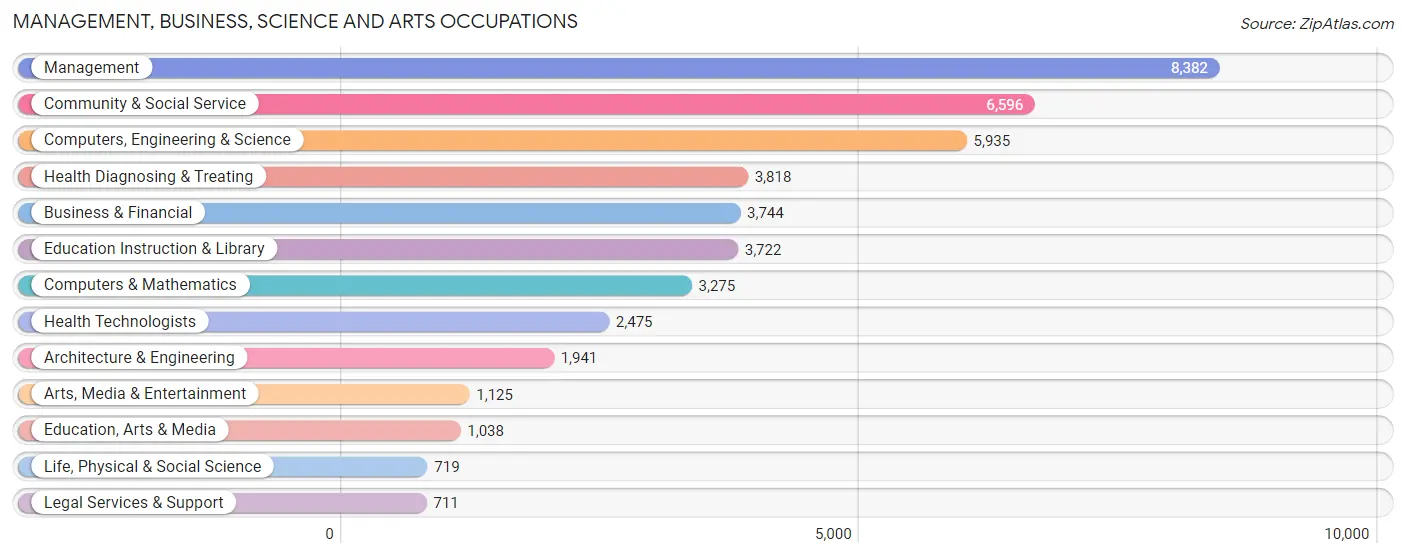
Management, Business, Science and Arts Occupations
The most common Management, Business, Science and Arts occupations in Thornton are Management (8,382 | 10.9%), Community & Social Service (6,596 | 8.6%), Computers, Engineering & Science (5,935 | 7.7%), Health Diagnosing & Treating (3,818 | 5.0%), and Business & Financial (3,744 | 4.9%).
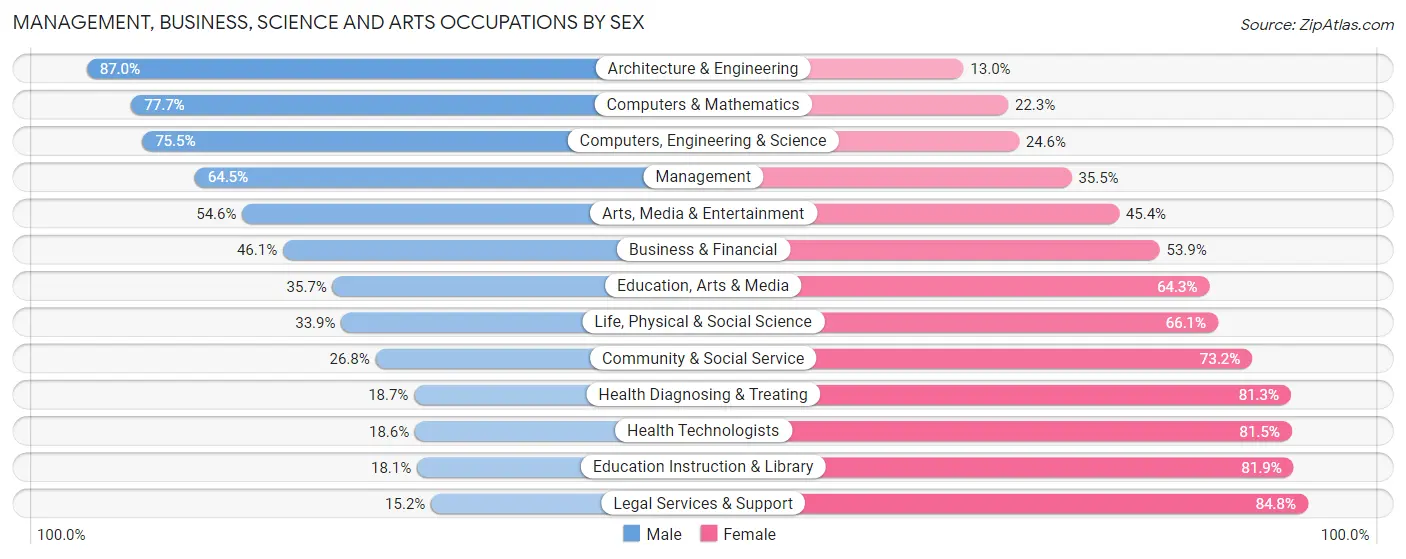
Management, Business, Science and Arts Occupations by Sex
Within the Management, Business, Science and Arts occupations in Thornton, the most male-oriented occupations are Architecture & Engineering (87.0%), Computers & Mathematics (77.7%), and Computers, Engineering & Science (75.4%), while the most female-oriented occupations are Legal Services & Support (84.8%), Education Instruction & Library (81.9%), and Health Technologists (81.5%).
| Occupation | Male | Female |
| Management | 5,405 (64.5%) | 2,977 (35.5%) |
| Business & Financial | 1,726 (46.1%) | 2,018 (53.9%) |
| Computers, Engineering & Science | 4,478 (75.4%) | 1,457 (24.5%) |
| Computers & Mathematics | 2,545 (77.7%) | 730 (22.3%) |
| Architecture & Engineering | 1,689 (87.0%) | 252 (13.0%) |
| Life, Physical & Social Science | 244 (33.9%) | 475 (66.1%) |
| Community & Social Service | 1,768 (26.8%) | 4,828 (73.2%) |
| Education, Arts & Media | 371 (35.7%) | 667 (64.3%) |
| Legal Services & Support | 108 (15.2%) | 603 (84.8%) |
| Education Instruction & Library | 675 (18.1%) | 3,047 (81.9%) |
| Arts, Media & Entertainment | 614 (54.6%) | 511 (45.4%) |
| Health Diagnosing & Treating | 715 (18.7%) | 3,103 (81.3%) |
| Health Technologists | 459 (18.5%) | 2,016 (81.5%) |
| Total (Category) | 14,092 (49.5%) | 14,383 (50.5%) |
| Total (Overall) | 41,228 (53.7%) | 35,472 (46.3%) |
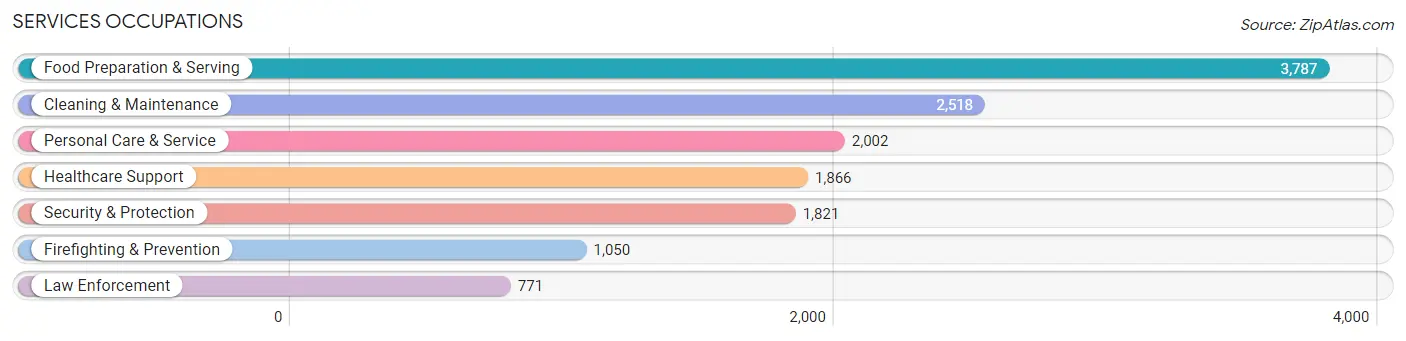
Services Occupations
The most common Services occupations in Thornton are Food Preparation & Serving (3,787 | 4.9%), Cleaning & Maintenance (2,518 | 3.3%), Personal Care & Service (2,002 | 2.6%), Healthcare Support (1,866 | 2.4%), and Security & Protection (1,821 | 2.4%).
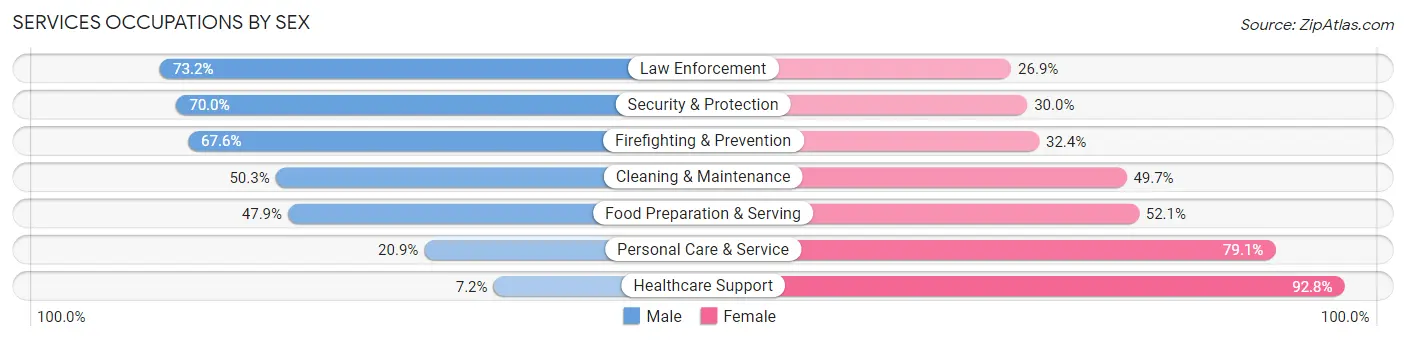
Services Occupations by Sex
Within the Services occupations in Thornton, the most male-oriented occupations are Law Enforcement (73.2%), Security & Protection (70.0%), and Firefighting & Prevention (67.6%), while the most female-oriented occupations are Healthcare Support (92.8%), Personal Care & Service (79.1%), and Food Preparation & Serving (52.1%).
| Occupation | Male | Female |
| Healthcare Support | 134 (7.2%) | 1,732 (92.8%) |
| Security & Protection | 1,274 (70.0%) | 547 (30.0%) |
| Firefighting & Prevention | 710 (67.6%) | 340 (32.4%) |
| Law Enforcement | 564 (73.2%) | 207 (26.9%) |
| Food Preparation & Serving | 1,813 (47.9%) | 1,974 (52.1%) |
| Cleaning & Maintenance | 1,267 (50.3%) | 1,251 (49.7%) |
| Personal Care & Service | 418 (20.9%) | 1,584 (79.1%) |
| Total (Category) | 4,906 (40.9%) | 7,088 (59.1%) |
| Total (Overall) | 41,228 (53.7%) | 35,472 (46.3%) |
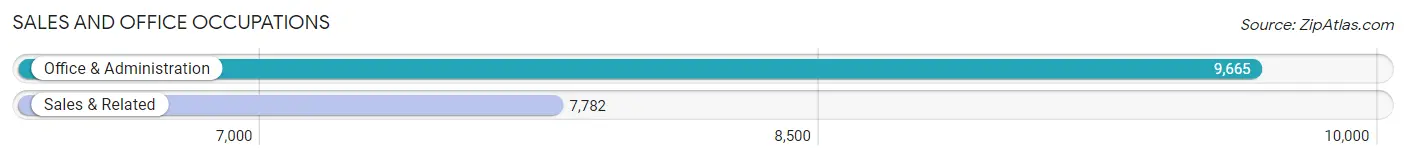
Sales and Office Occupations
The most common Sales and Office occupations in Thornton are Office & Administration (9,665 | 12.6%), and Sales & Related (7,782 | 10.2%).
Sales and Office Occupations by Sex
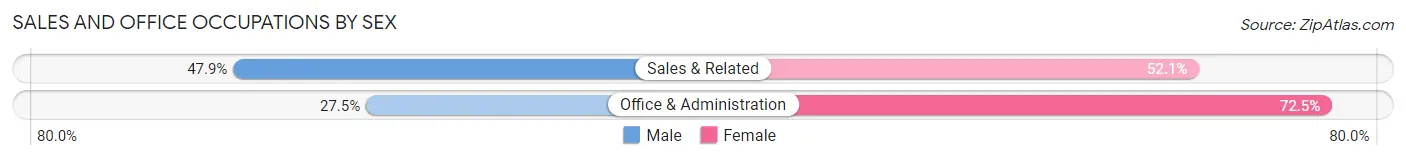
| Occupation | Male | Female |
| Sales & Related | 3,728 (47.9%) | 4,054 (52.1%) |
| Office & Administration | 2,655 (27.5%) | 7,010 (72.5%) |
| Total (Category) | 6,383 (36.6%) | 11,064 (63.4%) |
| Total (Overall) | 41,228 (53.7%) | 35,472 (46.3%) |
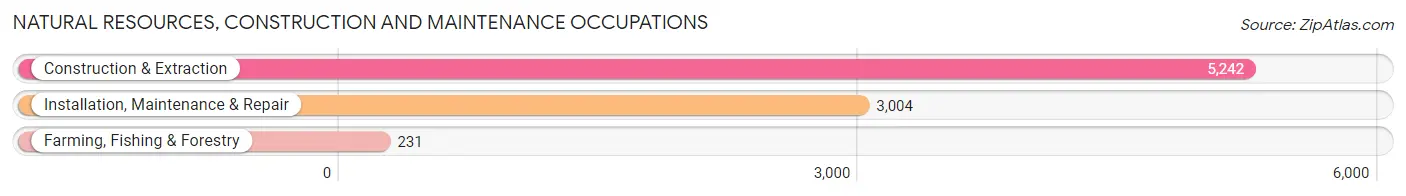
Natural Resources, Construction and Maintenance Occupations
The most common Natural Resources, Construction and Maintenance occupations in Thornton are Construction & Extraction (5,242 | 6.8%), Installation, Maintenance & Repair (3,004 | 3.9%), and Farming, Fishing & Forestry (231 | 0.3%).
Natural Resources, Construction and Maintenance Occupations by Sex
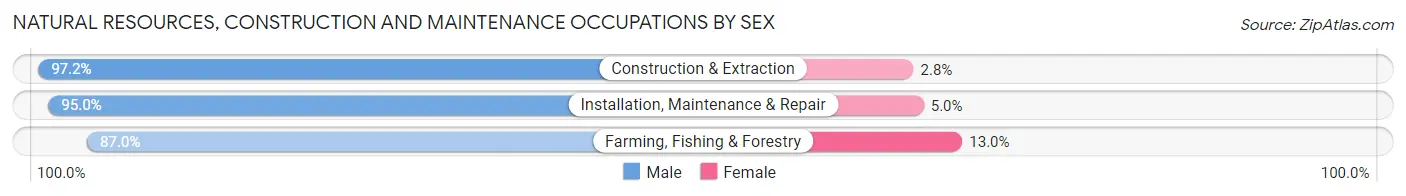
| Occupation | Male | Female |
| Farming, Fishing & Forestry | 201 (87.0%) | 30 (13.0%) |
| Construction & Extraction | 5,093 (97.2%) | 149 (2.8%) |
| Installation, Maintenance & Repair | 2,855 (95.0%) | 149 (5.0%) |
| Total (Category) | 8,149 (96.1%) | 328 (3.9%) |
| Total (Overall) | 41,228 (53.7%) | 35,472 (46.3%) |
Production, Transportation and Moving Occupations
The most common Production, Transportation and Moving occupations in Thornton are Transportation (3,734 | 4.9%), Production (3,627 | 4.7%), and Material Moving (2,946 | 3.8%).
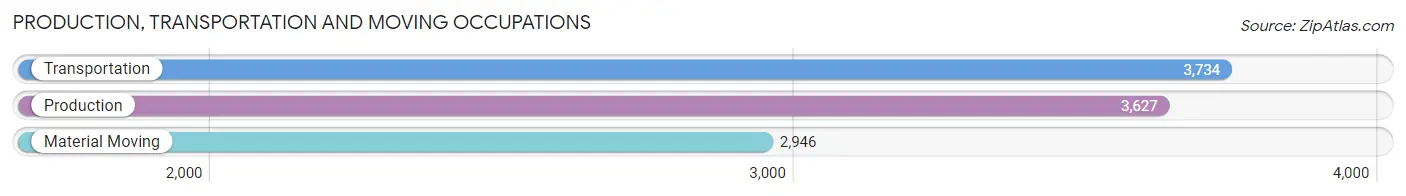
Production, Transportation and Moving Occupations by Sex
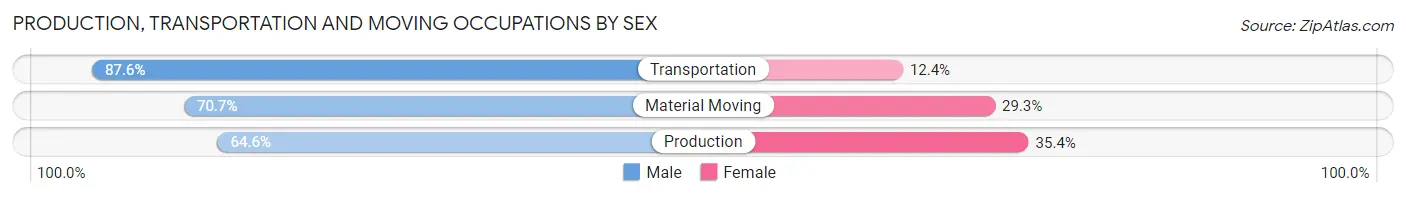
| Occupation | Male | Female |
| Production | 2,342 (64.6%) | 1,285 (35.4%) |
| Transportation | 3,272 (87.6%) | 462 (12.4%) |
| Material Moving | 2,084 (70.7%) | 862 (29.3%) |
| Total (Category) | 7,698 (74.7%) | 2,609 (25.3%) |
| Total (Overall) | 41,228 (53.7%) | 35,472 (46.3%) |
Employment Industries by Sex in Thornton
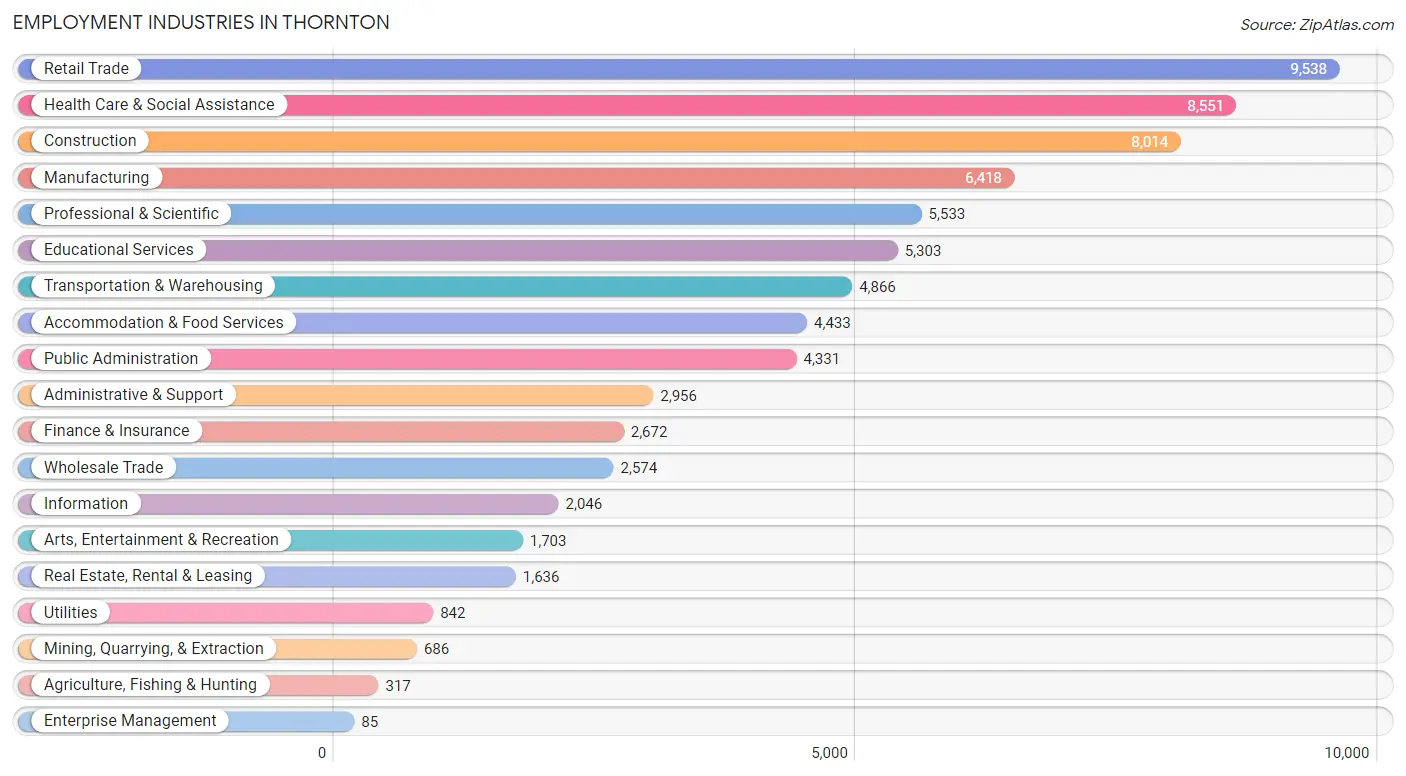
Employment Industries in Thornton
The major employment industries in Thornton include Retail Trade (9,538 | 12.4%), Health Care & Social Assistance (8,551 | 11.2%), Construction (8,014 | 10.4%), Manufacturing (6,418 | 8.4%), and Professional & Scientific (5,533 | 7.2%).
Employment Industries by Sex in Thornton
The Thornton industries that see more men than women are Construction (90.0%), Agriculture, Fishing & Hunting (84.2%), and Transportation & Warehousing (75.5%), whereas the industries that tend to have a higher number of women are Health Care & Social Assistance (84.0%), Educational Services (73.1%), and Finance & Insurance (69.6%).
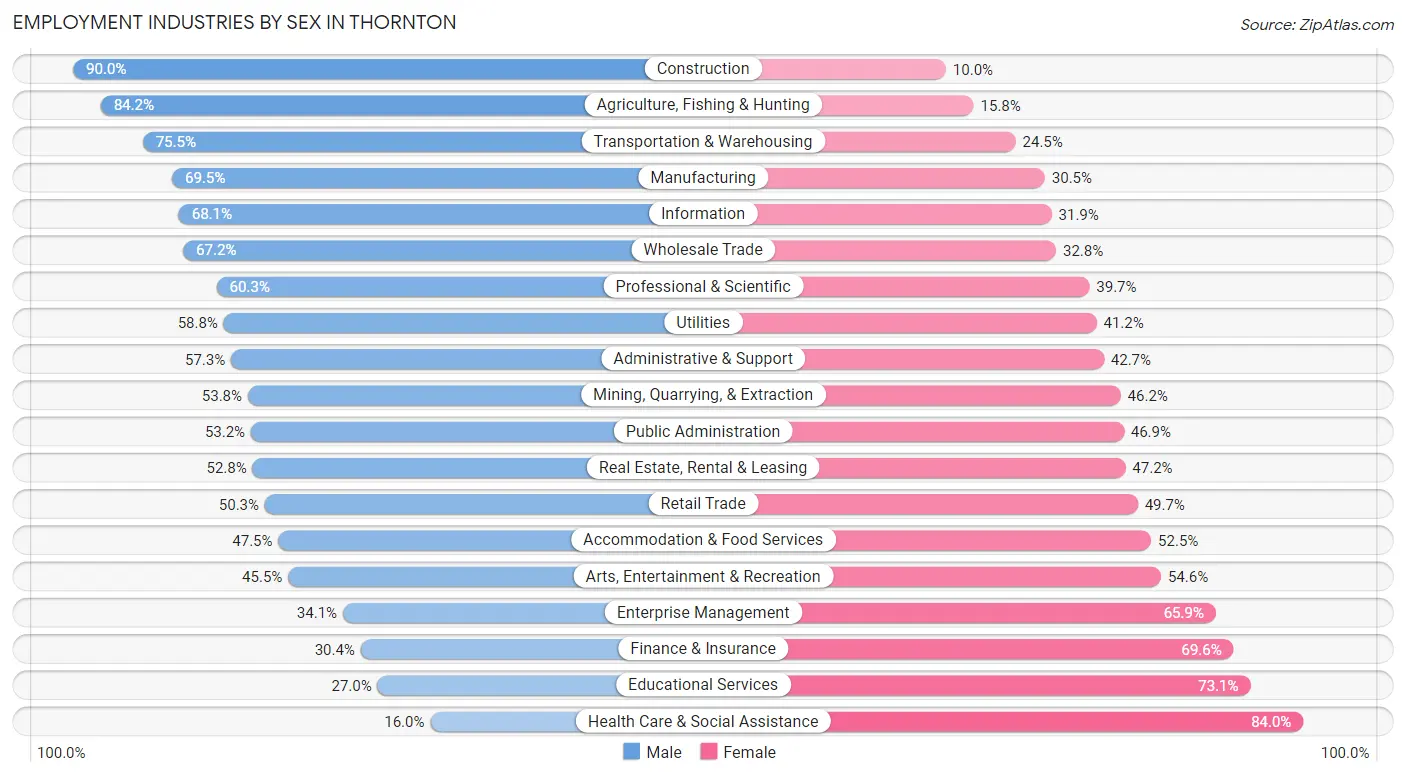
| Industry | Male | Female |
| Agriculture, Fishing & Hunting | 267 (84.2%) | 50 (15.8%) |
| Mining, Quarrying, & Extraction | 369 (53.8%) | 317 (46.2%) |
| Construction | 7,209 (90.0%) | 805 (10.0%) |
| Manufacturing | 4,459 (69.5%) | 1,959 (30.5%) |
| Wholesale Trade | 1,729 (67.2%) | 845 (32.8%) |
| Retail Trade | 4,795 (50.3%) | 4,743 (49.7%) |
| Transportation & Warehousing | 3,676 (75.5%) | 1,190 (24.5%) |
| Utilities | 495 (58.8%) | 347 (41.2%) |
| Information | 1,393 (68.1%) | 653 (31.9%) |
| Finance & Insurance | 813 (30.4%) | 1,859 (69.6%) |
| Real Estate, Rental & Leasing | 864 (52.8%) | 772 (47.2%) |
| Professional & Scientific | 3,335 (60.3%) | 2,198 (39.7%) |
| Enterprise Management | 29 (34.1%) | 56 (65.9%) |
| Administrative & Support | 1,693 (57.3%) | 1,263 (42.7%) |
| Educational Services | 1,429 (27.0%) | 3,874 (73.1%) |
| Health Care & Social Assistance | 1,370 (16.0%) | 7,181 (84.0%) |
| Arts, Entertainment & Recreation | 774 (45.5%) | 929 (54.5%) |
| Accommodation & Food Services | 2,105 (47.5%) | 2,328 (52.5%) |
| Public Administration | 2,302 (53.1%) | 2,029 (46.9%) |
| Total | 41,228 (53.7%) | 35,472 (46.3%) |
Education in Thornton
School Enrollment in Thornton
The most common levels of schooling among the 38,249 students in Thornton are middle school (10,365 | 27.1%), elementary school (8,188 | 21.4%), and high school (7,832 | 20.5%).
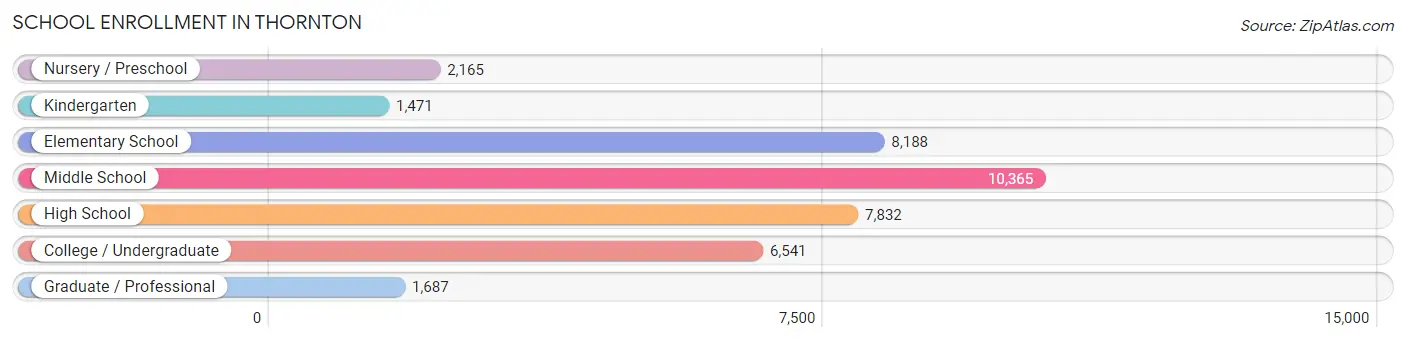
| School Level | # Students | % Students |
| Nursery / Preschool | 2,165 | 5.7% |
| Kindergarten | 1,471 | 3.8% |
| Elementary School | 8,188 | 21.4% |
| Middle School | 10,365 | 27.1% |
| High School | 7,832 | 20.5% |
| College / Undergraduate | 6,541 | 17.1% |
| Graduate / Professional | 1,687 | 4.4% |
| Total | 38,249 | 100.0% |
School Enrollment by Age by Funding Source in Thornton
Out of a total of 38,249 students who are enrolled in schools in Thornton, 3,901 (10.2%) attend a private institution, while the remaining 34,348 (89.8%) are enrolled in public schools. The age group of 35 years and over has the highest likelihood of being enrolled in private schools, with 438 (30.3% in the age bracket) enrolled. Conversely, the age group of 15 to 17 year olds has the lowest likelihood of being enrolled in a private school, with 5,693 (95.2% in the age bracket) attending a public institution.
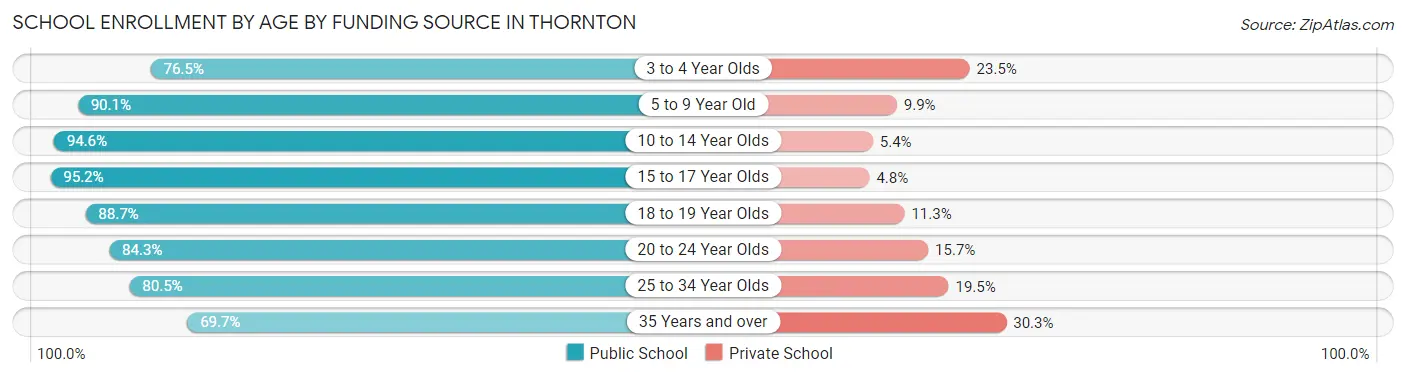
| Age Bracket | Public School | Private School |
| 3 to 4 Year Olds | 1,223 (76.5%) | 375 (23.5%) |
| 5 to 9 Year Old | 8,219 (90.1%) | 903 (9.9%) |
| 10 to 14 Year Olds | 11,550 (94.6%) | 665 (5.4%) |
| 15 to 17 Year Olds | 5,693 (95.2%) | 287 (4.8%) |
| 18 to 19 Year Olds | 1,847 (88.7%) | 236 (11.3%) |
| 20 to 24 Year Olds | 2,885 (84.3%) | 539 (15.7%) |
| 25 to 34 Year Olds | 1,916 (80.5%) | 465 (19.5%) |
| 35 Years and over | 1,008 (69.7%) | 438 (30.3%) |
| Total | 34,348 (89.8%) | 3,901 (10.2%) |
Educational Attainment by Field of Study in Thornton
Business (5,976 | 19.9%), science & technology (2,687 | 9.0%), engineering (2,550 | 8.5%), arts & humanities (2,408 | 8.0%), and education (2,354 | 7.9%) are the most common fields of study among 29,984 individuals in Thornton who have obtained a bachelor's degree or higher.
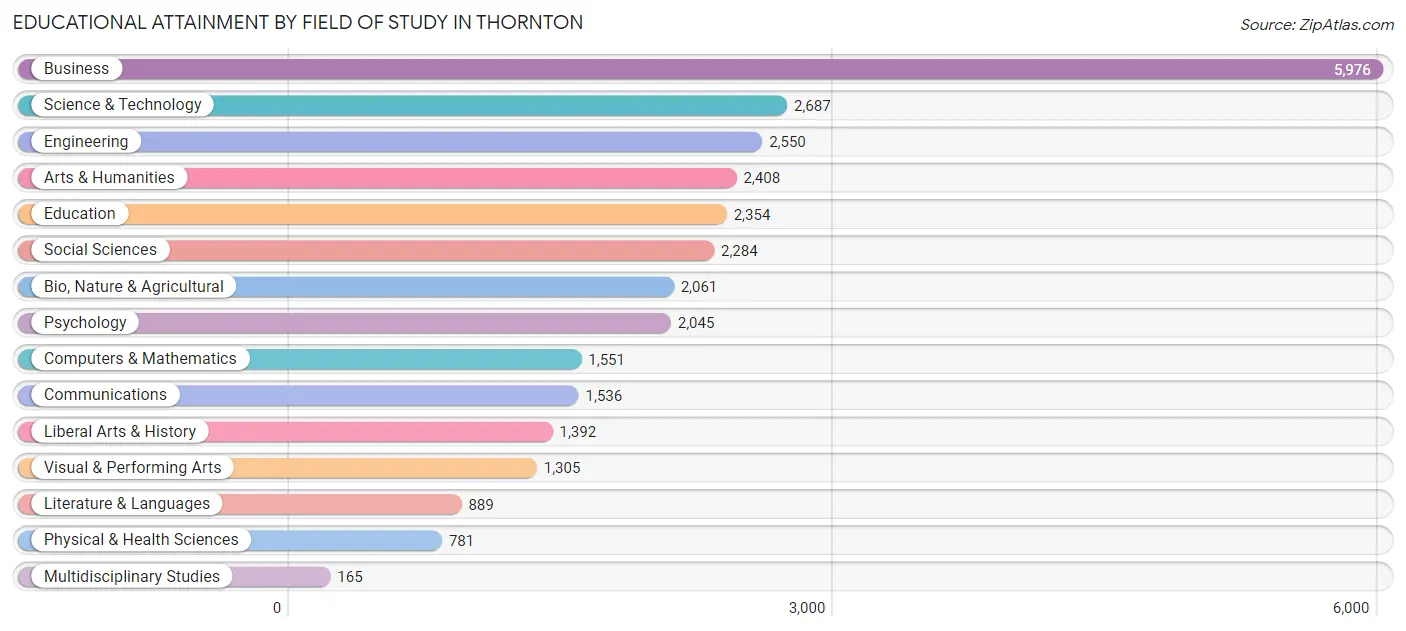
| Field of Study | # Graduates | % Graduates |
| Computers & Mathematics | 1,551 | 5.2% |
| Bio, Nature & Agricultural | 2,061 | 6.9% |
| Physical & Health Sciences | 781 | 2.6% |
| Psychology | 2,045 | 6.8% |
| Social Sciences | 2,284 | 7.6% |
| Engineering | 2,550 | 8.5% |
| Multidisciplinary Studies | 165 | 0.5% |
| Science & Technology | 2,687 | 9.0% |
| Business | 5,976 | 19.9% |
| Education | 2,354 | 7.9% |
| Literature & Languages | 889 | 3.0% |
| Liberal Arts & History | 1,392 | 4.6% |
| Visual & Performing Arts | 1,305 | 4.3% |
| Communications | 1,536 | 5.1% |
| Arts & Humanities | 2,408 | 8.0% |
| Total | 29,984 | 100.0% |
Transportation & Commute in Thornton
Vehicle Availability by Sex in Thornton
The most prevalent vehicle ownership categories in Thornton are males with 2 vehicles (16,261, accounting for 39.8%) and females with 2 vehicles (13,894, making up 46.6%).
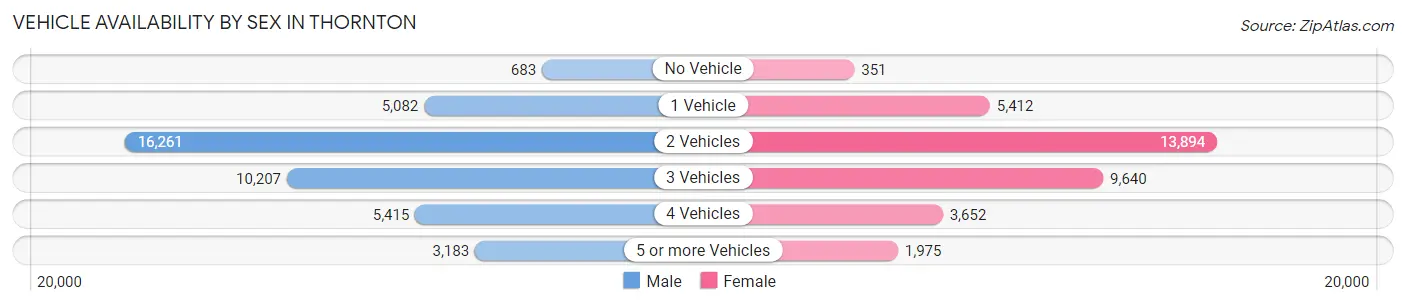
| Vehicles Available | Male | Female |
| No Vehicle | 683 (1.7%) | 351 (1.0%) |
| 1 Vehicle | 5,082 (12.4%) | 5,412 (15.5%) |
| 2 Vehicles | 16,261 (39.8%) | 13,894 (39.8%) |
| 3 Vehicles | 10,207 (25.0%) | 9,640 (27.6%) |
| 4 Vehicles | 5,415 (13.3%) | 3,652 (10.5%) |
| 5 or more Vehicles | 3,183 (7.8%) | 1,975 (5.7%) |
| Total | 40,831 (100.0%) | 34,924 (100.0%) |
Commute Time in Thornton
The most frequently occuring commute durations in Thornton are 30 to 34 minutes (12,152 commuters, 18.3%), 15 to 19 minutes (9,718 commuters, 14.7%), and 20 to 24 minutes (8,628 commuters, 13.0%).
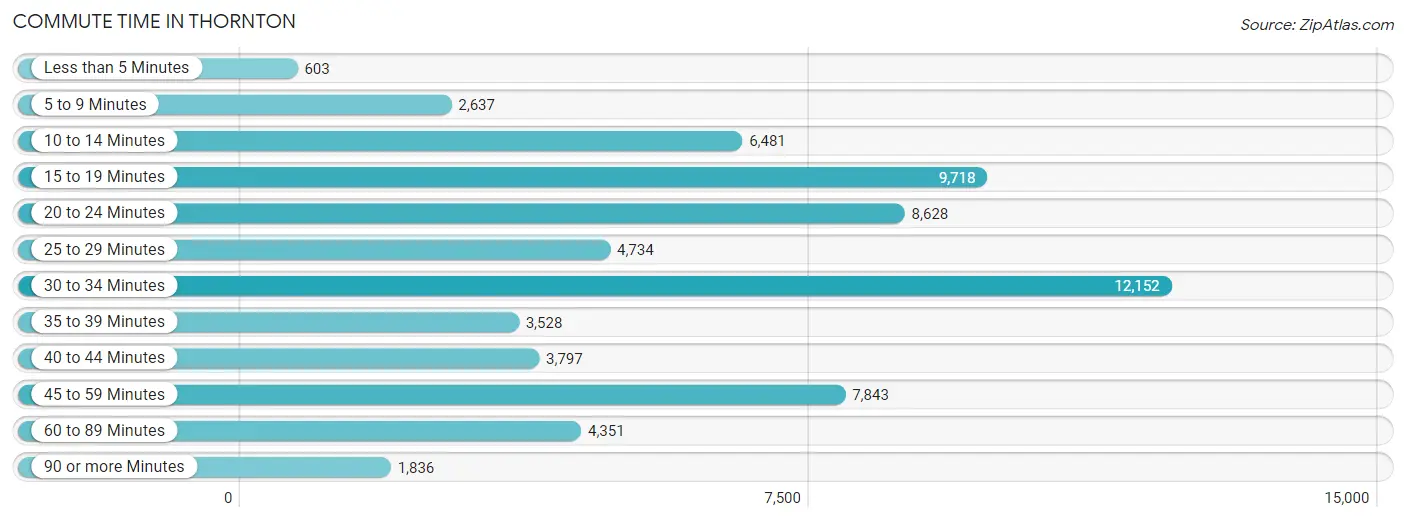
| Commute Time | # Commuters | % Commuters |
| Less than 5 Minutes | 603 | 0.9% |
| 5 to 9 Minutes | 2,637 | 4.0% |
| 10 to 14 Minutes | 6,481 | 9.8% |
| 15 to 19 Minutes | 9,718 | 14.7% |
| 20 to 24 Minutes | 8,628 | 13.0% |
| 25 to 29 Minutes | 4,734 | 7.1% |
| 30 to 34 Minutes | 12,152 | 18.3% |
| 35 to 39 Minutes | 3,528 | 5.3% |
| 40 to 44 Minutes | 3,797 | 5.7% |
| 45 to 59 Minutes | 7,843 | 11.8% |
| 60 to 89 Minutes | 4,351 | 6.6% |
| 90 or more Minutes | 1,836 | 2.8% |
Commute Time by Sex in Thornton
The most common commute times in Thornton are 30 to 34 minutes (6,924 commuters, 19.0%) for males and 30 to 34 minutes (5,228 commuters, 17.5%) for females.
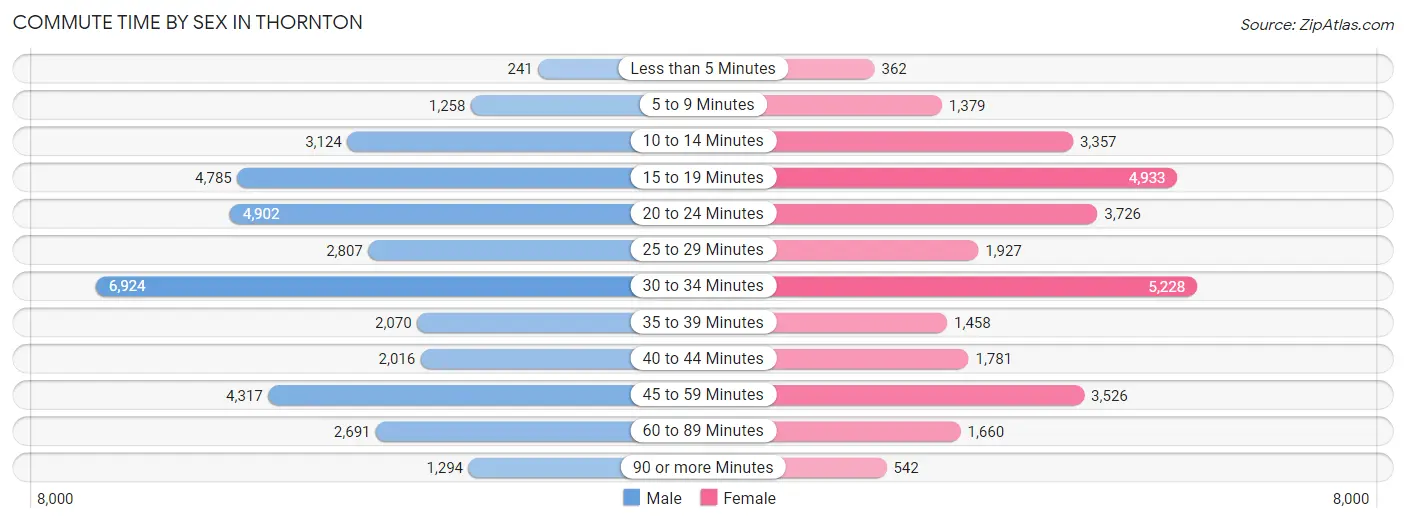
| Commute Time | Male | Female |
| Less than 5 Minutes | 241 (0.7%) | 362 (1.2%) |
| 5 to 9 Minutes | 1,258 (3.5%) | 1,379 (4.6%) |
| 10 to 14 Minutes | 3,124 (8.6%) | 3,357 (11.2%) |
| 15 to 19 Minutes | 4,785 (13.1%) | 4,933 (16.5%) |
| 20 to 24 Minutes | 4,902 (13.5%) | 3,726 (12.5%) |
| 25 to 29 Minutes | 2,807 (7.7%) | 1,927 (6.5%) |
| 30 to 34 Minutes | 6,924 (19.0%) | 5,228 (17.5%) |
| 35 to 39 Minutes | 2,070 (5.7%) | 1,458 (4.9%) |
| 40 to 44 Minutes | 2,016 (5.5%) | 1,781 (6.0%) |
| 45 to 59 Minutes | 4,317 (11.8%) | 3,526 (11.8%) |
| 60 to 89 Minutes | 2,691 (7.4%) | 1,660 (5.6%) |
| 90 or more Minutes | 1,294 (3.5%) | 542 (1.8%) |
Time of Departure to Work by Sex in Thornton
The most frequent times of departure to work in Thornton are 7:00 AM to 7:29 AM (5,499, 15.1%) for males and 7:00 AM to 7:29 AM (5,164, 17.3%) for females.
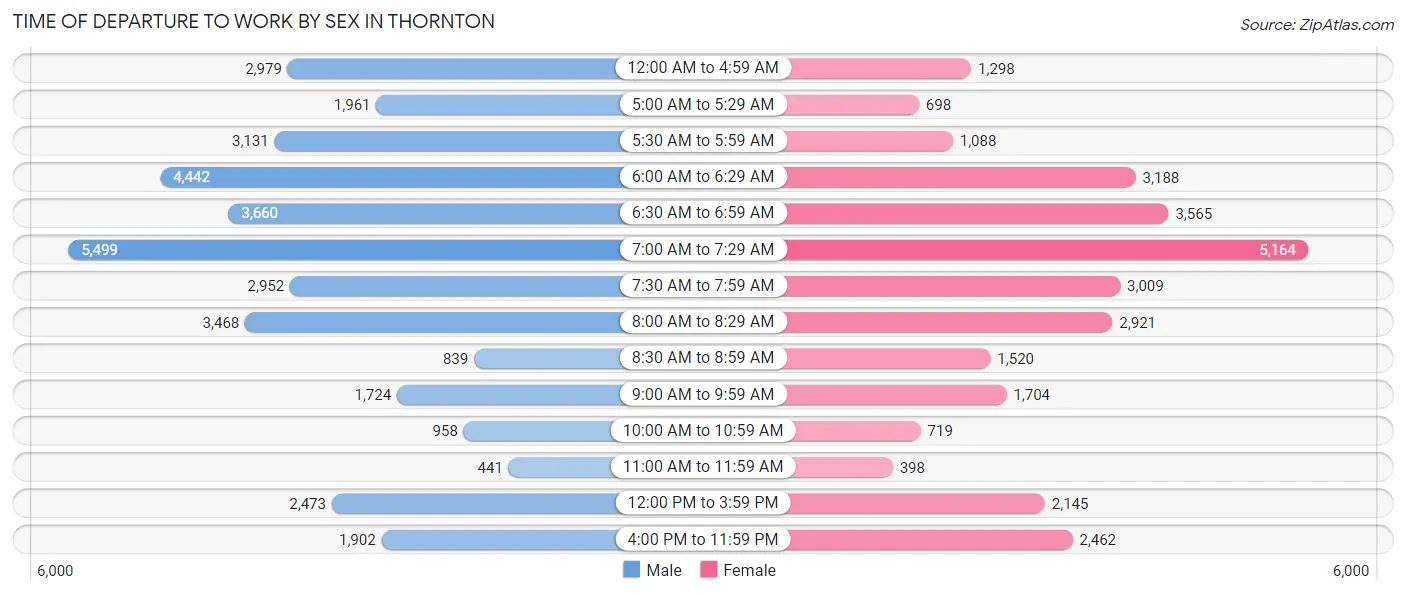
| Time of Departure | Male | Female |
| 12:00 AM to 4:59 AM | 2,979 (8.2%) | 1,298 (4.3%) |
| 5:00 AM to 5:29 AM | 1,961 (5.4%) | 698 (2.3%) |
| 5:30 AM to 5:59 AM | 3,131 (8.6%) | 1,088 (3.6%) |
| 6:00 AM to 6:29 AM | 4,442 (12.2%) | 3,188 (10.7%) |
| 6:30 AM to 6:59 AM | 3,660 (10.1%) | 3,565 (11.9%) |
| 7:00 AM to 7:29 AM | 5,499 (15.1%) | 5,164 (17.3%) |
| 7:30 AM to 7:59 AM | 2,952 (8.1%) | 3,009 (10.1%) |
| 8:00 AM to 8:29 AM | 3,468 (9.5%) | 2,921 (9.8%) |
| 8:30 AM to 8:59 AM | 839 (2.3%) | 1,520 (5.1%) |
| 9:00 AM to 9:59 AM | 1,724 (4.7%) | 1,704 (5.7%) |
| 10:00 AM to 10:59 AM | 958 (2.6%) | 719 (2.4%) |
| 11:00 AM to 11:59 AM | 441 (1.2%) | 398 (1.3%) |
| 12:00 PM to 3:59 PM | 2,473 (6.8%) | 2,145 (7.2%) |
| 4:00 PM to 11:59 PM | 1,902 (5.2%) | 2,462 (8.2%) |
| Total | 36,429 (100.0%) | 29,879 (100.0%) |
Housing Occupancy in Thornton
Occupancy by Ownership in Thornton
Of the total 48,466 dwellings in Thornton, owner-occupied units account for 35,254 (72.7%), while renter-occupied units make up 13,212 (27.3%).
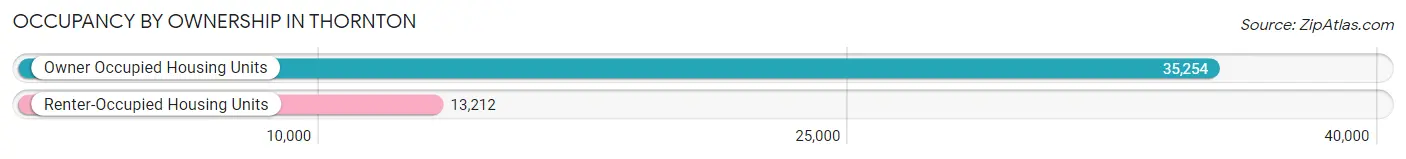
| Occupancy | # Housing Units | % Housing Units |
| Owner Occupied Housing Units | 35,254 | 72.7% |
| Renter-Occupied Housing Units | 13,212 | 27.3% |
| Total Occupied Housing Units | 48,466 | 100.0% |
Occupancy by Household Size in Thornton
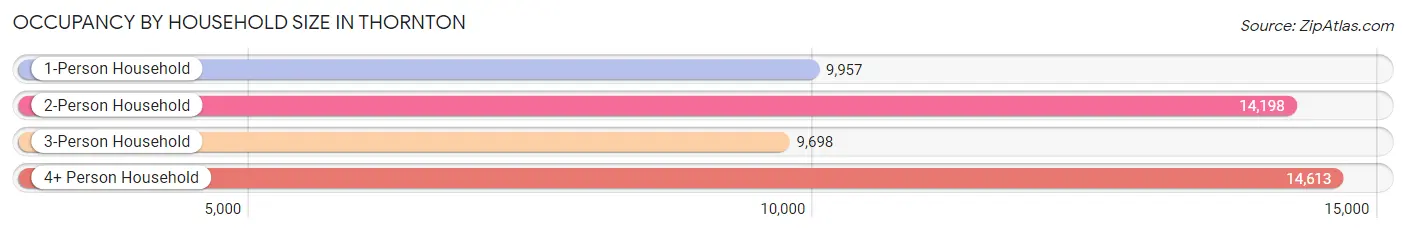
| Household Size | # Housing Units | % Housing Units |
| 1-Person Household | 9,957 | 20.5% |
| 2-Person Household | 14,198 | 29.3% |
| 3-Person Household | 9,698 | 20.0% |
| 4+ Person Household | 14,613 | 30.1% |
| Total Housing Units | 48,466 | 100.0% |
Occupancy by Ownership by Household Size in Thornton
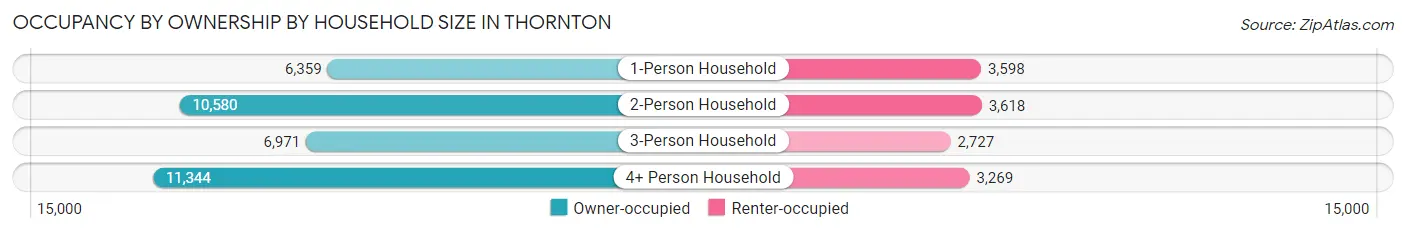
| Household Size | Owner-occupied | Renter-occupied |
| 1-Person Household | 6,359 (63.9%) | 3,598 (36.1%) |
| 2-Person Household | 10,580 (74.5%) | 3,618 (25.5%) |
| 3-Person Household | 6,971 (71.9%) | 2,727 (28.1%) |
| 4+ Person Household | 11,344 (77.6%) | 3,269 (22.4%) |
| Total Housing Units | 35,254 (72.7%) | 13,212 (27.3%) |
Occupancy by Educational Attainment in Thornton
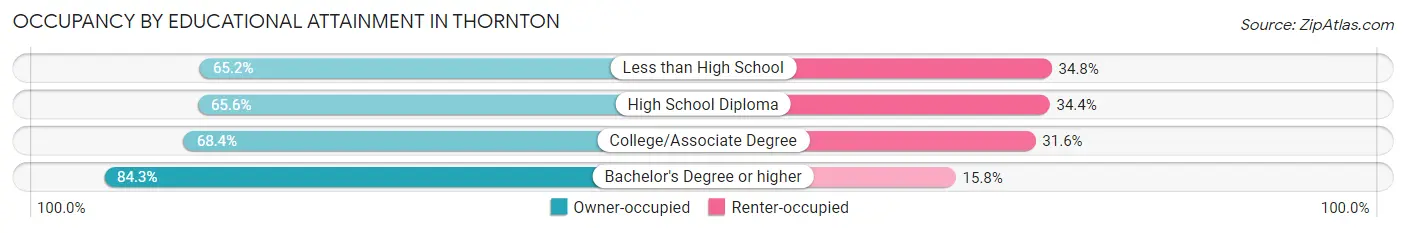
| Household Size | Owner-occupied | Renter-occupied |
| Less than High School | 2,863 (65.2%) | 1,527 (34.8%) |
| High School Diploma | 7,783 (65.6%) | 4,077 (34.4%) |
| College/Associate Degree | 10,968 (68.4%) | 5,059 (31.6%) |
| Bachelor's Degree or higher | 13,640 (84.3%) | 2,549 (15.8%) |
Occupancy by Age of Householder in Thornton
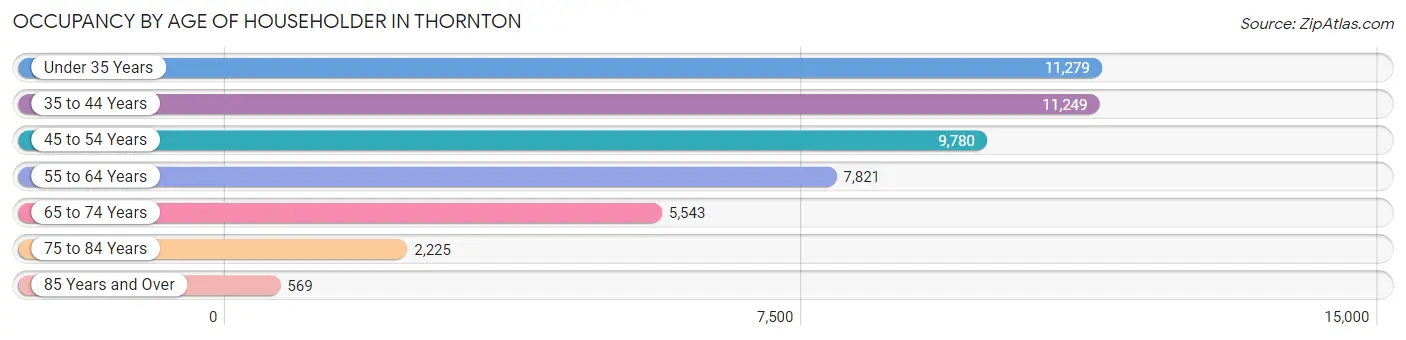
| Age Bracket | # Households | % Households |
| Under 35 Years | 11,279 | 23.3% |
| 35 to 44 Years | 11,249 | 23.2% |
| 45 to 54 Years | 9,780 | 20.2% |
| 55 to 64 Years | 7,821 | 16.1% |
| 65 to 74 Years | 5,543 | 11.4% |
| 75 to 84 Years | 2,225 | 4.6% |
| 85 Years and Over | 569 | 1.2% |
| Total | 48,466 | 100.0% |
Housing Finances in Thornton
Median Income by Occupancy in Thornton
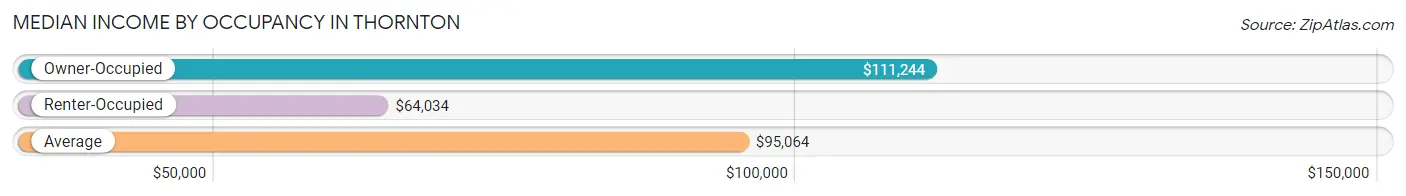
| Occupancy Type | # Households | Median Income |
| Owner-Occupied | 35,254 (72.7%) | $111,244 |
| Renter-Occupied | 13,212 (27.3%) | $64,034 |
| Average | 48,466 (100.0%) | $95,064 |
Occupancy by Householder Income Bracket in Thornton
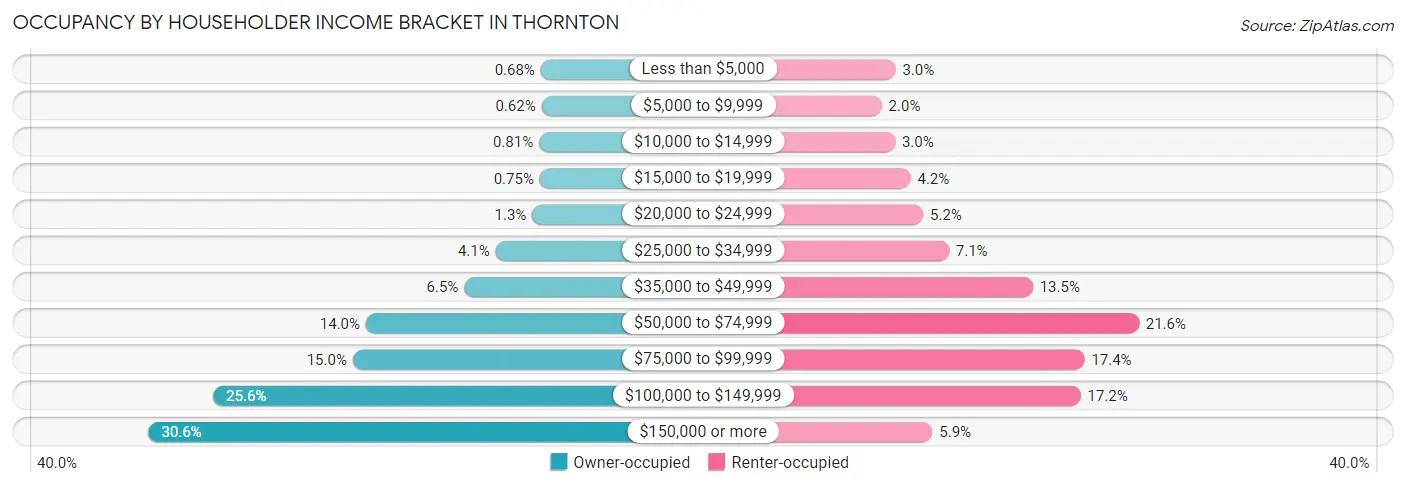
| Income Bracket | Owner-occupied | Renter-occupied |
| Less than $5,000 | 238 (0.7%) | 401 (3.0%) |
| $5,000 to $9,999 | 217 (0.6%) | 263 (2.0%) |
| $10,000 to $14,999 | 284 (0.8%) | 397 (3.0%) |
| $15,000 to $19,999 | 263 (0.7%) | 553 (4.2%) |
| $20,000 to $24,999 | 469 (1.3%) | 681 (5.1%) |
| $25,000 to $34,999 | 1,454 (4.1%) | 940 (7.1%) |
| $35,000 to $49,999 | 2,295 (6.5%) | 1,783 (13.5%) |
| $50,000 to $74,999 | 4,936 (14.0%) | 2,851 (21.6%) |
| $75,000 to $99,999 | 5,287 (15.0%) | 2,304 (17.4%) |
| $100,000 to $149,999 | 9,037 (25.6%) | 2,266 (17.2%) |
| $150,000 or more | 10,774 (30.6%) | 773 (5.9%) |
| Total | 35,254 (100.0%) | 13,212 (100.0%) |
Monthly Housing Cost Tiers in Thornton
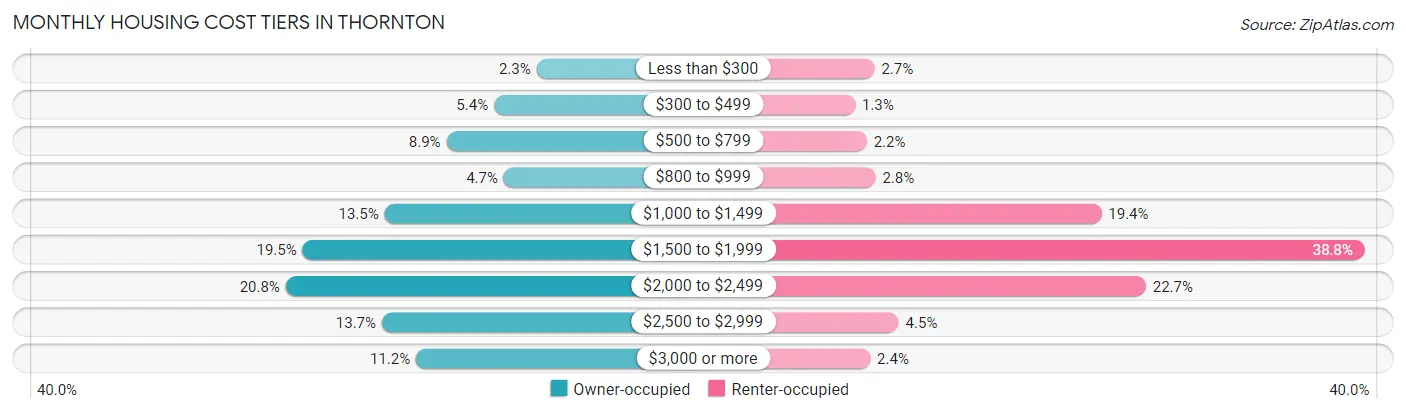
| Monthly Cost | Owner-occupied | Renter-occupied |
| Less than $300 | 806 (2.3%) | 361 (2.7%) |
| $300 to $499 | 1,913 (5.4%) | 171 (1.3%) |
| $500 to $799 | 3,149 (8.9%) | 285 (2.2%) |
| $800 to $999 | 1,661 (4.7%) | 370 (2.8%) |
| $1,000 to $1,499 | 4,755 (13.5%) | 2,568 (19.4%) |
| $1,500 to $1,999 | 6,885 (19.5%) | 5,131 (38.8%) |
| $2,000 to $2,499 | 7,322 (20.8%) | 3,001 (22.7%) |
| $2,500 to $2,999 | 4,826 (13.7%) | 596 (4.5%) |
| $3,000 or more | 3,937 (11.2%) | 319 (2.4%) |
| Total | 35,254 (100.0%) | 13,212 (100.0%) |
Physical Housing Characteristics in Thornton
Housing Structures in Thornton
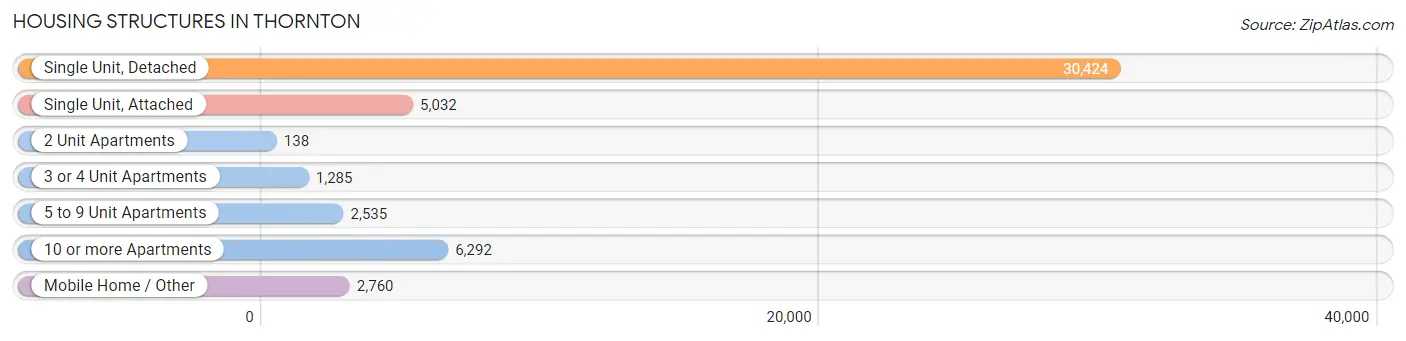
| Structure Type | # Housing Units | % Housing Units |
| Single Unit, Detached | 30,424 | 62.8% |
| Single Unit, Attached | 5,032 | 10.4% |
| 2 Unit Apartments | 138 | 0.3% |
| 3 or 4 Unit Apartments | 1,285 | 2.6% |
| 5 to 9 Unit Apartments | 2,535 | 5.2% |
| 10 or more Apartments | 6,292 | 13.0% |
| Mobile Home / Other | 2,760 | 5.7% |
| Total | 48,466 | 100.0% |
Housing Structures by Occupancy in Thornton
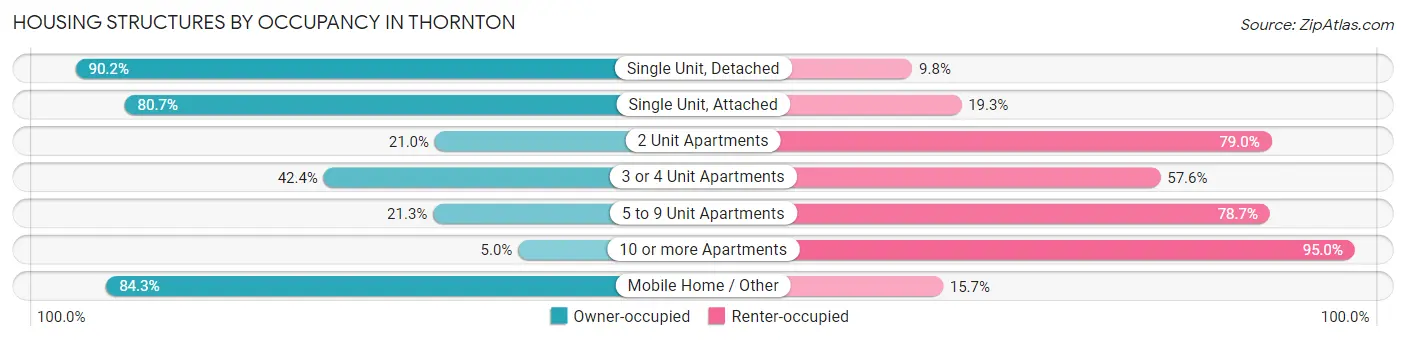
| Structure Type | Owner-occupied | Renter-occupied |
| Single Unit, Detached | 27,437 (90.2%) | 2,987 (9.8%) |
| Single Unit, Attached | 4,063 (80.7%) | 969 (19.3%) |
| 2 Unit Apartments | 29 (21.0%) | 109 (79.0%) |
| 3 or 4 Unit Apartments | 545 (42.4%) | 740 (57.6%) |
| 5 to 9 Unit Apartments | 541 (21.3%) | 1,994 (78.7%) |
| 10 or more Apartments | 313 (5.0%) | 5,979 (95.0%) |
| Mobile Home / Other | 2,326 (84.3%) | 434 (15.7%) |
| Total | 35,254 (72.7%) | 13,212 (27.3%) |
Housing Structures by Number of Rooms in Thornton
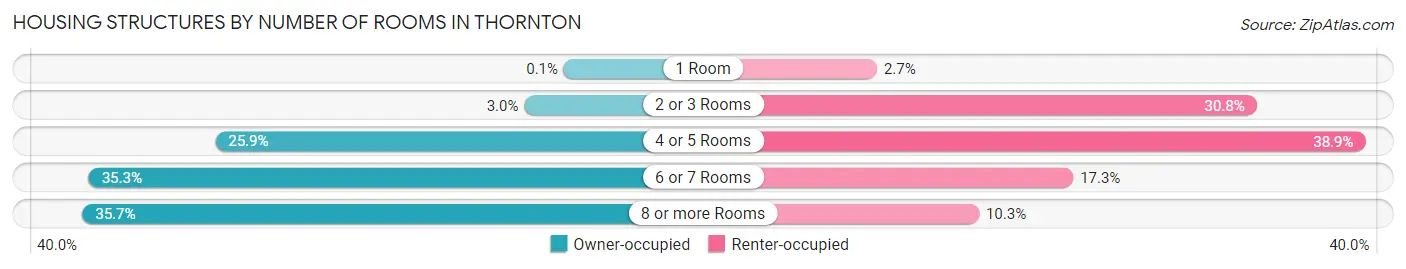
| Number of Rooms | Owner-occupied | Renter-occupied |
| 1 Room | 35 (0.1%) | 362 (2.7%) |
| 2 or 3 Rooms | 1,069 (3.0%) | 4,073 (30.8%) |
| 4 or 5 Rooms | 9,129 (25.9%) | 5,136 (38.9%) |
| 6 or 7 Rooms | 12,426 (35.2%) | 2,281 (17.3%) |
| 8 or more Rooms | 12,595 (35.7%) | 1,360 (10.3%) |
| Total | 35,254 (100.0%) | 13,212 (100.0%) |
Housing Structure by Heating Type in Thornton
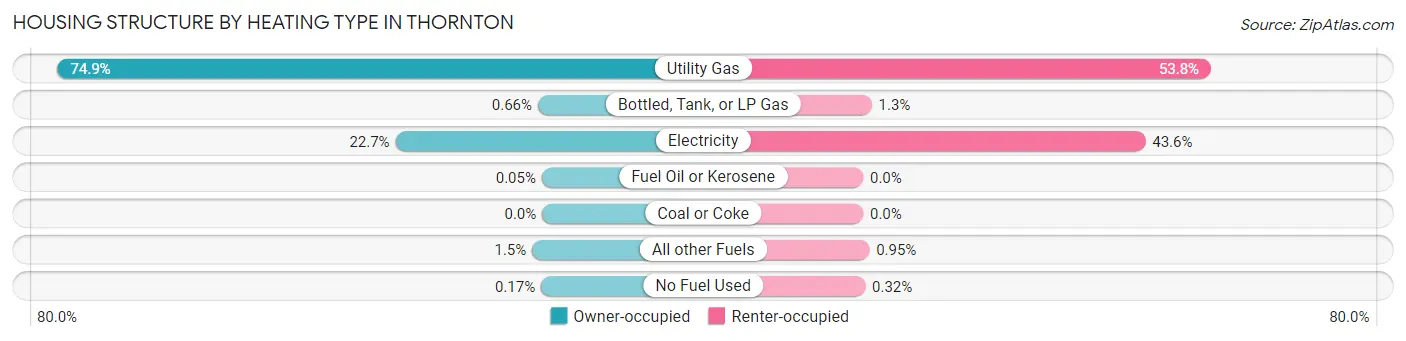
| Heating Type | Owner-occupied | Renter-occupied |
| Utility Gas | 26,413 (74.9%) | 7,106 (53.8%) |
| Bottled, Tank, or LP Gas | 232 (0.7%) | 174 (1.3%) |
| Electricity | 7,992 (22.7%) | 5,764 (43.6%) |
| Fuel Oil or Kerosene | 16 (0.1%) | 0 (0.0%) |
| Coal or Coke | 0 (0.0%) | 0 (0.0%) |
| All other Fuels | 542 (1.5%) | 126 (0.9%) |
| No Fuel Used | 59 (0.2%) | 42 (0.3%) |
| Total | 35,254 (100.0%) | 13,212 (100.0%) |
Household Vehicle Usage in Thornton
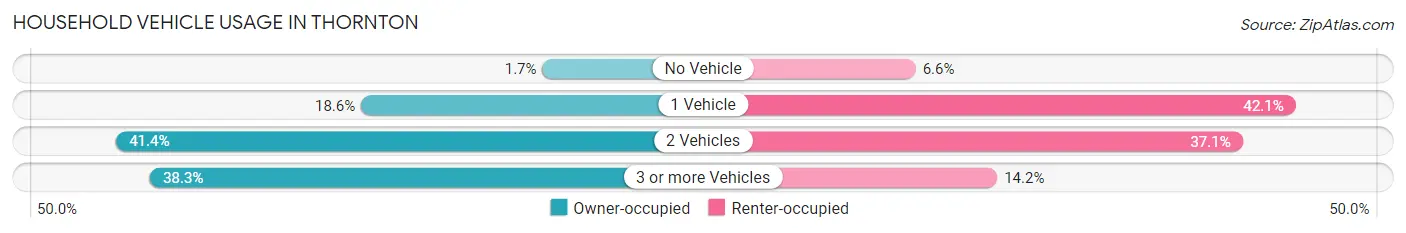
| Vehicles per Household | Owner-occupied | Renter-occupied |
| No Vehicle | 590 (1.7%) | 873 (6.6%) |
| 1 Vehicle | 6,555 (18.6%) | 5,557 (42.1%) |
| 2 Vehicles | 14,610 (41.4%) | 4,903 (37.1%) |
| 3 or more Vehicles | 13,499 (38.3%) | 1,879 (14.2%) |
| Total | 35,254 (100.0%) | 13,212 (100.0%) |
Real Estate & Mortgages in Thornton
Real Estate and Mortgage Overview in Thornton
| Characteristic | Without Mortgage | With Mortgage |
| Housing Units | 7,890 | 27,364 |
| Median Property Value | $390,500 | $458,200 |
| Median Household Income | $78,104 | $9,115 |
| Monthly Housing Costs | $635 | $3,937 |
| Real Estate Taxes | $2,178 | $630 |
Property Value by Mortgage Status in Thornton
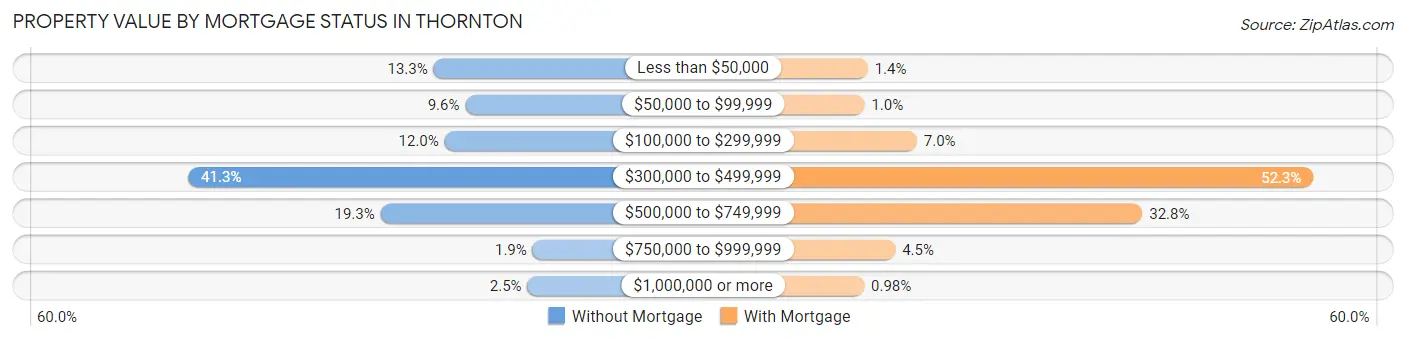
| Property Value | Without Mortgage | With Mortgage |
| Less than $50,000 | 1,046 (13.3%) | 379 (1.4%) |
| $50,000 to $99,999 | 760 (9.6%) | 280 (1.0%) |
| $100,000 to $299,999 | 947 (12.0%) | 1,917 (7.0%) |
| $300,000 to $499,999 | 3,260 (41.3%) | 14,314 (52.3%) |
| $500,000 to $749,999 | 1,524 (19.3%) | 8,966 (32.8%) |
| $750,000 to $999,999 | 153 (1.9%) | 1,239 (4.5%) |
| $1,000,000 or more | 200 (2.5%) | 269 (1.0%) |
| Total | 7,890 (100.0%) | 27,364 (100.0%) |
Household Income by Mortgage Status in Thornton
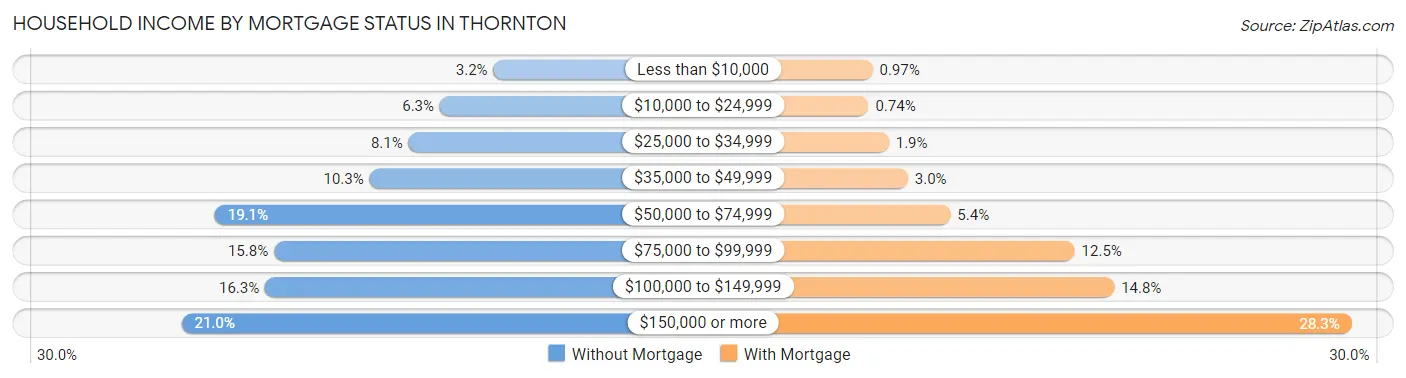
| Household Income | Without Mortgage | With Mortgage |
| Less than $10,000 | 253 (3.2%) | 266 (1.0%) |
| $10,000 to $24,999 | 495 (6.3%) | 202 (0.7%) |
| $25,000 to $34,999 | 636 (8.1%) | 521 (1.9%) |
| $35,000 to $49,999 | 812 (10.3%) | 818 (3.0%) |
| $50,000 to $74,999 | 1,509 (19.1%) | 1,483 (5.4%) |
| $75,000 to $99,999 | 1,243 (15.8%) | 3,427 (12.5%) |
| $100,000 to $149,999 | 1,283 (16.3%) | 4,044 (14.8%) |
| $150,000 or more | 1,659 (21.0%) | 7,754 (28.3%) |
| Total | 7,890 (100.0%) | 27,364 (100.0%) |
Property Value to Household Income Ratio in Thornton
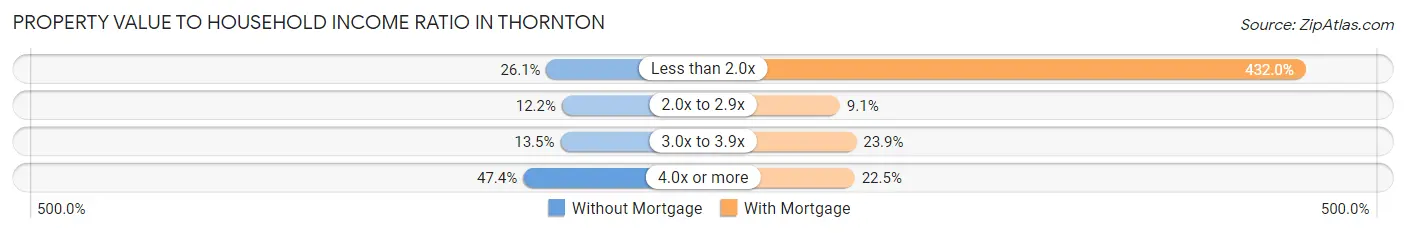
| Value-to-Income Ratio | Without Mortgage | With Mortgage |
| Less than 2.0x | 2,062 (26.1%) | 118,220 (432.0%) |
| 2.0x to 2.9x | 962 (12.2%) | 2,478 (9.1%) |
| 3.0x to 3.9x | 1,068 (13.5%) | 6,544 (23.9%) |
| 4.0x or more | 3,738 (47.4%) | 6,169 (22.5%) |
| Total | 7,890 (100.0%) | 27,364 (100.0%) |
Real Estate Taxes by Mortgage Status in Thornton
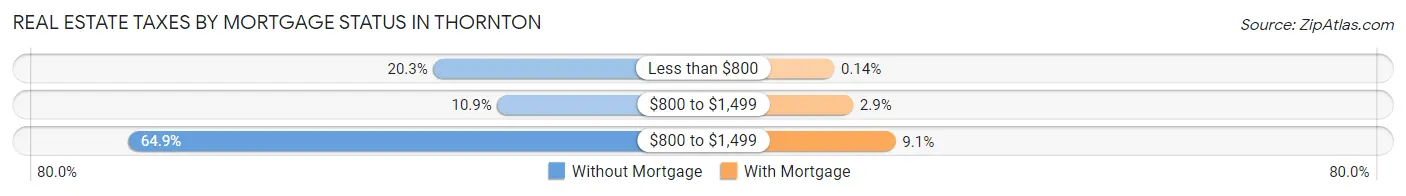
| Property Taxes | Without Mortgage | With Mortgage |
| Less than $800 | 1,598 (20.3%) | 38 (0.1%) |
| $800 to $1,499 | 859 (10.9%) | 794 (2.9%) |
| $800 to $1,499 | 5,121 (64.9%) | 2,492 (9.1%) |
| Total | 7,890 (100.0%) | 27,364 (100.0%) |
Health & Disability in Thornton
Health Insurance Coverage by Age in Thornton
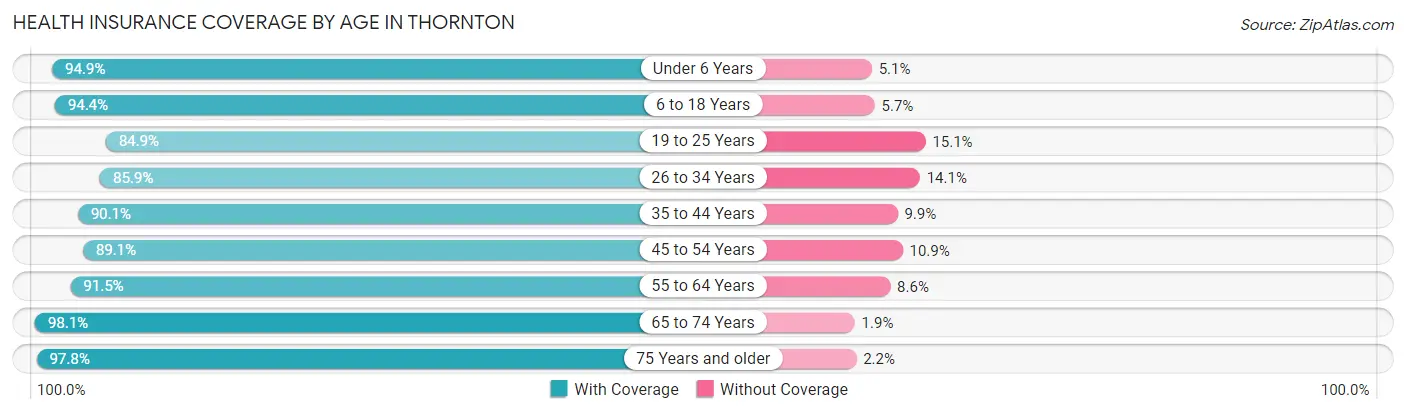
| Age Bracket | With Coverage | Without Coverage |
| Under 6 Years | 10,733 (94.9%) | 579 (5.1%) |
| 6 to 18 Years | 26,740 (94.4%) | 1,602 (5.7%) |
| 19 to 25 Years | 12,151 (84.9%) | 2,167 (15.1%) |
| 26 to 34 Years | 17,196 (85.9%) | 2,816 (14.1%) |
| 35 to 44 Years | 19,844 (90.1%) | 2,182 (9.9%) |
| 45 to 54 Years | 15,944 (89.1%) | 1,943 (10.9%) |
| 55 to 64 Years | 12,296 (91.4%) | 1,149 (8.6%) |
| 65 to 74 Years | 9,077 (98.1%) | 179 (1.9%) |
| 75 Years and older | 4,584 (97.8%) | 104 (2.2%) |
| Total | 128,565 (91.0%) | 12,721 (9.0%) |
Health Insurance Coverage by Citizenship Status in Thornton
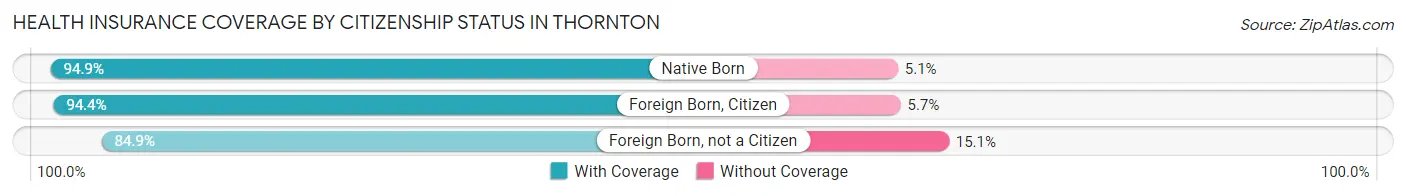
| Citizenship Status | With Coverage | Without Coverage |
| Native Born | 10,733 (94.9%) | 579 (5.1%) |
| Foreign Born, Citizen | 26,740 (94.4%) | 1,602 (5.7%) |
| Foreign Born, not a Citizen | 12,151 (84.9%) | 2,167 (15.1%) |
Health Insurance Coverage by Household Income in Thornton
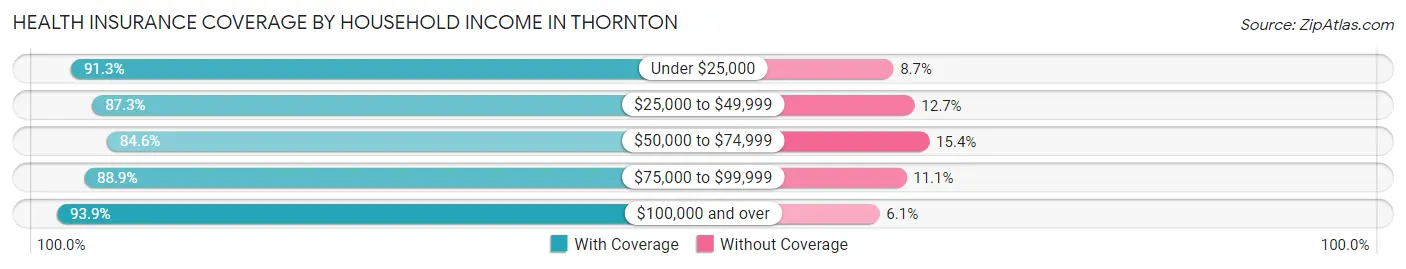
| Household Income | With Coverage | Without Coverage |
| Under $25,000 | 6,884 (91.3%) | 656 (8.7%) |
| $25,000 to $49,999 | 13,607 (87.3%) | 1,974 (12.7%) |
| $50,000 to $74,999 | 16,303 (84.6%) | 2,974 (15.4%) |
| $75,000 to $99,999 | 19,007 (88.9%) | 2,382 (11.1%) |
| $100,000 and over | 72,683 (93.9%) | 4,730 (6.1%) |
Public vs Private Health Insurance Coverage by Age in Thornton
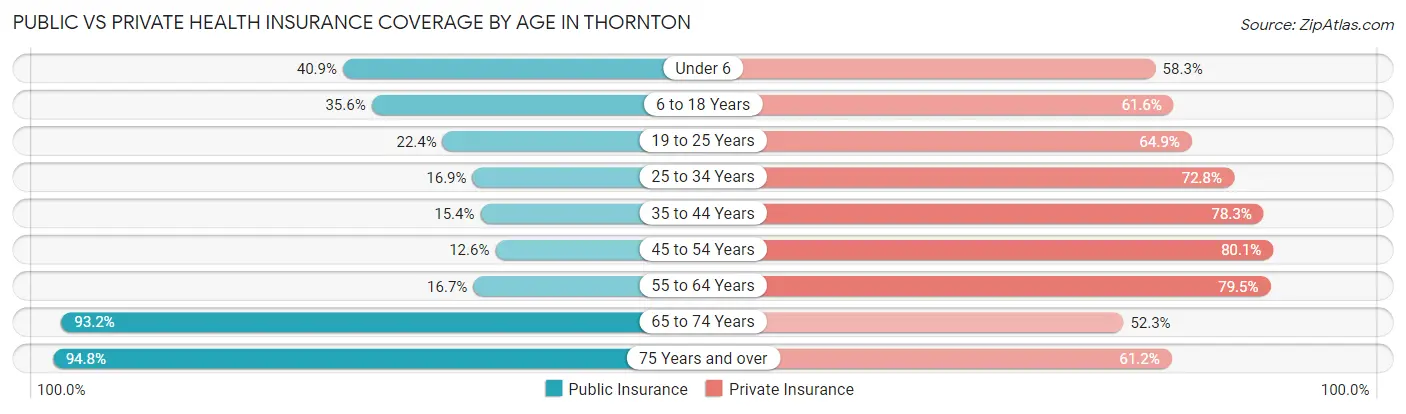
| Age Bracket | Public Insurance | Private Insurance |
| Under 6 | 4,631 (40.9%) | 6,590 (58.3%) |
| 6 to 18 Years | 10,093 (35.6%) | 17,458 (61.6%) |
| 19 to 25 Years | 3,210 (22.4%) | 9,296 (64.9%) |
| 25 to 34 Years | 3,381 (16.9%) | 14,558 (72.8%) |
| 35 to 44 Years | 3,395 (15.4%) | 17,246 (78.3%) |
| 45 to 54 Years | 2,261 (12.6%) | 14,323 (80.1%) |
| 55 to 64 Years | 2,251 (16.7%) | 10,693 (79.5%) |
| 65 to 74 Years | 8,623 (93.2%) | 4,839 (52.3%) |
| 75 Years and over | 4,443 (94.8%) | 2,869 (61.2%) |
| Total | 42,288 (29.9%) | 97,872 (69.3%) |
Disability Status by Sex by Age in Thornton
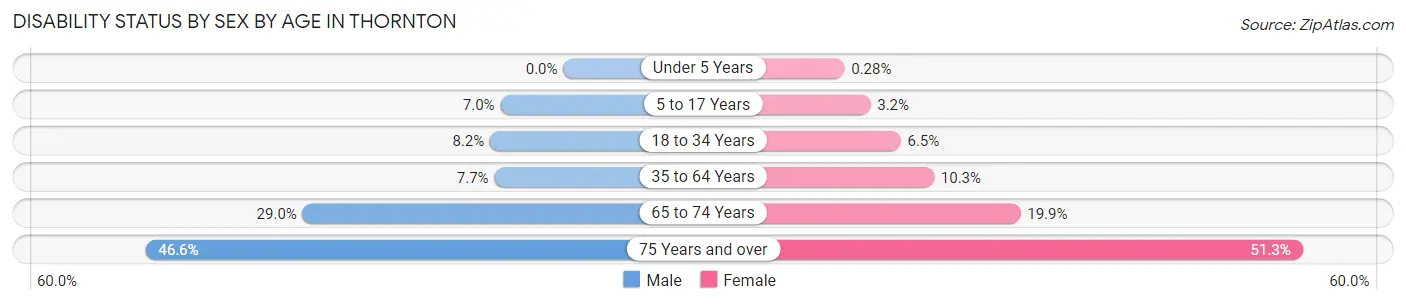
| Age Bracket | Male | Female |
| Under 5 Years | 0 (0.0%) | 13 (0.3%) |
| 5 to 17 Years | 1,001 (7.0%) | 436 (3.2%) |
| 18 to 34 Years | 1,523 (8.2%) | 1,152 (6.5%) |
| 35 to 64 Years | 2,062 (7.7%) | 2,718 (10.2%) |
| 65 to 74 Years | 1,193 (29.0%) | 1,023 (19.9%) |
| 75 Years and over | 965 (46.6%) | 1,342 (51.3%) |
Disability Class by Sex by Age in Thornton
Disability Class: Hearing Difficulty
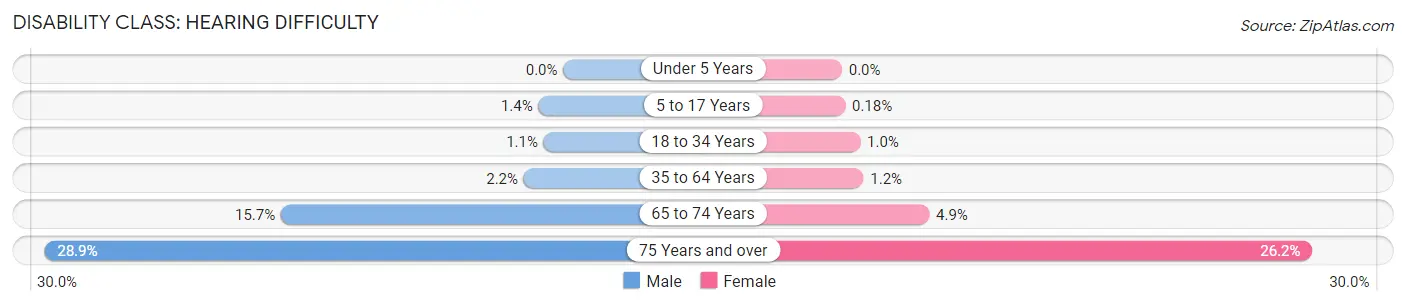
| Age Bracket | Male | Female |
| Under 5 Years | 0 (0.0%) | 0 (0.0%) |
| 5 to 17 Years | 197 (1.4%) | 25 (0.2%) |
| 18 to 34 Years | 203 (1.1%) | 180 (1.0%) |
| 35 to 64 Years | 591 (2.2%) | 318 (1.2%) |
| 65 to 74 Years | 646 (15.7%) | 250 (4.9%) |
| 75 Years and over | 599 (28.9%) | 685 (26.2%) |
Disability Class: Vision Difficulty
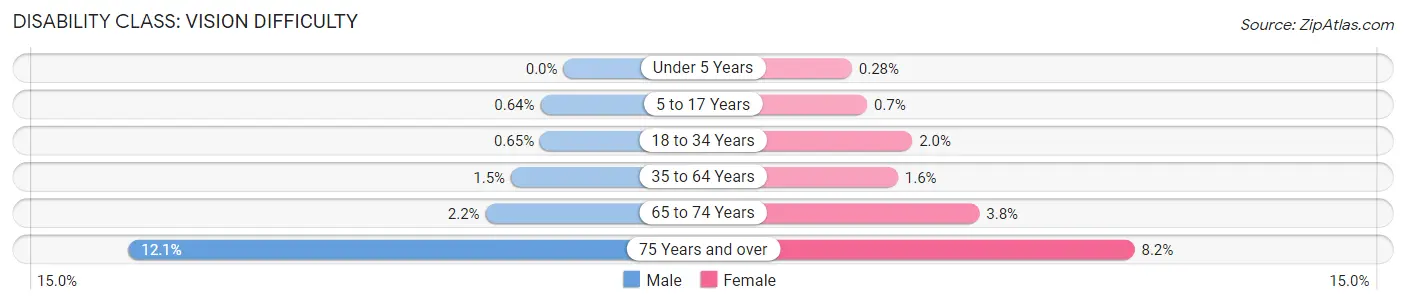
| Age Bracket | Male | Female |
| Under 5 Years | 0 (0.0%) | 13 (0.3%) |
| 5 to 17 Years | 92 (0.6%) | 96 (0.7%) |
| 18 to 34 Years | 122 (0.6%) | 346 (2.0%) |
| 35 to 64 Years | 393 (1.5%) | 414 (1.6%) |
| 65 to 74 Years | 89 (2.2%) | 197 (3.8%) |
| 75 Years and over | 251 (12.1%) | 213 (8.2%) |
Disability Class: Cognitive Difficulty
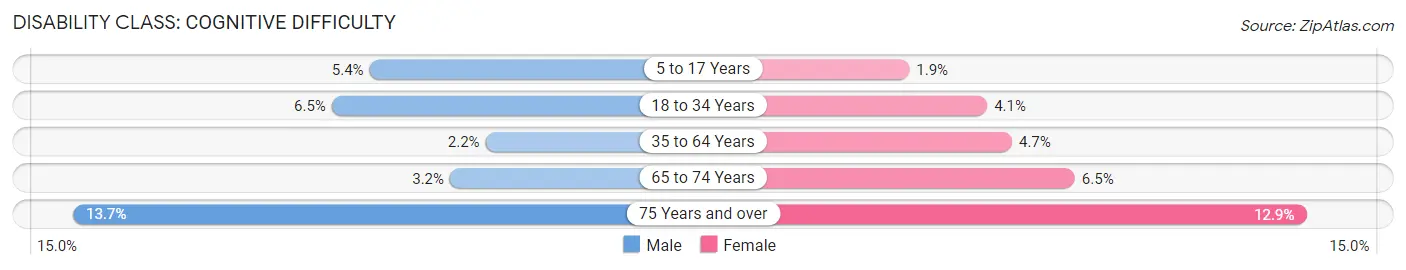
| Age Bracket | Male | Female |
| 5 to 17 Years | 771 (5.4%) | 258 (1.9%) |
| 18 to 34 Years | 1,205 (6.5%) | 714 (4.1%) |
| 35 to 64 Years | 583 (2.2%) | 1,256 (4.7%) |
| 65 to 74 Years | 130 (3.2%) | 334 (6.5%) |
| 75 Years and over | 283 (13.7%) | 338 (12.9%) |
Disability Class: Ambulatory Difficulty
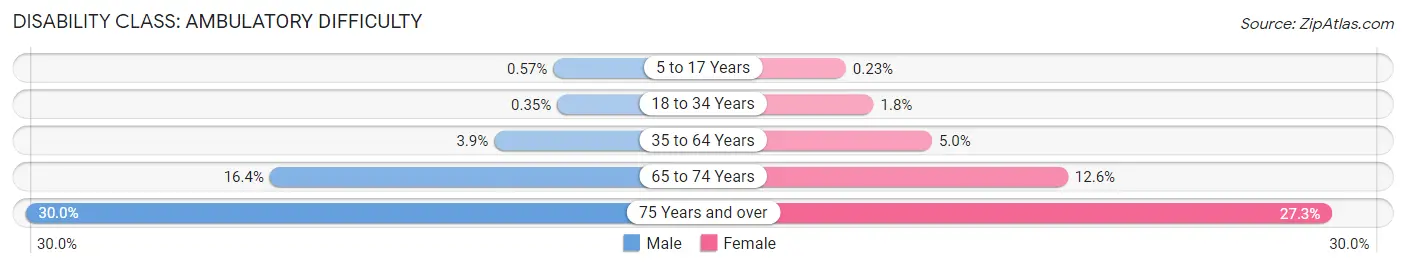
| Age Bracket | Male | Female |
| 5 to 17 Years | 82 (0.6%) | 32 (0.2%) |
| 18 to 34 Years | 66 (0.4%) | 312 (1.8%) |
| 35 to 64 Years | 1,036 (3.9%) | 1,332 (5.0%) |
| 65 to 74 Years | 672 (16.4%) | 648 (12.6%) |
| 75 Years and over | 621 (30.0%) | 714 (27.3%) |
Disability Class: Self-Care Difficulty
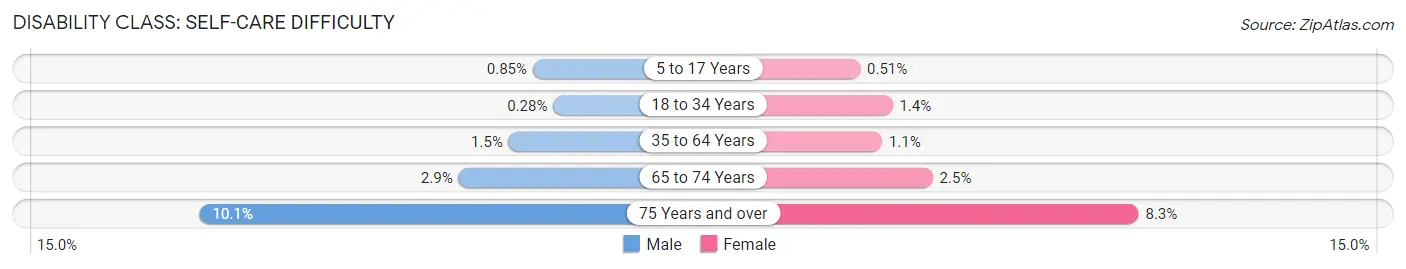
| Age Bracket | Male | Female |
| 5 to 17 Years | 121 (0.9%) | 70 (0.5%) |
| 18 to 34 Years | 52 (0.3%) | 249 (1.4%) |
| 35 to 64 Years | 408 (1.5%) | 298 (1.1%) |
| 65 to 74 Years | 120 (2.9%) | 130 (2.5%) |
| 75 Years and over | 210 (10.1%) | 216 (8.3%) |
Technology Access in Thornton
Computing Device Access in Thornton
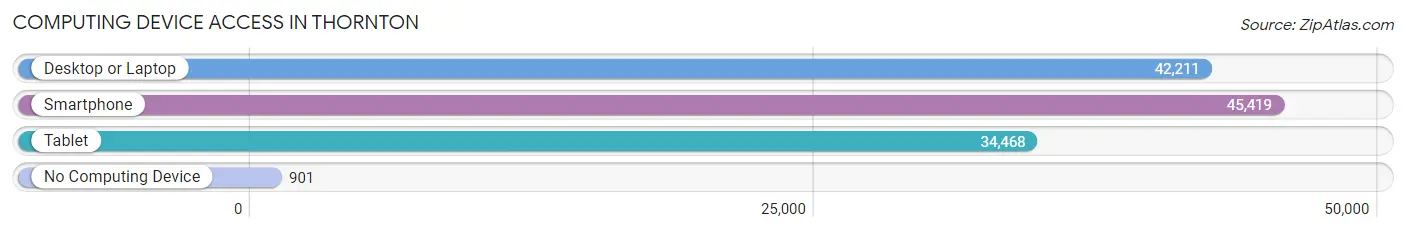
| Device Type | # Households | % Households |
| Desktop or Laptop | 42,211 | 87.1% |
| Smartphone | 45,419 | 93.7% |
| Tablet | 34,468 | 71.1% |
| No Computing Device | 901 | 1.9% |
| Total | 48,466 | 100.0% |
Internet Access in Thornton
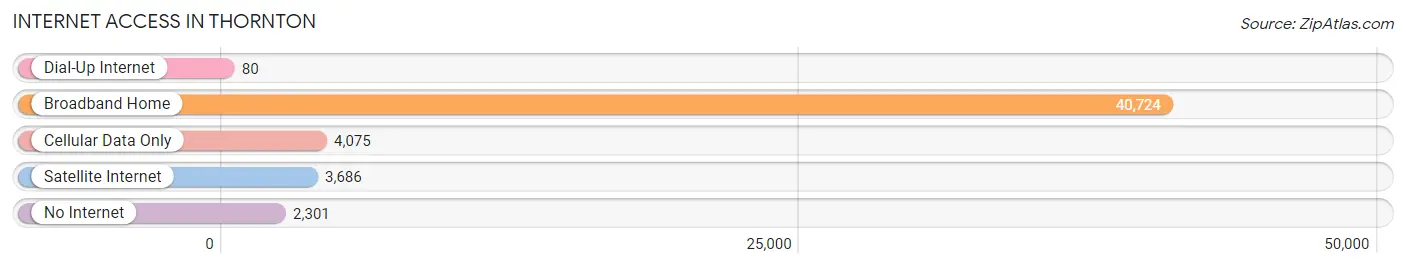
| Internet Type | # Households | % Households |
| Dial-Up Internet | 80 | 0.2% |
| Broadband Home | 40,724 | 84.0% |
| Cellular Data Only | 4,075 | 8.4% |
| Satellite Internet | 3,686 | 7.6% |
| No Internet | 2,301 | 4.8% |
| Total | 48,466 | 100.0% |
Thornton Summary
Thornton, Colorado is a city located in Adams and Weld counties in the north-central part of the state. It is a suburb of Denver and is the sixth-most populous city in Colorado. Thornton was founded in 1956 and incorporated in 1956. It is located in the Denver-Aurora-Lakewood Metropolitan Statistical Area.
Geography
Thornton is located at 39°54'N 104°59'W (39.9000, -104.9833). It is situated in the Denver-Aurora-Lakewood Metropolitan Statistical Area, which is part of the Front Range Urban Corridor. Thornton is located approximately 10 miles (16 km) north of downtown Denver and 55 miles (89 km) north of Colorado Springs.
The city is bordered by Westminster to the north, Broomfield to the northeast, Northglenn to the east, Federal Heights to the southeast, Westminster to the south, and Brighton to the southwest. Thornton is located in the South Platte River Valley, which is a part of the Great Plains region of the United States. The city is located at the base of the foothills of the Rocky Mountains.
Economy
Thornton is a major economic center in the Denver metropolitan area. The city is home to a variety of businesses, including retail, manufacturing, and service industries. The city is also home to several large employers, including the University of Colorado Health Sciences Center, the University of Colorado Denver, and the University of Colorado Anschutz Medical Campus.
The city is also home to several major shopping centers, including the Thornton Town Center, the Thornton Marketplace, and the Thornton Crossing Shopping Center. The city is also home to several major employers, including the University of Colorado Health Sciences Center, the University of Colorado Denver, and the University of Colorado Anschutz Medical Campus.
Demographics
As of the 2010 census, Thornton had a population of 118,772. The racial makeup of the city was 73.2% White, 4.3% African American, 0.7% Native American, 8.8% Asian, 0.1% Pacific Islander, 8.0% from other races, and 4.9% from two or more races. Hispanic or Latino of any race were 24.4% of the population.
The median income for a household in the city was $60,936, and the median income for a family was $68,927. Males had a median income of $45,919 versus $35,945 for females. The per capita income for the city was $26,945. About 5.2% of families and 7.3% of the population were below the poverty line, including 9.2% of those under age 18 and 6.2% of those age 65 or over.
Thornton is a diverse city with a variety of cultures and backgrounds. The city is home to a large Hispanic population, as well as a large Asian population. The city is also home to a large number of immigrants from all over the world. The city is also home to a large number of military veterans.
Common Questions
What is Per Capita Income in Thornton?
Per Capita income in Thornton is $38,876.
What is the Median Family Income in Thornton?
Median Family Income in Thornton is $106,963.
What is the Median Household income in Thornton?
Median Household Income in Thornton is $95,064.
What is Income or Wage Gap in Thornton?
Income or Wage Gap in Thornton is 28.8%.
Women in Thornton earn 71.2 cents for every dollar earned by a man.
What is Family Income Deficit in Thornton?
Family Income Deficit in Thornton is $11,625.
Families that are below poverty line in Thornton earn $11,625 less on average than the poverty threshold level.
What is Inequality or Gini Index in Thornton?
Inequality or Gini Index in Thornton is 0.37.
What is the Total Population of Thornton?
Total Population of Thornton is 141,799.
What is the Total Male Population of Thornton?
Total Male Population of Thornton is 71,197.
What is the Total Female Population of Thornton?
Total Female Population of Thornton is 70,602.
What is the Ratio of Males per 100 Females in Thornton?
There are 100.84 Males per 100 Females in Thornton.
What is the Ratio of Females per 100 Males in Thornton?
There are 99.16 Females per 100 Males in Thornton.
What is the Median Population Age in Thornton?
Median Population Age in Thornton is 33.7 Years.
What is the Average Family Size in Thornton
Average Family Size in Thornton is 3.4 People.
What is the Average Household Size in Thornton
Average Household Size in Thornton is 2.9 People.
How Large is the Labor Force in Thornton?
There are 80,413 People in the Labor Forcein in Thornton.
What is the Percentage of People in the Labor Force in Thornton?
74.3% of People are in the Labor Force in Thornton.
What is the Unemployment Rate in Thornton?
Unemployment Rate in Thornton is 4.6%.