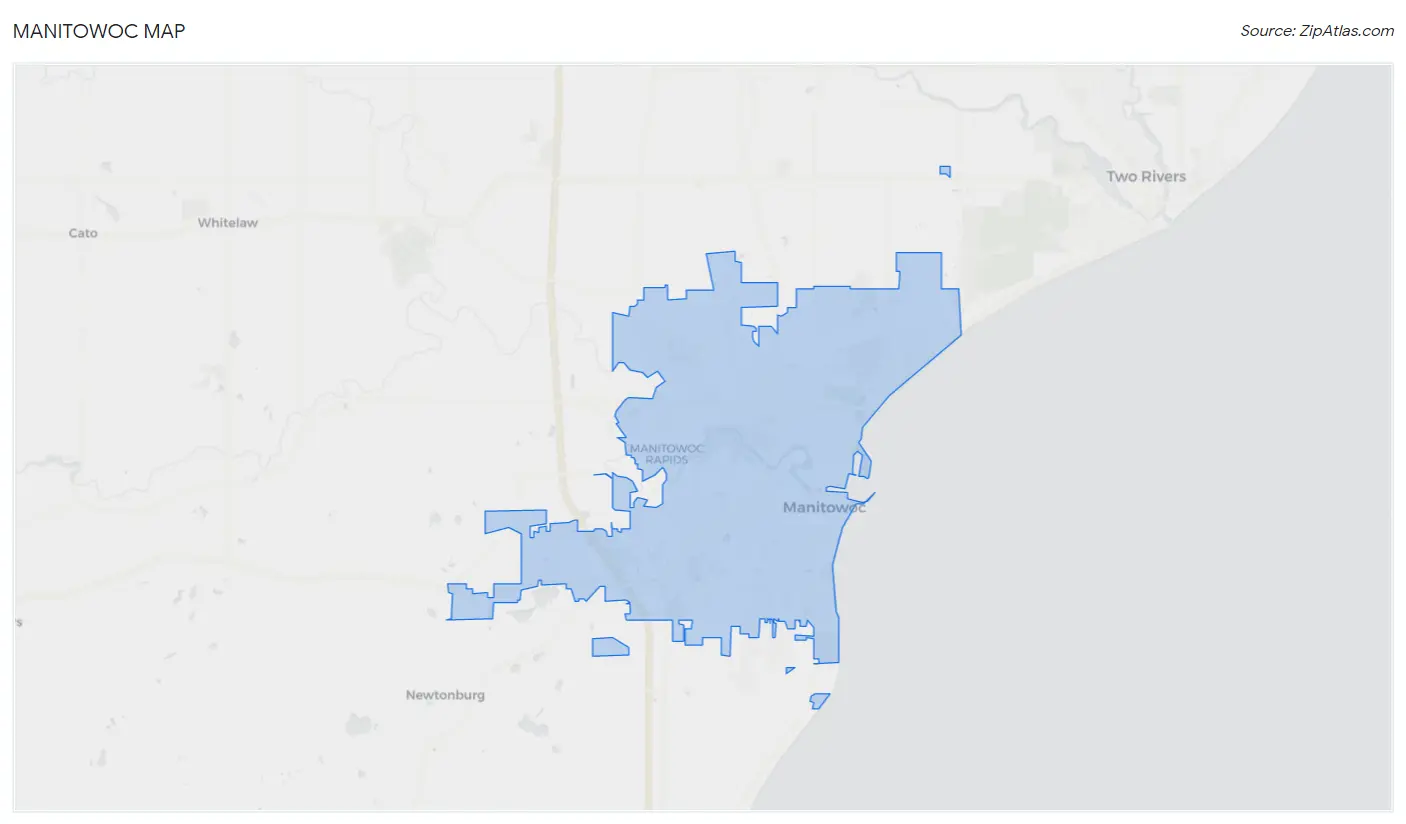
Manitowoc, WI Map & Demographics
Manitowoc Map
Manitowoc Overview
$33,416
PER CAPITA INCOME
$74,433
AVG FAMILY INCOME
$60,040
AVG HOUSEHOLD INCOME
37.1%
WAGE / INCOME GAP [ % ]
62.9¢/ $1
WAGE / INCOME GAP [ $ ]
$10,250
FAMILY INCOME DEFICIT
0.43
INEQUALITY / GINI INDEX
34,500
TOTAL POPULATION
17,349
MALE POPULATION
17,151
FEMALE POPULATION
101.15
MALES / 100 FEMALES
98.86
FEMALES / 100 MALES
42.9
MEDIAN AGE
2.9
AVG FAMILY SIZE
2.3
AVG HOUSEHOLD SIZE
16,712
LABOR FORCE [ PEOPLE ]
59.7%
PERCENT IN LABOR FORCE
2.8%
UNEMPLOYMENT RATE
Manitowoc Zip Codes
Manitowoc Area Codes
Income in Manitowoc
Income Overview in Manitowoc
Per Capita Income in Manitowoc is $33,416, while median incomes of families and households are $74,433 and $60,040 respectively.
| Characteristic | Number | Measure |
| Per Capita Income | 34,500 | $33,416 |
| Median Family Income | 8,388 | $74,433 |
| Mean Family Income | 8,388 | $92,297 |
| Median Household Income | 14,774 | $60,040 |
| Mean Household Income | 14,774 | $76,119 |
| Income Deficit | 8,388 | $10,250 |
| Wage / Income Gap (%) | 34,500 | 37.12% |
| Wage / Income Gap ($) | 34,500 | 62.88¢ per $1 |
| Gini / Inequality Index | 34,500 | 0.43 |
Earnings by Sex in Manitowoc
Average Earnings in Manitowoc are $38,083, $46,217 for men and $29,061 for women, a difference of 37.1%.
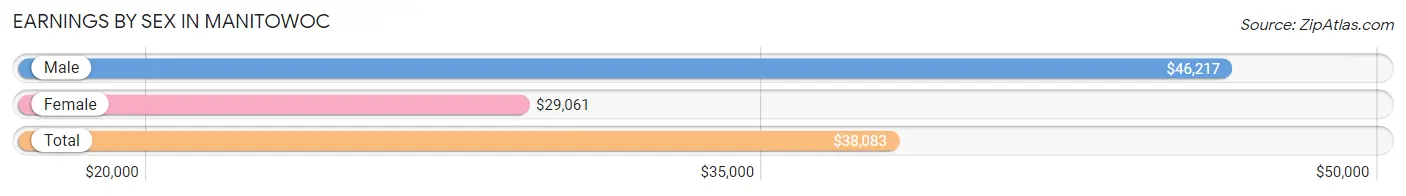
| Sex | Number | Average Earnings |
| Male | 9,843 (54.8%) | $46,217 |
| Female | 8,110 (45.2%) | $29,061 |
| Total | 17,953 (100.0%) | $38,083 |
Earnings by Sex by Income Bracket in Manitowoc
The most common earnings brackets in Manitowoc are $55,000 to $64,999 for men (1,184 | 12.0%) and $35,000 to $39,999 for women (628 | 7.7%).
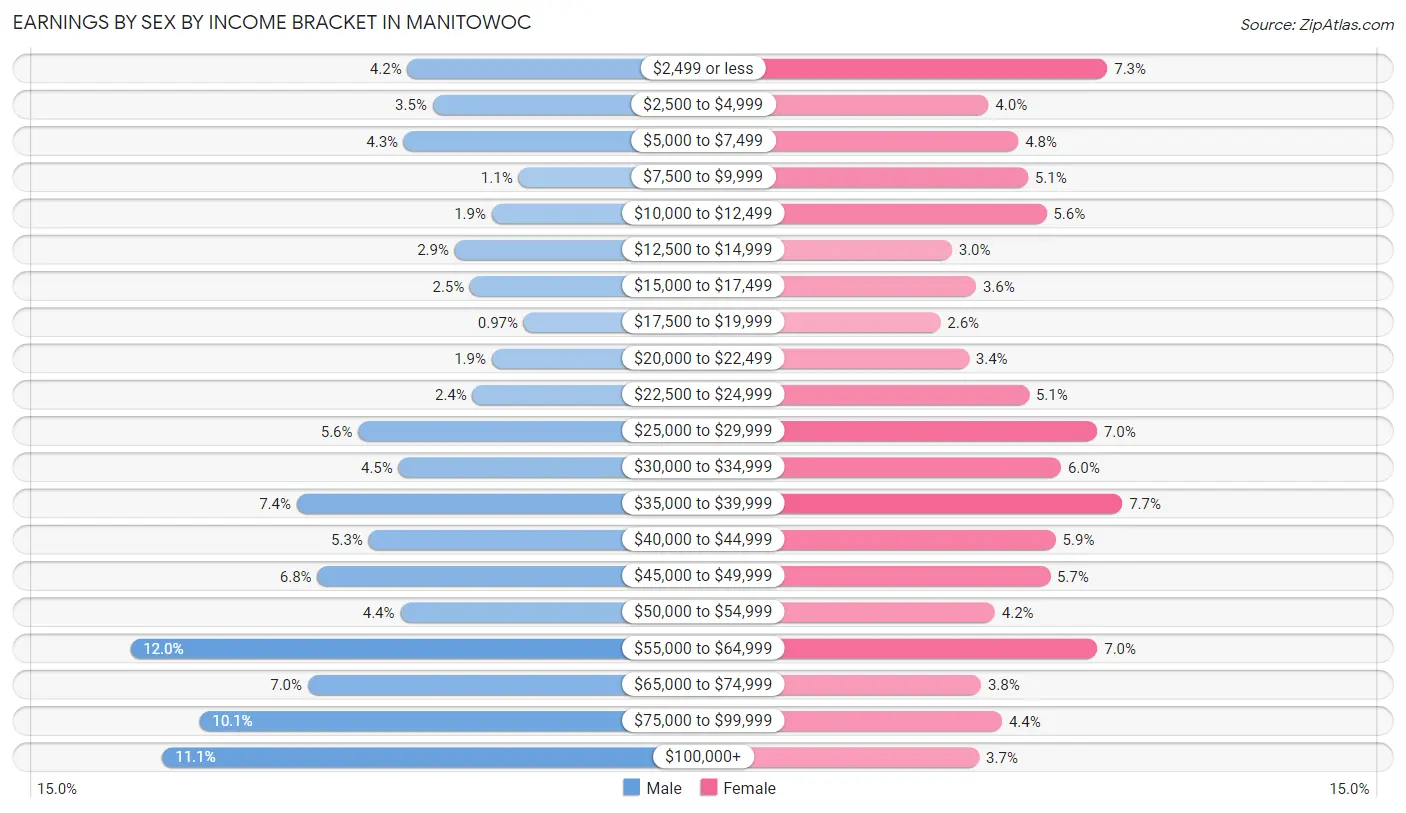
| Income | Male | Female |
| $2,499 or less | 417 (4.2%) | 594 (7.3%) |
| $2,500 to $4,999 | 347 (3.5%) | 323 (4.0%) |
| $5,000 to $7,499 | 427 (4.3%) | 391 (4.8%) |
| $7,500 to $9,999 | 110 (1.1%) | 413 (5.1%) |
| $10,000 to $12,499 | 184 (1.9%) | 455 (5.6%) |
| $12,500 to $14,999 | 286 (2.9%) | 239 (2.9%) |
| $15,000 to $17,499 | 244 (2.5%) | 294 (3.6%) |
| $17,500 to $19,999 | 95 (1.0%) | 213 (2.6%) |
| $20,000 to $22,499 | 184 (1.9%) | 278 (3.4%) |
| $22,500 to $24,999 | 237 (2.4%) | 415 (5.1%) |
| $25,000 to $29,999 | 553 (5.6%) | 570 (7.0%) |
| $30,000 to $34,999 | 442 (4.5%) | 488 (6.0%) |
| $35,000 to $39,999 | 723 (7.3%) | 628 (7.7%) |
| $40,000 to $44,999 | 525 (5.3%) | 476 (5.9%) |
| $45,000 to $49,999 | 666 (6.8%) | 463 (5.7%) |
| $50,000 to $54,999 | 437 (4.4%) | 337 (4.2%) |
| $55,000 to $64,999 | 1,184 (12.0%) | 571 (7.0%) |
| $65,000 to $74,999 | 693 (7.0%) | 306 (3.8%) |
| $75,000 to $99,999 | 993 (10.1%) | 354 (4.4%) |
| $100,000+ | 1,096 (11.1%) | 302 (3.7%) |
| Total | 9,843 (100.0%) | 8,110 (100.0%) |
Earnings by Sex by Educational Attainment in Manitowoc
Average earnings in Manitowoc are $51,612 for men and $33,976 for women, a difference of 34.2%. Men with an educational attainment of graduate degree enjoy the highest average annual earnings of $80,982, while those with less than high school education earn the least with $35,391. Women with an educational attainment of graduate degree earn the most with the average annual earnings of $58,514, while those with less than high school education have the smallest earnings of $27,743.
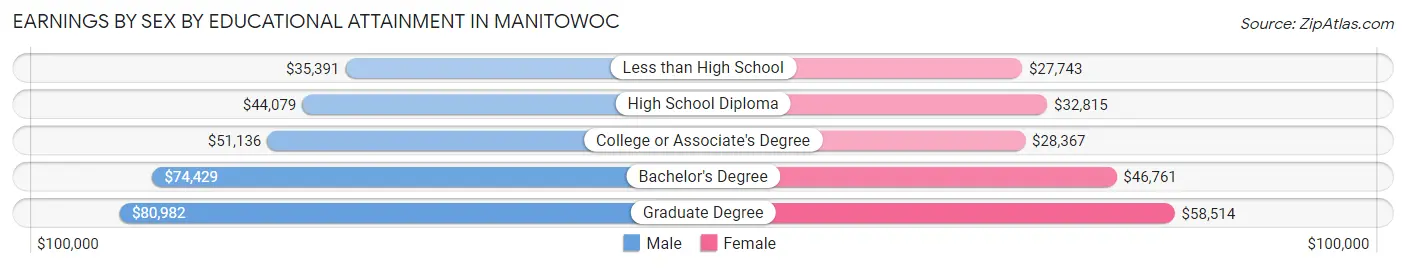
| Educational Attainment | Male Income | Female Income |
| Less than High School | $35,391 | $27,743 |
| High School Diploma | $44,079 | $32,815 |
| College or Associate's Degree | $51,136 | $28,367 |
| Bachelor's Degree | $74,429 | $46,761 |
| Graduate Degree | $80,982 | $58,514 |
| Total | $51,612 | $33,976 |
Family Income in Manitowoc
Family Income Brackets in Manitowoc
According to the Manitowoc family income data, there are 1,745 families falling into the $50,000 to $74,999 income range, which is the most common income bracket and makes up 20.8% of all families. Conversely, the less than $10,000 income bracket is the least frequent group with only 252 families (3.0%) belonging to this category.
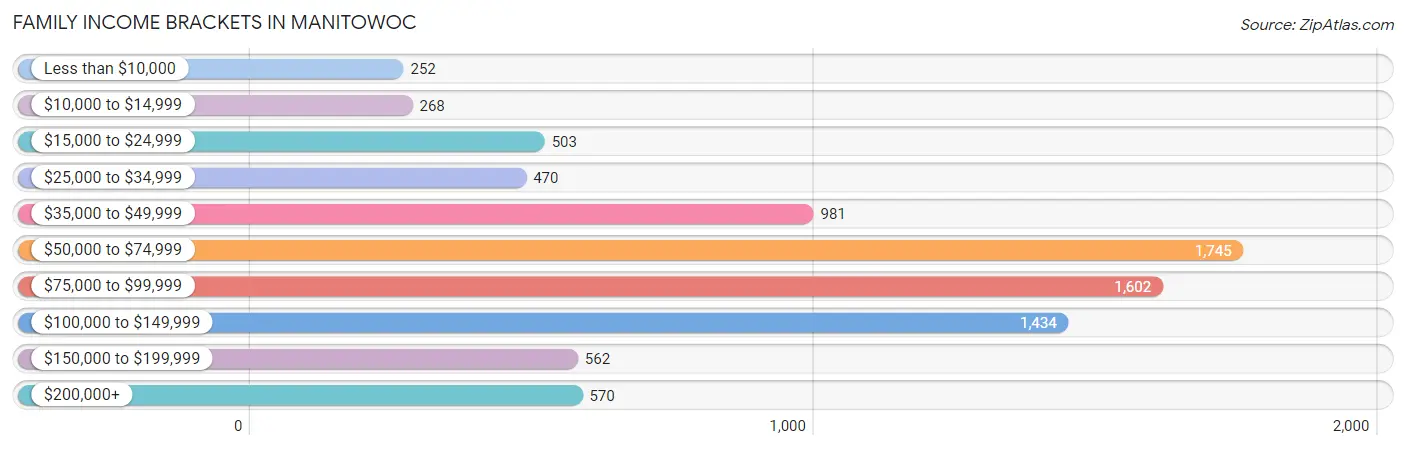
| Income Bracket | # Families | % Families |
| Less than $10,000 | 252 | 3.0% |
| $10,000 to $14,999 | 268 | 3.2% |
| $15,000 to $24,999 | 503 | 6.0% |
| $25,000 to $34,999 | 470 | 5.6% |
| $35,000 to $49,999 | 981 | 11.7% |
| $50,000 to $74,999 | 1,745 | 20.8% |
| $75,000 to $99,999 | 1,602 | 19.1% |
| $100,000 to $149,999 | 1,434 | 17.1% |
| $150,000 to $199,999 | 562 | 6.7% |
| $200,000+ | 570 | 6.8% |
Family Income by Famaliy Size in Manitowoc
4-person families (1,282 | 15.3%) account for the highest median family income in Manitowoc with $97,644 per family, while 2-person families (4,376 | 52.2%) have the highest median income of $33,988 per family member.
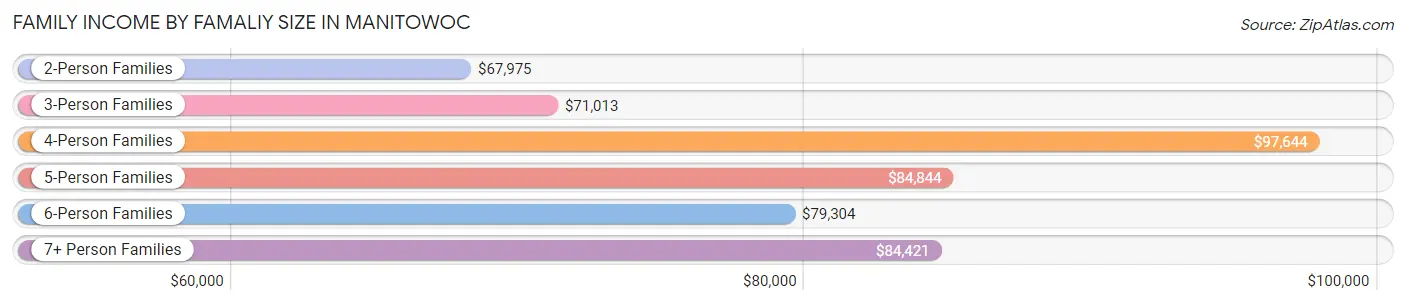
| Income Bracket | # Families | Median Income |
| 2-Person Families | 4,376 (52.2%) | $67,975 |
| 3-Person Families | 1,913 (22.8%) | $71,013 |
| 4-Person Families | 1,282 (15.3%) | $97,644 |
| 5-Person Families | 463 (5.5%) | $84,844 |
| 6-Person Families | 165 (2.0%) | $79,304 |
| 7+ Person Families | 189 (2.2%) | $84,421 |
| Total | 8,388 (100.0%) | $74,433 |
Family Income by Number of Earners in Manitowoc
The median family income in Manitowoc is $74,433, with families comprising 3+ earners (982) having the highest median family income of $118,214, while families with no earners (1,765) have the lowest median family income of $48,257, accounting for 11.7% and 21.0% of families, respectively.
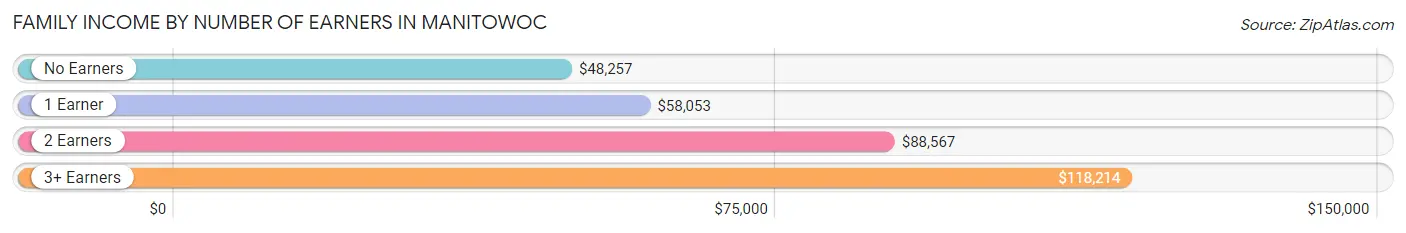
| Number of Earners | # Families | Median Income |
| No Earners | 1,765 (21.0%) | $48,257 |
| 1 Earner | 2,305 (27.5%) | $58,053 |
| 2 Earners | 3,336 (39.8%) | $88,567 |
| 3+ Earners | 982 (11.7%) | $118,214 |
| Total | 8,388 (100.0%) | $74,433 |
Household Income in Manitowoc
Household Income Brackets in Manitowoc
With 2,940 households falling in the category, the $50,000 to $74,999 income range is the most frequent in Manitowoc, accounting for 19.9% of all households. In contrast, only 591 households (4.0%) fall into the less than $10,000 income bracket, making it the least populous group.
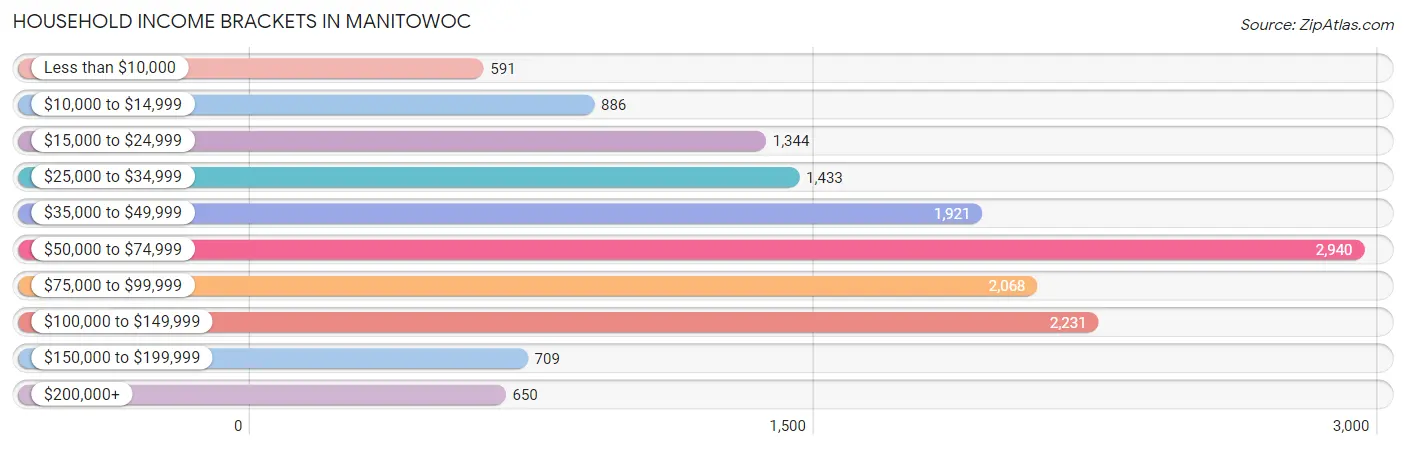
| Income Bracket | # Households | % Households |
| Less than $10,000 | 591 | 4.0% |
| $10,000 to $14,999 | 886 | 6.0% |
| $15,000 to $24,999 | 1,344 | 9.1% |
| $25,000 to $34,999 | 1,433 | 9.7% |
| $35,000 to $49,999 | 1,921 | 13.0% |
| $50,000 to $74,999 | 2,940 | 19.9% |
| $75,000 to $99,999 | 2,068 | 14.0% |
| $100,000 to $149,999 | 2,231 | 15.1% |
| $150,000 to $199,999 | 709 | 4.8% |
| $200,000+ | 650 | 4.4% |
Household Income by Householder Age in Manitowoc
The median household income in Manitowoc is $60,040, with the highest median household income of $68,441 found in the 25 to 44 years age bracket for the primary householder. A total of 4,337 households (29.4%) fall into this category. Meanwhile, the 65+ years age bracket for the primary householder has the lowest median household income of $45,417, with 4,304 households (29.1%) in this group.
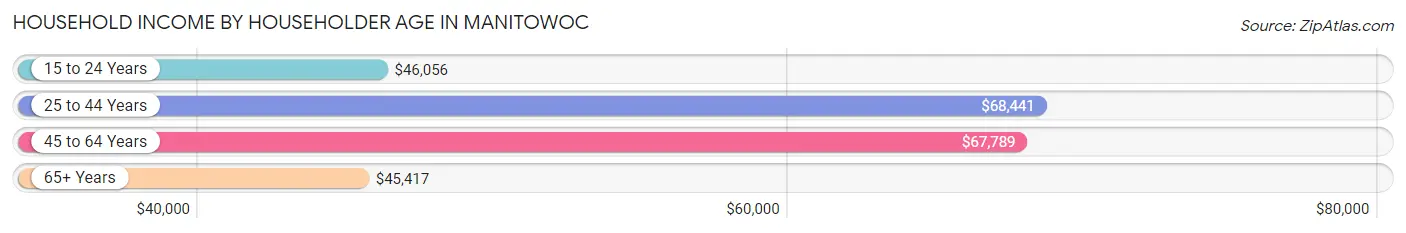
| Income Bracket | # Households | Median Income |
| 15 to 24 Years | 356 (2.4%) | $46,056 |
| 25 to 44 Years | 4,337 (29.4%) | $68,441 |
| 45 to 64 Years | 5,777 (39.1%) | $67,789 |
| 65+ Years | 4,304 (29.1%) | $45,417 |
| Total | 14,774 (100.0%) | $60,040 |
Poverty in Manitowoc
Income Below Poverty by Sex and Age in Manitowoc
With 11.3% poverty level for males and 17.9% for females among the residents of Manitowoc, 12 to 14 year old males and 5 year old females are the most vulnerable to poverty, with 146 males (27.4%) and 81 females (48.5%) in their respective age groups living below the poverty level.
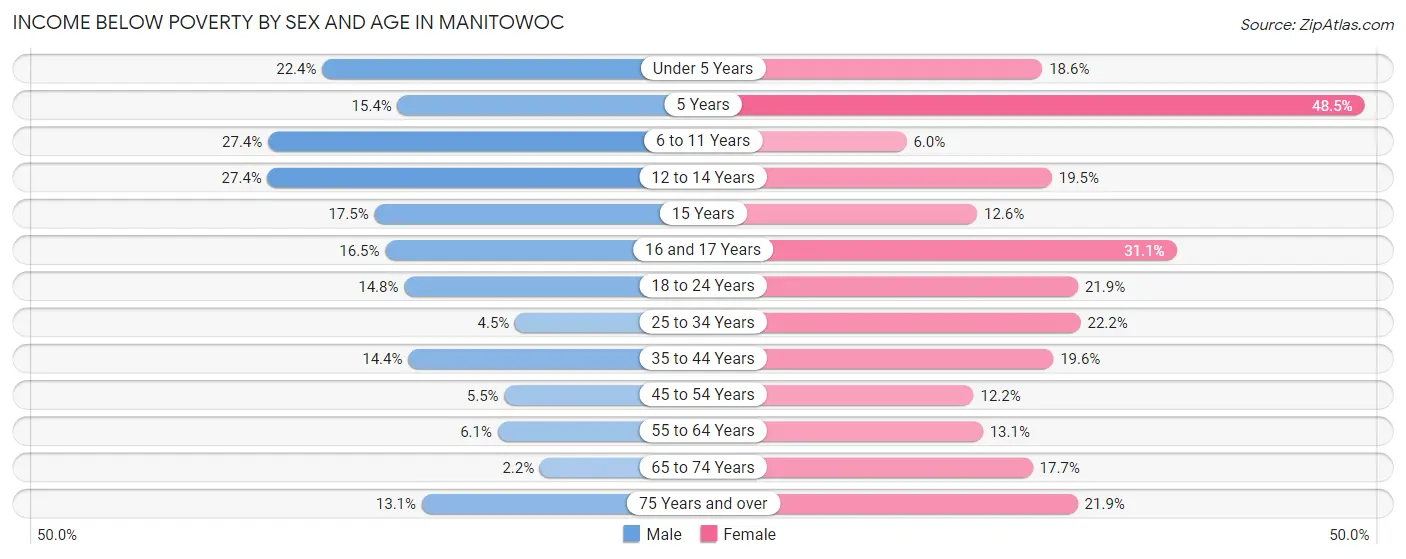
| Age Bracket | Male | Female |
| Under 5 Years | 215 (22.4%) | 167 (18.6%) |
| 5 Years | 42 (15.4%) | 81 (48.5%) |
| 6 to 11 Years | 394 (27.4%) | 58 (6.0%) |
| 12 to 14 Years | 146 (27.4%) | 115 (19.5%) |
| 15 Years | 44 (17.5%) | 32 (12.6%) |
| 16 and 17 Years | 73 (16.5%) | 145 (31.0%) |
| 18 to 24 Years | 192 (14.8%) | 254 (21.9%) |
| 25 to 34 Years | 94 (4.5%) | 443 (22.2%) |
| 35 to 44 Years | 278 (14.4%) | 363 (19.6%) |
| 45 to 54 Years | 116 (5.5%) | 219 (12.2%) |
| 55 to 64 Years | 151 (6.1%) | 348 (13.1%) |
| 65 to 74 Years | 46 (2.2%) | 370 (17.7%) |
| 75 Years and over | 131 (13.1%) | 419 (21.9%) |
| Total | 1,922 (11.3%) | 3,014 (17.9%) |
Income Above Poverty by Sex and Age in Manitowoc
According to the poverty statistics in Manitowoc, males aged 65 to 74 years and females aged 6 to 11 years are the age groups that are most secure financially, with 97.8% of males and 94.0% of females in these age groups living above the poverty line.
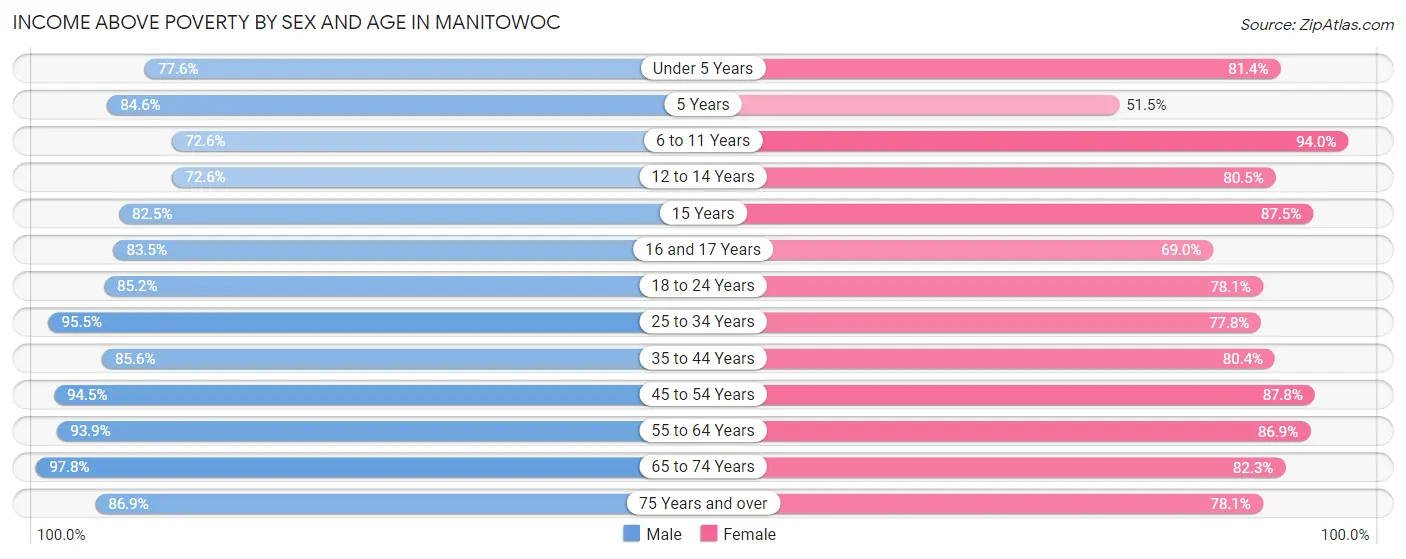
| Age Bracket | Male | Female |
| Under 5 Years | 746 (77.6%) | 731 (81.4%) |
| 5 Years | 231 (84.6%) | 86 (51.5%) |
| 6 to 11 Years | 1,044 (72.6%) | 908 (94.0%) |
| 12 to 14 Years | 386 (72.6%) | 475 (80.5%) |
| 15 Years | 207 (82.5%) | 223 (87.5%) |
| 16 and 17 Years | 369 (83.5%) | 322 (69.0%) |
| 18 to 24 Years | 1,109 (85.2%) | 905 (78.1%) |
| 25 to 34 Years | 2,007 (95.5%) | 1,556 (77.8%) |
| 35 to 44 Years | 1,654 (85.6%) | 1,487 (80.4%) |
| 45 to 54 Years | 2,004 (94.5%) | 1,571 (87.8%) |
| 55 to 64 Years | 2,332 (93.9%) | 2,312 (86.9%) |
| 65 to 74 Years | 2,087 (97.8%) | 1,719 (82.3%) |
| 75 Years and over | 867 (86.9%) | 1,495 (78.1%) |
| Total | 15,043 (88.7%) | 13,790 (82.1%) |
Income Below Poverty Among Married-Couple Families in Manitowoc
The poverty statistics for married-couple families in Manitowoc show that 3.6% or 207 of the total 5,784 families live below the poverty line. Families with 1 or 2 children have the highest poverty rate of 8.3%, comprising of 129 families. On the other hand, families with 5 or more children have the lowest poverty rate of 0.0%, which includes 0 families.
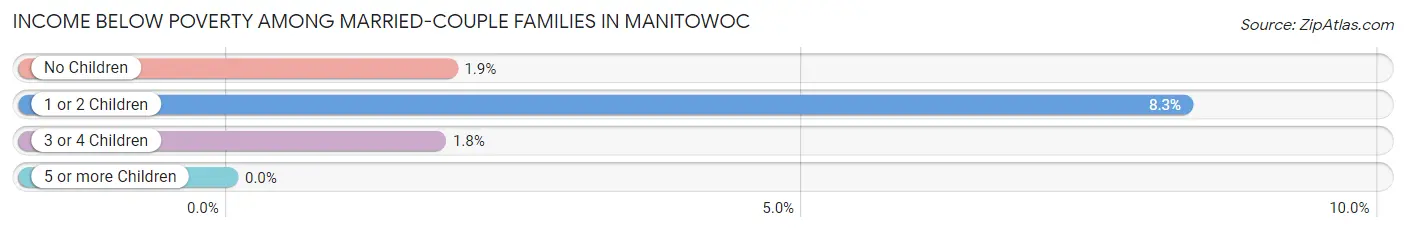
| Children | Above Poverty | Below Poverty |
| No Children | 3,590 (98.1%) | 70 (1.9%) |
| 1 or 2 Children | 1,423 (91.7%) | 129 (8.3%) |
| 3 or 4 Children | 433 (98.2%) | 8 (1.8%) |
| 5 or more Children | 131 (100.0%) | 0 (0.0%) |
| Total | 5,577 (96.4%) | 207 (3.6%) |
Income Below Poverty Among Single-Parent Households in Manitowoc
According to the poverty data in Manitowoc, 15.3% or 119 single-father households and 33.5% or 612 single-mother households are living below the poverty line. Among single-father households, those with 1 or 2 children have the highest poverty rate, with 108 households (40.2%) experiencing poverty. Likewise, among single-mother households, those with 3 or 4 children have the highest poverty rate, with 148 households (65.8%) falling below the poverty line.
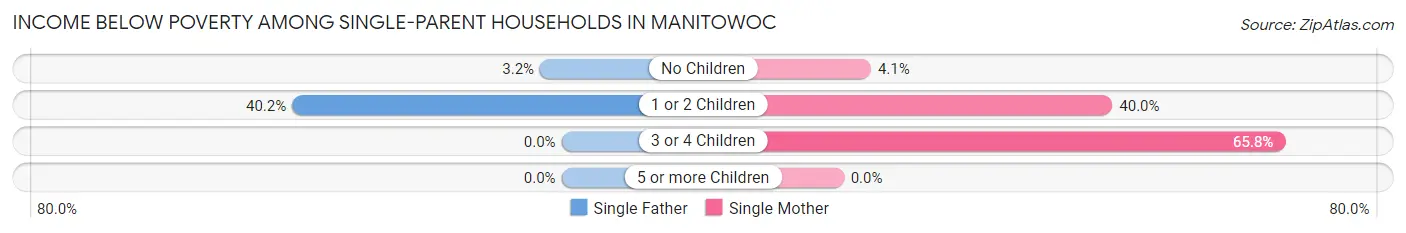
| Children | Single Father | Single Mother |
| No Children | 11 (3.2%) | 20 (4.1%) |
| 1 or 2 Children | 108 (40.2%) | 444 (40.0%) |
| 3 or 4 Children | 0 (0.0%) | 148 (65.8%) |
| 5 or more Children | 0 (0.0%) | 0 (0.0%) |
| Total | 119 (15.3%) | 612 (33.5%) |
Income Below Poverty Among Married-Couple vs Single-Parent Households in Manitowoc
The poverty data for Manitowoc shows that 207 of the married-couple family households (3.6%) and 731 of the single-parent households (28.1%) are living below the poverty level. Within the married-couple family households, those with 1 or 2 children have the highest poverty rate, with 129 households (8.3%) falling below the poverty line. Among the single-parent households, those with 1 or 2 children have the highest poverty rate, with 552 household (40.1%) living below poverty.
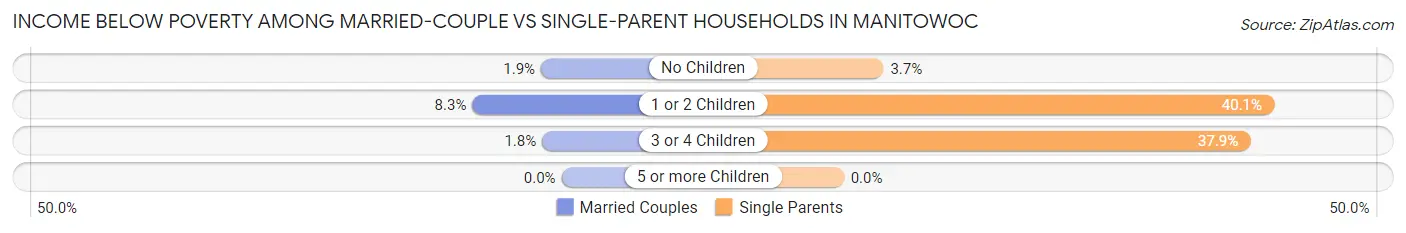
| Children | Married-Couple Families | Single-Parent Households |
| No Children | 70 (1.9%) | 31 (3.7%) |
| 1 or 2 Children | 129 (8.3%) | 552 (40.1%) |
| 3 or 4 Children | 8 (1.8%) | 148 (37.9%) |
| 5 or more Children | 0 (0.0%) | 0 (0.0%) |
| Total | 207 (3.6%) | 731 (28.1%) |
Race in Manitowoc
The most populous races in Manitowoc are White / Caucasian (30,108 | 87.3%), Hispanic or Latino (2,027 | 5.9%), and Asian (1,785 | 5.2%).
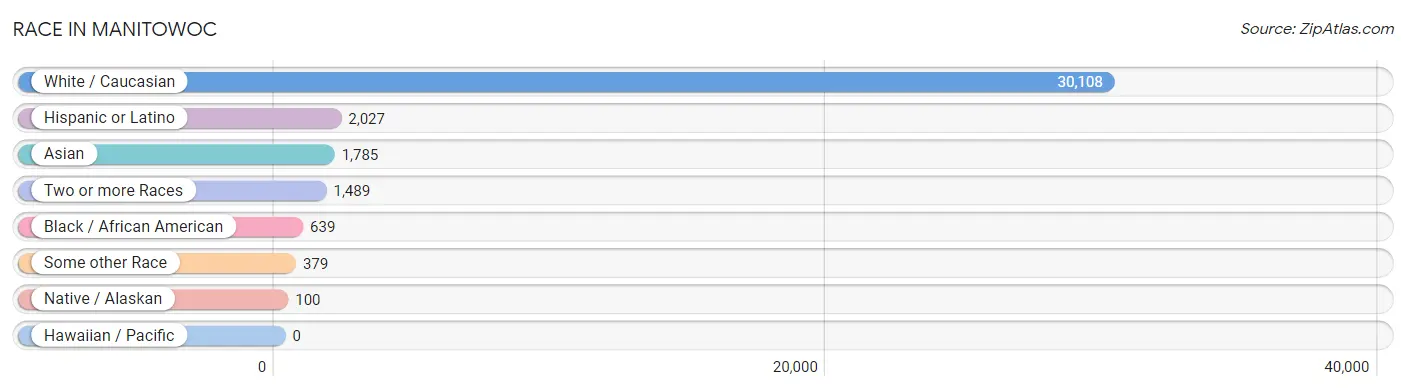
| Race | # Population | % Population |
| Asian | 1,785 | 5.2% |
| Black / African American | 639 | 1.8% |
| Hawaiian / Pacific | 0 | 0.0% |
| Hispanic or Latino | 2,027 | 5.9% |
| Native / Alaskan | 100 | 0.3% |
| White / Caucasian | 30,108 | 87.3% |
| Two or more Races | 1,489 | 4.3% |
| Some other Race | 379 | 1.1% |
| Total | 34,500 | 100.0% |
Ancestry in Manitowoc
The most populous ancestries reported in Manitowoc are German (14,785 | 42.9%), Irish (3,657 | 10.6%), Polish (3,171 | 9.2%), French (2,004 | 5.8%), and American (1,721 | 5.0%), together accounting for 73.4% of all Manitowoc residents.
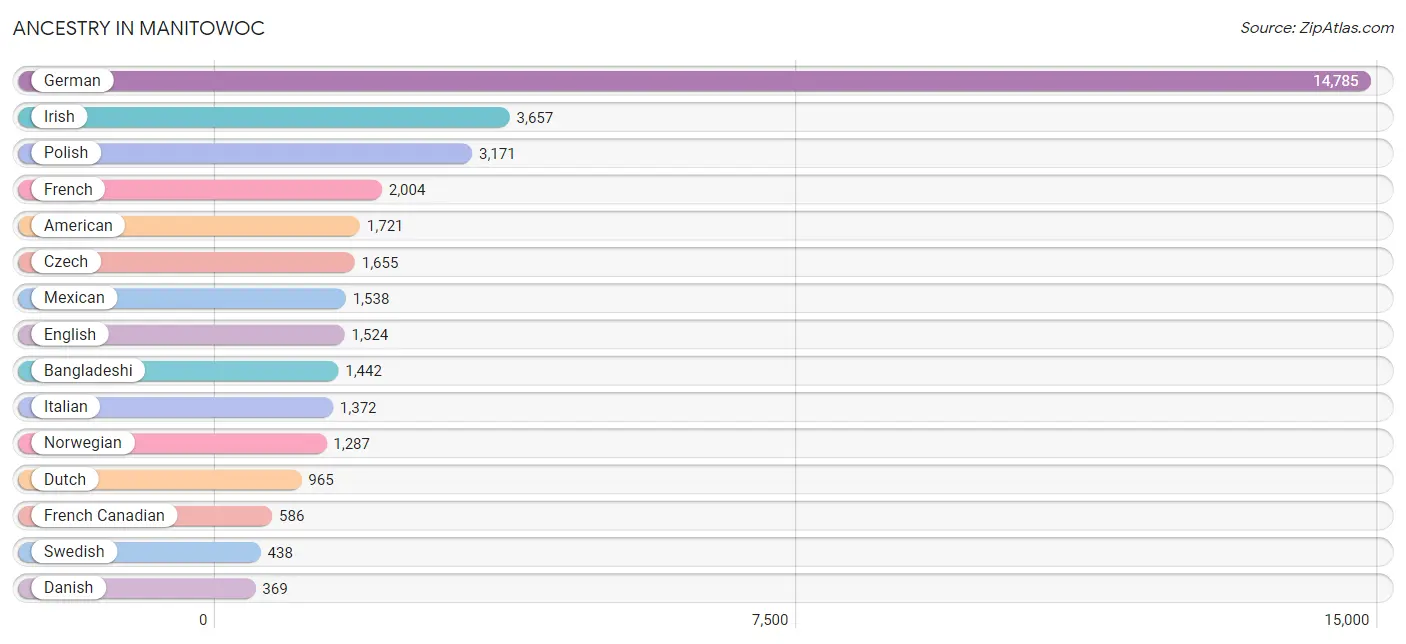
| Ancestry | # Population | % Population |
| African | 11 | 0.0% |
| American | 1,721 | 5.0% |
| Arab | 62 | 0.2% |
| Austrian | 190 | 0.5% |
| Bangladeshi | 1,442 | 4.2% |
| Belgian | 190 | 0.5% |
| Bhutanese | 46 | 0.1% |
| Blackfeet | 5 | 0.0% |
| British | 51 | 0.2% |
| Cambodian | 31 | 0.1% |
| Celtic | 19 | 0.1% |
| Central American | 156 | 0.4% |
| Cherokee | 78 | 0.2% |
| Chippewa | 55 | 0.2% |
| Colombian | 20 | 0.1% |
| Cree | 16 | 0.1% |
| Croatian | 60 | 0.2% |
| Cuban | 37 | 0.1% |
| Czech | 1,655 | 4.8% |
| Czechoslovakian | 59 | 0.2% |
| Danish | 369 | 1.1% |
| Dominican | 35 | 0.1% |
| Dutch | 965 | 2.8% |
| Eastern European | 97 | 0.3% |
| English | 1,524 | 4.4% |
| European | 325 | 0.9% |
| Finnish | 131 | 0.4% |
| French | 2,004 | 5.8% |
| French Canadian | 586 | 1.7% |
| German | 14,785 | 42.9% |
| Greek | 33 | 0.1% |
| Guatemalan | 111 | 0.3% |
| Honduran | 1 | 0.0% |
| Hungarian | 76 | 0.2% |
| Icelander | 3 | 0.0% |
| Indian (Asian) | 94 | 0.3% |
| Iranian | 21 | 0.1% |
| Irish | 3,657 | 10.6% |
| Iroquois | 43 | 0.1% |
| Italian | 1,372 | 4.0% |
| Korean | 139 | 0.4% |
| Latvian | 13 | 0.0% |
| Lithuanian | 51 | 0.2% |
| Luxembourger | 63 | 0.2% |
| Malaysian | 128 | 0.4% |
| Menominee | 17 | 0.1% |
| Mexican | 1,538 | 4.5% |
| Native Hawaiian | 63 | 0.2% |
| Norwegian | 1,287 | 3.7% |
| Pakistani | 42 | 0.1% |
| Panamanian | 44 | 0.1% |
| Peruvian | 58 | 0.2% |
| Polish | 3,171 | 9.2% |
| Portuguese | 15 | 0.0% |
| Puerto Rican | 91 | 0.3% |
| Russian | 360 | 1.0% |
| Scandinavian | 125 | 0.4% |
| Scotch-Irish | 70 | 0.2% |
| Scottish | 194 | 0.6% |
| Slavic | 7 | 0.0% |
| Slovak | 32 | 0.1% |
| South American | 78 | 0.2% |
| Spaniard | 17 | 0.1% |
| Spanish | 17 | 0.1% |
| Spanish American Indian | 18 | 0.1% |
| Subsaharan African | 11 | 0.0% |
| Swedish | 438 | 1.3% |
| Swiss | 124 | 0.4% |
| Syrian | 62 | 0.2% |
| Thai | 110 | 0.3% |
| Ukrainian | 40 | 0.1% |
| Welsh | 11 | 0.0% |
| Yugoslavian | 13 | 0.0% | View All 73 Rows |
Immigrants in Manitowoc
The most numerous immigrant groups reported in Manitowoc came from Asia (839 | 2.4%), South Eastern Asia (640 | 1.9%), Latin America (566 | 1.6%), Central America (483 | 1.4%), and Mexico (406 | 1.2%), together accounting for 8.5% of all Manitowoc residents.
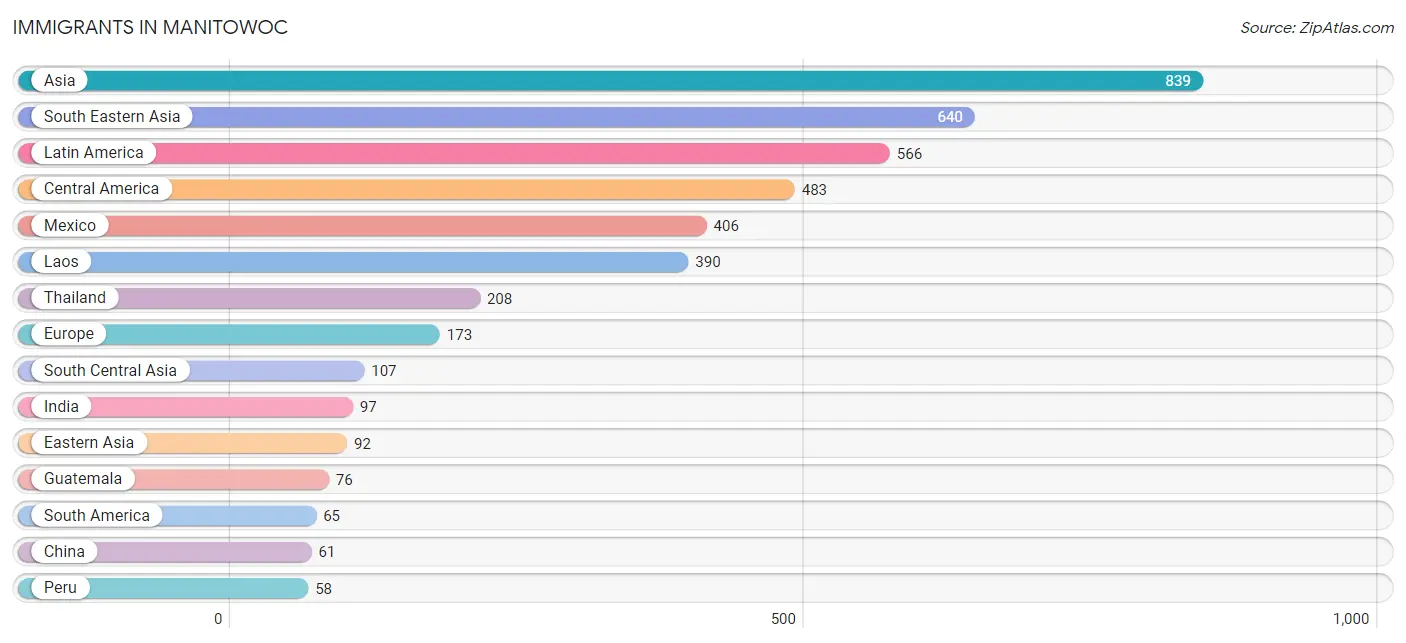
| Immigration Origin | # Population | % Population |
| Asia | 839 | 2.4% |
| Australia | 9 | 0.0% |
| Austria | 9 | 0.0% |
| Bosnia and Herzegovina | 6 | 0.0% |
| Caribbean | 18 | 0.1% |
| Central America | 483 | 1.4% |
| China | 61 | 0.2% |
| Colombia | 7 | 0.0% |
| Czechoslovakia | 10 | 0.0% |
| Dominican Republic | 18 | 0.1% |
| Eastern Asia | 92 | 0.3% |
| Eastern Europe | 55 | 0.2% |
| Europe | 173 | 0.5% |
| France | 13 | 0.0% |
| Germany | 16 | 0.1% |
| Greece | 18 | 0.1% |
| Guatemala | 76 | 0.2% |
| Honduras | 1 | 0.0% |
| India | 97 | 0.3% |
| Iran | 10 | 0.0% |
| Italy | 22 | 0.1% |
| Laos | 390 | 1.1% |
| Latin America | 566 | 1.6% |
| Latvia | 13 | 0.0% |
| Mexico | 406 | 1.2% |
| Northern Europe | 40 | 0.1% |
| Oceania | 9 | 0.0% |
| Peru | 58 | 0.2% |
| Philippines | 42 | 0.1% |
| Poland | 16 | 0.1% |
| South America | 65 | 0.2% |
| South Central Asia | 107 | 0.3% |
| South Eastern Asia | 640 | 1.9% |
| Southern Europe | 40 | 0.1% |
| Thailand | 208 | 0.6% |
| Ukraine | 10 | 0.0% |
| Western Europe | 38 | 0.1% | View All 37 Rows |
Sex and Age in Manitowoc
Sex and Age in Manitowoc
The most populous age groups in Manitowoc are 60 to 64 Years (1,323 | 7.6%) for men and 60 to 64 Years (1,369 | 8.0%) for women.
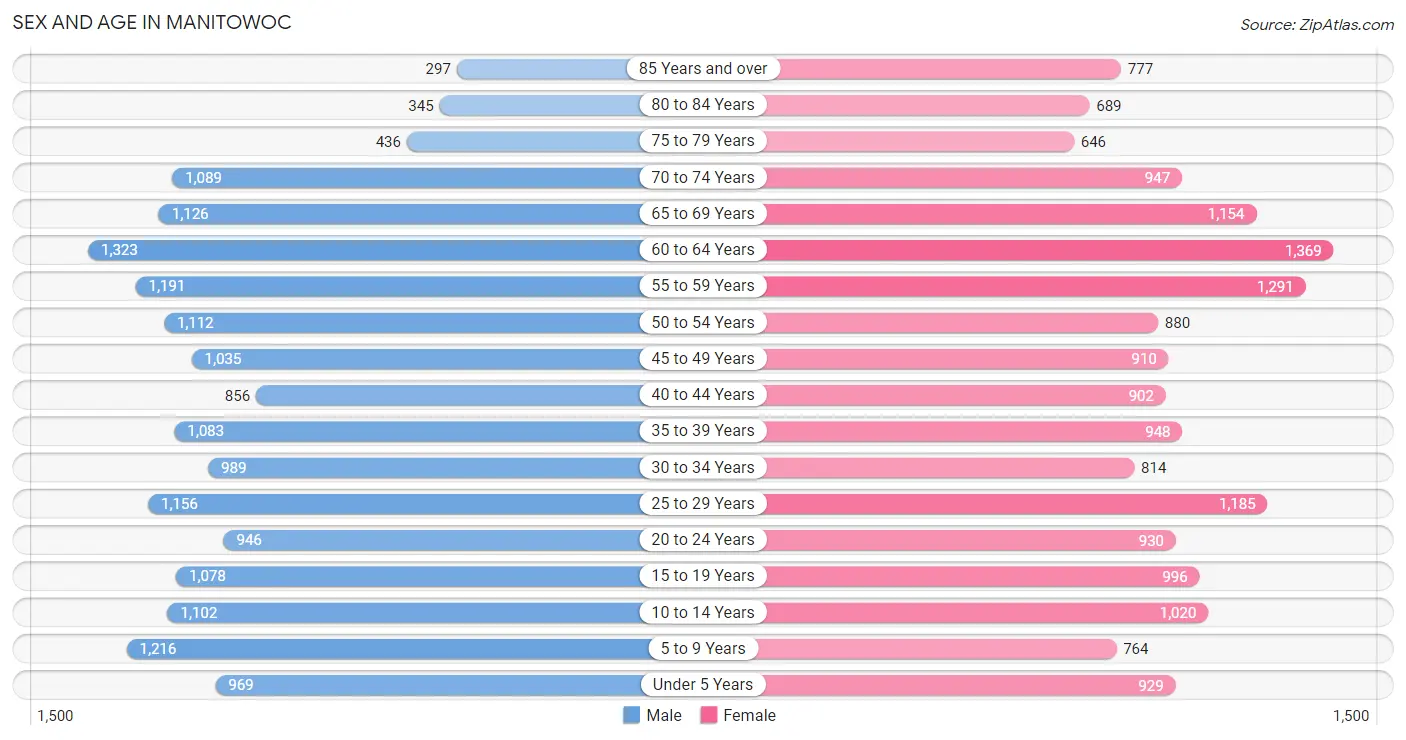
| Age Bracket | Male | Female |
| Under 5 Years | 969 (5.6%) | 929 (5.4%) |
| 5 to 9 Years | 1,216 (7.0%) | 764 (4.4%) |
| 10 to 14 Years | 1,102 (6.4%) | 1,020 (5.9%) |
| 15 to 19 Years | 1,078 (6.2%) | 996 (5.8%) |
| 20 to 24 Years | 946 (5.4%) | 930 (5.4%) |
| 25 to 29 Years | 1,156 (6.7%) | 1,185 (6.9%) |
| 30 to 34 Years | 989 (5.7%) | 814 (4.8%) |
| 35 to 39 Years | 1,083 (6.2%) | 948 (5.5%) |
| 40 to 44 Years | 856 (4.9%) | 902 (5.3%) |
| 45 to 49 Years | 1,035 (6.0%) | 910 (5.3%) |
| 50 to 54 Years | 1,112 (6.4%) | 880 (5.1%) |
| 55 to 59 Years | 1,191 (6.9%) | 1,291 (7.5%) |
| 60 to 64 Years | 1,323 (7.6%) | 1,369 (8.0%) |
| 65 to 69 Years | 1,126 (6.5%) | 1,154 (6.7%) |
| 70 to 74 Years | 1,089 (6.3%) | 947 (5.5%) |
| 75 to 79 Years | 436 (2.5%) | 646 (3.8%) |
| 80 to 84 Years | 345 (2.0%) | 689 (4.0%) |
| 85 Years and over | 297 (1.7%) | 777 (4.5%) |
| Total | 17,349 (100.0%) | 17,151 (100.0%) |
Families and Households in Manitowoc
Median Family Size in Manitowoc
The median family size in Manitowoc is 2.90 persons per family, with married-couple families (5,784 | 69.0%) accounting for the largest median family size of 2.93 persons per family. On the other hand, single male/father families (778 | 9.3%) represent the smallest median family size with 2.68 persons per family.
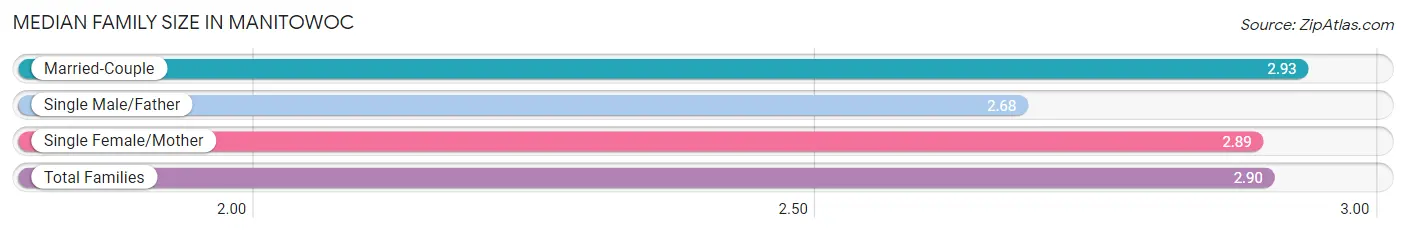
| Family Type | # Families | Family Size |
| Married-Couple | 5,784 (69.0%) | 2.93 |
| Single Male/Father | 778 (9.3%) | 2.68 |
| Single Female/Mother | 1,826 (21.8%) | 2.89 |
| Total Families | 8,388 (100.0%) | 2.90 |
Median Household Size in Manitowoc
The median household size in Manitowoc is 2.26 persons per household, with single male/father households (778 | 5.3%) accounting for the largest median household size of 3.45 persons per household. non-family households (6,386 | 43.2%) represent the smallest median household size with 1.22 persons per household.
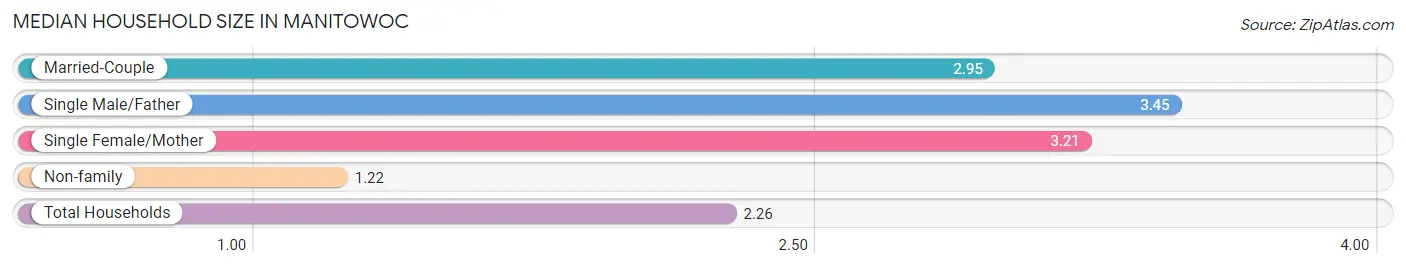
| Household Type | # Households | Household Size |
| Married-Couple | 5,784 (39.2%) | 2.95 |
| Single Male/Father | 778 (5.3%) | 3.45 |
| Single Female/Mother | 1,826 (12.4%) | 3.21 |
| Non-family | 6,386 (43.2%) | 1.22 |
| Total Households | 14,774 (100.0%) | 2.26 |
Household Size by Marriage Status in Manitowoc
Out of a total of 14,774 households in Manitowoc, 8,388 (56.8%) are family households, while 6,386 (43.2%) are nonfamily households. The most numerous type of family households are 2-person households, comprising 4,061, and the most common type of nonfamily households are 1-person households, comprising 5,362.
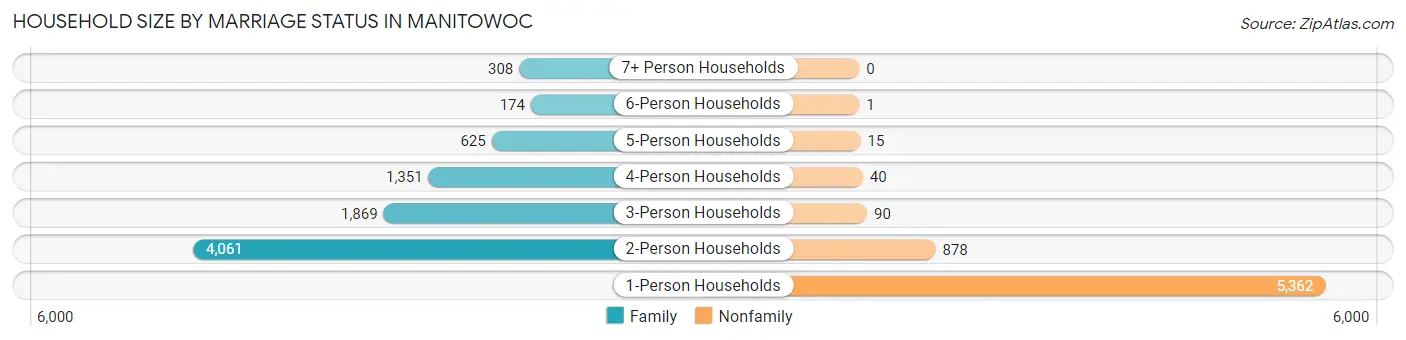
| Household Size | Family Households | Nonfamily Households |
| 1-Person Households | - | 5,362 (36.3%) |
| 2-Person Households | 4,061 (27.5%) | 878 (5.9%) |
| 3-Person Households | 1,869 (12.7%) | 90 (0.6%) |
| 4-Person Households | 1,351 (9.1%) | 40 (0.3%) |
| 5-Person Households | 625 (4.2%) | 15 (0.1%) |
| 6-Person Households | 174 (1.2%) | 1 (0.0%) |
| 7+ Person Households | 308 (2.1%) | 0 (0.0%) |
| Total | 8,388 (56.8%) | 6,386 (43.2%) |
Female Fertility in Manitowoc
Fertility by Age in Manitowoc
Average fertility rate in Manitowoc is 61.0 births per 1,000 women. Women in the age bracket of 20 to 34 years have the highest fertility rate with 119.0 births per 1,000 women. Women in the age bracket of 20 to 34 years acount for 84.3% of all women with births.
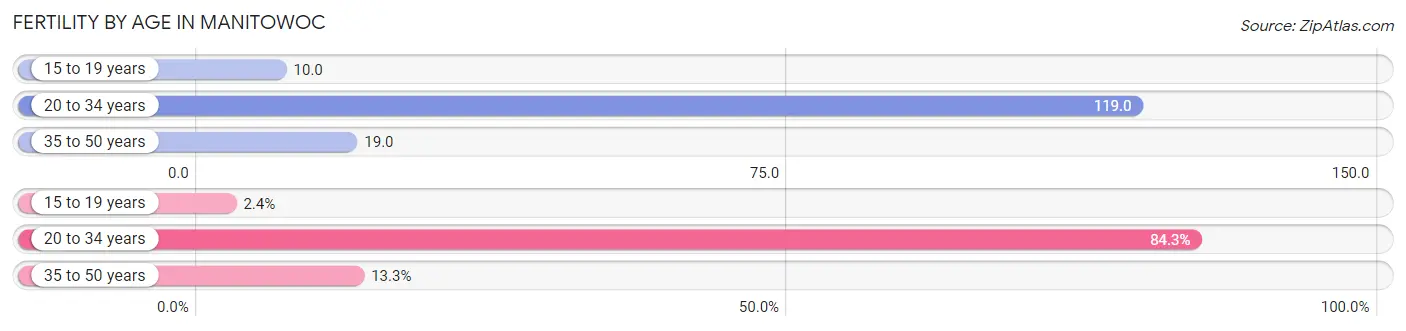
| Age Bracket | Women with Births | Births / 1,000 Women |
| 15 to 19 years | 10 (2.4%) | 10.0 |
| 20 to 34 years | 350 (84.3%) | 119.0 |
| 35 to 50 years | 55 (13.3%) | 19.0 |
| Total | 415 (100.0%) | 61.0 |
Fertility by Age by Marriage Status in Manitowoc
58.3% of women with births (415) in Manitowoc are married. The highest percentage of unmarried women with births falls into 15 to 19 years age bracket with 100.0% of them unmarried at the time of birth, while the lowest percentage of unmarried women with births belong to 35 to 50 years age bracket with 14.5% of them unmarried.
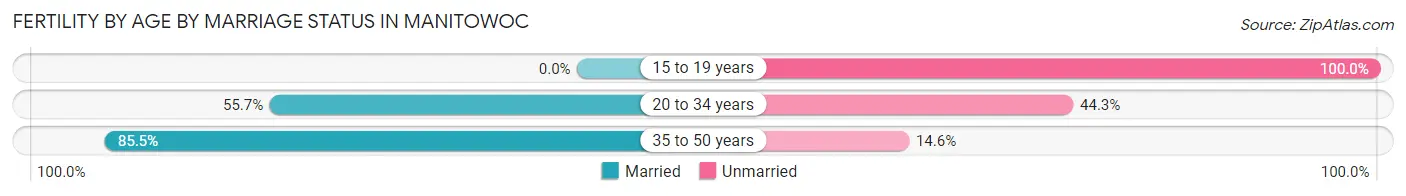
| Age Bracket | Married | Unmarried |
| 15 to 19 years | 0 (0.0%) | 10 (100.0%) |
| 20 to 34 years | 195 (55.7%) | 155 (44.3%) |
| 35 to 50 years | 47 (85.5%) | 8 (14.5%) |
| Total | 242 (58.3%) | 173 (41.7%) |
Fertility by Education in Manitowoc
Average fertility rate in Manitowoc is 61.0 births per 1,000 women. Women with the education attainment of graduate degree have the highest fertility rate of 123.0 births per 1,000 women, while women with the education attainment of less than high school have the lowest fertility at 31.0 births per 1,000 women. Women with the education attainment of college or associate's degree represent 26.3% of all women with births.
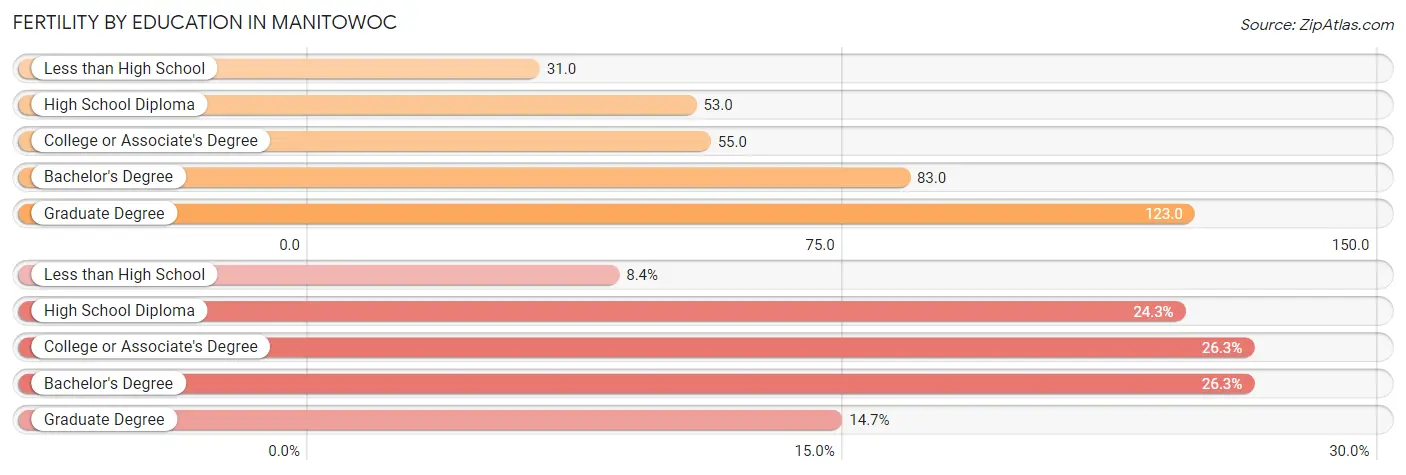
| Educational Attainment | Women with Births | Births / 1,000 Women |
| Less than High School | 35 (8.4%) | 31.0 |
| High School Diploma | 101 (24.3%) | 53.0 |
| College or Associate's Degree | 109 (26.3%) | 55.0 |
| Bachelor's Degree | 109 (26.3%) | 83.0 |
| Graduate Degree | 61 (14.7%) | 123.0 |
| Total | 415 (100.0%) | 61.0 |
Fertility by Education by Marriage Status in Manitowoc
41.7% of women with births in Manitowoc are unmarried. Women with the educational attainment of college or associate's degree are most likely to be married with 87.2% of them married at childbirth, while women with the educational attainment of less than high school are least likely to be married with 100.0% of them unmarried at childbirth.
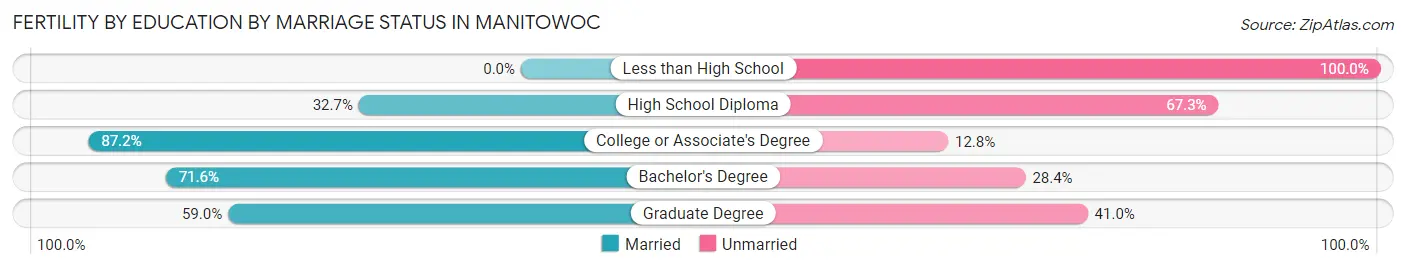
| Educational Attainment | Married | Unmarried |
| Less than High School | 0 (0.0%) | 35 (100.0%) |
| High School Diploma | 33 (32.7%) | 68 (67.3%) |
| College or Associate's Degree | 95 (87.2%) | 14 (12.8%) |
| Bachelor's Degree | 78 (71.6%) | 31 (28.4%) |
| Graduate Degree | 36 (59.0%) | 25 (41.0%) |
| Total | 242 (58.3%) | 173 (41.7%) |
Employment Characteristics in Manitowoc
Employment by Class of Employer in Manitowoc
Among the 16,089 employed individuals in Manitowoc, private company employees (12,032 | 74.8%), not-for-profit organizations (1,805 | 11.2%), and local government employees (1,043 | 6.5%) make up the most common classes of employment.
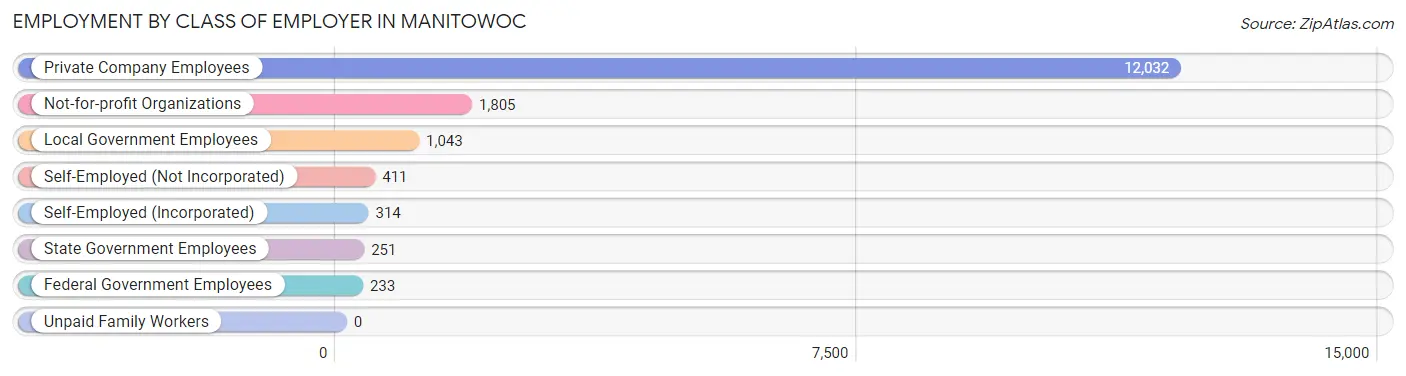
| Employer Class | # Employees | % Employees |
| Private Company Employees | 12,032 | 74.8% |
| Self-Employed (Incorporated) | 314 | 1.9% |
| Self-Employed (Not Incorporated) | 411 | 2.5% |
| Not-for-profit Organizations | 1,805 | 11.2% |
| Local Government Employees | 1,043 | 6.5% |
| State Government Employees | 251 | 1.6% |
| Federal Government Employees | 233 | 1.5% |
| Unpaid Family Workers | 0 | 0.0% |
| Total | 16,089 | 100.0% |
Employment Status by Age in Manitowoc
According to the labor force statistics for Manitowoc, out of the total population over 16 years of age (27,994), 59.7% or 16,712 individuals are in the labor force, with 2.8% or 468 of them unemployed. The age group with the highest labor force participation rate is 30 to 34 years, with 89.2% or 1,608 individuals in the labor force. Within the labor force, the 16 to 19 years age range has the highest percentage of unemployed individuals, with 13.4% or 116 of them being unemployed.
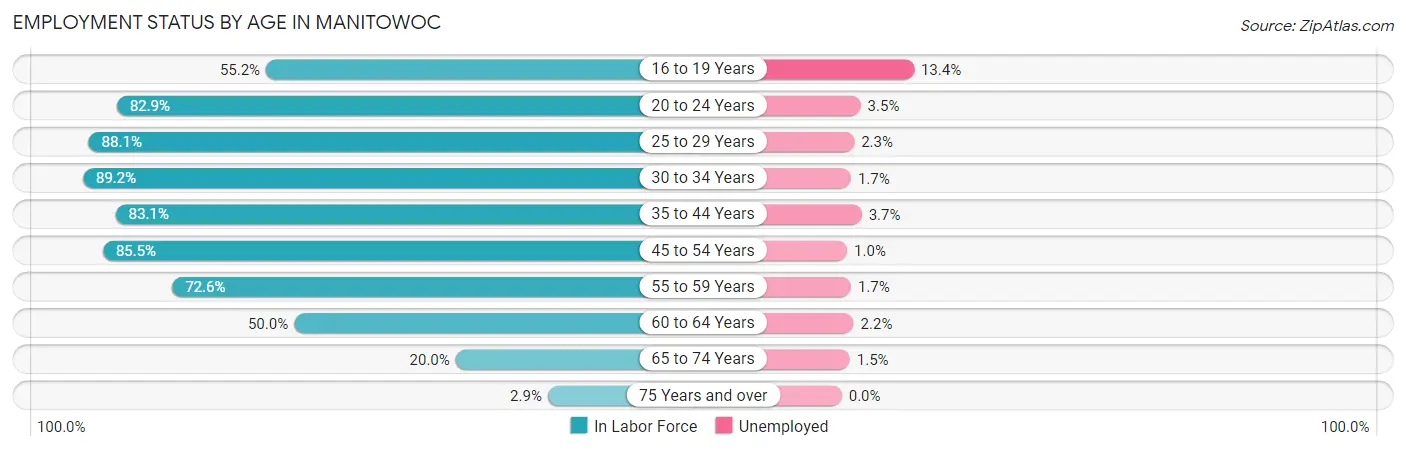
| Age Bracket | In Labor Force | Unemployed |
| 16 to 19 Years | 866 (55.2%) | 116 (13.4%) |
| 20 to 24 Years | 1,555 (82.9%) | 54 (3.5%) |
| 25 to 29 Years | 2,062 (88.1%) | 47 (2.3%) |
| 30 to 34 Years | 1,608 (89.2%) | 27 (1.7%) |
| 35 to 44 Years | 3,149 (83.1%) | 117 (3.7%) |
| 45 to 54 Years | 3,366 (85.5%) | 34 (1.0%) |
| 55 to 59 Years | 1,802 (72.6%) | 31 (1.7%) |
| 60 to 64 Years | 1,346 (50.0%) | 30 (2.2%) |
| 65 to 74 Years | 863 (20.0%) | 13 (1.5%) |
| 75 Years and over | 93 (2.9%) | 0 (0.0%) |
| Total | 16,712 (59.7%) | 468 (2.8%) |
Employment Status by Educational Attainment in Manitowoc
According to labor force statistics for Manitowoc, 78.2% of individuals (13,328) out of the total population between 25 and 64 years of age (17,044) are in the labor force, with 2.1% or 280 of them being unemployed. The group with the highest labor force participation rate are those with the educational attainment of bachelor's degree or higher, with 89.4% or 3,944 individuals in the labor force. Within the labor force, individuals with less than high school education have the highest percentage of unemployment, with 7.1% or 54 of them being unemployed.
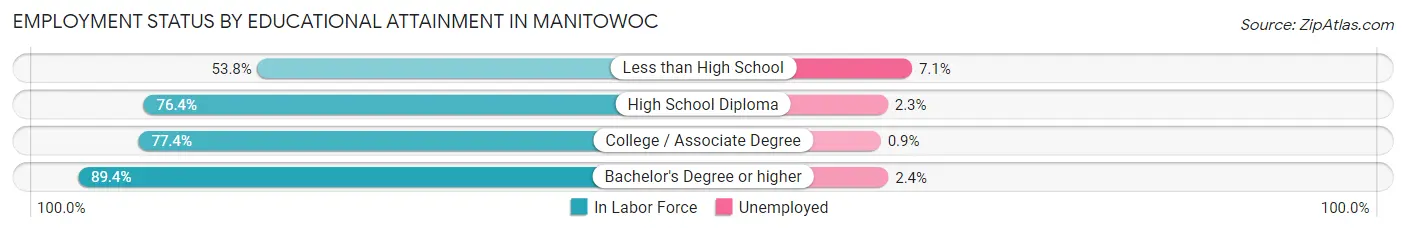
| Educational Attainment | In Labor Force | Unemployed |
| Less than High School | 762 (53.8%) | 101 (7.1%) |
| High School Diploma | 4,268 (76.4%) | 129 (2.3%) |
| College / Associate Degree | 4,356 (77.4%) | 51 (0.9%) |
| Bachelor's Degree or higher | 3,944 (89.4%) | 106 (2.4%) |
| Total | 13,328 (78.2%) | 358 (2.1%) |
Employment Occupations by Sex in Manitowoc
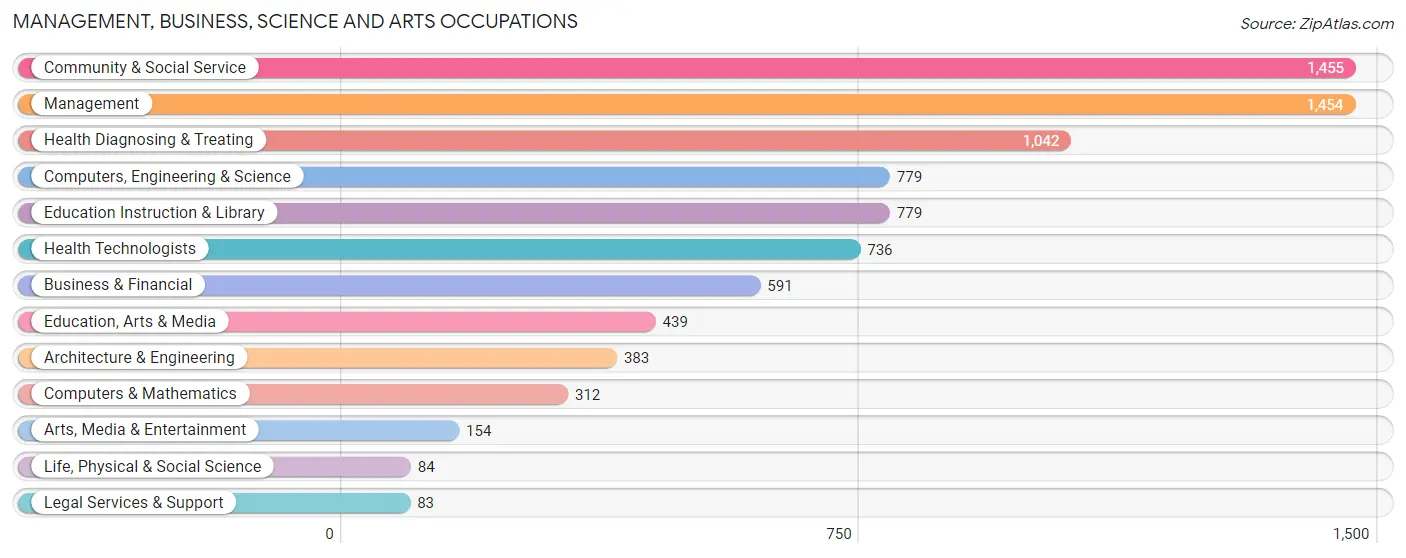
Management, Business, Science and Arts Occupations
The most common Management, Business, Science and Arts occupations in Manitowoc are Community & Social Service (1,455 | 9.0%), Management (1,454 | 9.0%), Health Diagnosing & Treating (1,042 | 6.4%), Computers, Engineering & Science (779 | 4.8%), and Education Instruction & Library (779 | 4.8%).
Management, Business, Science and Arts Occupations by Sex
Within the Management, Business, Science and Arts occupations in Manitowoc, the most male-oriented occupations are Architecture & Engineering (91.4%), Computers, Engineering & Science (87.0%), and Computers & Mathematics (84.3%), while the most female-oriented occupations are Health Diagnosing & Treating (92.7%), Health Technologists (89.7%), and Education Instruction & Library (62.0%).
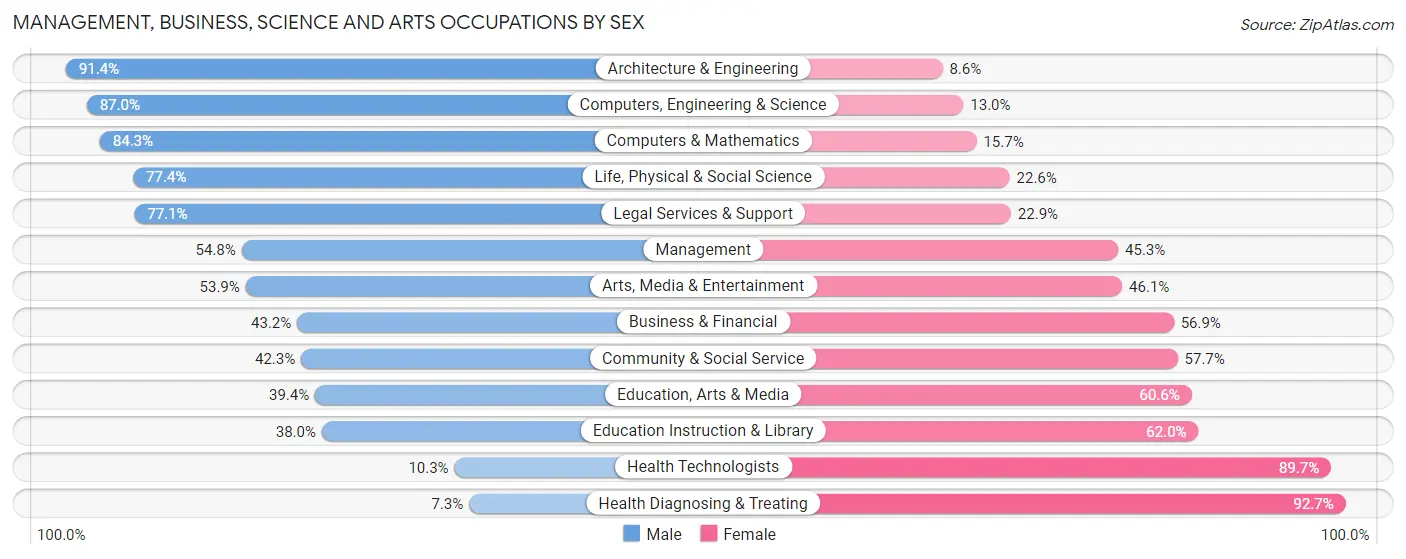
| Occupation | Male | Female |
| Management | 796 (54.7%) | 658 (45.3%) |
| Business & Financial | 255 (43.1%) | 336 (56.9%) |
| Computers, Engineering & Science | 678 (87.0%) | 101 (13.0%) |
| Computers & Mathematics | 263 (84.3%) | 49 (15.7%) |
| Architecture & Engineering | 350 (91.4%) | 33 (8.6%) |
| Life, Physical & Social Science | 65 (77.4%) | 19 (22.6%) |
| Community & Social Service | 616 (42.3%) | 839 (57.7%) |
| Education, Arts & Media | 173 (39.4%) | 266 (60.6%) |
| Legal Services & Support | 64 (77.1%) | 19 (22.9%) |
| Education Instruction & Library | 296 (38.0%) | 483 (62.0%) |
| Arts, Media & Entertainment | 83 (53.9%) | 71 (46.1%) |
| Health Diagnosing & Treating | 76 (7.3%) | 966 (92.7%) |
| Health Technologists | 76 (10.3%) | 660 (89.7%) |
| Total (Category) | 2,421 (45.5%) | 2,900 (54.5%) |
| Total (Overall) | 8,846 (54.6%) | 7,350 (45.4%) |
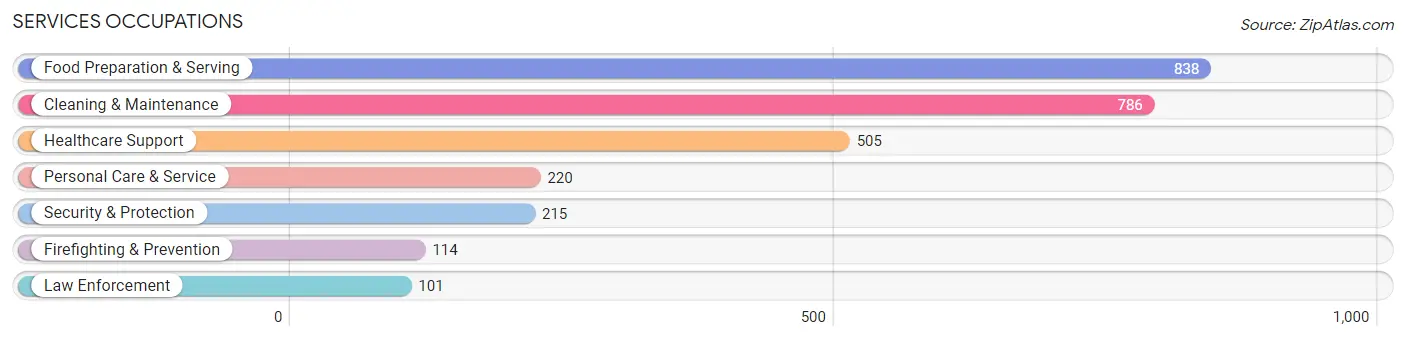
Services Occupations
The most common Services occupations in Manitowoc are Food Preparation & Serving (838 | 5.2%), Cleaning & Maintenance (786 | 4.9%), Healthcare Support (505 | 3.1%), Personal Care & Service (220 | 1.4%), and Security & Protection (215 | 1.3%).
Services Occupations by Sex
Within the Services occupations in Manitowoc, the most male-oriented occupations are Firefighting & Prevention (100.0%), Security & Protection (96.3%), and Law Enforcement (92.1%), while the most female-oriented occupations are Personal Care & Service (85.5%), Healthcare Support (82.6%), and Cleaning & Maintenance (64.5%).
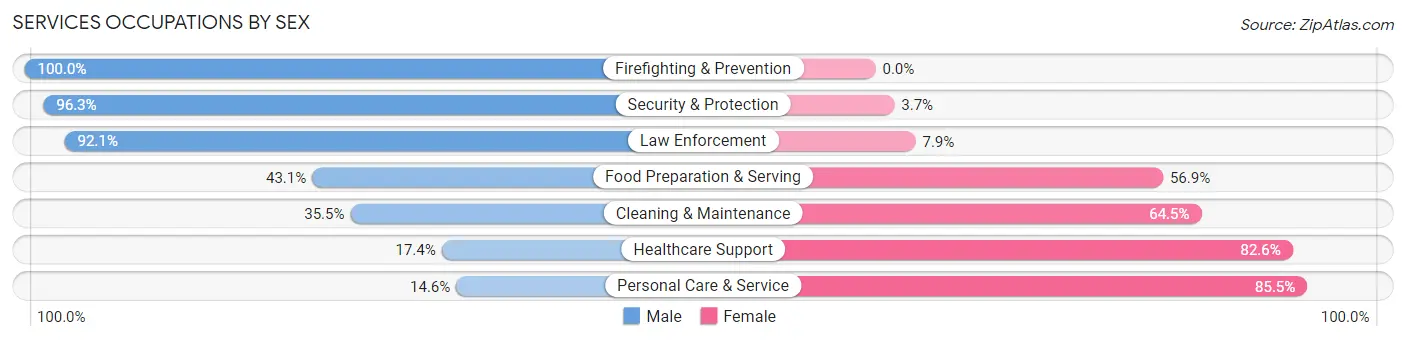
| Occupation | Male | Female |
| Healthcare Support | 88 (17.4%) | 417 (82.6%) |
| Security & Protection | 207 (96.3%) | 8 (3.7%) |
| Firefighting & Prevention | 114 (100.0%) | 0 (0.0%) |
| Law Enforcement | 93 (92.1%) | 8 (7.9%) |
| Food Preparation & Serving | 361 (43.1%) | 477 (56.9%) |
| Cleaning & Maintenance | 279 (35.5%) | 507 (64.5%) |
| Personal Care & Service | 32 (14.5%) | 188 (85.5%) |
| Total (Category) | 967 (37.7%) | 1,597 (62.3%) |
| Total (Overall) | 8,846 (54.6%) | 7,350 (45.4%) |
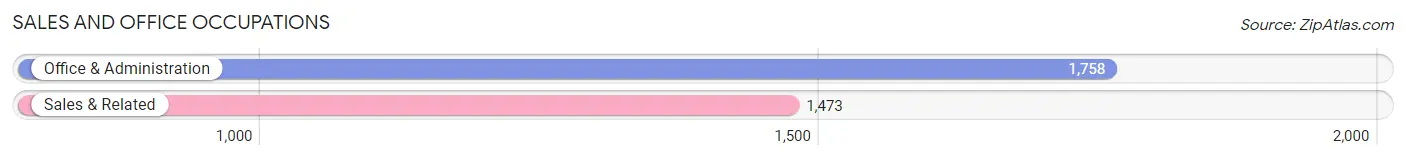
Sales and Office Occupations
The most common Sales and Office occupations in Manitowoc are Office & Administration (1,758 | 10.8%), and Sales & Related (1,473 | 9.1%).
Sales and Office Occupations by Sex
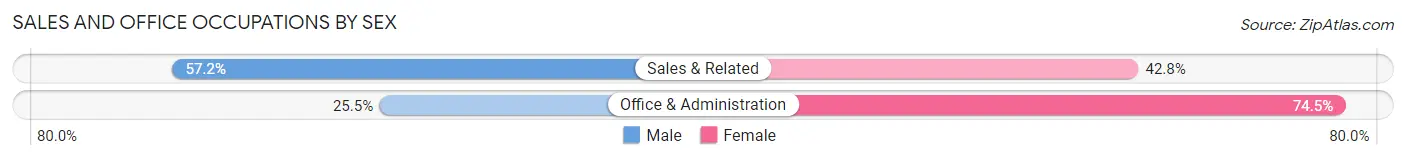
| Occupation | Male | Female |
| Sales & Related | 843 (57.2%) | 630 (42.8%) |
| Office & Administration | 448 (25.5%) | 1,310 (74.5%) |
| Total (Category) | 1,291 (40.0%) | 1,940 (60.0%) |
| Total (Overall) | 8,846 (54.6%) | 7,350 (45.4%) |
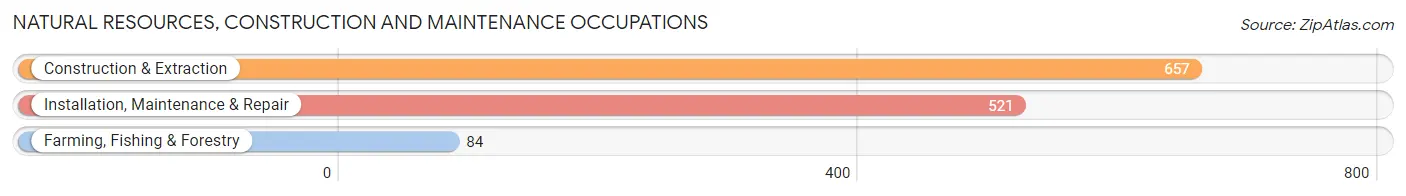
Natural Resources, Construction and Maintenance Occupations
The most common Natural Resources, Construction and Maintenance occupations in Manitowoc are Construction & Extraction (657 | 4.1%), Installation, Maintenance & Repair (521 | 3.2%), and Farming, Fishing & Forestry (84 | 0.5%).
Natural Resources, Construction and Maintenance Occupations by Sex
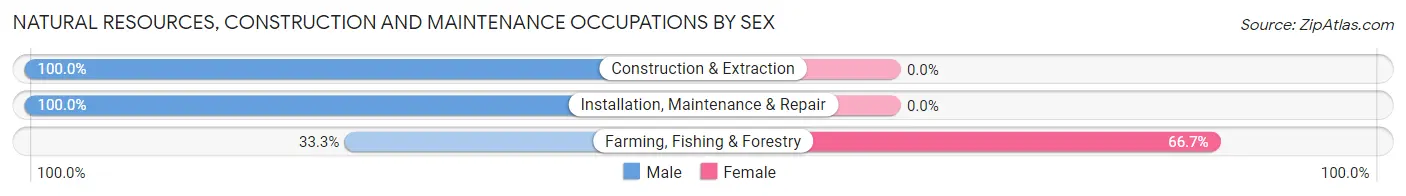
| Occupation | Male | Female |
| Farming, Fishing & Forestry | 28 (33.3%) | 56 (66.7%) |
| Construction & Extraction | 657 (100.0%) | 0 (0.0%) |
| Installation, Maintenance & Repair | 521 (100.0%) | 0 (0.0%) |
| Total (Category) | 1,206 (95.6%) | 56 (4.4%) |
| Total (Overall) | 8,846 (54.6%) | 7,350 (45.4%) |
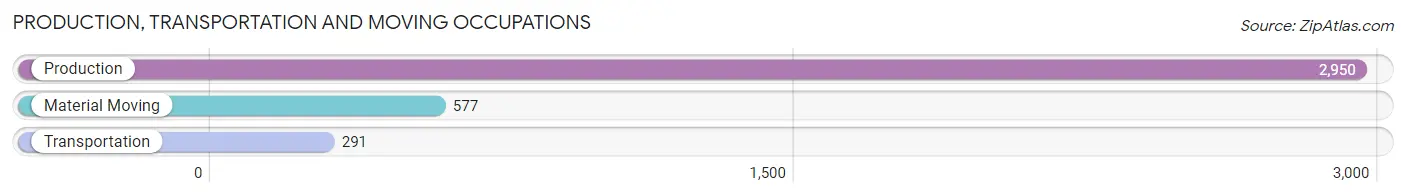
Production, Transportation and Moving Occupations
The most common Production, Transportation and Moving occupations in Manitowoc are Production (2,950 | 18.2%), Material Moving (577 | 3.6%), and Transportation (291 | 1.8%).
Production, Transportation and Moving Occupations by Sex
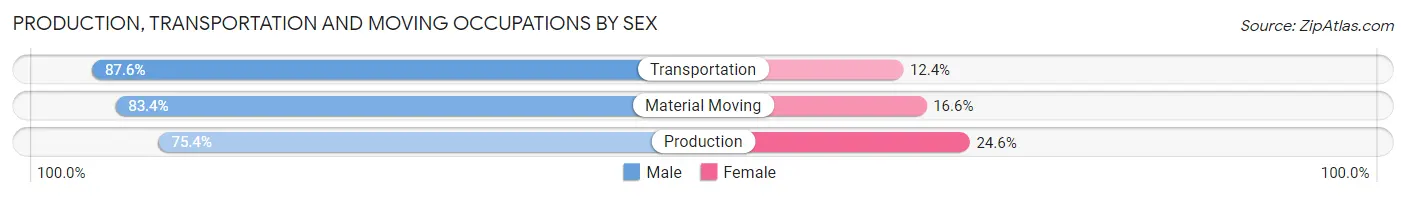
| Occupation | Male | Female |
| Production | 2,225 (75.4%) | 725 (24.6%) |
| Transportation | 255 (87.6%) | 36 (12.4%) |
| Material Moving | 481 (83.4%) | 96 (16.6%) |
| Total (Category) | 2,961 (77.5%) | 857 (22.5%) |
| Total (Overall) | 8,846 (54.6%) | 7,350 (45.4%) |
Employment Industries by Sex in Manitowoc
Employment Industries in Manitowoc
The major employment industries in Manitowoc include Manufacturing (4,825 | 29.8%), Health Care & Social Assistance (2,403 | 14.8%), Retail Trade (1,869 | 11.5%), Accommodation & Food Services (1,149 | 7.1%), and Educational Services (797 | 4.9%).
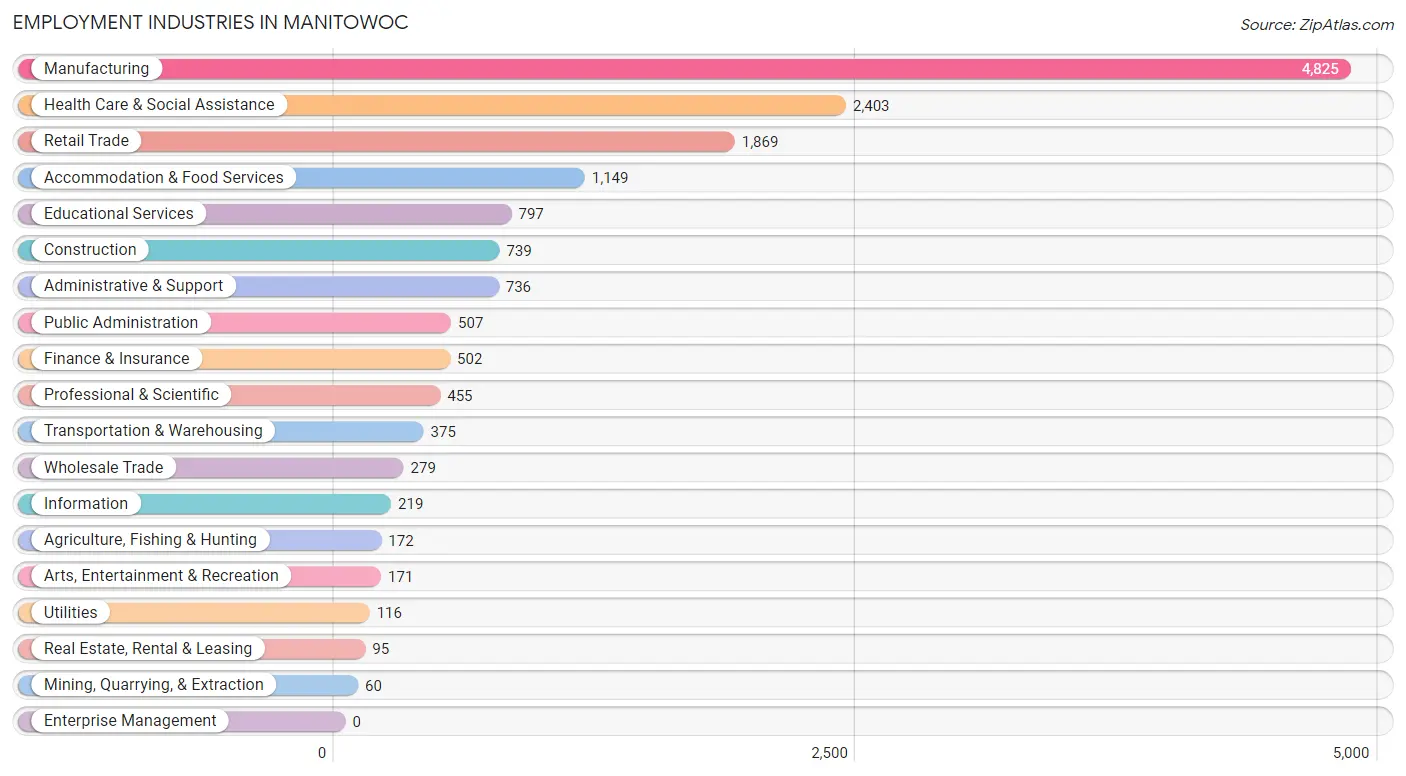
Employment Industries by Sex in Manitowoc
The Manitowoc industries that see more men than women are Mining, Quarrying, & Extraction (100.0%), Construction (100.0%), and Utilities (92.2%), whereas the industries that tend to have a higher number of women are Health Care & Social Assistance (84.7%), Educational Services (72.0%), and Finance & Insurance (64.1%).
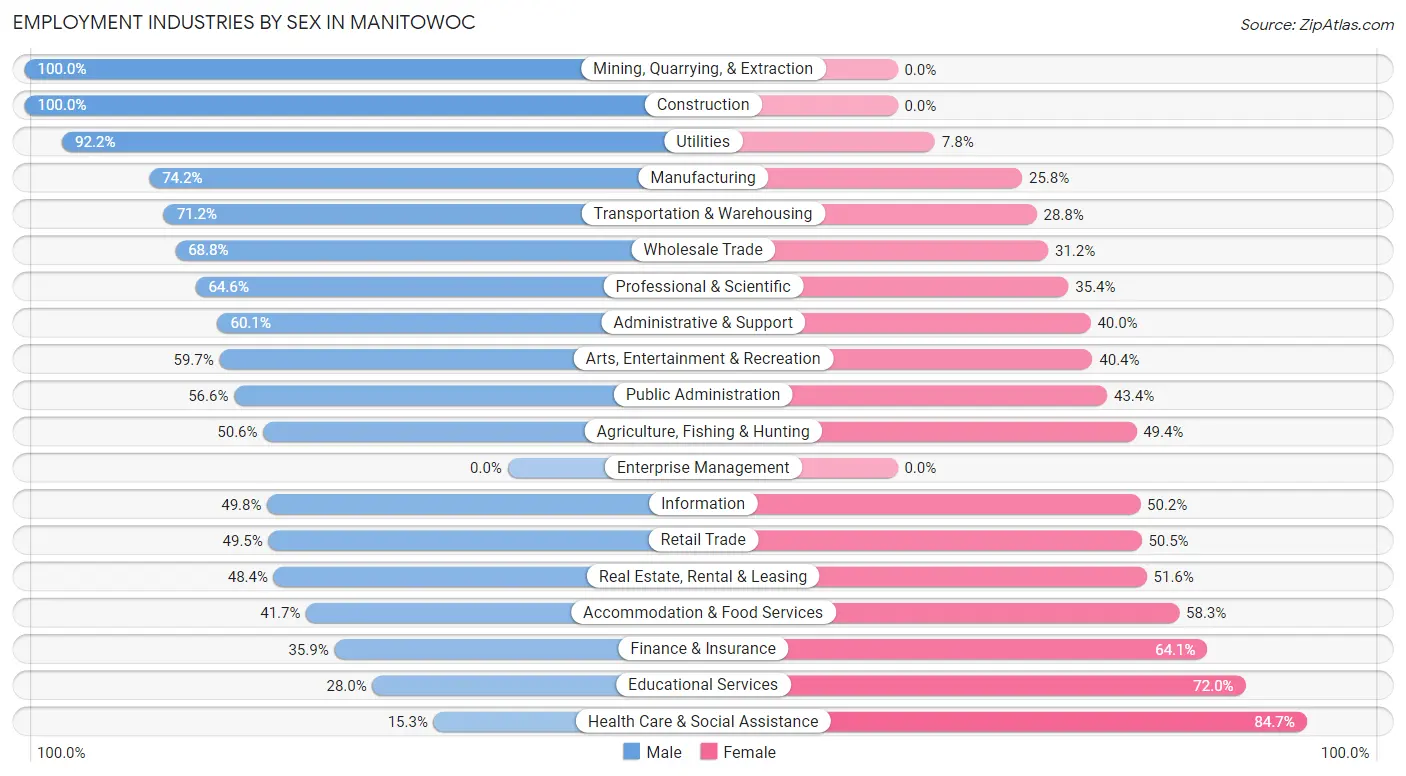
| Industry | Male | Female |
| Agriculture, Fishing & Hunting | 87 (50.6%) | 85 (49.4%) |
| Mining, Quarrying, & Extraction | 60 (100.0%) | 0 (0.0%) |
| Construction | 739 (100.0%) | 0 (0.0%) |
| Manufacturing | 3,580 (74.2%) | 1,245 (25.8%) |
| Wholesale Trade | 192 (68.8%) | 87 (31.2%) |
| Retail Trade | 925 (49.5%) | 944 (50.5%) |
| Transportation & Warehousing | 267 (71.2%) | 108 (28.8%) |
| Utilities | 107 (92.2%) | 9 (7.8%) |
| Information | 109 (49.8%) | 110 (50.2%) |
| Finance & Insurance | 180 (35.9%) | 322 (64.1%) |
| Real Estate, Rental & Leasing | 46 (48.4%) | 49 (51.6%) |
| Professional & Scientific | 294 (64.6%) | 161 (35.4%) |
| Enterprise Management | 0 (0.0%) | 0 (0.0%) |
| Administrative & Support | 442 (60.1%) | 294 (40.0%) |
| Educational Services | 223 (28.0%) | 574 (72.0%) |
| Health Care & Social Assistance | 368 (15.3%) | 2,035 (84.7%) |
| Arts, Entertainment & Recreation | 102 (59.7%) | 69 (40.4%) |
| Accommodation & Food Services | 479 (41.7%) | 670 (58.3%) |
| Public Administration | 287 (56.6%) | 220 (43.4%) |
| Total | 8,846 (54.6%) | 7,350 (45.4%) |
Education in Manitowoc
School Enrollment in Manitowoc
The most common levels of schooling among the 6,875 students in Manitowoc are middle school (1,651 | 24.0%), elementary school (1,621 | 23.6%), and high school (1,590 | 23.1%).
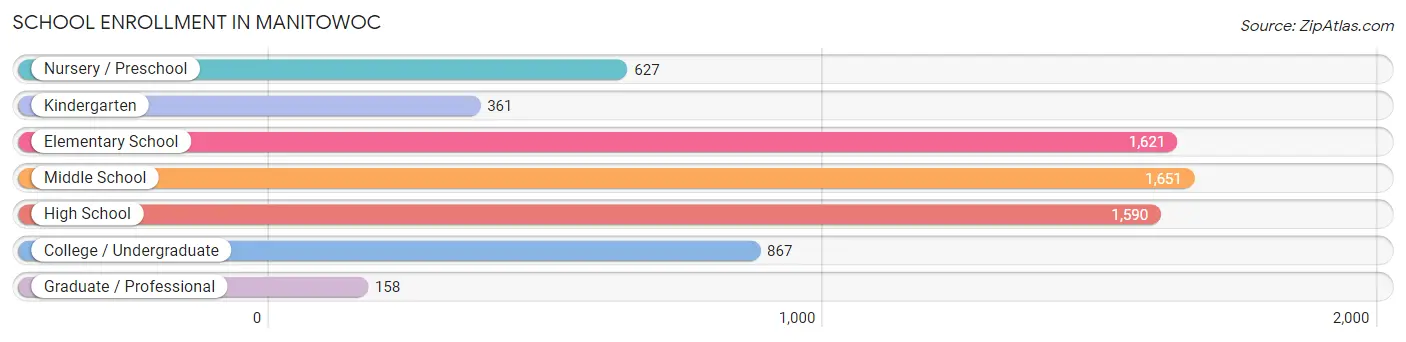
| School Level | # Students | % Students |
| Nursery / Preschool | 627 | 9.1% |
| Kindergarten | 361 | 5.2% |
| Elementary School | 1,621 | 23.6% |
| Middle School | 1,651 | 24.0% |
| High School | 1,590 | 23.1% |
| College / Undergraduate | 867 | 12.6% |
| Graduate / Professional | 158 | 2.3% |
| Total | 6,875 | 100.0% |
School Enrollment by Age by Funding Source in Manitowoc
Out of a total of 6,875 students who are enrolled in schools in Manitowoc, 1,121 (16.3%) attend a private institution, while the remaining 5,754 (83.7%) are enrolled in public schools. The age group of 3 to 4 year olds has the highest likelihood of being enrolled in private schools, with 90 (18.8% in the age bracket) enrolled. Conversely, the age group of 20 to 24 year olds has the lowest likelihood of being enrolled in a private school, with 316 (94.3% in the age bracket) attending a public institution.
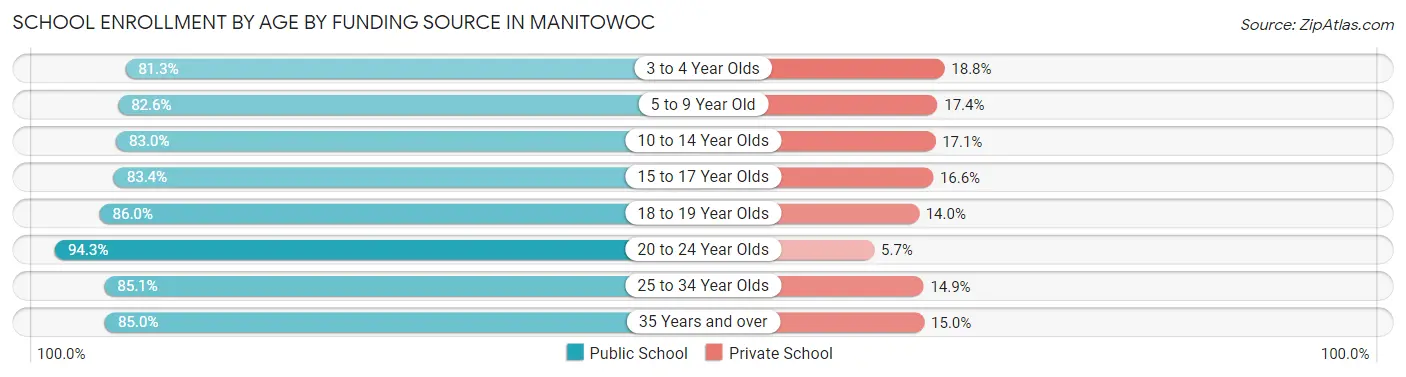
| Age Bracket | Public School | Private School |
| 3 to 4 Year Olds | 390 (81.2%) | 90 (18.8%) |
| 5 to 9 Year Old | 1,548 (82.6%) | 327 (17.4%) |
| 10 to 14 Year Olds | 1,659 (83.0%) | 341 (17.1%) |
| 15 to 17 Year Olds | 1,128 (83.4%) | 225 (16.6%) |
| 18 to 19 Year Olds | 283 (86.0%) | 46 (14.0%) |
| 20 to 24 Year Olds | 316 (94.3%) | 19 (5.7%) |
| 25 to 34 Year Olds | 252 (85.1%) | 44 (14.9%) |
| 35 Years and over | 176 (85.0%) | 31 (15.0%) |
| Total | 5,754 (83.7%) | 1,121 (16.3%) |
Educational Attainment by Field of Study in Manitowoc
Business (1,292 | 18.5%), education (1,209 | 17.3%), science & technology (988 | 14.2%), arts & humanities (546 | 7.8%), and communications (474 | 6.8%) are the most common fields of study among 6,978 individuals in Manitowoc who have obtained a bachelor's degree or higher.
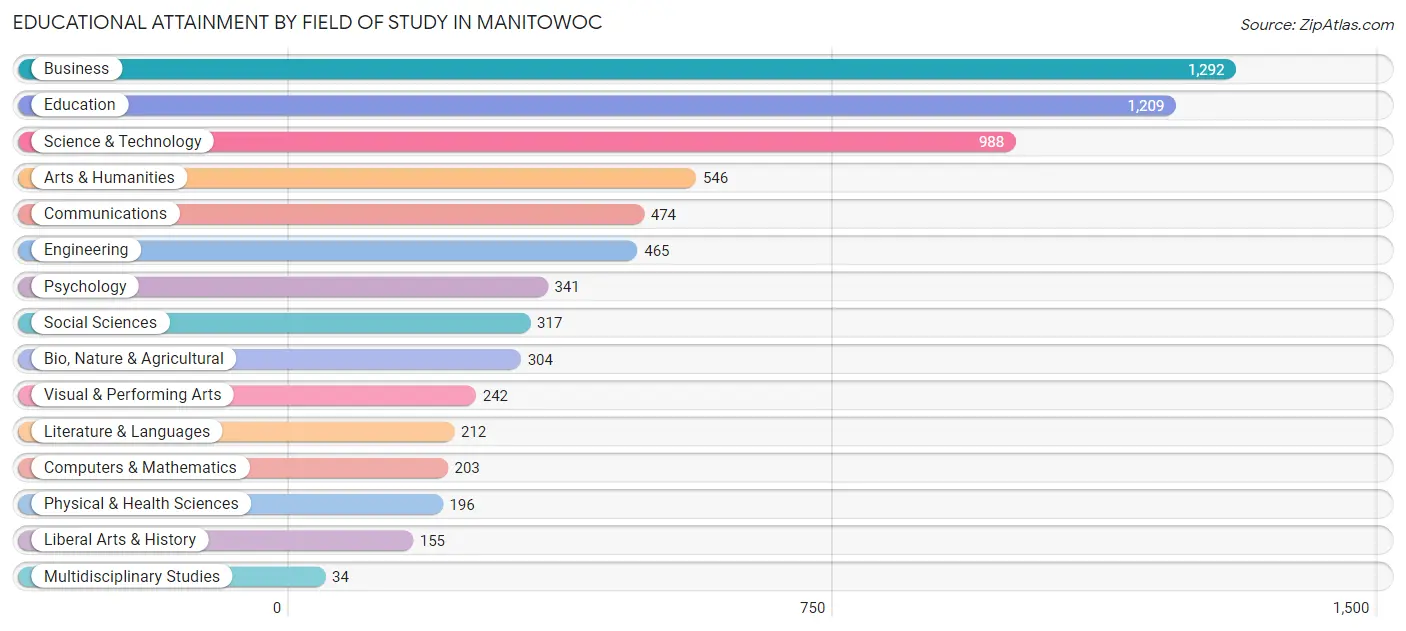
| Field of Study | # Graduates | % Graduates |
| Computers & Mathematics | 203 | 2.9% |
| Bio, Nature & Agricultural | 304 | 4.4% |
| Physical & Health Sciences | 196 | 2.8% |
| Psychology | 341 | 4.9% |
| Social Sciences | 317 | 4.5% |
| Engineering | 465 | 6.7% |
| Multidisciplinary Studies | 34 | 0.5% |
| Science & Technology | 988 | 14.2% |
| Business | 1,292 | 18.5% |
| Education | 1,209 | 17.3% |
| Literature & Languages | 212 | 3.0% |
| Liberal Arts & History | 155 | 2.2% |
| Visual & Performing Arts | 242 | 3.5% |
| Communications | 474 | 6.8% |
| Arts & Humanities | 546 | 7.8% |
| Total | 6,978 | 100.0% |
Transportation & Commute in Manitowoc
Vehicle Availability by Sex in Manitowoc
The most prevalent vehicle ownership categories in Manitowoc are males with 2 vehicles (4,232, accounting for 48.2%) and females with 2 vehicles (3,436, making up 58.4%).
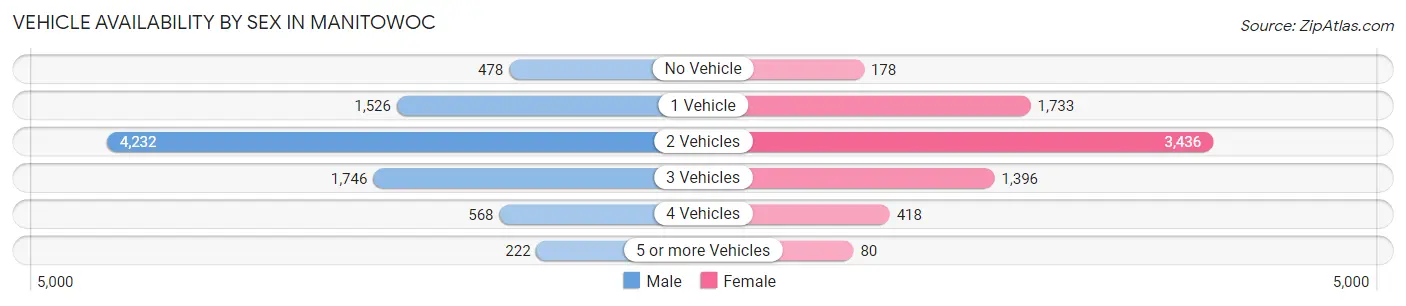
| Vehicles Available | Male | Female |
| No Vehicle | 478 (5.4%) | 178 (2.5%) |
| 1 Vehicle | 1,526 (17.4%) | 1,733 (23.9%) |
| 2 Vehicles | 4,232 (48.2%) | 3,436 (47.4%) |
| 3 Vehicles | 1,746 (19.9%) | 1,396 (19.3%) |
| 4 Vehicles | 568 (6.5%) | 418 (5.8%) |
| 5 or more Vehicles | 222 (2.5%) | 80 (1.1%) |
| Total | 8,772 (100.0%) | 7,241 (100.0%) |
Commute Time in Manitowoc
The most frequently occuring commute durations in Manitowoc are 10 to 14 minutes (4,199 commuters, 27.5%), 5 to 9 minutes (3,845 commuters, 25.2%), and 15 to 19 minutes (2,091 commuters, 13.7%).
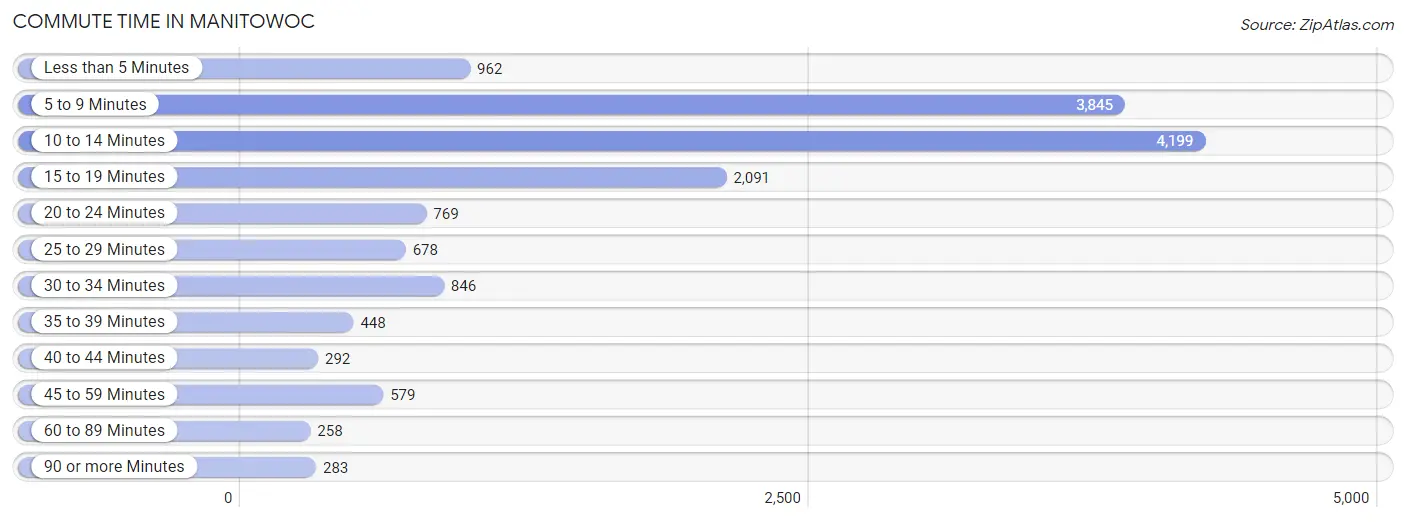
| Commute Time | # Commuters | % Commuters |
| Less than 5 Minutes | 962 | 6.3% |
| 5 to 9 Minutes | 3,845 | 25.2% |
| 10 to 14 Minutes | 4,199 | 27.5% |
| 15 to 19 Minutes | 2,091 | 13.7% |
| 20 to 24 Minutes | 769 | 5.0% |
| 25 to 29 Minutes | 678 | 4.4% |
| 30 to 34 Minutes | 846 | 5.6% |
| 35 to 39 Minutes | 448 | 2.9% |
| 40 to 44 Minutes | 292 | 1.9% |
| 45 to 59 Minutes | 579 | 3.8% |
| 60 to 89 Minutes | 258 | 1.7% |
| 90 or more Minutes | 283 | 1.9% |
Commute Time by Sex in Manitowoc
The most common commute times in Manitowoc are 10 to 14 minutes (2,208 commuters, 26.2%) for males and 5 to 9 minutes (2,048 commuters, 30.0%) for females.
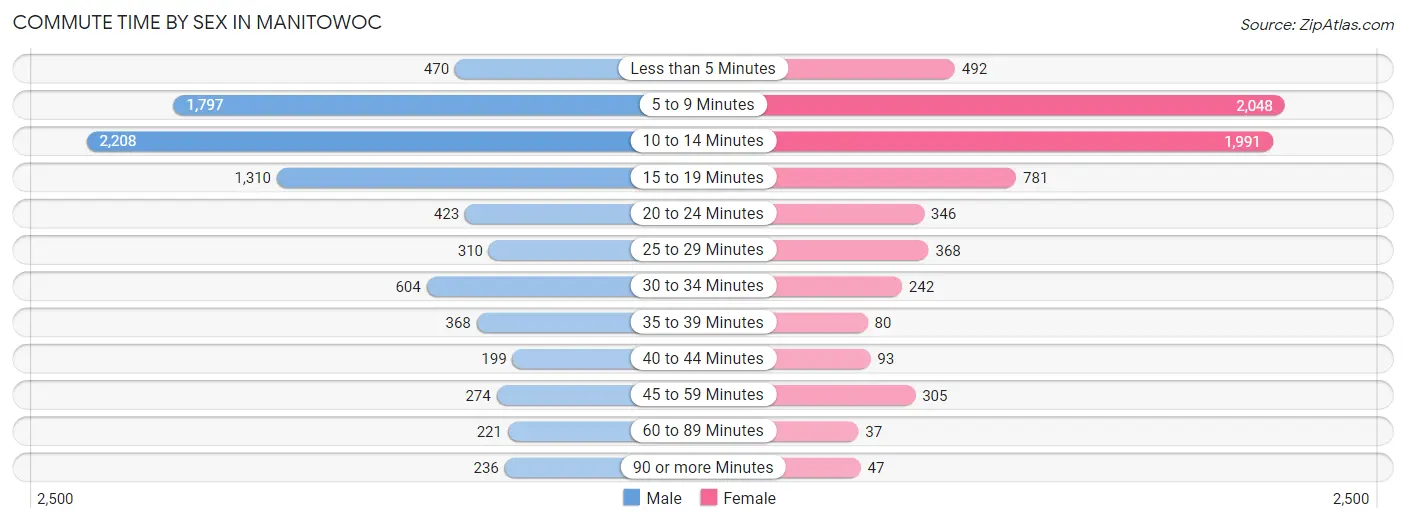
| Commute Time | Male | Female |
| Less than 5 Minutes | 470 (5.6%) | 492 (7.2%) |
| 5 to 9 Minutes | 1,797 (21.3%) | 2,048 (30.0%) |
| 10 to 14 Minutes | 2,208 (26.2%) | 1,991 (29.1%) |
| 15 to 19 Minutes | 1,310 (15.6%) | 781 (11.4%) |
| 20 to 24 Minutes | 423 (5.0%) | 346 (5.1%) |
| 25 to 29 Minutes | 310 (3.7%) | 368 (5.4%) |
| 30 to 34 Minutes | 604 (7.2%) | 242 (3.5%) |
| 35 to 39 Minutes | 368 (4.4%) | 80 (1.2%) |
| 40 to 44 Minutes | 199 (2.4%) | 93 (1.4%) |
| 45 to 59 Minutes | 274 (3.3%) | 305 (4.5%) |
| 60 to 89 Minutes | 221 (2.6%) | 37 (0.5%) |
| 90 or more Minutes | 236 (2.8%) | 47 (0.7%) |
Time of Departure to Work by Sex in Manitowoc
The most frequent times of departure to work in Manitowoc are 12:00 AM to 4:59 AM (1,211, 14.4%) for males and 7:30 AM to 7:59 AM (1,313, 19.2%) for females.
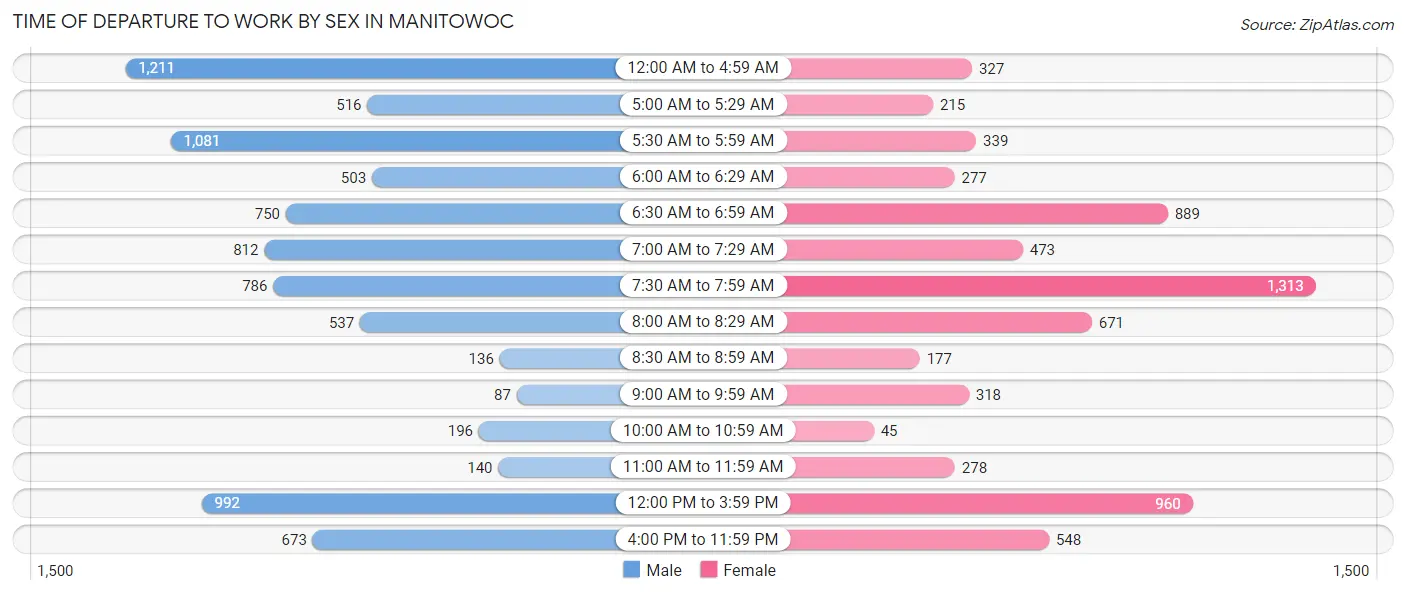
| Time of Departure | Male | Female |
| 12:00 AM to 4:59 AM | 1,211 (14.4%) | 327 (4.8%) |
| 5:00 AM to 5:29 AM | 516 (6.1%) | 215 (3.2%) |
| 5:30 AM to 5:59 AM | 1,081 (12.8%) | 339 (5.0%) |
| 6:00 AM to 6:29 AM | 503 (6.0%) | 277 (4.1%) |
| 6:30 AM to 6:59 AM | 750 (8.9%) | 889 (13.0%) |
| 7:00 AM to 7:29 AM | 812 (9.6%) | 473 (6.9%) |
| 7:30 AM to 7:59 AM | 786 (9.3%) | 1,313 (19.2%) |
| 8:00 AM to 8:29 AM | 537 (6.4%) | 671 (9.8%) |
| 8:30 AM to 8:59 AM | 136 (1.6%) | 177 (2.6%) |
| 9:00 AM to 9:59 AM | 87 (1.0%) | 318 (4.7%) |
| 10:00 AM to 10:59 AM | 196 (2.3%) | 45 (0.7%) |
| 11:00 AM to 11:59 AM | 140 (1.7%) | 278 (4.1%) |
| 12:00 PM to 3:59 PM | 992 (11.8%) | 960 (14.1%) |
| 4:00 PM to 11:59 PM | 673 (8.0%) | 548 (8.0%) |
| Total | 8,420 (100.0%) | 6,830 (100.0%) |
Housing Occupancy in Manitowoc
Occupancy by Ownership in Manitowoc
Of the total 14,774 dwellings in Manitowoc, owner-occupied units account for 9,540 (64.6%), while renter-occupied units make up 5,234 (35.4%).
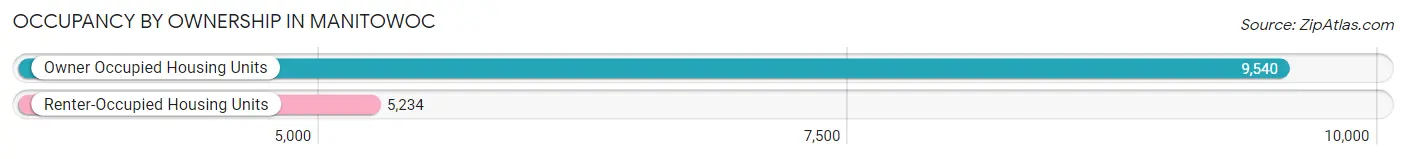
| Occupancy | # Housing Units | % Housing Units |
| Owner Occupied Housing Units | 9,540 | 64.6% |
| Renter-Occupied Housing Units | 5,234 | 35.4% |
| Total Occupied Housing Units | 14,774 | 100.0% |
Occupancy by Household Size in Manitowoc
| Household Size | # Housing Units | % Housing Units |
| 1-Person Household | 5,362 | 36.3% |
| 2-Person Household | 4,939 | 33.4% |
| 3-Person Household | 1,959 | 13.3% |
| 4+ Person Household | 2,514 | 17.0% |
| Total Housing Units | 14,774 | 100.0% |
Occupancy by Ownership by Household Size in Manitowoc
| Household Size | Owner-occupied | Renter-occupied |
| 1-Person Household | 2,546 (47.5%) | 2,816 (52.5%) |
| 2-Person Household | 3,844 (77.8%) | 1,095 (22.2%) |
| 3-Person Household | 1,220 (62.3%) | 739 (37.7%) |
| 4+ Person Household | 1,930 (76.8%) | 584 (23.2%) |
| Total Housing Units | 9,540 (64.6%) | 5,234 (35.4%) |
Occupancy by Educational Attainment in Manitowoc
| Household Size | Owner-occupied | Renter-occupied |
| Less than High School | 556 (57.5%) | 411 (42.5%) |
| High School Diploma | 2,998 (60.5%) | 1,959 (39.5%) |
| College/Associate Degree | 3,250 (64.8%) | 1,762 (35.2%) |
| Bachelor's Degree or higher | 2,736 (71.3%) | 1,102 (28.7%) |
Occupancy by Age of Householder in Manitowoc
| Age Bracket | # Households | % Households |
| Under 35 Years | 2,566 | 17.4% |
| 35 to 44 Years | 2,127 | 14.4% |
| 45 to 54 Years | 2,474 | 16.8% |
| 55 to 64 Years | 3,303 | 22.4% |
| 65 to 74 Years | 2,617 | 17.7% |
| 75 to 84 Years | 1,121 | 7.6% |
| 85 Years and Over | 566 | 3.8% |
| Total | 14,774 | 100.0% |
Housing Finances in Manitowoc
Median Income by Occupancy in Manitowoc
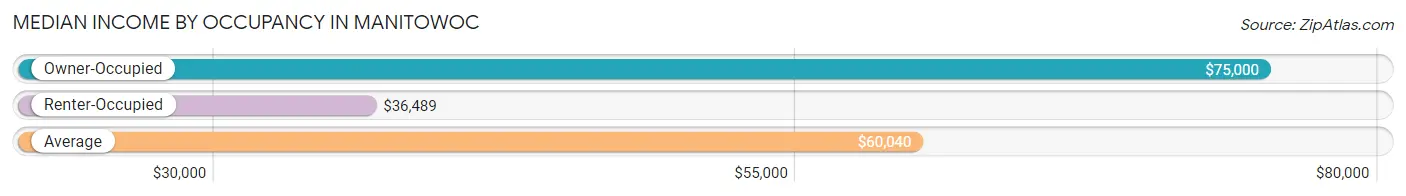
| Occupancy Type | # Households | Median Income |
| Owner-Occupied | 9,540 (64.6%) | $75,000 |
| Renter-Occupied | 5,234 (35.4%) | $36,489 |
| Average | 14,774 (100.0%) | $60,040 |
Occupancy by Householder Income Bracket in Manitowoc
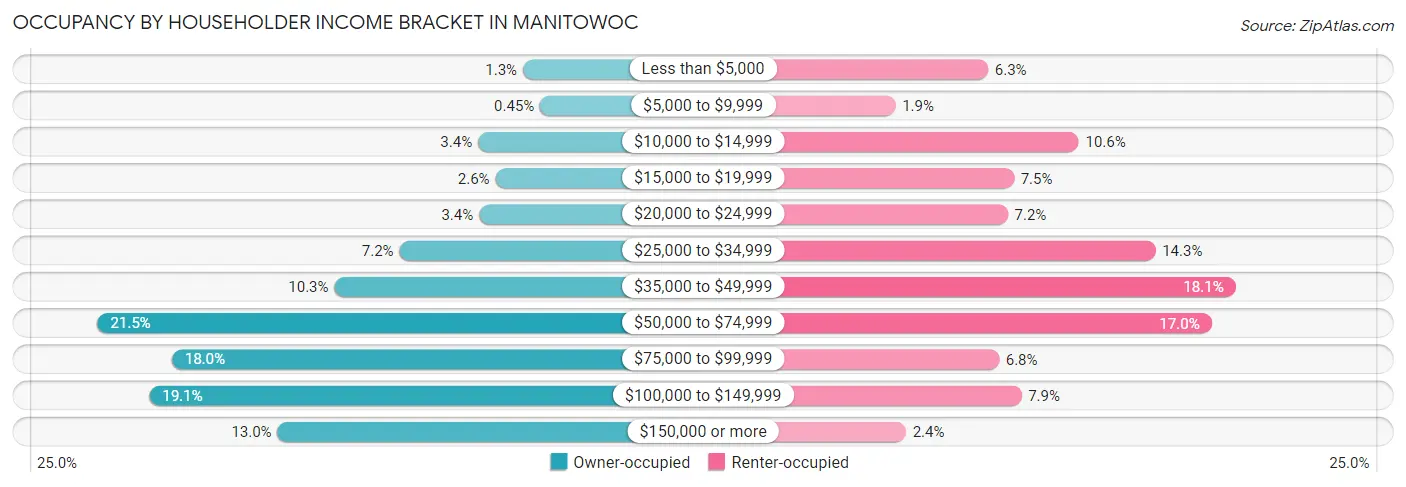
| Income Bracket | Owner-occupied | Renter-occupied |
| Less than $5,000 | 121 (1.3%) | 330 (6.3%) |
| $5,000 to $9,999 | 43 (0.4%) | 99 (1.9%) |
| $10,000 to $14,999 | 325 (3.4%) | 556 (10.6%) |
| $15,000 to $19,999 | 246 (2.6%) | 394 (7.5%) |
| $20,000 to $24,999 | 321 (3.4%) | 379 (7.2%) |
| $25,000 to $34,999 | 682 (7.1%) | 747 (14.3%) |
| $35,000 to $49,999 | 978 (10.2%) | 947 (18.1%) |
| $50,000 to $74,999 | 2,054 (21.5%) | 887 (17.0%) |
| $75,000 to $99,999 | 1,716 (18.0%) | 357 (6.8%) |
| $100,000 to $149,999 | 1,818 (19.1%) | 413 (7.9%) |
| $150,000 or more | 1,236 (13.0%) | 125 (2.4%) |
| Total | 9,540 (100.0%) | 5,234 (100.0%) |
Monthly Housing Cost Tiers in Manitowoc
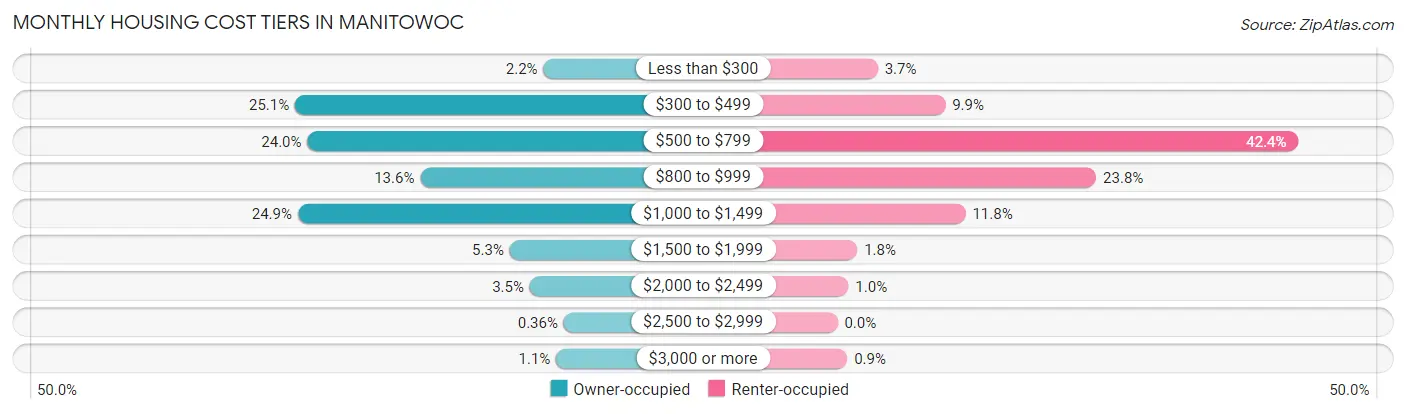
| Monthly Cost | Owner-occupied | Renter-occupied |
| Less than $300 | 214 (2.2%) | 194 (3.7%) |
| $300 to $499 | 2,395 (25.1%) | 519 (9.9%) |
| $500 to $799 | 2,287 (24.0%) | 2,221 (42.4%) |
| $800 to $999 | 1,296 (13.6%) | 1,247 (23.8%) |
| $1,000 to $1,499 | 2,371 (24.8%) | 617 (11.8%) |
| $1,500 to $1,999 | 509 (5.3%) | 95 (1.8%) |
| $2,000 to $2,499 | 333 (3.5%) | 53 (1.0%) |
| $2,500 to $2,999 | 34 (0.4%) | 0 (0.0%) |
| $3,000 or more | 101 (1.1%) | 47 (0.9%) |
| Total | 9,540 (100.0%) | 5,234 (100.0%) |
Physical Housing Characteristics in Manitowoc
Housing Structures in Manitowoc
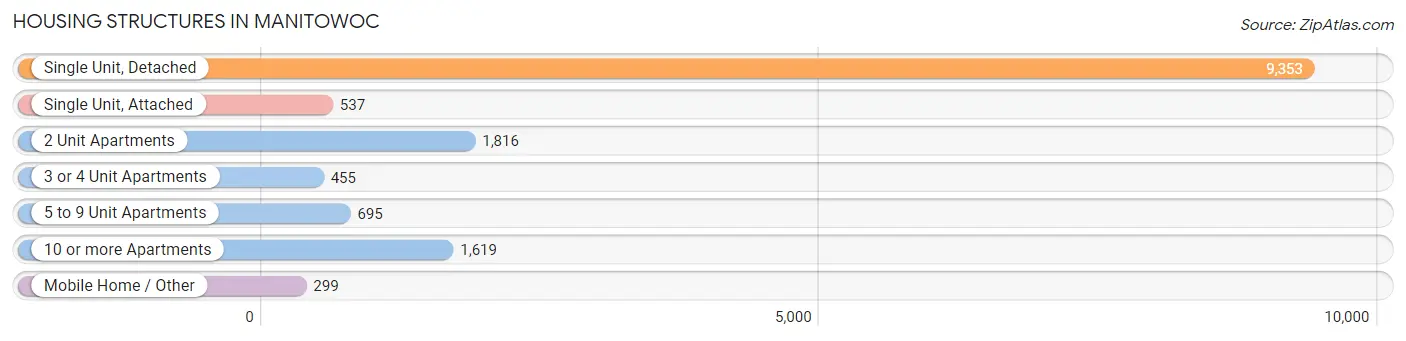
| Structure Type | # Housing Units | % Housing Units |
| Single Unit, Detached | 9,353 | 63.3% |
| Single Unit, Attached | 537 | 3.6% |
| 2 Unit Apartments | 1,816 | 12.3% |
| 3 or 4 Unit Apartments | 455 | 3.1% |
| 5 to 9 Unit Apartments | 695 | 4.7% |
| 10 or more Apartments | 1,619 | 11.0% |
| Mobile Home / Other | 299 | 2.0% |
| Total | 14,774 | 100.0% |
Housing Structures by Occupancy in Manitowoc
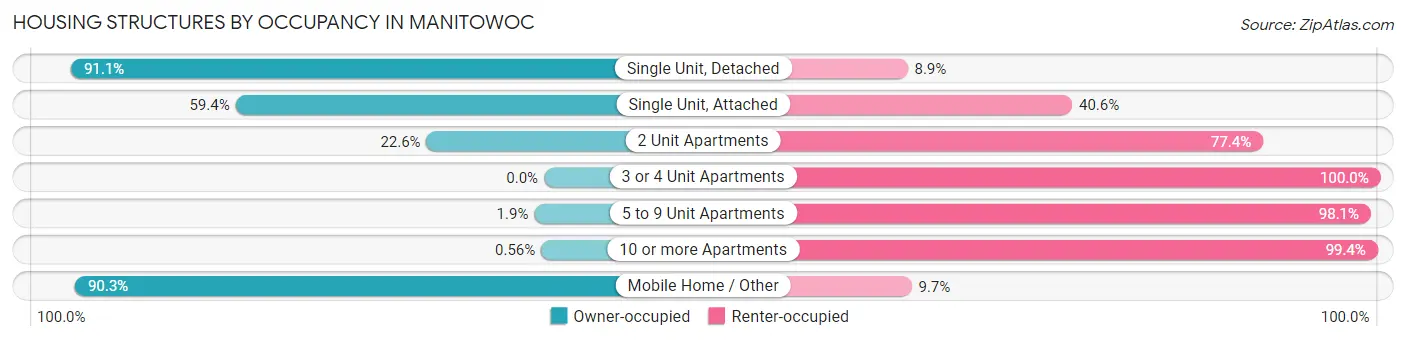
| Structure Type | Owner-occupied | Renter-occupied |
| Single Unit, Detached | 8,518 (91.1%) | 835 (8.9%) |
| Single Unit, Attached | 319 (59.4%) | 218 (40.6%) |
| 2 Unit Apartments | 411 (22.6%) | 1,405 (77.4%) |
| 3 or 4 Unit Apartments | 0 (0.0%) | 455 (100.0%) |
| 5 to 9 Unit Apartments | 13 (1.9%) | 682 (98.1%) |
| 10 or more Apartments | 9 (0.6%) | 1,610 (99.4%) |
| Mobile Home / Other | 270 (90.3%) | 29 (9.7%) |
| Total | 9,540 (64.6%) | 5,234 (35.4%) |
Housing Structures by Number of Rooms in Manitowoc
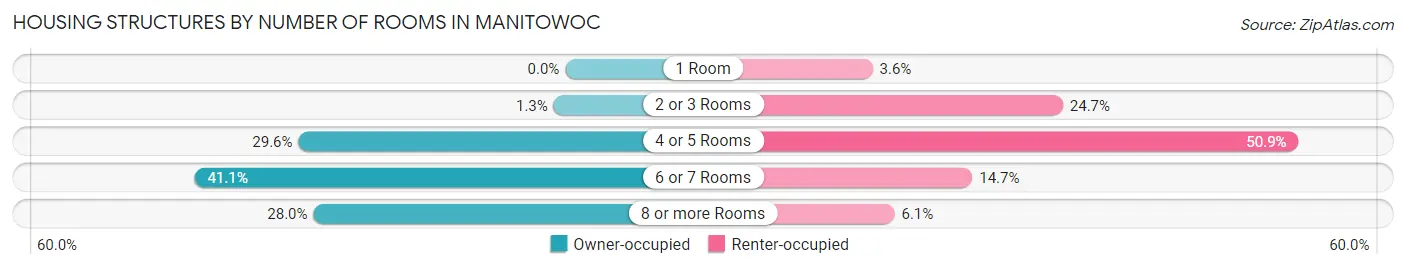
| Number of Rooms | Owner-occupied | Renter-occupied |
| 1 Room | 0 (0.0%) | 190 (3.6%) |
| 2 or 3 Rooms | 123 (1.3%) | 1,295 (24.7%) |
| 4 or 5 Rooms | 2,826 (29.6%) | 2,663 (50.9%) |
| 6 or 7 Rooms | 3,925 (41.1%) | 769 (14.7%) |
| 8 or more Rooms | 2,666 (28.0%) | 317 (6.1%) |
| Total | 9,540 (100.0%) | 5,234 (100.0%) |
Housing Structure by Heating Type in Manitowoc
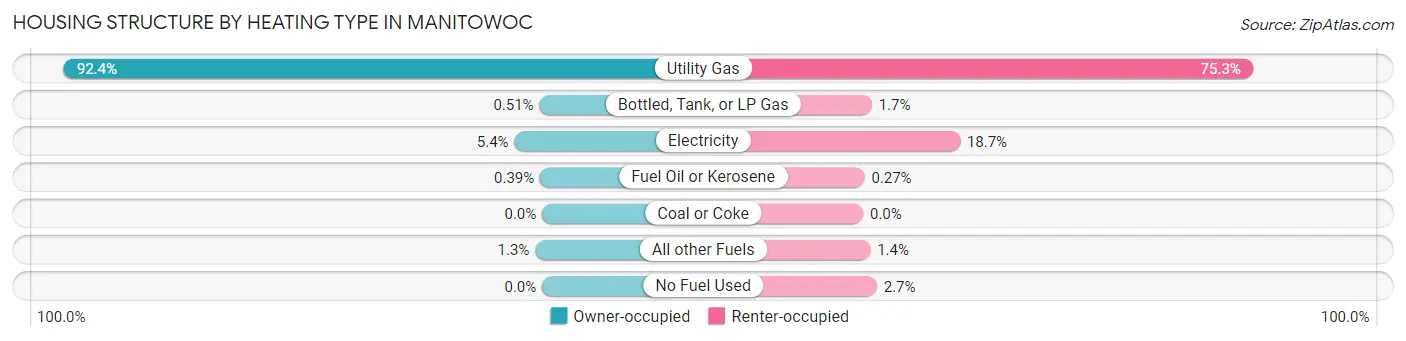
| Heating Type | Owner-occupied | Renter-occupied |
| Utility Gas | 8,817 (92.4%) | 3,940 (75.3%) |
| Bottled, Tank, or LP Gas | 49 (0.5%) | 88 (1.7%) |
| Electricity | 510 (5.3%) | 980 (18.7%) |
| Fuel Oil or Kerosene | 37 (0.4%) | 14 (0.3%) |
| Coal or Coke | 0 (0.0%) | 0 (0.0%) |
| All other Fuels | 127 (1.3%) | 73 (1.4%) |
| No Fuel Used | 0 (0.0%) | 139 (2.7%) |
| Total | 9,540 (100.0%) | 5,234 (100.0%) |
Household Vehicle Usage in Manitowoc
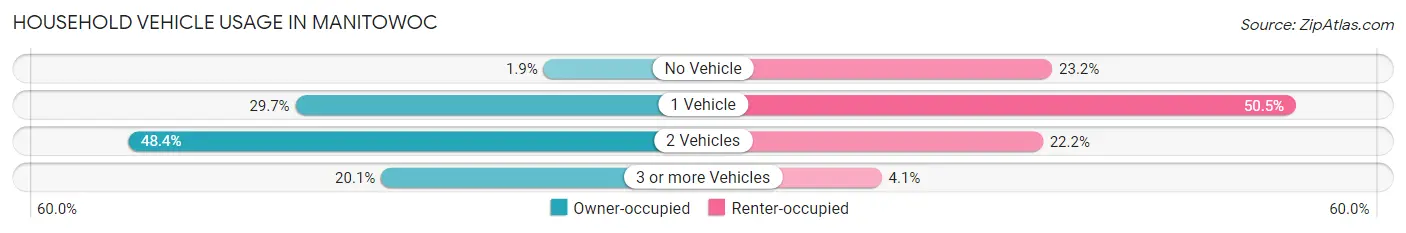
| Vehicles per Household | Owner-occupied | Renter-occupied |
| No Vehicle | 178 (1.9%) | 1,215 (23.2%) |
| 1 Vehicle | 2,830 (29.7%) | 2,644 (50.5%) |
| 2 Vehicles | 4,618 (48.4%) | 1,160 (22.2%) |
| 3 or more Vehicles | 1,914 (20.1%) | 215 (4.1%) |
| Total | 9,540 (100.0%) | 5,234 (100.0%) |
Real Estate & Mortgages in Manitowoc
Real Estate and Mortgage Overview in Manitowoc
| Characteristic | Without Mortgage | With Mortgage |
| Housing Units | 4,297 | 5,243 |
| Median Property Value | $134,800 | $135,100 |
| Median Household Income | $66,659 | $723 |
| Monthly Housing Costs | $461 | $101 |
| Real Estate Taxes | $2,418 | $118 |
Property Value by Mortgage Status in Manitowoc
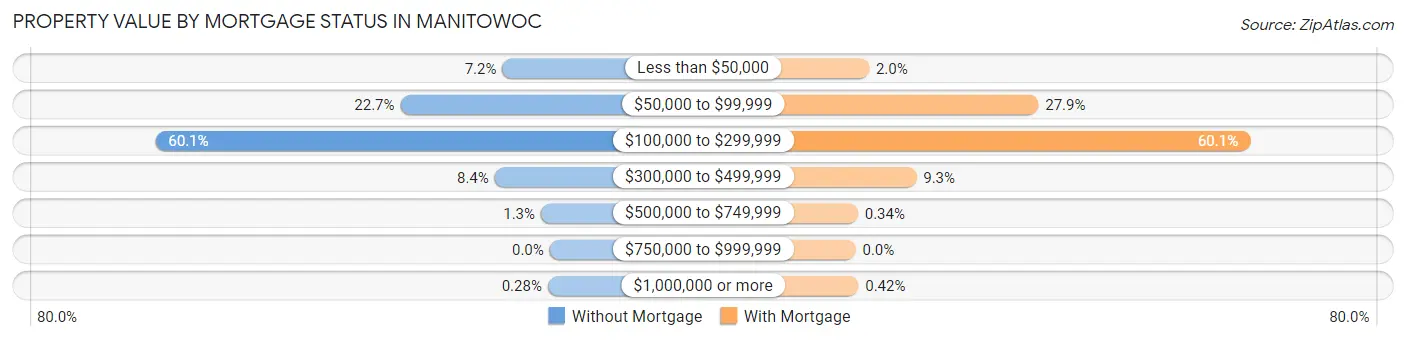
| Property Value | Without Mortgage | With Mortgage |
| Less than $50,000 | 310 (7.2%) | 107 (2.0%) |
| $50,000 to $99,999 | 977 (22.7%) | 1,460 (27.9%) |
| $100,000 to $299,999 | 2,581 (60.1%) | 3,151 (60.1%) |
| $300,000 to $499,999 | 360 (8.4%) | 485 (9.2%) |
| $500,000 to $749,999 | 57 (1.3%) | 18 (0.3%) |
| $750,000 to $999,999 | 0 (0.0%) | 0 (0.0%) |
| $1,000,000 or more | 12 (0.3%) | 22 (0.4%) |
| Total | 4,297 (100.0%) | 5,243 (100.0%) |
Household Income by Mortgage Status in Manitowoc
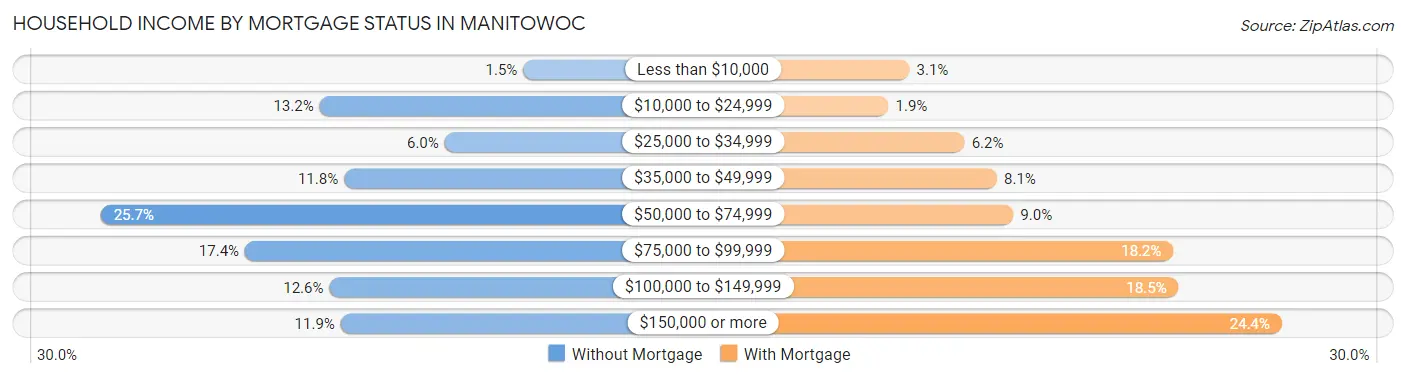
| Household Income | Without Mortgage | With Mortgage |
| Less than $10,000 | 65 (1.5%) | 162 (3.1%) |
| $10,000 to $24,999 | 565 (13.2%) | 99 (1.9%) |
| $25,000 to $34,999 | 258 (6.0%) | 327 (6.2%) |
| $35,000 to $49,999 | 505 (11.7%) | 424 (8.1%) |
| $50,000 to $74,999 | 1,102 (25.7%) | 473 (9.0%) |
| $75,000 to $99,999 | 748 (17.4%) | 952 (18.2%) |
| $100,000 to $149,999 | 541 (12.6%) | 968 (18.5%) |
| $150,000 or more | 513 (11.9%) | 1,277 (24.4%) |
| Total | 4,297 (100.0%) | 5,243 (100.0%) |
Property Value to Household Income Ratio in Manitowoc
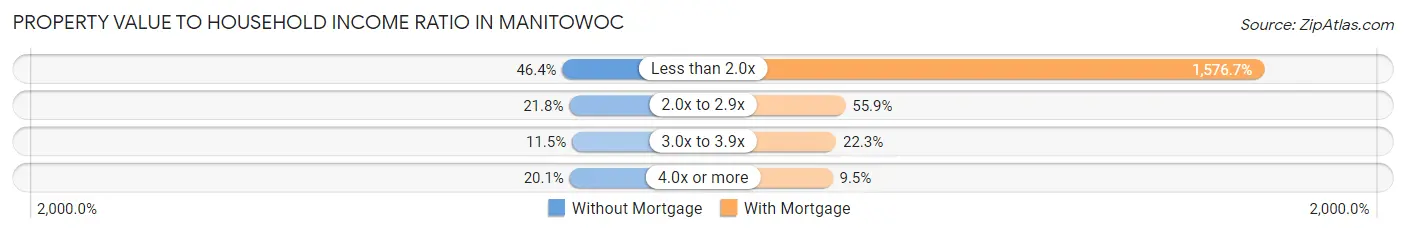
| Value-to-Income Ratio | Without Mortgage | With Mortgage |
| Less than 2.0x | 1,994 (46.4%) | 82,664 (1,576.7%) |
| 2.0x to 2.9x | 936 (21.8%) | 2,928 (55.8%) |
| 3.0x to 3.9x | 494 (11.5%) | 1,169 (22.3%) |
| 4.0x or more | 864 (20.1%) | 496 (9.5%) |
| Total | 4,297 (100.0%) | 5,243 (100.0%) |
Real Estate Taxes by Mortgage Status in Manitowoc
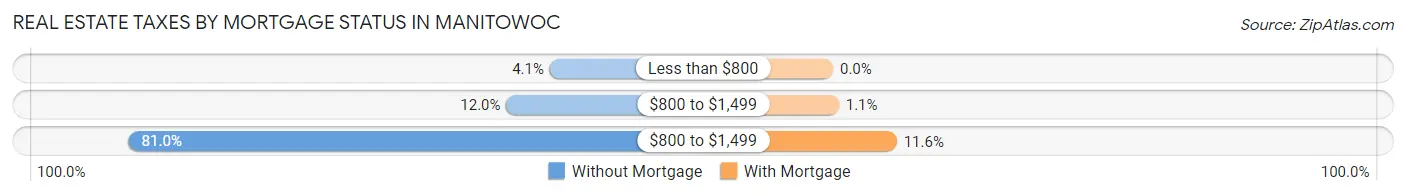
| Property Taxes | Without Mortgage | With Mortgage |
| Less than $800 | 175 (4.1%) | 0 (0.0%) |
| $800 to $1,499 | 516 (12.0%) | 55 (1.1%) |
| $800 to $1,499 | 3,480 (81.0%) | 610 (11.6%) |
| Total | 4,297 (100.0%) | 5,243 (100.0%) |
Health & Disability in Manitowoc
Health Insurance Coverage by Age in Manitowoc
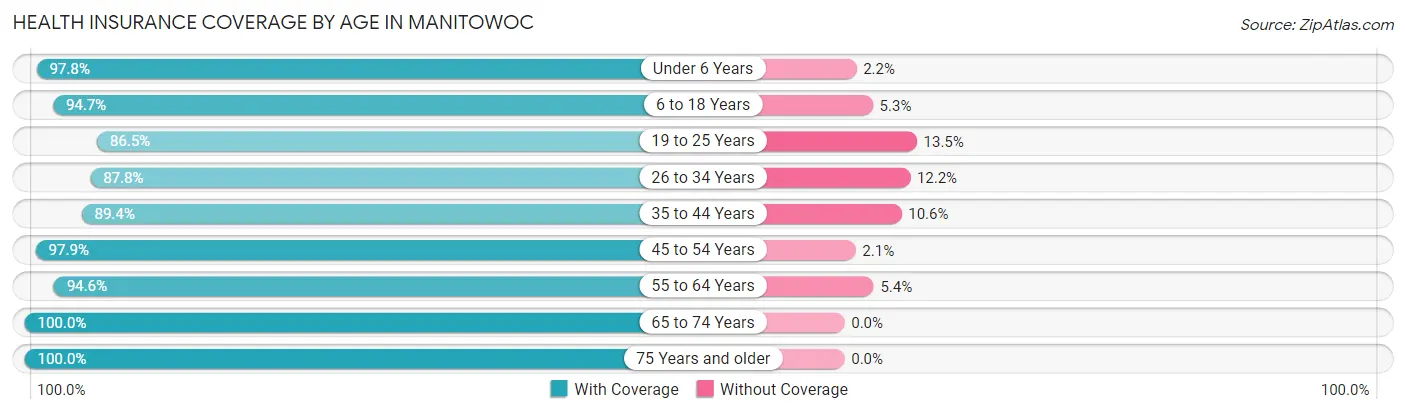
| Age Bracket | With Coverage | Without Coverage |
| Under 6 Years | 2,286 (97.8%) | 52 (2.2%) |
| 6 to 18 Years | 5,156 (94.7%) | 288 (5.3%) |
| 19 to 25 Years | 2,258 (86.5%) | 352 (13.5%) |
| 26 to 34 Years | 3,184 (87.8%) | 444 (12.2%) |
| 35 to 44 Years | 3,362 (89.4%) | 400 (10.6%) |
| 45 to 54 Years | 3,824 (97.9%) | 81 (2.1%) |
| 55 to 64 Years | 4,863 (94.6%) | 280 (5.4%) |
| 65 to 74 Years | 4,222 (100.0%) | 0 (0.0%) |
| 75 Years and older | 2,912 (100.0%) | 0 (0.0%) |
| Total | 32,067 (94.4%) | 1,897 (5.6%) |
Health Insurance Coverage by Citizenship Status in Manitowoc
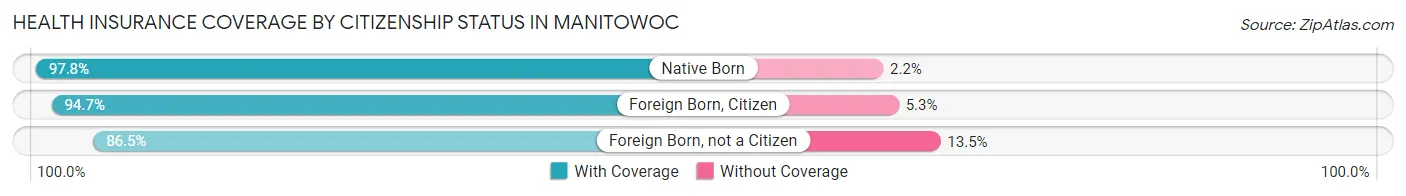
| Citizenship Status | With Coverage | Without Coverage |
| Native Born | 2,286 (97.8%) | 52 (2.2%) |
| Foreign Born, Citizen | 5,156 (94.7%) | 288 (5.3%) |
| Foreign Born, not a Citizen | 2,258 (86.5%) | 352 (13.5%) |
Health Insurance Coverage by Household Income in Manitowoc
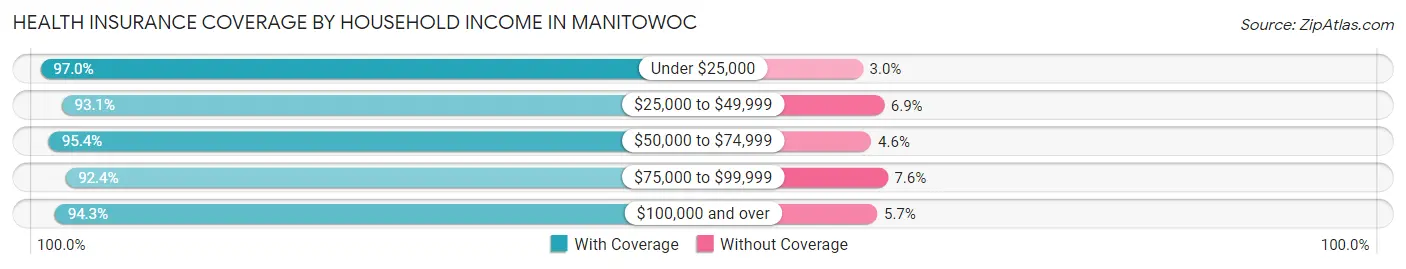
| Household Income | With Coverage | Without Coverage |
| Under $25,000 | 4,262 (97.0%) | 130 (3.0%) |
| $25,000 to $49,999 | 5,448 (93.1%) | 406 (6.9%) |
| $50,000 to $74,999 | 6,042 (95.4%) | 289 (4.6%) |
| $75,000 to $99,999 | 5,393 (92.4%) | 445 (7.6%) |
| $100,000 and over | 10,305 (94.3%) | 619 (5.7%) |
Public vs Private Health Insurance Coverage by Age in Manitowoc
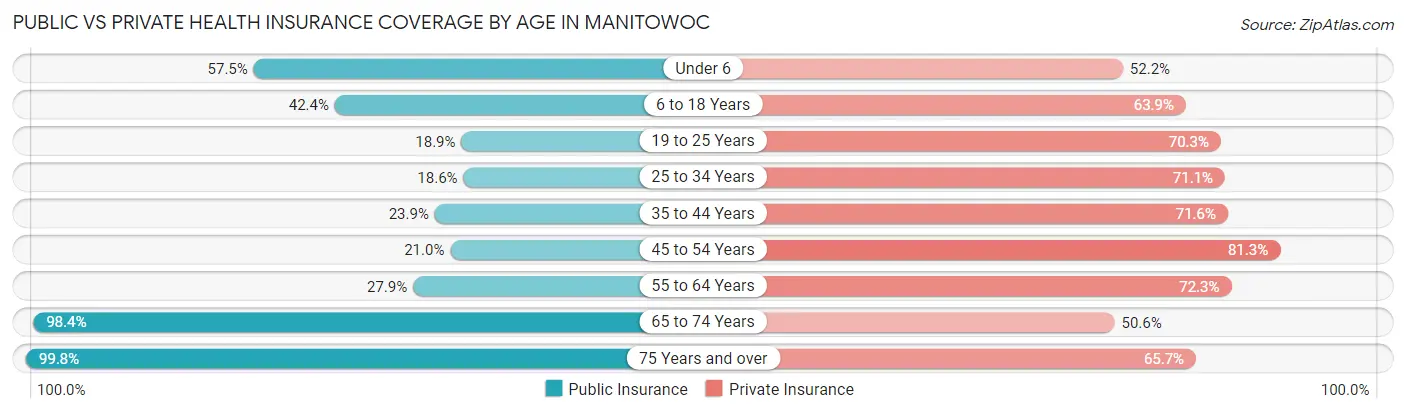
| Age Bracket | Public Insurance | Private Insurance |
| Under 6 | 1,344 (57.5%) | 1,220 (52.2%) |
| 6 to 18 Years | 2,310 (42.4%) | 3,476 (63.8%) |
| 19 to 25 Years | 494 (18.9%) | 1,836 (70.3%) |
| 25 to 34 Years | 673 (18.5%) | 2,580 (71.1%) |
| 35 to 44 Years | 898 (23.9%) | 2,695 (71.6%) |
| 45 to 54 Years | 820 (21.0%) | 3,176 (81.3%) |
| 55 to 64 Years | 1,435 (27.9%) | 3,718 (72.3%) |
| 65 to 74 Years | 4,154 (98.4%) | 2,137 (50.6%) |
| 75 Years and over | 2,905 (99.8%) | 1,914 (65.7%) |
| Total | 15,033 (44.3%) | 22,752 (67.0%) |
Disability Status by Sex by Age in Manitowoc
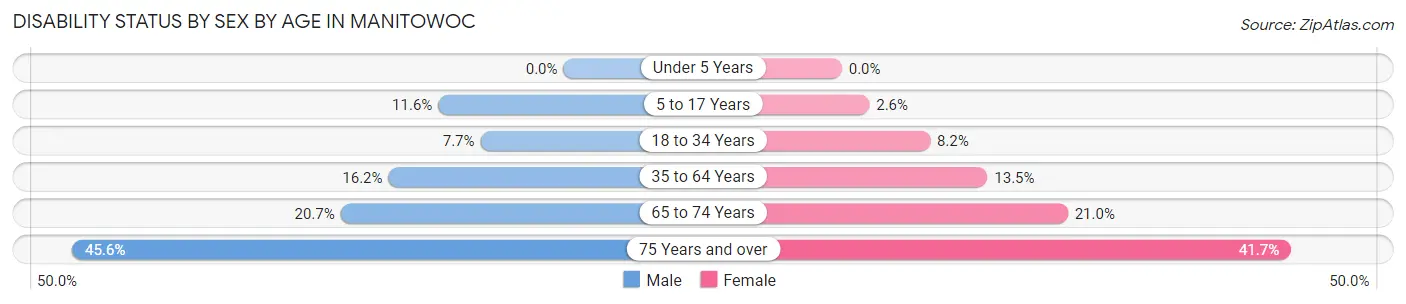
| Age Bracket | Male | Female |
| Under 5 Years | 0 (0.0%) | 0 (0.0%) |
| 5 to 17 Years | 350 (11.6%) | 64 (2.5%) |
| 18 to 34 Years | 262 (7.7%) | 262 (8.2%) |
| 35 to 64 Years | 1,057 (16.2%) | 851 (13.5%) |
| 65 to 74 Years | 441 (20.7%) | 438 (21.0%) |
| 75 Years and over | 455 (45.6%) | 798 (41.7%) |
Disability Class by Sex by Age in Manitowoc
Disability Class: Hearing Difficulty
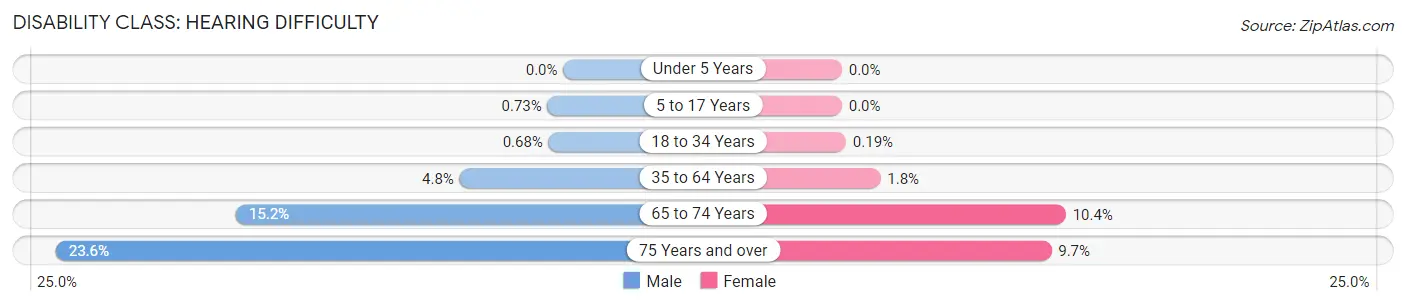
| Age Bracket | Male | Female |
| Under 5 Years | 0 (0.0%) | 0 (0.0%) |
| 5 to 17 Years | 22 (0.7%) | 0 (0.0%) |
| 18 to 34 Years | 23 (0.7%) | 6 (0.2%) |
| 35 to 64 Years | 313 (4.8%) | 113 (1.8%) |
| 65 to 74 Years | 324 (15.2%) | 217 (10.4%) |
| 75 Years and over | 235 (23.5%) | 186 (9.7%) |
Disability Class: Vision Difficulty
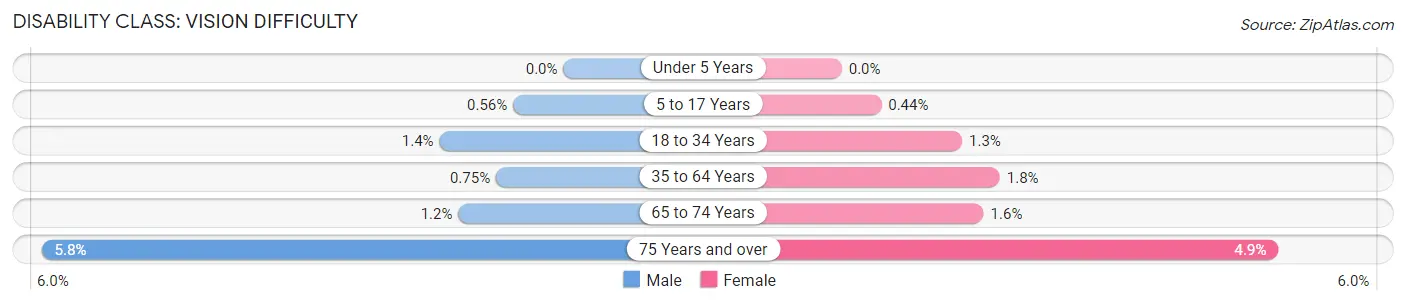
| Age Bracket | Male | Female |
| Under 5 Years | 0 (0.0%) | 0 (0.0%) |
| 5 to 17 Years | 17 (0.6%) | 11 (0.4%) |
| 18 to 34 Years | 47 (1.4%) | 43 (1.3%) |
| 35 to 64 Years | 49 (0.7%) | 111 (1.8%) |
| 65 to 74 Years | 25 (1.2%) | 33 (1.6%) |
| 75 Years and over | 58 (5.8%) | 93 (4.9%) |
Disability Class: Cognitive Difficulty
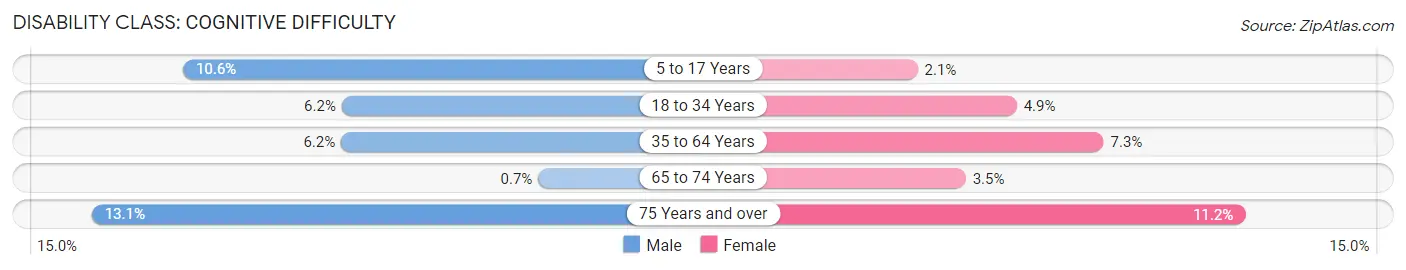
| Age Bracket | Male | Female |
| 5 to 17 Years | 319 (10.6%) | 53 (2.1%) |
| 18 to 34 Years | 210 (6.2%) | 156 (4.9%) |
| 35 to 64 Years | 403 (6.2%) | 459 (7.3%) |
| 65 to 74 Years | 15 (0.7%) | 72 (3.5%) |
| 75 Years and over | 131 (13.1%) | 215 (11.2%) |
Disability Class: Ambulatory Difficulty
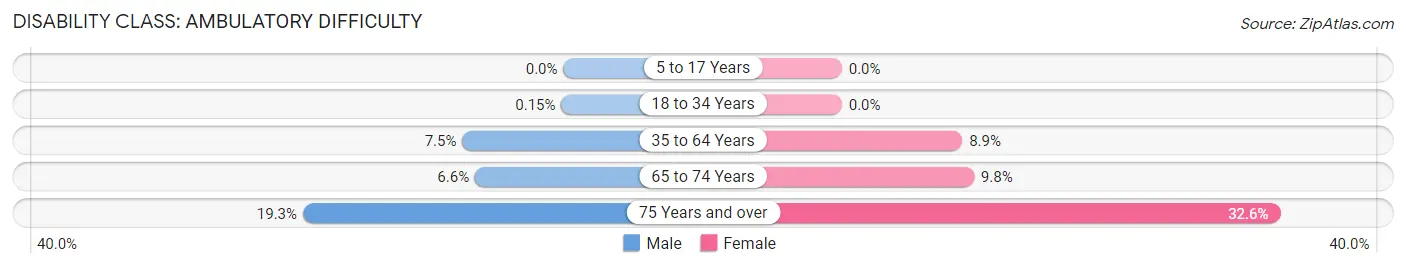
| Age Bracket | Male | Female |
| 5 to 17 Years | 0 (0.0%) | 0 (0.0%) |
| 18 to 34 Years | 5 (0.2%) | 0 (0.0%) |
| 35 to 64 Years | 488 (7.5%) | 563 (8.9%) |
| 65 to 74 Years | 140 (6.6%) | 205 (9.8%) |
| 75 Years and over | 193 (19.3%) | 623 (32.6%) |
Disability Class: Self-Care Difficulty
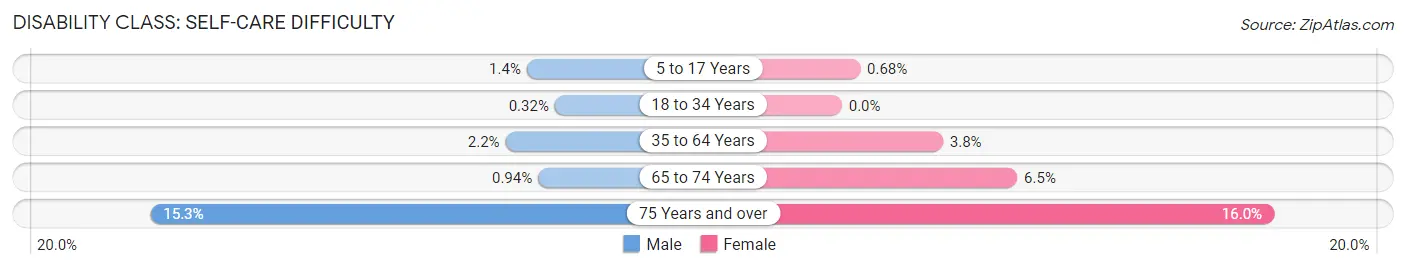
| Age Bracket | Male | Female |
| 5 to 17 Years | 41 (1.4%) | 17 (0.7%) |
| 18 to 34 Years | 11 (0.3%) | 0 (0.0%) |
| 35 to 64 Years | 140 (2.1%) | 236 (3.7%) |
| 65 to 74 Years | 20 (0.9%) | 136 (6.5%) |
| 75 Years and over | 153 (15.3%) | 307 (16.0%) |
Technology Access in Manitowoc
Computing Device Access in Manitowoc
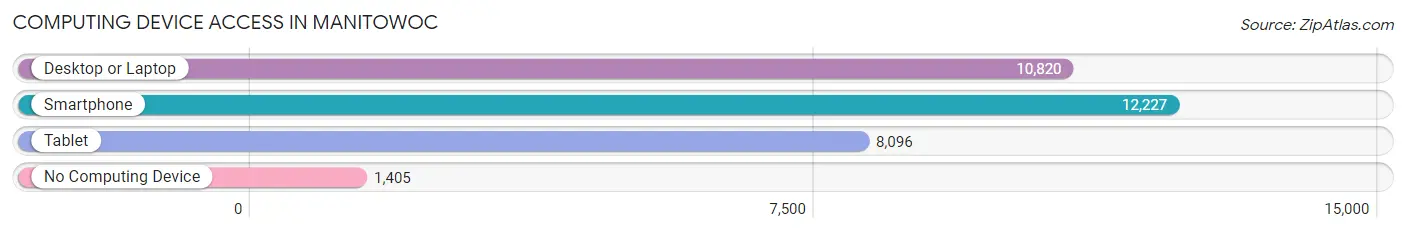
| Device Type | # Households | % Households |
| Desktop or Laptop | 10,820 | 73.2% |
| Smartphone | 12,227 | 82.8% |
| Tablet | 8,096 | 54.8% |
| No Computing Device | 1,405 | 9.5% |
| Total | 14,774 | 100.0% |
Internet Access in Manitowoc
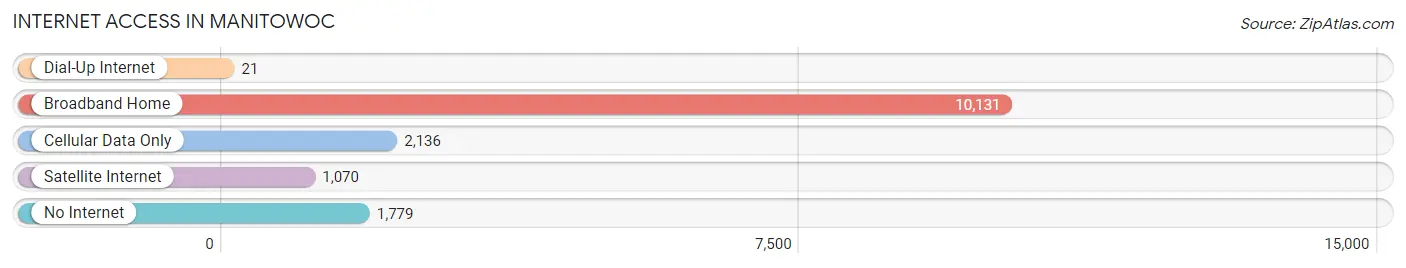
| Internet Type | # Households | % Households |
| Dial-Up Internet | 21 | 0.1% |
| Broadband Home | 10,131 | 68.6% |
| Cellular Data Only | 2,136 | 14.5% |
| Satellite Internet | 1,070 | 7.2% |
| No Internet | 1,779 | 12.0% |
| Total | 14,774 | 100.0% |
Manitowoc Summary
Manitowoc, Wisconsin is a city located in Manitowoc County, Wisconsin, United States. It is located on the western shore of Lake Michigan, about 50 miles north of Milwaukee. The city has a population of 33,736 as of the 2010 census, making it the largest city in Manitowoc County.
Geography
Manitowoc is located at 44°4′N 87°40′W (44.07, -87.67). According to the United States Census Bureau, the city has a total area of 16.2 square miles (41.8 km2), of which, 15.7 square miles (40.7 km2) is land and 0.5 square miles (1.2 km2) is water.
The city is located on the western shore of Lake Michigan, and is bordered by the towns of Two Rivers to the north, Mishicot to the east, and the city of Two Rivers to the south. The city is also bordered by the Manitowoc River to the west.
History
The area that is now Manitowoc was first settled by Native Americans in the early 1800s. The first permanent white settlers arrived in the area in 1836, and the city was officially incorporated in 1851.
The city was named after the Native American tribe that lived in the area, the Menominee. The name Manitowoc is derived from the Menominee word manidoowag, which means “spirit-land”.
The city quickly grew in the late 19th century, and by the early 20th century, it had become a major port city. The city was home to several large industries, including shipbuilding, paper mills, and a large brewery.
Economy
Manitowoc’s economy is largely based on manufacturing and tourism. The city is home to several large manufacturing companies, including Manitowoc Company, which produces cranes and other heavy equipment, and Sargento Foods, which produces cheese and other dairy products.
The city is also home to several tourist attractions, including the Wisconsin Maritime Museum, the Rahr-West Art Museum, and the Lincoln Park Zoo. The city also hosts several annual festivals, including the Manitowoc County Fair and the Lakeshore Art Festival.
Demographics
As of the 2010 census, there were 33,736 people, 13,845 households, and 8,541 families residing in the city. The population density was 2,139.3 people per square mile (824.2/km2). There were 14,845 housing units at an average density of 941.2 per square mile (363.7/km2). The racial makeup of the city was 92.2% White, 0.7% African American, 0.4% Native American, 0.9% Asian, 0.1% Pacific Islander, 4.2% from other races, and 1.5% from two or more races. Hispanic or Latino of any race were 8.2% of the population.
There were 13,845 households, out of which 28.7% had children under the age of 18 living with them, 44.2% were married couples living together, 12.3% had a female householder with no husband present, and 38.7% were non-families. 32.2% of all households were made up of individuals, and 13.3% had someone living alone who was 65 years of age or older. The average household size was 2.37 and the average family size was 2.98.
In the city, the population was spread out, with 23.7% under the age of 18, 8.7% from 18 to 24, 28.2% from 25 to 44, 22.2% from 45 to 64, and 17.2% who were 65 years of age or older. The median age was 38 years. For every 100 females, there were 93.2 males. For every 100 females age 18 and over, there were 89.7 males.
The median income for a household in the city was $40,845, and the median income for a family was $50,945. Males had a median income of $37,845 versus $25,945 for females. The per capita income for the city was $20,945. About 6.7% of families and 9.2% of the population were below the poverty line, including 11.7% of those under age 18 and 8.2% of those age 65 or over.
Common Questions
What is Per Capita Income in Manitowoc?
Per Capita income in Manitowoc is $33,416.
What is the Median Family Income in Manitowoc?
Median Family Income in Manitowoc is $74,433.
What is the Median Household income in Manitowoc?
Median Household Income in Manitowoc is $60,040.
What is Income or Wage Gap in Manitowoc?
Income or Wage Gap in Manitowoc is 37.1%.
Women in Manitowoc earn 62.9 cents for every dollar earned by a man.
What is Family Income Deficit in Manitowoc?
Family Income Deficit in Manitowoc is $10,250.
Families that are below poverty line in Manitowoc earn $10,250 less on average than the poverty threshold level.
What is Inequality or Gini Index in Manitowoc?
Inequality or Gini Index in Manitowoc is 0.43.
What is the Total Population of Manitowoc?
Total Population of Manitowoc is 34,500.
What is the Total Male Population of Manitowoc?
Total Male Population of Manitowoc is 17,349.
What is the Total Female Population of Manitowoc?
Total Female Population of Manitowoc is 17,151.
What is the Ratio of Males per 100 Females in Manitowoc?
There are 101.15 Males per 100 Females in Manitowoc.
What is the Ratio of Females per 100 Males in Manitowoc?
There are 98.86 Females per 100 Males in Manitowoc.
What is the Median Population Age in Manitowoc?
Median Population Age in Manitowoc is 42.9 Years.
What is the Average Family Size in Manitowoc
Average Family Size in Manitowoc is 2.9 People.
What is the Average Household Size in Manitowoc
Average Household Size in Manitowoc is 2.3 People.
How Large is the Labor Force in Manitowoc?
There are 16,712 People in the Labor Forcein in Manitowoc.
What is the Percentage of People in the Labor Force in Manitowoc?
59.7% of People are in the Labor Force in Manitowoc.
What is the Unemployment Rate in Manitowoc?
Unemployment Rate in Manitowoc is 2.8%.