Fifth Ward, LA Map & Demographics
Fifth Ward Map
Fifth Ward Overview
$27,354
PER CAPITA INCOME
$49,207
AVG HOUSEHOLD INCOME
0.39
INEQUALITY / GINI INDEX
1,147
TOTAL POPULATION
664
MALE POPULATION
483
FEMALE POPULATION
137.47
MALES / 100 FEMALES
72.74
FEMALES / 100 MALES
43.5
MEDIAN AGE
2.7
AVG FAMILY SIZE
2.4
AVG HOUSEHOLD SIZE
609
LABOR FORCE [ PEOPLE ]
74.2%
PERCENT IN LABOR FORCE
5.3%
UNEMPLOYMENT RATE
Income in Fifth Ward
Income Overview in Fifth Ward
| Characteristic | Number | Measure |
| Per Capita Income | 1,147 | $27,354 |
| Median Family Income | 363 | $0 |
| Mean Family Income | 363 | $76,778 |
| Median Household Income | 482 | $49,207 |
| Mean Household Income | 482 | $65,862 |
| Income Deficit | 363 | $0 |
| Wage / Income Gap (%) | 1,147 | 0.00% |
| Wage / Income Gap ($) | 1,147 | 100.00¢ per $1 |
| Gini / Inequality Index | 1,147 | 0.39 |
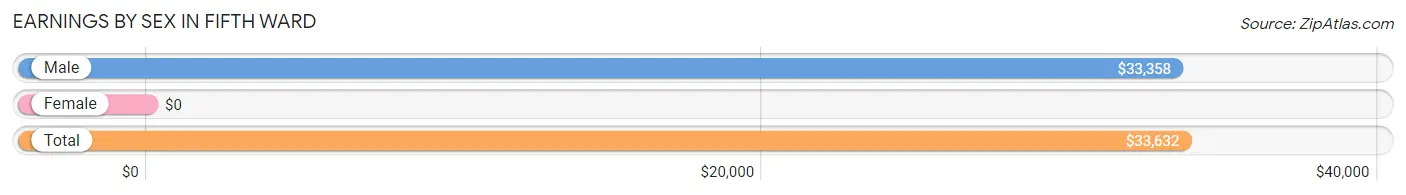
Earnings by Sex in Fifth Ward
| Sex | Number | Average Earnings |
| Male | 385 (64.6%) | $33,358 |
| Female | 211 (35.4%) | $0 |
| Total | 596 (100.0%) | $33,632 |
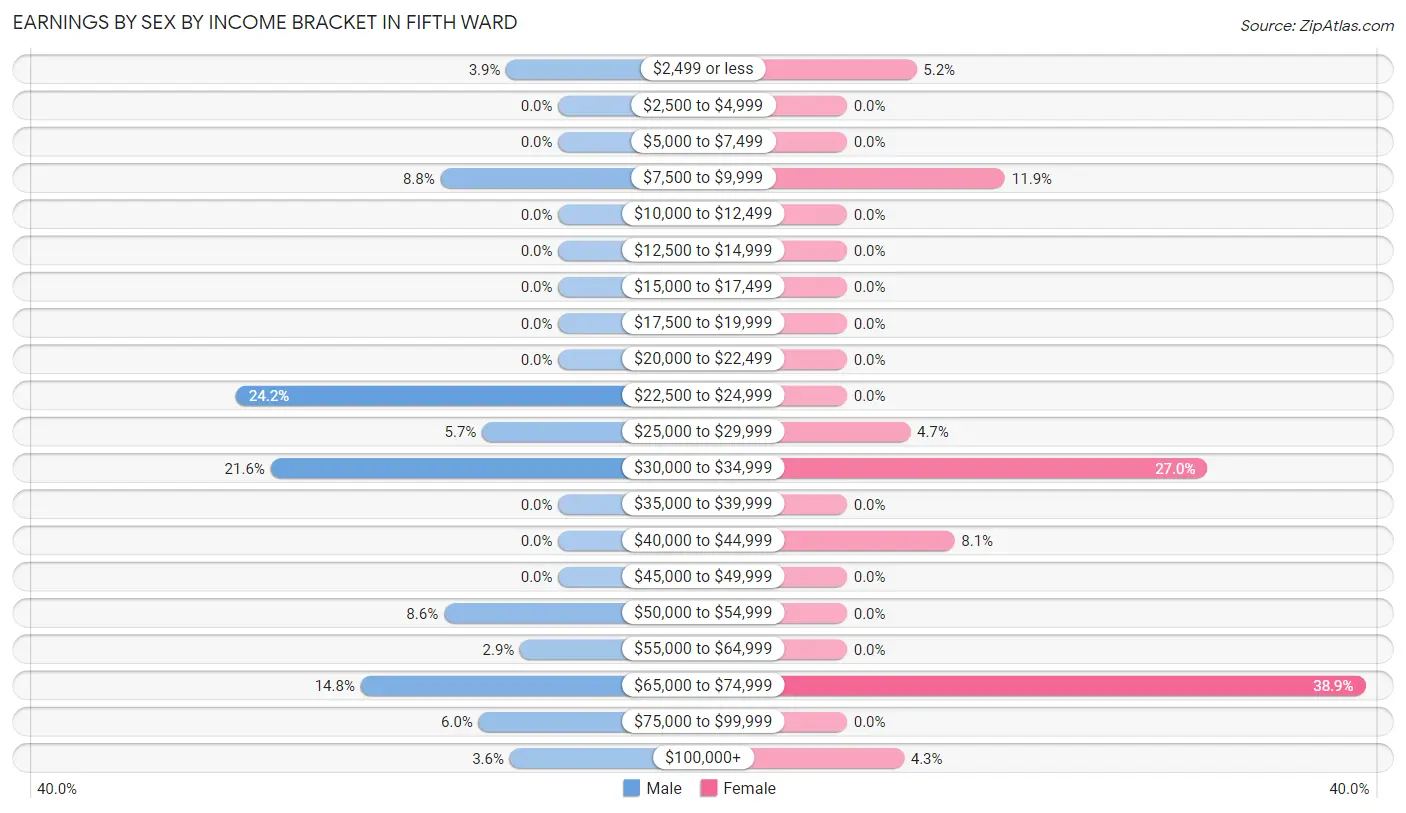
Earnings by Sex by Income Bracket in Fifth Ward
The most common earnings brackets in Fifth Ward are $22,500 to $24,999 for men (93 | 24.2%) and $65,000 to $74,999 for women (82 | 38.9%).
| Income | Male | Female |
| $2,499 or less | 15 (3.9%) | 11 (5.2%) |
| $2,500 to $4,999 | 0 (0.0%) | 0 (0.0%) |
| $5,000 to $7,499 | 0 (0.0%) | 0 (0.0%) |
| $7,500 to $9,999 | 34 (8.8%) | 25 (11.8%) |
| $10,000 to $12,499 | 0 (0.0%) | 0 (0.0%) |
| $12,500 to $14,999 | 0 (0.0%) | 0 (0.0%) |
| $15,000 to $17,499 | 0 (0.0%) | 0 (0.0%) |
| $17,500 to $19,999 | 0 (0.0%) | 0 (0.0%) |
| $20,000 to $22,499 | 0 (0.0%) | 0 (0.0%) |
| $22,500 to $24,999 | 93 (24.2%) | 0 (0.0%) |
| $25,000 to $29,999 | 22 (5.7%) | 10 (4.7%) |
| $30,000 to $34,999 | 83 (21.6%) | 57 (27.0%) |
| $35,000 to $39,999 | 0 (0.0%) | 0 (0.0%) |
| $40,000 to $44,999 | 0 (0.0%) | 17 (8.1%) |
| $45,000 to $49,999 | 0 (0.0%) | 0 (0.0%) |
| $50,000 to $54,999 | 33 (8.6%) | 0 (0.0%) |
| $55,000 to $64,999 | 11 (2.9%) | 0 (0.0%) |
| $65,000 to $74,999 | 57 (14.8%) | 82 (38.9%) |
| $75,000 to $99,999 | 23 (6.0%) | 0 (0.0%) |
| $100,000+ | 14 (3.6%) | 9 (4.3%) |
| Total | 385 (100.0%) | 211 (100.0%) |
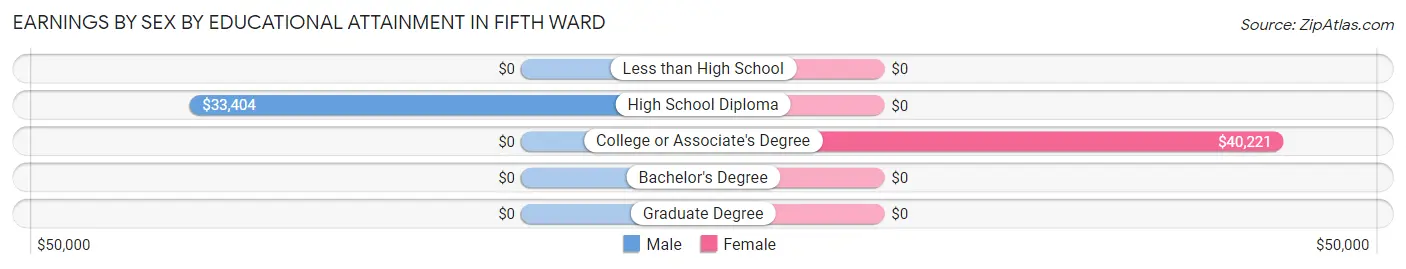
Earnings by Sex by Educational Attainment in Fifth Ward
| Educational Attainment | Male Income | Female Income |
| Less than High School | - | - |
| High School Diploma | $33,404 | $0 |
| College or Associate's Degree | - | - |
| Bachelor's Degree | - | - |
| Graduate Degree | - | - |
| Total | $33,464 | $0 |
Family Income in Fifth Ward
Family Income Brackets in Fifth Ward
According to the Fifth Ward family income data, there are 141 families falling into the $100,000 to $149,999 income range, which is the most common income bracket and makes up 38.8% of all families.
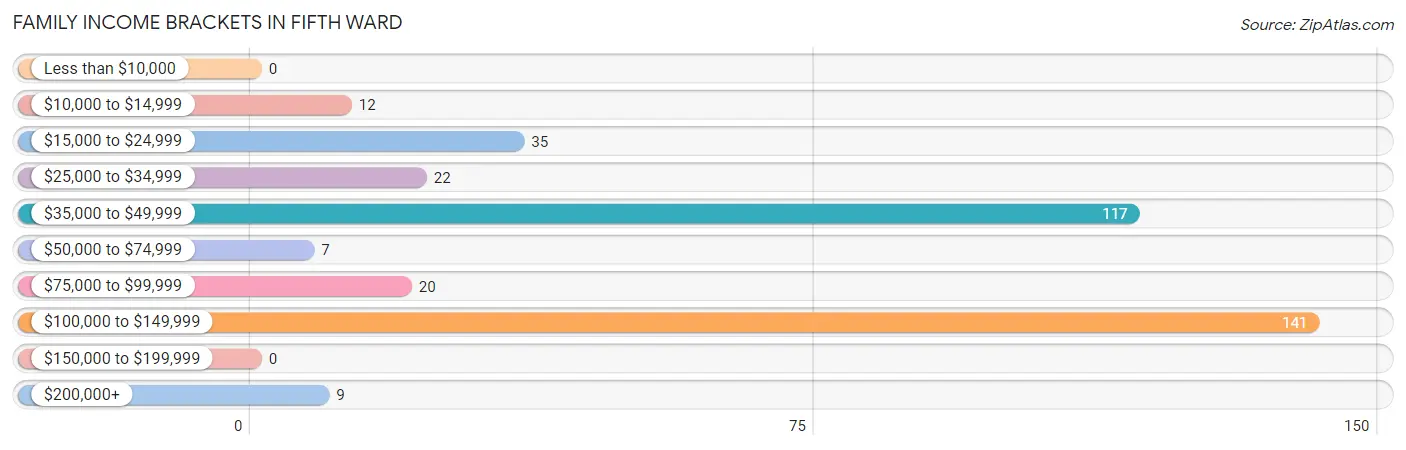
| Income Bracket | # Families | % Families |
| Less than $10,000 | 0 | 0.0% |
| $10,000 to $14,999 | 12 | 3.3% |
| $15,000 to $24,999 | 35 | 9.6% |
| $25,000 to $34,999 | 22 | 6.1% |
| $35,000 to $49,999 | 117 | 32.2% |
| $50,000 to $74,999 | 7 | 1.9% |
| $75,000 to $99,999 | 20 | 5.5% |
| $100,000 to $149,999 | 141 | 38.8% |
| $150,000 to $199,999 | 0 | 0.0% |
| $200,000+ | 9 | 2.5% |
Family Income by Famaliy Size in Fifth Ward
| Income Bracket | # Families | Median Income |
| 2-Person Families | 246 (67.8%) | $0 |
| 3-Person Families | 47 (13.0%) | $0 |
| 4-Person Families | 45 (12.4%) | $0 |
| 5-Person Families | 25 (6.9%) | $0 |
| 6-Person Families | 0 (0.0%) | $0 |
| 7+ Person Families | 0 (0.0%) | $0 |
| Total | 363 (100.0%) | $0 |
Family Income by Number of Earners in Fifth Ward
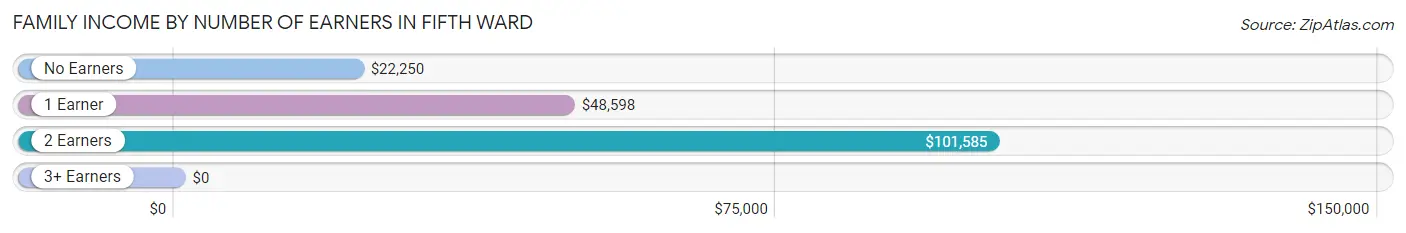
| Number of Earners | # Families | Median Income |
| No Earners | 42 (11.6%) | $22,250 |
| 1 Earner | 140 (38.6%) | $48,598 |
| 2 Earners | 160 (44.1%) | $101,585 |
| 3+ Earners | 21 (5.8%) | $0 |
| Total | 363 (100.0%) | $0 |
Household Income in Fifth Ward
Household Income Brackets in Fifth Ward
With 141 households falling in the category, the $100,000 to $149,999 income range is the most frequent in Fifth Ward, accounting for 29.2% of all households.

| Income Bracket | # Households | % Households |
| Less than $10,000 | 28 | 5.8% |
| $10,000 to $14,999 | 12 | 2.5% |
| $15,000 to $24,999 | 35 | 7.3% |
| $25,000 to $34,999 | 53 | 11.0% |
| $35,000 to $49,999 | 139 | 28.8% |
| $50,000 to $74,999 | 38 | 7.9% |
| $75,000 to $99,999 | 27 | 5.6% |
| $100,000 to $149,999 | 141 | 29.3% |
| $150,000 to $199,999 | 0 | 0.0% |
| $200,000+ | 9 | 1.9% |
Household Income by Householder Age in Fifth Ward
The median household income in Fifth Ward is $49,207, with the highest median household income of $25,242 found in the 65+ years age bracket for the primary householder. A total of 76 households (15.8%) fall into this category.
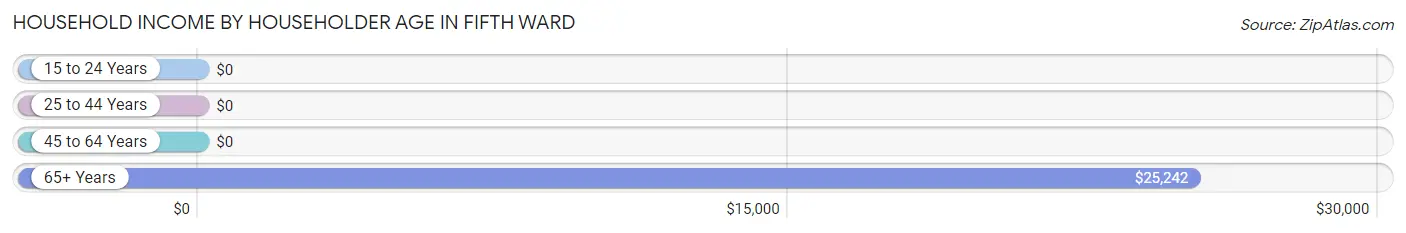
| Income Bracket | # Households | Median Income |
| 15 to 24 Years | 0 (0.0%) | $0 |
| 25 to 44 Years | 176 (36.5%) | $0 |
| 45 to 64 Years | 230 (47.7%) | $0 |
| 65+ Years | 76 (15.8%) | $25,242 |
| Total | 482 (100.0%) | $49,207 |
Poverty in Fifth Ward
Income Below Poverty by Sex and Age in Fifth Ward
With 10.1% poverty level for males and 36.8% for females among the residents of Fifth Ward, 5 year old males and 18 to 24 year old females are the most vulnerable to poverty, with 40 males (100.0%) and 28 females (100.0%) in their respective age groups living below the poverty level.
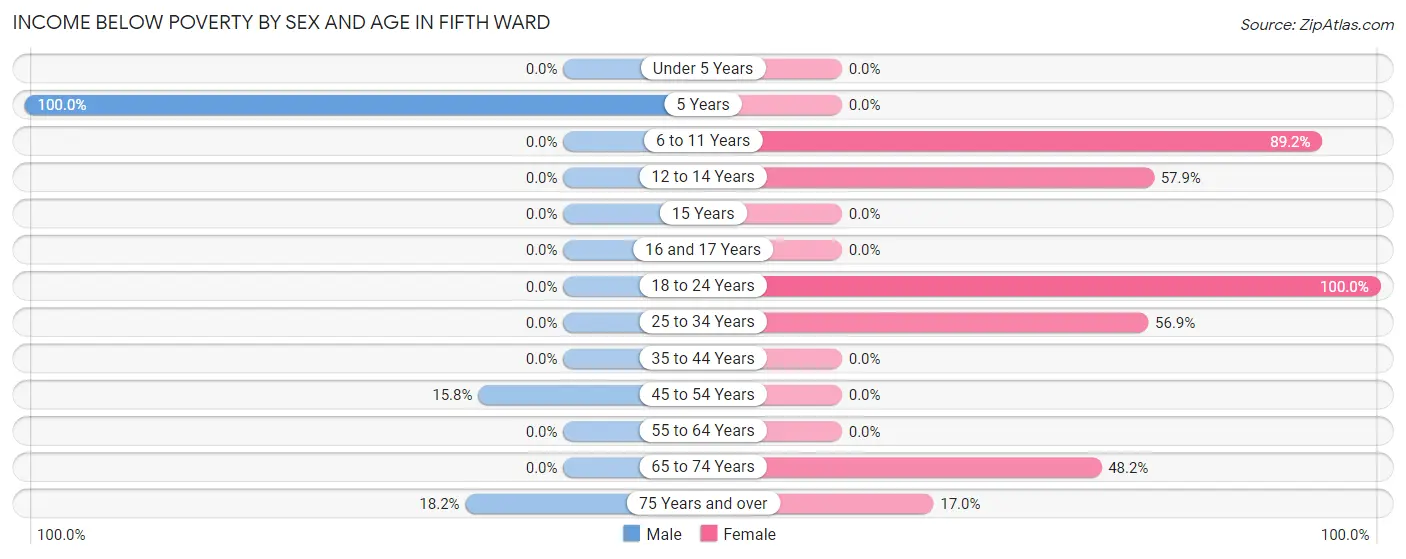
| Age Bracket | Male | Female |
| Under 5 Years | 0 (0.0%) | 0 (0.0%) |
| 5 Years | 40 (100.0%) | 0 (0.0%) |
| 6 to 11 Years | 0 (0.0%) | 66 (89.2%) |
| 12 to 14 Years | 0 (0.0%) | 33 (57.9%) |
| 15 Years | 0 (0.0%) | 0 (0.0%) |
| 16 and 17 Years | 0 (0.0%) | 0 (0.0%) |
| 18 to 24 Years | 0 (0.0%) | 28 (100.0%) |
| 25 to 34 Years | 0 (0.0%) | 29 (56.9%) |
| 35 to 44 Years | 0 (0.0%) | 0 (0.0%) |
| 45 to 54 Years | 15 (15.8%) | 0 (0.0%) |
| 55 to 64 Years | 0 (0.0%) | 0 (0.0%) |
| 65 to 74 Years | 0 (0.0%) | 13 (48.1%) |
| 75 Years and over | 12 (18.2%) | 9 (17.0%) |
| Total | 67 (10.1%) | 178 (36.8%) |
Income Above Poverty by Sex and Age in Fifth Ward
According to the poverty statistics in Fifth Ward, males aged under 5 years and females aged 35 to 44 years are the age groups that are most secure financially, with 100.0% of males and 100.0% of females in these age groups living above the poverty line.
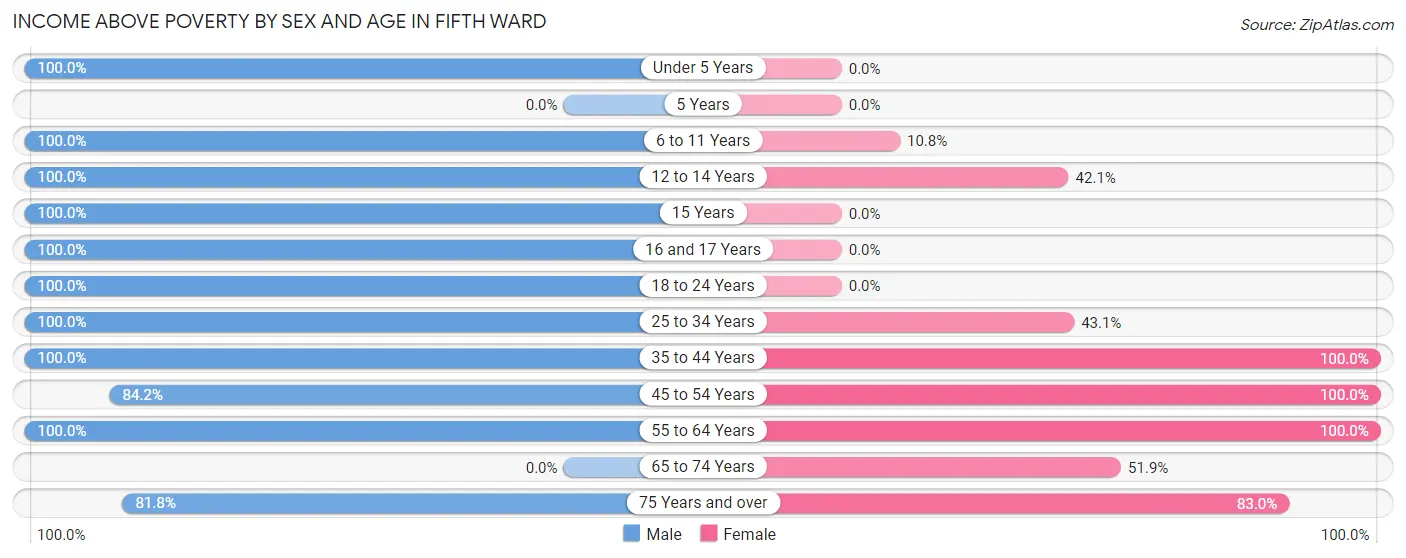
| Age Bracket | Male | Female |
| Under 5 Years | 95 (100.0%) | 0 (0.0%) |
| 5 Years | 0 (0.0%) | 0 (0.0%) |
| 6 to 11 Years | 5 (100.0%) | 8 (10.8%) |
| 12 to 14 Years | 50 (100.0%) | 24 (42.1%) |
| 15 Years | 5 (100.0%) | 0 (0.0%) |
| 16 and 17 Years | 19 (100.0%) | 0 (0.0%) |
| 18 to 24 Years | 12 (100.0%) | 0 (0.0%) |
| 25 to 34 Years | 103 (100.0%) | 22 (43.1%) |
| 35 to 44 Years | 44 (100.0%) | 45 (100.0%) |
| 45 to 54 Years | 80 (84.2%) | 127 (100.0%) |
| 55 to 64 Years | 130 (100.0%) | 21 (100.0%) |
| 65 to 74 Years | 0 (0.0%) | 14 (51.8%) |
| 75 Years and over | 54 (81.8%) | 44 (83.0%) |
| Total | 597 (89.9%) | 305 (63.1%) |
Income Below Poverty Among Married-Couple Families in Fifth Ward
The poverty statistics for married-couple families in Fifth Ward show that 4.8% or 12 of the total 249 families live below the poverty line. Families with no children have the highest poverty rate of 5.7%, comprising of 12 families. On the other hand, families with 1 or 2 children have the lowest poverty rate of 0.0%, which includes 0 families.
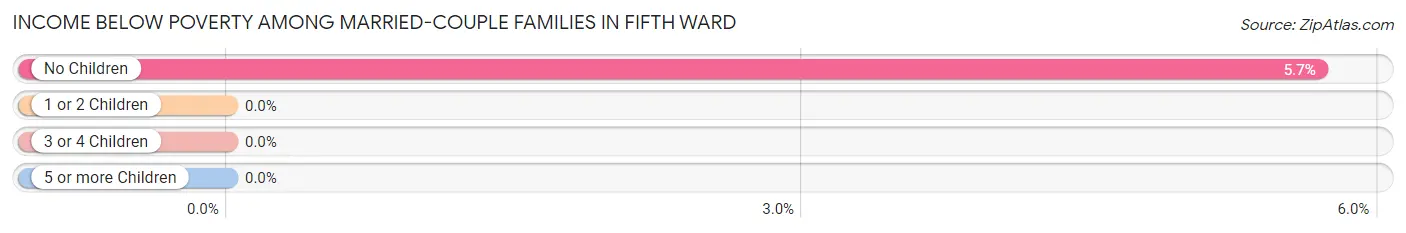
| Children | Above Poverty | Below Poverty |
| No Children | 199 (94.3%) | 12 (5.7%) |
| 1 or 2 Children | 38 (100.0%) | 0 (0.0%) |
| 3 or 4 Children | 0 (0.0%) | 0 (0.0%) |
| 5 or more Children | 0 (0.0%) | 0 (0.0%) |
| Total | 237 (95.2%) | 12 (4.8%) |
Income Below Poverty Among Single-Parent Households in Fifth Ward
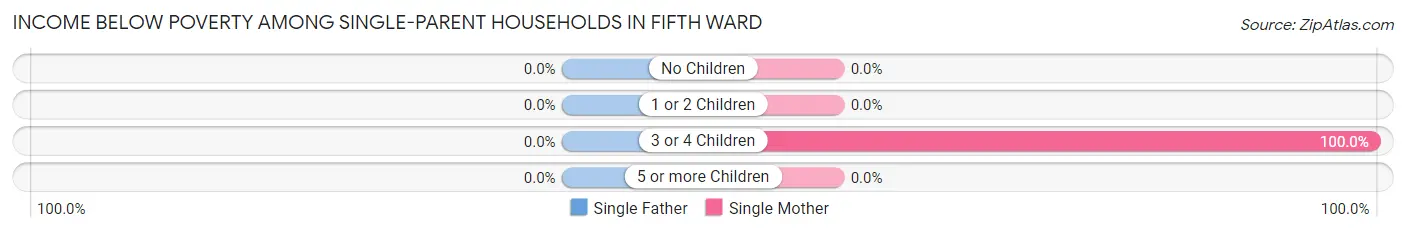
| Children | Single Father | Single Mother |
| No Children | 0 (0.0%) | 0 (0.0%) |
| 1 or 2 Children | 0 (0.0%) | 0 (0.0%) |
| 3 or 4 Children | 0 (0.0%) | 25 (100.0%) |
| 5 or more Children | 0 (0.0%) | 0 (0.0%) |
| Total | 0 (0.0%) | 25 (100.0%) |
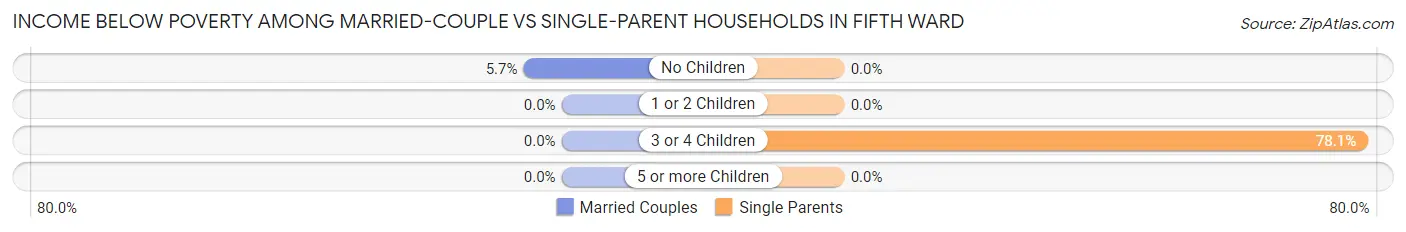
Income Below Poverty Among Married-Couple vs Single-Parent Households in Fifth Ward
The poverty data for Fifth Ward shows that 12 of the married-couple family households (4.8%) and 25 of the single-parent households (21.9%) are living below the poverty level. Within the married-couple family households, those with no children have the highest poverty rate, with 12 households (5.7%) falling below the poverty line. Among the single-parent households, those with 3 or 4 children have the highest poverty rate, with 25 household (78.1%) living below poverty.
| Children | Married-Couple Families | Single-Parent Households |
| No Children | 12 (5.7%) | 0 (0.0%) |
| 1 or 2 Children | 0 (0.0%) | 0 (0.0%) |
| 3 or 4 Children | 0 (0.0%) | 25 (78.1%) |
| 5 or more Children | 0 (0.0%) | 0 (0.0%) |
| Total | 12 (4.8%) | 25 (21.9%) |
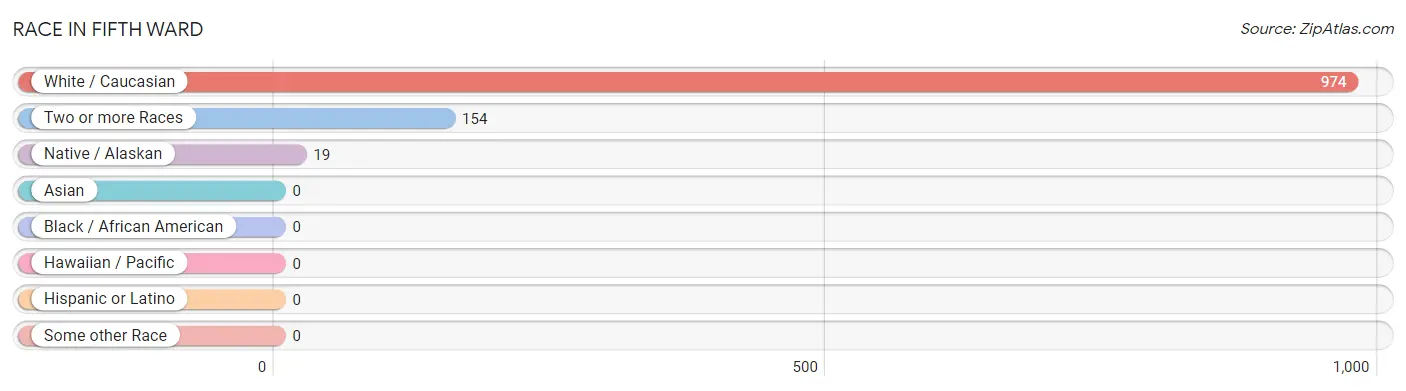
Race in Fifth Ward
The most populous races in Fifth Ward are White / Caucasian (974 | 84.9%), Two or more Races (154 | 13.4%), and Native / Alaskan (19 | 1.7%).
| Race | # Population | % Population |
| Asian | 0 | 0.0% |
| Black / African American | 0 | 0.0% |
| Hawaiian / Pacific | 0 | 0.0% |
| Hispanic or Latino | 0 | 0.0% |
| Native / Alaskan | 19 | 1.7% |
| White / Caucasian | 974 | 84.9% |
| Two or more Races | 154 | 13.4% |
| Some other Race | 0 | 0.0% |
| Total | 1,147 | 100.0% |
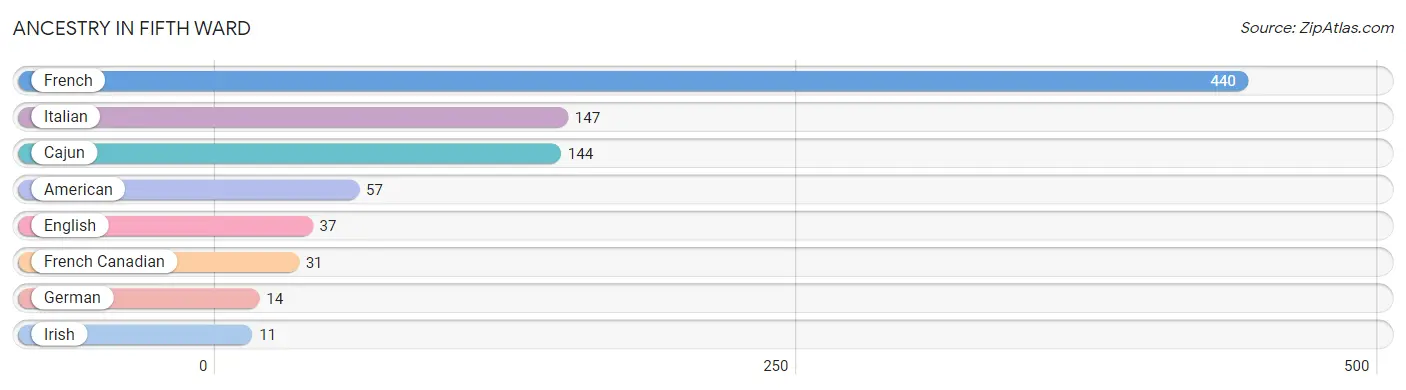
Ancestry in Fifth Ward
The most populous ancestries reported in Fifth Ward are French (440 | 38.4%), Italian (147 | 12.8%), Cajun (144 | 12.6%), American (57 | 5.0%), and English (37 | 3.2%), together accounting for 71.9% of all Fifth Ward residents.
| Ancestry | # Population | % Population |
| American | 57 | 5.0% |
| Cajun | 144 | 12.6% |
| English | 37 | 3.2% |
| French | 440 | 38.4% |
| French Canadian | 31 | 2.7% |
| German | 14 | 1.2% |
| Irish | 11 | 1.0% |
| Italian | 147 | 12.8% | View All 8 Rows |
Immigrants in Fifth Ward

| Immigration Origin | # Population | % Population | View All 0 Rows |
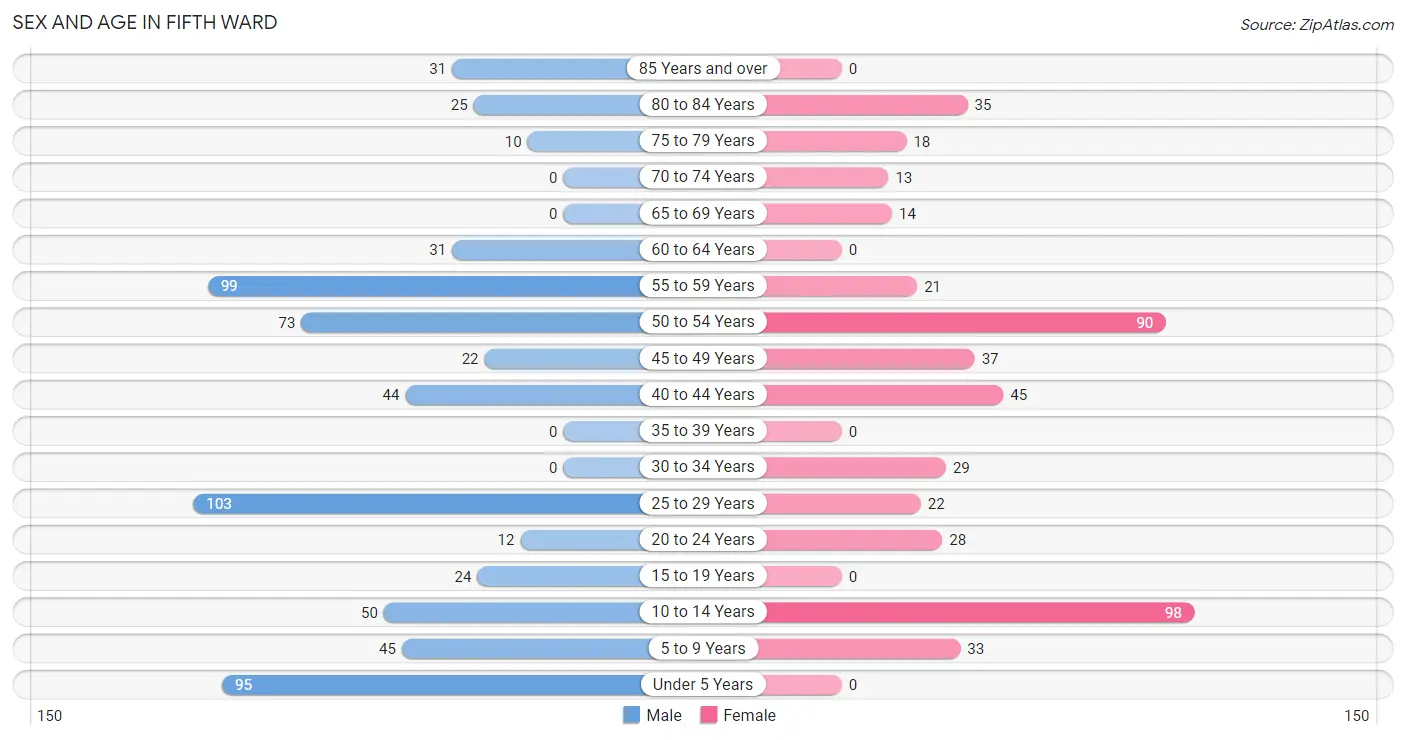
Sex and Age in Fifth Ward
Sex and Age in Fifth Ward
The most populous age groups in Fifth Ward are 25 to 29 Years (103 | 15.5%) for men and 10 to 14 Years (98 | 20.3%) for women.
| Age Bracket | Male | Female |
| Under 5 Years | 95 (14.3%) | 0 (0.0%) |
| 5 to 9 Years | 45 (6.8%) | 33 (6.8%) |
| 10 to 14 Years | 50 (7.5%) | 98 (20.3%) |
| 15 to 19 Years | 24 (3.6%) | 0 (0.0%) |
| 20 to 24 Years | 12 (1.8%) | 28 (5.8%) |
| 25 to 29 Years | 103 (15.5%) | 22 (4.5%) |
| 30 to 34 Years | 0 (0.0%) | 29 (6.0%) |
| 35 to 39 Years | 0 (0.0%) | 0 (0.0%) |
| 40 to 44 Years | 44 (6.6%) | 45 (9.3%) |
| 45 to 49 Years | 22 (3.3%) | 37 (7.7%) |
| 50 to 54 Years | 73 (11.0%) | 90 (18.6%) |
| 55 to 59 Years | 99 (14.9%) | 21 (4.3%) |
| 60 to 64 Years | 31 (4.7%) | 0 (0.0%) |
| 65 to 69 Years | 0 (0.0%) | 14 (2.9%) |
| 70 to 74 Years | 0 (0.0%) | 13 (2.7%) |
| 75 to 79 Years | 10 (1.5%) | 18 (3.7%) |
| 80 to 84 Years | 25 (3.8%) | 35 (7.2%) |
| 85 Years and over | 31 (4.7%) | 0 (0.0%) |
| Total | 664 (100.0%) | 483 (100.0%) |
Families and Households in Fifth Ward
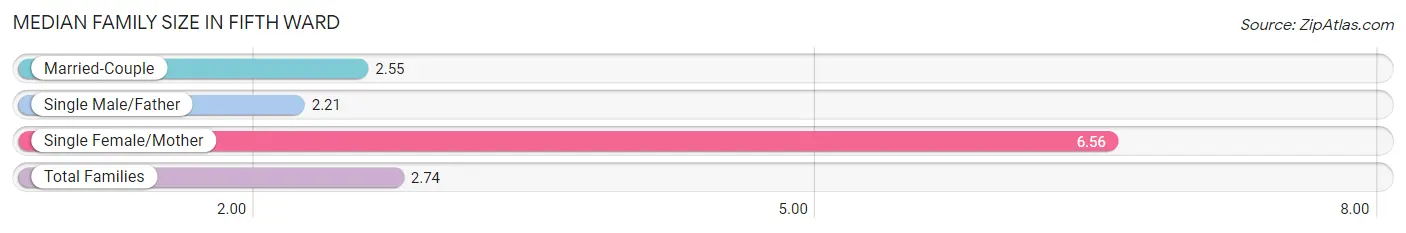
Median Family Size in Fifth Ward
The median family size in Fifth Ward is 2.74 persons per family, with single female/mother families (25 | 6.9%) accounting for the largest median family size of 6.56 persons per family. On the other hand, single male/father families (89 | 24.5%) represent the smallest median family size with 2.21 persons per family.
| Family Type | # Families | Family Size |
| Married-Couple | 249 (68.6%) | 2.55 |
| Single Male/Father | 89 (24.5%) | 2.21 |
| Single Female/Mother | 25 (6.9%) | 6.56 |
| Total Families | 363 (100.0%) | 2.74 |
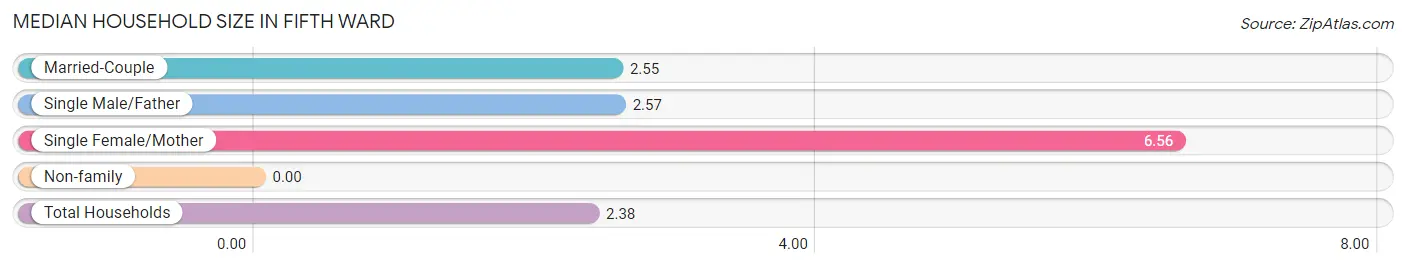
Median Household Size in Fifth Ward
| Household Type | # Households | Household Size |
| Married-Couple | 249 (51.7%) | 2.55 |
| Single Male/Father | 89 (18.5%) | 2.57 |
| Single Female/Mother | 25 (5.2%) | 6.56 |
| Non-family | 119 (24.7%) | - |
| Total Households | 482 (100.0%) | 2.38 |
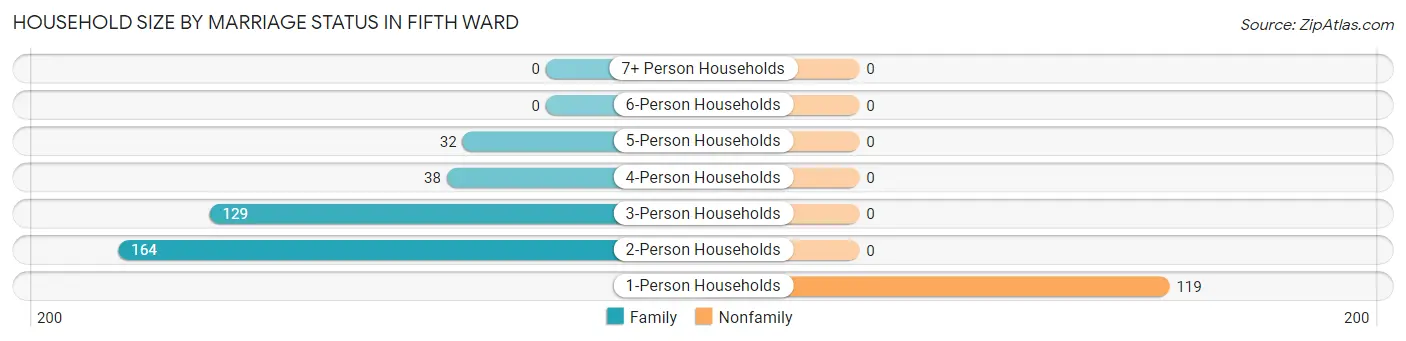
Household Size by Marriage Status in Fifth Ward
Out of a total of 482 households in Fifth Ward, 363 (75.3%) are family households, while 119 (24.7%) are nonfamily households. The most numerous type of family households are 2-person households, comprising 164, and the most common type of nonfamily households are 1-person households, comprising 119.
| Household Size | Family Households | Nonfamily Households |
| 1-Person Households | - | 119 (24.7%) |
| 2-Person Households | 164 (34.0%) | 0 (0.0%) |
| 3-Person Households | 129 (26.8%) | 0 (0.0%) |
| 4-Person Households | 38 (7.9%) | 0 (0.0%) |
| 5-Person Households | 32 (6.6%) | 0 (0.0%) |
| 6-Person Households | 0 (0.0%) | 0 (0.0%) |
| 7+ Person Households | 0 (0.0%) | 0 (0.0%) |
| Total | 363 (75.3%) | 119 (24.7%) |
Female Fertility in Fifth Ward
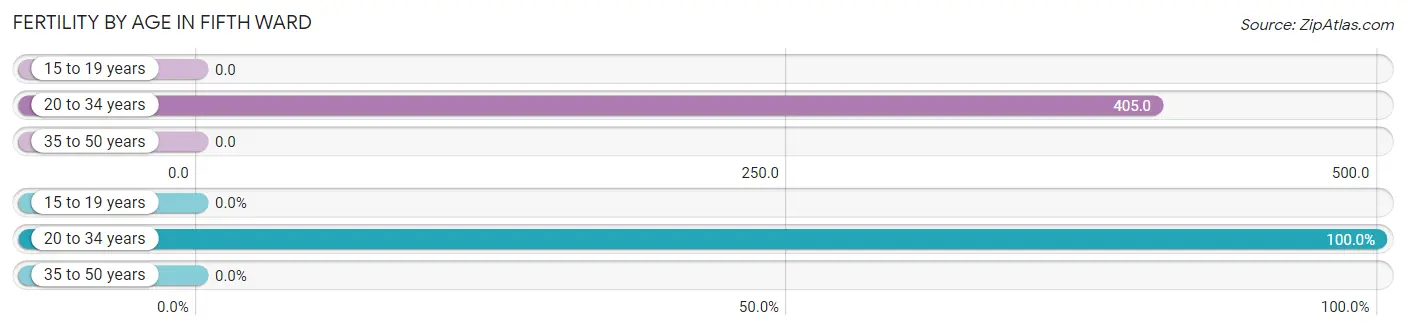
Fertility by Age in Fifth Ward
Average fertility rate in Fifth Ward is 199.0 births per 1,000 women. Women in the age bracket of 20 to 34 years have the highest fertility rate with 405.0 births per 1,000 women. Women in the age bracket of 20 to 34 years acount for 100.0% of all women with births.
| Age Bracket | Women with Births | Births / 1,000 Women |
| 15 to 19 years | 0 (0.0%) | 0.0 |
| 20 to 34 years | 32 (100.0%) | 405.0 |
| 35 to 50 years | 0 (0.0%) | 0.0 |
| Total | 32 (100.0%) | 199.0 |
Fertility by Age by Marriage Status in Fifth Ward
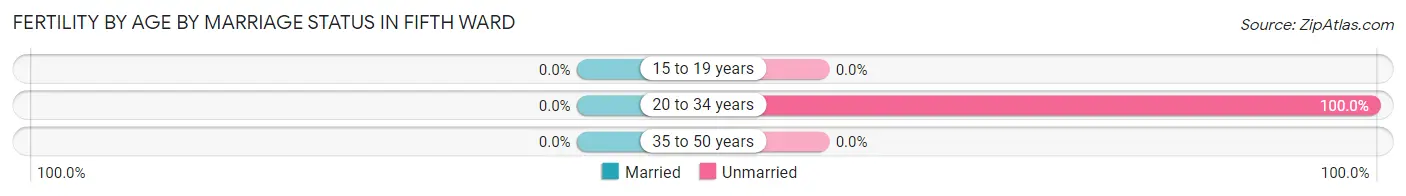
| Age Bracket | Married | Unmarried |
| 15 to 19 years | 0 (0.0%) | 0 (0.0%) |
| 20 to 34 years | 0 (0.0%) | 32 (100.0%) |
| 35 to 50 years | 0 (0.0%) | 0 (0.0%) |
| Total | 0 (0.0%) | 32 (100.0%) |
Fertility by Education in Fifth Ward
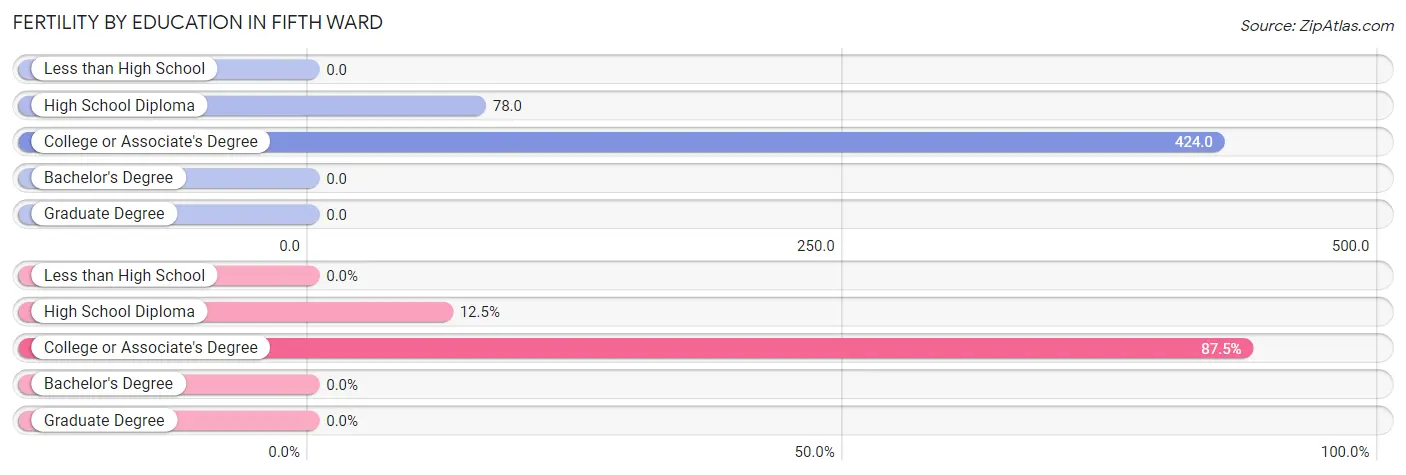
| Educational Attainment | Women with Births | Births / 1,000 Women |
| Less than High School | 0 (0.0%) | 0.0 |
| High School Diploma | 4 (12.5%) | 78.0 |
| College or Associate's Degree | 28 (87.5%) | 424.0 |
| Bachelor's Degree | 0 (0.0%) | 0.0 |
| Graduate Degree | 0 (0.0%) | 0.0 |
| Total | 32 (100.0%) | 199.0 |
Fertility by Education by Marriage Status in Fifth Ward
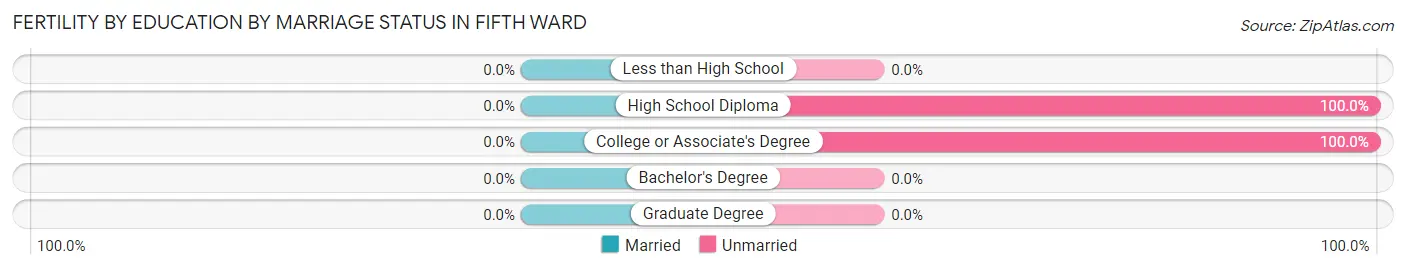
| Educational Attainment | Married | Unmarried |
| Less than High School | 0 (0.0%) | 0 (0.0%) |
| High School Diploma | 0 (0.0%) | 4 (100.0%) |
| College or Associate's Degree | 0 (0.0%) | 28 (100.0%) |
| Bachelor's Degree | 0 (0.0%) | 0 (0.0%) |
| Graduate Degree | 0 (0.0%) | 0 (0.0%) |
| Total | 0 (0.0%) | 32 (100.0%) |
Employment Characteristics in Fifth Ward
Employment by Class of Employer in Fifth Ward
Among the 571 employed individuals in Fifth Ward, private company employees (313 | 54.8%), local government employees (83 | 14.5%), and federal government employees (82 | 14.4%) make up the most common classes of employment.
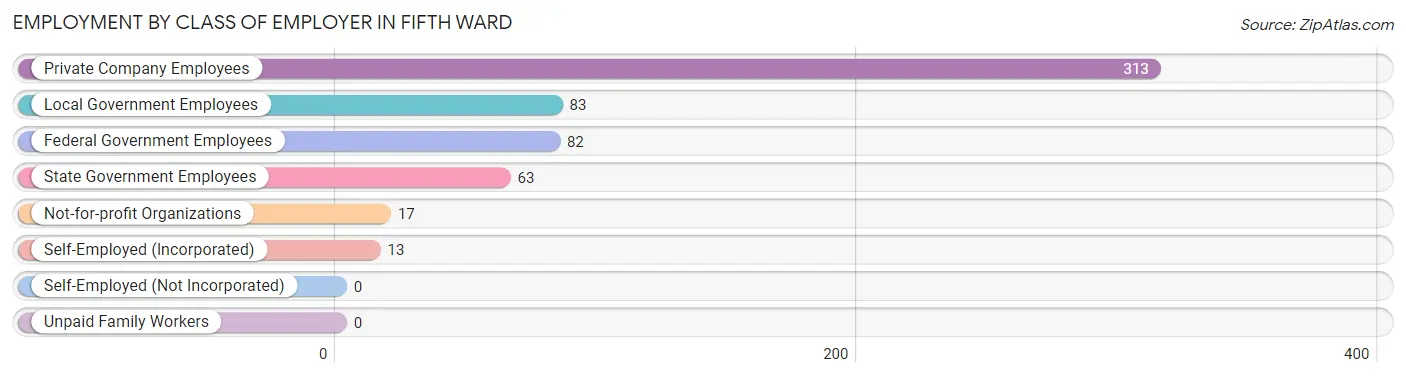
| Employer Class | # Employees | % Employees |
| Private Company Employees | 313 | 54.8% |
| Self-Employed (Incorporated) | 13 | 2.3% |
| Self-Employed (Not Incorporated) | 0 | 0.0% |
| Not-for-profit Organizations | 17 | 3.0% |
| Local Government Employees | 83 | 14.5% |
| State Government Employees | 63 | 11.0% |
| Federal Government Employees | 82 | 14.4% |
| Unpaid Family Workers | 0 | 0.0% |
| Total | 571 | 100.0% |
Employment Status by Age in Fifth Ward
According to the labor force statistics for Fifth Ward, out of the total population over 16 years of age (821), 74.2% or 609 individuals are in the labor force, with 5.3% or 32 of them unemployed. The age group with the highest labor force participation rate is 16 to 19 years, with 100.0% or 19 individuals in the labor force. Within the labor force, the 20 to 24 years age range has the highest percentage of unemployed individuals, with 70.0% or 28 of them being unemployed.
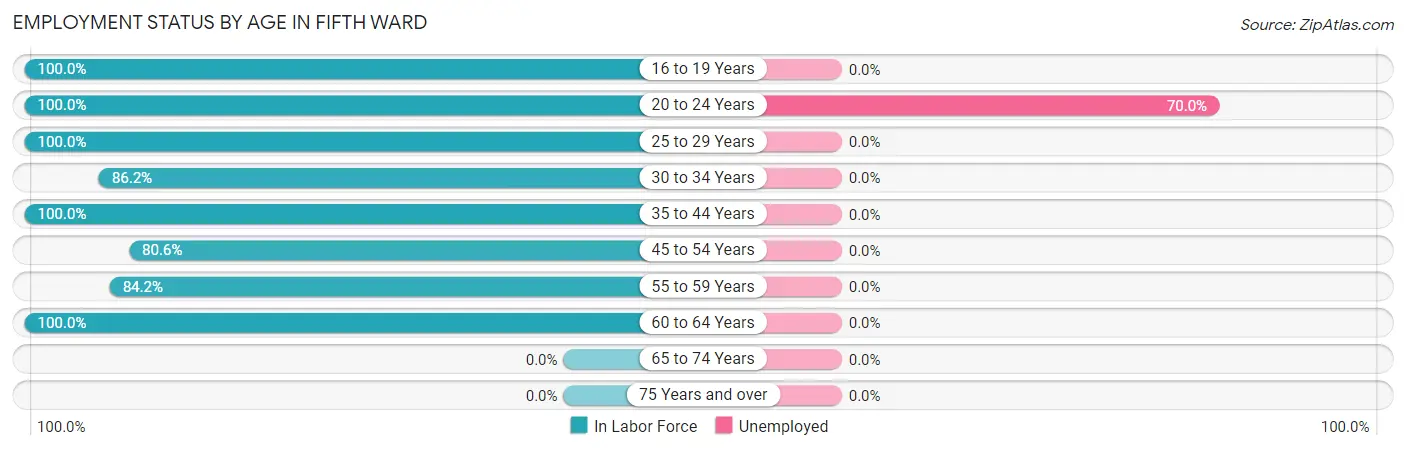
| Age Bracket | In Labor Force | Unemployed |
| 16 to 19 Years | 19 (100.0%) | 0 (0.0%) |
| 20 to 24 Years | 40 (100.0%) | 28 (70.0%) |
| 25 to 29 Years | 125 (100.0%) | 0 (0.0%) |
| 30 to 34 Years | 25 (86.2%) | 0 (0.0%) |
| 35 to 44 Years | 89 (100.0%) | 0 (0.0%) |
| 45 to 54 Years | 179 (80.6%) | 0 (0.0%) |
| 55 to 59 Years | 101 (84.2%) | 0 (0.0%) |
| 60 to 64 Years | 31 (100.0%) | 0 (0.0%) |
| 65 to 74 Years | 0 (0.0%) | 0 (0.0%) |
| 75 Years and over | 0 (0.0%) | 0 (0.0%) |
| Total | 609 (74.2%) | 32 (5.3%) |
Employment Status by Educational Attainment in Fifth Ward
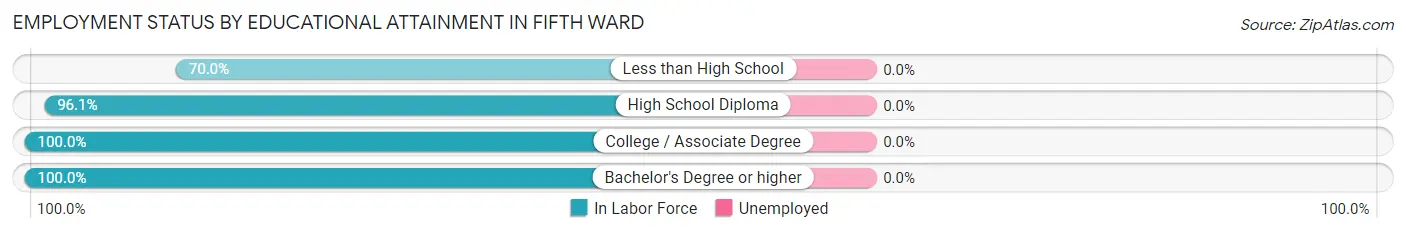
| Educational Attainment | In Labor Force | Unemployed |
| Less than High School | 126 (70.0%) | 0 (0.0%) |
| High School Diploma | 293 (96.1%) | 0 (0.0%) |
| College / Associate Degree | 49 (100.0%) | 0 (0.0%) |
| Bachelor's Degree or higher | 82 (100.0%) | 0 (0.0%) |
| Total | 550 (89.3%) | 0 (0.0%) |
Employment Occupations by Sex in Fifth Ward
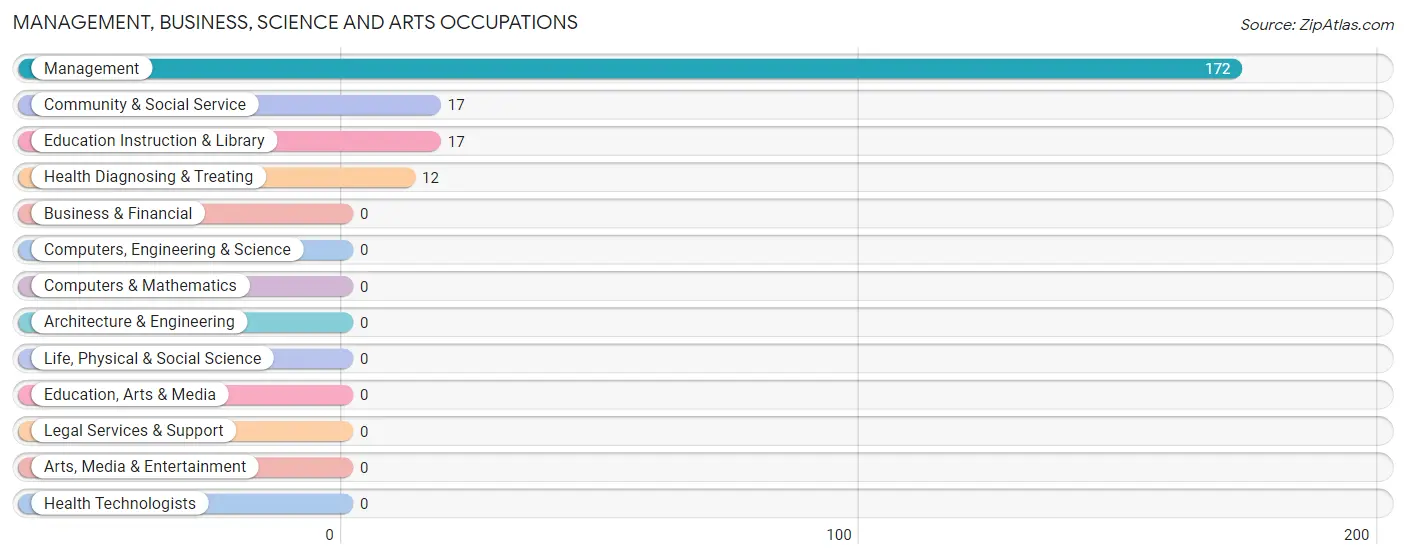
Management, Business, Science and Arts Occupations
The most common Management, Business, Science and Arts occupations in Fifth Ward are Management (172 | 34.5%), Community & Social Service (17 | 3.4%), Education Instruction & Library (17 | 3.4%), and Health Diagnosing & Treating (12 | 2.4%).
Management, Business, Science and Arts Occupations by Sex
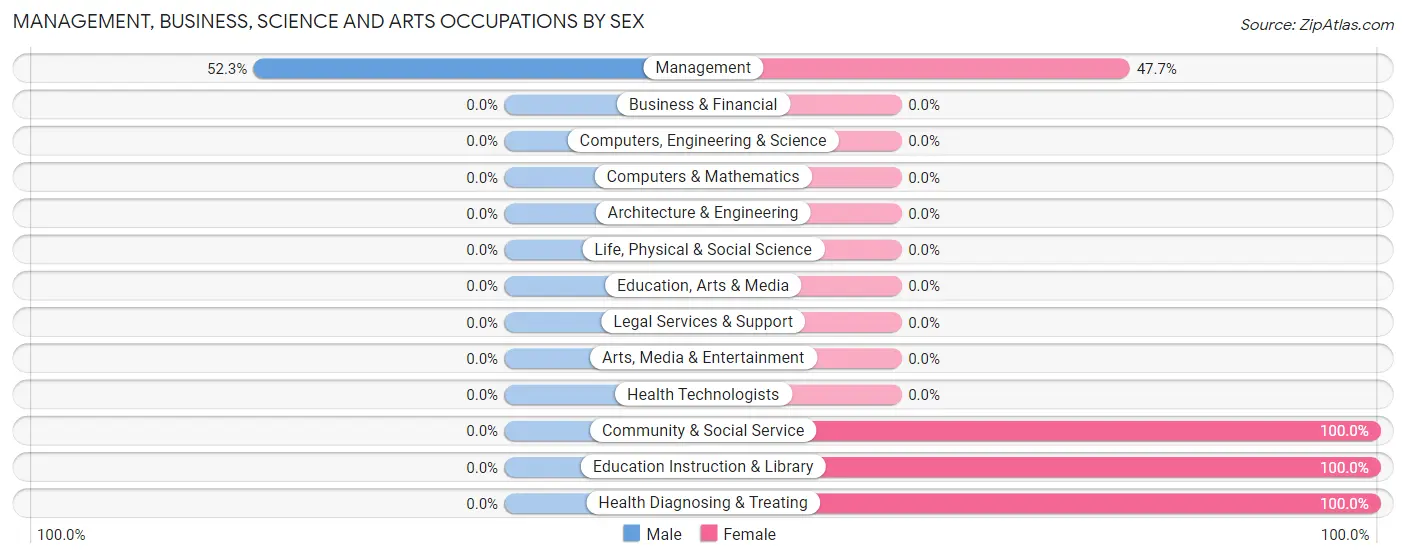
| Occupation | Male | Female |
| Management | 90 (52.3%) | 82 (47.7%) |
| Business & Financial | 0 (0.0%) | 0 (0.0%) |
| Computers, Engineering & Science | 0 (0.0%) | 0 (0.0%) |
| Computers & Mathematics | 0 (0.0%) | 0 (0.0%) |
| Architecture & Engineering | 0 (0.0%) | 0 (0.0%) |
| Life, Physical & Social Science | 0 (0.0%) | 0 (0.0%) |
| Community & Social Service | 0 (0.0%) | 17 (100.0%) |
| Education, Arts & Media | 0 (0.0%) | 0 (0.0%) |
| Legal Services & Support | 0 (0.0%) | 0 (0.0%) |
| Education Instruction & Library | 0 (0.0%) | 17 (100.0%) |
| Arts, Media & Entertainment | 0 (0.0%) | 0 (0.0%) |
| Health Diagnosing & Treating | 0 (0.0%) | 12 (100.0%) |
| Health Technologists | 0 (0.0%) | 0 (0.0%) |
| Total (Category) | 90 (44.8%) | 111 (55.2%) |
| Total (Overall) | 288 (57.7%) | 211 (42.3%) |
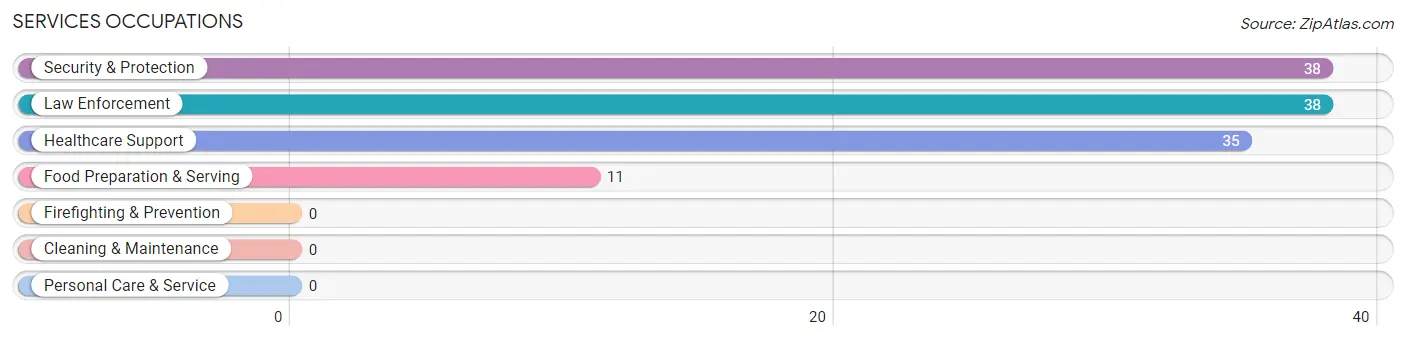
Services Occupations
The most common Services occupations in Fifth Ward are Security & Protection (38 | 7.6%), Law Enforcement (38 | 7.6%), Healthcare Support (35 | 7.0%), and Food Preparation & Serving (11 | 2.2%).
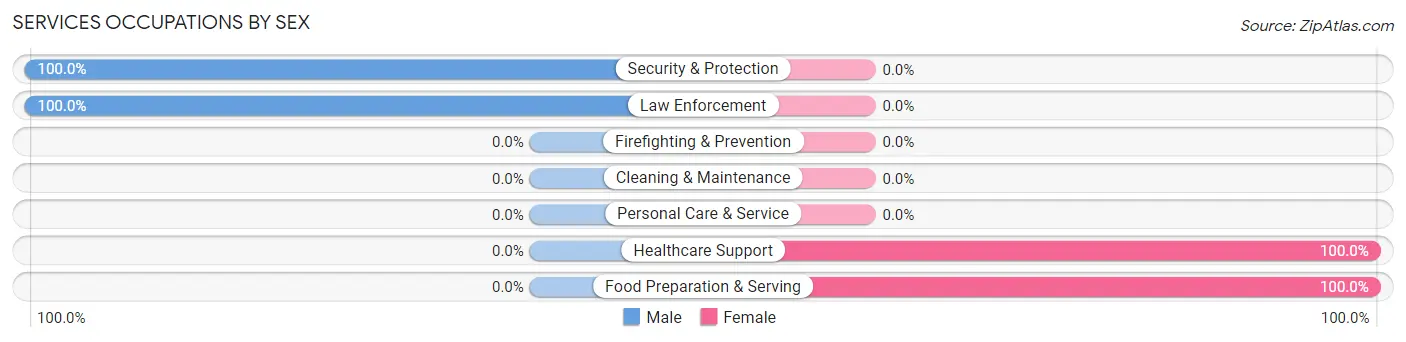
Services Occupations by Sex
Within the Services occupations in Fifth Ward, the most male-oriented occupations are Security & Protection (100.0%), and Law Enforcement (100.0%), while the most female-oriented occupations are Healthcare Support (100.0%), and Food Preparation & Serving (100.0%).
| Occupation | Male | Female |
| Healthcare Support | 0 (0.0%) | 35 (100.0%) |
| Security & Protection | 38 (100.0%) | 0 (0.0%) |
| Firefighting & Prevention | 0 (0.0%) | 0 (0.0%) |
| Law Enforcement | 38 (100.0%) | 0 (0.0%) |
| Food Preparation & Serving | 0 (0.0%) | 11 (100.0%) |
| Cleaning & Maintenance | 0 (0.0%) | 0 (0.0%) |
| Personal Care & Service | 0 (0.0%) | 0 (0.0%) |
| Total (Category) | 38 (45.2%) | 46 (54.8%) |
| Total (Overall) | 288 (57.7%) | 211 (42.3%) |
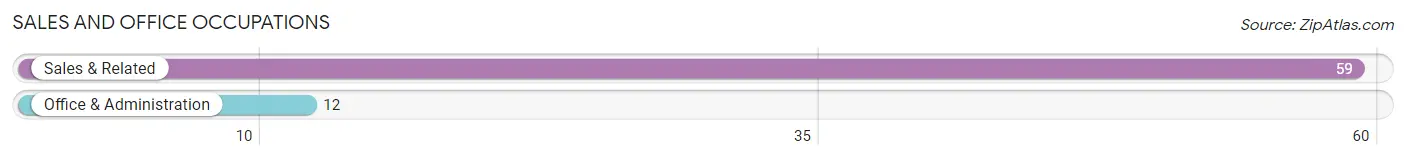
Sales and Office Occupations
The most common Sales and Office occupations in Fifth Ward are Sales & Related (59 | 11.8%), and Office & Administration (12 | 2.4%).
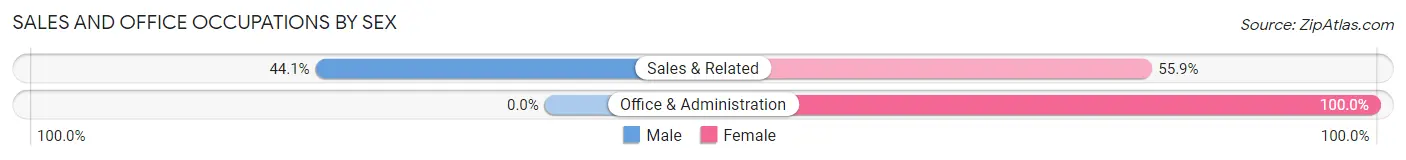
Sales and Office Occupations by Sex
| Occupation | Male | Female |
| Sales & Related | 26 (44.1%) | 33 (55.9%) |
| Office & Administration | 0 (0.0%) | 12 (100.0%) |
| Total (Category) | 26 (36.6%) | 45 (63.4%) |
| Total (Overall) | 288 (57.7%) | 211 (42.3%) |
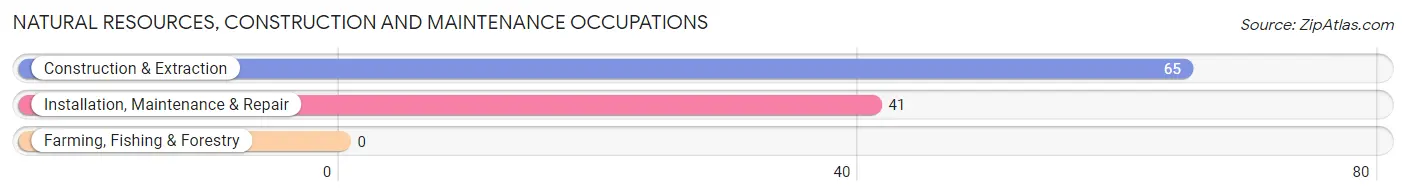
Natural Resources, Construction and Maintenance Occupations
The most common Natural Resources, Construction and Maintenance occupations in Fifth Ward are Construction & Extraction (65 | 13.0%), and Installation, Maintenance & Repair (41 | 8.2%).
Natural Resources, Construction and Maintenance Occupations by Sex
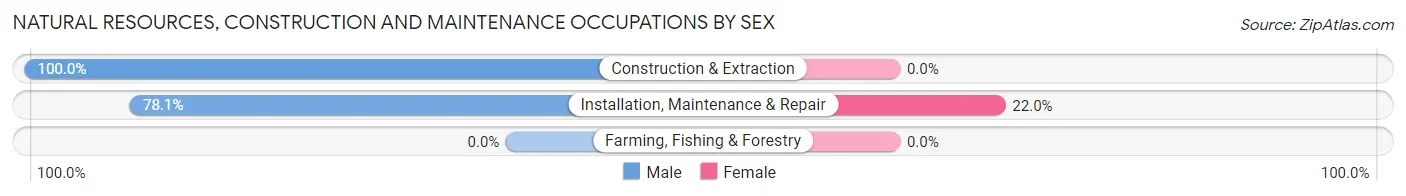
| Occupation | Male | Female |
| Farming, Fishing & Forestry | 0 (0.0%) | 0 (0.0%) |
| Construction & Extraction | 65 (100.0%) | 0 (0.0%) |
| Installation, Maintenance & Repair | 32 (78.0%) | 9 (22.0%) |
| Total (Category) | 97 (91.5%) | 9 (8.5%) |
| Total (Overall) | 288 (57.7%) | 211 (42.3%) |
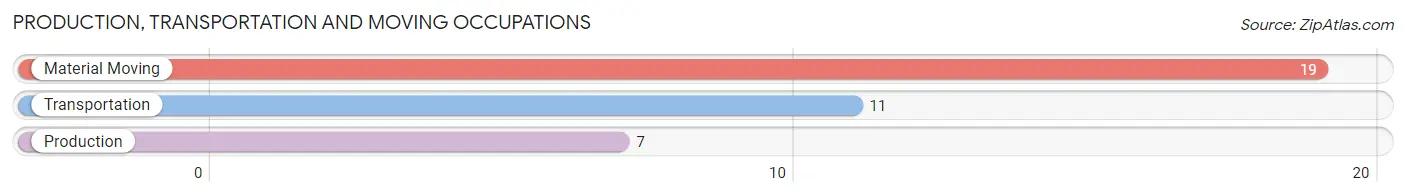
Production, Transportation and Moving Occupations
The most common Production, Transportation and Moving occupations in Fifth Ward are Material Moving (19 | 3.8%), Transportation (11 | 2.2%), and Production (7 | 1.4%).
Production, Transportation and Moving Occupations by Sex
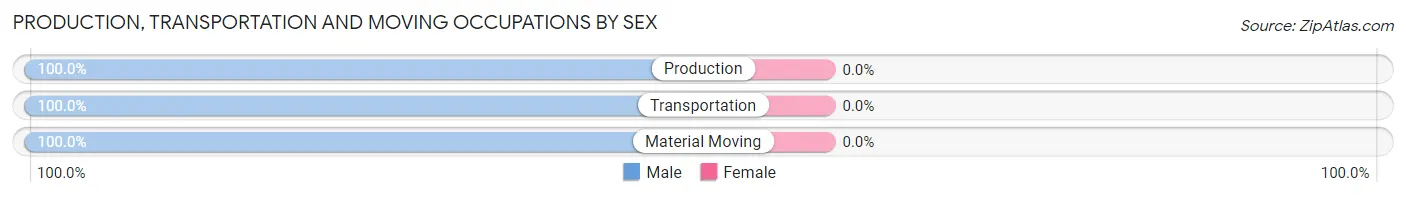
| Occupation | Male | Female |
| Production | 7 (100.0%) | 0 (0.0%) |
| Transportation | 11 (100.0%) | 0 (0.0%) |
| Material Moving | 19 (100.0%) | 0 (0.0%) |
| Total (Category) | 37 (100.0%) | 0 (0.0%) |
| Total (Overall) | 288 (57.7%) | 211 (42.3%) |
Employment Industries by Sex in Fifth Ward
Employment Industries in Fifth Ward
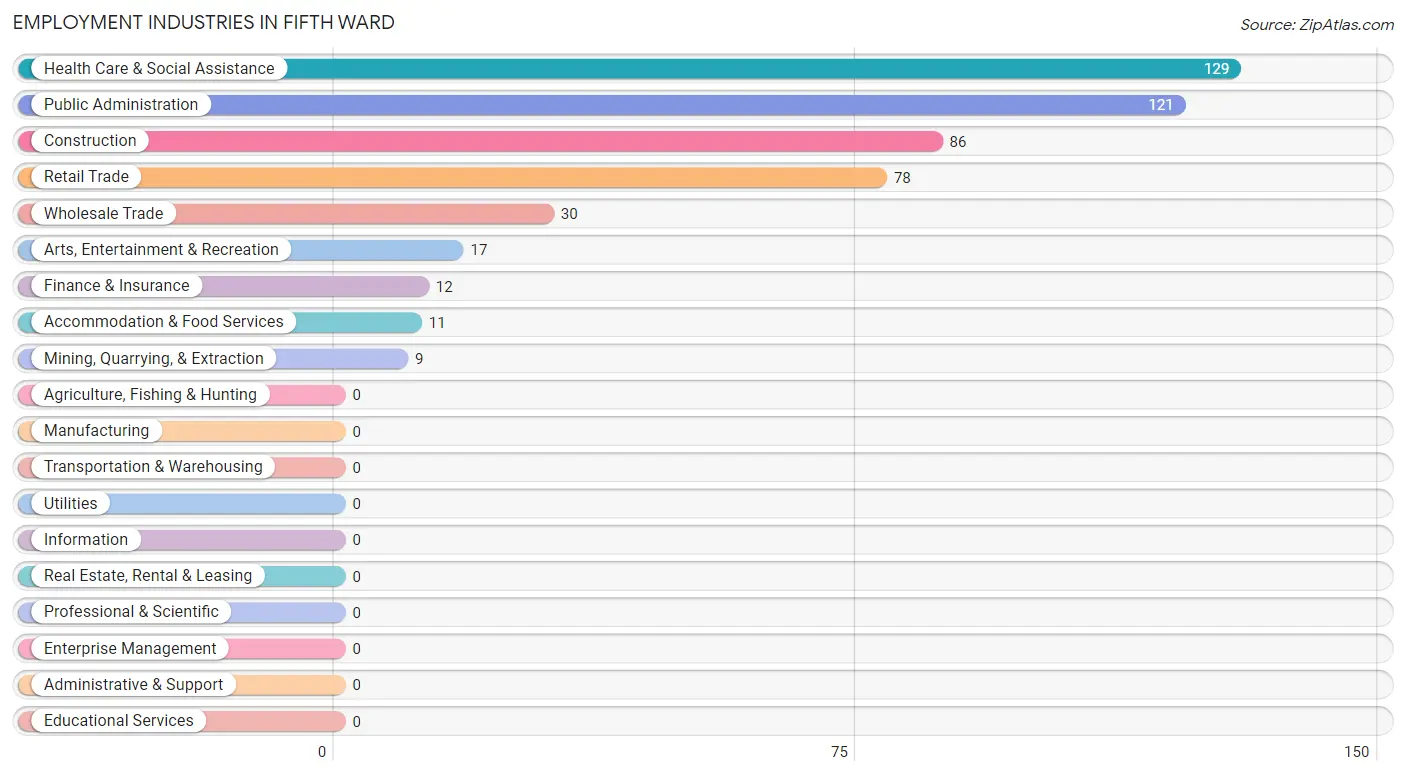
The major employment industries in Fifth Ward include Health Care & Social Assistance (129 | 25.9%), Public Administration (121 | 24.2%), Construction (86 | 17.2%), Retail Trade (78 | 15.6%), and Wholesale Trade (30 | 6.0%).
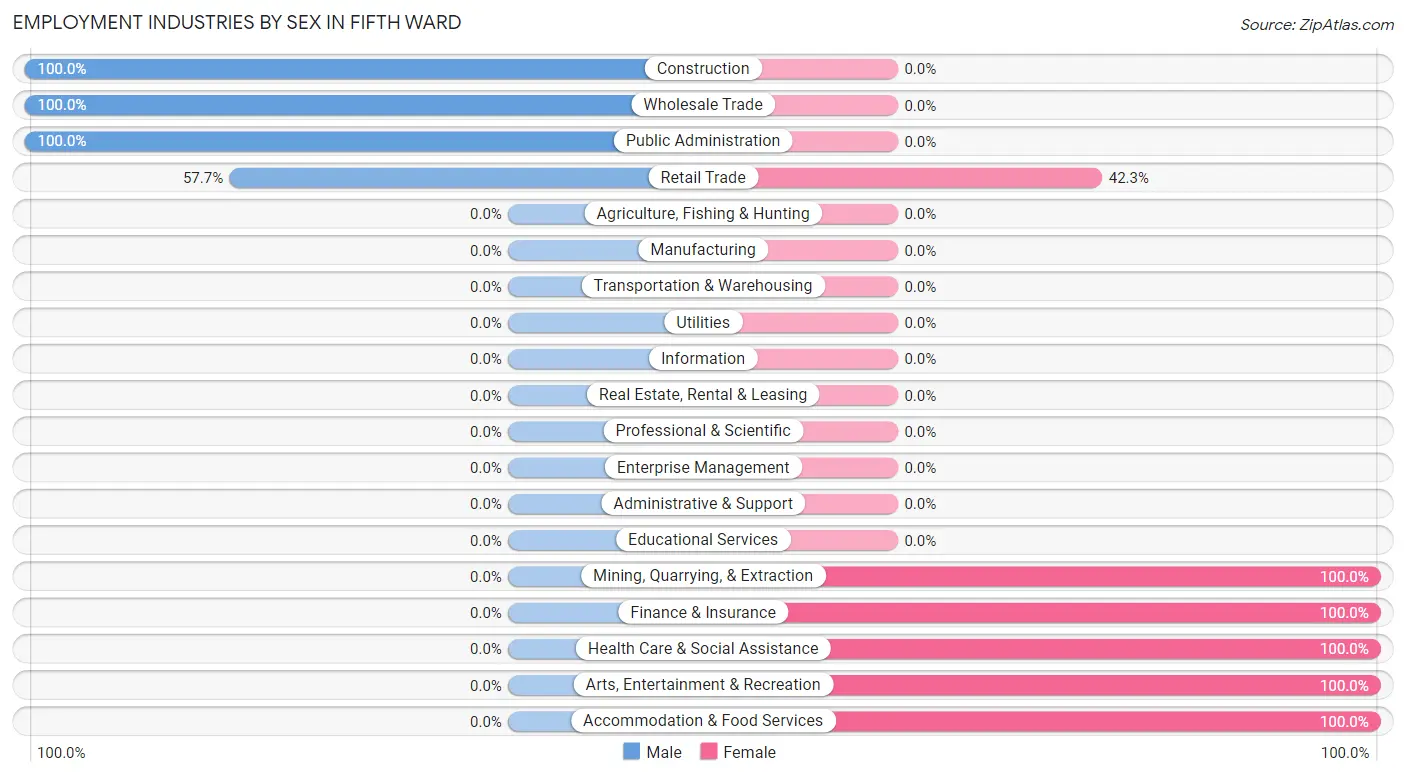
Employment Industries by Sex in Fifth Ward
The Fifth Ward industries that see more men than women are Construction (100.0%), Wholesale Trade (100.0%), and Public Administration (100.0%), whereas the industries that tend to have a higher number of women are Mining, Quarrying, & Extraction (100.0%), Finance & Insurance (100.0%), and Health Care & Social Assistance (100.0%).
| Industry | Male | Female |
| Agriculture, Fishing & Hunting | 0 (0.0%) | 0 (0.0%) |
| Mining, Quarrying, & Extraction | 0 (0.0%) | 9 (100.0%) |
| Construction | 86 (100.0%) | 0 (0.0%) |
| Manufacturing | 0 (0.0%) | 0 (0.0%) |
| Wholesale Trade | 30 (100.0%) | 0 (0.0%) |
| Retail Trade | 45 (57.7%) | 33 (42.3%) |
| Transportation & Warehousing | 0 (0.0%) | 0 (0.0%) |
| Utilities | 0 (0.0%) | 0 (0.0%) |
| Information | 0 (0.0%) | 0 (0.0%) |
| Finance & Insurance | 0 (0.0%) | 12 (100.0%) |
| Real Estate, Rental & Leasing | 0 (0.0%) | 0 (0.0%) |
| Professional & Scientific | 0 (0.0%) | 0 (0.0%) |
| Enterprise Management | 0 (0.0%) | 0 (0.0%) |
| Administrative & Support | 0 (0.0%) | 0 (0.0%) |
| Educational Services | 0 (0.0%) | 0 (0.0%) |
| Health Care & Social Assistance | 0 (0.0%) | 129 (100.0%) |
| Arts, Entertainment & Recreation | 0 (0.0%) | 17 (100.0%) |
| Accommodation & Food Services | 0 (0.0%) | 11 (100.0%) |
| Public Administration | 121 (100.0%) | 0 (0.0%) |
| Total | 288 (57.7%) | 211 (42.3%) |
Education in Fifth Ward
School Enrollment in Fifth Ward
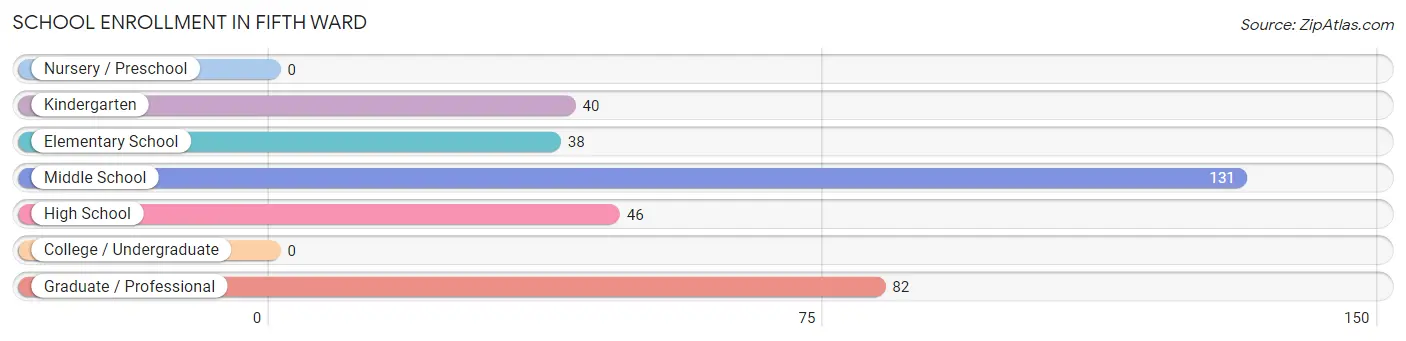
The most common levels of schooling among the 337 students in Fifth Ward are middle school (131 | 38.9%), graduate / professional (82 | 24.3%), and high school (46 | 13.7%).
| School Level | # Students | % Students |
| Nursery / Preschool | 0 | 0.0% |
| Kindergarten | 40 | 11.9% |
| Elementary School | 38 | 11.3% |
| Middle School | 131 | 38.9% |
| High School | 46 | 13.7% |
| College / Undergraduate | 0 | 0.0% |
| Graduate / Professional | 82 | 24.3% |
| Total | 337 | 100.0% |
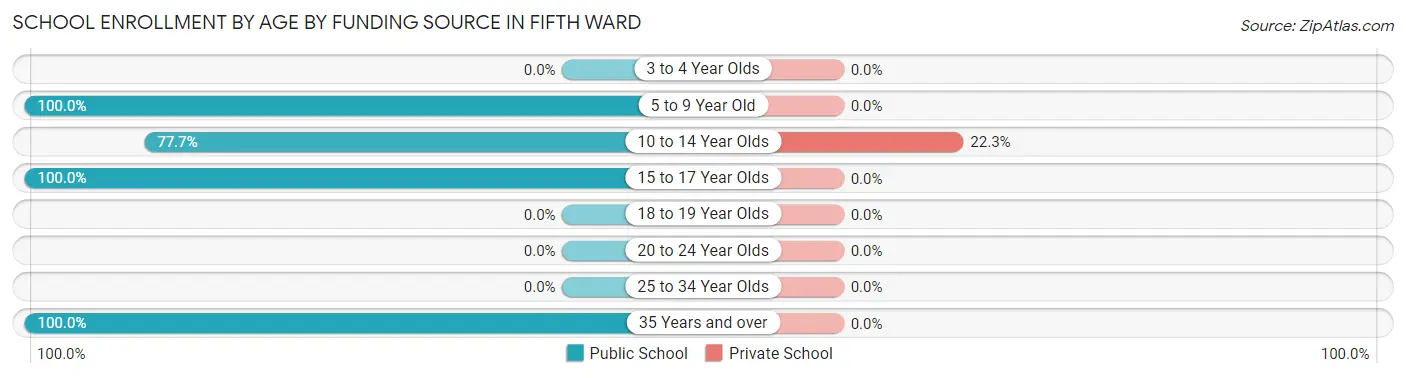
School Enrollment by Age by Funding Source in Fifth Ward
Out of a total of 337 students who are enrolled in schools in Fifth Ward, 33 (9.8%) attend a private institution, while the remaining 304 (90.2%) are enrolled in public schools. The age group of 10 to 14 year olds has the highest likelihood of being enrolled in private schools, with 33 (22.3% in the age bracket) enrolled. Conversely, the age group of 5 to 9 year old has the lowest likelihood of being enrolled in a private school, with 78 (100.0% in the age bracket) attending a public institution.
| Age Bracket | Public School | Private School |
| 3 to 4 Year Olds | 0 (0.0%) | 0 (0.0%) |
| 5 to 9 Year Old | 78 (100.0%) | 0 (0.0%) |
| 10 to 14 Year Olds | 115 (77.7%) | 33 (22.3%) |
| 15 to 17 Year Olds | 24 (100.0%) | 0 (0.0%) |
| 18 to 19 Year Olds | 0 (0.0%) | 0 (0.0%) |
| 20 to 24 Year Olds | 0 (0.0%) | 0 (0.0%) |
| 25 to 34 Year Olds | 0 (0.0%) | 0 (0.0%) |
| 35 Years and over | 87 (100.0%) | 0 (0.0%) |
| Total | 304 (90.2%) | 33 (9.8%) |
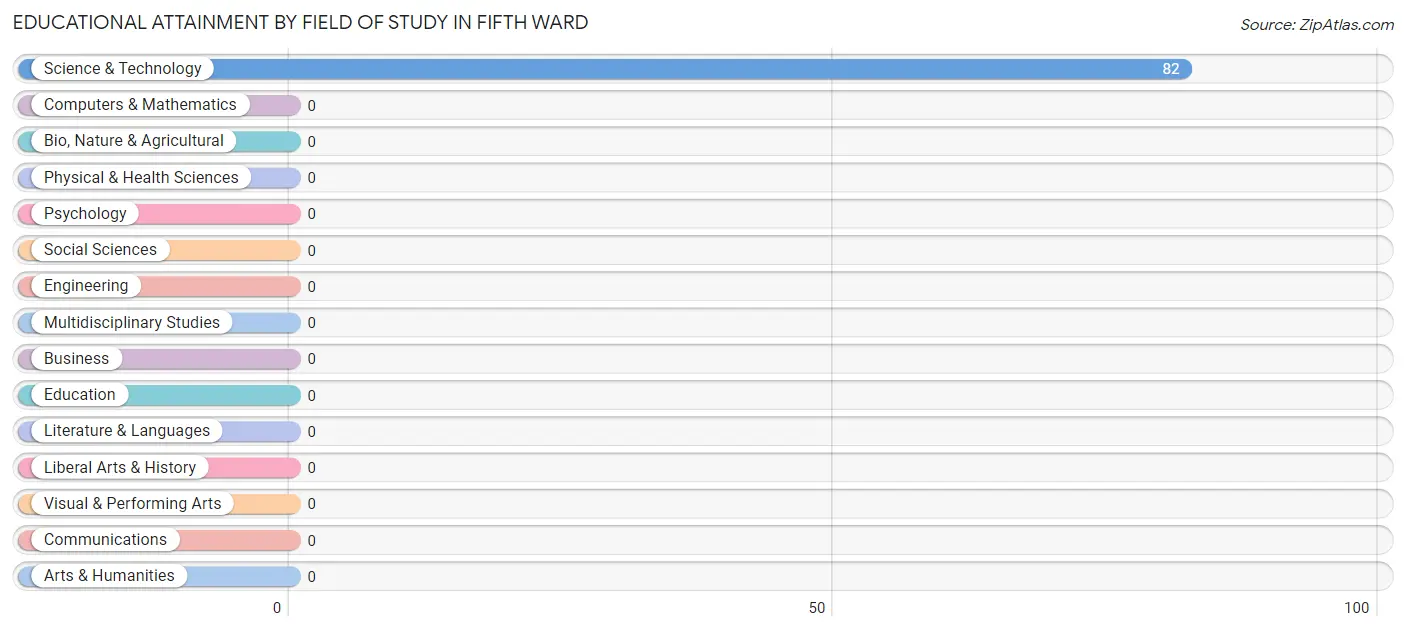
Educational Attainment by Field of Study in Fifth Ward
, and science & technology (82 | 100.0%) are the most common fields of study among 82 individuals in Fifth Ward who have obtained a bachelor's degree or higher.
| Field of Study | # Graduates | % Graduates |
| Computers & Mathematics | 0 | 0.0% |
| Bio, Nature & Agricultural | 0 | 0.0% |
| Physical & Health Sciences | 0 | 0.0% |
| Psychology | 0 | 0.0% |
| Social Sciences | 0 | 0.0% |
| Engineering | 0 | 0.0% |
| Multidisciplinary Studies | 0 | 0.0% |
| Science & Technology | 82 | 100.0% |
| Business | 0 | 0.0% |
| Education | 0 | 0.0% |
| Literature & Languages | 0 | 0.0% |
| Liberal Arts & History | 0 | 0.0% |
| Visual & Performing Arts | 0 | 0.0% |
| Communications | 0 | 0.0% |
| Arts & Humanities | 0 | 0.0% |
| Total | 82 | 100.0% |
Transportation & Commute in Fifth Ward
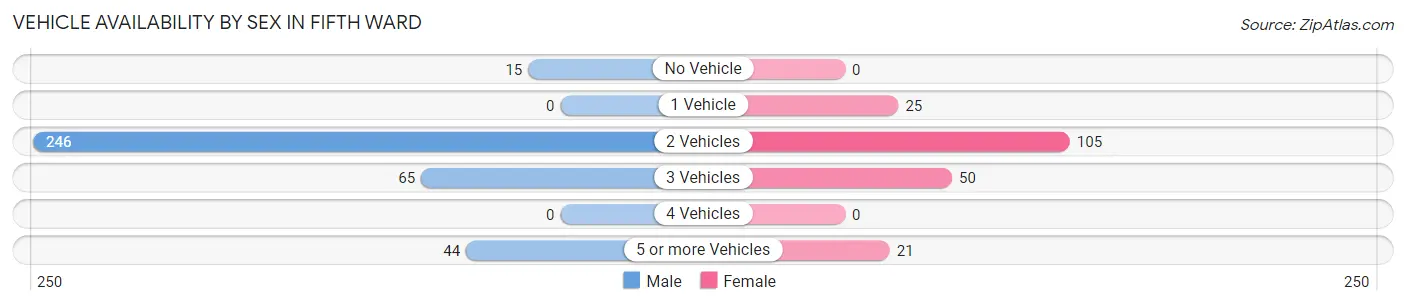
Vehicle Availability by Sex in Fifth Ward
The most prevalent vehicle ownership categories in Fifth Ward are males with 2 vehicles (246, accounting for 66.5%) and females with 2 vehicles (105, making up 122.4%).
| Vehicles Available | Male | Female |
| No Vehicle | 15 (4.1%) | 0 (0.0%) |
| 1 Vehicle | 0 (0.0%) | 25 (12.4%) |
| 2 Vehicles | 246 (66.5%) | 105 (52.2%) |
| 3 Vehicles | 65 (17.6%) | 50 (24.9%) |
| 4 Vehicles | 0 (0.0%) | 0 (0.0%) |
| 5 or more Vehicles | 44 (11.9%) | 21 (10.4%) |
| Total | 370 (100.0%) | 201 (100.0%) |
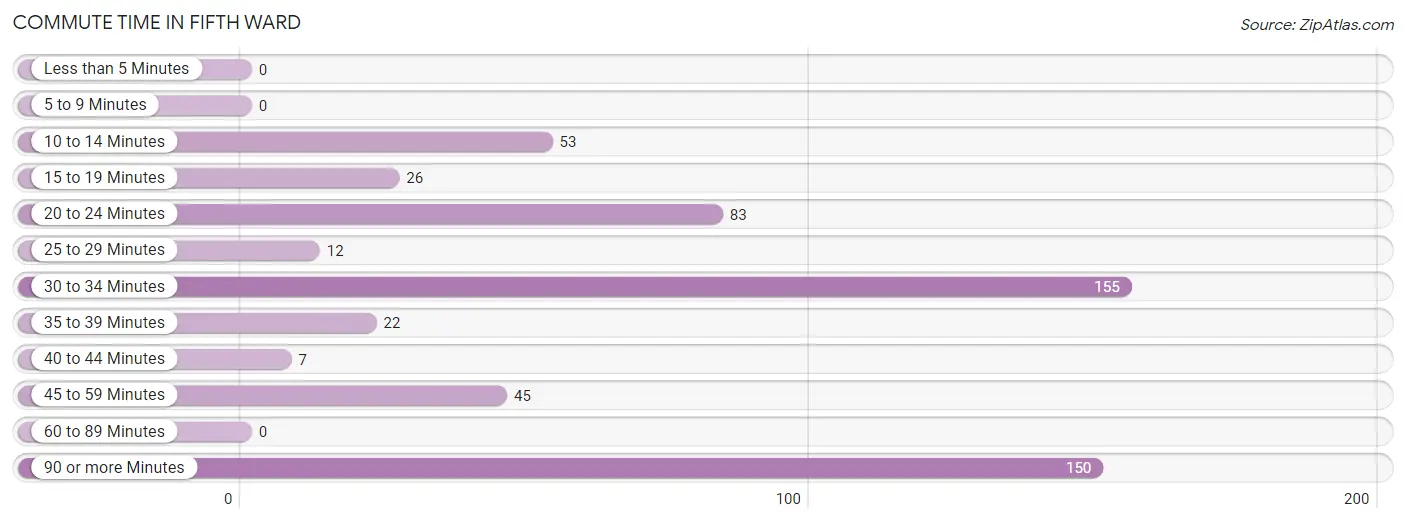
Commute Time in Fifth Ward
The most frequently occuring commute durations in Fifth Ward are 30 to 34 minutes (155 commuters, 28.0%), 90 or more minutes (150 commuters, 27.1%), and 20 to 24 minutes (83 commuters, 15.0%).
| Commute Time | # Commuters | % Commuters |
| Less than 5 Minutes | 0 | 0.0% |
| 5 to 9 Minutes | 0 | 0.0% |
| 10 to 14 Minutes | 53 | 9.6% |
| 15 to 19 Minutes | 26 | 4.7% |
| 20 to 24 Minutes | 83 | 15.0% |
| 25 to 29 Minutes | 12 | 2.2% |
| 30 to 34 Minutes | 155 | 28.0% |
| 35 to 39 Minutes | 22 | 4.0% |
| 40 to 44 Minutes | 7 | 1.3% |
| 45 to 59 Minutes | 45 | 8.1% |
| 60 to 89 Minutes | 0 | 0.0% |
| 90 or more Minutes | 150 | 27.1% |
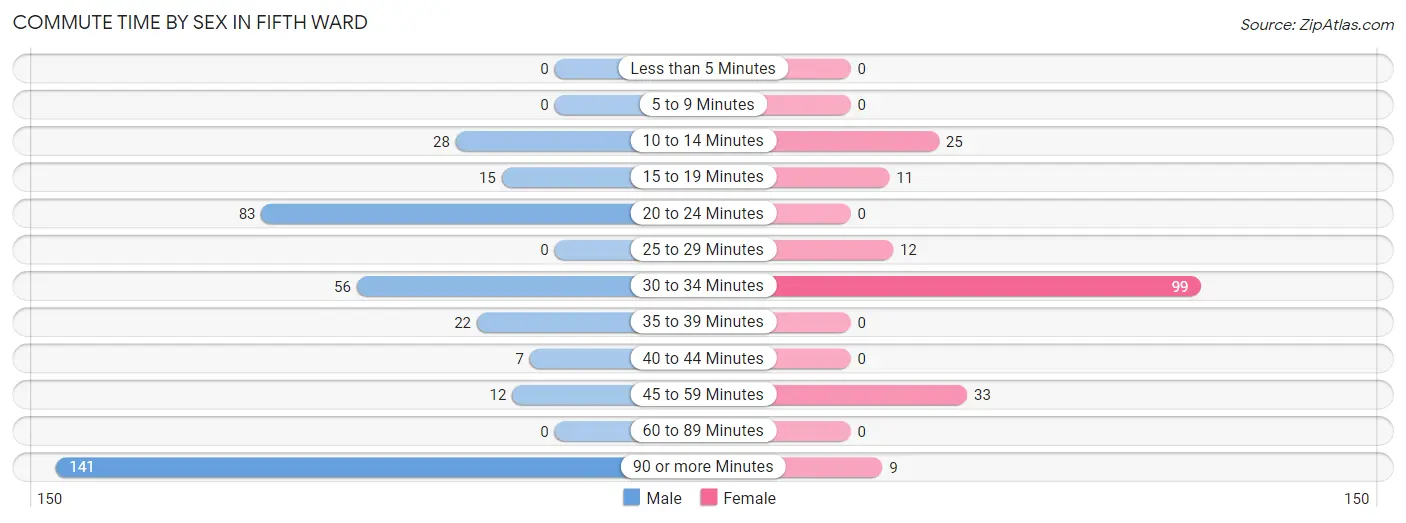
Commute Time by Sex in Fifth Ward
The most common commute times in Fifth Ward are 90 or more minutes (141 commuters, 38.7%) for males and 30 to 34 minutes (99 commuters, 52.4%) for females.
| Commute Time | Male | Female |
| Less than 5 Minutes | 0 (0.0%) | 0 (0.0%) |
| 5 to 9 Minutes | 0 (0.0%) | 0 (0.0%) |
| 10 to 14 Minutes | 28 (7.7%) | 25 (13.2%) |
| 15 to 19 Minutes | 15 (4.1%) | 11 (5.8%) |
| 20 to 24 Minutes | 83 (22.8%) | 0 (0.0%) |
| 25 to 29 Minutes | 0 (0.0%) | 12 (6.4%) |
| 30 to 34 Minutes | 56 (15.4%) | 99 (52.4%) |
| 35 to 39 Minutes | 22 (6.0%) | 0 (0.0%) |
| 40 to 44 Minutes | 7 (1.9%) | 0 (0.0%) |
| 45 to 59 Minutes | 12 (3.3%) | 33 (17.5%) |
| 60 to 89 Minutes | 0 (0.0%) | 0 (0.0%) |
| 90 or more Minutes | 141 (38.7%) | 9 (4.8%) |
Time of Departure to Work by Sex in Fifth Ward
The most frequent times of departure to work in Fifth Ward are 12:00 AM to 4:59 AM (116, 31.9%) for males and 6:30 AM to 6:59 AM (82, 43.4%) for females.
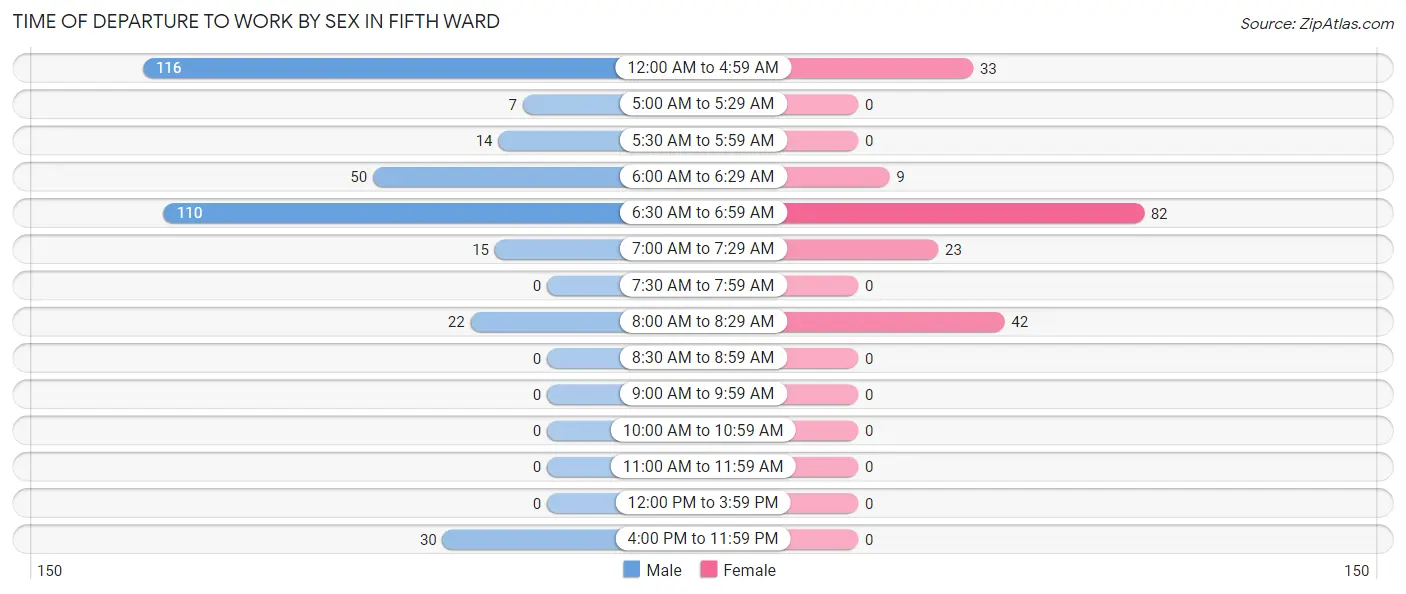
| Time of Departure | Male | Female |
| 12:00 AM to 4:59 AM | 116 (31.9%) | 33 (17.5%) |
| 5:00 AM to 5:29 AM | 7 (1.9%) | 0 (0.0%) |
| 5:30 AM to 5:59 AM | 14 (3.8%) | 0 (0.0%) |
| 6:00 AM to 6:29 AM | 50 (13.7%) | 9 (4.8%) |
| 6:30 AM to 6:59 AM | 110 (30.2%) | 82 (43.4%) |
| 7:00 AM to 7:29 AM | 15 (4.1%) | 23 (12.2%) |
| 7:30 AM to 7:59 AM | 0 (0.0%) | 0 (0.0%) |
| 8:00 AM to 8:29 AM | 22 (6.0%) | 42 (22.2%) |
| 8:30 AM to 8:59 AM | 0 (0.0%) | 0 (0.0%) |
| 9:00 AM to 9:59 AM | 0 (0.0%) | 0 (0.0%) |
| 10:00 AM to 10:59 AM | 0 (0.0%) | 0 (0.0%) |
| 11:00 AM to 11:59 AM | 0 (0.0%) | 0 (0.0%) |
| 12:00 PM to 3:59 PM | 0 (0.0%) | 0 (0.0%) |
| 4:00 PM to 11:59 PM | 30 (8.2%) | 0 (0.0%) |
| Total | 364 (100.0%) | 189 (100.0%) |
Housing Occupancy in Fifth Ward
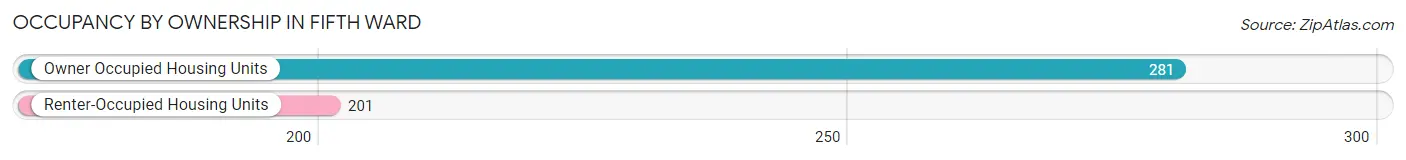
Occupancy by Ownership in Fifth Ward
Of the total 482 dwellings in Fifth Ward, owner-occupied units account for 281 (58.3%), while renter-occupied units make up 201 (41.7%).
| Occupancy | # Housing Units | % Housing Units |
| Owner Occupied Housing Units | 281 | 58.3% |
| Renter-Occupied Housing Units | 201 | 41.7% |
| Total Occupied Housing Units | 482 | 100.0% |
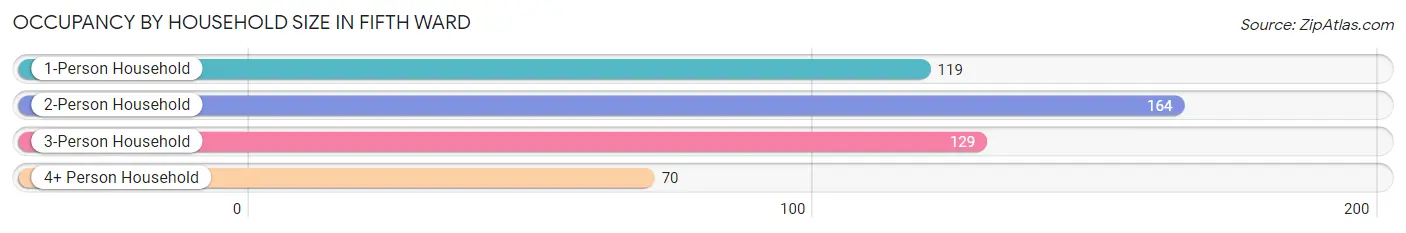
Occupancy by Household Size in Fifth Ward
| Household Size | # Housing Units | % Housing Units |
| 1-Person Household | 119 | 24.7% |
| 2-Person Household | 164 | 34.0% |
| 3-Person Household | 129 | 26.8% |
| 4+ Person Household | 70 | 14.5% |
| Total Housing Units | 482 | 100.0% |
Occupancy by Ownership by Household Size in Fifth Ward
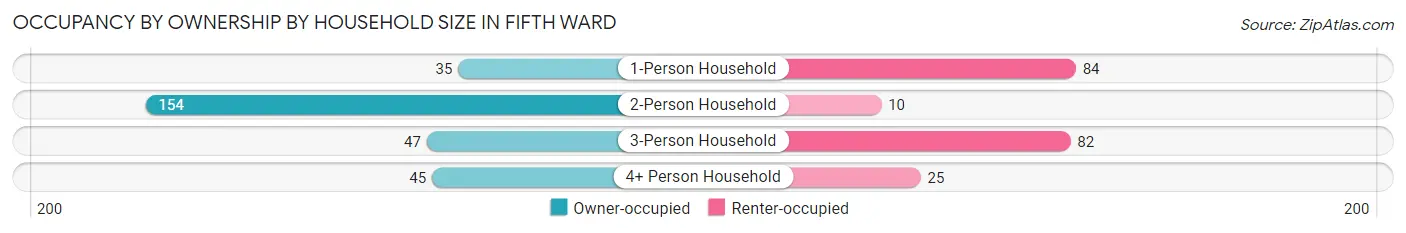
| Household Size | Owner-occupied | Renter-occupied |
| 1-Person Household | 35 (29.4%) | 84 (70.6%) |
| 2-Person Household | 154 (93.9%) | 10 (6.1%) |
| 3-Person Household | 47 (36.4%) | 82 (63.6%) |
| 4+ Person Household | 45 (64.3%) | 25 (35.7%) |
| Total Housing Units | 281 (58.3%) | 201 (41.7%) |
Occupancy by Educational Attainment in Fifth Ward
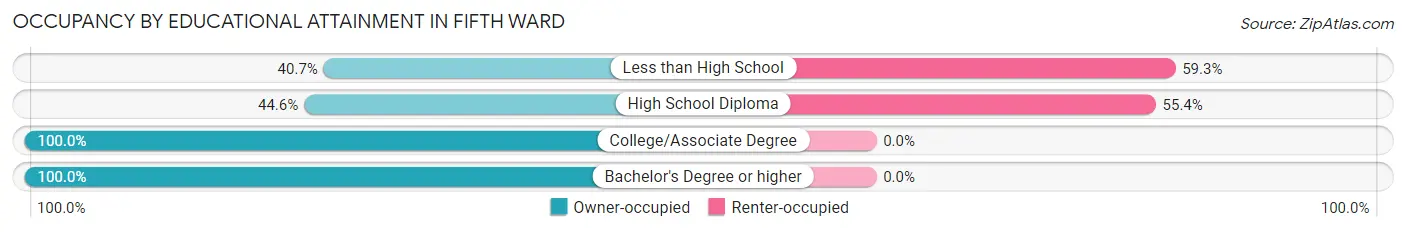
| Household Size | Owner-occupied | Renter-occupied |
| Less than High School | 57 (40.7%) | 83 (59.3%) |
| High School Diploma | 95 (44.6%) | 118 (55.4%) |
| College/Associate Degree | 47 (100.0%) | 0 (0.0%) |
| Bachelor's Degree or higher | 82 (100.0%) | 0 (0.0%) |
Occupancy by Age of Householder in Fifth Ward
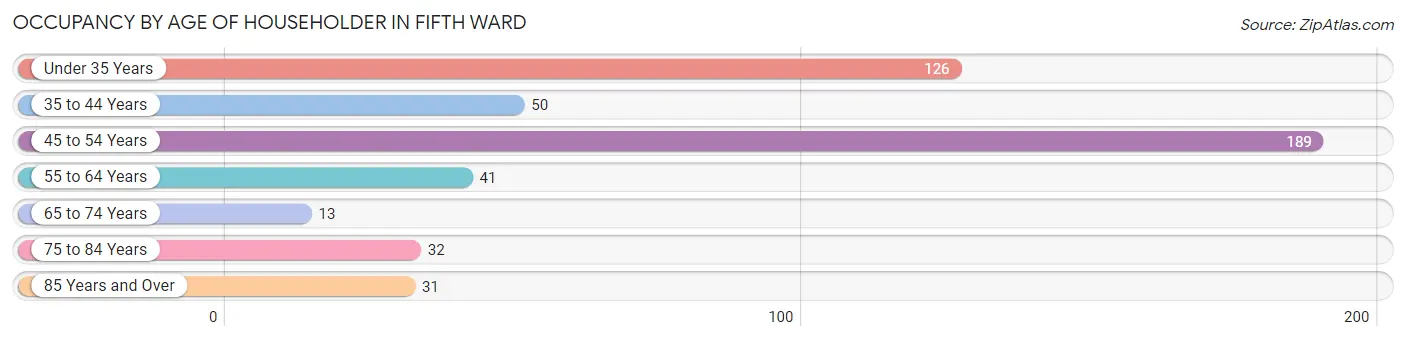
| Age Bracket | # Households | % Households |
| Under 35 Years | 126 | 26.1% |
| 35 to 44 Years | 50 | 10.4% |
| 45 to 54 Years | 189 | 39.2% |
| 55 to 64 Years | 41 | 8.5% |
| 65 to 74 Years | 13 | 2.7% |
| 75 to 84 Years | 32 | 6.6% |
| 85 Years and Over | 31 | 6.4% |
| Total | 482 | 100.0% |
Housing Finances in Fifth Ward
Median Income by Occupancy in Fifth Ward
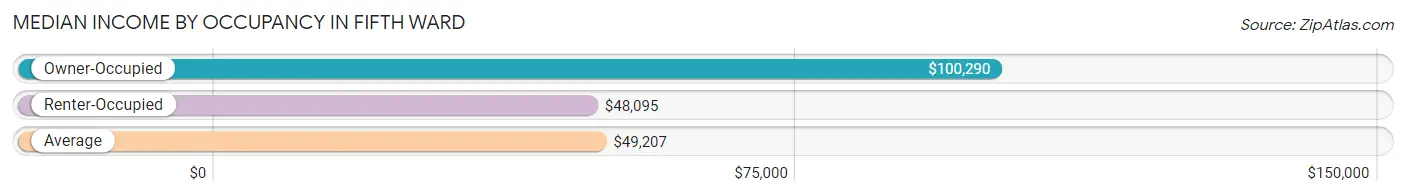
| Occupancy Type | # Households | Median Income |
| Owner-Occupied | 281 (58.3%) | $100,290 |
| Renter-Occupied | 201 (41.7%) | $48,095 |
| Average | 482 (100.0%) | $49,207 |
Occupancy by Householder Income Bracket in Fifth Ward
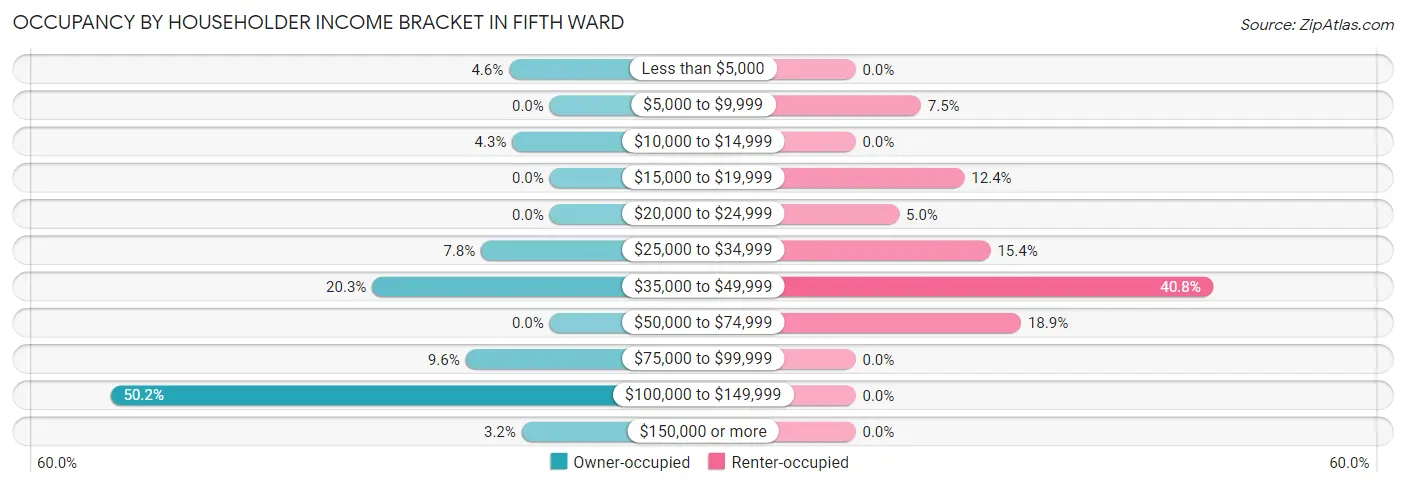
| Income Bracket | Owner-occupied | Renter-occupied |
| Less than $5,000 | 13 (4.6%) | 0 (0.0%) |
| $5,000 to $9,999 | 0 (0.0%) | 15 (7.5%) |
| $10,000 to $14,999 | 12 (4.3%) | 0 (0.0%) |
| $15,000 to $19,999 | 0 (0.0%) | 25 (12.4%) |
| $20,000 to $24,999 | 0 (0.0%) | 10 (5.0%) |
| $25,000 to $34,999 | 22 (7.8%) | 31 (15.4%) |
| $35,000 to $49,999 | 57 (20.3%) | 82 (40.8%) |
| $50,000 to $74,999 | 0 (0.0%) | 38 (18.9%) |
| $75,000 to $99,999 | 27 (9.6%) | 0 (0.0%) |
| $100,000 to $149,999 | 141 (50.2%) | 0 (0.0%) |
| $150,000 or more | 9 (3.2%) | 0 (0.0%) |
| Total | 281 (100.0%) | 201 (100.0%) |
Monthly Housing Cost Tiers in Fifth Ward
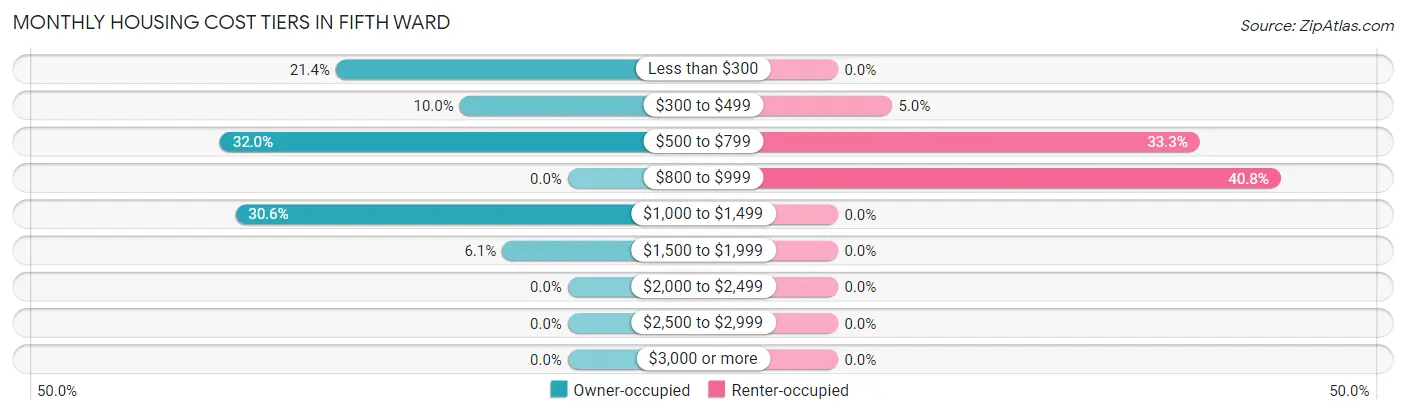
| Monthly Cost | Owner-occupied | Renter-occupied |
| Less than $300 | 60 (21.3%) | 0 (0.0%) |
| $300 to $499 | 28 (10.0%) | 10 (5.0%) |
| $500 to $799 | 90 (32.0%) | 67 (33.3%) |
| $800 to $999 | 0 (0.0%) | 82 (40.8%) |
| $1,000 to $1,499 | 86 (30.6%) | 0 (0.0%) |
| $1,500 to $1,999 | 17 (6.0%) | 0 (0.0%) |
| $2,000 to $2,499 | 0 (0.0%) | 0 (0.0%) |
| $2,500 to $2,999 | 0 (0.0%) | 0 (0.0%) |
| $3,000 or more | 0 (0.0%) | 0 (0.0%) |
| Total | 281 (100.0%) | 201 (100.0%) |
Physical Housing Characteristics in Fifth Ward
Housing Structures in Fifth Ward
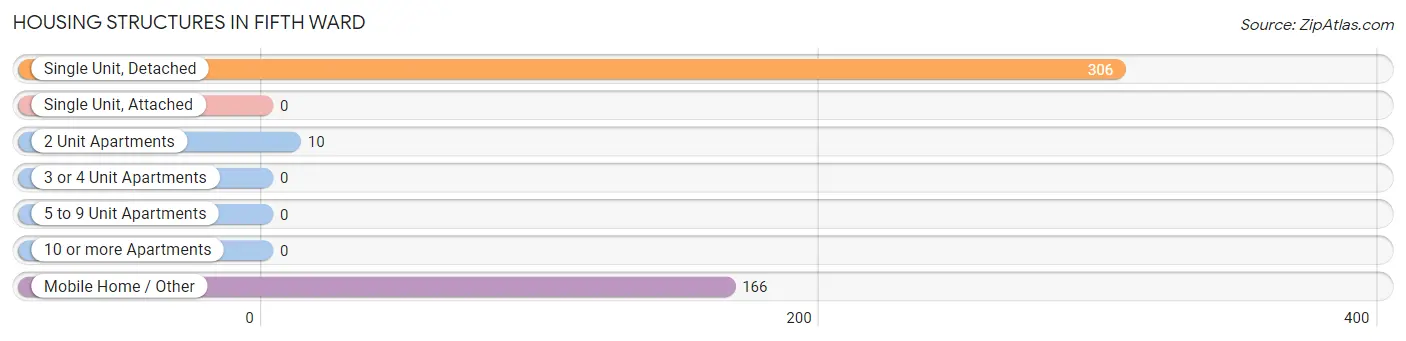
| Structure Type | # Housing Units | % Housing Units |
| Single Unit, Detached | 306 | 63.5% |
| Single Unit, Attached | 0 | 0.0% |
| 2 Unit Apartments | 10 | 2.1% |
| 3 or 4 Unit Apartments | 0 | 0.0% |
| 5 to 9 Unit Apartments | 0 | 0.0% |
| 10 or more Apartments | 0 | 0.0% |
| Mobile Home / Other | 166 | 34.4% |
| Total | 482 | 100.0% |
Housing Structures by Occupancy in Fifth Ward
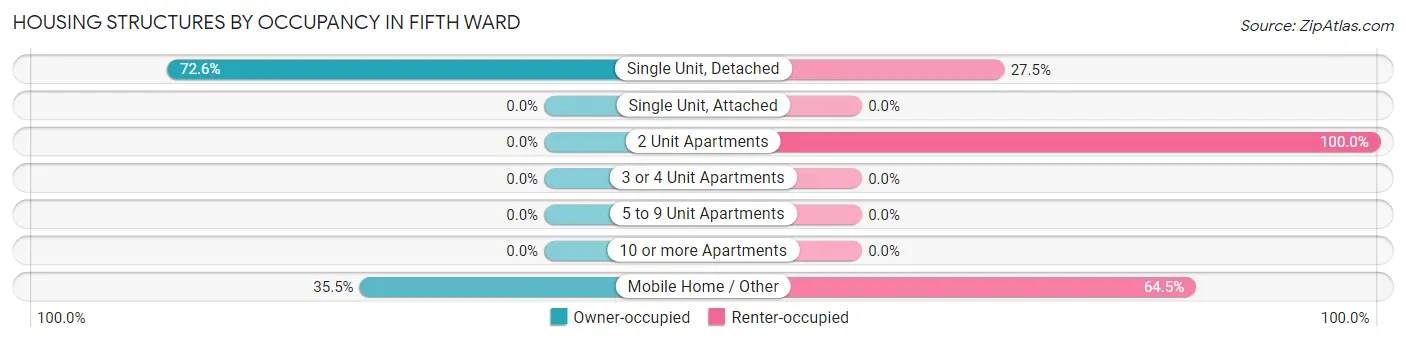
| Structure Type | Owner-occupied | Renter-occupied |
| Single Unit, Detached | 222 (72.6%) | 84 (27.5%) |
| Single Unit, Attached | 0 (0.0%) | 0 (0.0%) |
| 2 Unit Apartments | 0 (0.0%) | 10 (100.0%) |
| 3 or 4 Unit Apartments | 0 (0.0%) | 0 (0.0%) |
| 5 to 9 Unit Apartments | 0 (0.0%) | 0 (0.0%) |
| 10 or more Apartments | 0 (0.0%) | 0 (0.0%) |
| Mobile Home / Other | 59 (35.5%) | 107 (64.5%) |
| Total | 281 (58.3%) | 201 (41.7%) |
Housing Structures by Number of Rooms in Fifth Ward
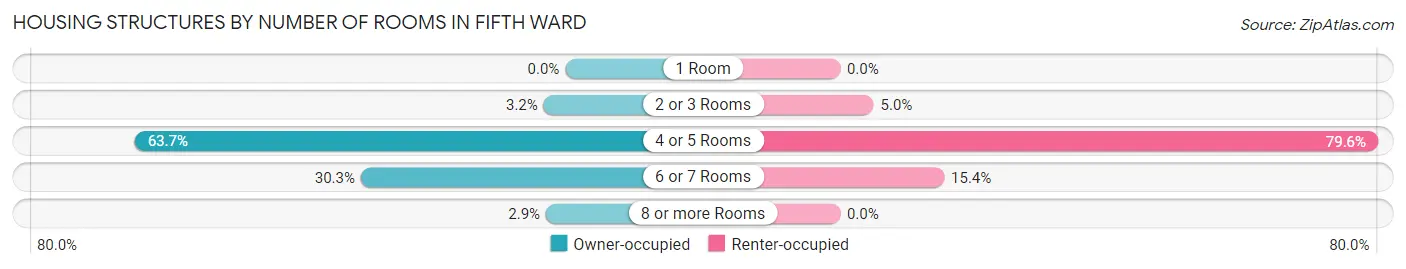
| Number of Rooms | Owner-occupied | Renter-occupied |
| 1 Room | 0 (0.0%) | 0 (0.0%) |
| 2 or 3 Rooms | 9 (3.2%) | 10 (5.0%) |
| 4 or 5 Rooms | 179 (63.7%) | 160 (79.6%) |
| 6 or 7 Rooms | 85 (30.2%) | 31 (15.4%) |
| 8 or more Rooms | 8 (2.9%) | 0 (0.0%) |
| Total | 281 (100.0%) | 201 (100.0%) |
Housing Structure by Heating Type in Fifth Ward
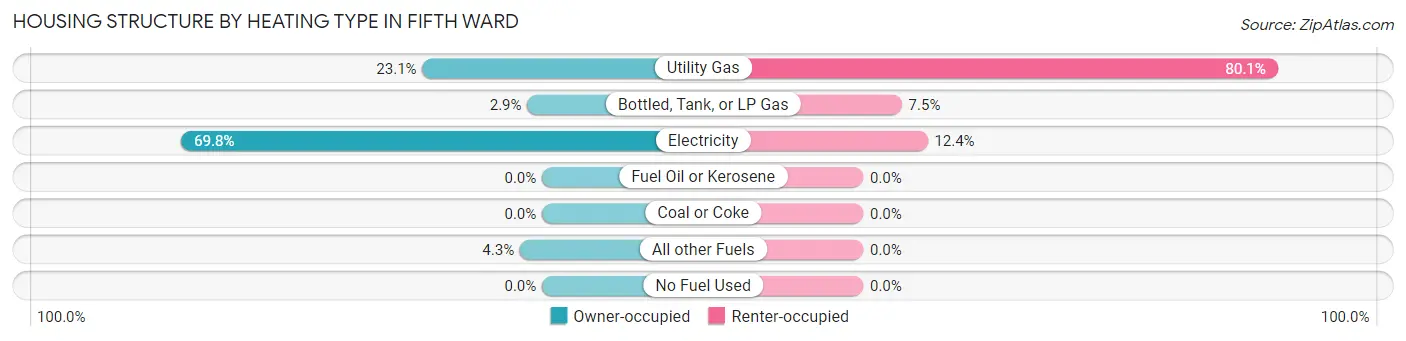
| Heating Type | Owner-occupied | Renter-occupied |
| Utility Gas | 65 (23.1%) | 161 (80.1%) |
| Bottled, Tank, or LP Gas | 8 (2.9%) | 15 (7.5%) |
| Electricity | 196 (69.8%) | 25 (12.4%) |
| Fuel Oil or Kerosene | 0 (0.0%) | 0 (0.0%) |
| Coal or Coke | 0 (0.0%) | 0 (0.0%) |
| All other Fuels | 12 (4.3%) | 0 (0.0%) |
| No Fuel Used | 0 (0.0%) | 0 (0.0%) |
| Total | 281 (100.0%) | 201 (100.0%) |
Household Vehicle Usage in Fifth Ward
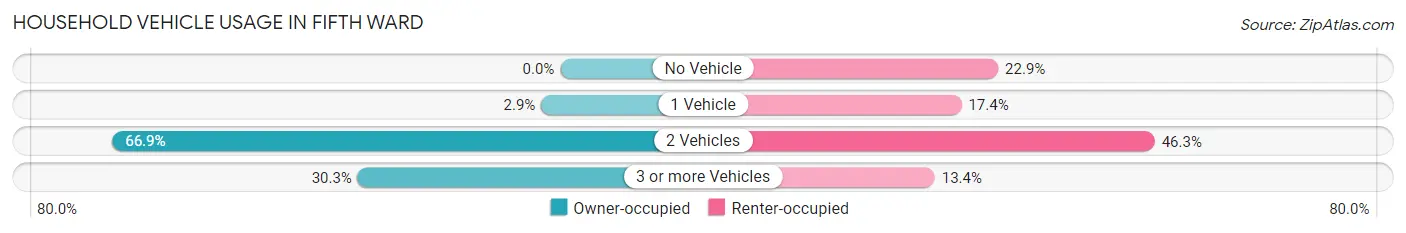
| Vehicles per Household | Owner-occupied | Renter-occupied |
| No Vehicle | 0 (0.0%) | 46 (22.9%) |
| 1 Vehicle | 8 (2.9%) | 35 (17.4%) |
| 2 Vehicles | 188 (66.9%) | 93 (46.3%) |
| 3 or more Vehicles | 85 (30.2%) | 27 (13.4%) |
| Total | 281 (100.0%) | 201 (100.0%) |
Real Estate & Mortgages in Fifth Ward
Real Estate and Mortgage Overview in Fifth Ward
| Characteristic | Without Mortgage | With Mortgage |
| Housing Units | 195 | 86 |
| Median Property Value | - | - |
| Median Household Income | - | - |
| Monthly Housing Costs | $512 | $0 |
| Real Estate Taxes | $684 | $45 |
Property Value by Mortgage Status in Fifth Ward
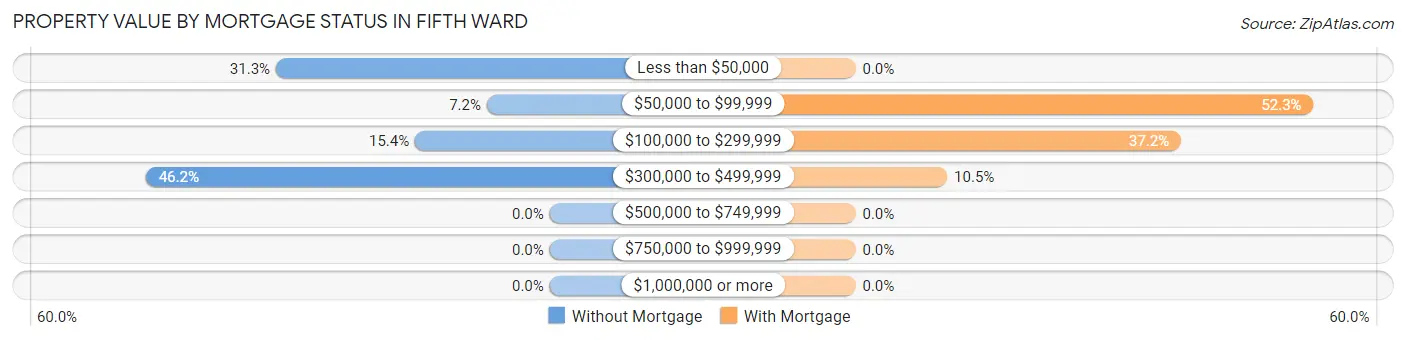
| Property Value | Without Mortgage | With Mortgage |
| Less than $50,000 | 61 (31.3%) | 0 (0.0%) |
| $50,000 to $99,999 | 14 (7.2%) | 45 (52.3%) |
| $100,000 to $299,999 | 30 (15.4%) | 32 (37.2%) |
| $300,000 to $499,999 | 90 (46.2%) | 9 (10.5%) |
| $500,000 to $749,999 | 0 (0.0%) | 0 (0.0%) |
| $750,000 to $999,999 | 0 (0.0%) | 0 (0.0%) |
| $1,000,000 or more | 0 (0.0%) | 0 (0.0%) |
| Total | 195 (100.0%) | 86 (100.0%) |
Household Income by Mortgage Status in Fifth Ward
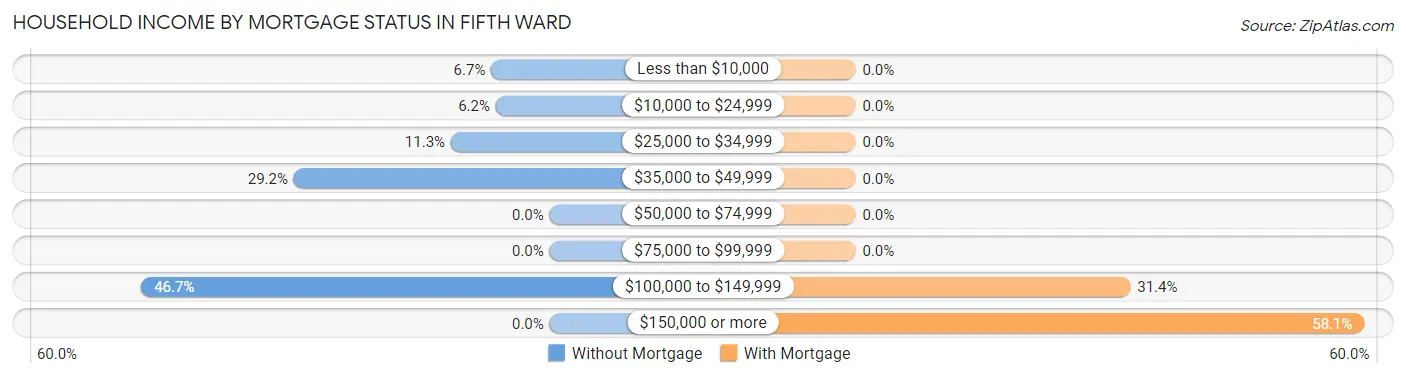
| Household Income | Without Mortgage | With Mortgage |
| Less than $10,000 | 13 (6.7%) | 0 (0.0%) |
| $10,000 to $24,999 | 12 (6.1%) | 0 (0.0%) |
| $25,000 to $34,999 | 22 (11.3%) | 0 (0.0%) |
| $35,000 to $49,999 | 57 (29.2%) | 0 (0.0%) |
| $50,000 to $74,999 | 0 (0.0%) | 0 (0.0%) |
| $75,000 to $99,999 | 0 (0.0%) | 0 (0.0%) |
| $100,000 to $149,999 | 91 (46.7%) | 27 (31.4%) |
| $150,000 or more | 0 (0.0%) | 50 (58.1%) |
| Total | 195 (100.0%) | 86 (100.0%) |
Property Value to Household Income Ratio in Fifth Ward
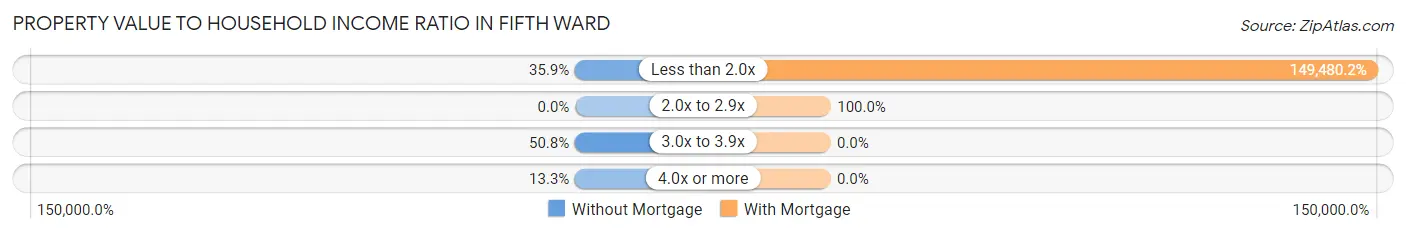
| Value-to-Income Ratio | Without Mortgage | With Mortgage |
| Less than 2.0x | 70 (35.9%) | 128,553 (149,480.2%) |
| 2.0x to 2.9x | 0 (0.0%) | 86 (100.0%) |
| 3.0x to 3.9x | 99 (50.8%) | 0 (0.0%) |
| 4.0x or more | 26 (13.3%) | 0 (0.0%) |
| Total | 195 (100.0%) | 86 (100.0%) |
Real Estate Taxes by Mortgage Status in Fifth Ward
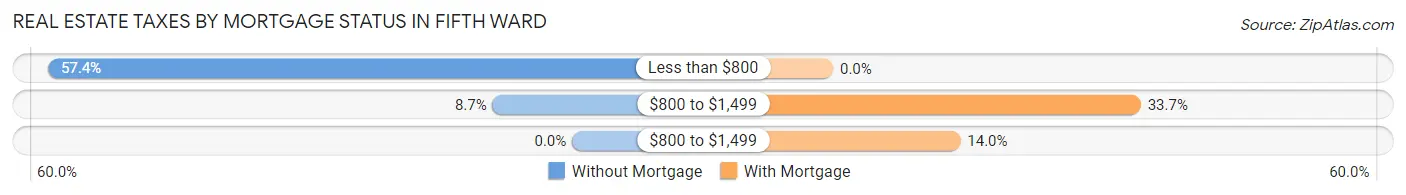
| Property Taxes | Without Mortgage | With Mortgage |
| Less than $800 | 112 (57.4%) | 0 (0.0%) |
| $800 to $1,499 | 17 (8.7%) | 29 (33.7%) |
| $800 to $1,499 | 0 (0.0%) | 12 (14.0%) |
| Total | 195 (100.0%) | 86 (100.0%) |
Health & Disability in Fifth Ward
Health Insurance Coverage by Age in Fifth Ward
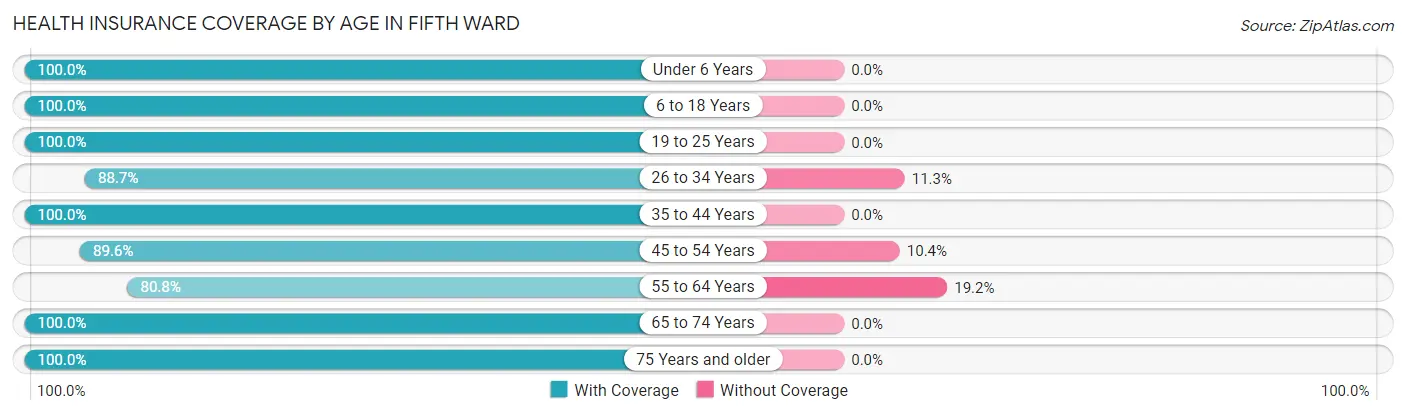
| Age Bracket | With Coverage | Without Coverage |
| Under 6 Years | 135 (100.0%) | 0 (0.0%) |
| 6 to 18 Years | 210 (100.0%) | 0 (0.0%) |
| 19 to 25 Years | 50 (100.0%) | 0 (0.0%) |
| 26 to 34 Years | 55 (88.7%) | 7 (11.3%) |
| 35 to 44 Years | 89 (100.0%) | 0 (0.0%) |
| 45 to 54 Years | 199 (89.6%) | 23 (10.4%) |
| 55 to 64 Years | 122 (80.8%) | 29 (19.2%) |
| 65 to 74 Years | 27 (100.0%) | 0 (0.0%) |
| 75 Years and older | 119 (100.0%) | 0 (0.0%) |
| Total | 1,006 (94.5%) | 59 (5.5%) |
Health Insurance Coverage by Citizenship Status in Fifth Ward
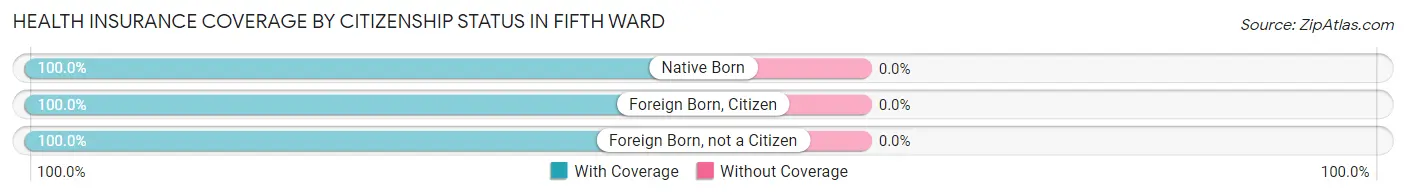
| Citizenship Status | With Coverage | Without Coverage |
| Native Born | 135 (100.0%) | 0 (0.0%) |
| Foreign Born, Citizen | 210 (100.0%) | 0 (0.0%) |
| Foreign Born, not a Citizen | 50 (100.0%) | 0 (0.0%) |
Health Insurance Coverage by Household Income in Fifth Ward
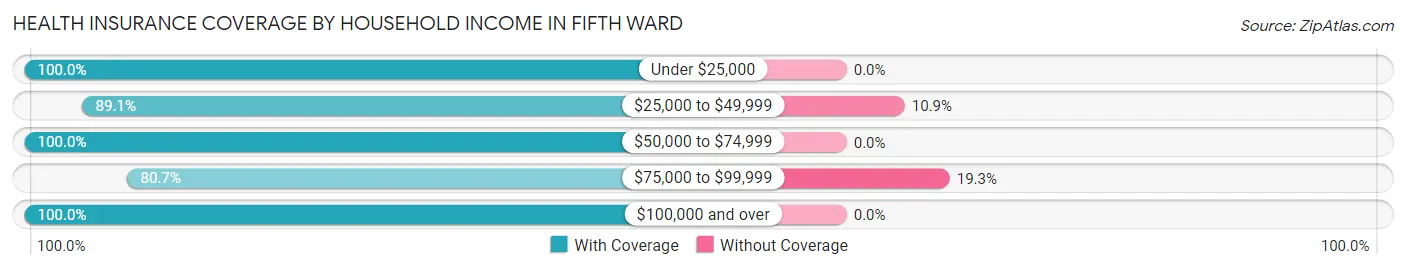
| Household Income | With Coverage | Without Coverage |
| Under $25,000 | 230 (100.0%) | 0 (0.0%) |
| $25,000 to $49,999 | 303 (89.1%) | 37 (10.9%) |
| $50,000 to $74,999 | 38 (100.0%) | 0 (0.0%) |
| $75,000 to $99,999 | 92 (80.7%) | 22 (19.3%) |
| $100,000 and over | 343 (100.0%) | 0 (0.0%) |
Public vs Private Health Insurance Coverage by Age in Fifth Ward
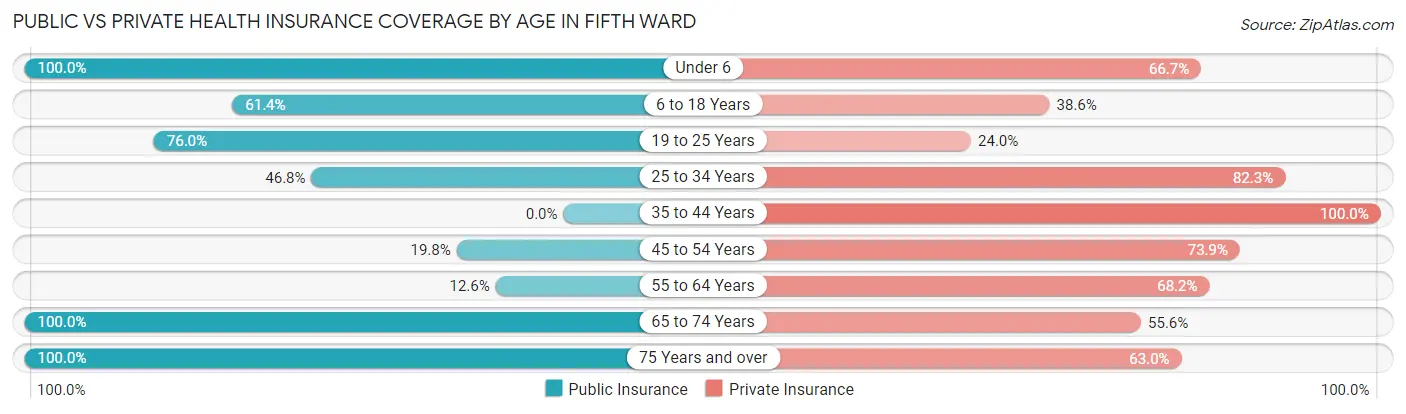
| Age Bracket | Public Insurance | Private Insurance |
| Under 6 | 135 (100.0%) | 90 (66.7%) |
| 6 to 18 Years | 129 (61.4%) | 81 (38.6%) |
| 19 to 25 Years | 38 (76.0%) | 12 (24.0%) |
| 25 to 34 Years | 29 (46.8%) | 51 (82.3%) |
| 35 to 44 Years | 0 (0.0%) | 89 (100.0%) |
| 45 to 54 Years | 44 (19.8%) | 164 (73.9%) |
| 55 to 64 Years | 19 (12.6%) | 103 (68.2%) |
| 65 to 74 Years | 27 (100.0%) | 15 (55.6%) |
| 75 Years and over | 119 (100.0%) | 75 (63.0%) |
| Total | 540 (50.7%) | 680 (63.8%) |
Disability Status by Sex by Age in Fifth Ward
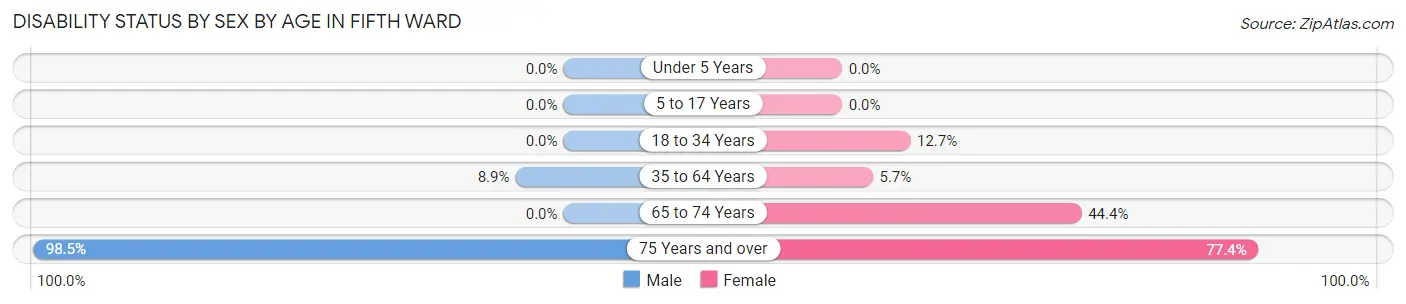
| Age Bracket | Male | Female |
| Under 5 Years | 0 (0.0%) | 0 (0.0%) |
| 5 to 17 Years | 0 (0.0%) | 0 (0.0%) |
| 18 to 34 Years | 0 (0.0%) | 10 (12.7%) |
| 35 to 64 Years | 24 (8.9%) | 11 (5.7%) |
| 65 to 74 Years | 0 (0.0%) | 12 (44.4%) |
| 75 Years and over | 65 (98.5%) | 41 (77.4%) |
Disability Class by Sex by Age in Fifth Ward
Disability Class: Hearing Difficulty
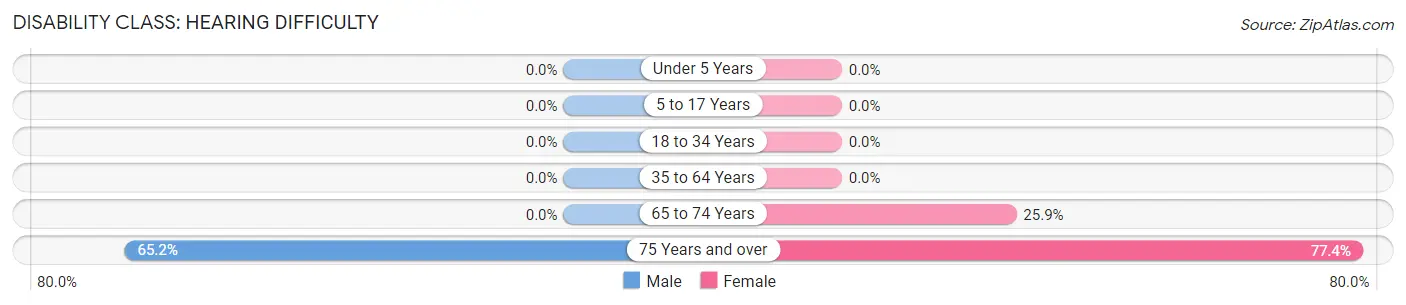
| Age Bracket | Male | Female |
| Under 5 Years | 0 (0.0%) | 0 (0.0%) |
| 5 to 17 Years | 0 (0.0%) | 0 (0.0%) |
| 18 to 34 Years | 0 (0.0%) | 0 (0.0%) |
| 35 to 64 Years | 0 (0.0%) | 0 (0.0%) |
| 65 to 74 Years | 0 (0.0%) | 7 (25.9%) |
| 75 Years and over | 43 (65.1%) | 41 (77.4%) |
Disability Class: Vision Difficulty
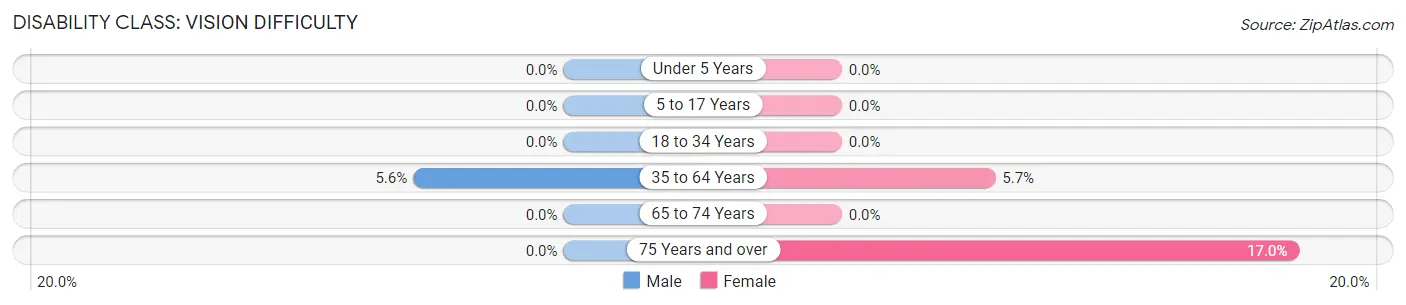
| Age Bracket | Male | Female |
| Under 5 Years | 0 (0.0%) | 0 (0.0%) |
| 5 to 17 Years | 0 (0.0%) | 0 (0.0%) |
| 18 to 34 Years | 0 (0.0%) | 0 (0.0%) |
| 35 to 64 Years | 15 (5.6%) | 11 (5.7%) |
| 65 to 74 Years | 0 (0.0%) | 0 (0.0%) |
| 75 Years and over | 0 (0.0%) | 9 (17.0%) |
Disability Class: Cognitive Difficulty
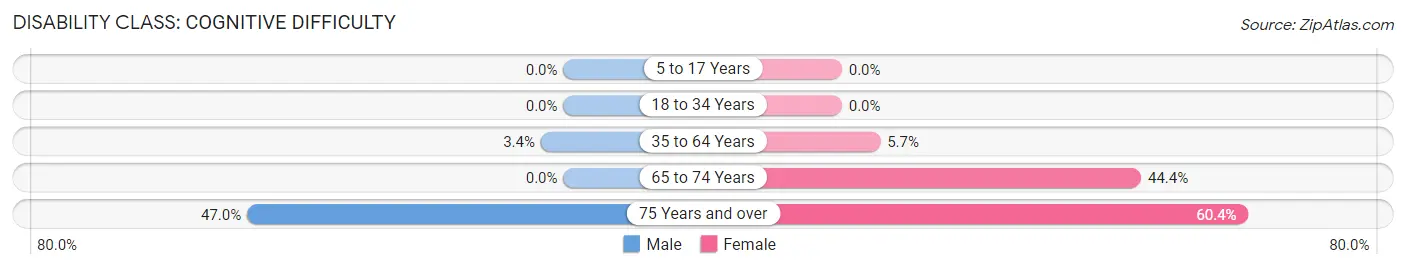
| Age Bracket | Male | Female |
| 5 to 17 Years | 0 (0.0%) | 0 (0.0%) |
| 18 to 34 Years | 0 (0.0%) | 0 (0.0%) |
| 35 to 64 Years | 9 (3.4%) | 11 (5.7%) |
| 65 to 74 Years | 0 (0.0%) | 12 (44.4%) |
| 75 Years and over | 31 (47.0%) | 32 (60.4%) |
Disability Class: Ambulatory Difficulty
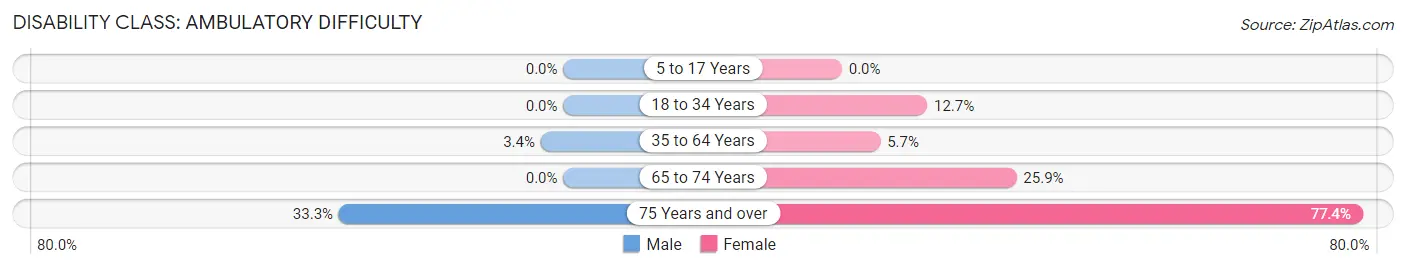
| Age Bracket | Male | Female |
| 5 to 17 Years | 0 (0.0%) | 0 (0.0%) |
| 18 to 34 Years | 0 (0.0%) | 10 (12.7%) |
| 35 to 64 Years | 9 (3.4%) | 11 (5.7%) |
| 65 to 74 Years | 0 (0.0%) | 7 (25.9%) |
| 75 Years and over | 22 (33.3%) | 41 (77.4%) |
Disability Class: Self-Care Difficulty
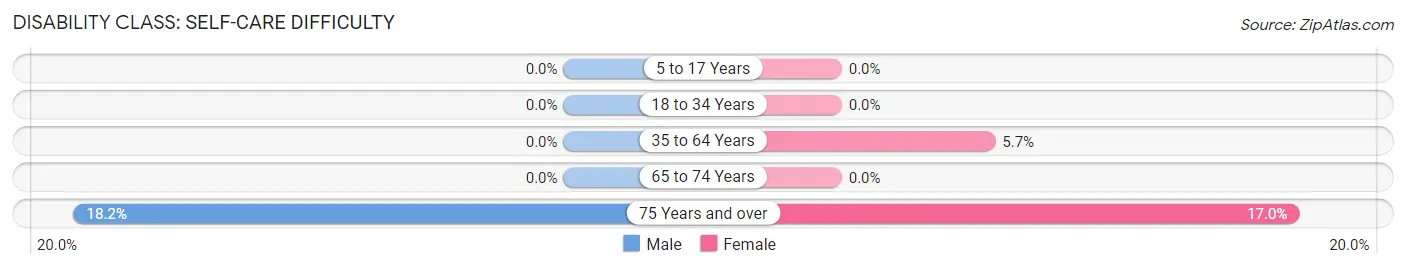
| Age Bracket | Male | Female |
| 5 to 17 Years | 0 (0.0%) | 0 (0.0%) |
| 18 to 34 Years | 0 (0.0%) | 0 (0.0%) |
| 35 to 64 Years | 0 (0.0%) | 11 (5.7%) |
| 65 to 74 Years | 0 (0.0%) | 0 (0.0%) |
| 75 Years and over | 12 (18.2%) | 9 (17.0%) |
Technology Access in Fifth Ward
Computing Device Access in Fifth Ward
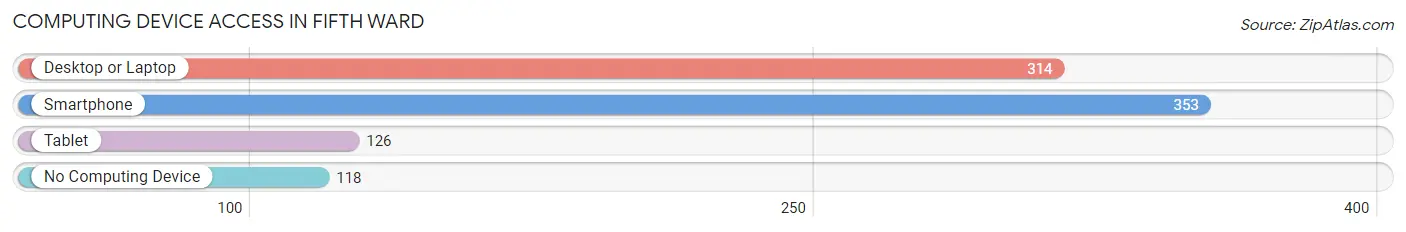
| Device Type | # Households | % Households |
| Desktop or Laptop | 314 | 65.1% |
| Smartphone | 353 | 73.2% |
| Tablet | 126 | 26.1% |
| No Computing Device | 118 | 24.5% |
| Total | 482 | 100.0% |
Internet Access in Fifth Ward
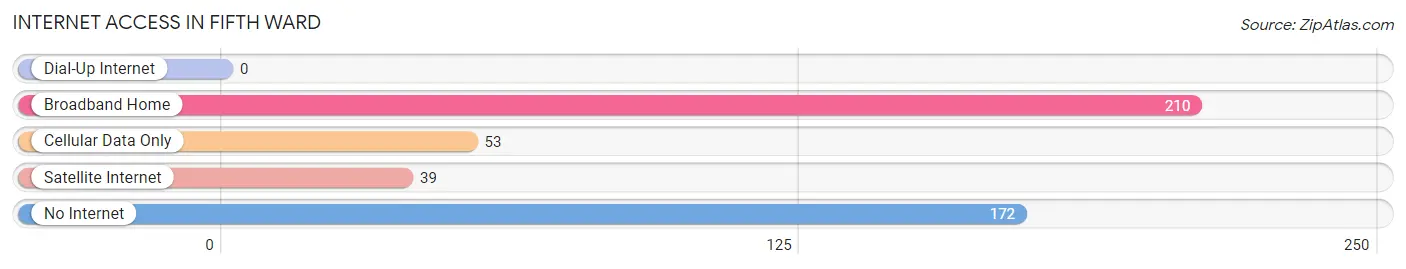
| Internet Type | # Households | % Households |
| Dial-Up Internet | 0 | 0.0% |
| Broadband Home | 210 | 43.6% |
| Cellular Data Only | 53 | 11.0% |
| Satellite Internet | 39 | 8.1% |
| No Internet | 172 | 35.7% |
| Total | 482 | 100.0% |
Fifth Ward Summary
The Fifth Ward is a neighborhood located in the northeastern part of Houston, Texas. It is bounded by the Houston Ship Channel to the south, the Eastex Freeway to the west, the North Freeway to the north, and the East Loop to the east. The Fifth Ward is one of the oldest neighborhoods in Houston and has a rich history, geography, economy, and demographics.
History
The Fifth Ward was originally part of the Allen Ranch, which was established in 1824 by John Kirby Allen and Augustus Chapman Allen. The Allen brothers were two of the founders of the city of Houston. The Fifth Ward was established in 1866 when the city of Houston annexed the area. The area was originally a rural farming community, but it began to develop into an urban neighborhood in the late 19th century. The area was home to many African American families who had migrated to Houston from other parts of the South.
The Fifth Ward was a center of African American culture and politics in the early 20th century. It was home to many prominent African American leaders, including civil rights activists, politicians, and business owners. The Fifth Ward was also home to many jazz clubs and other entertainment venues.
Geography
The Fifth Ward is located in the northeastern part of Houston, Texas. It is bounded by the Houston Ship Channel to the south, the Eastex Freeway to the west, the North Freeway to the north, and the East Loop to the east. The Fifth Ward is located in Harris County and is part of the Houston-Sugar Land-Baytown metropolitan area.
The Fifth Ward is a predominantly residential neighborhood. It is home to many single-family homes, as well as some apartment complexes and townhomes. The area is also home to several parks, including Fifth Ward Park, which is located on the east side of the neighborhood.
Economy
The Fifth Ward has a diverse economy. The area is home to many small businesses, including restaurants, retail stores, and service providers. The area is also home to several industrial businesses, including a steel mill and a chemical plant.
The Fifth Ward is also home to several educational institutions, including the University of Houston-Downtown, Houston Community College, and Texas Southern University. The area is also home to several healthcare facilities, including the Fifth Ward Health Center and the Fifth Ward Multi-Service Center.
Demographics
The Fifth Ward is a predominantly African American neighborhood. According to the 2010 U.S. Census, the population of the Fifth Ward was 28,945, of which 87.3% were African American, 8.2% were Hispanic or Latino, and 2.2% were White. The median household income in the Fifth Ward was $25,945, and the median home value was $77,000.
Conclusion
The Fifth Ward is a historically significant neighborhood located in the northeastern part of Houston, Texas. It has a rich history, geography, economy, and demographics. The area is home to many small businesses, educational institutions, and healthcare facilities. The Fifth Ward is a predominantly African American neighborhood, with a median household income of $25,945 and a median home value of $77,000.
Common Questions
What is Per Capita Income in Fifth Ward?
Per Capita income in Fifth Ward is $27,354.
What is the Median Household income in Fifth Ward?
Median Household Income in Fifth Ward is $49,207.
What is Inequality or Gini Index in Fifth Ward?
Inequality or Gini Index in Fifth Ward is 0.39.
What is the Total Population of Fifth Ward?
Total Population of Fifth Ward is 1,147.
What is the Total Male Population of Fifth Ward?
Total Male Population of Fifth Ward is 664.
What is the Total Female Population of Fifth Ward?
Total Female Population of Fifth Ward is 483.
What is the Ratio of Males per 100 Females in Fifth Ward?
There are 137.47 Males per 100 Females in Fifth Ward.
What is the Ratio of Females per 100 Males in Fifth Ward?
There are 72.74 Females per 100 Males in Fifth Ward.
What is the Median Population Age in Fifth Ward?
Median Population Age in Fifth Ward is 43.5 Years.
What is the Average Family Size in Fifth Ward
Average Family Size in Fifth Ward is 2.7 People.
What is the Average Household Size in Fifth Ward
Average Household Size in Fifth Ward is 2.4 People.
How Large is the Labor Force in Fifth Ward?
There are 609 People in the Labor Forcein in Fifth Ward.
What is the Percentage of People in the Labor Force in Fifth Ward?
74.2% of People are in the Labor Force in Fifth Ward.
What is the Unemployment Rate in Fifth Ward?
Unemployment Rate in Fifth Ward is 5.3%.