Ehrenberg, AZ Map & Demographics
Ehrenberg Map
Ehrenberg Overview
$22,260
PER CAPITA INCOME
$37,180
AVG HOUSEHOLD INCOME
0.36
INEQUALITY / GINI INDEX
1,012
TOTAL POPULATION
531
MALE POPULATION
481
FEMALE POPULATION
110.40
MALES / 100 FEMALES
90.58
FEMALES / 100 MALES
30.4
MEDIAN AGE
1.6
AVG FAMILY SIZE
1.6
AVG HOUSEHOLD SIZE
423
LABOR FORCE [ PEOPLE ]
50.9%
PERCENT IN LABOR FORCE
9.7%
UNEMPLOYMENT RATE
Ehrenberg Zip Codes
Ehrenberg Area Codes
Income in Ehrenberg
Income Overview in Ehrenberg
| Characteristic | Number | Measure |
| Per Capita Income | 1,012 | $22,260 |
| Median Family Income | 350 | $0 |
| Mean Family Income | 350 | $33,494 |
| Median Household Income | 621 | $37,180 |
| Mean Household Income | 621 | $42,731 |
| Income Deficit | 350 | $0 |
| Wage / Income Gap (%) | 1,012 | 0.00% |
| Wage / Income Gap ($) | 1,012 | 100.00¢ per $1 |
| Gini / Inequality Index | 1,012 | 0.36 |
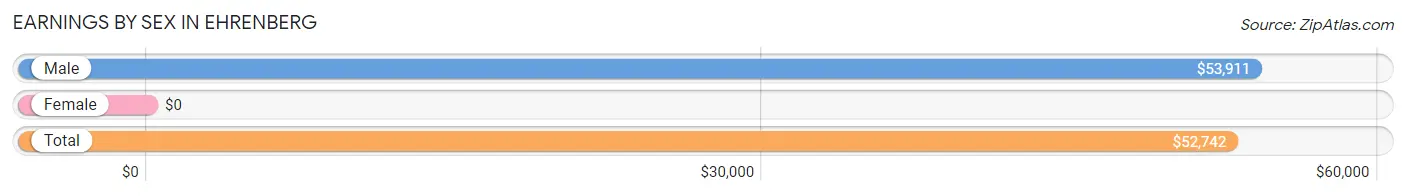
Earnings by Sex in Ehrenberg
| Sex | Number | Average Earnings |
| Male | 331 (82.8%) | $53,911 |
| Female | 69 (17.2%) | $0 |
| Total | 400 (100.0%) | $52,742 |
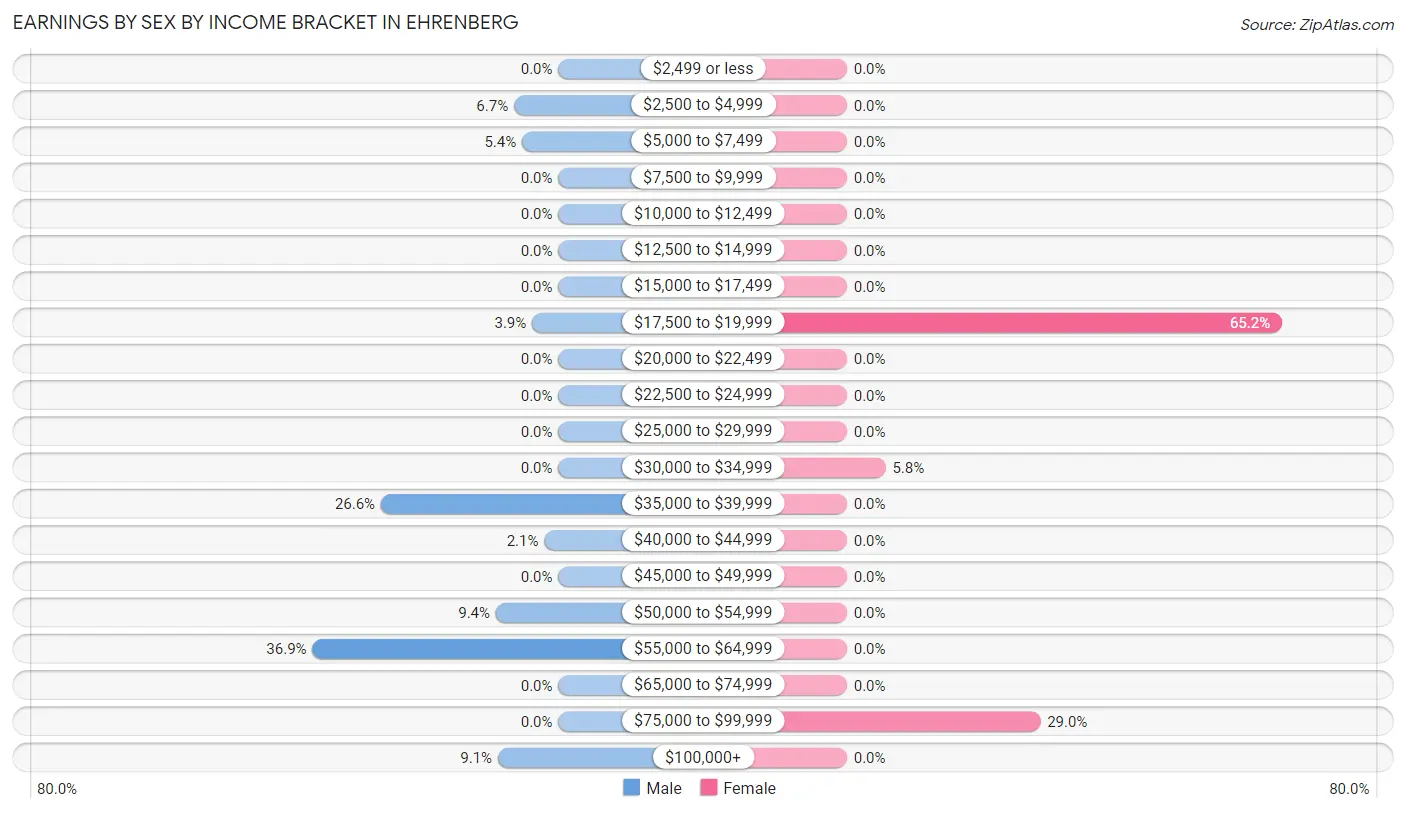
Earnings by Sex by Income Bracket in Ehrenberg
The most common earnings brackets in Ehrenberg are $55,000 to $64,999 for men (122 | 36.9%) and $17,500 to $19,999 for women (45 | 65.2%).
| Income | Male | Female |
| $2,499 or less | 0 (0.0%) | 0 (0.0%) |
| $2,500 to $4,999 | 22 (6.7%) | 0 (0.0%) |
| $5,000 to $7,499 | 18 (5.4%) | 0 (0.0%) |
| $7,500 to $9,999 | 0 (0.0%) | 0 (0.0%) |
| $10,000 to $12,499 | 0 (0.0%) | 0 (0.0%) |
| $12,500 to $14,999 | 0 (0.0%) | 0 (0.0%) |
| $15,000 to $17,499 | 0 (0.0%) | 0 (0.0%) |
| $17,500 to $19,999 | 13 (3.9%) | 45 (65.2%) |
| $20,000 to $22,499 | 0 (0.0%) | 0 (0.0%) |
| $22,500 to $24,999 | 0 (0.0%) | 0 (0.0%) |
| $25,000 to $29,999 | 0 (0.0%) | 0 (0.0%) |
| $30,000 to $34,999 | 0 (0.0%) | 4 (5.8%) |
| $35,000 to $39,999 | 88 (26.6%) | 0 (0.0%) |
| $40,000 to $44,999 | 7 (2.1%) | 0 (0.0%) |
| $45,000 to $49,999 | 0 (0.0%) | 0 (0.0%) |
| $50,000 to $54,999 | 31 (9.4%) | 0 (0.0%) |
| $55,000 to $64,999 | 122 (36.9%) | 0 (0.0%) |
| $65,000 to $74,999 | 0 (0.0%) | 0 (0.0%) |
| $75,000 to $99,999 | 0 (0.0%) | 20 (29.0%) |
| $100,000+ | 30 (9.1%) | 0 (0.0%) |
| Total | 331 (100.0%) | 69 (100.0%) |
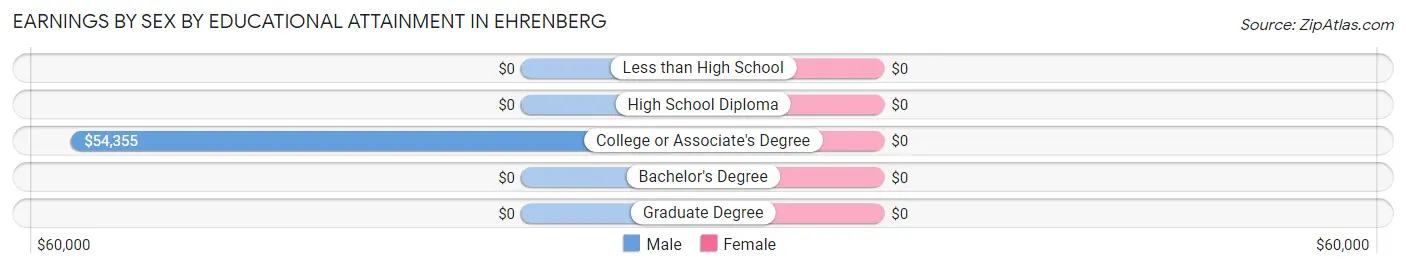
Earnings by Sex by Educational Attainment in Ehrenberg
| Educational Attainment | Male Income | Female Income |
| Less than High School | - | - |
| High School Diploma | - | - |
| College or Associate's Degree | $54,355 | $0 |
| Bachelor's Degree | - | - |
| Graduate Degree | - | - |
| Total | $54,395 | $0 |
Family Income in Ehrenberg
Family Income Brackets in Ehrenberg
According to the Ehrenberg family income data, there are 123 families falling into the $15,000 to $24,999 income range, which is the most common income bracket and makes up 35.1% of all families.
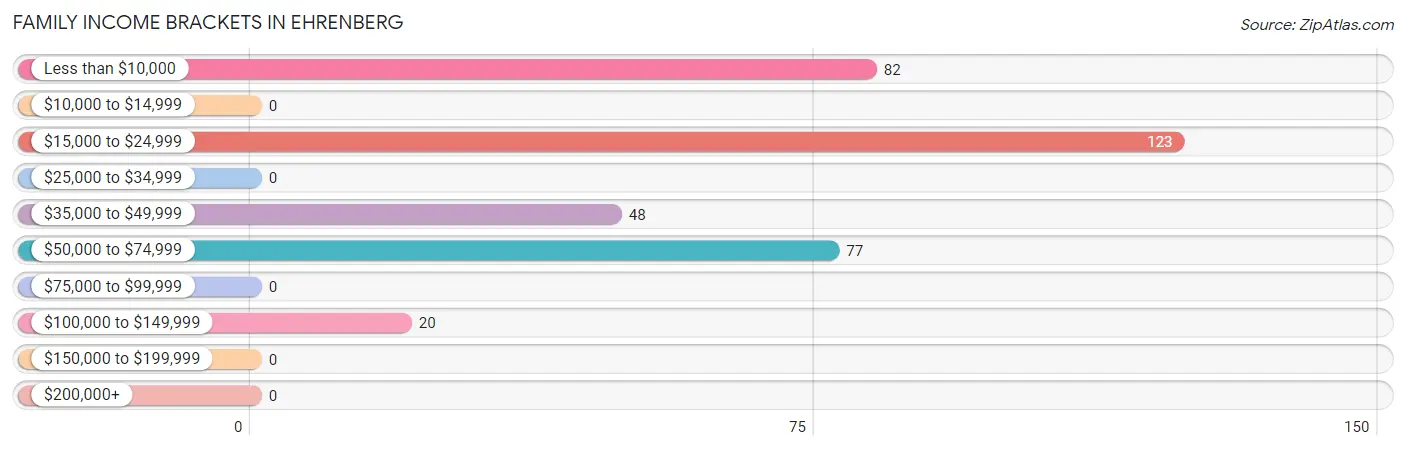
| Income Bracket | # Families | % Families |
| Less than $10,000 | 82 | 23.4% |
| $10,000 to $14,999 | 0 | 0.0% |
| $15,000 to $24,999 | 123 | 35.1% |
| $25,000 to $34,999 | 0 | 0.0% |
| $35,000 to $49,999 | 48 | 13.7% |
| $50,000 to $74,999 | 77 | 22.0% |
| $75,000 to $99,999 | 0 | 0.0% |
| $100,000 to $149,999 | 20 | 5.7% |
| $150,000 to $199,999 | 0 | 0.0% |
| $200,000+ | 0 | 0.0% |
Family Income by Famaliy Size in Ehrenberg
2-person families (212 | 60.6%) account for the highest median family income in Ehrenberg with $45,677 per family, while 2-person families (212 | 60.6%) have the highest median income of $22,838 per family member.
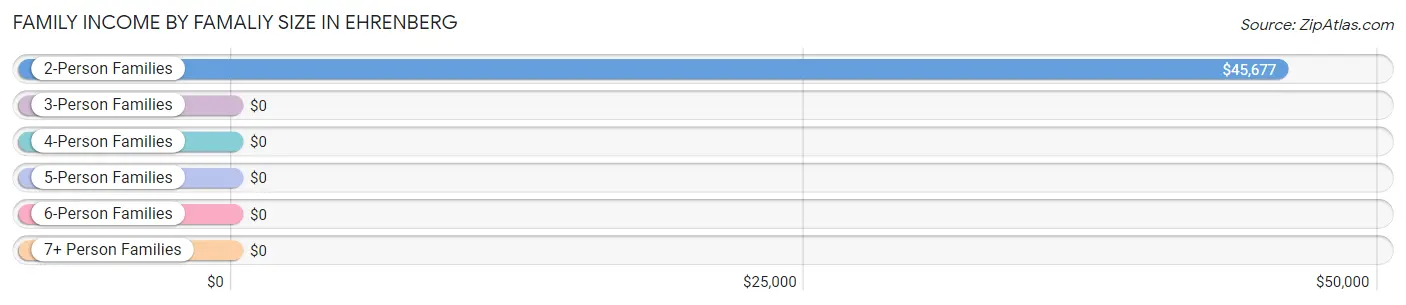
| Income Bracket | # Families | Median Income |
| 2-Person Families | 212 (60.6%) | $45,677 |
| 3-Person Families | 108 (30.9%) | $0 |
| 4-Person Families | 30 (8.6%) | $0 |
| 5-Person Families | 0 (0.0%) | $0 |
| 6-Person Families | 0 (0.0%) | $0 |
| 7+ Person Families | 0 (0.0%) | $0 |
| Total | 350 (100.0%) | $0 |
Family Income by Number of Earners in Ehrenberg
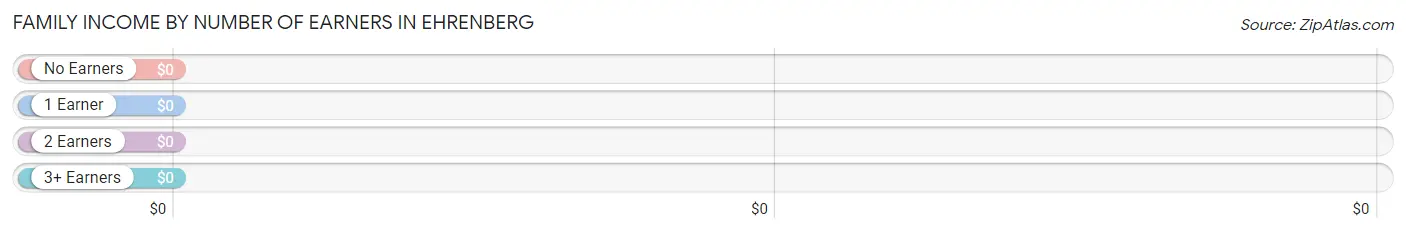
| Number of Earners | # Families | Median Income |
| No Earners | 178 (50.9%) | $0 |
| 1 Earner | 139 (39.7%) | $0 |
| 2 Earners | 33 (9.4%) | $0 |
| 3+ Earners | 0 (0.0%) | $0 |
| Total | 350 (100.0%) | $0 |
Household Income in Ehrenberg
Household Income Brackets in Ehrenberg
With 184 households falling in the category, the $50,000 to $74,999 income range is the most frequent in Ehrenberg, accounting for 29.6% of all households.
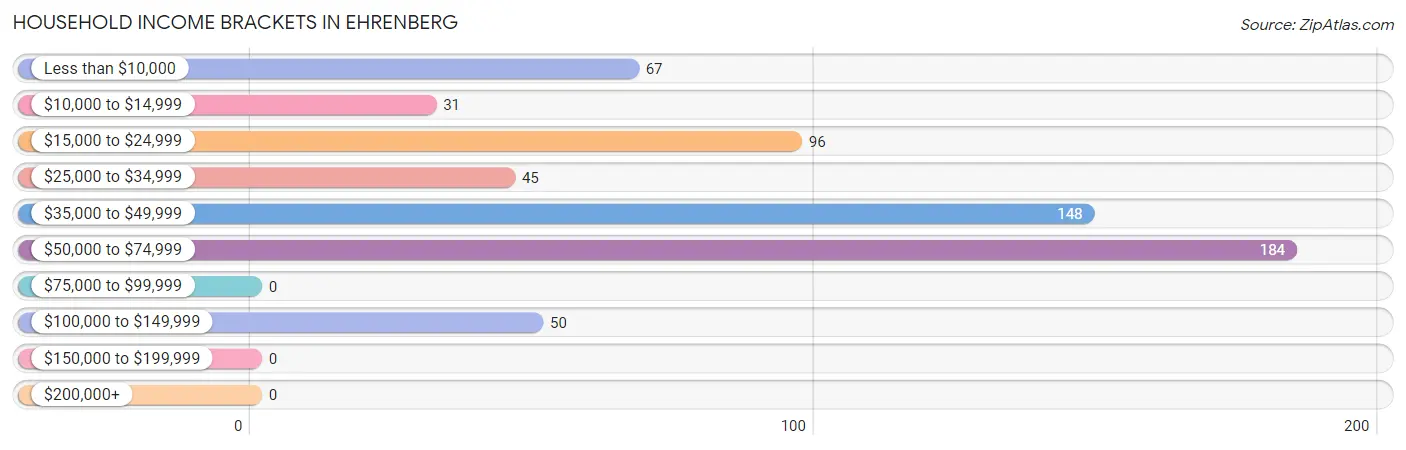
| Income Bracket | # Households | % Households |
| Less than $10,000 | 67 | 10.8% |
| $10,000 to $14,999 | 31 | 5.0% |
| $15,000 to $24,999 | 96 | 15.5% |
| $25,000 to $34,999 | 45 | 7.2% |
| $35,000 to $49,999 | 148 | 23.8% |
| $50,000 to $74,999 | 184 | 29.6% |
| $75,000 to $99,999 | 0 | 0.0% |
| $100,000 to $149,999 | 50 | 8.1% |
| $150,000 to $199,999 | 0 | 0.0% |
| $200,000+ | 0 | 0.0% |
Household Income by Householder Age in Ehrenberg
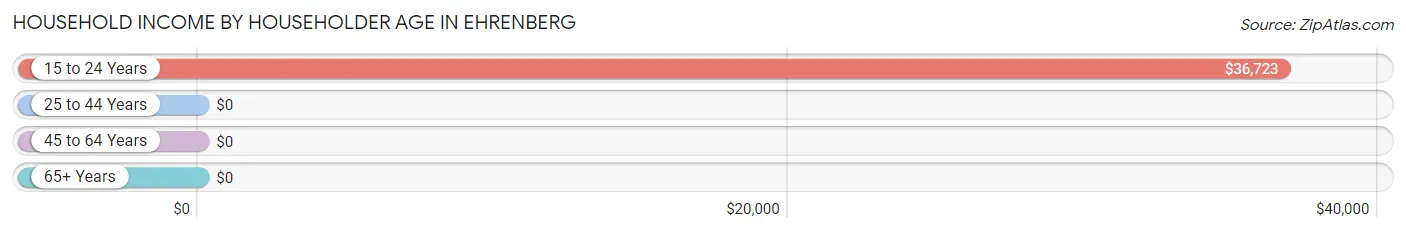
The median household income in Ehrenberg is $37,180, with the highest median household income of $36,723 found in the 15 to 24 years age bracket for the primary householder. A total of 203 households (32.7%) fall into this category. Meanwhile, the 25 to 44 years age bracket for the primary householder has the lowest median household income of $0, with 107 households (17.2%) in this group.
| Income Bracket | # Households | Median Income |
| 15 to 24 Years | 203 (32.7%) | $36,723 |
| 25 to 44 Years | 107 (17.2%) | $0 |
| 45 to 64 Years | 81 (13.0%) | $0 |
| 65+ Years | 230 (37.0%) | $0 |
| Total | 621 (100.0%) | $37,180 |
Poverty in Ehrenberg
Income Below Poverty by Sex and Age in Ehrenberg
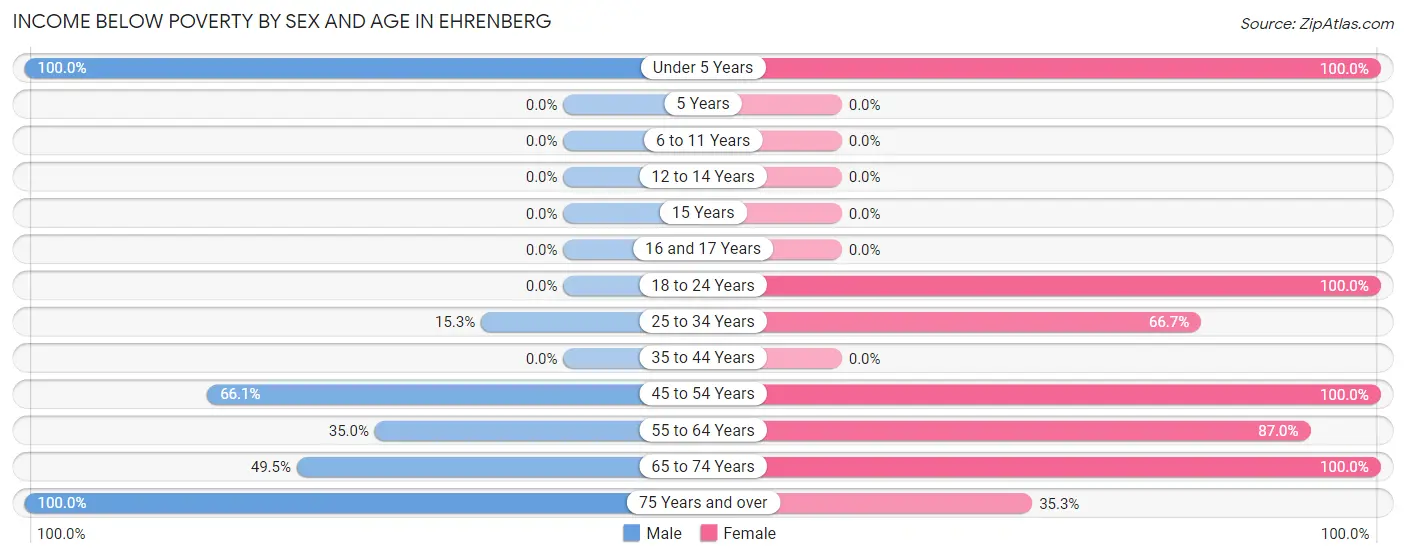
With 27.2% poverty level for males and 73.4% for females among the residents of Ehrenberg, under 5 year old males and under 5 year old females are the most vulnerable to poverty, with 20 males (100.0%) and 56 females (100.0%) in their respective age groups living below the poverty level.
| Age Bracket | Male | Female |
| Under 5 Years | 20 (100.0%) | 56 (100.0%) |
| 5 Years | 0 (0.0%) | 0 (0.0%) |
| 6 to 11 Years | 0 (0.0%) | 0 (0.0%) |
| 12 to 14 Years | 0 (0.0%) | 0 (0.0%) |
| 15 Years | 0 (0.0%) | 0 (0.0%) |
| 16 and 17 Years | 0 (0.0%) | 0 (0.0%) |
| 18 to 24 Years | 0 (0.0%) | 127 (100.0%) |
| 25 to 34 Years | 11 (15.3%) | 8 (66.7%) |
| 35 to 44 Years | 0 (0.0%) | 0 (0.0%) |
| 45 to 54 Years | 39 (66.1%) | 30 (100.0%) |
| 55 to 64 Years | 14 (35.0%) | 20 (87.0%) |
| 65 to 74 Years | 48 (49.5%) | 24 (100.0%) |
| 75 Years and over | 4 (100.0%) | 47 (35.3%) |
| Total | 136 (27.2%) | 312 (73.4%) |
Income Above Poverty by Sex and Age in Ehrenberg
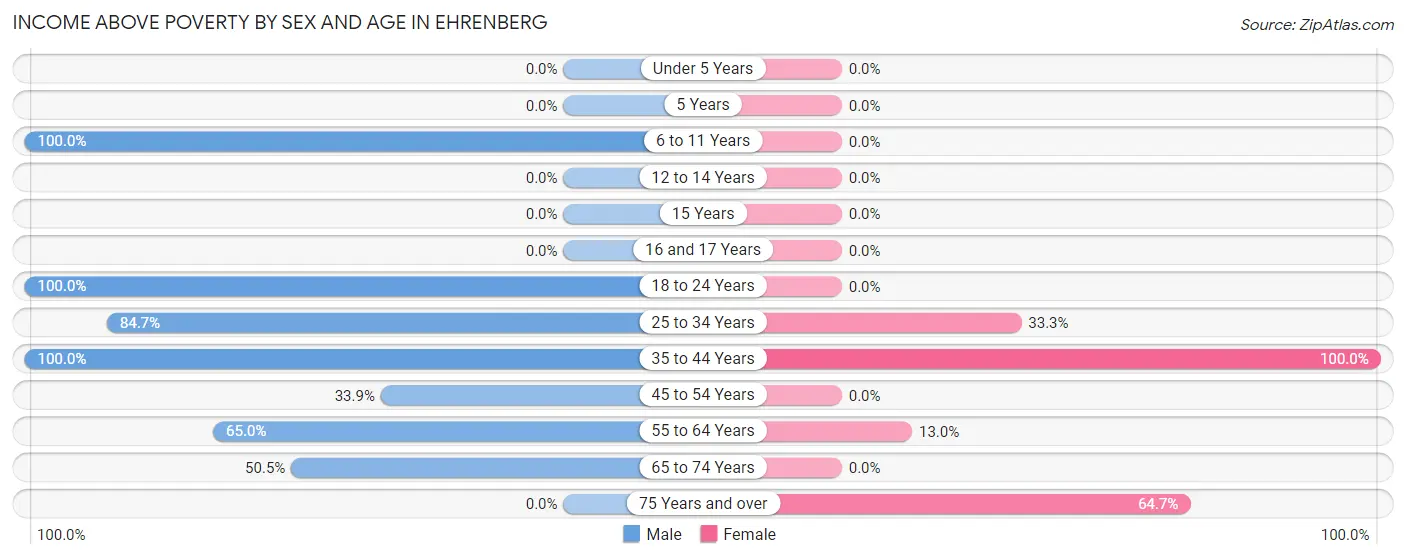
According to the poverty statistics in Ehrenberg, males aged 6 to 11 years and females aged 35 to 44 years are the age groups that are most secure financially, with 100.0% of males and 100.0% of females in these age groups living above the poverty line.
| Age Bracket | Male | Female |
| Under 5 Years | 0 (0.0%) | 0 (0.0%) |
| 5 Years | 0 (0.0%) | 0 (0.0%) |
| 6 to 11 Years | 18 (100.0%) | 0 (0.0%) |
| 12 to 14 Years | 0 (0.0%) | 0 (0.0%) |
| 15 Years | 0 (0.0%) | 0 (0.0%) |
| 16 and 17 Years | 0 (0.0%) | 0 (0.0%) |
| 18 to 24 Years | 164 (100.0%) | 0 (0.0%) |
| 25 to 34 Years | 61 (84.7%) | 4 (33.3%) |
| 35 to 44 Years | 26 (100.0%) | 20 (100.0%) |
| 45 to 54 Years | 20 (33.9%) | 0 (0.0%) |
| 55 to 64 Years | 26 (65.0%) | 3 (13.0%) |
| 65 to 74 Years | 49 (50.5%) | 0 (0.0%) |
| 75 Years and over | 0 (0.0%) | 86 (64.7%) |
| Total | 364 (72.8%) | 113 (26.6%) |
Income Below Poverty Among Married-Couple Families in Ehrenberg
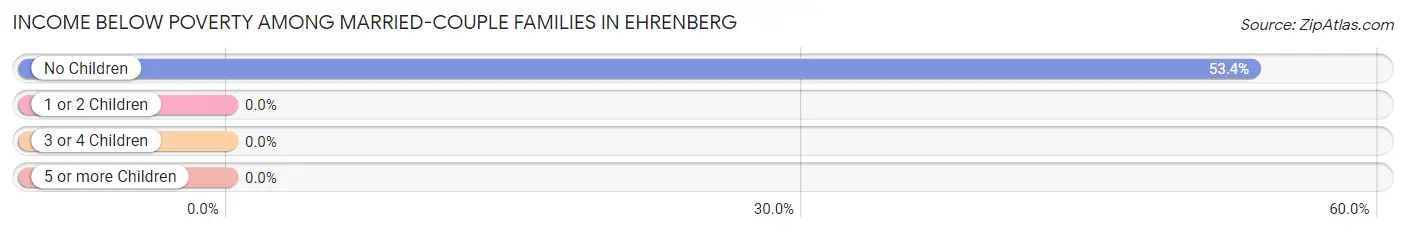
The poverty statistics for married-couple families in Ehrenberg show that 53.4% or 78 of the total 146 families live below the poverty line. Families with no children have the highest poverty rate of 53.4%, comprising of 78 families. On the other hand, families with no children have the lowest poverty rate of 53.4%, which includes 78 families.
| Children | Above Poverty | Below Poverty |
| No Children | 68 (46.6%) | 78 (53.4%) |
| 1 or 2 Children | 0 (0.0%) | 0 (0.0%) |
| 3 or 4 Children | 0 (0.0%) | 0 (0.0%) |
| 5 or more Children | 0 (0.0%) | 0 (0.0%) |
| Total | 68 (46.6%) | 78 (53.4%) |
Income Below Poverty Among Single-Parent Households in Ehrenberg
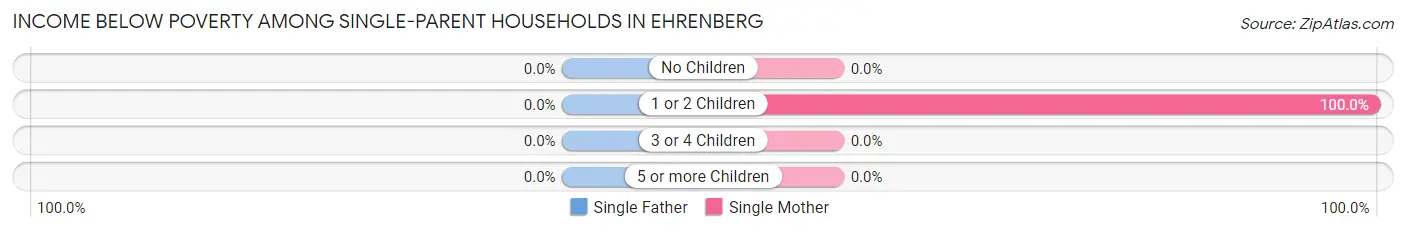
| Children | Single Father | Single Mother |
| No Children | 0 (0.0%) | 0 (0.0%) |
| 1 or 2 Children | 0 (0.0%) | 127 (100.0%) |
| 3 or 4 Children | 0 (0.0%) | 0 (0.0%) |
| 5 or more Children | 0 (0.0%) | 0 (0.0%) |
| Total | 0 (0.0%) | 127 (77.0%) |
Income Below Poverty Among Married-Couple vs Single-Parent Households in Ehrenberg
The poverty data for Ehrenberg shows that 78 of the married-couple family households (53.4%) and 127 of the single-parent households (62.3%) are living below the poverty level. Within the married-couple family households, those with no children have the highest poverty rate, with 78 households (53.4%) falling below the poverty line. Among the single-parent households, those with 1 or 2 children have the highest poverty rate, with 127 household (83.0%) living below poverty.
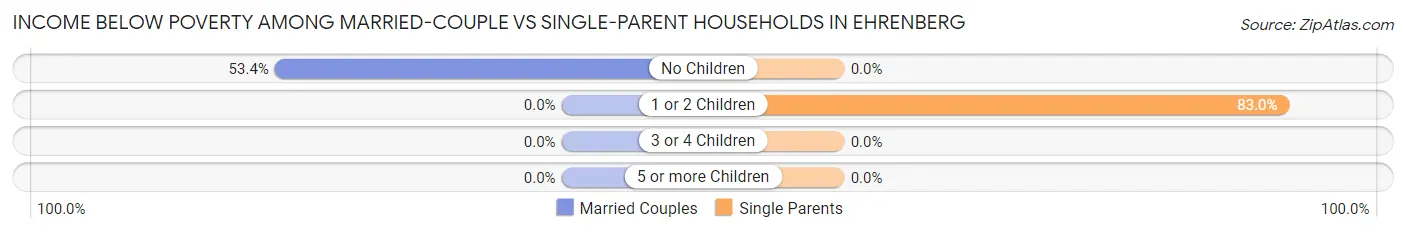
| Children | Married-Couple Families | Single-Parent Households |
| No Children | 78 (53.4%) | 0 (0.0%) |
| 1 or 2 Children | 0 (0.0%) | 127 (83.0%) |
| 3 or 4 Children | 0 (0.0%) | 0 (0.0%) |
| 5 or more Children | 0 (0.0%) | 0 (0.0%) |
| Total | 78 (53.4%) | 127 (62.3%) |
Race in Ehrenberg
The most populous races in Ehrenberg are White / Caucasian (709 | 70.1%), Hispanic or Latino (323 | 31.9%), and Two or more Races (303 | 29.9%).
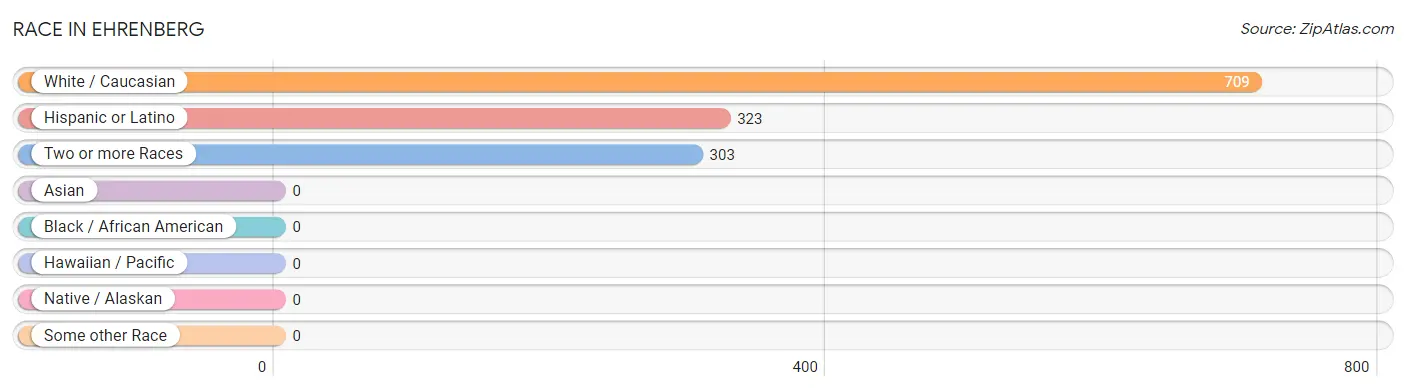
| Race | # Population | % Population |
| Asian | 0 | 0.0% |
| Black / African American | 0 | 0.0% |
| Hawaiian / Pacific | 0 | 0.0% |
| Hispanic or Latino | 323 | 31.9% |
| Native / Alaskan | 0 | 0.0% |
| White / Caucasian | 709 | 70.1% |
| Two or more Races | 303 | 29.9% |
| Some other Race | 0 | 0.0% |
| Total | 1,012 | 100.0% |
Ancestry in Ehrenberg
The most populous ancestries reported in Ehrenberg are Mexican (247 | 24.4%), Irish (207 | 20.4%), German (173 | 17.1%), English (112 | 11.1%), and American (89 | 8.8%), together accounting for 81.8% of all Ehrenberg residents.
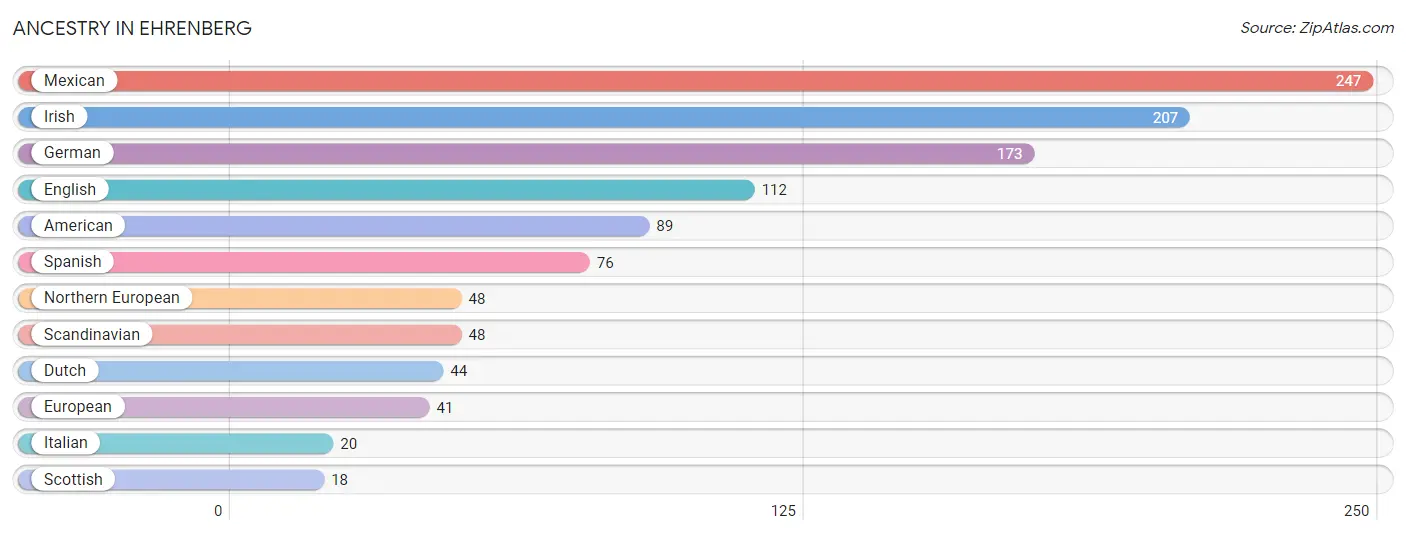
| Ancestry | # Population | % Population |
| American | 89 | 8.8% |
| Dutch | 44 | 4.3% |
| English | 112 | 11.1% |
| European | 41 | 4.1% |
| German | 173 | 17.1% |
| Irish | 207 | 20.4% |
| Italian | 20 | 2.0% |
| Mexican | 247 | 24.4% |
| Northern European | 48 | 4.7% |
| Scandinavian | 48 | 4.7% |
| Scottish | 18 | 1.8% |
| Spanish | 76 | 7.5% | View All 12 Rows |
Immigrants in Ehrenberg
The most numerous immigrant groups reported in Ehrenberg came from Central America (82 | 8.1%), Latin America (82 | 8.1%), and Mexico (82 | 8.1%), together accounting for 24.3% of all Ehrenberg residents.
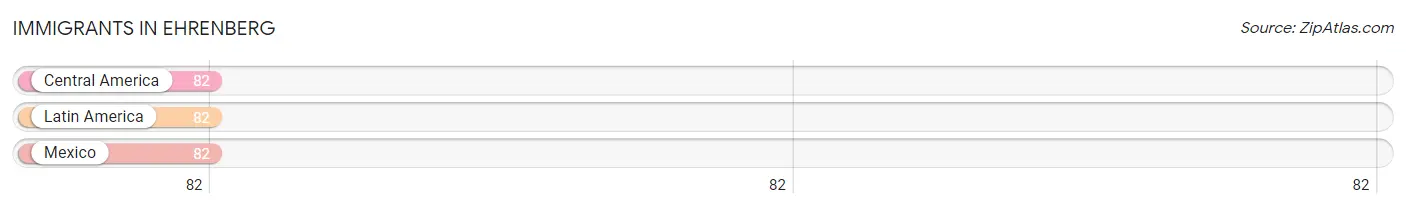
| Immigration Origin | # Population | % Population |
| Central America | 82 | 8.1% |
| Latin America | 82 | 8.1% |
| Mexico | 82 | 8.1% | View All 3 Rows |
Sex and Age in Ehrenberg
Sex and Age in Ehrenberg
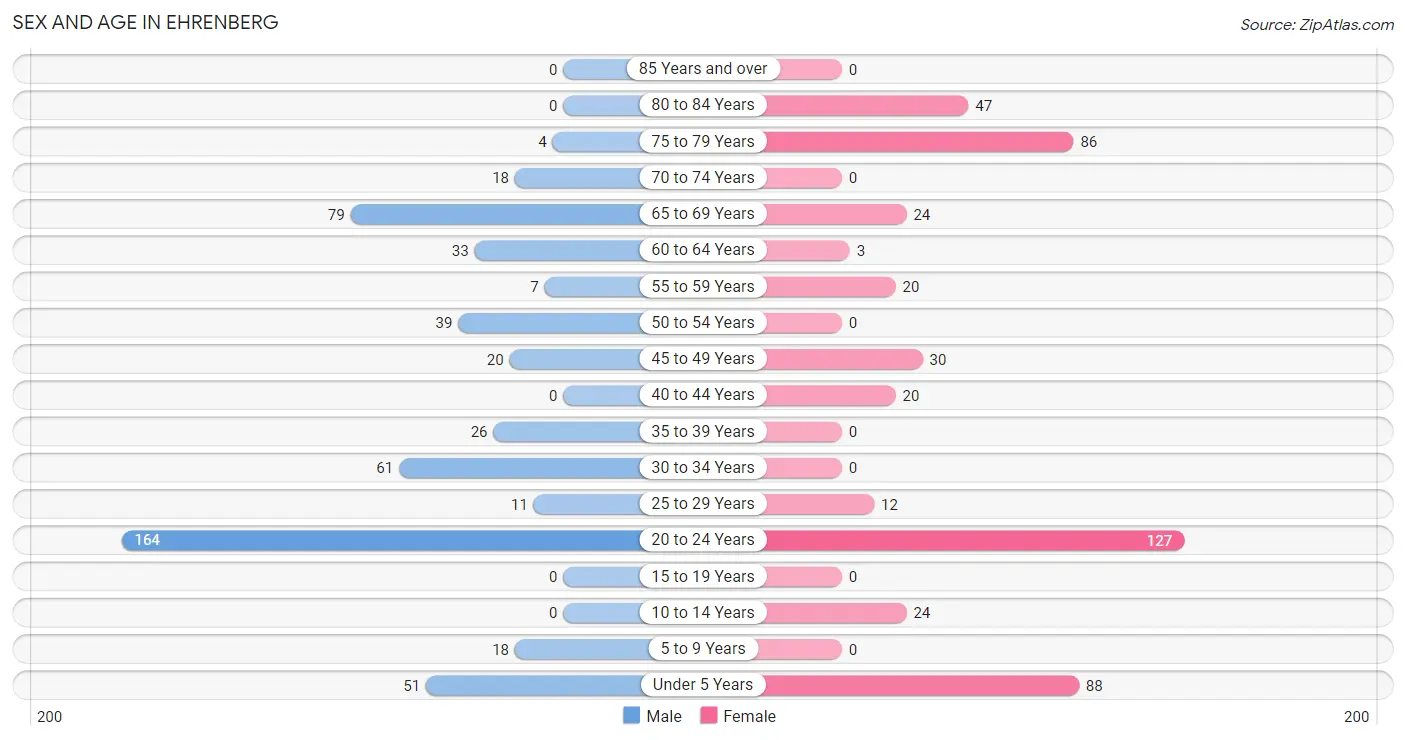
The most populous age groups in Ehrenberg are 20 to 24 Years (164 | 30.9%) for men and 20 to 24 Years (127 | 26.4%) for women.
| Age Bracket | Male | Female |
| Under 5 Years | 51 (9.6%) | 88 (18.3%) |
| 5 to 9 Years | 18 (3.4%) | 0 (0.0%) |
| 10 to 14 Years | 0 (0.0%) | 24 (5.0%) |
| 15 to 19 Years | 0 (0.0%) | 0 (0.0%) |
| 20 to 24 Years | 164 (30.9%) | 127 (26.4%) |
| 25 to 29 Years | 11 (2.1%) | 12 (2.5%) |
| 30 to 34 Years | 61 (11.5%) | 0 (0.0%) |
| 35 to 39 Years | 26 (4.9%) | 0 (0.0%) |
| 40 to 44 Years | 0 (0.0%) | 20 (4.2%) |
| 45 to 49 Years | 20 (3.8%) | 30 (6.2%) |
| 50 to 54 Years | 39 (7.3%) | 0 (0.0%) |
| 55 to 59 Years | 7 (1.3%) | 20 (4.2%) |
| 60 to 64 Years | 33 (6.2%) | 3 (0.6%) |
| 65 to 69 Years | 79 (14.9%) | 24 (5.0%) |
| 70 to 74 Years | 18 (3.4%) | 0 (0.0%) |
| 75 to 79 Years | 4 (0.7%) | 86 (17.9%) |
| 80 to 84 Years | 0 (0.0%) | 47 (9.8%) |
| 85 Years and over | 0 (0.0%) | 0 (0.0%) |
| Total | 531 (100.0%) | 481 (100.0%) |
Families and Households in Ehrenberg
Median Family Size in Ehrenberg
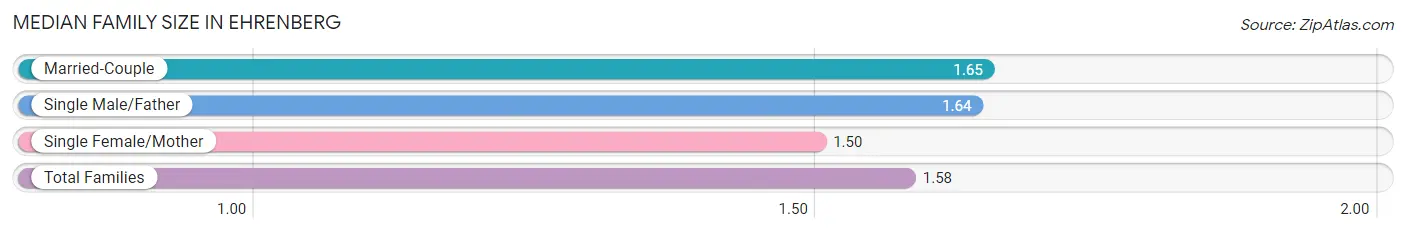
The median family size in Ehrenberg is 1.58 persons per family, with married-couple families (146 | 41.7%) accounting for the largest median family size of 1.65 persons per family. On the other hand, single female/mother families (165 | 47.1%) represent the smallest median family size with 1.50 persons per family.
| Family Type | # Families | Family Size |
| Married-Couple | 146 (41.7%) | 1.65 |
| Single Male/Father | 39 (11.1%) | 1.64 |
| Single Female/Mother | 165 (47.1%) | 1.50 |
| Total Families | 350 (100.0%) | 1.58 |
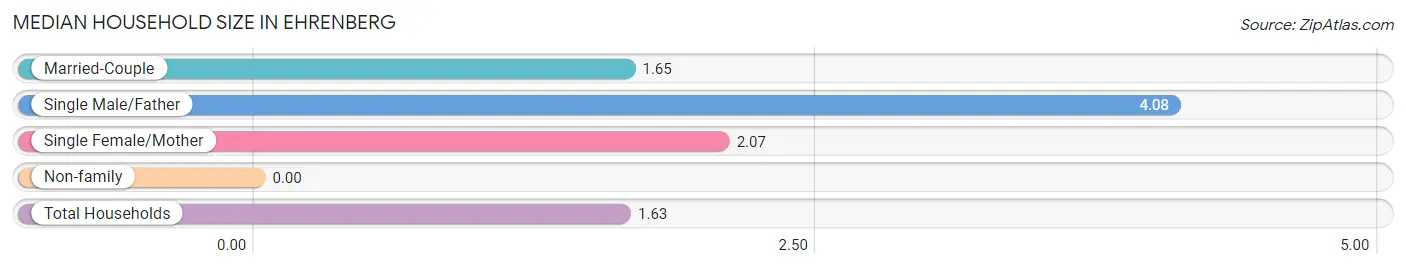
Median Household Size in Ehrenberg
| Household Type | # Households | Household Size |
| Married-Couple | 146 (23.5%) | 1.65 |
| Single Male/Father | 39 (6.3%) | 4.08 |
| Single Female/Mother | 165 (26.6%) | 2.07 |
| Non-family | 271 (43.6%) | - |
| Total Households | 621 (100.0%) | 1.63 |
Household Size by Marriage Status in Ehrenberg
Out of a total of 621 households in Ehrenberg, 350 (56.4%) are family households, while 271 (43.6%) are nonfamily households. The most numerous type of family households are 2-person households, comprising 167, and the most common type of nonfamily households are 1-person households, comprising 271.
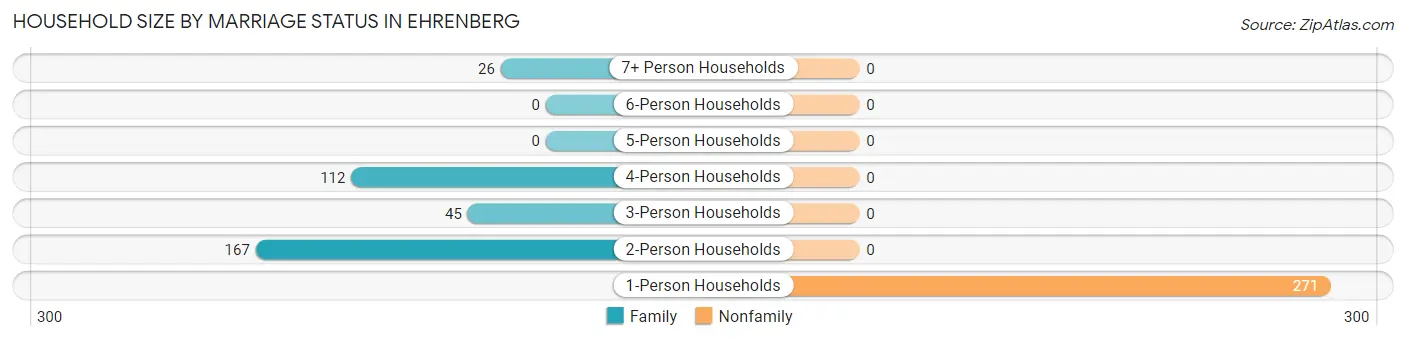
| Household Size | Family Households | Nonfamily Households |
| 1-Person Households | - | 271 (43.6%) |
| 2-Person Households | 167 (26.9%) | 0 (0.0%) |
| 3-Person Households | 45 (7.2%) | 0 (0.0%) |
| 4-Person Households | 112 (18.0%) | 0 (0.0%) |
| 5-Person Households | 0 (0.0%) | 0 (0.0%) |
| 6-Person Households | 0 (0.0%) | 0 (0.0%) |
| 7+ Person Households | 26 (4.2%) | 0 (0.0%) |
| Total | 350 (56.4%) | 271 (43.6%) |
Female Fertility in Ehrenberg
Fertility by Age in Ehrenberg
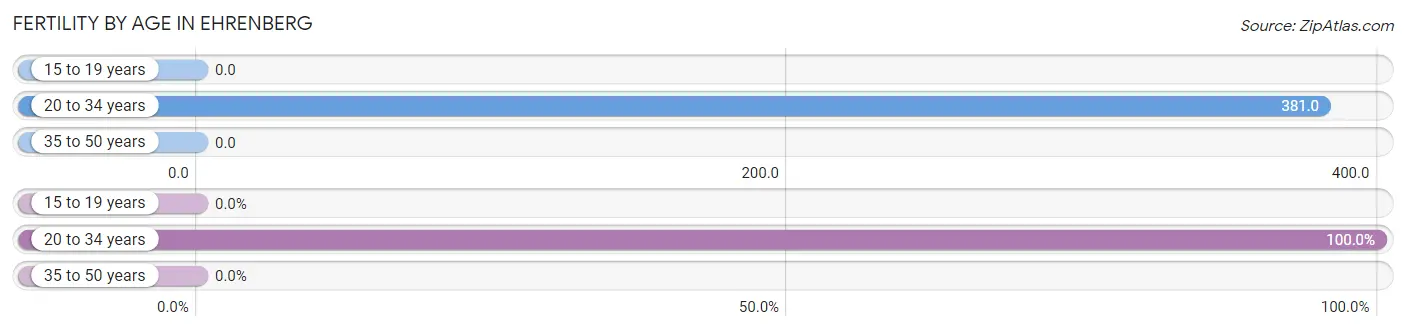
Average fertility rate in Ehrenberg is 280.0 births per 1,000 women. Women in the age bracket of 20 to 34 years have the highest fertility rate with 381.0 births per 1,000 women. Women in the age bracket of 20 to 34 years acount for 100.0% of all women with births.
| Age Bracket | Women with Births | Births / 1,000 Women |
| 15 to 19 years | 0 (0.0%) | 0.0 |
| 20 to 34 years | 53 (100.0%) | 381.0 |
| 35 to 50 years | 0 (0.0%) | 0.0 |
| Total | 53 (100.0%) | 280.0 |
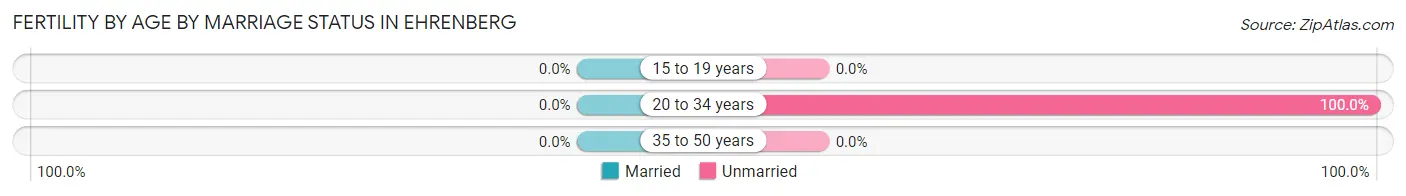
Fertility by Age by Marriage Status in Ehrenberg
| Age Bracket | Married | Unmarried |
| 15 to 19 years | 0 (0.0%) | 0 (0.0%) |
| 20 to 34 years | 0 (0.0%) | 53 (100.0%) |
| 35 to 50 years | 0 (0.0%) | 0 (0.0%) |
| Total | 0 (0.0%) | 53 (100.0%) |
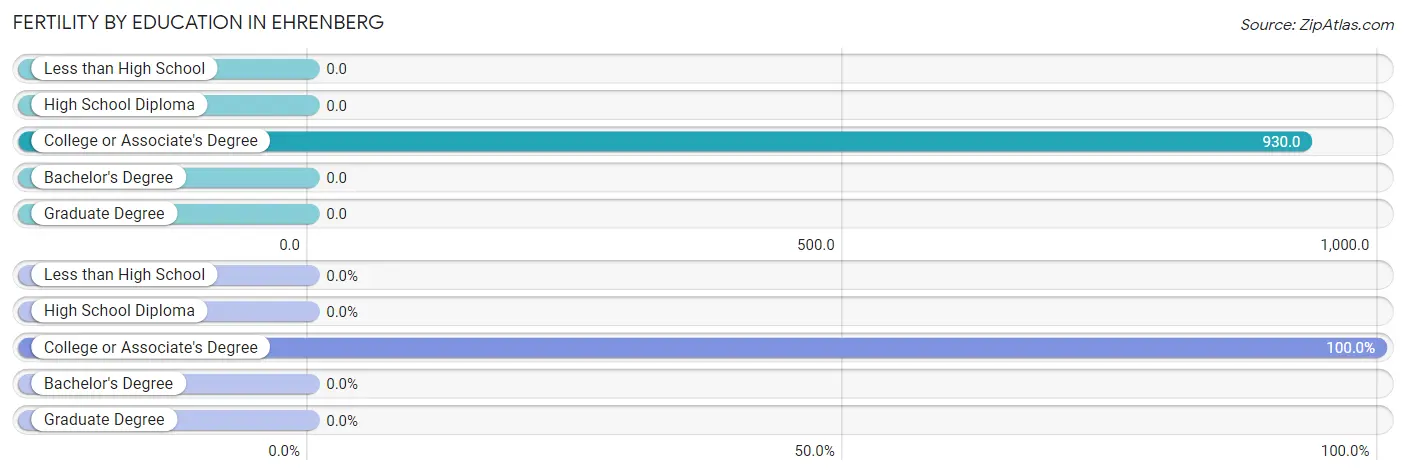
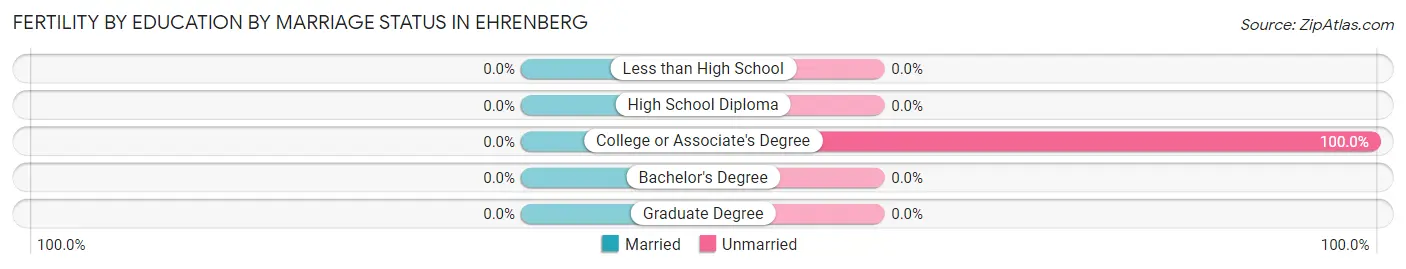
Fertility by Education in Ehrenberg
| Educational Attainment | Women with Births | Births / 1,000 Women |
| Less than High School | 0 (0.0%) | 0.0 |
| High School Diploma | 0 (0.0%) | 0.0 |
| College or Associate's Degree | 53 (100.0%) | 930.0 |
| Bachelor's Degree | 0 (0.0%) | 0.0 |
| Graduate Degree | 0 (0.0%) | 0.0 |
| Total | 53 (100.0%) | 280.0 |
Fertility by Education by Marriage Status in Ehrenberg
| Educational Attainment | Married | Unmarried |
| Less than High School | 0 (0.0%) | 0 (0.0%) |
| High School Diploma | 0 (0.0%) | 0 (0.0%) |
| College or Associate's Degree | 0 (0.0%) | 53 (100.0%) |
| Bachelor's Degree | 0 (0.0%) | 0 (0.0%) |
| Graduate Degree | 0 (0.0%) | 0 (0.0%) |
| Total | 0 (0.0%) | 53 (100.0%) |
Employment Characteristics in Ehrenberg
Employment by Class of Employer in Ehrenberg
Among the 382 employed individuals in Ehrenberg, private company employees (313 | 81.9%), state government employees (27 | 7.1%), and self-employed (not incorporated) (22 | 5.8%) make up the most common classes of employment.
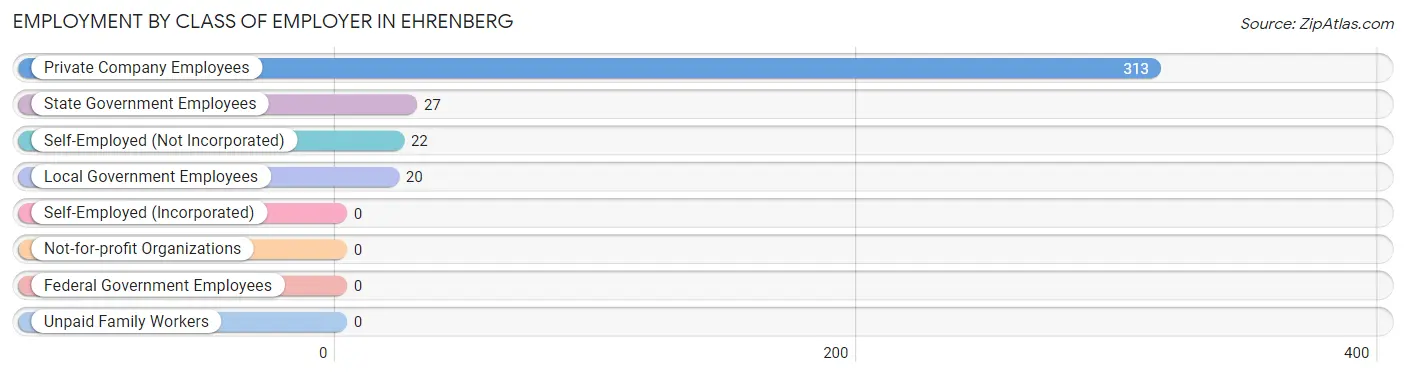
| Employer Class | # Employees | % Employees |
| Private Company Employees | 313 | 81.9% |
| Self-Employed (Incorporated) | 0 | 0.0% |
| Self-Employed (Not Incorporated) | 22 | 5.8% |
| Not-for-profit Organizations | 0 | 0.0% |
| Local Government Employees | 20 | 5.2% |
| State Government Employees | 27 | 7.1% |
| Federal Government Employees | 0 | 0.0% |
| Unpaid Family Workers | 0 | 0.0% |
| Total | 382 | 100.0% |
Employment Status by Age in Ehrenberg
According to the labor force statistics for Ehrenberg, out of the total population over 16 years of age (831), 50.9% or 423 individuals are in the labor force, with 9.7% or 41 of them unemployed. The age group with the highest labor force participation rate is 30 to 34 years, with 100.0% or 61 individuals in the labor force. Within the labor force, the 25 to 29 years age range has the highest percentage of unemployed individuals, with 73.3% or 11 of them being unemployed.
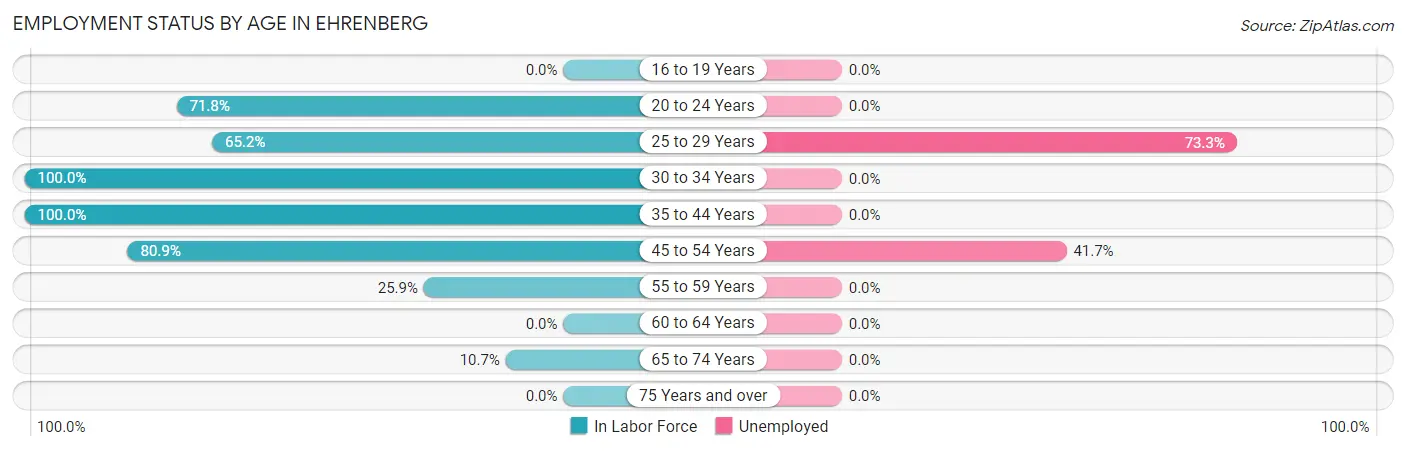
| Age Bracket | In Labor Force | Unemployed |
| 16 to 19 Years | 0 (0.0%) | 0 (0.0%) |
| 20 to 24 Years | 209 (71.8%) | 0 (0.0%) |
| 25 to 29 Years | 15 (65.2%) | 11 (73.3%) |
| 30 to 34 Years | 61 (100.0%) | 0 (0.0%) |
| 35 to 44 Years | 46 (100.0%) | 0 (0.0%) |
| 45 to 54 Years | 72 (80.9%) | 30 (41.7%) |
| 55 to 59 Years | 7 (25.9%) | 0 (0.0%) |
| 60 to 64 Years | 0 (0.0%) | 0 (0.0%) |
| 65 to 74 Years | 13 (10.7%) | 0 (0.0%) |
| 75 Years and over | 0 (0.0%) | 0 (0.0%) |
| Total | 423 (50.9%) | 41 (9.7%) |
Employment Status by Educational Attainment in Ehrenberg
According to labor force statistics for Ehrenberg, 71.3% of individuals (201) out of the total population between 25 and 64 years of age (282) are in the labor force, with 20.4% or 41 of them being unemployed. The group with the highest labor force participation rate are those with the educational attainment of bachelor's degree or higher, with 100.0% or 20 individuals in the labor force. Within the labor force, individuals with high school diploma education have the highest percentage of unemployment, with 52.2% or 36 of them being unemployed.
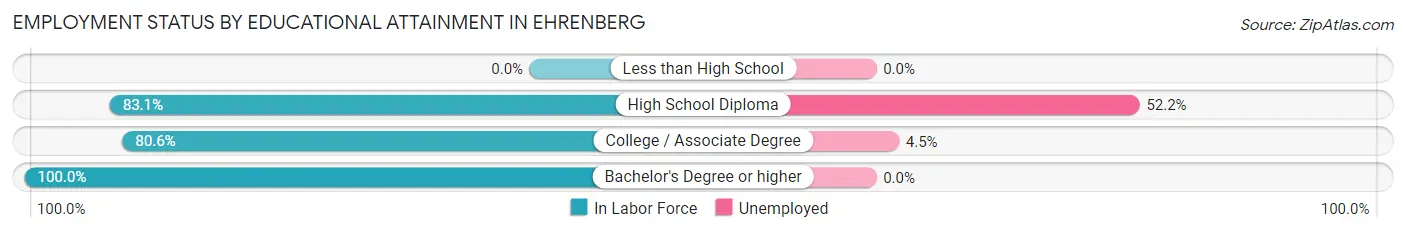
| Educational Attainment | In Labor Force | Unemployed |
| Less than High School | 0 (0.0%) | 0 (0.0%) |
| High School Diploma | 69 (83.1%) | 43 (52.2%) |
| College / Associate Degree | 112 (80.6%) | 6 (4.5%) |
| Bachelor's Degree or higher | 20 (100.0%) | 0 (0.0%) |
| Total | 201 (71.3%) | 58 (20.4%) |
Employment Occupations by Sex in Ehrenberg
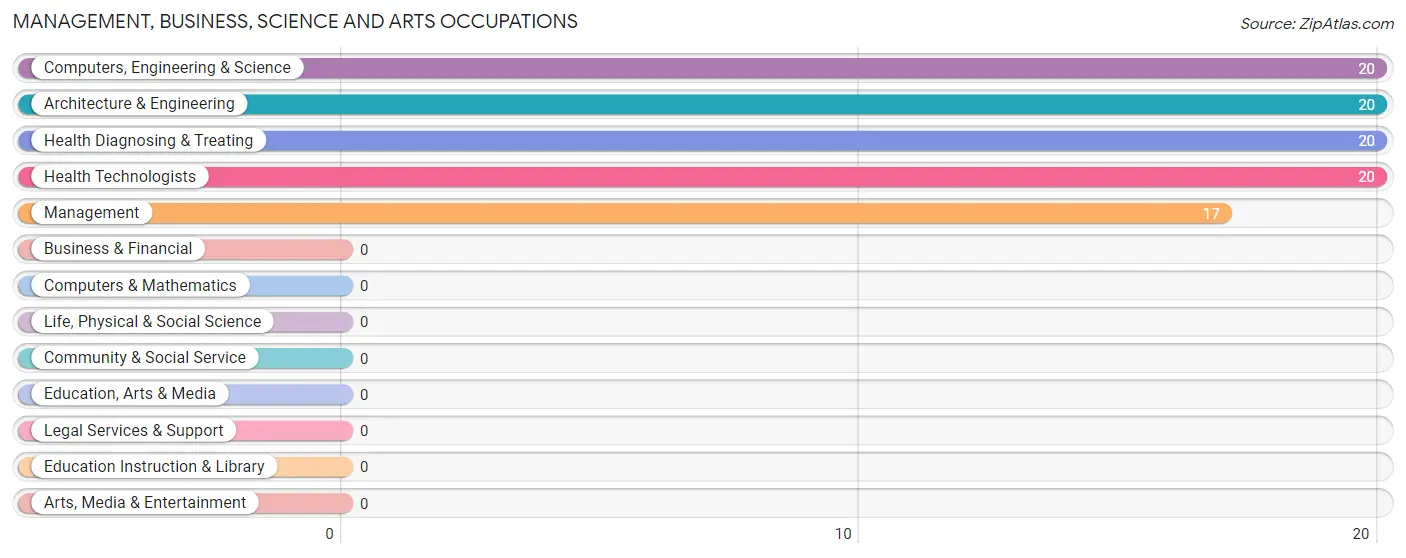
Management, Business, Science and Arts Occupations
The most common Management, Business, Science and Arts occupations in Ehrenberg are Computers, Engineering & Science (20 | 5.2%), Architecture & Engineering (20 | 5.2%), Health Diagnosing & Treating (20 | 5.2%), Health Technologists (20 | 5.2%), and Management (17 | 4.4%).
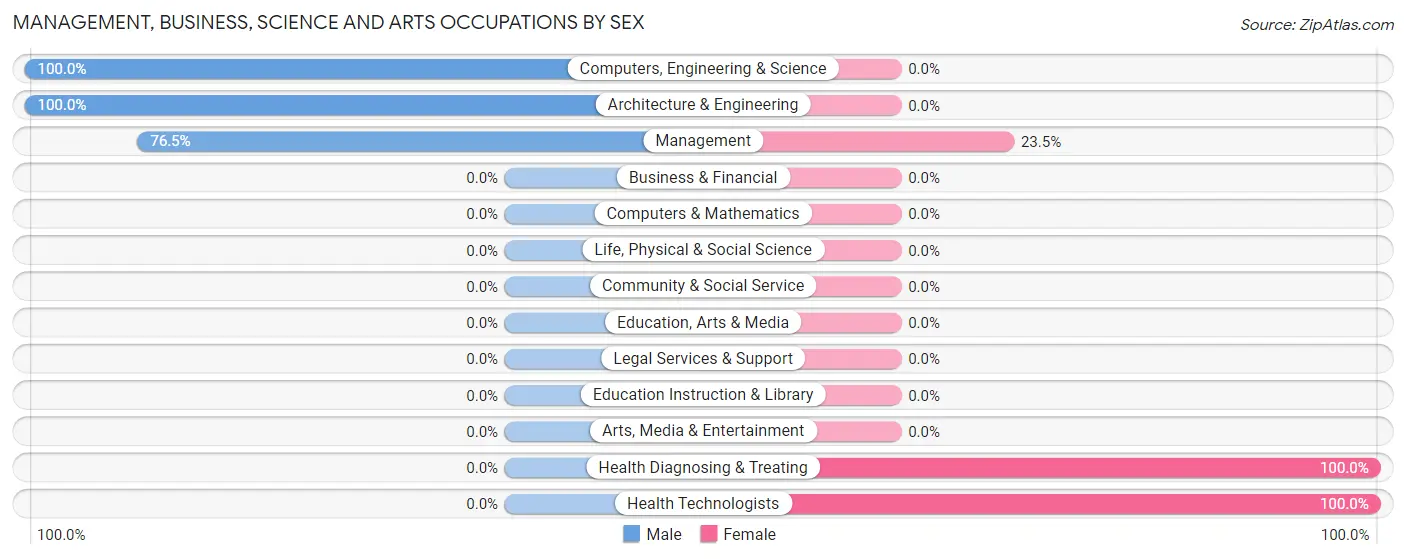
Management, Business, Science and Arts Occupations by Sex
Within the Management, Business, Science and Arts occupations in Ehrenberg, the most male-oriented occupations are Computers, Engineering & Science (100.0%), Architecture & Engineering (100.0%), and Management (76.5%), while the most female-oriented occupations are Health Diagnosing & Treating (100.0%), Health Technologists (100.0%), and Management (23.5%).
| Occupation | Male | Female |
| Management | 13 (76.5%) | 4 (23.5%) |
| Business & Financial | 0 (0.0%) | 0 (0.0%) |
| Computers, Engineering & Science | 20 (100.0%) | 0 (0.0%) |
| Computers & Mathematics | 0 (0.0%) | 0 (0.0%) |
| Architecture & Engineering | 20 (100.0%) | 0 (0.0%) |
| Life, Physical & Social Science | 0 (0.0%) | 0 (0.0%) |
| Community & Social Service | 0 (0.0%) | 0 (0.0%) |
| Education, Arts & Media | 0 (0.0%) | 0 (0.0%) |
| Legal Services & Support | 0 (0.0%) | 0 (0.0%) |
| Education Instruction & Library | 0 (0.0%) | 0 (0.0%) |
| Arts, Media & Entertainment | 0 (0.0%) | 0 (0.0%) |
| Health Diagnosing & Treating | 0 (0.0%) | 20 (100.0%) |
| Health Technologists | 0 (0.0%) | 20 (100.0%) |
| Total (Category) | 33 (57.9%) | 24 (42.1%) |
| Total (Overall) | 313 (81.9%) | 69 (18.1%) |
Services Occupations
Services Occupations by Sex
| Occupation | Male | Female |
| Healthcare Support | 0 (0.0%) | 0 (0.0%) |
| Security & Protection | 0 (0.0%) | 0 (0.0%) |
| Firefighting & Prevention | 0 (0.0%) | 0 (0.0%) |
| Law Enforcement | 0 (0.0%) | 0 (0.0%) |
| Food Preparation & Serving | 0 (0.0%) | 0 (0.0%) |
| Cleaning & Maintenance | 0 (0.0%) | 0 (0.0%) |
| Personal Care & Service | 0 (0.0%) | 0 (0.0%) |
| Total (Category) | 0 (0.0%) | 0 (0.0%) |
| Total (Overall) | 313 (81.9%) | 69 (18.1%) |
Sales and Office Occupations
The most common Sales and Office occupations in Ehrenberg are , and Sales & Related (102 | 26.7%).
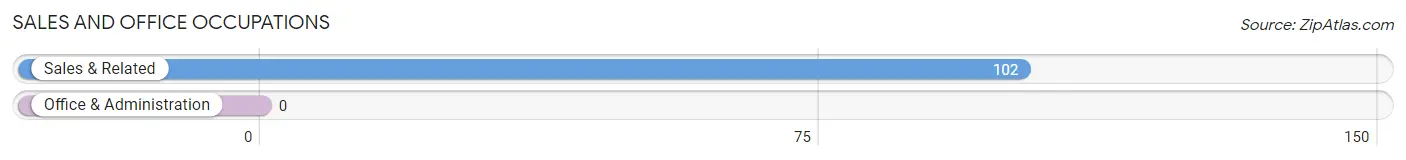
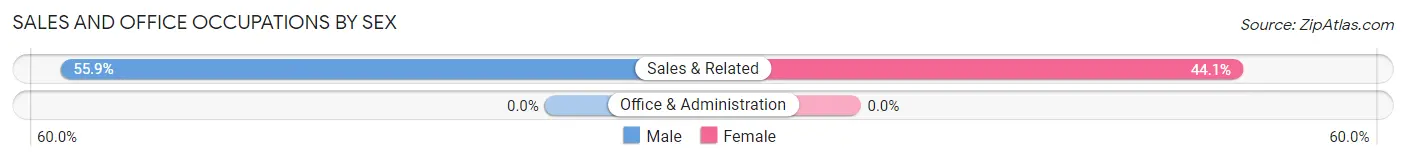
Sales and Office Occupations by Sex
| Occupation | Male | Female |
| Sales & Related | 57 (55.9%) | 45 (44.1%) |
| Office & Administration | 0 (0.0%) | 0 (0.0%) |
| Total (Category) | 57 (55.9%) | 45 (44.1%) |
| Total (Overall) | 313 (81.9%) | 69 (18.1%) |
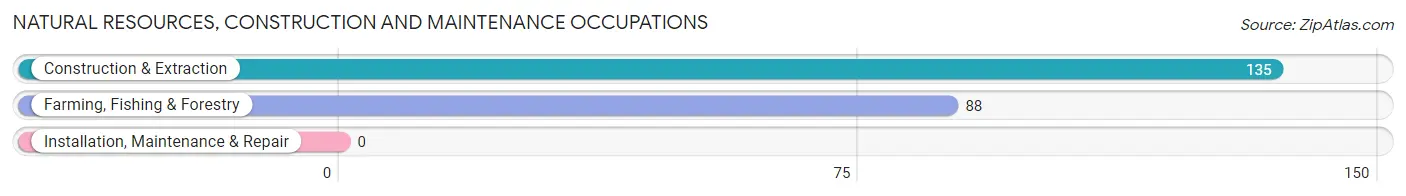
Natural Resources, Construction and Maintenance Occupations
The most common Natural Resources, Construction and Maintenance occupations in Ehrenberg are Construction & Extraction (135 | 35.3%), and Farming, Fishing & Forestry (88 | 23.0%).
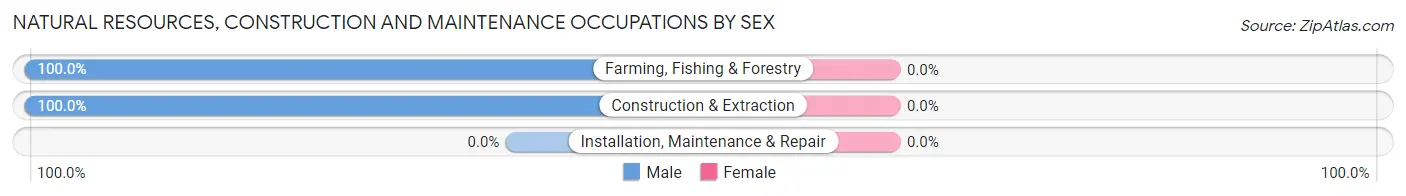
Natural Resources, Construction and Maintenance Occupations by Sex
| Occupation | Male | Female |
| Farming, Fishing & Forestry | 88 (100.0%) | 0 (0.0%) |
| Construction & Extraction | 135 (100.0%) | 0 (0.0%) |
| Installation, Maintenance & Repair | 0 (0.0%) | 0 (0.0%) |
| Total (Category) | 223 (100.0%) | 0 (0.0%) |
| Total (Overall) | 313 (81.9%) | 69 (18.1%) |
Production, Transportation and Moving Occupations
Production, Transportation and Moving Occupations by Sex
| Occupation | Male | Female |
| Production | 0 (0.0%) | 0 (0.0%) |
| Transportation | 0 (0.0%) | 0 (0.0%) |
| Material Moving | 0 (0.0%) | 0 (0.0%) |
| Total (Category) | 0 (0.0%) | 0 (0.0%) |
| Total (Overall) | 313 (81.9%) | 69 (18.1%) |
Employment Industries by Sex in Ehrenberg
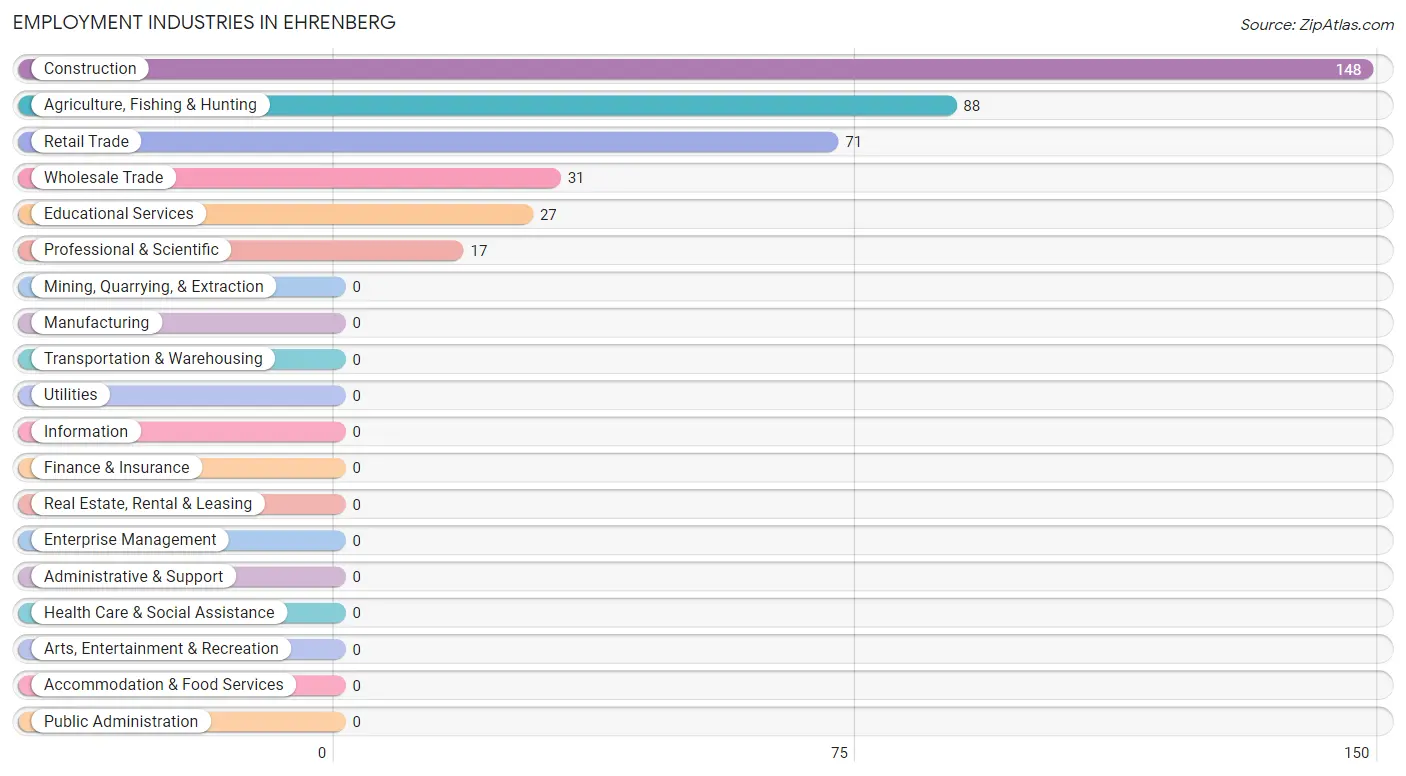
Employment Industries in Ehrenberg
The major employment industries in Ehrenberg include Construction (148 | 38.7%), Agriculture, Fishing & Hunting (88 | 23.0%), Retail Trade (71 | 18.6%), Wholesale Trade (31 | 8.1%), and Educational Services (27 | 7.1%).
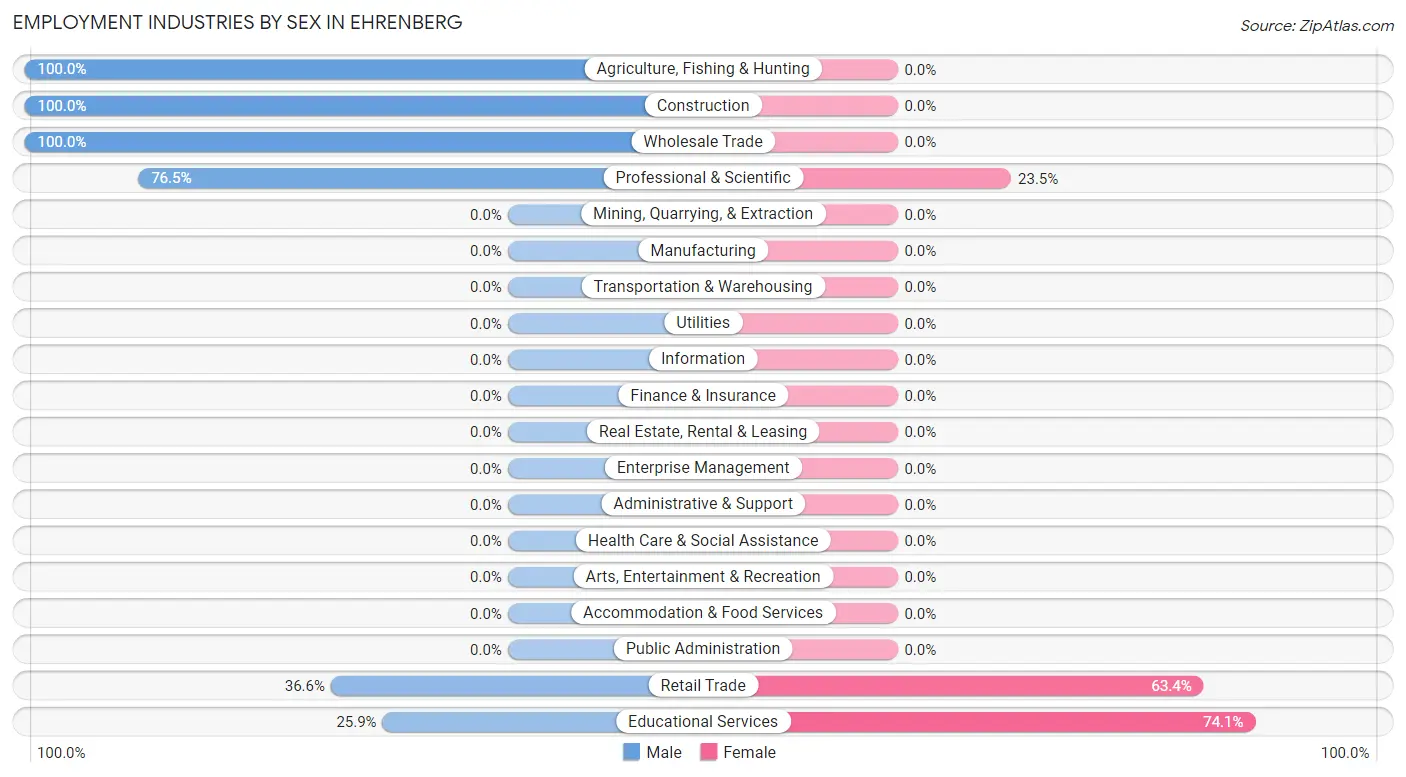
Employment Industries by Sex in Ehrenberg
The Ehrenberg industries that see more men than women are Agriculture, Fishing & Hunting (100.0%), Construction (100.0%), and Wholesale Trade (100.0%), whereas the industries that tend to have a higher number of women are Educational Services (74.1%), Retail Trade (63.4%), and Professional & Scientific (23.5%).
| Industry | Male | Female |
| Agriculture, Fishing & Hunting | 88 (100.0%) | 0 (0.0%) |
| Mining, Quarrying, & Extraction | 0 (0.0%) | 0 (0.0%) |
| Construction | 148 (100.0%) | 0 (0.0%) |
| Manufacturing | 0 (0.0%) | 0 (0.0%) |
| Wholesale Trade | 31 (100.0%) | 0 (0.0%) |
| Retail Trade | 26 (36.6%) | 45 (63.4%) |
| Transportation & Warehousing | 0 (0.0%) | 0 (0.0%) |
| Utilities | 0 (0.0%) | 0 (0.0%) |
| Information | 0 (0.0%) | 0 (0.0%) |
| Finance & Insurance | 0 (0.0%) | 0 (0.0%) |
| Real Estate, Rental & Leasing | 0 (0.0%) | 0 (0.0%) |
| Professional & Scientific | 13 (76.5%) | 4 (23.5%) |
| Enterprise Management | 0 (0.0%) | 0 (0.0%) |
| Administrative & Support | 0 (0.0%) | 0 (0.0%) |
| Educational Services | 7 (25.9%) | 20 (74.1%) |
| Health Care & Social Assistance | 0 (0.0%) | 0 (0.0%) |
| Arts, Entertainment & Recreation | 0 (0.0%) | 0 (0.0%) |
| Accommodation & Food Services | 0 (0.0%) | 0 (0.0%) |
| Public Administration | 0 (0.0%) | 0 (0.0%) |
| Total | 313 (81.9%) | 69 (18.1%) |
Education in Ehrenberg
School Enrollment in Ehrenberg
The most common levels of schooling among the 126 students in Ehrenberg are college / undergraduate (76 | 60.3%), middle school (24 | 19.1%), and elementary school (18 | 14.3%).

| School Level | # Students | % Students |
| Nursery / Preschool | 0 | 0.0% |
| Kindergarten | 0 | 0.0% |
| Elementary School | 18 | 14.3% |
| Middle School | 24 | 19.1% |
| High School | 8 | 6.4% |
| College / Undergraduate | 76 | 60.3% |
| Graduate / Professional | 0 | 0.0% |
| Total | 126 | 100.0% |
School Enrollment by Age by Funding Source in Ehrenberg
Out of a total of 126 students who are enrolled in schools in Ehrenberg, 8 (6.3%) attend a private institution, while the remaining 118 (93.7%) are enrolled in public schools. The age group of 25 to 34 year olds has the highest likelihood of being enrolled in private schools, with 8 (100.0% in the age bracket) enrolled. Conversely, the age group of 5 to 9 year old has the lowest likelihood of being enrolled in a private school, with 18 (100.0% in the age bracket) attending a public institution.
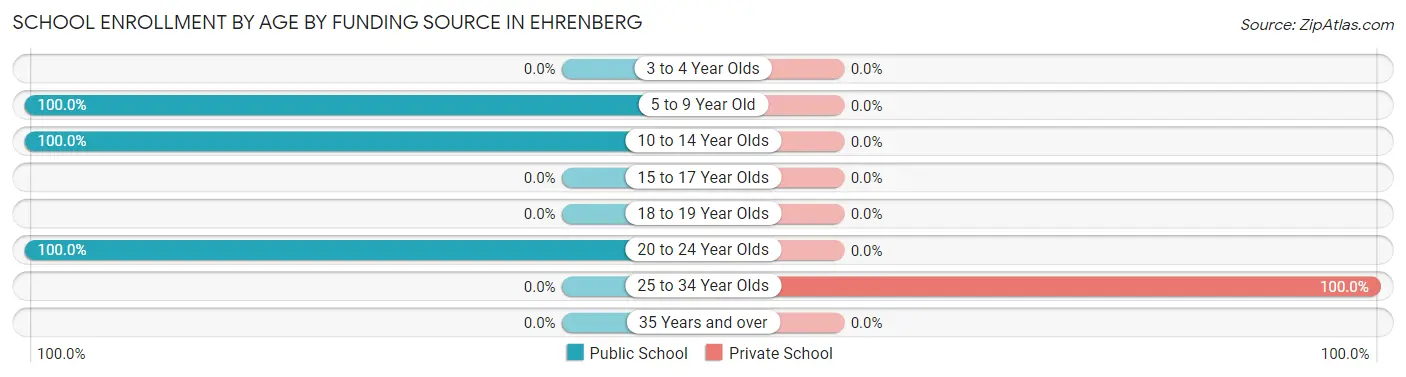
| Age Bracket | Public School | Private School |
| 3 to 4 Year Olds | 0 (0.0%) | 0 (0.0%) |
| 5 to 9 Year Old | 18 (100.0%) | 0 (0.0%) |
| 10 to 14 Year Olds | 24 (100.0%) | 0 (0.0%) |
| 15 to 17 Year Olds | 0 (0.0%) | 0 (0.0%) |
| 18 to 19 Year Olds | 0 (0.0%) | 0 (0.0%) |
| 20 to 24 Year Olds | 76 (100.0%) | 0 (0.0%) |
| 25 to 34 Year Olds | 0 (0.0%) | 8 (100.0%) |
| 35 Years and over | 0 (0.0%) | 0 (0.0%) |
| Total | 118 (93.7%) | 8 (6.3%) |
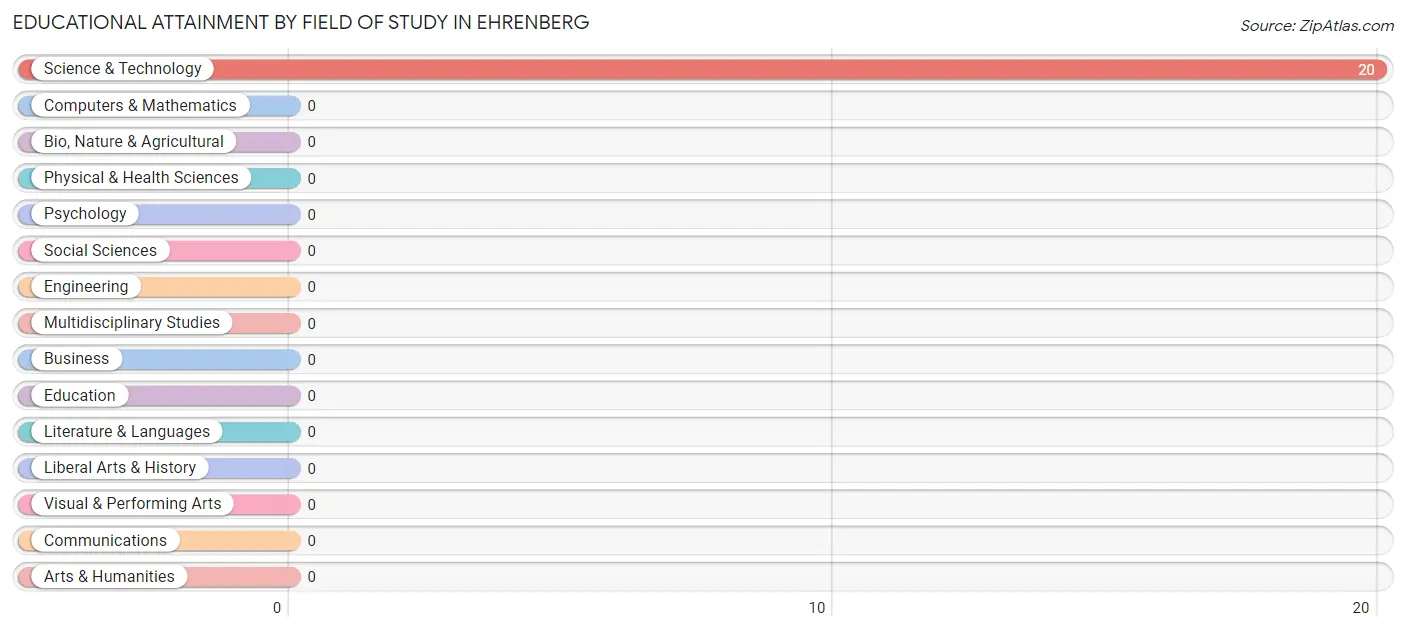
Educational Attainment by Field of Study in Ehrenberg
, and science & technology (20 | 100.0%) are the most common fields of study among 20 individuals in Ehrenberg who have obtained a bachelor's degree or higher.
| Field of Study | # Graduates | % Graduates |
| Computers & Mathematics | 0 | 0.0% |
| Bio, Nature & Agricultural | 0 | 0.0% |
| Physical & Health Sciences | 0 | 0.0% |
| Psychology | 0 | 0.0% |
| Social Sciences | 0 | 0.0% |
| Engineering | 0 | 0.0% |
| Multidisciplinary Studies | 0 | 0.0% |
| Science & Technology | 20 | 100.0% |
| Business | 0 | 0.0% |
| Education | 0 | 0.0% |
| Literature & Languages | 0 | 0.0% |
| Liberal Arts & History | 0 | 0.0% |
| Visual & Performing Arts | 0 | 0.0% |
| Communications | 0 | 0.0% |
| Arts & Humanities | 0 | 0.0% |
| Total | 20 | 100.0% |
Transportation & Commute in Ehrenberg
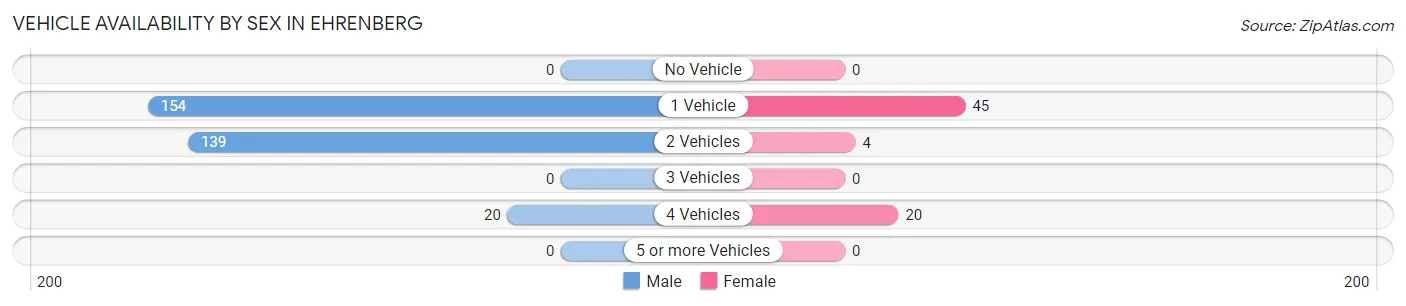
Vehicle Availability by Sex in Ehrenberg
The most prevalent vehicle ownership categories in Ehrenberg are males with 1 vehicle (154, accounting for 49.2%) and females with 1 vehicle (45, making up 223.2%).
| Vehicles Available | Male | Female |
| No Vehicle | 0 (0.0%) | 0 (0.0%) |
| 1 Vehicle | 154 (49.2%) | 45 (65.2%) |
| 2 Vehicles | 139 (44.4%) | 4 (5.8%) |
| 3 Vehicles | 0 (0.0%) | 0 (0.0%) |
| 4 Vehicles | 20 (6.4%) | 20 (29.0%) |
| 5 or more Vehicles | 0 (0.0%) | 0 (0.0%) |
| Total | 313 (100.0%) | 69 (100.0%) |
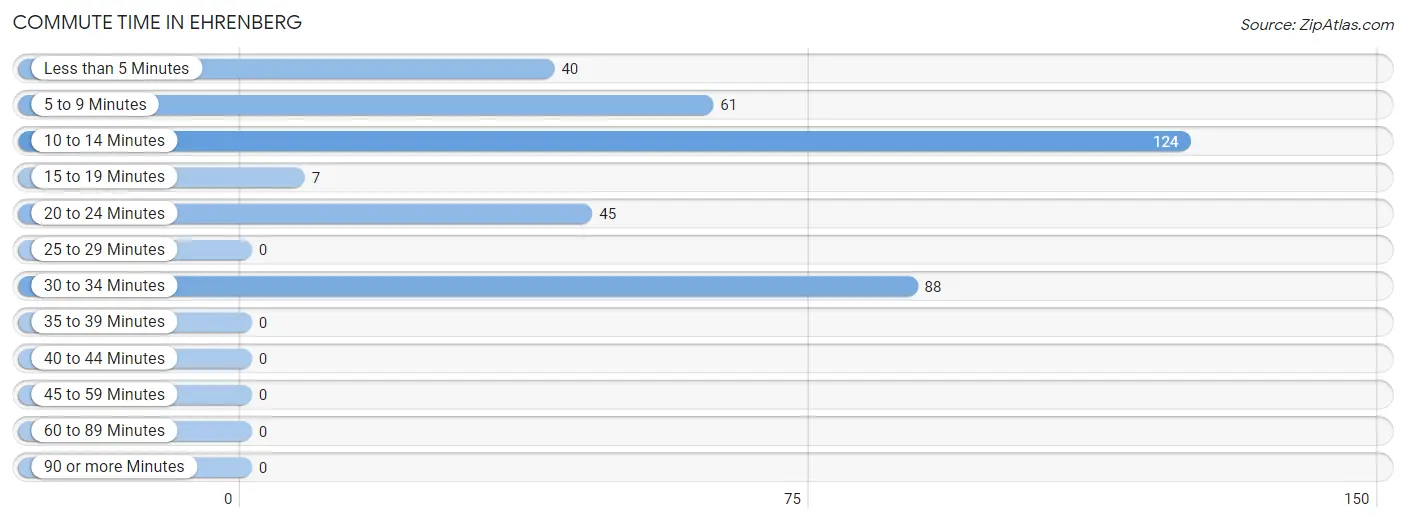
Commute Time in Ehrenberg
The most frequently occuring commute durations in Ehrenberg are 10 to 14 minutes (124 commuters, 34.0%), 30 to 34 minutes (88 commuters, 24.1%), and 5 to 9 minutes (61 commuters, 16.7%).
| Commute Time | # Commuters | % Commuters |
| Less than 5 Minutes | 40 | 11.0% |
| 5 to 9 Minutes | 61 | 16.7% |
| 10 to 14 Minutes | 124 | 34.0% |
| 15 to 19 Minutes | 7 | 1.9% |
| 20 to 24 Minutes | 45 | 12.3% |
| 25 to 29 Minutes | 0 | 0.0% |
| 30 to 34 Minutes | 88 | 24.1% |
| 35 to 39 Minutes | 0 | 0.0% |
| 40 to 44 Minutes | 0 | 0.0% |
| 45 to 59 Minutes | 0 | 0.0% |
| 60 to 89 Minutes | 0 | 0.0% |
| 90 or more Minutes | 0 | 0.0% |
Commute Time by Sex in Ehrenberg
The most common commute times in Ehrenberg are 10 to 14 minutes (124 commuters, 41.3%) for males and 20 to 24 minutes (45 commuters, 69.2%) for females.
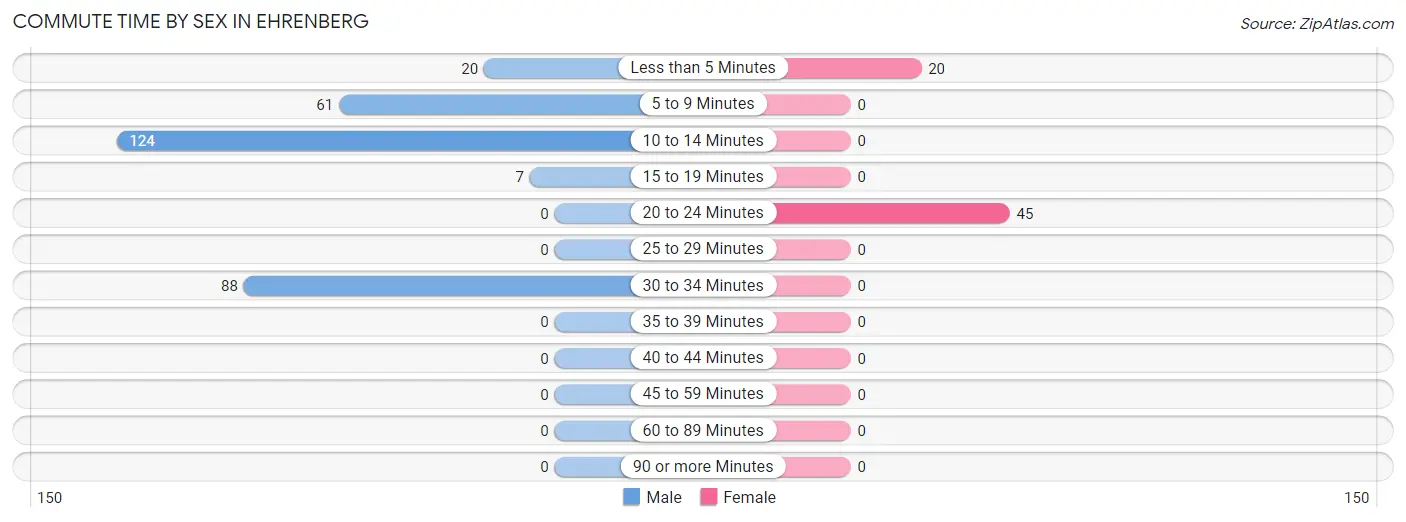
| Commute Time | Male | Female |
| Less than 5 Minutes | 20 (6.7%) | 20 (30.8%) |
| 5 to 9 Minutes | 61 (20.3%) | 0 (0.0%) |
| 10 to 14 Minutes | 124 (41.3%) | 0 (0.0%) |
| 15 to 19 Minutes | 7 (2.3%) | 0 (0.0%) |
| 20 to 24 Minutes | 0 (0.0%) | 45 (69.2%) |
| 25 to 29 Minutes | 0 (0.0%) | 0 (0.0%) |
| 30 to 34 Minutes | 88 (29.3%) | 0 (0.0%) |
| 35 to 39 Minutes | 0 (0.0%) | 0 (0.0%) |
| 40 to 44 Minutes | 0 (0.0%) | 0 (0.0%) |
| 45 to 59 Minutes | 0 (0.0%) | 0 (0.0%) |
| 60 to 89 Minutes | 0 (0.0%) | 0 (0.0%) |
| 90 or more Minutes | 0 (0.0%) | 0 (0.0%) |
Time of Departure to Work by Sex in Ehrenberg
The most frequent times of departure to work in Ehrenberg are 12:00 AM to 4:59 AM (105, 35.0%) for males and 12:00 PM to 3:59 PM (45, 69.2%) for females.
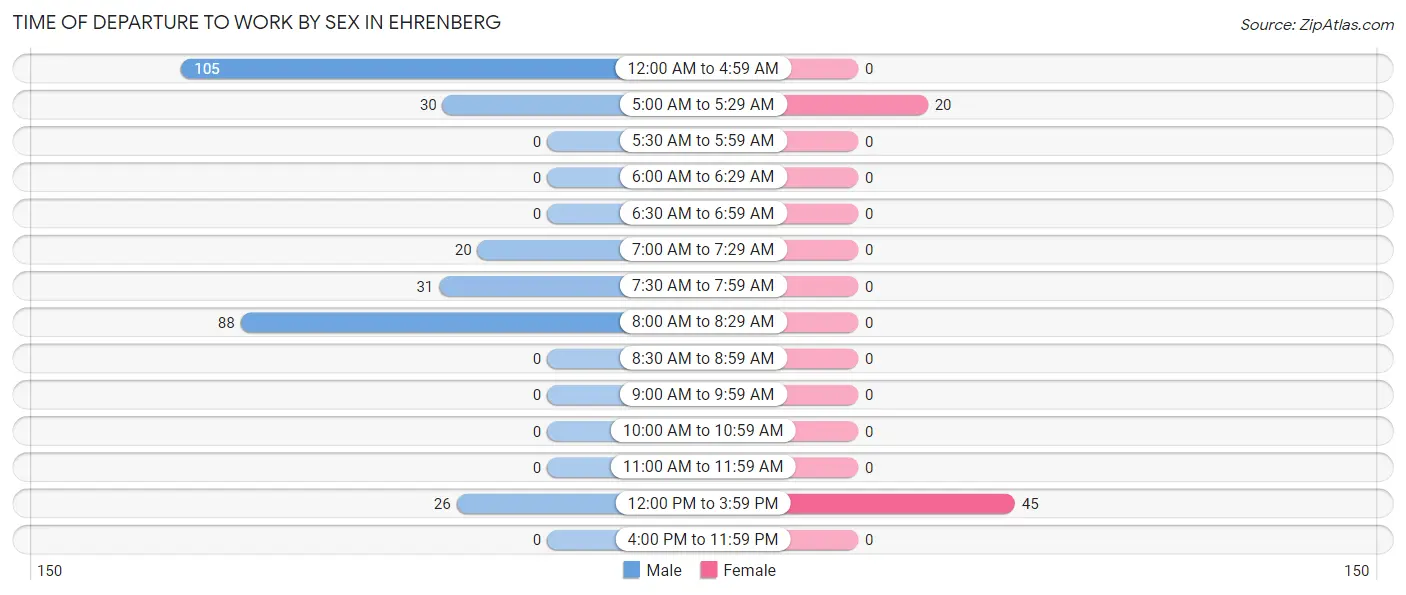
| Time of Departure | Male | Female |
| 12:00 AM to 4:59 AM | 105 (35.0%) | 0 (0.0%) |
| 5:00 AM to 5:29 AM | 30 (10.0%) | 20 (30.8%) |
| 5:30 AM to 5:59 AM | 0 (0.0%) | 0 (0.0%) |
| 6:00 AM to 6:29 AM | 0 (0.0%) | 0 (0.0%) |
| 6:30 AM to 6:59 AM | 0 (0.0%) | 0 (0.0%) |
| 7:00 AM to 7:29 AM | 20 (6.7%) | 0 (0.0%) |
| 7:30 AM to 7:59 AM | 31 (10.3%) | 0 (0.0%) |
| 8:00 AM to 8:29 AM | 88 (29.3%) | 0 (0.0%) |
| 8:30 AM to 8:59 AM | 0 (0.0%) | 0 (0.0%) |
| 9:00 AM to 9:59 AM | 0 (0.0%) | 0 (0.0%) |
| 10:00 AM to 10:59 AM | 0 (0.0%) | 0 (0.0%) |
| 11:00 AM to 11:59 AM | 0 (0.0%) | 0 (0.0%) |
| 12:00 PM to 3:59 PM | 26 (8.7%) | 45 (69.2%) |
| 4:00 PM to 11:59 PM | 0 (0.0%) | 0 (0.0%) |
| Total | 300 (100.0%) | 65 (100.0%) |
Housing Occupancy in Ehrenberg
Occupancy by Ownership in Ehrenberg
Of the total 621 dwellings in Ehrenberg, owner-occupied units account for 293 (47.2%), while renter-occupied units make up 328 (52.8%).
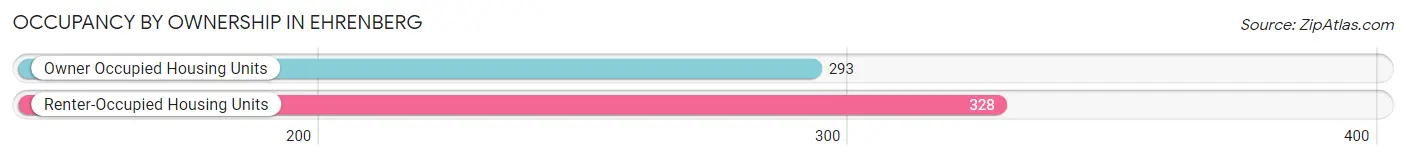
| Occupancy | # Housing Units | % Housing Units |
| Owner Occupied Housing Units | 293 | 47.2% |
| Renter-Occupied Housing Units | 328 | 52.8% |
| Total Occupied Housing Units | 621 | 100.0% |
Occupancy by Household Size in Ehrenberg
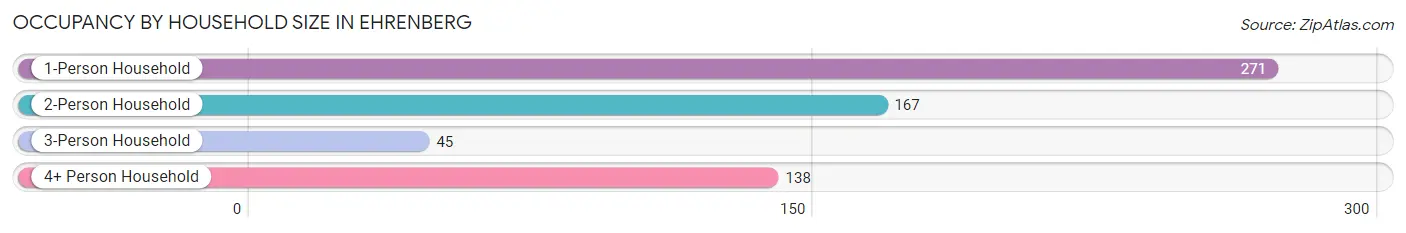
| Household Size | # Housing Units | % Housing Units |
| 1-Person Household | 271 | 43.6% |
| 2-Person Household | 167 | 26.9% |
| 3-Person Household | 45 | 7.2% |
| 4+ Person Household | 138 | 22.2% |
| Total Housing Units | 621 | 100.0% |
Occupancy by Ownership by Household Size in Ehrenberg
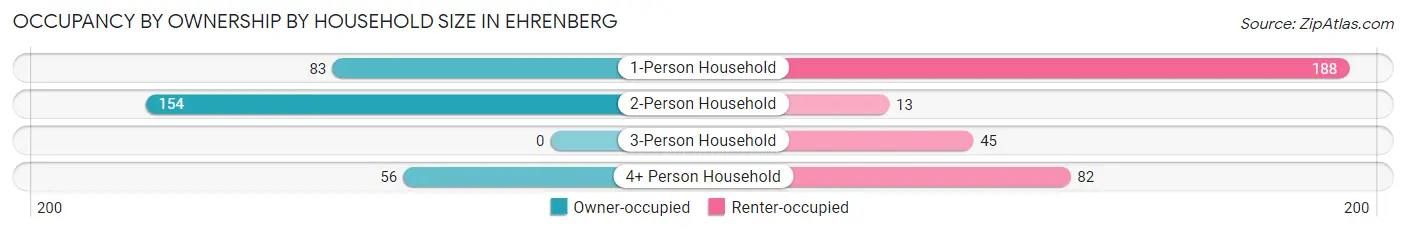
| Household Size | Owner-occupied | Renter-occupied |
| 1-Person Household | 83 (30.6%) | 188 (69.4%) |
| 2-Person Household | 154 (92.2%) | 13 (7.8%) |
| 3-Person Household | 0 (0.0%) | 45 (100.0%) |
| 4+ Person Household | 56 (40.6%) | 82 (59.4%) |
| Total Housing Units | 293 (47.2%) | 328 (52.8%) |
Occupancy by Educational Attainment in Ehrenberg
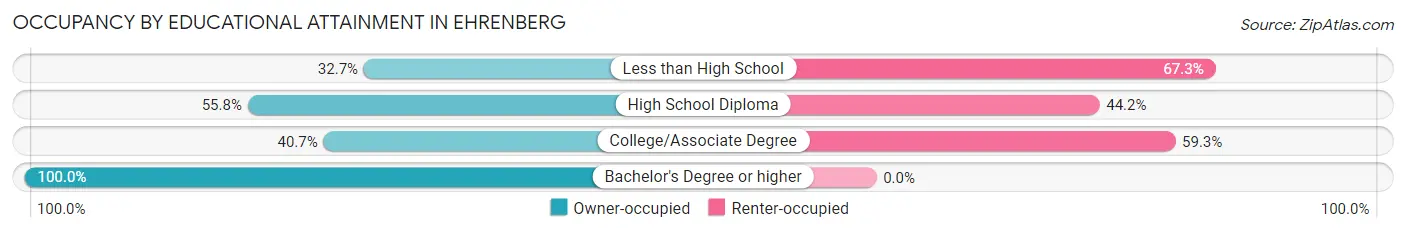
| Household Size | Owner-occupied | Renter-occupied |
| Less than High School | 18 (32.7%) | 37 (67.3%) |
| High School Diploma | 121 (55.8%) | 96 (44.2%) |
| College/Associate Degree | 134 (40.7%) | 195 (59.3%) |
| Bachelor's Degree or higher | 20 (100.0%) | 0 (0.0%) |
Occupancy by Age of Householder in Ehrenberg
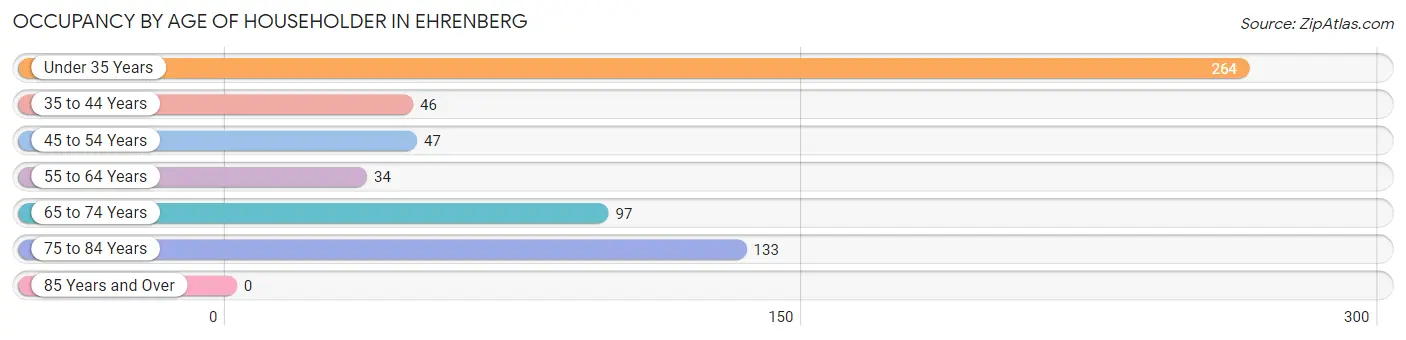
| Age Bracket | # Households | % Households |
| Under 35 Years | 264 | 42.5% |
| 35 to 44 Years | 46 | 7.4% |
| 45 to 54 Years | 47 | 7.6% |
| 55 to 64 Years | 34 | 5.5% |
| 65 to 74 Years | 97 | 15.6% |
| 75 to 84 Years | 133 | 21.4% |
| 85 Years and Over | 0 | 0.0% |
| Total | 621 | 100.0% |
Housing Finances in Ehrenberg
Median Income by Occupancy in Ehrenberg
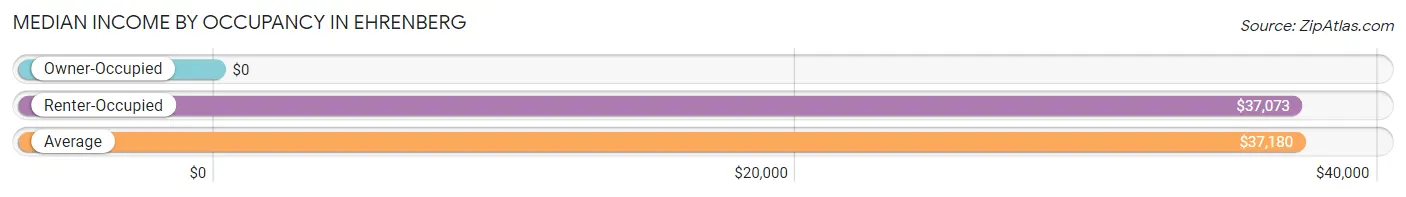
| Occupancy Type | # Households | Median Income |
| Owner-Occupied | 293 (47.2%) | $0 |
| Renter-Occupied | 328 (52.8%) | $37,073 |
| Average | 621 (100.0%) | $37,180 |
Occupancy by Householder Income Bracket in Ehrenberg
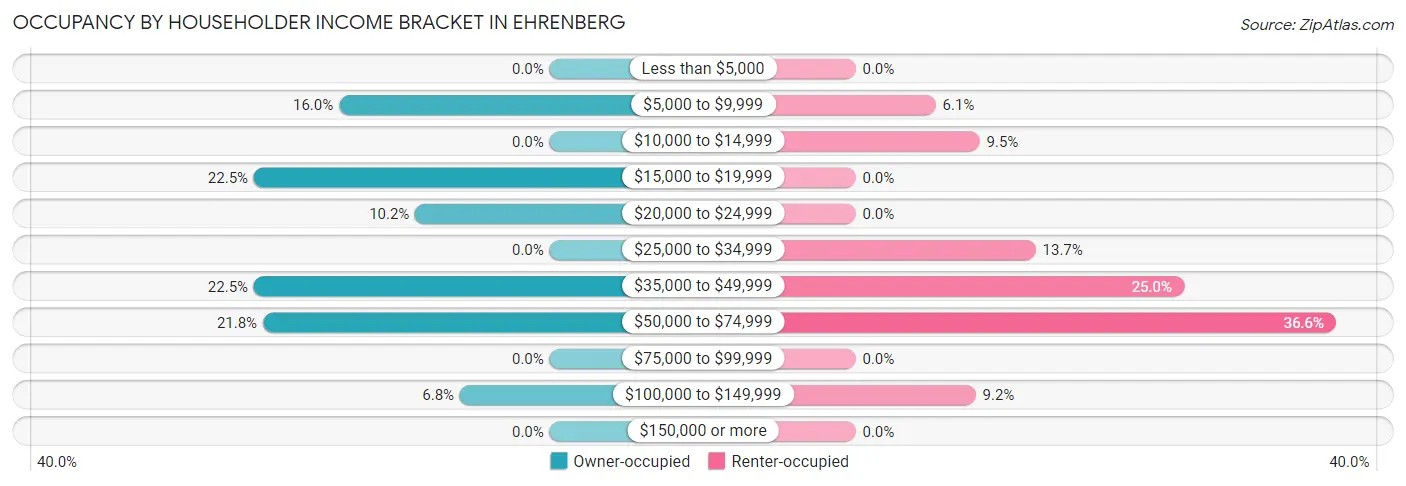
| Income Bracket | Owner-occupied | Renter-occupied |
| Less than $5,000 | 0 (0.0%) | 0 (0.0%) |
| $5,000 to $9,999 | 47 (16.0%) | 20 (6.1%) |
| $10,000 to $14,999 | 0 (0.0%) | 31 (9.5%) |
| $15,000 to $19,999 | 66 (22.5%) | 0 (0.0%) |
| $20,000 to $24,999 | 30 (10.2%) | 0 (0.0%) |
| $25,000 to $34,999 | 0 (0.0%) | 45 (13.7%) |
| $35,000 to $49,999 | 66 (22.5%) | 82 (25.0%) |
| $50,000 to $74,999 | 64 (21.8%) | 120 (36.6%) |
| $75,000 to $99,999 | 0 (0.0%) | 0 (0.0%) |
| $100,000 to $149,999 | 20 (6.8%) | 30 (9.1%) |
| $150,000 or more | 0 (0.0%) | 0 (0.0%) |
| Total | 293 (100.0%) | 328 (100.0%) |
Monthly Housing Cost Tiers in Ehrenberg
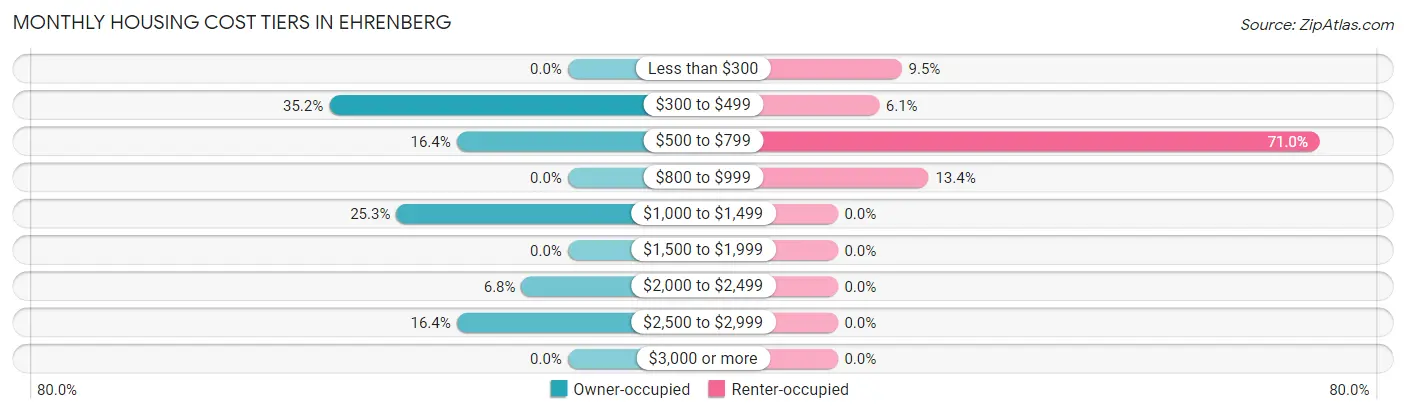
| Monthly Cost | Owner-occupied | Renter-occupied |
| Less than $300 | 0 (0.0%) | 31 (9.5%) |
| $300 to $499 | 103 (35.1%) | 20 (6.1%) |
| $500 to $799 | 48 (16.4%) | 233 (71.0%) |
| $800 to $999 | 0 (0.0%) | 44 (13.4%) |
| $1,000 to $1,499 | 74 (25.3%) | 0 (0.0%) |
| $1,500 to $1,999 | 0 (0.0%) | 0 (0.0%) |
| $2,000 to $2,499 | 20 (6.8%) | 0 (0.0%) |
| $2,500 to $2,999 | 48 (16.4%) | 0 (0.0%) |
| $3,000 or more | 0 (0.0%) | 0 (0.0%) |
| Total | 293 (100.0%) | 328 (100.0%) |
Physical Housing Characteristics in Ehrenberg
Housing Structures in Ehrenberg
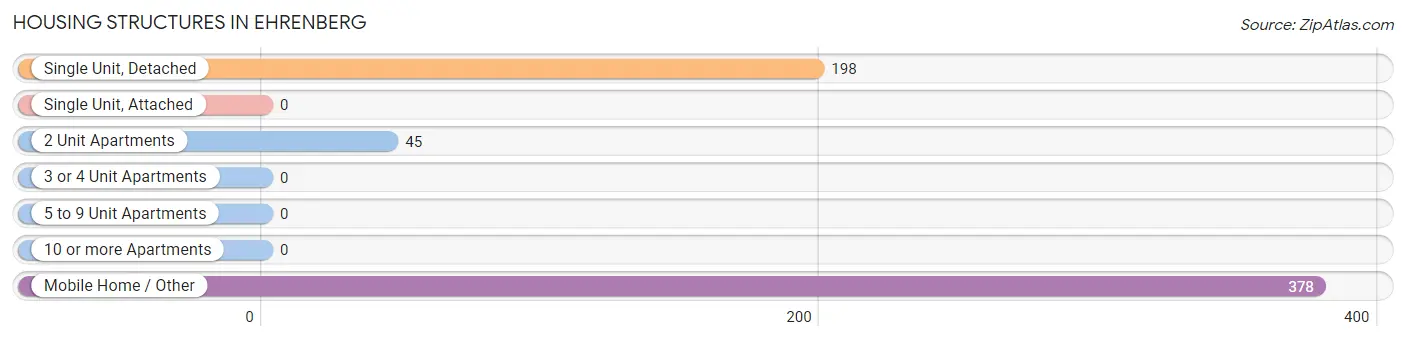
| Structure Type | # Housing Units | % Housing Units |
| Single Unit, Detached | 198 | 31.9% |
| Single Unit, Attached | 0 | 0.0% |
| 2 Unit Apartments | 45 | 7.2% |
| 3 or 4 Unit Apartments | 0 | 0.0% |
| 5 to 9 Unit Apartments | 0 | 0.0% |
| 10 or more Apartments | 0 | 0.0% |
| Mobile Home / Other | 378 | 60.9% |
| Total | 621 | 100.0% |
Housing Structures by Occupancy in Ehrenberg
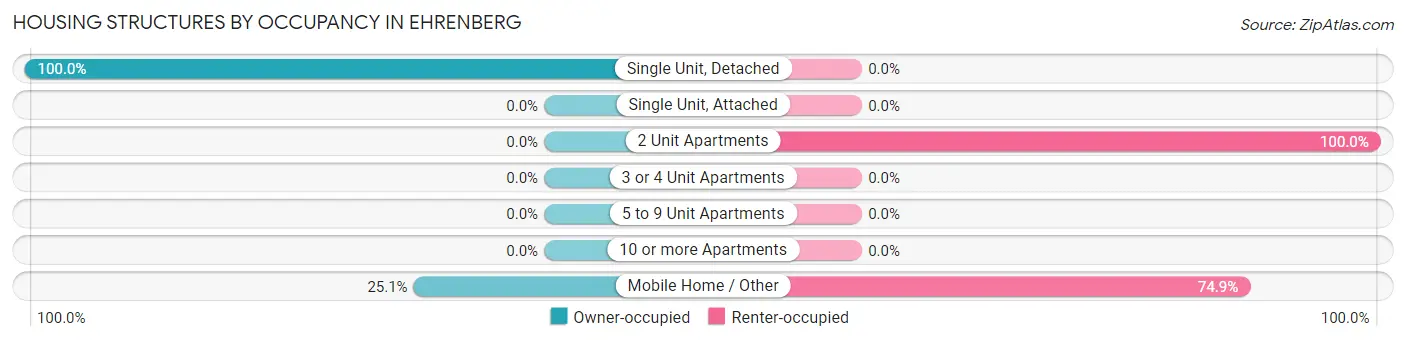
| Structure Type | Owner-occupied | Renter-occupied |
| Single Unit, Detached | 198 (100.0%) | 0 (0.0%) |
| Single Unit, Attached | 0 (0.0%) | 0 (0.0%) |
| 2 Unit Apartments | 0 (0.0%) | 45 (100.0%) |
| 3 or 4 Unit Apartments | 0 (0.0%) | 0 (0.0%) |
| 5 to 9 Unit Apartments | 0 (0.0%) | 0 (0.0%) |
| 10 or more Apartments | 0 (0.0%) | 0 (0.0%) |
| Mobile Home / Other | 95 (25.1%) | 283 (74.9%) |
| Total | 293 (47.2%) | 328 (52.8%) |
Housing Structures by Number of Rooms in Ehrenberg
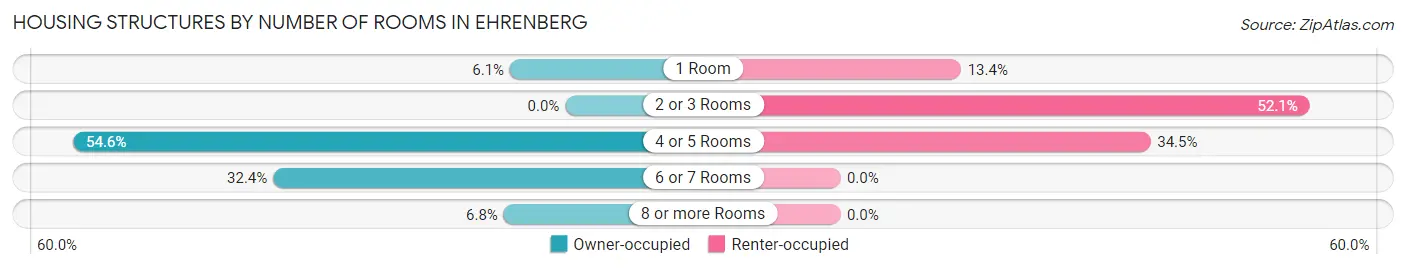
| Number of Rooms | Owner-occupied | Renter-occupied |
| 1 Room | 18 (6.1%) | 44 (13.4%) |
| 2 or 3 Rooms | 0 (0.0%) | 171 (52.1%) |
| 4 or 5 Rooms | 160 (54.6%) | 113 (34.4%) |
| 6 or 7 Rooms | 95 (32.4%) | 0 (0.0%) |
| 8 or more Rooms | 20 (6.8%) | 0 (0.0%) |
| Total | 293 (100.0%) | 328 (100.0%) |
Housing Structure by Heating Type in Ehrenberg
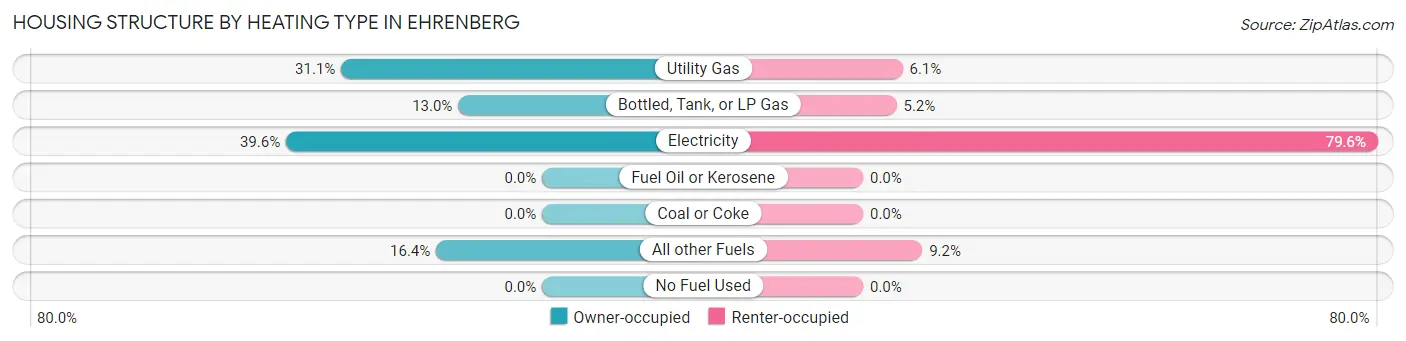
| Heating Type | Owner-occupied | Renter-occupied |
| Utility Gas | 91 (31.1%) | 20 (6.1%) |
| Bottled, Tank, or LP Gas | 38 (13.0%) | 17 (5.2%) |
| Electricity | 116 (39.6%) | 261 (79.6%) |
| Fuel Oil or Kerosene | 0 (0.0%) | 0 (0.0%) |
| Coal or Coke | 0 (0.0%) | 0 (0.0%) |
| All other Fuels | 48 (16.4%) | 30 (9.1%) |
| No Fuel Used | 0 (0.0%) | 0 (0.0%) |
| Total | 293 (100.0%) | 328 (100.0%) |
Household Vehicle Usage in Ehrenberg
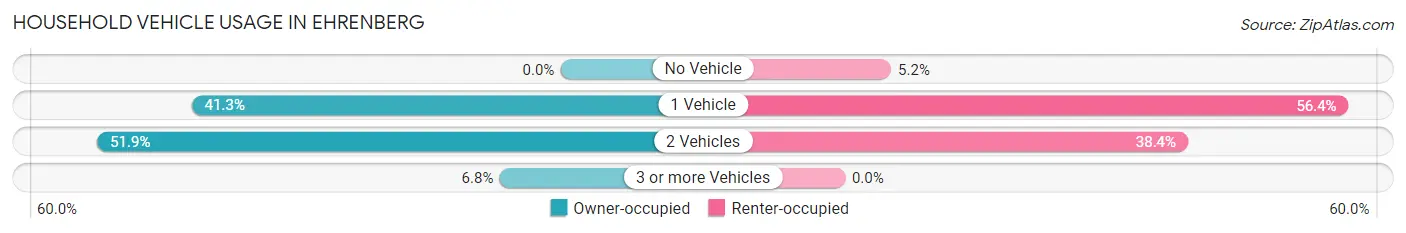
| Vehicles per Household | Owner-occupied | Renter-occupied |
| No Vehicle | 0 (0.0%) | 17 (5.2%) |
| 1 Vehicle | 121 (41.3%) | 185 (56.4%) |
| 2 Vehicles | 152 (51.9%) | 126 (38.4%) |
| 3 or more Vehicles | 20 (6.8%) | 0 (0.0%) |
| Total | 293 (100.0%) | 328 (100.0%) |
Real Estate & Mortgages in Ehrenberg
Real Estate and Mortgage Overview in Ehrenberg
| Characteristic | Without Mortgage | With Mortgage |
| Housing Units | 133 | 160 |
| Median Property Value | $79,600 | $0 |
| Median Household Income | - | - |
| Monthly Housing Costs | $376 | $0 |
| Real Estate Taxes | $471 | $0 |
Property Value by Mortgage Status in Ehrenberg
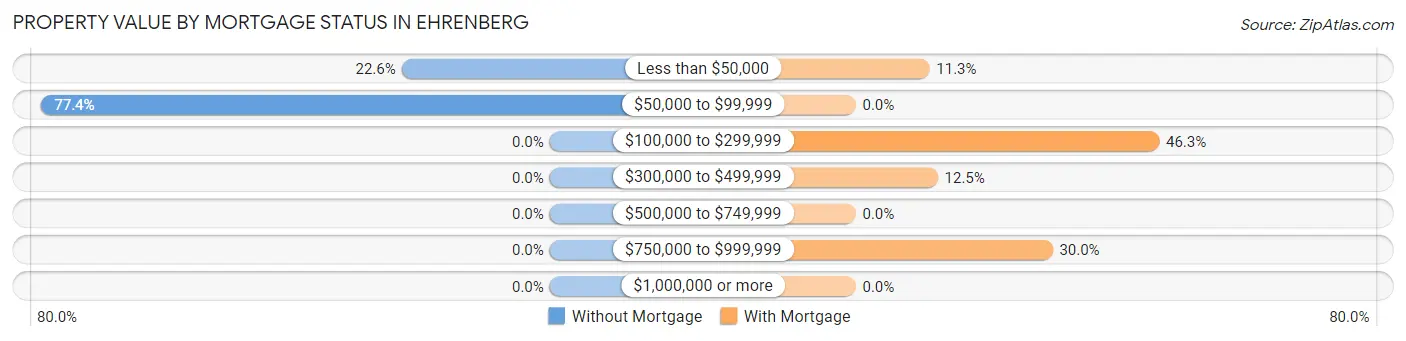
| Property Value | Without Mortgage | With Mortgage |
| Less than $50,000 | 30 (22.6%) | 18 (11.3%) |
| $50,000 to $99,999 | 103 (77.4%) | 0 (0.0%) |
| $100,000 to $299,999 | 0 (0.0%) | 74 (46.3%) |
| $300,000 to $499,999 | 0 (0.0%) | 20 (12.5%) |
| $500,000 to $749,999 | 0 (0.0%) | 0 (0.0%) |
| $750,000 to $999,999 | 0 (0.0%) | 48 (30.0%) |
| $1,000,000 or more | 0 (0.0%) | 0 (0.0%) |
| Total | 133 (100.0%) | 160 (100.0%) |
Household Income by Mortgage Status in Ehrenberg
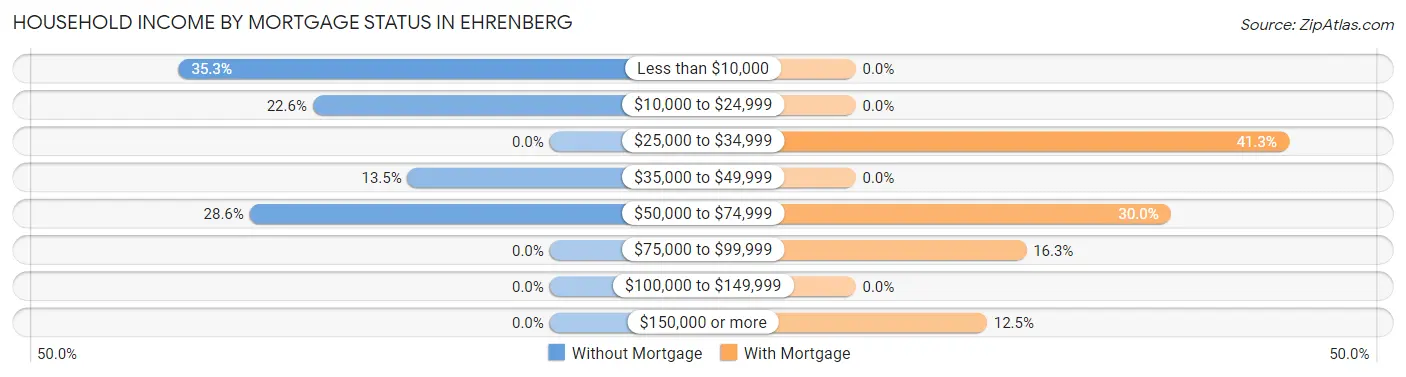
| Household Income | Without Mortgage | With Mortgage |
| Less than $10,000 | 47 (35.3%) | 0 (0.0%) |
| $10,000 to $24,999 | 30 (22.6%) | 0 (0.0%) |
| $25,000 to $34,999 | 0 (0.0%) | 66 (41.2%) |
| $35,000 to $49,999 | 18 (13.5%) | 0 (0.0%) |
| $50,000 to $74,999 | 38 (28.6%) | 48 (30.0%) |
| $75,000 to $99,999 | 0 (0.0%) | 26 (16.3%) |
| $100,000 to $149,999 | 0 (0.0%) | 0 (0.0%) |
| $150,000 or more | 0 (0.0%) | 20 (12.5%) |
| Total | 133 (100.0%) | 160 (100.0%) |
Property Value to Household Income Ratio in Ehrenberg
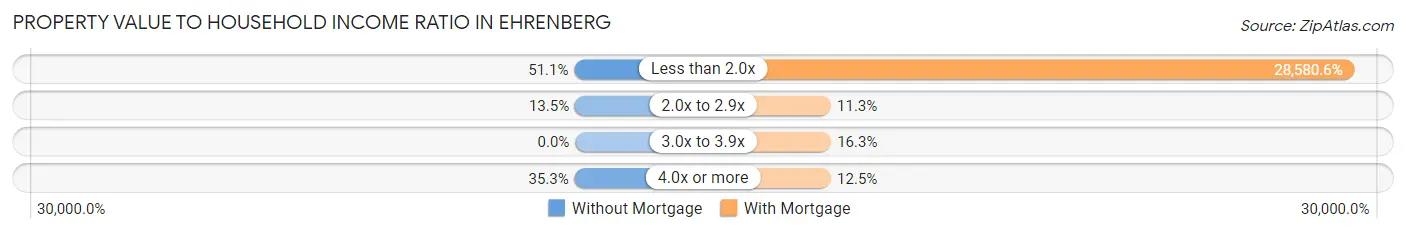
| Value-to-Income Ratio | Without Mortgage | With Mortgage |
| Less than 2.0x | 68 (51.1%) | 45,729 (28,580.6%) |
| 2.0x to 2.9x | 18 (13.5%) | 18 (11.3%) |
| 3.0x to 3.9x | 0 (0.0%) | 26 (16.3%) |
| 4.0x or more | 47 (35.3%) | 20 (12.5%) |
| Total | 133 (100.0%) | 160 (100.0%) |
Real Estate Taxes by Mortgage Status in Ehrenberg
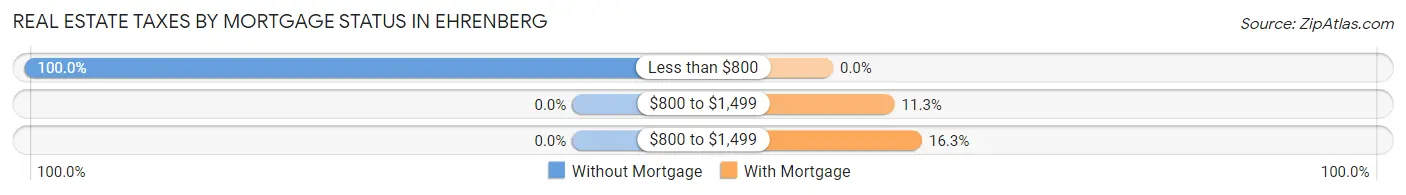
| Property Taxes | Without Mortgage | With Mortgage |
| Less than $800 | 133 (100.0%) | 0 (0.0%) |
| $800 to $1,499 | 0 (0.0%) | 18 (11.3%) |
| $800 to $1,499 | 0 (0.0%) | 26 (16.3%) |
| Total | 133 (100.0%) | 160 (100.0%) |
Health & Disability in Ehrenberg
Health Insurance Coverage by Age in Ehrenberg
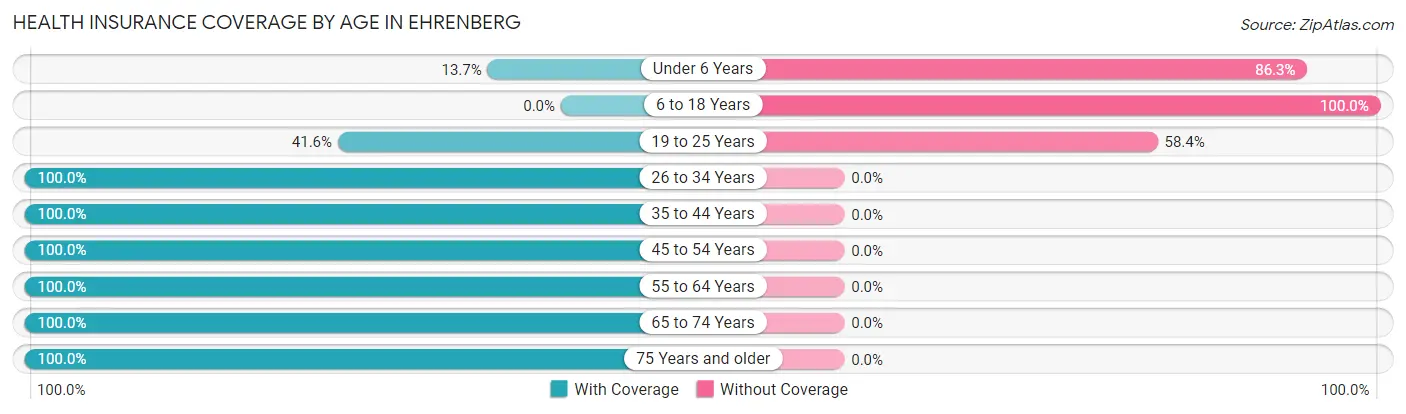
| Age Bracket | With Coverage | Without Coverage |
| Under 6 Years | 19 (13.7%) | 120 (86.3%) |
| 6 to 18 Years | 0 (0.0%) | 42 (100.0%) |
| 19 to 25 Years | 121 (41.6%) | 170 (58.4%) |
| 26 to 34 Years | 84 (100.0%) | 0 (0.0%) |
| 35 to 44 Years | 46 (100.0%) | 0 (0.0%) |
| 45 to 54 Years | 89 (100.0%) | 0 (0.0%) |
| 55 to 64 Years | 63 (100.0%) | 0 (0.0%) |
| 65 to 74 Years | 121 (100.0%) | 0 (0.0%) |
| 75 Years and older | 137 (100.0%) | 0 (0.0%) |
| Total | 680 (67.2%) | 332 (32.8%) |
Health Insurance Coverage by Citizenship Status in Ehrenberg
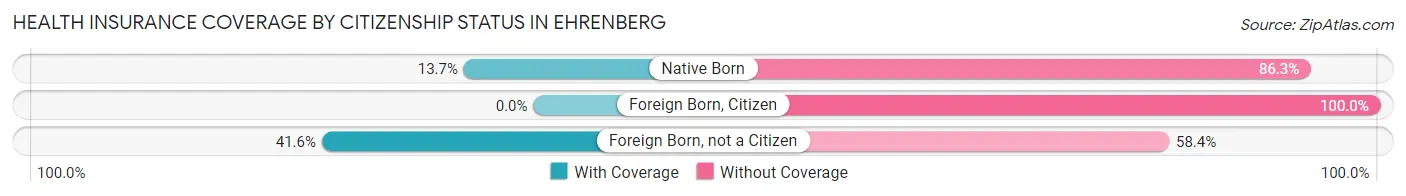
| Citizenship Status | With Coverage | Without Coverage |
| Native Born | 19 (13.7%) | 120 (86.3%) |
| Foreign Born, Citizen | 0 (0.0%) | 42 (100.0%) |
| Foreign Born, not a Citizen | 121 (41.6%) | 170 (58.4%) |
Health Insurance Coverage by Household Income in Ehrenberg
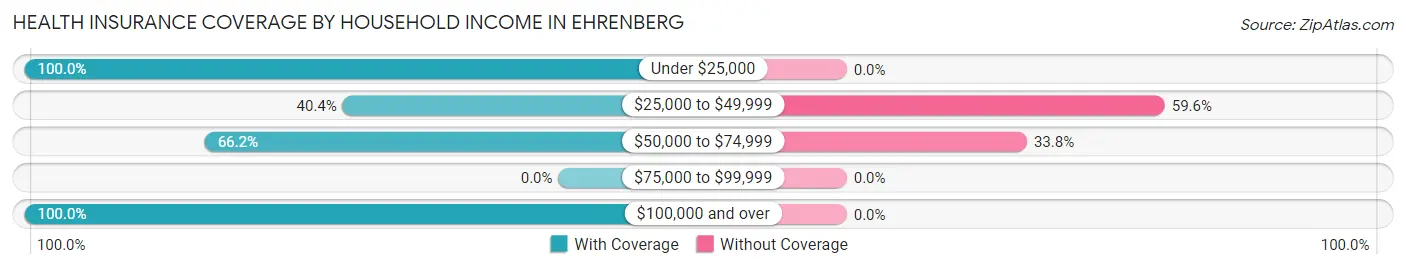
| Household Income | With Coverage | Without Coverage |
| Under $25,000 | 250 (100.0%) | 0 (0.0%) |
| $25,000 to $49,999 | 154 (40.4%) | 227 (59.6%) |
| $50,000 to $74,999 | 206 (66.2%) | 105 (33.8%) |
| $75,000 to $99,999 | 0 (0.0%) | 0 (0.0%) |
| $100,000 and over | 70 (100.0%) | 0 (0.0%) |
Public vs Private Health Insurance Coverage by Age in Ehrenberg
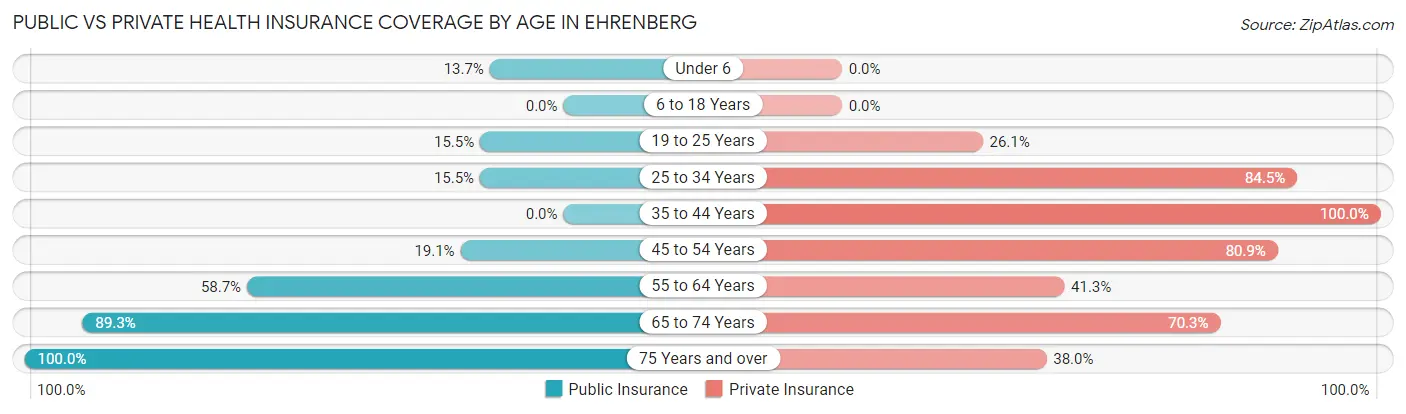
| Age Bracket | Public Insurance | Private Insurance |
| Under 6 | 19 (13.7%) | 0 (0.0%) |
| 6 to 18 Years | 0 (0.0%) | 0 (0.0%) |
| 19 to 25 Years | 45 (15.5%) | 76 (26.1%) |
| 25 to 34 Years | 13 (15.5%) | 71 (84.5%) |
| 35 to 44 Years | 0 (0.0%) | 46 (100.0%) |
| 45 to 54 Years | 17 (19.1%) | 72 (80.9%) |
| 55 to 64 Years | 37 (58.7%) | 26 (41.3%) |
| 65 to 74 Years | 108 (89.3%) | 85 (70.3%) |
| 75 Years and over | 137 (100.0%) | 52 (38.0%) |
| Total | 376 (37.1%) | 428 (42.3%) |
Disability Status by Sex by Age in Ehrenberg
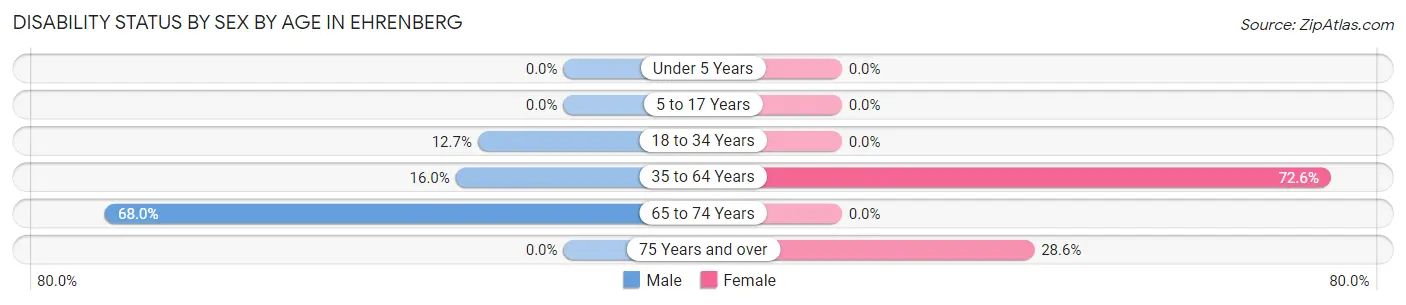
| Age Bracket | Male | Female |
| Under 5 Years | 0 (0.0%) | 0 (0.0%) |
| 5 to 17 Years | 0 (0.0%) | 0 (0.0%) |
| 18 to 34 Years | 30 (12.7%) | 0 (0.0%) |
| 35 to 64 Years | 20 (16.0%) | 53 (72.6%) |
| 65 to 74 Years | 66 (68.0%) | 0 (0.0%) |
| 75 Years and over | 0 (0.0%) | 38 (28.6%) |
Disability Class by Sex by Age in Ehrenberg
Disability Class: Hearing Difficulty
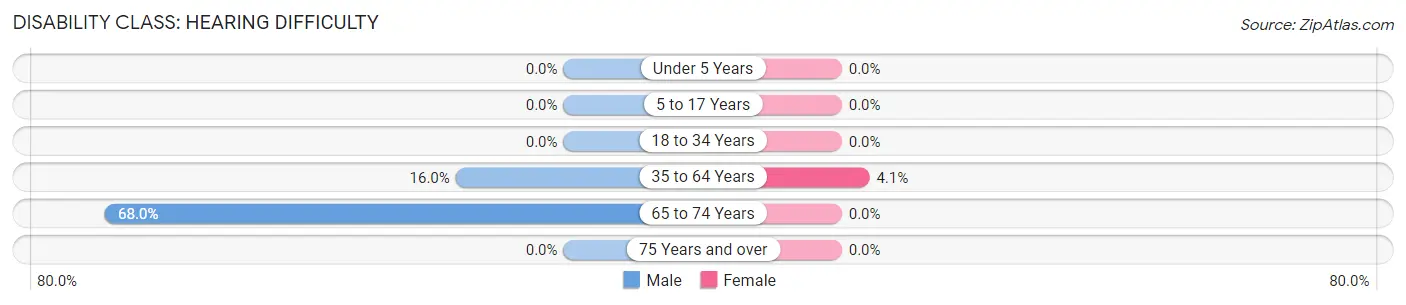
| Age Bracket | Male | Female |
| Under 5 Years | 0 (0.0%) | 0 (0.0%) |
| 5 to 17 Years | 0 (0.0%) | 0 (0.0%) |
| 18 to 34 Years | 0 (0.0%) | 0 (0.0%) |
| 35 to 64 Years | 20 (16.0%) | 3 (4.1%) |
| 65 to 74 Years | 66 (68.0%) | 0 (0.0%) |
| 75 Years and over | 0 (0.0%) | 0 (0.0%) |
Disability Class: Vision Difficulty
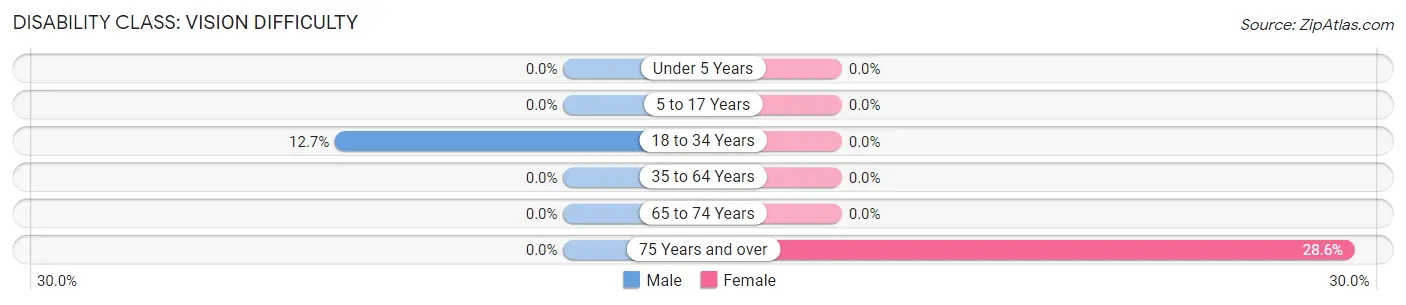
| Age Bracket | Male | Female |
| Under 5 Years | 0 (0.0%) | 0 (0.0%) |
| 5 to 17 Years | 0 (0.0%) | 0 (0.0%) |
| 18 to 34 Years | 30 (12.7%) | 0 (0.0%) |
| 35 to 64 Years | 0 (0.0%) | 0 (0.0%) |
| 65 to 74 Years | 0 (0.0%) | 0 (0.0%) |
| 75 Years and over | 0 (0.0%) | 38 (28.6%) |
Disability Class: Cognitive Difficulty
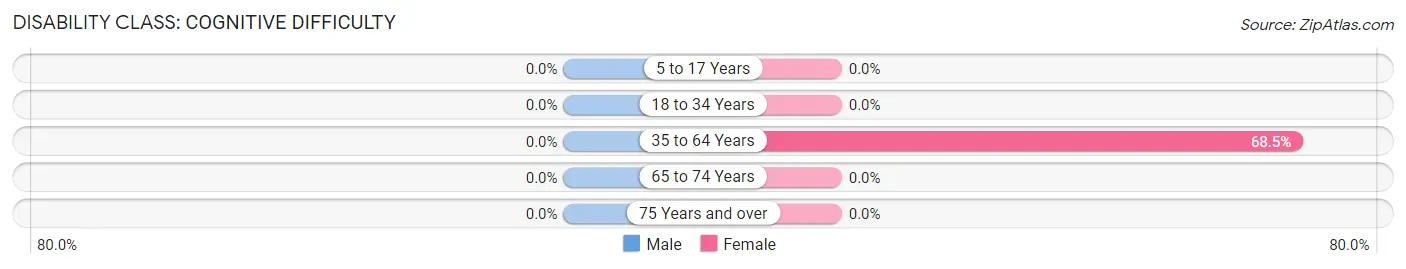
| Age Bracket | Male | Female |
| 5 to 17 Years | 0 (0.0%) | 0 (0.0%) |
| 18 to 34 Years | 0 (0.0%) | 0 (0.0%) |
| 35 to 64 Years | 0 (0.0%) | 50 (68.5%) |
| 65 to 74 Years | 0 (0.0%) | 0 (0.0%) |
| 75 Years and over | 0 (0.0%) | 0 (0.0%) |
Disability Class: Ambulatory Difficulty
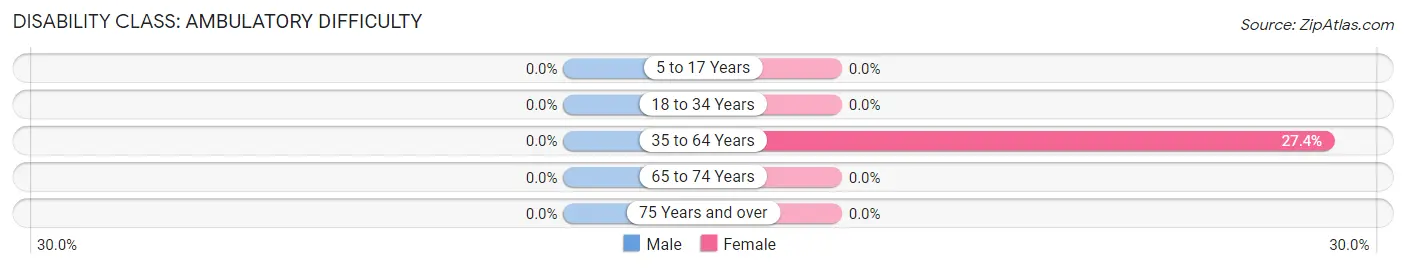
| Age Bracket | Male | Female |
| 5 to 17 Years | 0 (0.0%) | 0 (0.0%) |
| 18 to 34 Years | 0 (0.0%) | 0 (0.0%) |
| 35 to 64 Years | 0 (0.0%) | 20 (27.4%) |
| 65 to 74 Years | 0 (0.0%) | 0 (0.0%) |
| 75 Years and over | 0 (0.0%) | 0 (0.0%) |
Disability Class: Self-Care Difficulty
| Age Bracket | Male | Female |
| 5 to 17 Years | 0 (0.0%) | 0 (0.0%) |
| 18 to 34 Years | 0 (0.0%) | 0 (0.0%) |
| 35 to 64 Years | 0 (0.0%) | 0 (0.0%) |
| 65 to 74 Years | 0 (0.0%) | 0 (0.0%) |
| 75 Years and over | 0 (0.0%) | 0 (0.0%) |
Technology Access in Ehrenberg
Computing Device Access in Ehrenberg
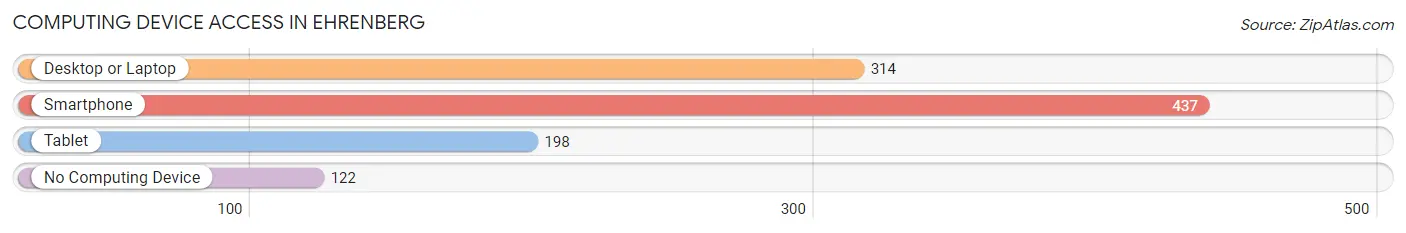
| Device Type | # Households | % Households |
| Desktop or Laptop | 314 | 50.6% |
| Smartphone | 437 | 70.4% |
| Tablet | 198 | 31.9% |
| No Computing Device | 122 | 19.7% |
| Total | 621 | 100.0% |
Internet Access in Ehrenberg
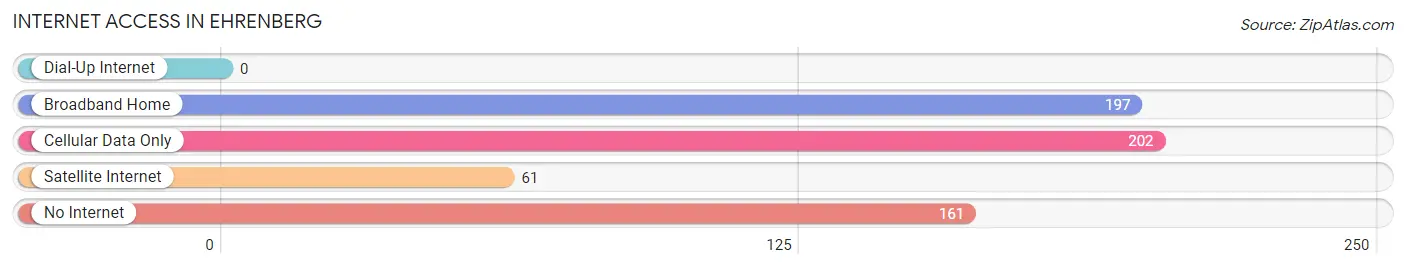
| Internet Type | # Households | % Households |
| Dial-Up Internet | 0 | 0.0% |
| Broadband Home | 197 | 31.7% |
| Cellular Data Only | 202 | 32.5% |
| Satellite Internet | 61 | 9.8% |
| No Internet | 161 | 25.9% |
| Total | 621 | 100.0% |
Ehrenberg Summary
Erhenberg, Arizona is a small town located in La Paz County, Arizona. It is situated on the Colorado River, just south of the California border. The town was founded in 1877 by German immigrant, John Ehrenberg, and was named after him. The town has a population of approximately 1,000 people and is located in the Sonoran Desert.
Geography
Ehrenberg is located in the Sonoran Desert, which is characterized by hot, dry summers and mild winters. The town is situated on the Colorado River, which provides a source of water for the area. The town is surrounded by mountains, including the Chocolate Mountains to the east and the Buckskin Mountains to the west. The town is located at an elevation of 1,000 feet above sea level.
Economy
The economy of Ehrenberg is largely based on agriculture and tourism. The town is home to several farms, which produce a variety of crops, including cotton, alfalfa, and melons. The town is also home to several tourist attractions, including the Ehrenberg Sand Dunes, which are popular for off-roading and camping. The town is also home to several restaurants, bars, and other businesses.
Demographics
As of the 2010 census, the population of Ehrenberg was 1,000 people. The racial makeup of the town was 94.2% White, 0.7% African American, 0.3% Native American, 0.2% Asian, 0.1% Pacific Islander, and 4.5% from other races. The median household income was $30,000, and the median age was 37.
History
Ehrenberg was founded in 1877 by German immigrant, John Ehrenberg. The town was originally a trading post and was used as a stopover for travelers on their way to California. The town was also a popular spot for prospectors during the gold rush. In the early 1900s, the town was home to several businesses, including a hotel, saloon, and general store.
In the 1950s, the town began to decline as the population shifted to larger cities. In the 1970s, the town was revitalized by the construction of a new bridge over the Colorado River. This bridge allowed for easier access to the town and helped to attract new businesses and residents.
Today, Ehrenberg is a small, rural town with a population of approximately 1,000 people. The town is home to several farms, businesses, and tourist attractions. The town is also home to several restaurants, bars, and other businesses. The town is a popular destination for off-roading and camping, and is a great place to experience the beauty of the Sonoran Desert.
Common Questions
What is Per Capita Income in Ehrenberg?
Per Capita income in Ehrenberg is $22,260.
What is the Median Household income in Ehrenberg?
Median Household Income in Ehrenberg is $37,180.
What is Inequality or Gini Index in Ehrenberg?
Inequality or Gini Index in Ehrenberg is 0.36.
What is the Total Population of Ehrenberg?
Total Population of Ehrenberg is 1,012.
What is the Total Male Population of Ehrenberg?
Total Male Population of Ehrenberg is 531.
What is the Total Female Population of Ehrenberg?
Total Female Population of Ehrenberg is 481.
What is the Ratio of Males per 100 Females in Ehrenberg?
There are 110.40 Males per 100 Females in Ehrenberg.
What is the Ratio of Females per 100 Males in Ehrenberg?
There are 90.58 Females per 100 Males in Ehrenberg.
What is the Median Population Age in Ehrenberg?
Median Population Age in Ehrenberg is 30.4 Years.
What is the Average Family Size in Ehrenberg
Average Family Size in Ehrenberg is 1.6 People.
What is the Average Household Size in Ehrenberg
Average Household Size in Ehrenberg is 1.6 People.
How Large is the Labor Force in Ehrenberg?
There are 423 People in the Labor Forcein in Ehrenberg.
What is the Percentage of People in the Labor Force in Ehrenberg?
50.9% of People are in the Labor Force in Ehrenberg.
What is the Unemployment Rate in Ehrenberg?
Unemployment Rate in Ehrenberg is 9.7%.