Soldier Creek, SD Map & Demographics
Soldier Creek Map
Soldier Creek Overview
$8,830
PER CAPITA INCOME
0.73
INEQUALITY / GINI INDEX
286
TOTAL POPULATION
90
MALE POPULATION
196
FEMALE POPULATION
45.92
MALES / 100 FEMALES
217.78
FEMALES / 100 MALES
18.2
MEDIAN AGE
6.2
AVG FAMILY SIZE
4.9
AVG HOUSEHOLD SIZE
32
LABOR FORCE [ PEOPLE ]
21.2%
PERCENT IN LABOR FORCE
53.1%
UNEMPLOYMENT RATE
Income in Soldier Creek
Income Overview in Soldier Creek
| Characteristic | Number | Measure |
| Per Capita Income | 286 | $8,830 |
| Median Family Income | 41 | $0 |
| Mean Family Income | 41 | $65,154 |
| Median Household Income | 58 | $0 |
| Mean Household Income | 58 | $47,403 |
| Income Deficit | 41 | $0 |
| Wage / Income Gap (%) | 286 | 0.00% |
| Wage / Income Gap ($) | 286 | 100.00¢ per $1 |
| Gini / Inequality Index | 286 | 0.73 |
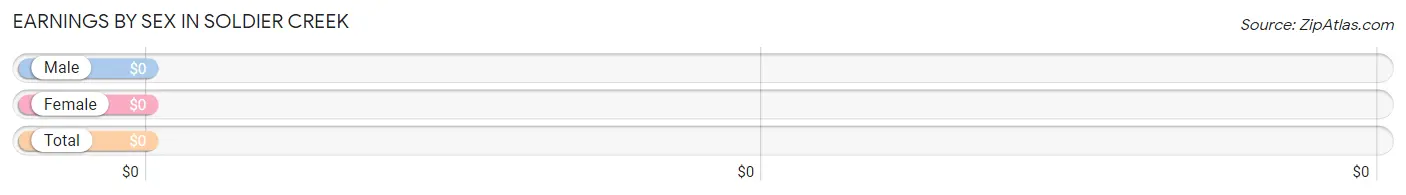
Earnings by Sex in Soldier Creek
| Sex | Number | Average Earnings |
| Male | 15 (65.2%) | $0 |
| Female | 8 (34.8%) | $0 |
| Total | 23 (100.0%) | $0 |
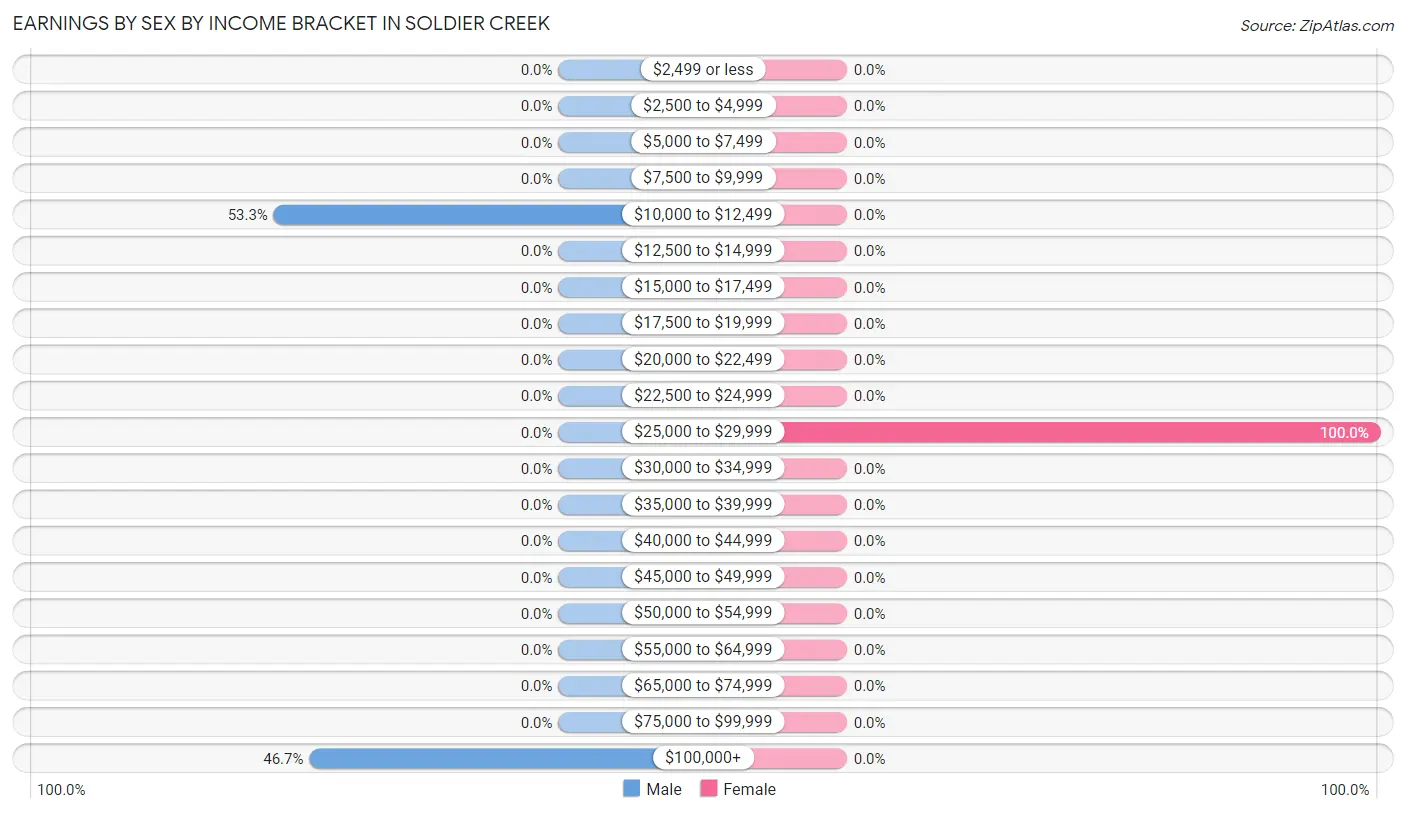
Earnings by Sex by Income Bracket in Soldier Creek
The most common earnings brackets in Soldier Creek are $10,000 to $12,499 for men (8 | 53.3%) and $25,000 to $29,999 for women (8 | 100.0%).
| Income | Male | Female |
| $2,499 or less | 0 (0.0%) | 0 (0.0%) |
| $2,500 to $4,999 | 0 (0.0%) | 0 (0.0%) |
| $5,000 to $7,499 | 0 (0.0%) | 0 (0.0%) |
| $7,500 to $9,999 | 0 (0.0%) | 0 (0.0%) |
| $10,000 to $12,499 | 8 (53.3%) | 0 (0.0%) |
| $12,500 to $14,999 | 0 (0.0%) | 0 (0.0%) |
| $15,000 to $17,499 | 0 (0.0%) | 0 (0.0%) |
| $17,500 to $19,999 | 0 (0.0%) | 0 (0.0%) |
| $20,000 to $22,499 | 0 (0.0%) | 0 (0.0%) |
| $22,500 to $24,999 | 0 (0.0%) | 0 (0.0%) |
| $25,000 to $29,999 | 0 (0.0%) | 8 (100.0%) |
| $30,000 to $34,999 | 0 (0.0%) | 0 (0.0%) |
| $35,000 to $39,999 | 0 (0.0%) | 0 (0.0%) |
| $40,000 to $44,999 | 0 (0.0%) | 0 (0.0%) |
| $45,000 to $49,999 | 0 (0.0%) | 0 (0.0%) |
| $50,000 to $54,999 | 0 (0.0%) | 0 (0.0%) |
| $55,000 to $64,999 | 0 (0.0%) | 0 (0.0%) |
| $65,000 to $74,999 | 0 (0.0%) | 0 (0.0%) |
| $75,000 to $99,999 | 0 (0.0%) | 0 (0.0%) |
| $100,000+ | 7 (46.7%) | 0 (0.0%) |
| Total | 15 (100.0%) | 8 (100.0%) |
Earnings by Sex by Educational Attainment in Soldier Creek
| Educational Attainment | Male Income | Female Income |
| Less than High School | - | - |
| High School Diploma | - | - |
| College or Associate's Degree | - | - |
| Bachelor's Degree | - | - |
| Graduate Degree | - | - |
| Total | - | - |
Family Income in Soldier Creek
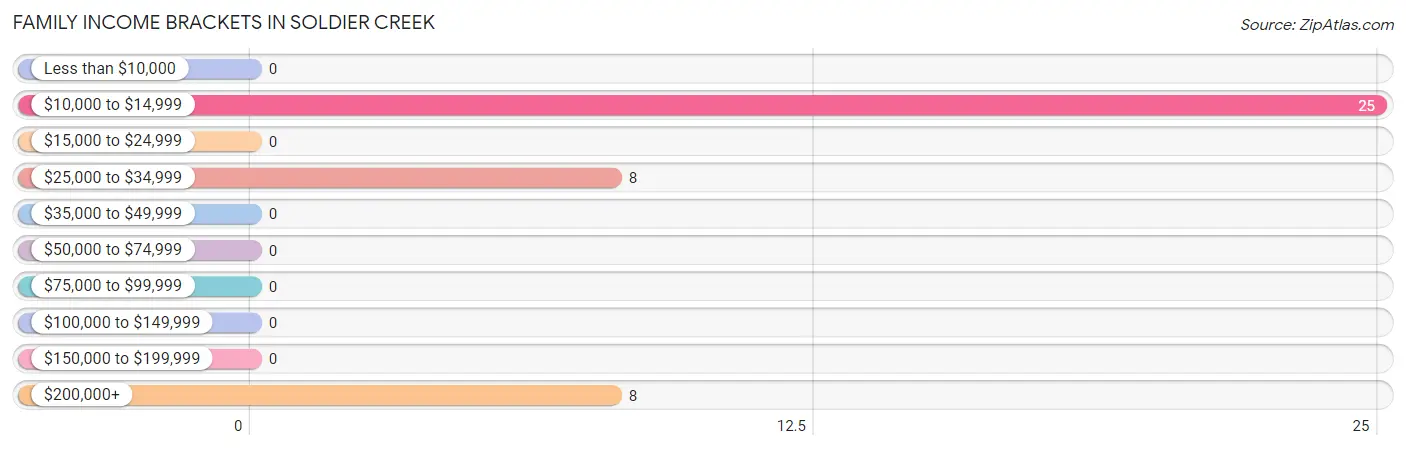
Family Income Brackets in Soldier Creek
According to the Soldier Creek family income data, there are 25 families falling into the $10,000 to $14,999 income range, which is the most common income bracket and makes up 61.0% of all families.
| Income Bracket | # Families | % Families |
| Less than $10,000 | 0 | 0.0% |
| $10,000 to $14,999 | 25 | 61.0% |
| $15,000 to $24,999 | 0 | 0.0% |
| $25,000 to $34,999 | 8 | 19.5% |
| $35,000 to $49,999 | 0 | 0.0% |
| $50,000 to $74,999 | 0 | 0.0% |
| $75,000 to $99,999 | 0 | 0.0% |
| $100,000 to $149,999 | 0 | 0.0% |
| $150,000 to $199,999 | 0 | 0.0% |
| $200,000+ | 8 | 19.5% |
Family Income by Famaliy Size in Soldier Creek
| Income Bracket | # Families | Median Income |
| 2-Person Families | 16 (39.0%) | $0 |
| 3-Person Families | 0 (0.0%) | $0 |
| 4-Person Families | 17 (41.5%) | $0 |
| 5-Person Families | 0 (0.0%) | $0 |
| 6-Person Families | 0 (0.0%) | $0 |
| 7+ Person Families | 8 (19.5%) | $0 |
| Total | 41 (100.0%) | $0 |
Family Income by Number of Earners in Soldier Creek
| Number of Earners | # Families | Median Income |
| No Earners | 17 (41.5%) | $0 |
| 1 Earner | 24 (58.5%) | $0 |
| 2 Earners | 0 (0.0%) | $0 |
| 3+ Earners | 0 (0.0%) | $0 |
| Total | 41 (100.0%) | $0 |
Household Income in Soldier Creek
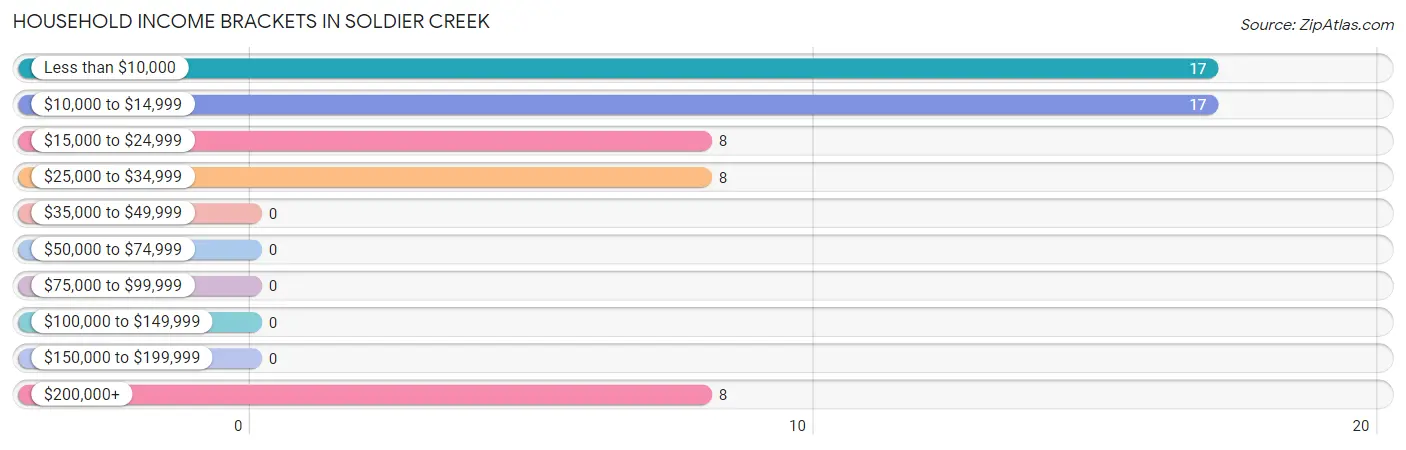
Household Income Brackets in Soldier Creek
With 17 households falling in the category, the less than $10,000 income range is the most frequent in Soldier Creek, accounting for 29.3% of all households.
| Income Bracket | # Households | % Households |
| Less than $10,000 | 17 | 29.3% |
| $10,000 to $14,999 | 17 | 29.3% |
| $15,000 to $24,999 | 8 | 13.8% |
| $25,000 to $34,999 | 8 | 13.8% |
| $35,000 to $49,999 | 0 | 0.0% |
| $50,000 to $74,999 | 0 | 0.0% |
| $75,000 to $99,999 | 0 | 0.0% |
| $100,000 to $149,999 | 0 | 0.0% |
| $150,000 to $199,999 | 0 | 0.0% |
| $200,000+ | 8 | 13.8% |
Household Income by Householder Age in Soldier Creek
| Income Bracket | # Households | Median Income |
| 15 to 24 Years | 0 (0.0%) | $0 |
| 25 to 44 Years | 25 (43.1%) | $0 |
| 45 to 64 Years | 33 (56.9%) | $0 |
| 65+ Years | 0 (0.0%) | $0 |
| Total | 58 (100.0%) | $0 |
Poverty in Soldier Creek
Income Below Poverty by Sex and Age in Soldier Creek
With 92.2% poverty level for males and 84.2% for females among the residents of Soldier Creek, under 5 year old males and under 5 year old females are the most vulnerable to poverty, with 18 males (100.0%) and 32 females (100.0%) in their respective age groups living below the poverty level.
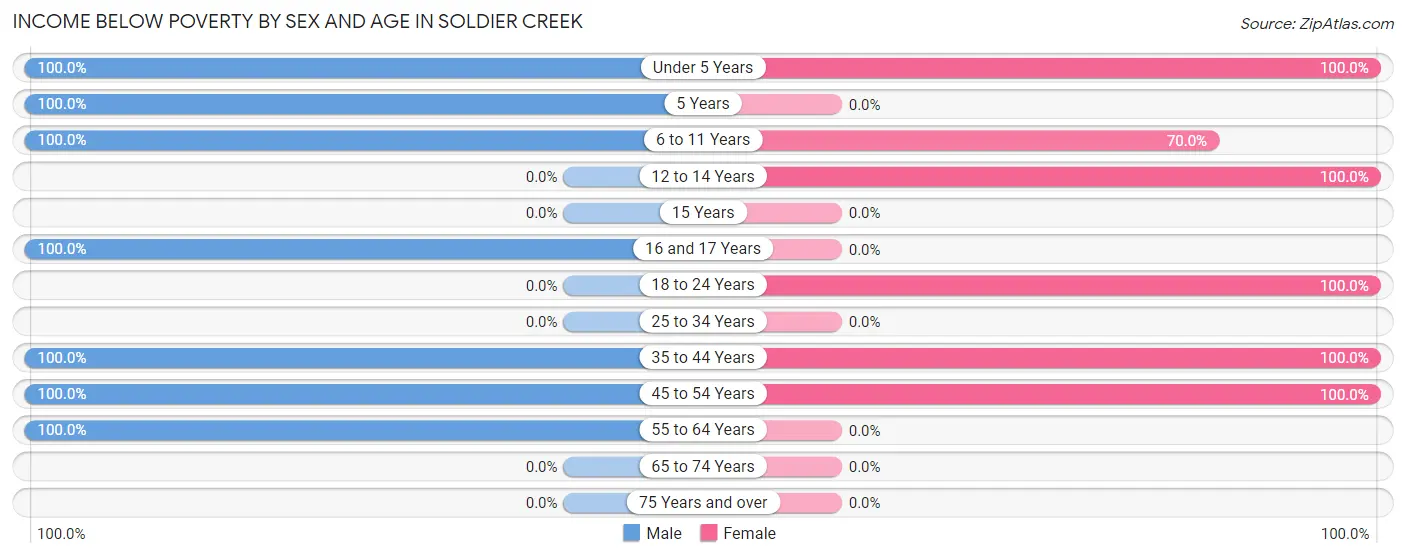
| Age Bracket | Male | Female |
| Under 5 Years | 18 (100.0%) | 32 (100.0%) |
| 5 Years | 9 (100.0%) | 0 (0.0%) |
| 6 to 11 Years | 9 (100.0%) | 35 (70.0%) |
| 12 to 14 Years | 0 (0.0%) | 17 (100.0%) |
| 15 Years | 0 (0.0%) | 0 (0.0%) |
| 16 and 17 Years | 5 (100.0%) | 0 (0.0%) |
| 18 to 24 Years | 0 (0.0%) | 40 (100.0%) |
| 25 to 34 Years | 0 (0.0%) | 0 (0.0%) |
| 35 to 44 Years | 17 (100.0%) | 26 (100.0%) |
| 45 to 54 Years | 8 (100.0%) | 15 (100.0%) |
| 55 to 64 Years | 17 (100.0%) | 0 (0.0%) |
| 65 to 74 Years | 0 (0.0%) | 0 (0.0%) |
| 75 Years and over | 0 (0.0%) | 0 (0.0%) |
| Total | 83 (92.2%) | 165 (84.2%) |
Income Above Poverty by Sex and Age in Soldier Creek
According to the poverty statistics in Soldier Creek, males aged 75 years and over and females aged 25 to 34 years are the age groups that are most secure financially, with 100.0% of males and 100.0% of females in these age groups living above the poverty line.
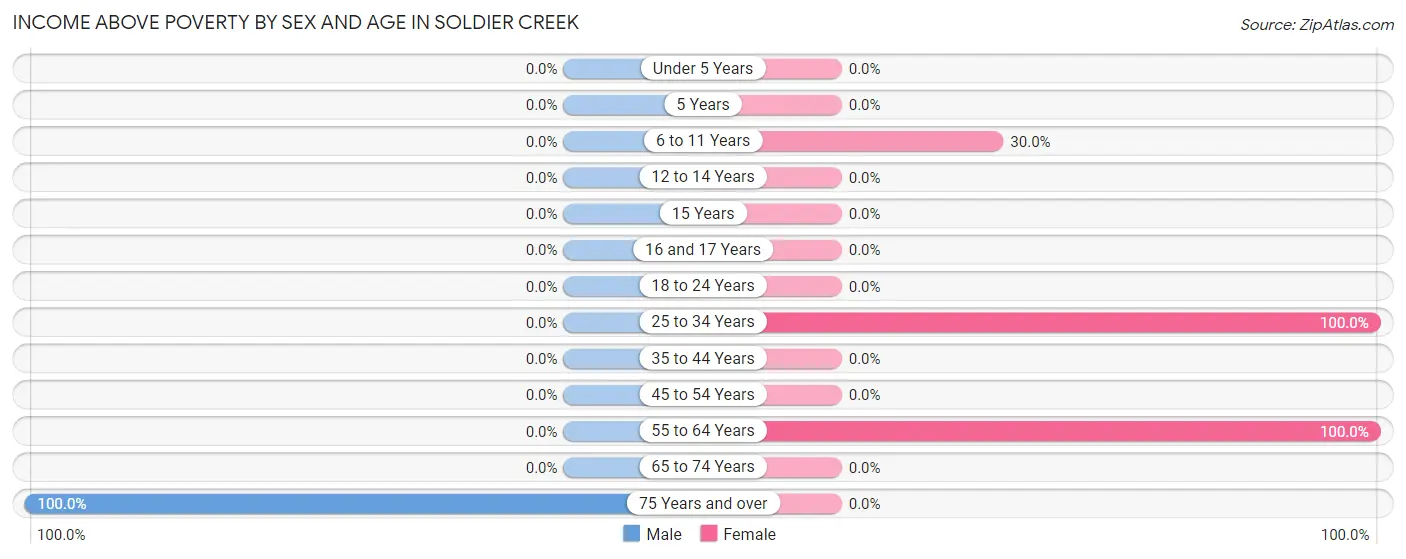
| Age Bracket | Male | Female |
| Under 5 Years | 0 (0.0%) | 0 (0.0%) |
| 5 Years | 0 (0.0%) | 0 (0.0%) |
| 6 to 11 Years | 0 (0.0%) | 15 (30.0%) |
| 12 to 14 Years | 0 (0.0%) | 0 (0.0%) |
| 15 Years | 0 (0.0%) | 0 (0.0%) |
| 16 and 17 Years | 0 (0.0%) | 0 (0.0%) |
| 18 to 24 Years | 0 (0.0%) | 0 (0.0%) |
| 25 to 34 Years | 0 (0.0%) | 8 (100.0%) |
| 35 to 44 Years | 0 (0.0%) | 0 (0.0%) |
| 45 to 54 Years | 0 (0.0%) | 0 (0.0%) |
| 55 to 64 Years | 0 (0.0%) | 8 (100.0%) |
| 65 to 74 Years | 0 (0.0%) | 0 (0.0%) |
| 75 Years and over | 7 (100.0%) | 0 (0.0%) |
| Total | 7 (7.8%) | 31 (15.8%) |
Income Below Poverty Among Married-Couple Families in Soldier Creek
| Children | Above Poverty | Below Poverty |
| No Children | 8 (100.0%) | 0 (0.0%) |
| 1 or 2 Children | 0 (0.0%) | 0 (0.0%) |
| 3 or 4 Children | 0 (0.0%) | 0 (0.0%) |
| 5 or more Children | 0 (0.0%) | 0 (0.0%) |
| Total | 8 (100.0%) | 0 (0.0%) |
Income Below Poverty Among Single-Parent Households in Soldier Creek
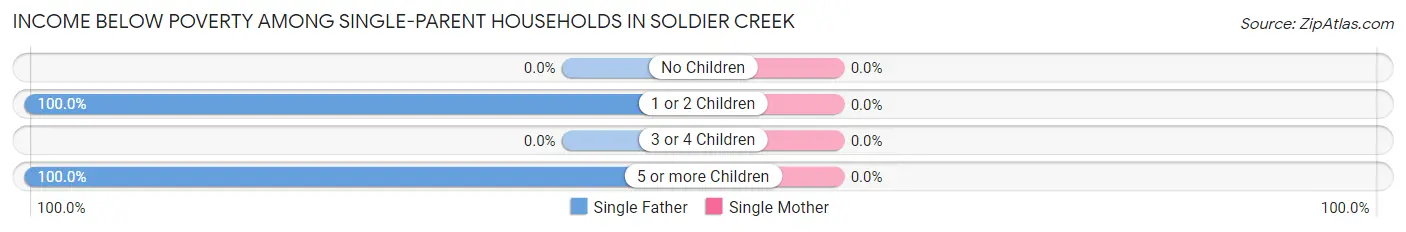
| Children | Single Father | Single Mother |
| No Children | 0 (0.0%) | 0 (0.0%) |
| 1 or 2 Children | 17 (100.0%) | 0 (0.0%) |
| 3 or 4 Children | 0 (0.0%) | 0 (0.0%) |
| 5 or more Children | 8 (100.0%) | 0 (0.0%) |
| Total | 25 (100.0%) | 0 (0.0%) |
Income Below Poverty Among Married-Couple vs Single-Parent Households in Soldier Creek
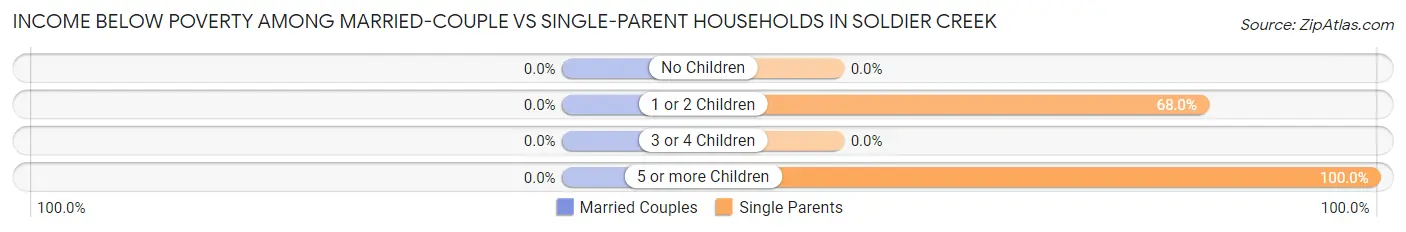
| Children | Married-Couple Families | Single-Parent Households |
| No Children | 0 (0.0%) | 0 (0.0%) |
| 1 or 2 Children | 0 (0.0%) | 17 (68.0%) |
| 3 or 4 Children | 0 (0.0%) | 0 (0.0%) |
| 5 or more Children | 0 (0.0%) | 8 (100.0%) |
| Total | 0 (0.0%) | 25 (75.8%) |
Race in Soldier Creek
The most populous races in Soldier Creek are , and Native / Alaskan (286 | 100.0%).
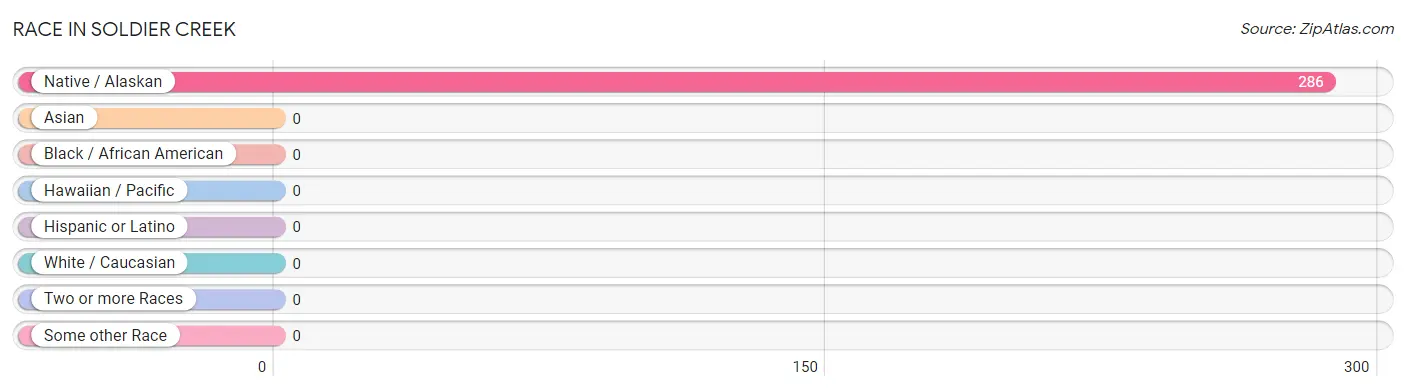
| Race | # Population | % Population |
| Asian | 0 | 0.0% |
| Black / African American | 0 | 0.0% |
| Hawaiian / Pacific | 0 | 0.0% |
| Hispanic or Latino | 0 | 0.0% |
| Native / Alaskan | 286 | 100.0% |
| White / Caucasian | 0 | 0.0% |
| Two or more Races | 0 | 0.0% |
| Some other Race | 0 | 0.0% |
| Total | 286 | 100.0% |
Ancestry in Soldier Creek
The most populous ancestries reported in Soldier Creek are , and Sioux (133 | 46.5%), together accounting for 46.5% of all Soldier Creek residents.

| Ancestry | # Population | % Population |
| Sioux | 133 | 46.5% | View All 1 Rows |
Immigrants in Soldier Creek

| Immigration Origin | # Population | % Population | View All 0 Rows |
Sex and Age in Soldier Creek
Sex and Age in Soldier Creek
The most populous age groups in Soldier Creek are Under 5 Years (18 | 20.0%) for men and 5 to 9 Years (35 | 17.9%) for women.
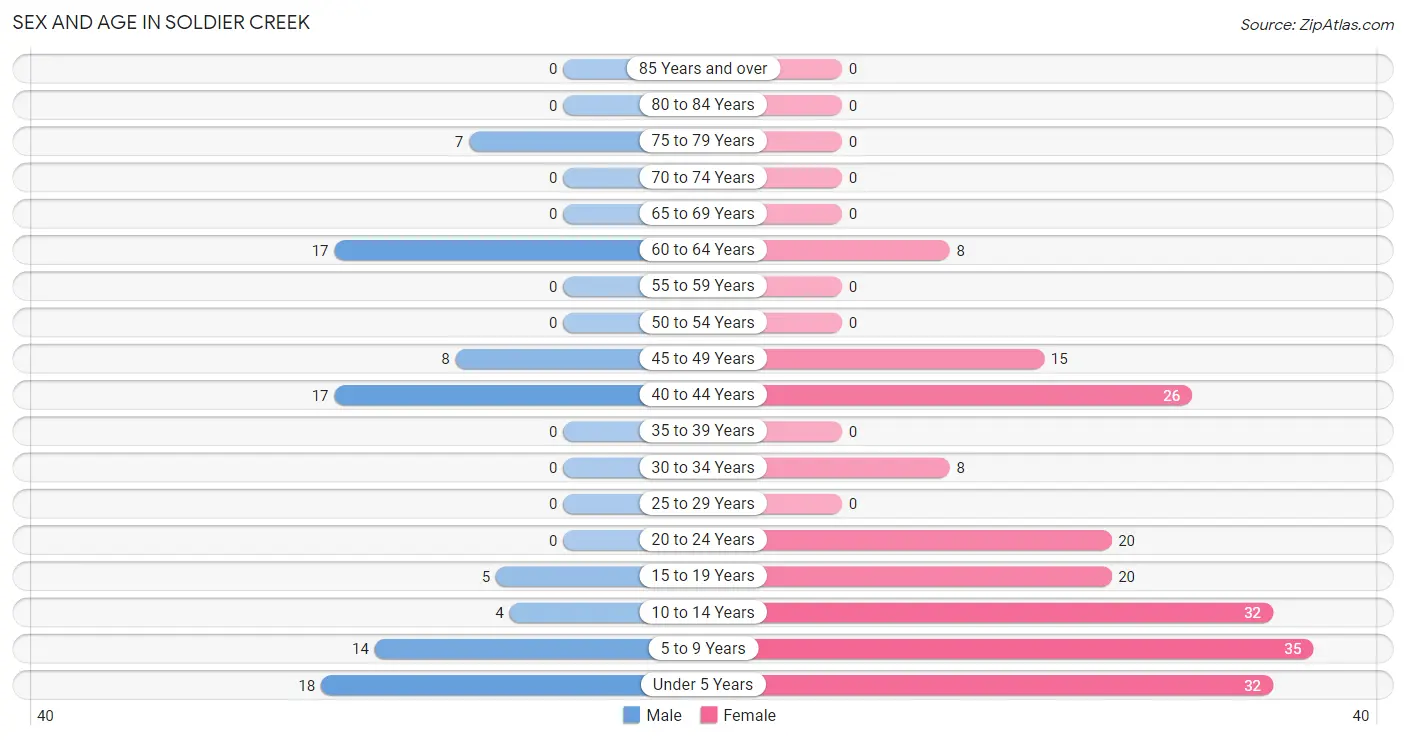
| Age Bracket | Male | Female |
| Under 5 Years | 18 (20.0%) | 32 (16.3%) |
| 5 to 9 Years | 14 (15.6%) | 35 (17.9%) |
| 10 to 14 Years | 4 (4.4%) | 32 (16.3%) |
| 15 to 19 Years | 5 (5.6%) | 20 (10.2%) |
| 20 to 24 Years | 0 (0.0%) | 20 (10.2%) |
| 25 to 29 Years | 0 (0.0%) | 0 (0.0%) |
| 30 to 34 Years | 0 (0.0%) | 8 (4.1%) |
| 35 to 39 Years | 0 (0.0%) | 0 (0.0%) |
| 40 to 44 Years | 17 (18.9%) | 26 (13.3%) |
| 45 to 49 Years | 8 (8.9%) | 15 (7.6%) |
| 50 to 54 Years | 0 (0.0%) | 0 (0.0%) |
| 55 to 59 Years | 0 (0.0%) | 0 (0.0%) |
| 60 to 64 Years | 17 (18.9%) | 8 (4.1%) |
| 65 to 69 Years | 0 (0.0%) | 0 (0.0%) |
| 70 to 74 Years | 0 (0.0%) | 0 (0.0%) |
| 75 to 79 Years | 7 (7.8%) | 0 (0.0%) |
| 80 to 84 Years | 0 (0.0%) | 0 (0.0%) |
| 85 Years and over | 0 (0.0%) | 0 (0.0%) |
| Total | 90 (100.0%) | 196 (100.0%) |
Families and Households in Soldier Creek
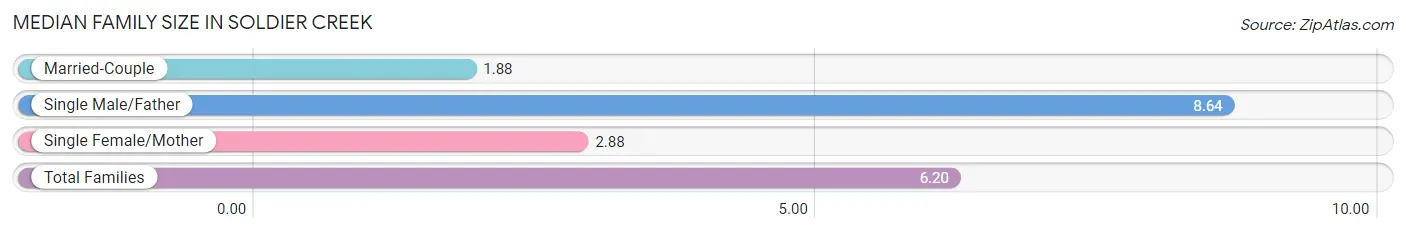
Median Family Size in Soldier Creek
The median family size in Soldier Creek is 6.20 persons per family, with single male/father families (25 | 61.0%) accounting for the largest median family size of 8.64 persons per family. On the other hand, married-couple families (8 | 19.5%) represent the smallest median family size with 1.88 persons per family.
| Family Type | # Families | Family Size |
| Married-Couple | 8 (19.5%) | 1.88 |
| Single Male/Father | 25 (61.0%) | 8.64 |
| Single Female/Mother | 8 (19.5%) | 2.88 |
| Total Families | 41 (100.0%) | 6.20 |
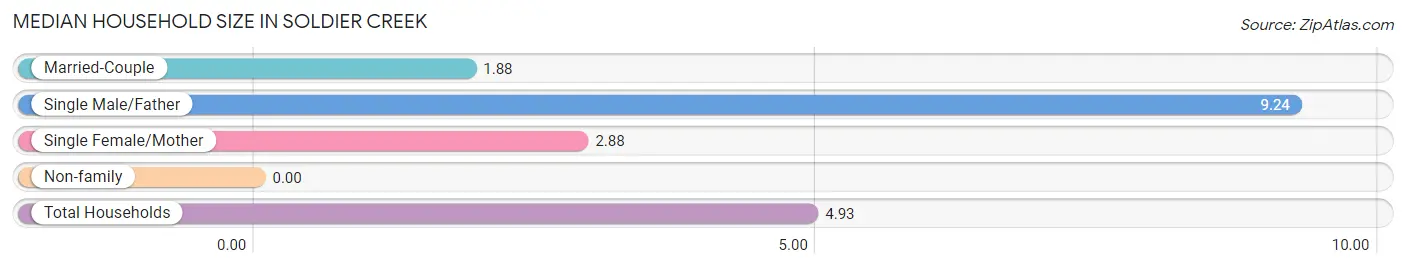
Median Household Size in Soldier Creek
| Household Type | # Households | Household Size |
| Married-Couple | 8 (13.8%) | 1.88 |
| Single Male/Father | 25 (43.1%) | 9.24 |
| Single Female/Mother | 8 (13.8%) | 2.88 |
| Non-family | 17 (29.3%) | - |
| Total Households | 58 (100.0%) | 4.93 |
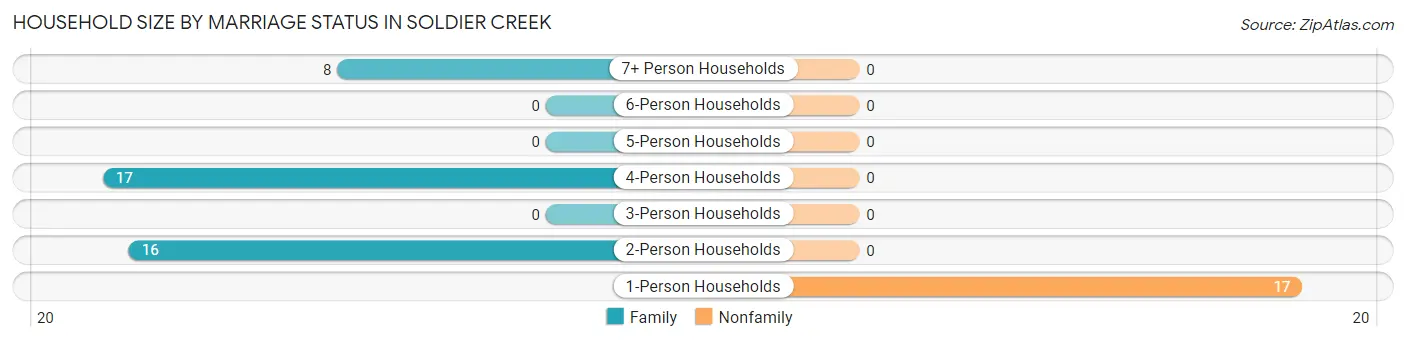
Household Size by Marriage Status in Soldier Creek
Out of a total of 58 households in Soldier Creek, 41 (70.7%) are family households, while 17 (29.3%) are nonfamily households. The most numerous type of family households are 4-person households, comprising 17, and the most common type of nonfamily households are 1-person households, comprising 17.
| Household Size | Family Households | Nonfamily Households |
| 1-Person Households | - | 17 (29.3%) |
| 2-Person Households | 16 (27.6%) | 0 (0.0%) |
| 3-Person Households | 0 (0.0%) | 0 (0.0%) |
| 4-Person Households | 17 (29.3%) | 0 (0.0%) |
| 5-Person Households | 0 (0.0%) | 0 (0.0%) |
| 6-Person Households | 0 (0.0%) | 0 (0.0%) |
| 7+ Person Households | 8 (13.8%) | 0 (0.0%) |
| Total | 41 (70.7%) | 17 (29.3%) |
Female Fertility in Soldier Creek
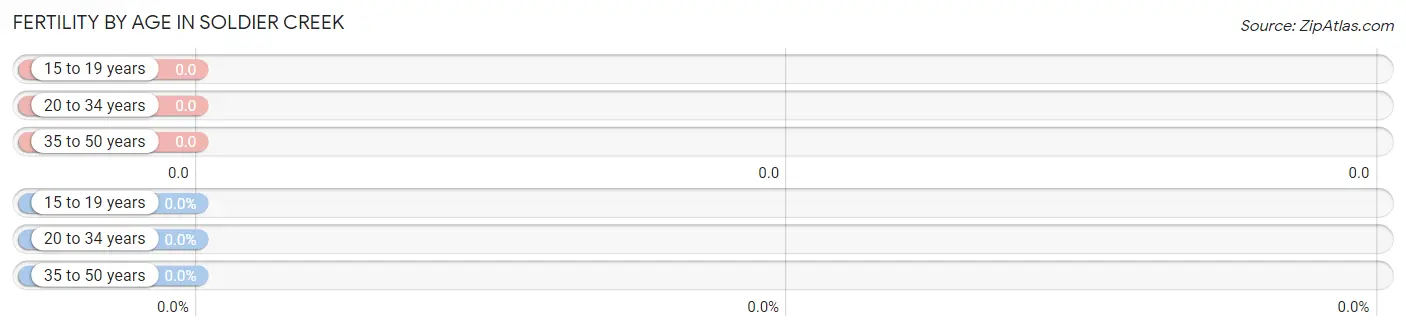
Fertility by Age in Soldier Creek
| Age Bracket | Women with Births | Births / 1,000 Women |
| 15 to 19 years | 0 (0.0%) | 0.0 |
| 20 to 34 years | 0 (0.0%) | 0.0 |
| 35 to 50 years | 0 (0.0%) | 0.0 |
| Total | 0 (0.0%) | 0.0 |
Fertility by Age by Marriage Status in Soldier Creek
| Age Bracket | Married | Unmarried |
| 15 to 19 years | 0 (0.0%) | 0 (0.0%) |
| 20 to 34 years | 0 (0.0%) | 0 (0.0%) |
| 35 to 50 years | 0 (0.0%) | 0 (0.0%) |
| Total | 0 (0.0%) | 0 (0.0%) |
Fertility by Education in Soldier Creek
| Educational Attainment | Women with Births | Births / 1,000 Women |
| Less than High School | 0 (0.0%) | 0.0 |
| High School Diploma | 0 (0.0%) | 0.0 |
| College or Associate's Degree | 0 (0.0%) | 0.0 |
| Bachelor's Degree | 0 (0.0%) | 0.0 |
| Graduate Degree | 0 (0.0%) | 0.0 |
| Total | 0 (0.0%) | 0.0 |
Fertility by Education by Marriage Status in Soldier Creek
| Educational Attainment | Married | Unmarried |
| Less than High School | 0 (0.0%) | 0 (0.0%) |
| High School Diploma | 0 (0.0%) | 0 (0.0%) |
| College or Associate's Degree | 0 (0.0%) | 0 (0.0%) |
| Bachelor's Degree | 0 (0.0%) | 0 (0.0%) |
| Graduate Degree | 0 (0.0%) | 0 (0.0%) |
| Total | 0 (0.0%) | 0 (0.0%) |
Employment Characteristics in Soldier Creek
Employment by Class of Employer in Soldier Creek
Among the 15 employed individuals in Soldier Creek, federal government employees (8 | 53.3%), and not-for-profit organizations (7 | 46.7%) make up the most common classes of employment.
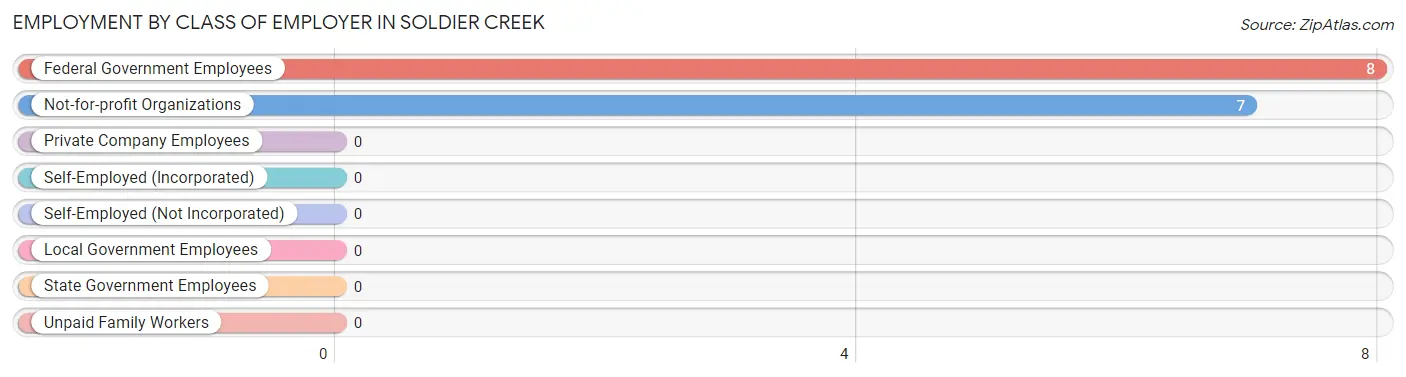
| Employer Class | # Employees | % Employees |
| Private Company Employees | 0 | 0.0% |
| Self-Employed (Incorporated) | 0 | 0.0% |
| Self-Employed (Not Incorporated) | 0 | 0.0% |
| Not-for-profit Organizations | 7 | 46.7% |
| Local Government Employees | 0 | 0.0% |
| State Government Employees | 0 | 0.0% |
| Federal Government Employees | 8 | 53.3% |
| Unpaid Family Workers | 0 | 0.0% |
| Total | 15 | 100.0% |
Employment Status by Age in Soldier Creek
According to the labor force statistics for Soldier Creek, out of the total population over 16 years of age (151), 21.2% or 32 individuals are in the labor force, with 53.1% or 17 of them unemployed. The age group with the highest labor force participation rate is 30 to 34 years, with 100.0% or 8 individuals in the labor force. Within the labor force, the 35 to 44 years age range has the highest percentage of unemployed individuals, with 100.0% or 17 of them being unemployed.
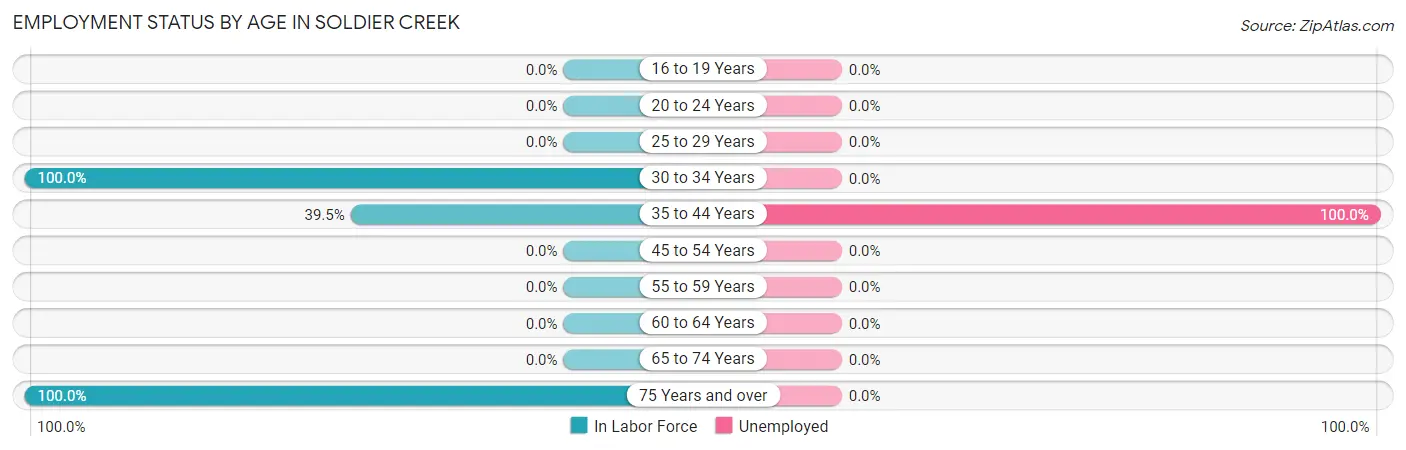
| Age Bracket | In Labor Force | Unemployed |
| 16 to 19 Years | 0 (0.0%) | 0 (0.0%) |
| 20 to 24 Years | 0 (0.0%) | 0 (0.0%) |
| 25 to 29 Years | 0 (0.0%) | 0 (0.0%) |
| 30 to 34 Years | 8 (100.0%) | 0 (0.0%) |
| 35 to 44 Years | 17 (39.5%) | 17 (100.0%) |
| 45 to 54 Years | 0 (0.0%) | 0 (0.0%) |
| 55 to 59 Years | 0 (0.0%) | 0 (0.0%) |
| 60 to 64 Years | 0 (0.0%) | 0 (0.0%) |
| 65 to 74 Years | 0 (0.0%) | 0 (0.0%) |
| 75 Years and over | 7 (100.0%) | 0 (0.0%) |
| Total | 32 (21.2%) | 17 (53.1%) |
Employment Status by Educational Attainment in Soldier Creek
According to labor force statistics for Soldier Creek, 25.3% of individuals (25) out of the total population between 25 and 64 years of age (99) are in the labor force, with 68.0% or 17 of them being unemployed. The group with the highest labor force participation rate are those with the educational attainment of high school diploma, with 49.0% or 25 individuals in the labor force. Within the labor force, individuals with high school diploma education have the highest percentage of unemployment, with 68.0% or 17 of them being unemployed.
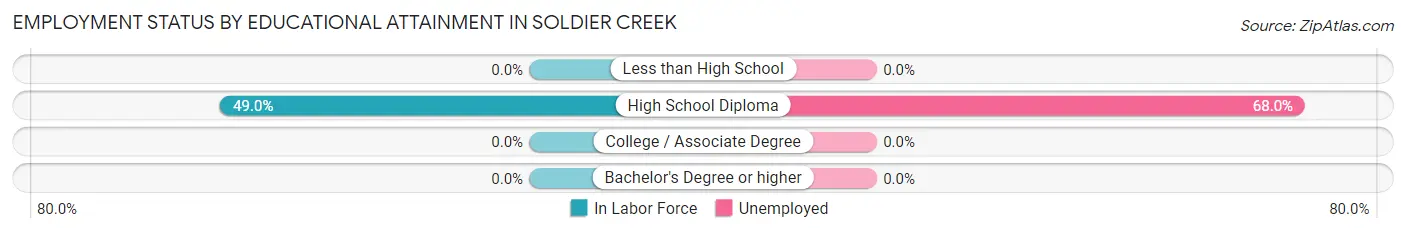
| Educational Attainment | In Labor Force | Unemployed |
| Less than High School | 0 (0.0%) | 0 (0.0%) |
| High School Diploma | 25 (49.0%) | 35 (68.0%) |
| College / Associate Degree | 0 (0.0%) | 0 (0.0%) |
| Bachelor's Degree or higher | 0 (0.0%) | 0 (0.0%) |
| Total | 25 (25.3%) | 67 (68.0%) |
Employment Occupations by Sex in Soldier Creek
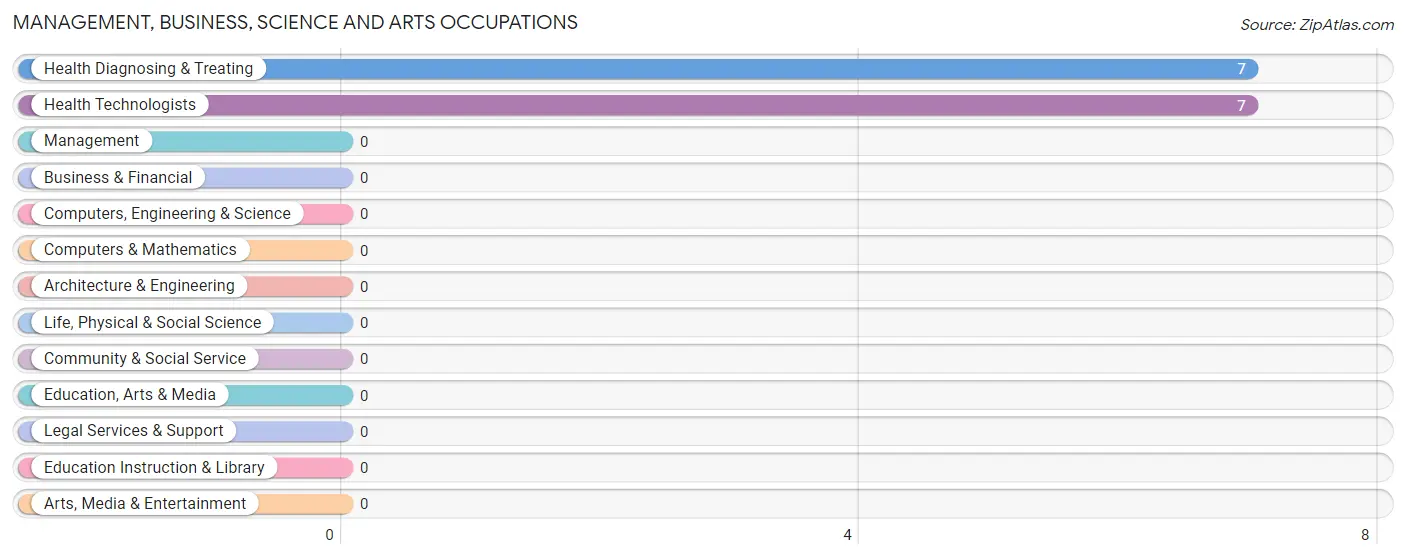
Management, Business, Science and Arts Occupations
The most common Management, Business, Science and Arts occupations in Soldier Creek are Health Diagnosing & Treating (7 | 46.7%), and Health Technologists (7 | 46.7%).
Management, Business, Science and Arts Occupations by Sex
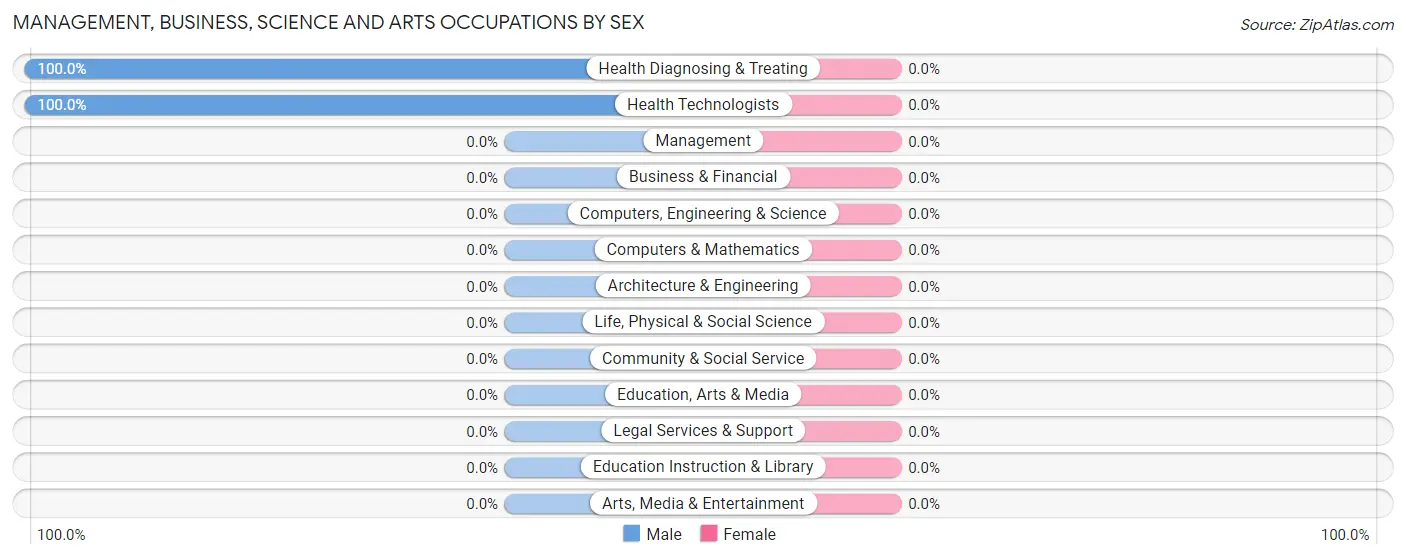
| Occupation | Male | Female |
| Management | 0 (0.0%) | 0 (0.0%) |
| Business & Financial | 0 (0.0%) | 0 (0.0%) |
| Computers, Engineering & Science | 0 (0.0%) | 0 (0.0%) |
| Computers & Mathematics | 0 (0.0%) | 0 (0.0%) |
| Architecture & Engineering | 0 (0.0%) | 0 (0.0%) |
| Life, Physical & Social Science | 0 (0.0%) | 0 (0.0%) |
| Community & Social Service | 0 (0.0%) | 0 (0.0%) |
| Education, Arts & Media | 0 (0.0%) | 0 (0.0%) |
| Legal Services & Support | 0 (0.0%) | 0 (0.0%) |
| Education Instruction & Library | 0 (0.0%) | 0 (0.0%) |
| Arts, Media & Entertainment | 0 (0.0%) | 0 (0.0%) |
| Health Diagnosing & Treating | 7 (100.0%) | 0 (0.0%) |
| Health Technologists | 7 (100.0%) | 0 (0.0%) |
| Total (Category) | 7 (100.0%) | 0 (0.0%) |
| Total (Overall) | 7 (46.7%) | 8 (53.3%) |
Services Occupations
Services Occupations by Sex
| Occupation | Male | Female |
| Healthcare Support | 0 (0.0%) | 0 (0.0%) |
| Security & Protection | 0 (0.0%) | 0 (0.0%) |
| Firefighting & Prevention | 0 (0.0%) | 0 (0.0%) |
| Law Enforcement | 0 (0.0%) | 0 (0.0%) |
| Food Preparation & Serving | 0 (0.0%) | 0 (0.0%) |
| Cleaning & Maintenance | 0 (0.0%) | 0 (0.0%) |
| Personal Care & Service | 0 (0.0%) | 0 (0.0%) |
| Total (Category) | 0 (0.0%) | 0 (0.0%) |
| Total (Overall) | 7 (46.7%) | 8 (53.3%) |
Sales and Office Occupations
Sales and Office Occupations by Sex
| Occupation | Male | Female |
| Sales & Related | 0 (0.0%) | 0 (0.0%) |
| Office & Administration | 0 (0.0%) | 0 (0.0%) |
| Total (Category) | 0 (0.0%) | 0 (0.0%) |
| Total (Overall) | 7 (46.7%) | 8 (53.3%) |
Natural Resources, Construction and Maintenance Occupations
Natural Resources, Construction and Maintenance Occupations by Sex
| Occupation | Male | Female |
| Farming, Fishing & Forestry | 0 (0.0%) | 0 (0.0%) |
| Construction & Extraction | 0 (0.0%) | 0 (0.0%) |
| Installation, Maintenance & Repair | 0 (0.0%) | 0 (0.0%) |
| Total (Category) | 0 (0.0%) | 0 (0.0%) |
| Total (Overall) | 7 (46.7%) | 8 (53.3%) |
Production, Transportation and Moving Occupations
The most common Production, Transportation and Moving occupations in Soldier Creek are , and Transportation (8 | 53.3%).
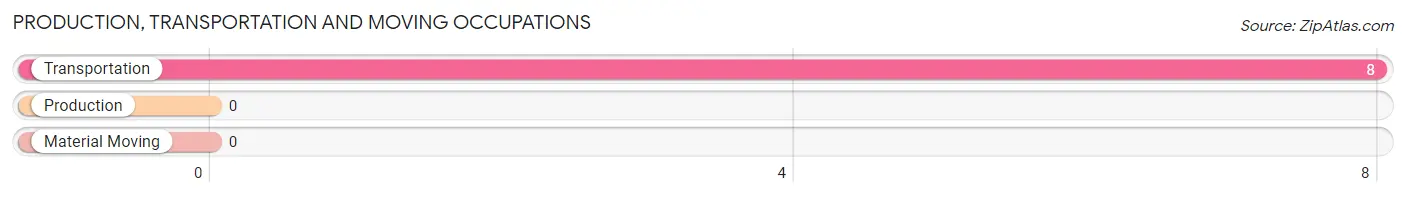
Production, Transportation and Moving Occupations by Sex
| Occupation | Male | Female |
| Production | 0 (0.0%) | 0 (0.0%) |
| Transportation | 0 (0.0%) | 8 (100.0%) |
| Material Moving | 0 (0.0%) | 0 (0.0%) |
| Total (Category) | 0 (0.0%) | 8 (100.0%) |
| Total (Overall) | 7 (46.7%) | 8 (53.3%) |
Employment Industries by Sex in Soldier Creek
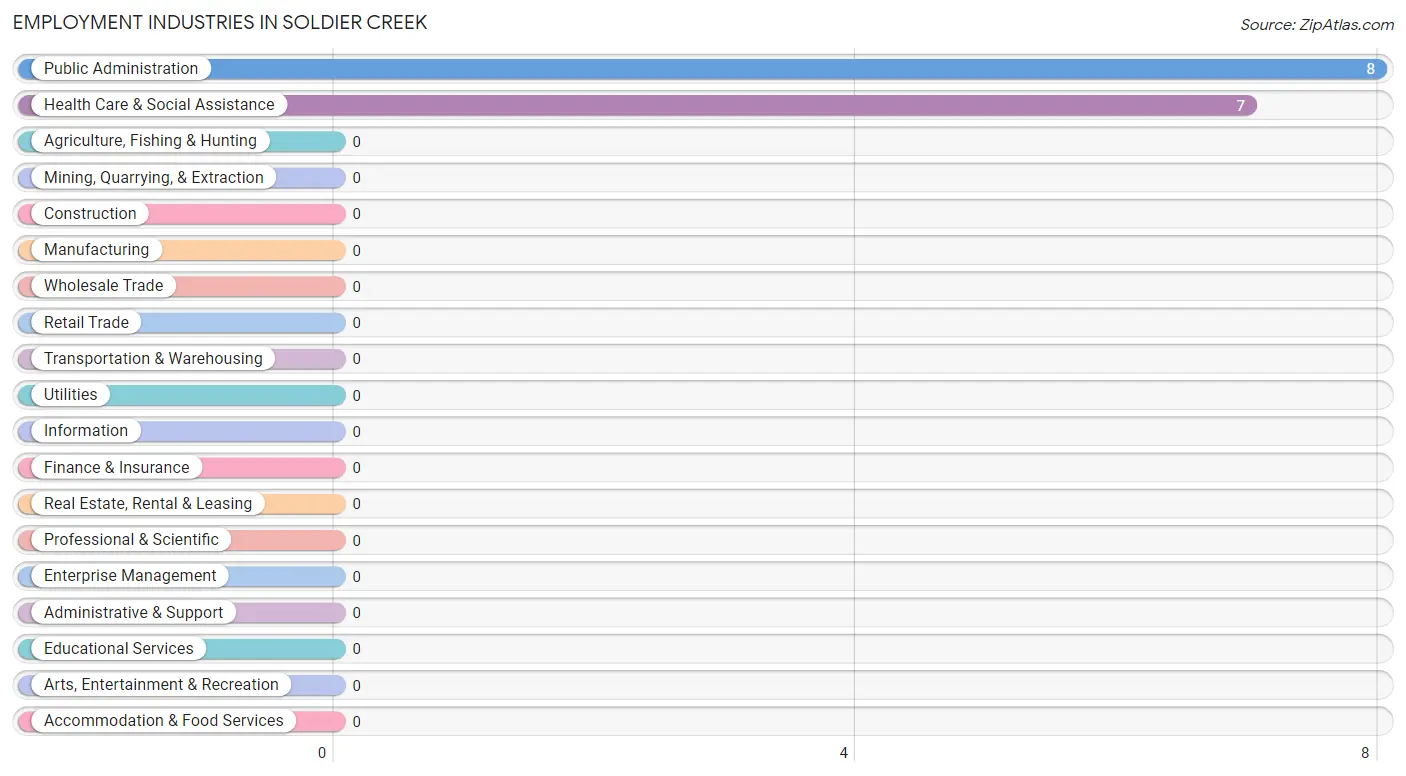
Employment Industries in Soldier Creek
The major employment industries in Soldier Creek include Public Administration (8 | 53.3%), and Health Care & Social Assistance (7 | 46.7%).
Employment Industries by Sex in Soldier Creek
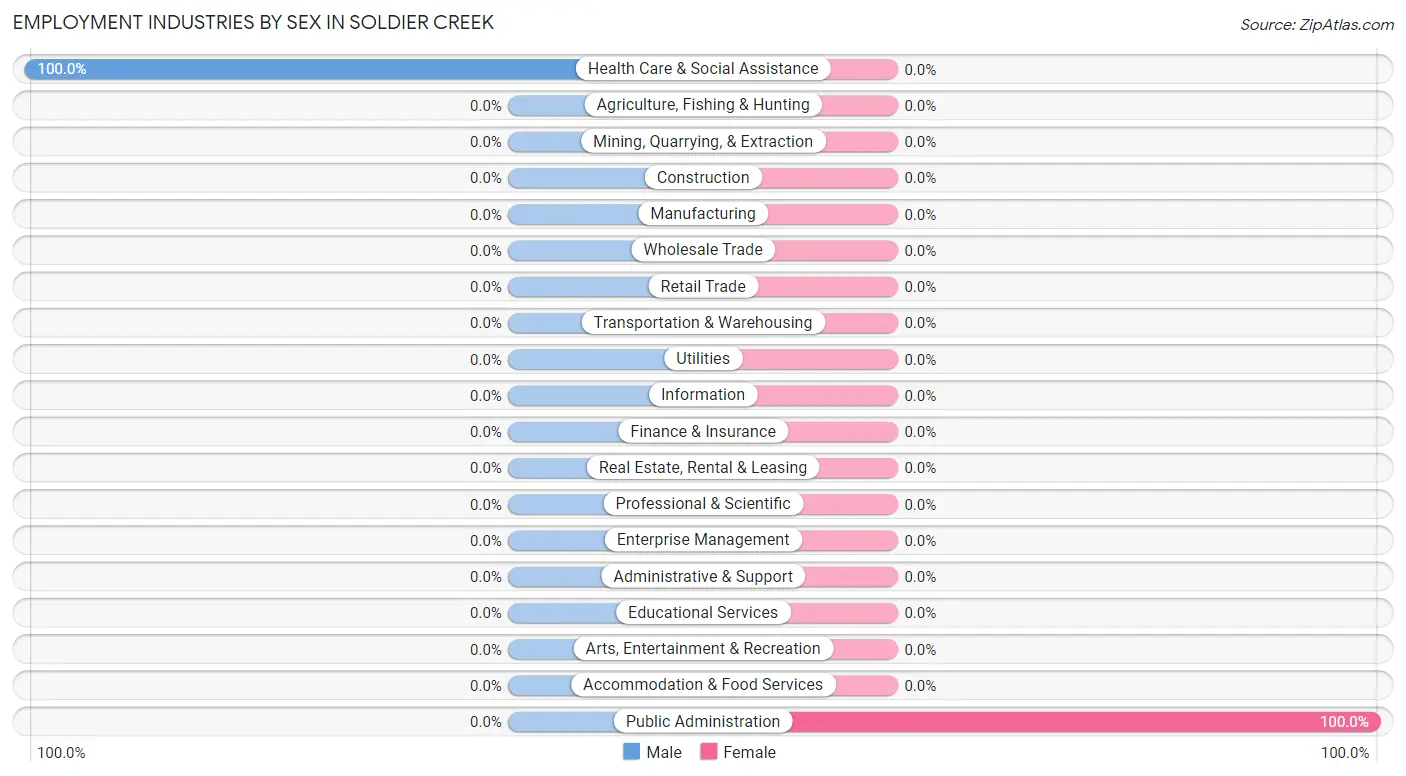
| Industry | Male | Female |
| Agriculture, Fishing & Hunting | 0 (0.0%) | 0 (0.0%) |
| Mining, Quarrying, & Extraction | 0 (0.0%) | 0 (0.0%) |
| Construction | 0 (0.0%) | 0 (0.0%) |
| Manufacturing | 0 (0.0%) | 0 (0.0%) |
| Wholesale Trade | 0 (0.0%) | 0 (0.0%) |
| Retail Trade | 0 (0.0%) | 0 (0.0%) |
| Transportation & Warehousing | 0 (0.0%) | 0 (0.0%) |
| Utilities | 0 (0.0%) | 0 (0.0%) |
| Information | 0 (0.0%) | 0 (0.0%) |
| Finance & Insurance | 0 (0.0%) | 0 (0.0%) |
| Real Estate, Rental & Leasing | 0 (0.0%) | 0 (0.0%) |
| Professional & Scientific | 0 (0.0%) | 0 (0.0%) |
| Enterprise Management | 0 (0.0%) | 0 (0.0%) |
| Administrative & Support | 0 (0.0%) | 0 (0.0%) |
| Educational Services | 0 (0.0%) | 0 (0.0%) |
| Health Care & Social Assistance | 7 (100.0%) | 0 (0.0%) |
| Arts, Entertainment & Recreation | 0 (0.0%) | 0 (0.0%) |
| Accommodation & Food Services | 0 (0.0%) | 0 (0.0%) |
| Public Administration | 0 (0.0%) | 8 (100.0%) |
| Total | 7 (46.7%) | 8 (53.3%) |
Education in Soldier Creek
School Enrollment in Soldier Creek
The most common levels of schooling among the 105 students in Soldier Creek are elementary school (46 | 43.8%), middle school (39 | 37.1%), and high school (20 | 19.1%).
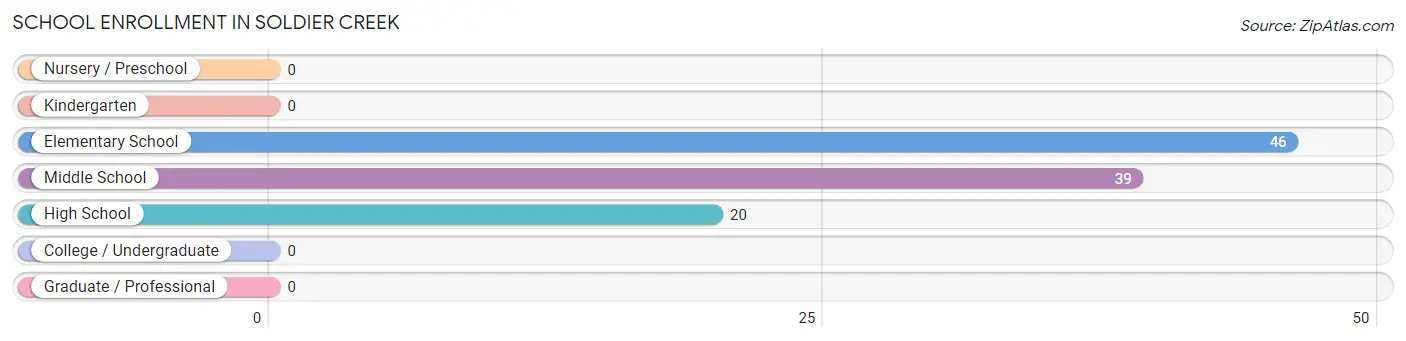
| School Level | # Students | % Students |
| Nursery / Preschool | 0 | 0.0% |
| Kindergarten | 0 | 0.0% |
| Elementary School | 46 | 43.8% |
| Middle School | 39 | 37.1% |
| High School | 20 | 19.1% |
| College / Undergraduate | 0 | 0.0% |
| Graduate / Professional | 0 | 0.0% |
| Total | 105 | 100.0% |
School Enrollment by Age by Funding Source in Soldier Creek
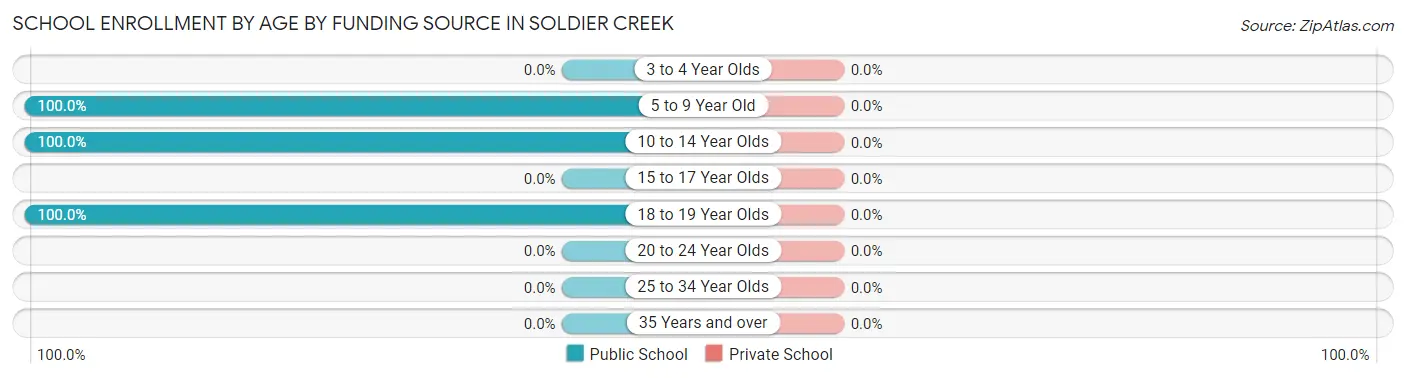
| Age Bracket | Public School | Private School |
| 3 to 4 Year Olds | 0 (0.0%) | 0 (0.0%) |
| 5 to 9 Year Old | 49 (100.0%) | 0 (0.0%) |
| 10 to 14 Year Olds | 36 (100.0%) | 0 (0.0%) |
| 15 to 17 Year Olds | 0 (0.0%) | 0 (0.0%) |
| 18 to 19 Year Olds | 20 (100.0%) | 0 (0.0%) |
| 20 to 24 Year Olds | 0 (0.0%) | 0 (0.0%) |
| 25 to 34 Year Olds | 0 (0.0%) | 0 (0.0%) |
| 35 Years and over | 0 (0.0%) | 0 (0.0%) |
| Total | 105 (100.0%) | 0 (0.0%) |
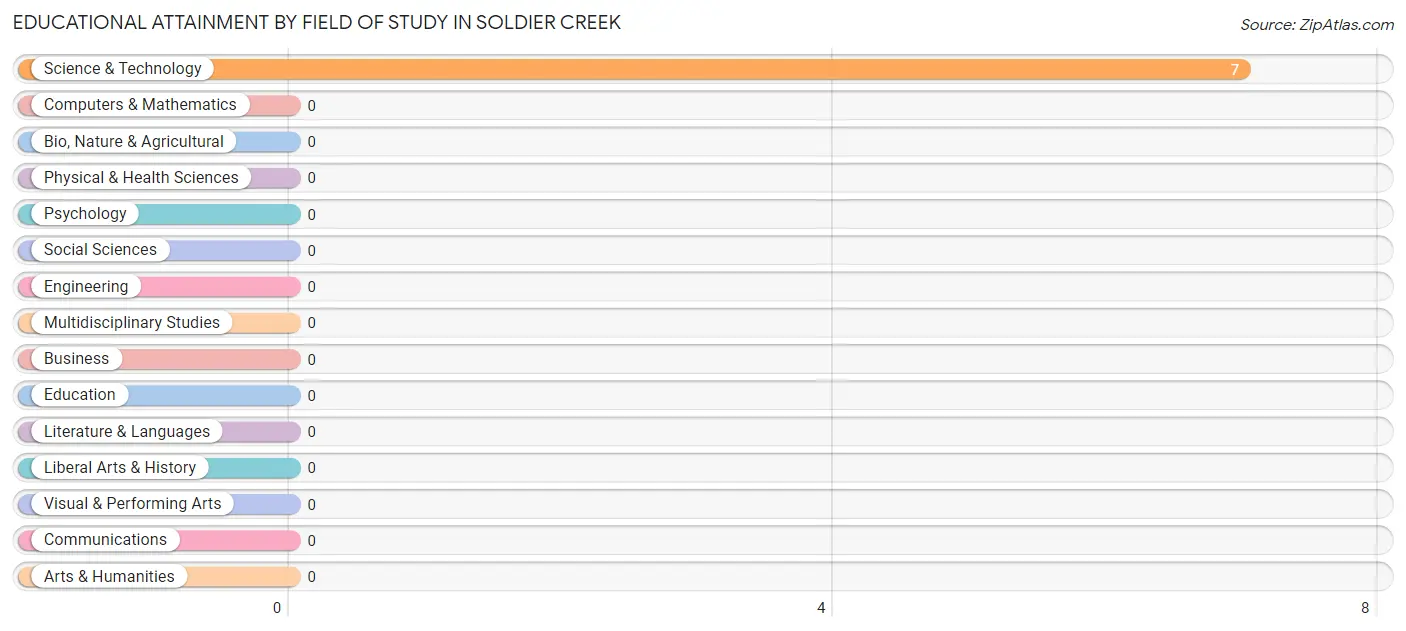
Educational Attainment by Field of Study in Soldier Creek
, and science & technology (7 | 100.0%) are the most common fields of study among 7 individuals in Soldier Creek who have obtained a bachelor's degree or higher.
| Field of Study | # Graduates | % Graduates |
| Computers & Mathematics | 0 | 0.0% |
| Bio, Nature & Agricultural | 0 | 0.0% |
| Physical & Health Sciences | 0 | 0.0% |
| Psychology | 0 | 0.0% |
| Social Sciences | 0 | 0.0% |
| Engineering | 0 | 0.0% |
| Multidisciplinary Studies | 0 | 0.0% |
| Science & Technology | 7 | 100.0% |
| Business | 0 | 0.0% |
| Education | 0 | 0.0% |
| Literature & Languages | 0 | 0.0% |
| Liberal Arts & History | 0 | 0.0% |
| Visual & Performing Arts | 0 | 0.0% |
| Communications | 0 | 0.0% |
| Arts & Humanities | 0 | 0.0% |
| Total | 7 | 100.0% |
Transportation & Commute in Soldier Creek
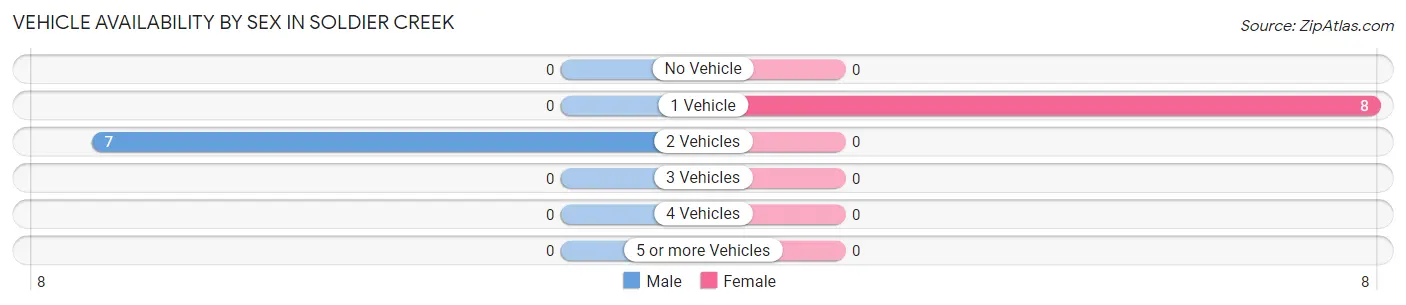
Vehicle Availability by Sex in Soldier Creek
The most prevalent vehicle ownership categories in Soldier Creek are males with 2 vehicles (7, accounting for 100.0%) and females with 2 vehicles (0, making up 87.5%).
| Vehicles Available | Male | Female |
| No Vehicle | 0 (0.0%) | 0 (0.0%) |
| 1 Vehicle | 0 (0.0%) | 8 (100.0%) |
| 2 Vehicles | 7 (100.0%) | 0 (0.0%) |
| 3 Vehicles | 0 (0.0%) | 0 (0.0%) |
| 4 Vehicles | 0 (0.0%) | 0 (0.0%) |
| 5 or more Vehicles | 0 (0.0%) | 0 (0.0%) |
| Total | 7 (100.0%) | 8 (100.0%) |
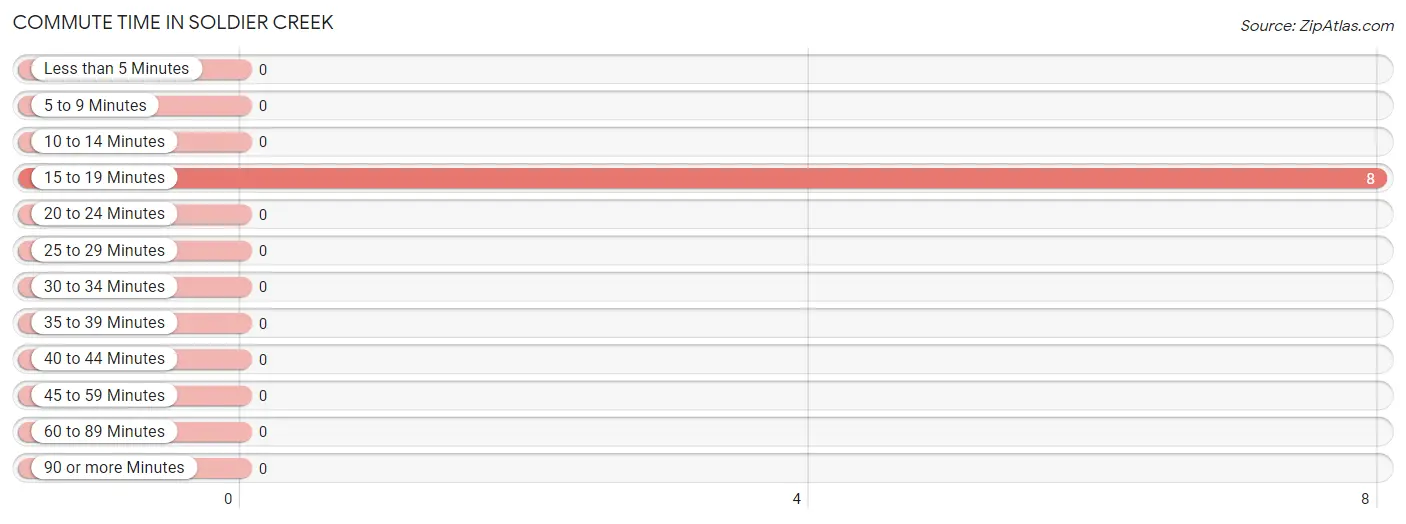
Commute Time in Soldier Creek
The most frequently occuring commute durations in Soldier Creek are 15 to 19 minutes (8 commuters, 100.0%), less than 5 minutes (0 commuters, 0.0%), and 5 to 9 minutes (0 commuters, 0.0%).
| Commute Time | # Commuters | % Commuters |
| Less than 5 Minutes | 0 | 0.0% |
| 5 to 9 Minutes | 0 | 0.0% |
| 10 to 14 Minutes | 0 | 0.0% |
| 15 to 19 Minutes | 8 | 100.0% |
| 20 to 24 Minutes | 0 | 0.0% |
| 25 to 29 Minutes | 0 | 0.0% |
| 30 to 34 Minutes | 0 | 0.0% |
| 35 to 39 Minutes | 0 | 0.0% |
| 40 to 44 Minutes | 0 | 0.0% |
| 45 to 59 Minutes | 0 | 0.0% |
| 60 to 89 Minutes | 0 | 0.0% |
| 90 or more Minutes | 0 | 0.0% |
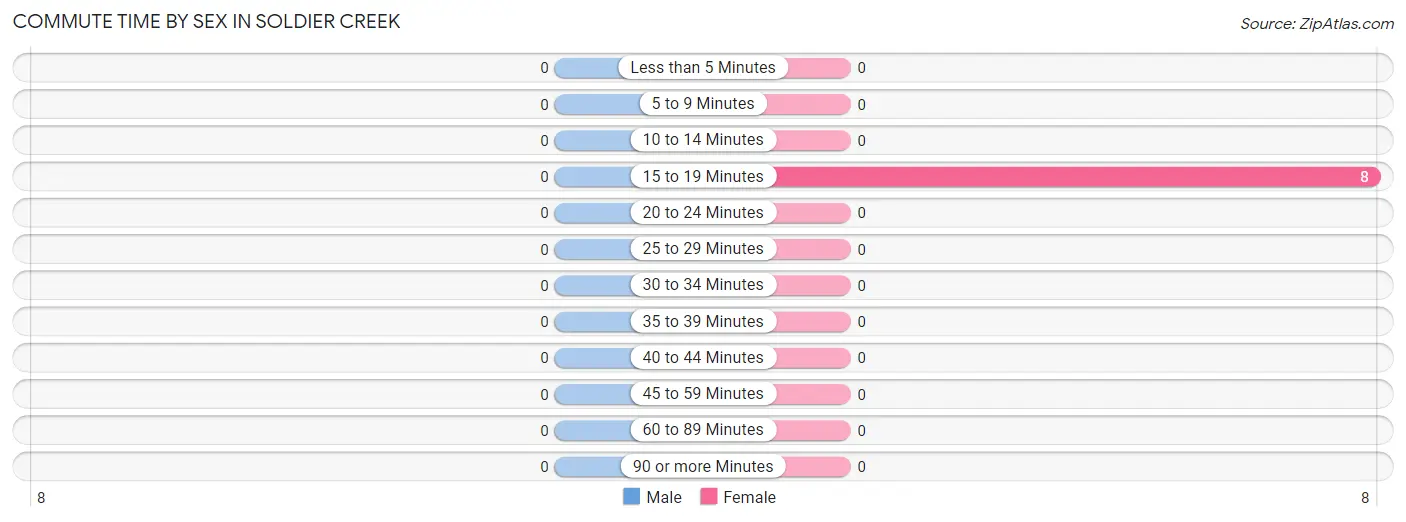
Commute Time by Sex in Soldier Creek
| Commute Time | Male | Female |
| Less than 5 Minutes | 0 (0.0%) | 0 (0.0%) |
| 5 to 9 Minutes | 0 (0.0%) | 0 (0.0%) |
| 10 to 14 Minutes | 0 (0.0%) | 0 (0.0%) |
| 15 to 19 Minutes | 0 (0.0%) | 8 (100.0%) |
| 20 to 24 Minutes | 0 (0.0%) | 0 (0.0%) |
| 25 to 29 Minutes | 0 (0.0%) | 0 (0.0%) |
| 30 to 34 Minutes | 0 (0.0%) | 0 (0.0%) |
| 35 to 39 Minutes | 0 (0.0%) | 0 (0.0%) |
| 40 to 44 Minutes | 0 (0.0%) | 0 (0.0%) |
| 45 to 59 Minutes | 0 (0.0%) | 0 (0.0%) |
| 60 to 89 Minutes | 0 (0.0%) | 0 (0.0%) |
| 90 or more Minutes | 0 (0.0%) | 0 (0.0%) |
Time of Departure to Work by Sex in Soldier Creek
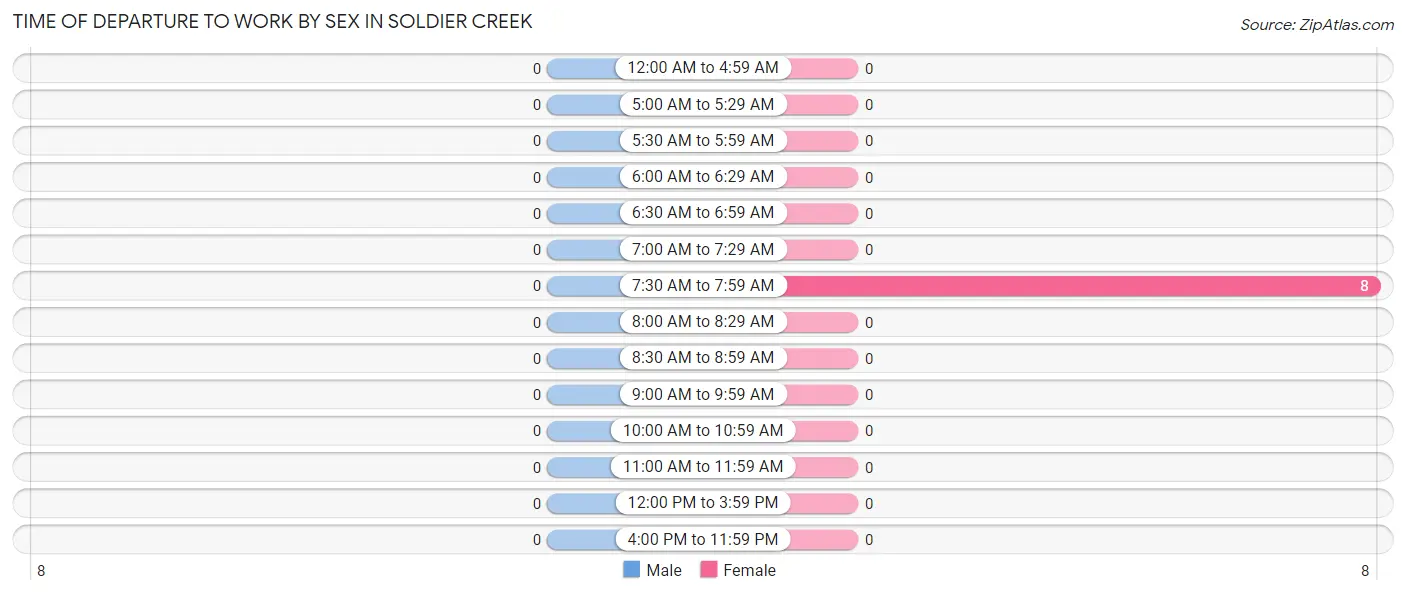
| Time of Departure | Male | Female |
| 12:00 AM to 4:59 AM | 0 (0.0%) | 0 (0.0%) |
| 5:00 AM to 5:29 AM | 0 (0.0%) | 0 (0.0%) |
| 5:30 AM to 5:59 AM | 0 (0.0%) | 0 (0.0%) |
| 6:00 AM to 6:29 AM | 0 (0.0%) | 0 (0.0%) |
| 6:30 AM to 6:59 AM | 0 (0.0%) | 0 (0.0%) |
| 7:00 AM to 7:29 AM | 0 (0.0%) | 0 (0.0%) |
| 7:30 AM to 7:59 AM | 0 (0.0%) | 8 (100.0%) |
| 8:00 AM to 8:29 AM | 0 (0.0%) | 0 (0.0%) |
| 8:30 AM to 8:59 AM | 0 (0.0%) | 0 (0.0%) |
| 9:00 AM to 9:59 AM | 0 (0.0%) | 0 (0.0%) |
| 10:00 AM to 10:59 AM | 0 (0.0%) | 0 (0.0%) |
| 11:00 AM to 11:59 AM | 0 (0.0%) | 0 (0.0%) |
| 12:00 PM to 3:59 PM | 0 (0.0%) | 0 (0.0%) |
| 4:00 PM to 11:59 PM | 0 (0.0%) | 0 (0.0%) |
| Total | 0 (0.0%) | 8 (100.0%) |
Housing Occupancy in Soldier Creek
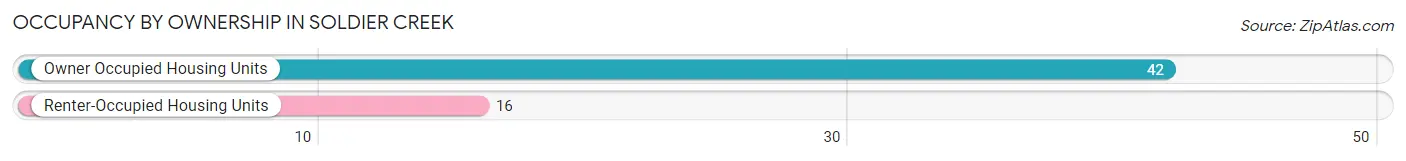
Occupancy by Ownership in Soldier Creek
Of the total 58 dwellings in Soldier Creek, owner-occupied units account for 42 (72.4%), while renter-occupied units make up 16 (27.6%).
| Occupancy | # Housing Units | % Housing Units |
| Owner Occupied Housing Units | 42 | 72.4% |
| Renter-Occupied Housing Units | 16 | 27.6% |
| Total Occupied Housing Units | 58 | 100.0% |
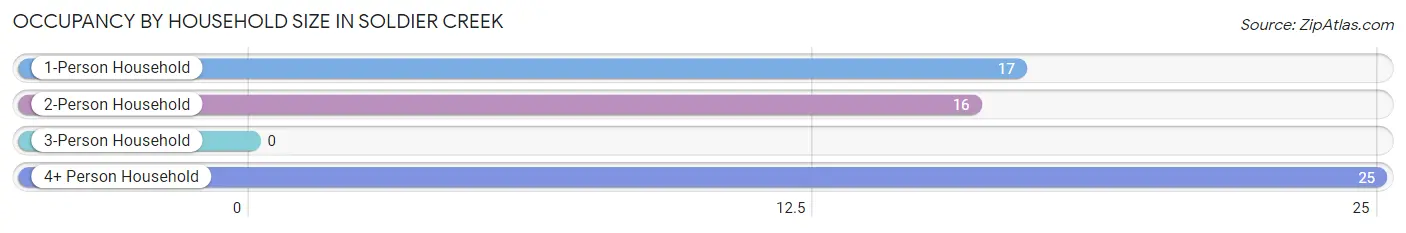
Occupancy by Household Size in Soldier Creek
| Household Size | # Housing Units | % Housing Units |
| 1-Person Household | 17 | 29.3% |
| 2-Person Household | 16 | 27.6% |
| 3-Person Household | 0 | 0.0% |
| 4+ Person Household | 25 | 43.1% |
| Total Housing Units | 58 | 100.0% |
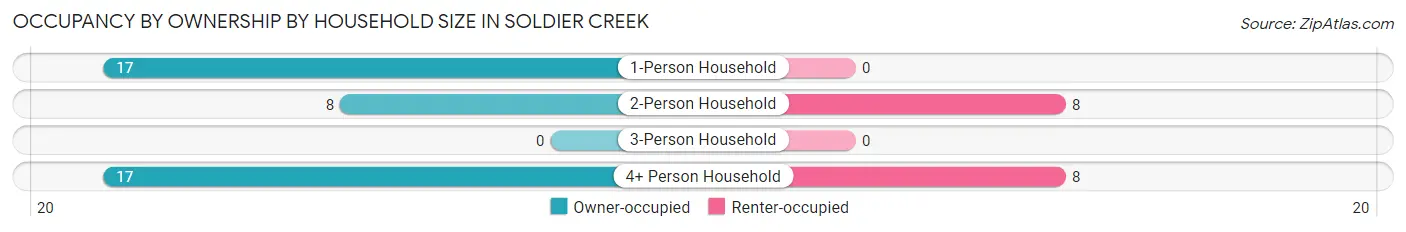
Occupancy by Ownership by Household Size in Soldier Creek
| Household Size | Owner-occupied | Renter-occupied |
| 1-Person Household | 17 (100.0%) | 0 (0.0%) |
| 2-Person Household | 8 (50.0%) | 8 (50.0%) |
| 3-Person Household | 0 (0.0%) | 0 (0.0%) |
| 4+ Person Household | 17 (68.0%) | 8 (32.0%) |
| Total Housing Units | 42 (72.4%) | 16 (27.6%) |
Occupancy by Educational Attainment in Soldier Creek
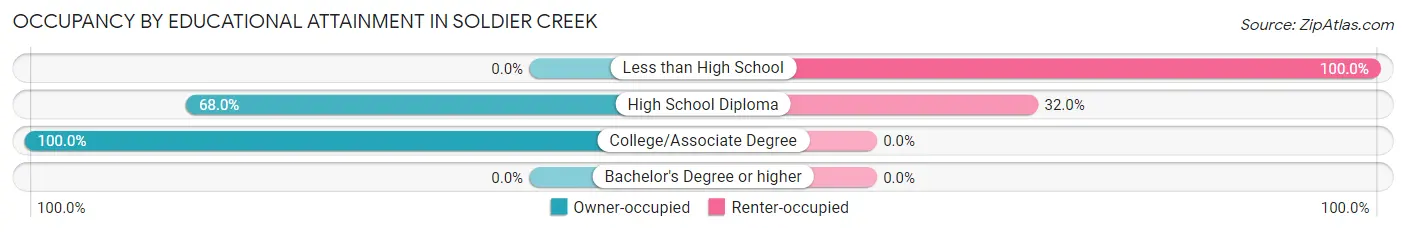
| Household Size | Owner-occupied | Renter-occupied |
| Less than High School | 0 (0.0%) | 8 (100.0%) |
| High School Diploma | 17 (68.0%) | 8 (32.0%) |
| College/Associate Degree | 25 (100.0%) | 0 (0.0%) |
| Bachelor's Degree or higher | 0 (0.0%) | 0 (0.0%) |
Occupancy by Age of Householder in Soldier Creek
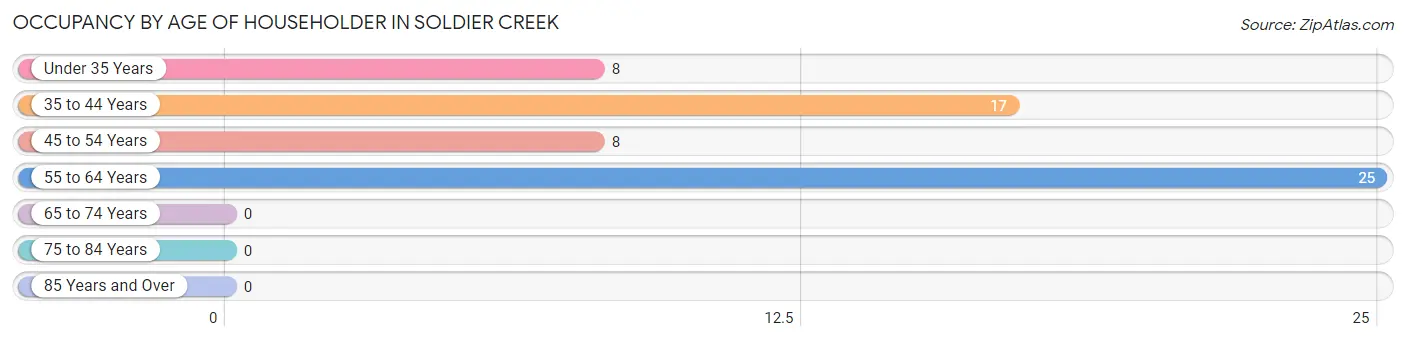
| Age Bracket | # Households | % Households |
| Under 35 Years | 8 | 13.8% |
| 35 to 44 Years | 17 | 29.3% |
| 45 to 54 Years | 8 | 13.8% |
| 55 to 64 Years | 25 | 43.1% |
| 65 to 74 Years | 0 | 0.0% |
| 75 to 84 Years | 0 | 0.0% |
| 85 Years and Over | 0 | 0.0% |
| Total | 58 | 100.0% |
Housing Finances in Soldier Creek
Median Income by Occupancy in Soldier Creek
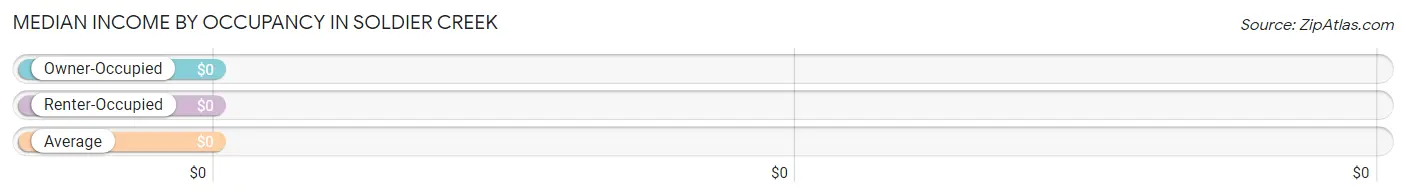
| Occupancy Type | # Households | Median Income |
| Owner-Occupied | 42 (72.4%) | $0 |
| Renter-Occupied | 16 (27.6%) | $0 |
| Average | 58 (100.0%) | $0 |
Occupancy by Householder Income Bracket in Soldier Creek
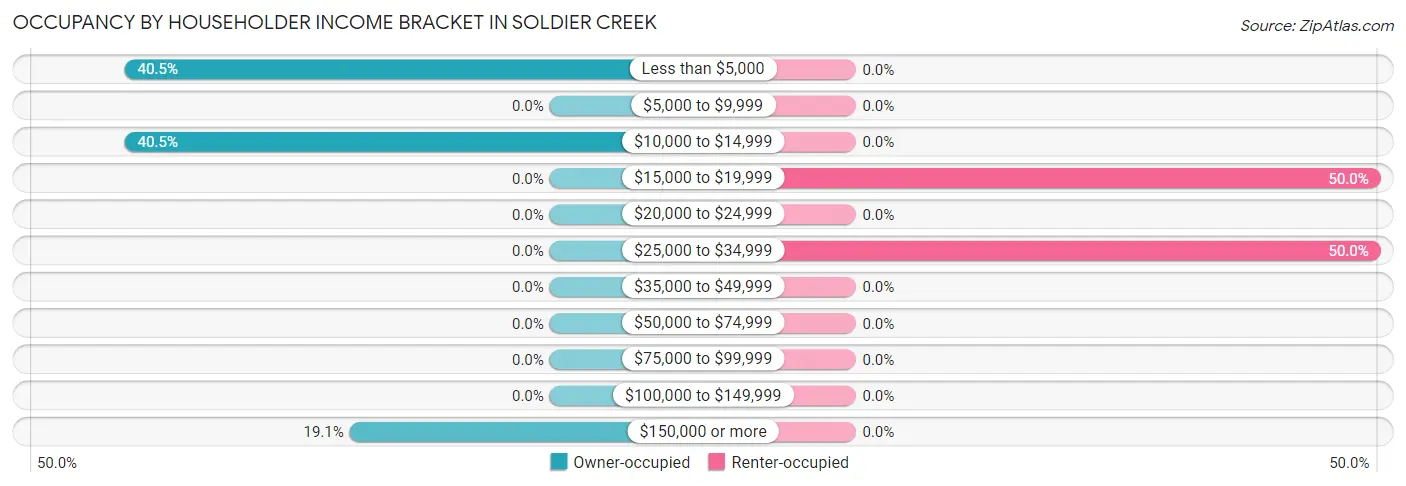
| Income Bracket | Owner-occupied | Renter-occupied |
| Less than $5,000 | 17 (40.5%) | 0 (0.0%) |
| $5,000 to $9,999 | 0 (0.0%) | 0 (0.0%) |
| $10,000 to $14,999 | 17 (40.5%) | 0 (0.0%) |
| $15,000 to $19,999 | 0 (0.0%) | 8 (50.0%) |
| $20,000 to $24,999 | 0 (0.0%) | 0 (0.0%) |
| $25,000 to $34,999 | 0 (0.0%) | 8 (50.0%) |
| $35,000 to $49,999 | 0 (0.0%) | 0 (0.0%) |
| $50,000 to $74,999 | 0 (0.0%) | 0 (0.0%) |
| $75,000 to $99,999 | 0 (0.0%) | 0 (0.0%) |
| $100,000 to $149,999 | 0 (0.0%) | 0 (0.0%) |
| $150,000 or more | 8 (19.1%) | 0 (0.0%) |
| Total | 42 (100.0%) | 16 (100.0%) |
Monthly Housing Cost Tiers in Soldier Creek
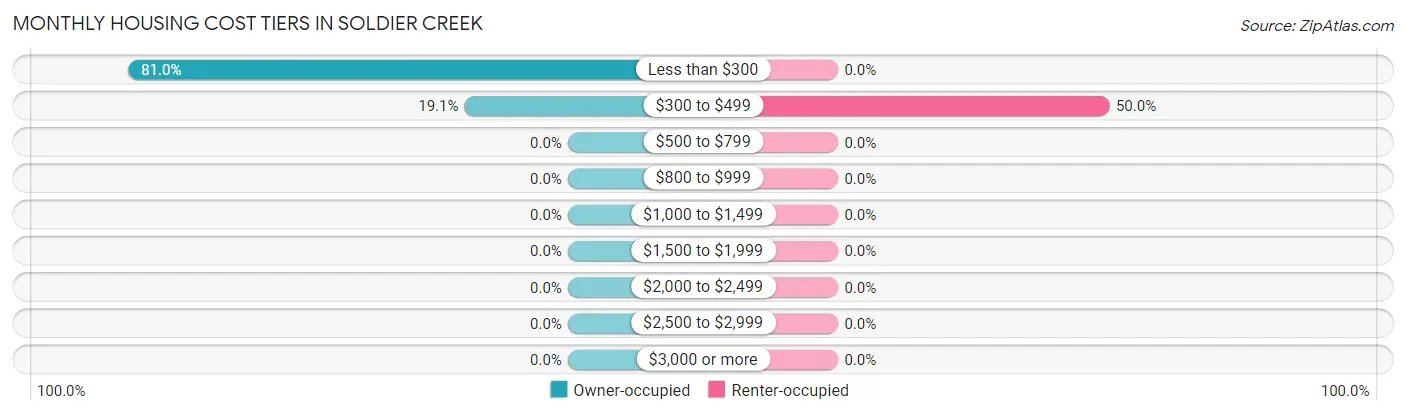
| Monthly Cost | Owner-occupied | Renter-occupied |
| Less than $300 | 34 (80.9%) | 0 (0.0%) |
| $300 to $499 | 8 (19.1%) | 8 (50.0%) |
| $500 to $799 | 0 (0.0%) | 0 (0.0%) |
| $800 to $999 | 0 (0.0%) | 0 (0.0%) |
| $1,000 to $1,499 | 0 (0.0%) | 0 (0.0%) |
| $1,500 to $1,999 | 0 (0.0%) | 0 (0.0%) |
| $2,000 to $2,499 | 0 (0.0%) | 0 (0.0%) |
| $2,500 to $2,999 | 0 (0.0%) | 0 (0.0%) |
| $3,000 or more | 0 (0.0%) | 0 (0.0%) |
| Total | 42 (100.0%) | 16 (100.0%) |
Physical Housing Characteristics in Soldier Creek
Housing Structures in Soldier Creek
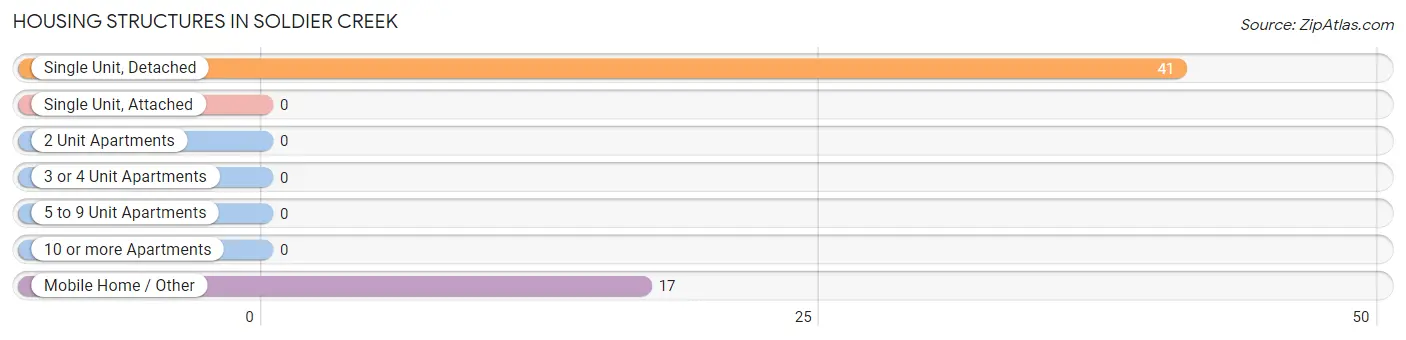
| Structure Type | # Housing Units | % Housing Units |
| Single Unit, Detached | 41 | 70.7% |
| Single Unit, Attached | 0 | 0.0% |
| 2 Unit Apartments | 0 | 0.0% |
| 3 or 4 Unit Apartments | 0 | 0.0% |
| 5 to 9 Unit Apartments | 0 | 0.0% |
| 10 or more Apartments | 0 | 0.0% |
| Mobile Home / Other | 17 | 29.3% |
| Total | 58 | 100.0% |
Housing Structures by Occupancy in Soldier Creek
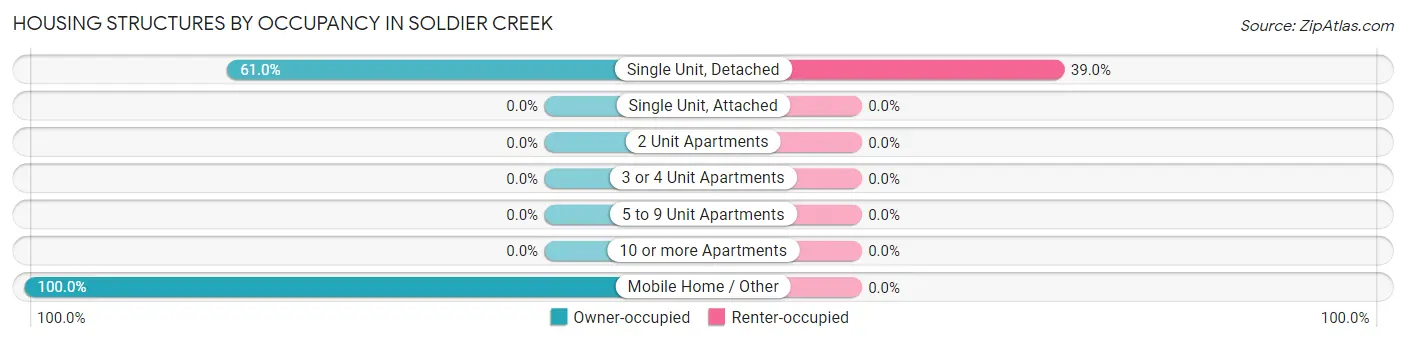
| Structure Type | Owner-occupied | Renter-occupied |
| Single Unit, Detached | 25 (61.0%) | 16 (39.0%) |
| Single Unit, Attached | 0 (0.0%) | 0 (0.0%) |
| 2 Unit Apartments | 0 (0.0%) | 0 (0.0%) |
| 3 or 4 Unit Apartments | 0 (0.0%) | 0 (0.0%) |
| 5 to 9 Unit Apartments | 0 (0.0%) | 0 (0.0%) |
| 10 or more Apartments | 0 (0.0%) | 0 (0.0%) |
| Mobile Home / Other | 17 (100.0%) | 0 (0.0%) |
| Total | 42 (72.4%) | 16 (27.6%) |
Housing Structures by Number of Rooms in Soldier Creek
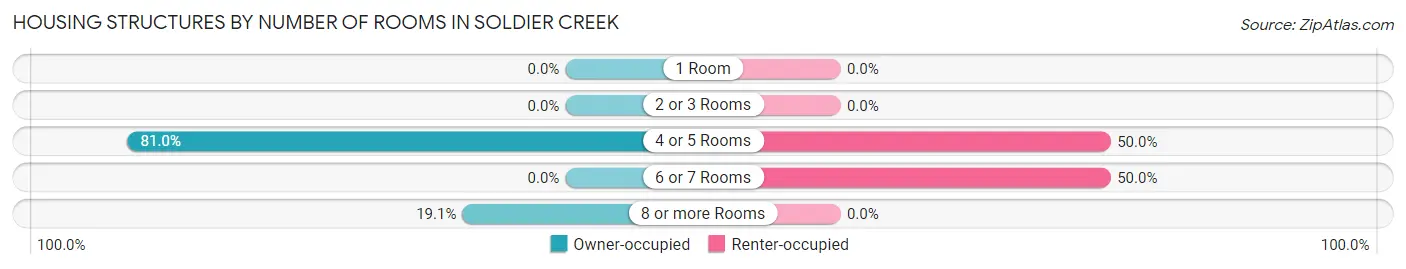
| Number of Rooms | Owner-occupied | Renter-occupied |
| 1 Room | 0 (0.0%) | 0 (0.0%) |
| 2 or 3 Rooms | 0 (0.0%) | 0 (0.0%) |
| 4 or 5 Rooms | 34 (80.9%) | 8 (50.0%) |
| 6 or 7 Rooms | 0 (0.0%) | 8 (50.0%) |
| 8 or more Rooms | 8 (19.1%) | 0 (0.0%) |
| Total | 42 (100.0%) | 16 (100.0%) |
Housing Structure by Heating Type in Soldier Creek
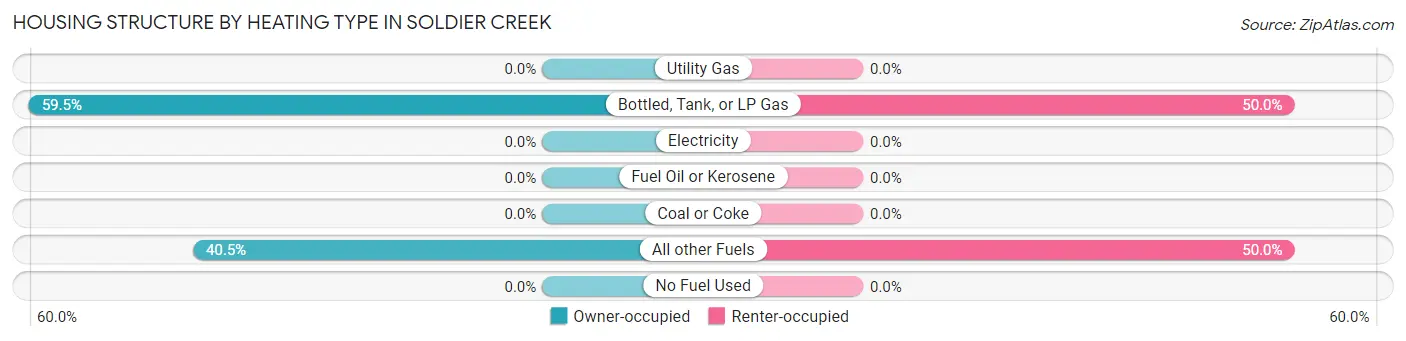
| Heating Type | Owner-occupied | Renter-occupied |
| Utility Gas | 0 (0.0%) | 0 (0.0%) |
| Bottled, Tank, or LP Gas | 25 (59.5%) | 8 (50.0%) |
| Electricity | 0 (0.0%) | 0 (0.0%) |
| Fuel Oil or Kerosene | 0 (0.0%) | 0 (0.0%) |
| Coal or Coke | 0 (0.0%) | 0 (0.0%) |
| All other Fuels | 17 (40.5%) | 8 (50.0%) |
| No Fuel Used | 0 (0.0%) | 0 (0.0%) |
| Total | 42 (100.0%) | 16 (100.0%) |
Household Vehicle Usage in Soldier Creek
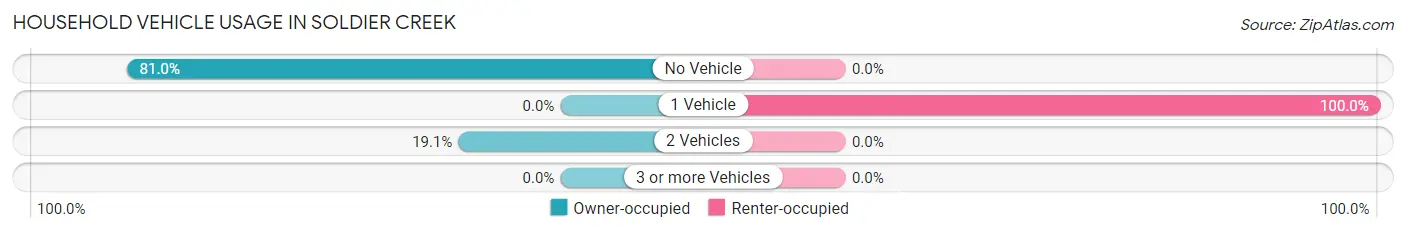
| Vehicles per Household | Owner-occupied | Renter-occupied |
| No Vehicle | 34 (80.9%) | 0 (0.0%) |
| 1 Vehicle | 0 (0.0%) | 16 (100.0%) |
| 2 Vehicles | 8 (19.1%) | 0 (0.0%) |
| 3 or more Vehicles | 0 (0.0%) | 0 (0.0%) |
| Total | 42 (100.0%) | 16 (100.0%) |
Real Estate & Mortgages in Soldier Creek
Real Estate and Mortgage Overview in Soldier Creek
| Characteristic | Without Mortgage | With Mortgage |
| Housing Units | 42 | 0 |
| Median Property Value | - | - |
| Median Household Income | - | - |
| Monthly Housing Costs | - | - |
| Real Estate Taxes | - | - |
Property Value by Mortgage Status in Soldier Creek
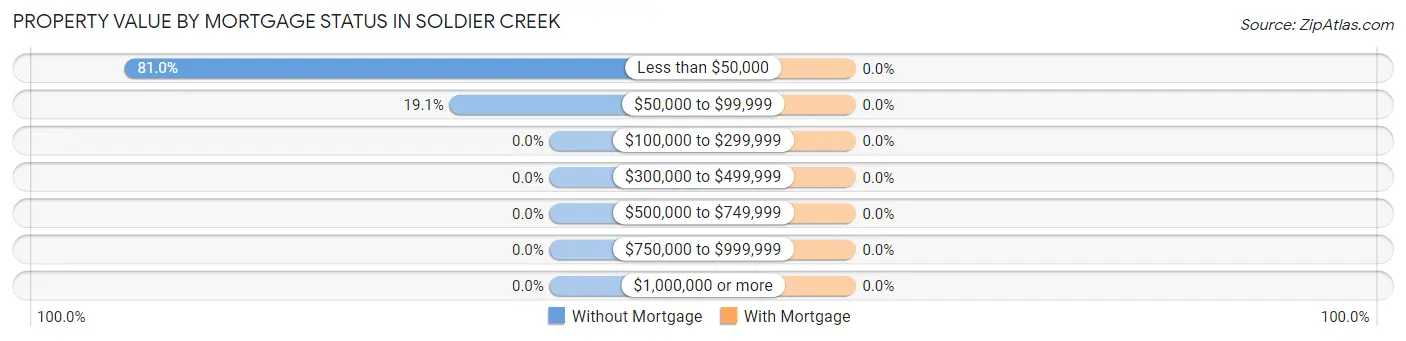
| Property Value | Without Mortgage | With Mortgage |
| Less than $50,000 | 34 (80.9%) | 0 (0.0%) |
| $50,000 to $99,999 | 8 (19.1%) | 0 (0.0%) |
| $100,000 to $299,999 | 0 (0.0%) | 0 (0.0%) |
| $300,000 to $499,999 | 0 (0.0%) | 0 (0.0%) |
| $500,000 to $749,999 | 0 (0.0%) | 0 (0.0%) |
| $750,000 to $999,999 | 0 (0.0%) | 0 (0.0%) |
| $1,000,000 or more | 0 (0.0%) | 0 (0.0%) |
| Total | 42 (100.0%) | 0 (0.0%) |
Household Income by Mortgage Status in Soldier Creek
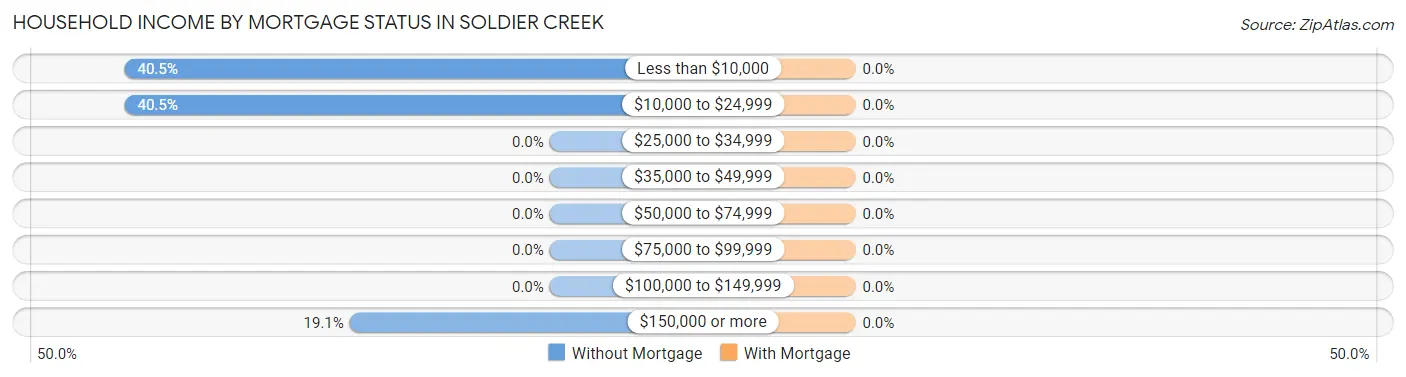
| Household Income | Without Mortgage | With Mortgage |
| Less than $10,000 | 17 (40.5%) | 0 (0.0%) |
| $10,000 to $24,999 | 17 (40.5%) | 0 (0.0%) |
| $25,000 to $34,999 | 0 (0.0%) | 0 (0.0%) |
| $35,000 to $49,999 | 0 (0.0%) | 0 (0.0%) |
| $50,000 to $74,999 | 0 (0.0%) | 0 (0.0%) |
| $75,000 to $99,999 | 0 (0.0%) | 0 (0.0%) |
| $100,000 to $149,999 | 0 (0.0%) | 0 (0.0%) |
| $150,000 or more | 8 (19.1%) | 0 (0.0%) |
| Total | 42 (100.0%) | 0 (0.0%) |
Property Value to Household Income Ratio in Soldier Creek
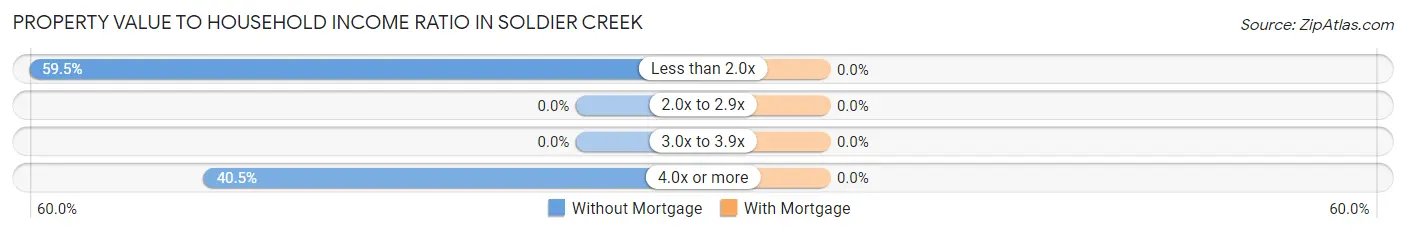
| Value-to-Income Ratio | Without Mortgage | With Mortgage |
| Less than 2.0x | 25 (59.5%) | 0 (0.0%) |
| 2.0x to 2.9x | 0 (0.0%) | 0 (0.0%) |
| 3.0x to 3.9x | 0 (0.0%) | 0 (0.0%) |
| 4.0x or more | 17 (40.5%) | 0 (0.0%) |
| Total | 42 (100.0%) | 0 (0.0%) |
Real Estate Taxes by Mortgage Status in Soldier Creek
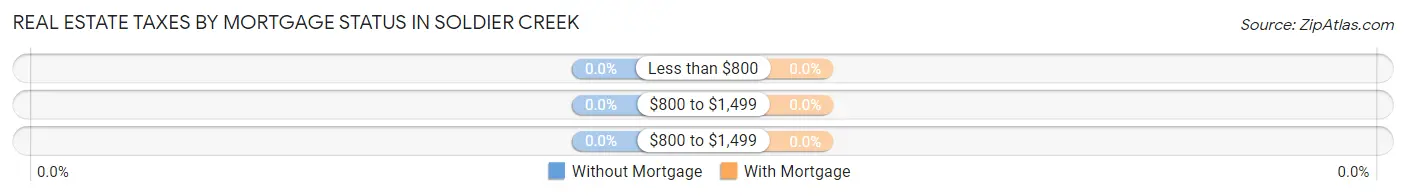
| Property Taxes | Without Mortgage | With Mortgage |
| Less than $800 | 0 (0.0%) | 0 (0.0%) |
| $800 to $1,499 | 0 (0.0%) | 0 (0.0%) |
| $800 to $1,499 | 0 (0.0%) | 0 (0.0%) |
| Total | 42 (100.0%) | 0 (0.0%) |
Health & Disability in Soldier Creek
Health Insurance Coverage by Age in Soldier Creek
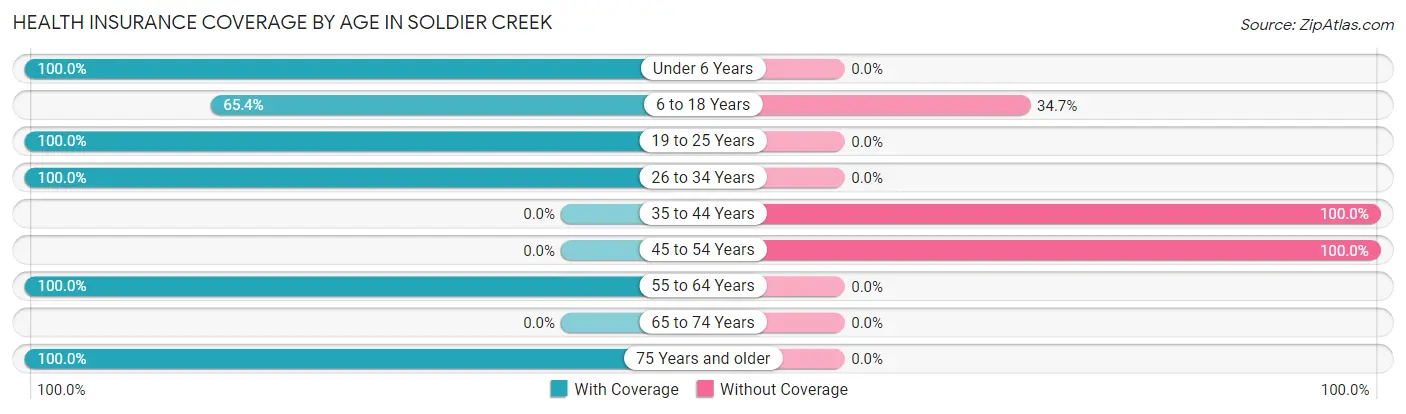
| Age Bracket | With Coverage | Without Coverage |
| Under 6 Years | 59 (100.0%) | 0 (0.0%) |
| 6 to 18 Years | 66 (65.3%) | 35 (34.6%) |
| 19 to 25 Years | 20 (100.0%) | 0 (0.0%) |
| 26 to 34 Years | 8 (100.0%) | 0 (0.0%) |
| 35 to 44 Years | 0 (0.0%) | 43 (100.0%) |
| 45 to 54 Years | 0 (0.0%) | 23 (100.0%) |
| 55 to 64 Years | 25 (100.0%) | 0 (0.0%) |
| 65 to 74 Years | 0 (0.0%) | 0 (0.0%) |
| 75 Years and older | 7 (100.0%) | 0 (0.0%) |
| Total | 185 (64.7%) | 101 (35.3%) |
Health Insurance Coverage by Citizenship Status in Soldier Creek
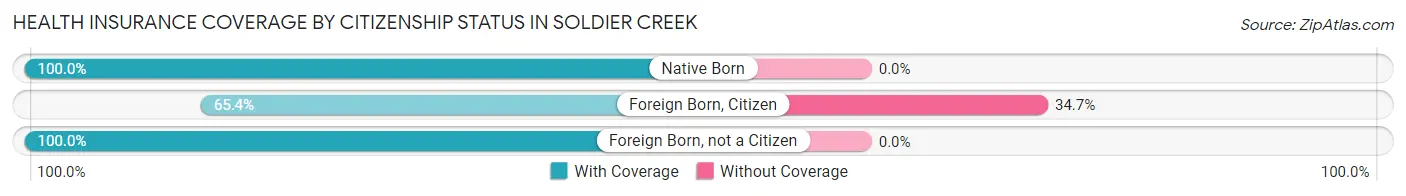
| Citizenship Status | With Coverage | Without Coverage |
| Native Born | 59 (100.0%) | 0 (0.0%) |
| Foreign Born, Citizen | 66 (65.3%) | 35 (34.6%) |
| Foreign Born, not a Citizen | 20 (100.0%) | 0 (0.0%) |
Health Insurance Coverage by Household Income in Soldier Creek
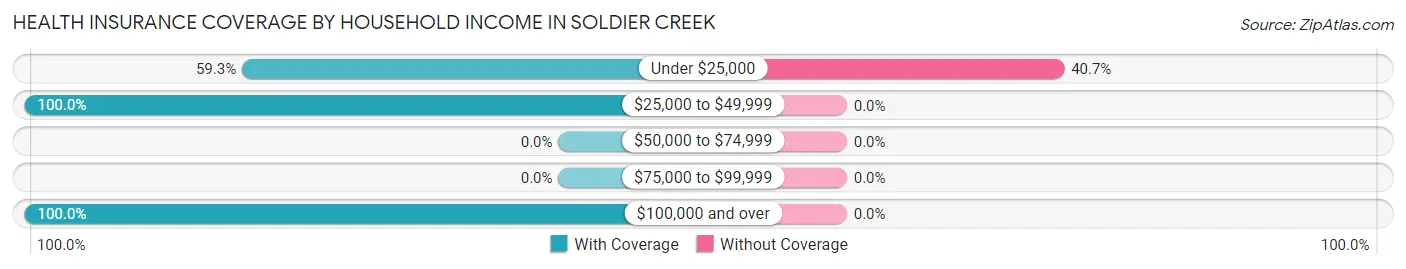
| Household Income | With Coverage | Without Coverage |
| Under $25,000 | 147 (59.3%) | 101 (40.7%) |
| $25,000 to $49,999 | 23 (100.0%) | 0 (0.0%) |
| $50,000 to $74,999 | 0 (0.0%) | 0 (0.0%) |
| $75,000 to $99,999 | 0 (0.0%) | 0 (0.0%) |
| $100,000 and over | 15 (100.0%) | 0 (0.0%) |
Public vs Private Health Insurance Coverage by Age in Soldier Creek
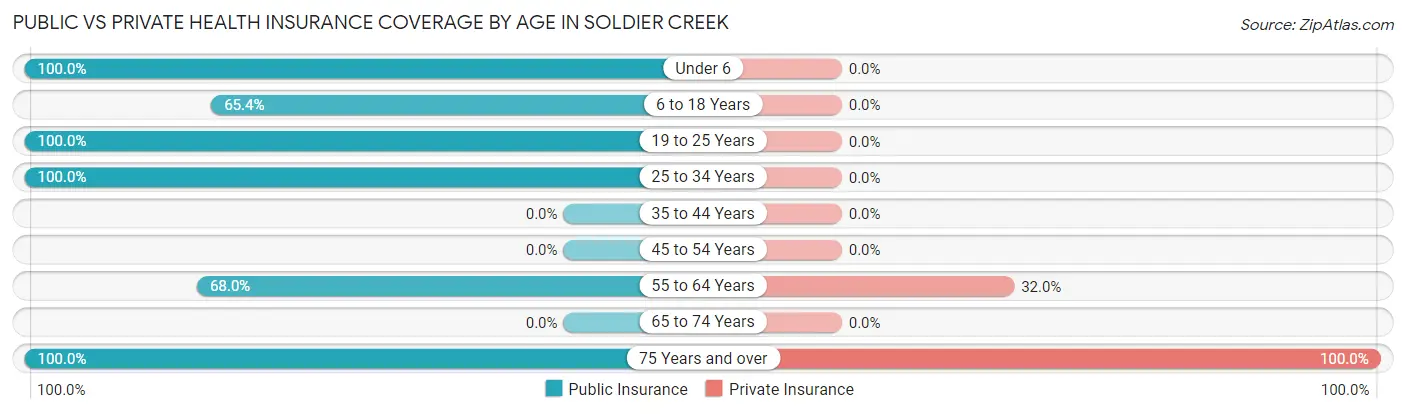
| Age Bracket | Public Insurance | Private Insurance |
| Under 6 | 59 (100.0%) | 0 (0.0%) |
| 6 to 18 Years | 66 (65.3%) | 0 (0.0%) |
| 19 to 25 Years | 20 (100.0%) | 0 (0.0%) |
| 25 to 34 Years | 8 (100.0%) | 0 (0.0%) |
| 35 to 44 Years | 0 (0.0%) | 0 (0.0%) |
| 45 to 54 Years | 0 (0.0%) | 0 (0.0%) |
| 55 to 64 Years | 17 (68.0%) | 8 (32.0%) |
| 65 to 74 Years | 0 (0.0%) | 0 (0.0%) |
| 75 Years and over | 7 (100.0%) | 7 (100.0%) |
| Total | 177 (61.9%) | 15 (5.2%) |
Disability Status by Sex by Age in Soldier Creek
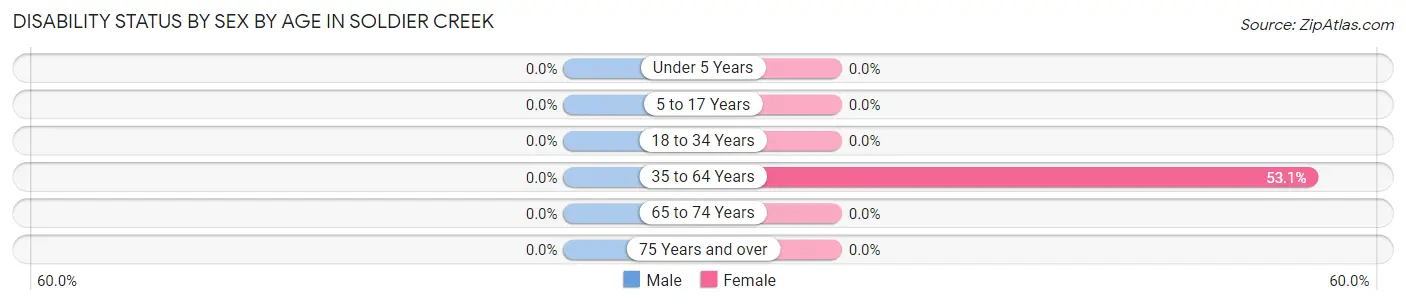
| Age Bracket | Male | Female |
| Under 5 Years | 0 (0.0%) | 0 (0.0%) |
| 5 to 17 Years | 0 (0.0%) | 0 (0.0%) |
| 18 to 34 Years | 0 (0.0%) | 0 (0.0%) |
| 35 to 64 Years | 0 (0.0%) | 26 (53.1%) |
| 65 to 74 Years | 0 (0.0%) | 0 (0.0%) |
| 75 Years and over | 0 (0.0%) | 0 (0.0%) |
Disability Class by Sex by Age in Soldier Creek
Disability Class: Hearing Difficulty
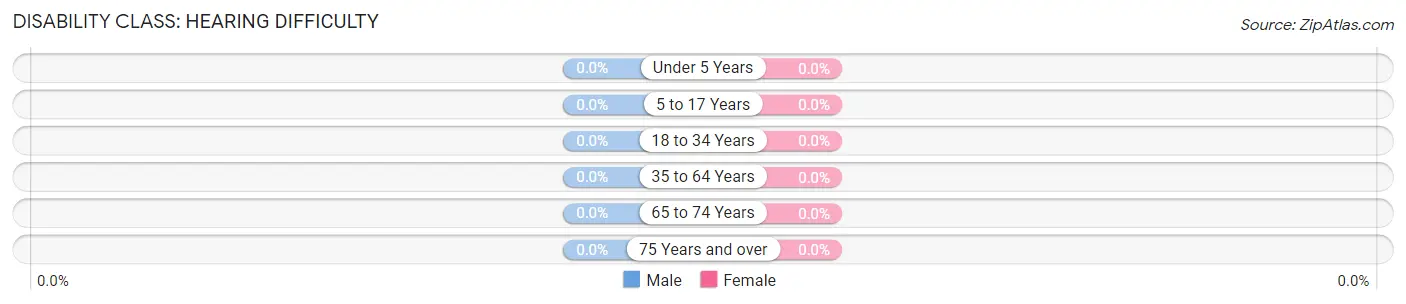
| Age Bracket | Male | Female |
| Under 5 Years | 0 (0.0%) | 0 (0.0%) |
| 5 to 17 Years | 0 (0.0%) | 0 (0.0%) |
| 18 to 34 Years | 0 (0.0%) | 0 (0.0%) |
| 35 to 64 Years | 0 (0.0%) | 0 (0.0%) |
| 65 to 74 Years | 0 (0.0%) | 0 (0.0%) |
| 75 Years and over | 0 (0.0%) | 0 (0.0%) |
Disability Class: Vision Difficulty
| Age Bracket | Male | Female |
| Under 5 Years | 0 (0.0%) | 0 (0.0%) |
| 5 to 17 Years | 0 (0.0%) | 0 (0.0%) |
| 18 to 34 Years | 0 (0.0%) | 0 (0.0%) |
| 35 to 64 Years | 0 (0.0%) | 0 (0.0%) |
| 65 to 74 Years | 0 (0.0%) | 0 (0.0%) |
| 75 Years and over | 0 (0.0%) | 0 (0.0%) |
Disability Class: Cognitive Difficulty
| Age Bracket | Male | Female |
| 5 to 17 Years | 0 (0.0%) | 0 (0.0%) |
| 18 to 34 Years | 0 (0.0%) | 0 (0.0%) |
| 35 to 64 Years | 0 (0.0%) | 0 (0.0%) |
| 65 to 74 Years | 0 (0.0%) | 0 (0.0%) |
| 75 Years and over | 0 (0.0%) | 0 (0.0%) |
Disability Class: Ambulatory Difficulty
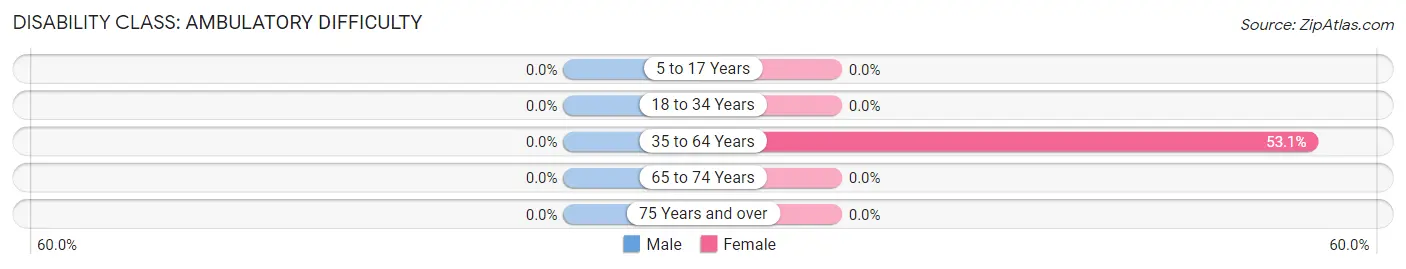
| Age Bracket | Male | Female |
| 5 to 17 Years | 0 (0.0%) | 0 (0.0%) |
| 18 to 34 Years | 0 (0.0%) | 0 (0.0%) |
| 35 to 64 Years | 0 (0.0%) | 26 (53.1%) |
| 65 to 74 Years | 0 (0.0%) | 0 (0.0%) |
| 75 Years and over | 0 (0.0%) | 0 (0.0%) |
Disability Class: Self-Care Difficulty
| Age Bracket | Male | Female |
| 5 to 17 Years | 0 (0.0%) | 0 (0.0%) |
| 18 to 34 Years | 0 (0.0%) | 0 (0.0%) |
| 35 to 64 Years | 0 (0.0%) | 0 (0.0%) |
| 65 to 74 Years | 0 (0.0%) | 0 (0.0%) |
| 75 Years and over | 0 (0.0%) | 0 (0.0%) |
Technology Access in Soldier Creek
Computing Device Access in Soldier Creek
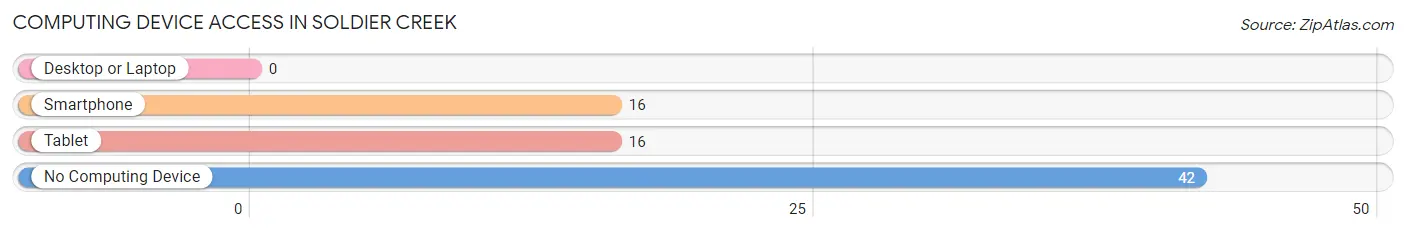
| Device Type | # Households | % Households |
| Desktop or Laptop | 0 | 0.0% |
| Smartphone | 16 | 27.6% |
| Tablet | 16 | 27.6% |
| No Computing Device | 42 | 72.4% |
| Total | 58 | 100.0% |
Internet Access in Soldier Creek
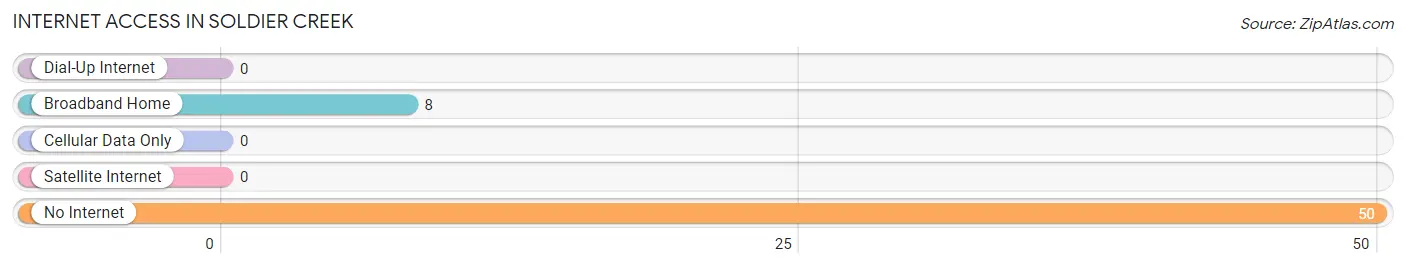
| Internet Type | # Households | % Households |
| Dial-Up Internet | 0 | 0.0% |
| Broadband Home | 8 | 13.8% |
| Cellular Data Only | 0 | 0.0% |
| Satellite Internet | 0 | 0.0% |
| No Internet | 50 | 86.2% |
| Total | 58 | 100.0% |
Soldier Creek Summary
Soldier Creek is a small unincorporated community located in the southeastern corner of South Dakota, in the United States. It is situated in the extreme southeastern corner of the state, near the border with Nebraska and Iowa. The town is located in the extreme southeastern corner of Union County, South Dakota, and is part of the Sioux Falls Metropolitan Statistical Area.
History
The town of Soldier Creek was founded in 1883 by a group of settlers from Iowa. The town was named after the nearby Soldier Creek, which was named after a group of soldiers who camped near the creek during the Sioux Wars of the late 19th century. The town was originally a farming community, and the settlers grew wheat, corn, and other crops.
In the early 20th century, the town began to grow and develop. The town was incorporated in 1909, and the first mayor was elected in 1910. The town was home to a number of businesses, including a general store, a blacksmith shop, a hotel, and a bank.
Geography
Soldier Creek is located in the extreme southeastern corner of South Dakota, near the border with Nebraska and Iowa. The town is situated in the extreme southeastern corner of Union County, South Dakota, and is part of the Sioux Falls Metropolitan Statistical Area. The town is located at an elevation of 1,845 feet (562 m).
The town is located in a rural area, and is surrounded by rolling hills and farmland. The nearest major city is Sioux Falls, which is located about 40 miles (64 km) to the northwest.
Economy
The economy of Soldier Creek is largely based on agriculture. The town is home to a number of farms, which grow a variety of crops, including wheat, corn, soybeans, and hay. The town is also home to a number of small businesses, including a general store, a hardware store, and a restaurant.
Demographics
As of the 2010 census, the population of Soldier Creek was 545. The town has a total area of 0.6 square miles (1.6 km2), all of which is land. The racial makeup of the town was 97.3% White, 0.2% African American, 0.2% Native American, 0.2% Asian, 0.2% from other races, and 1.9% from two or more races. Hispanic or Latino of any race were 0.7% of the population.
The median income for a household in the town was $37,500, and the median income for a family was $41,250. The per capita income for the town was $17,845. About 8.3% of families and 10.2% of the population were below the poverty line, including 11.3% of those under age 18 and 8.3% of those age 65 or over.
Conclusion
Soldier Creek is a small unincorporated community located in the extreme southeastern corner of South Dakota, near the border with Nebraska and Iowa. The town was founded in 1883 by a group of settlers from Iowa, and was named after the nearby Soldier Creek. The town is largely agricultural, and is home to a number of farms and small businesses. The population of Soldier Creek was 545 as of the 2010 census, and the median income for a household was $37,500.
Common Questions
What is Per Capita Income in Soldier Creek?
Per Capita income in Soldier Creek is $8,830.
What is Inequality or Gini Index in Soldier Creek?
Inequality or Gini Index in Soldier Creek is 0.73.
What is the Total Population of Soldier Creek?
Total Population of Soldier Creek is 286.
What is the Total Male Population of Soldier Creek?
Total Male Population of Soldier Creek is 90.
What is the Total Female Population of Soldier Creek?
Total Female Population of Soldier Creek is 196.
What is the Ratio of Males per 100 Females in Soldier Creek?
There are 45.92 Males per 100 Females in Soldier Creek.
What is the Ratio of Females per 100 Males in Soldier Creek?
There are 217.78 Females per 100 Males in Soldier Creek.
What is the Median Population Age in Soldier Creek?
Median Population Age in Soldier Creek is 18.2 Years.
What is the Average Family Size in Soldier Creek
Average Family Size in Soldier Creek is 6.2 People.
What is the Average Household Size in Soldier Creek
Average Household Size in Soldier Creek is 4.9 People.
How Large is the Labor Force in Soldier Creek?
There are 32 People in the Labor Forcein in Soldier Creek.
What is the Percentage of People in the Labor Force in Soldier Creek?
21.2% of People are in the Labor Force in Soldier Creek.
What is the Unemployment Rate in Soldier Creek?
Unemployment Rate in Soldier Creek is 53.1%.