Marshall, OK Map & Demographics
Marshall Map
Marshall Overview
$29,190
PER CAPITA INCOME
$51,250
AVG FAMILY INCOME
$58,182
AVG HOUSEHOLD INCOME
17.2%
WAGE / INCOME GAP [ % ]
82.8¢/ $1
WAGE / INCOME GAP [ $ ]
0.33
INEQUALITY / GINI INDEX
335
TOTAL POPULATION
163
MALE POPULATION
172
FEMALE POPULATION
94.77
MALES / 100 FEMALES
105.52
FEMALES / 100 MALES
49.5
MEDIAN AGE
3.6
AVG FAMILY SIZE
2.1
AVG HOUSEHOLD SIZE
202
LABOR FORCE [ PEOPLE ]
68.7%
PERCENT IN LABOR FORCE
Marshall Zip Codes
Marshall Area Codes
Income in Marshall
Income Overview in Marshall
Per Capita Income in Marshall is $29,190, while median incomes of families and households are $51,250 and $58,182 respectively.
| Characteristic | Number | Measure |
| Per Capita Income | 335 | $29,190 |
| Median Family Income | 66 | $51,250 |
| Mean Family Income | 66 | $60,252 |
| Median Household Income | 158 | $58,182 |
| Mean Household Income | 158 | $57,805 |
| Income Deficit | 66 | $0 |
| Wage / Income Gap (%) | 335 | 17.18% |
| Wage / Income Gap ($) | 335 | 82.82¢ per $1 |
| Gini / Inequality Index | 335 | 0.33 |
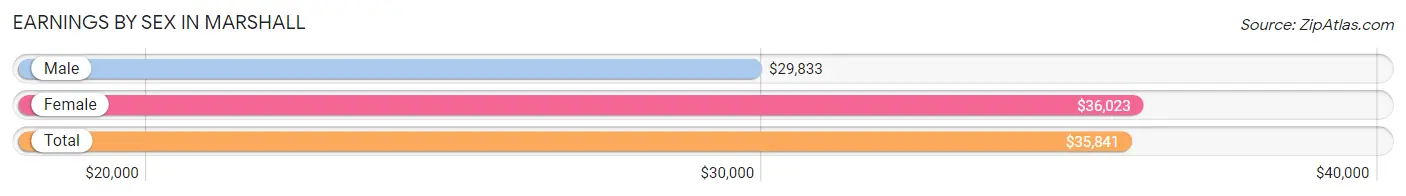
Earnings by Sex in Marshall
Average Earnings in Marshall are $35,841, $29,833 for men and $36,023 for women, a difference of 17.2%.
| Sex | Number | Average Earnings |
| Male | 80 (39.4%) | $29,833 |
| Female | 123 (60.6%) | $36,023 |
| Total | 203 (100.0%) | $35,841 |
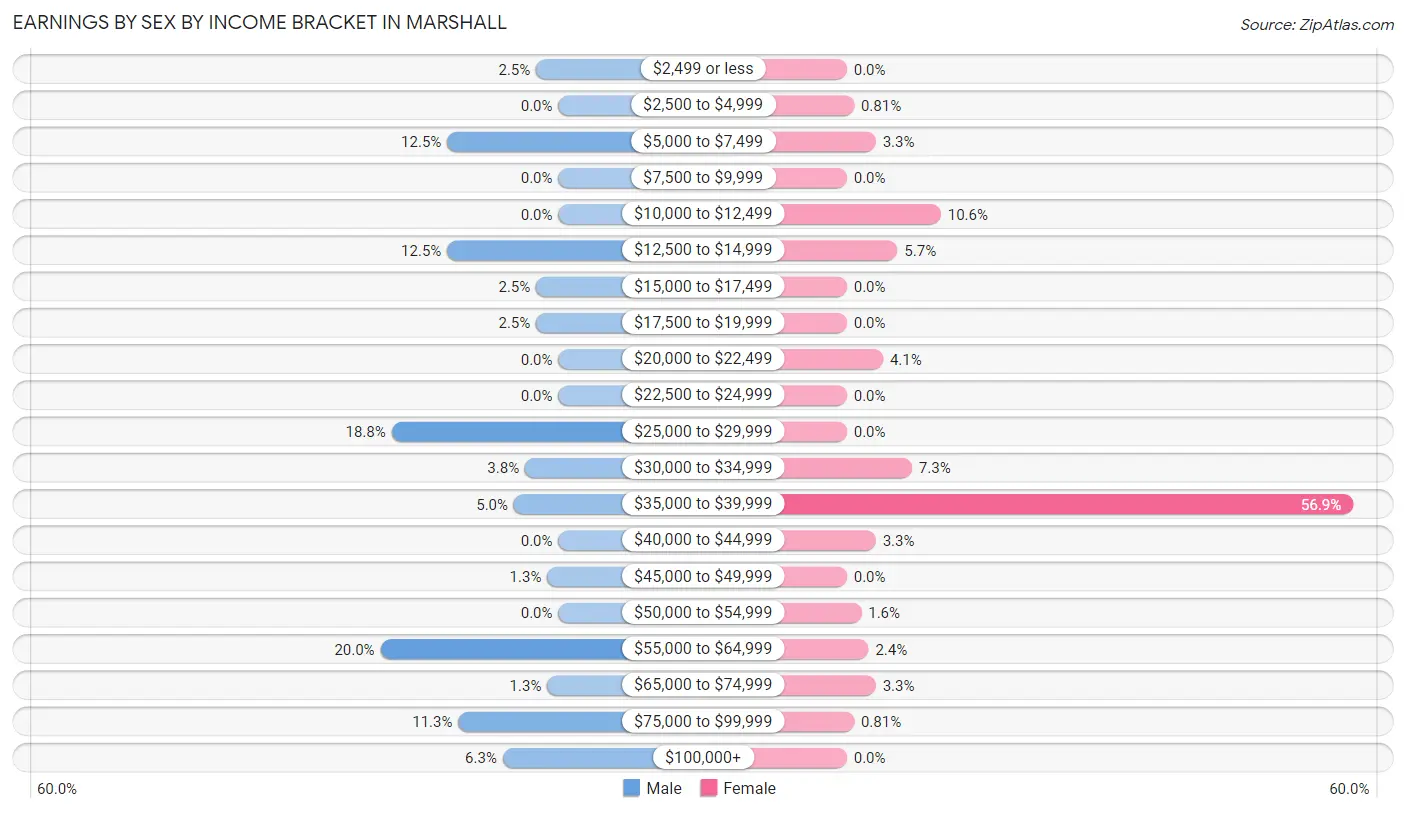
Earnings by Sex by Income Bracket in Marshall
The most common earnings brackets in Marshall are $55,000 to $64,999 for men (16 | 20.0%) and $35,000 to $39,999 for women (70 | 56.9%).
| Income | Male | Female |
| $2,499 or less | 2 (2.5%) | 0 (0.0%) |
| $2,500 to $4,999 | 0 (0.0%) | 1 (0.8%) |
| $5,000 to $7,499 | 10 (12.5%) | 4 (3.3%) |
| $7,500 to $9,999 | 0 (0.0%) | 0 (0.0%) |
| $10,000 to $12,499 | 0 (0.0%) | 13 (10.6%) |
| $12,500 to $14,999 | 10 (12.5%) | 7 (5.7%) |
| $15,000 to $17,499 | 2 (2.5%) | 0 (0.0%) |
| $17,500 to $19,999 | 2 (2.5%) | 0 (0.0%) |
| $20,000 to $22,499 | 0 (0.0%) | 5 (4.1%) |
| $22,500 to $24,999 | 0 (0.0%) | 0 (0.0%) |
| $25,000 to $29,999 | 15 (18.8%) | 0 (0.0%) |
| $30,000 to $34,999 | 3 (3.7%) | 9 (7.3%) |
| $35,000 to $39,999 | 4 (5.0%) | 70 (56.9%) |
| $40,000 to $44,999 | 0 (0.0%) | 4 (3.3%) |
| $45,000 to $49,999 | 1 (1.3%) | 0 (0.0%) |
| $50,000 to $54,999 | 0 (0.0%) | 2 (1.6%) |
| $55,000 to $64,999 | 16 (20.0%) | 3 (2.4%) |
| $65,000 to $74,999 | 1 (1.3%) | 4 (3.3%) |
| $75,000 to $99,999 | 9 (11.3%) | 1 (0.8%) |
| $100,000+ | 5 (6.2%) | 0 (0.0%) |
| Total | 80 (100.0%) | 123 (100.0%) |
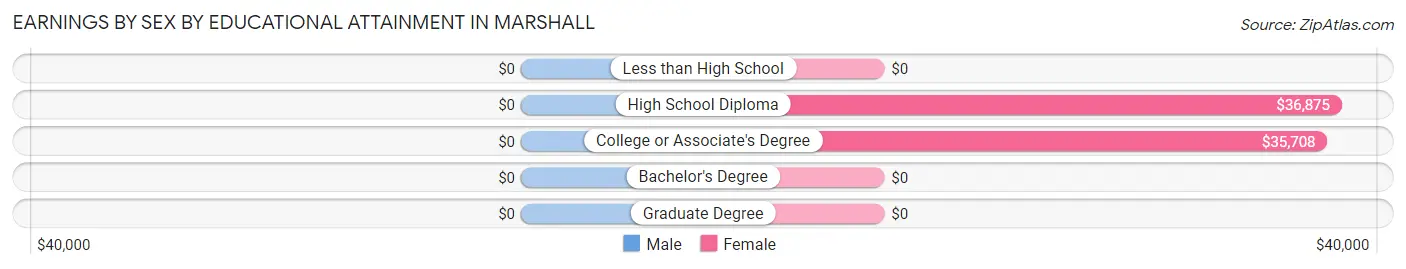
Earnings by Sex by Educational Attainment in Marshall
| Educational Attainment | Male Income | Female Income |
| Less than High School | - | - |
| High School Diploma | - | - |
| College or Associate's Degree | - | - |
| Bachelor's Degree | - | - |
| Graduate Degree | - | - |
| Total | $55,357 | $35,750 |
Family Income in Marshall
Family Income Brackets in Marshall
According to the Marshall family income data, there are 13 families falling into the $100,000 to $149,999 income range, which is the most common income bracket and makes up 19.7% of all families.
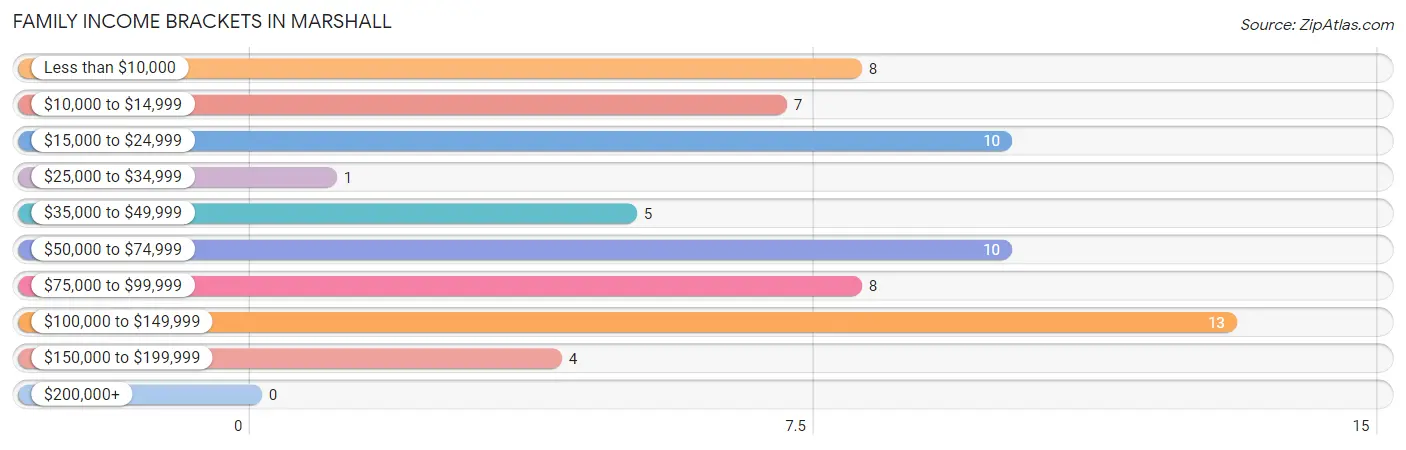
| Income Bracket | # Families | % Families |
| Less than $10,000 | 8 | 12.1% |
| $10,000 to $14,999 | 7 | 10.6% |
| $15,000 to $24,999 | 10 | 15.2% |
| $25,000 to $34,999 | 1 | 1.5% |
| $35,000 to $49,999 | 5 | 7.6% |
| $50,000 to $74,999 | 10 | 15.2% |
| $75,000 to $99,999 | 8 | 12.1% |
| $100,000 to $149,999 | 13 | 19.7% |
| $150,000 to $199,999 | 4 | 6.1% |
| $200,000+ | 0 | 0.0% |
Family Income by Famaliy Size in Marshall
4-person families (16 | 24.2%) account for the highest median family income in Marshall with $81,250 per family, while 4-person families (16 | 24.2%) have the highest median income of $20,312 per family member.
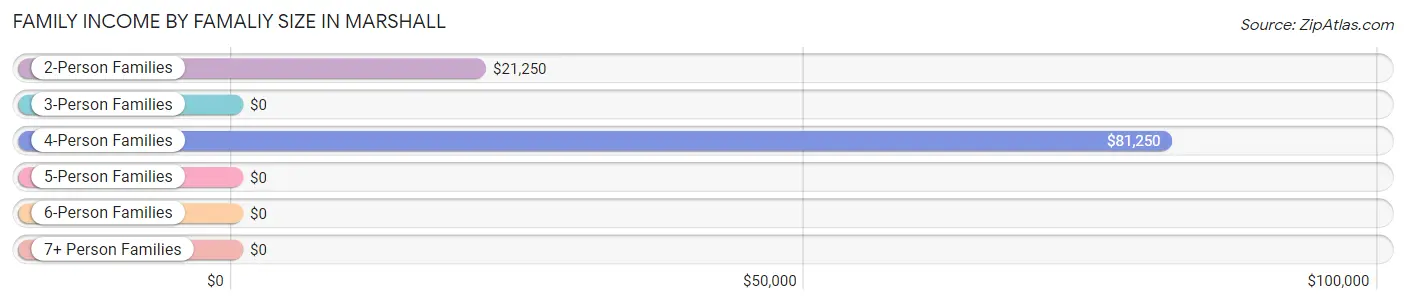
| Income Bracket | # Families | Median Income |
| 2-Person Families | 24 (36.4%) | $21,250 |
| 3-Person Families | 18 (27.3%) | $0 |
| 4-Person Families | 16 (24.2%) | $81,250 |
| 5-Person Families | 8 (12.1%) | $0 |
| 6-Person Families | 0 (0.0%) | $0 |
| 7+ Person Families | 0 (0.0%) | $0 |
| Total | 66 (100.0%) | $51,250 |
Family Income by Number of Earners in Marshall
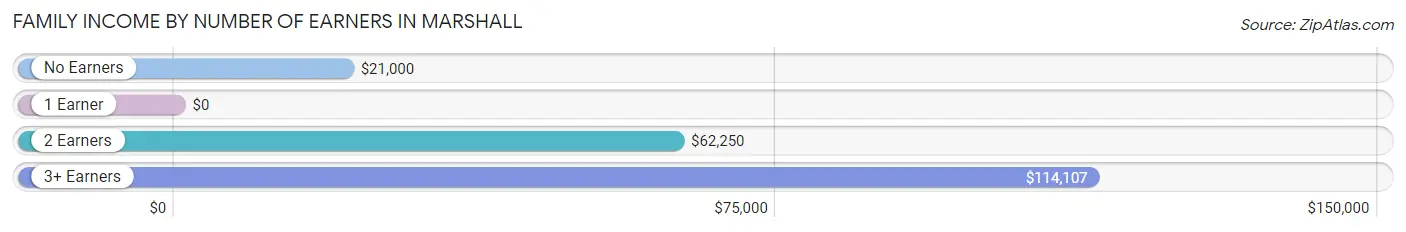
| Number of Earners | # Families | Median Income |
| No Earners | 12 (18.2%) | $21,000 |
| 1 Earner | 14 (21.2%) | $0 |
| 2 Earners | 27 (40.9%) | $62,250 |
| 3+ Earners | 13 (19.7%) | $114,107 |
| Total | 66 (100.0%) | $51,250 |
Household Income in Marshall
Household Income Brackets in Marshall
With 70 households falling in the category, the $50,000 to $74,999 income range is the most frequent in Marshall, accounting for 44.3% of all households.
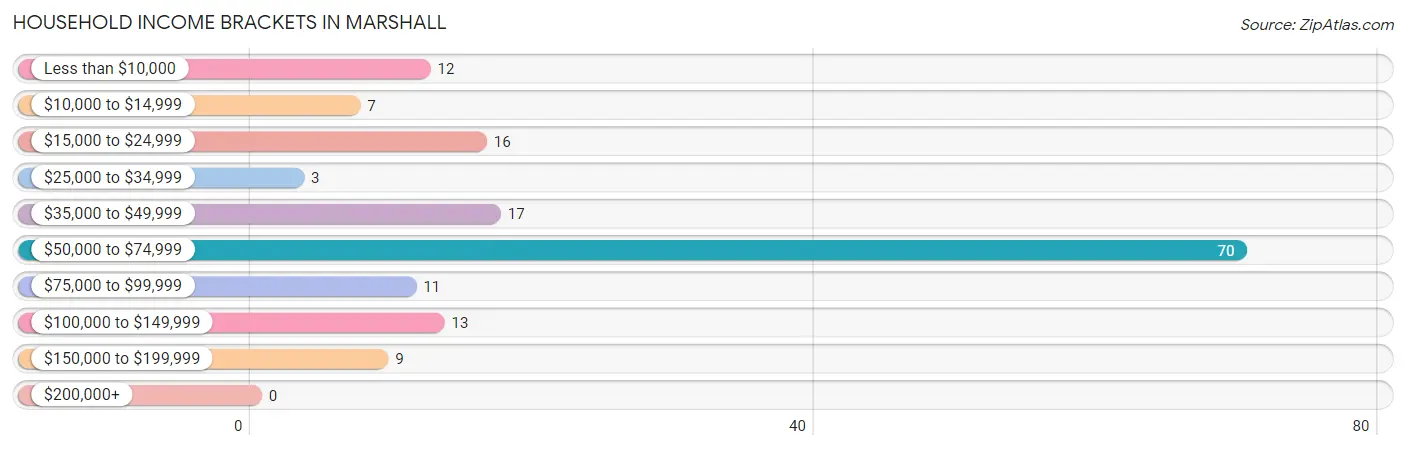
| Income Bracket | # Households | % Households |
| Less than $10,000 | 12 | 7.6% |
| $10,000 to $14,999 | 7 | 4.4% |
| $15,000 to $24,999 | 16 | 10.1% |
| $25,000 to $34,999 | 3 | 1.9% |
| $35,000 to $49,999 | 17 | 10.8% |
| $50,000 to $74,999 | 70 | 44.3% |
| $75,000 to $99,999 | 11 | 7.0% |
| $100,000 to $149,999 | 13 | 8.2% |
| $150,000 to $199,999 | 9 | 5.7% |
| $200,000+ | 0 | 0.0% |
Household Income by Householder Age in Marshall
The median household income in Marshall is $58,182, with the highest median household income of $95,625 found in the 25 to 44 years age bracket for the primary householder. A total of 19 households (12.0%) fall into this category. Meanwhile, the 15 to 24 years age bracket for the primary householder has the lowest median household income of $0, with 3 households (1.9%) in this group.
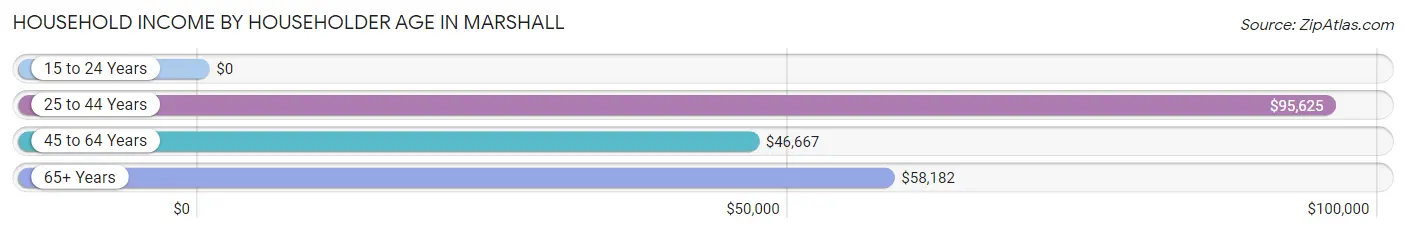
| Income Bracket | # Households | Median Income |
| 15 to 24 Years | 3 (1.9%) | $0 |
| 25 to 44 Years | 19 (12.0%) | $95,625 |
| 45 to 64 Years | 46 (29.1%) | $46,667 |
| 65+ Years | 90 (57.0%) | $58,182 |
| Total | 158 (100.0%) | $58,182 |
Poverty in Marshall
Income Below Poverty by Sex and Age in Marshall
With 25.2% poverty level for males and 14.5% for females among the residents of Marshall, 55 to 64 year old males and 55 to 64 year old females are the most vulnerable to poverty, with 10 males (55.6%) and 9 females (39.1%) in their respective age groups living below the poverty level.
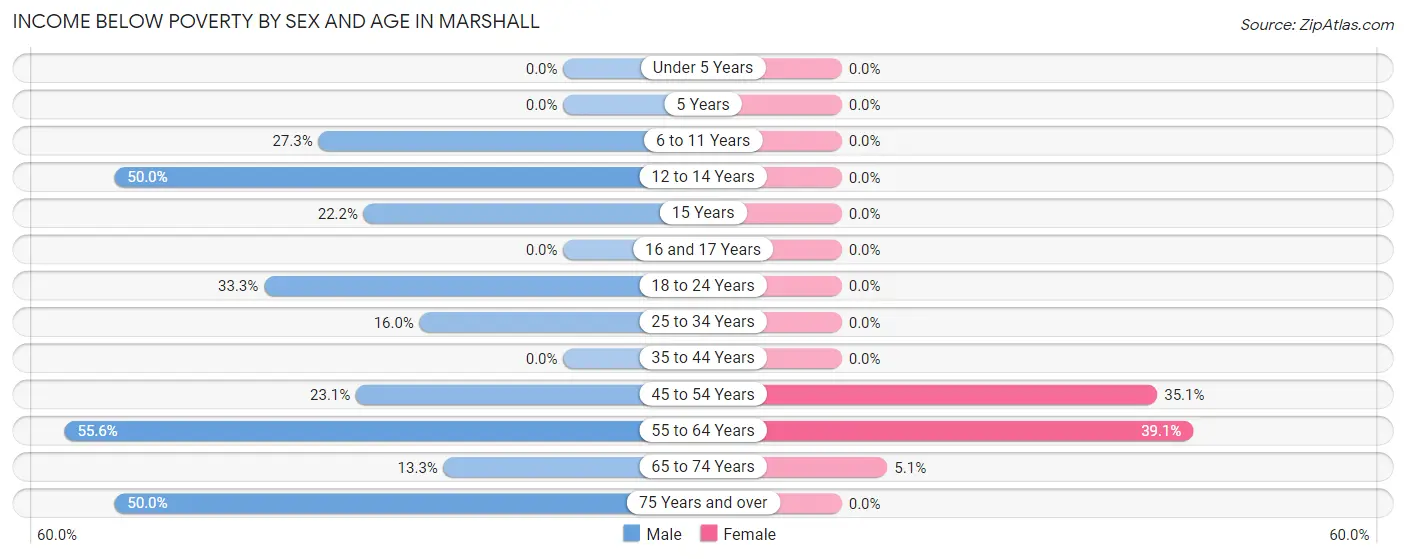
| Age Bracket | Male | Female |
| Under 5 Years | 0 (0.0%) | 0 (0.0%) |
| 5 Years | 0 (0.0%) | 0 (0.0%) |
| 6 to 11 Years | 3 (27.3%) | 0 (0.0%) |
| 12 to 14 Years | 1 (50.0%) | 0 (0.0%) |
| 15 Years | 2 (22.2%) | 0 (0.0%) |
| 16 and 17 Years | 0 (0.0%) | 0 (0.0%) |
| 18 to 24 Years | 9 (33.3%) | 0 (0.0%) |
| 25 to 34 Years | 4 (16.0%) | 0 (0.0%) |
| 35 to 44 Years | 0 (0.0%) | 0 (0.0%) |
| 45 to 54 Years | 6 (23.1%) | 13 (35.1%) |
| 55 to 64 Years | 10 (55.6%) | 9 (39.1%) |
| 65 to 74 Years | 2 (13.3%) | 3 (5.1%) |
| 75 Years and over | 4 (50.0%) | 0 (0.0%) |
| Total | 41 (25.2%) | 25 (14.5%) |
Income Above Poverty by Sex and Age in Marshall
According to the poverty statistics in Marshall, males aged under 5 years and females aged under 5 years are the age groups that are most secure financially, with 100.0% of males and 100.0% of females in these age groups living above the poverty line.
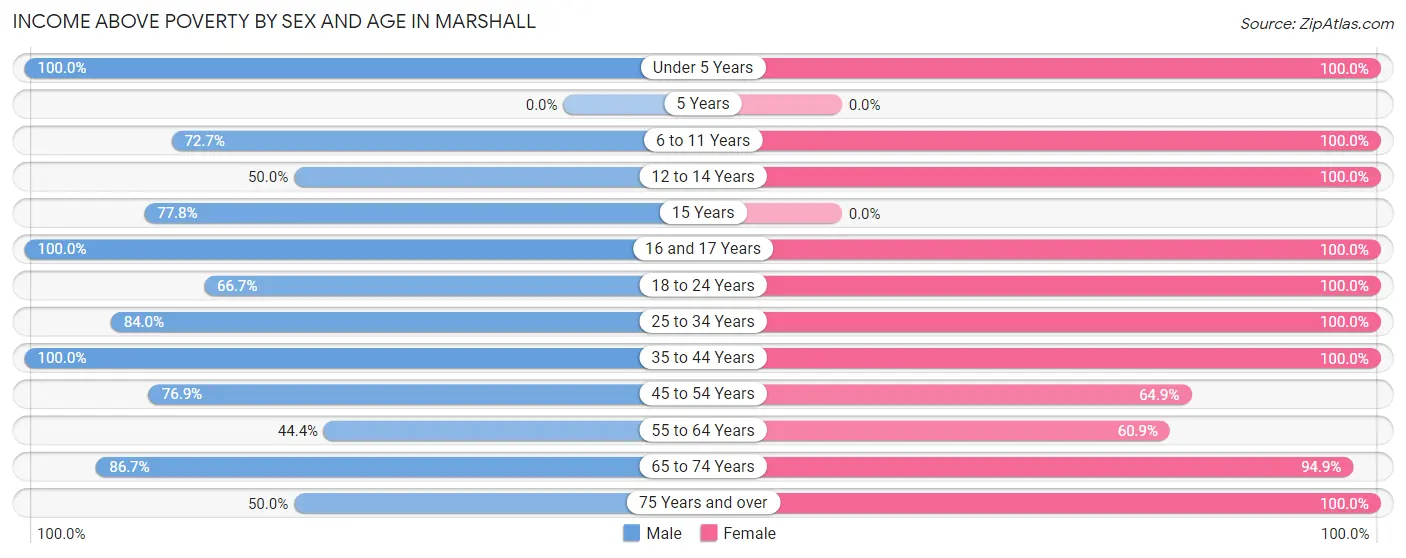
| Age Bracket | Male | Female |
| Under 5 Years | 6 (100.0%) | 3 (100.0%) |
| 5 Years | 0 (0.0%) | 0 (0.0%) |
| 6 to 11 Years | 8 (72.7%) | 4 (100.0%) |
| 12 to 14 Years | 1 (50.0%) | 6 (100.0%) |
| 15 Years | 7 (77.8%) | 0 (0.0%) |
| 16 and 17 Years | 2 (100.0%) | 3 (100.0%) |
| 18 to 24 Years | 18 (66.7%) | 14 (100.0%) |
| 25 to 34 Years | 21 (84.0%) | 6 (100.0%) |
| 35 to 44 Years | 14 (100.0%) | 7 (100.0%) |
| 45 to 54 Years | 20 (76.9%) | 24 (64.9%) |
| 55 to 64 Years | 8 (44.4%) | 14 (60.9%) |
| 65 to 74 Years | 13 (86.7%) | 56 (94.9%) |
| 75 Years and over | 4 (50.0%) | 10 (100.0%) |
| Total | 122 (74.9%) | 147 (85.5%) |
Income Below Poverty Among Married-Couple Families in Marshall
The poverty statistics for married-couple families in Marshall show that 19.6% or 11 of the total 56 families live below the poverty line. Families with no children have the highest poverty rate of 34.6%, comprising of 9 families. On the other hand, families with 1 or 2 children have the lowest poverty rate of 6.7%, which includes 2 families.
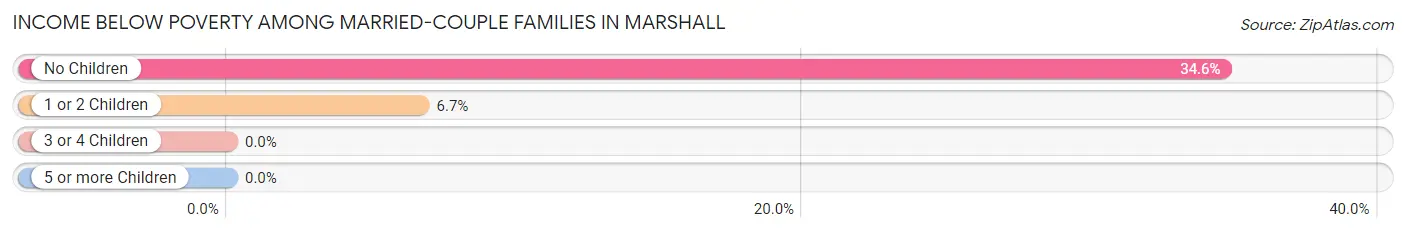
| Children | Above Poverty | Below Poverty |
| No Children | 17 (65.4%) | 9 (34.6%) |
| 1 or 2 Children | 28 (93.3%) | 2 (6.7%) |
| 3 or 4 Children | 0 (0.0%) | 0 (0.0%) |
| 5 or more Children | 0 (0.0%) | 0 (0.0%) |
| Total | 45 (80.4%) | 11 (19.6%) |
Income Below Poverty Among Single-Parent Households in Marshall
According to the poverty data in Marshall, 66.7% or 6 single-father households and 100.0% or 1 single-mother households are living below the poverty line. Among single-father households, those with no children have the highest poverty rate, with 6 households (66.7%) experiencing poverty. Likewise, among single-mother households, those with 3 or 4 children have the highest poverty rate, with 1 households (100.0%) falling below the poverty line.
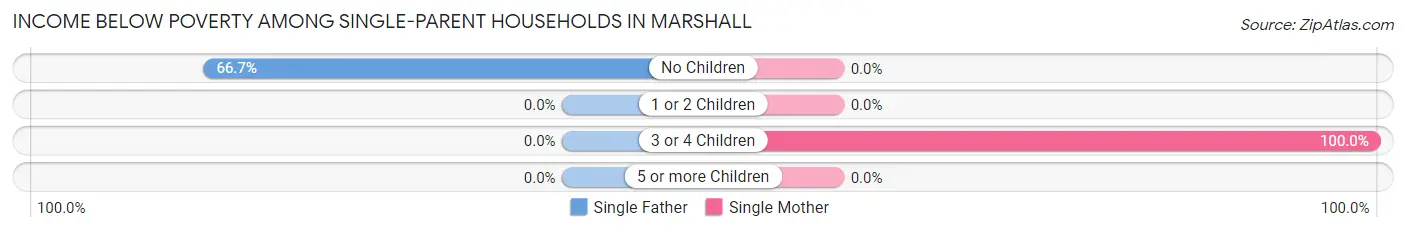
| Children | Single Father | Single Mother |
| No Children | 6 (66.7%) | 0 (0.0%) |
| 1 or 2 Children | 0 (0.0%) | 0 (0.0%) |
| 3 or 4 Children | 0 (0.0%) | 1 (100.0%) |
| 5 or more Children | 0 (0.0%) | 0 (0.0%) |
| Total | 6 (66.7%) | 1 (100.0%) |
Income Below Poverty Among Married-Couple vs Single-Parent Households in Marshall
The poverty data for Marshall shows that 11 of the married-couple family households (19.6%) and 7 of the single-parent households (70.0%) are living below the poverty level. Within the married-couple family households, those with no children have the highest poverty rate, with 9 households (34.6%) falling below the poverty line. Among the single-parent households, those with 3 or 4 children have the highest poverty rate, with 1 household (100.0%) living below poverty.
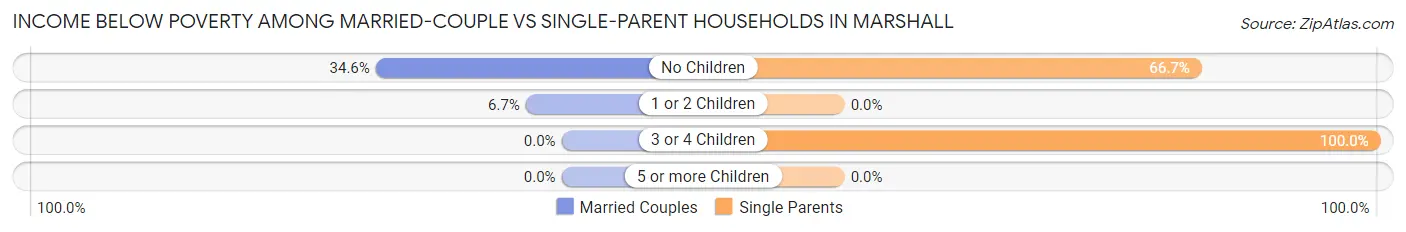
| Children | Married-Couple Families | Single-Parent Households |
| No Children | 9 (34.6%) | 6 (66.7%) |
| 1 or 2 Children | 2 (6.7%) | 0 (0.0%) |
| 3 or 4 Children | 0 (0.0%) | 1 (100.0%) |
| 5 or more Children | 0 (0.0%) | 0 (0.0%) |
| Total | 11 (19.6%) | 7 (70.0%) |
Race in Marshall
The most populous races in Marshall are White / Caucasian (300 | 89.5%), Two or more Races (33 | 9.9%), and Hispanic or Latino (20 | 6.0%).
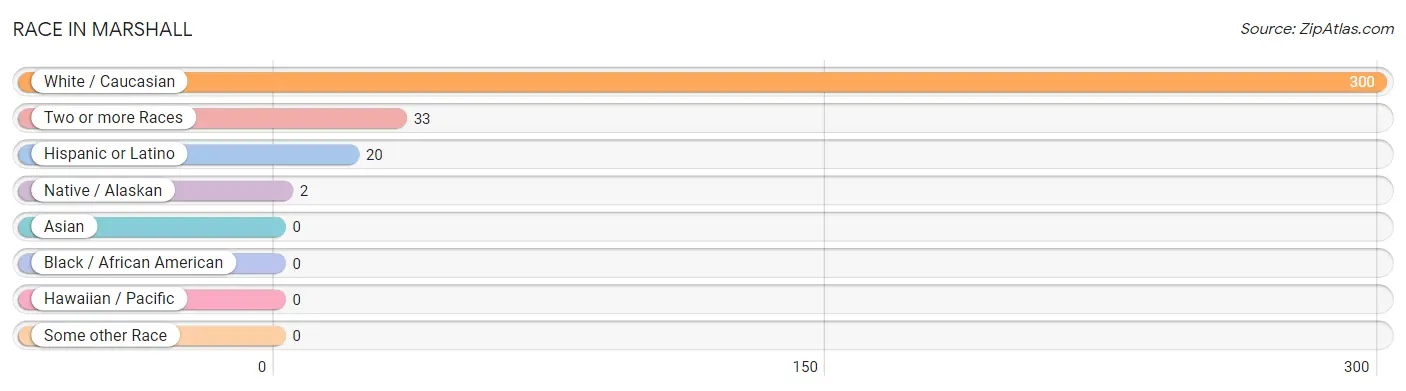
| Race | # Population | % Population |
| Asian | 0 | 0.0% |
| Black / African American | 0 | 0.0% |
| Hawaiian / Pacific | 0 | 0.0% |
| Hispanic or Latino | 20 | 6.0% |
| Native / Alaskan | 2 | 0.6% |
| White / Caucasian | 300 | 89.5% |
| Two or more Races | 33 | 9.9% |
| Some other Race | 0 | 0.0% |
| Total | 335 | 100.0% |
Ancestry in Marshall
The most populous ancestries reported in Marshall are English (113 | 33.7%), Irish (59 | 17.6%), German (37 | 11.0%), Mexican (20 | 6.0%), and American (17 | 5.1%), together accounting for 73.4% of all Marshall residents.
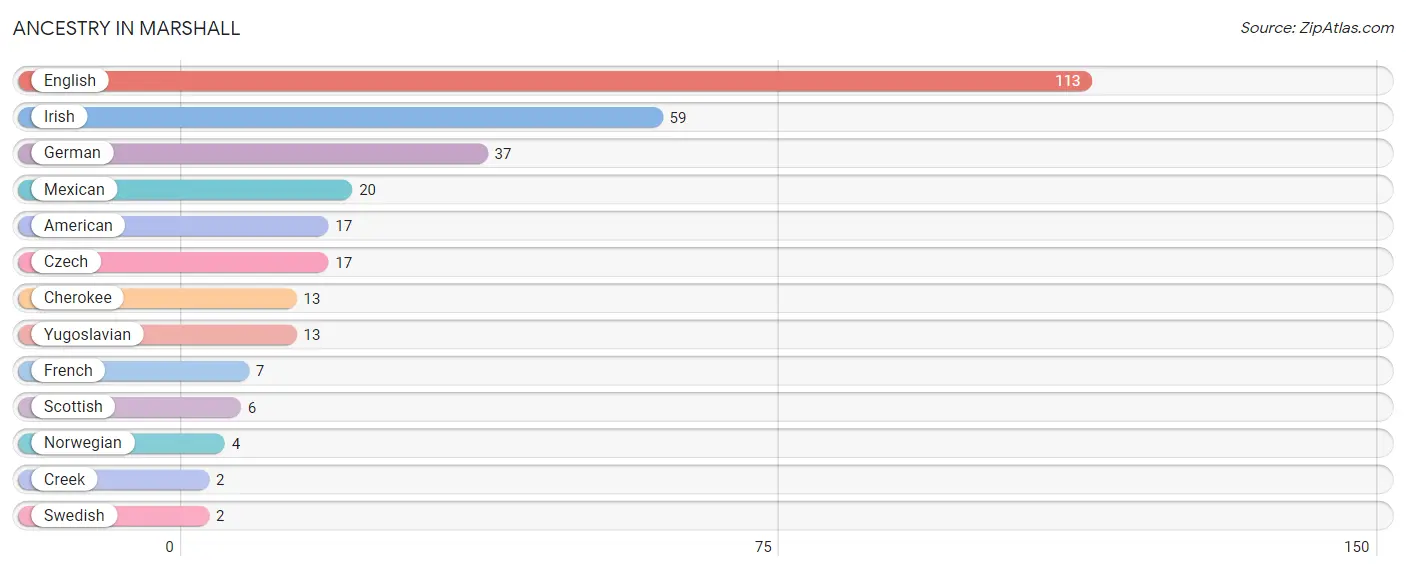
| Ancestry | # Population | % Population |
| American | 17 | 5.1% |
| Cherokee | 13 | 3.9% |
| Creek | 2 | 0.6% |
| Czech | 17 | 5.1% |
| English | 113 | 33.7% |
| French | 7 | 2.1% |
| German | 37 | 11.0% |
| Irish | 59 | 17.6% |
| Mexican | 20 | 6.0% |
| Norwegian | 4 | 1.2% |
| Scottish | 6 | 1.8% |
| Swedish | 2 | 0.6% |
| Yugoslavian | 13 | 3.9% | View All 13 Rows |
Immigrants in Marshall
The most numerous immigrant groups reported in Marshall came from Central America (6 | 1.8%), Latin America (6 | 1.8%), and Mexico (6 | 1.8%), together accounting for 5.4% of all Marshall residents.
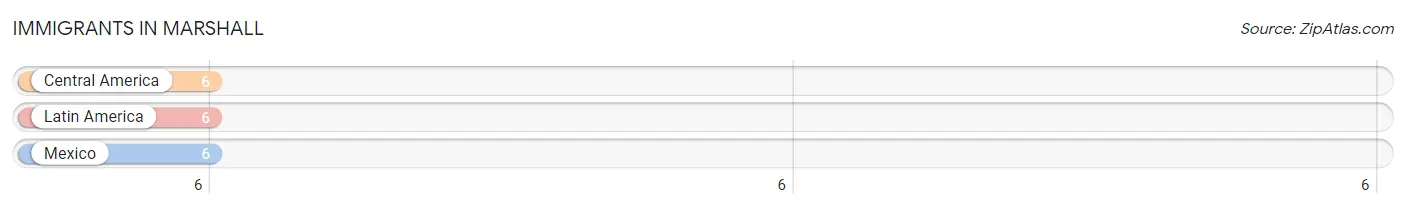
| Immigration Origin | # Population | % Population |
| Central America | 6 | 1.8% |
| Latin America | 6 | 1.8% |
| Mexico | 6 | 1.8% | View All 3 Rows |
Sex and Age in Marshall
Sex and Age in Marshall
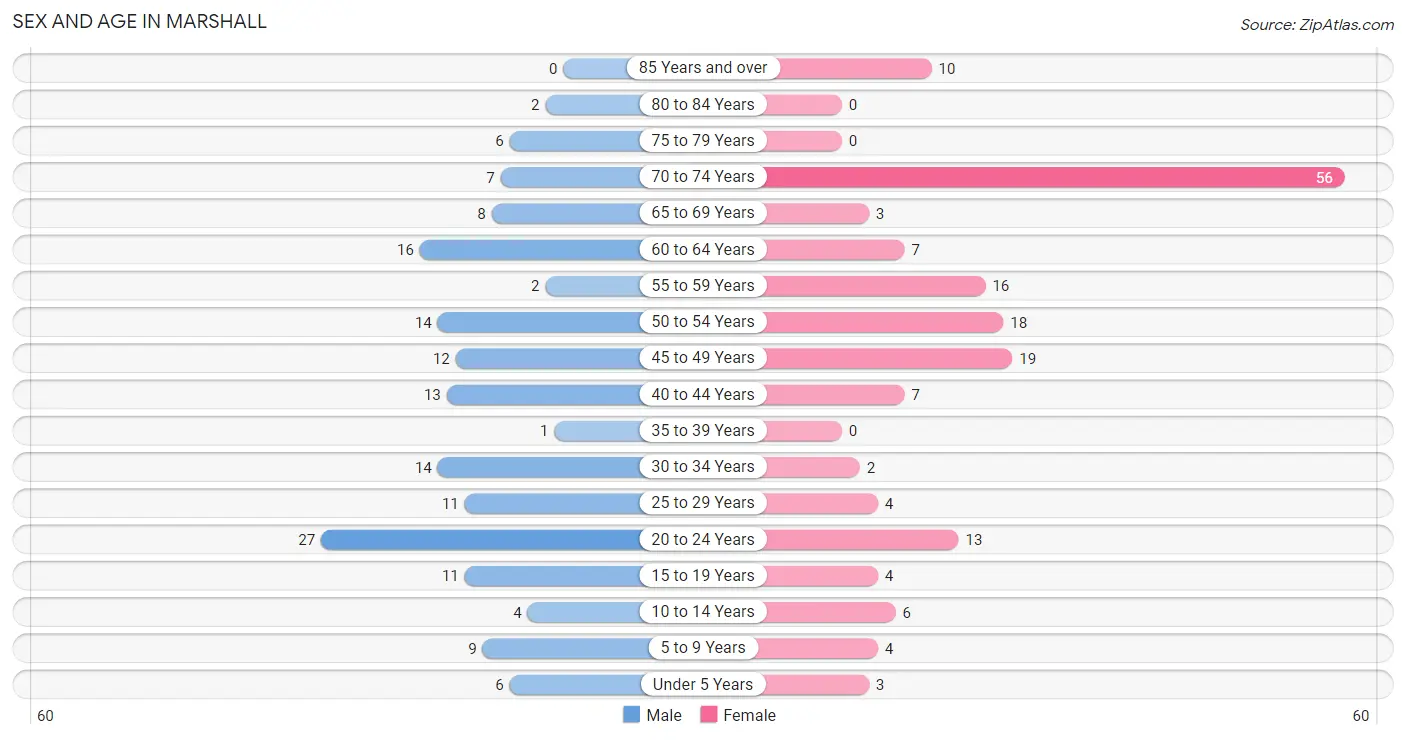
The most populous age groups in Marshall are 20 to 24 Years (27 | 16.6%) for men and 70 to 74 Years (56 | 32.6%) for women.
| Age Bracket | Male | Female |
| Under 5 Years | 6 (3.7%) | 3 (1.7%) |
| 5 to 9 Years | 9 (5.5%) | 4 (2.3%) |
| 10 to 14 Years | 4 (2.5%) | 6 (3.5%) |
| 15 to 19 Years | 11 (6.8%) | 4 (2.3%) |
| 20 to 24 Years | 27 (16.6%) | 13 (7.6%) |
| 25 to 29 Years | 11 (6.8%) | 4 (2.3%) |
| 30 to 34 Years | 14 (8.6%) | 2 (1.2%) |
| 35 to 39 Years | 1 (0.6%) | 0 (0.0%) |
| 40 to 44 Years | 13 (8.0%) | 7 (4.1%) |
| 45 to 49 Years | 12 (7.4%) | 19 (11.1%) |
| 50 to 54 Years | 14 (8.6%) | 18 (10.5%) |
| 55 to 59 Years | 2 (1.2%) | 16 (9.3%) |
| 60 to 64 Years | 16 (9.8%) | 7 (4.1%) |
| 65 to 69 Years | 8 (4.9%) | 3 (1.7%) |
| 70 to 74 Years | 7 (4.3%) | 56 (32.6%) |
| 75 to 79 Years | 6 (3.7%) | 0 (0.0%) |
| 80 to 84 Years | 2 (1.2%) | 0 (0.0%) |
| 85 Years and over | 0 (0.0%) | 10 (5.8%) |
| Total | 163 (100.0%) | 172 (100.0%) |
Families and Households in Marshall
Median Family Size in Marshall
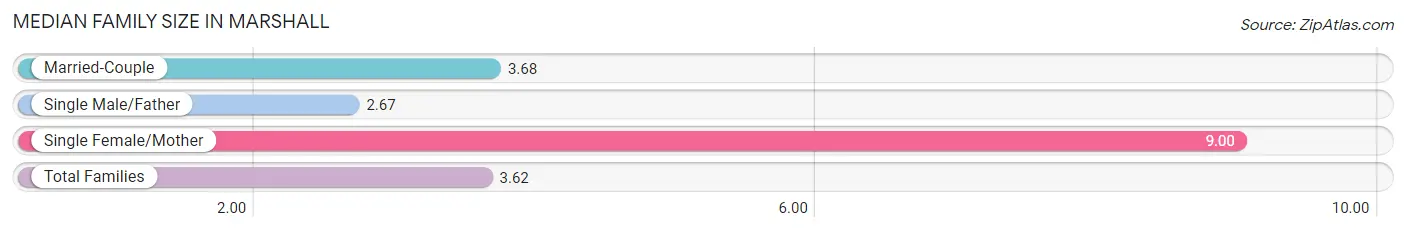
The median family size in Marshall is 3.62 persons per family, with single female/mother families (1 | 1.5%) accounting for the largest median family size of 9 persons per family. On the other hand, single male/father families (9 | 13.6%) represent the smallest median family size with 2.67 persons per family.
| Family Type | # Families | Family Size |
| Married-Couple | 56 (84.9%) | 3.68 |
| Single Male/Father | 9 (13.6%) | 2.67 |
| Single Female/Mother | 1 (1.5%) | 9.00 |
| Total Families | 66 (100.0%) | 3.62 |
Median Household Size in Marshall
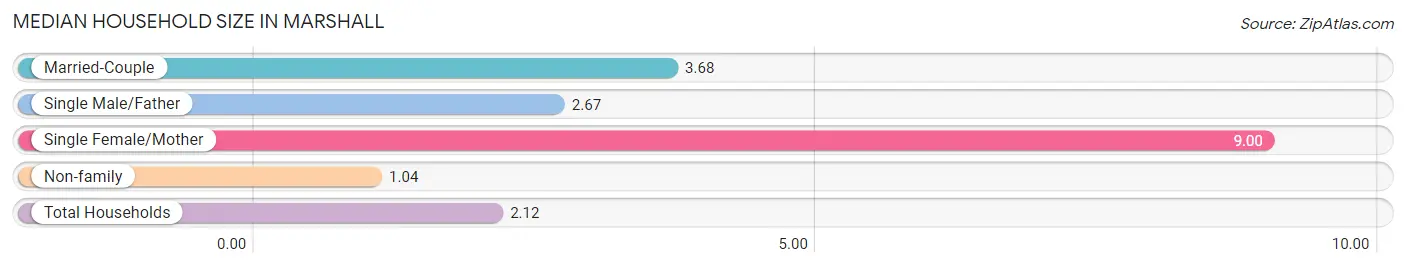
The median household size in Marshall is 2.12 persons per household, with single female/mother households (1 | 0.6%) accounting for the largest median household size of 9 persons per household. non-family households (92 | 58.2%) represent the smallest median household size with 1.04 persons per household.
| Household Type | # Households | Household Size |
| Married-Couple | 56 (35.4%) | 3.68 |
| Single Male/Father | 9 (5.7%) | 2.67 |
| Single Female/Mother | 1 (0.6%) | 9.00 |
| Non-family | 92 (58.2%) | 1.04 |
| Total Households | 158 (100.0%) | 2.12 |
Household Size by Marriage Status in Marshall
Out of a total of 158 households in Marshall, 66 (41.8%) are family households, while 92 (58.2%) are nonfamily households. The most numerous type of family households are 2-person households, comprising 24, and the most common type of nonfamily households are 1-person households, comprising 86.
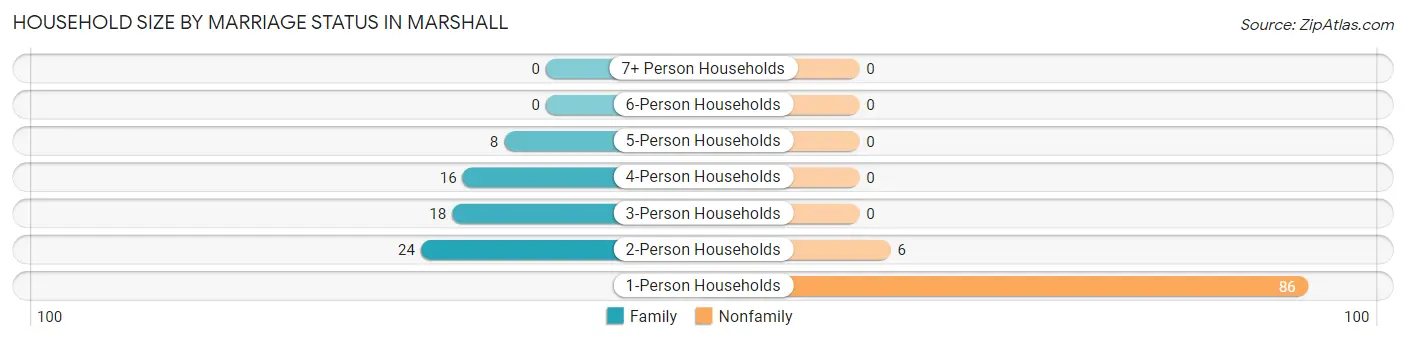
| Household Size | Family Households | Nonfamily Households |
| 1-Person Households | - | 86 (54.4%) |
| 2-Person Households | 24 (15.2%) | 6 (3.8%) |
| 3-Person Households | 18 (11.4%) | 0 (0.0%) |
| 4-Person Households | 16 (10.1%) | 0 (0.0%) |
| 5-Person Households | 8 (5.1%) | 0 (0.0%) |
| 6-Person Households | 0 (0.0%) | 0 (0.0%) |
| 7+ Person Households | 0 (0.0%) | 0 (0.0%) |
| Total | 66 (41.8%) | 92 (58.2%) |
Female Fertility in Marshall
Fertility by Age in Marshall
Average fertility rate in Marshall is 38.0 births per 1,000 women. Women in the age bracket of 20 to 34 years have the highest fertility rate with 105.0 births per 1,000 women. Women in the age bracket of 20 to 34 years acount for 100.0% of all women with births.
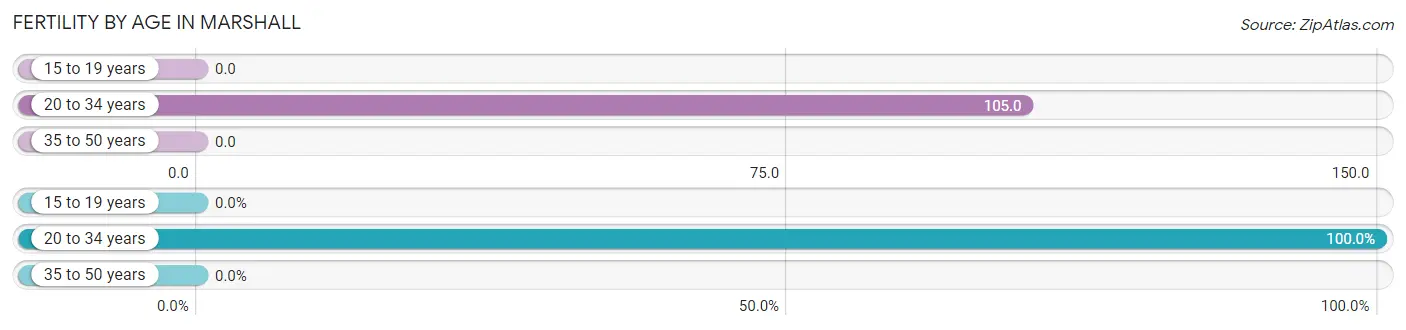
| Age Bracket | Women with Births | Births / 1,000 Women |
| 15 to 19 years | 0 (0.0%) | 0.0 |
| 20 to 34 years | 2 (100.0%) | 105.0 |
| 35 to 50 years | 0 (0.0%) | 0.0 |
| Total | 2 (100.0%) | 38.0 |
Fertility by Age by Marriage Status in Marshall
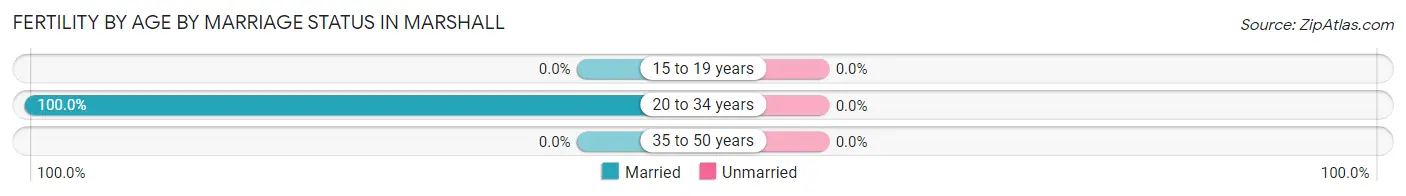
| Age Bracket | Married | Unmarried |
| 15 to 19 years | 0 (0.0%) | 0 (0.0%) |
| 20 to 34 years | 2 (100.0%) | 0 (0.0%) |
| 35 to 50 years | 0 (0.0%) | 0 (0.0%) |
| Total | 2 (100.0%) | 0 (0.0%) |
Fertility by Education in Marshall
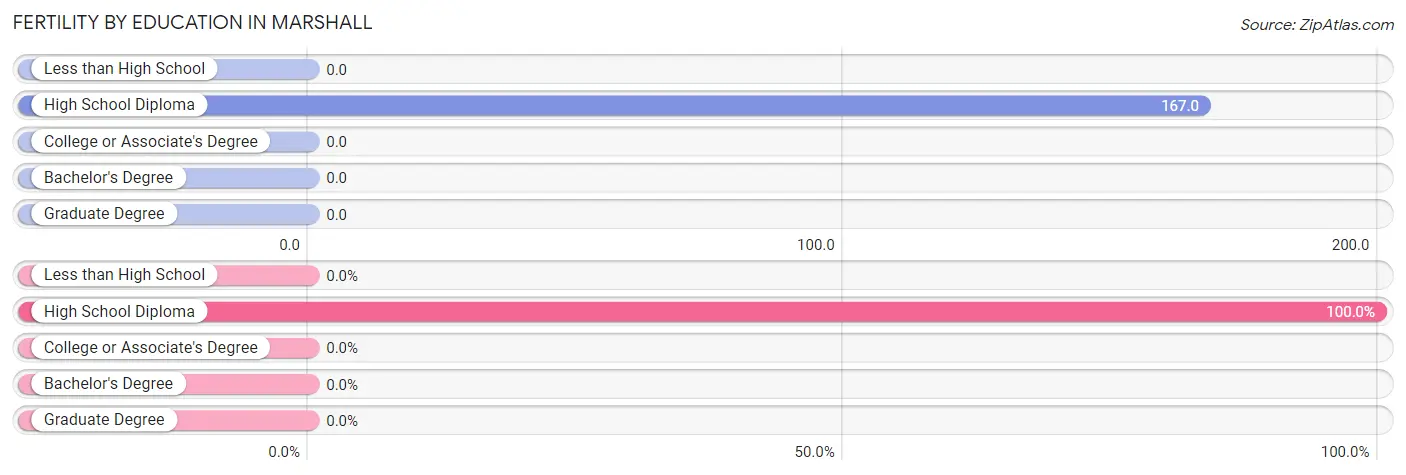
| Educational Attainment | Women with Births | Births / 1,000 Women |
| Less than High School | 0 (0.0%) | 0.0 |
| High School Diploma | 2 (100.0%) | 167.0 |
| College or Associate's Degree | 0 (0.0%) | 0.0 |
| Bachelor's Degree | 0 (0.0%) | 0.0 |
| Graduate Degree | 0 (0.0%) | 0.0 |
| Total | 2 (100.0%) | 38.0 |
Fertility by Education by Marriage Status in Marshall
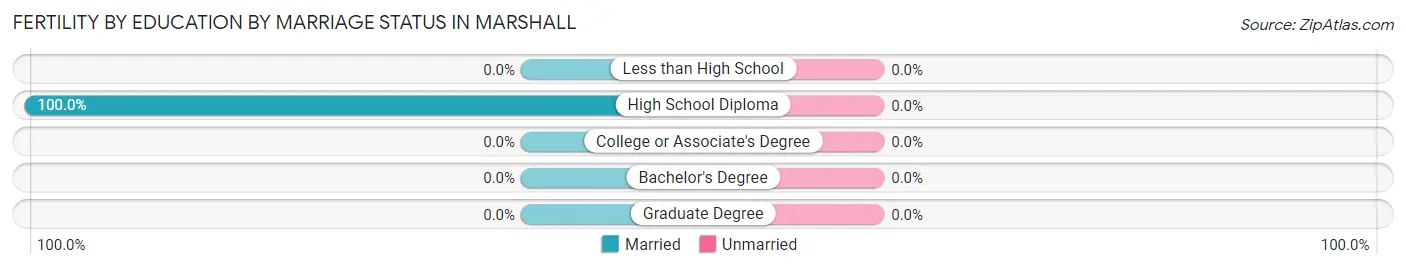
| Educational Attainment | Married | Unmarried |
| Less than High School | 0 (0.0%) | 0 (0.0%) |
| High School Diploma | 2 (100.0%) | 0 (0.0%) |
| College or Associate's Degree | 0 (0.0%) | 0 (0.0%) |
| Bachelor's Degree | 0 (0.0%) | 0 (0.0%) |
| Graduate Degree | 0 (0.0%) | 0 (0.0%) |
| Total | 2 (100.0%) | 0 (0.0%) |
Employment Characteristics in Marshall
Employment by Class of Employer in Marshall
Among the 202 employed individuals in Marshall, private company employees (173 | 85.6%), federal government employees (11 | 5.4%), and state government employees (6 | 3.0%) make up the most common classes of employment.
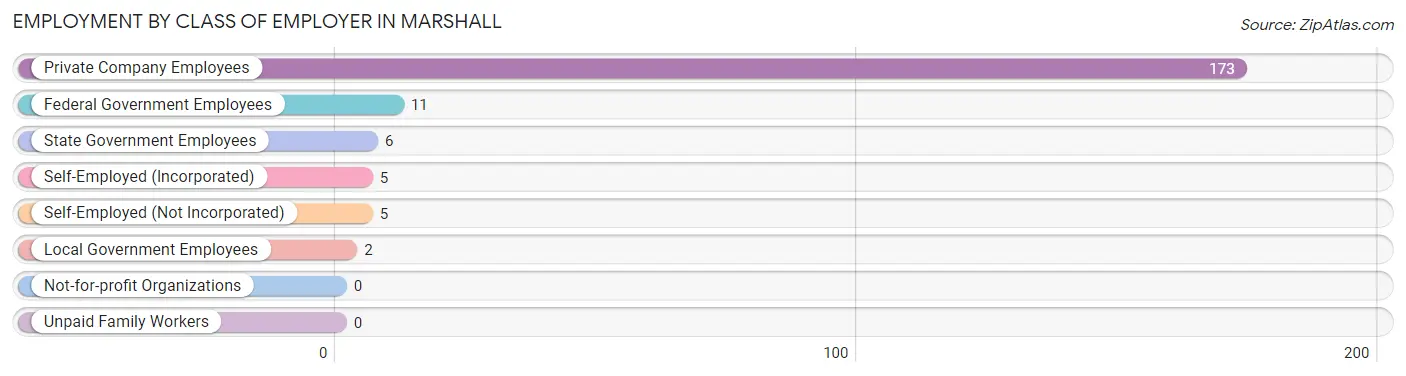
| Employer Class | # Employees | % Employees |
| Private Company Employees | 173 | 85.6% |
| Self-Employed (Incorporated) | 5 | 2.5% |
| Self-Employed (Not Incorporated) | 5 | 2.5% |
| Not-for-profit Organizations | 0 | 0.0% |
| Local Government Employees | 2 | 1.0% |
| State Government Employees | 6 | 3.0% |
| Federal Government Employees | 11 | 5.4% |
| Unpaid Family Workers | 0 | 0.0% |
| Total | 202 | 100.0% |
Employment Status by Age in Marshall
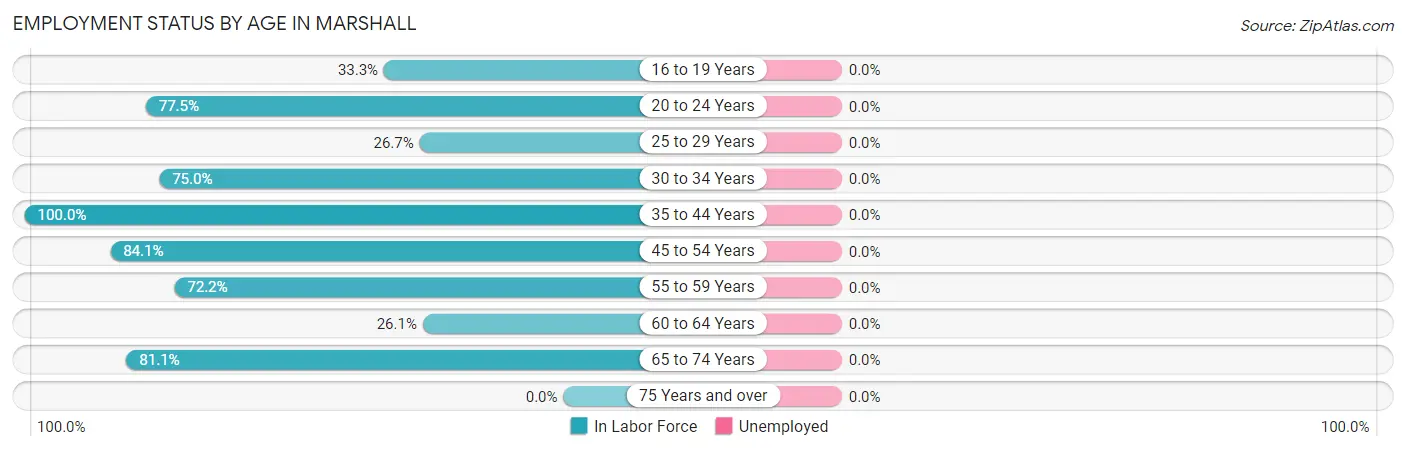
| Age Bracket | In Labor Force | Unemployed |
| 16 to 19 Years | 2 (33.3%) | 0 (0.0%) |
| 20 to 24 Years | 31 (77.5%) | 0 (0.0%) |
| 25 to 29 Years | 4 (26.7%) | 0 (0.0%) |
| 30 to 34 Years | 12 (75.0%) | 0 (0.0%) |
| 35 to 44 Years | 21 (100.0%) | 0 (0.0%) |
| 45 to 54 Years | 53 (84.1%) | 0 (0.0%) |
| 55 to 59 Years | 13 (72.2%) | 0 (0.0%) |
| 60 to 64 Years | 6 (26.1%) | 0 (0.0%) |
| 65 to 74 Years | 60 (81.1%) | 0 (0.0%) |
| 75 Years and over | 0 (0.0%) | 0 (0.0%) |
| Total | 202 (68.7%) | 0 (0.0%) |
Employment Status by Educational Attainment in Marshall
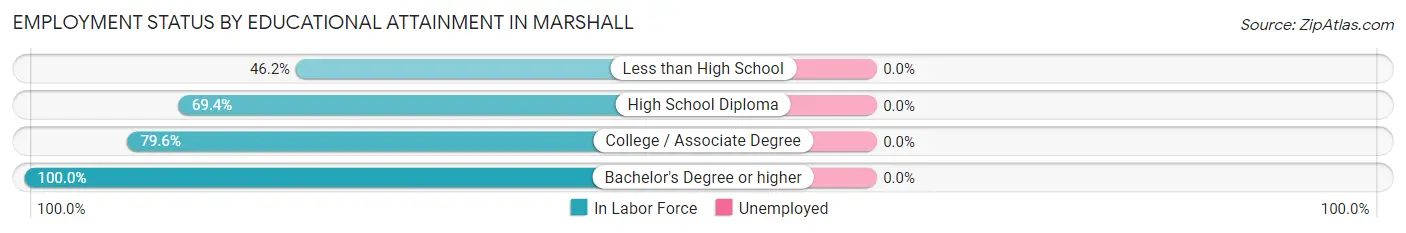
| Educational Attainment | In Labor Force | Unemployed |
| Less than High School | 12 (46.2%) | 0 (0.0%) |
| High School Diploma | 50 (69.4%) | 0 (0.0%) |
| College / Associate Degree | 43 (79.6%) | 0 (0.0%) |
| Bachelor's Degree or higher | 4 (100.0%) | 0 (0.0%) |
| Total | 109 (69.9%) | 0 (0.0%) |
Employment Occupations by Sex in Marshall
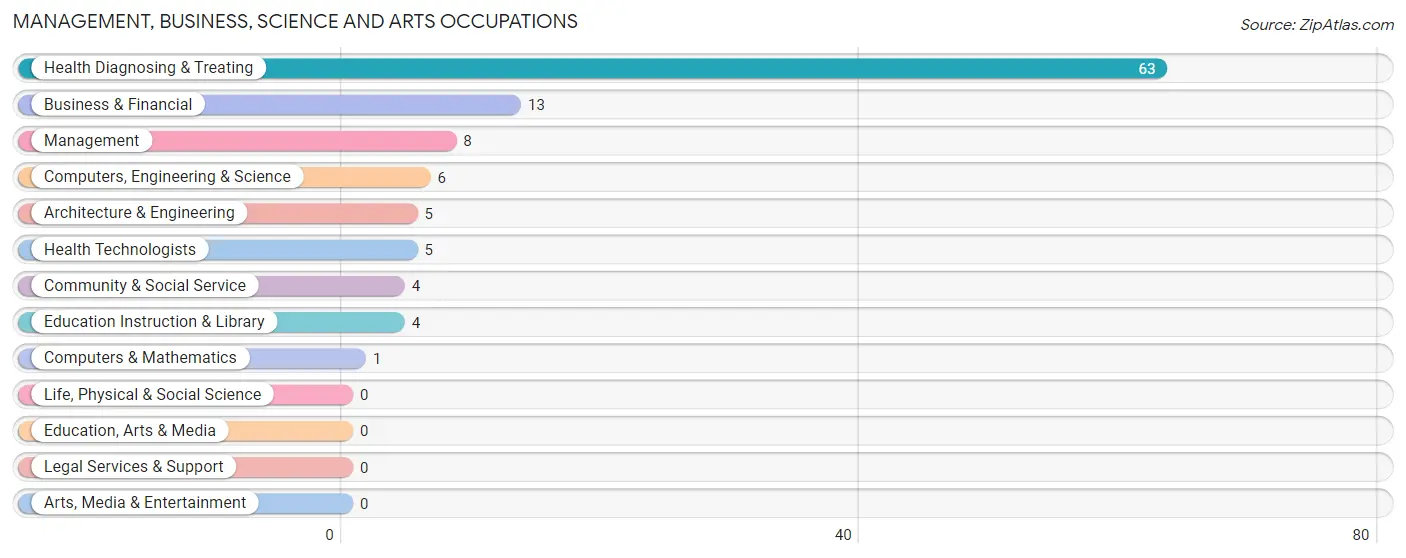
Management, Business, Science and Arts Occupations
The most common Management, Business, Science and Arts occupations in Marshall are Health Diagnosing & Treating (63 | 31.2%), Business & Financial (13 | 6.4%), Management (8 | 4.0%), Computers, Engineering & Science (6 | 3.0%), and Architecture & Engineering (5 | 2.5%).
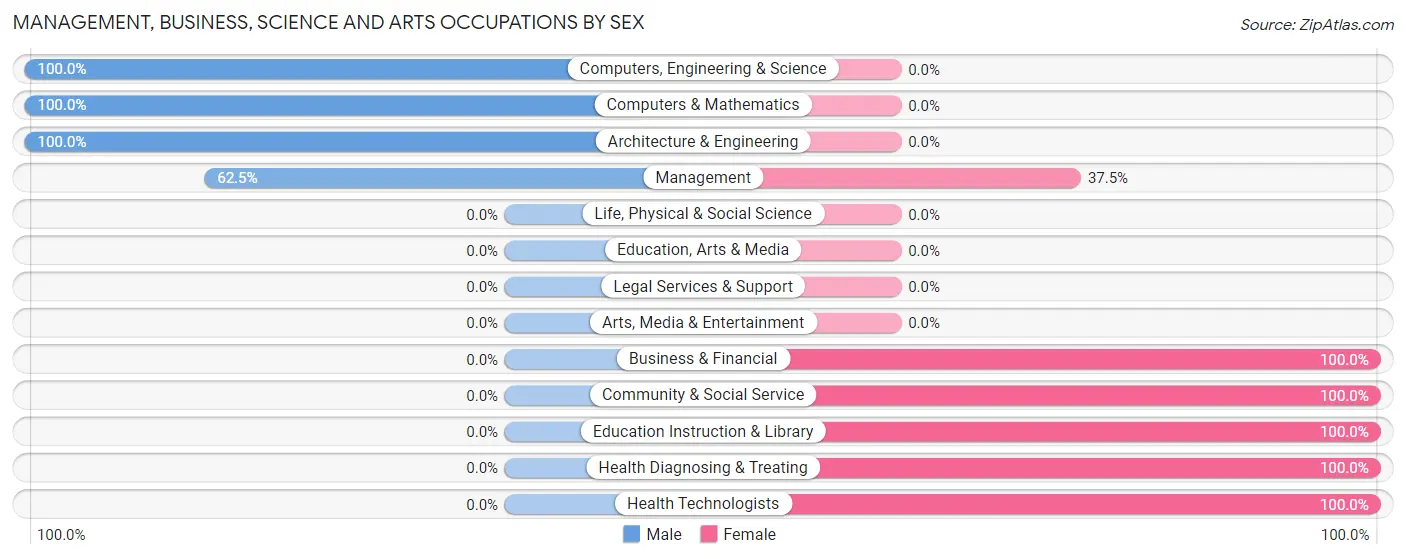
Management, Business, Science and Arts Occupations by Sex
Within the Management, Business, Science and Arts occupations in Marshall, the most male-oriented occupations are Computers, Engineering & Science (100.0%), Computers & Mathematics (100.0%), and Architecture & Engineering (100.0%), while the most female-oriented occupations are Business & Financial (100.0%), Community & Social Service (100.0%), and Education Instruction & Library (100.0%).
| Occupation | Male | Female |
| Management | 5 (62.5%) | 3 (37.5%) |
| Business & Financial | 0 (0.0%) | 13 (100.0%) |
| Computers, Engineering & Science | 6 (100.0%) | 0 (0.0%) |
| Computers & Mathematics | 1 (100.0%) | 0 (0.0%) |
| Architecture & Engineering | 5 (100.0%) | 0 (0.0%) |
| Life, Physical & Social Science | 0 (0.0%) | 0 (0.0%) |
| Community & Social Service | 0 (0.0%) | 4 (100.0%) |
| Education, Arts & Media | 0 (0.0%) | 0 (0.0%) |
| Legal Services & Support | 0 (0.0%) | 0 (0.0%) |
| Education Instruction & Library | 0 (0.0%) | 4 (100.0%) |
| Arts, Media & Entertainment | 0 (0.0%) | 0 (0.0%) |
| Health Diagnosing & Treating | 0 (0.0%) | 63 (100.0%) |
| Health Technologists | 0 (0.0%) | 5 (100.0%) |
| Total (Category) | 11 (11.7%) | 83 (88.3%) |
| Total (Overall) | 80 (39.6%) | 122 (60.4%) |
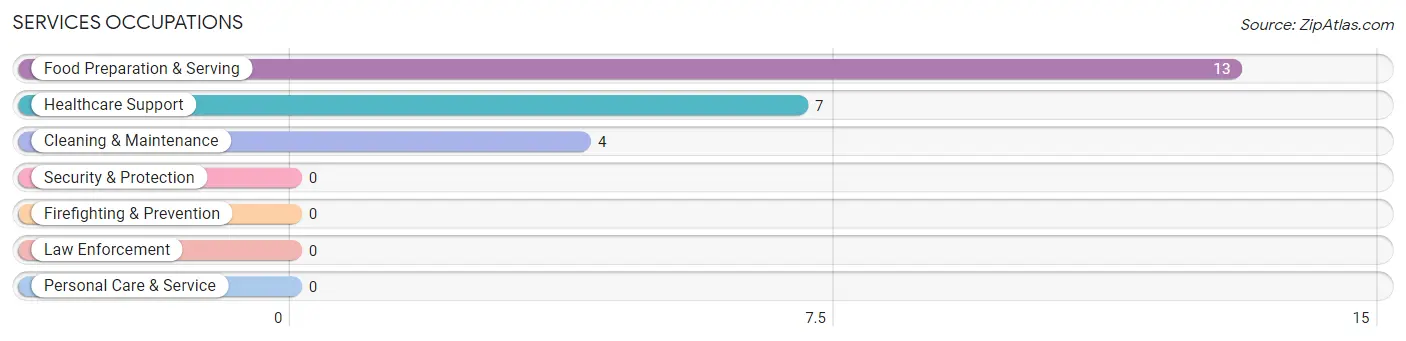
Services Occupations
The most common Services occupations in Marshall are Food Preparation & Serving (13 | 6.4%), Healthcare Support (7 | 3.5%), and Cleaning & Maintenance (4 | 2.0%).
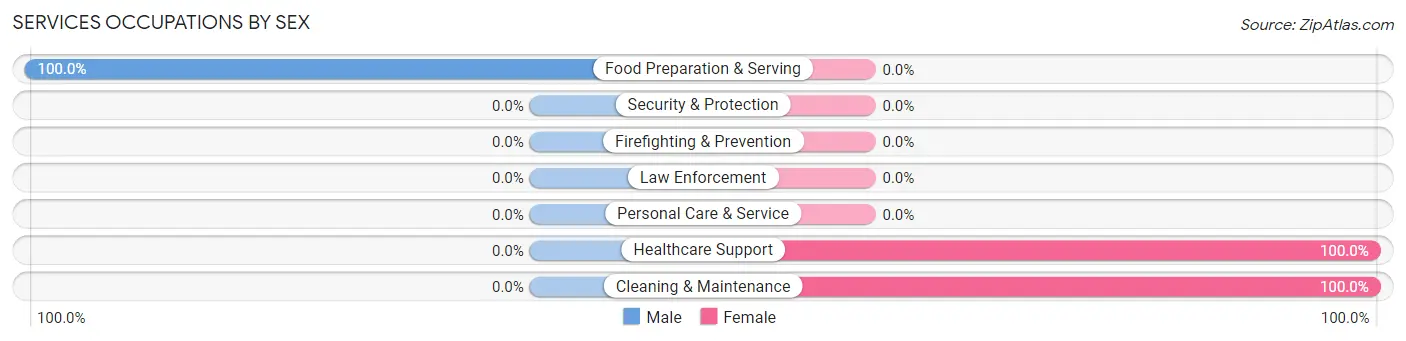
Services Occupations by Sex
| Occupation | Male | Female |
| Healthcare Support | 0 (0.0%) | 7 (100.0%) |
| Security & Protection | 0 (0.0%) | 0 (0.0%) |
| Firefighting & Prevention | 0 (0.0%) | 0 (0.0%) |
| Law Enforcement | 0 (0.0%) | 0 (0.0%) |
| Food Preparation & Serving | 13 (100.0%) | 0 (0.0%) |
| Cleaning & Maintenance | 0 (0.0%) | 4 (100.0%) |
| Personal Care & Service | 0 (0.0%) | 0 (0.0%) |
| Total (Category) | 13 (54.2%) | 11 (45.8%) |
| Total (Overall) | 80 (39.6%) | 122 (60.4%) |
Sales and Office Occupations
The most common Sales and Office occupations in Marshall are Sales & Related (26 | 12.9%), and Office & Administration (6 | 3.0%).
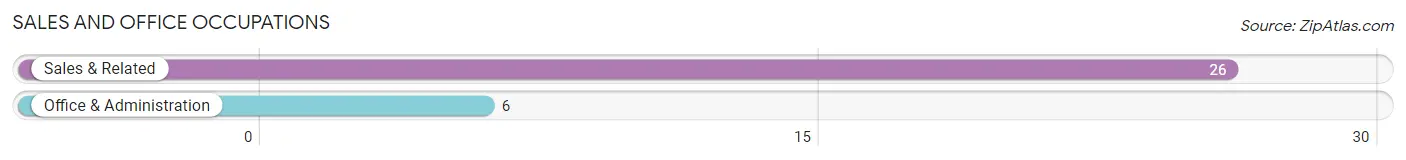
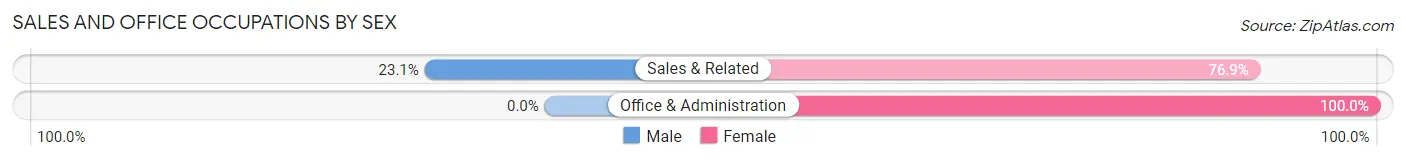
Sales and Office Occupations by Sex
| Occupation | Male | Female |
| Sales & Related | 6 (23.1%) | 20 (76.9%) |
| Office & Administration | 0 (0.0%) | 6 (100.0%) |
| Total (Category) | 6 (18.8%) | 26 (81.2%) |
| Total (Overall) | 80 (39.6%) | 122 (60.4%) |
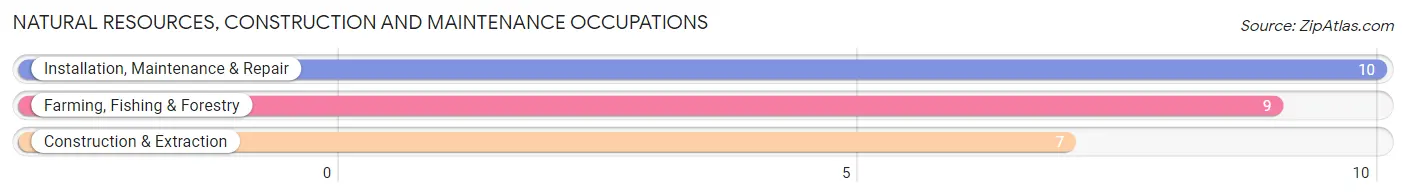
Natural Resources, Construction and Maintenance Occupations
The most common Natural Resources, Construction and Maintenance occupations in Marshall are Installation, Maintenance & Repair (10 | 5.0%), Farming, Fishing & Forestry (9 | 4.5%), and Construction & Extraction (7 | 3.5%).
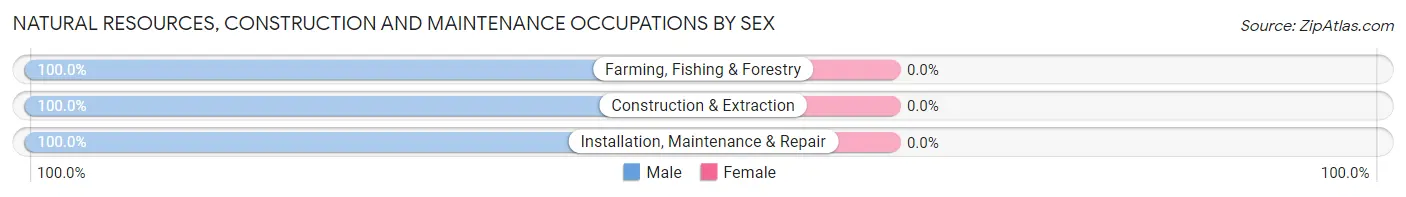
Natural Resources, Construction and Maintenance Occupations by Sex
| Occupation | Male | Female |
| Farming, Fishing & Forestry | 9 (100.0%) | 0 (0.0%) |
| Construction & Extraction | 7 (100.0%) | 0 (0.0%) |
| Installation, Maintenance & Repair | 10 (100.0%) | 0 (0.0%) |
| Total (Category) | 26 (100.0%) | 0 (0.0%) |
| Total (Overall) | 80 (39.6%) | 122 (60.4%) |
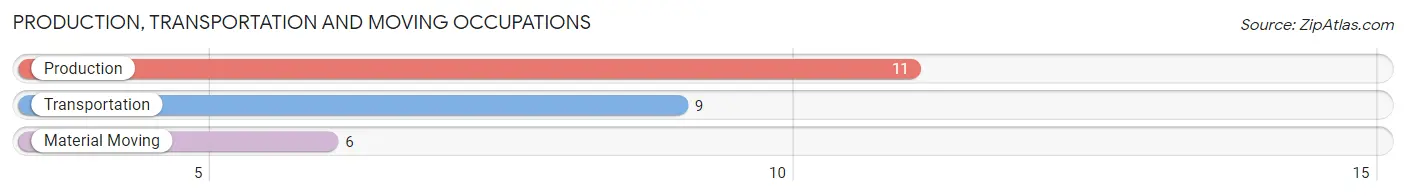
Production, Transportation and Moving Occupations
The most common Production, Transportation and Moving occupations in Marshall are Production (11 | 5.4%), Transportation (9 | 4.5%), and Material Moving (6 | 3.0%).
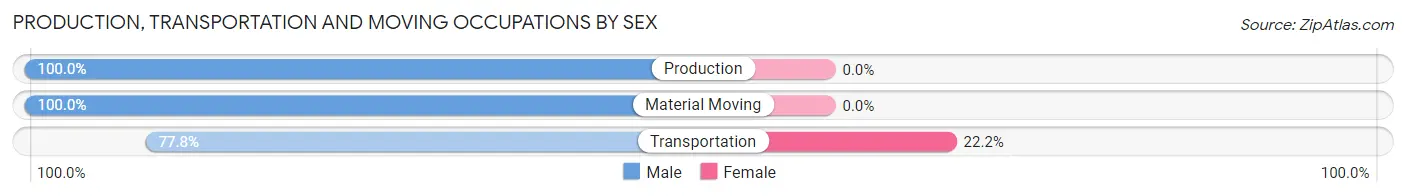
Production, Transportation and Moving Occupations by Sex
| Occupation | Male | Female |
| Production | 11 (100.0%) | 0 (0.0%) |
| Transportation | 7 (77.8%) | 2 (22.2%) |
| Material Moving | 6 (100.0%) | 0 (0.0%) |
| Total (Category) | 24 (92.3%) | 2 (7.7%) |
| Total (Overall) | 80 (39.6%) | 122 (60.4%) |
Employment Industries by Sex in Marshall
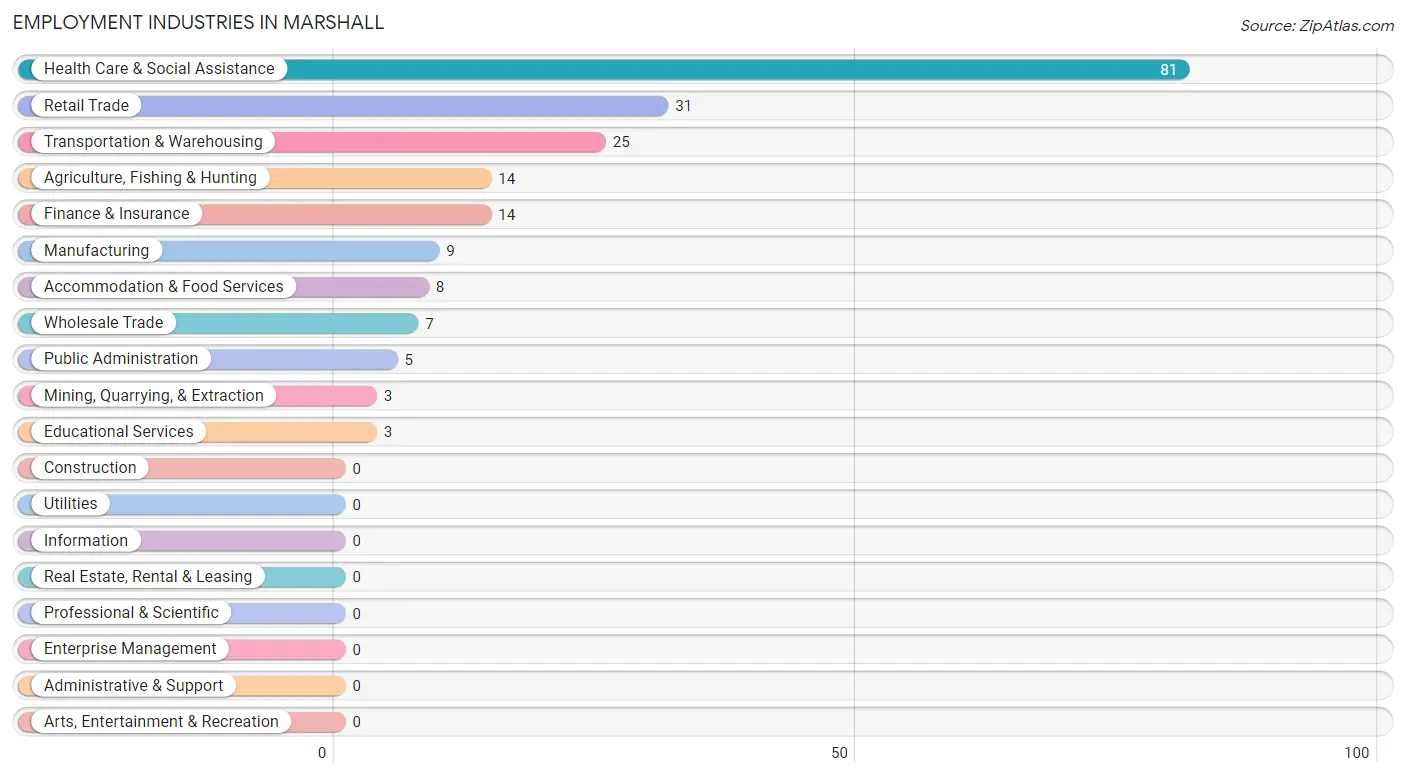
Employment Industries in Marshall
The major employment industries in Marshall include Health Care & Social Assistance (81 | 40.1%), Retail Trade (31 | 15.3%), Transportation & Warehousing (25 | 12.4%), Agriculture, Fishing & Hunting (14 | 6.9%), and Finance & Insurance (14 | 6.9%).
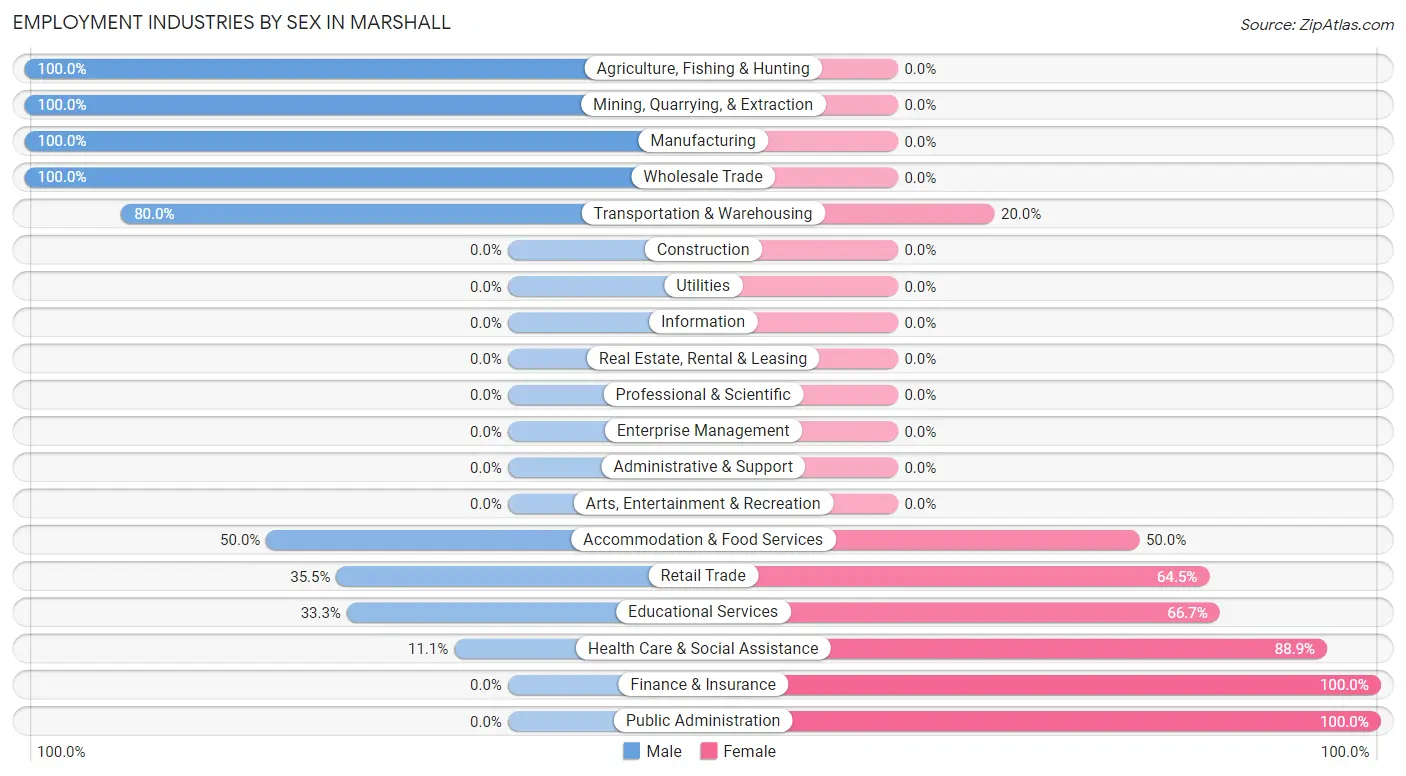
Employment Industries by Sex in Marshall
The Marshall industries that see more men than women are Agriculture, Fishing & Hunting (100.0%), Mining, Quarrying, & Extraction (100.0%), and Manufacturing (100.0%), whereas the industries that tend to have a higher number of women are Finance & Insurance (100.0%), Public Administration (100.0%), and Health Care & Social Assistance (88.9%).
| Industry | Male | Female |
| Agriculture, Fishing & Hunting | 14 (100.0%) | 0 (0.0%) |
| Mining, Quarrying, & Extraction | 3 (100.0%) | 0 (0.0%) |
| Construction | 0 (0.0%) | 0 (0.0%) |
| Manufacturing | 9 (100.0%) | 0 (0.0%) |
| Wholesale Trade | 7 (100.0%) | 0 (0.0%) |
| Retail Trade | 11 (35.5%) | 20 (64.5%) |
| Transportation & Warehousing | 20 (80.0%) | 5 (20.0%) |
| Utilities | 0 (0.0%) | 0 (0.0%) |
| Information | 0 (0.0%) | 0 (0.0%) |
| Finance & Insurance | 0 (0.0%) | 14 (100.0%) |
| Real Estate, Rental & Leasing | 0 (0.0%) | 0 (0.0%) |
| Professional & Scientific | 0 (0.0%) | 0 (0.0%) |
| Enterprise Management | 0 (0.0%) | 0 (0.0%) |
| Administrative & Support | 0 (0.0%) | 0 (0.0%) |
| Educational Services | 1 (33.3%) | 2 (66.7%) |
| Health Care & Social Assistance | 9 (11.1%) | 72 (88.9%) |
| Arts, Entertainment & Recreation | 0 (0.0%) | 0 (0.0%) |
| Accommodation & Food Services | 4 (50.0%) | 4 (50.0%) |
| Public Administration | 0 (0.0%) | 5 (100.0%) |
| Total | 80 (39.6%) | 122 (60.4%) |
Education in Marshall
School Enrollment in Marshall
The most common levels of schooling among the 68 students in Marshall are college / undergraduate (30 | 44.1%), high school (19 | 27.9%), and elementary school (13 | 19.1%).
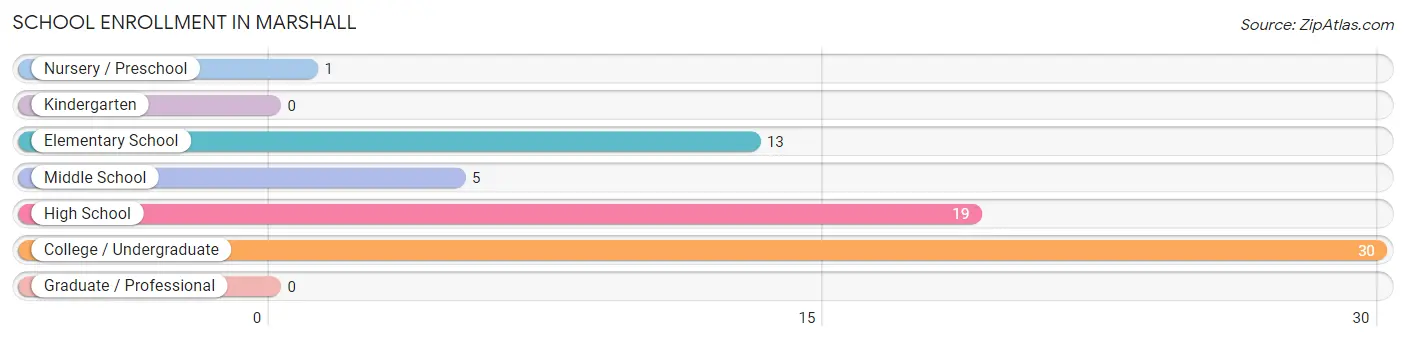
| School Level | # Students | % Students |
| Nursery / Preschool | 1 | 1.5% |
| Kindergarten | 0 | 0.0% |
| Elementary School | 13 | 19.1% |
| Middle School | 5 | 7.3% |
| High School | 19 | 27.9% |
| College / Undergraduate | 30 | 44.1% |
| Graduate / Professional | 0 | 0.0% |
| Total | 68 | 100.0% |
School Enrollment by Age by Funding Source in Marshall
Out of a total of 68 students who are enrolled in schools in Marshall, 1 (1.5%) attend a private institution, while the remaining 67 (98.5%) are enrolled in public schools. The age group of 3 to 4 year olds has the highest likelihood of being enrolled in private schools, with 1 (100.0% in the age bracket) enrolled. Conversely, the age group of 5 to 9 year old has the lowest likelihood of being enrolled in a private school, with 13 (100.0% in the age bracket) attending a public institution.
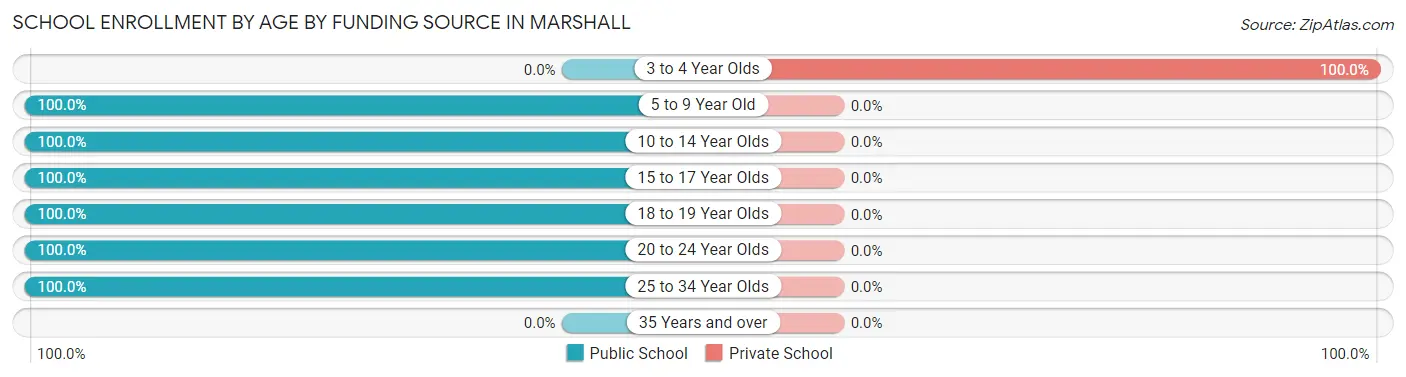
| Age Bracket | Public School | Private School |
| 3 to 4 Year Olds | 0 (0.0%) | 1 (100.0%) |
| 5 to 9 Year Old | 13 (100.0%) | 0 (0.0%) |
| 10 to 14 Year Olds | 10 (100.0%) | 0 (0.0%) |
| 15 to 17 Year Olds | 14 (100.0%) | 0 (0.0%) |
| 18 to 19 Year Olds | 1 (100.0%) | 0 (0.0%) |
| 20 to 24 Year Olds | 16 (100.0%) | 0 (0.0%) |
| 25 to 34 Year Olds | 13 (100.0%) | 0 (0.0%) |
| 35 Years and over | 0 (0.0%) | 0 (0.0%) |
| Total | 67 (98.5%) | 1 (1.5%) |
Educational Attainment by Field of Study in Marshall
, and science & technology (4 | 100.0%) are the most common fields of study among 4 individuals in Marshall who have obtained a bachelor's degree or higher.
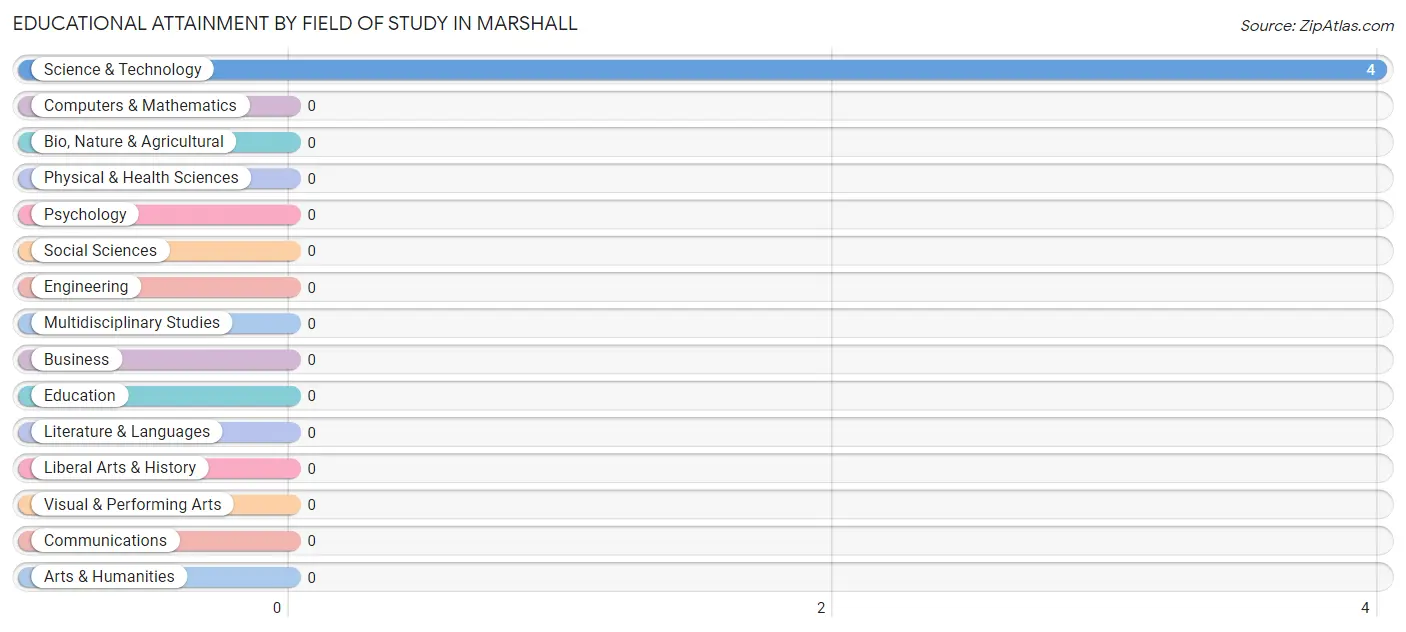
| Field of Study | # Graduates | % Graduates |
| Computers & Mathematics | 0 | 0.0% |
| Bio, Nature & Agricultural | 0 | 0.0% |
| Physical & Health Sciences | 0 | 0.0% |
| Psychology | 0 | 0.0% |
| Social Sciences | 0 | 0.0% |
| Engineering | 0 | 0.0% |
| Multidisciplinary Studies | 0 | 0.0% |
| Science & Technology | 4 | 100.0% |
| Business | 0 | 0.0% |
| Education | 0 | 0.0% |
| Literature & Languages | 0 | 0.0% |
| Liberal Arts & History | 0 | 0.0% |
| Visual & Performing Arts | 0 | 0.0% |
| Communications | 0 | 0.0% |
| Arts & Humanities | 0 | 0.0% |
| Total | 4 | 100.0% |
Transportation & Commute in Marshall
Vehicle Availability by Sex in Marshall
The most prevalent vehicle ownership categories in Marshall are males with 3 vehicles (32, accounting for 40.0%) and females with 3 vehicles (21, making up 26.2%).
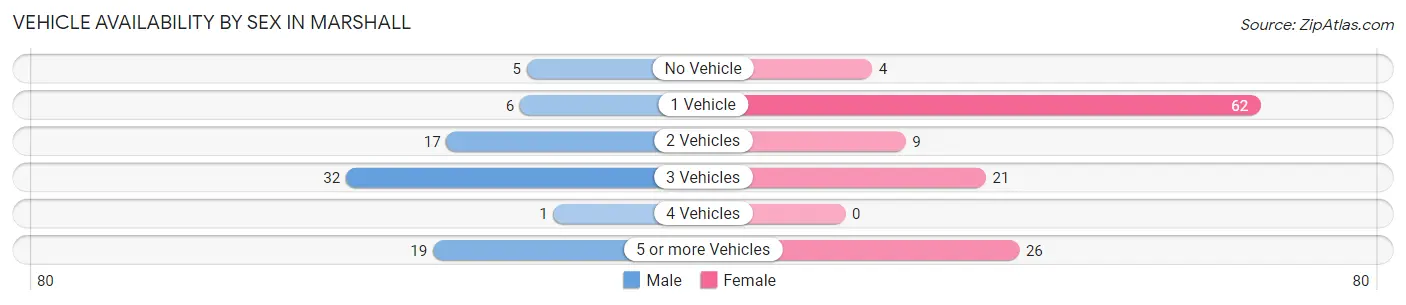
| Vehicles Available | Male | Female |
| No Vehicle | 5 (6.2%) | 4 (3.3%) |
| 1 Vehicle | 6 (7.5%) | 62 (50.8%) |
| 2 Vehicles | 17 (21.2%) | 9 (7.4%) |
| 3 Vehicles | 32 (40.0%) | 21 (17.2%) |
| 4 Vehicles | 1 (1.3%) | 0 (0.0%) |
| 5 or more Vehicles | 19 (23.7%) | 26 (21.3%) |
| Total | 80 (100.0%) | 122 (100.0%) |
Commute Time in Marshall
The most frequently occuring commute durations in Marshall are 40 to 44 minutes (57 commuters, 28.5%), 45 to 59 minutes (28 commuters, 14.0%), and 60 to 89 minutes (25 commuters, 12.5%).
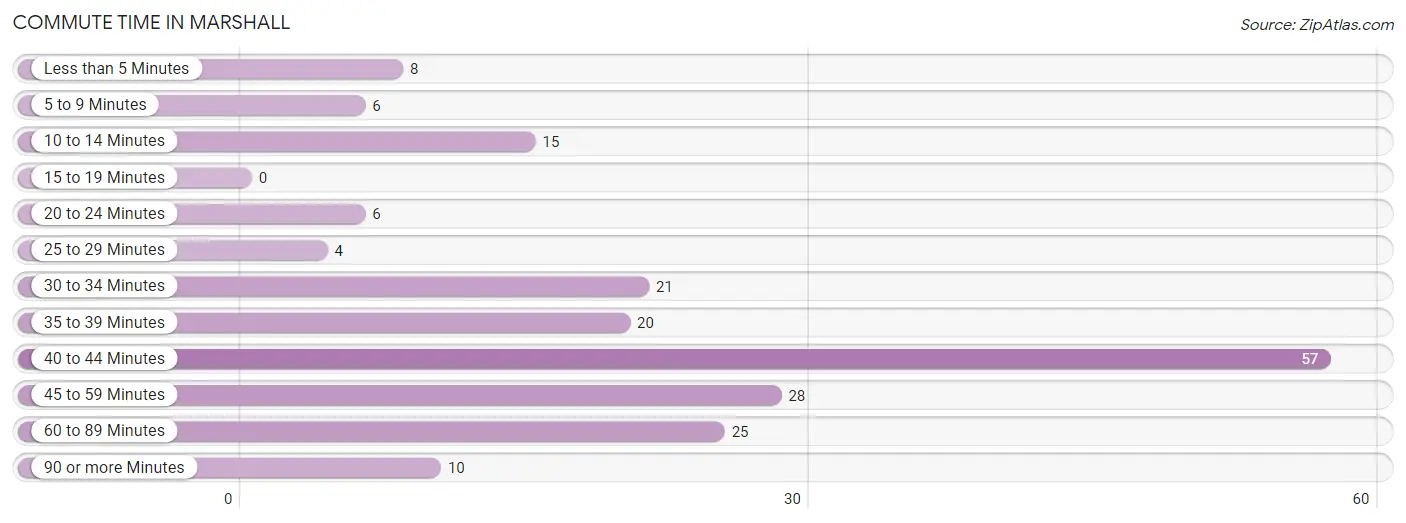
| Commute Time | # Commuters | % Commuters |
| Less than 5 Minutes | 8 | 4.0% |
| 5 to 9 Minutes | 6 | 3.0% |
| 10 to 14 Minutes | 15 | 7.5% |
| 15 to 19 Minutes | 0 | 0.0% |
| 20 to 24 Minutes | 6 | 3.0% |
| 25 to 29 Minutes | 4 | 2.0% |
| 30 to 34 Minutes | 21 | 10.5% |
| 35 to 39 Minutes | 20 | 10.0% |
| 40 to 44 Minutes | 57 | 28.5% |
| 45 to 59 Minutes | 28 | 14.0% |
| 60 to 89 Minutes | 25 | 12.5% |
| 90 or more Minutes | 10 | 5.0% |
Commute Time by Sex in Marshall
The most common commute times in Marshall are 30 to 34 minutes (21 commuters, 26.9%) for males and 40 to 44 minutes (57 commuters, 46.7%) for females.
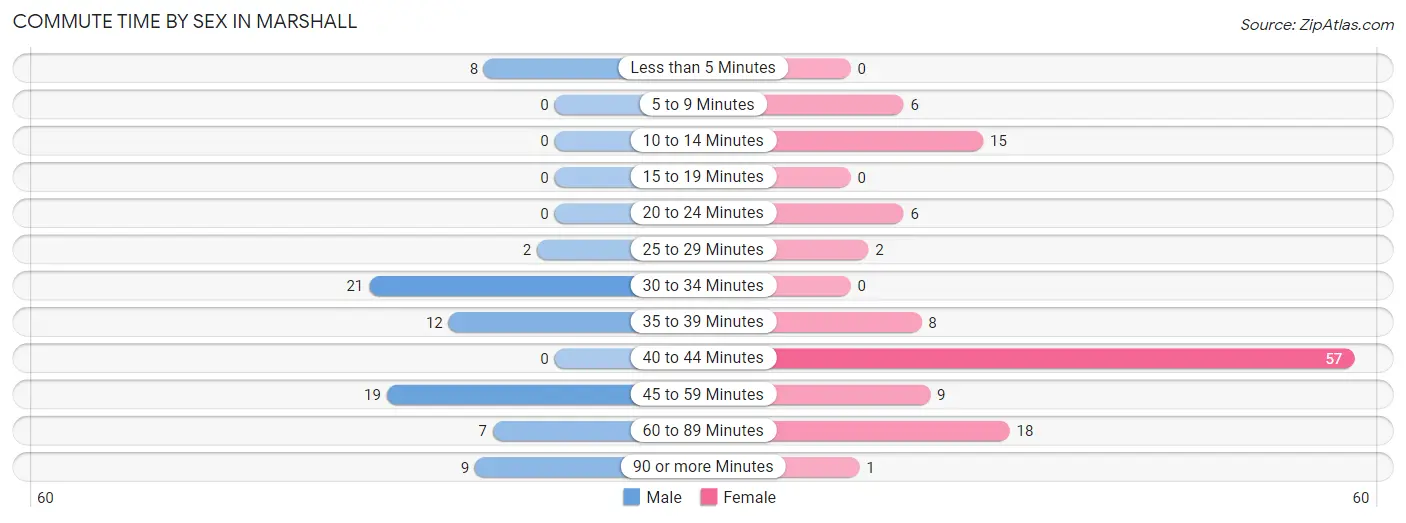
| Commute Time | Male | Female |
| Less than 5 Minutes | 8 (10.3%) | 0 (0.0%) |
| 5 to 9 Minutes | 0 (0.0%) | 6 (4.9%) |
| 10 to 14 Minutes | 0 (0.0%) | 15 (12.3%) |
| 15 to 19 Minutes | 0 (0.0%) | 0 (0.0%) |
| 20 to 24 Minutes | 0 (0.0%) | 6 (4.9%) |
| 25 to 29 Minutes | 2 (2.6%) | 2 (1.6%) |
| 30 to 34 Minutes | 21 (26.9%) | 0 (0.0%) |
| 35 to 39 Minutes | 12 (15.4%) | 8 (6.6%) |
| 40 to 44 Minutes | 0 (0.0%) | 57 (46.7%) |
| 45 to 59 Minutes | 19 (24.4%) | 9 (7.4%) |
| 60 to 89 Minutes | 7 (9.0%) | 18 (14.7%) |
| 90 or more Minutes | 9 (11.5%) | 1 (0.8%) |
Time of Departure to Work by Sex in Marshall
The most frequent times of departure to work in Marshall are 8:30 AM to 8:59 AM (16, 20.5%) for males and 12:00 AM to 4:59 AM (70, 57.4%) for females.
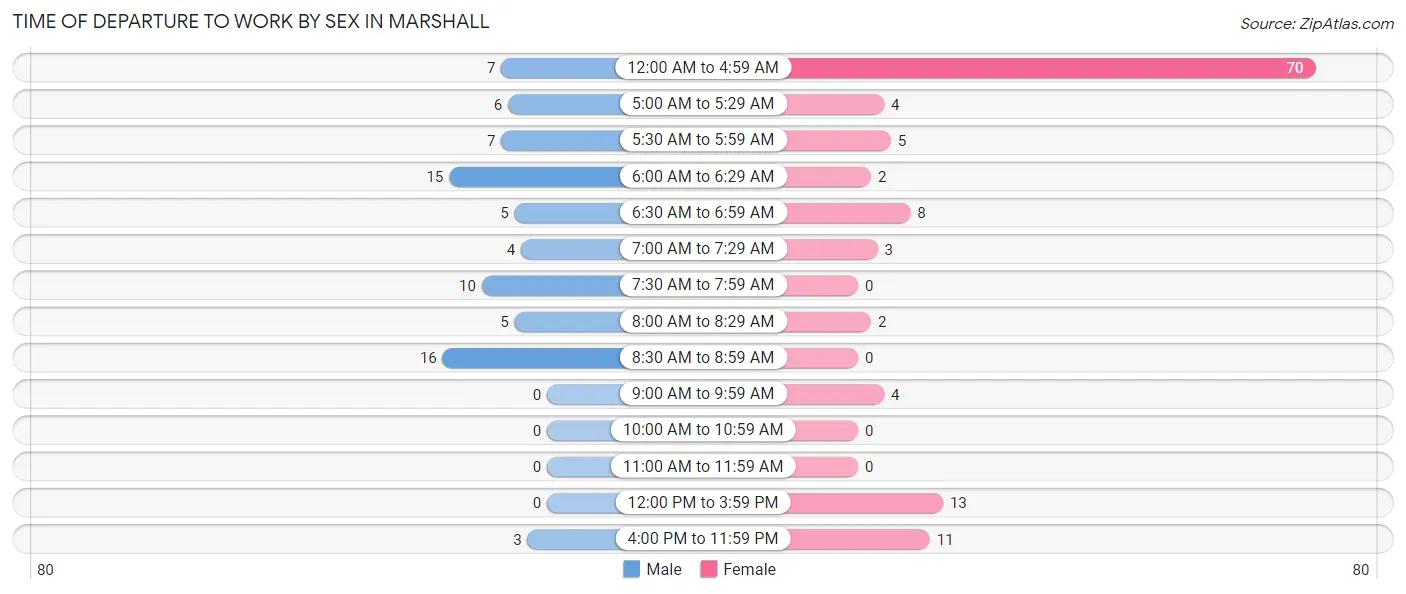
| Time of Departure | Male | Female |
| 12:00 AM to 4:59 AM | 7 (9.0%) | 70 (57.4%) |
| 5:00 AM to 5:29 AM | 6 (7.7%) | 4 (3.3%) |
| 5:30 AM to 5:59 AM | 7 (9.0%) | 5 (4.1%) |
| 6:00 AM to 6:29 AM | 15 (19.2%) | 2 (1.6%) |
| 6:30 AM to 6:59 AM | 5 (6.4%) | 8 (6.6%) |
| 7:00 AM to 7:29 AM | 4 (5.1%) | 3 (2.5%) |
| 7:30 AM to 7:59 AM | 10 (12.8%) | 0 (0.0%) |
| 8:00 AM to 8:29 AM | 5 (6.4%) | 2 (1.6%) |
| 8:30 AM to 8:59 AM | 16 (20.5%) | 0 (0.0%) |
| 9:00 AM to 9:59 AM | 0 (0.0%) | 4 (3.3%) |
| 10:00 AM to 10:59 AM | 0 (0.0%) | 0 (0.0%) |
| 11:00 AM to 11:59 AM | 0 (0.0%) | 0 (0.0%) |
| 12:00 PM to 3:59 PM | 0 (0.0%) | 13 (10.7%) |
| 4:00 PM to 11:59 PM | 3 (3.8%) | 11 (9.0%) |
| Total | 78 (100.0%) | 122 (100.0%) |
Housing Occupancy in Marshall
Occupancy by Ownership in Marshall
Of the total 158 dwellings in Marshall, owner-occupied units account for 154 (97.5%), while renter-occupied units make up 4 (2.5%).
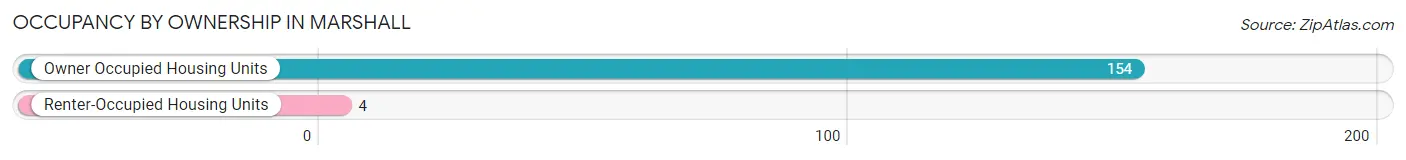
| Occupancy | # Housing Units | % Housing Units |
| Owner Occupied Housing Units | 154 | 97.5% |
| Renter-Occupied Housing Units | 4 | 2.5% |
| Total Occupied Housing Units | 158 | 100.0% |
Occupancy by Household Size in Marshall
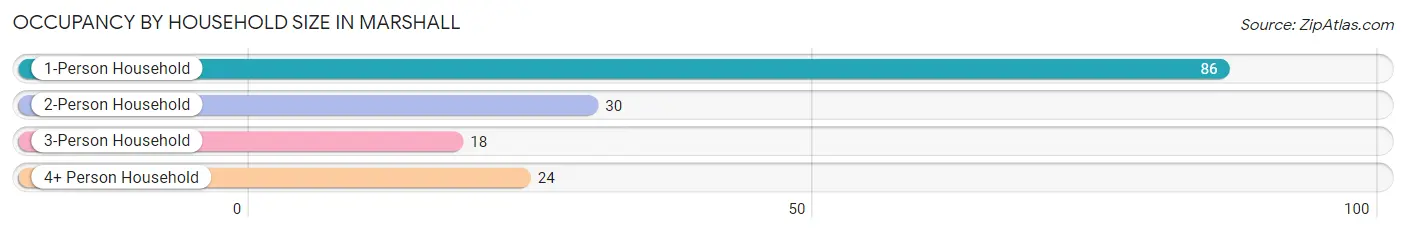
| Household Size | # Housing Units | % Housing Units |
| 1-Person Household | 86 | 54.4% |
| 2-Person Household | 30 | 19.0% |
| 3-Person Household | 18 | 11.4% |
| 4+ Person Household | 24 | 15.2% |
| Total Housing Units | 158 | 100.0% |
Occupancy by Ownership by Household Size in Marshall
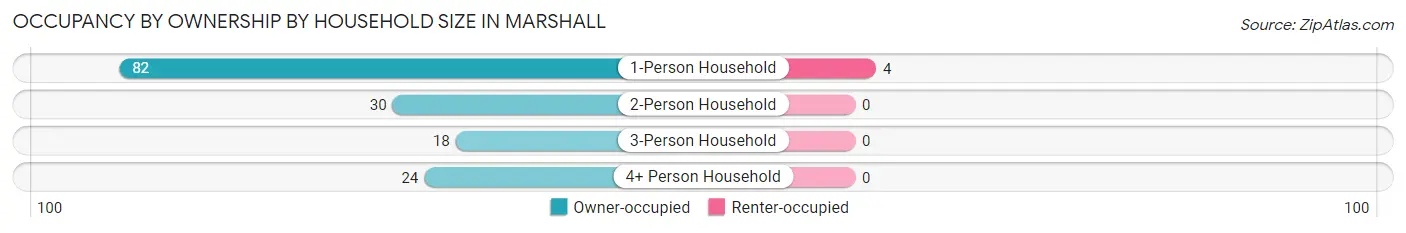
| Household Size | Owner-occupied | Renter-occupied |
| 1-Person Household | 82 (95.4%) | 4 (4.6%) |
| 2-Person Household | 30 (100.0%) | 0 (0.0%) |
| 3-Person Household | 18 (100.0%) | 0 (0.0%) |
| 4+ Person Household | 24 (100.0%) | 0 (0.0%) |
| Total Housing Units | 154 (97.5%) | 4 (2.5%) |
Occupancy by Educational Attainment in Marshall
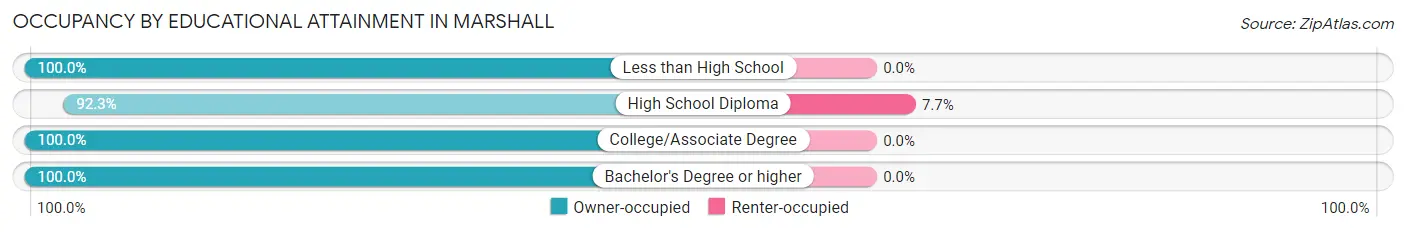
| Household Size | Owner-occupied | Renter-occupied |
| Less than High School | 24 (100.0%) | 0 (0.0%) |
| High School Diploma | 48 (92.3%) | 4 (7.7%) |
| College/Associate Degree | 78 (100.0%) | 0 (0.0%) |
| Bachelor's Degree or higher | 4 (100.0%) | 0 (0.0%) |
Occupancy by Age of Householder in Marshall
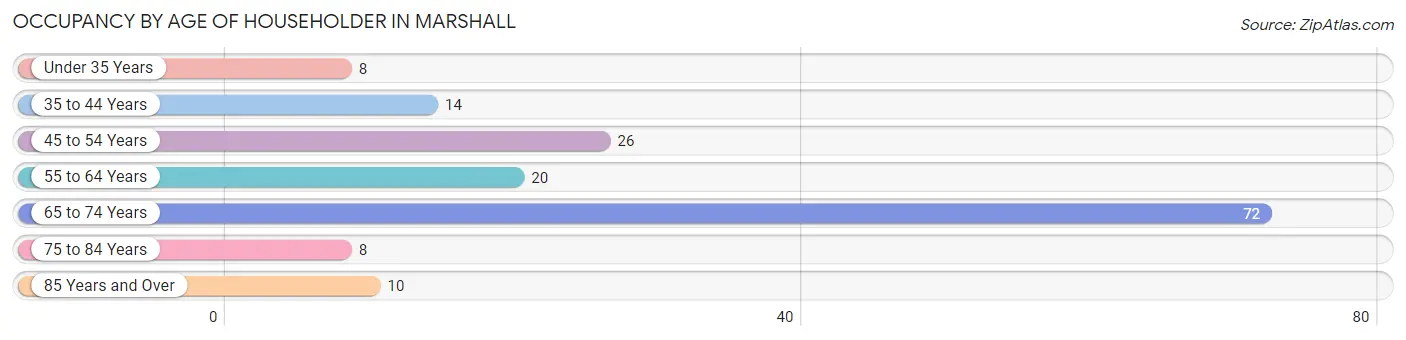
| Age Bracket | # Households | % Households |
| Under 35 Years | 8 | 5.1% |
| 35 to 44 Years | 14 | 8.9% |
| 45 to 54 Years | 26 | 16.5% |
| 55 to 64 Years | 20 | 12.7% |
| 65 to 74 Years | 72 | 45.6% |
| 75 to 84 Years | 8 | 5.1% |
| 85 Years and Over | 10 | 6.3% |
| Total | 158 | 100.0% |
Housing Finances in Marshall
Median Income by Occupancy in Marshall
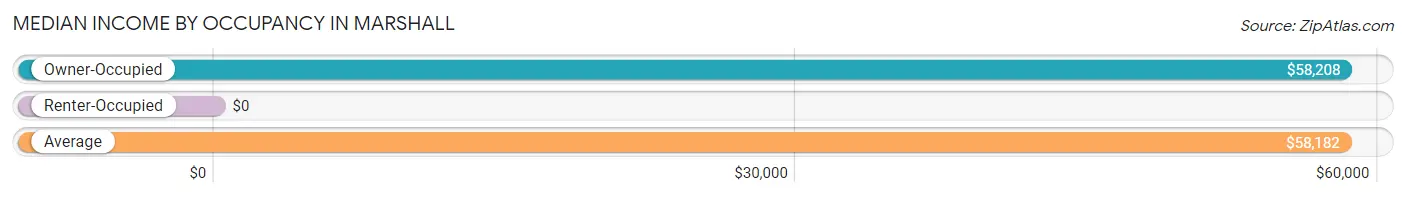
| Occupancy Type | # Households | Median Income |
| Owner-Occupied | 154 (97.5%) | $58,208 |
| Renter-Occupied | 4 (2.5%) | $0 |
| Average | 158 (100.0%) | $58,182 |
Occupancy by Householder Income Bracket in Marshall
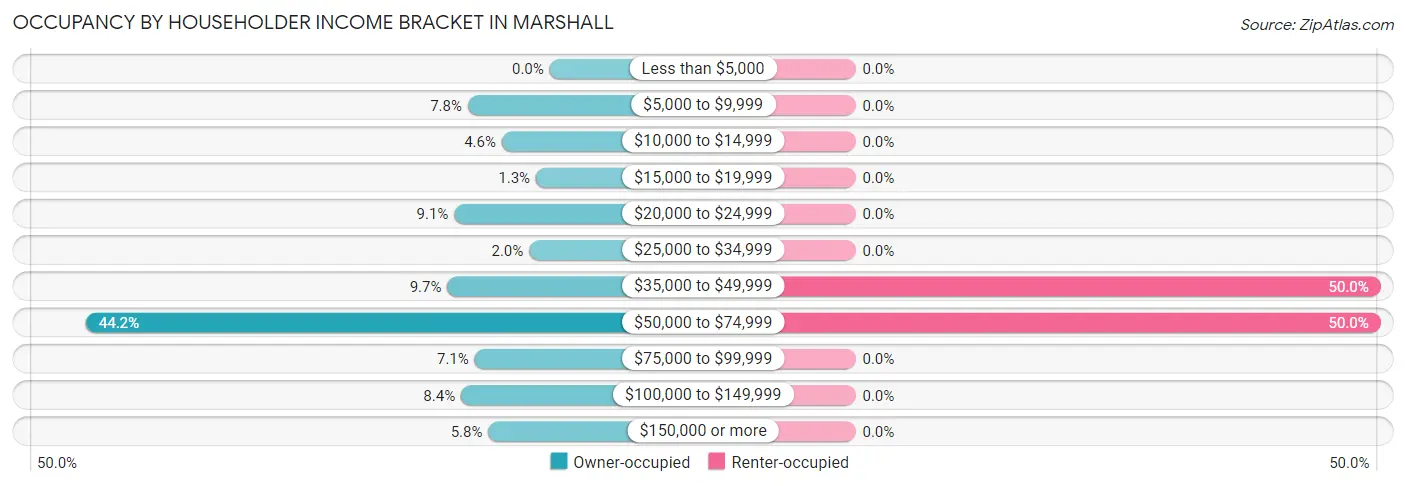
| Income Bracket | Owner-occupied | Renter-occupied |
| Less than $5,000 | 0 (0.0%) | 0 (0.0%) |
| $5,000 to $9,999 | 12 (7.8%) | 0 (0.0%) |
| $10,000 to $14,999 | 7 (4.5%) | 0 (0.0%) |
| $15,000 to $19,999 | 2 (1.3%) | 0 (0.0%) |
| $20,000 to $24,999 | 14 (9.1%) | 0 (0.0%) |
| $25,000 to $34,999 | 3 (1.9%) | 0 (0.0%) |
| $35,000 to $49,999 | 15 (9.7%) | 2 (50.0%) |
| $50,000 to $74,999 | 68 (44.2%) | 2 (50.0%) |
| $75,000 to $99,999 | 11 (7.1%) | 0 (0.0%) |
| $100,000 to $149,999 | 13 (8.4%) | 0 (0.0%) |
| $150,000 or more | 9 (5.8%) | 0 (0.0%) |
| Total | 154 (100.0%) | 4 (100.0%) |
Monthly Housing Cost Tiers in Marshall
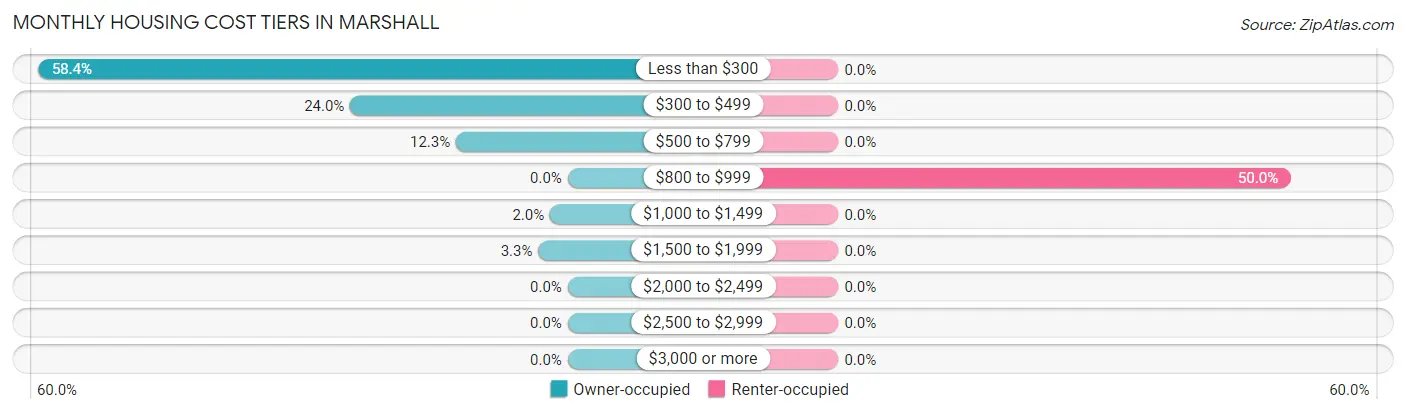
| Monthly Cost | Owner-occupied | Renter-occupied |
| Less than $300 | 90 (58.4%) | 0 (0.0%) |
| $300 to $499 | 37 (24.0%) | 0 (0.0%) |
| $500 to $799 | 19 (12.3%) | 0 (0.0%) |
| $800 to $999 | 0 (0.0%) | 2 (50.0%) |
| $1,000 to $1,499 | 3 (1.9%) | 0 (0.0%) |
| $1,500 to $1,999 | 5 (3.3%) | 0 (0.0%) |
| $2,000 to $2,499 | 0 (0.0%) | 0 (0.0%) |
| $2,500 to $2,999 | 0 (0.0%) | 0 (0.0%) |
| $3,000 or more | 0 (0.0%) | 0 (0.0%) |
| Total | 154 (100.0%) | 4 (100.0%) |
Physical Housing Characteristics in Marshall
Housing Structures in Marshall
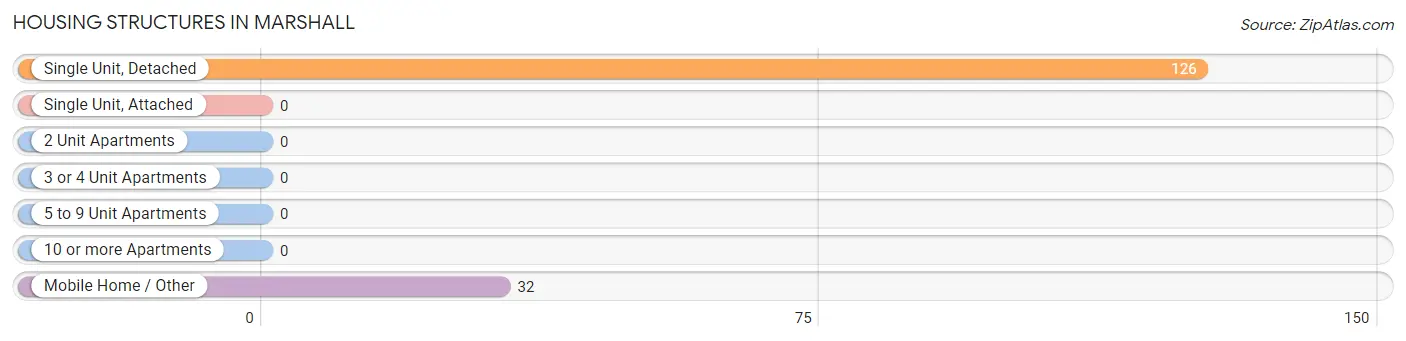
| Structure Type | # Housing Units | % Housing Units |
| Single Unit, Detached | 126 | 79.7% |
| Single Unit, Attached | 0 | 0.0% |
| 2 Unit Apartments | 0 | 0.0% |
| 3 or 4 Unit Apartments | 0 | 0.0% |
| 5 to 9 Unit Apartments | 0 | 0.0% |
| 10 or more Apartments | 0 | 0.0% |
| Mobile Home / Other | 32 | 20.3% |
| Total | 158 | 100.0% |
Housing Structures by Occupancy in Marshall
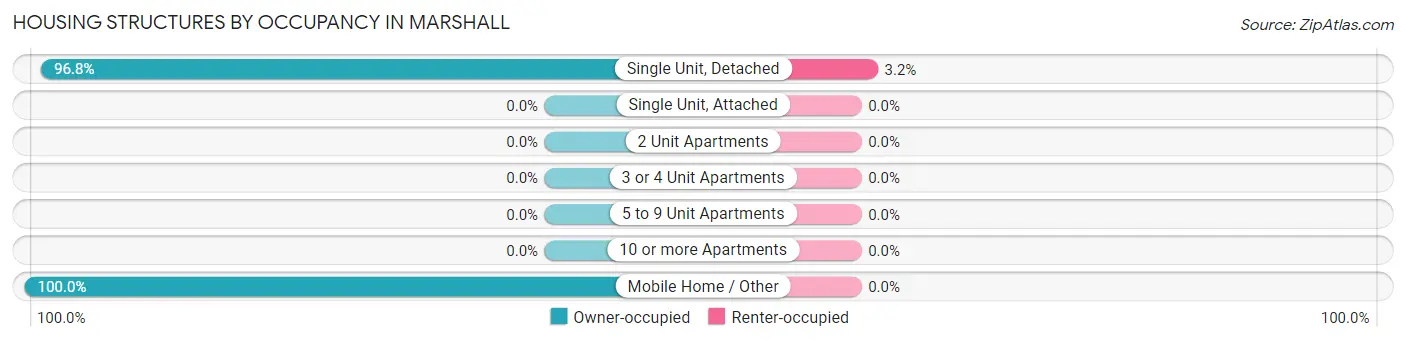
| Structure Type | Owner-occupied | Renter-occupied |
| Single Unit, Detached | 122 (96.8%) | 4 (3.2%) |
| Single Unit, Attached | 0 (0.0%) | 0 (0.0%) |
| 2 Unit Apartments | 0 (0.0%) | 0 (0.0%) |
| 3 or 4 Unit Apartments | 0 (0.0%) | 0 (0.0%) |
| 5 to 9 Unit Apartments | 0 (0.0%) | 0 (0.0%) |
| 10 or more Apartments | 0 (0.0%) | 0 (0.0%) |
| Mobile Home / Other | 32 (100.0%) | 0 (0.0%) |
| Total | 154 (97.5%) | 4 (2.5%) |
Housing Structures by Number of Rooms in Marshall
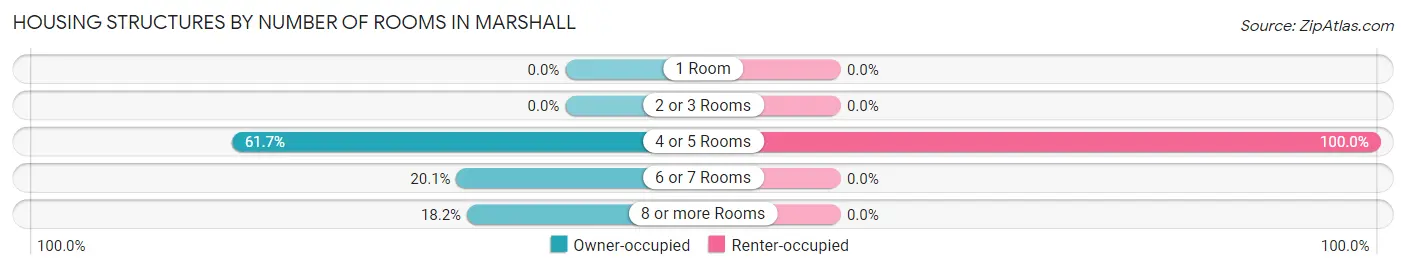
| Number of Rooms | Owner-occupied | Renter-occupied |
| 1 Room | 0 (0.0%) | 0 (0.0%) |
| 2 or 3 Rooms | 0 (0.0%) | 0 (0.0%) |
| 4 or 5 Rooms | 95 (61.7%) | 4 (100.0%) |
| 6 or 7 Rooms | 31 (20.1%) | 0 (0.0%) |
| 8 or more Rooms | 28 (18.2%) | 0 (0.0%) |
| Total | 154 (100.0%) | 4 (100.0%) |
Housing Structure by Heating Type in Marshall
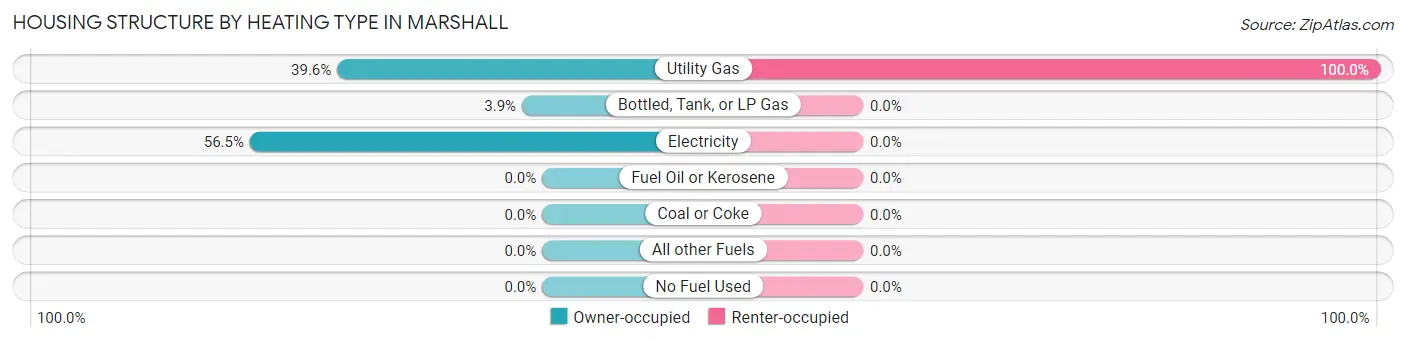
| Heating Type | Owner-occupied | Renter-occupied |
| Utility Gas | 61 (39.6%) | 4 (100.0%) |
| Bottled, Tank, or LP Gas | 6 (3.9%) | 0 (0.0%) |
| Electricity | 87 (56.5%) | 0 (0.0%) |
| Fuel Oil or Kerosene | 0 (0.0%) | 0 (0.0%) |
| Coal or Coke | 0 (0.0%) | 0 (0.0%) |
| All other Fuels | 0 (0.0%) | 0 (0.0%) |
| No Fuel Used | 0 (0.0%) | 0 (0.0%) |
| Total | 154 (100.0%) | 4 (100.0%) |
Household Vehicle Usage in Marshall
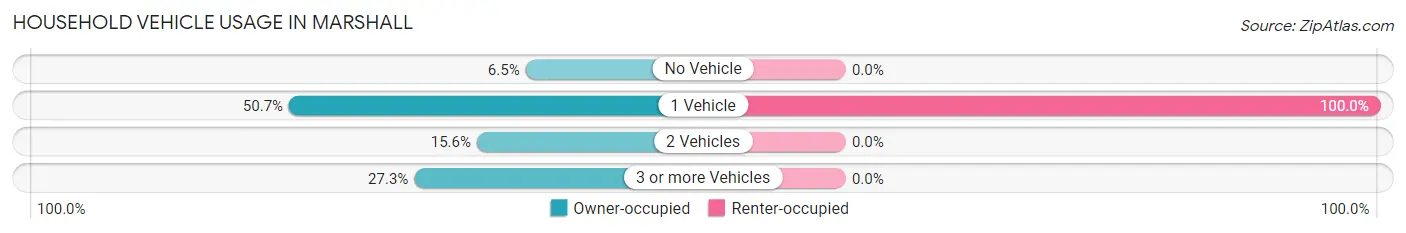
| Vehicles per Household | Owner-occupied | Renter-occupied |
| No Vehicle | 10 (6.5%) | 0 (0.0%) |
| 1 Vehicle | 78 (50.6%) | 4 (100.0%) |
| 2 Vehicles | 24 (15.6%) | 0 (0.0%) |
| 3 or more Vehicles | 42 (27.3%) | 0 (0.0%) |
| Total | 154 (100.0%) | 4 (100.0%) |
Real Estate & Mortgages in Marshall
Real Estate and Mortgage Overview in Marshall
| Characteristic | Without Mortgage | With Mortgage |
| Housing Units | 126 | 28 |
| Median Property Value | $28,000 | $155,000 |
| Median Household Income | $58,443 | $0 |
| Monthly Housing Costs | $244 | $0 |
| Real Estate Taxes | $235 | $0 |
Property Value by Mortgage Status in Marshall
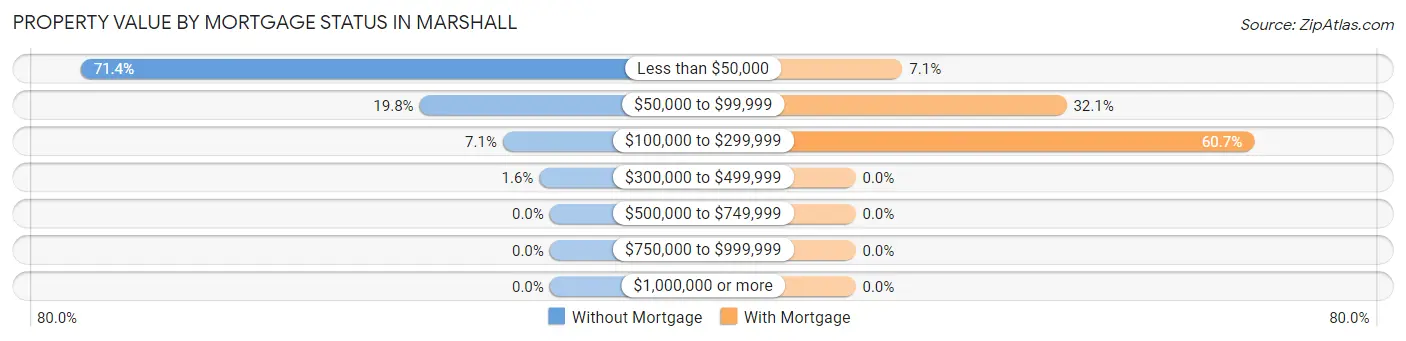
| Property Value | Without Mortgage | With Mortgage |
| Less than $50,000 | 90 (71.4%) | 2 (7.1%) |
| $50,000 to $99,999 | 25 (19.8%) | 9 (32.1%) |
| $100,000 to $299,999 | 9 (7.1%) | 17 (60.7%) |
| $300,000 to $499,999 | 2 (1.6%) | 0 (0.0%) |
| $500,000 to $749,999 | 0 (0.0%) | 0 (0.0%) |
| $750,000 to $999,999 | 0 (0.0%) | 0 (0.0%) |
| $1,000,000 or more | 0 (0.0%) | 0 (0.0%) |
| Total | 126 (100.0%) | 28 (100.0%) |
Household Income by Mortgage Status in Marshall
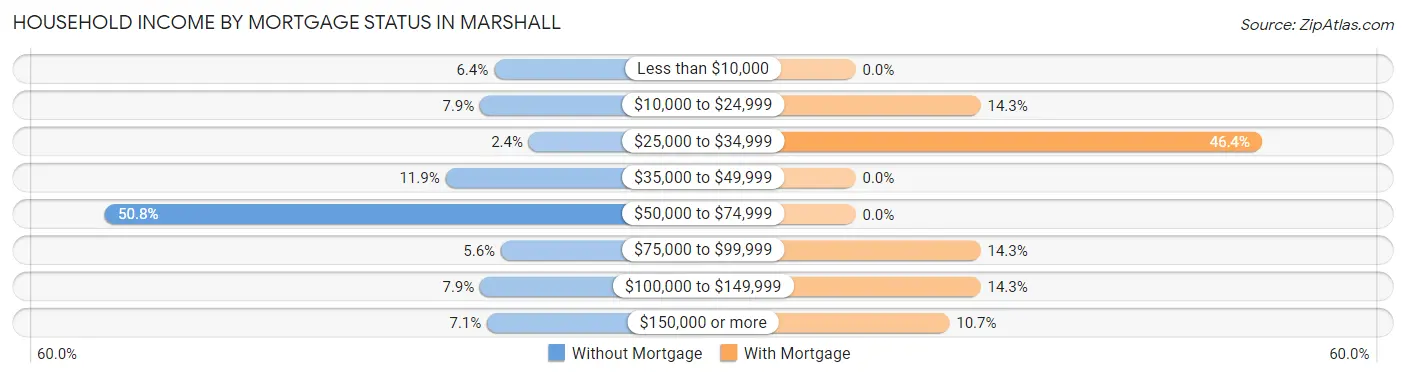
| Household Income | Without Mortgage | With Mortgage |
| Less than $10,000 | 8 (6.4%) | 0 (0.0%) |
| $10,000 to $24,999 | 10 (7.9%) | 4 (14.3%) |
| $25,000 to $34,999 | 3 (2.4%) | 13 (46.4%) |
| $35,000 to $49,999 | 15 (11.9%) | 0 (0.0%) |
| $50,000 to $74,999 | 64 (50.8%) | 0 (0.0%) |
| $75,000 to $99,999 | 7 (5.6%) | 4 (14.3%) |
| $100,000 to $149,999 | 10 (7.9%) | 4 (14.3%) |
| $150,000 or more | 9 (7.1%) | 3 (10.7%) |
| Total | 126 (100.0%) | 28 (100.0%) |
Property Value to Household Income Ratio in Marshall
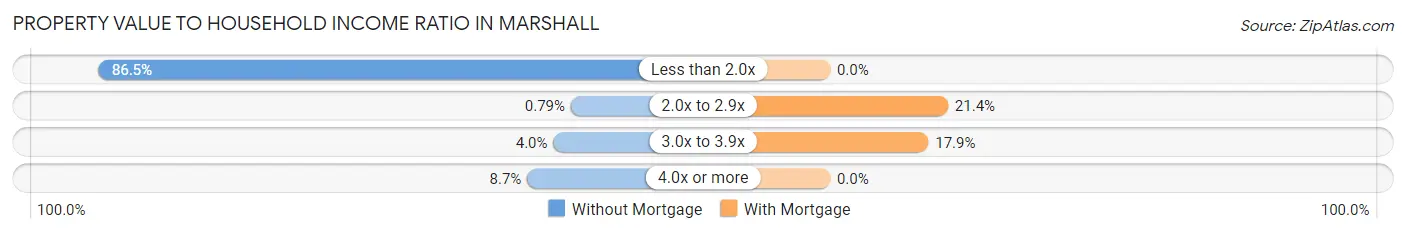
| Value-to-Income Ratio | Without Mortgage | With Mortgage |
| Less than 2.0x | 109 (86.5%) | 0 (0.0%) |
| 2.0x to 2.9x | 1 (0.8%) | 6 (21.4%) |
| 3.0x to 3.9x | 5 (4.0%) | 5 (17.9%) |
| 4.0x or more | 11 (8.7%) | 0 (0.0%) |
| Total | 126 (100.0%) | 28 (100.0%) |
Real Estate Taxes by Mortgage Status in Marshall
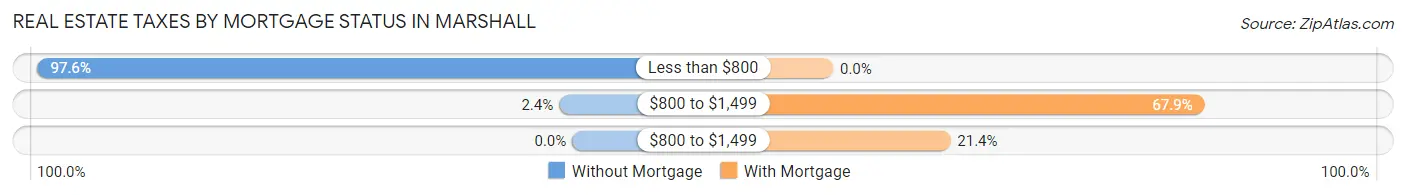
| Property Taxes | Without Mortgage | With Mortgage |
| Less than $800 | 123 (97.6%) | 0 (0.0%) |
| $800 to $1,499 | 3 (2.4%) | 19 (67.9%) |
| $800 to $1,499 | 0 (0.0%) | 6 (21.4%) |
| Total | 126 (100.0%) | 28 (100.0%) |
Health & Disability in Marshall
Health Insurance Coverage by Age in Marshall
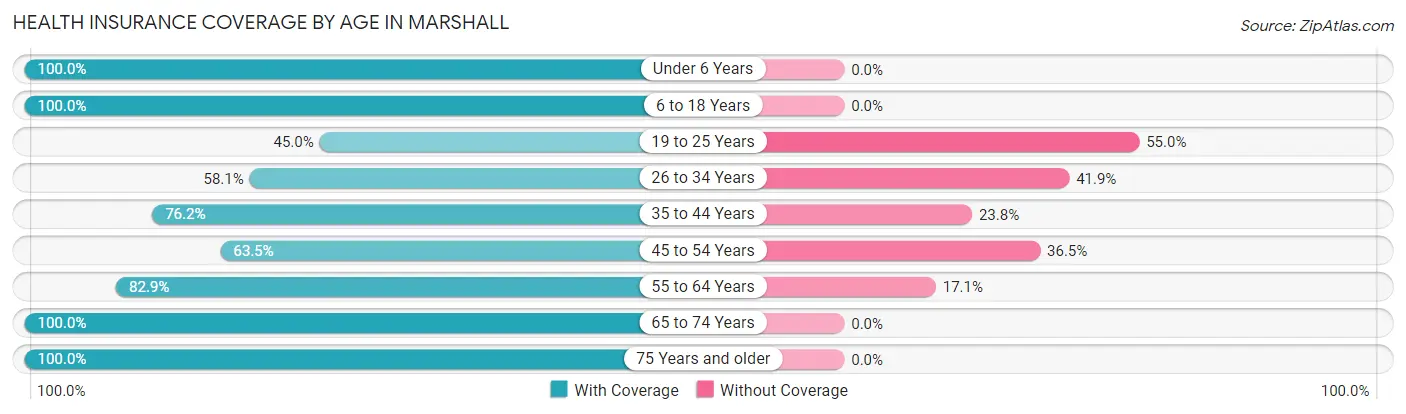
| Age Bracket | With Coverage | Without Coverage |
| Under 6 Years | 9 (100.0%) | 0 (0.0%) |
| 6 to 18 Years | 38 (100.0%) | 0 (0.0%) |
| 19 to 25 Years | 18 (45.0%) | 22 (55.0%) |
| 26 to 34 Years | 18 (58.1%) | 13 (41.9%) |
| 35 to 44 Years | 16 (76.2%) | 5 (23.8%) |
| 45 to 54 Years | 40 (63.5%) | 23 (36.5%) |
| 55 to 64 Years | 34 (82.9%) | 7 (17.1%) |
| 65 to 74 Years | 74 (100.0%) | 0 (0.0%) |
| 75 Years and older | 18 (100.0%) | 0 (0.0%) |
| Total | 265 (79.1%) | 70 (20.9%) |
Health Insurance Coverage by Citizenship Status in Marshall
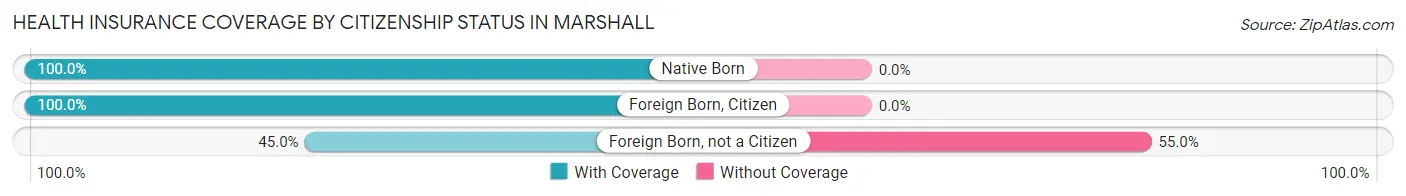
| Citizenship Status | With Coverage | Without Coverage |
| Native Born | 9 (100.0%) | 0 (0.0%) |
| Foreign Born, Citizen | 38 (100.0%) | 0 (0.0%) |
| Foreign Born, not a Citizen | 18 (45.0%) | 22 (55.0%) |
Health Insurance Coverage by Household Income in Marshall
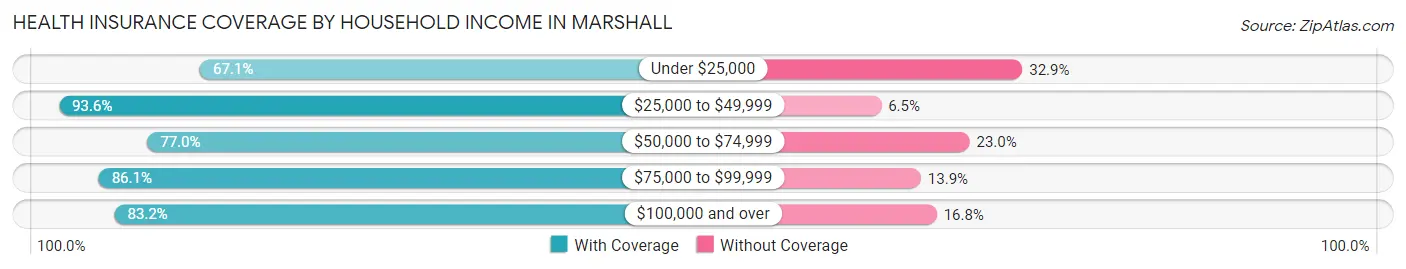
| Household Income | With Coverage | Without Coverage |
| Under $25,000 | 49 (67.1%) | 24 (32.9%) |
| $25,000 to $49,999 | 29 (93.5%) | 2 (6.5%) |
| $50,000 to $74,999 | 77 (77.0%) | 23 (23.0%) |
| $75,000 to $99,999 | 31 (86.1%) | 5 (13.9%) |
| $100,000 and over | 79 (83.2%) | 16 (16.8%) |
Public vs Private Health Insurance Coverage by Age in Marshall
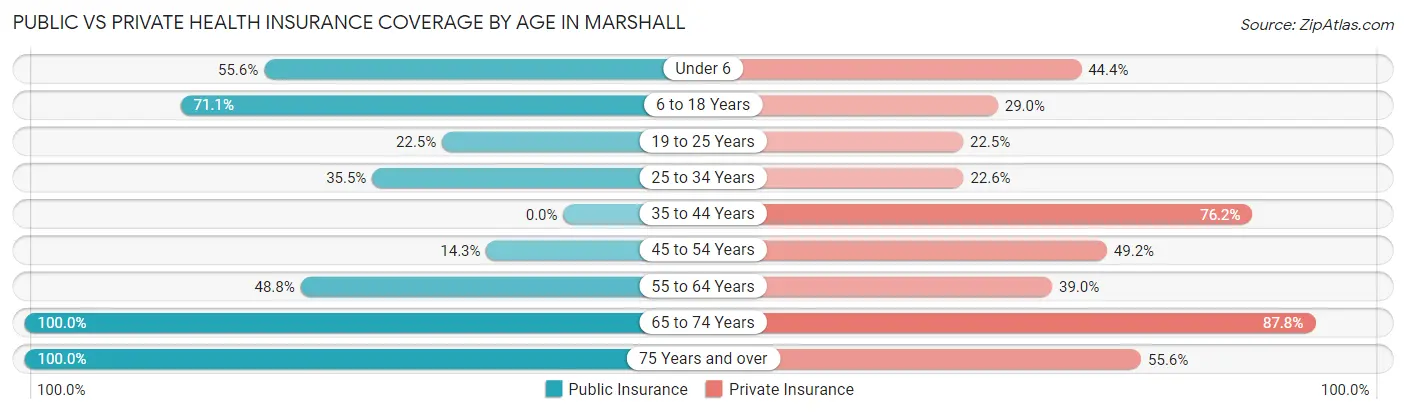
| Age Bracket | Public Insurance | Private Insurance |
| Under 6 | 5 (55.6%) | 4 (44.4%) |
| 6 to 18 Years | 27 (71.1%) | 11 (28.9%) |
| 19 to 25 Years | 9 (22.5%) | 9 (22.5%) |
| 25 to 34 Years | 11 (35.5%) | 7 (22.6%) |
| 35 to 44 Years | 0 (0.0%) | 16 (76.2%) |
| 45 to 54 Years | 9 (14.3%) | 31 (49.2%) |
| 55 to 64 Years | 20 (48.8%) | 16 (39.0%) |
| 65 to 74 Years | 74 (100.0%) | 65 (87.8%) |
| 75 Years and over | 18 (100.0%) | 10 (55.6%) |
| Total | 173 (51.6%) | 169 (50.4%) |
Disability Status by Sex by Age in Marshall
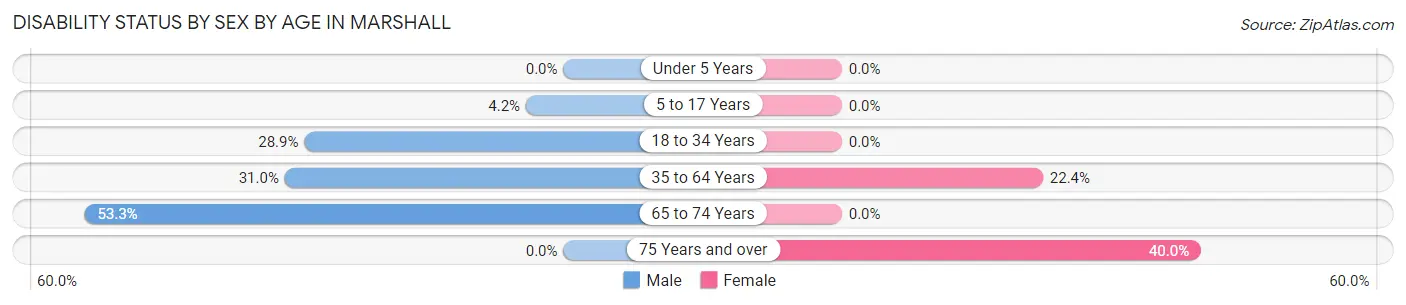
| Age Bracket | Male | Female |
| Under 5 Years | 0 (0.0%) | 0 (0.0%) |
| 5 to 17 Years | 1 (4.2%) | 0 (0.0%) |
| 18 to 34 Years | 15 (28.8%) | 0 (0.0%) |
| 35 to 64 Years | 18 (31.0%) | 15 (22.4%) |
| 65 to 74 Years | 8 (53.3%) | 0 (0.0%) |
| 75 Years and over | 0 (0.0%) | 4 (40.0%) |
Disability Class by Sex by Age in Marshall
Disability Class: Hearing Difficulty
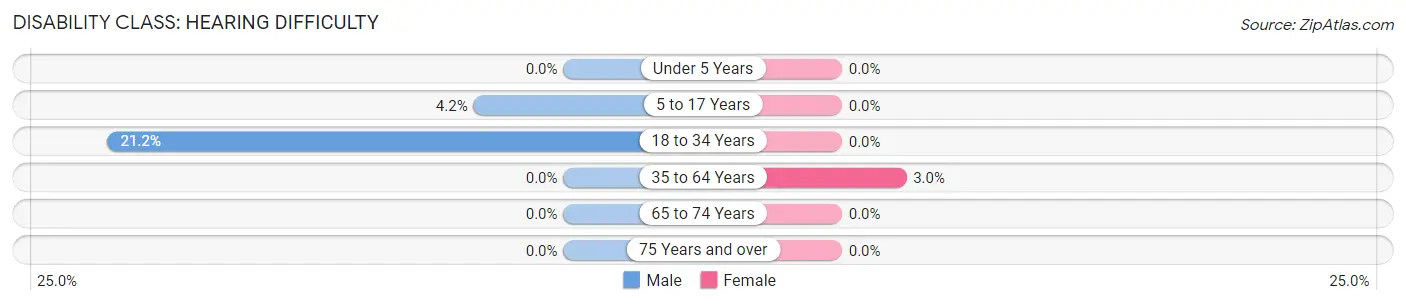
| Age Bracket | Male | Female |
| Under 5 Years | 0 (0.0%) | 0 (0.0%) |
| 5 to 17 Years | 1 (4.2%) | 0 (0.0%) |
| 18 to 34 Years | 11 (21.1%) | 0 (0.0%) |
| 35 to 64 Years | 0 (0.0%) | 2 (3.0%) |
| 65 to 74 Years | 0 (0.0%) | 0 (0.0%) |
| 75 Years and over | 0 (0.0%) | 0 (0.0%) |
Disability Class: Vision Difficulty
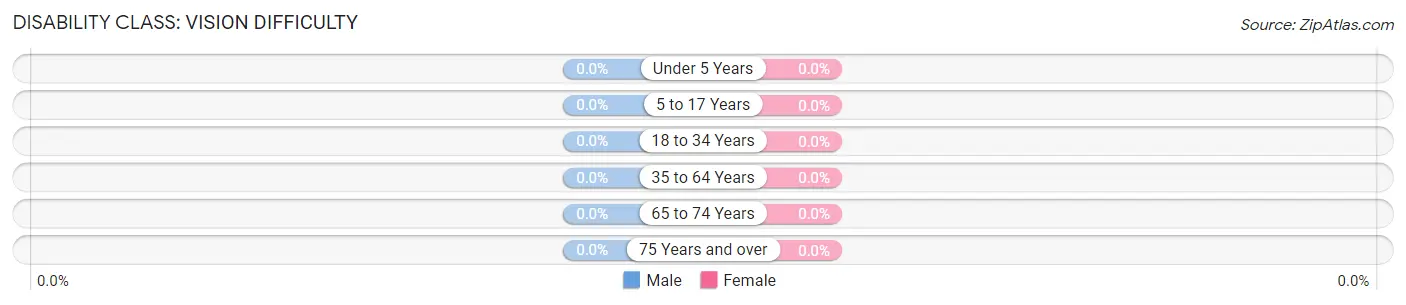
| Age Bracket | Male | Female |
| Under 5 Years | 0 (0.0%) | 0 (0.0%) |
| 5 to 17 Years | 0 (0.0%) | 0 (0.0%) |
| 18 to 34 Years | 0 (0.0%) | 0 (0.0%) |
| 35 to 64 Years | 0 (0.0%) | 0 (0.0%) |
| 65 to 74 Years | 0 (0.0%) | 0 (0.0%) |
| 75 Years and over | 0 (0.0%) | 0 (0.0%) |
Disability Class: Cognitive Difficulty
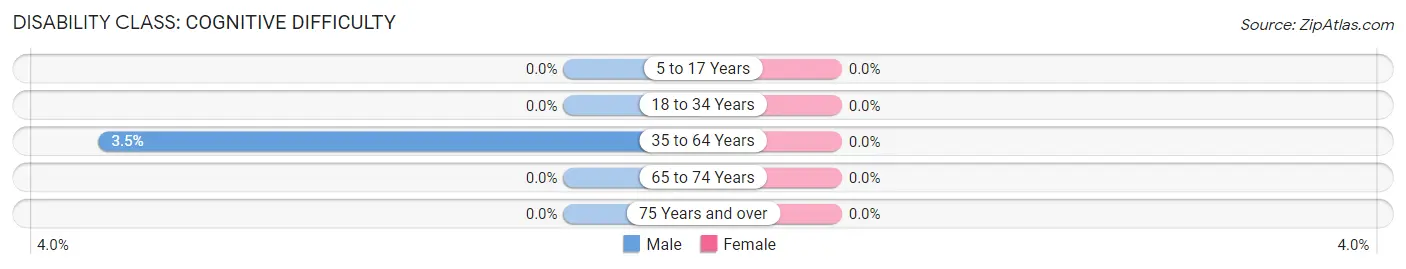
| Age Bracket | Male | Female |
| 5 to 17 Years | 0 (0.0%) | 0 (0.0%) |
| 18 to 34 Years | 0 (0.0%) | 0 (0.0%) |
| 35 to 64 Years | 2 (3.5%) | 0 (0.0%) |
| 65 to 74 Years | 0 (0.0%) | 0 (0.0%) |
| 75 Years and over | 0 (0.0%) | 0 (0.0%) |
Disability Class: Ambulatory Difficulty
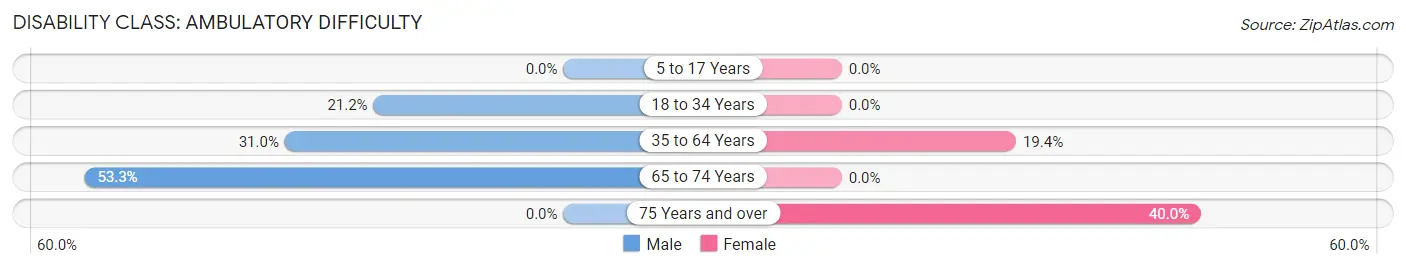
| Age Bracket | Male | Female |
| 5 to 17 Years | 0 (0.0%) | 0 (0.0%) |
| 18 to 34 Years | 11 (21.1%) | 0 (0.0%) |
| 35 to 64 Years | 18 (31.0%) | 13 (19.4%) |
| 65 to 74 Years | 8 (53.3%) | 0 (0.0%) |
| 75 Years and over | 0 (0.0%) | 4 (40.0%) |
Disability Class: Self-Care Difficulty
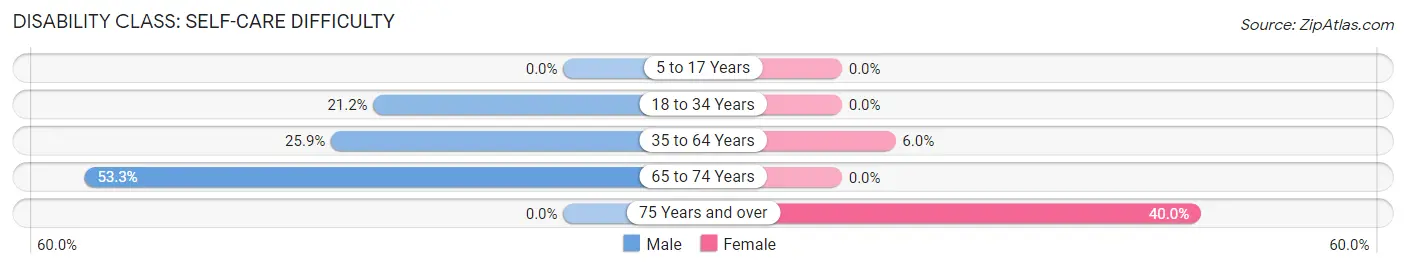
| Age Bracket | Male | Female |
| 5 to 17 Years | 0 (0.0%) | 0 (0.0%) |
| 18 to 34 Years | 11 (21.1%) | 0 (0.0%) |
| 35 to 64 Years | 15 (25.9%) | 4 (6.0%) |
| 65 to 74 Years | 8 (53.3%) | 0 (0.0%) |
| 75 Years and over | 0 (0.0%) | 4 (40.0%) |
Technology Access in Marshall
Computing Device Access in Marshall
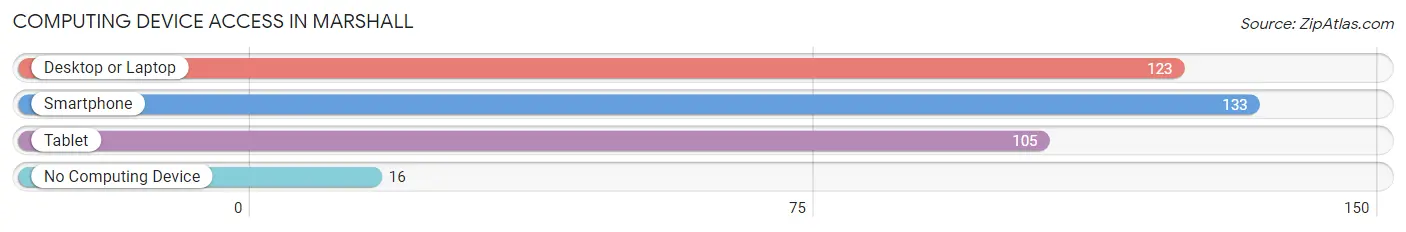
| Device Type | # Households | % Households |
| Desktop or Laptop | 123 | 77.8% |
| Smartphone | 133 | 84.2% |
| Tablet | 105 | 66.5% |
| No Computing Device | 16 | 10.1% |
| Total | 158 | 100.0% |
Internet Access in Marshall
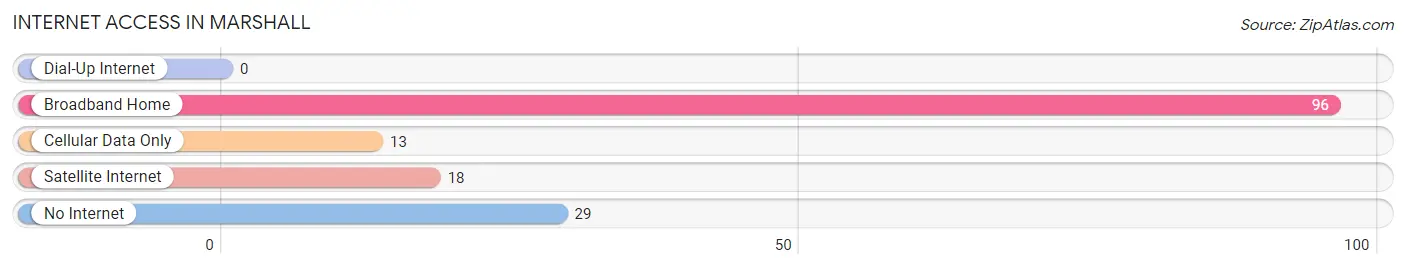
| Internet Type | # Households | % Households |
| Dial-Up Internet | 0 | 0.0% |
| Broadband Home | 96 | 60.8% |
| Cellular Data Only | 13 | 8.2% |
| Satellite Internet | 18 | 11.4% |
| No Internet | 29 | 18.3% |
| Total | 158 | 100.0% |
Marshall Summary
Marshall, Oklahoma is a small town located in the southeastern corner of the state, in the foothills of the Ouachita Mountains. It is situated in the foothills of the Ouachita Mountains, and is part of the Ouachita National Forest. The town is located in the foothills of the Ouachita Mountains, and is part of the Ouachita National Forest. The town is located in the foothills of the Ouachita Mountains, and is part of the Ouachita National Forest.
History
Marshall, Oklahoma was founded in 1891 by a group of settlers from Arkansas. The town was named after the Marshall family, who were among the first settlers. The town was originally a farming community, and the first crops grown were cotton and corn. The town was also home to a number of small businesses, including a general store, a blacksmith shop, and a sawmill.
In the early 1900s, the town began to grow and develop. The first school was built in 1906, and the first bank opened in 1908. The town also had a post office, a newspaper, and a telephone exchange.
In the 1920s, the town began to experience a period of growth and prosperity. The population increased from 500 to 1,500, and the town was home to several businesses, including a hotel, a movie theater, and a number of stores.
In the 1930s, the Great Depression hit the town hard, and many businesses closed. The population decreased to around 500, and the town was in decline.
In the 1940s, the town began to experience a period of recovery. The population increased to around 1,000, and the town was home to several businesses, including a grocery store, a hardware store, and a drug store.
In the 1950s, the town experienced a period of growth and prosperity. The population increased to around 1,500, and the town was home to several businesses, including a bank, a hospital, and a number of stores.
In the 1960s, the town experienced a period of decline. The population decreased to around 500, and the town was in decline.
In the 1970s, the town began to experience a period of recovery. The population increased to around 1,000, and the town was home to several businesses, including a grocery store, a hardware store, and a drug store.
In the 1980s, the town experienced a period of growth and prosperity. The population increased to around 1,500, and the town was home to several businesses, including a bank, a hospital, and a number of stores.
Geography
Marshall, Oklahoma is located in the southeastern corner of the state, in the foothills of the Ouachita Mountains. The town is situated in the foothills of the Ouachita Mountains, and is part of the Ouachita National Forest. The town is located in the foothills of the Ouachita Mountains, and is part of the Ouachita National Forest.
The town is located in the foothills of the Ouachita Mountains, and is part of the Ouachita National Forest. The town is located in the foothills of the Ouachita Mountains, and is part of the Ouachita National Forest. The town is located in the foothills of the Ouachita Mountains, and is part of the Ouachita National Forest.
The town is located in the foothills of the Ouachita Mountains, and is part of the Ouachita National Forest. The town is located in the foothills of the Ouachita Mountains, and is part of the Ouachita National Forest. The town is located in the foothills of the Ouachita Mountains, and is part of the Ouachita National Forest.
Economy
Marshall, Oklahoma is a small town with a population of around 1,500. The town is home to several businesses, including a bank, a hospital, and a number of stores. The town is also home to a number of small businesses, including a general store, a blacksmith shop, and a sawmill.
The town is also home to a number of small businesses, including a grocery store, a hardware store, and a drug store. The town is also home to a number of small businesses, including a restaurant, a bar, and a gas station.
The town is also home to a number of small businesses, including a lumber yard, a feed store, and a car dealership. The town is also home to a number of small businesses, including a furniture store, a clothing store, and a hardware store.
Demographics
As of the 2010 census, the population of Marshall, Oklahoma was 1,521. The racial makeup of the town was 95.3% White, 0.7% African American, 0.2% Native American, 0.2% Asian, 0.1% Pacific Islander, 0.2% from other races, and 3.3% from two or more races. Hispanic or Latino of any race were 1.2% of the population.
The median income for a household in the town was $30,938, and the median income for a family was $37,500. The per capita income for the town was $15,945. About 15.2% of families and 18.2% of the population were below the poverty line, including 25.2% of those under age 18 and 11.2% of those age 65 or over.
Conclusion
Marshall, Oklahoma is a small town located in the southeastern corner of the state, in the foothills of the Ouachita Mountains. The town was founded in 1891 by a group of settlers from Arkansas, and was named after the Marshall family. The town has experienced periods of growth and decline throughout its history, but has remained a small town with a population of around 1,500. The town is home to several businesses, including a bank, a hospital, and a number of stores. The town has a diverse population, with a median income of $30,938 and a per capita income of $15,945.
Common Questions
What is Per Capita Income in Marshall?
Per Capita income in Marshall is $29,190.
What is the Median Family Income in Marshall?
Median Family Income in Marshall is $51,250.
What is the Median Household income in Marshall?
Median Household Income in Marshall is $58,182.
What is Income or Wage Gap in Marshall?
Income or Wage Gap in Marshall is 17.2%.
Women in Marshall earn 82.8 cents for every dollar earned by a man.
What is Inequality or Gini Index in Marshall?
Inequality or Gini Index in Marshall is 0.33.
What is the Total Population of Marshall?
Total Population of Marshall is 335.
What is the Total Male Population of Marshall?
Total Male Population of Marshall is 163.
What is the Total Female Population of Marshall?
Total Female Population of Marshall is 172.
What is the Ratio of Males per 100 Females in Marshall?
There are 94.77 Males per 100 Females in Marshall.
What is the Ratio of Females per 100 Males in Marshall?
There are 105.52 Females per 100 Males in Marshall.
What is the Median Population Age in Marshall?
Median Population Age in Marshall is 49.5 Years.
What is the Average Family Size in Marshall
Average Family Size in Marshall is 3.6 People.
What is the Average Household Size in Marshall
Average Household Size in Marshall is 2.1 People.
How Large is the Labor Force in Marshall?
There are 202 People in the Labor Forcein in Marshall.
What is the Percentage of People in the Labor Force in Marshall?
68.7% of People are in the Labor Force in Marshall.