Bradley Junction, FL Map & Demographics
Bradley Junction Map
Bradley Junction Overview
$22,133
PER CAPITA INCOME
$54,107
AVG FAMILY INCOME
$43,679
AVG HOUSEHOLD INCOME
44.5%
WAGE / INCOME GAP [ % ]
55.5¢/ $1
WAGE / INCOME GAP [ $ ]
0.35
INEQUALITY / GINI INDEX
743
TOTAL POPULATION
408
MALE POPULATION
335
FEMALE POPULATION
121.79
MALES / 100 FEMALES
82.11
FEMALES / 100 MALES
50.3
MEDIAN AGE
3.5
AVG FAMILY SIZE
2.9
AVG HOUSEHOLD SIZE
335
LABOR FORCE [ PEOPLE ]
51.0%
PERCENT IN LABOR FORCE
4.5%
UNEMPLOYMENT RATE
Income in Bradley Junction
Income Overview in Bradley Junction
Per Capita Income in Bradley Junction is $22,133, while median incomes of families and households are $54,107 and $43,679 respectively.
| Characteristic | Number | Measure |
| Per Capita Income | 743 | $22,133 |
| Median Family Income | 186 | $54,107 |
| Mean Family Income | 186 | $65,769 |
| Median Household Income | 253 | $43,679 |
| Mean Household Income | 253 | $57,099 |
| Income Deficit | 186 | $0 |
| Wage / Income Gap (%) | 743 | 44.46% |
| Wage / Income Gap ($) | 743 | 55.54¢ per $1 |
| Gini / Inequality Index | 743 | 0.35 |
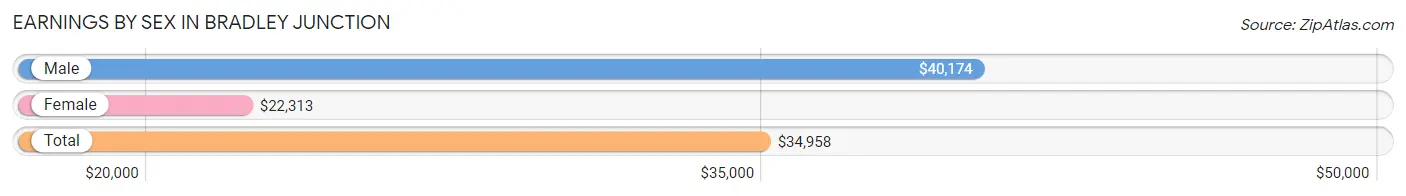
Earnings by Sex in Bradley Junction
Average Earnings in Bradley Junction are $34,958, $40,174 for men and $22,313 for women, a difference of 44.5%.
| Sex | Number | Average Earnings |
| Male | 200 (60.4%) | $40,174 |
| Female | 131 (39.6%) | $22,313 |
| Total | 331 (100.0%) | $34,958 |
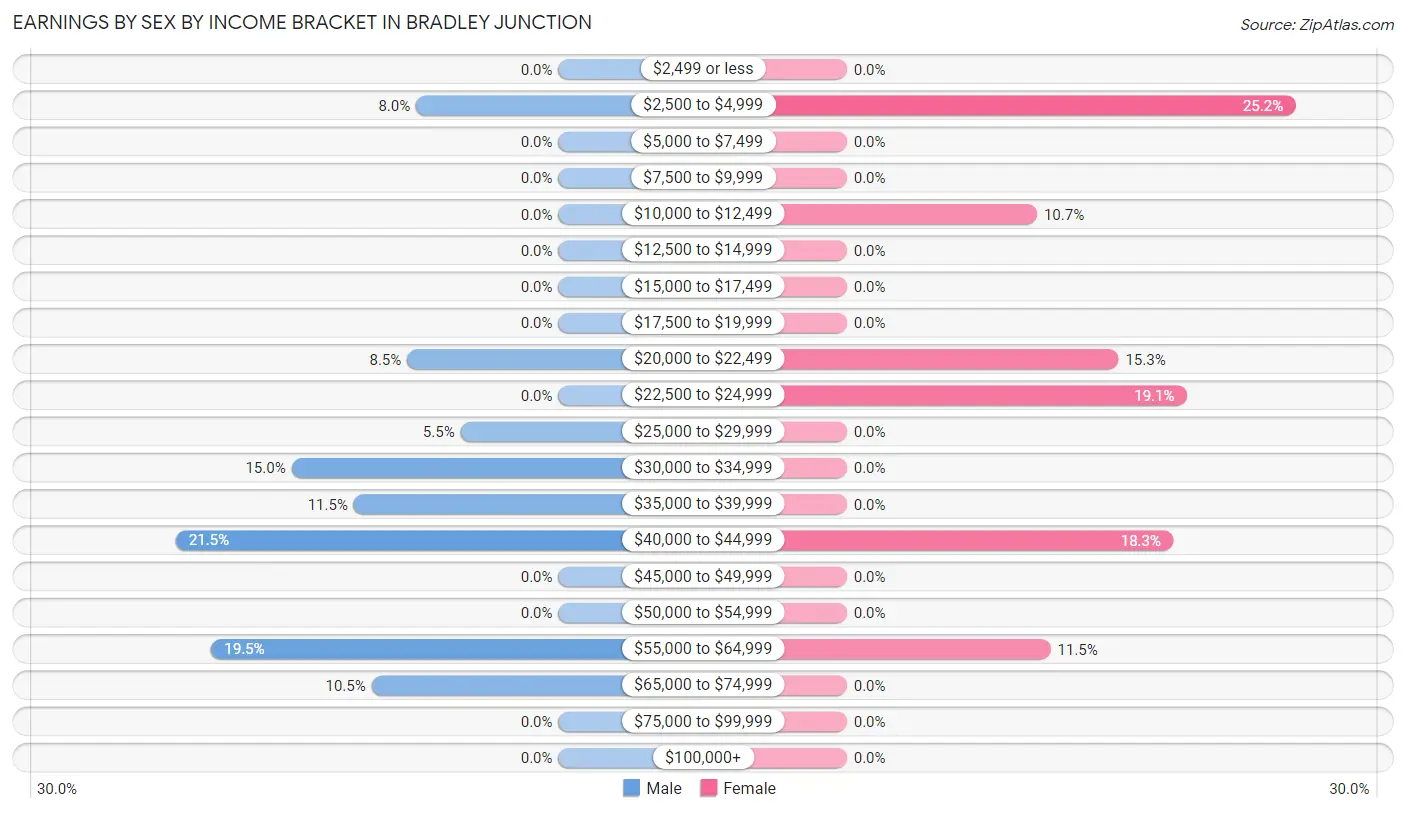
Earnings by Sex by Income Bracket in Bradley Junction
The most common earnings brackets in Bradley Junction are $40,000 to $44,999 for men (43 | 21.5%) and $2,500 to $4,999 for women (33 | 25.2%).
| Income | Male | Female |
| $2,499 or less | 0 (0.0%) | 0 (0.0%) |
| $2,500 to $4,999 | 16 (8.0%) | 33 (25.2%) |
| $5,000 to $7,499 | 0 (0.0%) | 0 (0.0%) |
| $7,500 to $9,999 | 0 (0.0%) | 0 (0.0%) |
| $10,000 to $12,499 | 0 (0.0%) | 14 (10.7%) |
| $12,500 to $14,999 | 0 (0.0%) | 0 (0.0%) |
| $15,000 to $17,499 | 0 (0.0%) | 0 (0.0%) |
| $17,500 to $19,999 | 0 (0.0%) | 0 (0.0%) |
| $20,000 to $22,499 | 17 (8.5%) | 20 (15.3%) |
| $22,500 to $24,999 | 0 (0.0%) | 25 (19.1%) |
| $25,000 to $29,999 | 11 (5.5%) | 0 (0.0%) |
| $30,000 to $34,999 | 30 (15.0%) | 0 (0.0%) |
| $35,000 to $39,999 | 23 (11.5%) | 0 (0.0%) |
| $40,000 to $44,999 | 43 (21.5%) | 24 (18.3%) |
| $45,000 to $49,999 | 0 (0.0%) | 0 (0.0%) |
| $50,000 to $54,999 | 0 (0.0%) | 0 (0.0%) |
| $55,000 to $64,999 | 39 (19.5%) | 15 (11.5%) |
| $65,000 to $74,999 | 21 (10.5%) | 0 (0.0%) |
| $75,000 to $99,999 | 0 (0.0%) | 0 (0.0%) |
| $100,000+ | 0 (0.0%) | 0 (0.0%) |
| Total | 200 (100.0%) | 131 (100.0%) |
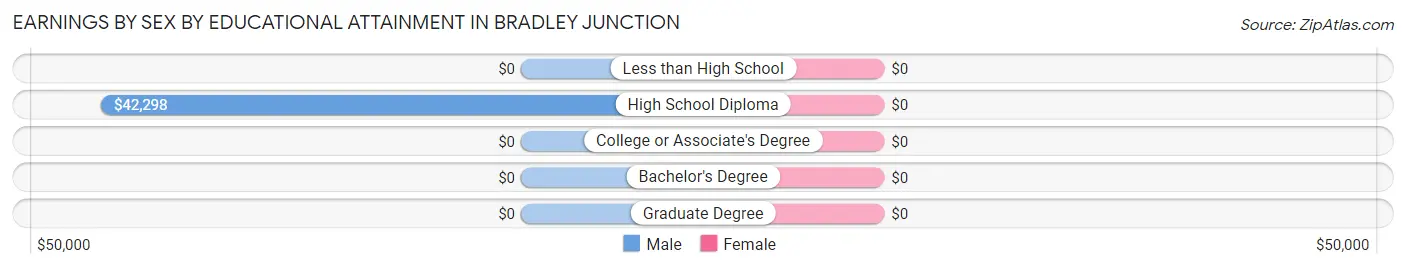
Earnings by Sex by Educational Attainment in Bradley Junction
| Educational Attainment | Male Income | Female Income |
| Less than High School | - | - |
| High School Diploma | $42,298 | $0 |
| College or Associate's Degree | - | - |
| Bachelor's Degree | - | - |
| Graduate Degree | - | - |
| Total | $41,512 | $23,050 |
Family Income in Bradley Junction
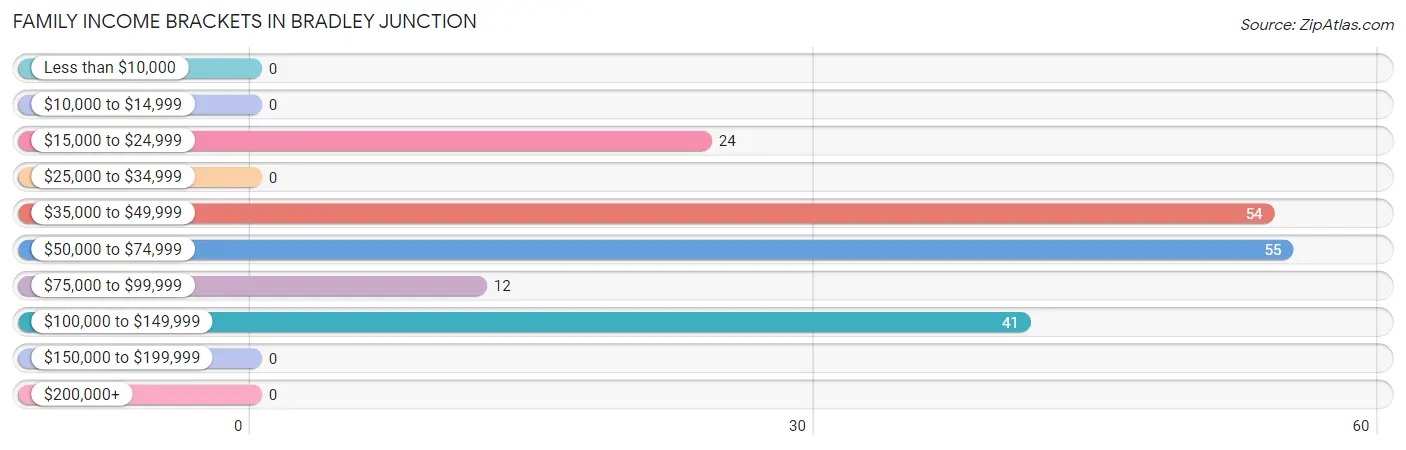
Family Income Brackets in Bradley Junction
According to the Bradley Junction family income data, there are 55 families falling into the $50,000 to $74,999 income range, which is the most common income bracket and makes up 29.6% of all families.
| Income Bracket | # Families | % Families |
| Less than $10,000 | 0 | 0.0% |
| $10,000 to $14,999 | 0 | 0.0% |
| $15,000 to $24,999 | 24 | 12.9% |
| $25,000 to $34,999 | 0 | 0.0% |
| $35,000 to $49,999 | 54 | 29.0% |
| $50,000 to $74,999 | 55 | 29.6% |
| $75,000 to $99,999 | 12 | 6.5% |
| $100,000 to $149,999 | 41 | 22.0% |
| $150,000 to $199,999 | 0 | 0.0% |
| $200,000+ | 0 | 0.0% |
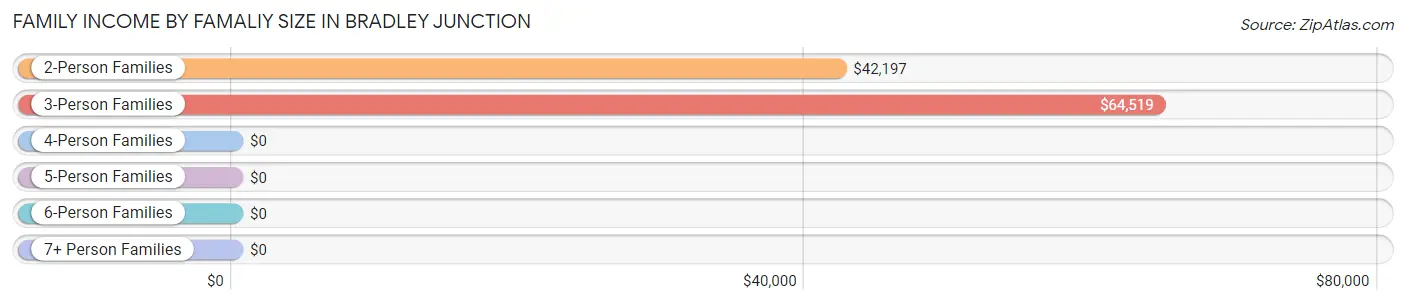
Family Income by Famaliy Size in Bradley Junction
3-person families (49 | 26.3%) account for the highest median family income in Bradley Junction with $64,519 per family, while 3-person families (49 | 26.3%) have the highest median income of $21,506 per family member.
| Income Bracket | # Families | Median Income |
| 2-Person Families | 106 (57.0%) | $42,197 |
| 3-Person Families | 49 (26.3%) | $64,519 |
| 4-Person Families | 6 (3.2%) | $0 |
| 5-Person Families | 0 (0.0%) | $0 |
| 6-Person Families | 12 (6.5%) | $0 |
| 7+ Person Families | 13 (7.0%) | $0 |
| Total | 186 (100.0%) | $54,107 |
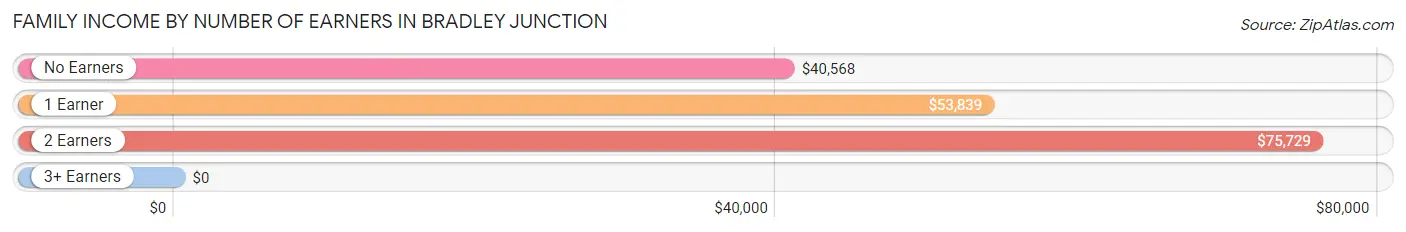
Family Income by Number of Earners in Bradley Junction
| Number of Earners | # Families | Median Income |
| No Earners | 53 (28.5%) | $40,568 |
| 1 Earner | 59 (31.7%) | $53,839 |
| 2 Earners | 49 (26.3%) | $75,729 |
| 3+ Earners | 25 (13.4%) | $0 |
| Total | 186 (100.0%) | $54,107 |
Household Income in Bradley Junction
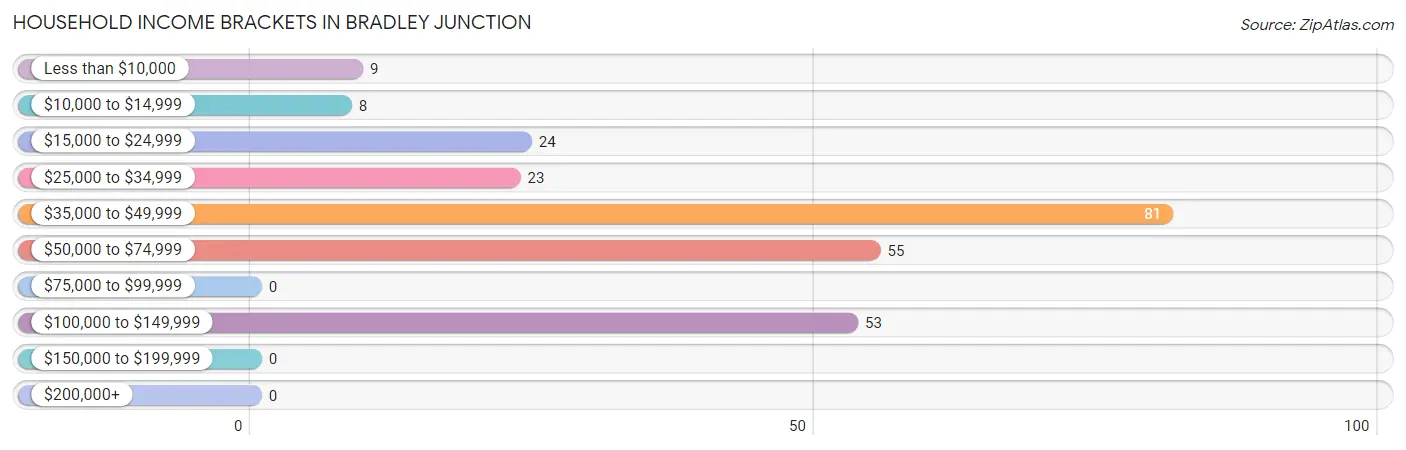
Household Income Brackets in Bradley Junction
With 81 households falling in the category, the $35,000 to $49,999 income range is the most frequent in Bradley Junction, accounting for 32.0% of all households.
| Income Bracket | # Households | % Households |
| Less than $10,000 | 9 | 3.6% |
| $10,000 to $14,999 | 8 | 3.2% |
| $15,000 to $24,999 | 24 | 9.5% |
| $25,000 to $34,999 | 23 | 9.1% |
| $35,000 to $49,999 | 81 | 32.0% |
| $50,000 to $74,999 | 55 | 21.7% |
| $75,000 to $99,999 | 0 | 0.0% |
| $100,000 to $149,999 | 53 | 20.9% |
| $150,000 to $199,999 | 0 | 0.0% |
| $200,000+ | 0 | 0.0% |
Household Income by Householder Age in Bradley Junction
The median household income in Bradley Junction is $43,679, with the highest median household income of $108,646 found in the 25 to 44 years age bracket for the primary householder. A total of 37 households (14.6%) fall into this category.
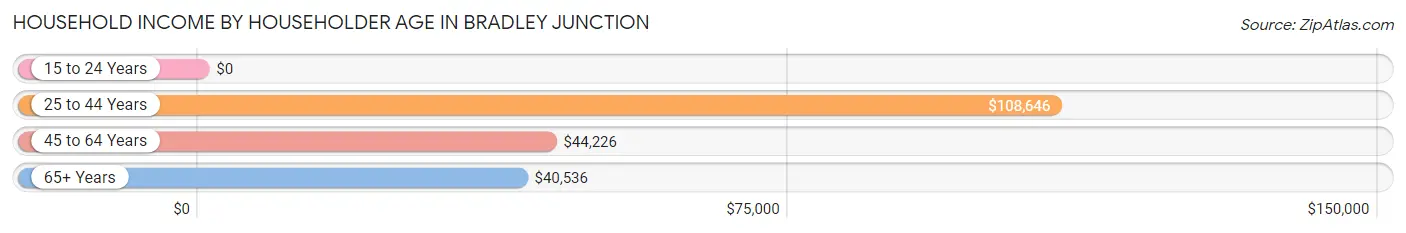
| Income Bracket | # Households | Median Income |
| 15 to 24 Years | 0 (0.0%) | $0 |
| 25 to 44 Years | 37 (14.6%) | $108,646 |
| 45 to 64 Years | 119 (47.0%) | $44,226 |
| 65+ Years | 97 (38.3%) | $40,536 |
| Total | 253 (100.0%) | $43,679 |
Poverty in Bradley Junction
Income Below Poverty by Sex and Age in Bradley Junction
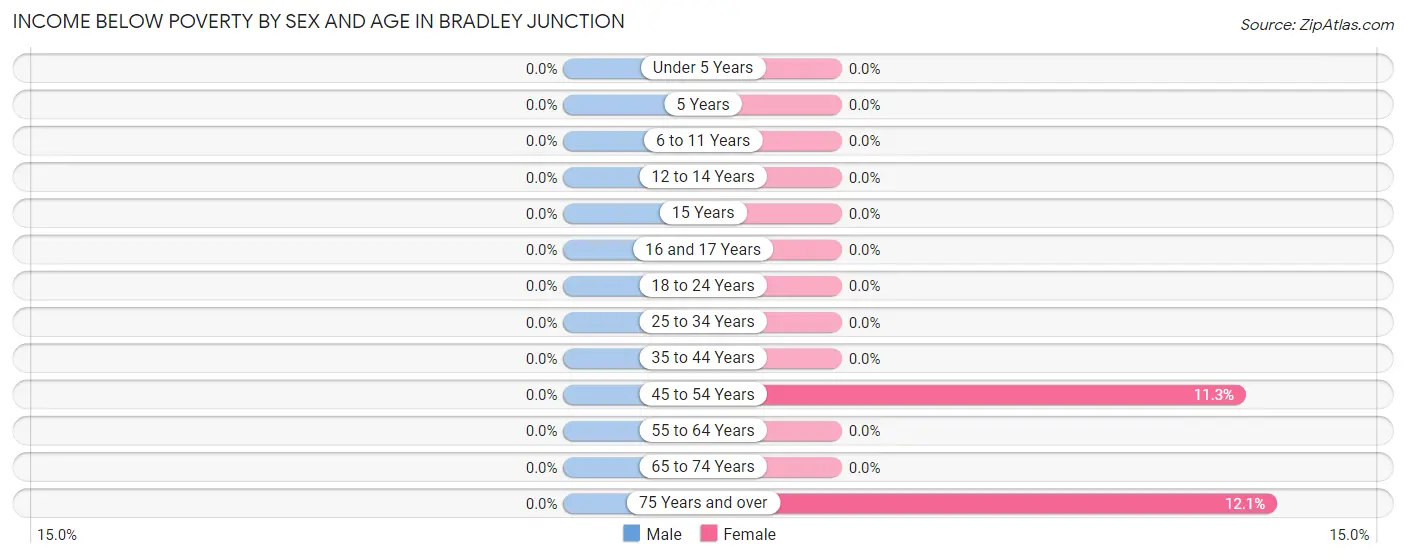
| Age Bracket | Male | Female |
| Under 5 Years | 0 (0.0%) | 0 (0.0%) |
| 5 Years | 0 (0.0%) | 0 (0.0%) |
| 6 to 11 Years | 0 (0.0%) | 0 (0.0%) |
| 12 to 14 Years | 0 (0.0%) | 0 (0.0%) |
| 15 Years | 0 (0.0%) | 0 (0.0%) |
| 16 and 17 Years | 0 (0.0%) | 0 (0.0%) |
| 18 to 24 Years | 0 (0.0%) | 0 (0.0%) |
| 25 to 34 Years | 0 (0.0%) | 0 (0.0%) |
| 35 to 44 Years | 0 (0.0%) | 0 (0.0%) |
| 45 to 54 Years | 0 (0.0%) | 9 (11.3%) |
| 55 to 64 Years | 0 (0.0%) | 0 (0.0%) |
| 65 to 74 Years | 0 (0.0%) | 0 (0.0%) |
| 75 Years and over | 0 (0.0%) | 8 (12.1%) |
| Total | 0 (0.0%) | 17 (5.1%) |
Income Above Poverty by Sex and Age in Bradley Junction
According to the poverty statistics in Bradley Junction, males aged under 5 years and females aged 5 years are the age groups that are most secure financially, with 100.0% of males and 100.0% of females in these age groups living above the poverty line.
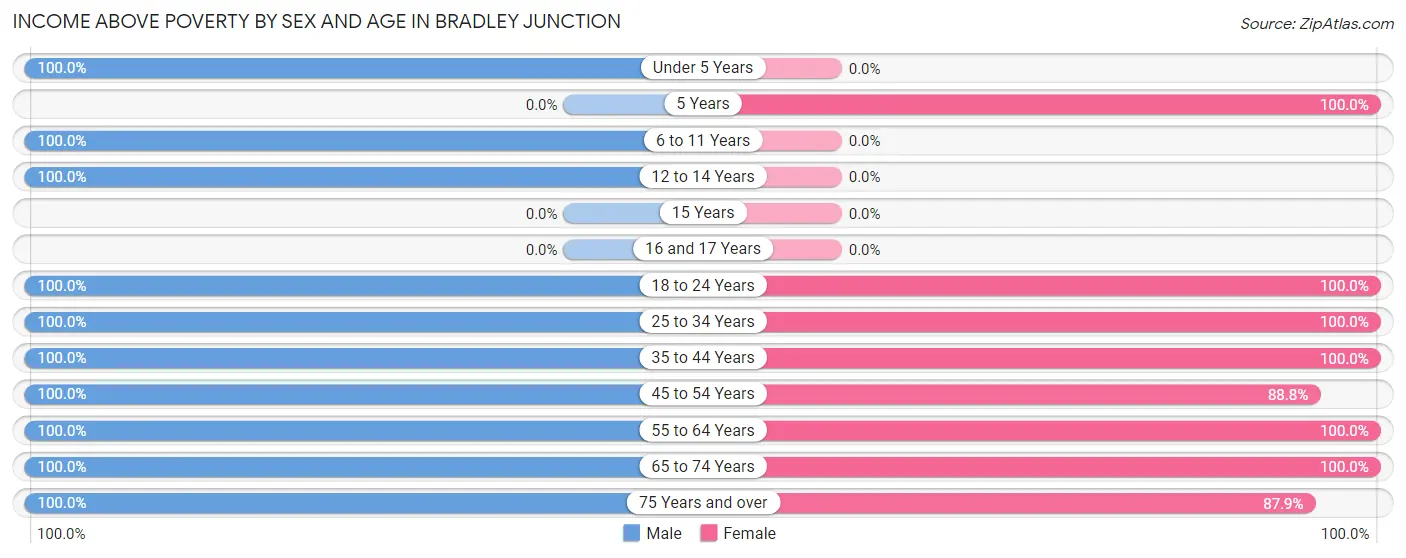
| Age Bracket | Male | Female |
| Under 5 Years | 16 (100.0%) | 0 (0.0%) |
| 5 Years | 0 (0.0%) | 13 (100.0%) |
| 6 to 11 Years | 34 (100.0%) | 0 (0.0%) |
| 12 to 14 Years | 19 (100.0%) | 0 (0.0%) |
| 15 Years | 0 (0.0%) | 0 (0.0%) |
| 16 and 17 Years | 0 (0.0%) | 0 (0.0%) |
| 18 to 24 Years | 61 (100.0%) | 14 (100.0%) |
| 25 to 34 Years | 41 (100.0%) | 24 (100.0%) |
| 35 to 44 Years | 40 (100.0%) | 29 (100.0%) |
| 45 to 54 Years | 34 (100.0%) | 71 (88.7%) |
| 55 to 64 Years | 80 (100.0%) | 56 (100.0%) |
| 65 to 74 Years | 37 (100.0%) | 53 (100.0%) |
| 75 Years and over | 39 (100.0%) | 58 (87.9%) |
| Total | 401 (100.0%) | 318 (94.9%) |
Income Below Poverty Among Married-Couple Families in Bradley Junction
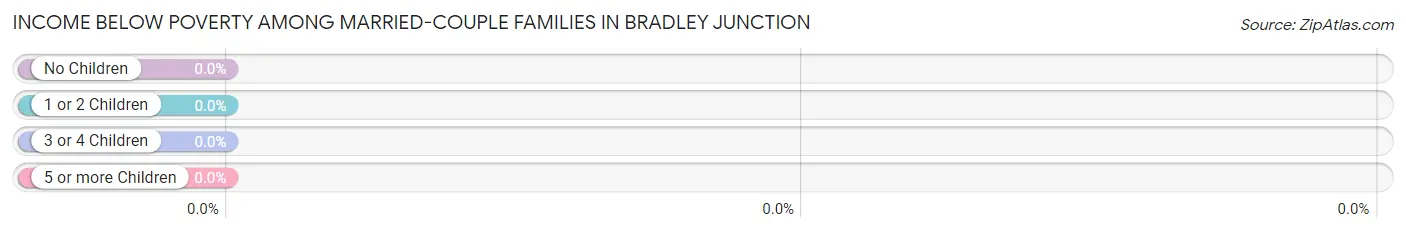
| Children | Above Poverty | Below Poverty |
| No Children | 106 (100.0%) | 0 (0.0%) |
| 1 or 2 Children | 13 (100.0%) | 0 (0.0%) |
| 3 or 4 Children | 13 (100.0%) | 0 (0.0%) |
| 5 or more Children | 0 (0.0%) | 0 (0.0%) |
| Total | 132 (100.0%) | 0 (0.0%) |
Income Below Poverty Among Single-Parent Households in Bradley Junction
| Children | Single Father | Single Mother |
| No Children | 0 (0.0%) | 0 (0.0%) |
| 1 or 2 Children | 0 (0.0%) | 0 (0.0%) |
| 3 or 4 Children | 0 (0.0%) | 0 (0.0%) |
| 5 or more Children | 0 (0.0%) | 0 (0.0%) |
| Total | 0 (0.0%) | 0 (0.0%) |
Income Below Poverty Among Married-Couple vs Single-Parent Households in Bradley Junction
| Children | Married-Couple Families | Single-Parent Households |
| No Children | 0 (0.0%) | 0 (0.0%) |
| 1 or 2 Children | 0 (0.0%) | 0 (0.0%) |
| 3 or 4 Children | 0 (0.0%) | 0 (0.0%) |
| 5 or more Children | 0 (0.0%) | 0 (0.0%) |
| Total | 0 (0.0%) | 0 (0.0%) |
Race in Bradley Junction
The most populous races in Bradley Junction are Black / African American (259 | 34.9%), White / Caucasian (237 | 31.9%), and Hispanic or Latino (205 | 27.6%).
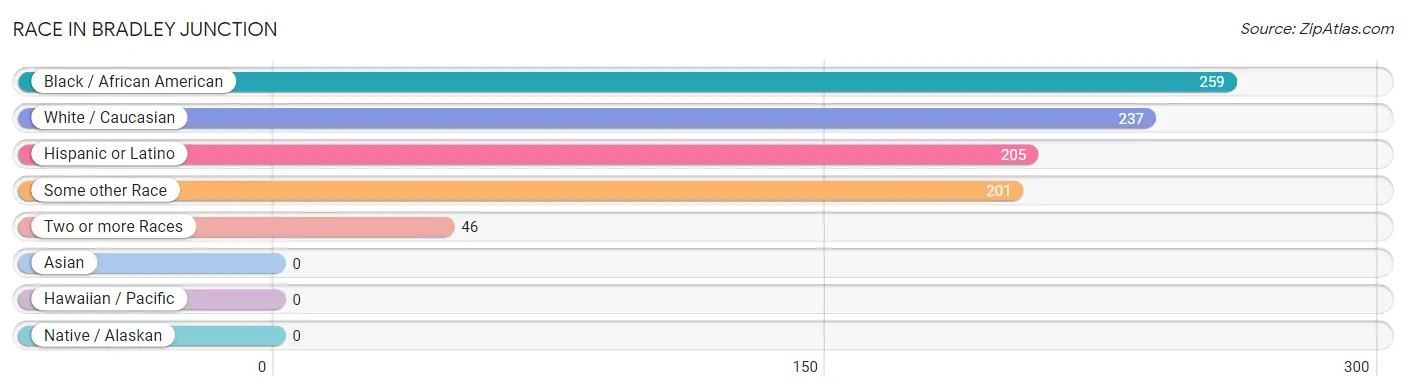
| Race | # Population | % Population |
| Asian | 0 | 0.0% |
| Black / African American | 259 | 34.9% |
| Hawaiian / Pacific | 0 | 0.0% |
| Hispanic or Latino | 205 | 27.6% |
| Native / Alaskan | 0 | 0.0% |
| White / Caucasian | 237 | 31.9% |
| Two or more Races | 46 | 6.2% |
| Some other Race | 201 | 27.1% |
| Total | 743 | 100.0% |
Ancestry in Bradley Junction
The most populous ancestries reported in Bradley Junction are Mexican (180 | 24.2%), American (121 | 16.3%), German (80 | 10.8%), African (43 | 5.8%), and Subsaharan African (43 | 5.8%), together accounting for 62.9% of all Bradley Junction residents.
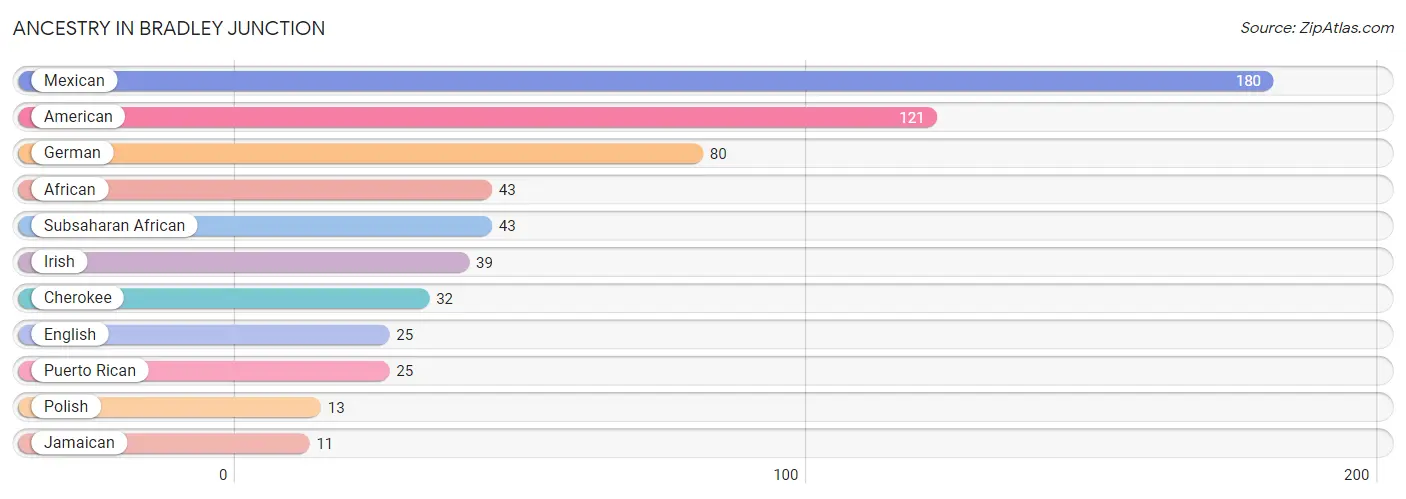
| Ancestry | # Population | % Population |
| African | 43 | 5.8% |
| American | 121 | 16.3% |
| Cherokee | 32 | 4.3% |
| English | 25 | 3.4% |
| German | 80 | 10.8% |
| Irish | 39 | 5.2% |
| Jamaican | 11 | 1.5% |
| Mexican | 180 | 24.2% |
| Polish | 13 | 1.8% |
| Puerto Rican | 25 | 3.4% |
| Subsaharan African | 43 | 5.8% | View All 11 Rows |
Immigrants in Bradley Junction
The most numerous immigrant groups reported in Bradley Junction came from Latin America (66 | 8.9%), Central America (55 | 7.4%), Mexico (55 | 7.4%), Caribbean (11 | 1.5%), and Jamaica (11 | 1.5%), together accounting for 26.6% of all Bradley Junction residents.
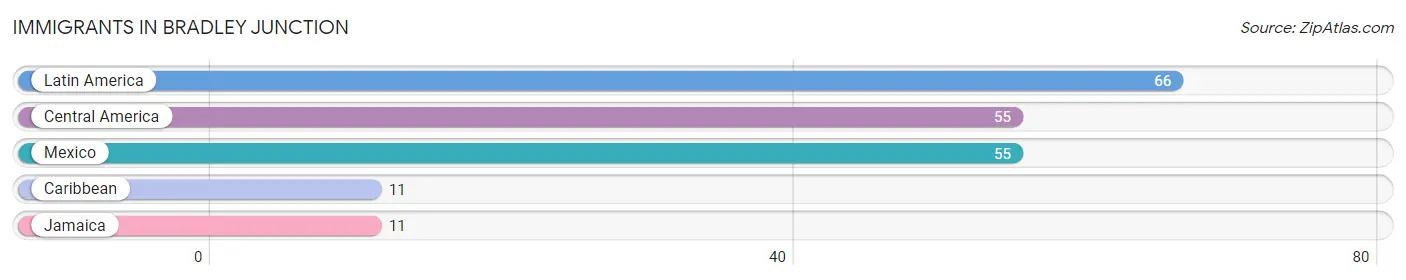
| Immigration Origin | # Population | % Population |
| Caribbean | 11 | 1.5% |
| Central America | 55 | 7.4% |
| Jamaica | 11 | 1.5% |
| Latin America | 66 | 8.9% |
| Mexico | 55 | 7.4% | View All 5 Rows |
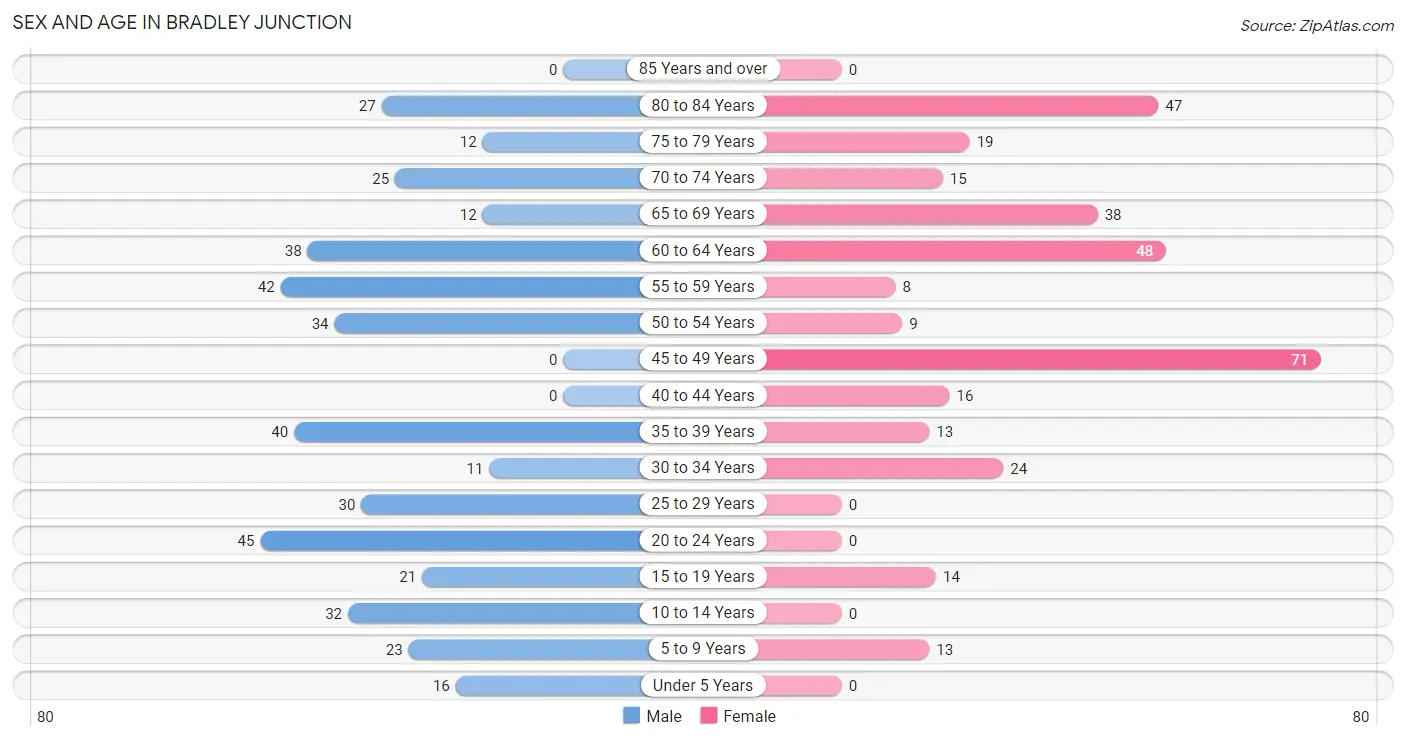
Sex and Age in Bradley Junction
Sex and Age in Bradley Junction
The most populous age groups in Bradley Junction are 20 to 24 Years (45 | 11.0%) for men and 45 to 49 Years (71 | 21.2%) for women.
| Age Bracket | Male | Female |
| Under 5 Years | 16 (3.9%) | 0 (0.0%) |
| 5 to 9 Years | 23 (5.6%) | 13 (3.9%) |
| 10 to 14 Years | 32 (7.8%) | 0 (0.0%) |
| 15 to 19 Years | 21 (5.1%) | 14 (4.2%) |
| 20 to 24 Years | 45 (11.0%) | 0 (0.0%) |
| 25 to 29 Years | 30 (7.3%) | 0 (0.0%) |
| 30 to 34 Years | 11 (2.7%) | 24 (7.2%) |
| 35 to 39 Years | 40 (9.8%) | 13 (3.9%) |
| 40 to 44 Years | 0 (0.0%) | 16 (4.8%) |
| 45 to 49 Years | 0 (0.0%) | 71 (21.2%) |
| 50 to 54 Years | 34 (8.3%) | 9 (2.7%) |
| 55 to 59 Years | 42 (10.3%) | 8 (2.4%) |
| 60 to 64 Years | 38 (9.3%) | 48 (14.3%) |
| 65 to 69 Years | 12 (2.9%) | 38 (11.3%) |
| 70 to 74 Years | 25 (6.1%) | 15 (4.5%) |
| 75 to 79 Years | 12 (2.9%) | 19 (5.7%) |
| 80 to 84 Years | 27 (6.6%) | 47 (14.0%) |
| 85 Years and over | 0 (0.0%) | 0 (0.0%) |
| Total | 408 (100.0%) | 335 (100.0%) |
Families and Households in Bradley Junction
Median Family Size in Bradley Junction
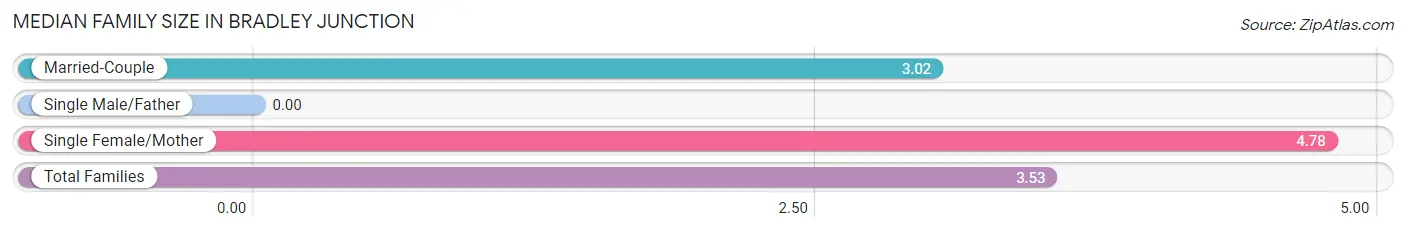
| Family Type | # Families | Family Size |
| Married-Couple | 132 (71.0%) | 3.02 |
| Single Male/Father | 0 (0.0%) | - |
| Single Female/Mother | 54 (29.0%) | 4.78 |
| Total Families | 186 (100.0%) | 3.53 |
Median Household Size in Bradley Junction
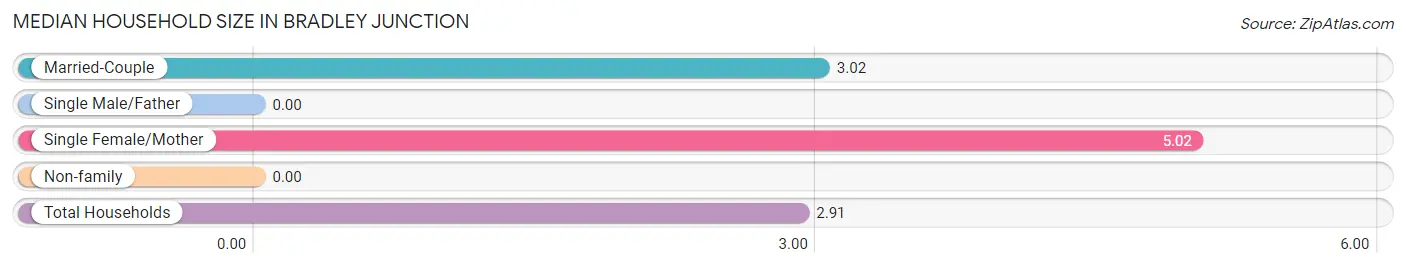
| Household Type | # Households | Household Size |
| Married-Couple | 132 (52.2%) | 3.02 |
| Single Male/Father | 0 (0.0%) | - |
| Single Female/Mother | 54 (21.3%) | 5.02 |
| Non-family | 67 (26.5%) | - |
| Total Households | 253 (100.0%) | 2.91 |
Household Size by Marriage Status in Bradley Junction
Out of a total of 253 households in Bradley Junction, 186 (73.5%) are family households, while 67 (26.5%) are nonfamily households. The most numerous type of family households are 2-person households, comprising 106, and the most common type of nonfamily households are 1-person households, comprising 67.
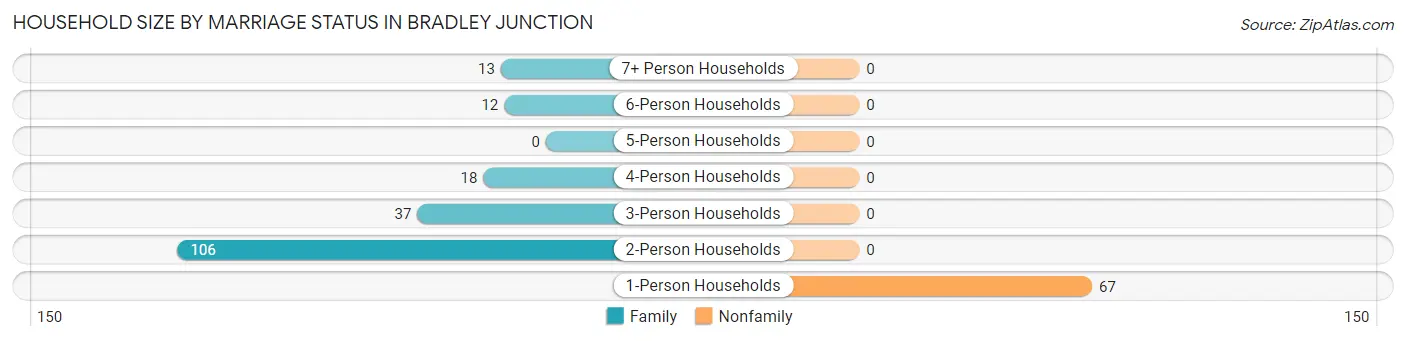
| Household Size | Family Households | Nonfamily Households |
| 1-Person Households | - | 67 (26.5%) |
| 2-Person Households | 106 (41.9%) | 0 (0.0%) |
| 3-Person Households | 37 (14.6%) | 0 (0.0%) |
| 4-Person Households | 18 (7.1%) | 0 (0.0%) |
| 5-Person Households | 0 (0.0%) | 0 (0.0%) |
| 6-Person Households | 12 (4.7%) | 0 (0.0%) |
| 7+ Person Households | 13 (5.1%) | 0 (0.0%) |
| Total | 186 (73.5%) | 67 (26.5%) |
Female Fertility in Bradley Junction
Fertility by Age in Bradley Junction
Average fertility rate in Bradley Junction is 177.0 births per 1,000 women. Women in the age bracket of 15 to 19 years have the highest fertility rate with 1,000.0 births per 1,000 women. Women in the age bracket of 15 to 19 years acount for 53.8% of all women with births.
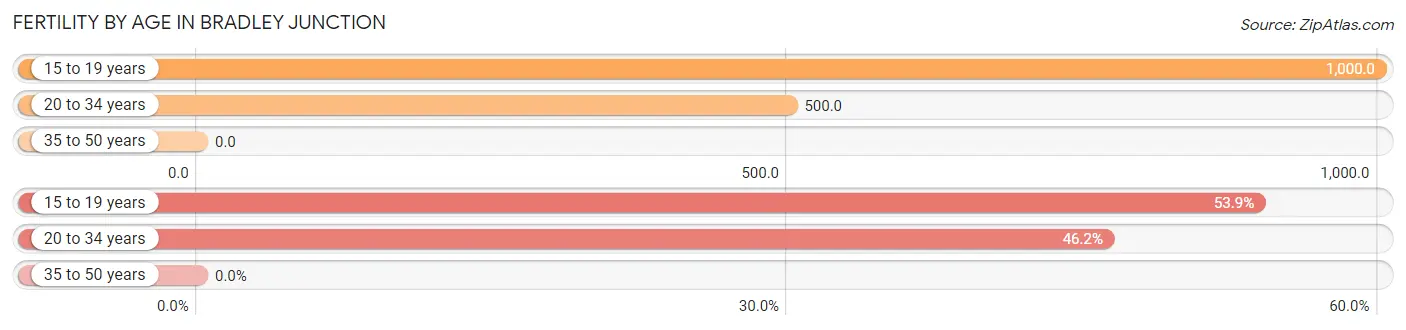
| Age Bracket | Women with Births | Births / 1,000 Women |
| 15 to 19 years | 14 (53.8%) | 1,000.0 |
| 20 to 34 years | 12 (46.2%) | 500.0 |
| 35 to 50 years | 0 (0.0%) | 0.0 |
| Total | 26 (100.0%) | 177.0 |
Fertility by Age by Marriage Status in Bradley Junction
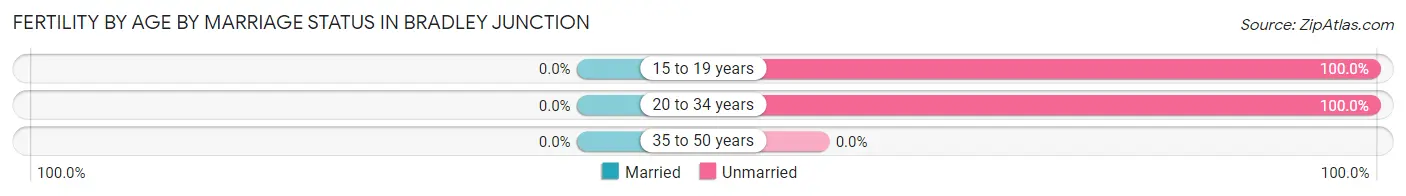
| Age Bracket | Married | Unmarried |
| 15 to 19 years | 0 (0.0%) | 14 (100.0%) |
| 20 to 34 years | 0 (0.0%) | 12 (100.0%) |
| 35 to 50 years | 0 (0.0%) | 0 (0.0%) |
| Total | 0 (0.0%) | 26 (100.0%) |
Fertility by Education in Bradley Junction
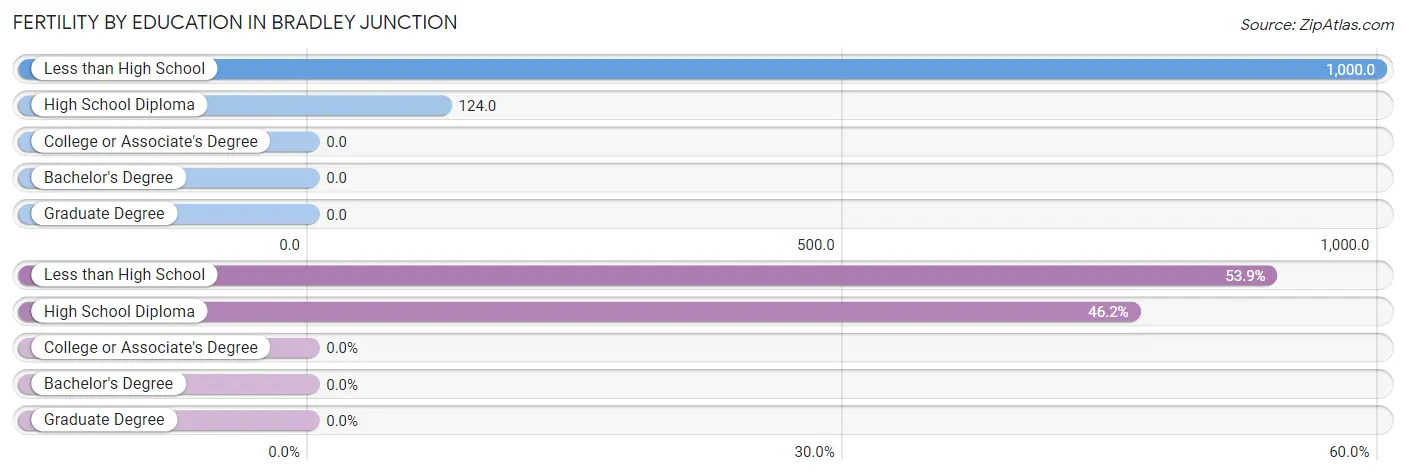
| Educational Attainment | Women with Births | Births / 1,000 Women |
| Less than High School | 14 (53.8%) | 1,000.0 |
| High School Diploma | 12 (46.2%) | 124.0 |
| College or Associate's Degree | 0 (0.0%) | 0.0 |
| Bachelor's Degree | 0 (0.0%) | 0.0 |
| Graduate Degree | 0 (0.0%) | 0.0 |
| Total | 26 (100.0%) | 177.0 |
Fertility by Education by Marriage Status in Bradley Junction
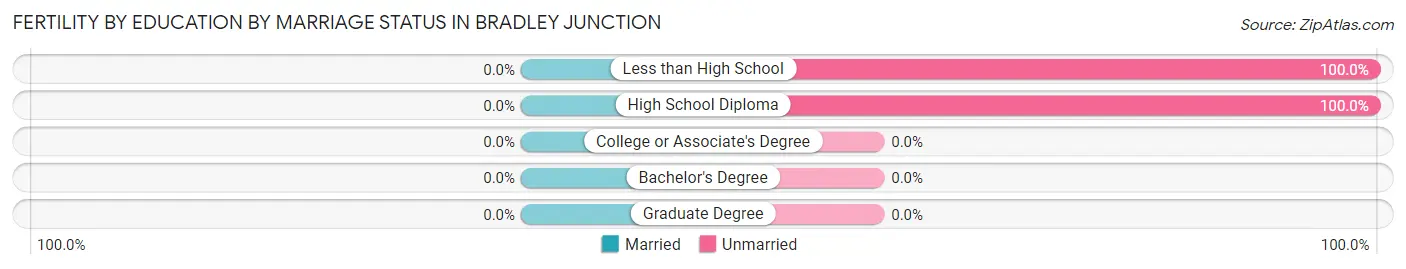
| Educational Attainment | Married | Unmarried |
| Less than High School | 0 (0.0%) | 14 (100.0%) |
| High School Diploma | 0 (0.0%) | 12 (100.0%) |
| College or Associate's Degree | 0 (0.0%) | 0 (0.0%) |
| Bachelor's Degree | 0 (0.0%) | 0 (0.0%) |
| Graduate Degree | 0 (0.0%) | 0 (0.0%) |
| Total | 0 (0.0%) | 26 (100.0%) |
Employment Characteristics in Bradley Junction
Employment by Class of Employer in Bradley Junction
Among the 320 employed individuals in Bradley Junction, private company employees (215 | 67.2%), self-employed (incorporated) (39 | 12.2%), and local government employees (25 | 7.8%) make up the most common classes of employment.
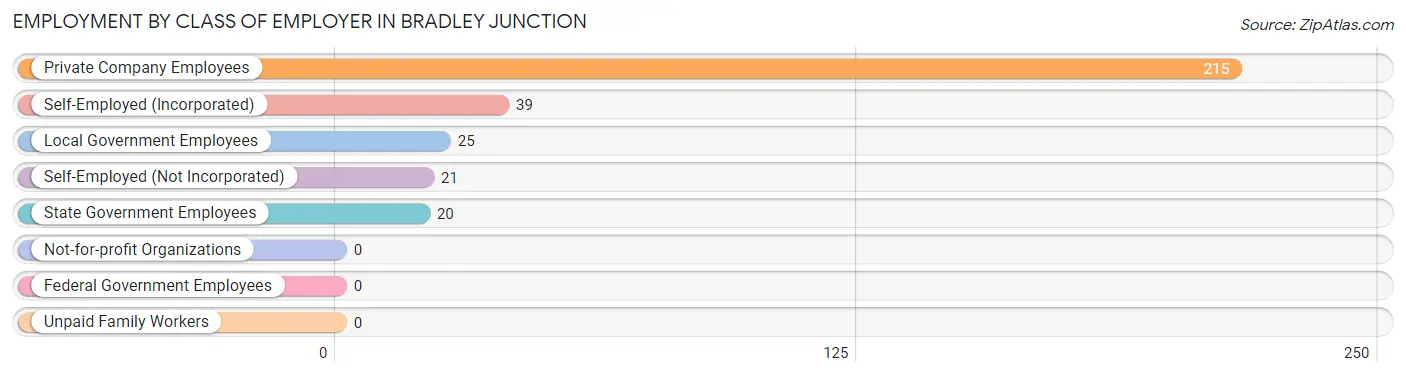
| Employer Class | # Employees | % Employees |
| Private Company Employees | 215 | 67.2% |
| Self-Employed (Incorporated) | 39 | 12.2% |
| Self-Employed (Not Incorporated) | 21 | 6.6% |
| Not-for-profit Organizations | 0 | 0.0% |
| Local Government Employees | 25 | 7.8% |
| State Government Employees | 20 | 6.2% |
| Federal Government Employees | 0 | 0.0% |
| Unpaid Family Workers | 0 | 0.0% |
| Total | 320 | 100.0% |
Employment Status by Age in Bradley Junction
According to the labor force statistics for Bradley Junction, out of the total population over 16 years of age (657), 51.0% or 335 individuals are in the labor force, with 4.5% or 15 of them unemployed. The age group with the highest labor force participation rate is 20 to 24 years, with 100.0% or 45 individuals in the labor force. Within the labor force, the 20 to 24 years age range has the highest percentage of unemployed individuals, with 33.3% or 15 of them being unemployed.
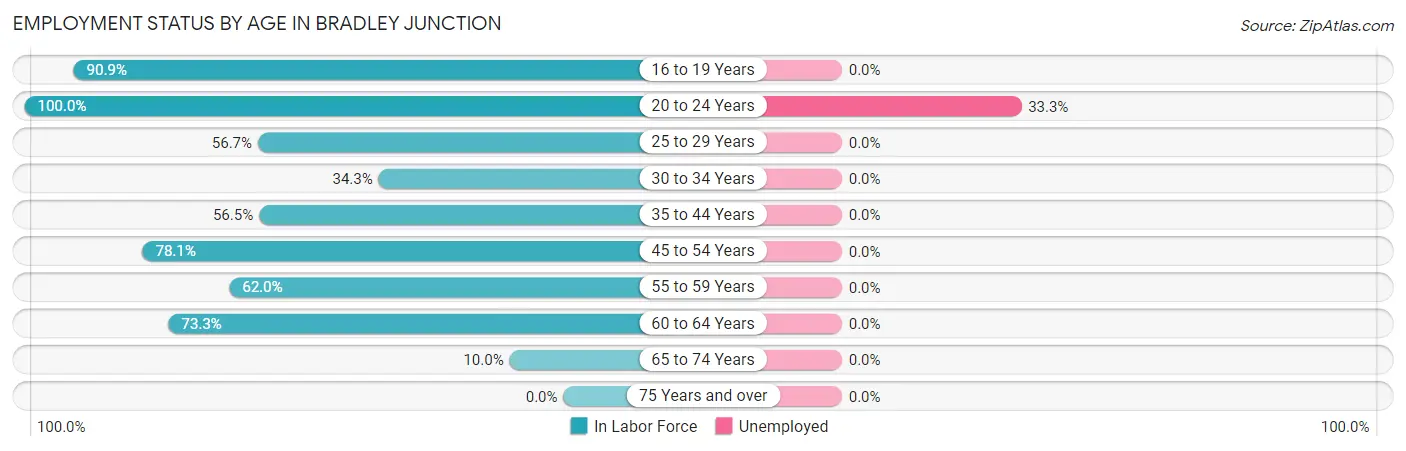
| Age Bracket | In Labor Force | Unemployed |
| 16 to 19 Years | 30 (90.9%) | 0 (0.0%) |
| 20 to 24 Years | 45 (100.0%) | 15 (33.3%) |
| 25 to 29 Years | 17 (56.7%) | 0 (0.0%) |
| 30 to 34 Years | 12 (34.3%) | 0 (0.0%) |
| 35 to 44 Years | 39 (56.5%) | 0 (0.0%) |
| 45 to 54 Years | 89 (78.1%) | 0 (0.0%) |
| 55 to 59 Years | 31 (62.0%) | 0 (0.0%) |
| 60 to 64 Years | 63 (73.3%) | 0 (0.0%) |
| 65 to 74 Years | 9 (10.0%) | 0 (0.0%) |
| 75 Years and over | 0 (0.0%) | 0 (0.0%) |
| Total | 335 (51.0%) | 15 (4.5%) |
Employment Status by Educational Attainment in Bradley Junction
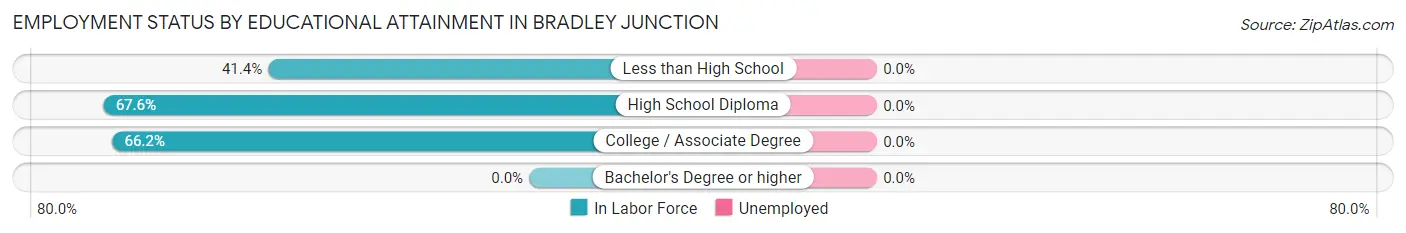
| Educational Attainment | In Labor Force | Unemployed |
| Less than High School | 12 (41.4%) | 0 (0.0%) |
| High School Diploma | 192 (67.6%) | 0 (0.0%) |
| College / Associate Degree | 47 (66.2%) | 0 (0.0%) |
| Bachelor's Degree or higher | 0 (0.0%) | 0 (0.0%) |
| Total | 251 (65.4%) | 0 (0.0%) |
Employment Occupations by Sex in Bradley Junction
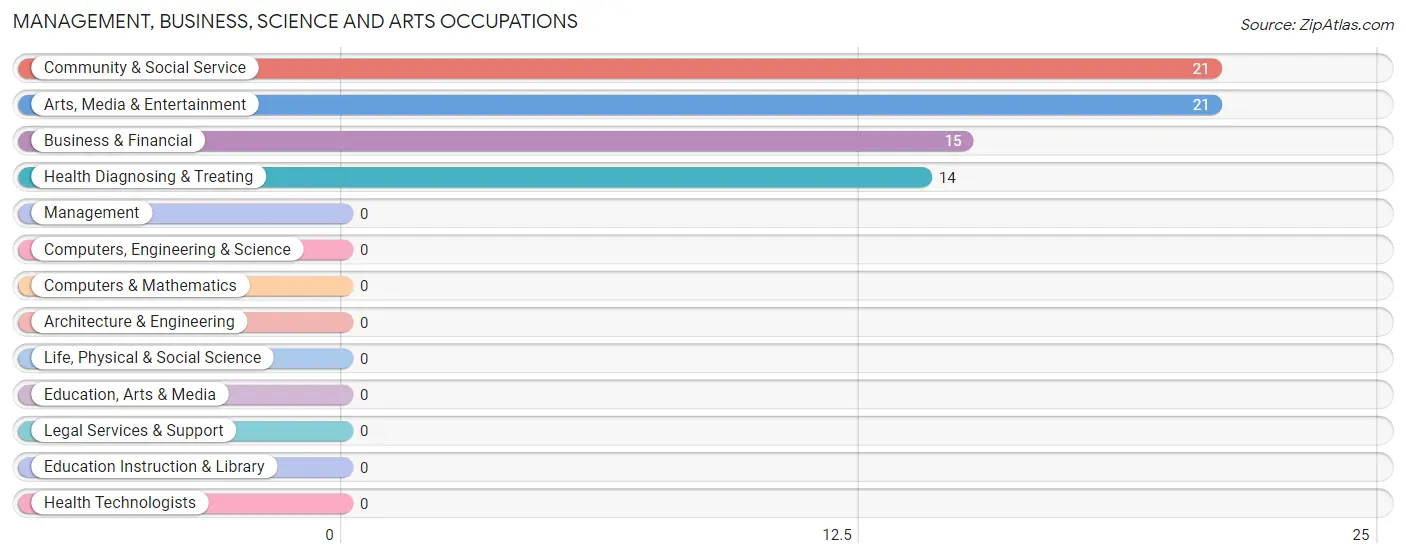
Management, Business, Science and Arts Occupations
The most common Management, Business, Science and Arts occupations in Bradley Junction are Community & Social Service (21 | 6.6%), Arts, Media & Entertainment (21 | 6.6%), Business & Financial (15 | 4.7%), and Health Diagnosing & Treating (14 | 4.4%).
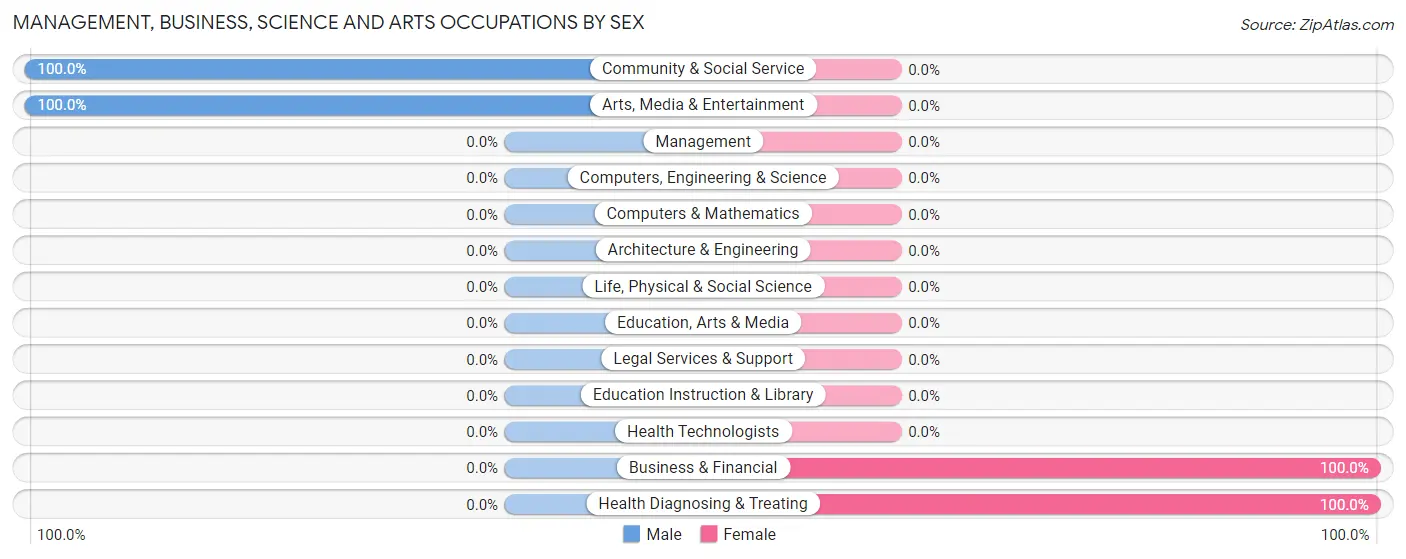
Management, Business, Science and Arts Occupations by Sex
Within the Management, Business, Science and Arts occupations in Bradley Junction, the most male-oriented occupations are Community & Social Service (100.0%), and Arts, Media & Entertainment (100.0%), while the most female-oriented occupations are Business & Financial (100.0%), and Health Diagnosing & Treating (100.0%).
| Occupation | Male | Female |
| Management | 0 (0.0%) | 0 (0.0%) |
| Business & Financial | 0 (0.0%) | 15 (100.0%) |
| Computers, Engineering & Science | 0 (0.0%) | 0 (0.0%) |
| Computers & Mathematics | 0 (0.0%) | 0 (0.0%) |
| Architecture & Engineering | 0 (0.0%) | 0 (0.0%) |
| Life, Physical & Social Science | 0 (0.0%) | 0 (0.0%) |
| Community & Social Service | 21 (100.0%) | 0 (0.0%) |
| Education, Arts & Media | 0 (0.0%) | 0 (0.0%) |
| Legal Services & Support | 0 (0.0%) | 0 (0.0%) |
| Education Instruction & Library | 0 (0.0%) | 0 (0.0%) |
| Arts, Media & Entertainment | 21 (100.0%) | 0 (0.0%) |
| Health Diagnosing & Treating | 0 (0.0%) | 14 (100.0%) |
| Health Technologists | 0 (0.0%) | 0 (0.0%) |
| Total (Category) | 21 (42.0%) | 29 (58.0%) |
| Total (Overall) | 189 (59.1%) | 131 (40.9%) |
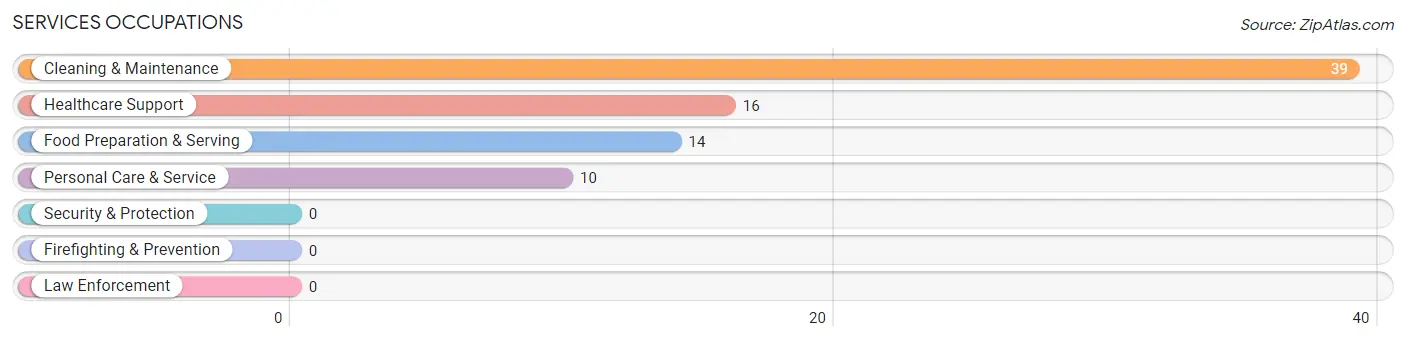
Services Occupations
The most common Services occupations in Bradley Junction are Cleaning & Maintenance (39 | 12.2%), Healthcare Support (16 | 5.0%), Food Preparation & Serving (14 | 4.4%), and Personal Care & Service (10 | 3.1%).
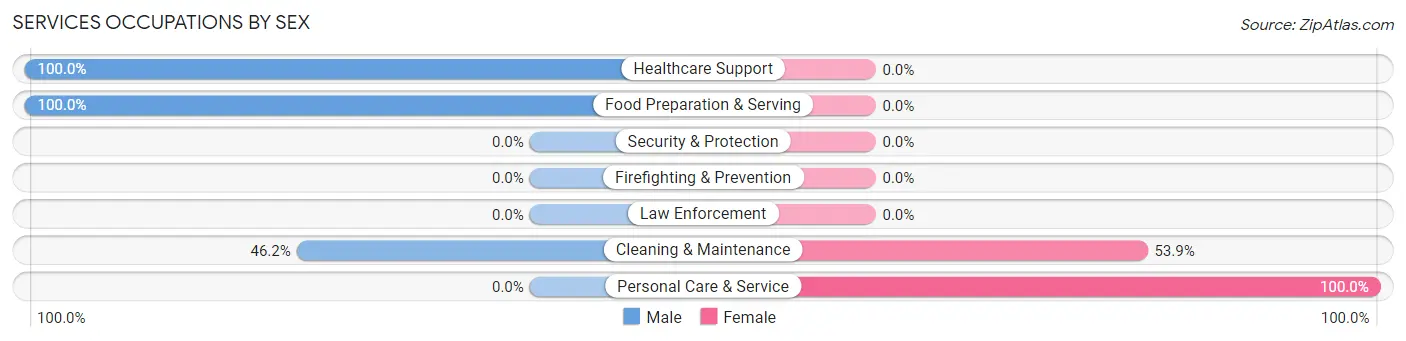
Services Occupations by Sex
Within the Services occupations in Bradley Junction, the most male-oriented occupations are Healthcare Support (100.0%), Food Preparation & Serving (100.0%), and Cleaning & Maintenance (46.2%), while the most female-oriented occupations are Personal Care & Service (100.0%), and Cleaning & Maintenance (53.8%).
| Occupation | Male | Female |
| Healthcare Support | 16 (100.0%) | 0 (0.0%) |
| Security & Protection | 0 (0.0%) | 0 (0.0%) |
| Firefighting & Prevention | 0 (0.0%) | 0 (0.0%) |
| Law Enforcement | 0 (0.0%) | 0 (0.0%) |
| Food Preparation & Serving | 14 (100.0%) | 0 (0.0%) |
| Cleaning & Maintenance | 18 (46.2%) | 21 (53.8%) |
| Personal Care & Service | 0 (0.0%) | 10 (100.0%) |
| Total (Category) | 48 (60.8%) | 31 (39.2%) |
| Total (Overall) | 189 (59.1%) | 131 (40.9%) |
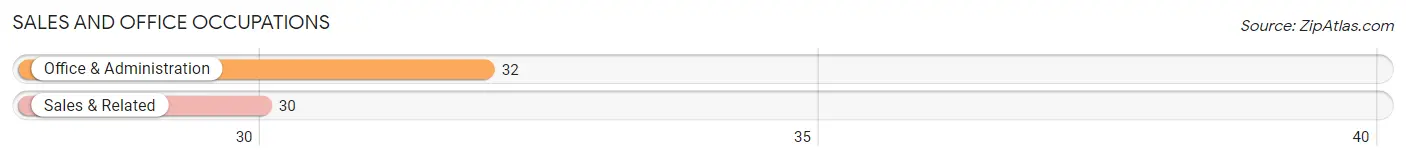
Sales and Office Occupations
The most common Sales and Office occupations in Bradley Junction are Office & Administration (32 | 10.0%), and Sales & Related (30 | 9.4%).
Sales and Office Occupations by Sex
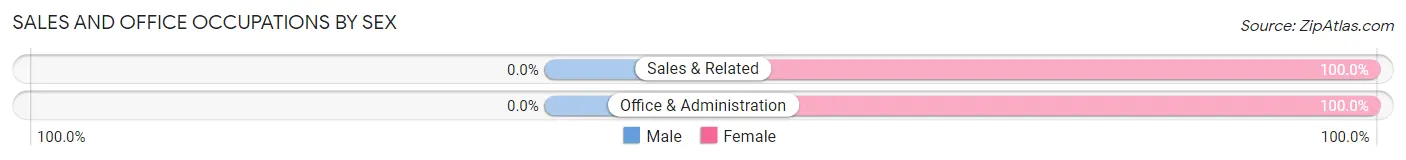
| Occupation | Male | Female |
| Sales & Related | 0 (0.0%) | 30 (100.0%) |
| Office & Administration | 0 (0.0%) | 32 (100.0%) |
| Total (Category) | 0 (0.0%) | 62 (100.0%) |
| Total (Overall) | 189 (59.1%) | 131 (40.9%) |
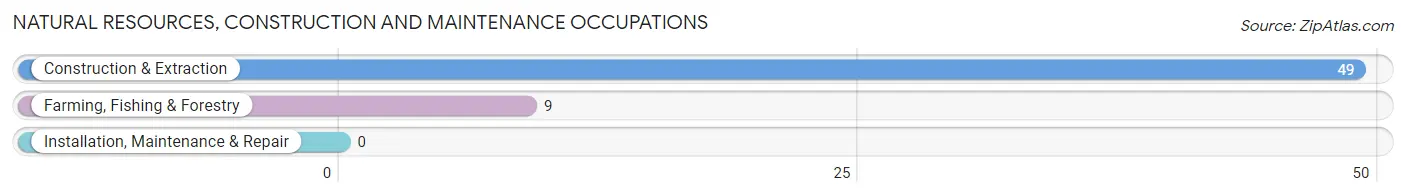
Natural Resources, Construction and Maintenance Occupations
The most common Natural Resources, Construction and Maintenance occupations in Bradley Junction are Construction & Extraction (49 | 15.3%), and Farming, Fishing & Forestry (9 | 2.8%).
Natural Resources, Construction and Maintenance Occupations by Sex
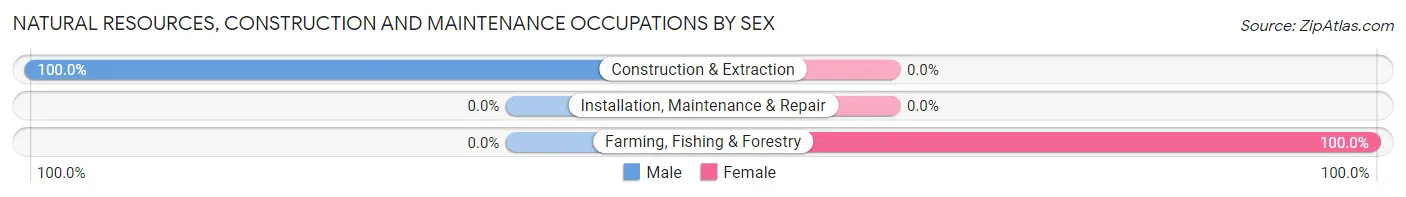
| Occupation | Male | Female |
| Farming, Fishing & Forestry | 0 (0.0%) | 9 (100.0%) |
| Construction & Extraction | 49 (100.0%) | 0 (0.0%) |
| Installation, Maintenance & Repair | 0 (0.0%) | 0 (0.0%) |
| Total (Category) | 49 (84.5%) | 9 (15.5%) |
| Total (Overall) | 189 (59.1%) | 131 (40.9%) |
Production, Transportation and Moving Occupations
The most common Production, Transportation and Moving occupations in Bradley Junction are Production (48 | 15.0%), and Material Moving (23 | 7.2%).
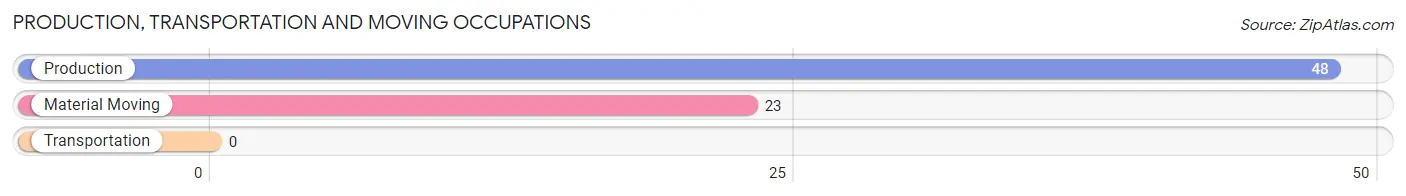
Production, Transportation and Moving Occupations by Sex
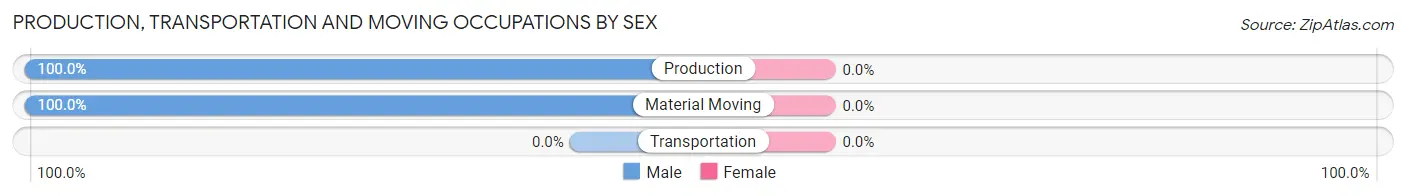
| Occupation | Male | Female |
| Production | 48 (100.0%) | 0 (0.0%) |
| Transportation | 0 (0.0%) | 0 (0.0%) |
| Material Moving | 23 (100.0%) | 0 (0.0%) |
| Total (Category) | 71 (100.0%) | 0 (0.0%) |
| Total (Overall) | 189 (59.1%) | 131 (40.9%) |
Employment Industries by Sex in Bradley Junction
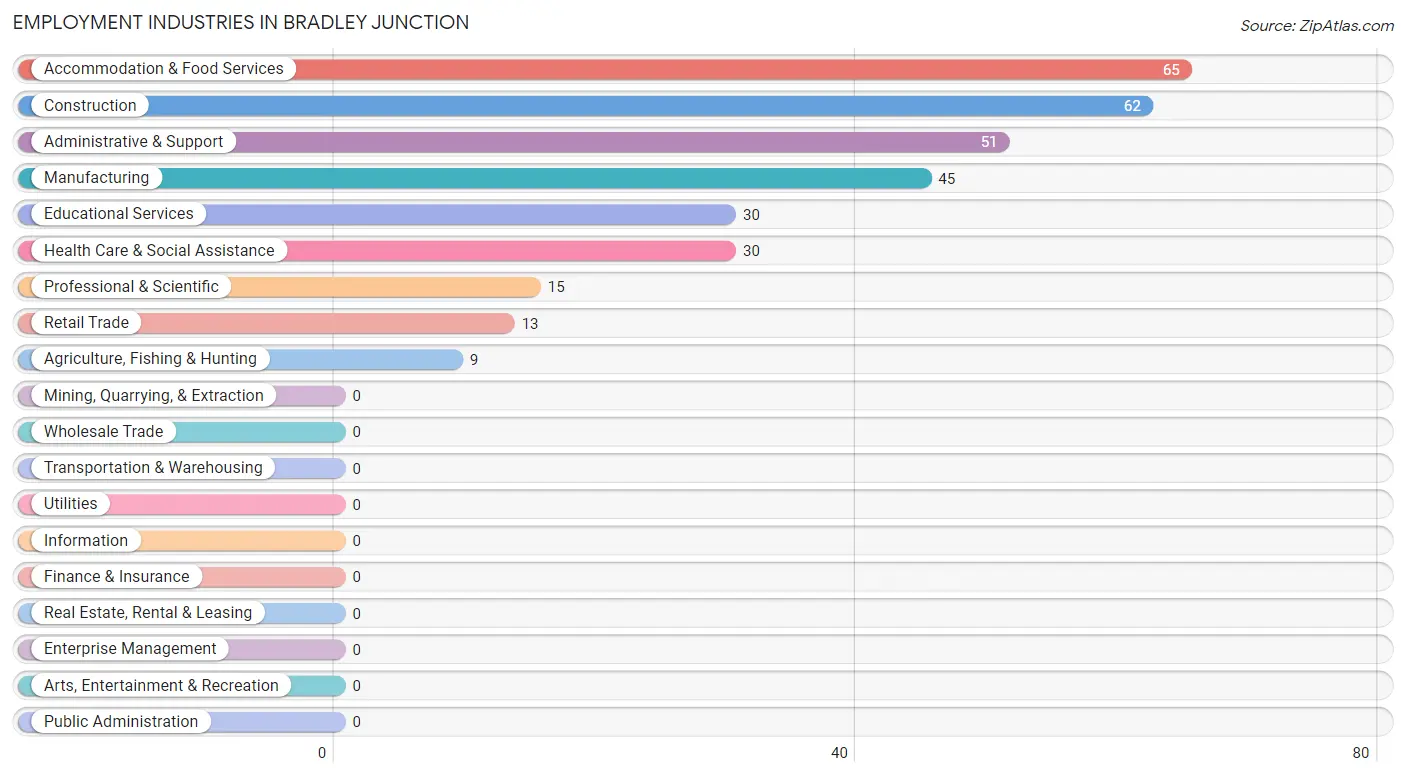
Employment Industries in Bradley Junction
The major employment industries in Bradley Junction include Accommodation & Food Services (65 | 20.3%), Construction (62 | 19.4%), Administrative & Support (51 | 15.9%), Manufacturing (45 | 14.1%), and Educational Services (30 | 9.4%).
Employment Industries by Sex in Bradley Junction
The Bradley Junction industries that see more men than women are Construction (100.0%), Manufacturing (100.0%), and Retail Trade (100.0%), whereas the industries that tend to have a higher number of women are Agriculture, Fishing & Hunting (100.0%), Professional & Scientific (100.0%), and Educational Services (100.0%).
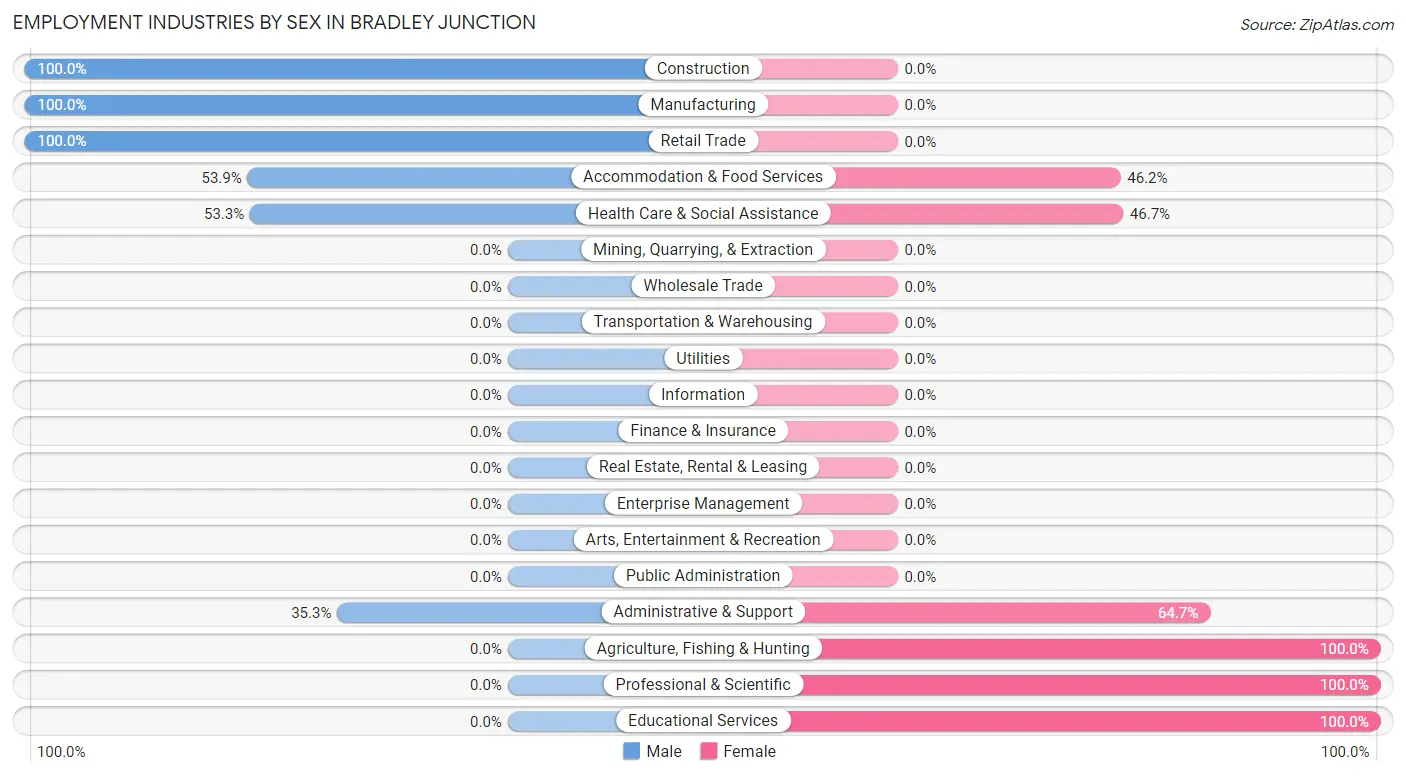
| Industry | Male | Female |
| Agriculture, Fishing & Hunting | 0 (0.0%) | 9 (100.0%) |
| Mining, Quarrying, & Extraction | 0 (0.0%) | 0 (0.0%) |
| Construction | 62 (100.0%) | 0 (0.0%) |
| Manufacturing | 45 (100.0%) | 0 (0.0%) |
| Wholesale Trade | 0 (0.0%) | 0 (0.0%) |
| Retail Trade | 13 (100.0%) | 0 (0.0%) |
| Transportation & Warehousing | 0 (0.0%) | 0 (0.0%) |
| Utilities | 0 (0.0%) | 0 (0.0%) |
| Information | 0 (0.0%) | 0 (0.0%) |
| Finance & Insurance | 0 (0.0%) | 0 (0.0%) |
| Real Estate, Rental & Leasing | 0 (0.0%) | 0 (0.0%) |
| Professional & Scientific | 0 (0.0%) | 15 (100.0%) |
| Enterprise Management | 0 (0.0%) | 0 (0.0%) |
| Administrative & Support | 18 (35.3%) | 33 (64.7%) |
| Educational Services | 0 (0.0%) | 30 (100.0%) |
| Health Care & Social Assistance | 16 (53.3%) | 14 (46.7%) |
| Arts, Entertainment & Recreation | 0 (0.0%) | 0 (0.0%) |
| Accommodation & Food Services | 35 (53.8%) | 30 (46.2%) |
| Public Administration | 0 (0.0%) | 0 (0.0%) |
| Total | 189 (59.1%) | 131 (40.9%) |
Education in Bradley Junction
School Enrollment in Bradley Junction
The most common levels of schooling among the 60 students in Bradley Junction are middle school (32 | 53.3%), kindergarten (13 | 21.7%), and elementary school (12 | 20.0%).
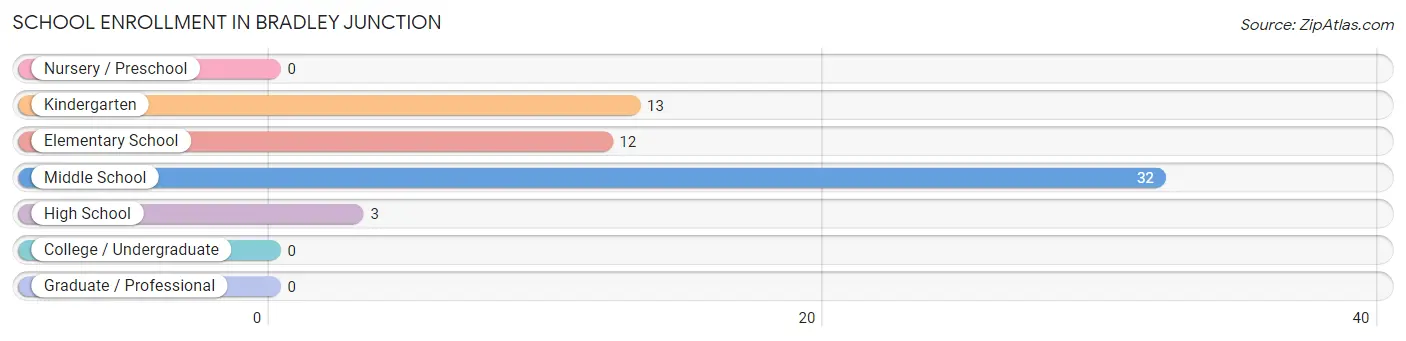
| School Level | # Students | % Students |
| Nursery / Preschool | 0 | 0.0% |
| Kindergarten | 13 | 21.7% |
| Elementary School | 12 | 20.0% |
| Middle School | 32 | 53.3% |
| High School | 3 | 5.0% |
| College / Undergraduate | 0 | 0.0% |
| Graduate / Professional | 0 | 0.0% |
| Total | 60 | 100.0% |
School Enrollment by Age by Funding Source in Bradley Junction
Out of a total of 60 students who are enrolled in schools in Bradley Junction, 19 (31.7%) attend a private institution, while the remaining 41 (68.3%) are enrolled in public schools. The age group of 10 to 14 year olds has the highest likelihood of being enrolled in private schools, with 19 (90.5% in the age bracket) enrolled. Conversely, the age group of 5 to 9 year old has the lowest likelihood of being enrolled in a private school, with 36 (100.0% in the age bracket) attending a public institution.
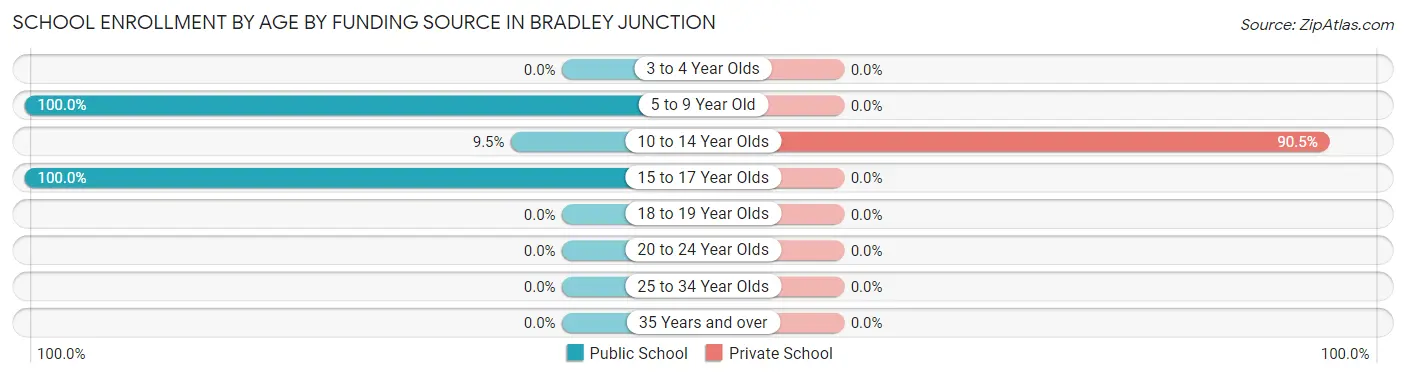
| Age Bracket | Public School | Private School |
| 3 to 4 Year Olds | 0 (0.0%) | 0 (0.0%) |
| 5 to 9 Year Old | 36 (100.0%) | 0 (0.0%) |
| 10 to 14 Year Olds | 2 (9.5%) | 19 (90.5%) |
| 15 to 17 Year Olds | 3 (100.0%) | 0 (0.0%) |
| 18 to 19 Year Olds | 0 (0.0%) | 0 (0.0%) |
| 20 to 24 Year Olds | 0 (0.0%) | 0 (0.0%) |
| 25 to 34 Year Olds | 0 (0.0%) | 0 (0.0%) |
| 35 Years and over | 0 (0.0%) | 0 (0.0%) |
| Total | 41 (68.3%) | 19 (31.7%) |
Educational Attainment by Field of Study in Bradley Junction
, and science & technology (6 | 100.0%) are the most common fields of study among 6 individuals in Bradley Junction who have obtained a bachelor's degree or higher.
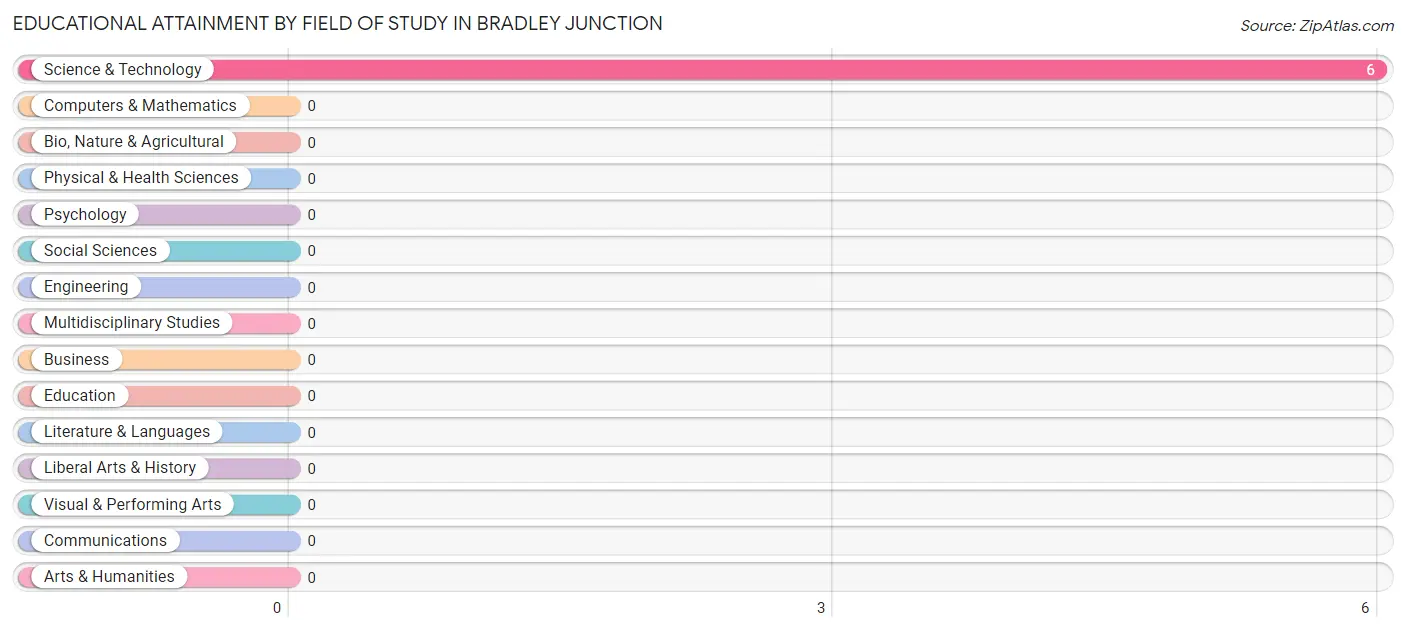
| Field of Study | # Graduates | % Graduates |
| Computers & Mathematics | 0 | 0.0% |
| Bio, Nature & Agricultural | 0 | 0.0% |
| Physical & Health Sciences | 0 | 0.0% |
| Psychology | 0 | 0.0% |
| Social Sciences | 0 | 0.0% |
| Engineering | 0 | 0.0% |
| Multidisciplinary Studies | 0 | 0.0% |
| Science & Technology | 6 | 100.0% |
| Business | 0 | 0.0% |
| Education | 0 | 0.0% |
| Literature & Languages | 0 | 0.0% |
| Liberal Arts & History | 0 | 0.0% |
| Visual & Performing Arts | 0 | 0.0% |
| Communications | 0 | 0.0% |
| Arts & Humanities | 0 | 0.0% |
| Total | 6 | 100.0% |
Transportation & Commute in Bradley Junction
Vehicle Availability by Sex in Bradley Junction
The most prevalent vehicle ownership categories in Bradley Junction are males with 4 vehicles (56, accounting for 29.6%) and females with 4 vehicles (23, making up 42.7%).
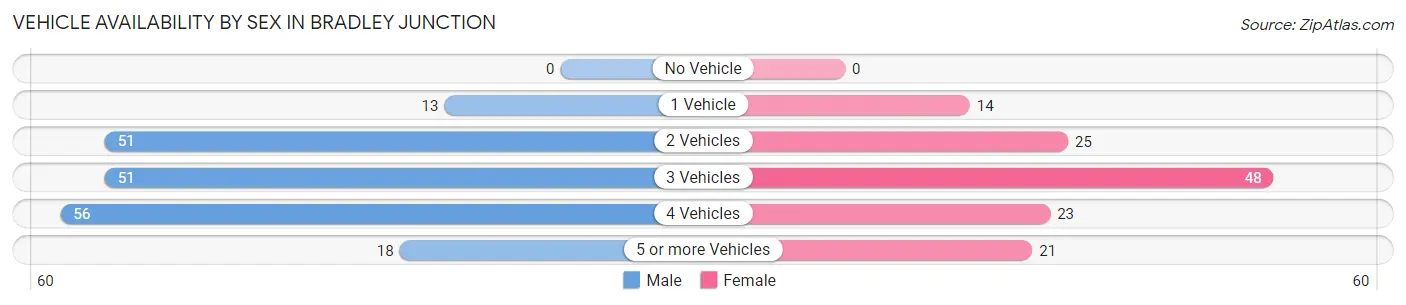
| Vehicles Available | Male | Female |
| No Vehicle | 0 (0.0%) | 0 (0.0%) |
| 1 Vehicle | 13 (6.9%) | 14 (10.7%) |
| 2 Vehicles | 51 (27.0%) | 25 (19.1%) |
| 3 Vehicles | 51 (27.0%) | 48 (36.6%) |
| 4 Vehicles | 56 (29.6%) | 23 (17.6%) |
| 5 or more Vehicles | 18 (9.5%) | 21 (16.0%) |
| Total | 189 (100.0%) | 131 (100.0%) |
Commute Time in Bradley Junction
The most frequently occuring commute durations in Bradley Junction are 20 to 24 minutes (75 commuters, 24.6%), 30 to 34 minutes (68 commuters, 22.3%), and 45 to 59 minutes (48 commuters, 15.7%).
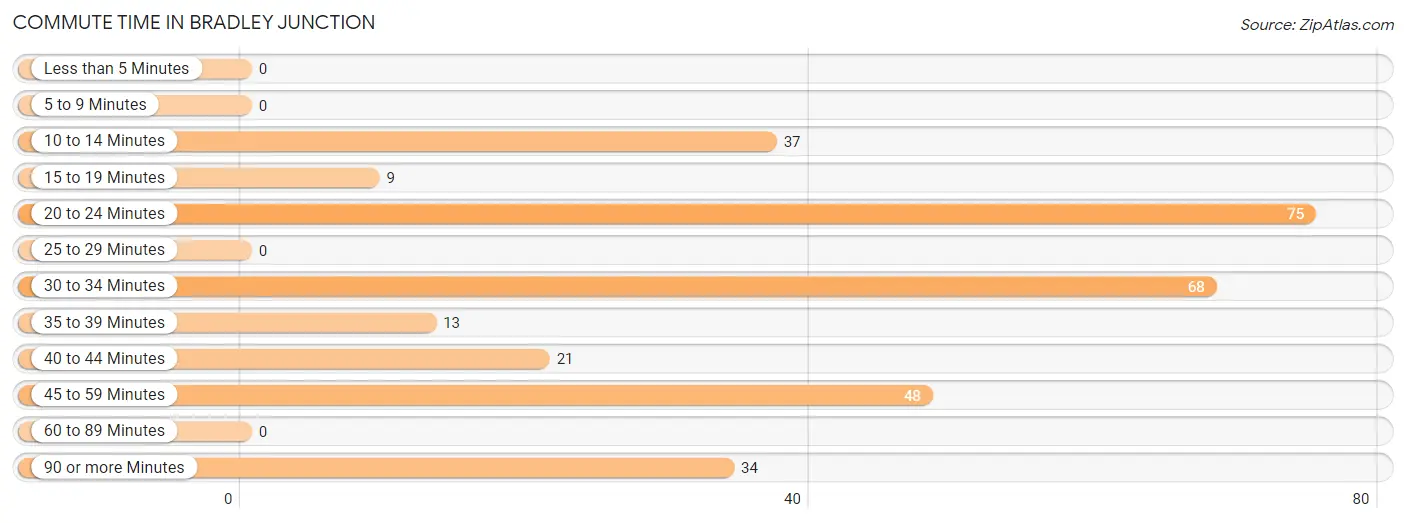
| Commute Time | # Commuters | % Commuters |
| Less than 5 Minutes | 0 | 0.0% |
| 5 to 9 Minutes | 0 | 0.0% |
| 10 to 14 Minutes | 37 | 12.1% |
| 15 to 19 Minutes | 9 | 2.9% |
| 20 to 24 Minutes | 75 | 24.6% |
| 25 to 29 Minutes | 0 | 0.0% |
| 30 to 34 Minutes | 68 | 22.3% |
| 35 to 39 Minutes | 13 | 4.3% |
| 40 to 44 Minutes | 21 | 6.9% |
| 45 to 59 Minutes | 48 | 15.7% |
| 60 to 89 Minutes | 0 | 0.0% |
| 90 or more Minutes | 34 | 11.2% |
Commute Time by Sex in Bradley Junction
The most common commute times in Bradley Junction are 20 to 24 minutes (59 commuters, 31.2%) for males and 45 to 59 minutes (32 commuters, 27.6%) for females.
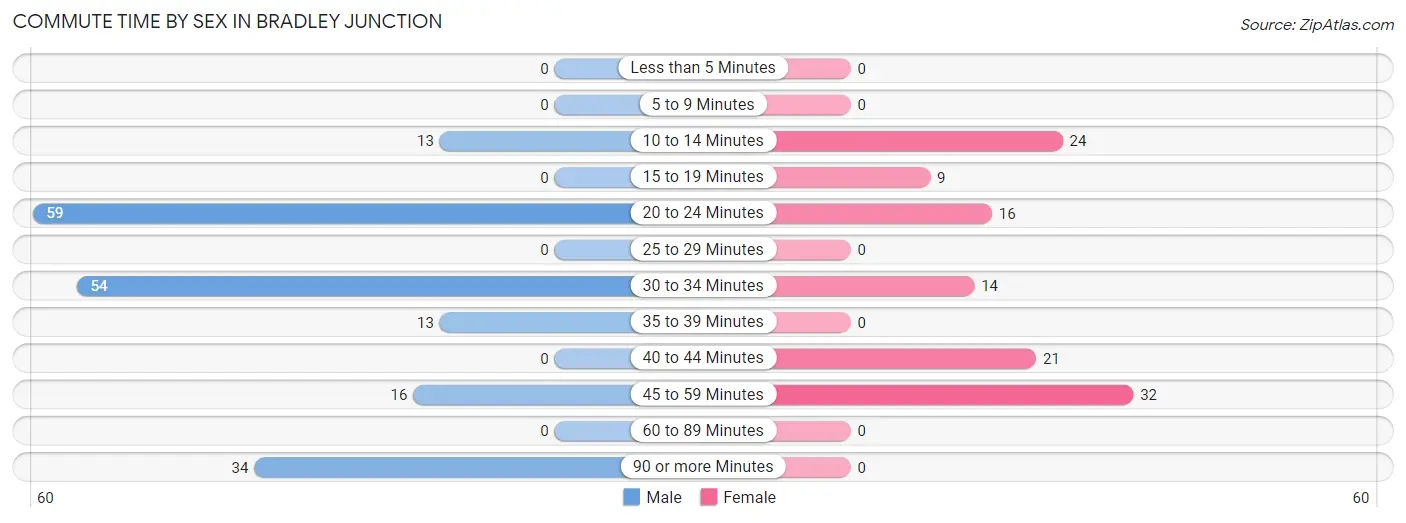
| Commute Time | Male | Female |
| Less than 5 Minutes | 0 (0.0%) | 0 (0.0%) |
| 5 to 9 Minutes | 0 (0.0%) | 0 (0.0%) |
| 10 to 14 Minutes | 13 (6.9%) | 24 (20.7%) |
| 15 to 19 Minutes | 0 (0.0%) | 9 (7.8%) |
| 20 to 24 Minutes | 59 (31.2%) | 16 (13.8%) |
| 25 to 29 Minutes | 0 (0.0%) | 0 (0.0%) |
| 30 to 34 Minutes | 54 (28.6%) | 14 (12.1%) |
| 35 to 39 Minutes | 13 (6.9%) | 0 (0.0%) |
| 40 to 44 Minutes | 0 (0.0%) | 21 (18.1%) |
| 45 to 59 Minutes | 16 (8.5%) | 32 (27.6%) |
| 60 to 89 Minutes | 0 (0.0%) | 0 (0.0%) |
| 90 or more Minutes | 34 (18.0%) | 0 (0.0%) |
Time of Departure to Work by Sex in Bradley Junction
The most frequent times of departure to work in Bradley Junction are 6:00 AM to 6:29 AM (66, 34.9%) for males and 7:00 AM to 7:29 AM (47, 40.5%) for females.
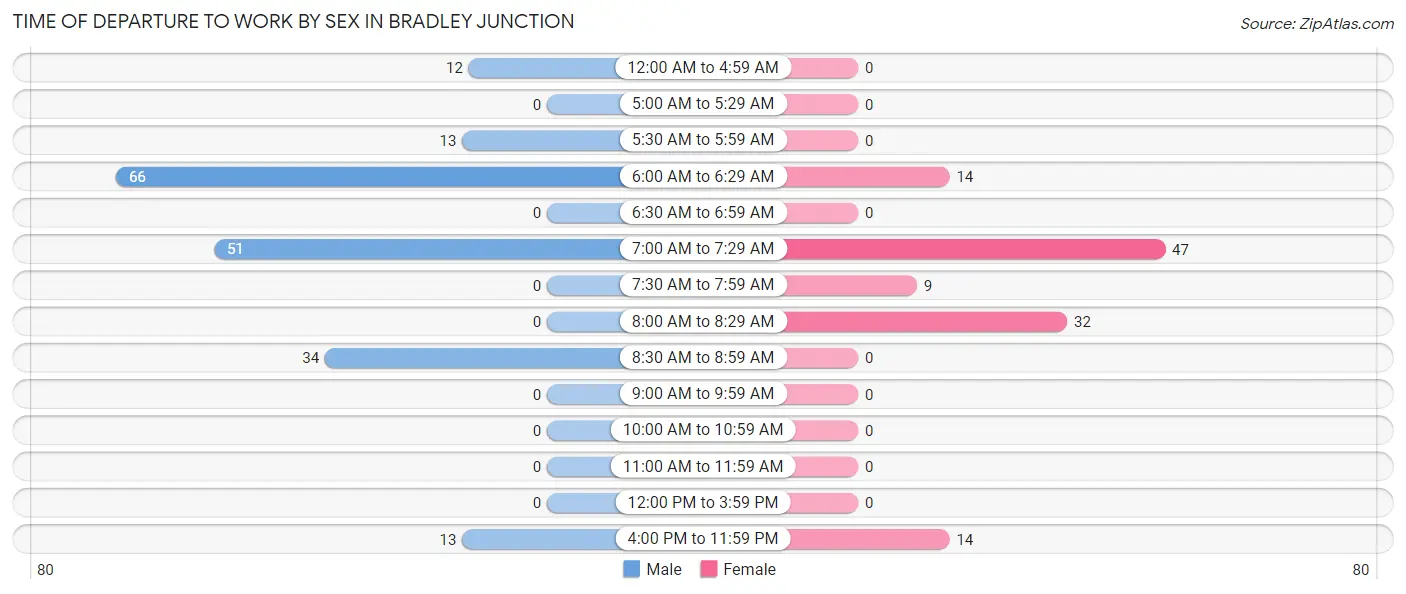
| Time of Departure | Male | Female |
| 12:00 AM to 4:59 AM | 12 (6.4%) | 0 (0.0%) |
| 5:00 AM to 5:29 AM | 0 (0.0%) | 0 (0.0%) |
| 5:30 AM to 5:59 AM | 13 (6.9%) | 0 (0.0%) |
| 6:00 AM to 6:29 AM | 66 (34.9%) | 14 (12.1%) |
| 6:30 AM to 6:59 AM | 0 (0.0%) | 0 (0.0%) |
| 7:00 AM to 7:29 AM | 51 (27.0%) | 47 (40.5%) |
| 7:30 AM to 7:59 AM | 0 (0.0%) | 9 (7.8%) |
| 8:00 AM to 8:29 AM | 0 (0.0%) | 32 (27.6%) |
| 8:30 AM to 8:59 AM | 34 (18.0%) | 0 (0.0%) |
| 9:00 AM to 9:59 AM | 0 (0.0%) | 0 (0.0%) |
| 10:00 AM to 10:59 AM | 0 (0.0%) | 0 (0.0%) |
| 11:00 AM to 11:59 AM | 0 (0.0%) | 0 (0.0%) |
| 12:00 PM to 3:59 PM | 0 (0.0%) | 0 (0.0%) |
| 4:00 PM to 11:59 PM | 13 (6.9%) | 14 (12.1%) |
| Total | 189 (100.0%) | 116 (100.0%) |
Housing Occupancy in Bradley Junction
Occupancy by Ownership in Bradley Junction
Of the total 253 dwellings in Bradley Junction, owner-occupied units account for 191 (75.5%), while renter-occupied units make up 62 (24.5%).
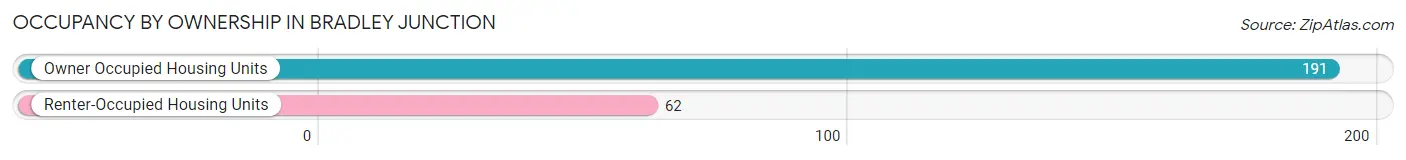
| Occupancy | # Housing Units | % Housing Units |
| Owner Occupied Housing Units | 191 | 75.5% |
| Renter-Occupied Housing Units | 62 | 24.5% |
| Total Occupied Housing Units | 253 | 100.0% |
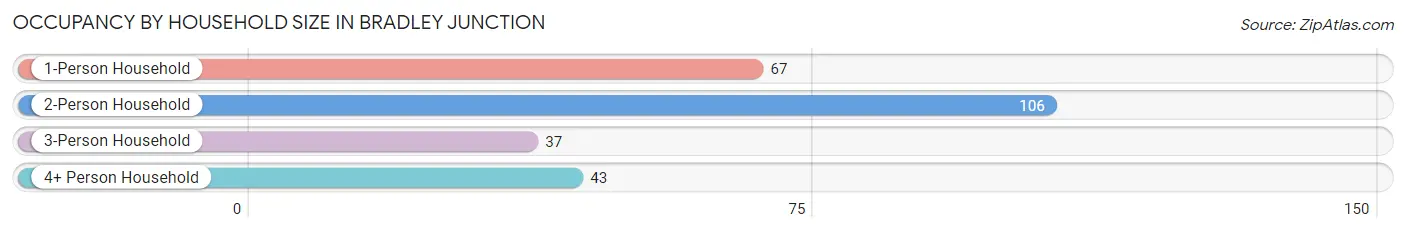
Occupancy by Household Size in Bradley Junction
| Household Size | # Housing Units | % Housing Units |
| 1-Person Household | 67 | 26.5% |
| 2-Person Household | 106 | 41.9% |
| 3-Person Household | 37 | 14.6% |
| 4+ Person Household | 43 | 17.0% |
| Total Housing Units | 253 | 100.0% |
Occupancy by Ownership by Household Size in Bradley Junction
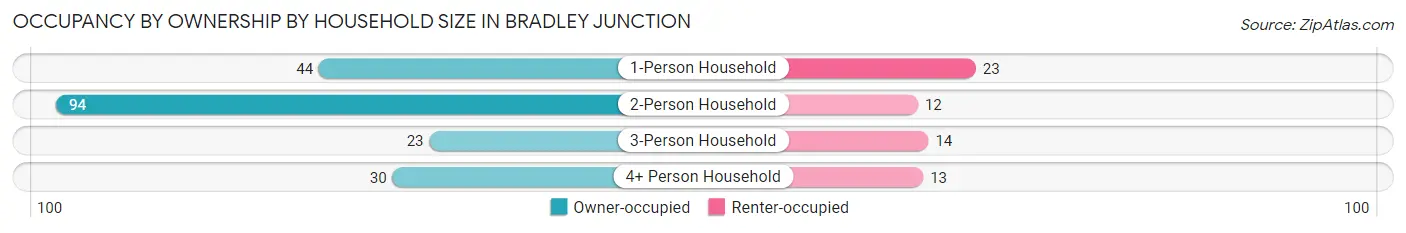
| Household Size | Owner-occupied | Renter-occupied |
| 1-Person Household | 44 (65.7%) | 23 (34.3%) |
| 2-Person Household | 94 (88.7%) | 12 (11.3%) |
| 3-Person Household | 23 (62.2%) | 14 (37.8%) |
| 4+ Person Household | 30 (69.8%) | 13 (30.2%) |
| Total Housing Units | 191 (75.5%) | 62 (24.5%) |
Occupancy by Educational Attainment in Bradley Junction
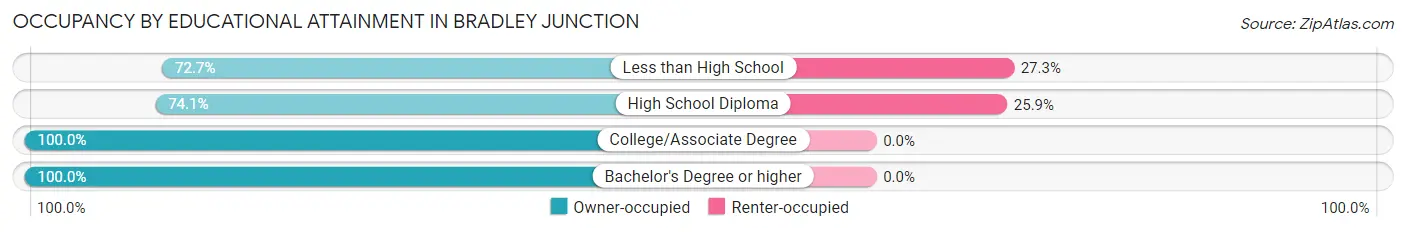
| Household Size | Owner-occupied | Renter-occupied |
| Less than High School | 32 (72.7%) | 12 (27.3%) |
| High School Diploma | 143 (74.1%) | 50 (25.9%) |
| College/Associate Degree | 10 (100.0%) | 0 (0.0%) |
| Bachelor's Degree or higher | 6 (100.0%) | 0 (0.0%) |
Occupancy by Age of Householder in Bradley Junction
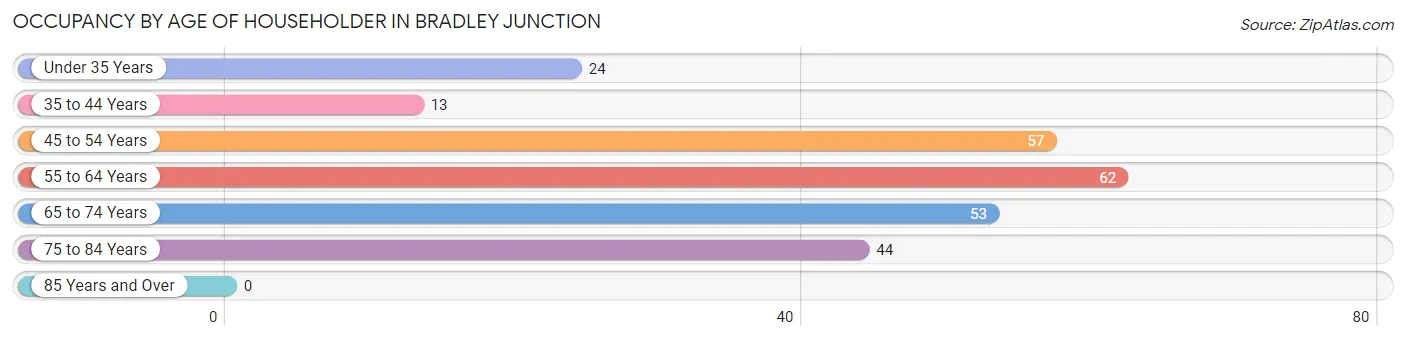
| Age Bracket | # Households | % Households |
| Under 35 Years | 24 | 9.5% |
| 35 to 44 Years | 13 | 5.1% |
| 45 to 54 Years | 57 | 22.5% |
| 55 to 64 Years | 62 | 24.5% |
| 65 to 74 Years | 53 | 20.9% |
| 75 to 84 Years | 44 | 17.4% |
| 85 Years and Over | 0 | 0.0% |
| Total | 253 | 100.0% |
Housing Finances in Bradley Junction
Median Income by Occupancy in Bradley Junction
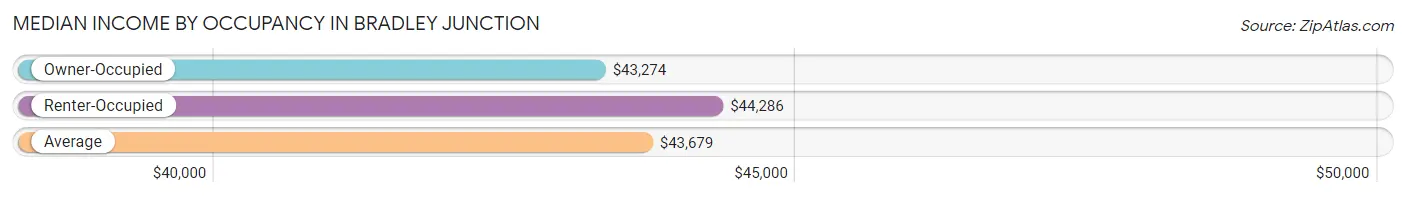
| Occupancy Type | # Households | Median Income |
| Owner-Occupied | 191 (75.5%) | $43,274 |
| Renter-Occupied | 62 (24.5%) | $44,286 |
| Average | 253 (100.0%) | $43,679 |
Occupancy by Householder Income Bracket in Bradley Junction
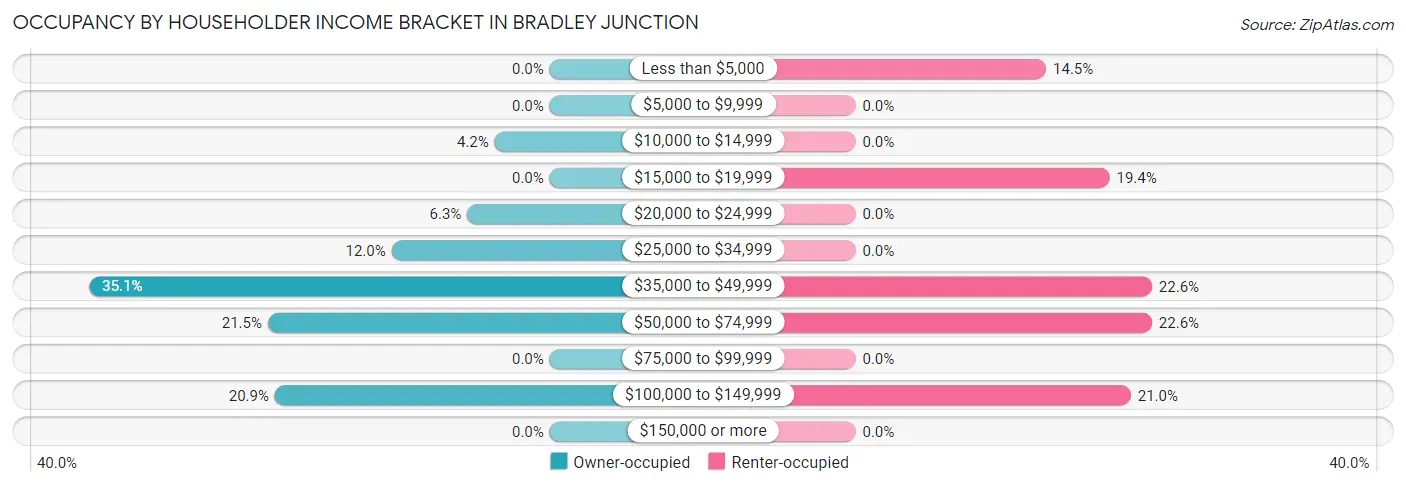
| Income Bracket | Owner-occupied | Renter-occupied |
| Less than $5,000 | 0 (0.0%) | 9 (14.5%) |
| $5,000 to $9,999 | 0 (0.0%) | 0 (0.0%) |
| $10,000 to $14,999 | 8 (4.2%) | 0 (0.0%) |
| $15,000 to $19,999 | 0 (0.0%) | 12 (19.4%) |
| $20,000 to $24,999 | 12 (6.3%) | 0 (0.0%) |
| $25,000 to $34,999 | 23 (12.0%) | 0 (0.0%) |
| $35,000 to $49,999 | 67 (35.1%) | 14 (22.6%) |
| $50,000 to $74,999 | 41 (21.5%) | 14 (22.6%) |
| $75,000 to $99,999 | 0 (0.0%) | 0 (0.0%) |
| $100,000 to $149,999 | 40 (20.9%) | 13 (21.0%) |
| $150,000 or more | 0 (0.0%) | 0 (0.0%) |
| Total | 191 (100.0%) | 62 (100.0%) |
Monthly Housing Cost Tiers in Bradley Junction
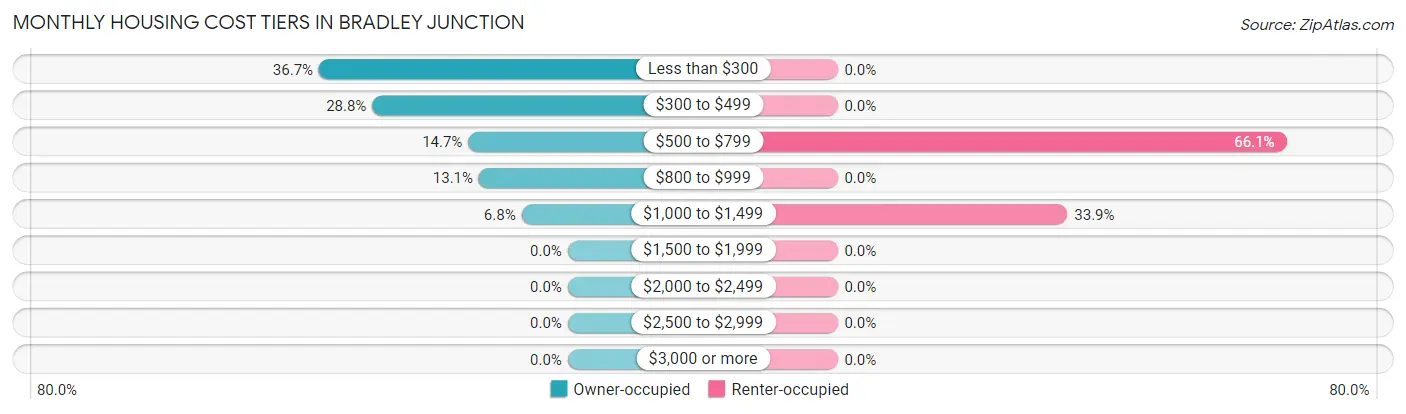
| Monthly Cost | Owner-occupied | Renter-occupied |
| Less than $300 | 70 (36.6%) | 0 (0.0%) |
| $300 to $499 | 55 (28.8%) | 0 (0.0%) |
| $500 to $799 | 28 (14.7%) | 41 (66.1%) |
| $800 to $999 | 25 (13.1%) | 0 (0.0%) |
| $1,000 to $1,499 | 13 (6.8%) | 21 (33.9%) |
| $1,500 to $1,999 | 0 (0.0%) | 0 (0.0%) |
| $2,000 to $2,499 | 0 (0.0%) | 0 (0.0%) |
| $2,500 to $2,999 | 0 (0.0%) | 0 (0.0%) |
| $3,000 or more | 0 (0.0%) | 0 (0.0%) |
| Total | 191 (100.0%) | 62 (100.0%) |
Physical Housing Characteristics in Bradley Junction
Housing Structures in Bradley Junction
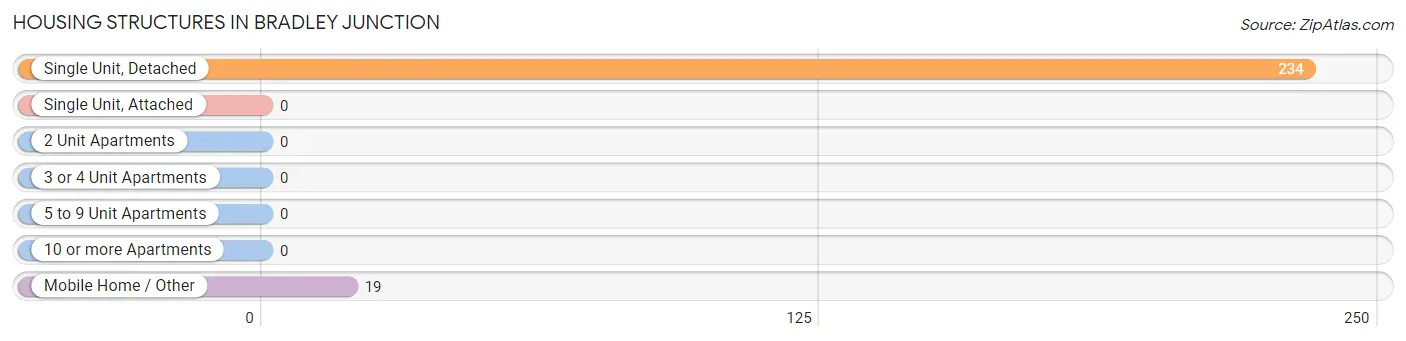
| Structure Type | # Housing Units | % Housing Units |
| Single Unit, Detached | 234 | 92.5% |
| Single Unit, Attached | 0 | 0.0% |
| 2 Unit Apartments | 0 | 0.0% |
| 3 or 4 Unit Apartments | 0 | 0.0% |
| 5 to 9 Unit Apartments | 0 | 0.0% |
| 10 or more Apartments | 0 | 0.0% |
| Mobile Home / Other | 19 | 7.5% |
| Total | 253 | 100.0% |
Housing Structures by Occupancy in Bradley Junction
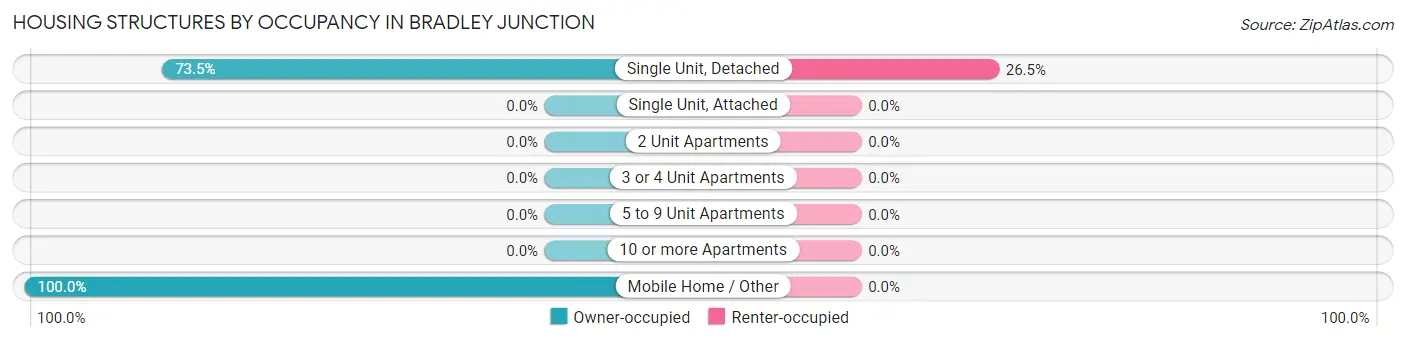
| Structure Type | Owner-occupied | Renter-occupied |
| Single Unit, Detached | 172 (73.5%) | 62 (26.5%) |
| Single Unit, Attached | 0 (0.0%) | 0 (0.0%) |
| 2 Unit Apartments | 0 (0.0%) | 0 (0.0%) |
| 3 or 4 Unit Apartments | 0 (0.0%) | 0 (0.0%) |
| 5 to 9 Unit Apartments | 0 (0.0%) | 0 (0.0%) |
| 10 or more Apartments | 0 (0.0%) | 0 (0.0%) |
| Mobile Home / Other | 19 (100.0%) | 0 (0.0%) |
| Total | 191 (75.5%) | 62 (24.5%) |
Housing Structures by Number of Rooms in Bradley Junction
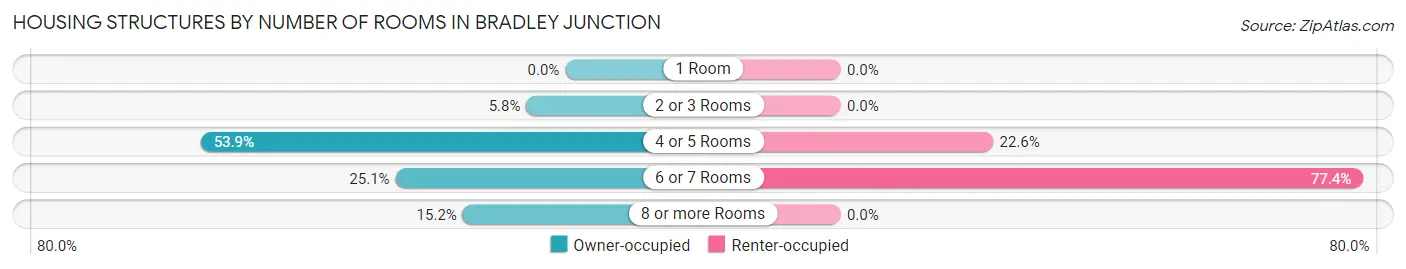
| Number of Rooms | Owner-occupied | Renter-occupied |
| 1 Room | 0 (0.0%) | 0 (0.0%) |
| 2 or 3 Rooms | 11 (5.8%) | 0 (0.0%) |
| 4 or 5 Rooms | 103 (53.9%) | 14 (22.6%) |
| 6 or 7 Rooms | 48 (25.1%) | 48 (77.4%) |
| 8 or more Rooms | 29 (15.2%) | 0 (0.0%) |
| Total | 191 (100.0%) | 62 (100.0%) |
Housing Structure by Heating Type in Bradley Junction
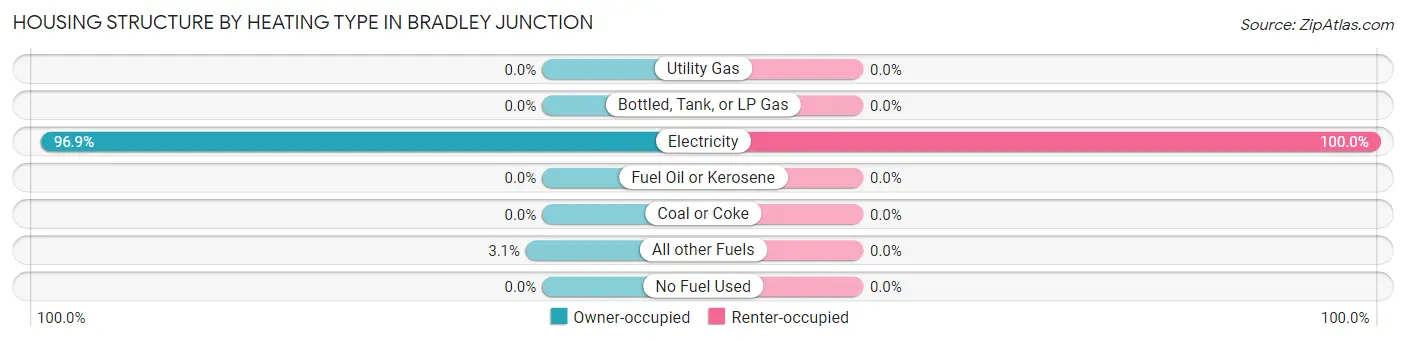
| Heating Type | Owner-occupied | Renter-occupied |
| Utility Gas | 0 (0.0%) | 0 (0.0%) |
| Bottled, Tank, or LP Gas | 0 (0.0%) | 0 (0.0%) |
| Electricity | 185 (96.9%) | 62 (100.0%) |
| Fuel Oil or Kerosene | 0 (0.0%) | 0 (0.0%) |
| Coal or Coke | 0 (0.0%) | 0 (0.0%) |
| All other Fuels | 6 (3.1%) | 0 (0.0%) |
| No Fuel Used | 0 (0.0%) | 0 (0.0%) |
| Total | 191 (100.0%) | 62 (100.0%) |
Household Vehicle Usage in Bradley Junction
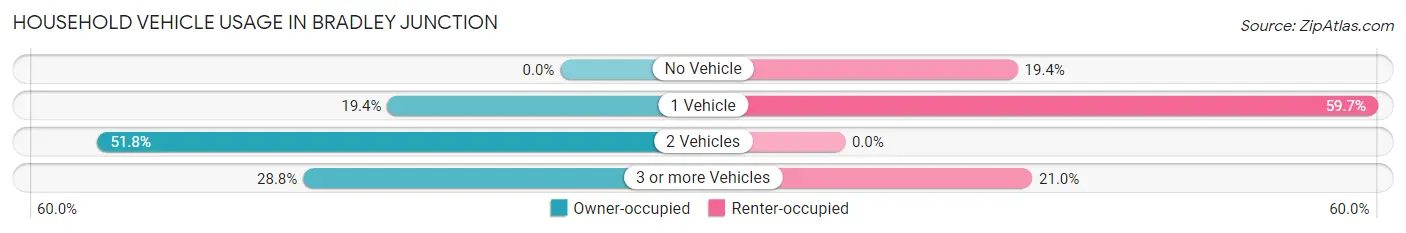
| Vehicles per Household | Owner-occupied | Renter-occupied |
| No Vehicle | 0 (0.0%) | 12 (19.4%) |
| 1 Vehicle | 37 (19.4%) | 37 (59.7%) |
| 2 Vehicles | 99 (51.8%) | 0 (0.0%) |
| 3 or more Vehicles | 55 (28.8%) | 13 (21.0%) |
| Total | 191 (100.0%) | 62 (100.0%) |
Real Estate & Mortgages in Bradley Junction
Real Estate and Mortgage Overview in Bradley Junction
| Characteristic | Without Mortgage | With Mortgage |
| Housing Units | 153 | 38 |
| Median Property Value | $131,300 | $138,500 |
| Median Household Income | $42,560 | $0 |
| Monthly Housing Costs | $310 | $0 |
| Real Estate Taxes | $1,008 | $0 |
Property Value by Mortgage Status in Bradley Junction
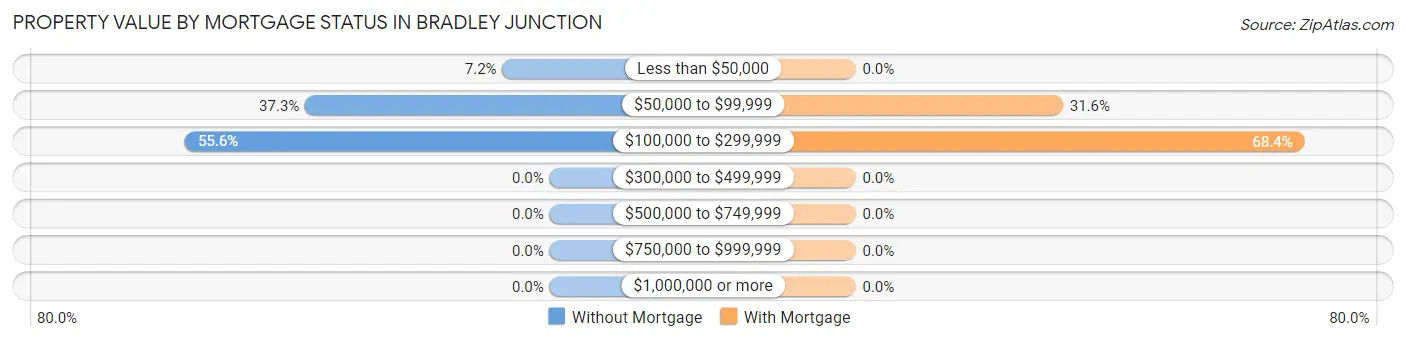
| Property Value | Without Mortgage | With Mortgage |
| Less than $50,000 | 11 (7.2%) | 0 (0.0%) |
| $50,000 to $99,999 | 57 (37.2%) | 12 (31.6%) |
| $100,000 to $299,999 | 85 (55.6%) | 26 (68.4%) |
| $300,000 to $499,999 | 0 (0.0%) | 0 (0.0%) |
| $500,000 to $749,999 | 0 (0.0%) | 0 (0.0%) |
| $750,000 to $999,999 | 0 (0.0%) | 0 (0.0%) |
| $1,000,000 or more | 0 (0.0%) | 0 (0.0%) |
| Total | 153 (100.0%) | 38 (100.0%) |
Household Income by Mortgage Status in Bradley Junction
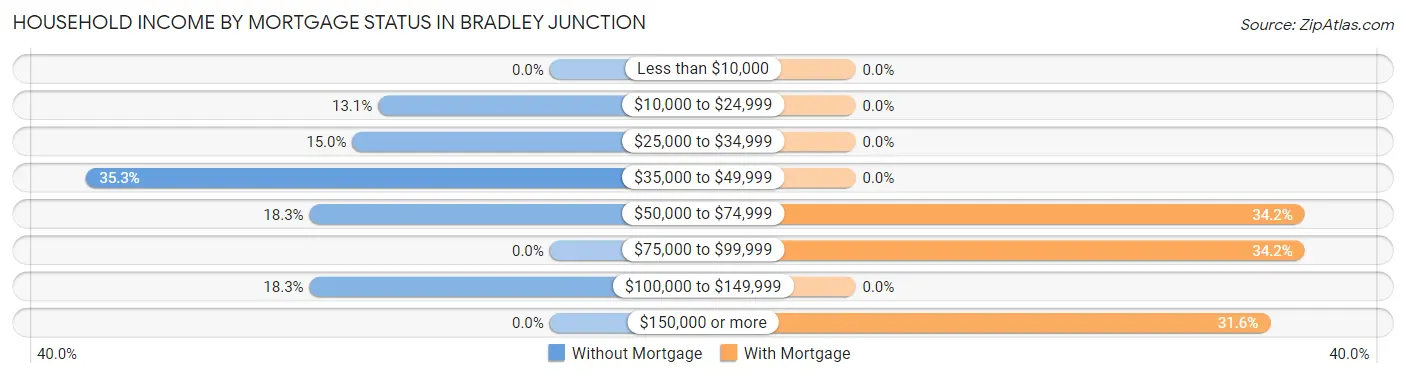
| Household Income | Without Mortgage | With Mortgage |
| Less than $10,000 | 0 (0.0%) | 0 (0.0%) |
| $10,000 to $24,999 | 20 (13.1%) | 0 (0.0%) |
| $25,000 to $34,999 | 23 (15.0%) | 0 (0.0%) |
| $35,000 to $49,999 | 54 (35.3%) | 0 (0.0%) |
| $50,000 to $74,999 | 28 (18.3%) | 13 (34.2%) |
| $75,000 to $99,999 | 0 (0.0%) | 13 (34.2%) |
| $100,000 to $149,999 | 28 (18.3%) | 0 (0.0%) |
| $150,000 or more | 0 (0.0%) | 12 (31.6%) |
| Total | 153 (100.0%) | 38 (100.0%) |
Property Value to Household Income Ratio in Bradley Junction
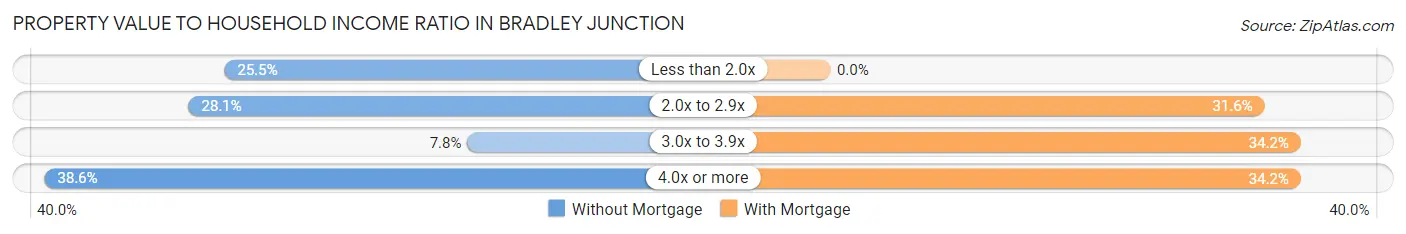
| Value-to-Income Ratio | Without Mortgage | With Mortgage |
| Less than 2.0x | 39 (25.5%) | 0 (0.0%) |
| 2.0x to 2.9x | 43 (28.1%) | 12 (31.6%) |
| 3.0x to 3.9x | 12 (7.8%) | 13 (34.2%) |
| 4.0x or more | 59 (38.6%) | 13 (34.2%) |
| Total | 153 (100.0%) | 38 (100.0%) |
Real Estate Taxes by Mortgage Status in Bradley Junction
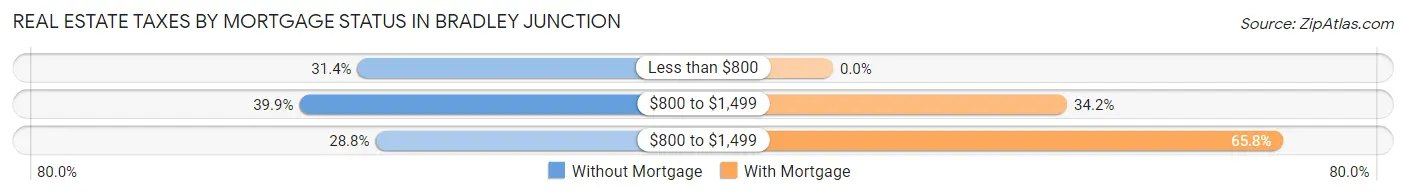
| Property Taxes | Without Mortgage | With Mortgage |
| Less than $800 | 48 (31.4%) | 0 (0.0%) |
| $800 to $1,499 | 61 (39.9%) | 13 (34.2%) |
| $800 to $1,499 | 44 (28.8%) | 25 (65.8%) |
| Total | 153 (100.0%) | 38 (100.0%) |
Health & Disability in Bradley Junction
Health Insurance Coverage by Age in Bradley Junction
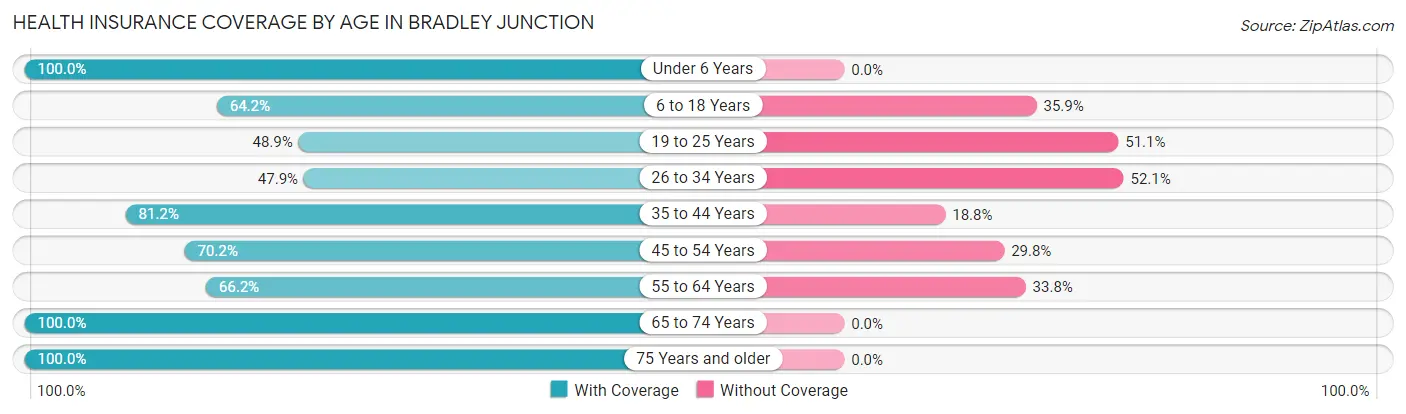
| Age Bracket | With Coverage | Without Coverage |
| Under 6 Years | 29 (100.0%) | 0 (0.0%) |
| 6 to 18 Years | 34 (64.1%) | 19 (35.8%) |
| 19 to 25 Years | 45 (48.9%) | 47 (51.1%) |
| 26 to 34 Years | 23 (47.9%) | 25 (52.1%) |
| 35 to 44 Years | 56 (81.2%) | 13 (18.8%) |
| 45 to 54 Years | 80 (70.2%) | 34 (29.8%) |
| 55 to 64 Years | 90 (66.2%) | 46 (33.8%) |
| 65 to 74 Years | 90 (100.0%) | 0 (0.0%) |
| 75 Years and older | 105 (100.0%) | 0 (0.0%) |
| Total | 552 (75.0%) | 184 (25.0%) |
Health Insurance Coverage by Citizenship Status in Bradley Junction
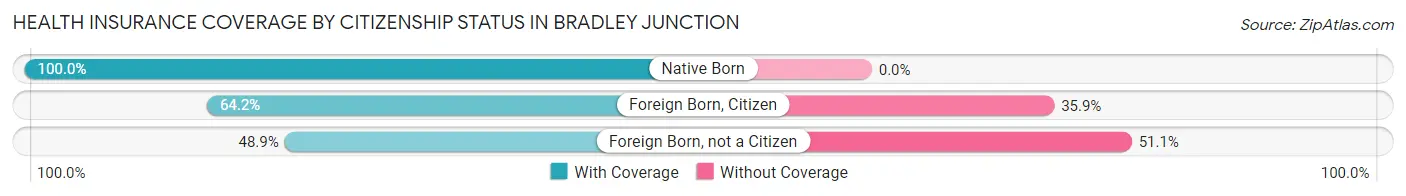
| Citizenship Status | With Coverage | Without Coverage |
| Native Born | 29 (100.0%) | 0 (0.0%) |
| Foreign Born, Citizen | 34 (64.1%) | 19 (35.8%) |
| Foreign Born, not a Citizen | 45 (48.9%) | 47 (51.1%) |
Health Insurance Coverage by Household Income in Bradley Junction
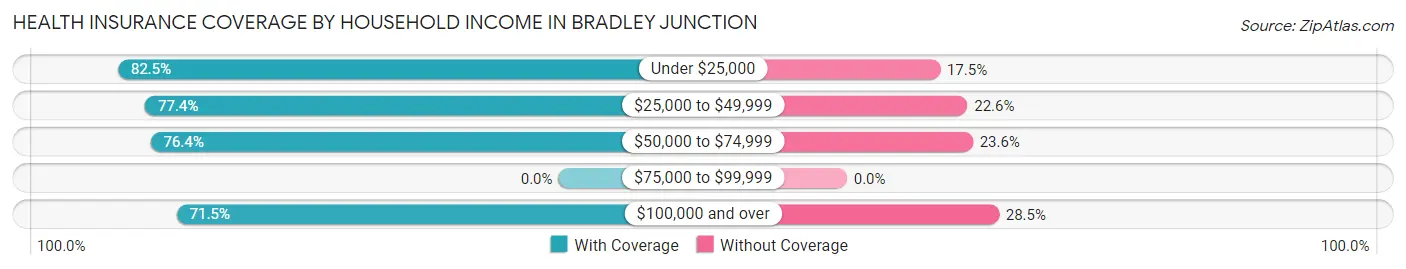
| Household Income | With Coverage | Without Coverage |
| Under $25,000 | 52 (82.5%) | 11 (17.5%) |
| $25,000 to $49,999 | 120 (77.4%) | 35 (22.6%) |
| $50,000 to $74,999 | 149 (76.4%) | 46 (23.6%) |
| $75,000 to $99,999 | 0 (0.0%) | 0 (0.0%) |
| $100,000 and over | 231 (71.5%) | 92 (28.5%) |
Public vs Private Health Insurance Coverage by Age in Bradley Junction
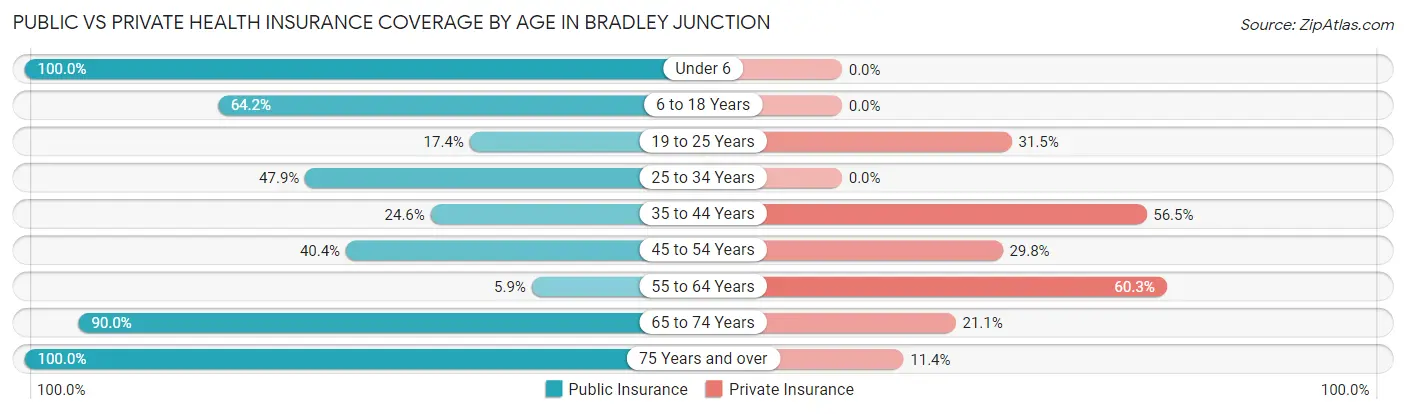
| Age Bracket | Public Insurance | Private Insurance |
| Under 6 | 29 (100.0%) | 0 (0.0%) |
| 6 to 18 Years | 34 (64.1%) | 0 (0.0%) |
| 19 to 25 Years | 16 (17.4%) | 29 (31.5%) |
| 25 to 34 Years | 23 (47.9%) | 0 (0.0%) |
| 35 to 44 Years | 17 (24.6%) | 39 (56.5%) |
| 45 to 54 Years | 46 (40.4%) | 34 (29.8%) |
| 55 to 64 Years | 8 (5.9%) | 82 (60.3%) |
| 65 to 74 Years | 81 (90.0%) | 19 (21.1%) |
| 75 Years and over | 105 (100.0%) | 12 (11.4%) |
| Total | 359 (48.8%) | 215 (29.2%) |
Disability Status by Sex by Age in Bradley Junction
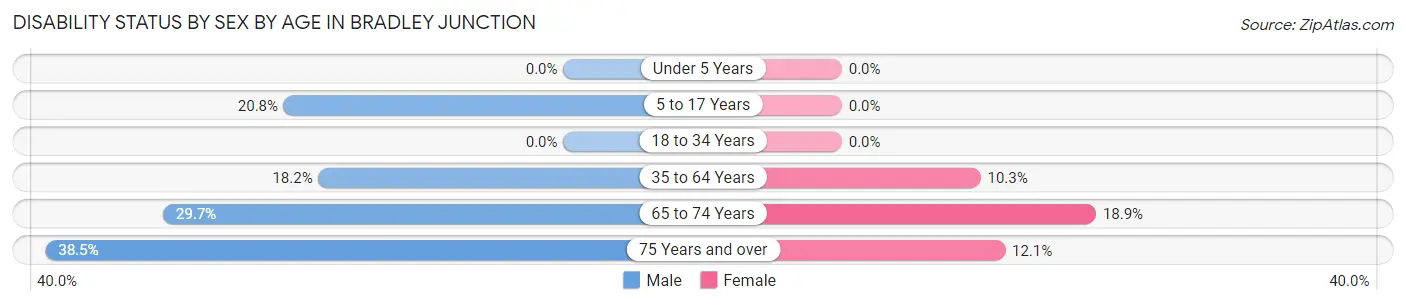
| Age Bracket | Male | Female |
| Under 5 Years | 0 (0.0%) | 0 (0.0%) |
| 5 to 17 Years | 11 (20.7%) | 0 (0.0%) |
| 18 to 34 Years | 0 (0.0%) | 0 (0.0%) |
| 35 to 64 Years | 28 (18.2%) | 17 (10.3%) |
| 65 to 74 Years | 11 (29.7%) | 10 (18.9%) |
| 75 Years and over | 15 (38.5%) | 8 (12.1%) |
Disability Class by Sex by Age in Bradley Junction
Disability Class: Hearing Difficulty
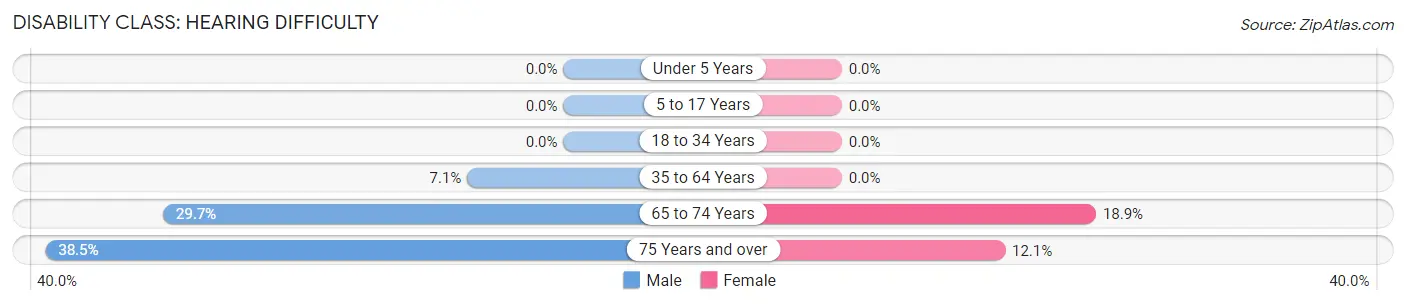
| Age Bracket | Male | Female |
| Under 5 Years | 0 (0.0%) | 0 (0.0%) |
| 5 to 17 Years | 0 (0.0%) | 0 (0.0%) |
| 18 to 34 Years | 0 (0.0%) | 0 (0.0%) |
| 35 to 64 Years | 11 (7.1%) | 0 (0.0%) |
| 65 to 74 Years | 11 (29.7%) | 10 (18.9%) |
| 75 Years and over | 15 (38.5%) | 8 (12.1%) |
Disability Class: Vision Difficulty
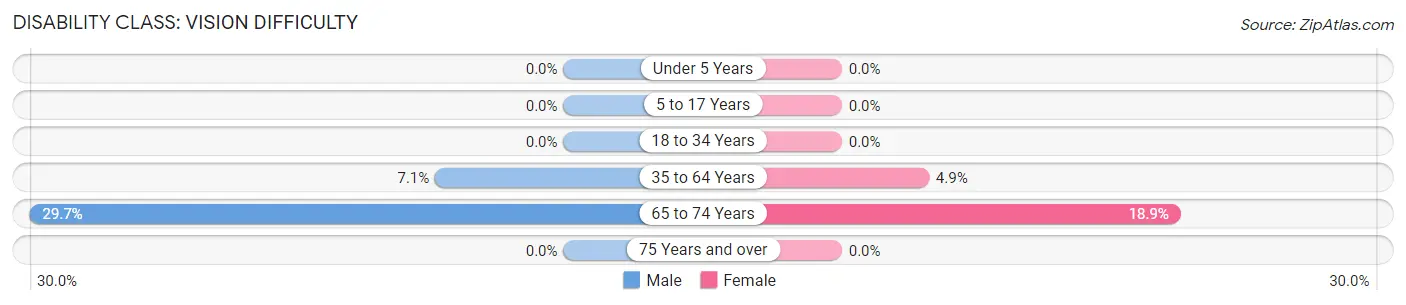
| Age Bracket | Male | Female |
| Under 5 Years | 0 (0.0%) | 0 (0.0%) |
| 5 to 17 Years | 0 (0.0%) | 0 (0.0%) |
| 18 to 34 Years | 0 (0.0%) | 0 (0.0%) |
| 35 to 64 Years | 11 (7.1%) | 8 (4.9%) |
| 65 to 74 Years | 11 (29.7%) | 10 (18.9%) |
| 75 Years and over | 0 (0.0%) | 0 (0.0%) |
Disability Class: Cognitive Difficulty
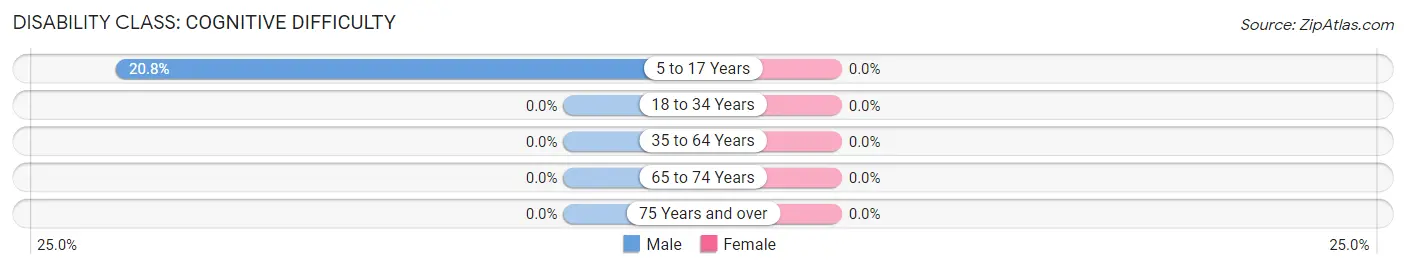
| Age Bracket | Male | Female |
| 5 to 17 Years | 11 (20.7%) | 0 (0.0%) |
| 18 to 34 Years | 0 (0.0%) | 0 (0.0%) |
| 35 to 64 Years | 0 (0.0%) | 0 (0.0%) |
| 65 to 74 Years | 0 (0.0%) | 0 (0.0%) |
| 75 Years and over | 0 (0.0%) | 0 (0.0%) |
Disability Class: Ambulatory Difficulty
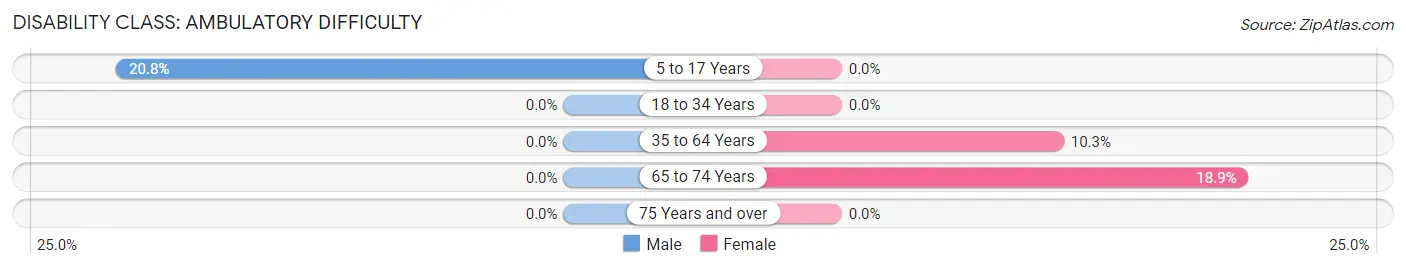
| Age Bracket | Male | Female |
| 5 to 17 Years | 11 (20.7%) | 0 (0.0%) |
| 18 to 34 Years | 0 (0.0%) | 0 (0.0%) |
| 35 to 64 Years | 0 (0.0%) | 17 (10.3%) |
| 65 to 74 Years | 0 (0.0%) | 10 (18.9%) |
| 75 Years and over | 0 (0.0%) | 0 (0.0%) |
Disability Class: Self-Care Difficulty
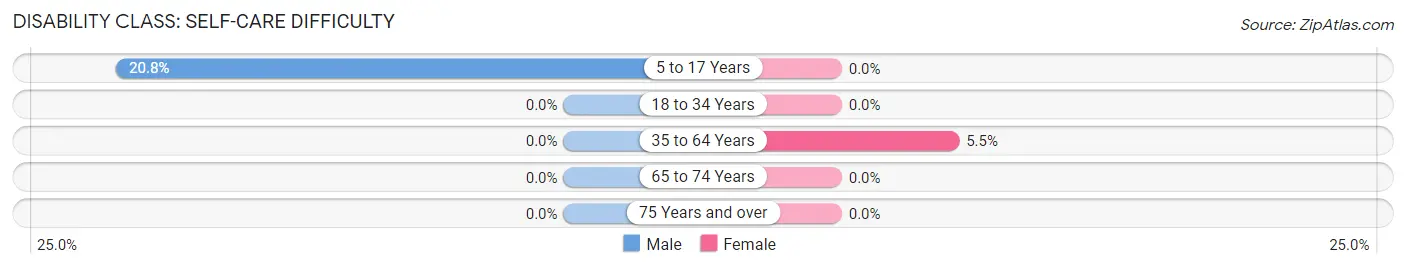
| Age Bracket | Male | Female |
| 5 to 17 Years | 11 (20.7%) | 0 (0.0%) |
| 18 to 34 Years | 0 (0.0%) | 0 (0.0%) |
| 35 to 64 Years | 0 (0.0%) | 9 (5.4%) |
| 65 to 74 Years | 0 (0.0%) | 0 (0.0%) |
| 75 Years and over | 0 (0.0%) | 0 (0.0%) |
Technology Access in Bradley Junction
Computing Device Access in Bradley Junction
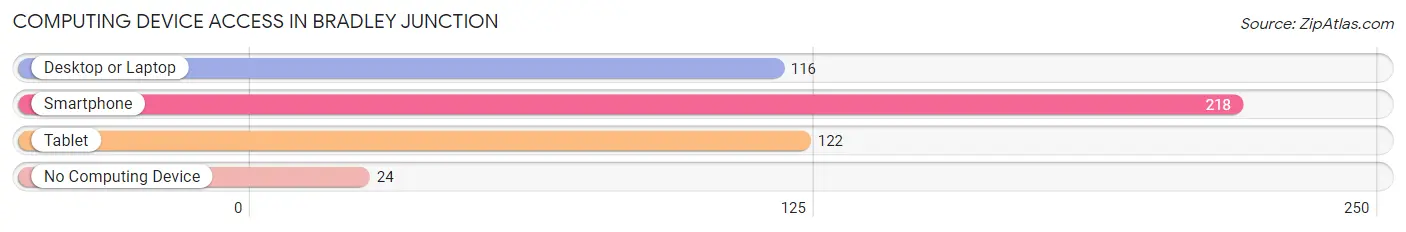
| Device Type | # Households | % Households |
| Desktop or Laptop | 116 | 45.9% |
| Smartphone | 218 | 86.2% |
| Tablet | 122 | 48.2% |
| No Computing Device | 24 | 9.5% |
| Total | 253 | 100.0% |
Internet Access in Bradley Junction
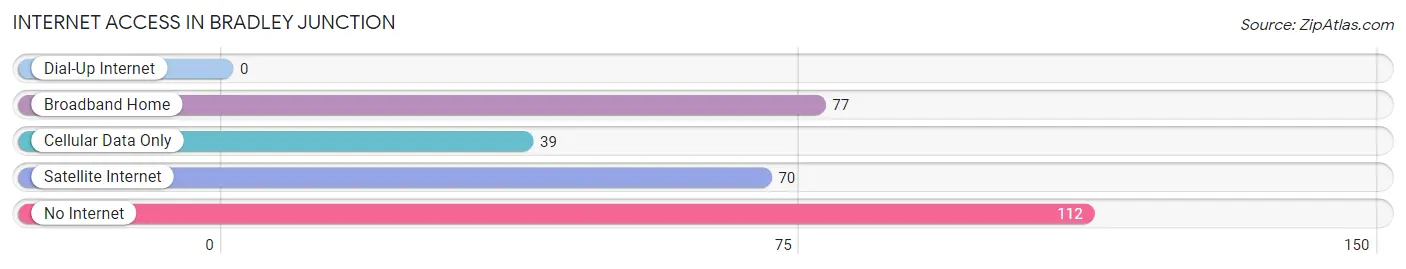
| Internet Type | # Households | % Households |
| Dial-Up Internet | 0 | 0.0% |
| Broadband Home | 77 | 30.4% |
| Cellular Data Only | 39 | 15.4% |
| Satellite Internet | 70 | 27.7% |
| No Internet | 112 | 44.3% |
| Total | 253 | 100.0% |
Bradley Junction Summary
Bradley Junction is a small unincorporated community located in Polk County, Florida. It is situated in the northern part of the county, approximately 20 miles east of Lakeland and 40 miles southwest of Orlando. The community is bordered by the cities of Lakeland, Winter Haven, and Auburndale.
History
Bradley Junction was founded in the late 1800s by the Bradley family, who were among the first settlers in the area. The family owned a large tract of land in the area, which they used for farming and ranching. The community was named after the family, and the junction was created when the railroad was built through the area in the early 1900s.
The community grew slowly over the years, and by the 1950s it had become a small rural town with a population of around 500 people. The town was home to a few small businesses, including a general store, a post office, and a few churches.
Geography
Bradley Junction is located in northern Polk County, approximately 20 miles east of Lakeland and 40 miles southwest of Orlando. The community is bordered by the cities of Lakeland, Winter Haven, and Auburndale. The terrain in the area is mostly flat, with some rolling hills. The area is mostly rural, with some small farms and ranches.
The climate in the area is subtropical, with hot, humid summers and mild winters. The average annual temperature is around 72 degrees Fahrenheit, with an average high of around 90 degrees in the summer and an average low of around 50 degrees in the winter.
Economy
The economy of Bradley Junction is largely based on agriculture and ranching. The area is home to several small farms and ranches, which produce a variety of crops and livestock. The community is also home to a few small businesses, including a general store, a post office, and a few churches.
Demographics
As of the 2010 census, the population of Bradley Junction was 1,093. The racial makeup of the community was 94.3% White, 2.2% African American, 0.7% Native American, 0.3% Asian, 0.1% Pacific Islander, and 2.4% from other races. The median household income was $37,917, and the median family income was $45,625. The per capita income was $18,945.
Conclusion
Bradley Junction is a small unincorporated community located in Polk County, Florida. It is situated in the northern part of the county, approximately 20 miles east of Lakeland and 40 miles southwest of Orlando. The community is bordered by the cities of Lakeland, Winter Haven, and Auburndale. The economy of Bradley Junction is largely based on agriculture and ranching, and the population of the community was 1,093 as of the 2010 census.
Common Questions
What is Per Capita Income in Bradley Junction?
Per Capita income in Bradley Junction is $22,133.
What is the Median Family Income in Bradley Junction?
Median Family Income in Bradley Junction is $54,107.
What is the Median Household income in Bradley Junction?
Median Household Income in Bradley Junction is $43,679.
What is Income or Wage Gap in Bradley Junction?
Income or Wage Gap in Bradley Junction is 44.5%.
Women in Bradley Junction earn 55.5 cents for every dollar earned by a man.
What is Inequality or Gini Index in Bradley Junction?
Inequality or Gini Index in Bradley Junction is 0.35.
What is the Total Population of Bradley Junction?
Total Population of Bradley Junction is 743.
What is the Total Male Population of Bradley Junction?
Total Male Population of Bradley Junction is 408.
What is the Total Female Population of Bradley Junction?
Total Female Population of Bradley Junction is 335.
What is the Ratio of Males per 100 Females in Bradley Junction?
There are 121.79 Males per 100 Females in Bradley Junction.
What is the Ratio of Females per 100 Males in Bradley Junction?
There are 82.11 Females per 100 Males in Bradley Junction.
What is the Median Population Age in Bradley Junction?
Median Population Age in Bradley Junction is 50.3 Years.
What is the Average Family Size in Bradley Junction
Average Family Size in Bradley Junction is 3.5 People.
What is the Average Household Size in Bradley Junction
Average Household Size in Bradley Junction is 2.9 People.
How Large is the Labor Force in Bradley Junction?
There are 335 People in the Labor Forcein in Bradley Junction.
What is the Percentage of People in the Labor Force in Bradley Junction?
51.0% of People are in the Labor Force in Bradley Junction.
What is the Unemployment Rate in Bradley Junction?
Unemployment Rate in Bradley Junction is 4.5%.