Gila Crossing, AZ Map & Demographics
Gila Crossing Map
Gila Crossing Overview
$11,914
PER CAPITA INCOME
$54,500
AVG FAMILY INCOME
$51,583
AVG HOUSEHOLD INCOME
3.3%
WAGE / INCOME GAP [ % ]
96.7¢/ $1
WAGE / INCOME GAP [ $ ]
0.42
INEQUALITY / GINI INDEX
965
TOTAL POPULATION
461
MALE POPULATION
504
FEMALE POPULATION
91.47
MALES / 100 FEMALES
109.33
FEMALES / 100 MALES
31.2
MEDIAN AGE
4.8
AVG FAMILY SIZE
4.8
AVG HOUSEHOLD SIZE
358
LABOR FORCE [ PEOPLE ]
49.7%
PERCENT IN LABOR FORCE
15.4%
UNEMPLOYMENT RATE
Income in Gila Crossing
Income Overview in Gila Crossing
Per Capita Income in Gila Crossing is $11,914, while median incomes of families and households are $54,500 and $51,583 respectively.
| Characteristic | Number | Measure |
| Per Capita Income | 965 | $11,914 |
| Median Family Income | 174 | $54,500 |
| Mean Family Income | 174 | $49,165 |
| Median Household Income | 201 | $51,583 |
| Mean Household Income | 201 | $48,238 |
| Income Deficit | 174 | $0 |
| Wage / Income Gap (%) | 965 | 3.27% |
| Wage / Income Gap ($) | 965 | 96.73¢ per $1 |
| Gini / Inequality Index | 965 | 0.42 |
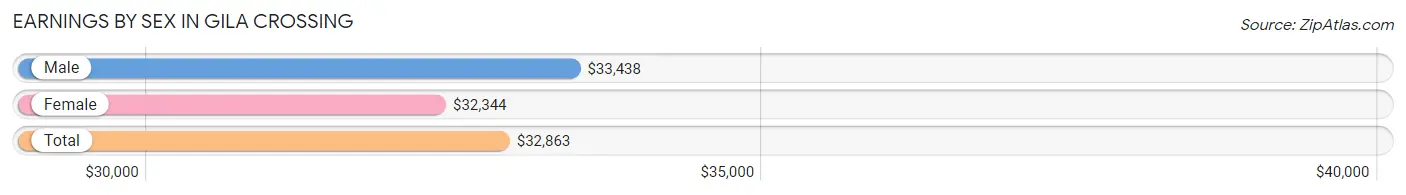
Earnings by Sex in Gila Crossing
Average Earnings in Gila Crossing are $32,863, $33,438 for men and $32,344 for women, a difference of 3.3%.
| Sex | Number | Average Earnings |
| Male | 210 (69.3%) | $33,438 |
| Female | 93 (30.7%) | $32,344 |
| Total | 303 (100.0%) | $32,863 |
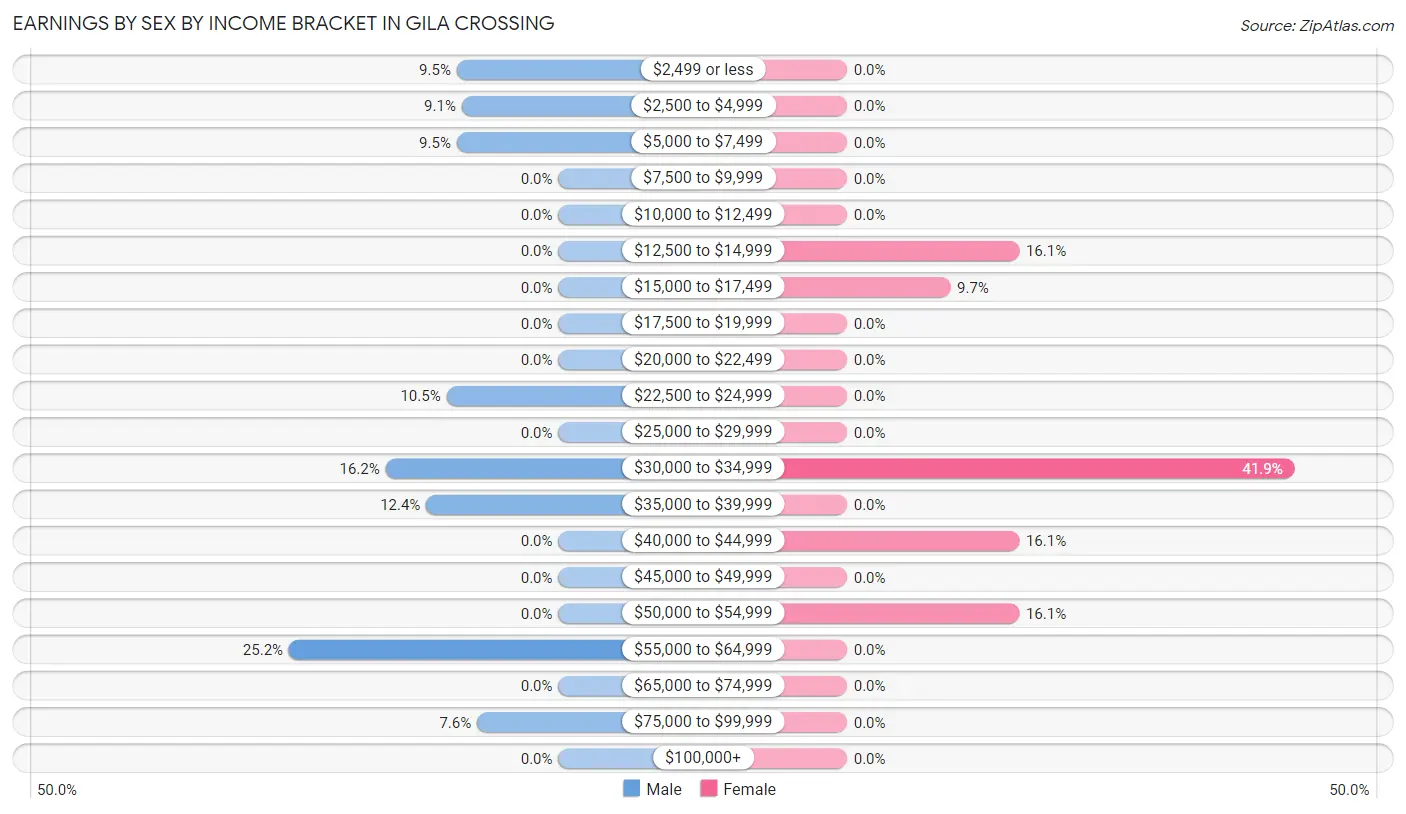
Earnings by Sex by Income Bracket in Gila Crossing
The most common earnings brackets in Gila Crossing are $55,000 to $64,999 for men (53 | 25.2%) and $30,000 to $34,999 for women (39 | 41.9%).
| Income | Male | Female |
| $2,499 or less | 20 (9.5%) | 0 (0.0%) |
| $2,500 to $4,999 | 19 (9.0%) | 0 (0.0%) |
| $5,000 to $7,499 | 20 (9.5%) | 0 (0.0%) |
| $7,500 to $9,999 | 0 (0.0%) | 0 (0.0%) |
| $10,000 to $12,499 | 0 (0.0%) | 0 (0.0%) |
| $12,500 to $14,999 | 0 (0.0%) | 15 (16.1%) |
| $15,000 to $17,499 | 0 (0.0%) | 9 (9.7%) |
| $17,500 to $19,999 | 0 (0.0%) | 0 (0.0%) |
| $20,000 to $22,499 | 0 (0.0%) | 0 (0.0%) |
| $22,500 to $24,999 | 22 (10.5%) | 0 (0.0%) |
| $25,000 to $29,999 | 0 (0.0%) | 0 (0.0%) |
| $30,000 to $34,999 | 34 (16.2%) | 39 (41.9%) |
| $35,000 to $39,999 | 26 (12.4%) | 0 (0.0%) |
| $40,000 to $44,999 | 0 (0.0%) | 15 (16.1%) |
| $45,000 to $49,999 | 0 (0.0%) | 0 (0.0%) |
| $50,000 to $54,999 | 0 (0.0%) | 15 (16.1%) |
| $55,000 to $64,999 | 53 (25.2%) | 0 (0.0%) |
| $65,000 to $74,999 | 0 (0.0%) | 0 (0.0%) |
| $75,000 to $99,999 | 16 (7.6%) | 0 (0.0%) |
| $100,000+ | 0 (0.0%) | 0 (0.0%) |
| Total | 210 (100.0%) | 93 (100.0%) |
Earnings by Sex by Educational Attainment in Gila Crossing
| Educational Attainment | Male Income | Female Income |
| Less than High School | - | - |
| High School Diploma | - | - |
| College or Associate's Degree | - | - |
| Bachelor's Degree | - | - |
| Graduate Degree | - | - |
| Total | $36,250 | $34,250 |
Family Income in Gila Crossing
Family Income Brackets in Gila Crossing
According to the Gila Crossing family income data, there are 79 families falling into the $50,000 to $74,999 income range, which is the most common income bracket and makes up 45.4% of all families.
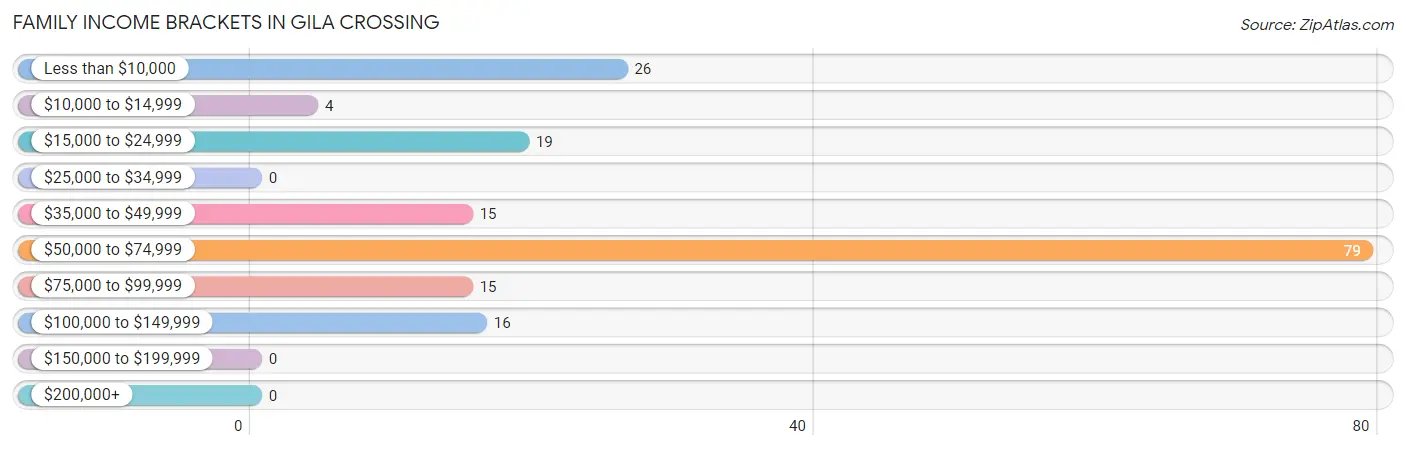
| Income Bracket | # Families | % Families |
| Less than $10,000 | 26 | 14.9% |
| $10,000 to $14,999 | 4 | 2.3% |
| $15,000 to $24,999 | 19 | 10.9% |
| $25,000 to $34,999 | 0 | 0.0% |
| $35,000 to $49,999 | 15 | 8.6% |
| $50,000 to $74,999 | 79 | 45.4% |
| $75,000 to $99,999 | 15 | 8.6% |
| $100,000 to $149,999 | 16 | 9.2% |
| $150,000 to $199,999 | 0 | 0.0% |
| $200,000+ | 0 | 0.0% |
Family Income by Famaliy Size in Gila Crossing
4-person families (85 | 48.8%) account for the highest median family income in Gila Crossing with $55,532 per family, while 4-person families (85 | 48.8%) have the highest median income of $13,883 per family member.
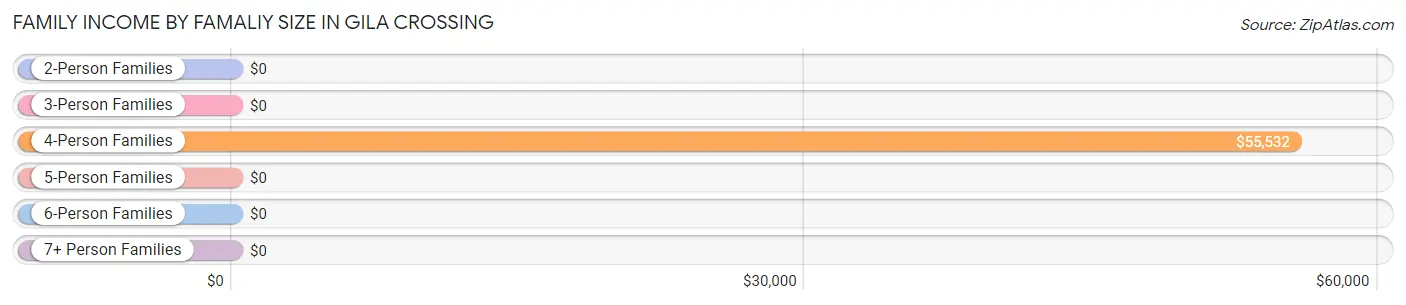
| Income Bracket | # Families | Median Income |
| 2-Person Families | 34 (19.5%) | $0 |
| 3-Person Families | 35 (20.1%) | $0 |
| 4-Person Families | 85 (48.8%) | $55,532 |
| 5-Person Families | 0 (0.0%) | $0 |
| 6-Person Families | 16 (9.2%) | $0 |
| 7+ Person Families | 4 (2.3%) | $0 |
| Total | 174 (100.0%) | $54,500 |
Family Income by Number of Earners in Gila Crossing
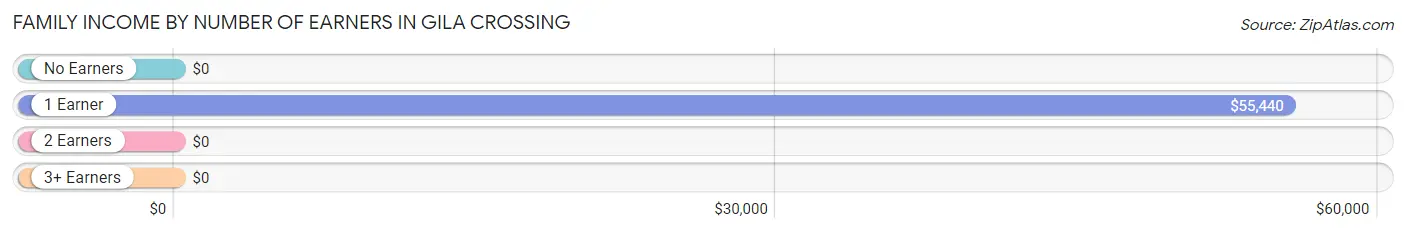
| Number of Earners | # Families | Median Income |
| No Earners | 11 (6.3%) | $0 |
| 1 Earner | 89 (51.1%) | $55,440 |
| 2 Earners | 59 (33.9%) | $0 |
| 3+ Earners | 15 (8.6%) | $0 |
| Total | 174 (100.0%) | $54,500 |
Household Income in Gila Crossing
Household Income Brackets in Gila Crossing
With 79 households falling in the category, the $50,000 to $74,999 income range is the most frequent in Gila Crossing, accounting for 39.3% of all households.
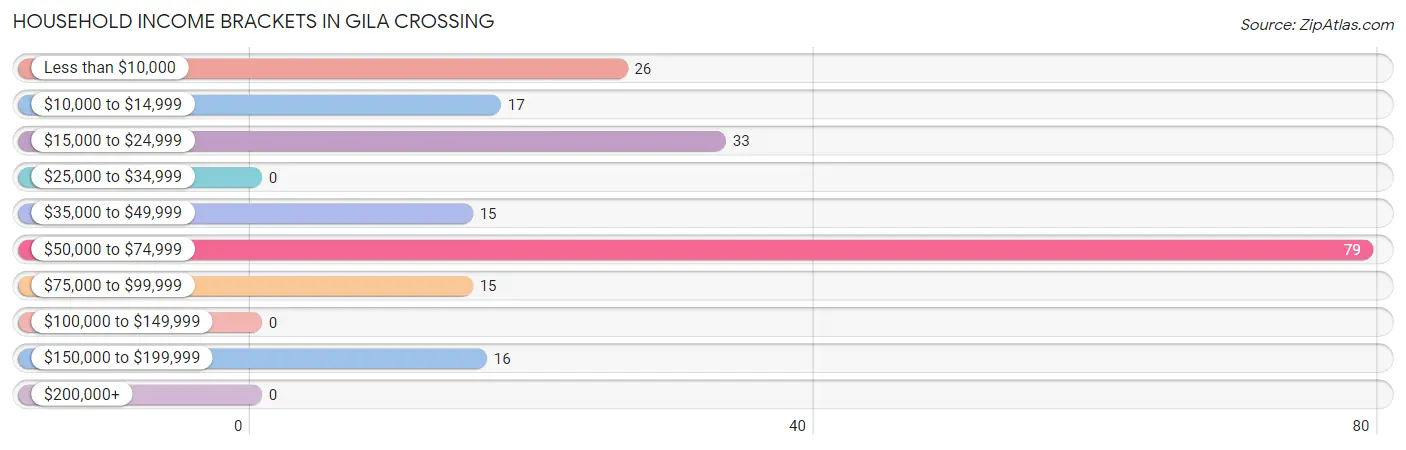
| Income Bracket | # Households | % Households |
| Less than $10,000 | 26 | 12.9% |
| $10,000 to $14,999 | 17 | 8.5% |
| $15,000 to $24,999 | 33 | 16.4% |
| $25,000 to $34,999 | 0 | 0.0% |
| $35,000 to $49,999 | 15 | 7.5% |
| $50,000 to $74,999 | 79 | 39.3% |
| $75,000 to $99,999 | 15 | 7.5% |
| $100,000 to $149,999 | 0 | 0.0% |
| $150,000 to $199,999 | 16 | 8.0% |
| $200,000+ | 0 | 0.0% |
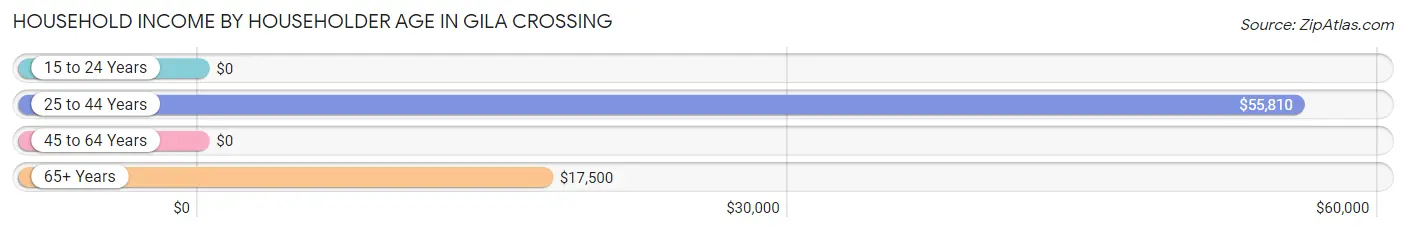
Household Income by Householder Age in Gila Crossing
The median household income in Gila Crossing is $51,583, with the highest median household income of $55,810 found in the 25 to 44 years age bracket for the primary householder. A total of 135 households (67.2%) fall into this category. Meanwhile, the 15 to 24 years age bracket for the primary householder has the lowest median household income of $0, with 4 households (2.0%) in this group.
| Income Bracket | # Households | Median Income |
| 15 to 24 Years | 4 (2.0%) | $0 |
| 25 to 44 Years | 135 (67.2%) | $55,810 |
| 45 to 64 Years | 36 (17.9%) | $0 |
| 65+ Years | 26 (12.9%) | $17,500 |
| Total | 201 (100.0%) | $51,583 |
Poverty in Gila Crossing
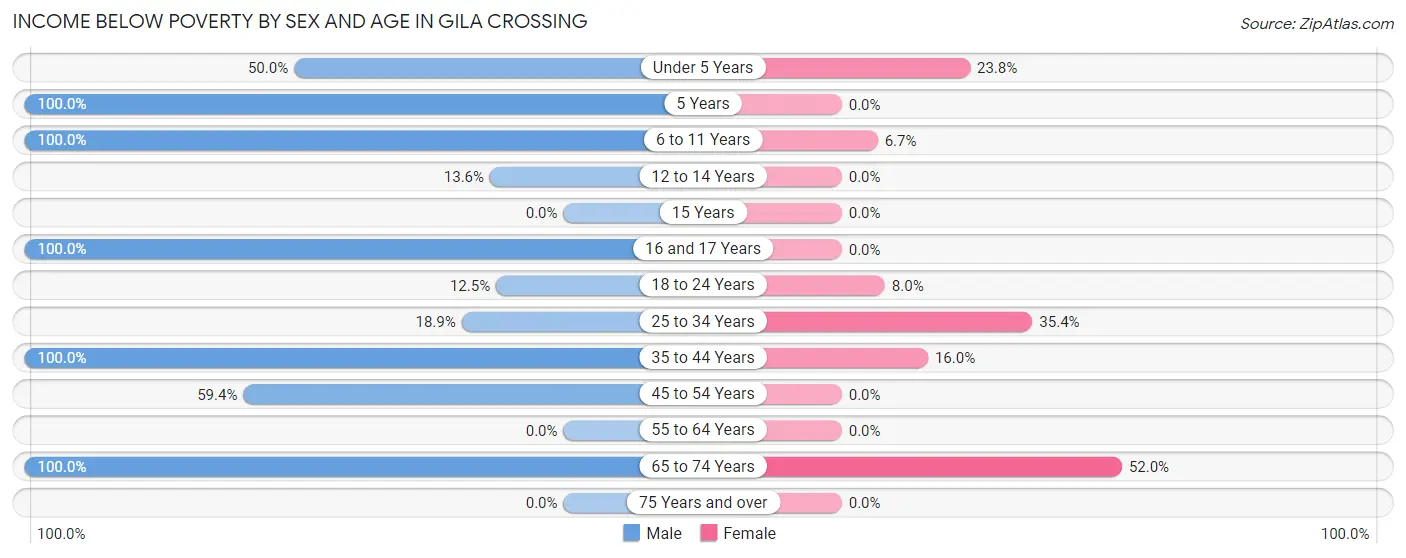
Income Below Poverty by Sex and Age in Gila Crossing
With 52.9% poverty level for males and 17.9% for females among the residents of Gila Crossing, 5 year old males and 65 to 74 year old females are the most vulnerable to poverty, with 3 males (100.0%) and 13 females (52.0%) in their respective age groups living below the poverty level.
| Age Bracket | Male | Female |
| Under 5 Years | 19 (50.0%) | 15 (23.8%) |
| 5 Years | 3 (100.0%) | 0 (0.0%) |
| 6 to 11 Years | 8 (100.0%) | 2 (6.7%) |
| 12 to 14 Years | 3 (13.6%) | 0 (0.0%) |
| 15 Years | 0 (0.0%) | 0 (0.0%) |
| 16 and 17 Years | 47 (100.0%) | 0 (0.0%) |
| 18 to 24 Years | 4 (12.5%) | 6 (8.0%) |
| 25 to 34 Years | 24 (18.9%) | 46 (35.4%) |
| 35 to 44 Years | 19 (100.0%) | 8 (16.0%) |
| 45 to 54 Years | 41 (59.4%) | 0 (0.0%) |
| 55 to 64 Years | 0 (0.0%) | 0 (0.0%) |
| 65 to 74 Years | 76 (100.0%) | 13 (52.0%) |
| 75 Years and over | 0 (0.0%) | 0 (0.0%) |
| Total | 244 (52.9%) | 90 (17.9%) |
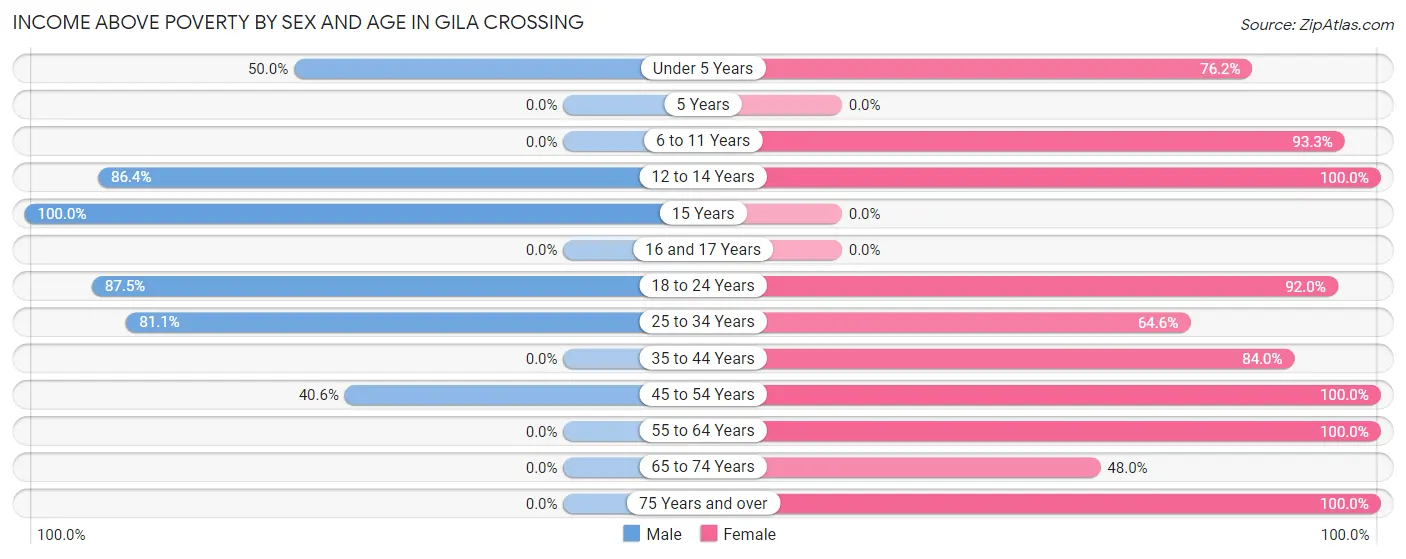
Income Above Poverty by Sex and Age in Gila Crossing
According to the poverty statistics in Gila Crossing, males aged 15 years and females aged 12 to 14 years are the age groups that are most secure financially, with 100.0% of males and 100.0% of females in these age groups living above the poverty line.
| Age Bracket | Male | Female |
| Under 5 Years | 19 (50.0%) | 48 (76.2%) |
| 5 Years | 0 (0.0%) | 0 (0.0%) |
| 6 to 11 Years | 0 (0.0%) | 28 (93.3%) |
| 12 to 14 Years | 19 (86.4%) | 61 (100.0%) |
| 15 Years | 20 (100.0%) | 0 (0.0%) |
| 16 and 17 Years | 0 (0.0%) | 0 (0.0%) |
| 18 to 24 Years | 28 (87.5%) | 69 (92.0%) |
| 25 to 34 Years | 103 (81.1%) | 84 (64.6%) |
| 35 to 44 Years | 0 (0.0%) | 42 (84.0%) |
| 45 to 54 Years | 28 (40.6%) | 38 (100.0%) |
| 55 to 64 Years | 0 (0.0%) | 31 (100.0%) |
| 65 to 74 Years | 0 (0.0%) | 12 (48.0%) |
| 75 Years and over | 0 (0.0%) | 1 (100.0%) |
| Total | 217 (47.1%) | 414 (82.1%) |
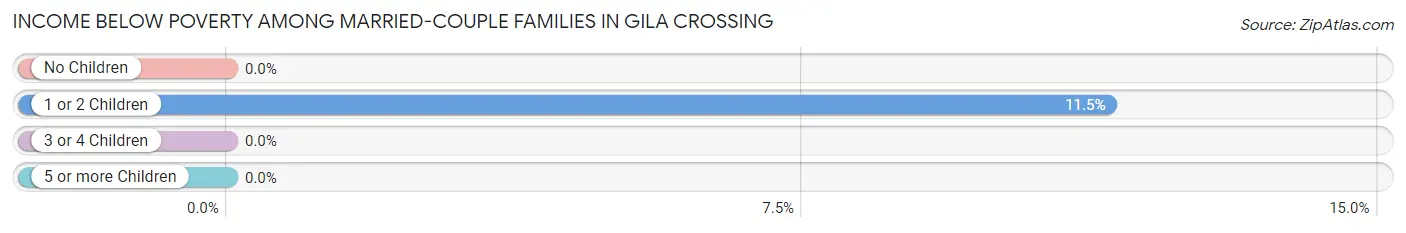
Income Below Poverty Among Married-Couple Families in Gila Crossing
The poverty statistics for married-couple families in Gila Crossing show that 11.5% or 7 of the total 61 families live below the poverty line. Families with 1 or 2 children have the highest poverty rate of 11.5%, comprising of 7 families. On the other hand, families with 1 or 2 children have the lowest poverty rate of 11.5%, which includes 7 families.
| Children | Above Poverty | Below Poverty |
| No Children | 0 (0.0%) | 0 (0.0%) |
| 1 or 2 Children | 54 (88.5%) | 7 (11.5%) |
| 3 or 4 Children | 0 (0.0%) | 0 (0.0%) |
| 5 or more Children | 0 (0.0%) | 0 (0.0%) |
| Total | 54 (88.5%) | 7 (11.5%) |
Income Below Poverty Among Single-Parent Households in Gila Crossing
According to the poverty data in Gila Crossing, 59.0% or 23 single-father households and 25.7% or 19 single-mother households are living below the poverty line. Among single-father households, those with 3 or 4 children have the highest poverty rate, with 4 households (100.0%) experiencing poverty. Likewise, among single-mother households, those with 1 or 2 children have the highest poverty rate, with 19 households (38.8%) falling below the poverty line.
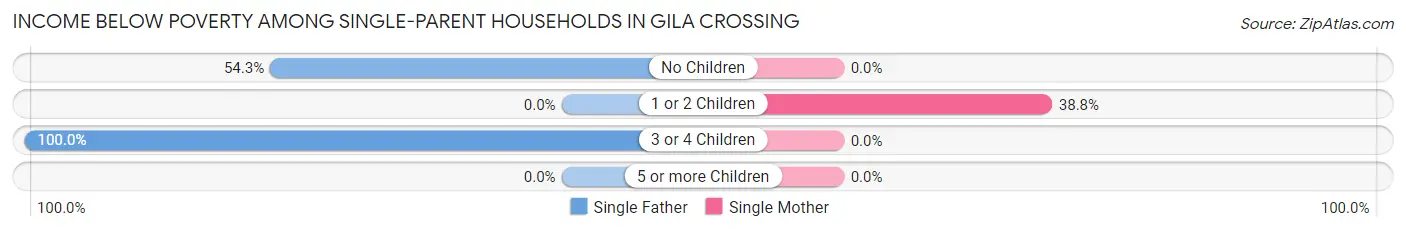
| Children | Single Father | Single Mother |
| No Children | 19 (54.3%) | 0 (0.0%) |
| 1 or 2 Children | 0 (0.0%) | 19 (38.8%) |
| 3 or 4 Children | 4 (100.0%) | 0 (0.0%) |
| 5 or more Children | 0 (0.0%) | 0 (0.0%) |
| Total | 23 (59.0%) | 19 (25.7%) |
Income Below Poverty Among Married-Couple vs Single-Parent Households in Gila Crossing
The poverty data for Gila Crossing shows that 7 of the married-couple family households (11.5%) and 42 of the single-parent households (37.2%) are living below the poverty level. Within the married-couple family households, those with 1 or 2 children have the highest poverty rate, with 7 households (11.5%) falling below the poverty line. Among the single-parent households, those with 3 or 4 children have the highest poverty rate, with 4 household (80.0%) living below poverty.
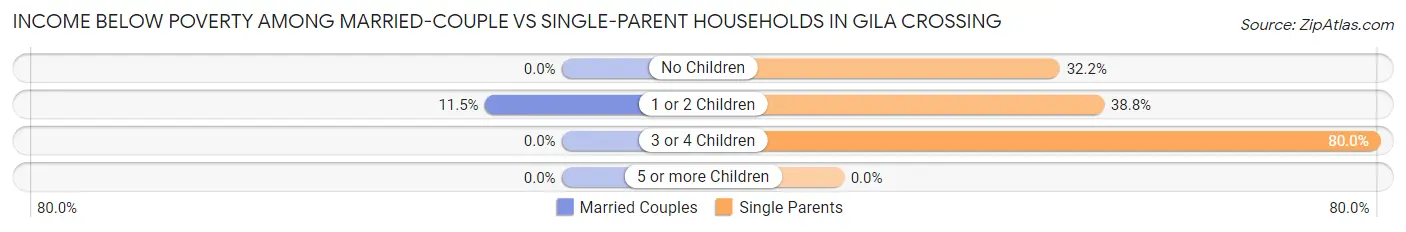
| Children | Married-Couple Families | Single-Parent Households |
| No Children | 0 (0.0%) | 19 (32.2%) |
| 1 or 2 Children | 7 (11.5%) | 19 (38.8%) |
| 3 or 4 Children | 0 (0.0%) | 4 (80.0%) |
| 5 or more Children | 0 (0.0%) | 0 (0.0%) |
| Total | 7 (11.5%) | 42 (37.2%) |
Race in Gila Crossing
The most populous races in Gila Crossing are Native / Alaskan (584 | 60.5%), Hispanic or Latino (373 | 38.7%), and Two or more Races (188 | 19.5%).
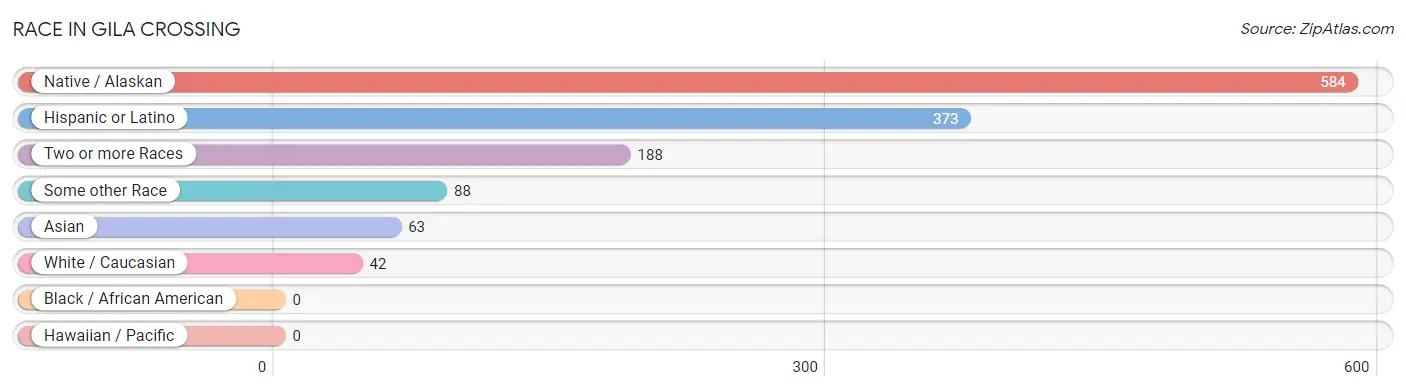
| Race | # Population | % Population |
| Asian | 63 | 6.5% |
| Black / African American | 0 | 0.0% |
| Hawaiian / Pacific | 0 | 0.0% |
| Hispanic or Latino | 373 | 38.7% |
| Native / Alaskan | 584 | 60.5% |
| White / Caucasian | 42 | 4.3% |
| Two or more Races | 188 | 19.5% |
| Some other Race | 88 | 9.1% |
| Total | 965 | 100.0% |
Ancestry in Gila Crossing
The most populous ancestries reported in Gila Crossing are Pima (467 | 48.4%), Mexican (373 | 38.7%), Thai (63 | 6.5%), German (54 | 5.6%), and Tohono O'Odham (50 | 5.2%), together accounting for 104.4% of all Gila Crossing residents.
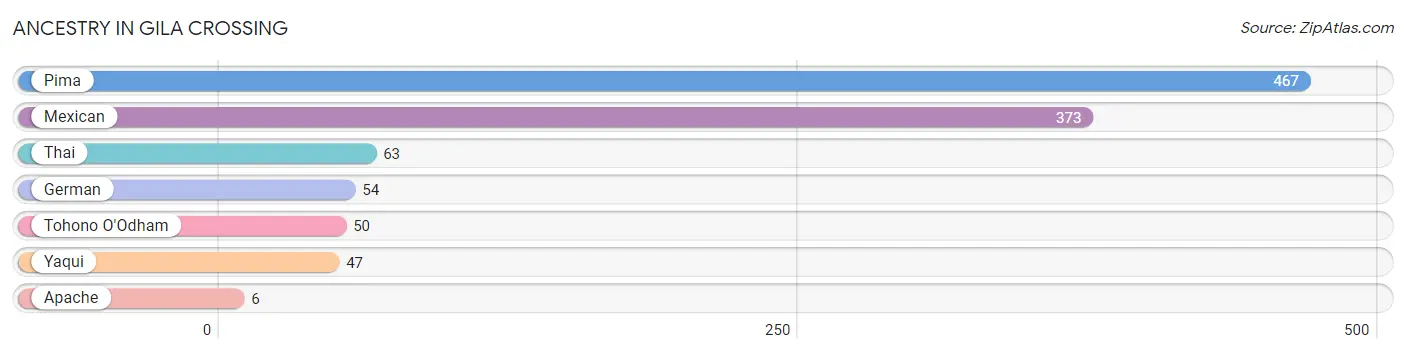
| Ancestry | # Population | % Population |
| Apache | 6 | 0.6% |
| German | 54 | 5.6% |
| Mexican | 373 | 38.7% |
| Pima | 467 | 48.4% |
| Thai | 63 | 6.5% |
| Tohono O'Odham | 50 | 5.2% |
| Yaqui | 47 | 4.9% | View All 7 Rows |
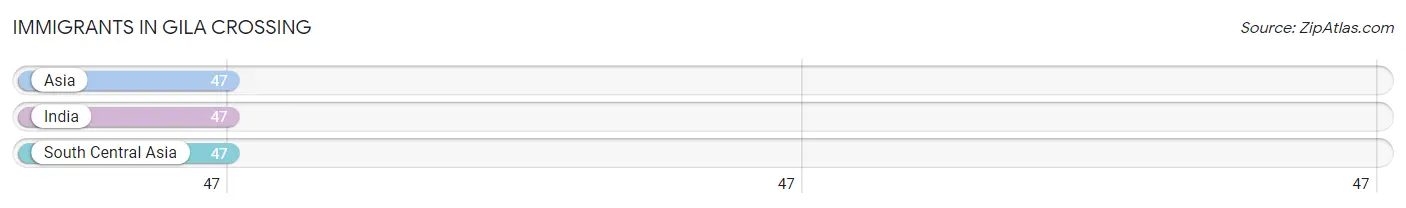
Immigrants in Gila Crossing
The most numerous immigrant groups reported in Gila Crossing came from Asia (47 | 4.9%), India (47 | 4.9%), and South Central Asia (47 | 4.9%), together accounting for 14.6% of all Gila Crossing residents.
| Immigration Origin | # Population | % Population |
| Asia | 47 | 4.9% |
| India | 47 | 4.9% |
| South Central Asia | 47 | 4.9% | View All 3 Rows |
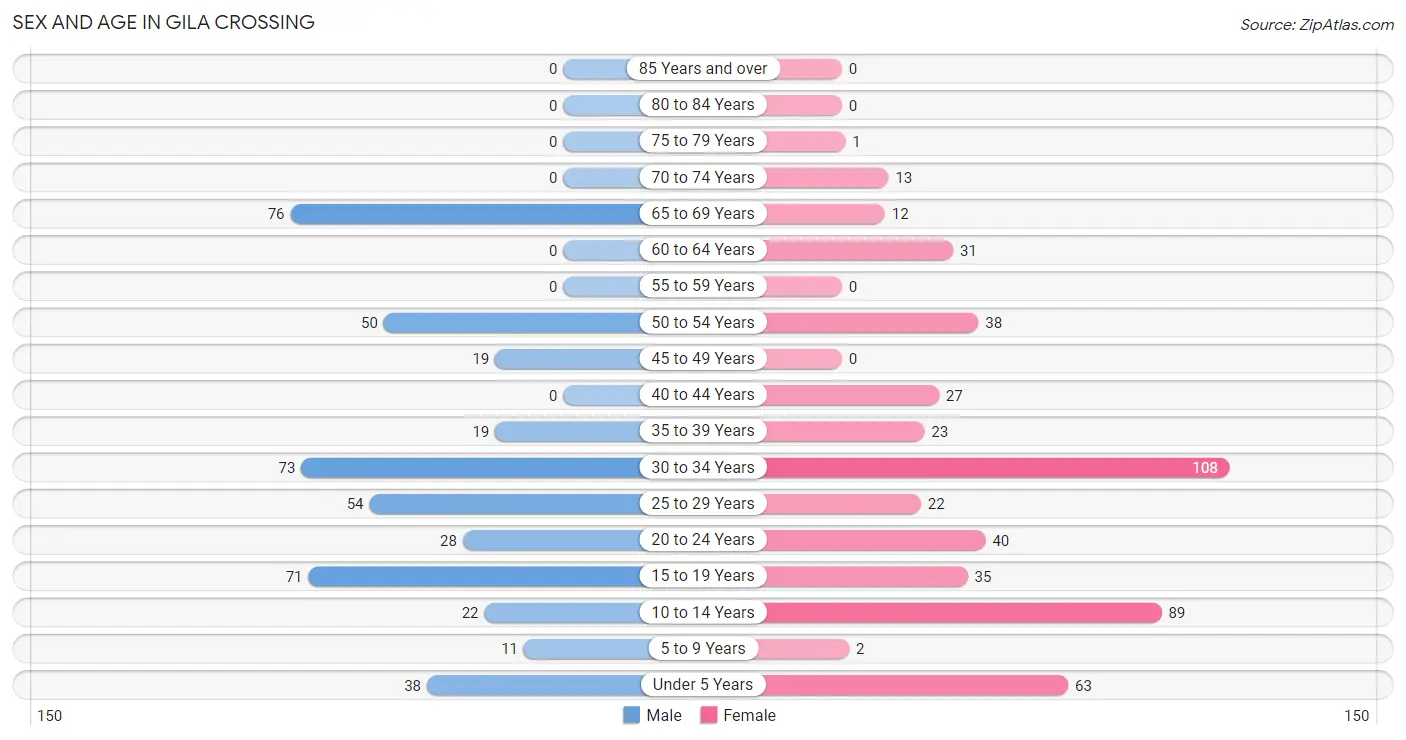
Sex and Age in Gila Crossing
Sex and Age in Gila Crossing
The most populous age groups in Gila Crossing are 65 to 69 Years (76 | 16.5%) for men and 30 to 34 Years (108 | 21.4%) for women.
| Age Bracket | Male | Female |
| Under 5 Years | 38 (8.2%) | 63 (12.5%) |
| 5 to 9 Years | 11 (2.4%) | 2 (0.4%) |
| 10 to 14 Years | 22 (4.8%) | 89 (17.7%) |
| 15 to 19 Years | 71 (15.4%) | 35 (6.9%) |
| 20 to 24 Years | 28 (6.1%) | 40 (7.9%) |
| 25 to 29 Years | 54 (11.7%) | 22 (4.4%) |
| 30 to 34 Years | 73 (15.8%) | 108 (21.4%) |
| 35 to 39 Years | 19 (4.1%) | 23 (4.6%) |
| 40 to 44 Years | 0 (0.0%) | 27 (5.4%) |
| 45 to 49 Years | 19 (4.1%) | 0 (0.0%) |
| 50 to 54 Years | 50 (10.8%) | 38 (7.5%) |
| 55 to 59 Years | 0 (0.0%) | 0 (0.0%) |
| 60 to 64 Years | 0 (0.0%) | 31 (6.1%) |
| 65 to 69 Years | 76 (16.5%) | 12 (2.4%) |
| 70 to 74 Years | 0 (0.0%) | 13 (2.6%) |
| 75 to 79 Years | 0 (0.0%) | 1 (0.2%) |
| 80 to 84 Years | 0 (0.0%) | 0 (0.0%) |
| 85 Years and over | 0 (0.0%) | 0 (0.0%) |
| Total | 461 (100.0%) | 504 (100.0%) |
Families and Households in Gila Crossing
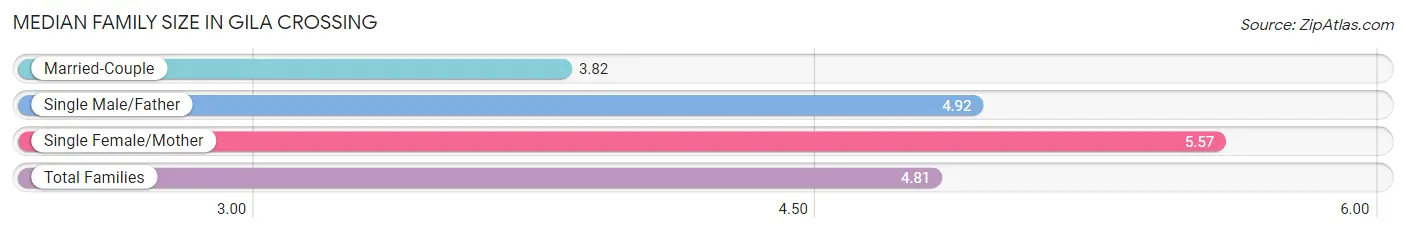
Median Family Size in Gila Crossing
The median family size in Gila Crossing is 4.81 persons per family, with single female/mother families (74 | 42.5%) accounting for the largest median family size of 5.57 persons per family. On the other hand, married-couple families (61 | 35.1%) represent the smallest median family size with 3.82 persons per family.
| Family Type | # Families | Family Size |
| Married-Couple | 61 (35.1%) | 3.82 |
| Single Male/Father | 39 (22.4%) | 4.92 |
| Single Female/Mother | 74 (42.5%) | 5.57 |
| Total Families | 174 (100.0%) | 4.81 |
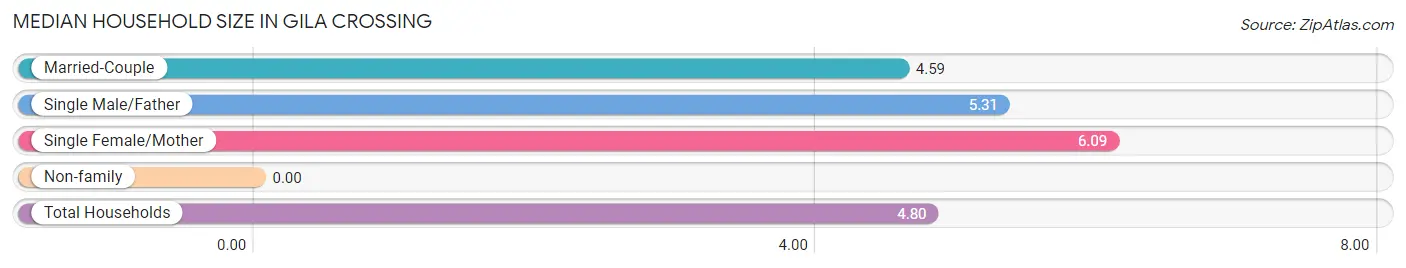
Median Household Size in Gila Crossing
| Household Type | # Households | Household Size |
| Married-Couple | 61 (30.3%) | 4.59 |
| Single Male/Father | 39 (19.4%) | 5.31 |
| Single Female/Mother | 74 (36.8%) | 6.09 |
| Non-family | 27 (13.4%) | - |
| Total Households | 201 (100.0%) | 4.80 |
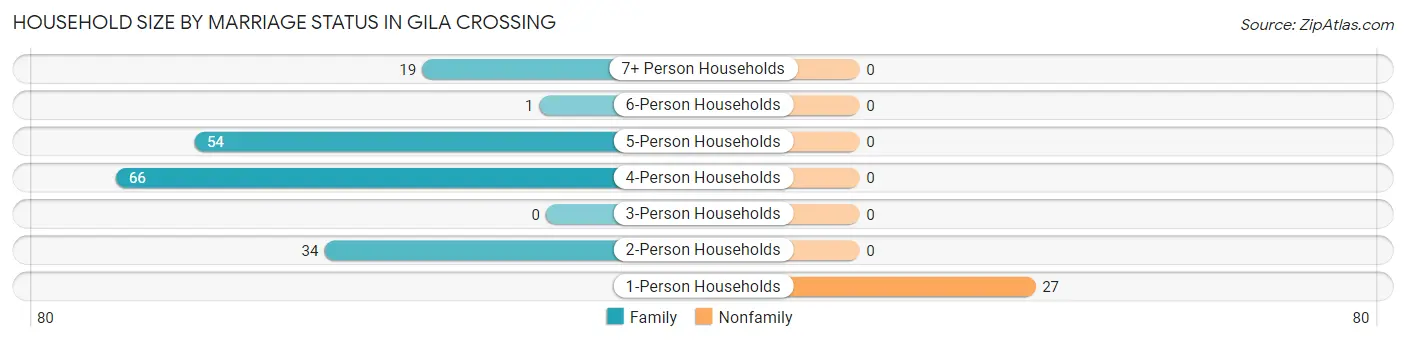
Household Size by Marriage Status in Gila Crossing
Out of a total of 201 households in Gila Crossing, 174 (86.6%) are family households, while 27 (13.4%) are nonfamily households. The most numerous type of family households are 4-person households, comprising 66, and the most common type of nonfamily households are 1-person households, comprising 27.
| Household Size | Family Households | Nonfamily Households |
| 1-Person Households | - | 27 (13.4%) |
| 2-Person Households | 34 (16.9%) | 0 (0.0%) |
| 3-Person Households | 0 (0.0%) | 0 (0.0%) |
| 4-Person Households | 66 (32.8%) | 0 (0.0%) |
| 5-Person Households | 54 (26.9%) | 0 (0.0%) |
| 6-Person Households | 1 (0.5%) | 0 (0.0%) |
| 7+ Person Households | 19 (9.5%) | 0 (0.0%) |
| Total | 174 (86.6%) | 27 (13.4%) |
Female Fertility in Gila Crossing
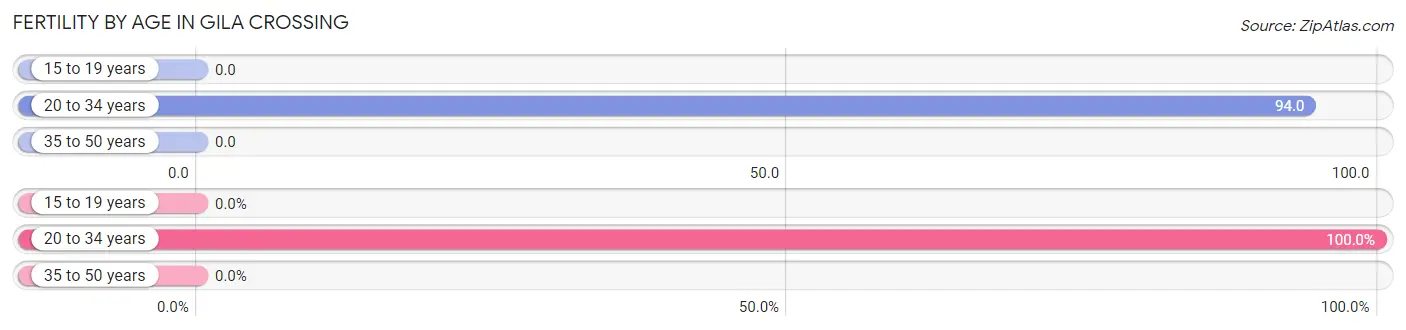
Fertility by Age in Gila Crossing
Average fertility rate in Gila Crossing is 63.0 births per 1,000 women. Women in the age bracket of 20 to 34 years have the highest fertility rate with 94.0 births per 1,000 women. Women in the age bracket of 20 to 34 years acount for 100.0% of all women with births.
| Age Bracket | Women with Births | Births / 1,000 Women |
| 15 to 19 years | 0 (0.0%) | 0.0 |
| 20 to 34 years | 16 (100.0%) | 94.0 |
| 35 to 50 years | 0 (0.0%) | 0.0 |
| Total | 16 (100.0%) | 63.0 |
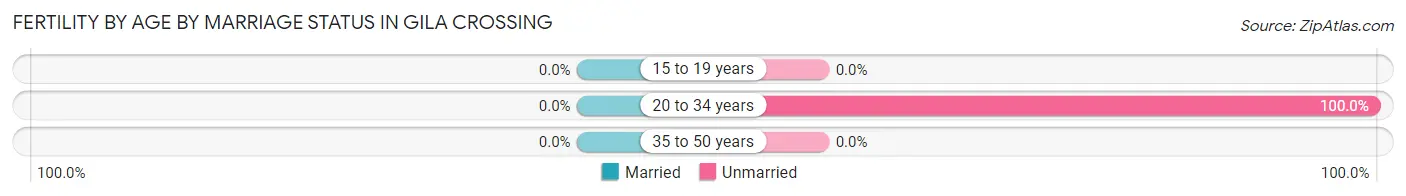
Fertility by Age by Marriage Status in Gila Crossing
| Age Bracket | Married | Unmarried |
| 15 to 19 years | 0 (0.0%) | 0 (0.0%) |
| 20 to 34 years | 0 (0.0%) | 16 (100.0%) |
| 35 to 50 years | 0 (0.0%) | 0 (0.0%) |
| Total | 0 (0.0%) | 16 (100.0%) |
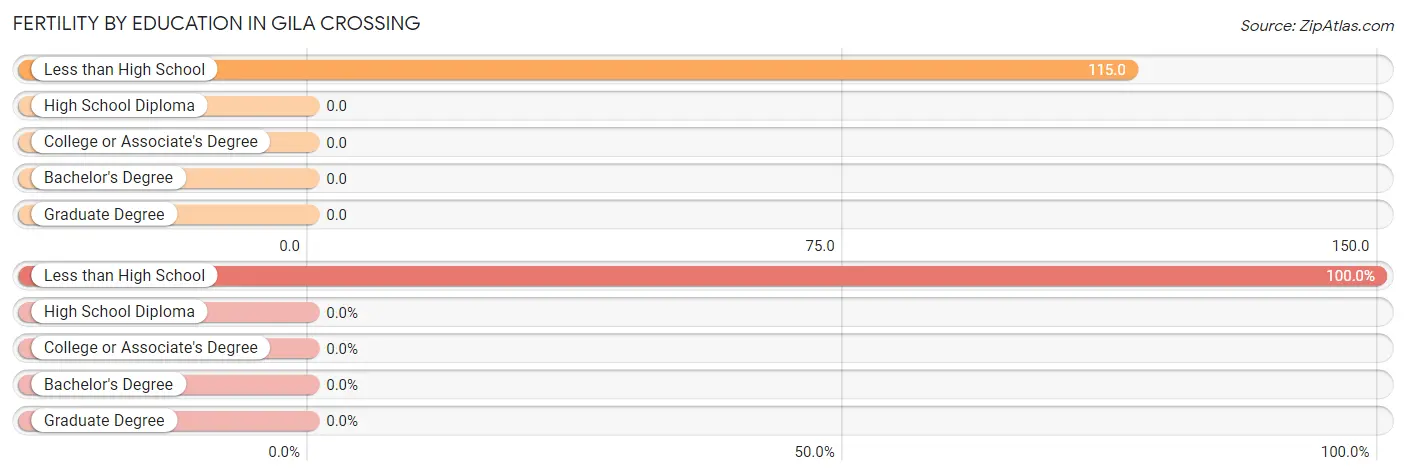
Fertility by Education in Gila Crossing
| Educational Attainment | Women with Births | Births / 1,000 Women |
| Less than High School | 16 (100.0%) | 115.0 |
| High School Diploma | 0 (0.0%) | 0.0 |
| College or Associate's Degree | 0 (0.0%) | 0.0 |
| Bachelor's Degree | 0 (0.0%) | 0.0 |
| Graduate Degree | 0 (0.0%) | 0.0 |
| Total | 16 (100.0%) | 63.0 |
Fertility by Education by Marriage Status in Gila Crossing
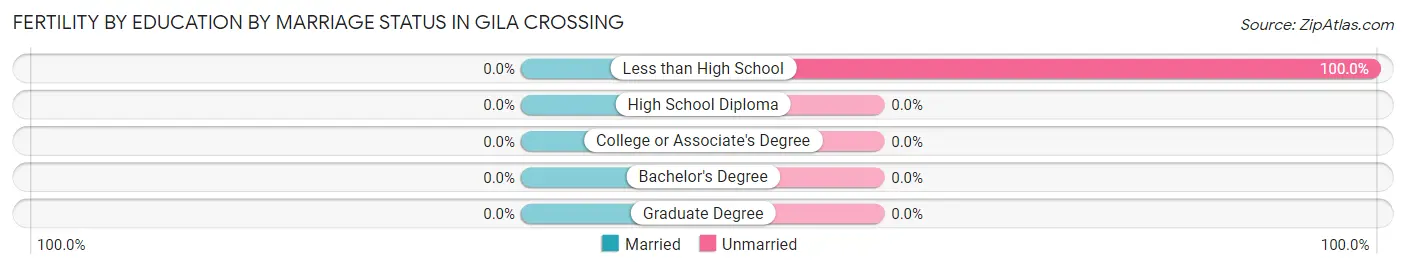
| Educational Attainment | Married | Unmarried |
| Less than High School | 0 (0.0%) | 16 (100.0%) |
| High School Diploma | 0 (0.0%) | 0 (0.0%) |
| College or Associate's Degree | 0 (0.0%) | 0 (0.0%) |
| Bachelor's Degree | 0 (0.0%) | 0 (0.0%) |
| Graduate Degree | 0 (0.0%) | 0 (0.0%) |
| Total | 0 (0.0%) | 16 (100.0%) |
Employment Characteristics in Gila Crossing
Employment by Class of Employer in Gila Crossing
Among the 303 employed individuals in Gila Crossing, private company employees (229 | 75.6%), not-for-profit organizations (59 | 19.5%), and local government employees (15 | 5.0%) make up the most common classes of employment.
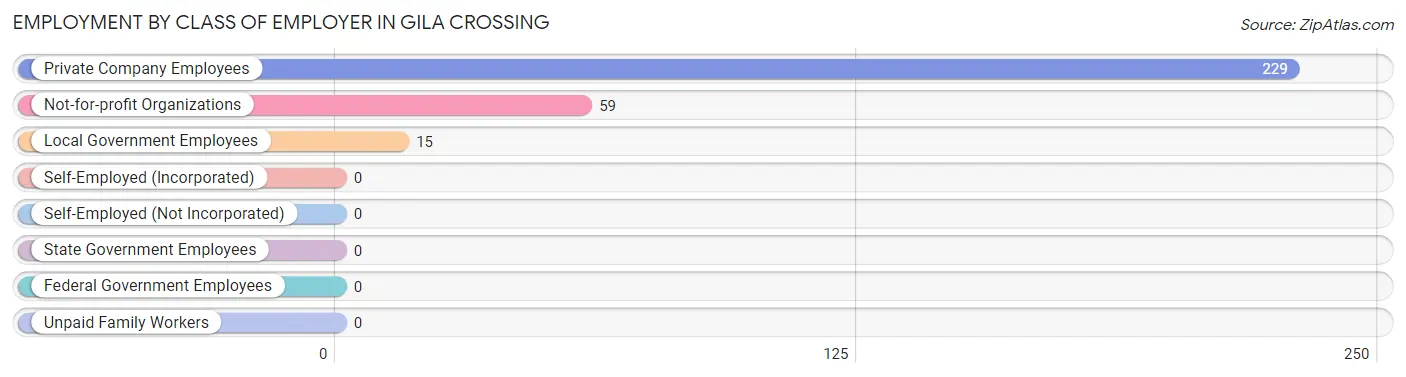
| Employer Class | # Employees | % Employees |
| Private Company Employees | 229 | 75.6% |
| Self-Employed (Incorporated) | 0 | 0.0% |
| Self-Employed (Not Incorporated) | 0 | 0.0% |
| Not-for-profit Organizations | 59 | 19.5% |
| Local Government Employees | 15 | 5.0% |
| State Government Employees | 0 | 0.0% |
| Federal Government Employees | 0 | 0.0% |
| Unpaid Family Workers | 0 | 0.0% |
| Total | 303 | 100.0% |
Employment Status by Age in Gila Crossing
According to the labor force statistics for Gila Crossing, out of the total population over 16 years of age (720), 49.7% or 358 individuals are in the labor force, with 15.4% or 55 of them unemployed. The age group with the highest labor force participation rate is 25 to 29 years, with 90.8% or 69 individuals in the labor force. Within the labor force, the 16 to 19 years age range has the highest percentage of unemployed individuals, with 100.0% or 47 of them being unemployed.
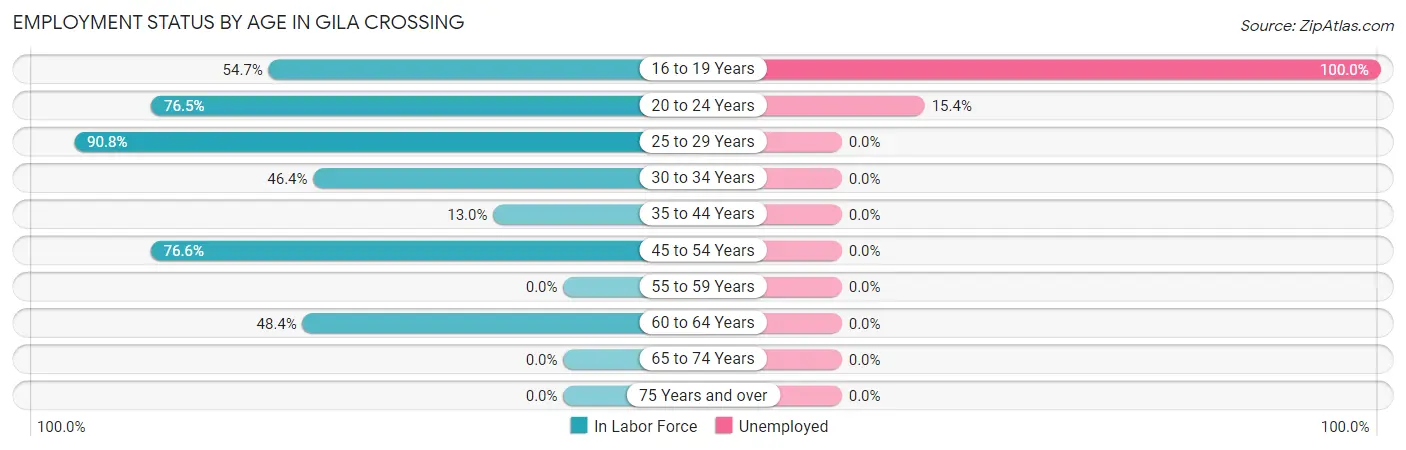
| Age Bracket | In Labor Force | Unemployed |
| 16 to 19 Years | 47 (54.7%) | 47 (100.0%) |
| 20 to 24 Years | 52 (76.5%) | 8 (15.4%) |
| 25 to 29 Years | 69 (90.8%) | 0 (0.0%) |
| 30 to 34 Years | 84 (46.4%) | 0 (0.0%) |
| 35 to 44 Years | 9 (13.0%) | 0 (0.0%) |
| 45 to 54 Years | 82 (76.6%) | 0 (0.0%) |
| 55 to 59 Years | 0 (0.0%) | 0 (0.0%) |
| 60 to 64 Years | 15 (48.4%) | 0 (0.0%) |
| 65 to 74 Years | 0 (0.0%) | 0 (0.0%) |
| 75 Years and over | 0 (0.0%) | 0 (0.0%) |
| Total | 358 (49.7%) | 55 (15.4%) |
Employment Status by Educational Attainment in Gila Crossing
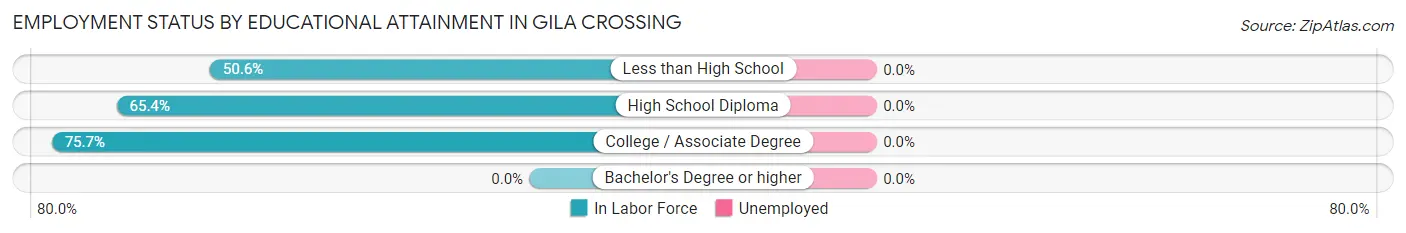
| Educational Attainment | In Labor Force | Unemployed |
| Less than High School | 133 (50.6%) | 0 (0.0%) |
| High School Diploma | 70 (65.4%) | 0 (0.0%) |
| College / Associate Degree | 56 (75.7%) | 0 (0.0%) |
| Bachelor's Degree or higher | 0 (0.0%) | 0 (0.0%) |
| Total | 259 (55.8%) | 0 (0.0%) |
Employment Occupations by Sex in Gila Crossing
Management, Business, Science and Arts Occupations
The most common Management, Business, Science and Arts occupations in Gila Crossing are , and Management (16 | 5.3%).
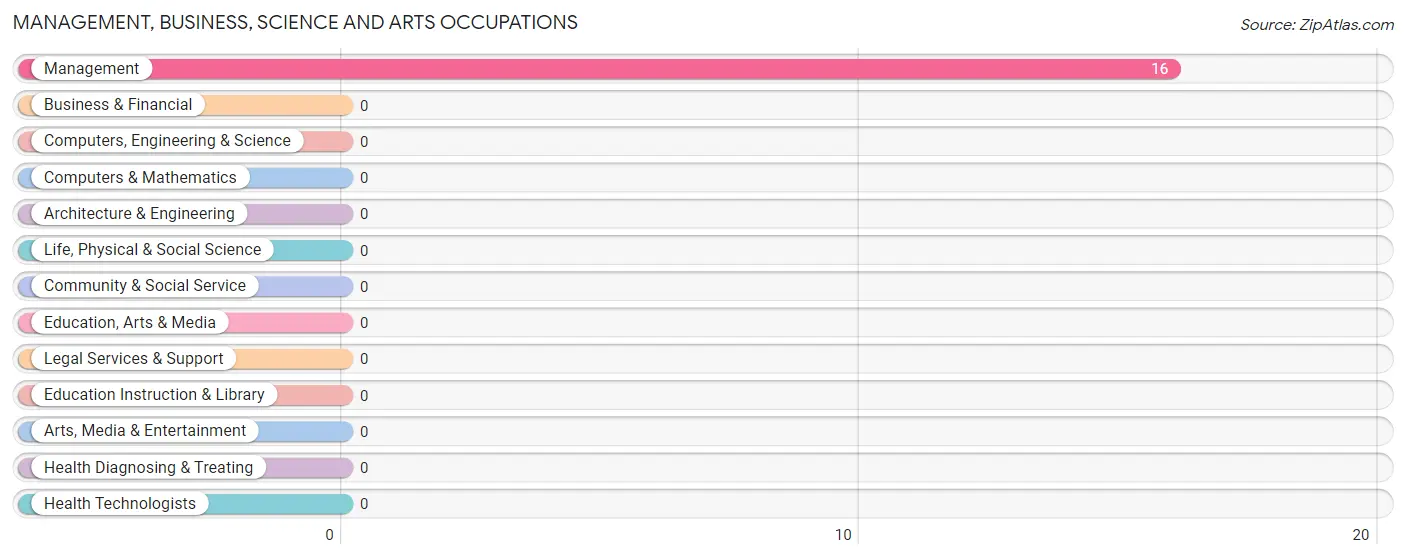
Management, Business, Science and Arts Occupations by Sex
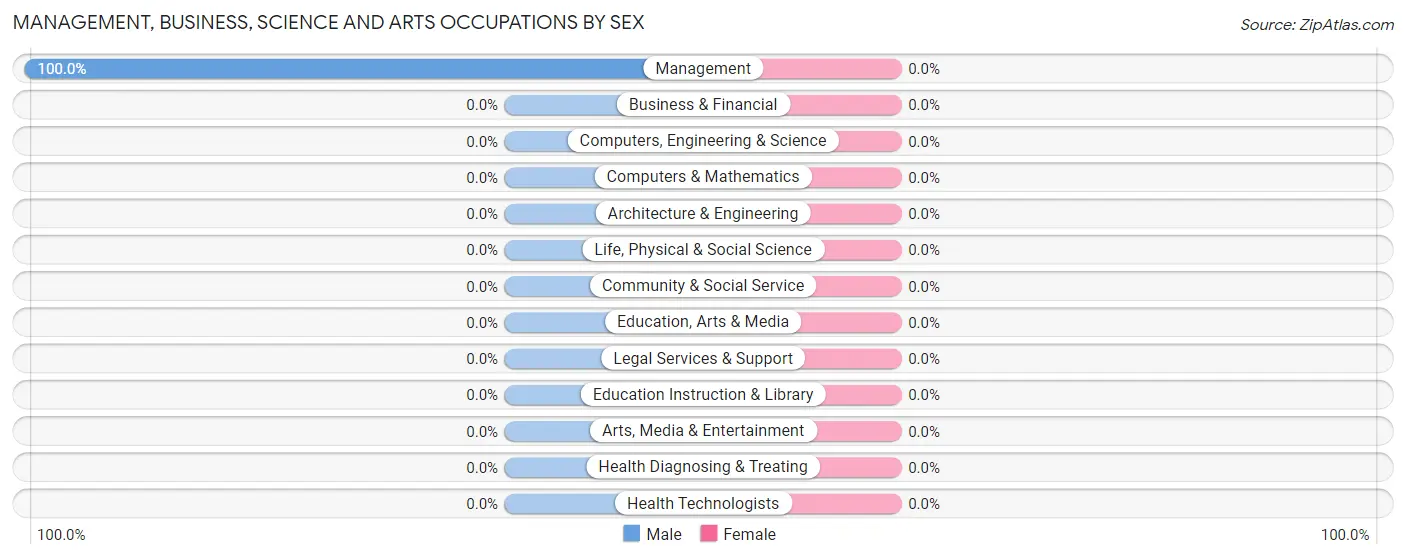
| Occupation | Male | Female |
| Management | 16 (100.0%) | 0 (0.0%) |
| Business & Financial | 0 (0.0%) | 0 (0.0%) |
| Computers, Engineering & Science | 0 (0.0%) | 0 (0.0%) |
| Computers & Mathematics | 0 (0.0%) | 0 (0.0%) |
| Architecture & Engineering | 0 (0.0%) | 0 (0.0%) |
| Life, Physical & Social Science | 0 (0.0%) | 0 (0.0%) |
| Community & Social Service | 0 (0.0%) | 0 (0.0%) |
| Education, Arts & Media | 0 (0.0%) | 0 (0.0%) |
| Legal Services & Support | 0 (0.0%) | 0 (0.0%) |
| Education Instruction & Library | 0 (0.0%) | 0 (0.0%) |
| Arts, Media & Entertainment | 0 (0.0%) | 0 (0.0%) |
| Health Diagnosing & Treating | 0 (0.0%) | 0 (0.0%) |
| Health Technologists | 0 (0.0%) | 0 (0.0%) |
| Total (Category) | 16 (100.0%) | 0 (0.0%) |
| Total (Overall) | 210 (69.3%) | 93 (30.7%) |
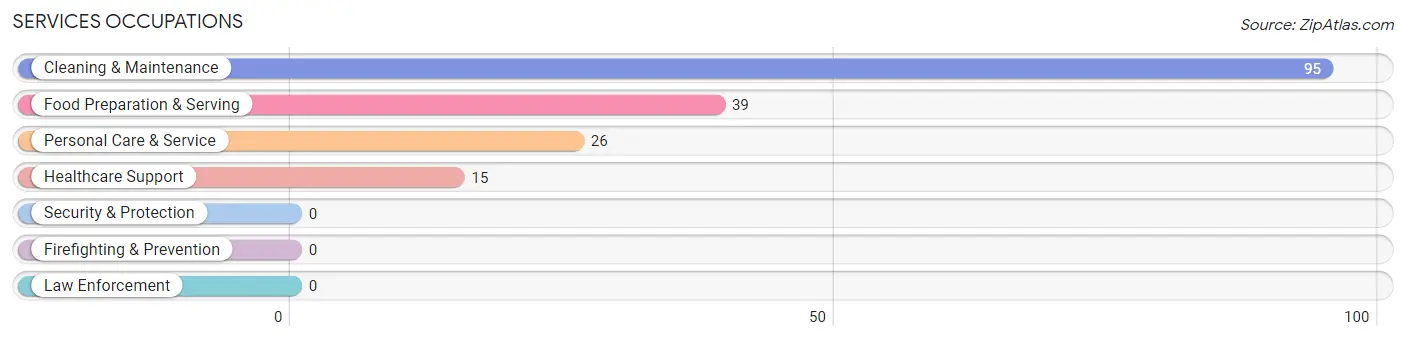
Services Occupations
The most common Services occupations in Gila Crossing are Cleaning & Maintenance (95 | 31.4%), Food Preparation & Serving (39 | 12.9%), Personal Care & Service (26 | 8.6%), and Healthcare Support (15 | 5.0%).
Services Occupations by Sex
Within the Services occupations in Gila Crossing, the most male-oriented occupations are Personal Care & Service (100.0%), and Cleaning & Maintenance (84.2%), while the most female-oriented occupations are Healthcare Support (100.0%), Food Preparation & Serving (100.0%), and Cleaning & Maintenance (15.8%).
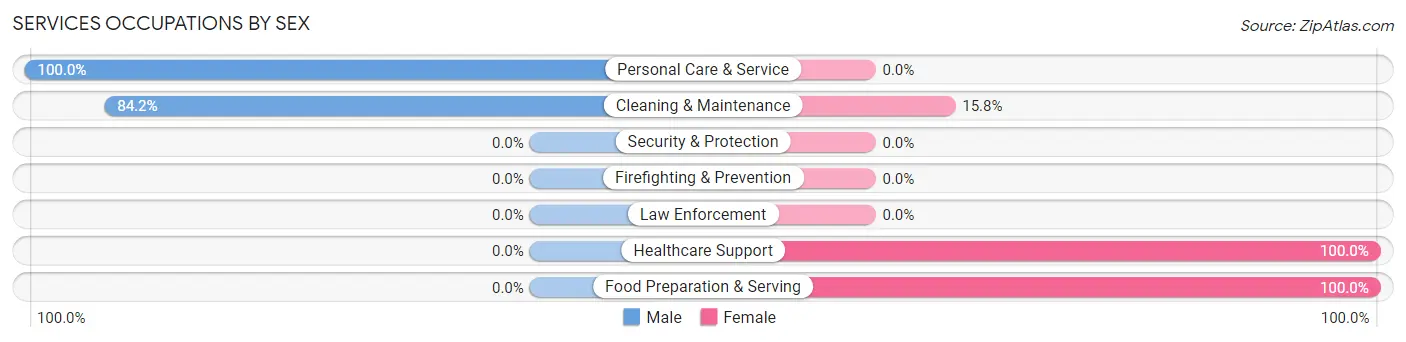
| Occupation | Male | Female |
| Healthcare Support | 0 (0.0%) | 15 (100.0%) |
| Security & Protection | 0 (0.0%) | 0 (0.0%) |
| Firefighting & Prevention | 0 (0.0%) | 0 (0.0%) |
| Law Enforcement | 0 (0.0%) | 0 (0.0%) |
| Food Preparation & Serving | 0 (0.0%) | 39 (100.0%) |
| Cleaning & Maintenance | 80 (84.2%) | 15 (15.8%) |
| Personal Care & Service | 26 (100.0%) | 0 (0.0%) |
| Total (Category) | 106 (60.6%) | 69 (39.4%) |
| Total (Overall) | 210 (69.3%) | 93 (30.7%) |
Sales and Office Occupations
The most common Sales and Office occupations in Gila Crossing are Office & Administration (15 | 5.0%), and Sales & Related (9 | 3.0%).
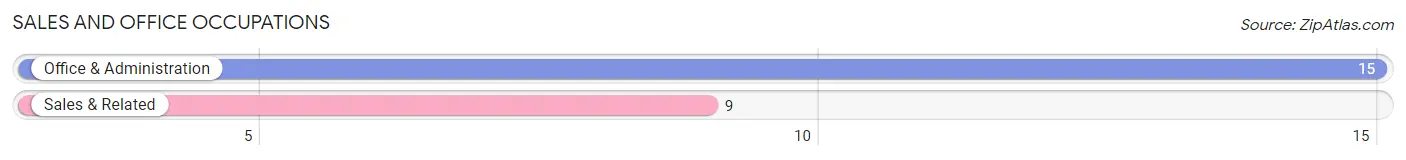
Sales and Office Occupations by Sex
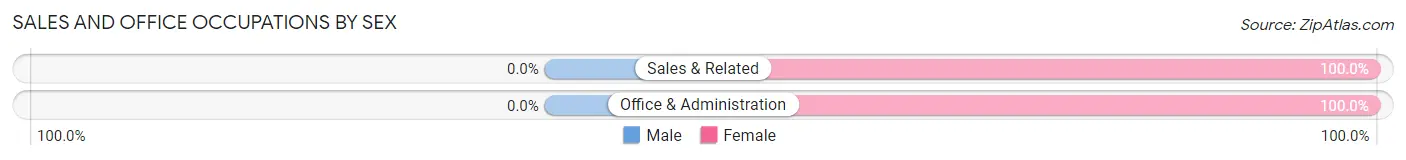
| Occupation | Male | Female |
| Sales & Related | 0 (0.0%) | 9 (100.0%) |
| Office & Administration | 0 (0.0%) | 15 (100.0%) |
| Total (Category) | 0 (0.0%) | 24 (100.0%) |
| Total (Overall) | 210 (69.3%) | 93 (30.7%) |
Natural Resources, Construction and Maintenance Occupations
The most common Natural Resources, Construction and Maintenance occupations in Gila Crossing are , and Construction & Extraction (53 | 17.5%).
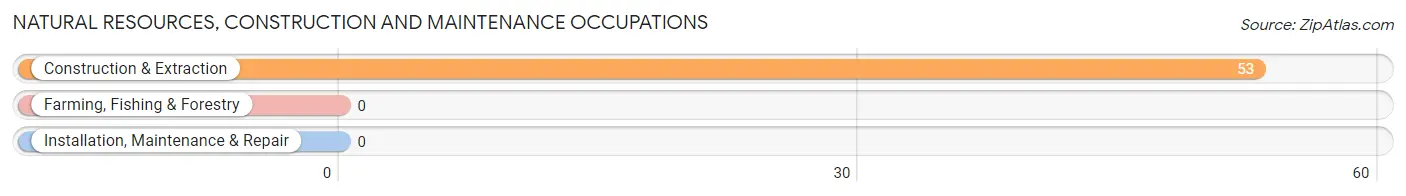
Natural Resources, Construction and Maintenance Occupations by Sex
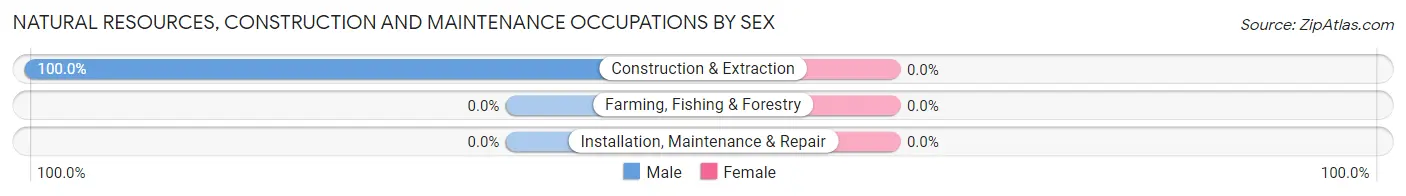
| Occupation | Male | Female |
| Farming, Fishing & Forestry | 0 (0.0%) | 0 (0.0%) |
| Construction & Extraction | 53 (100.0%) | 0 (0.0%) |
| Installation, Maintenance & Repair | 0 (0.0%) | 0 (0.0%) |
| Total (Category) | 53 (100.0%) | 0 (0.0%) |
| Total (Overall) | 210 (69.3%) | 93 (30.7%) |
Production, Transportation and Moving Occupations
The most common Production, Transportation and Moving occupations in Gila Crossing are , and Transportation (35 | 11.6%).
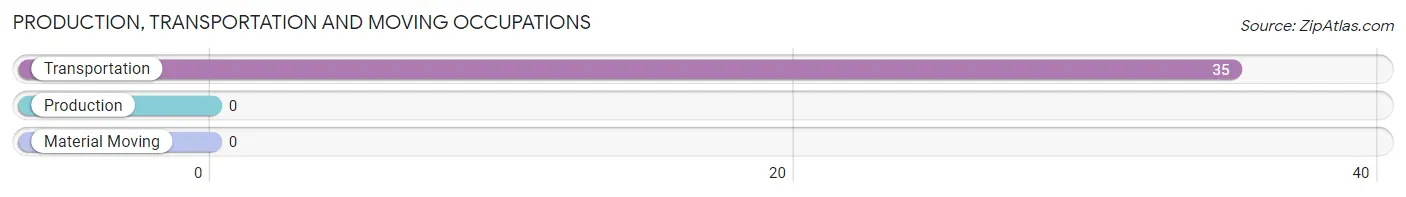
Production, Transportation and Moving Occupations by Sex
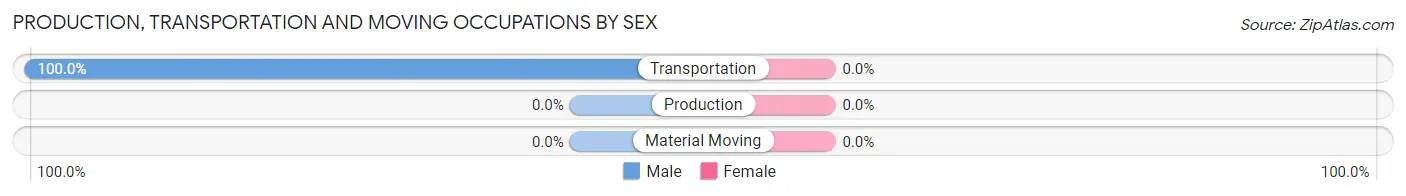
| Occupation | Male | Female |
| Production | 0 (0.0%) | 0 (0.0%) |
| Transportation | 35 (100.0%) | 0 (0.0%) |
| Material Moving | 0 (0.0%) | 0 (0.0%) |
| Total (Category) | 35 (100.0%) | 0 (0.0%) |
| Total (Overall) | 210 (69.3%) | 93 (30.7%) |
Employment Industries by Sex in Gila Crossing
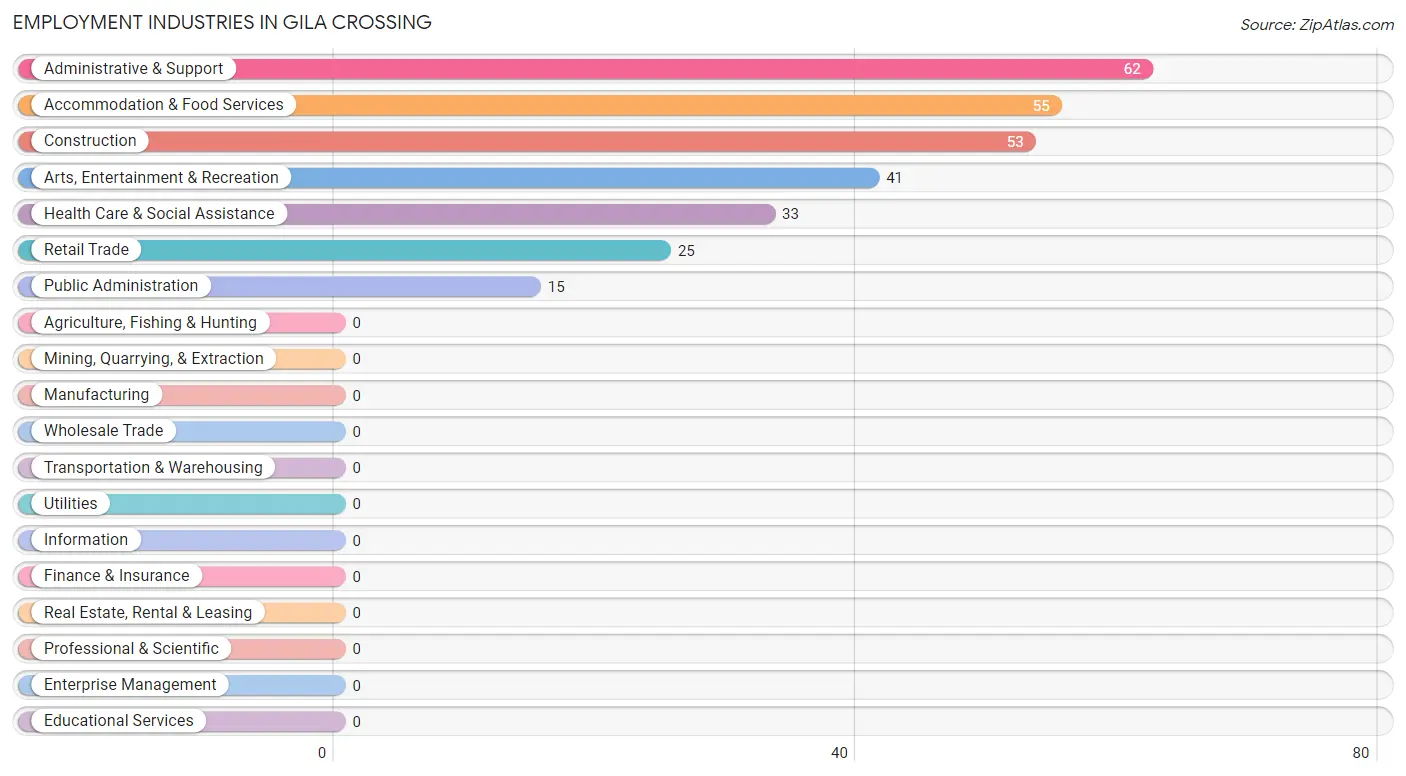
Employment Industries in Gila Crossing
The major employment industries in Gila Crossing include Administrative & Support (62 | 20.5%), Accommodation & Food Services (55 | 18.1%), Construction (53 | 17.5%), Arts, Entertainment & Recreation (41 | 13.5%), and Health Care & Social Assistance (33 | 10.9%).
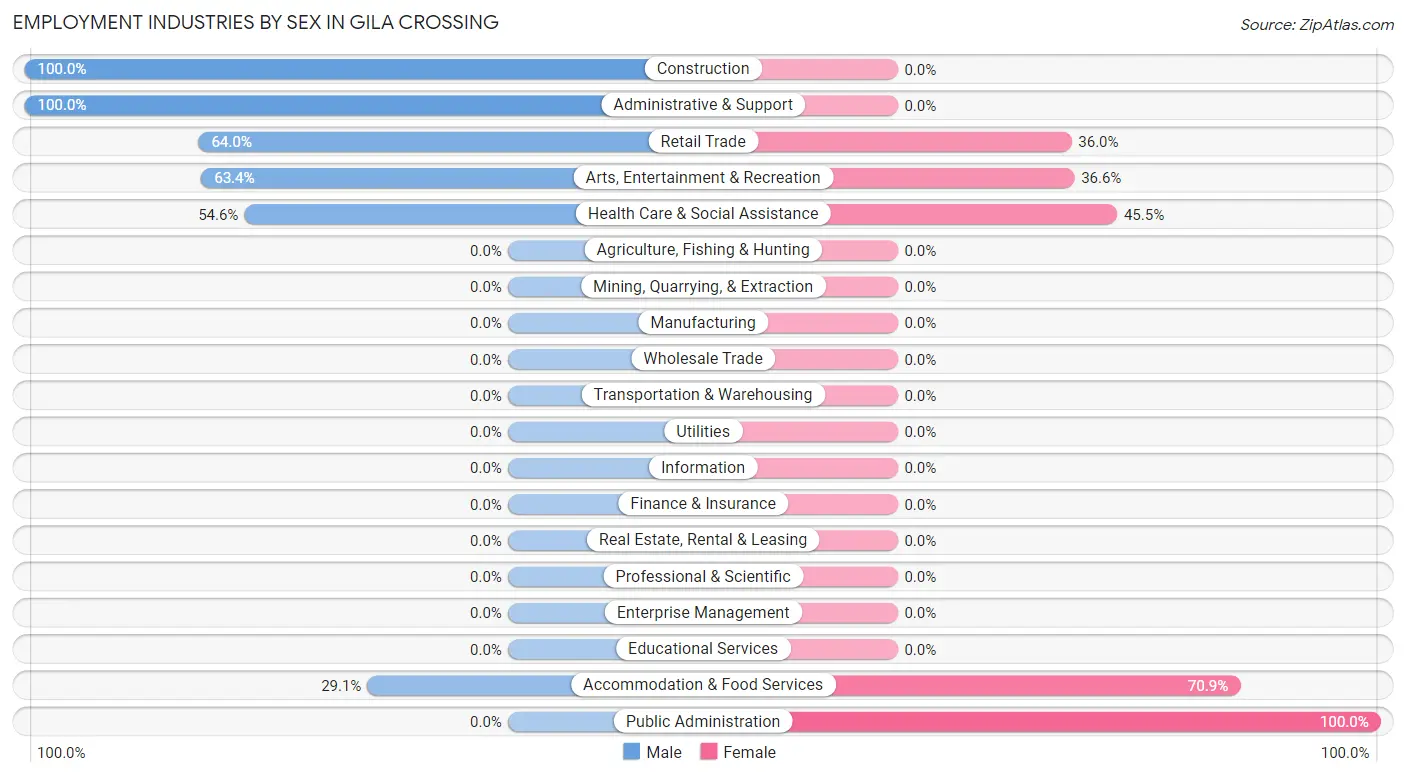
Employment Industries by Sex in Gila Crossing
The Gila Crossing industries that see more men than women are Construction (100.0%), Administrative & Support (100.0%), and Retail Trade (64.0%), whereas the industries that tend to have a higher number of women are Public Administration (100.0%), Accommodation & Food Services (70.9%), and Health Care & Social Assistance (45.5%).
| Industry | Male | Female |
| Agriculture, Fishing & Hunting | 0 (0.0%) | 0 (0.0%) |
| Mining, Quarrying, & Extraction | 0 (0.0%) | 0 (0.0%) |
| Construction | 53 (100.0%) | 0 (0.0%) |
| Manufacturing | 0 (0.0%) | 0 (0.0%) |
| Wholesale Trade | 0 (0.0%) | 0 (0.0%) |
| Retail Trade | 16 (64.0%) | 9 (36.0%) |
| Transportation & Warehousing | 0 (0.0%) | 0 (0.0%) |
| Utilities | 0 (0.0%) | 0 (0.0%) |
| Information | 0 (0.0%) | 0 (0.0%) |
| Finance & Insurance | 0 (0.0%) | 0 (0.0%) |
| Real Estate, Rental & Leasing | 0 (0.0%) | 0 (0.0%) |
| Professional & Scientific | 0 (0.0%) | 0 (0.0%) |
| Enterprise Management | 0 (0.0%) | 0 (0.0%) |
| Administrative & Support | 62 (100.0%) | 0 (0.0%) |
| Educational Services | 0 (0.0%) | 0 (0.0%) |
| Health Care & Social Assistance | 18 (54.5%) | 15 (45.5%) |
| Arts, Entertainment & Recreation | 26 (63.4%) | 15 (36.6%) |
| Accommodation & Food Services | 16 (29.1%) | 39 (70.9%) |
| Public Administration | 0 (0.0%) | 15 (100.0%) |
| Total | 210 (69.3%) | 93 (30.7%) |
Education in Gila Crossing
School Enrollment in Gila Crossing
The most common levels of schooling among the 239 students in Gila Crossing are high school (171 | 71.6%), college / undergraduate (32 | 13.4%), and middle school (28 | 11.7%).
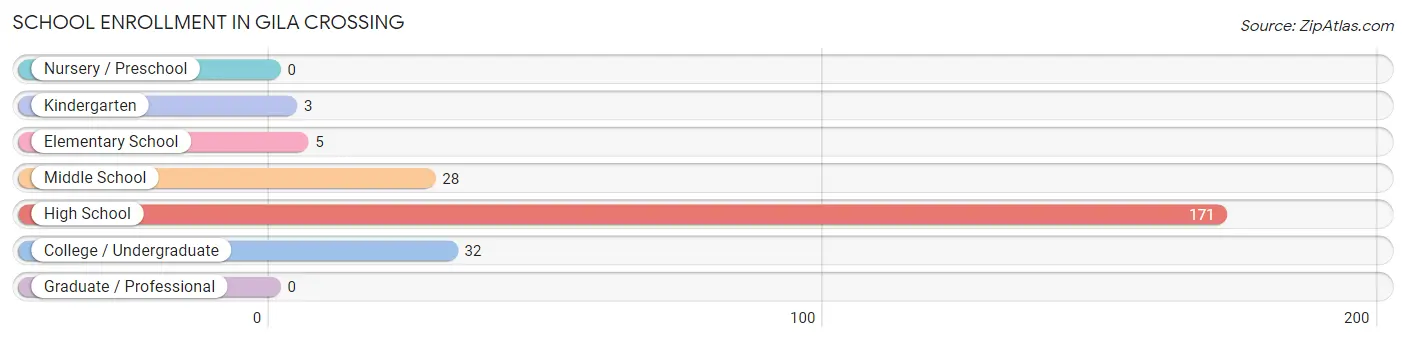
| School Level | # Students | % Students |
| Nursery / Preschool | 0 | 0.0% |
| Kindergarten | 3 | 1.3% |
| Elementary School | 5 | 2.1% |
| Middle School | 28 | 11.7% |
| High School | 171 | 71.6% |
| College / Undergraduate | 32 | 13.4% |
| Graduate / Professional | 0 | 0.0% |
| Total | 239 | 100.0% |
School Enrollment by Age by Funding Source in Gila Crossing
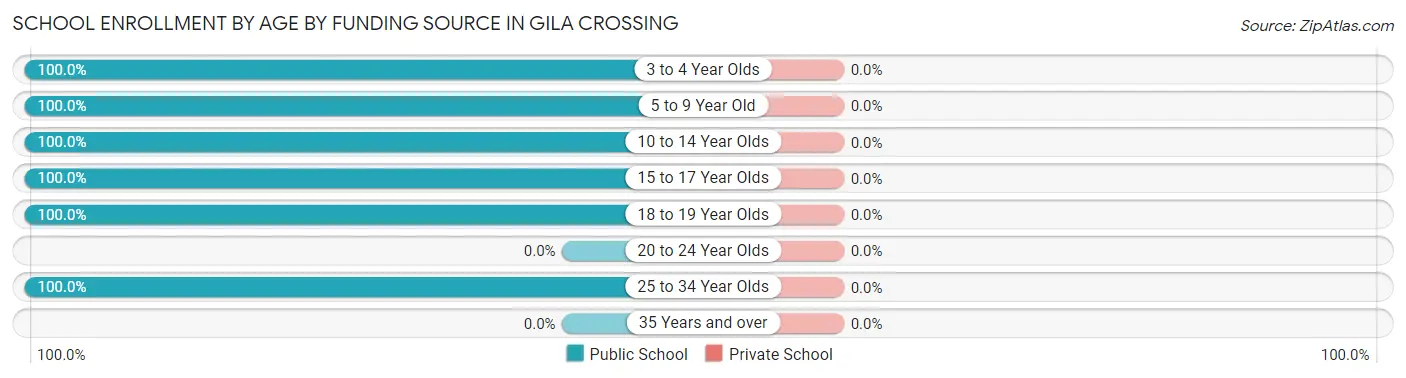
| Age Bracket | Public School | Private School |
| 3 to 4 Year Olds | 3 (100.0%) | 0 (0.0%) |
| 5 to 9 Year Old | 5 (100.0%) | 0 (0.0%) |
| 10 to 14 Year Olds | 111 (100.0%) | 0 (0.0%) |
| 15 to 17 Year Olds | 67 (100.0%) | 0 (0.0%) |
| 18 to 19 Year Olds | 21 (100.0%) | 0 (0.0%) |
| 20 to 24 Year Olds | 0 (0.0%) | 0 (0.0%) |
| 25 to 34 Year Olds | 32 (100.0%) | 0 (0.0%) |
| 35 Years and over | 0 (0.0%) | 0 (0.0%) |
| Total | 239 (100.0%) | 0 (0.0%) |
Educational Attainment by Field of Study in Gila Crossing
, and science & technology (20 | 100.0%) are the most common fields of study among 20 individuals in Gila Crossing who have obtained a bachelor's degree or higher.
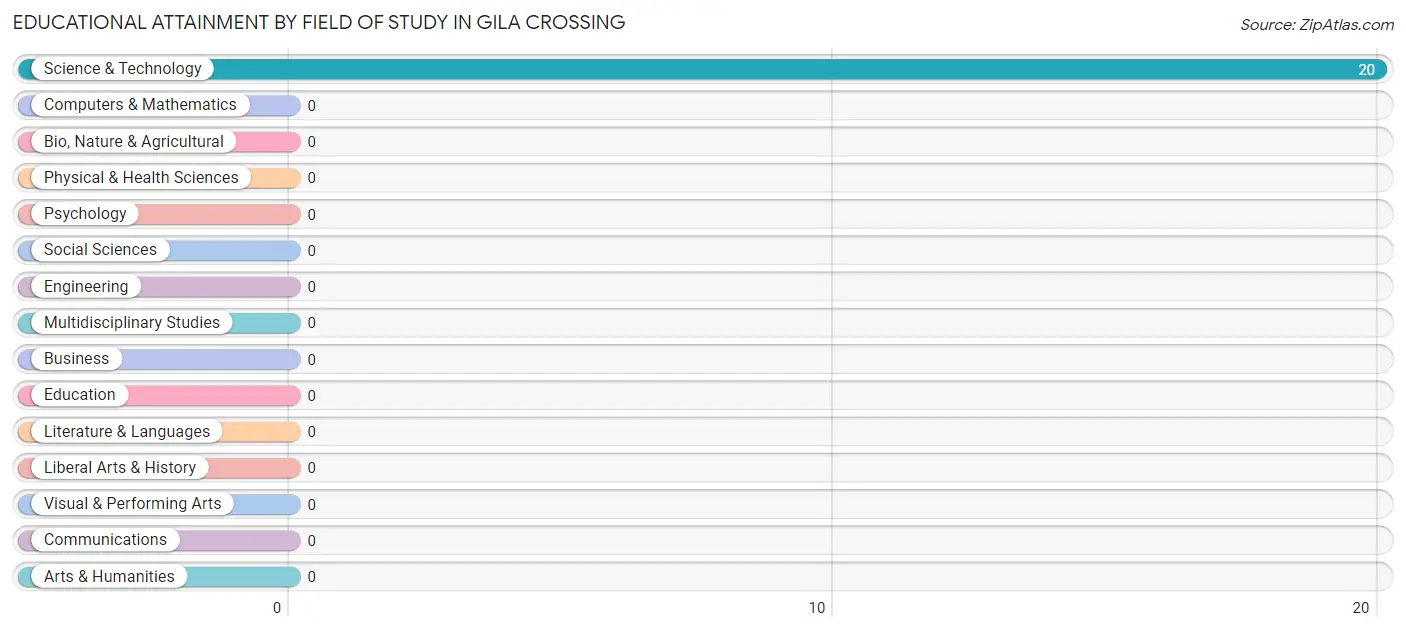
| Field of Study | # Graduates | % Graduates |
| Computers & Mathematics | 0 | 0.0% |
| Bio, Nature & Agricultural | 0 | 0.0% |
| Physical & Health Sciences | 0 | 0.0% |
| Psychology | 0 | 0.0% |
| Social Sciences | 0 | 0.0% |
| Engineering | 0 | 0.0% |
| Multidisciplinary Studies | 0 | 0.0% |
| Science & Technology | 20 | 100.0% |
| Business | 0 | 0.0% |
| Education | 0 | 0.0% |
| Literature & Languages | 0 | 0.0% |
| Liberal Arts & History | 0 | 0.0% |
| Visual & Performing Arts | 0 | 0.0% |
| Communications | 0 | 0.0% |
| Arts & Humanities | 0 | 0.0% |
| Total | 20 | 100.0% |
Transportation & Commute in Gila Crossing
Vehicle Availability by Sex in Gila Crossing
The most prevalent vehicle ownership categories in Gila Crossing are males with 1 vehicle (105, accounting for 50.0%) and females with 1 vehicle (30, making up 112.9%).
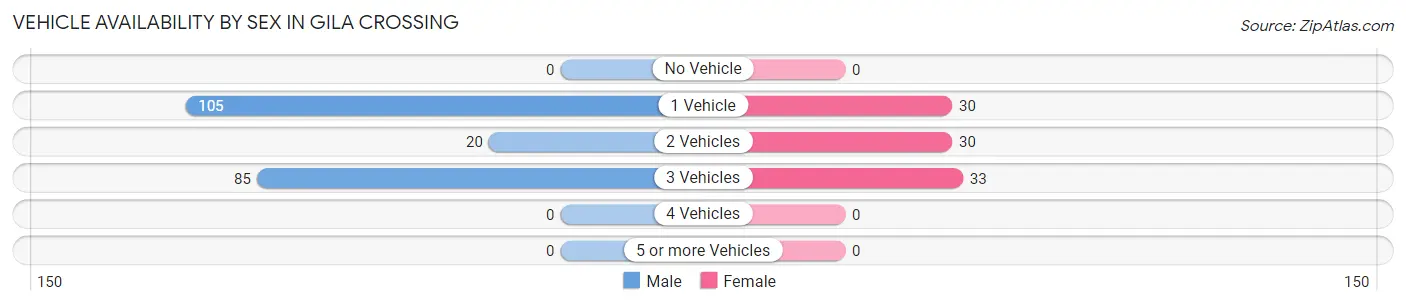
| Vehicles Available | Male | Female |
| No Vehicle | 0 (0.0%) | 0 (0.0%) |
| 1 Vehicle | 105 (50.0%) | 30 (32.3%) |
| 2 Vehicles | 20 (9.5%) | 30 (32.3%) |
| 3 Vehicles | 85 (40.5%) | 33 (35.5%) |
| 4 Vehicles | 0 (0.0%) | 0 (0.0%) |
| 5 or more Vehicles | 0 (0.0%) | 0 (0.0%) |
| Total | 210 (100.0%) | 93 (100.0%) |
Commute Time in Gila Crossing
The most frequently occuring commute durations in Gila Crossing are 45 to 59 minutes (92 commuters, 30.4%), 5 to 9 minutes (63 commuters, 20.8%), and less than 5 minutes (48 commuters, 15.8%).
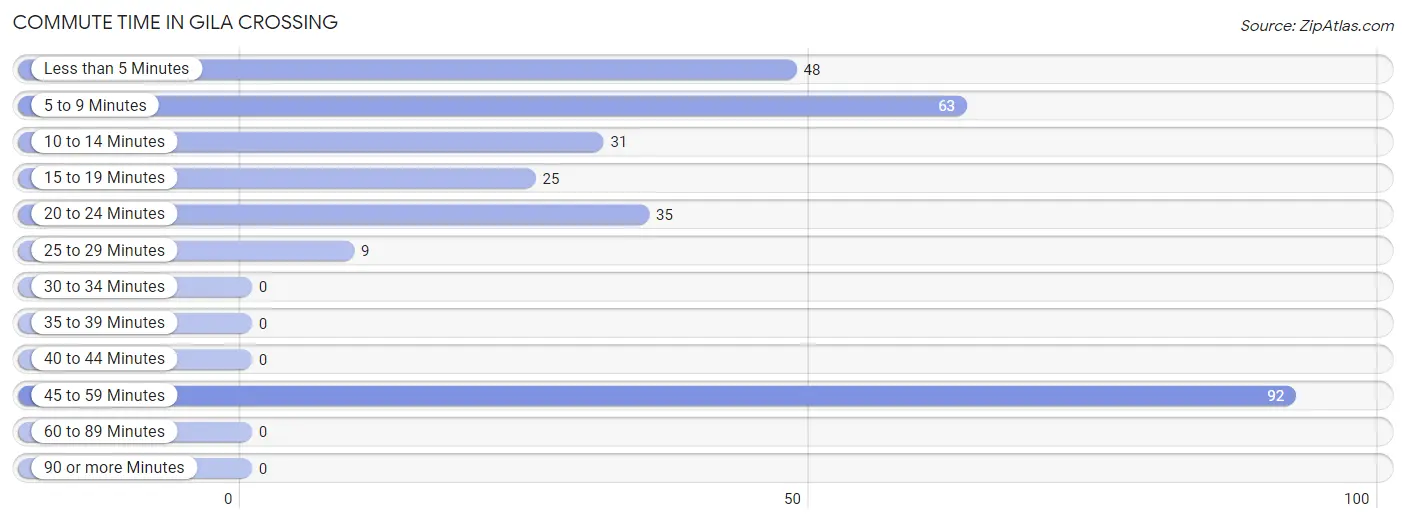
| Commute Time | # Commuters | % Commuters |
| Less than 5 Minutes | 48 | 15.8% |
| 5 to 9 Minutes | 63 | 20.8% |
| 10 to 14 Minutes | 31 | 10.2% |
| 15 to 19 Minutes | 25 | 8.3% |
| 20 to 24 Minutes | 35 | 11.6% |
| 25 to 29 Minutes | 9 | 3.0% |
| 30 to 34 Minutes | 0 | 0.0% |
| 35 to 39 Minutes | 0 | 0.0% |
| 40 to 44 Minutes | 0 | 0.0% |
| 45 to 59 Minutes | 92 | 30.4% |
| 60 to 89 Minutes | 0 | 0.0% |
| 90 or more Minutes | 0 | 0.0% |
Commute Time by Sex in Gila Crossing
The most common commute times in Gila Crossing are 45 to 59 minutes (92 commuters, 43.8%) for males and 5 to 9 minutes (45 commuters, 48.4%) for females.
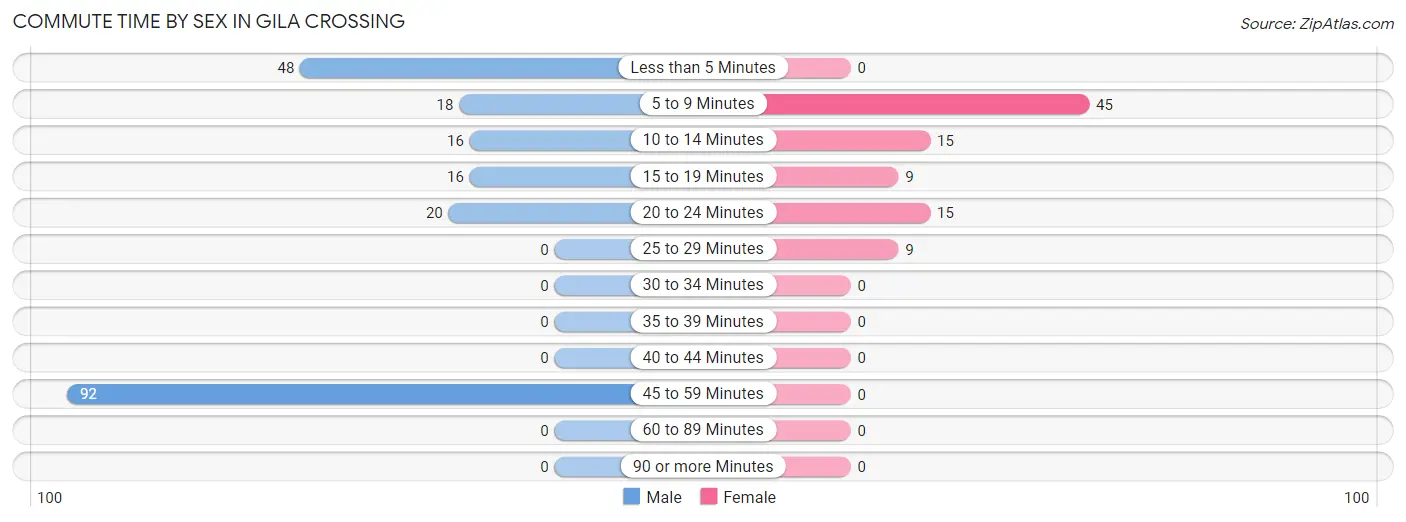
| Commute Time | Male | Female |
| Less than 5 Minutes | 48 (22.9%) | 0 (0.0%) |
| 5 to 9 Minutes | 18 (8.6%) | 45 (48.4%) |
| 10 to 14 Minutes | 16 (7.6%) | 15 (16.1%) |
| 15 to 19 Minutes | 16 (7.6%) | 9 (9.7%) |
| 20 to 24 Minutes | 20 (9.5%) | 15 (16.1%) |
| 25 to 29 Minutes | 0 (0.0%) | 9 (9.7%) |
| 30 to 34 Minutes | 0 (0.0%) | 0 (0.0%) |
| 35 to 39 Minutes | 0 (0.0%) | 0 (0.0%) |
| 40 to 44 Minutes | 0 (0.0%) | 0 (0.0%) |
| 45 to 59 Minutes | 92 (43.8%) | 0 (0.0%) |
| 60 to 89 Minutes | 0 (0.0%) | 0 (0.0%) |
| 90 or more Minutes | 0 (0.0%) | 0 (0.0%) |
Time of Departure to Work by Sex in Gila Crossing
The most frequent times of departure to work in Gila Crossing are 5:00 AM to 5:29 AM (73, 34.8%) for males and 4:00 PM to 11:59 PM (45, 48.4%) for females.
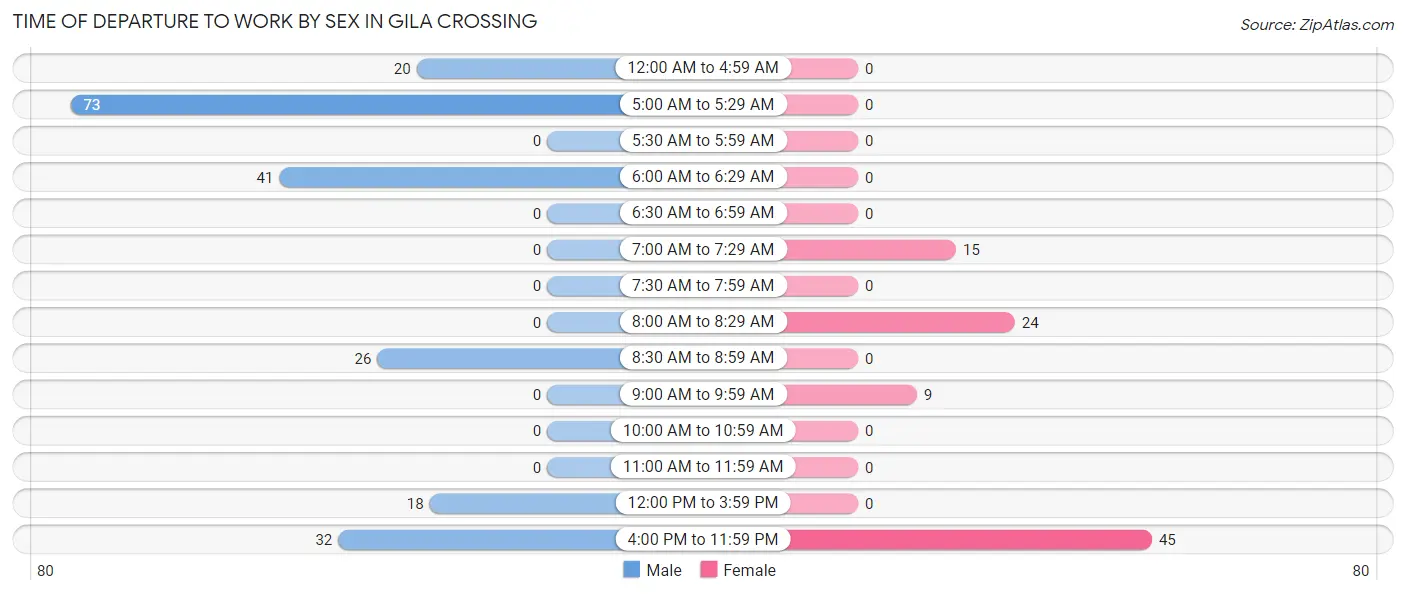
| Time of Departure | Male | Female |
| 12:00 AM to 4:59 AM | 20 (9.5%) | 0 (0.0%) |
| 5:00 AM to 5:29 AM | 73 (34.8%) | 0 (0.0%) |
| 5:30 AM to 5:59 AM | 0 (0.0%) | 0 (0.0%) |
| 6:00 AM to 6:29 AM | 41 (19.5%) | 0 (0.0%) |
| 6:30 AM to 6:59 AM | 0 (0.0%) | 0 (0.0%) |
| 7:00 AM to 7:29 AM | 0 (0.0%) | 15 (16.1%) |
| 7:30 AM to 7:59 AM | 0 (0.0%) | 0 (0.0%) |
| 8:00 AM to 8:29 AM | 0 (0.0%) | 24 (25.8%) |
| 8:30 AM to 8:59 AM | 26 (12.4%) | 0 (0.0%) |
| 9:00 AM to 9:59 AM | 0 (0.0%) | 9 (9.7%) |
| 10:00 AM to 10:59 AM | 0 (0.0%) | 0 (0.0%) |
| 11:00 AM to 11:59 AM | 0 (0.0%) | 0 (0.0%) |
| 12:00 PM to 3:59 PM | 18 (8.6%) | 0 (0.0%) |
| 4:00 PM to 11:59 PM | 32 (15.2%) | 45 (48.4%) |
| Total | 210 (100.0%) | 93 (100.0%) |
Housing Occupancy in Gila Crossing
Occupancy by Ownership in Gila Crossing
Of the total 201 dwellings in Gila Crossing, owner-occupied units account for 165 (82.1%), while renter-occupied units make up 36 (17.9%).
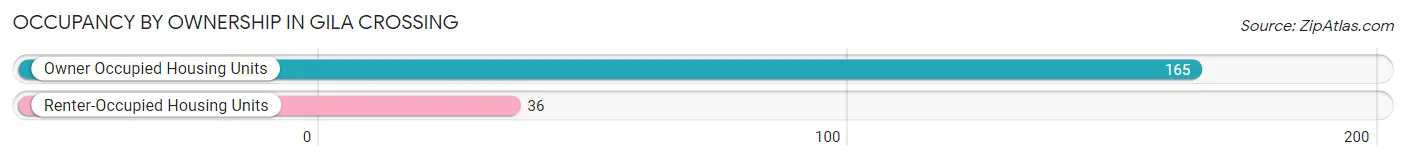
| Occupancy | # Housing Units | % Housing Units |
| Owner Occupied Housing Units | 165 | 82.1% |
| Renter-Occupied Housing Units | 36 | 17.9% |
| Total Occupied Housing Units | 201 | 100.0% |
Occupancy by Household Size in Gila Crossing

| Household Size | # Housing Units | % Housing Units |
| 1-Person Household | 27 | 13.4% |
| 2-Person Household | 34 | 16.9% |
| 3-Person Household | 0 | 0.0% |
| 4+ Person Household | 140 | 69.7% |
| Total Housing Units | 201 | 100.0% |
Occupancy by Ownership by Household Size in Gila Crossing
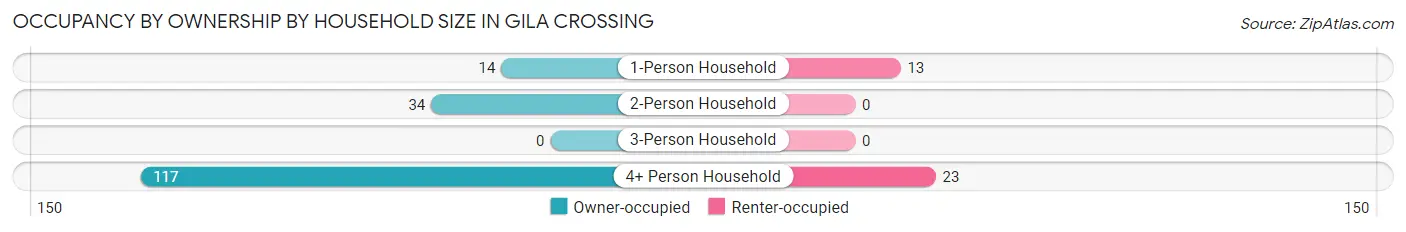
| Household Size | Owner-occupied | Renter-occupied |
| 1-Person Household | 14 (51.8%) | 13 (48.1%) |
| 2-Person Household | 34 (100.0%) | 0 (0.0%) |
| 3-Person Household | 0 (0.0%) | 0 (0.0%) |
| 4+ Person Household | 117 (83.6%) | 23 (16.4%) |
| Total Housing Units | 165 (82.1%) | 36 (17.9%) |
Occupancy by Educational Attainment in Gila Crossing
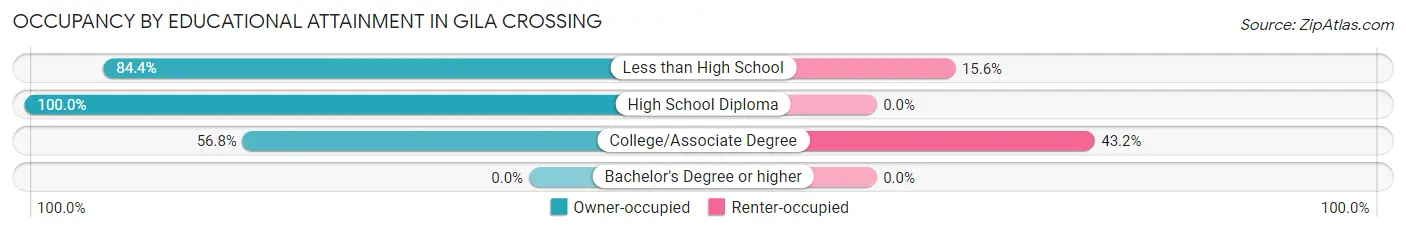
| Household Size | Owner-occupied | Renter-occupied |
| Less than High School | 108 (84.4%) | 20 (15.6%) |
| High School Diploma | 36 (100.0%) | 0 (0.0%) |
| College/Associate Degree | 21 (56.8%) | 16 (43.2%) |
| Bachelor's Degree or higher | 0 (0.0%) | 0 (0.0%) |
Occupancy by Age of Householder in Gila Crossing
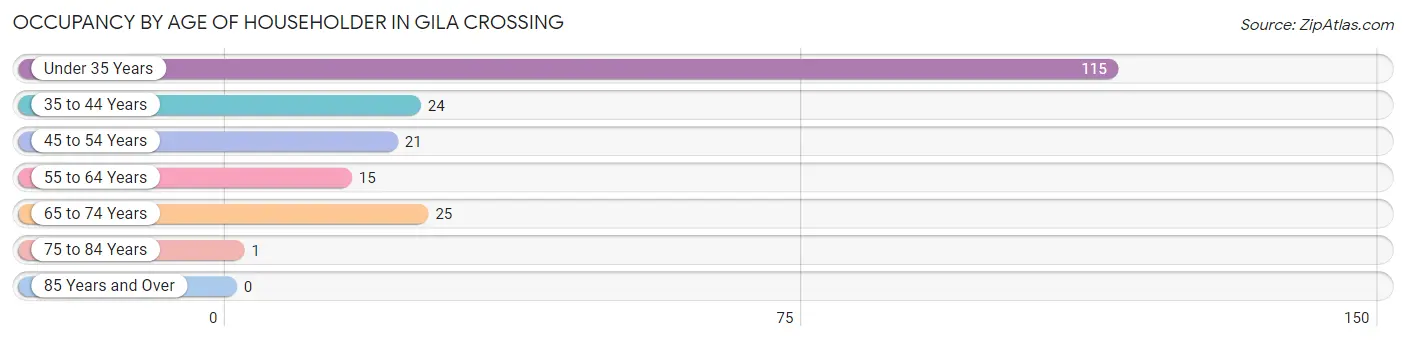
| Age Bracket | # Households | % Households |
| Under 35 Years | 115 | 57.2% |
| 35 to 44 Years | 24 | 11.9% |
| 45 to 54 Years | 21 | 10.4% |
| 55 to 64 Years | 15 | 7.5% |
| 65 to 74 Years | 25 | 12.4% |
| 75 to 84 Years | 1 | 0.5% |
| 85 Years and Over | 0 | 0.0% |
| Total | 201 | 100.0% |
Housing Finances in Gila Crossing
Median Income by Occupancy in Gila Crossing
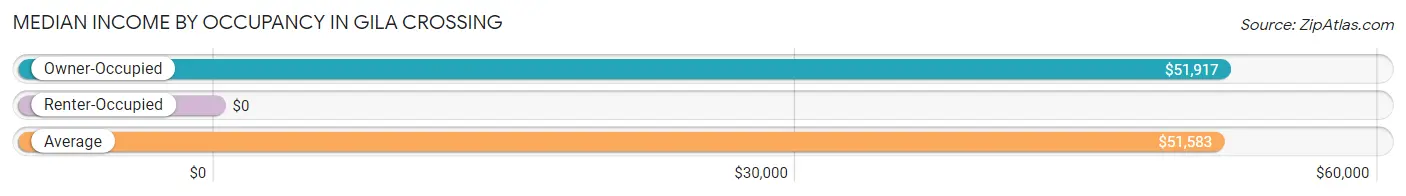
| Occupancy Type | # Households | Median Income |
| Owner-Occupied | 165 (82.1%) | $51,917 |
| Renter-Occupied | 36 (17.9%) | $0 |
| Average | 201 (100.0%) | $51,583 |
Occupancy by Householder Income Bracket in Gila Crossing
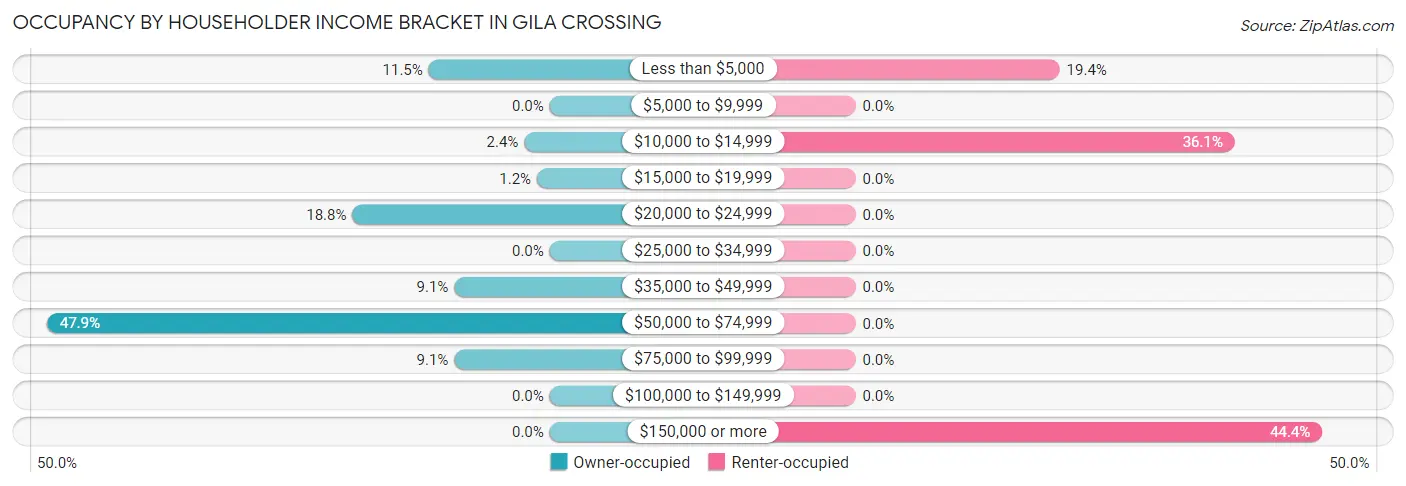
| Income Bracket | Owner-occupied | Renter-occupied |
| Less than $5,000 | 19 (11.5%) | 7 (19.4%) |
| $5,000 to $9,999 | 0 (0.0%) | 0 (0.0%) |
| $10,000 to $14,999 | 4 (2.4%) | 13 (36.1%) |
| $15,000 to $19,999 | 2 (1.2%) | 0 (0.0%) |
| $20,000 to $24,999 | 31 (18.8%) | 0 (0.0%) |
| $25,000 to $34,999 | 0 (0.0%) | 0 (0.0%) |
| $35,000 to $49,999 | 15 (9.1%) | 0 (0.0%) |
| $50,000 to $74,999 | 79 (47.9%) | 0 (0.0%) |
| $75,000 to $99,999 | 15 (9.1%) | 0 (0.0%) |
| $100,000 to $149,999 | 0 (0.0%) | 0 (0.0%) |
| $150,000 or more | 0 (0.0%) | 16 (44.4%) |
| Total | 165 (100.0%) | 36 (100.0%) |
Monthly Housing Cost Tiers in Gila Crossing
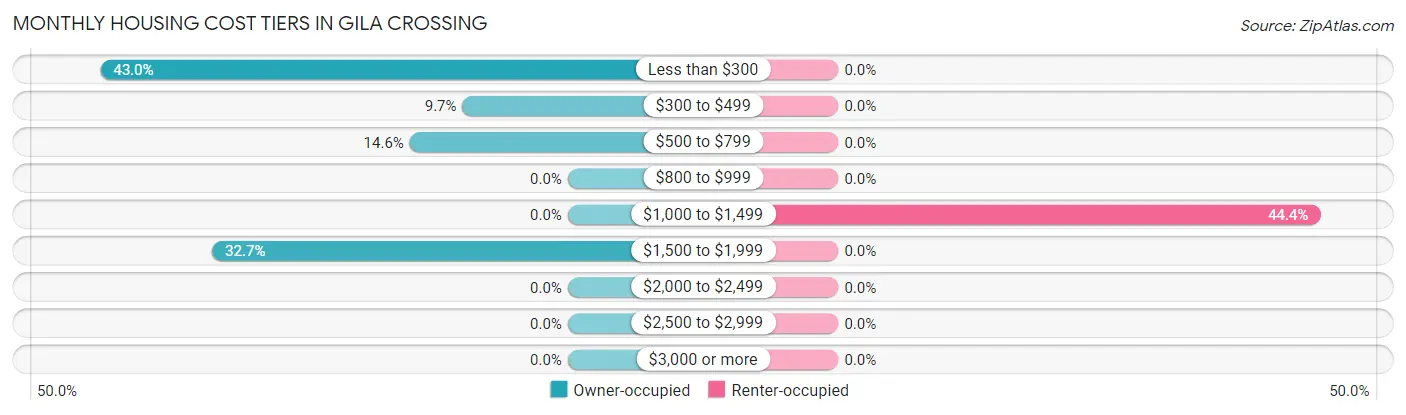
| Monthly Cost | Owner-occupied | Renter-occupied |
| Less than $300 | 71 (43.0%) | 0 (0.0%) |
| $300 to $499 | 16 (9.7%) | 0 (0.0%) |
| $500 to $799 | 24 (14.5%) | 0 (0.0%) |
| $800 to $999 | 0 (0.0%) | 0 (0.0%) |
| $1,000 to $1,499 | 0 (0.0%) | 16 (44.4%) |
| $1,500 to $1,999 | 54 (32.7%) | 0 (0.0%) |
| $2,000 to $2,499 | 0 (0.0%) | 0 (0.0%) |
| $2,500 to $2,999 | 0 (0.0%) | 0 (0.0%) |
| $3,000 or more | 0 (0.0%) | 0 (0.0%) |
| Total | 165 (100.0%) | 36 (100.0%) |
Physical Housing Characteristics in Gila Crossing
Housing Structures in Gila Crossing
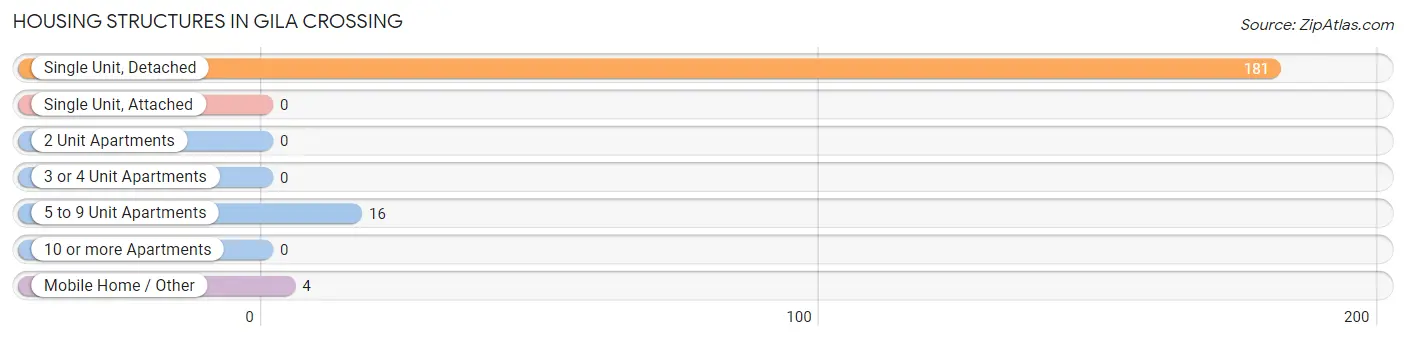
| Structure Type | # Housing Units | % Housing Units |
| Single Unit, Detached | 181 | 90.0% |
| Single Unit, Attached | 0 | 0.0% |
| 2 Unit Apartments | 0 | 0.0% |
| 3 or 4 Unit Apartments | 0 | 0.0% |
| 5 to 9 Unit Apartments | 16 | 8.0% |
| 10 or more Apartments | 0 | 0.0% |
| Mobile Home / Other | 4 | 2.0% |
| Total | 201 | 100.0% |
Housing Structures by Occupancy in Gila Crossing
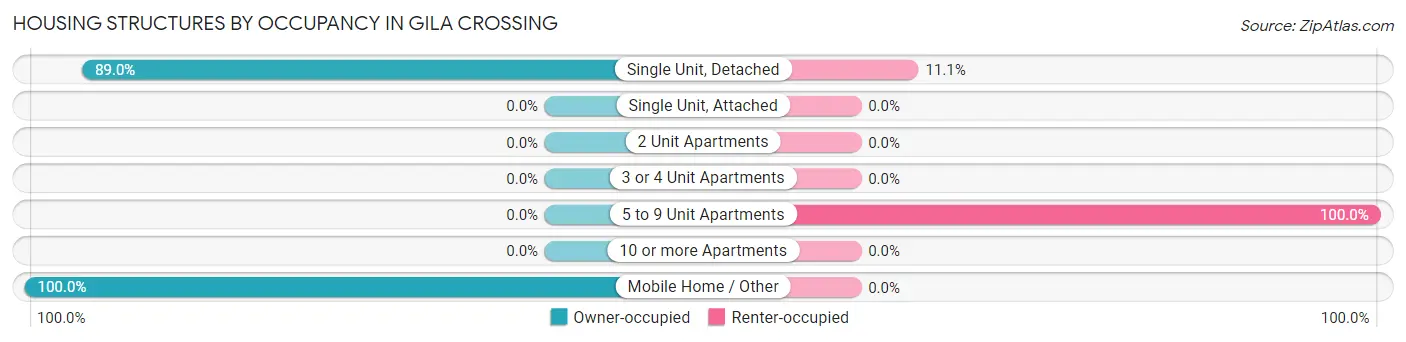
| Structure Type | Owner-occupied | Renter-occupied |
| Single Unit, Detached | 161 (88.9%) | 20 (11.1%) |
| Single Unit, Attached | 0 (0.0%) | 0 (0.0%) |
| 2 Unit Apartments | 0 (0.0%) | 0 (0.0%) |
| 3 or 4 Unit Apartments | 0 (0.0%) | 0 (0.0%) |
| 5 to 9 Unit Apartments | 0 (0.0%) | 16 (100.0%) |
| 10 or more Apartments | 0 (0.0%) | 0 (0.0%) |
| Mobile Home / Other | 4 (100.0%) | 0 (0.0%) |
| Total | 165 (82.1%) | 36 (17.9%) |
Housing Structures by Number of Rooms in Gila Crossing
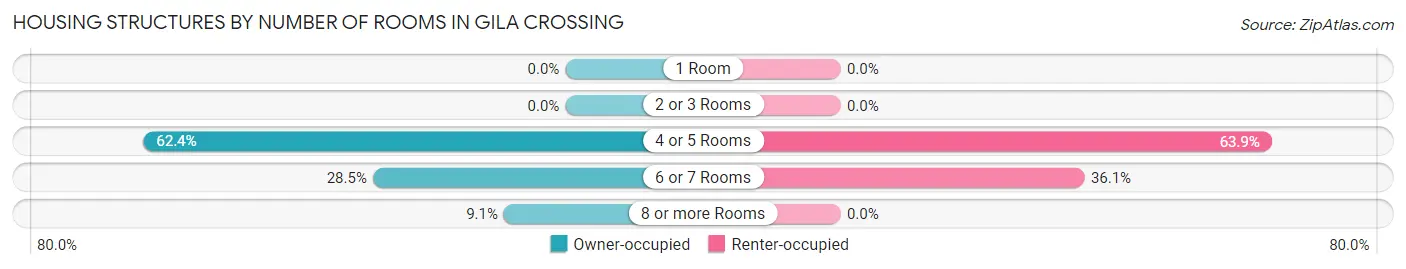
| Number of Rooms | Owner-occupied | Renter-occupied |
| 1 Room | 0 (0.0%) | 0 (0.0%) |
| 2 or 3 Rooms | 0 (0.0%) | 0 (0.0%) |
| 4 or 5 Rooms | 103 (62.4%) | 23 (63.9%) |
| 6 or 7 Rooms | 47 (28.5%) | 13 (36.1%) |
| 8 or more Rooms | 15 (9.1%) | 0 (0.0%) |
| Total | 165 (100.0%) | 36 (100.0%) |
Housing Structure by Heating Type in Gila Crossing
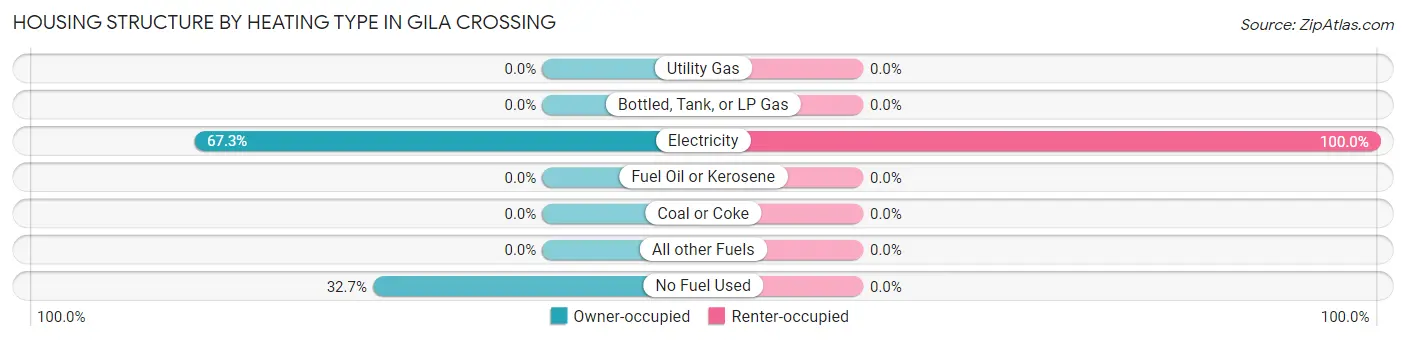
| Heating Type | Owner-occupied | Renter-occupied |
| Utility Gas | 0 (0.0%) | 0 (0.0%) |
| Bottled, Tank, or LP Gas | 0 (0.0%) | 0 (0.0%) |
| Electricity | 111 (67.3%) | 36 (100.0%) |
| Fuel Oil or Kerosene | 0 (0.0%) | 0 (0.0%) |
| Coal or Coke | 0 (0.0%) | 0 (0.0%) |
| All other Fuels | 0 (0.0%) | 0 (0.0%) |
| No Fuel Used | 54 (32.7%) | 0 (0.0%) |
| Total | 165 (100.0%) | 36 (100.0%) |
Household Vehicle Usage in Gila Crossing
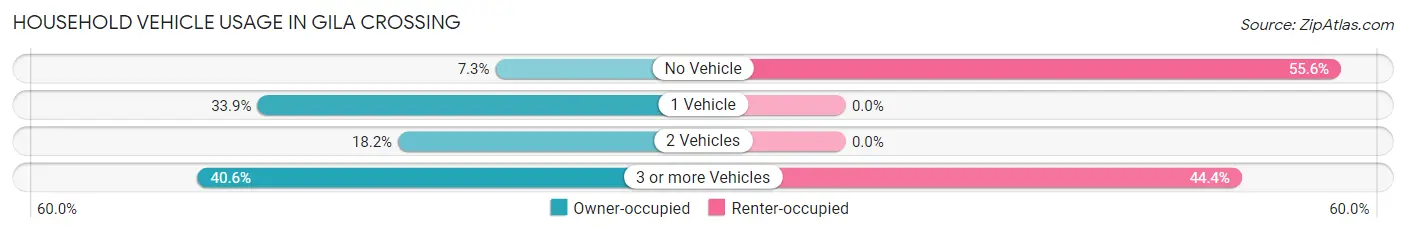
| Vehicles per Household | Owner-occupied | Renter-occupied |
| No Vehicle | 12 (7.3%) | 20 (55.6%) |
| 1 Vehicle | 56 (33.9%) | 0 (0.0%) |
| 2 Vehicles | 30 (18.2%) | 0 (0.0%) |
| 3 or more Vehicles | 67 (40.6%) | 16 (44.4%) |
| Total | 165 (100.0%) | 36 (100.0%) |
Real Estate & Mortgages in Gila Crossing
Real Estate and Mortgage Overview in Gila Crossing
| Characteristic | Without Mortgage | With Mortgage |
| Housing Units | 111 | 54 |
| Median Property Value | $172,000 | $0 |
| Median Household Income | - | - |
| Monthly Housing Costs | - | - |
| Real Estate Taxes | - | - |
Property Value by Mortgage Status in Gila Crossing
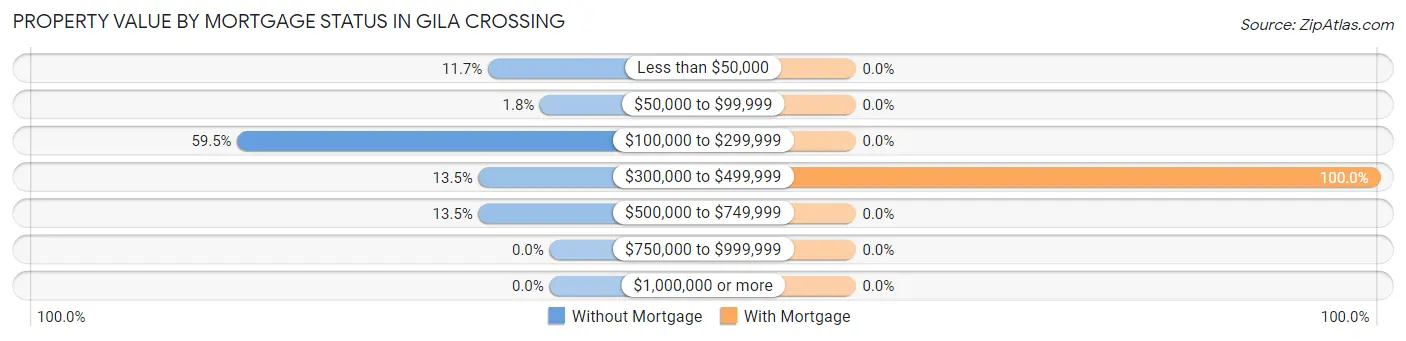
| Property Value | Without Mortgage | With Mortgage |
| Less than $50,000 | 13 (11.7%) | 0 (0.0%) |
| $50,000 to $99,999 | 2 (1.8%) | 0 (0.0%) |
| $100,000 to $299,999 | 66 (59.5%) | 0 (0.0%) |
| $300,000 to $499,999 | 15 (13.5%) | 54 (100.0%) |
| $500,000 to $749,999 | 15 (13.5%) | 0 (0.0%) |
| $750,000 to $999,999 | 0 (0.0%) | 0 (0.0%) |
| $1,000,000 or more | 0 (0.0%) | 0 (0.0%) |
| Total | 111 (100.0%) | 54 (100.0%) |
Household Income by Mortgage Status in Gila Crossing
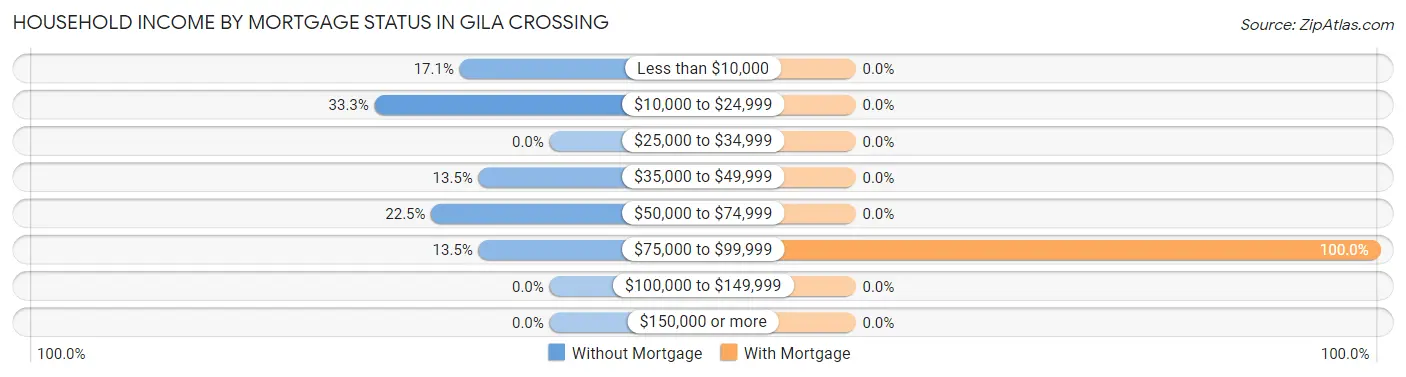
| Household Income | Without Mortgage | With Mortgage |
| Less than $10,000 | 19 (17.1%) | 0 (0.0%) |
| $10,000 to $24,999 | 37 (33.3%) | 0 (0.0%) |
| $25,000 to $34,999 | 0 (0.0%) | 0 (0.0%) |
| $35,000 to $49,999 | 15 (13.5%) | 0 (0.0%) |
| $50,000 to $74,999 | 25 (22.5%) | 0 (0.0%) |
| $75,000 to $99,999 | 15 (13.5%) | 54 (100.0%) |
| $100,000 to $149,999 | 0 (0.0%) | 0 (0.0%) |
| $150,000 or more | 0 (0.0%) | 0 (0.0%) |
| Total | 111 (100.0%) | 54 (100.0%) |
Property Value to Household Income Ratio in Gila Crossing
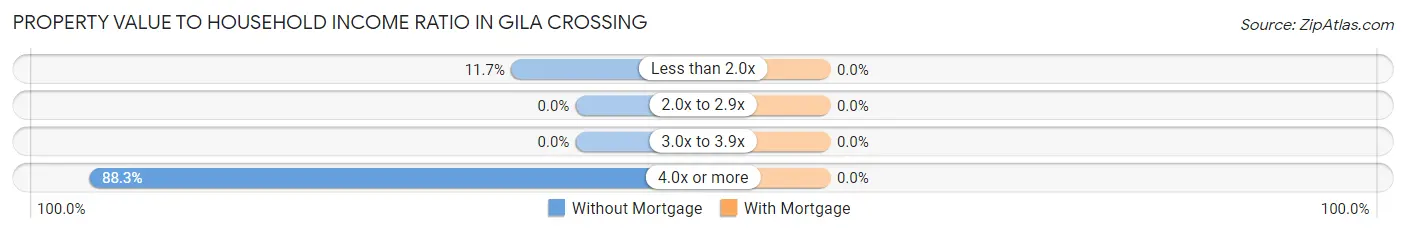
| Value-to-Income Ratio | Without Mortgage | With Mortgage |
| Less than 2.0x | 13 (11.7%) | 0 (0.0%) |
| 2.0x to 2.9x | 0 (0.0%) | 0 (0.0%) |
| 3.0x to 3.9x | 0 (0.0%) | 0 (0.0%) |
| 4.0x or more | 98 (88.3%) | 0 (0.0%) |
| Total | 111 (100.0%) | 54 (100.0%) |
Real Estate Taxes by Mortgage Status in Gila Crossing
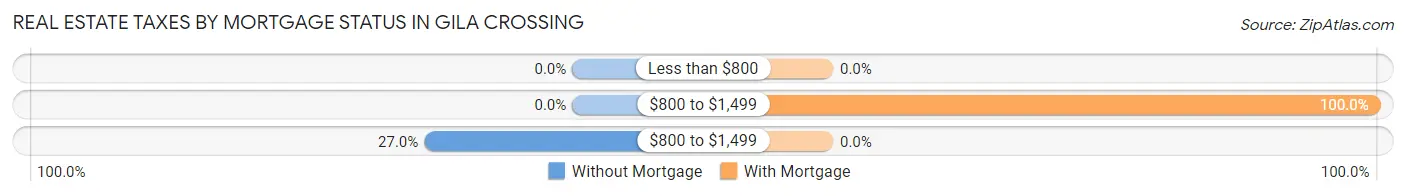
| Property Taxes | Without Mortgage | With Mortgage |
| Less than $800 | 0 (0.0%) | 0 (0.0%) |
| $800 to $1,499 | 0 (0.0%) | 54 (100.0%) |
| $800 to $1,499 | 30 (27.0%) | 0 (0.0%) |
| Total | 111 (100.0%) | 54 (100.0%) |
Health & Disability in Gila Crossing
Health Insurance Coverage by Age in Gila Crossing
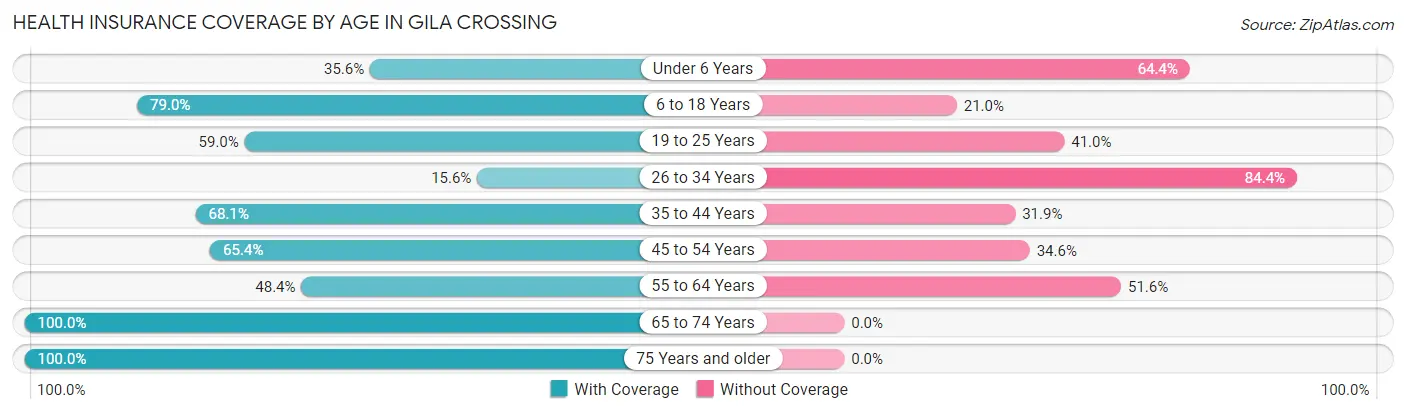
| Age Bracket | With Coverage | Without Coverage |
| Under 6 Years | 37 (35.6%) | 67 (64.4%) |
| 6 to 18 Years | 177 (79.0%) | 47 (21.0%) |
| 19 to 25 Years | 46 (59.0%) | 32 (41.0%) |
| 26 to 34 Years | 39 (15.6%) | 211 (84.4%) |
| 35 to 44 Years | 47 (68.1%) | 22 (31.9%) |
| 45 to 54 Years | 70 (65.4%) | 37 (34.6%) |
| 55 to 64 Years | 15 (48.4%) | 16 (51.6%) |
| 65 to 74 Years | 101 (100.0%) | 0 (0.0%) |
| 75 Years and older | 1 (100.0%) | 0 (0.0%) |
| Total | 533 (55.2%) | 432 (44.8%) |
Health Insurance Coverage by Citizenship Status in Gila Crossing
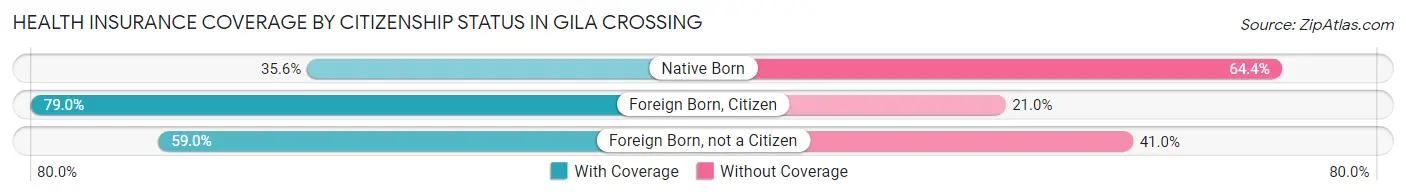
| Citizenship Status | With Coverage | Without Coverage |
| Native Born | 37 (35.6%) | 67 (64.4%) |
| Foreign Born, Citizen | 177 (79.0%) | 47 (21.0%) |
| Foreign Born, not a Citizen | 46 (59.0%) | 32 (41.0%) |
Health Insurance Coverage by Household Income in Gila Crossing
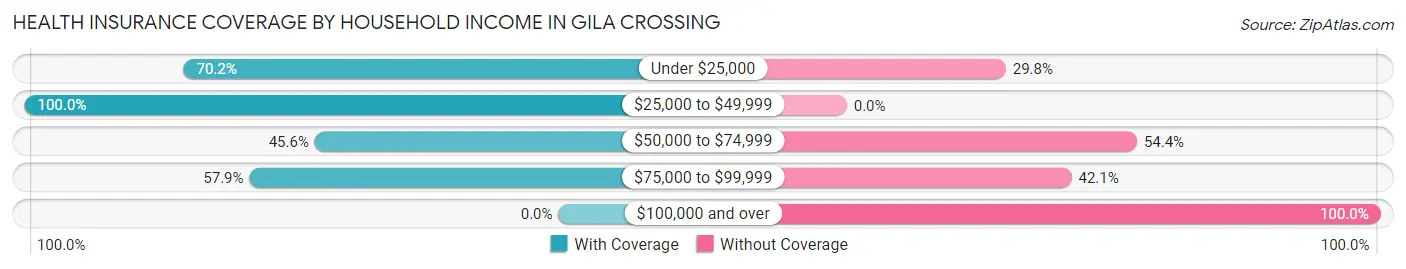
| Household Income | With Coverage | Without Coverage |
| Under $25,000 | 198 (70.2%) | 84 (29.8%) |
| $25,000 to $49,999 | 70 (100.0%) | 0 (0.0%) |
| $50,000 to $74,999 | 199 (45.6%) | 237 (54.4%) |
| $75,000 to $99,999 | 66 (57.9%) | 48 (42.1%) |
| $100,000 and over | 0 (0.0%) | 63 (100.0%) |
Public vs Private Health Insurance Coverage by Age in Gila Crossing
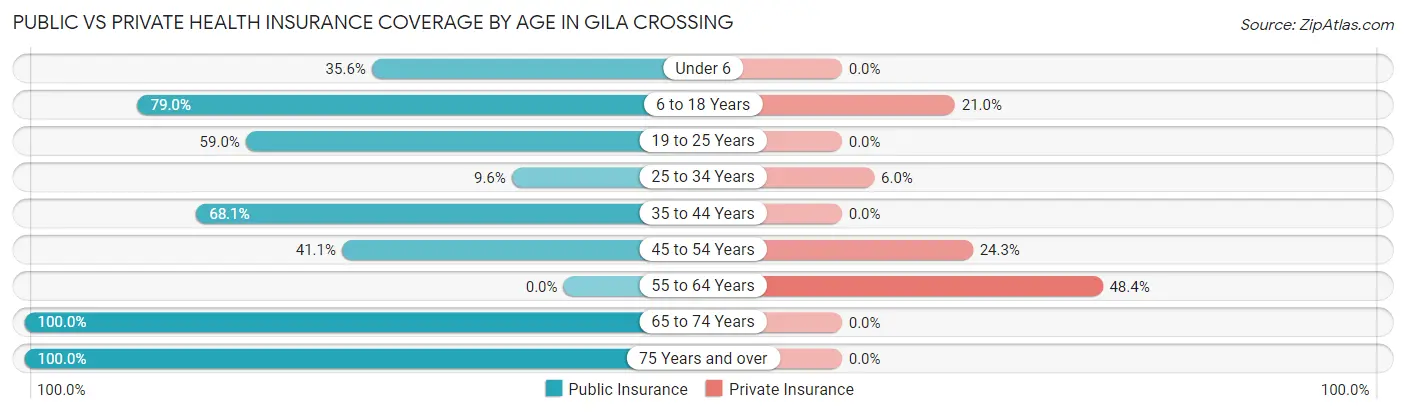
| Age Bracket | Public Insurance | Private Insurance |
| Under 6 | 37 (35.6%) | 0 (0.0%) |
| 6 to 18 Years | 177 (79.0%) | 47 (21.0%) |
| 19 to 25 Years | 46 (59.0%) | 0 (0.0%) |
| 25 to 34 Years | 24 (9.6%) | 15 (6.0%) |
| 35 to 44 Years | 47 (68.1%) | 0 (0.0%) |
| 45 to 54 Years | 44 (41.1%) | 26 (24.3%) |
| 55 to 64 Years | 0 (0.0%) | 15 (48.4%) |
| 65 to 74 Years | 101 (100.0%) | 0 (0.0%) |
| 75 Years and over | 1 (100.0%) | 0 (0.0%) |
| Total | 477 (49.4%) | 103 (10.7%) |
Disability Status by Sex by Age in Gila Crossing
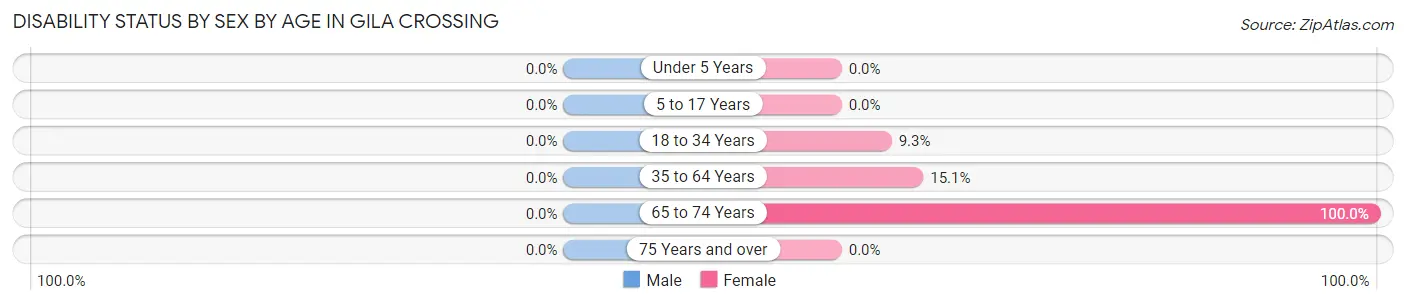
| Age Bracket | Male | Female |
| Under 5 Years | 0 (0.0%) | 0 (0.0%) |
| 5 to 17 Years | 0 (0.0%) | 0 (0.0%) |
| 18 to 34 Years | 0 (0.0%) | 19 (9.3%) |
| 35 to 64 Years | 0 (0.0%) | 18 (15.1%) |
| 65 to 74 Years | 0 (0.0%) | 25 (100.0%) |
| 75 Years and over | 0 (0.0%) | 0 (0.0%) |
Disability Class by Sex by Age in Gila Crossing
Disability Class: Hearing Difficulty
| Age Bracket | Male | Female |
| Under 5 Years | 0 (0.0%) | 0 (0.0%) |
| 5 to 17 Years | 0 (0.0%) | 0 (0.0%) |
| 18 to 34 Years | 0 (0.0%) | 0 (0.0%) |
| 35 to 64 Years | 0 (0.0%) | 0 (0.0%) |
| 65 to 74 Years | 0 (0.0%) | 0 (0.0%) |
| 75 Years and over | 0 (0.0%) | 0 (0.0%) |
Disability Class: Vision Difficulty
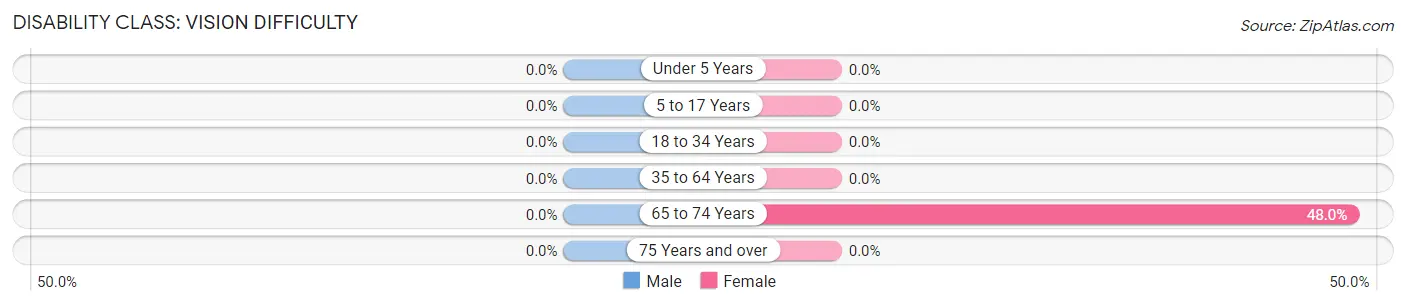
| Age Bracket | Male | Female |
| Under 5 Years | 0 (0.0%) | 0 (0.0%) |
| 5 to 17 Years | 0 (0.0%) | 0 (0.0%) |
| 18 to 34 Years | 0 (0.0%) | 0 (0.0%) |
| 35 to 64 Years | 0 (0.0%) | 0 (0.0%) |
| 65 to 74 Years | 0 (0.0%) | 12 (48.0%) |
| 75 Years and over | 0 (0.0%) | 0 (0.0%) |
Disability Class: Cognitive Difficulty
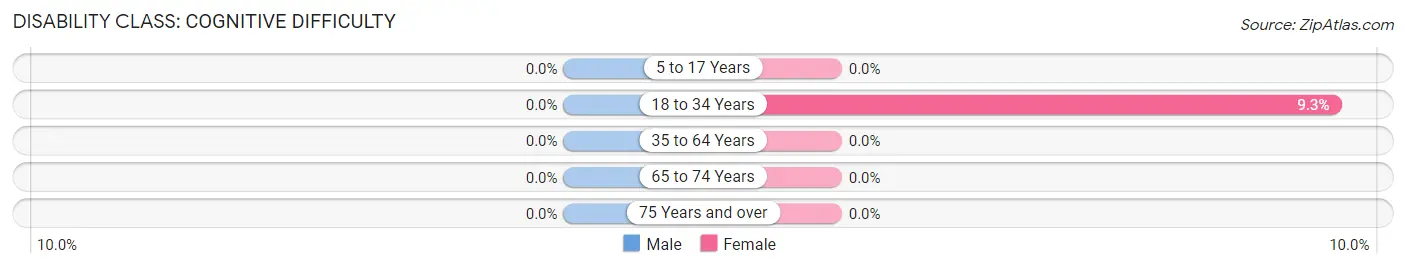
| Age Bracket | Male | Female |
| 5 to 17 Years | 0 (0.0%) | 0 (0.0%) |
| 18 to 34 Years | 0 (0.0%) | 19 (9.3%) |
| 35 to 64 Years | 0 (0.0%) | 0 (0.0%) |
| 65 to 74 Years | 0 (0.0%) | 0 (0.0%) |
| 75 Years and over | 0 (0.0%) | 0 (0.0%) |
Disability Class: Ambulatory Difficulty
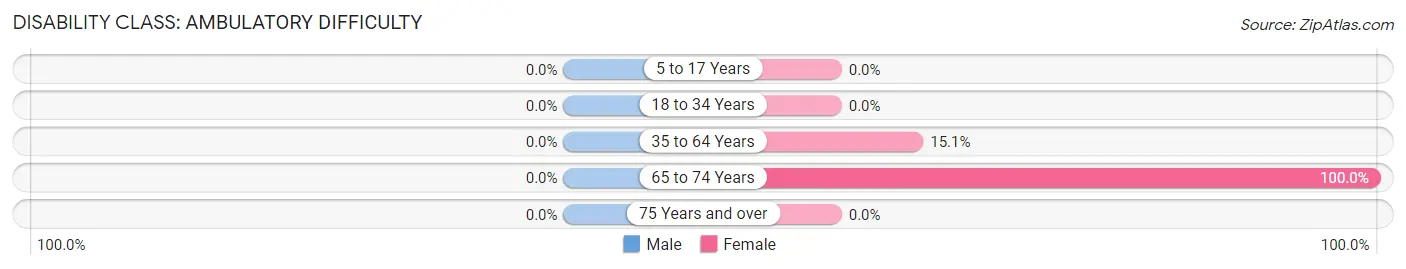
| Age Bracket | Male | Female |
| 5 to 17 Years | 0 (0.0%) | 0 (0.0%) |
| 18 to 34 Years | 0 (0.0%) | 0 (0.0%) |
| 35 to 64 Years | 0 (0.0%) | 18 (15.1%) |
| 65 to 74 Years | 0 (0.0%) | 25 (100.0%) |
| 75 Years and over | 0 (0.0%) | 0 (0.0%) |
Disability Class: Self-Care Difficulty
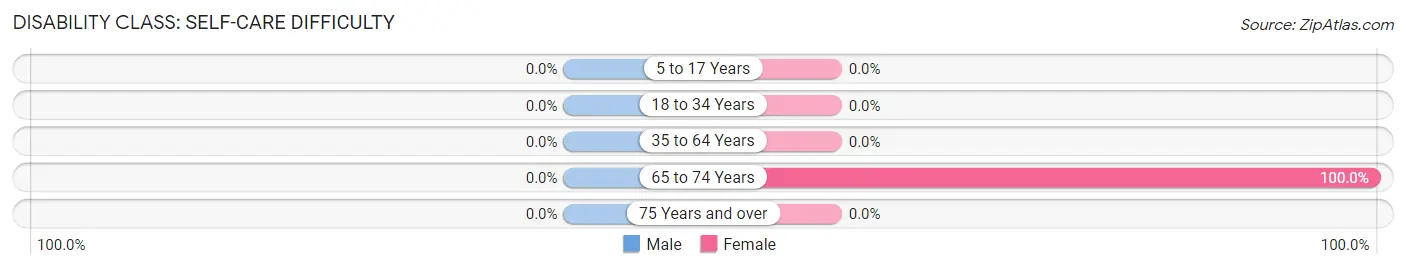
| Age Bracket | Male | Female |
| 5 to 17 Years | 0 (0.0%) | 0 (0.0%) |
| 18 to 34 Years | 0 (0.0%) | 0 (0.0%) |
| 35 to 64 Years | 0 (0.0%) | 0 (0.0%) |
| 65 to 74 Years | 0 (0.0%) | 25 (100.0%) |
| 75 Years and over | 0 (0.0%) | 0 (0.0%) |
Technology Access in Gila Crossing
Computing Device Access in Gila Crossing
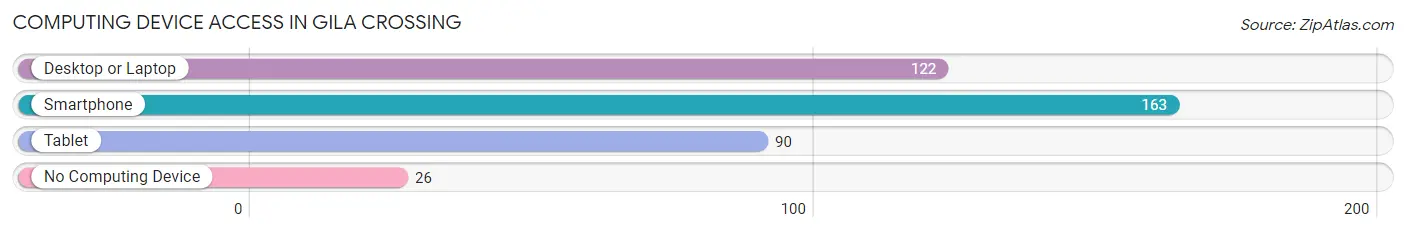
| Device Type | # Households | % Households |
| Desktop or Laptop | 122 | 60.7% |
| Smartphone | 163 | 81.1% |
| Tablet | 90 | 44.8% |
| No Computing Device | 26 | 12.9% |
| Total | 201 | 100.0% |
Internet Access in Gila Crossing
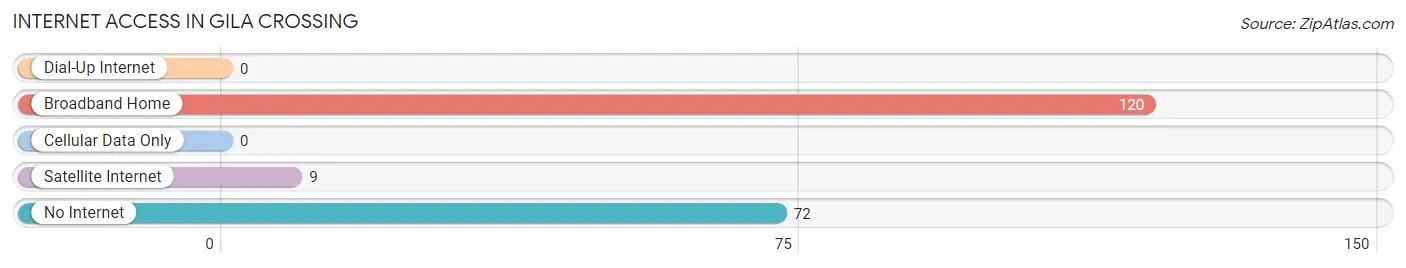
| Internet Type | # Households | % Households |
| Dial-Up Internet | 0 | 0.0% |
| Broadband Home | 120 | 59.7% |
| Cellular Data Only | 0 | 0.0% |
| Satellite Internet | 9 | 4.5% |
| No Internet | 72 | 35.8% |
| Total | 201 | 100.0% |
Gila Crossing Summary
Gila Crossing is a small unincorporated community located in Maricopa County, Arizona. It is situated on the Gila River Indian Reservation, approximately 40 miles southeast of Phoenix. The community is home to the Gila River Indian Community, a federally recognized tribe of Pima and Maricopa people.
History
Gila Crossing has a long and rich history. The area was first inhabited by the Hohokam people, who lived in the area for centuries before the arrival of Europeans. The Hohokam were a semi-nomadic people who lived in small villages and farmed the land. They were known for their irrigation systems, which were used to irrigate their crops.
In the late 1700s, Spanish explorers arrived in the area and established a mission in the area. The mission was abandoned in the early 1800s, but the area remained inhabited by the Pima and Maricopa people.
In 1871, the United States government established the Gila River Indian Reservation, which encompassed the area that is now Gila Crossing. The reservation was established to provide a home for the Pima and Maricopa people, who had been displaced from their traditional lands.
In the late 1800s, the area was settled by non-Native Americans, who established farms and ranches in the area. The community of Gila Crossing was established in the early 1900s, and the town grew steadily over the next several decades.
Geography
Gila Crossing is located in Maricopa County, Arizona, approximately 40 miles southeast of Phoenix. The community is situated on the Gila River Indian Reservation, which covers an area of approximately 5,400 square miles.
The area is mostly flat, with some rolling hills. The climate is arid, with hot summers and mild winters. The average annual precipitation is approximately 8 inches.
Economy
The economy of Gila Crossing is largely based on agriculture. The area is home to several farms and ranches, which produce a variety of crops, including cotton, alfalfa, and hay.
The Gila River Indian Community also operates several businesses in the area, including a casino, a hotel, and a golf course. The community also operates a number of retail stores, including a grocery store, a hardware store, and a gas station.
Demographics
As of the 2010 census, the population of Gila Crossing was 1,845. The racial makeup of the community was 94.3% Native American, 4.2% White, 0.3% African American, 0.2% Asian, and 0.9% from other races.
The median household income in Gila Crossing was $25,938, and the median family income was $30,938. The per capita income was $13,938. Approximately 28.3% of the population was below the poverty line.
Common Questions
What is Per Capita Income in Gila Crossing?
Per Capita income in Gila Crossing is $11,914.
What is the Median Family Income in Gila Crossing?
Median Family Income in Gila Crossing is $54,500.
What is the Median Household income in Gila Crossing?
Median Household Income in Gila Crossing is $51,583.
What is Income or Wage Gap in Gila Crossing?
Income or Wage Gap in Gila Crossing is 3.3%.
Women in Gila Crossing earn 96.7 cents for every dollar earned by a man.
What is Inequality or Gini Index in Gila Crossing?
Inequality or Gini Index in Gila Crossing is 0.42.
What is the Total Population of Gila Crossing?
Total Population of Gila Crossing is 965.
What is the Total Male Population of Gila Crossing?
Total Male Population of Gila Crossing is 461.
What is the Total Female Population of Gila Crossing?
Total Female Population of Gila Crossing is 504.
What is the Ratio of Males per 100 Females in Gila Crossing?
There are 91.47 Males per 100 Females in Gila Crossing.
What is the Ratio of Females per 100 Males in Gila Crossing?
There are 109.33 Females per 100 Males in Gila Crossing.
What is the Median Population Age in Gila Crossing?
Median Population Age in Gila Crossing is 31.2 Years.
What is the Average Family Size in Gila Crossing
Average Family Size in Gila Crossing is 4.8 People.
What is the Average Household Size in Gila Crossing
Average Household Size in Gila Crossing is 4.8 People.
How Large is the Labor Force in Gila Crossing?
There are 358 People in the Labor Forcein in Gila Crossing.
What is the Percentage of People in the Labor Force in Gila Crossing?
49.7% of People are in the Labor Force in Gila Crossing.
What is the Unemployment Rate in Gila Crossing?
Unemployment Rate in Gila Crossing is 15.4%.