New Trenton, IN Map & Demographics
New Trenton Map
New Trenton Overview
$42,352
PER CAPITA INCOME
$89,405
AVG FAMILY INCOME
$80,592
AVG HOUSEHOLD INCOME
35.0%
WAGE / INCOME GAP [ % ]
65.0¢/ $1
WAGE / INCOME GAP [ $ ]
0.28
INEQUALITY / GINI INDEX
258
TOTAL POPULATION
105
MALE POPULATION
153
FEMALE POPULATION
68.63
MALES / 100 FEMALES
145.71
FEMALES / 100 MALES
62.9
MEDIAN AGE
2.1
AVG FAMILY SIZE
1.8
AVG HOUSEHOLD SIZE
161
LABOR FORCE [ PEOPLE ]
62.4%
PERCENT IN LABOR FORCE
New Trenton Zip Codes
Income in New Trenton
Income Overview in New Trenton
Per Capita Income in New Trenton is $42,352, while median incomes of families and households are $89,405 and $80,592 respectively.
| Characteristic | Number | Measure |
| Per Capita Income | 258 | $42,352 |
| Median Family Income | 86 | $89,405 |
| Mean Family Income | 86 | $89,116 |
| Median Household Income | 147 | $80,592 |
| Mean Household Income | 147 | $72,678 |
| Income Deficit | 86 | $0 |
| Wage / Income Gap (%) | 258 | 35.00% |
| Wage / Income Gap ($) | 258 | 65.00¢ per $1 |
| Gini / Inequality Index | 258 | 0.28 |
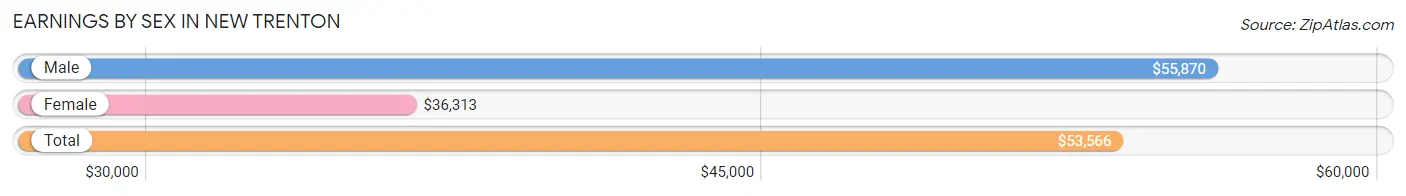
Earnings by Sex in New Trenton
Average Earnings in New Trenton are $53,566, $55,870 for men and $36,313 for women, a difference of 35.0%.
| Sex | Number | Average Earnings |
| Male | 64 (39.8%) | $55,870 |
| Female | 97 (60.3%) | $36,313 |
| Total | 161 (100.0%) | $53,566 |
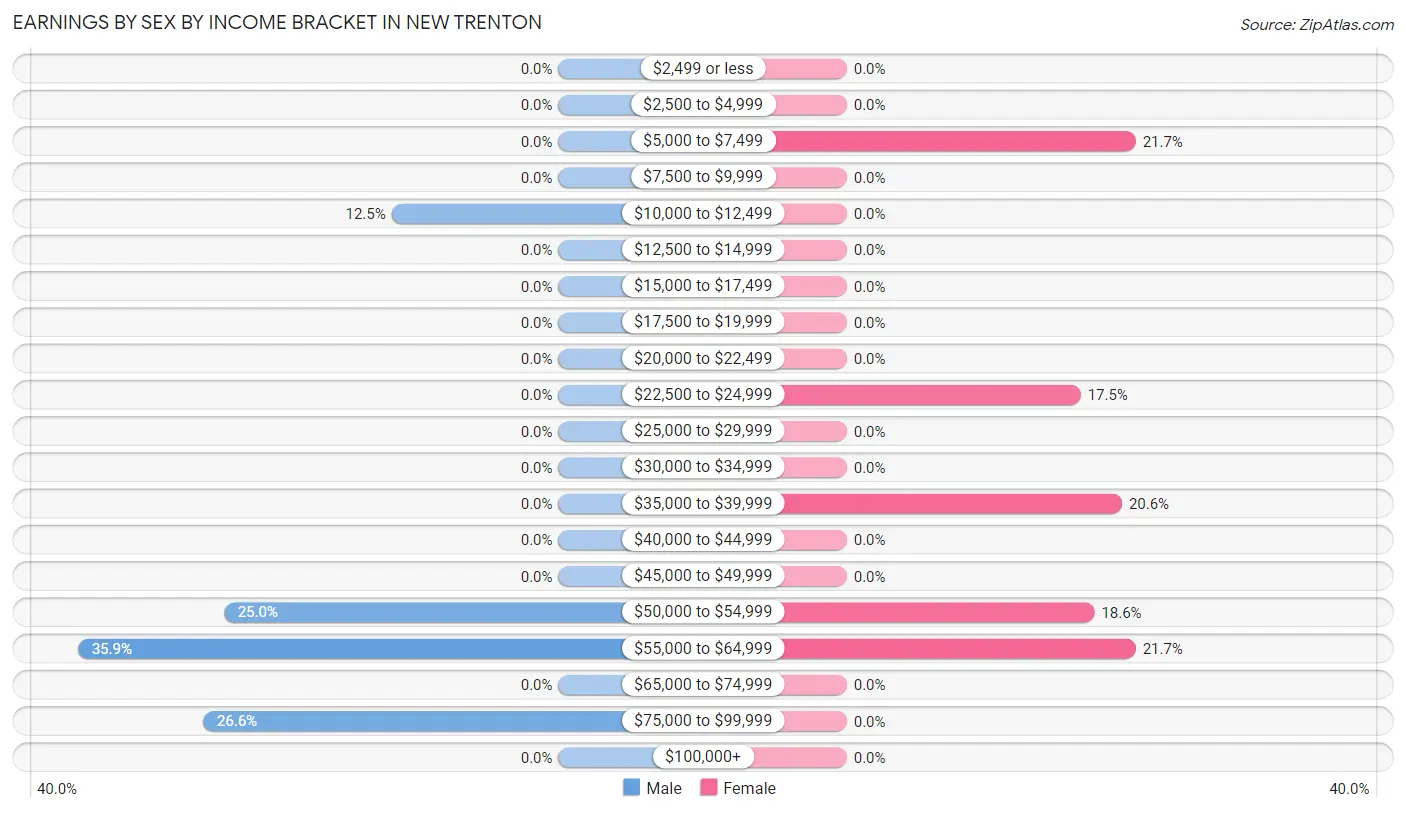
Earnings by Sex by Income Bracket in New Trenton
The most common earnings brackets in New Trenton are $55,000 to $64,999 for men (23 | 35.9%) and $5,000 to $7,499 for women (21 | 21.6%).
| Income | Male | Female |
| $2,499 or less | 0 (0.0%) | 0 (0.0%) |
| $2,500 to $4,999 | 0 (0.0%) | 0 (0.0%) |
| $5,000 to $7,499 | 0 (0.0%) | 21 (21.6%) |
| $7,500 to $9,999 | 0 (0.0%) | 0 (0.0%) |
| $10,000 to $12,499 | 8 (12.5%) | 0 (0.0%) |
| $12,500 to $14,999 | 0 (0.0%) | 0 (0.0%) |
| $15,000 to $17,499 | 0 (0.0%) | 0 (0.0%) |
| $17,500 to $19,999 | 0 (0.0%) | 0 (0.0%) |
| $20,000 to $22,499 | 0 (0.0%) | 0 (0.0%) |
| $22,500 to $24,999 | 0 (0.0%) | 17 (17.5%) |
| $25,000 to $29,999 | 0 (0.0%) | 0 (0.0%) |
| $30,000 to $34,999 | 0 (0.0%) | 0 (0.0%) |
| $35,000 to $39,999 | 0 (0.0%) | 20 (20.6%) |
| $40,000 to $44,999 | 0 (0.0%) | 0 (0.0%) |
| $45,000 to $49,999 | 0 (0.0%) | 0 (0.0%) |
| $50,000 to $54,999 | 16 (25.0%) | 18 (18.6%) |
| $55,000 to $64,999 | 23 (35.9%) | 21 (21.6%) |
| $65,000 to $74,999 | 0 (0.0%) | 0 (0.0%) |
| $75,000 to $99,999 | 17 (26.6%) | 0 (0.0%) |
| $100,000+ | 0 (0.0%) | 0 (0.0%) |
| Total | 64 (100.0%) | 97 (100.0%) |
Earnings by Sex by Educational Attainment in New Trenton
| Educational Attainment | Male Income | Female Income |
| Less than High School | - | - |
| High School Diploma | - | - |
| College or Associate's Degree | - | - |
| Bachelor's Degree | - | - |
| Graduate Degree | - | - |
| Total | $55,870 | $0 |
Family Income in New Trenton
Family Income Brackets in New Trenton
According to the New Trenton family income data, there are 38 families falling into the $100,000 to $149,999 income range, which is the most common income bracket and makes up 44.2% of all families.
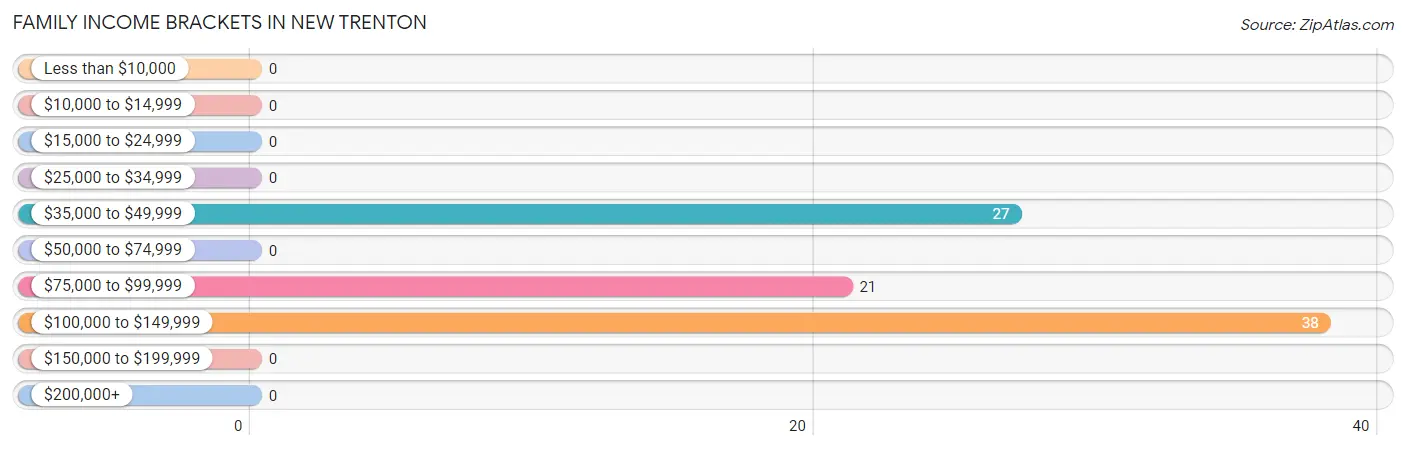
| Income Bracket | # Families | % Families |
| Less than $10,000 | 0 | 0.0% |
| $10,000 to $14,999 | 0 | 0.0% |
| $15,000 to $24,999 | 0 | 0.0% |
| $25,000 to $34,999 | 0 | 0.0% |
| $35,000 to $49,999 | 27 | 31.4% |
| $50,000 to $74,999 | 0 | 0.0% |
| $75,000 to $99,999 | 21 | 24.4% |
| $100,000 to $149,999 | 38 | 44.2% |
| $150,000 to $199,999 | 0 | 0.0% |
| $200,000+ | 0 | 0.0% |
Family Income by Famaliy Size in New Trenton
2-person families (86 | 100.0%) account for the highest median family income in New Trenton with $89,405 per family, while 2-person families (86 | 100.0%) have the highest median income of $44,702 per family member.
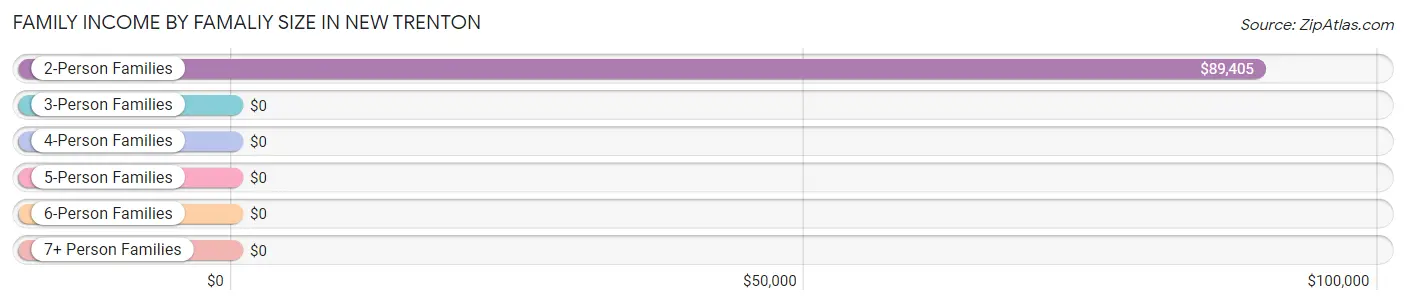
| Income Bracket | # Families | Median Income |
| 2-Person Families | 86 (100.0%) | $89,405 |
| 3-Person Families | 0 (0.0%) | $0 |
| 4-Person Families | 0 (0.0%) | $0 |
| 5-Person Families | 0 (0.0%) | $0 |
| 6-Person Families | 0 (0.0%) | $0 |
| 7+ Person Families | 0 (0.0%) | $0 |
| Total | 86 (100.0%) | $89,405 |
Family Income by Number of Earners in New Trenton
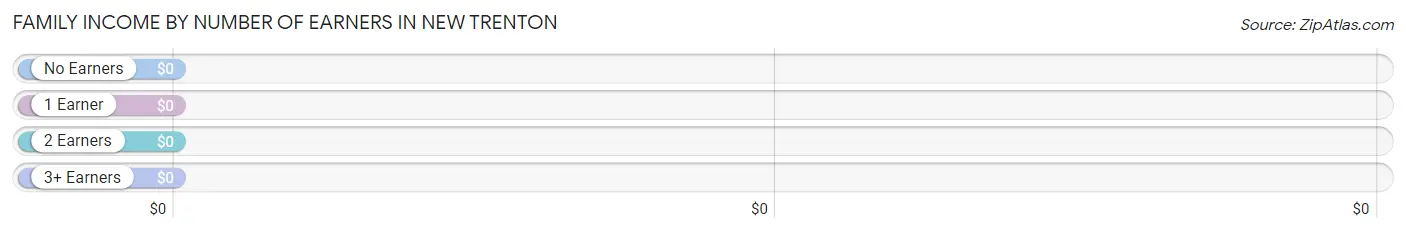
| Number of Earners | # Families | Median Income |
| No Earners | 0 (0.0%) | $0 |
| 1 Earner | 48 (55.8%) | $0 |
| 2 Earners | 38 (44.2%) | $0 |
| 3+ Earners | 0 (0.0%) | $0 |
| Total | 86 (100.0%) | $89,405 |
Household Income in New Trenton
Household Income Brackets in New Trenton
With 45 households falling in the category, the $25,000 to $34,999 income range is the most frequent in New Trenton, accounting for 30.6% of all households.
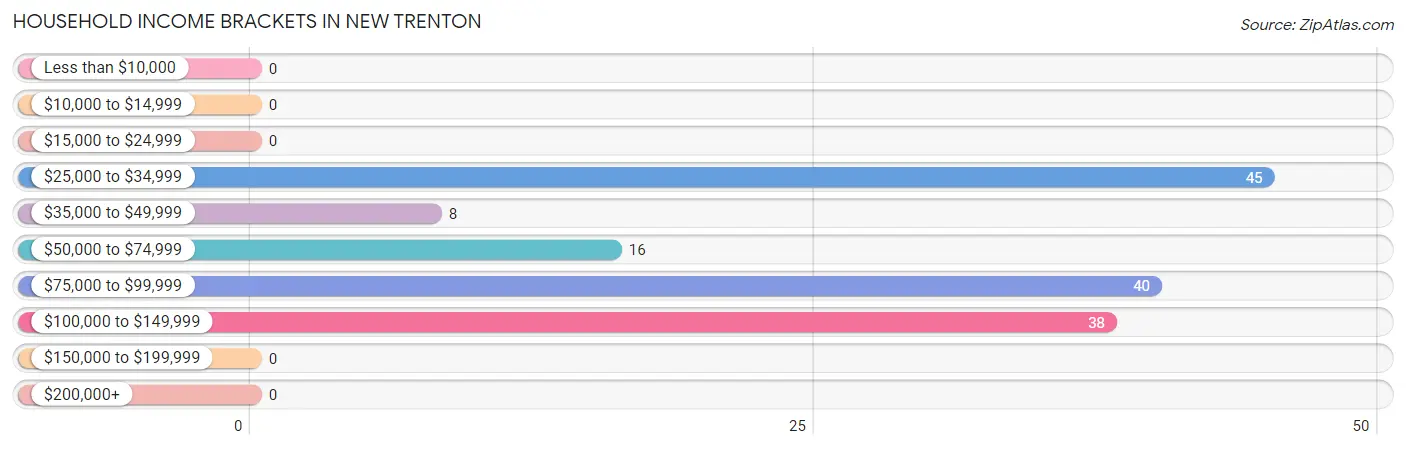
| Income Bracket | # Households | % Households |
| Less than $10,000 | 0 | 0.0% |
| $10,000 to $14,999 | 0 | 0.0% |
| $15,000 to $24,999 | 0 | 0.0% |
| $25,000 to $34,999 | 45 | 30.6% |
| $35,000 to $49,999 | 8 | 5.4% |
| $50,000 to $74,999 | 16 | 10.9% |
| $75,000 to $99,999 | 40 | 27.2% |
| $100,000 to $149,999 | 38 | 25.9% |
| $150,000 to $199,999 | 0 | 0.0% |
| $200,000+ | 0 | 0.0% |
Household Income by Householder Age in New Trenton
| Income Bracket | # Households | Median Income |
| 15 to 24 Years | 0 (0.0%) | $0 |
| 25 to 44 Years | 17 (11.6%) | $0 |
| 45 to 64 Years | 37 (25.2%) | $0 |
| 65+ Years | 93 (63.3%) | $0 |
| Total | 147 (100.0%) | $80,592 |
Poverty in New Trenton
Income Below Poverty by Sex and Age in New Trenton
| Age Bracket | Male | Female |
| Under 5 Years | 0 (0.0%) | 0 (0.0%) |
| 5 Years | 0 (0.0%) | 0 (0.0%) |
| 6 to 11 Years | 0 (0.0%) | 0 (0.0%) |
| 12 to 14 Years | 0 (0.0%) | 0 (0.0%) |
| 15 Years | 0 (0.0%) | 0 (0.0%) |
| 16 and 17 Years | 0 (0.0%) | 0 (0.0%) |
| 18 to 24 Years | 0 (0.0%) | 0 (0.0%) |
| 25 to 34 Years | 0 (0.0%) | 0 (0.0%) |
| 35 to 44 Years | 0 (0.0%) | 0 (0.0%) |
| 45 to 54 Years | 0 (0.0%) | 0 (0.0%) |
| 55 to 64 Years | 0 (0.0%) | 0 (0.0%) |
| 65 to 74 Years | 0 (0.0%) | 0 (0.0%) |
| 75 Years and over | 0 (0.0%) | 0 (0.0%) |
| Total | 0 (0.0%) | 0 (0.0%) |
Income Above Poverty by Sex and Age in New Trenton
According to the poverty statistics in New Trenton, males aged 35 to 44 years and females aged 18 to 24 years are the age groups that are most secure financially, with 100.0% of males and 100.0% of females in these age groups living above the poverty line.
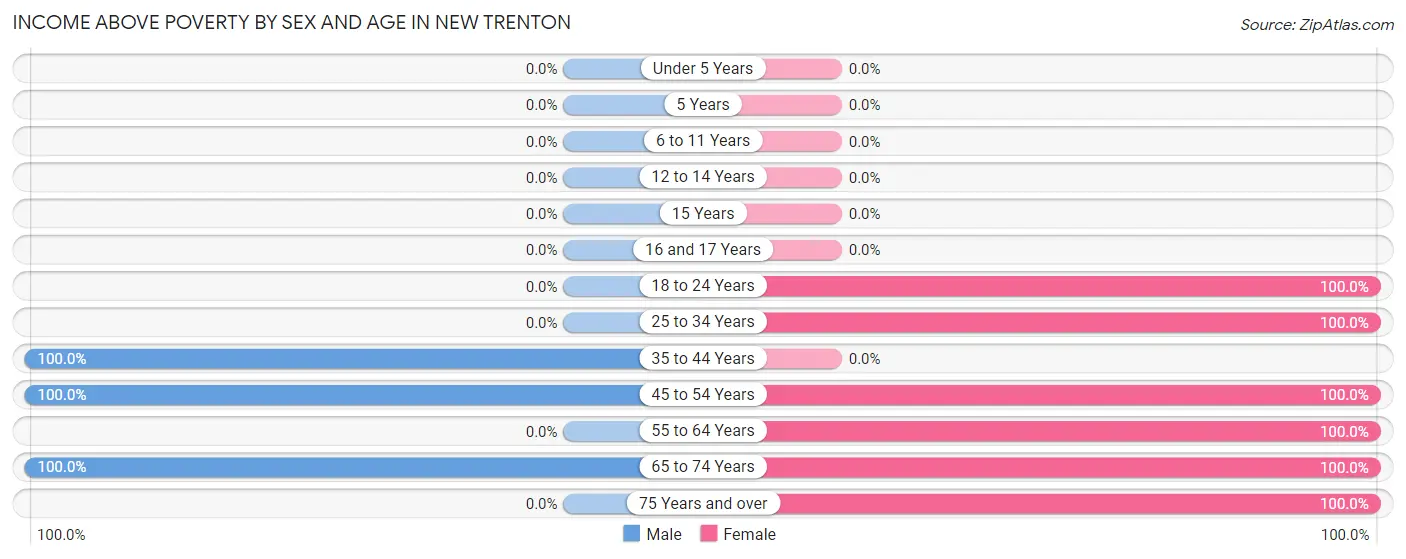
| Age Bracket | Male | Female |
| Under 5 Years | 0 (0.0%) | 0 (0.0%) |
| 5 Years | 0 (0.0%) | 0 (0.0%) |
| 6 to 11 Years | 0 (0.0%) | 0 (0.0%) |
| 12 to 14 Years | 0 (0.0%) | 0 (0.0%) |
| 15 Years | 0 (0.0%) | 0 (0.0%) |
| 16 and 17 Years | 0 (0.0%) | 0 (0.0%) |
| 18 to 24 Years | 0 (0.0%) | 17 (100.0%) |
| 25 to 34 Years | 0 (0.0%) | 18 (100.0%) |
| 35 to 44 Years | 17 (100.0%) | 0 (0.0%) |
| 45 to 54 Years | 39 (100.0%) | 20 (100.0%) |
| 55 to 64 Years | 0 (0.0%) | 21 (100.0%) |
| 65 to 74 Years | 49 (100.0%) | 32 (100.0%) |
| 75 Years and over | 0 (0.0%) | 45 (100.0%) |
| Total | 105 (100.0%) | 153 (100.0%) |
Income Below Poverty Among Married-Couple Families in New Trenton
| Children | Above Poverty | Below Poverty |
| No Children | 67 (100.0%) | 0 (0.0%) |
| 1 or 2 Children | 0 (0.0%) | 0 (0.0%) |
| 3 or 4 Children | 0 (0.0%) | 0 (0.0%) |
| 5 or more Children | 0 (0.0%) | 0 (0.0%) |
| Total | 67 (100.0%) | 0 (0.0%) |
Income Below Poverty Among Single-Parent Households in New Trenton
| Children | Single Father | Single Mother |
| No Children | 0 (0.0%) | 0 (0.0%) |
| 1 or 2 Children | 0 (0.0%) | 0 (0.0%) |
| 3 or 4 Children | 0 (0.0%) | 0 (0.0%) |
| 5 or more Children | 0 (0.0%) | 0 (0.0%) |
| Total | 0 (0.0%) | 0 (0.0%) |
Income Below Poverty Among Married-Couple vs Single-Parent Households in New Trenton
| Children | Married-Couple Families | Single-Parent Households |
| No Children | 0 (0.0%) | 0 (0.0%) |
| 1 or 2 Children | 0 (0.0%) | 0 (0.0%) |
| 3 or 4 Children | 0 (0.0%) | 0 (0.0%) |
| 5 or more Children | 0 (0.0%) | 0 (0.0%) |
| Total | 0 (0.0%) | 0 (0.0%) |
Race in New Trenton
The most populous races in New Trenton are , and White / Caucasian (258 | 100.0%).
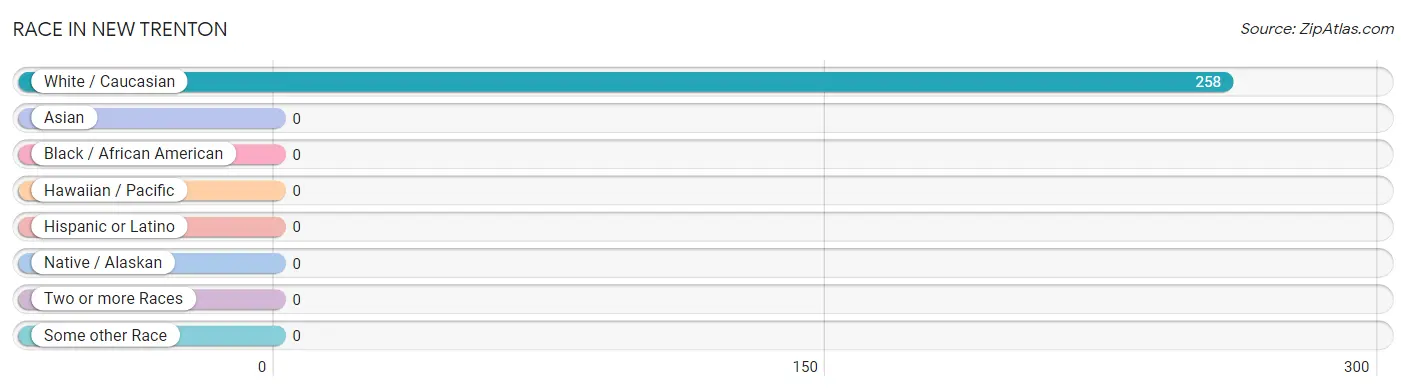
| Race | # Population | % Population |
| Asian | 0 | 0.0% |
| Black / African American | 0 | 0.0% |
| Hawaiian / Pacific | 0 | 0.0% |
| Hispanic or Latino | 0 | 0.0% |
| Native / Alaskan | 0 | 0.0% |
| White / Caucasian | 258 | 100.0% |
| Two or more Races | 0 | 0.0% |
| Some other Race | 0 | 0.0% |
| Total | 258 | 100.0% |
Ancestry in New Trenton
The most populous ancestries reported in New Trenton are German (107 | 41.5%), American (44 | 17.1%), Polish (18 | 7.0%), Russian (18 | 7.0%), and Dutch (11 | 4.3%), together accounting for 76.7% of all New Trenton residents.
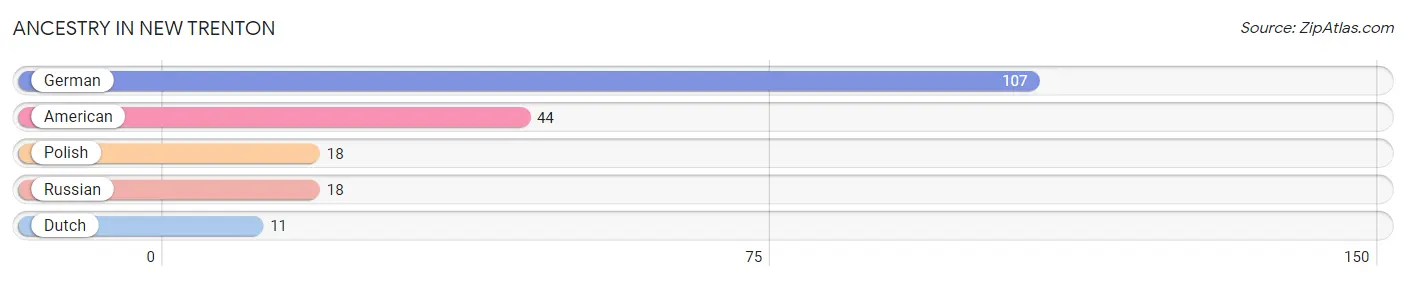
| Ancestry | # Population | % Population |
| American | 44 | 17.1% |
| Dutch | 11 | 4.3% |
| German | 107 | 41.5% |
| Polish | 18 | 7.0% |
| Russian | 18 | 7.0% | View All 5 Rows |
Immigrants in New Trenton

| Immigration Origin | # Population | % Population | View All 0 Rows |
Sex and Age in New Trenton
Sex and Age in New Trenton
The most populous age groups in New Trenton are 65 to 69 Years (27 | 25.7%) for men and 80 to 84 Years (45 | 29.4%) for women.
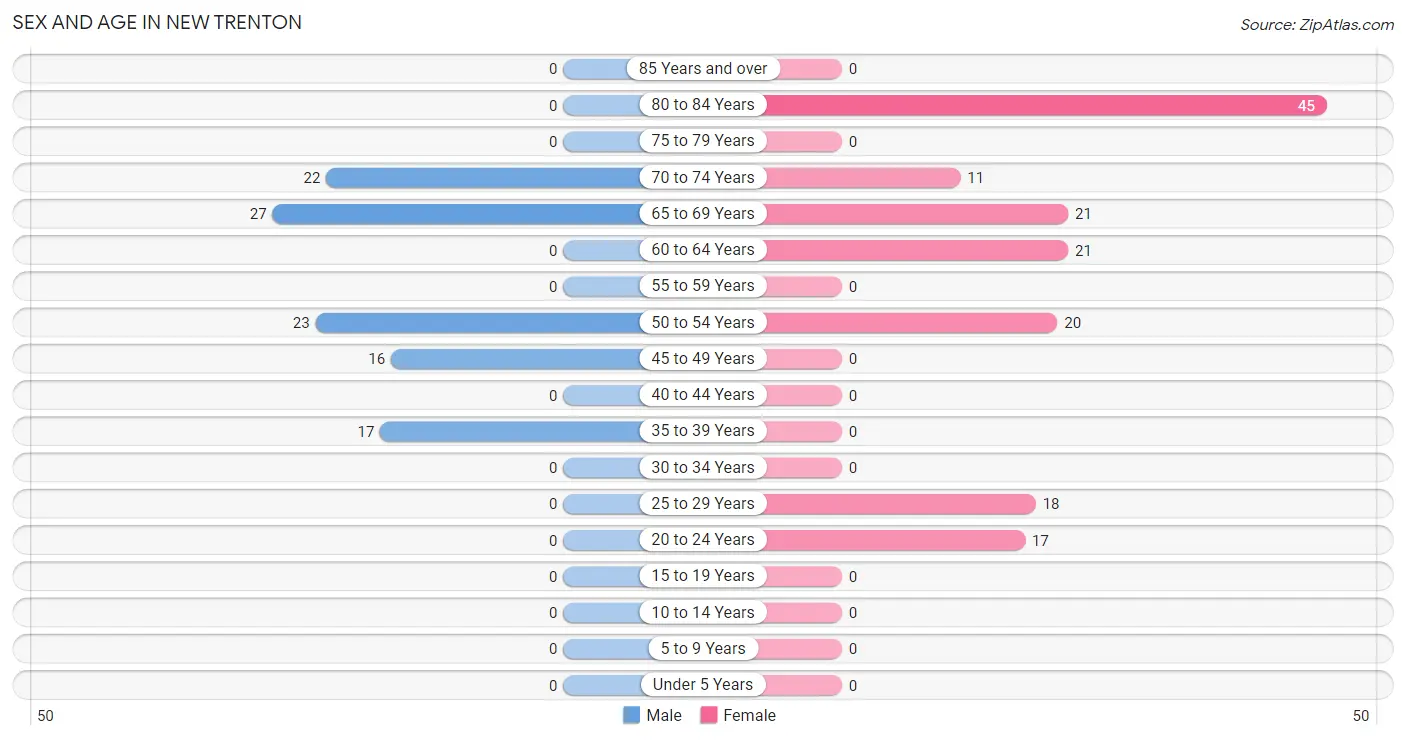
| Age Bracket | Male | Female |
| Under 5 Years | 0 (0.0%) | 0 (0.0%) |
| 5 to 9 Years | 0 (0.0%) | 0 (0.0%) |
| 10 to 14 Years | 0 (0.0%) | 0 (0.0%) |
| 15 to 19 Years | 0 (0.0%) | 0 (0.0%) |
| 20 to 24 Years | 0 (0.0%) | 17 (11.1%) |
| 25 to 29 Years | 0 (0.0%) | 18 (11.8%) |
| 30 to 34 Years | 0 (0.0%) | 0 (0.0%) |
| 35 to 39 Years | 17 (16.2%) | 0 (0.0%) |
| 40 to 44 Years | 0 (0.0%) | 0 (0.0%) |
| 45 to 49 Years | 16 (15.2%) | 0 (0.0%) |
| 50 to 54 Years | 23 (21.9%) | 20 (13.1%) |
| 55 to 59 Years | 0 (0.0%) | 0 (0.0%) |
| 60 to 64 Years | 0 (0.0%) | 21 (13.7%) |
| 65 to 69 Years | 27 (25.7%) | 21 (13.7%) |
| 70 to 74 Years | 22 (20.9%) | 11 (7.2%) |
| 75 to 79 Years | 0 (0.0%) | 0 (0.0%) |
| 80 to 84 Years | 0 (0.0%) | 45 (29.4%) |
| 85 Years and over | 0 (0.0%) | 0 (0.0%) |
| Total | 105 (100.0%) | 153 (100.0%) |
Families and Households in New Trenton
Median Family Size in New Trenton
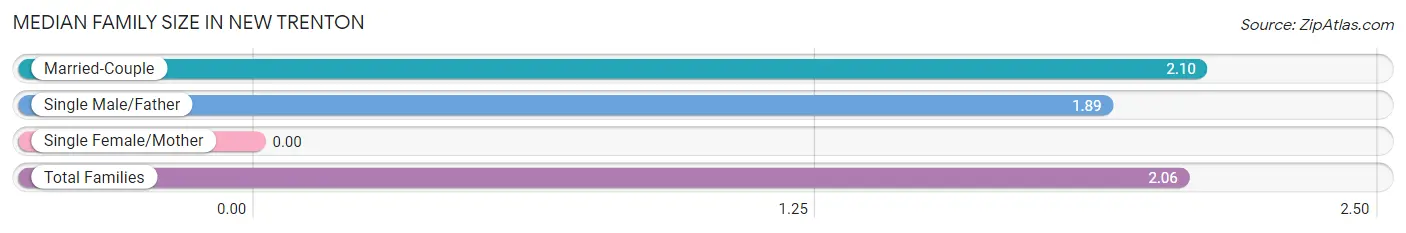
| Family Type | # Families | Family Size |
| Married-Couple | 67 (77.9%) | 2.10 |
| Single Male/Father | 19 (22.1%) | 1.89 |
| Single Female/Mother | 0 (0.0%) | - |
| Total Families | 86 (100.0%) | 2.06 |
Median Household Size in New Trenton
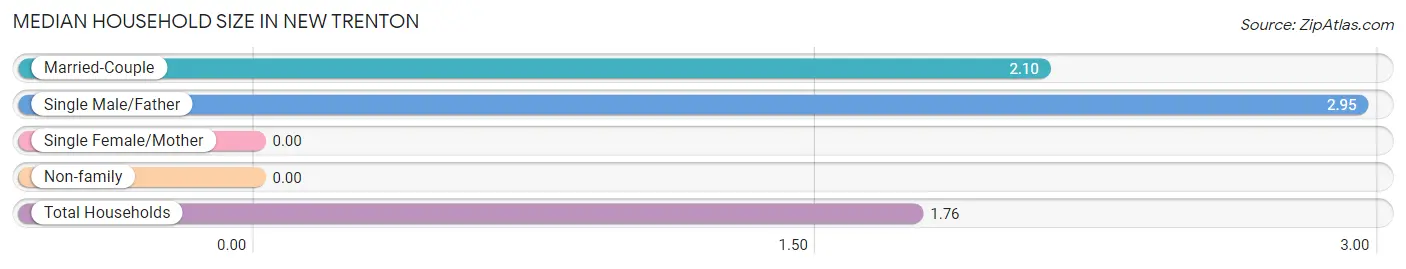
| Household Type | # Households | Household Size |
| Married-Couple | 67 (45.6%) | 2.10 |
| Single Male/Father | 19 (12.9%) | 2.95 |
| Single Female/Mother | 0 (0.0%) | - |
| Non-family | 61 (41.5%) | - |
| Total Households | 147 (100.0%) | 1.76 |
Household Size by Marriage Status in New Trenton
Out of a total of 147 households in New Trenton, 86 (58.5%) are family households, while 61 (41.5%) are nonfamily households. The most numerous type of family households are 2-person households, comprising 67, and the most common type of nonfamily households are 1-person households, comprising 61.
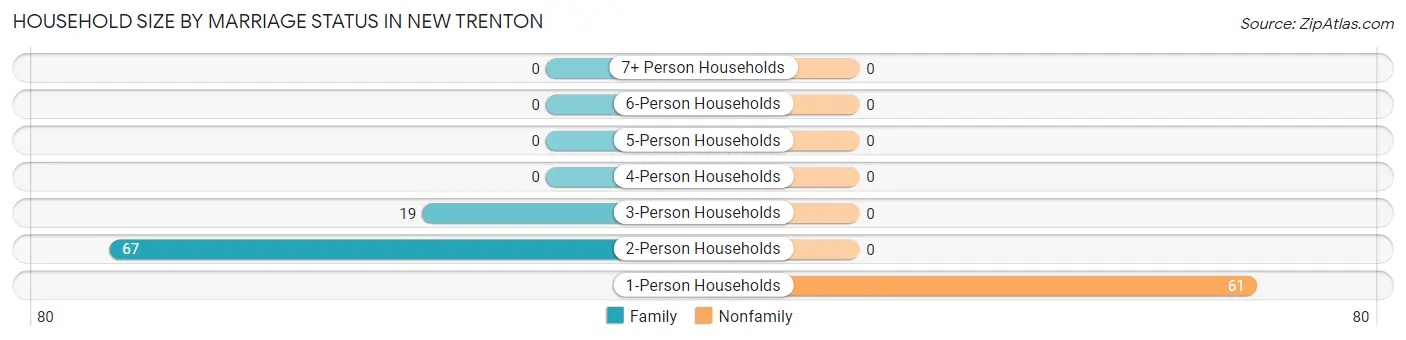
| Household Size | Family Households | Nonfamily Households |
| 1-Person Households | - | 61 (41.5%) |
| 2-Person Households | 67 (45.6%) | 0 (0.0%) |
| 3-Person Households | 19 (12.9%) | 0 (0.0%) |
| 4-Person Households | 0 (0.0%) | 0 (0.0%) |
| 5-Person Households | 0 (0.0%) | 0 (0.0%) |
| 6-Person Households | 0 (0.0%) | 0 (0.0%) |
| 7+ Person Households | 0 (0.0%) | 0 (0.0%) |
| Total | 86 (58.5%) | 61 (41.5%) |
Female Fertility in New Trenton
Fertility by Age in New Trenton
| Age Bracket | Women with Births | Births / 1,000 Women |
| 15 to 19 years | 0 (0.0%) | 0.0 |
| 20 to 34 years | 0 (0.0%) | 0.0 |
| 35 to 50 years | 0 (0.0%) | 0.0 |
| Total | 0 (0.0%) | 0.0 |
Fertility by Age by Marriage Status in New Trenton
| Age Bracket | Married | Unmarried |
| 15 to 19 years | 0 (0.0%) | 0 (0.0%) |
| 20 to 34 years | 0 (0.0%) | 0 (0.0%) |
| 35 to 50 years | 0 (0.0%) | 0 (0.0%) |
| Total | 0 (0.0%) | 0 (0.0%) |
Fertility by Education in New Trenton
| Educational Attainment | Women with Births | Births / 1,000 Women |
| Less than High School | 0 (0.0%) | 0.0 |
| High School Diploma | 0 (0.0%) | 0.0 |
| College or Associate's Degree | 0 (0.0%) | 0.0 |
| Bachelor's Degree | 0 (0.0%) | 0.0 |
| Graduate Degree | 0 (0.0%) | 0.0 |
| Total | 0 (0.0%) | 0.0 |
Fertility by Education by Marriage Status in New Trenton
| Educational Attainment | Married | Unmarried |
| Less than High School | 0 (0.0%) | 0 (0.0%) |
| High School Diploma | 0 (0.0%) | 0 (0.0%) |
| College or Associate's Degree | 0 (0.0%) | 0 (0.0%) |
| Bachelor's Degree | 0 (0.0%) | 0 (0.0%) |
| Graduate Degree | 0 (0.0%) | 0 (0.0%) |
| Total | 0 (0.0%) | 0 (0.0%) |
Employment Characteristics in New Trenton
Employment by Class of Employer in New Trenton
Among the 161 employed individuals in New Trenton, private company employees (59 | 36.6%), self-employed (not incorporated) (44 | 27.3%), and not-for-profit organizations (37 | 23.0%) make up the most common classes of employment.
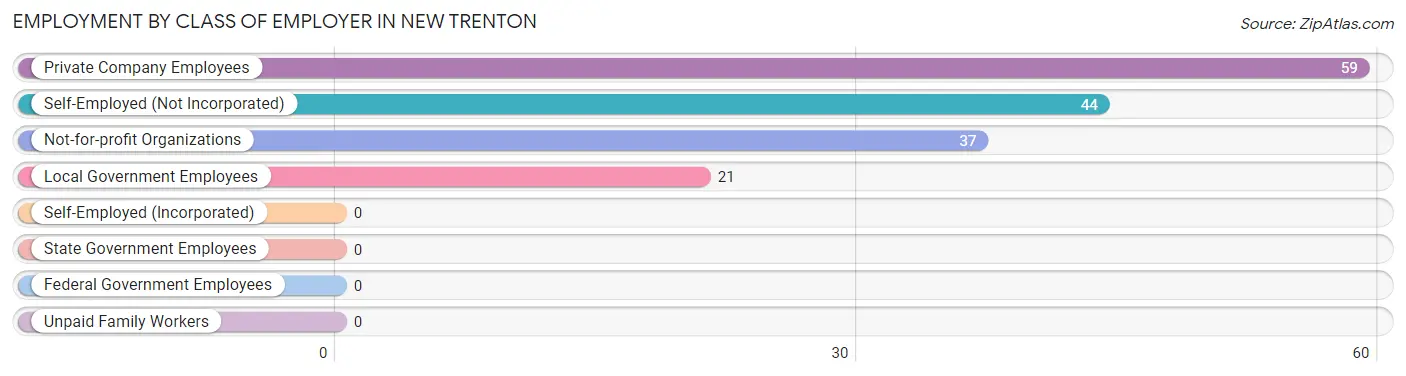
| Employer Class | # Employees | % Employees |
| Private Company Employees | 59 | 36.6% |
| Self-Employed (Incorporated) | 0 | 0.0% |
| Self-Employed (Not Incorporated) | 44 | 27.3% |
| Not-for-profit Organizations | 37 | 23.0% |
| Local Government Employees | 21 | 13.0% |
| State Government Employees | 0 | 0.0% |
| Federal Government Employees | 0 | 0.0% |
| Unpaid Family Workers | 0 | 0.0% |
| Total | 161 | 100.0% |
Employment Status by Age in New Trenton
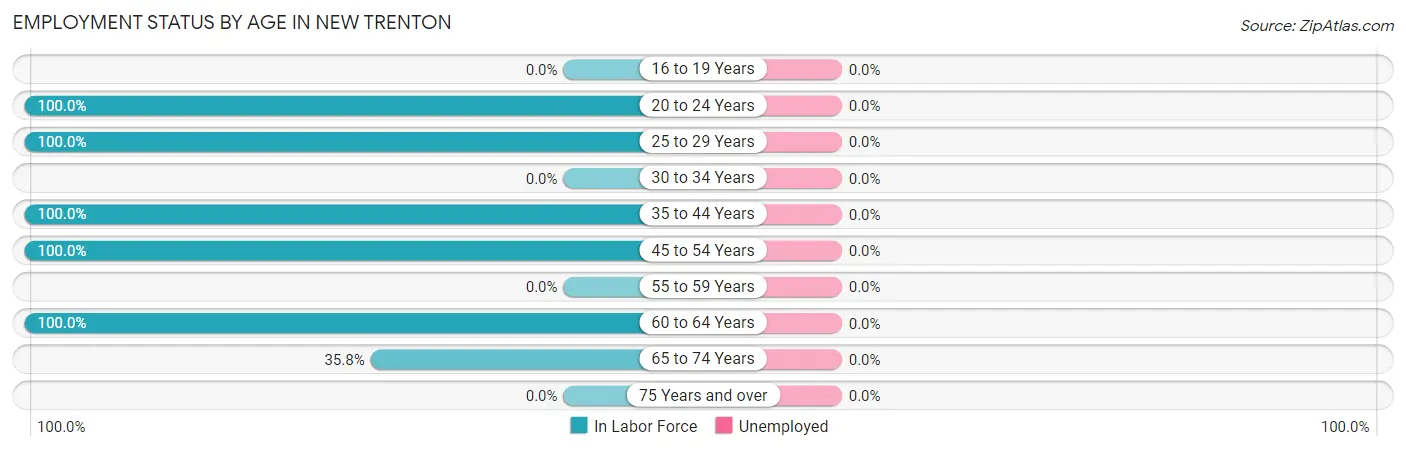
| Age Bracket | In Labor Force | Unemployed |
| 16 to 19 Years | 0 (0.0%) | 0 (0.0%) |
| 20 to 24 Years | 17 (100.0%) | 0 (0.0%) |
| 25 to 29 Years | 18 (100.0%) | 0 (0.0%) |
| 30 to 34 Years | 0 (0.0%) | 0 (0.0%) |
| 35 to 44 Years | 17 (100.0%) | 0 (0.0%) |
| 45 to 54 Years | 59 (100.0%) | 0 (0.0%) |
| 55 to 59 Years | 0 (0.0%) | 0 (0.0%) |
| 60 to 64 Years | 21 (100.0%) | 0 (0.0%) |
| 65 to 74 Years | 29 (35.8%) | 0 (0.0%) |
| 75 Years and over | 0 (0.0%) | 0 (0.0%) |
| Total | 161 (62.4%) | 0 (0.0%) |
Employment Status by Educational Attainment in New Trenton
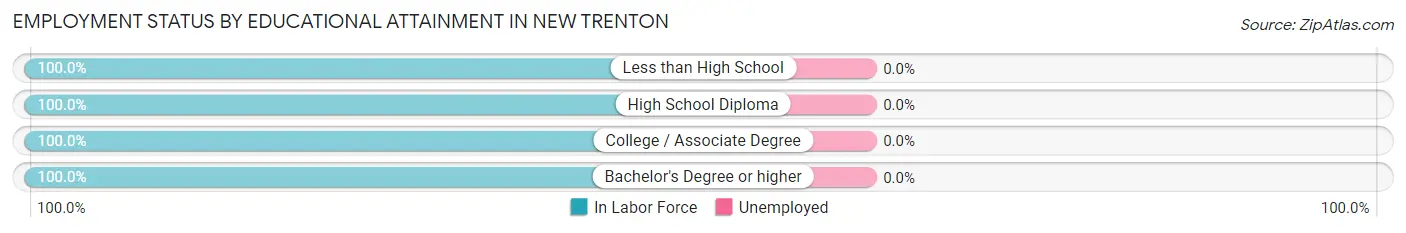
| Educational Attainment | In Labor Force | Unemployed |
| Less than High School | 60 (100.0%) | 0 (0.0%) |
| High School Diploma | 20 (100.0%) | 0 (0.0%) |
| College / Associate Degree | 17 (100.0%) | 0 (0.0%) |
| Bachelor's Degree or higher | 18 (100.0%) | 0 (0.0%) |
| Total | 115 (100.0%) | 0 (0.0%) |
Employment Occupations by Sex in New Trenton
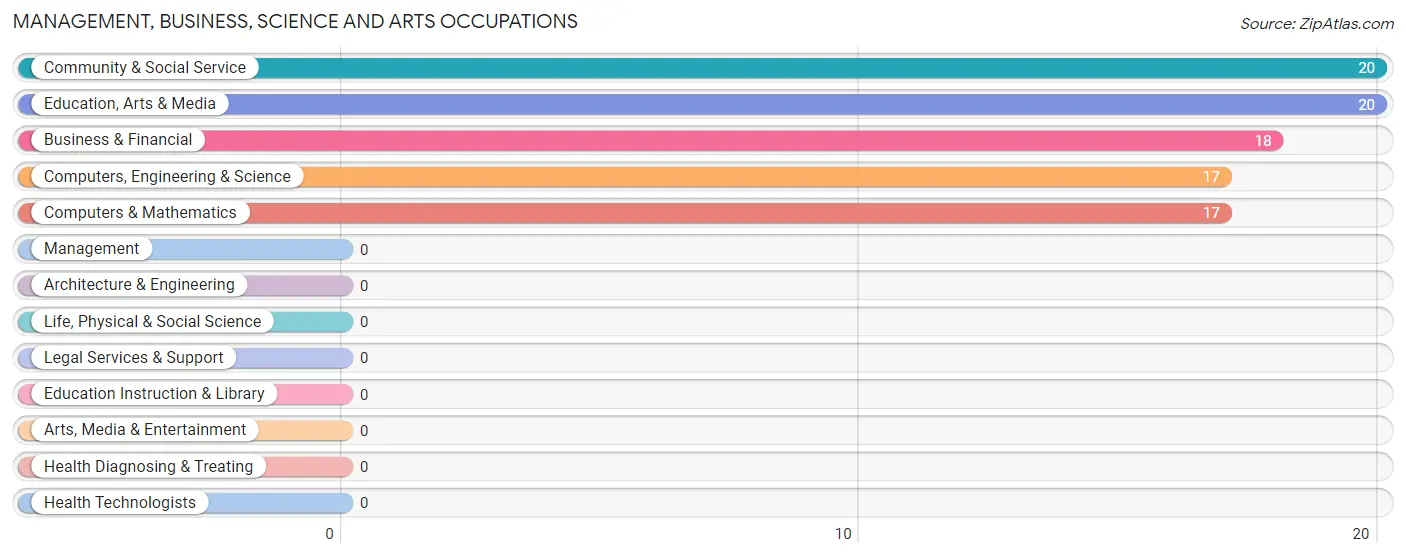
Management, Business, Science and Arts Occupations
The most common Management, Business, Science and Arts occupations in New Trenton are Community & Social Service (20 | 12.4%), Education, Arts & Media (20 | 12.4%), Business & Financial (18 | 11.2%), Computers, Engineering & Science (17 | 10.6%), and Computers & Mathematics (17 | 10.6%).
Management, Business, Science and Arts Occupations by Sex
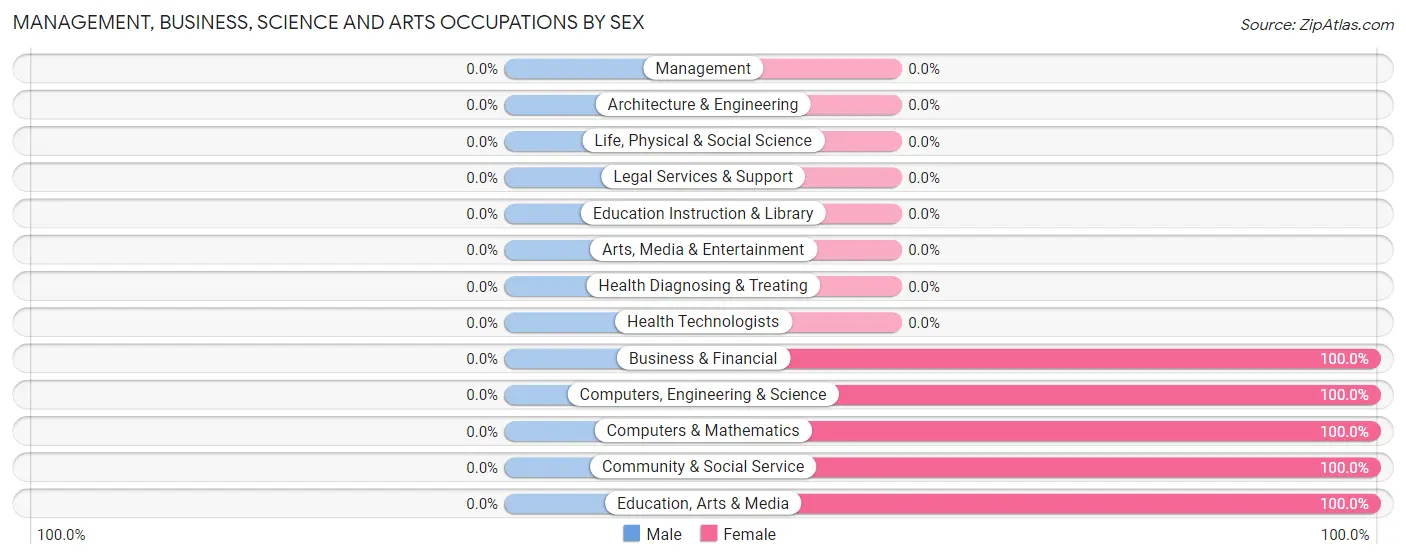
| Occupation | Male | Female |
| Management | 0 (0.0%) | 0 (0.0%) |
| Business & Financial | 0 (0.0%) | 18 (100.0%) |
| Computers, Engineering & Science | 0 (0.0%) | 17 (100.0%) |
| Computers & Mathematics | 0 (0.0%) | 17 (100.0%) |
| Architecture & Engineering | 0 (0.0%) | 0 (0.0%) |
| Life, Physical & Social Science | 0 (0.0%) | 0 (0.0%) |
| Community & Social Service | 0 (0.0%) | 20 (100.0%) |
| Education, Arts & Media | 0 (0.0%) | 20 (100.0%) |
| Legal Services & Support | 0 (0.0%) | 0 (0.0%) |
| Education Instruction & Library | 0 (0.0%) | 0 (0.0%) |
| Arts, Media & Entertainment | 0 (0.0%) | 0 (0.0%) |
| Health Diagnosing & Treating | 0 (0.0%) | 0 (0.0%) |
| Health Technologists | 0 (0.0%) | 0 (0.0%) |
| Total (Category) | 0 (0.0%) | 55 (100.0%) |
| Total (Overall) | 64 (39.8%) | 97 (60.3%) |
Services Occupations
The most common Services occupations in New Trenton are , and Food Preparation & Serving (21 | 13.0%).
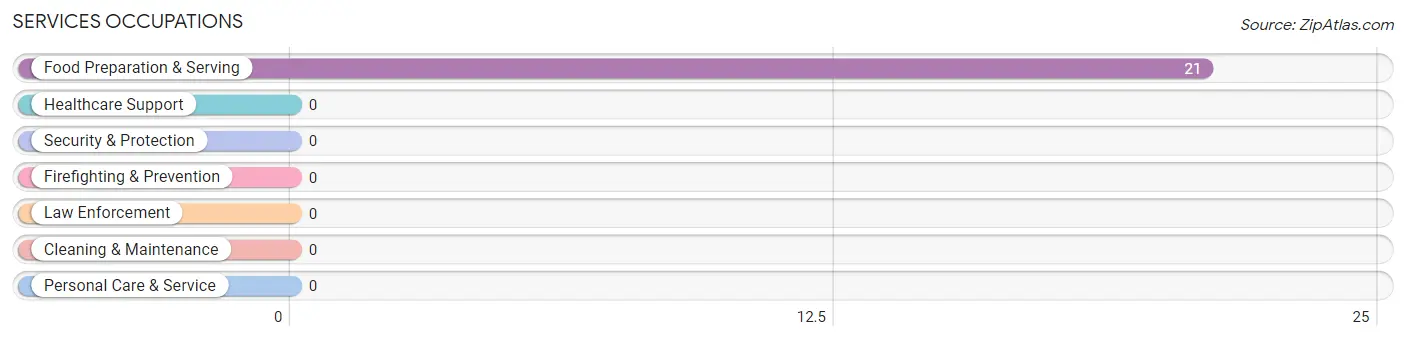
Services Occupations by Sex
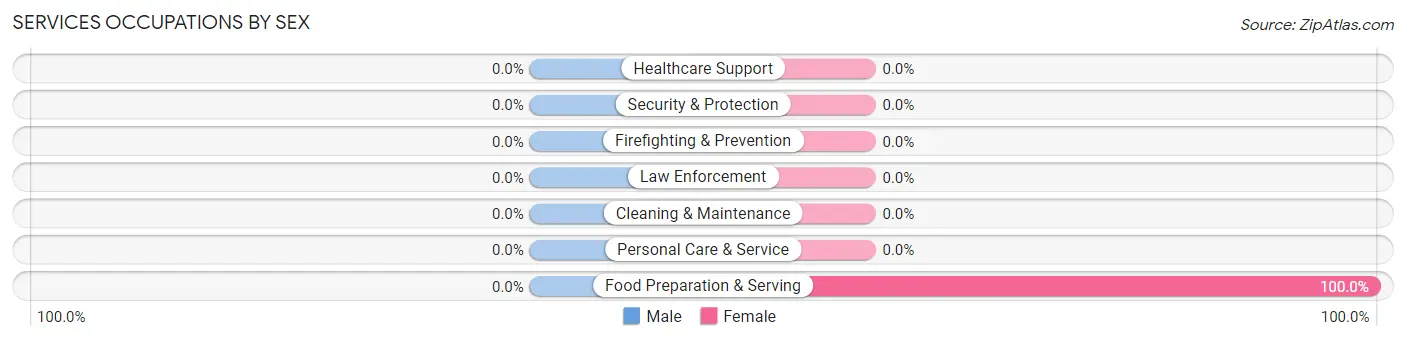
| Occupation | Male | Female |
| Healthcare Support | 0 (0.0%) | 0 (0.0%) |
| Security & Protection | 0 (0.0%) | 0 (0.0%) |
| Firefighting & Prevention | 0 (0.0%) | 0 (0.0%) |
| Law Enforcement | 0 (0.0%) | 0 (0.0%) |
| Food Preparation & Serving | 0 (0.0%) | 21 (100.0%) |
| Cleaning & Maintenance | 0 (0.0%) | 0 (0.0%) |
| Personal Care & Service | 0 (0.0%) | 0 (0.0%) |
| Total (Category) | 0 (0.0%) | 21 (100.0%) |
| Total (Overall) | 64 (39.8%) | 97 (60.3%) |
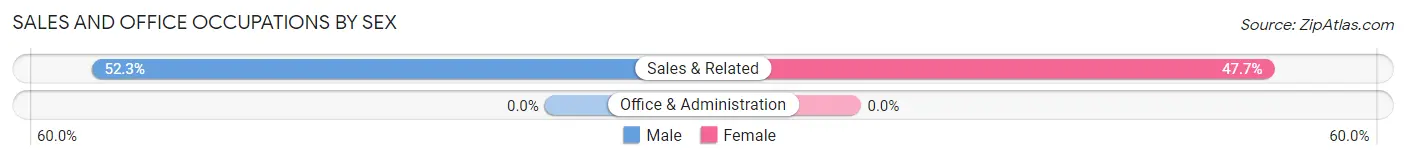
Sales and Office Occupations
The most common Sales and Office occupations in New Trenton are , and Sales & Related (44 | 27.3%).
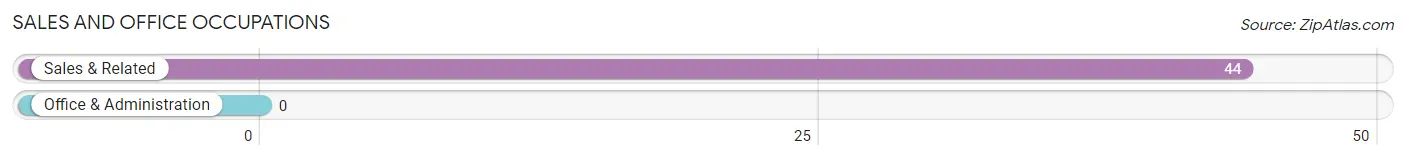
Sales and Office Occupations by Sex
| Occupation | Male | Female |
| Sales & Related | 23 (52.3%) | 21 (47.7%) |
| Office & Administration | 0 (0.0%) | 0 (0.0%) |
| Total (Category) | 23 (52.3%) | 21 (47.7%) |
| Total (Overall) | 64 (39.8%) | 97 (60.3%) |
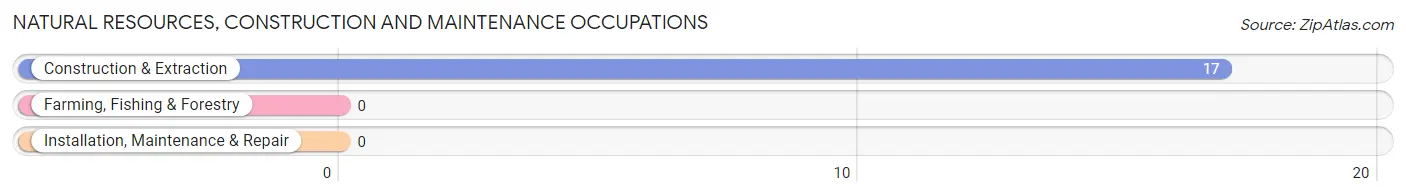
Natural Resources, Construction and Maintenance Occupations
The most common Natural Resources, Construction and Maintenance occupations in New Trenton are , and Construction & Extraction (17 | 10.6%).
Natural Resources, Construction and Maintenance Occupations by Sex
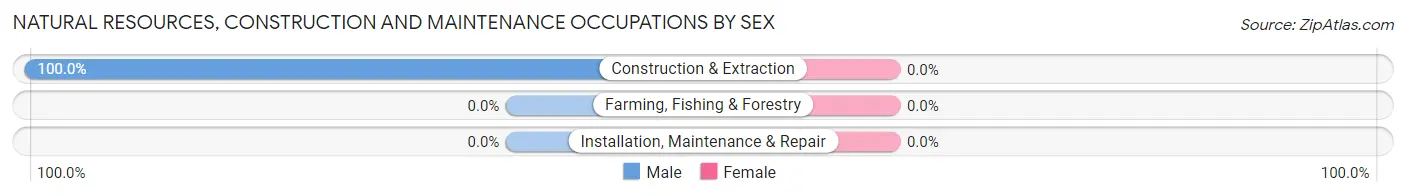
| Occupation | Male | Female |
| Farming, Fishing & Forestry | 0 (0.0%) | 0 (0.0%) |
| Construction & Extraction | 17 (100.0%) | 0 (0.0%) |
| Installation, Maintenance & Repair | 0 (0.0%) | 0 (0.0%) |
| Total (Category) | 17 (100.0%) | 0 (0.0%) |
| Total (Overall) | 64 (39.8%) | 97 (60.3%) |
Production, Transportation and Moving Occupations
The most common Production, Transportation and Moving occupations in New Trenton are Production (16 | 9.9%), and Material Moving (8 | 5.0%).
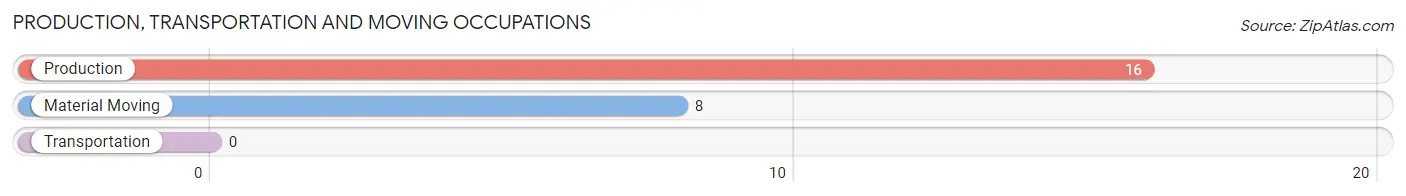
Production, Transportation and Moving Occupations by Sex
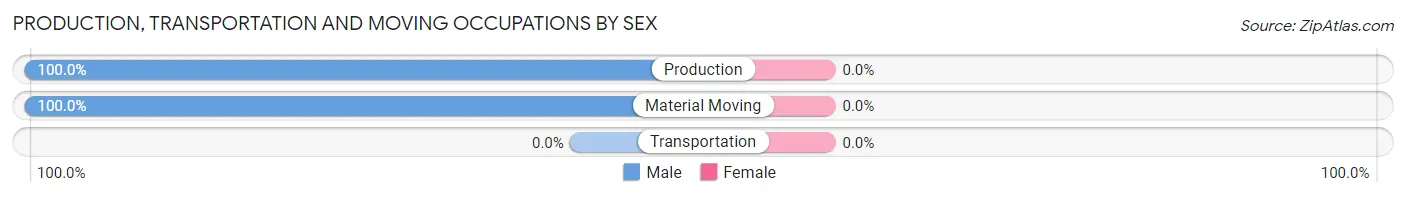
| Occupation | Male | Female |
| Production | 16 (100.0%) | 0 (0.0%) |
| Transportation | 0 (0.0%) | 0 (0.0%) |
| Material Moving | 8 (100.0%) | 0 (0.0%) |
| Total (Category) | 24 (100.0%) | 0 (0.0%) |
| Total (Overall) | 64 (39.8%) | 97 (60.3%) |
Employment Industries by Sex in New Trenton
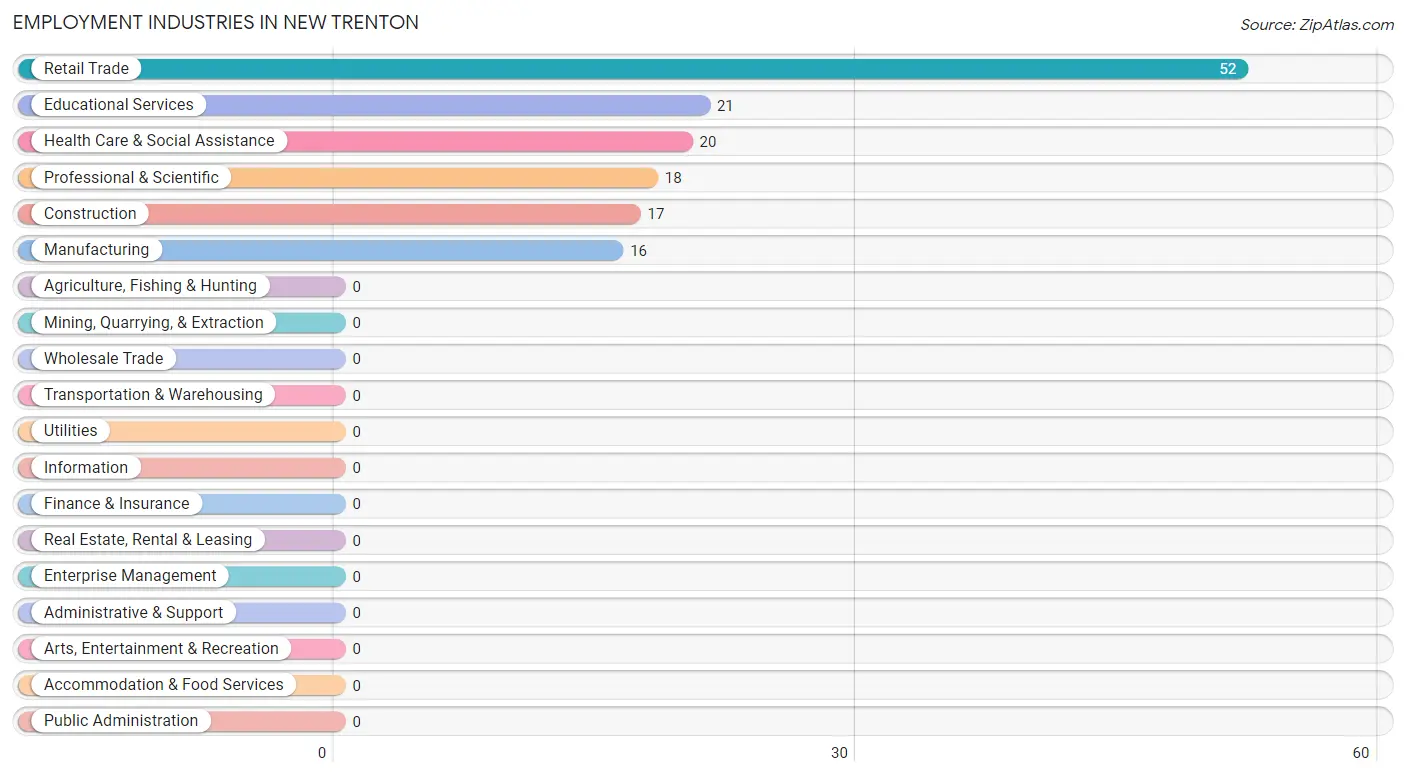
Employment Industries in New Trenton
The major employment industries in New Trenton include Retail Trade (52 | 32.3%), Educational Services (21 | 13.0%), Health Care & Social Assistance (20 | 12.4%), Professional & Scientific (18 | 11.2%), and Construction (17 | 10.6%).
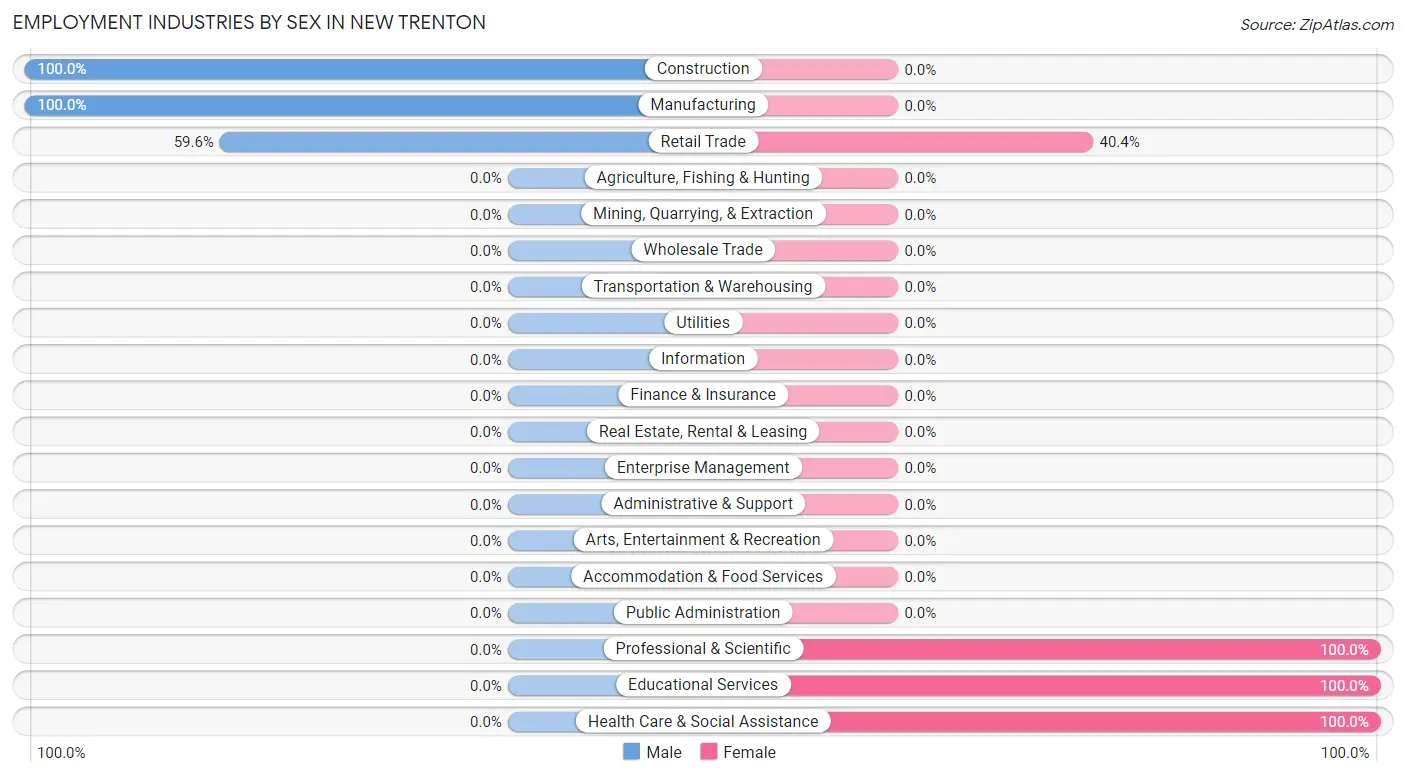
Employment Industries by Sex in New Trenton
The New Trenton industries that see more men than women are Construction (100.0%), Manufacturing (100.0%), and Retail Trade (59.6%), whereas the industries that tend to have a higher number of women are Professional & Scientific (100.0%), Educational Services (100.0%), and Health Care & Social Assistance (100.0%).
| Industry | Male | Female |
| Agriculture, Fishing & Hunting | 0 (0.0%) | 0 (0.0%) |
| Mining, Quarrying, & Extraction | 0 (0.0%) | 0 (0.0%) |
| Construction | 17 (100.0%) | 0 (0.0%) |
| Manufacturing | 16 (100.0%) | 0 (0.0%) |
| Wholesale Trade | 0 (0.0%) | 0 (0.0%) |
| Retail Trade | 31 (59.6%) | 21 (40.4%) |
| Transportation & Warehousing | 0 (0.0%) | 0 (0.0%) |
| Utilities | 0 (0.0%) | 0 (0.0%) |
| Information | 0 (0.0%) | 0 (0.0%) |
| Finance & Insurance | 0 (0.0%) | 0 (0.0%) |
| Real Estate, Rental & Leasing | 0 (0.0%) | 0 (0.0%) |
| Professional & Scientific | 0 (0.0%) | 18 (100.0%) |
| Enterprise Management | 0 (0.0%) | 0 (0.0%) |
| Administrative & Support | 0 (0.0%) | 0 (0.0%) |
| Educational Services | 0 (0.0%) | 21 (100.0%) |
| Health Care & Social Assistance | 0 (0.0%) | 20 (100.0%) |
| Arts, Entertainment & Recreation | 0 (0.0%) | 0 (0.0%) |
| Accommodation & Food Services | 0 (0.0%) | 0 (0.0%) |
| Public Administration | 0 (0.0%) | 0 (0.0%) |
| Total | 64 (39.8%) | 97 (60.3%) |
Education in New Trenton
School Enrollment in New Trenton
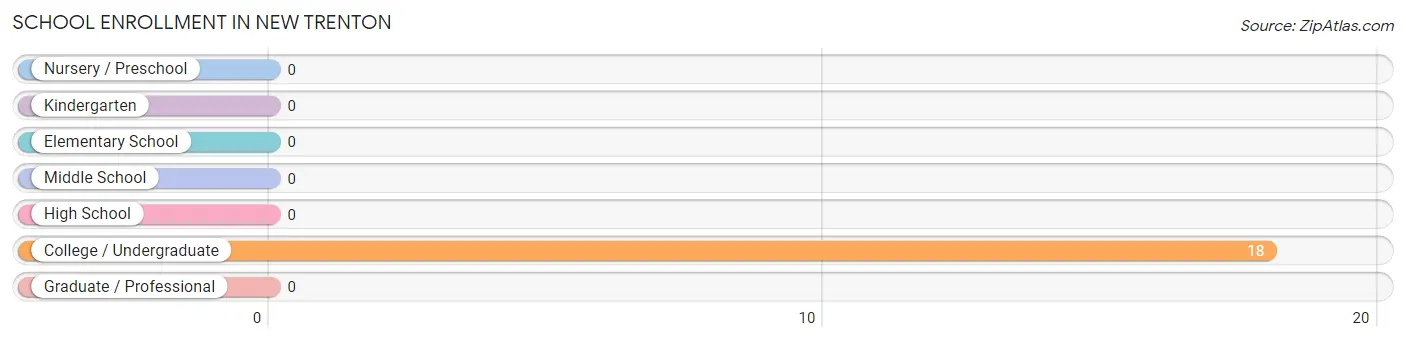
| School Level | # Students | % Students |
| Nursery / Preschool | 0 | 0.0% |
| Kindergarten | 0 | 0.0% |
| Elementary School | 0 | 0.0% |
| Middle School | 0 | 0.0% |
| High School | 0 | 0.0% |
| College / Undergraduate | 18 | 100.0% |
| Graduate / Professional | 0 | 0.0% |
| Total | 18 | 100.0% |
School Enrollment by Age by Funding Source in New Trenton
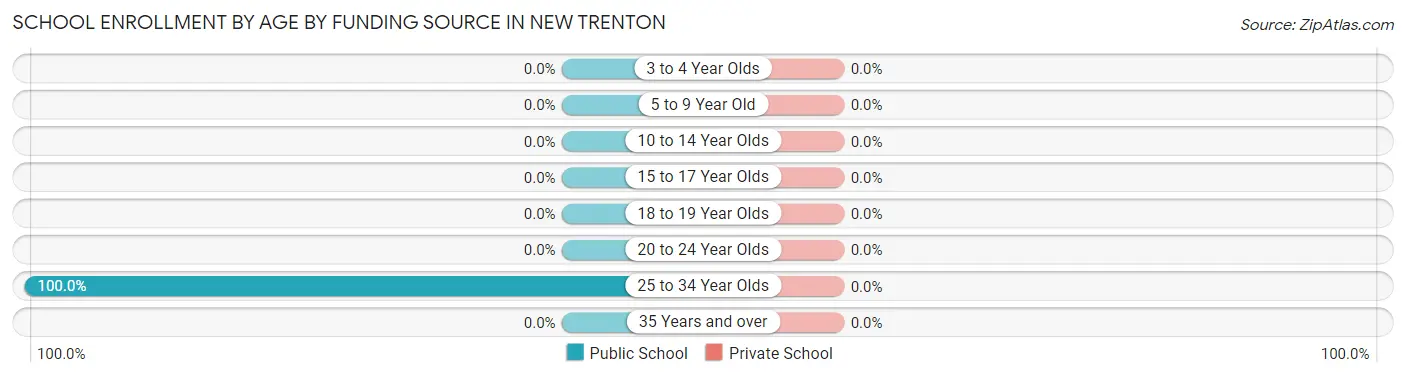
| Age Bracket | Public School | Private School |
| 3 to 4 Year Olds | 0 (0.0%) | 0 (0.0%) |
| 5 to 9 Year Old | 0 (0.0%) | 0 (0.0%) |
| 10 to 14 Year Olds | 0 (0.0%) | 0 (0.0%) |
| 15 to 17 Year Olds | 0 (0.0%) | 0 (0.0%) |
| 18 to 19 Year Olds | 0 (0.0%) | 0 (0.0%) |
| 20 to 24 Year Olds | 0 (0.0%) | 0 (0.0%) |
| 25 to 34 Year Olds | 18 (100.0%) | 0 (0.0%) |
| 35 Years and over | 0 (0.0%) | 0 (0.0%) |
| Total | 18 (100.0%) | 0 (0.0%) |
Educational Attainment by Field of Study in New Trenton
, and science & technology (18 | 100.0%) are the most common fields of study among 18 individuals in New Trenton who have obtained a bachelor's degree or higher.
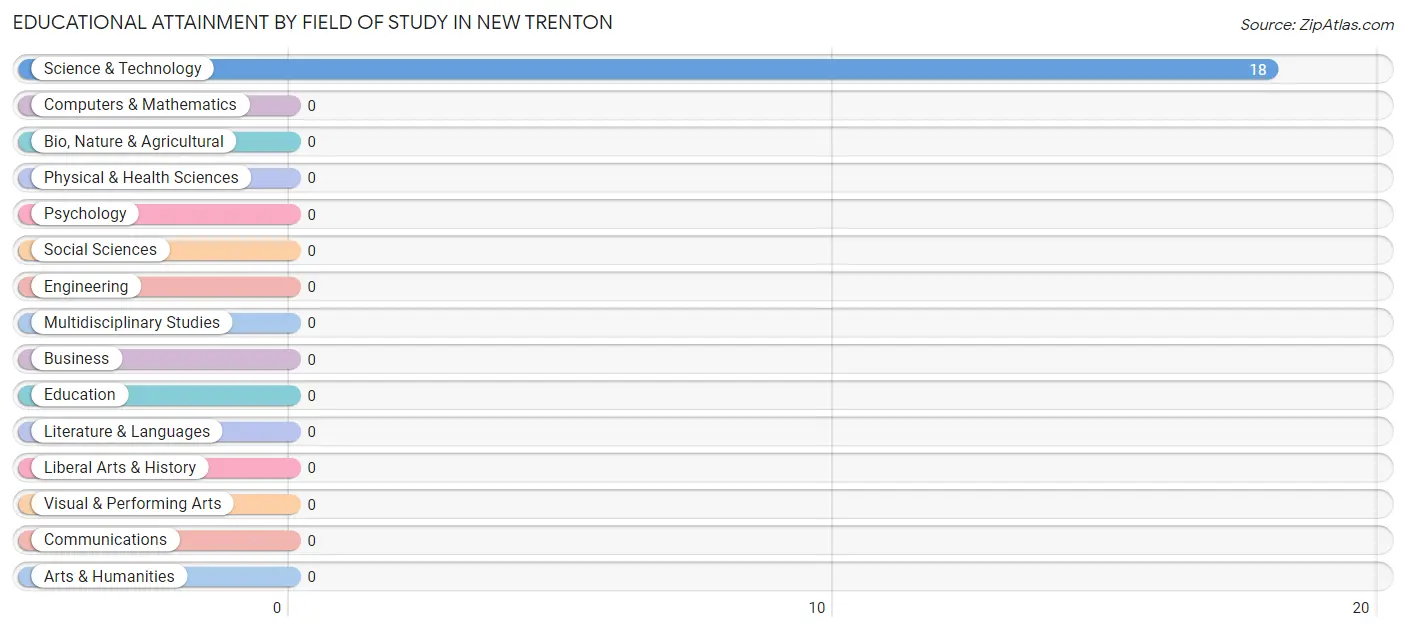
| Field of Study | # Graduates | % Graduates |
| Computers & Mathematics | 0 | 0.0% |
| Bio, Nature & Agricultural | 0 | 0.0% |
| Physical & Health Sciences | 0 | 0.0% |
| Psychology | 0 | 0.0% |
| Social Sciences | 0 | 0.0% |
| Engineering | 0 | 0.0% |
| Multidisciplinary Studies | 0 | 0.0% |
| Science & Technology | 18 | 100.0% |
| Business | 0 | 0.0% |
| Education | 0 | 0.0% |
| Literature & Languages | 0 | 0.0% |
| Liberal Arts & History | 0 | 0.0% |
| Visual & Performing Arts | 0 | 0.0% |
| Communications | 0 | 0.0% |
| Arts & Humanities | 0 | 0.0% |
| Total | 18 | 100.0% |
Transportation & Commute in New Trenton
Vehicle Availability by Sex in New Trenton
The most prevalent vehicle ownership categories in New Trenton are males with 2 vehicles (31, accounting for 48.4%) and females with 2 vehicles (42, making up 32.0%).
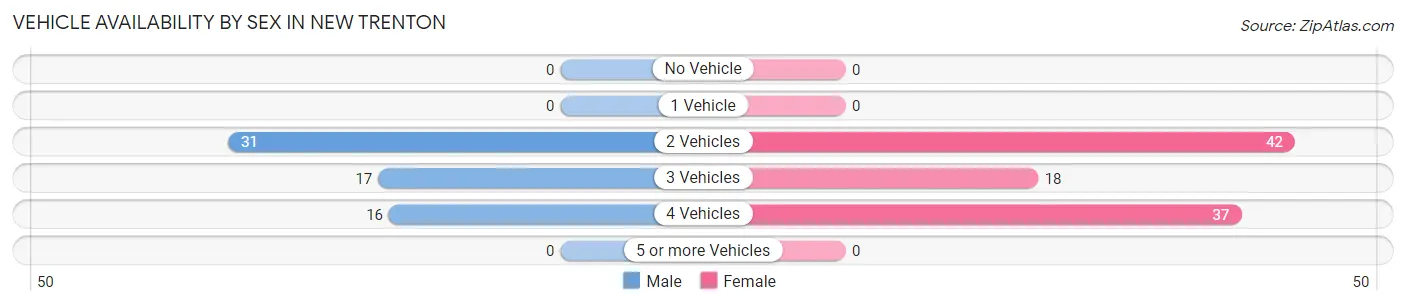
| Vehicles Available | Male | Female |
| No Vehicle | 0 (0.0%) | 0 (0.0%) |
| 1 Vehicle | 0 (0.0%) | 0 (0.0%) |
| 2 Vehicles | 31 (48.4%) | 42 (43.3%) |
| 3 Vehicles | 17 (26.6%) | 18 (18.6%) |
| 4 Vehicles | 16 (25.0%) | 37 (38.1%) |
| 5 or more Vehicles | 0 (0.0%) | 0 (0.0%) |
| Total | 64 (100.0%) | 97 (100.0%) |
Commute Time in New Trenton
The most frequently occuring commute durations in New Trenton are 25 to 29 minutes (21 commuters, 21.2%), 30 to 34 minutes (20 commuters, 20.2%), and 40 to 44 minutes (17 commuters, 17.2%).
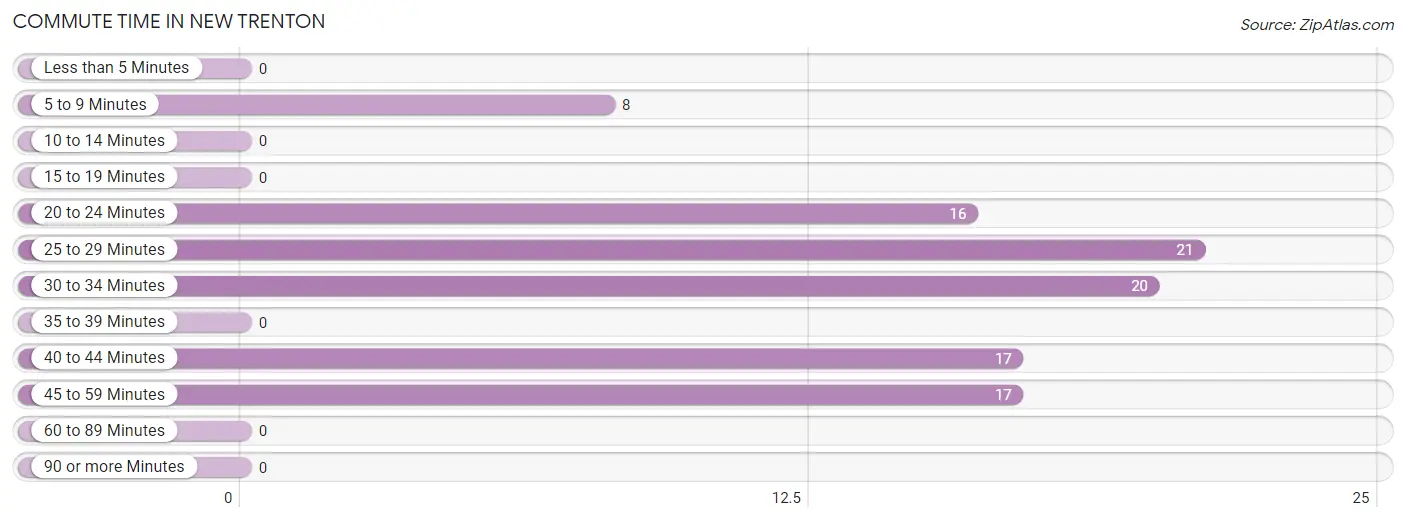
| Commute Time | # Commuters | % Commuters |
| Less than 5 Minutes | 0 | 0.0% |
| 5 to 9 Minutes | 8 | 8.1% |
| 10 to 14 Minutes | 0 | 0.0% |
| 15 to 19 Minutes | 0 | 0.0% |
| 20 to 24 Minutes | 16 | 16.2% |
| 25 to 29 Minutes | 21 | 21.2% |
| 30 to 34 Minutes | 20 | 20.2% |
| 35 to 39 Minutes | 0 | 0.0% |
| 40 to 44 Minutes | 17 | 17.2% |
| 45 to 59 Minutes | 17 | 17.2% |
| 60 to 89 Minutes | 0 | 0.0% |
| 90 or more Minutes | 0 | 0.0% |
Commute Time by Sex in New Trenton
The most common commute times in New Trenton are 40 to 44 minutes (17 commuters, 41.5%) for males and 25 to 29 minutes (21 commuters, 36.2%) for females.
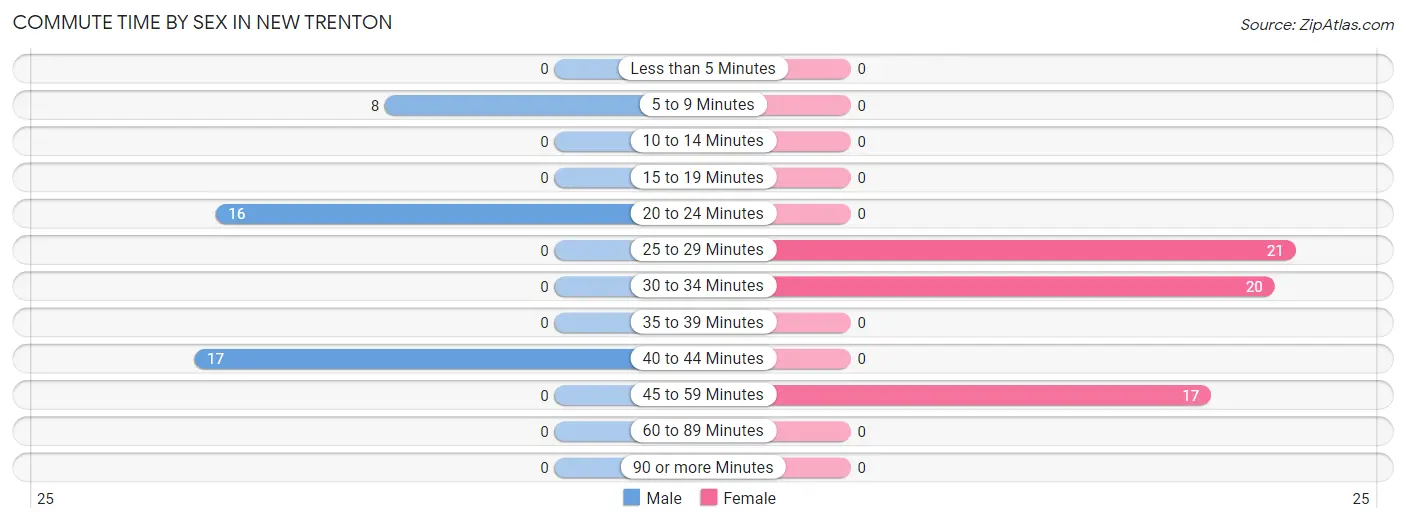
| Commute Time | Male | Female |
| Less than 5 Minutes | 0 (0.0%) | 0 (0.0%) |
| 5 to 9 Minutes | 8 (19.5%) | 0 (0.0%) |
| 10 to 14 Minutes | 0 (0.0%) | 0 (0.0%) |
| 15 to 19 Minutes | 0 (0.0%) | 0 (0.0%) |
| 20 to 24 Minutes | 16 (39.0%) | 0 (0.0%) |
| 25 to 29 Minutes | 0 (0.0%) | 21 (36.2%) |
| 30 to 34 Minutes | 0 (0.0%) | 20 (34.5%) |
| 35 to 39 Minutes | 0 (0.0%) | 0 (0.0%) |
| 40 to 44 Minutes | 17 (41.5%) | 0 (0.0%) |
| 45 to 59 Minutes | 0 (0.0%) | 17 (29.3%) |
| 60 to 89 Minutes | 0 (0.0%) | 0 (0.0%) |
| 90 or more Minutes | 0 (0.0%) | 0 (0.0%) |
Time of Departure to Work by Sex in New Trenton
The most frequent times of departure to work in New Trenton are 6:00 AM to 6:29 AM (17, 41.5%) for males and 5:30 AM to 5:59 AM (38, 65.5%) for females.
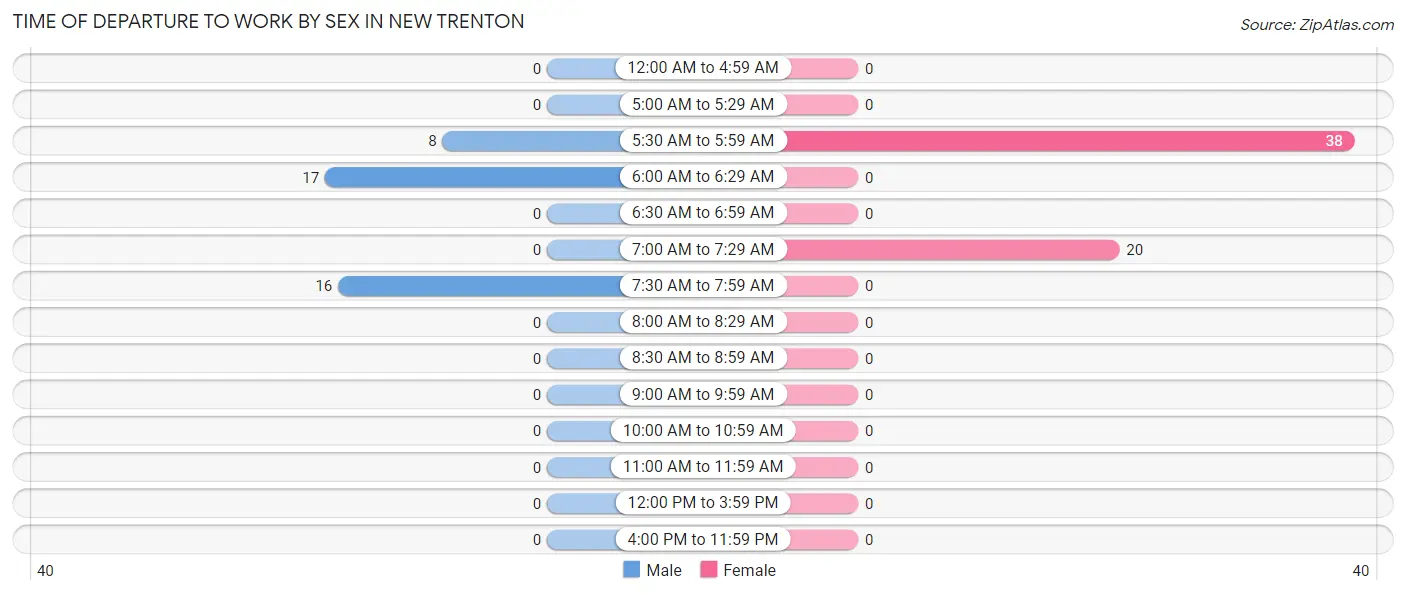
| Time of Departure | Male | Female |
| 12:00 AM to 4:59 AM | 0 (0.0%) | 0 (0.0%) |
| 5:00 AM to 5:29 AM | 0 (0.0%) | 0 (0.0%) |
| 5:30 AM to 5:59 AM | 8 (19.5%) | 38 (65.5%) |
| 6:00 AM to 6:29 AM | 17 (41.5%) | 0 (0.0%) |
| 6:30 AM to 6:59 AM | 0 (0.0%) | 0 (0.0%) |
| 7:00 AM to 7:29 AM | 0 (0.0%) | 20 (34.5%) |
| 7:30 AM to 7:59 AM | 16 (39.0%) | 0 (0.0%) |
| 8:00 AM to 8:29 AM | 0 (0.0%) | 0 (0.0%) |
| 8:30 AM to 8:59 AM | 0 (0.0%) | 0 (0.0%) |
| 9:00 AM to 9:59 AM | 0 (0.0%) | 0 (0.0%) |
| 10:00 AM to 10:59 AM | 0 (0.0%) | 0 (0.0%) |
| 11:00 AM to 11:59 AM | 0 (0.0%) | 0 (0.0%) |
| 12:00 PM to 3:59 PM | 0 (0.0%) | 0 (0.0%) |
| 4:00 PM to 11:59 PM | 0 (0.0%) | 0 (0.0%) |
| Total | 41 (100.0%) | 58 (100.0%) |
Housing Occupancy in New Trenton
Occupancy by Ownership in New Trenton
Of the total 147 dwellings in New Trenton, owner-occupied units account for 147 (100.0%), while renter-occupied units make up 0 (0.0%).
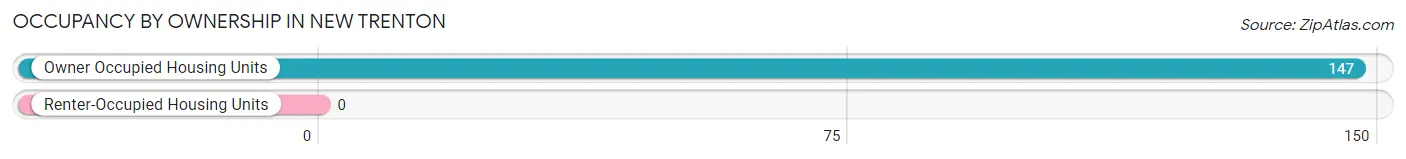
| Occupancy | # Housing Units | % Housing Units |
| Owner Occupied Housing Units | 147 | 100.0% |
| Renter-Occupied Housing Units | 0 | 0.0% |
| Total Occupied Housing Units | 147 | 100.0% |
Occupancy by Household Size in New Trenton
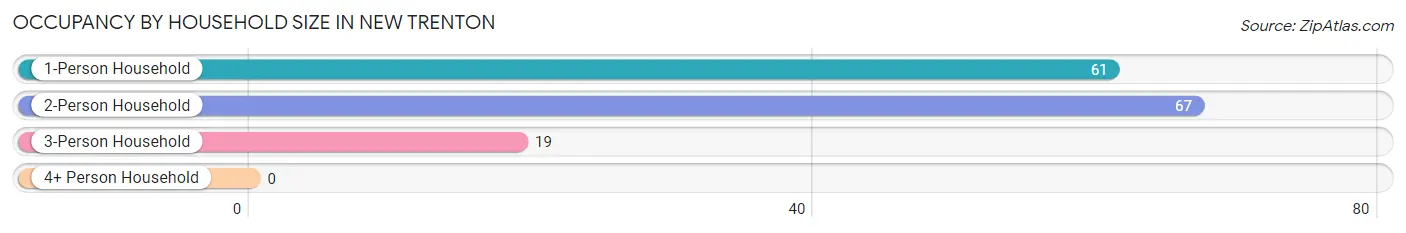
| Household Size | # Housing Units | % Housing Units |
| 1-Person Household | 61 | 41.5% |
| 2-Person Household | 67 | 45.6% |
| 3-Person Household | 19 | 12.9% |
| 4+ Person Household | 0 | 0.0% |
| Total Housing Units | 147 | 100.0% |
Occupancy by Ownership by Household Size in New Trenton
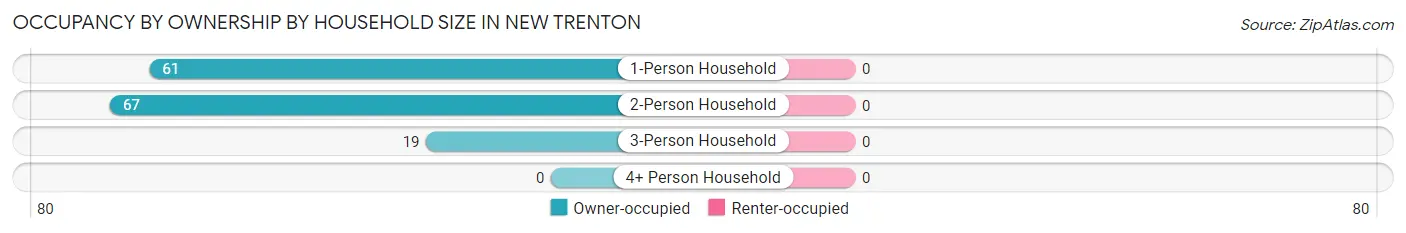
| Household Size | Owner-occupied | Renter-occupied |
| 1-Person Household | 61 (100.0%) | 0 (0.0%) |
| 2-Person Household | 67 (100.0%) | 0 (0.0%) |
| 3-Person Household | 19 (100.0%) | 0 (0.0%) |
| 4+ Person Household | 0 (0.0%) | 0 (0.0%) |
| Total Housing Units | 147 (100.0%) | 0 (0.0%) |
Occupancy by Educational Attainment in New Trenton
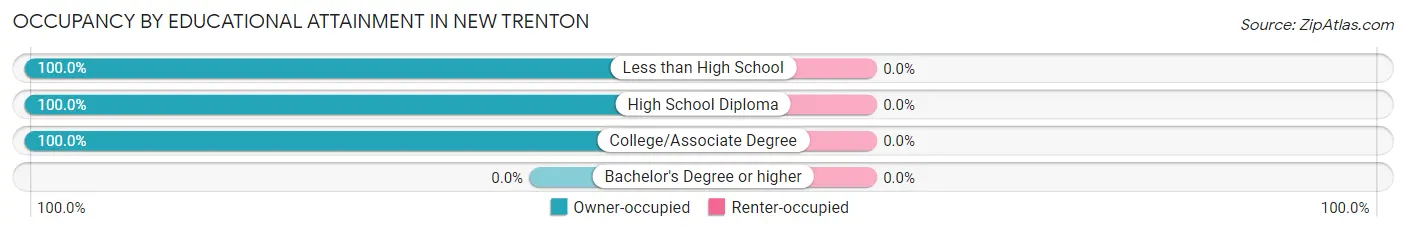
| Household Size | Owner-occupied | Renter-occupied |
| Less than High School | 37 (100.0%) | 0 (0.0%) |
| High School Diploma | 45 (100.0%) | 0 (0.0%) |
| College/Associate Degree | 65 (100.0%) | 0 (0.0%) |
| Bachelor's Degree or higher | 0 (0.0%) | 0 (0.0%) |
Occupancy by Age of Householder in New Trenton
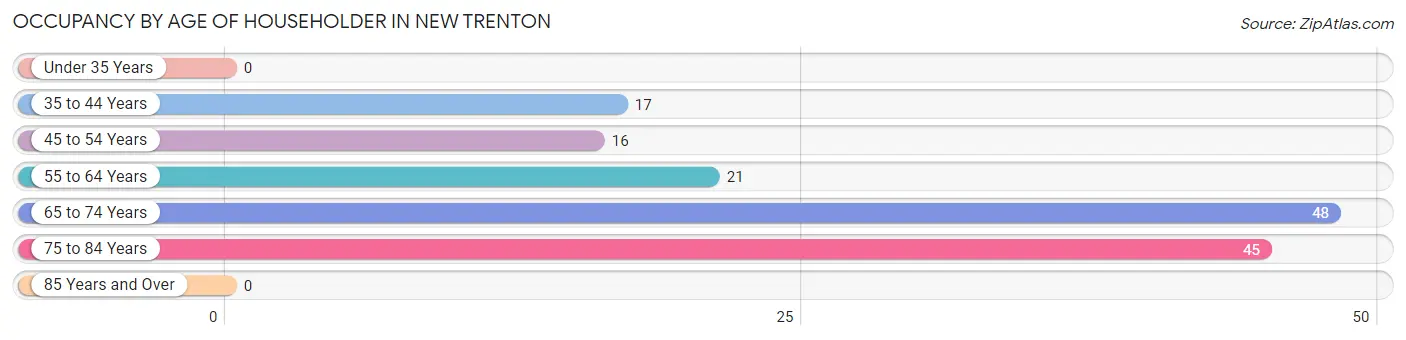
| Age Bracket | # Households | % Households |
| Under 35 Years | 0 | 0.0% |
| 35 to 44 Years | 17 | 11.6% |
| 45 to 54 Years | 16 | 10.9% |
| 55 to 64 Years | 21 | 14.3% |
| 65 to 74 Years | 48 | 32.7% |
| 75 to 84 Years | 45 | 30.6% |
| 85 Years and Over | 0 | 0.0% |
| Total | 147 | 100.0% |
Housing Finances in New Trenton
Median Income by Occupancy in New Trenton
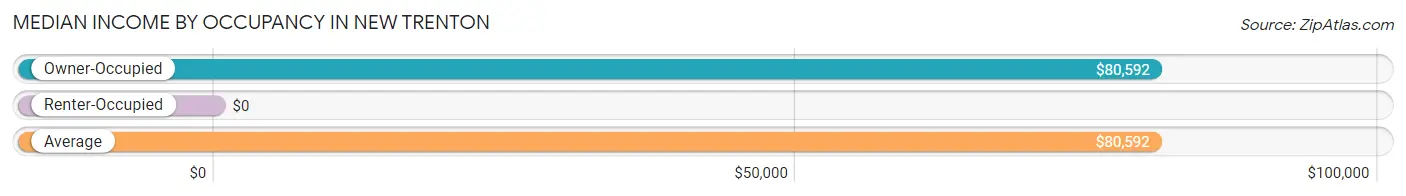
| Occupancy Type | # Households | Median Income |
| Owner-Occupied | 147 (100.0%) | $80,592 |
| Renter-Occupied | 0 (0.0%) | $0 |
| Average | 147 (100.0%) | $80,592 |
Occupancy by Householder Income Bracket in New Trenton
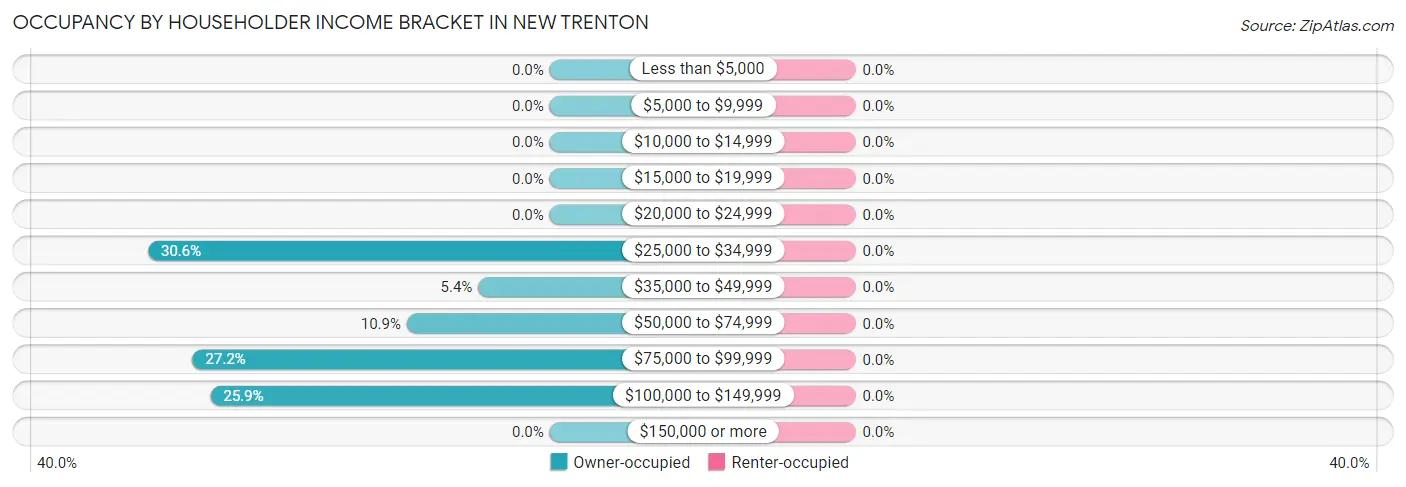
| Income Bracket | Owner-occupied | Renter-occupied |
| Less than $5,000 | 0 (0.0%) | 0 (0.0%) |
| $5,000 to $9,999 | 0 (0.0%) | 0 (0.0%) |
| $10,000 to $14,999 | 0 (0.0%) | 0 (0.0%) |
| $15,000 to $19,999 | 0 (0.0%) | 0 (0.0%) |
| $20,000 to $24,999 | 0 (0.0%) | 0 (0.0%) |
| $25,000 to $34,999 | 45 (30.6%) | 0 (0.0%) |
| $35,000 to $49,999 | 8 (5.4%) | 0 (0.0%) |
| $50,000 to $74,999 | 16 (10.9%) | 0 (0.0%) |
| $75,000 to $99,999 | 40 (27.2%) | 0 (0.0%) |
| $100,000 to $149,999 | 38 (25.9%) | 0 (0.0%) |
| $150,000 or more | 0 (0.0%) | 0 (0.0%) |
| Total | 147 (100.0%) | 0 (0.0%) |
Monthly Housing Cost Tiers in New Trenton
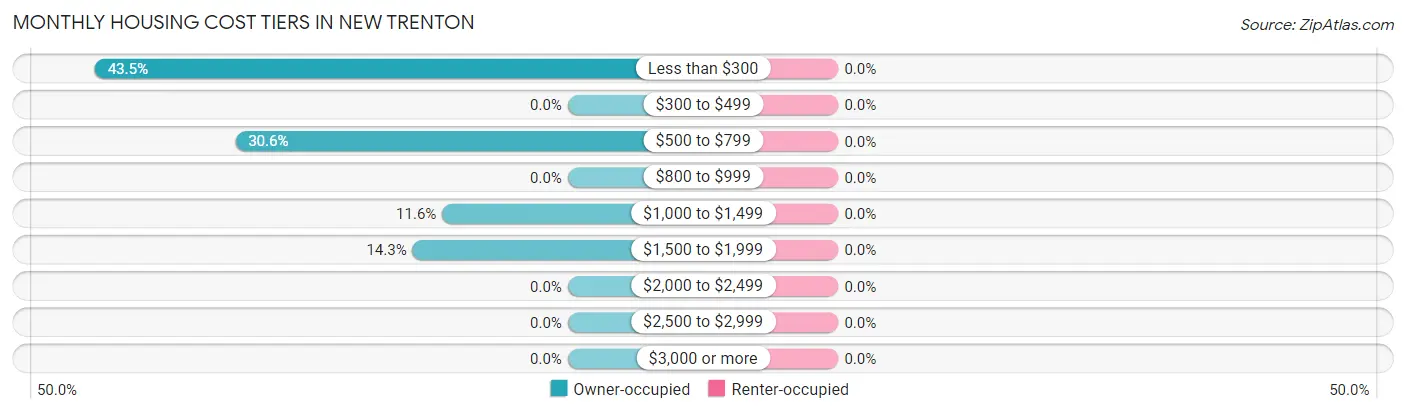
| Monthly Cost | Owner-occupied | Renter-occupied |
| Less than $300 | 64 (43.5%) | 0 (0.0%) |
| $300 to $499 | 0 (0.0%) | 0 (0.0%) |
| $500 to $799 | 45 (30.6%) | 0 (0.0%) |
| $800 to $999 | 0 (0.0%) | 0 (0.0%) |
| $1,000 to $1,499 | 17 (11.6%) | 0 (0.0%) |
| $1,500 to $1,999 | 21 (14.3%) | 0 (0.0%) |
| $2,000 to $2,499 | 0 (0.0%) | 0 (0.0%) |
| $2,500 to $2,999 | 0 (0.0%) | 0 (0.0%) |
| $3,000 or more | 0 (0.0%) | 0 (0.0%) |
| Total | 147 (100.0%) | 0 (0.0%) |
Physical Housing Characteristics in New Trenton
Housing Structures in New Trenton
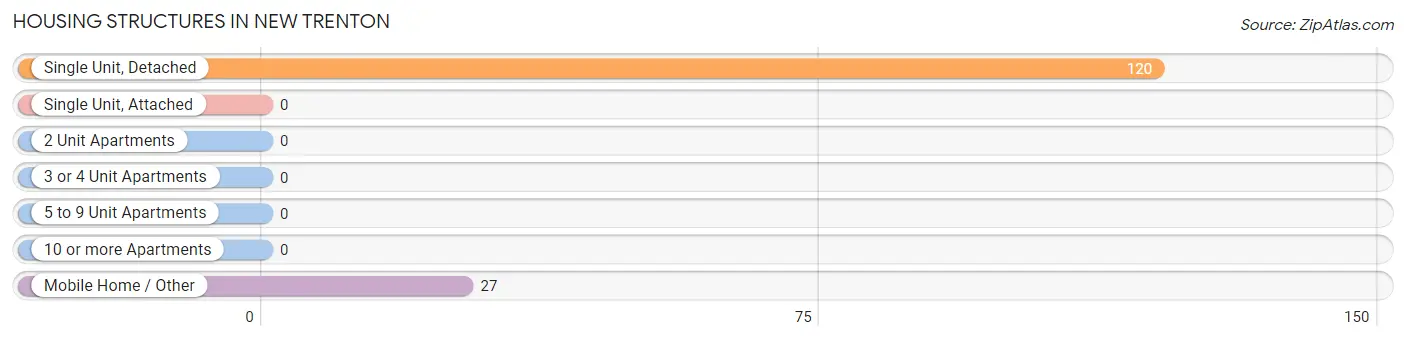
| Structure Type | # Housing Units | % Housing Units |
| Single Unit, Detached | 120 | 81.6% |
| Single Unit, Attached | 0 | 0.0% |
| 2 Unit Apartments | 0 | 0.0% |
| 3 or 4 Unit Apartments | 0 | 0.0% |
| 5 to 9 Unit Apartments | 0 | 0.0% |
| 10 or more Apartments | 0 | 0.0% |
| Mobile Home / Other | 27 | 18.4% |
| Total | 147 | 100.0% |
Housing Structures by Occupancy in New Trenton
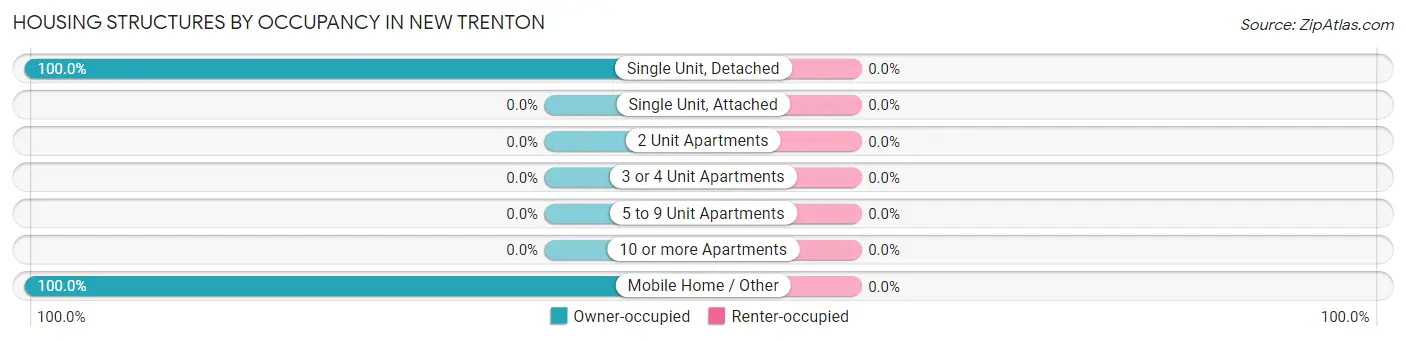
| Structure Type | Owner-occupied | Renter-occupied |
| Single Unit, Detached | 120 (100.0%) | 0 (0.0%) |
| Single Unit, Attached | 0 (0.0%) | 0 (0.0%) |
| 2 Unit Apartments | 0 (0.0%) | 0 (0.0%) |
| 3 or 4 Unit Apartments | 0 (0.0%) | 0 (0.0%) |
| 5 to 9 Unit Apartments | 0 (0.0%) | 0 (0.0%) |
| 10 or more Apartments | 0 (0.0%) | 0 (0.0%) |
| Mobile Home / Other | 27 (100.0%) | 0 (0.0%) |
| Total | 147 (100.0%) | 0 (0.0%) |
Housing Structures by Number of Rooms in New Trenton
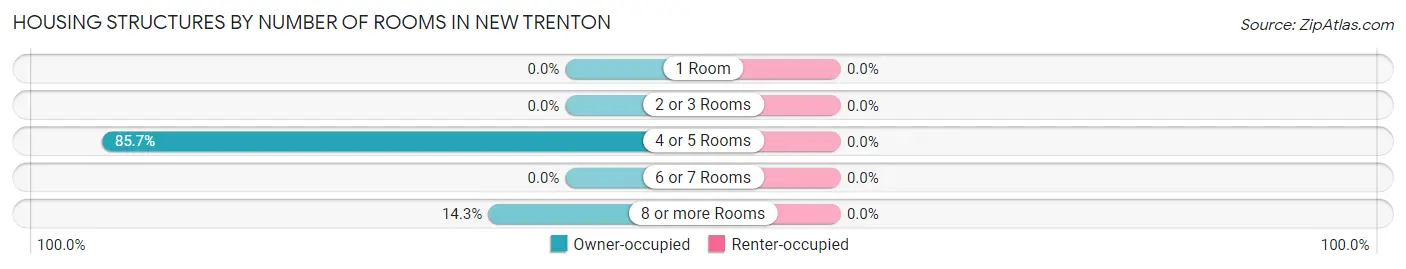
| Number of Rooms | Owner-occupied | Renter-occupied |
| 1 Room | 0 (0.0%) | 0 (0.0%) |
| 2 or 3 Rooms | 0 (0.0%) | 0 (0.0%) |
| 4 or 5 Rooms | 126 (85.7%) | 0 (0.0%) |
| 6 or 7 Rooms | 0 (0.0%) | 0 (0.0%) |
| 8 or more Rooms | 21 (14.3%) | 0 (0.0%) |
| Total | 147 (100.0%) | 0 (0.0%) |
Housing Structure by Heating Type in New Trenton
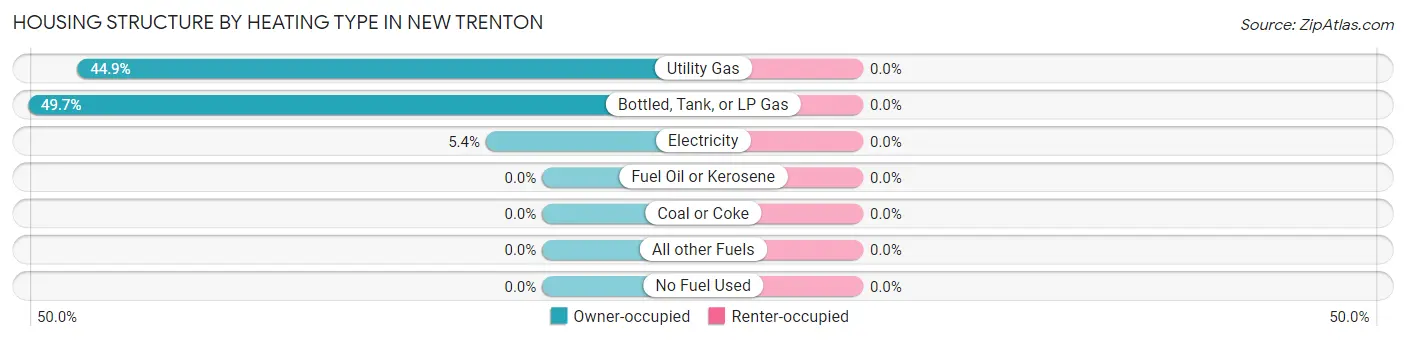
| Heating Type | Owner-occupied | Renter-occupied |
| Utility Gas | 66 (44.9%) | 0 (0.0%) |
| Bottled, Tank, or LP Gas | 73 (49.7%) | 0 (0.0%) |
| Electricity | 8 (5.4%) | 0 (0.0%) |
| Fuel Oil or Kerosene | 0 (0.0%) | 0 (0.0%) |
| Coal or Coke | 0 (0.0%) | 0 (0.0%) |
| All other Fuels | 0 (0.0%) | 0 (0.0%) |
| No Fuel Used | 0 (0.0%) | 0 (0.0%) |
| Total | 147 (100.0%) | 0 (0.0%) |
Household Vehicle Usage in New Trenton
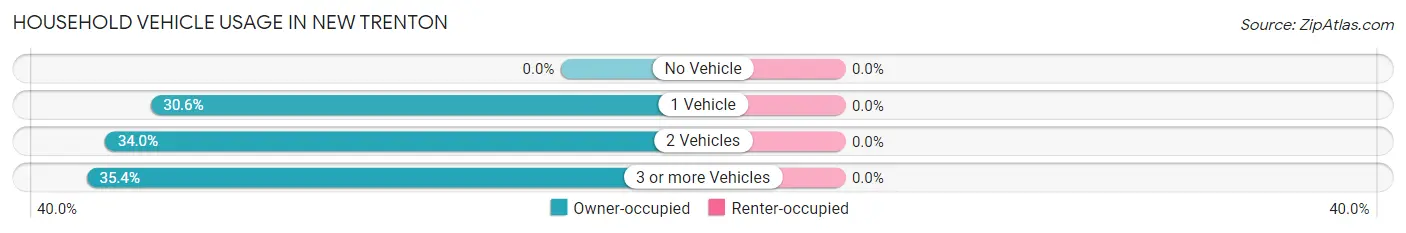
| Vehicles per Household | Owner-occupied | Renter-occupied |
| No Vehicle | 0 (0.0%) | 0 (0.0%) |
| 1 Vehicle | 45 (30.6%) | 0 (0.0%) |
| 2 Vehicles | 50 (34.0%) | 0 (0.0%) |
| 3 or more Vehicles | 52 (35.4%) | 0 (0.0%) |
| Total | 147 (100.0%) | 0 (0.0%) |
Real Estate & Mortgages in New Trenton
Real Estate and Mortgage Overview in New Trenton
| Characteristic | Without Mortgage | With Mortgage |
| Housing Units | 109 | 38 |
| Median Property Value | $92,600 | $0 |
| Median Household Income | - | - |
| Monthly Housing Costs | - | - |
| Real Estate Taxes | $693 | $0 |
Property Value by Mortgage Status in New Trenton
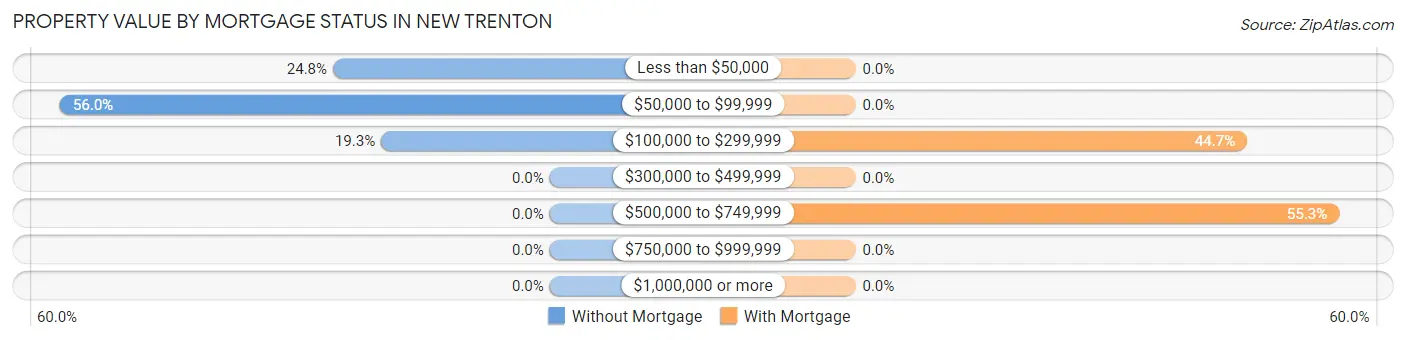
| Property Value | Without Mortgage | With Mortgage |
| Less than $50,000 | 27 (24.8%) | 0 (0.0%) |
| $50,000 to $99,999 | 61 (56.0%) | 0 (0.0%) |
| $100,000 to $299,999 | 21 (19.3%) | 17 (44.7%) |
| $300,000 to $499,999 | 0 (0.0%) | 0 (0.0%) |
| $500,000 to $749,999 | 0 (0.0%) | 21 (55.3%) |
| $750,000 to $999,999 | 0 (0.0%) | 0 (0.0%) |
| $1,000,000 or more | 0 (0.0%) | 0 (0.0%) |
| Total | 109 (100.0%) | 38 (100.0%) |
Household Income by Mortgage Status in New Trenton
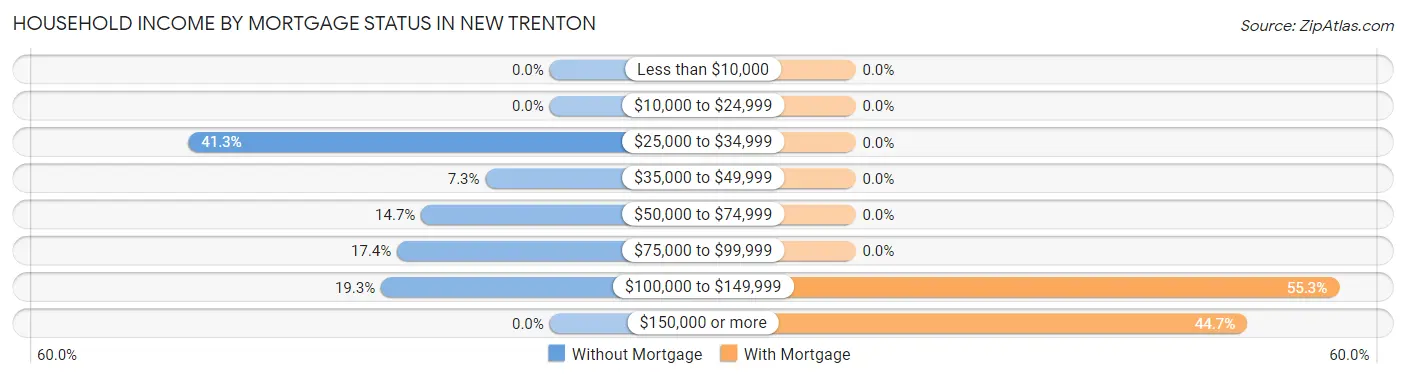
| Household Income | Without Mortgage | With Mortgage |
| Less than $10,000 | 0 (0.0%) | 0 (0.0%) |
| $10,000 to $24,999 | 0 (0.0%) | 0 (0.0%) |
| $25,000 to $34,999 | 45 (41.3%) | 0 (0.0%) |
| $35,000 to $49,999 | 8 (7.3%) | 0 (0.0%) |
| $50,000 to $74,999 | 16 (14.7%) | 0 (0.0%) |
| $75,000 to $99,999 | 19 (17.4%) | 0 (0.0%) |
| $100,000 to $149,999 | 21 (19.3%) | 21 (55.3%) |
| $150,000 or more | 0 (0.0%) | 17 (44.7%) |
| Total | 109 (100.0%) | 38 (100.0%) |
Property Value to Household Income Ratio in New Trenton
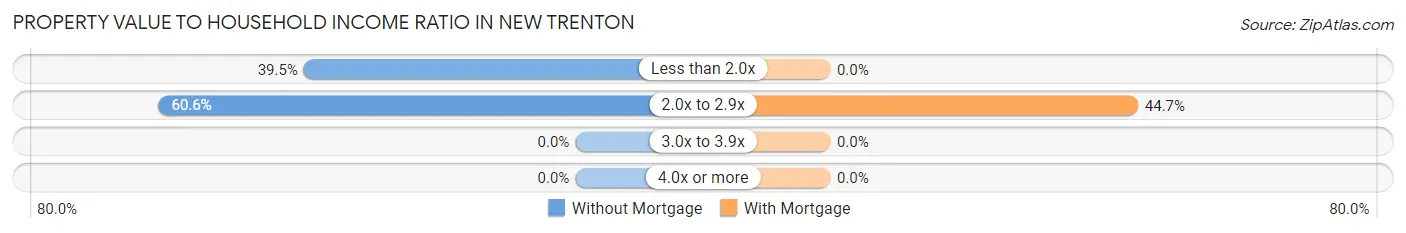
| Value-to-Income Ratio | Without Mortgage | With Mortgage |
| Less than 2.0x | 43 (39.5%) | 0 (0.0%) |
| 2.0x to 2.9x | 66 (60.6%) | 17 (44.7%) |
| 3.0x to 3.9x | 0 (0.0%) | 0 (0.0%) |
| 4.0x or more | 0 (0.0%) | 0 (0.0%) |
| Total | 109 (100.0%) | 38 (100.0%) |
Real Estate Taxes by Mortgage Status in New Trenton
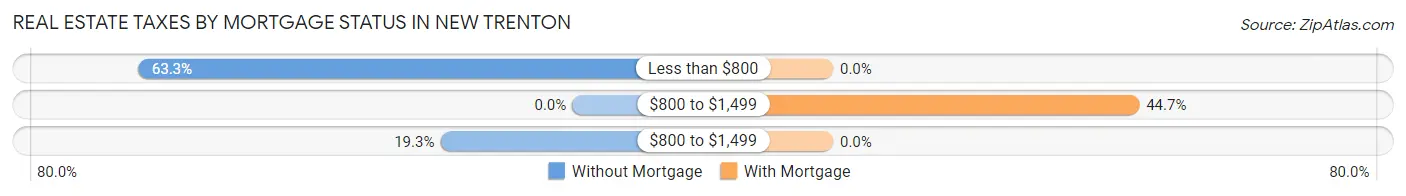
| Property Taxes | Without Mortgage | With Mortgage |
| Less than $800 | 69 (63.3%) | 0 (0.0%) |
| $800 to $1,499 | 0 (0.0%) | 17 (44.7%) |
| $800 to $1,499 | 21 (19.3%) | 0 (0.0%) |
| Total | 109 (100.0%) | 38 (100.0%) |
Health & Disability in New Trenton
Health Insurance Coverage by Age in New Trenton
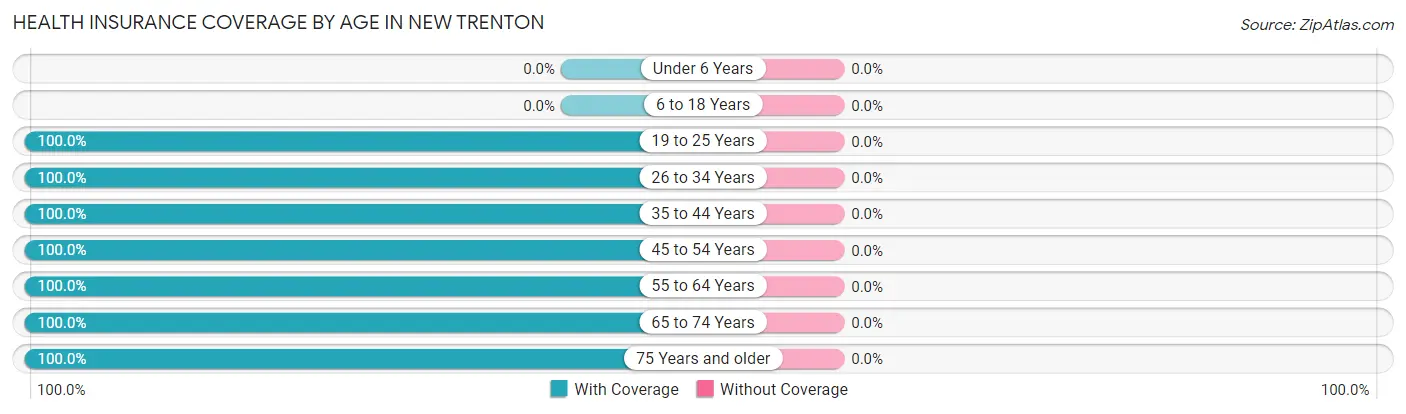
| Age Bracket | With Coverage | Without Coverage |
| Under 6 Years | 0 (0.0%) | 0 (0.0%) |
| 6 to 18 Years | 0 (0.0%) | 0 (0.0%) |
| 19 to 25 Years | 17 (100.0%) | 0 (0.0%) |
| 26 to 34 Years | 18 (100.0%) | 0 (0.0%) |
| 35 to 44 Years | 17 (100.0%) | 0 (0.0%) |
| 45 to 54 Years | 59 (100.0%) | 0 (0.0%) |
| 55 to 64 Years | 21 (100.0%) | 0 (0.0%) |
| 65 to 74 Years | 81 (100.0%) | 0 (0.0%) |
| 75 Years and older | 45 (100.0%) | 0 (0.0%) |
| Total | 258 (100.0%) | 0 (0.0%) |
Health Insurance Coverage by Citizenship Status in New Trenton
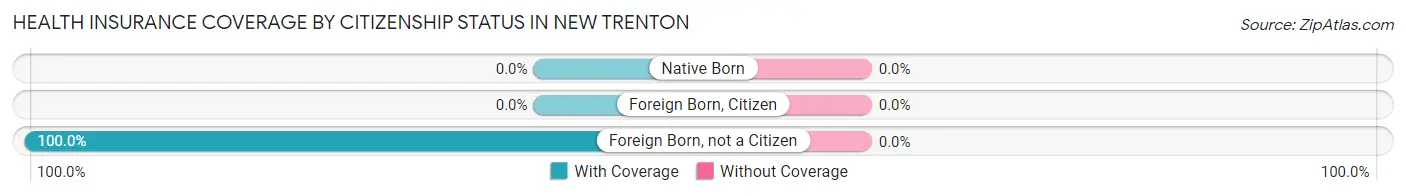
| Citizenship Status | With Coverage | Without Coverage |
| Native Born | 0 (0.0%) | 0 (0.0%) |
| Foreign Born, Citizen | 0 (0.0%) | 0 (0.0%) |
| Foreign Born, not a Citizen | 17 (100.0%) | 0 (0.0%) |
Health Insurance Coverage by Household Income in New Trenton
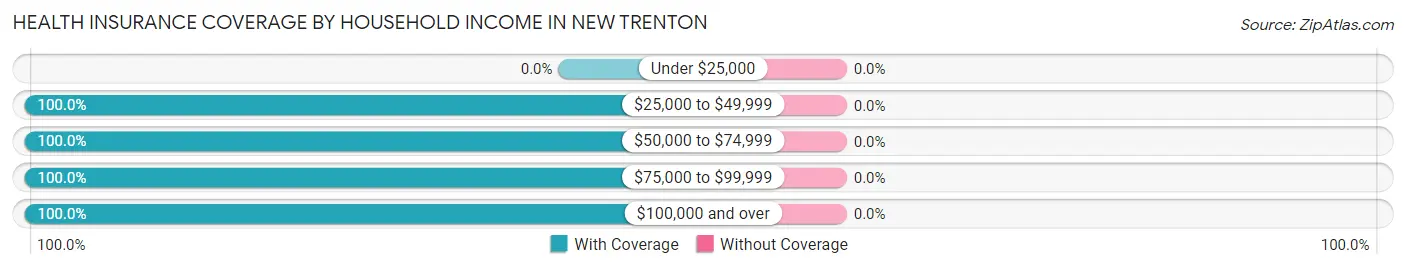
| Household Income | With Coverage | Without Coverage |
| Under $25,000 | 0 (0.0%) | 0 (0.0%) |
| $25,000 to $49,999 | 64 (100.0%) | 0 (0.0%) |
| $50,000 to $74,999 | 16 (100.0%) | 0 (0.0%) |
| $75,000 to $99,999 | 99 (100.0%) | 0 (0.0%) |
| $100,000 and over | 79 (100.0%) | 0 (0.0%) |
Public vs Private Health Insurance Coverage by Age in New Trenton
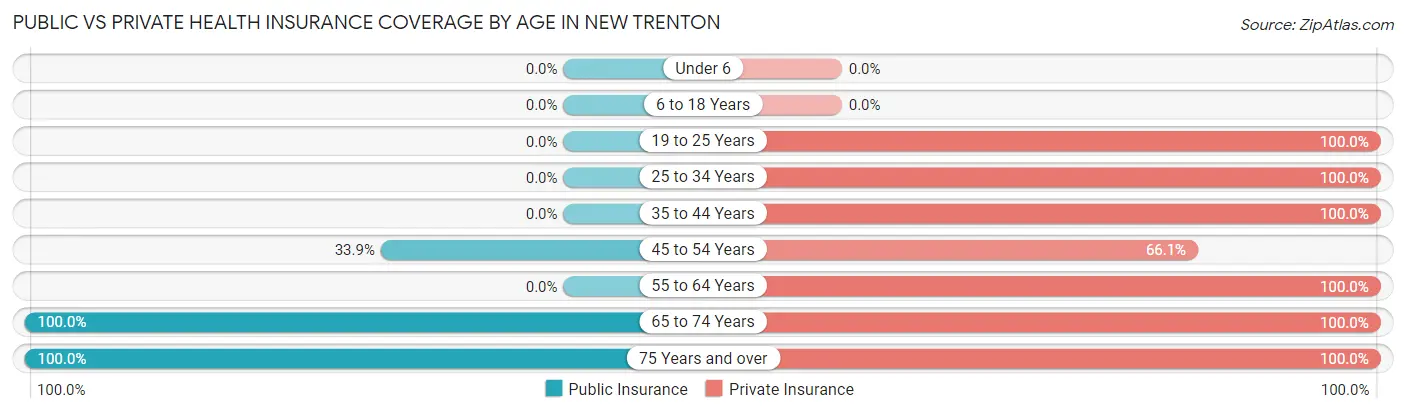
| Age Bracket | Public Insurance | Private Insurance |
| Under 6 | 0 (0.0%) | 0 (0.0%) |
| 6 to 18 Years | 0 (0.0%) | 0 (0.0%) |
| 19 to 25 Years | 0 (0.0%) | 17 (100.0%) |
| 25 to 34 Years | 0 (0.0%) | 18 (100.0%) |
| 35 to 44 Years | 0 (0.0%) | 17 (100.0%) |
| 45 to 54 Years | 20 (33.9%) | 39 (66.1%) |
| 55 to 64 Years | 0 (0.0%) | 21 (100.0%) |
| 65 to 74 Years | 81 (100.0%) | 81 (100.0%) |
| 75 Years and over | 45 (100.0%) | 45 (100.0%) |
| Total | 146 (56.6%) | 238 (92.2%) |
Disability Status by Sex by Age in New Trenton
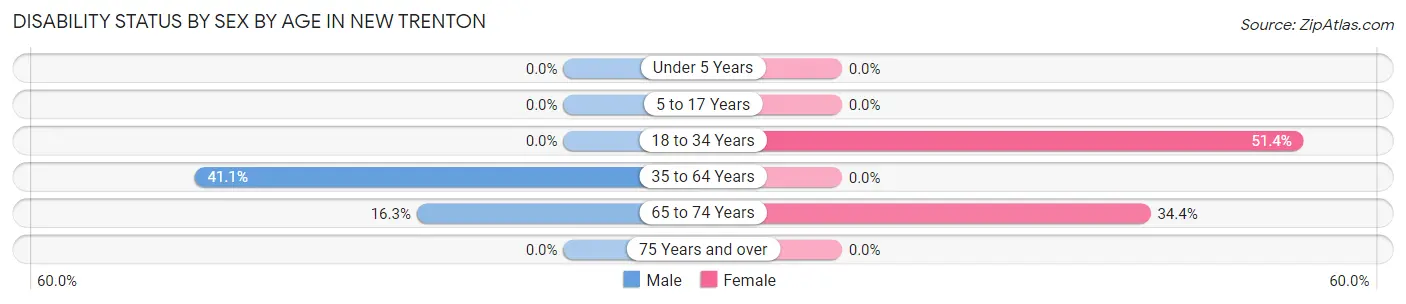
| Age Bracket | Male | Female |
| Under 5 Years | 0 (0.0%) | 0 (0.0%) |
| 5 to 17 Years | 0 (0.0%) | 0 (0.0%) |
| 18 to 34 Years | 0 (0.0%) | 18 (51.4%) |
| 35 to 64 Years | 23 (41.1%) | 0 (0.0%) |
| 65 to 74 Years | 8 (16.3%) | 11 (34.4%) |
| 75 Years and over | 0 (0.0%) | 0 (0.0%) |
Disability Class by Sex by Age in New Trenton
Disability Class: Hearing Difficulty
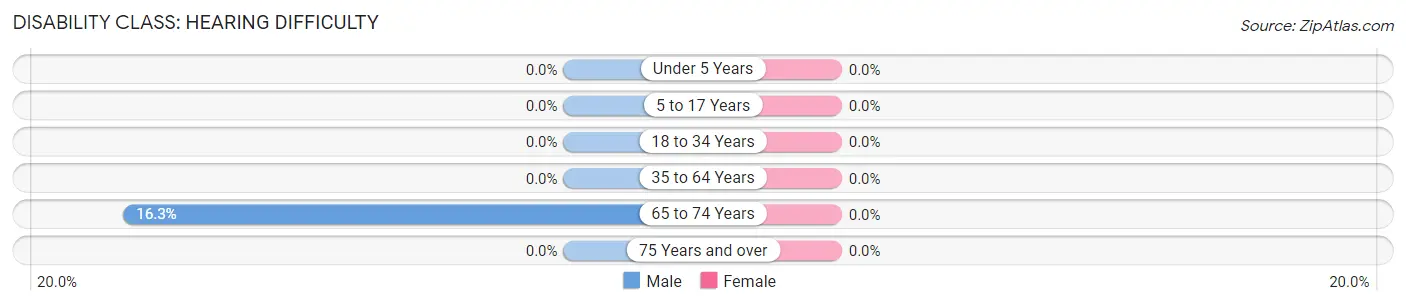
| Age Bracket | Male | Female |
| Under 5 Years | 0 (0.0%) | 0 (0.0%) |
| 5 to 17 Years | 0 (0.0%) | 0 (0.0%) |
| 18 to 34 Years | 0 (0.0%) | 0 (0.0%) |
| 35 to 64 Years | 0 (0.0%) | 0 (0.0%) |
| 65 to 74 Years | 8 (16.3%) | 0 (0.0%) |
| 75 Years and over | 0 (0.0%) | 0 (0.0%) |
Disability Class: Vision Difficulty
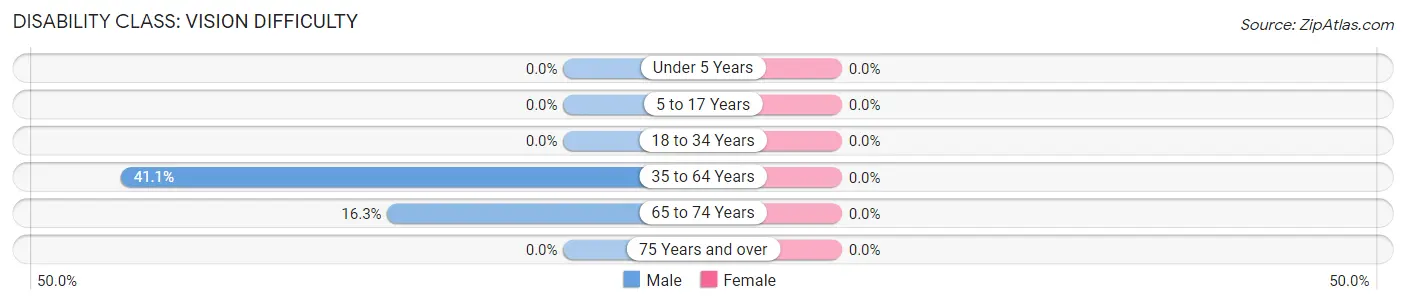
| Age Bracket | Male | Female |
| Under 5 Years | 0 (0.0%) | 0 (0.0%) |
| 5 to 17 Years | 0 (0.0%) | 0 (0.0%) |
| 18 to 34 Years | 0 (0.0%) | 0 (0.0%) |
| 35 to 64 Years | 23 (41.1%) | 0 (0.0%) |
| 65 to 74 Years | 8 (16.3%) | 0 (0.0%) |
| 75 Years and over | 0 (0.0%) | 0 (0.0%) |
Disability Class: Cognitive Difficulty
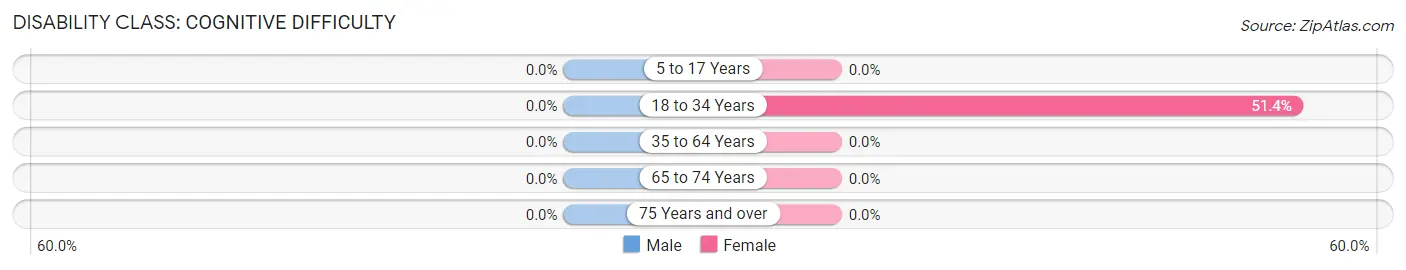
| Age Bracket | Male | Female |
| 5 to 17 Years | 0 (0.0%) | 0 (0.0%) |
| 18 to 34 Years | 0 (0.0%) | 18 (51.4%) |
| 35 to 64 Years | 0 (0.0%) | 0 (0.0%) |
| 65 to 74 Years | 0 (0.0%) | 0 (0.0%) |
| 75 Years and over | 0 (0.0%) | 0 (0.0%) |
Disability Class: Ambulatory Difficulty
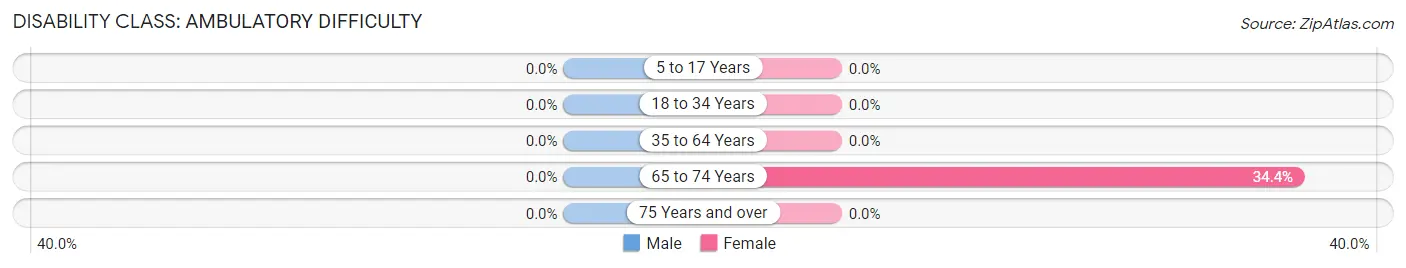
| Age Bracket | Male | Female |
| 5 to 17 Years | 0 (0.0%) | 0 (0.0%) |
| 18 to 34 Years | 0 (0.0%) | 0 (0.0%) |
| 35 to 64 Years | 0 (0.0%) | 0 (0.0%) |
| 65 to 74 Years | 0 (0.0%) | 11 (34.4%) |
| 75 Years and over | 0 (0.0%) | 0 (0.0%) |
Disability Class: Self-Care Difficulty
| Age Bracket | Male | Female |
| 5 to 17 Years | 0 (0.0%) | 0 (0.0%) |
| 18 to 34 Years | 0 (0.0%) | 0 (0.0%) |
| 35 to 64 Years | 0 (0.0%) | 0 (0.0%) |
| 65 to 74 Years | 0 (0.0%) | 0 (0.0%) |
| 75 Years and over | 0 (0.0%) | 0 (0.0%) |
Technology Access in New Trenton
Computing Device Access in New Trenton
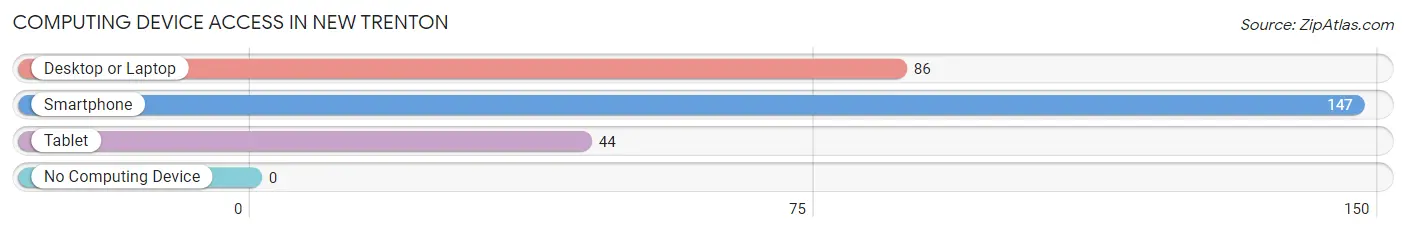
| Device Type | # Households | % Households |
| Desktop or Laptop | 86 | 58.5% |
| Smartphone | 147 | 100.0% |
| Tablet | 44 | 29.9% |
| No Computing Device | 0 | 0.0% |
| Total | 147 | 100.0% |
Internet Access in New Trenton
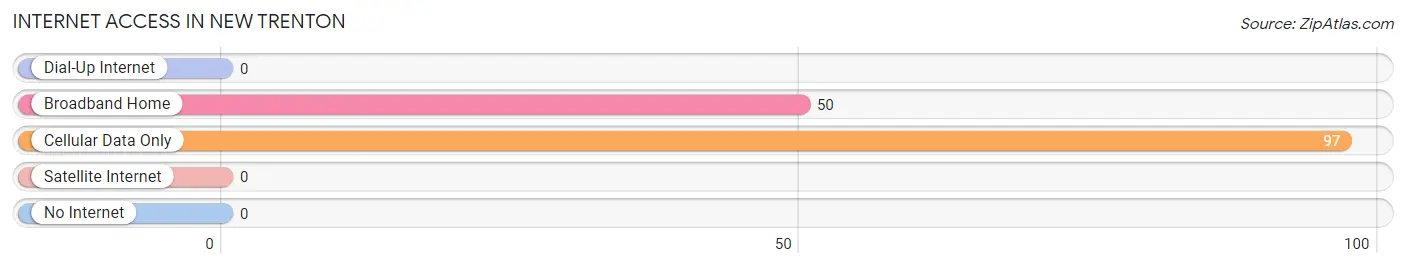
| Internet Type | # Households | % Households |
| Dial-Up Internet | 0 | 0.0% |
| Broadband Home | 50 | 34.0% |
| Cellular Data Only | 97 | 66.0% |
| Satellite Internet | 0 | 0.0% |
| No Internet | 0 | 0.0% |
| Total | 147 | 100.0% |
New Trenton Summary
New Trenton is a small town located in Franklin County, Indiana, United States. The town is situated on the banks of the Whitewater River, and is part of the Cincinnati metropolitan area. The population of New Trenton was 1,845 at the 2010 census.
History
New Trenton was founded in 1837 by a group of settlers from Trenton, New Jersey. The town was originally known as "Trenton," but the name was changed to "New Trenton" in 1845 to avoid confusion with the original Trenton. The town was incorporated in 1867.
The town was an important stop on the Whitewater Canal, which was built in the early 1800s to connect the Ohio River to the Great Lakes. The canal was a major transportation route for goods and people, and New Trenton was a popular stop for travelers.
The town was also an important stop on the Underground Railroad, which was used by escaped slaves to travel to freedom in the northern states. The town was home to several prominent abolitionists, including the Reverend John Rankin, who was a leader in the movement.
Geography
New Trenton is located at 39°25'25" North, 84°59'45" West (39.423, -84.996). The town is situated on the banks of the Whitewater River, and is part of the Cincinnati metropolitan area.
The town has a total area of 0.9 square miles, all of which is land. The town is located in a hilly region, and is surrounded by farmland.
Economy
The economy of New Trenton is largely based on agriculture. The town is home to several farms, which produce a variety of crops, including corn, soybeans, and wheat. The town is also home to several small businesses, including a grocery store, a hardware store, and a restaurant.
Demographics
As of the 2010 census, there were 1,845 people, 745 households, and 486 families residing in the town. The population density was 2,039.7 people per square mile. The racial makeup of the town was 97.2% White, 0.7% African American, 0.2% Native American, 0.2% Asian, 0.1% Pacific Islander, 0.7% from other races, and 0.9% from two or more races. Hispanic or Latino of any race were 1.3% of the population.
There were 745 households, out of which 28.3% had children under the age of 18 living with them, 46.2% were married couples living together, 13.2% had a female householder with no husband present, and 36.2% were non-families. 32.2% of all households were made up of individuals, and 15.2% had someone living alone who was 65 years of age or older. The average household size was 2.45 and the average family size was 3.09.
In the town, the population was spread out, with 25.2% under the age of 18, 8.2% from 18 to 24, 27.2% from 25 to 44, 22.7% from 45 to 64, and 16.7% who were 65 years of age or older. The median age was 37 years. For every 100 females, there were 91.2 males. For every 100 females age 18 and over, there were 87.2 males.
The median income for a household in the town was $35,000, and the median income for a family was $41,250. Males had a median income of $31,250 versus $21,250 for females. The per capita income for the town was $17,845. About 8.2% of families and 10.2% of the population were below the poverty line, including 14.2% of those under age 18 and 8.2% of those age 65 or over.
Common Questions
What is Per Capita Income in New Trenton?
Per Capita income in New Trenton is $42,352.
What is the Median Family Income in New Trenton?
Median Family Income in New Trenton is $89,405.
What is the Median Household income in New Trenton?
Median Household Income in New Trenton is $80,592.
What is Income or Wage Gap in New Trenton?
Income or Wage Gap in New Trenton is 35.0%.
Women in New Trenton earn 65.0 cents for every dollar earned by a man.
What is Inequality or Gini Index in New Trenton?
Inequality or Gini Index in New Trenton is 0.28.
What is the Total Population of New Trenton?
Total Population of New Trenton is 258.
What is the Total Male Population of New Trenton?
Total Male Population of New Trenton is 105.
What is the Total Female Population of New Trenton?
Total Female Population of New Trenton is 153.
What is the Ratio of Males per 100 Females in New Trenton?
There are 68.63 Males per 100 Females in New Trenton.
What is the Ratio of Females per 100 Males in New Trenton?
There are 145.71 Females per 100 Males in New Trenton.
What is the Median Population Age in New Trenton?
Median Population Age in New Trenton is 62.9 Years.
What is the Average Family Size in New Trenton
Average Family Size in New Trenton is 2.1 People.
What is the Average Household Size in New Trenton
Average Household Size in New Trenton is 1.8 People.
How Large is the Labor Force in New Trenton?
There are 161 People in the Labor Forcein in New Trenton.
What is the Percentage of People in the Labor Force in New Trenton?
62.4% of People are in the Labor Force in New Trenton.