Williamsburg, NM Map & Demographics
Williamsburg Map
Williamsburg Overview
$20,259
PER CAPITA INCOME
$52,989
AVG FAMILY INCOME
$36,354
AVG HOUSEHOLD INCOME
46.4%
WAGE / INCOME GAP [ % ]
53.6¢/ $1
WAGE / INCOME GAP [ $ ]
0.33
INEQUALITY / GINI INDEX
800
TOTAL POPULATION
319
MALE POPULATION
481
FEMALE POPULATION
66.32
MALES / 100 FEMALES
150.78
FEMALES / 100 MALES
50.5
MEDIAN AGE
4.8
AVG FAMILY SIZE
2.8
AVG HOUSEHOLD SIZE
388
LABOR FORCE [ PEOPLE ]
51.9%
PERCENT IN LABOR FORCE
8.0%
UNEMPLOYMENT RATE
Williamsburg Zip Codes
Williamsburg Area Codes
Income in Williamsburg
Income Overview in Williamsburg
Per Capita Income in Williamsburg is $20,259, while median incomes of families and households are $52,989 and $36,354 respectively.
| Characteristic | Number | Measure |
| Per Capita Income | 800 | $20,259 |
| Median Family Income | 111 | $52,989 |
| Mean Family Income | 111 | $51,300 |
| Median Household Income | 287 | $36,354 |
| Mean Household Income | 287 | $45,521 |
| Income Deficit | 111 | $0 |
| Wage / Income Gap (%) | 800 | 46.40% |
| Wage / Income Gap ($) | 800 | 53.60¢ per $1 |
| Gini / Inequality Index | 800 | 0.33 |
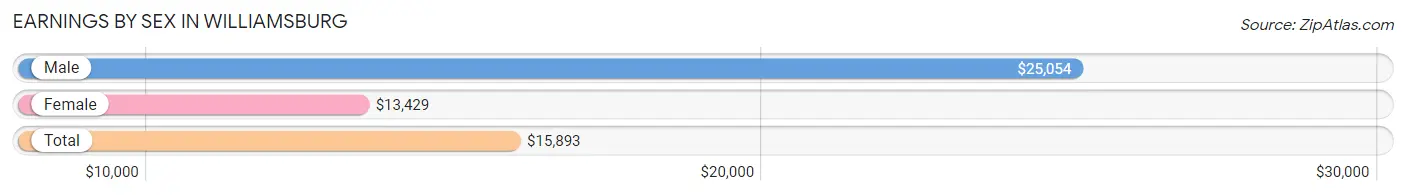
Earnings by Sex in Williamsburg
Average Earnings in Williamsburg are $15,893, $25,054 for men and $13,429 for women, a difference of 46.4%.
| Sex | Number | Average Earnings |
| Male | 149 (41.7%) | $25,054 |
| Female | 208 (58.3%) | $13,429 |
| Total | 357 (100.0%) | $15,893 |
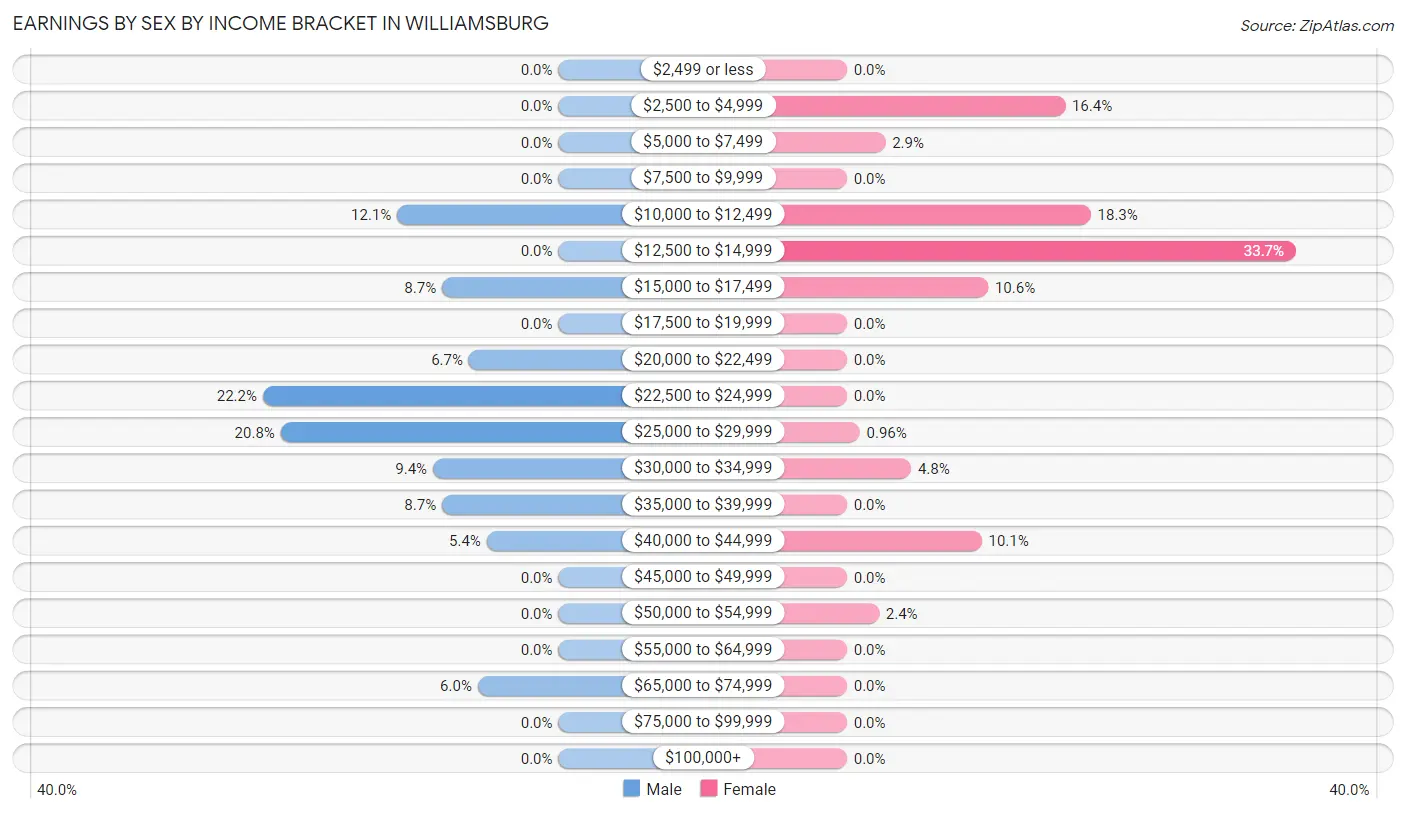
Earnings by Sex by Income Bracket in Williamsburg
The most common earnings brackets in Williamsburg are $22,500 to $24,999 for men (33 | 22.2%) and $12,500 to $14,999 for women (70 | 33.7%).
| Income | Male | Female |
| $2,499 or less | 0 (0.0%) | 0 (0.0%) |
| $2,500 to $4,999 | 0 (0.0%) | 34 (16.4%) |
| $5,000 to $7,499 | 0 (0.0%) | 6 (2.9%) |
| $7,500 to $9,999 | 0 (0.0%) | 0 (0.0%) |
| $10,000 to $12,499 | 18 (12.1%) | 38 (18.3%) |
| $12,500 to $14,999 | 0 (0.0%) | 70 (33.7%) |
| $15,000 to $17,499 | 13 (8.7%) | 22 (10.6%) |
| $17,500 to $19,999 | 0 (0.0%) | 0 (0.0%) |
| $20,000 to $22,499 | 10 (6.7%) | 0 (0.0%) |
| $22,500 to $24,999 | 33 (22.2%) | 0 (0.0%) |
| $25,000 to $29,999 | 31 (20.8%) | 2 (1.0%) |
| $30,000 to $34,999 | 14 (9.4%) | 10 (4.8%) |
| $35,000 to $39,999 | 13 (8.7%) | 0 (0.0%) |
| $40,000 to $44,999 | 8 (5.4%) | 21 (10.1%) |
| $45,000 to $49,999 | 0 (0.0%) | 0 (0.0%) |
| $50,000 to $54,999 | 0 (0.0%) | 5 (2.4%) |
| $55,000 to $64,999 | 0 (0.0%) | 0 (0.0%) |
| $65,000 to $74,999 | 9 (6.0%) | 0 (0.0%) |
| $75,000 to $99,999 | 0 (0.0%) | 0 (0.0%) |
| $100,000+ | 0 (0.0%) | 0 (0.0%) |
| Total | 149 (100.0%) | 208 (100.0%) |
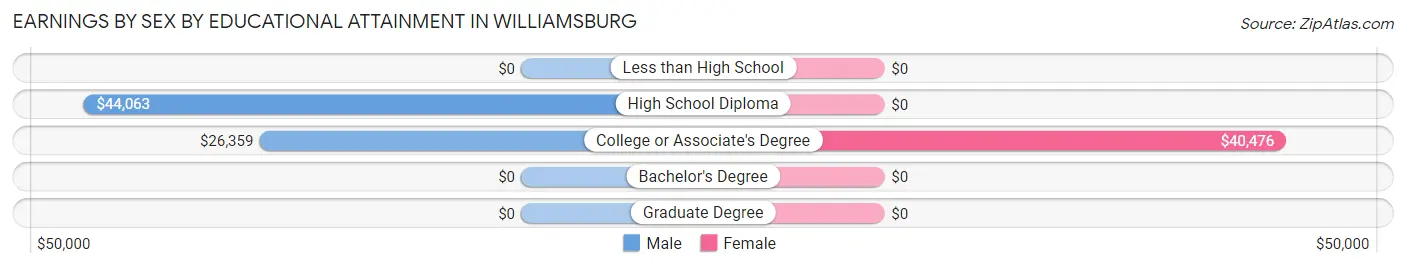
Earnings by Sex by Educational Attainment in Williamsburg
Average earnings in Williamsburg are $27,391 for men and $14,447 for women, a difference of 47.3%. Men with an educational attainment of high school diploma enjoy the highest average annual earnings of $44,063, while those with college or associate's degree education earn the least with $26,359. Women with an educational attainment of college or associate's degree earn the most with the average annual earnings of $40,476, while those with college or associate's degree education have the smallest earnings of $40,476.
| Educational Attainment | Male Income | Female Income |
| Less than High School | - | - |
| High School Diploma | $44,063 | $0 |
| College or Associate's Degree | $26,359 | $40,476 |
| Bachelor's Degree | - | - |
| Graduate Degree | - | - |
| Total | $27,391 | $14,447 |
Family Income in Williamsburg
Family Income Brackets in Williamsburg
According to the Williamsburg family income data, there are 63 families falling into the $50,000 to $74,999 income range, which is the most common income bracket and makes up 56.8% of all families.
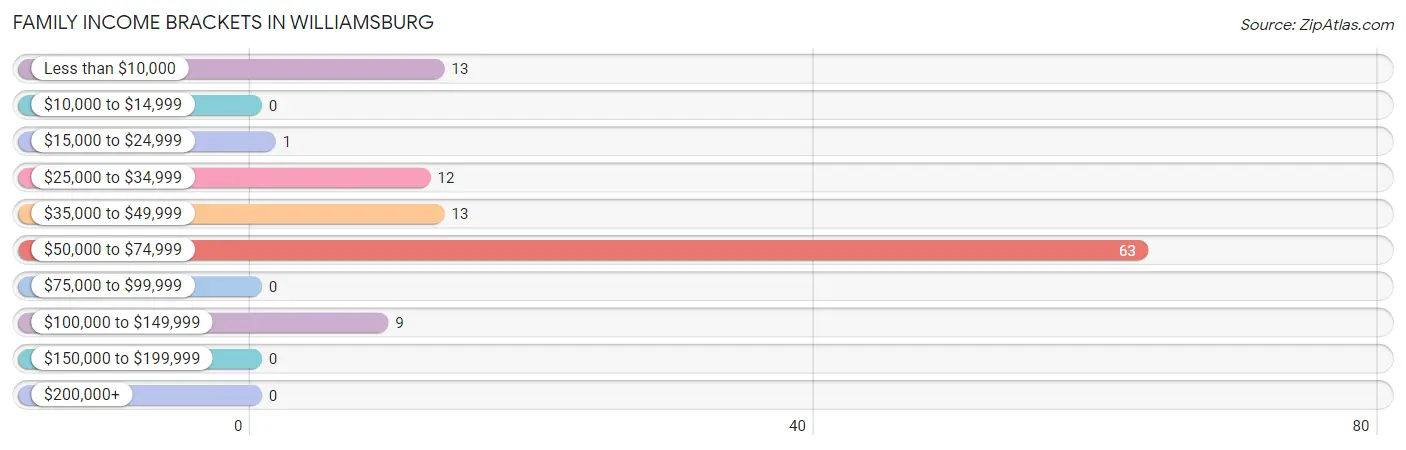
| Income Bracket | # Families | % Families |
| Less than $10,000 | 13 | 11.7% |
| $10,000 to $14,999 | 0 | 0.0% |
| $15,000 to $24,999 | 1 | 0.9% |
| $25,000 to $34,999 | 12 | 10.8% |
| $35,000 to $49,999 | 13 | 11.7% |
| $50,000 to $74,999 | 63 | 56.8% |
| $75,000 to $99,999 | 0 | 0.0% |
| $100,000 to $149,999 | 9 | 8.1% |
| $150,000 to $199,999 | 0 | 0.0% |
| $200,000+ | 0 | 0.0% |
Family Income by Famaliy Size in Williamsburg
3-person families (49 | 44.1%) account for the highest median family income in Williamsburg with $54,402 per family, while 2-person families (48 | 43.2%) have the highest median income of $18,558 per family member.
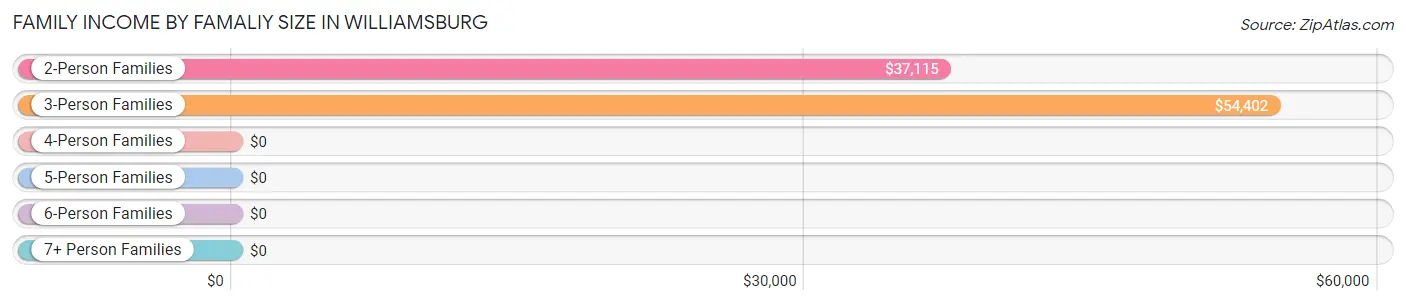
| Income Bracket | # Families | Median Income |
| 2-Person Families | 48 (43.2%) | $37,115 |
| 3-Person Families | 49 (44.1%) | $54,402 |
| 4-Person Families | 6 (5.4%) | $0 |
| 5-Person Families | 0 (0.0%) | $0 |
| 6-Person Families | 8 (7.2%) | $0 |
| 7+ Person Families | 0 (0.0%) | $0 |
| Total | 111 (100.0%) | $52,989 |
Family Income by Number of Earners in Williamsburg
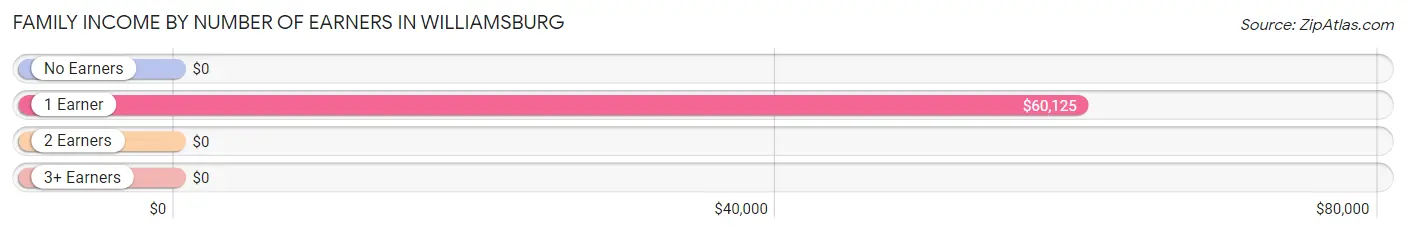
| Number of Earners | # Families | Median Income |
| No Earners | 32 (28.8%) | $0 |
| 1 Earner | 39 (35.1%) | $60,125 |
| 2 Earners | 9 (8.1%) | $0 |
| 3+ Earners | 31 (27.9%) | $0 |
| Total | 111 (100.0%) | $52,989 |
Household Income in Williamsburg
Household Income Brackets in Williamsburg
With 83 households falling in the category, the $50,000 to $74,999 income range is the most frequent in Williamsburg, accounting for 28.9% of all households.
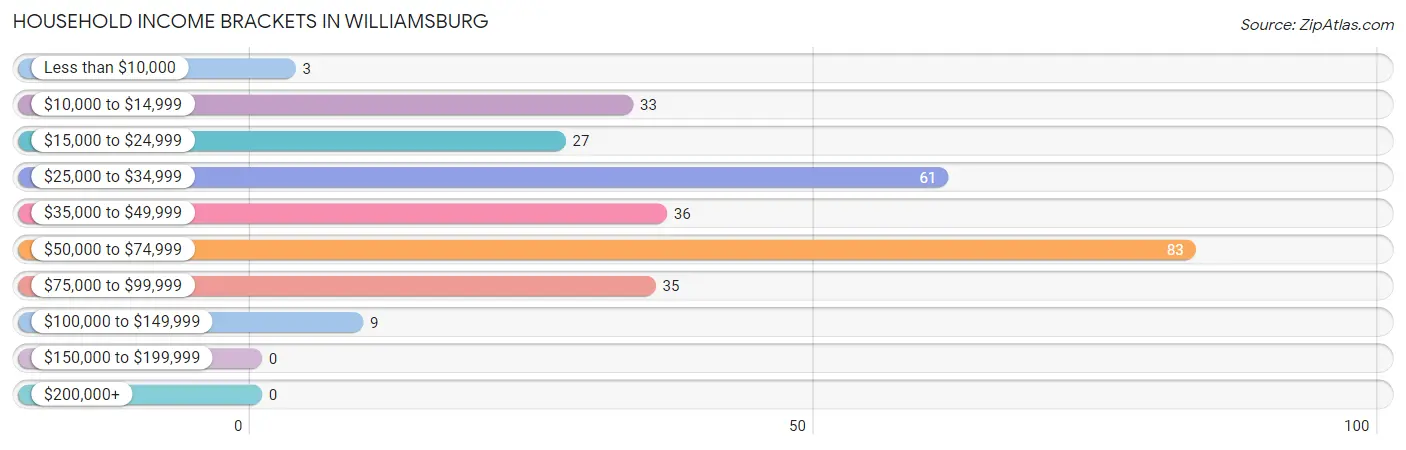
| Income Bracket | # Households | % Households |
| Less than $10,000 | 3 | 1.0% |
| $10,000 to $14,999 | 33 | 11.5% |
| $15,000 to $24,999 | 27 | 9.4% |
| $25,000 to $34,999 | 61 | 21.3% |
| $35,000 to $49,999 | 36 | 12.5% |
| $50,000 to $74,999 | 83 | 28.9% |
| $75,000 to $99,999 | 35 | 12.2% |
| $100,000 to $149,999 | 9 | 3.1% |
| $150,000 to $199,999 | 0 | 0.0% |
| $200,000+ | 0 | 0.0% |
Household Income by Householder Age in Williamsburg
The median household income in Williamsburg is $36,354, with the highest median household income of $53,370 found in the 45 to 64 years age bracket for the primary householder. A total of 74 households (25.8%) fall into this category. Meanwhile, the 15 to 24 years age bracket for the primary householder has the lowest median household income of $0, with 21 households (7.3%) in this group.
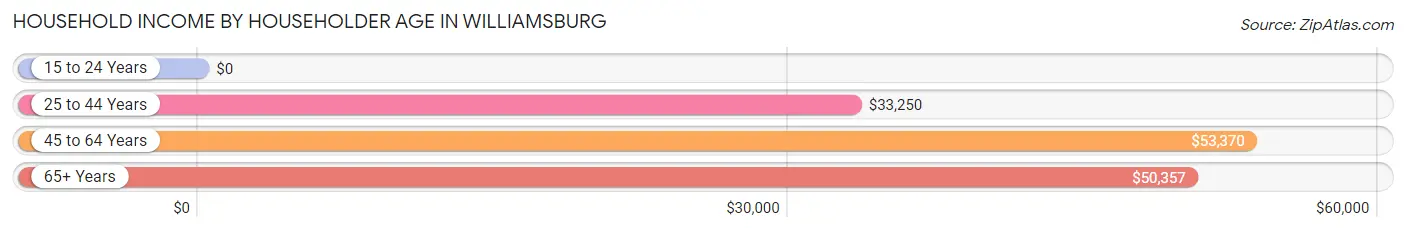
| Income Bracket | # Households | Median Income |
| 15 to 24 Years | 21 (7.3%) | $0 |
| 25 to 44 Years | 34 (11.8%) | $33,250 |
| 45 to 64 Years | 74 (25.8%) | $53,370 |
| 65+ Years | 158 (55.0%) | $50,357 |
| Total | 287 (100.0%) | $36,354 |
Poverty in Williamsburg
Income Below Poverty by Sex and Age in Williamsburg
With 8.8% poverty level for males and 33.9% for females among the residents of Williamsburg, under 5 year old males and 6 to 11 year old females are the most vulnerable to poverty, with 18 males (100.0%) and 19 females (100.0%) in their respective age groups living below the poverty level.
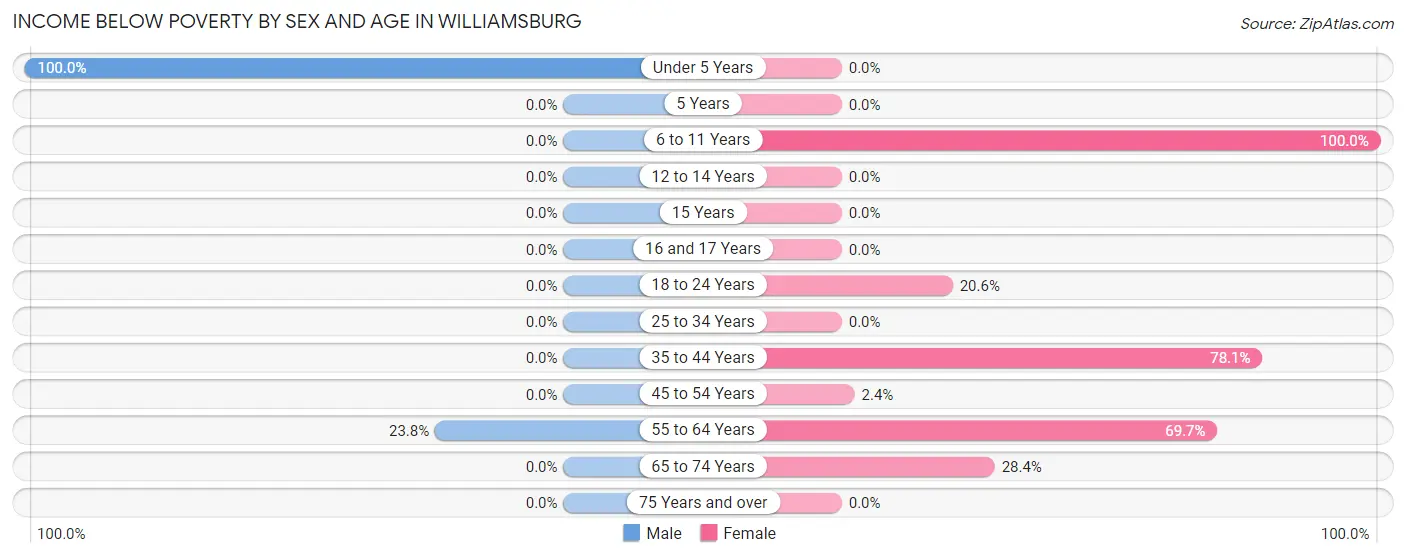
| Age Bracket | Male | Female |
| Under 5 Years | 18 (100.0%) | 0 (0.0%) |
| 5 Years | 0 (0.0%) | 0 (0.0%) |
| 6 to 11 Years | 0 (0.0%) | 19 (100.0%) |
| 12 to 14 Years | 0 (0.0%) | 0 (0.0%) |
| 15 Years | 0 (0.0%) | 0 (0.0%) |
| 16 and 17 Years | 0 (0.0%) | 0 (0.0%) |
| 18 to 24 Years | 0 (0.0%) | 21 (20.6%) |
| 25 to 34 Years | 0 (0.0%) | 0 (0.0%) |
| 35 to 44 Years | 0 (0.0%) | 32 (78.0%) |
| 45 to 54 Years | 0 (0.0%) | 1 (2.4%) |
| 55 to 64 Years | 10 (23.8%) | 69 (69.7%) |
| 65 to 74 Years | 0 (0.0%) | 21 (28.4%) |
| 75 Years and over | 0 (0.0%) | 0 (0.0%) |
| Total | 28 (8.8%) | 163 (33.9%) |
Income Above Poverty by Sex and Age in Williamsburg
According to the poverty statistics in Williamsburg, males aged 15 years and females aged 16 and 17 years are the age groups that are most secure financially, with 100.0% of males and 100.0% of females in these age groups living above the poverty line.
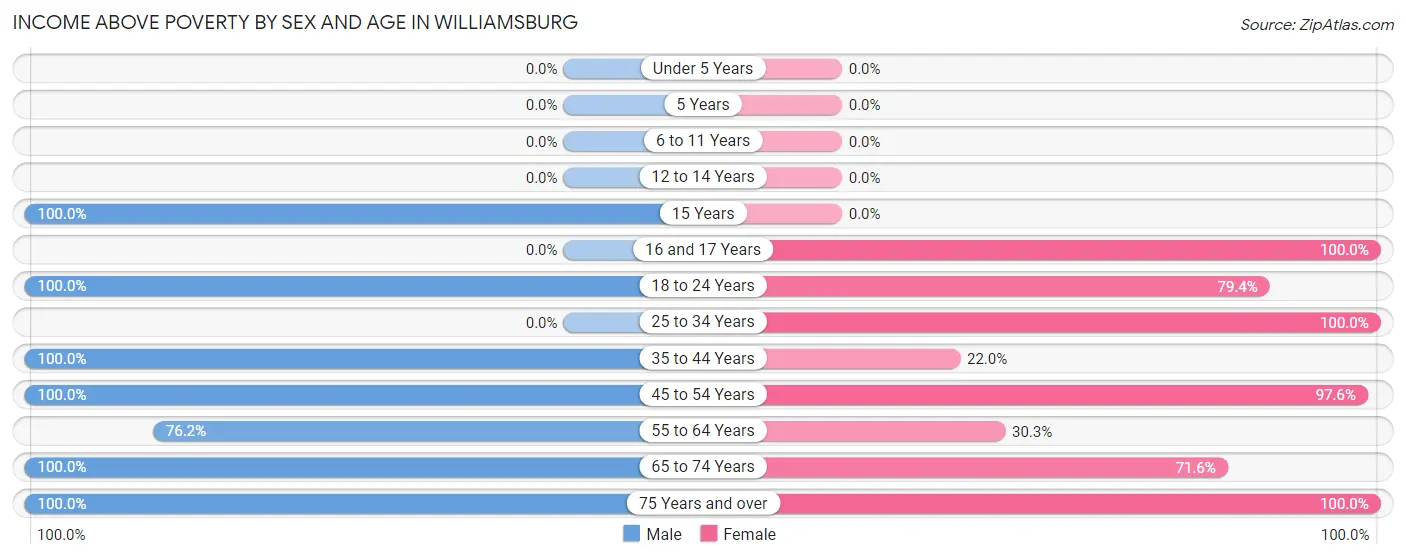
| Age Bracket | Male | Female |
| Under 5 Years | 0 (0.0%) | 0 (0.0%) |
| 5 Years | 0 (0.0%) | 0 (0.0%) |
| 6 to 11 Years | 0 (0.0%) | 0 (0.0%) |
| 12 to 14 Years | 0 (0.0%) | 0 (0.0%) |
| 15 Years | 15 (100.0%) | 0 (0.0%) |
| 16 and 17 Years | 0 (0.0%) | 14 (100.0%) |
| 18 to 24 Years | 74 (100.0%) | 81 (79.4%) |
| 25 to 34 Years | 0 (0.0%) | 62 (100.0%) |
| 35 to 44 Years | 13 (100.0%) | 9 (22.0%) |
| 45 to 54 Years | 57 (100.0%) | 41 (97.6%) |
| 55 to 64 Years | 32 (76.2%) | 30 (30.3%) |
| 65 to 74 Years | 77 (100.0%) | 53 (71.6%) |
| 75 Years and over | 23 (100.0%) | 28 (100.0%) |
| Total | 291 (91.2%) | 318 (66.1%) |
Income Below Poverty Among Married-Couple Families in Williamsburg
The poverty statistics for married-couple families in Williamsburg show that 6.5% or 6 of the total 92 families live below the poverty line. Families with 1 or 2 children have the highest poverty rate of 42.9%, comprising of 6 families. On the other hand, families with no children have the lowest poverty rate of 0.0%, which includes 0 families.
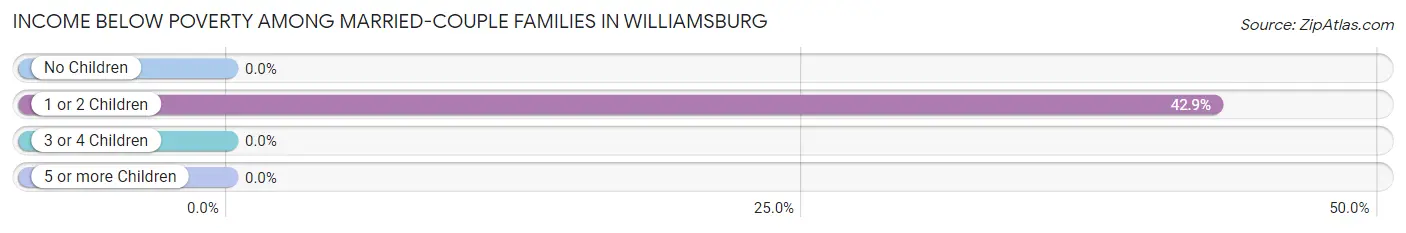
| Children | Above Poverty | Below Poverty |
| No Children | 78 (100.0%) | 0 (0.0%) |
| 1 or 2 Children | 8 (57.1%) | 6 (42.9%) |
| 3 or 4 Children | 0 (0.0%) | 0 (0.0%) |
| 5 or more Children | 0 (0.0%) | 0 (0.0%) |
| Total | 86 (93.5%) | 6 (6.5%) |
Income Below Poverty Among Single-Parent Households in Williamsburg
According to the poverty data in Williamsburg, 100.0% or 3 single-father households and 62.5% or 10 single-mother households are living below the poverty line. Among single-father households, those with 1 or 2 children have the highest poverty rate, with 3 households (100.0%) experiencing poverty. Likewise, among single-mother households, those with 1 or 2 children have the highest poverty rate, with 10 households (100.0%) falling below the poverty line.
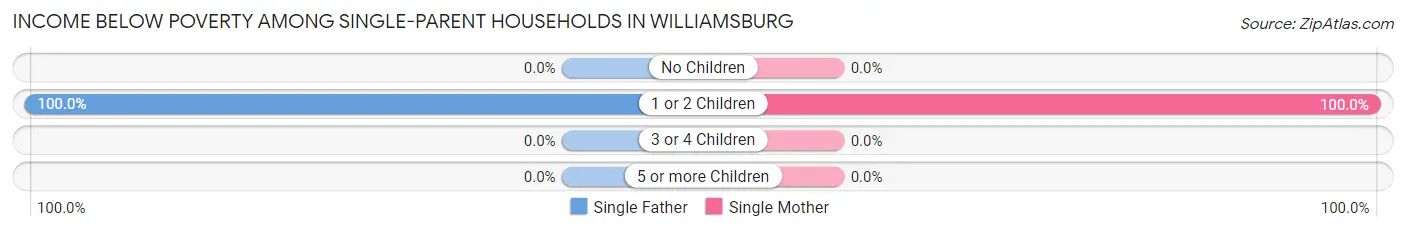
| Children | Single Father | Single Mother |
| No Children | 0 (0.0%) | 0 (0.0%) |
| 1 or 2 Children | 3 (100.0%) | 10 (100.0%) |
| 3 or 4 Children | 0 (0.0%) | 0 (0.0%) |
| 5 or more Children | 0 (0.0%) | 0 (0.0%) |
| Total | 3 (100.0%) | 10 (62.5%) |
Income Below Poverty Among Married-Couple vs Single-Parent Households in Williamsburg
The poverty data for Williamsburg shows that 6 of the married-couple family households (6.5%) and 13 of the single-parent households (68.4%) are living below the poverty level. Within the married-couple family households, those with 1 or 2 children have the highest poverty rate, with 6 households (42.9%) falling below the poverty line. Among the single-parent households, those with 1 or 2 children have the highest poverty rate, with 13 household (100.0%) living below poverty.
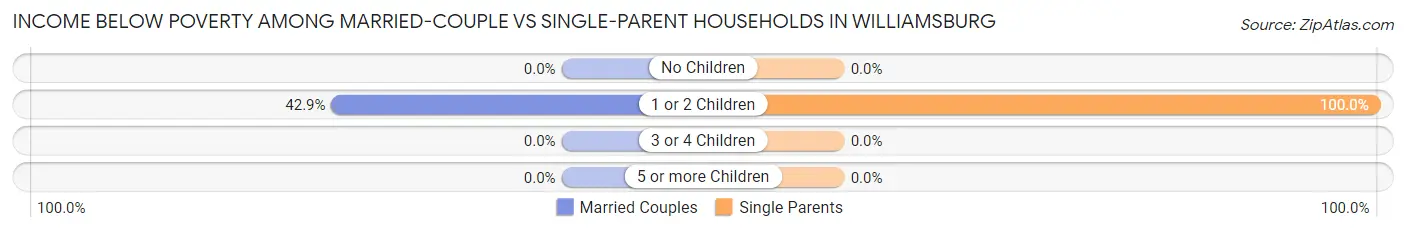
| Children | Married-Couple Families | Single-Parent Households |
| No Children | 0 (0.0%) | 0 (0.0%) |
| 1 or 2 Children | 6 (42.9%) | 13 (100.0%) |
| 3 or 4 Children | 0 (0.0%) | 0 (0.0%) |
| 5 or more Children | 0 (0.0%) | 0 (0.0%) |
| Total | 6 (6.5%) | 13 (68.4%) |
Race in Williamsburg
The most populous races in Williamsburg are White / Caucasian (576 | 72.0%), Hispanic or Latino (474 | 59.3%), and Two or more Races (178 | 22.3%).
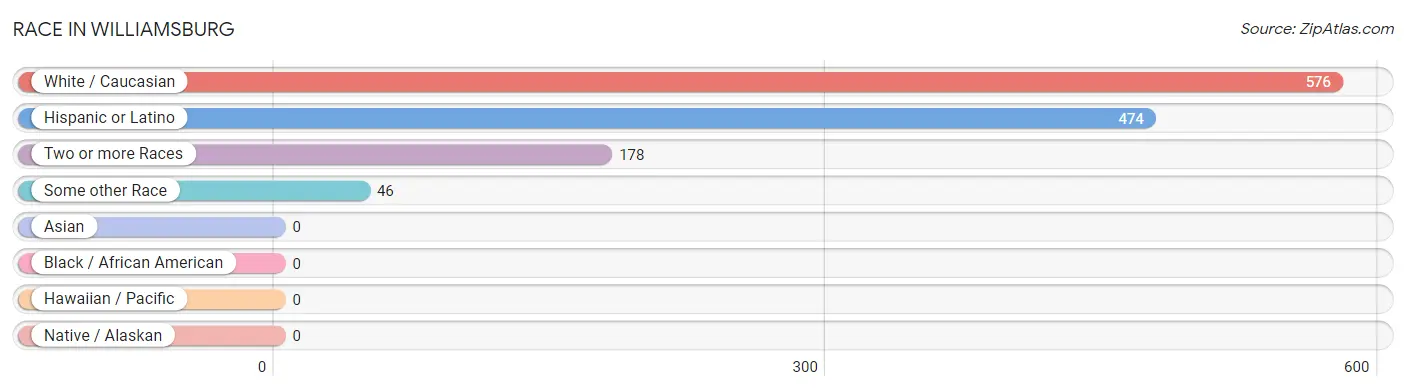
| Race | # Population | % Population |
| Asian | 0 | 0.0% |
| Black / African American | 0 | 0.0% |
| Hawaiian / Pacific | 0 | 0.0% |
| Hispanic or Latino | 474 | 59.3% |
| Native / Alaskan | 0 | 0.0% |
| White / Caucasian | 576 | 72.0% |
| Two or more Races | 178 | 22.3% |
| Some other Race | 46 | 5.8% |
| Total | 800 | 100.0% |
Ancestry in Williamsburg
The most populous ancestries reported in Williamsburg are Mexican (420 | 52.5%), German (112 | 14.0%), English (107 | 13.4%), Spaniard (38 | 4.8%), and American (25 | 3.1%), together accounting for 87.8% of all Williamsburg residents.
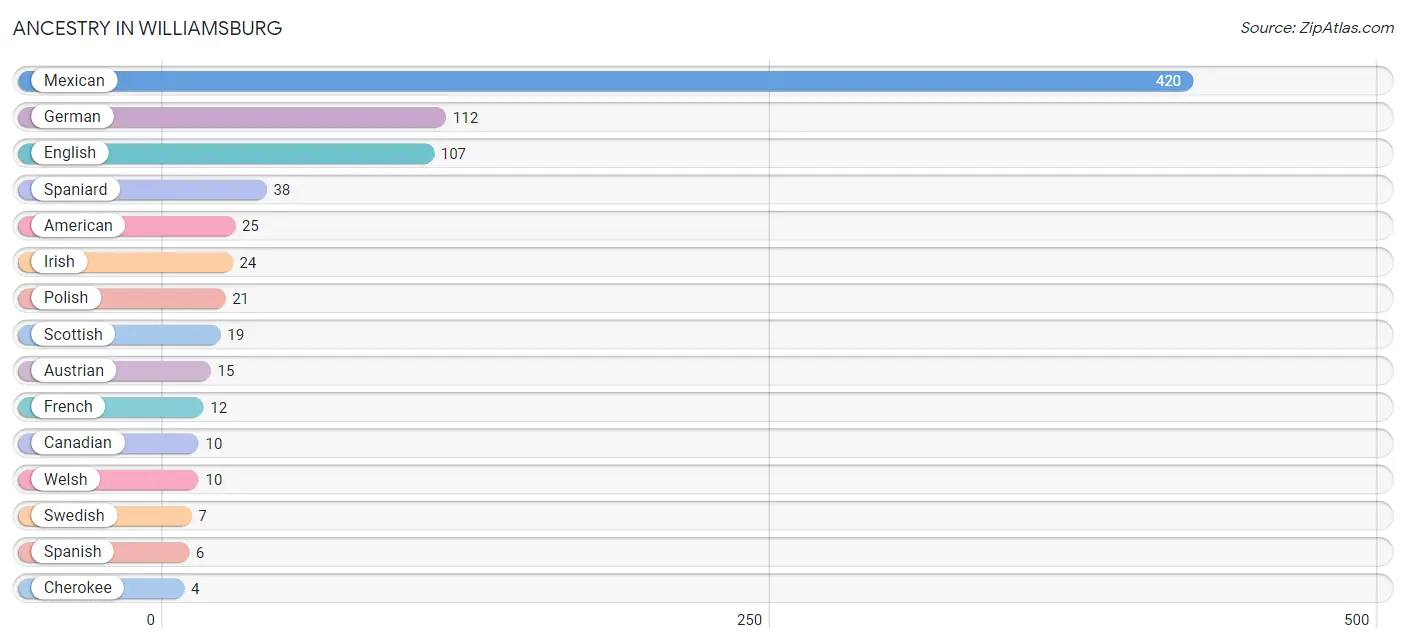
| Ancestry | # Population | % Population |
| American | 25 | 3.1% |
| Austrian | 15 | 1.9% |
| Canadian | 10 | 1.3% |
| Cherokee | 4 | 0.5% |
| English | 107 | 13.4% |
| French | 12 | 1.5% |
| German | 112 | 14.0% |
| Irish | 24 | 3.0% |
| Mexican | 420 | 52.5% |
| Polish | 21 | 2.6% |
| Scotch-Irish | 2 | 0.3% |
| Scottish | 19 | 2.4% |
| Spaniard | 38 | 4.8% |
| Spanish | 6 | 0.7% |
| Spanish American | 2 | 0.3% |
| Swedish | 7 | 0.9% |
| Welsh | 10 | 1.3% | View All 17 Rows |
Immigrants in Williamsburg
The most numerous immigrant groups reported in Williamsburg came from Central America (169 | 21.1%), Latin America (169 | 21.1%), and Mexico (169 | 21.1%), together accounting for 63.4% of all Williamsburg residents.
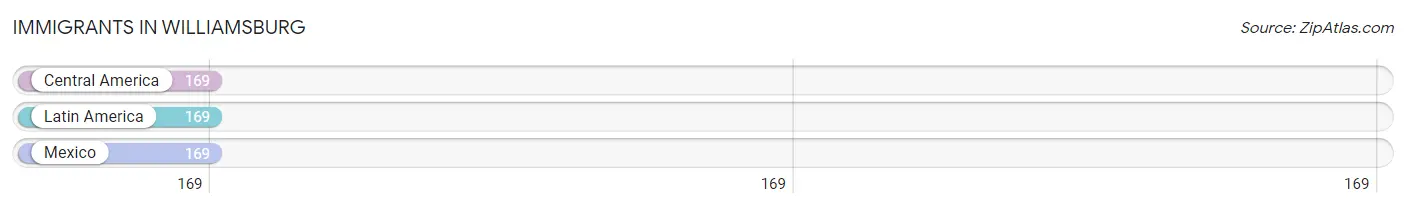
| Immigration Origin | # Population | % Population |
| Central America | 169 | 21.1% |
| Latin America | 169 | 21.1% |
| Mexico | 169 | 21.1% | View All 3 Rows |
Sex and Age in Williamsburg
Sex and Age in Williamsburg
The most populous age groups in Williamsburg are 50 to 54 Years (48 | 15.0%) for men and 55 to 59 Years (64 | 13.3%) for women.
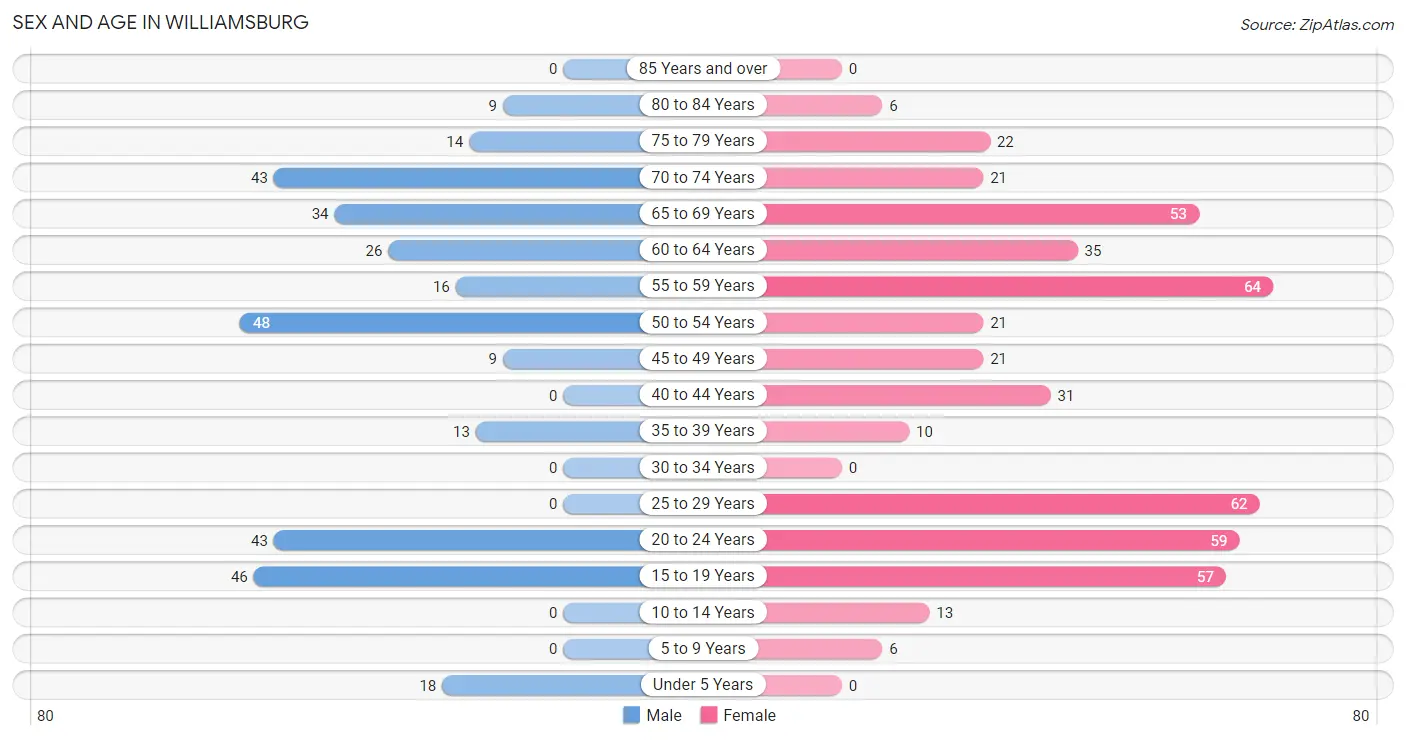
| Age Bracket | Male | Female |
| Under 5 Years | 18 (5.6%) | 0 (0.0%) |
| 5 to 9 Years | 0 (0.0%) | 6 (1.3%) |
| 10 to 14 Years | 0 (0.0%) | 13 (2.7%) |
| 15 to 19 Years | 46 (14.4%) | 57 (11.8%) |
| 20 to 24 Years | 43 (13.5%) | 59 (12.3%) |
| 25 to 29 Years | 0 (0.0%) | 62 (12.9%) |
| 30 to 34 Years | 0 (0.0%) | 0 (0.0%) |
| 35 to 39 Years | 13 (4.1%) | 10 (2.1%) |
| 40 to 44 Years | 0 (0.0%) | 31 (6.4%) |
| 45 to 49 Years | 9 (2.8%) | 21 (4.4%) |
| 50 to 54 Years | 48 (15.0%) | 21 (4.4%) |
| 55 to 59 Years | 16 (5.0%) | 64 (13.3%) |
| 60 to 64 Years | 26 (8.2%) | 35 (7.3%) |
| 65 to 69 Years | 34 (10.7%) | 53 (11.0%) |
| 70 to 74 Years | 43 (13.5%) | 21 (4.4%) |
| 75 to 79 Years | 14 (4.4%) | 22 (4.6%) |
| 80 to 84 Years | 9 (2.8%) | 6 (1.3%) |
| 85 Years and over | 0 (0.0%) | 0 (0.0%) |
| Total | 319 (100.0%) | 481 (100.0%) |
Families and Households in Williamsburg
Median Family Size in Williamsburg
The median family size in Williamsburg is 4.81 persons per family, with married-couple families (92 | 82.9%) accounting for the largest median family size of 5.17 persons per family. On the other hand, single male/father families (3 | 2.7%) represent the smallest median family size with 2.67 persons per family.
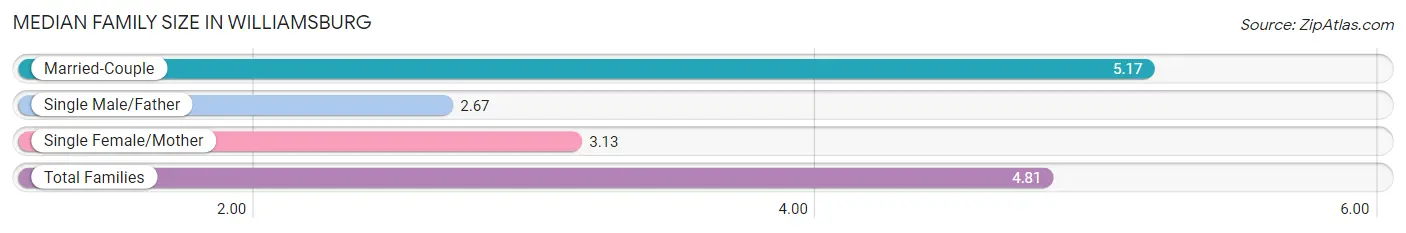
| Family Type | # Families | Family Size |
| Married-Couple | 92 (82.9%) | 5.17 |
| Single Male/Father | 3 (2.7%) | 2.67 |
| Single Female/Mother | 16 (14.4%) | 3.13 |
| Total Families | 111 (100.0%) | 4.81 |
Median Household Size in Williamsburg
The median household size in Williamsburg is 2.79 persons per household, with married-couple households (92 | 32.1%) accounting for the largest median household size of 5.17 persons per household. non-family households (176 | 61.3%) represent the smallest median household size with 1.44 persons per household.
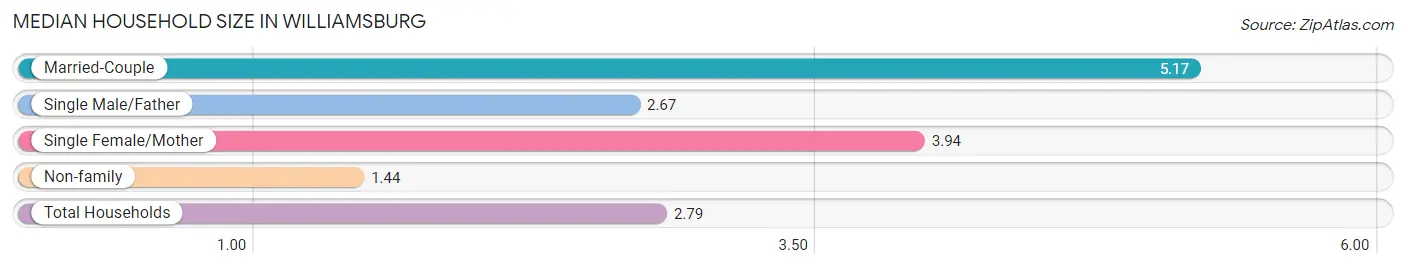
| Household Type | # Households | Household Size |
| Married-Couple | 92 (32.1%) | 5.17 |
| Single Male/Father | 3 (1.1%) | 2.67 |
| Single Female/Mother | 16 (5.6%) | 3.94 |
| Non-family | 176 (61.3%) | 1.44 |
| Total Households | 287 (100.0%) | 2.79 |
Household Size by Marriage Status in Williamsburg
Out of a total of 287 households in Williamsburg, 111 (38.7%) are family households, while 176 (61.3%) are nonfamily households. The most numerous type of family households are 3-person households, comprising 59, and the most common type of nonfamily households are 1-person households, comprising 151.
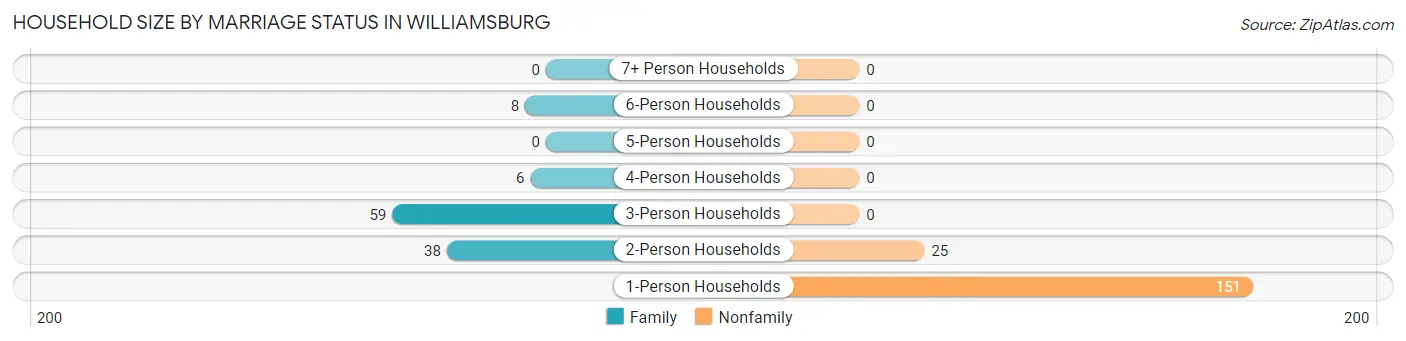
| Household Size | Family Households | Nonfamily Households |
| 1-Person Households | - | 151 (52.6%) |
| 2-Person Households | 38 (13.2%) | 25 (8.7%) |
| 3-Person Households | 59 (20.6%) | 0 (0.0%) |
| 4-Person Households | 6 (2.1%) | 0 (0.0%) |
| 5-Person Households | 0 (0.0%) | 0 (0.0%) |
| 6-Person Households | 8 (2.8%) | 0 (0.0%) |
| 7+ Person Households | 0 (0.0%) | 0 (0.0%) |
| Total | 111 (38.7%) | 176 (61.3%) |
Female Fertility in Williamsburg
Fertility by Age in Williamsburg
| Age Bracket | Women with Births | Births / 1,000 Women |
| 15 to 19 years | 0 (0.0%) | 0.0 |
| 20 to 34 years | 0 (0.0%) | 0.0 |
| 35 to 50 years | 0 (0.0%) | 0.0 |
| Total | 0 (0.0%) | 0.0 |
Fertility by Age by Marriage Status in Williamsburg
| Age Bracket | Married | Unmarried |
| 15 to 19 years | 0 (0.0%) | 0 (0.0%) |
| 20 to 34 years | 0 (0.0%) | 0 (0.0%) |
| 35 to 50 years | 0 (0.0%) | 0 (0.0%) |
| Total | 0 (0.0%) | 0 (0.0%) |
Fertility by Education in Williamsburg
| Educational Attainment | Women with Births | Births / 1,000 Women |
| Less than High School | 0 (0.0%) | 0.0 |
| High School Diploma | 0 (0.0%) | 0.0 |
| College or Associate's Degree | 0 (0.0%) | 0.0 |
| Bachelor's Degree | 0 (0.0%) | 0.0 |
| Graduate Degree | 0 (0.0%) | 0.0 |
| Total | 0 (0.0%) | 0.0 |
Fertility by Education by Marriage Status in Williamsburg
| Educational Attainment | Married | Unmarried |
| Less than High School | 0 (0.0%) | 0 (0.0%) |
| High School Diploma | 0 (0.0%) | 0 (0.0%) |
| College or Associate's Degree | 0 (0.0%) | 0 (0.0%) |
| Bachelor's Degree | 0 (0.0%) | 0 (0.0%) |
| Graduate Degree | 0 (0.0%) | 0 (0.0%) |
| Total | 0 (0.0%) | 0 (0.0%) |
Employment Characteristics in Williamsburg
Employment by Class of Employer in Williamsburg
Among the 350 employed individuals in Williamsburg, private company employees (275 | 78.6%), federal government employees (30 | 8.6%), and local government employees (19 | 5.4%) make up the most common classes of employment.
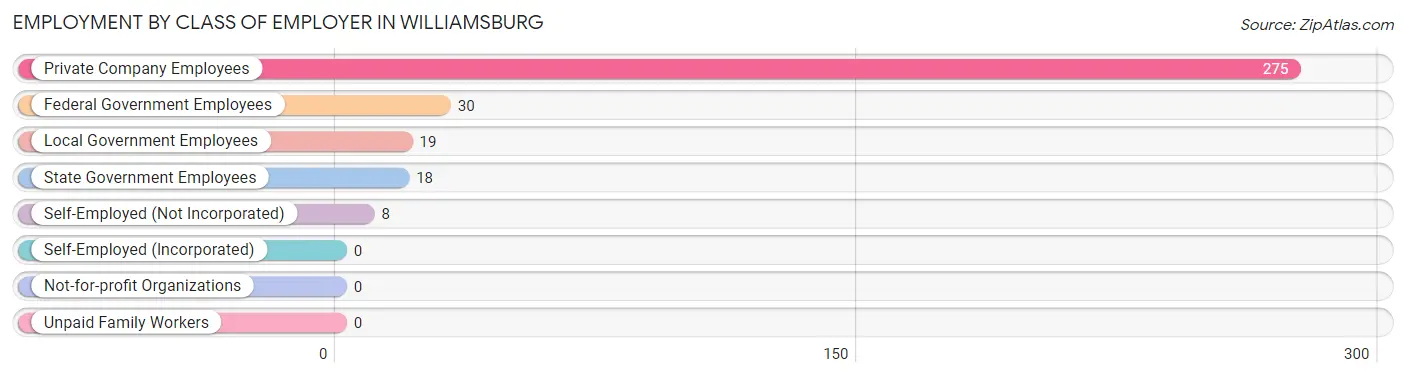
| Employer Class | # Employees | % Employees |
| Private Company Employees | 275 | 78.6% |
| Self-Employed (Incorporated) | 0 | 0.0% |
| Self-Employed (Not Incorporated) | 8 | 2.3% |
| Not-for-profit Organizations | 0 | 0.0% |
| Local Government Employees | 19 | 5.4% |
| State Government Employees | 18 | 5.1% |
| Federal Government Employees | 30 | 8.6% |
| Unpaid Family Workers | 0 | 0.0% |
| Total | 350 | 100.0% |
Employment Status by Age in Williamsburg
According to the labor force statistics for Williamsburg, out of the total population over 16 years of age (748), 51.9% or 388 individuals are in the labor force, with 8.0% or 31 of them unemployed. The age group with the highest labor force participation rate is 20 to 24 years, with 88.2% or 90 individuals in the labor force. Within the labor force, the 16 to 19 years age range has the highest percentage of unemployed individuals, with 68.9% or 31 of them being unemployed.
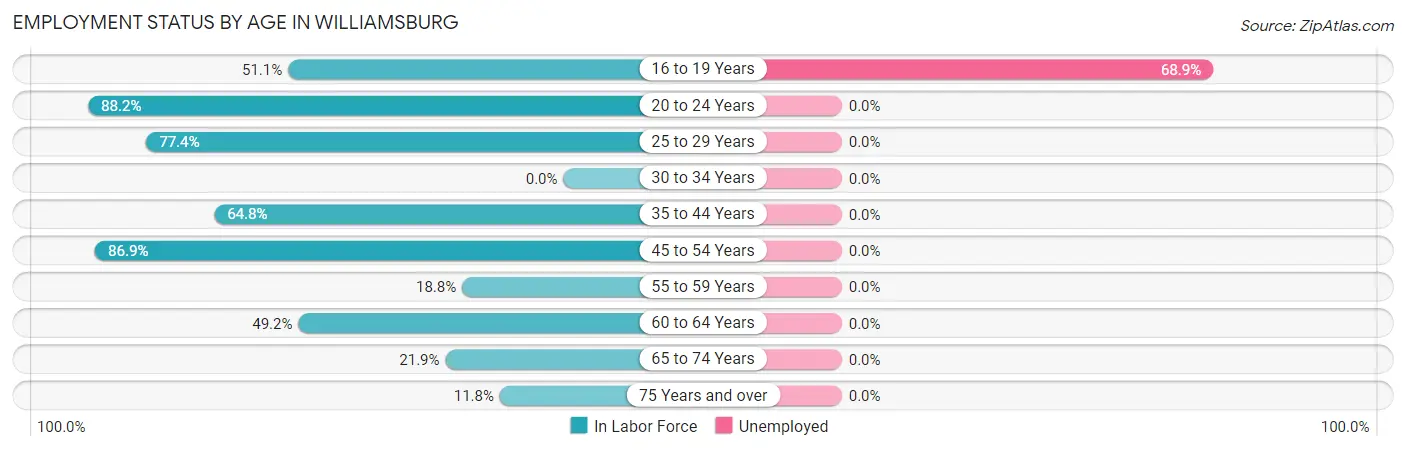
| Age Bracket | In Labor Force | Unemployed |
| 16 to 19 Years | 45 (51.1%) | 31 (68.9%) |
| 20 to 24 Years | 90 (88.2%) | 0 (0.0%) |
| 25 to 29 Years | 48 (77.4%) | 0 (0.0%) |
| 30 to 34 Years | 0 (0.0%) | 0 (0.0%) |
| 35 to 44 Years | 35 (64.8%) | 0 (0.0%) |
| 45 to 54 Years | 86 (86.9%) | 0 (0.0%) |
| 55 to 59 Years | 15 (18.8%) | 0 (0.0%) |
| 60 to 64 Years | 30 (49.2%) | 0 (0.0%) |
| 65 to 74 Years | 33 (21.9%) | 0 (0.0%) |
| 75 Years and over | 6 (11.8%) | 0 (0.0%) |
| Total | 388 (51.9%) | 31 (8.0%) |
Employment Status by Educational Attainment in Williamsburg
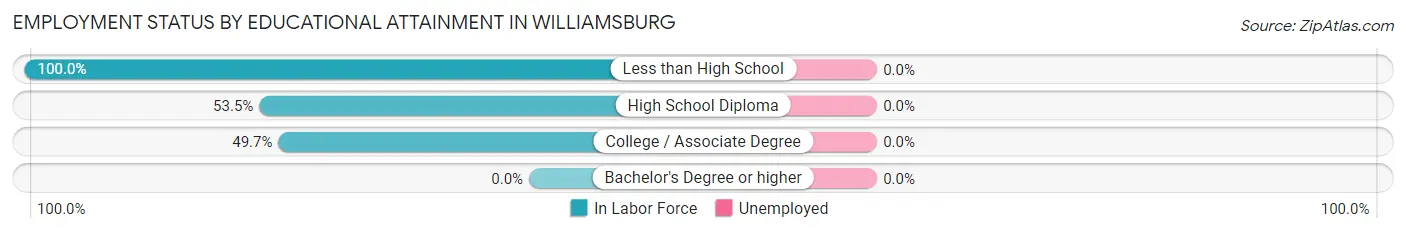
| Educational Attainment | In Labor Force | Unemployed |
| Less than High School | 64 (100.0%) | 0 (0.0%) |
| High School Diploma | 69 (53.5%) | 0 (0.0%) |
| College / Associate Degree | 81 (49.7%) | 0 (0.0%) |
| Bachelor's Degree or higher | 0 (0.0%) | 0 (0.0%) |
| Total | 214 (60.1%) | 0 (0.0%) |
Employment Occupations by Sex in Williamsburg
Management, Business, Science and Arts Occupations
The most common Management, Business, Science and Arts occupations in Williamsburg are , and Management (8 | 2.2%).
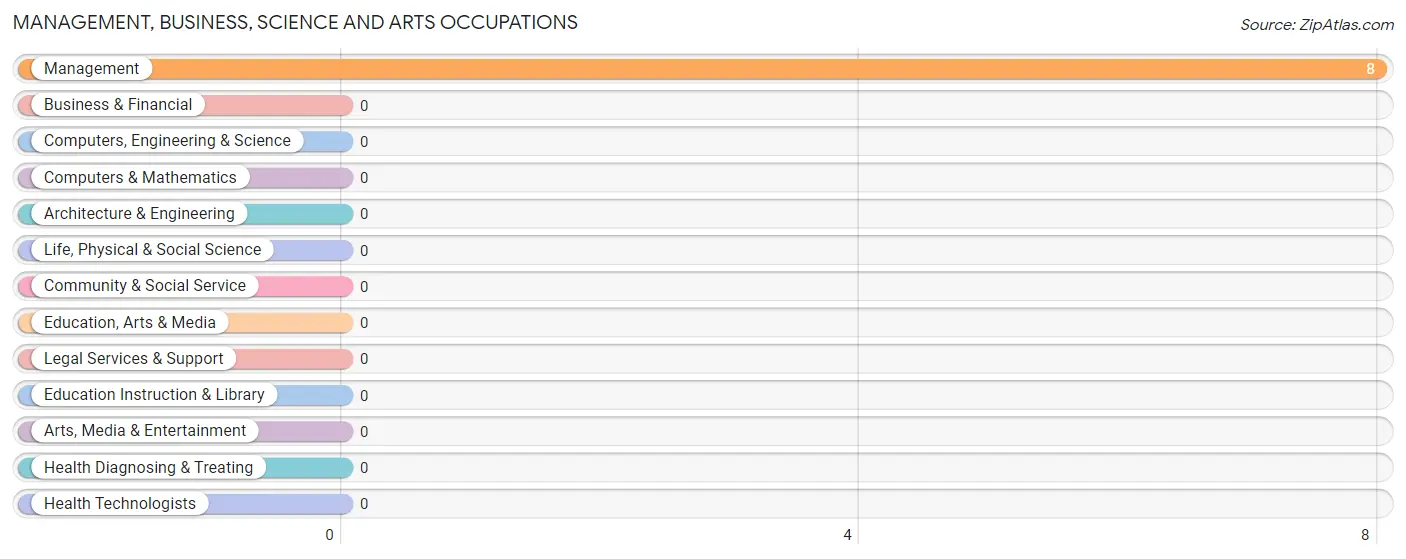
Management, Business, Science and Arts Occupations by Sex
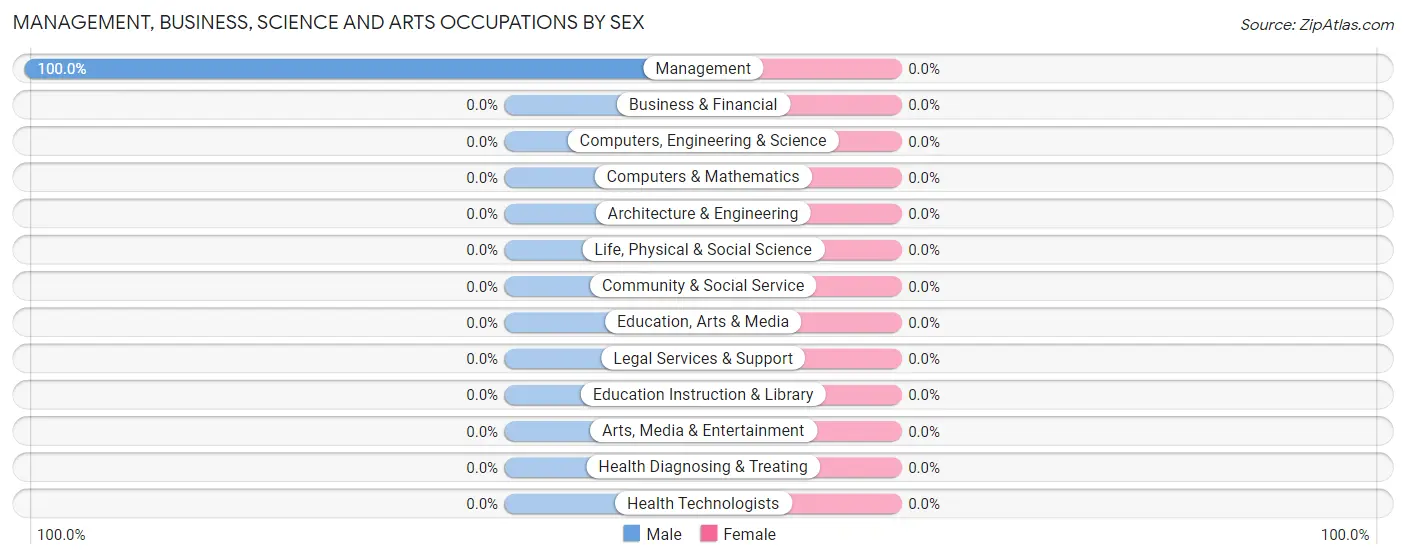
| Occupation | Male | Female |
| Management | 8 (100.0%) | 0 (0.0%) |
| Business & Financial | 0 (0.0%) | 0 (0.0%) |
| Computers, Engineering & Science | 0 (0.0%) | 0 (0.0%) |
| Computers & Mathematics | 0 (0.0%) | 0 (0.0%) |
| Architecture & Engineering | 0 (0.0%) | 0 (0.0%) |
| Life, Physical & Social Science | 0 (0.0%) | 0 (0.0%) |
| Community & Social Service | 0 (0.0%) | 0 (0.0%) |
| Education, Arts & Media | 0 (0.0%) | 0 (0.0%) |
| Legal Services & Support | 0 (0.0%) | 0 (0.0%) |
| Education Instruction & Library | 0 (0.0%) | 0 (0.0%) |
| Arts, Media & Entertainment | 0 (0.0%) | 0 (0.0%) |
| Health Diagnosing & Treating | 0 (0.0%) | 0 (0.0%) |
| Health Technologists | 0 (0.0%) | 0 (0.0%) |
| Total (Category) | 8 (100.0%) | 0 (0.0%) |
| Total (Overall) | 149 (41.7%) | 208 (58.3%) |
Services Occupations
The most common Services occupations in Williamsburg are Healthcare Support (51 | 14.3%), Food Preparation & Serving (33 | 9.2%), and Cleaning & Maintenance (14 | 3.9%).
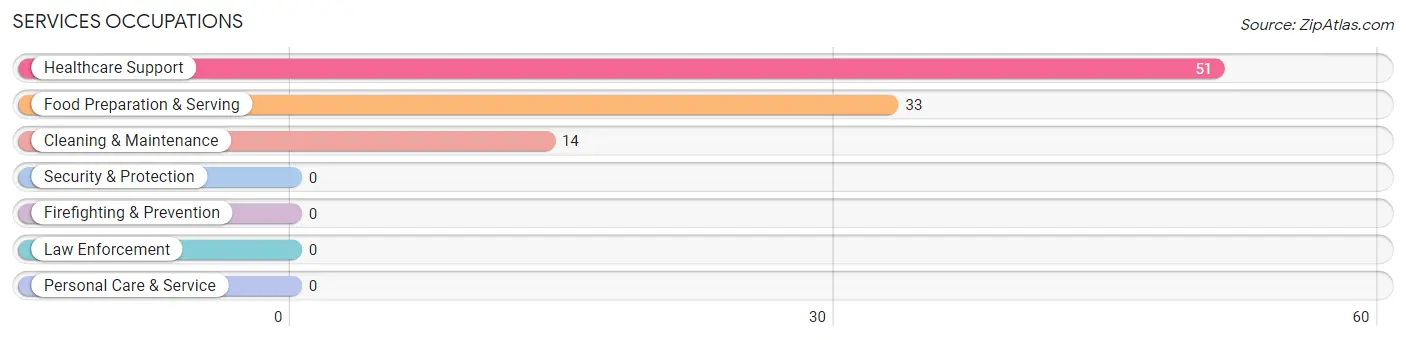
Services Occupations by Sex
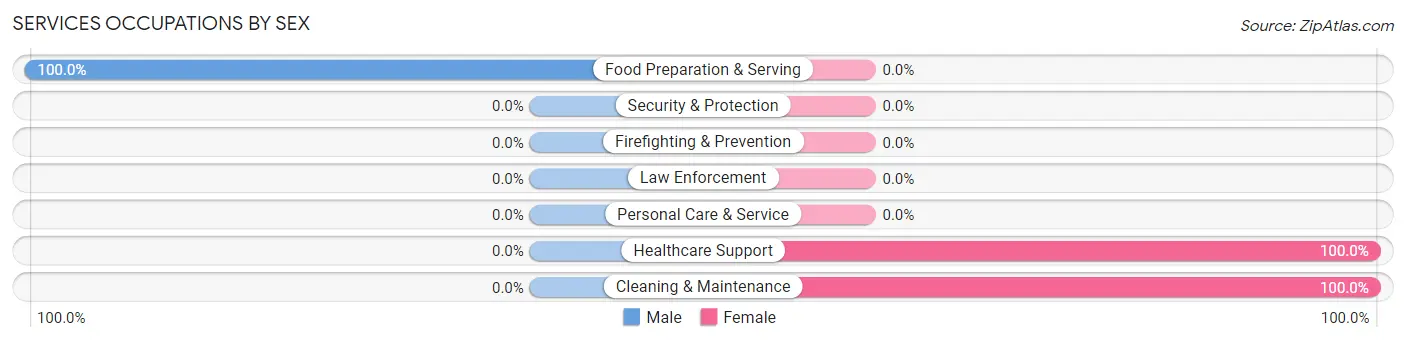
| Occupation | Male | Female |
| Healthcare Support | 0 (0.0%) | 51 (100.0%) |
| Security & Protection | 0 (0.0%) | 0 (0.0%) |
| Firefighting & Prevention | 0 (0.0%) | 0 (0.0%) |
| Law Enforcement | 0 (0.0%) | 0 (0.0%) |
| Food Preparation & Serving | 33 (100.0%) | 0 (0.0%) |
| Cleaning & Maintenance | 0 (0.0%) | 14 (100.0%) |
| Personal Care & Service | 0 (0.0%) | 0 (0.0%) |
| Total (Category) | 33 (33.7%) | 65 (66.3%) |
| Total (Overall) | 149 (41.7%) | 208 (58.3%) |
Sales and Office Occupations
The most common Sales and Office occupations in Williamsburg are Office & Administration (56 | 15.7%), and Sales & Related (20 | 5.6%).
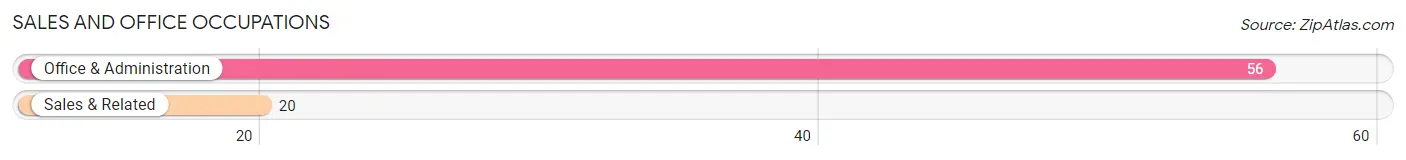
Sales and Office Occupations by Sex

| Occupation | Male | Female |
| Sales & Related | 18 (90.0%) | 2 (10.0%) |
| Office & Administration | 16 (28.6%) | 40 (71.4%) |
| Total (Category) | 34 (44.7%) | 42 (55.3%) |
| Total (Overall) | 149 (41.7%) | 208 (58.3%) |
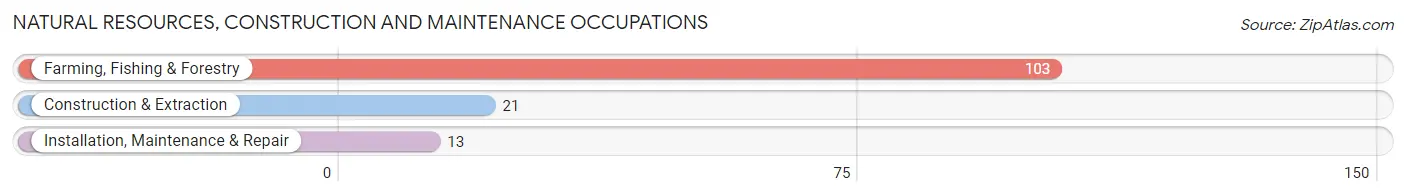
Natural Resources, Construction and Maintenance Occupations
The most common Natural Resources, Construction and Maintenance occupations in Williamsburg are Farming, Fishing & Forestry (103 | 28.8%), Construction & Extraction (21 | 5.9%), and Installation, Maintenance & Repair (13 | 3.6%).
Natural Resources, Construction and Maintenance Occupations by Sex
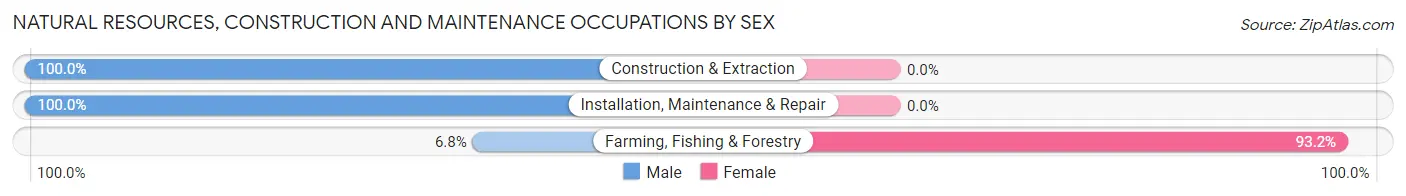
| Occupation | Male | Female |
| Farming, Fishing & Forestry | 7 (6.8%) | 96 (93.2%) |
| Construction & Extraction | 21 (100.0%) | 0 (0.0%) |
| Installation, Maintenance & Repair | 13 (100.0%) | 0 (0.0%) |
| Total (Category) | 41 (29.9%) | 96 (70.1%) |
| Total (Overall) | 149 (41.7%) | 208 (58.3%) |
Production, Transportation and Moving Occupations
The most common Production, Transportation and Moving occupations in Williamsburg are , and Transportation (38 | 10.6%).
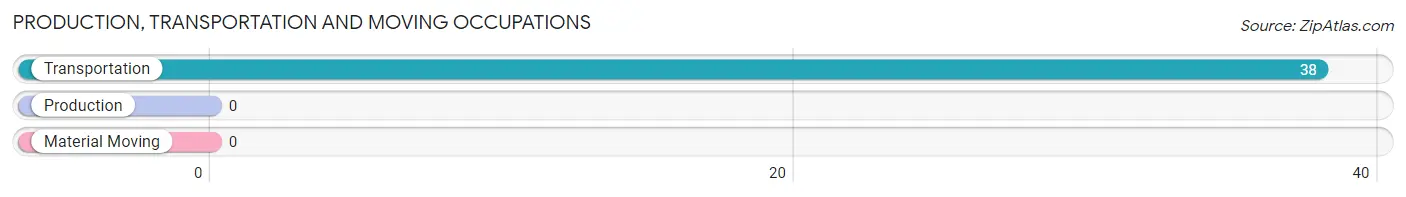
Production, Transportation and Moving Occupations by Sex
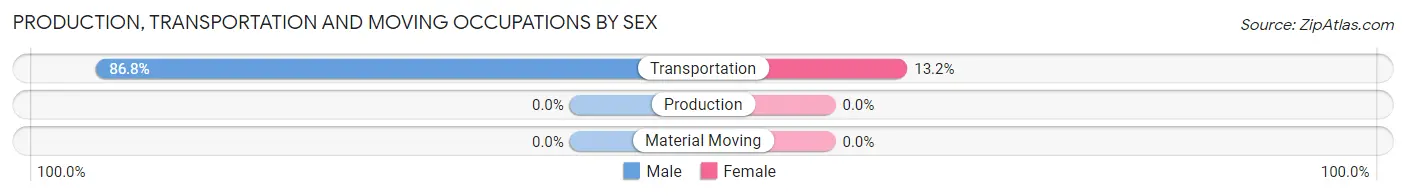
| Occupation | Male | Female |
| Production | 0 (0.0%) | 0 (0.0%) |
| Transportation | 33 (86.8%) | 5 (13.2%) |
| Material Moving | 0 (0.0%) | 0 (0.0%) |
| Total (Category) | 33 (86.8%) | 5 (13.2%) |
| Total (Overall) | 149 (41.7%) | 208 (58.3%) |
Employment Industries by Sex in Williamsburg
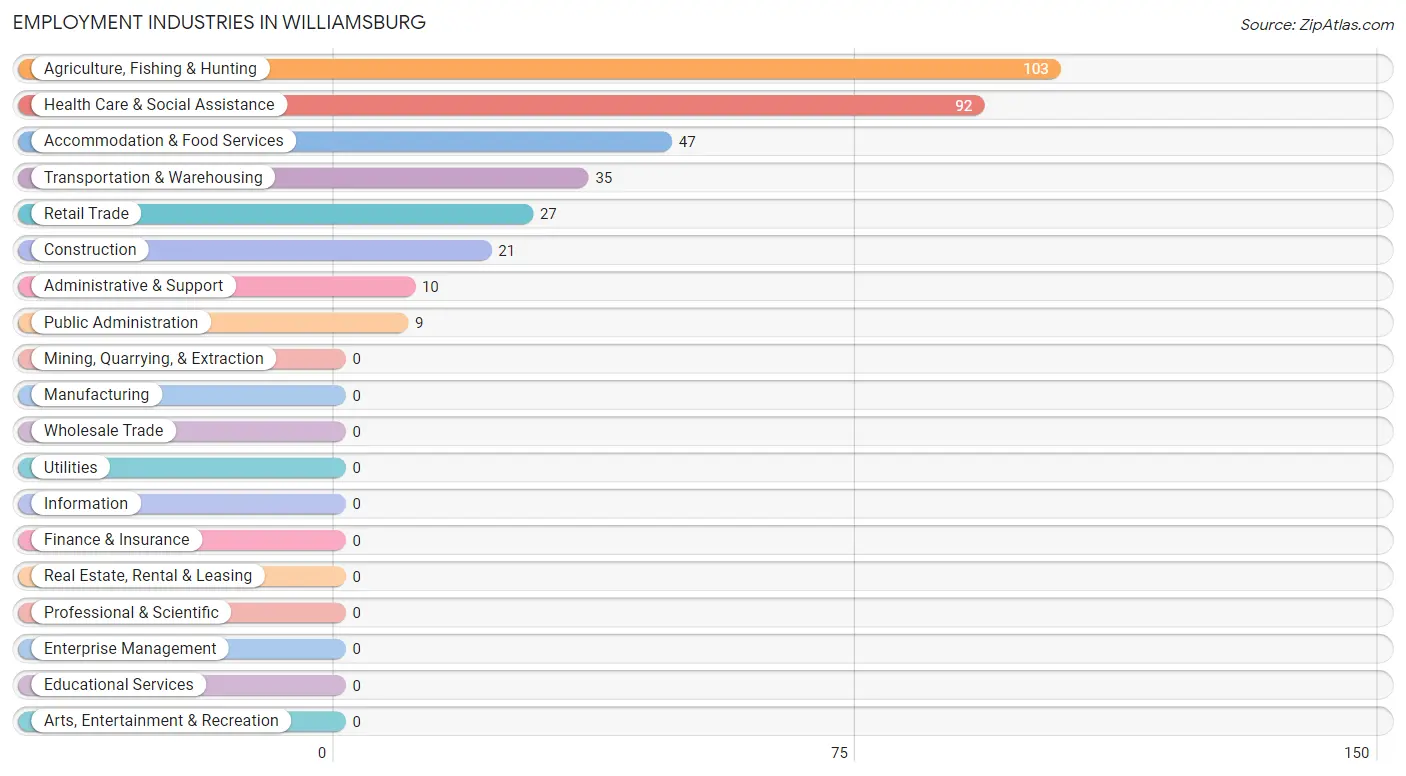
Employment Industries in Williamsburg
The major employment industries in Williamsburg include Agriculture, Fishing & Hunting (103 | 28.8%), Health Care & Social Assistance (92 | 25.8%), Accommodation & Food Services (47 | 13.2%), Transportation & Warehousing (35 | 9.8%), and Retail Trade (27 | 7.6%).
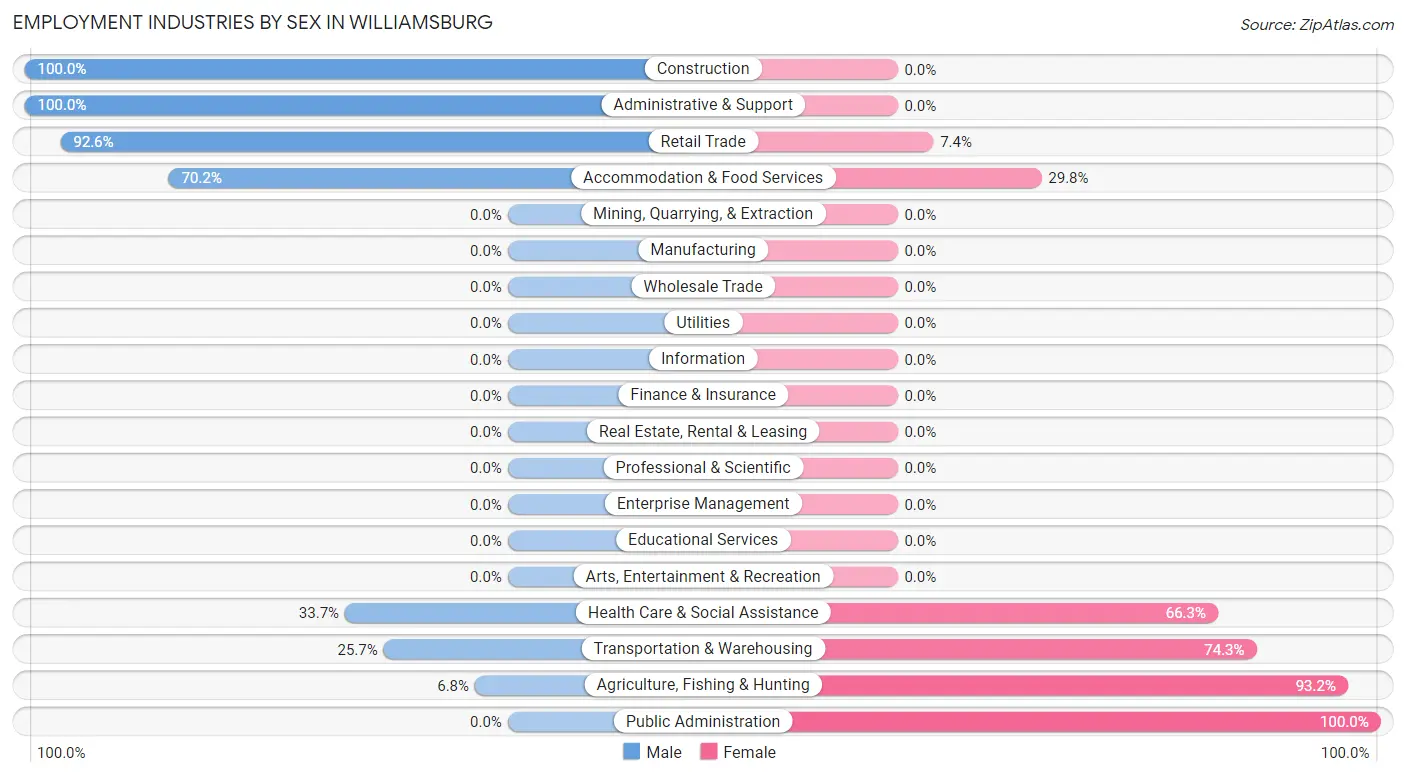
Employment Industries by Sex in Williamsburg
The Williamsburg industries that see more men than women are Construction (100.0%), Administrative & Support (100.0%), and Retail Trade (92.6%), whereas the industries that tend to have a higher number of women are Public Administration (100.0%), Agriculture, Fishing & Hunting (93.2%), and Transportation & Warehousing (74.3%).
| Industry | Male | Female |
| Agriculture, Fishing & Hunting | 7 (6.8%) | 96 (93.2%) |
| Mining, Quarrying, & Extraction | 0 (0.0%) | 0 (0.0%) |
| Construction | 21 (100.0%) | 0 (0.0%) |
| Manufacturing | 0 (0.0%) | 0 (0.0%) |
| Wholesale Trade | 0 (0.0%) | 0 (0.0%) |
| Retail Trade | 25 (92.6%) | 2 (7.4%) |
| Transportation & Warehousing | 9 (25.7%) | 26 (74.3%) |
| Utilities | 0 (0.0%) | 0 (0.0%) |
| Information | 0 (0.0%) | 0 (0.0%) |
| Finance & Insurance | 0 (0.0%) | 0 (0.0%) |
| Real Estate, Rental & Leasing | 0 (0.0%) | 0 (0.0%) |
| Professional & Scientific | 0 (0.0%) | 0 (0.0%) |
| Enterprise Management | 0 (0.0%) | 0 (0.0%) |
| Administrative & Support | 10 (100.0%) | 0 (0.0%) |
| Educational Services | 0 (0.0%) | 0 (0.0%) |
| Health Care & Social Assistance | 31 (33.7%) | 61 (66.3%) |
| Arts, Entertainment & Recreation | 0 (0.0%) | 0 (0.0%) |
| Accommodation & Food Services | 33 (70.2%) | 14 (29.8%) |
| Public Administration | 0 (0.0%) | 9 (100.0%) |
| Total | 149 (41.7%) | 208 (58.3%) |
Education in Williamsburg
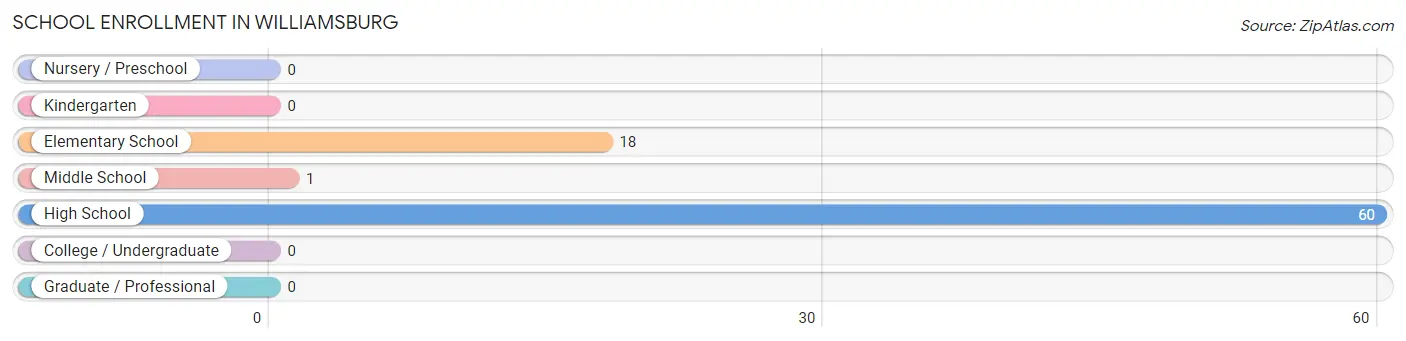
School Enrollment in Williamsburg
The most common levels of schooling among the 79 students in Williamsburg are high school (60 | 75.9%), elementary school (18 | 22.8%), and middle school (1 | 1.3%).
| School Level | # Students | % Students |
| Nursery / Preschool | 0 | 0.0% |
| Kindergarten | 0 | 0.0% |
| Elementary School | 18 | 22.8% |
| Middle School | 1 | 1.3% |
| High School | 60 | 75.9% |
| College / Undergraduate | 0 | 0.0% |
| Graduate / Professional | 0 | 0.0% |
| Total | 79 | 100.0% |
School Enrollment by Age by Funding Source in Williamsburg
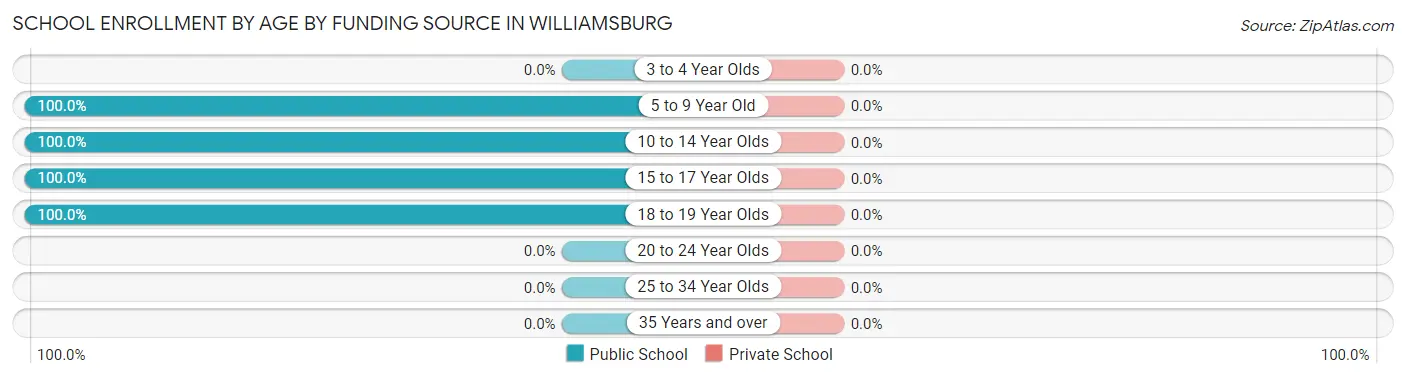
| Age Bracket | Public School | Private School |
| 3 to 4 Year Olds | 0 (0.0%) | 0 (0.0%) |
| 5 to 9 Year Old | 6 (100.0%) | 0 (0.0%) |
| 10 to 14 Year Olds | 13 (100.0%) | 0 (0.0%) |
| 15 to 17 Year Olds | 29 (100.0%) | 0 (0.0%) |
| 18 to 19 Year Olds | 31 (100.0%) | 0 (0.0%) |
| 20 to 24 Year Olds | 0 (0.0%) | 0 (0.0%) |
| 25 to 34 Year Olds | 0 (0.0%) | 0 (0.0%) |
| 35 Years and over | 0 (0.0%) | 0 (0.0%) |
| Total | 79 (100.0%) | 0 (0.0%) |
Educational Attainment by Field of Study in Williamsburg
, and science & technology (15 | 100.0%) are the most common fields of study among 15 individuals in Williamsburg who have obtained a bachelor's degree or higher.
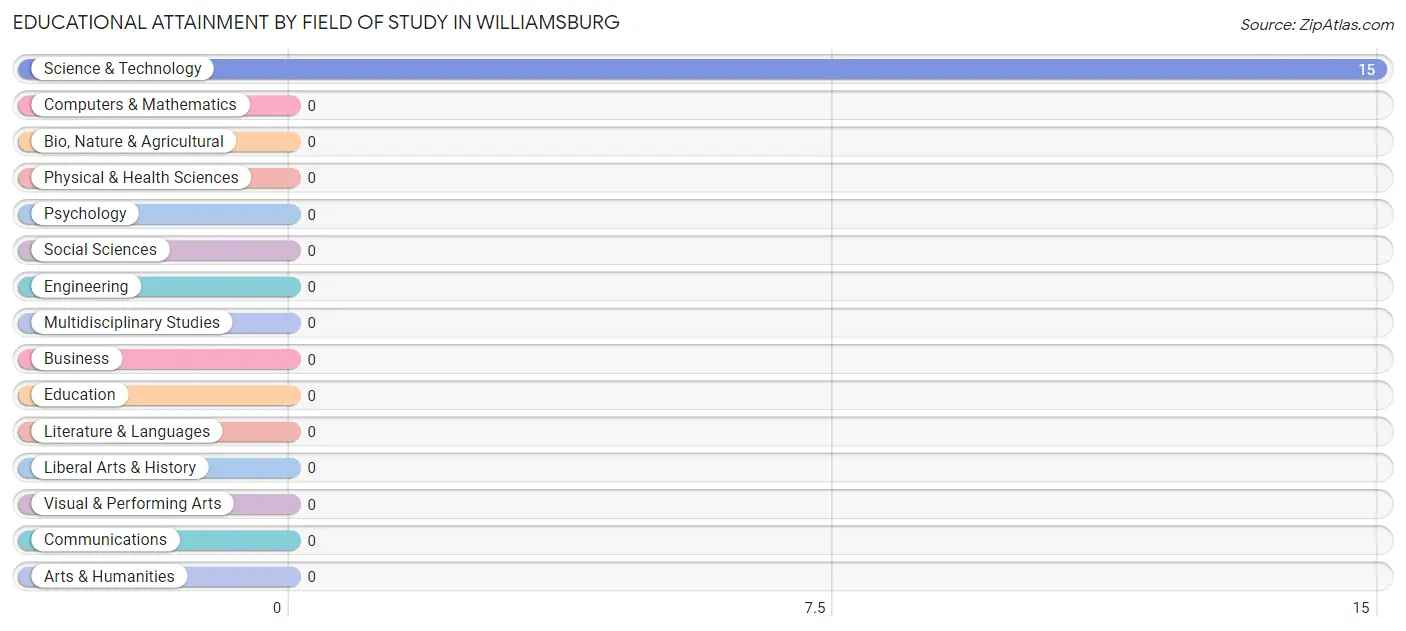
| Field of Study | # Graduates | % Graduates |
| Computers & Mathematics | 0 | 0.0% |
| Bio, Nature & Agricultural | 0 | 0.0% |
| Physical & Health Sciences | 0 | 0.0% |
| Psychology | 0 | 0.0% |
| Social Sciences | 0 | 0.0% |
| Engineering | 0 | 0.0% |
| Multidisciplinary Studies | 0 | 0.0% |
| Science & Technology | 15 | 100.0% |
| Business | 0 | 0.0% |
| Education | 0 | 0.0% |
| Literature & Languages | 0 | 0.0% |
| Liberal Arts & History | 0 | 0.0% |
| Visual & Performing Arts | 0 | 0.0% |
| Communications | 0 | 0.0% |
| Arts & Humanities | 0 | 0.0% |
| Total | 15 | 100.0% |
Transportation & Commute in Williamsburg
Vehicle Availability by Sex in Williamsburg
The most prevalent vehicle ownership categories in Williamsburg are males with 3 vehicles (78, accounting for 54.9%) and females with 3 vehicles (53, making up 37.5%).
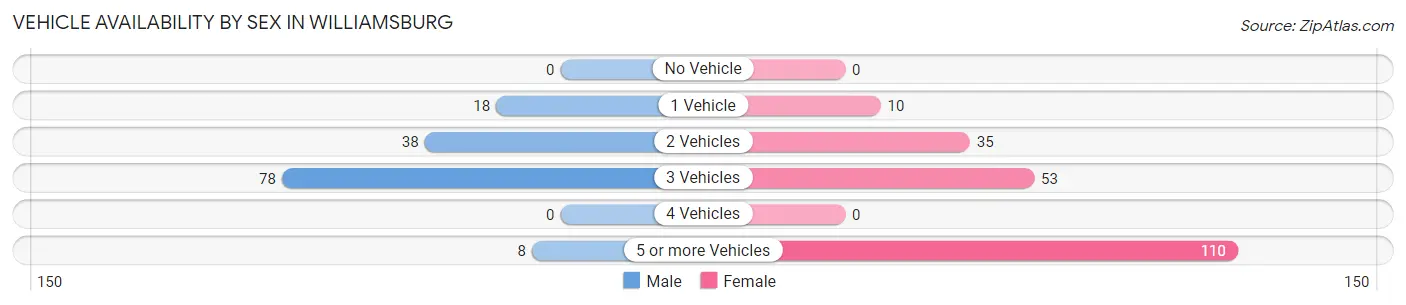
| Vehicles Available | Male | Female |
| No Vehicle | 0 (0.0%) | 0 (0.0%) |
| 1 Vehicle | 18 (12.7%) | 10 (4.8%) |
| 2 Vehicles | 38 (26.8%) | 35 (16.8%) |
| 3 Vehicles | 78 (54.9%) | 53 (25.5%) |
| 4 Vehicles | 0 (0.0%) | 0 (0.0%) |
| 5 or more Vehicles | 8 (5.6%) | 110 (52.9%) |
| Total | 142 (100.0%) | 208 (100.0%) |
Commute Time in Williamsburg
The most frequently occuring commute durations in Williamsburg are 20 to 24 minutes (99 commuters, 28.9%), 10 to 14 minutes (64 commuters, 18.7%), and 5 to 9 minutes (57 commuters, 16.7%).
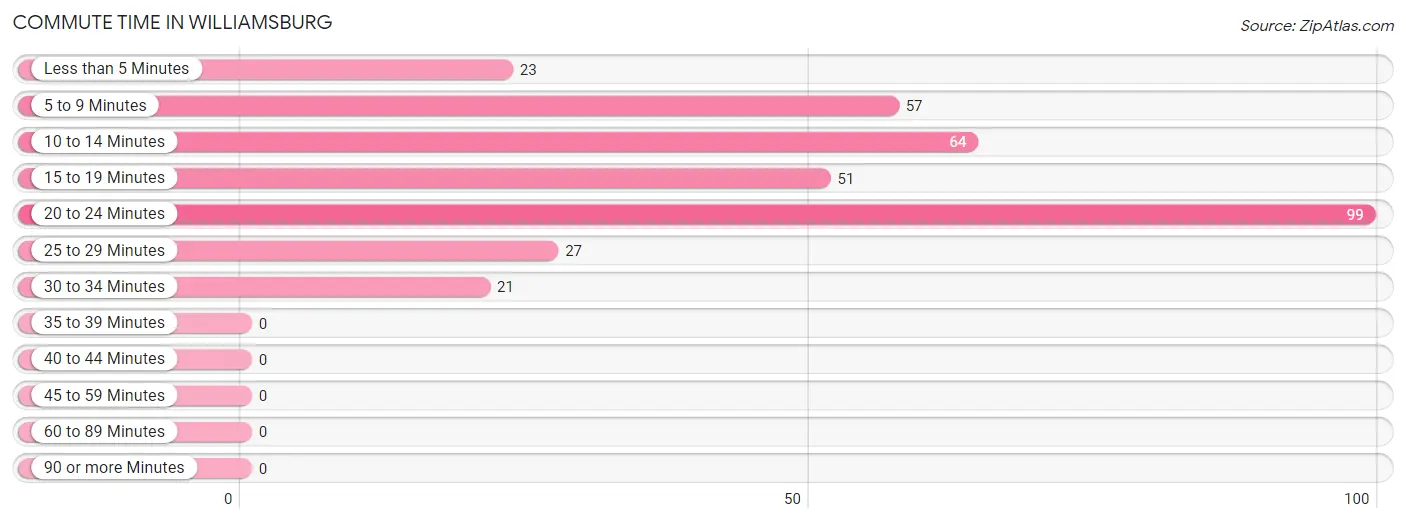
| Commute Time | # Commuters | % Commuters |
| Less than 5 Minutes | 23 | 6.7% |
| 5 to 9 Minutes | 57 | 16.7% |
| 10 to 14 Minutes | 64 | 18.7% |
| 15 to 19 Minutes | 51 | 14.9% |
| 20 to 24 Minutes | 99 | 28.9% |
| 25 to 29 Minutes | 27 | 7.9% |
| 30 to 34 Minutes | 21 | 6.1% |
| 35 to 39 Minutes | 0 | 0.0% |
| 40 to 44 Minutes | 0 | 0.0% |
| 45 to 59 Minutes | 0 | 0.0% |
| 60 to 89 Minutes | 0 | 0.0% |
| 90 or more Minutes | 0 | 0.0% |
Commute Time by Sex in Williamsburg
The most common commute times in Williamsburg are 15 to 19 minutes (51 commuters, 38.1%) for males and 20 to 24 minutes (76 commuters, 36.5%) for females.
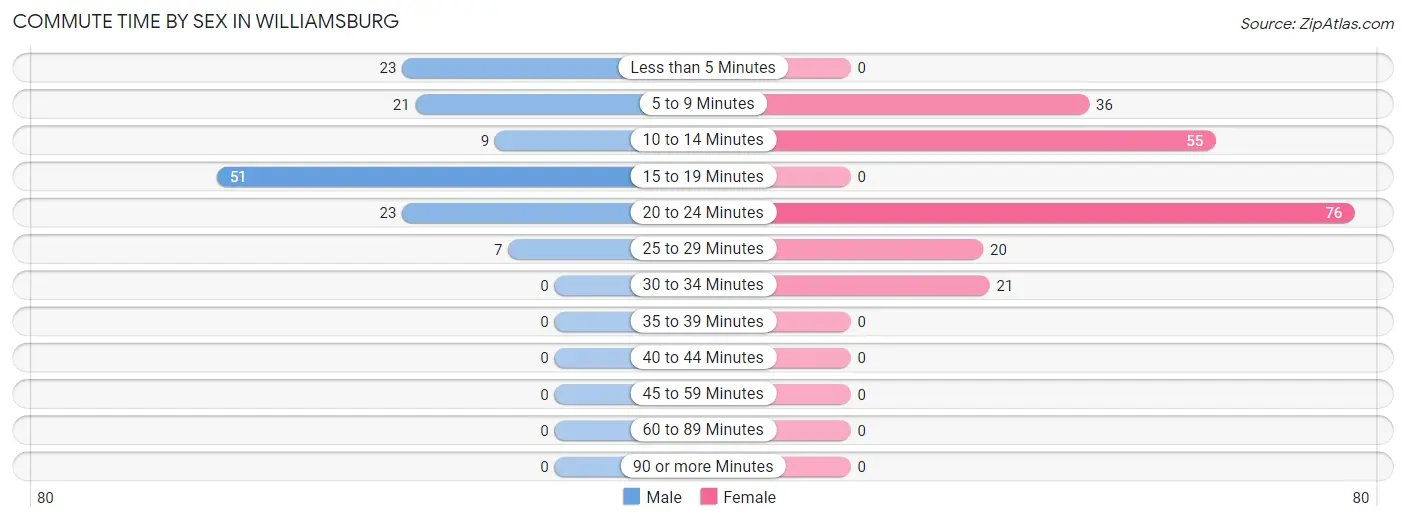
| Commute Time | Male | Female |
| Less than 5 Minutes | 23 (17.2%) | 0 (0.0%) |
| 5 to 9 Minutes | 21 (15.7%) | 36 (17.3%) |
| 10 to 14 Minutes | 9 (6.7%) | 55 (26.4%) |
| 15 to 19 Minutes | 51 (38.1%) | 0 (0.0%) |
| 20 to 24 Minutes | 23 (17.2%) | 76 (36.5%) |
| 25 to 29 Minutes | 7 (5.2%) | 20 (9.6%) |
| 30 to 34 Minutes | 0 (0.0%) | 21 (10.1%) |
| 35 to 39 Minutes | 0 (0.0%) | 0 (0.0%) |
| 40 to 44 Minutes | 0 (0.0%) | 0 (0.0%) |
| 45 to 59 Minutes | 0 (0.0%) | 0 (0.0%) |
| 60 to 89 Minutes | 0 (0.0%) | 0 (0.0%) |
| 90 or more Minutes | 0 (0.0%) | 0 (0.0%) |
Time of Departure to Work by Sex in Williamsburg
The most frequent times of departure to work in Williamsburg are 8:00 AM to 8:29 AM (41, 30.6%) for males and 7:30 AM to 7:59 AM (146, 70.2%) for females.
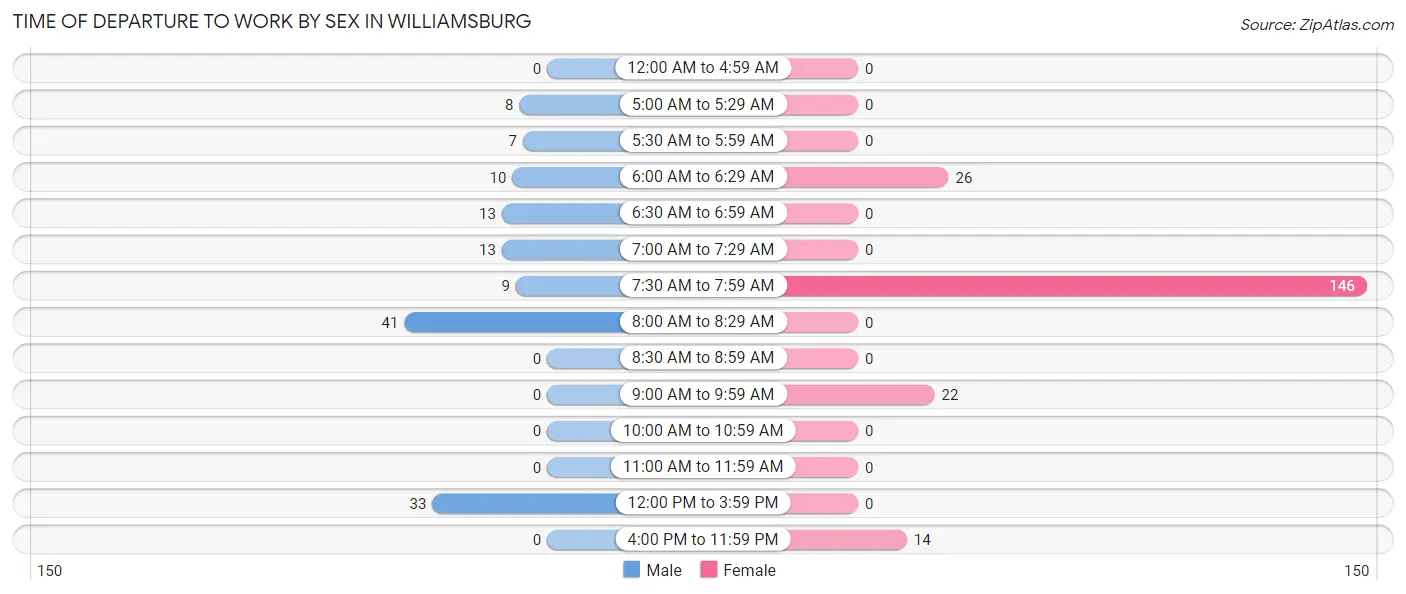
| Time of Departure | Male | Female |
| 12:00 AM to 4:59 AM | 0 (0.0%) | 0 (0.0%) |
| 5:00 AM to 5:29 AM | 8 (6.0%) | 0 (0.0%) |
| 5:30 AM to 5:59 AM | 7 (5.2%) | 0 (0.0%) |
| 6:00 AM to 6:29 AM | 10 (7.5%) | 26 (12.5%) |
| 6:30 AM to 6:59 AM | 13 (9.7%) | 0 (0.0%) |
| 7:00 AM to 7:29 AM | 13 (9.7%) | 0 (0.0%) |
| 7:30 AM to 7:59 AM | 9 (6.7%) | 146 (70.2%) |
| 8:00 AM to 8:29 AM | 41 (30.6%) | 0 (0.0%) |
| 8:30 AM to 8:59 AM | 0 (0.0%) | 0 (0.0%) |
| 9:00 AM to 9:59 AM | 0 (0.0%) | 22 (10.6%) |
| 10:00 AM to 10:59 AM | 0 (0.0%) | 0 (0.0%) |
| 11:00 AM to 11:59 AM | 0 (0.0%) | 0 (0.0%) |
| 12:00 PM to 3:59 PM | 33 (24.6%) | 0 (0.0%) |
| 4:00 PM to 11:59 PM | 0 (0.0%) | 14 (6.7%) |
| Total | 134 (100.0%) | 208 (100.0%) |
Housing Occupancy in Williamsburg
Occupancy by Ownership in Williamsburg
Of the total 287 dwellings in Williamsburg, owner-occupied units account for 197 (68.6%), while renter-occupied units make up 90 (31.4%).
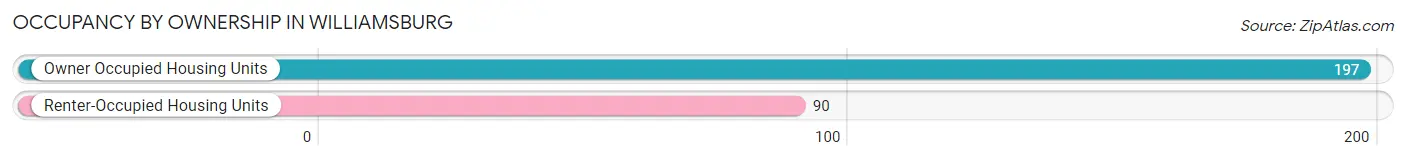
| Occupancy | # Housing Units | % Housing Units |
| Owner Occupied Housing Units | 197 | 68.6% |
| Renter-Occupied Housing Units | 90 | 31.4% |
| Total Occupied Housing Units | 287 | 100.0% |
Occupancy by Household Size in Williamsburg
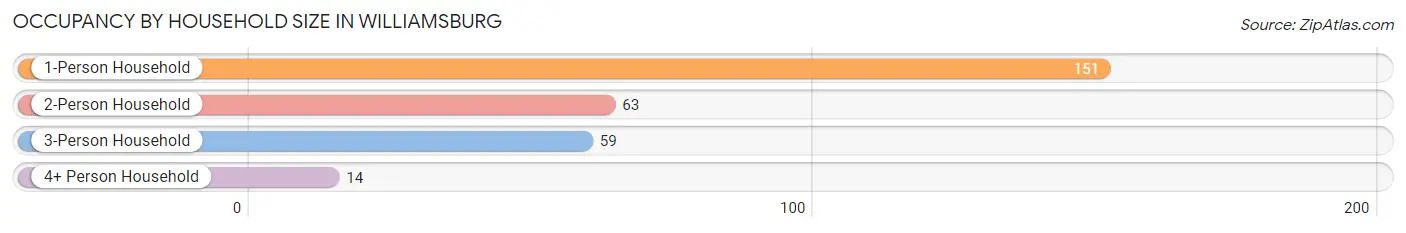
| Household Size | # Housing Units | % Housing Units |
| 1-Person Household | 151 | 52.6% |
| 2-Person Household | 63 | 22.0% |
| 3-Person Household | 59 | 20.6% |
| 4+ Person Household | 14 | 4.9% |
| Total Housing Units | 287 | 100.0% |
Occupancy by Ownership by Household Size in Williamsburg
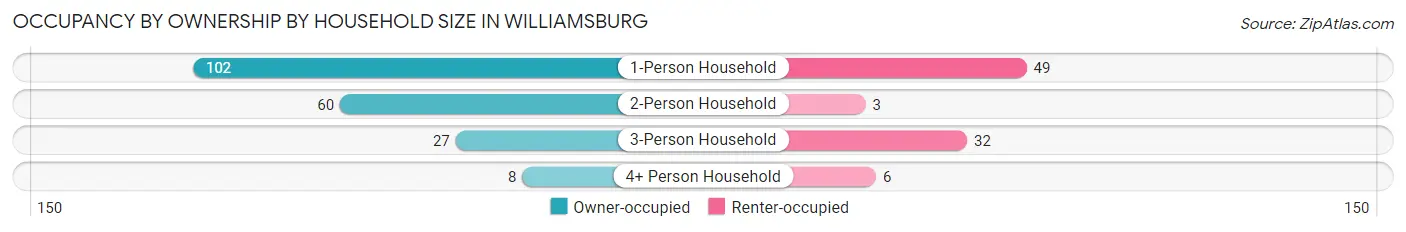
| Household Size | Owner-occupied | Renter-occupied |
| 1-Person Household | 102 (67.5%) | 49 (32.5%) |
| 2-Person Household | 60 (95.2%) | 3 (4.8%) |
| 3-Person Household | 27 (45.8%) | 32 (54.2%) |
| 4+ Person Household | 8 (57.1%) | 6 (42.9%) |
| Total Housing Units | 197 (68.6%) | 90 (31.4%) |
Occupancy by Educational Attainment in Williamsburg
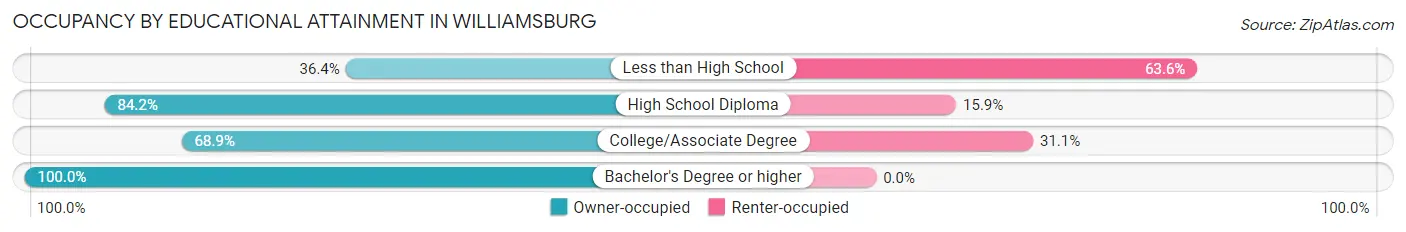
| Household Size | Owner-occupied | Renter-occupied |
| Less than High School | 20 (36.4%) | 35 (63.6%) |
| High School Diploma | 69 (84.2%) | 13 (15.9%) |
| College/Associate Degree | 93 (68.9%) | 42 (31.1%) |
| Bachelor's Degree or higher | 15 (100.0%) | 0 (0.0%) |
Occupancy by Age of Householder in Williamsburg
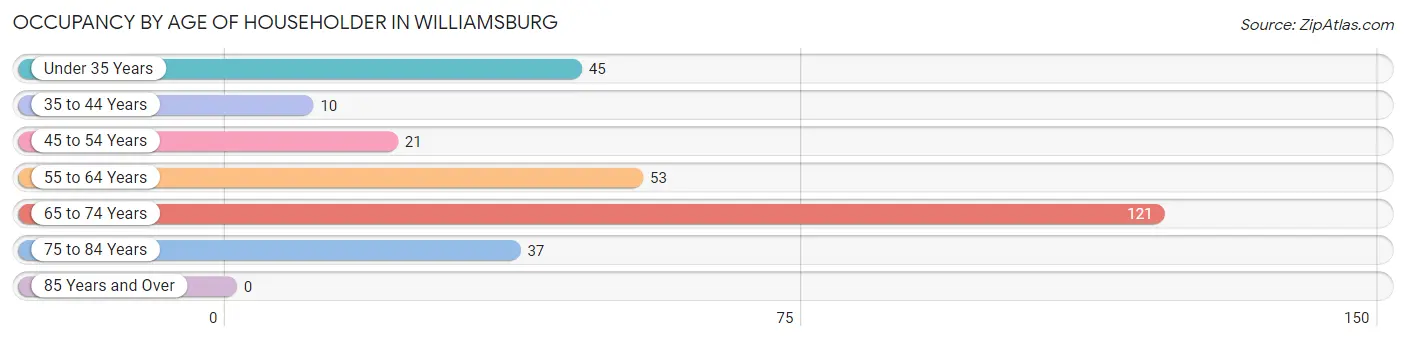
| Age Bracket | # Households | % Households |
| Under 35 Years | 45 | 15.7% |
| 35 to 44 Years | 10 | 3.5% |
| 45 to 54 Years | 21 | 7.3% |
| 55 to 64 Years | 53 | 18.5% |
| 65 to 74 Years | 121 | 42.2% |
| 75 to 84 Years | 37 | 12.9% |
| 85 Years and Over | 0 | 0.0% |
| Total | 287 | 100.0% |
Housing Finances in Williamsburg
Median Income by Occupancy in Williamsburg
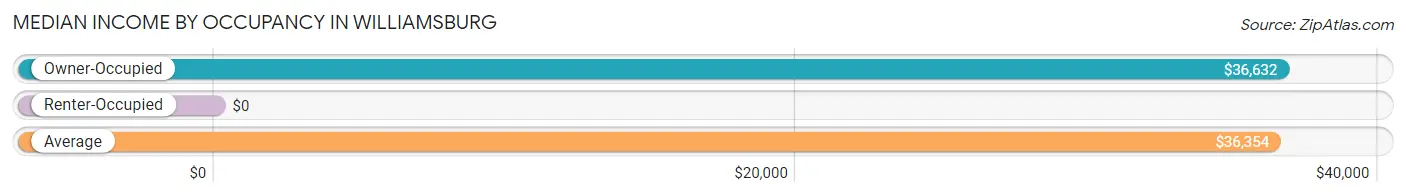
| Occupancy Type | # Households | Median Income |
| Owner-Occupied | 197 (68.6%) | $36,632 |
| Renter-Occupied | 90 (31.4%) | $0 |
| Average | 287 (100.0%) | $36,354 |
Occupancy by Householder Income Bracket in Williamsburg
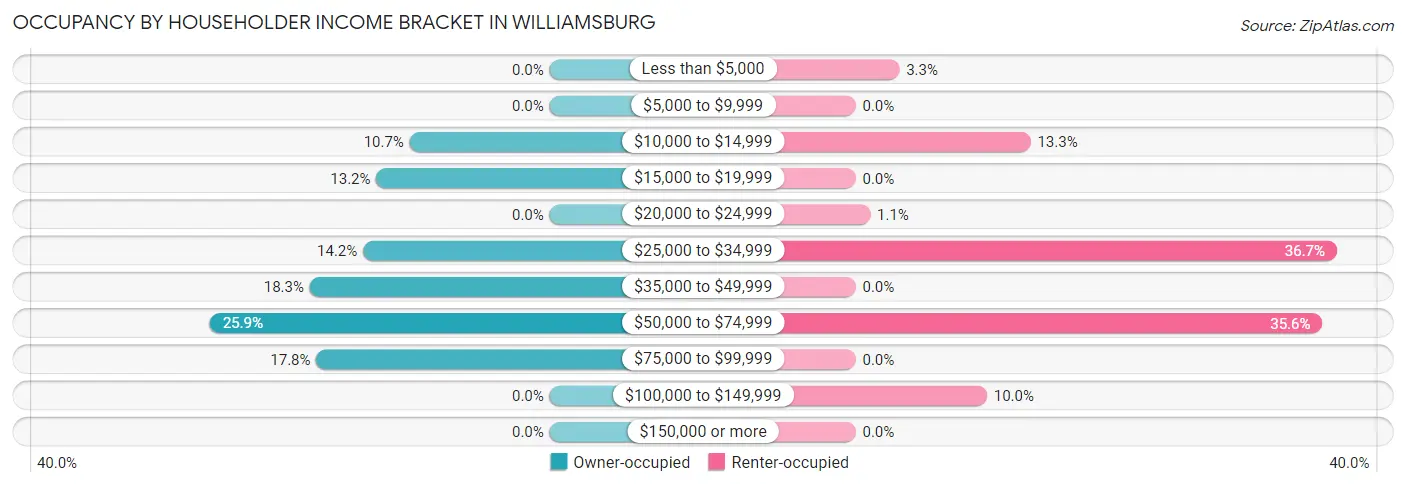
| Income Bracket | Owner-occupied | Renter-occupied |
| Less than $5,000 | 0 (0.0%) | 3 (3.3%) |
| $5,000 to $9,999 | 0 (0.0%) | 0 (0.0%) |
| $10,000 to $14,999 | 21 (10.7%) | 12 (13.3%) |
| $15,000 to $19,999 | 26 (13.2%) | 0 (0.0%) |
| $20,000 to $24,999 | 0 (0.0%) | 1 (1.1%) |
| $25,000 to $34,999 | 28 (14.2%) | 33 (36.7%) |
| $35,000 to $49,999 | 36 (18.3%) | 0 (0.0%) |
| $50,000 to $74,999 | 51 (25.9%) | 32 (35.6%) |
| $75,000 to $99,999 | 35 (17.8%) | 0 (0.0%) |
| $100,000 to $149,999 | 0 (0.0%) | 9 (10.0%) |
| $150,000 or more | 0 (0.0%) | 0 (0.0%) |
| Total | 197 (100.0%) | 90 (100.0%) |
Monthly Housing Cost Tiers in Williamsburg
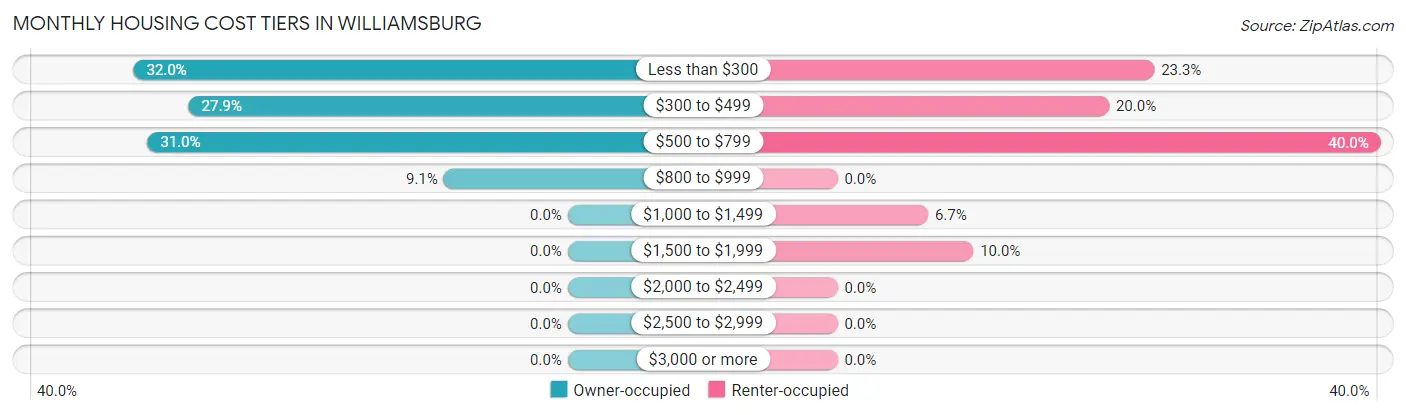
| Monthly Cost | Owner-occupied | Renter-occupied |
| Less than $300 | 63 (32.0%) | 21 (23.3%) |
| $300 to $499 | 55 (27.9%) | 18 (20.0%) |
| $500 to $799 | 61 (31.0%) | 36 (40.0%) |
| $800 to $999 | 18 (9.1%) | 0 (0.0%) |
| $1,000 to $1,499 | 0 (0.0%) | 6 (6.7%) |
| $1,500 to $1,999 | 0 (0.0%) | 9 (10.0%) |
| $2,000 to $2,499 | 0 (0.0%) | 0 (0.0%) |
| $2,500 to $2,999 | 0 (0.0%) | 0 (0.0%) |
| $3,000 or more | 0 (0.0%) | 0 (0.0%) |
| Total | 197 (100.0%) | 90 (100.0%) |
Physical Housing Characteristics in Williamsburg
Housing Structures in Williamsburg
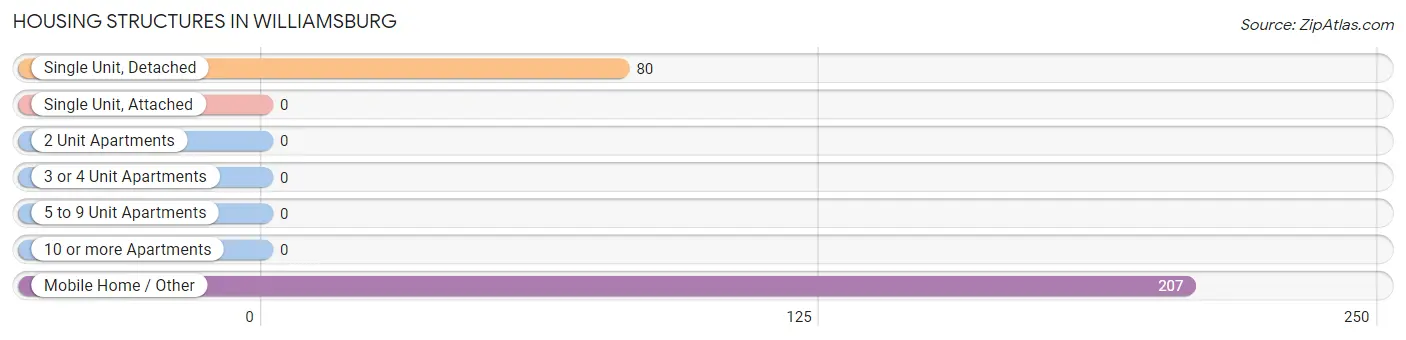
| Structure Type | # Housing Units | % Housing Units |
| Single Unit, Detached | 80 | 27.9% |
| Single Unit, Attached | 0 | 0.0% |
| 2 Unit Apartments | 0 | 0.0% |
| 3 or 4 Unit Apartments | 0 | 0.0% |
| 5 to 9 Unit Apartments | 0 | 0.0% |
| 10 or more Apartments | 0 | 0.0% |
| Mobile Home / Other | 207 | 72.1% |
| Total | 287 | 100.0% |
Housing Structures by Occupancy in Williamsburg
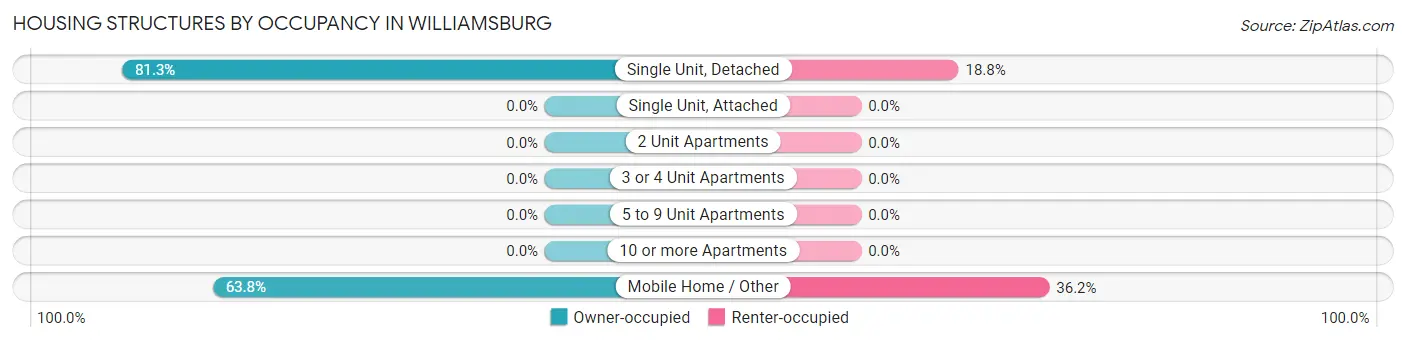
| Structure Type | Owner-occupied | Renter-occupied |
| Single Unit, Detached | 65 (81.2%) | 15 (18.8%) |
| Single Unit, Attached | 0 (0.0%) | 0 (0.0%) |
| 2 Unit Apartments | 0 (0.0%) | 0 (0.0%) |
| 3 or 4 Unit Apartments | 0 (0.0%) | 0 (0.0%) |
| 5 to 9 Unit Apartments | 0 (0.0%) | 0 (0.0%) |
| 10 or more Apartments | 0 (0.0%) | 0 (0.0%) |
| Mobile Home / Other | 132 (63.8%) | 75 (36.2%) |
| Total | 197 (68.6%) | 90 (31.4%) |
Housing Structures by Number of Rooms in Williamsburg
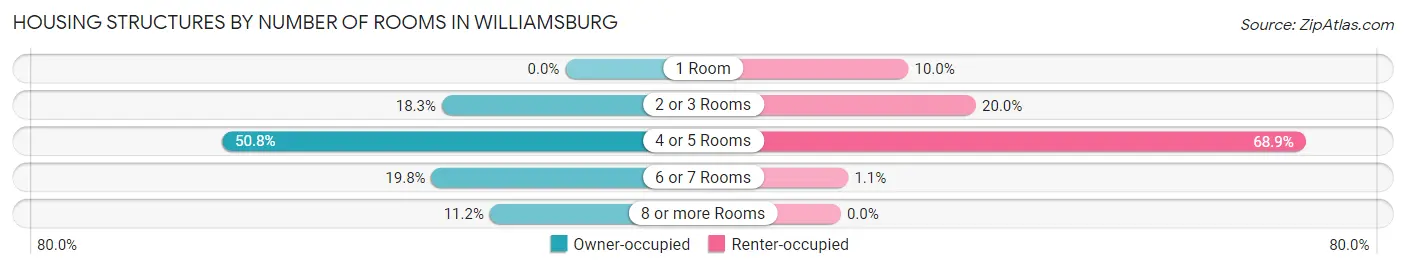
| Number of Rooms | Owner-occupied | Renter-occupied |
| 1 Room | 0 (0.0%) | 9 (10.0%) |
| 2 or 3 Rooms | 36 (18.3%) | 18 (20.0%) |
| 4 or 5 Rooms | 100 (50.8%) | 62 (68.9%) |
| 6 or 7 Rooms | 39 (19.8%) | 1 (1.1%) |
| 8 or more Rooms | 22 (11.2%) | 0 (0.0%) |
| Total | 197 (100.0%) | 90 (100.0%) |
Housing Structure by Heating Type in Williamsburg
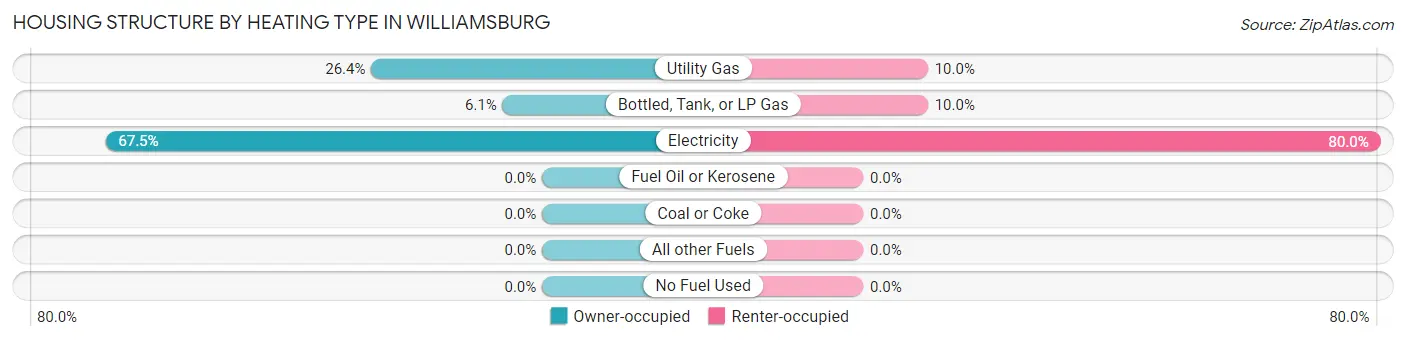
| Heating Type | Owner-occupied | Renter-occupied |
| Utility Gas | 52 (26.4%) | 9 (10.0%) |
| Bottled, Tank, or LP Gas | 12 (6.1%) | 9 (10.0%) |
| Electricity | 133 (67.5%) | 72 (80.0%) |
| Fuel Oil or Kerosene | 0 (0.0%) | 0 (0.0%) |
| Coal or Coke | 0 (0.0%) | 0 (0.0%) |
| All other Fuels | 0 (0.0%) | 0 (0.0%) |
| No Fuel Used | 0 (0.0%) | 0 (0.0%) |
| Total | 197 (100.0%) | 90 (100.0%) |
Household Vehicle Usage in Williamsburg
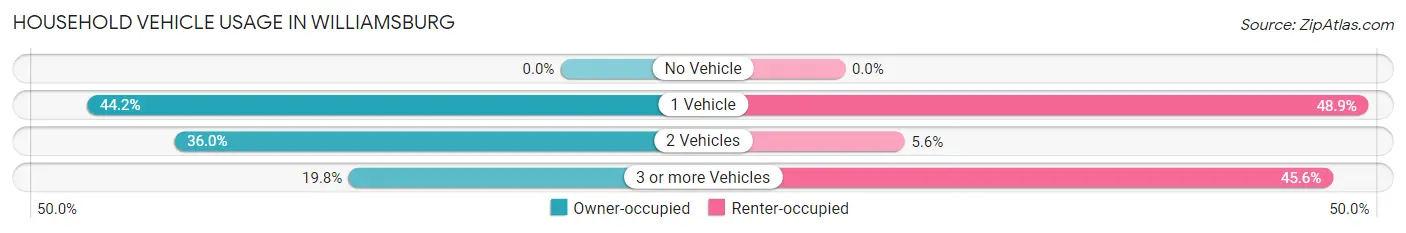
| Vehicles per Household | Owner-occupied | Renter-occupied |
| No Vehicle | 0 (0.0%) | 0 (0.0%) |
| 1 Vehicle | 87 (44.2%) | 44 (48.9%) |
| 2 Vehicles | 71 (36.0%) | 5 (5.6%) |
| 3 or more Vehicles | 39 (19.8%) | 41 (45.6%) |
| Total | 197 (100.0%) | 90 (100.0%) |
Real Estate & Mortgages in Williamsburg
Real Estate and Mortgage Overview in Williamsburg
| Characteristic | Without Mortgage | With Mortgage |
| Housing Units | 118 | 79 |
| Median Property Value | $42,500 | $71,700 |
| Median Household Income | - | - |
| Monthly Housing Costs | $228 | $0 |
| Real Estate Taxes | - | - |
Property Value by Mortgage Status in Williamsburg
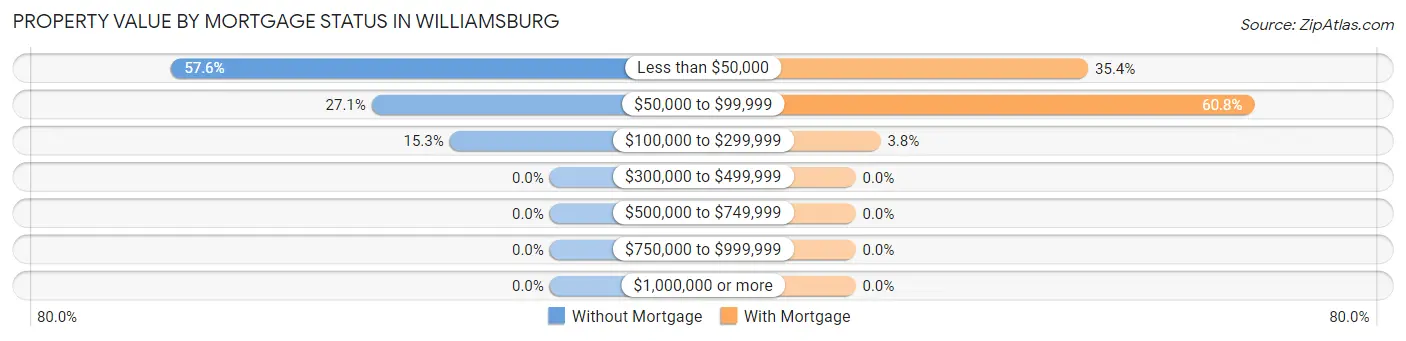
| Property Value | Without Mortgage | With Mortgage |
| Less than $50,000 | 68 (57.6%) | 28 (35.4%) |
| $50,000 to $99,999 | 32 (27.1%) | 48 (60.8%) |
| $100,000 to $299,999 | 18 (15.2%) | 3 (3.8%) |
| $300,000 to $499,999 | 0 (0.0%) | 0 (0.0%) |
| $500,000 to $749,999 | 0 (0.0%) | 0 (0.0%) |
| $750,000 to $999,999 | 0 (0.0%) | 0 (0.0%) |
| $1,000,000 or more | 0 (0.0%) | 0 (0.0%) |
| Total | 118 (100.0%) | 79 (100.0%) |
Household Income by Mortgage Status in Williamsburg
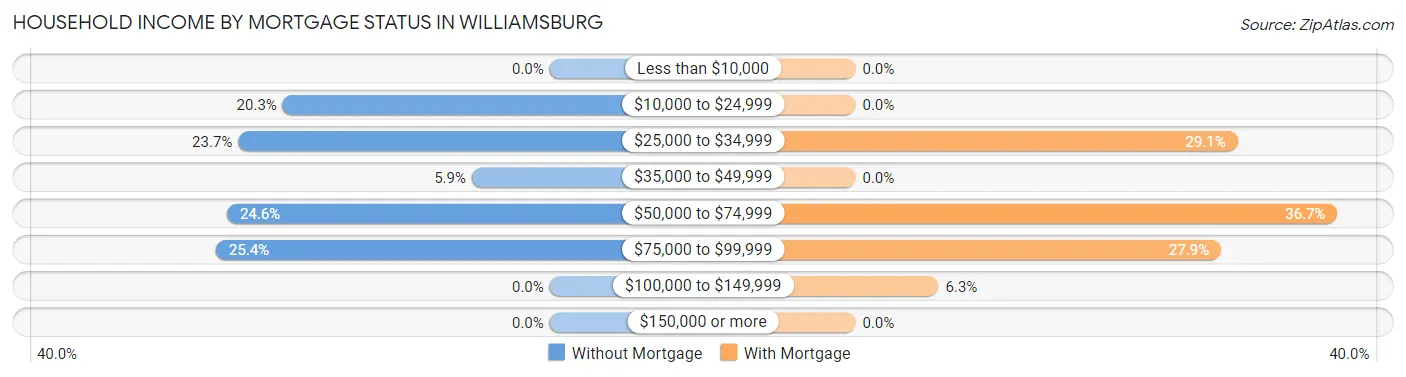
| Household Income | Without Mortgage | With Mortgage |
| Less than $10,000 | 0 (0.0%) | 0 (0.0%) |
| $10,000 to $24,999 | 24 (20.3%) | 0 (0.0%) |
| $25,000 to $34,999 | 28 (23.7%) | 23 (29.1%) |
| $35,000 to $49,999 | 7 (5.9%) | 0 (0.0%) |
| $50,000 to $74,999 | 29 (24.6%) | 29 (36.7%) |
| $75,000 to $99,999 | 30 (25.4%) | 22 (27.9%) |
| $100,000 to $149,999 | 0 (0.0%) | 5 (6.3%) |
| $150,000 or more | 0 (0.0%) | 0 (0.0%) |
| Total | 118 (100.0%) | 79 (100.0%) |
Property Value to Household Income Ratio in Williamsburg
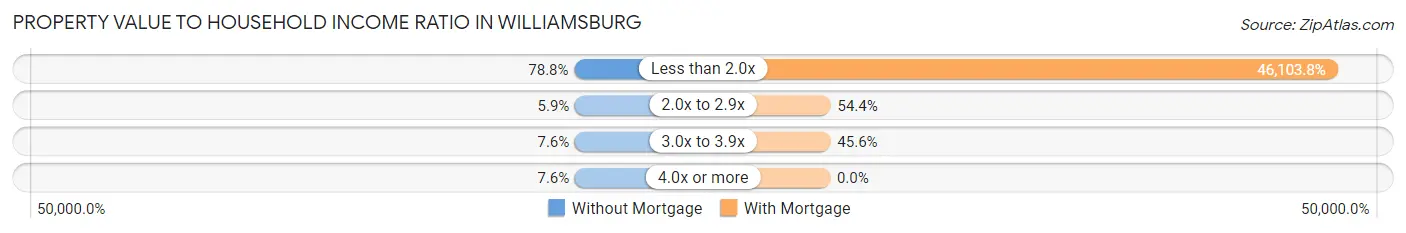
| Value-to-Income Ratio | Without Mortgage | With Mortgage |
| Less than 2.0x | 93 (78.8%) | 36,422 (46,103.8%) |
| 2.0x to 2.9x | 7 (5.9%) | 43 (54.4%) |
| 3.0x to 3.9x | 9 (7.6%) | 36 (45.6%) |
| 4.0x or more | 9 (7.6%) | 0 (0.0%) |
| Total | 118 (100.0%) | 79 (100.0%) |
Real Estate Taxes by Mortgage Status in Williamsburg
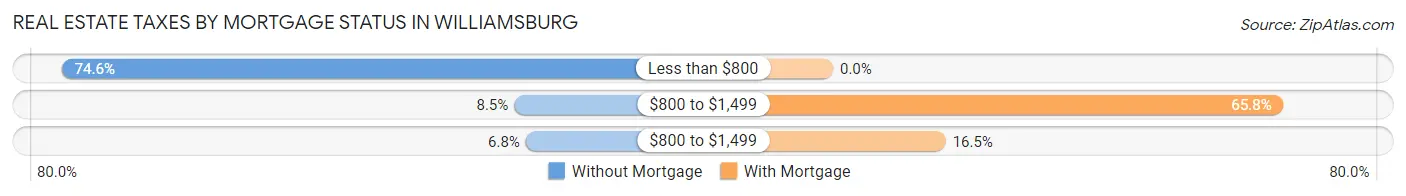
| Property Taxes | Without Mortgage | With Mortgage |
| Less than $800 | 88 (74.6%) | 0 (0.0%) |
| $800 to $1,499 | 10 (8.5%) | 52 (65.8%) |
| $800 to $1,499 | 8 (6.8%) | 13 (16.5%) |
| Total | 118 (100.0%) | 79 (100.0%) |
Health & Disability in Williamsburg
Health Insurance Coverage by Age in Williamsburg
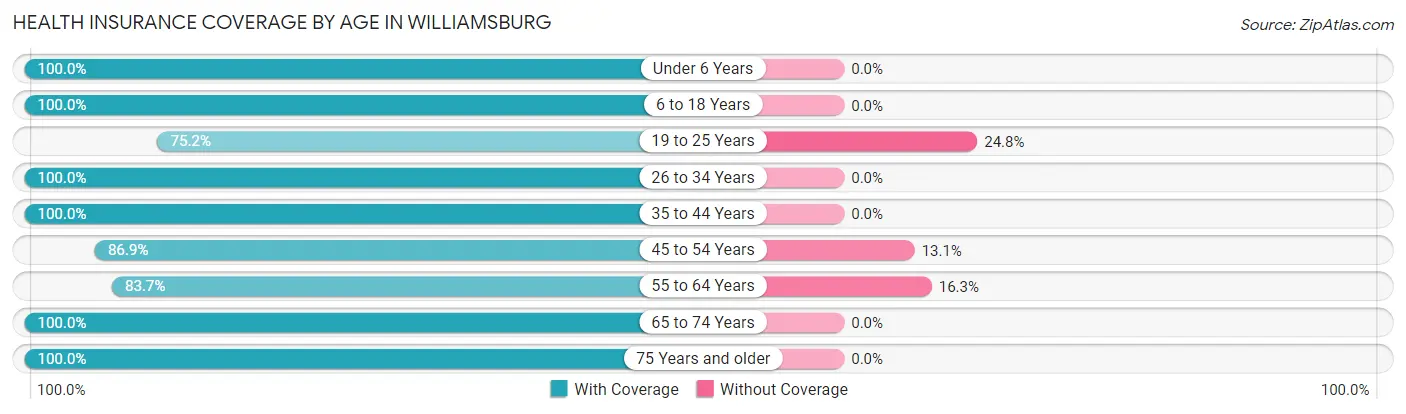
| Age Bracket | With Coverage | Without Coverage |
| Under 6 Years | 18 (100.0%) | 0 (0.0%) |
| 6 to 18 Years | 91 (100.0%) | 0 (0.0%) |
| 19 to 25 Years | 100 (75.2%) | 33 (24.8%) |
| 26 to 34 Years | 62 (100.0%) | 0 (0.0%) |
| 35 to 44 Years | 54 (100.0%) | 0 (0.0%) |
| 45 to 54 Years | 86 (86.9%) | 13 (13.1%) |
| 55 to 64 Years | 118 (83.7%) | 23 (16.3%) |
| 65 to 74 Years | 151 (100.0%) | 0 (0.0%) |
| 75 Years and older | 51 (100.0%) | 0 (0.0%) |
| Total | 731 (91.4%) | 69 (8.6%) |
Health Insurance Coverage by Citizenship Status in Williamsburg
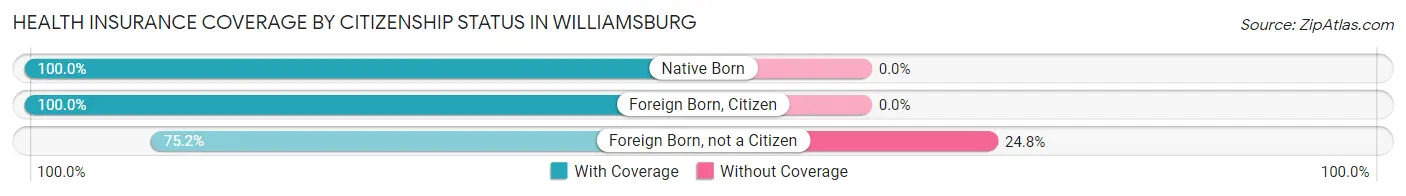
| Citizenship Status | With Coverage | Without Coverage |
| Native Born | 18 (100.0%) | 0 (0.0%) |
| Foreign Born, Citizen | 91 (100.0%) | 0 (0.0%) |
| Foreign Born, not a Citizen | 100 (75.2%) | 33 (24.8%) |
Health Insurance Coverage by Household Income in Williamsburg
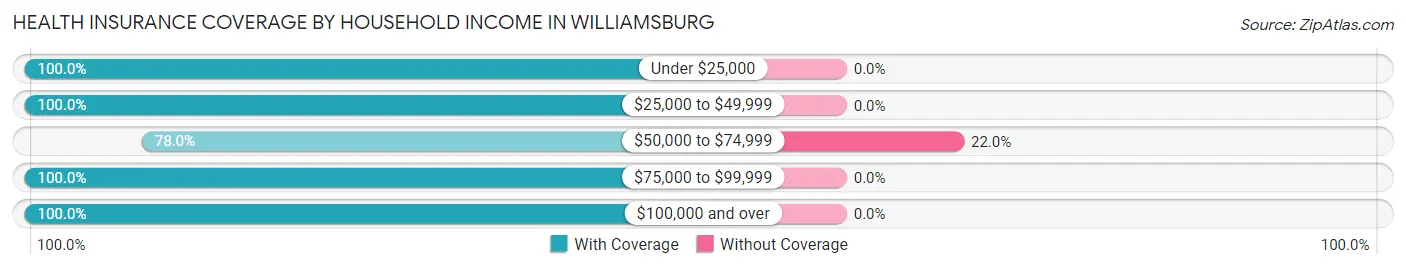
| Household Income | With Coverage | Without Coverage |
| Under $25,000 | 71 (100.0%) | 0 (0.0%) |
| $25,000 to $49,999 | 307 (100.0%) | 0 (0.0%) |
| $50,000 to $74,999 | 245 (78.0%) | 69 (22.0%) |
| $75,000 to $99,999 | 35 (100.0%) | 0 (0.0%) |
| $100,000 and over | 73 (100.0%) | 0 (0.0%) |
Public vs Private Health Insurance Coverage by Age in Williamsburg
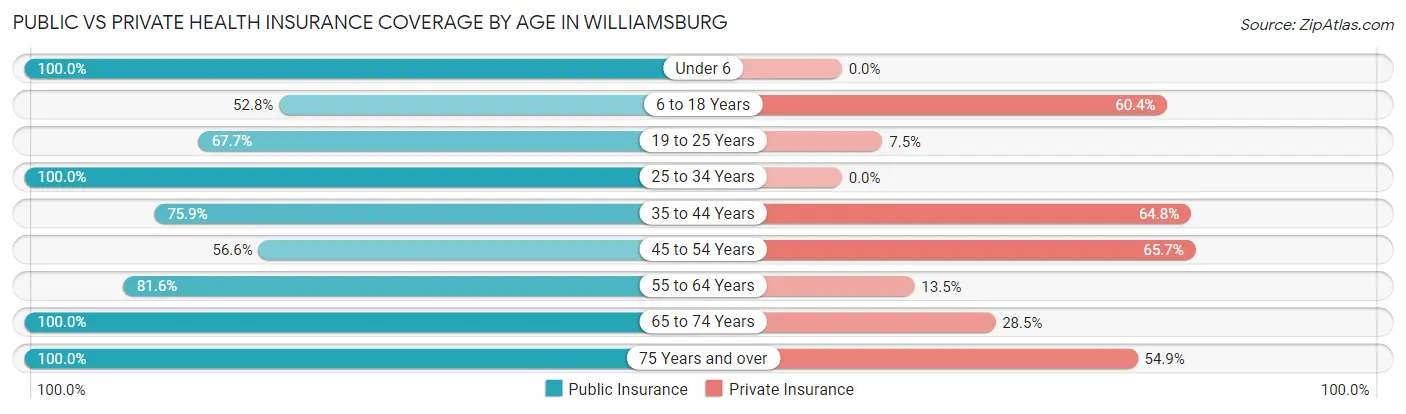
| Age Bracket | Public Insurance | Private Insurance |
| Under 6 | 18 (100.0%) | 0 (0.0%) |
| 6 to 18 Years | 48 (52.7%) | 55 (60.4%) |
| 19 to 25 Years | 90 (67.7%) | 10 (7.5%) |
| 25 to 34 Years | 62 (100.0%) | 0 (0.0%) |
| 35 to 44 Years | 41 (75.9%) | 35 (64.8%) |
| 45 to 54 Years | 56 (56.6%) | 65 (65.7%) |
| 55 to 64 Years | 115 (81.6%) | 19 (13.5%) |
| 65 to 74 Years | 151 (100.0%) | 43 (28.5%) |
| 75 Years and over | 51 (100.0%) | 28 (54.9%) |
| Total | 632 (79.0%) | 255 (31.9%) |
Disability Status by Sex by Age in Williamsburg
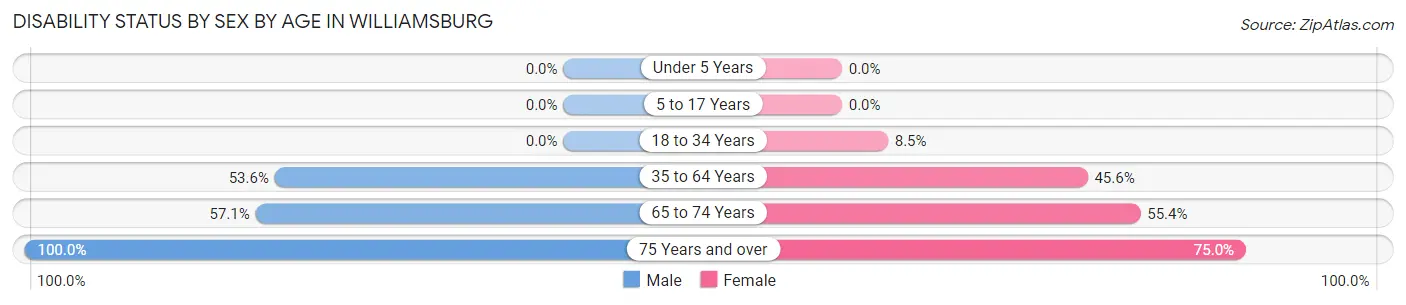
| Age Bracket | Male | Female |
| Under 5 Years | 0 (0.0%) | 0 (0.0%) |
| 5 to 17 Years | 0 (0.0%) | 0 (0.0%) |
| 18 to 34 Years | 0 (0.0%) | 14 (8.5%) |
| 35 to 64 Years | 60 (53.6%) | 83 (45.6%) |
| 65 to 74 Years | 44 (57.1%) | 41 (55.4%) |
| 75 Years and over | 23 (100.0%) | 21 (75.0%) |
Disability Class by Sex by Age in Williamsburg
Disability Class: Hearing Difficulty
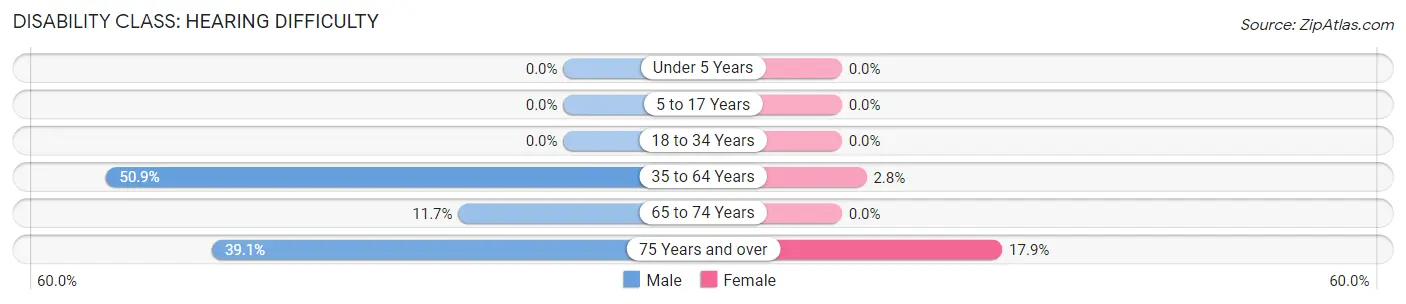
| Age Bracket | Male | Female |
| Under 5 Years | 0 (0.0%) | 0 (0.0%) |
| 5 to 17 Years | 0 (0.0%) | 0 (0.0%) |
| 18 to 34 Years | 0 (0.0%) | 0 (0.0%) |
| 35 to 64 Years | 57 (50.9%) | 5 (2.8%) |
| 65 to 74 Years | 9 (11.7%) | 0 (0.0%) |
| 75 Years and over | 9 (39.1%) | 5 (17.9%) |
Disability Class: Vision Difficulty
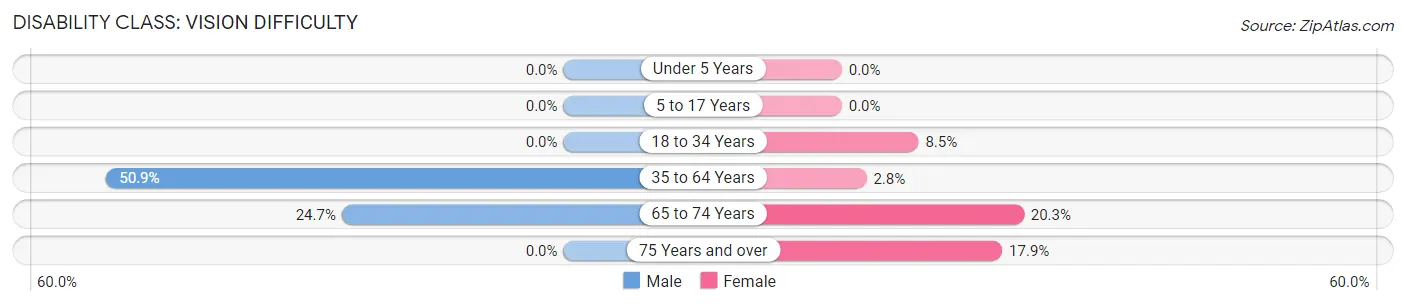
| Age Bracket | Male | Female |
| Under 5 Years | 0 (0.0%) | 0 (0.0%) |
| 5 to 17 Years | 0 (0.0%) | 0 (0.0%) |
| 18 to 34 Years | 0 (0.0%) | 14 (8.5%) |
| 35 to 64 Years | 57 (50.9%) | 5 (2.8%) |
| 65 to 74 Years | 19 (24.7%) | 15 (20.3%) |
| 75 Years and over | 0 (0.0%) | 5 (17.9%) |
Disability Class: Cognitive Difficulty
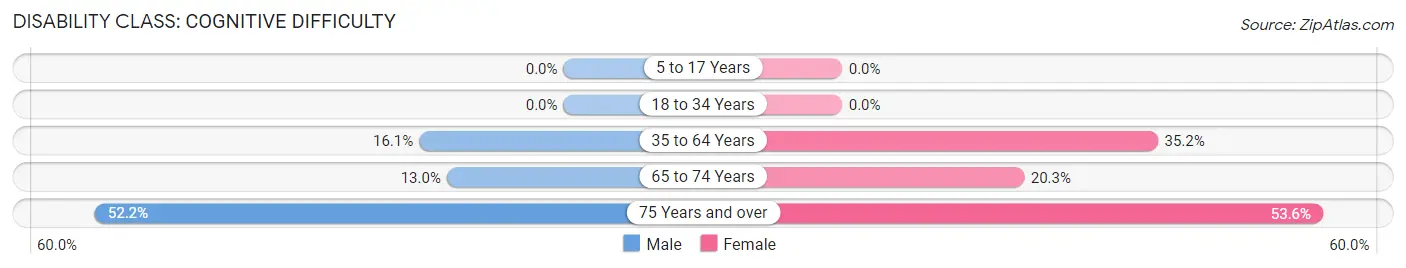
| Age Bracket | Male | Female |
| 5 to 17 Years | 0 (0.0%) | 0 (0.0%) |
| 18 to 34 Years | 0 (0.0%) | 0 (0.0%) |
| 35 to 64 Years | 18 (16.1%) | 64 (35.2%) |
| 65 to 74 Years | 10 (13.0%) | 15 (20.3%) |
| 75 Years and over | 12 (52.2%) | 15 (53.6%) |
Disability Class: Ambulatory Difficulty
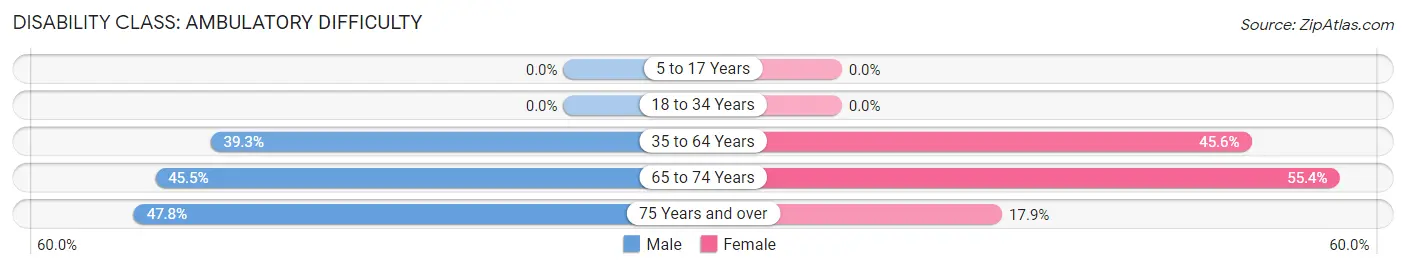
| Age Bracket | Male | Female |
| 5 to 17 Years | 0 (0.0%) | 0 (0.0%) |
| 18 to 34 Years | 0 (0.0%) | 0 (0.0%) |
| 35 to 64 Years | 44 (39.3%) | 83 (45.6%) |
| 65 to 74 Years | 35 (45.5%) | 41 (55.4%) |
| 75 Years and over | 11 (47.8%) | 5 (17.9%) |
Disability Class: Self-Care Difficulty
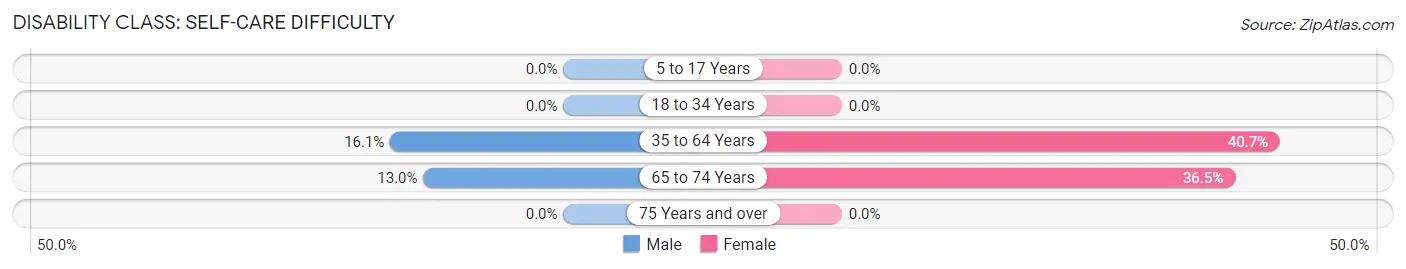
| Age Bracket | Male | Female |
| 5 to 17 Years | 0 (0.0%) | 0 (0.0%) |
| 18 to 34 Years | 0 (0.0%) | 0 (0.0%) |
| 35 to 64 Years | 18 (16.1%) | 74 (40.7%) |
| 65 to 74 Years | 10 (13.0%) | 27 (36.5%) |
| 75 Years and over | 0 (0.0%) | 0 (0.0%) |
Technology Access in Williamsburg
Computing Device Access in Williamsburg
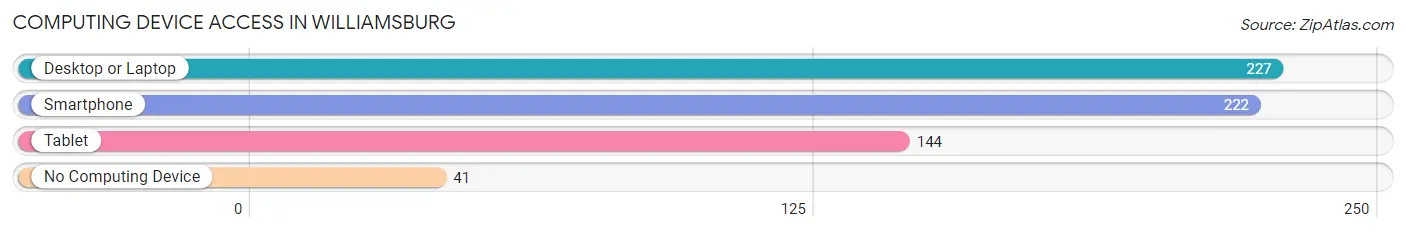
| Device Type | # Households | % Households |
| Desktop or Laptop | 227 | 79.1% |
| Smartphone | 222 | 77.3% |
| Tablet | 144 | 50.2% |
| No Computing Device | 41 | 14.3% |
| Total | 287 | 100.0% |
Internet Access in Williamsburg
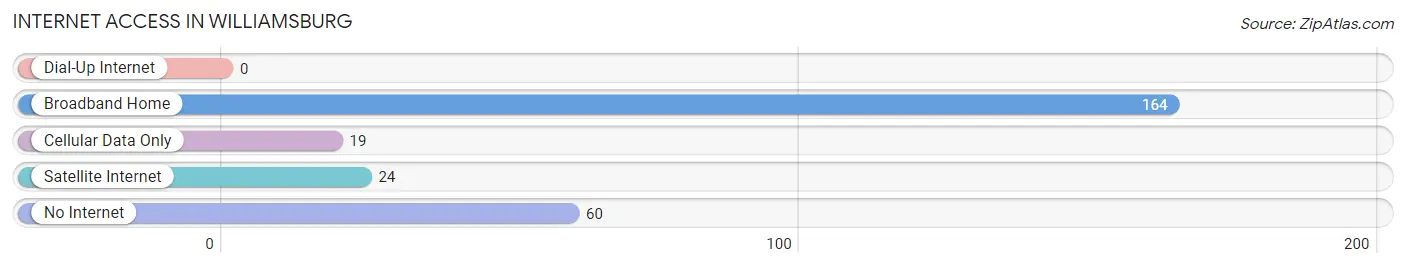
| Internet Type | # Households | % Households |
| Dial-Up Internet | 0 | 0.0% |
| Broadband Home | 164 | 57.1% |
| Cellular Data Only | 19 | 6.6% |
| Satellite Internet | 24 | 8.4% |
| No Internet | 60 | 20.9% |
| Total | 287 | 100.0% |
Williamsburg Summary
Williamsburg, New Mexico is a small unincorporated community located in the northeastern corner of the state. It is situated in the foothills of the Sangre de Cristo Mountains, approximately 25 miles east of Santa Fe. The town is home to a population of approximately 200 people, and is known for its rural charm and scenic beauty.
History
The area that is now Williamsburg was first settled in the late 1800s by a group of homesteaders from the Midwest. The town was originally called “Rio Grande”, but was later renamed “Williamsburg” in honor of the first postmaster, William B. Williams. The town was officially incorporated in 1909, and the first post office was established in 1910.
In the early 1900s, Williamsburg was a thriving agricultural community, with a variety of crops being grown in the area. The town was also home to a number of small businesses, including a general store, a blacksmith shop, and a saloon.
Geography
Williamsburg is located in the northeastern corner of New Mexico, in the foothills of the Sangre de Cristo Mountains. The town is situated at an elevation of 6,400 feet, and is surrounded by rolling hills and lush forests. The Rio Grande River runs through the area, providing a source of water for the town and its surrounding farms.
The climate in Williamsburg is semi-arid, with hot summers and cold winters. The average annual temperature is approximately 50 degrees Fahrenheit, and the average annual precipitation is approximately 12 inches.
Economy
The economy of Williamsburg is largely based on agriculture and tourism. The town is home to a number of small farms, which produce a variety of crops, including alfalfa, hay, and corn. The town is also home to a number of small businesses, including a general store, a restaurant, and a gas station.
Tourism is an important part of the local economy, as the town is a popular destination for outdoor enthusiasts. The area is home to a number of hiking trails, fishing spots, and camping sites. The town is also home to a number of historic sites, including the Williamsburg Cemetery and the Williamsburg Church.
Demographics
As of the 2010 census, the population of Williamsburg was approximately 200 people. The racial makeup of the town was 95.5% White, 0.5% African American, 0.5% Native American, 0.5% Asian, and 3% from other races. The median household income was $31,250, and the median age was 44.
Conclusion
Williamsburg, New Mexico is a small unincorporated community located in the northeastern corner of the state. It is situated in the foothills of the Sangre de Cristo Mountains, and is home to a population of approximately 200 people. The town is known for its rural charm and scenic beauty, and its economy is largely based on agriculture and tourism. The town is also home to a number of historic sites, and is a popular destination for outdoor enthusiasts.
Common Questions
What is Per Capita Income in Williamsburg?
Per Capita income in Williamsburg is $20,259.
What is the Median Family Income in Williamsburg?
Median Family Income in Williamsburg is $52,989.
What is the Median Household income in Williamsburg?
Median Household Income in Williamsburg is $36,354.
What is Income or Wage Gap in Williamsburg?
Income or Wage Gap in Williamsburg is 46.4%.
Women in Williamsburg earn 53.6 cents for every dollar earned by a man.
What is Inequality or Gini Index in Williamsburg?
Inequality or Gini Index in Williamsburg is 0.33.
What is the Total Population of Williamsburg?
Total Population of Williamsburg is 800.
What is the Total Male Population of Williamsburg?
Total Male Population of Williamsburg is 319.
What is the Total Female Population of Williamsburg?
Total Female Population of Williamsburg is 481.
What is the Ratio of Males per 100 Females in Williamsburg?
There are 66.32 Males per 100 Females in Williamsburg.
What is the Ratio of Females per 100 Males in Williamsburg?
There are 150.78 Females per 100 Males in Williamsburg.
What is the Median Population Age in Williamsburg?
Median Population Age in Williamsburg is 50.5 Years.
What is the Average Family Size in Williamsburg
Average Family Size in Williamsburg is 4.8 People.
What is the Average Household Size in Williamsburg
Average Household Size in Williamsburg is 2.8 People.
How Large is the Labor Force in Williamsburg?
There are 388 People in the Labor Forcein in Williamsburg.
What is the Percentage of People in the Labor Force in Williamsburg?
51.9% of People are in the Labor Force in Williamsburg.
What is the Unemployment Rate in Williamsburg?
Unemployment Rate in Williamsburg is 8.0%.