Fifth Street, TX Map & Demographics
Fifth Street Map
Fifth Street Overview
$9,976
PER CAPITA INCOME
$39,223
AVG FAMILY INCOME
$38,539
AVG HOUSEHOLD INCOME
38.7%
WAGE / INCOME GAP [ % ]
61.3¢/ $1
WAGE / INCOME GAP [ $ ]
0.24
INEQUALITY / GINI INDEX
1,523
TOTAL POPULATION
772
MALE POPULATION
751
FEMALE POPULATION
102.80
MALES / 100 FEMALES
97.28
FEMALES / 100 MALES
17.9
MEDIAN AGE
3.3
AVG FAMILY SIZE
3.4
AVG HOUSEHOLD SIZE
441
LABOR FORCE [ PEOPLE ]
56.5%
PERCENT IN LABOR FORCE
Income in Fifth Street
Income Overview in Fifth Street
Per Capita Income in Fifth Street is $9,976, while median incomes of families and households are $39,223 and $38,539 respectively.
| Characteristic | Number | Measure |
| Per Capita Income | 1,523 | $9,976 |
| Median Family Income | 366 | $39,223 |
| Mean Family Income | 366 | $38,201 |
| Median Household Income | 447 | $38,539 |
| Mean Household Income | 447 | $33,523 |
| Income Deficit | 366 | $0 |
| Wage / Income Gap (%) | 1,523 | 38.70% |
| Wage / Income Gap ($) | 1,523 | 61.30¢ per $1 |
| Gini / Inequality Index | 1,523 | 0.24 |
Earnings by Sex in Fifth Street
Average Earnings in Fifth Street are $37,644, $23,838 for men and $38,885 for women, a difference of 38.7%.
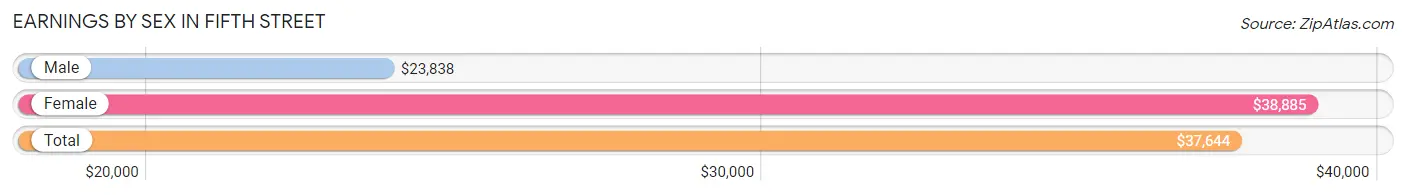
| Sex | Number | Average Earnings |
| Male | 189 (40.6%) | $23,838 |
| Female | 276 (59.4%) | $38,885 |
| Total | 465 (100.0%) | $37,644 |
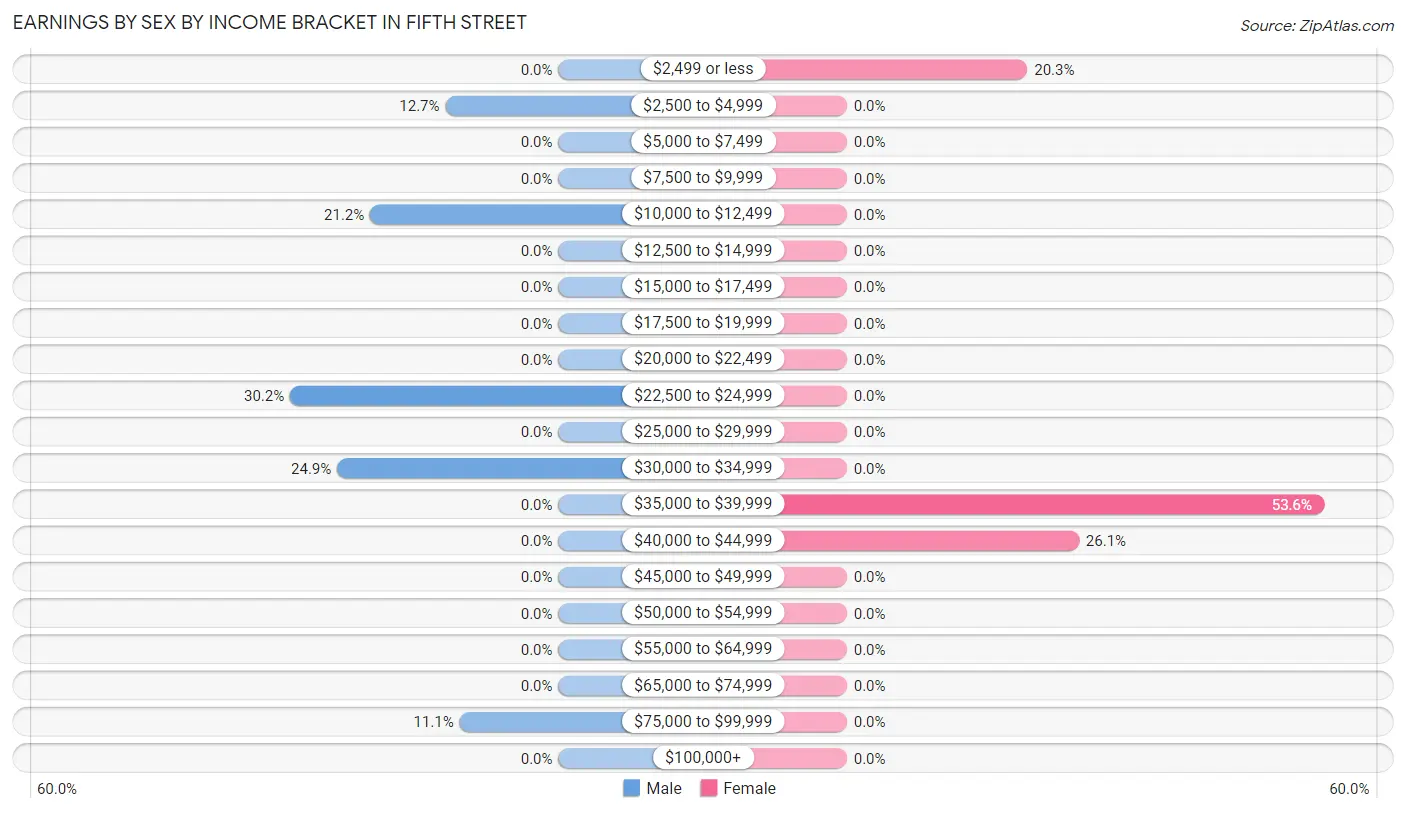
Earnings by Sex by Income Bracket in Fifth Street
The most common earnings brackets in Fifth Street are $22,500 to $24,999 for men (57 | 30.2%) and $35,000 to $39,999 for women (148 | 53.6%).
| Income | Male | Female |
| $2,499 or less | 0 (0.0%) | 56 (20.3%) |
| $2,500 to $4,999 | 24 (12.7%) | 0 (0.0%) |
| $5,000 to $7,499 | 0 (0.0%) | 0 (0.0%) |
| $7,500 to $9,999 | 0 (0.0%) | 0 (0.0%) |
| $10,000 to $12,499 | 40 (21.2%) | 0 (0.0%) |
| $12,500 to $14,999 | 0 (0.0%) | 0 (0.0%) |
| $15,000 to $17,499 | 0 (0.0%) | 0 (0.0%) |
| $17,500 to $19,999 | 0 (0.0%) | 0 (0.0%) |
| $20,000 to $22,499 | 0 (0.0%) | 0 (0.0%) |
| $22,500 to $24,999 | 57 (30.2%) | 0 (0.0%) |
| $25,000 to $29,999 | 0 (0.0%) | 0 (0.0%) |
| $30,000 to $34,999 | 47 (24.9%) | 0 (0.0%) |
| $35,000 to $39,999 | 0 (0.0%) | 148 (53.6%) |
| $40,000 to $44,999 | 0 (0.0%) | 72 (26.1%) |
| $45,000 to $49,999 | 0 (0.0%) | 0 (0.0%) |
| $50,000 to $54,999 | 0 (0.0%) | 0 (0.0%) |
| $55,000 to $64,999 | 0 (0.0%) | 0 (0.0%) |
| $65,000 to $74,999 | 0 (0.0%) | 0 (0.0%) |
| $75,000 to $99,999 | 21 (11.1%) | 0 (0.0%) |
| $100,000+ | 0 (0.0%) | 0 (0.0%) |
| Total | 189 (100.0%) | 276 (100.0%) |
Earnings by Sex by Educational Attainment in Fifth Street
| Educational Attainment | Male Income | Female Income |
| Less than High School | - | - |
| High School Diploma | - | - |
| College or Associate's Degree | - | - |
| Bachelor's Degree | - | - |
| Graduate Degree | - | - |
| Total | $24,715 | $0 |
Family Income in Fifth Street
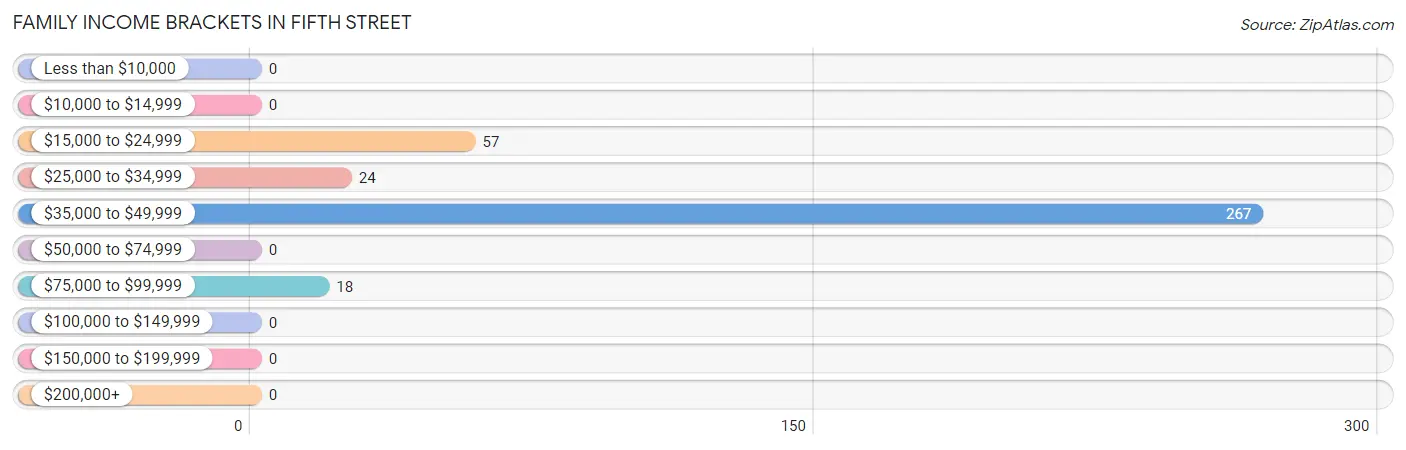
Family Income Brackets in Fifth Street
According to the Fifth Street family income data, there are 267 families falling into the $35,000 to $49,999 income range, which is the most common income bracket and makes up 73.0% of all families.
| Income Bracket | # Families | % Families |
| Less than $10,000 | 0 | 0.0% |
| $10,000 to $14,999 | 0 | 0.0% |
| $15,000 to $24,999 | 57 | 15.6% |
| $25,000 to $34,999 | 24 | 6.6% |
| $35,000 to $49,999 | 267 | 73.0% |
| $50,000 to $74,999 | 0 | 0.0% |
| $75,000 to $99,999 | 18 | 4.9% |
| $100,000 to $149,999 | 0 | 0.0% |
| $150,000 to $199,999 | 0 | 0.0% |
| $200,000+ | 0 | 0.0% |
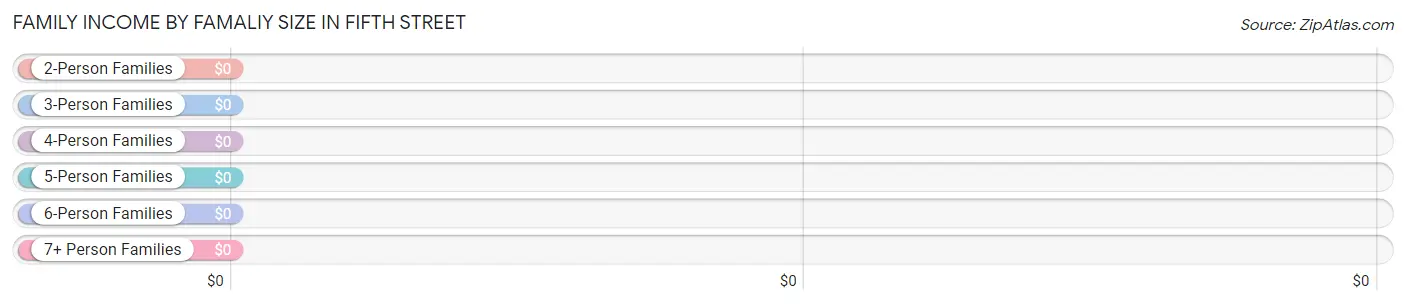
Family Income by Famaliy Size in Fifth Street
| Income Bracket | # Families | Median Income |
| 2-Person Families | 153 (41.8%) | $0 |
| 3-Person Families | 148 (40.4%) | $0 |
| 4-Person Families | 0 (0.0%) | $0 |
| 5-Person Families | 65 (17.8%) | $0 |
| 6-Person Families | 0 (0.0%) | $0 |
| 7+ Person Families | 0 (0.0%) | $0 |
| Total | 366 (100.0%) | $39,223 |
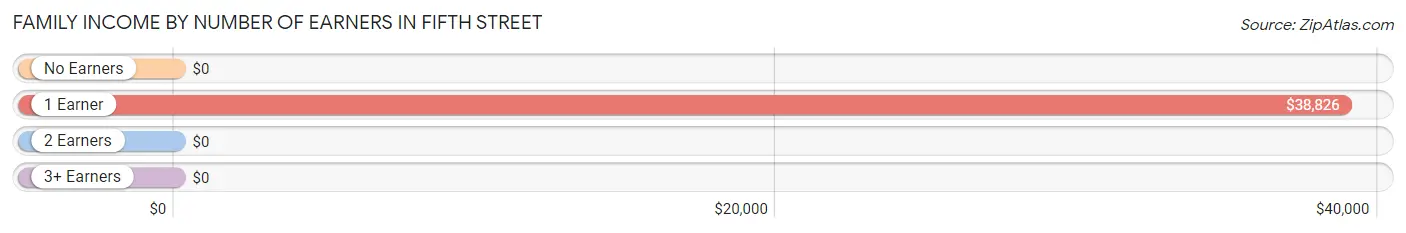
Family Income by Number of Earners in Fifth Street
| Number of Earners | # Families | Median Income |
| No Earners | 0 (0.0%) | $0 |
| 1 Earner | 319 (87.2%) | $38,826 |
| 2 Earners | 47 (12.8%) | $0 |
| 3+ Earners | 0 (0.0%) | $0 |
| Total | 366 (100.0%) | $39,223 |
Household Income in Fifth Street
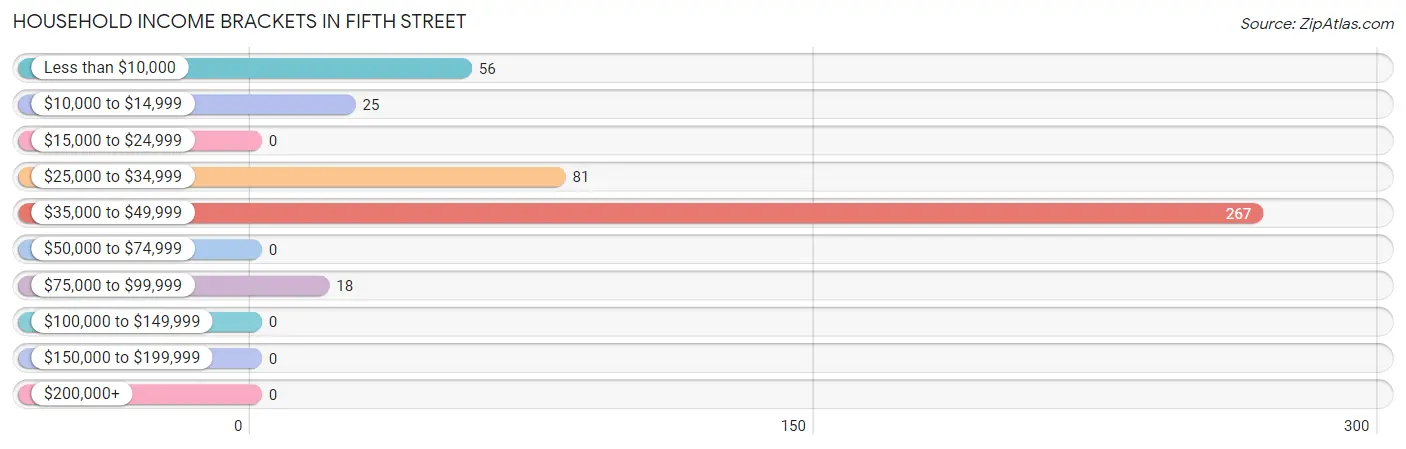
Household Income Brackets in Fifth Street
With 267 households falling in the category, the $35,000 to $49,999 income range is the most frequent in Fifth Street, accounting for 59.7% of all households.
| Income Bracket | # Households | % Households |
| Less than $10,000 | 56 | 12.5% |
| $10,000 to $14,999 | 25 | 5.6% |
| $15,000 to $24,999 | 0 | 0.0% |
| $25,000 to $34,999 | 81 | 18.1% |
| $35,000 to $49,999 | 267 | 59.7% |
| $50,000 to $74,999 | 0 | 0.0% |
| $75,000 to $99,999 | 18 | 4.0% |
| $100,000 to $149,999 | 0 | 0.0% |
| $150,000 to $199,999 | 0 | 0.0% |
| $200,000+ | 0 | 0.0% |
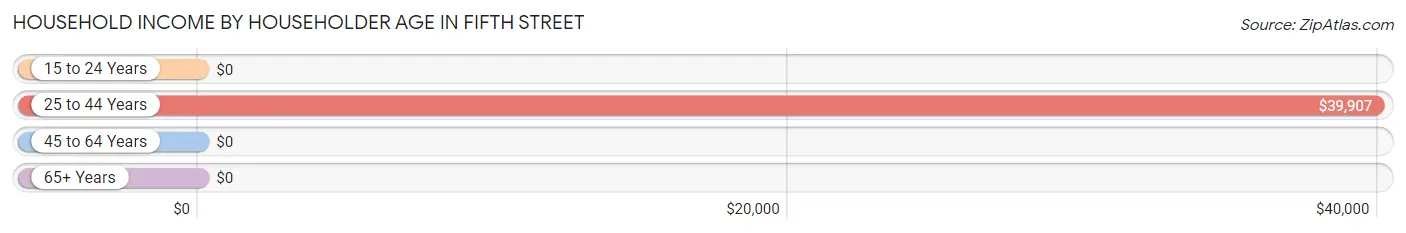
Household Income by Householder Age in Fifth Street
The median household income in Fifth Street is $38,539, with the highest median household income of $39,907 found in the 25 to 44 years age bracket for the primary householder. A total of 285 households (63.8%) fall into this category. Meanwhile, the 15 to 24 years age bracket for the primary householder has the lowest median household income of $0, with 56 households (12.5%) in this group.
| Income Bracket | # Households | Median Income |
| 15 to 24 Years | 56 (12.5%) | $0 |
| 25 to 44 Years | 285 (63.8%) | $39,907 |
| 45 to 64 Years | 81 (18.1%) | $0 |
| 65+ Years | 25 (5.6%) | $0 |
| Total | 447 (100.0%) | $38,539 |
Poverty in Fifth Street
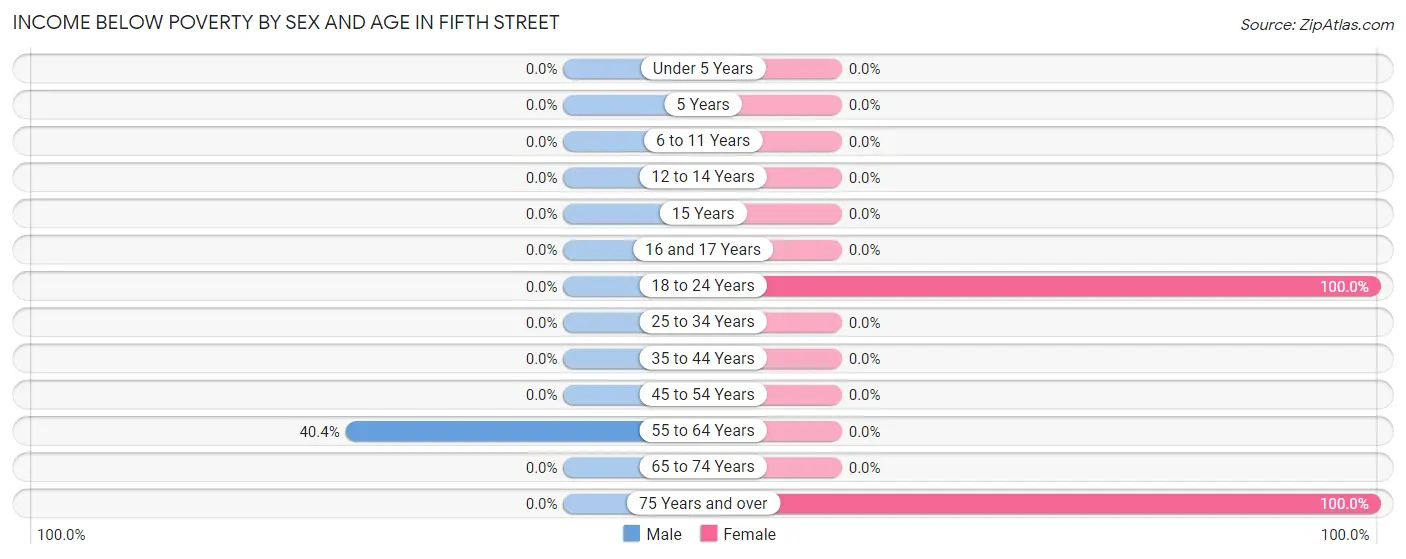
Income Below Poverty by Sex and Age in Fifth Street
With 7.1% poverty level for males and 14.0% for females among the residents of Fifth Street, 55 to 64 year old males and 18 to 24 year old females are the most vulnerable to poverty, with 55 males (40.4%) and 56 females (100.0%) in their respective age groups living below the poverty level.
| Age Bracket | Male | Female |
| Under 5 Years | 0 (0.0%) | 0 (0.0%) |
| 5 Years | 0 (0.0%) | 0 (0.0%) |
| 6 to 11 Years | 0 (0.0%) | 0 (0.0%) |
| 12 to 14 Years | 0 (0.0%) | 0 (0.0%) |
| 15 Years | 0 (0.0%) | 0 (0.0%) |
| 16 and 17 Years | 0 (0.0%) | 0 (0.0%) |
| 18 to 24 Years | 0 (0.0%) | 56 (100.0%) |
| 25 to 34 Years | 0 (0.0%) | 0 (0.0%) |
| 35 to 44 Years | 0 (0.0%) | 0 (0.0%) |
| 45 to 54 Years | 0 (0.0%) | 0 (0.0%) |
| 55 to 64 Years | 55 (40.4%) | 0 (0.0%) |
| 65 to 74 Years | 0 (0.0%) | 0 (0.0%) |
| 75 Years and over | 0 (0.0%) | 25 (100.0%) |
| Total | 55 (7.1%) | 81 (14.0%) |
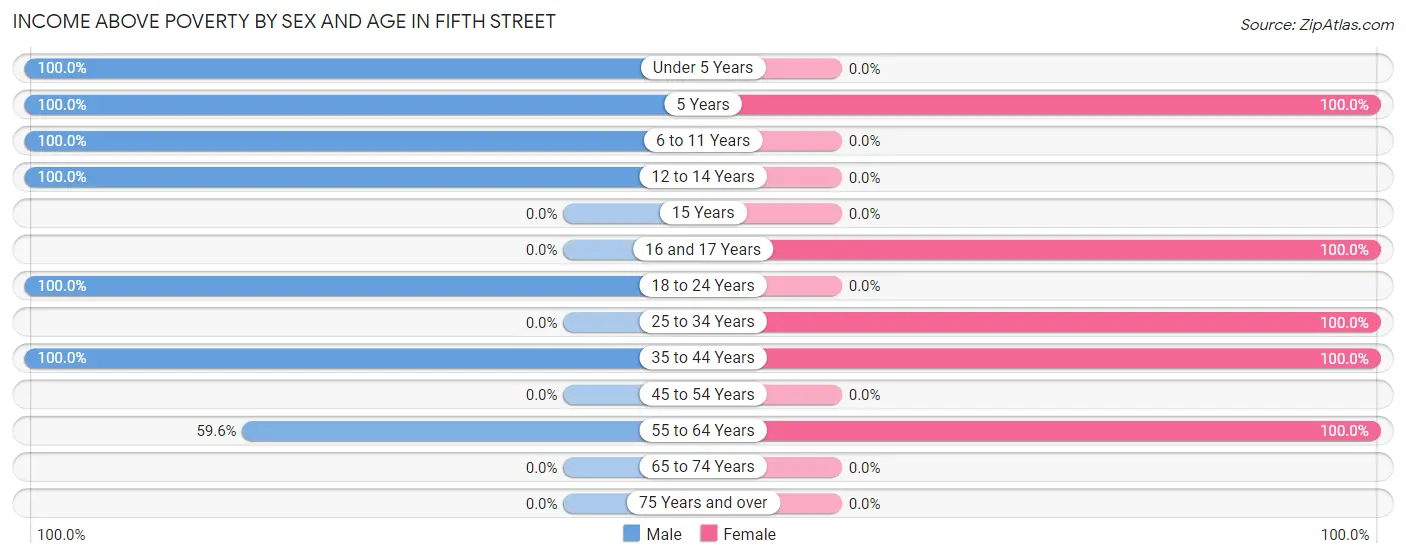
Income Above Poverty by Sex and Age in Fifth Street
According to the poverty statistics in Fifth Street, males aged under 5 years and females aged 5 years are the age groups that are most secure financially, with 100.0% of males and 100.0% of females in these age groups living above the poverty line.
| Age Bracket | Male | Female |
| Under 5 Years | 73 (100.0%) | 0 (0.0%) |
| 5 Years | 182 (100.0%) | 42 (100.0%) |
| 6 to 11 Years | 252 (100.0%) | 0 (0.0%) |
| 12 to 14 Years | 21 (100.0%) | 0 (0.0%) |
| 15 Years | 0 (0.0%) | 0 (0.0%) |
| 16 and 17 Years | 0 (0.0%) | 20 (100.0%) |
| 18 to 24 Years | 40 (100.0%) | 0 (0.0%) |
| 25 to 34 Years | 0 (0.0%) | 72 (100.0%) |
| 35 to 44 Years | 68 (100.0%) | 208 (100.0%) |
| 45 to 54 Years | 0 (0.0%) | 0 (0.0%) |
| 55 to 64 Years | 81 (59.6%) | 155 (100.0%) |
| 65 to 74 Years | 0 (0.0%) | 0 (0.0%) |
| 75 Years and over | 0 (0.0%) | 0 (0.0%) |
| Total | 717 (92.9%) | 497 (86.0%) |
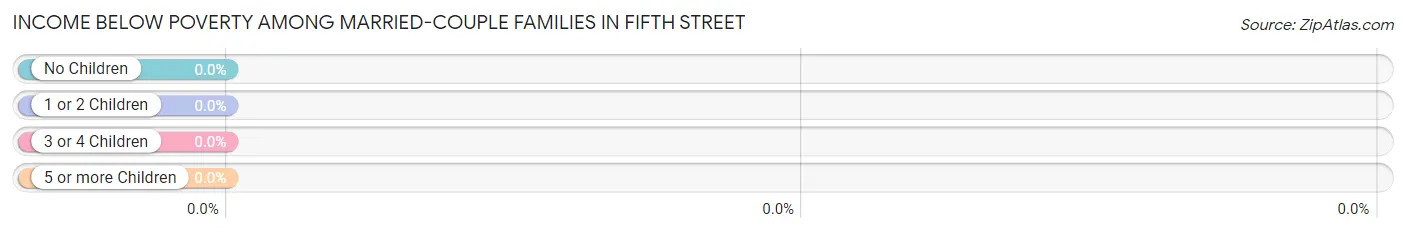
Income Below Poverty Among Married-Couple Families in Fifth Street
| Children | Above Poverty | Below Poverty |
| No Children | 81 (100.0%) | 0 (0.0%) |
| 1 or 2 Children | 47 (100.0%) | 0 (0.0%) |
| 3 or 4 Children | 18 (100.0%) | 0 (0.0%) |
| 5 or more Children | 0 (0.0%) | 0 (0.0%) |
| Total | 146 (100.0%) | 0 (0.0%) |
Income Below Poverty Among Single-Parent Households in Fifth Street
| Children | Single Father | Single Mother |
| No Children | 0 (0.0%) | 0 (0.0%) |
| 1 or 2 Children | 0 (0.0%) | 0 (0.0%) |
| 3 or 4 Children | 0 (0.0%) | 0 (0.0%) |
| 5 or more Children | 0 (0.0%) | 0 (0.0%) |
| Total | 0 (0.0%) | 0 (0.0%) |
Income Below Poverty Among Married-Couple vs Single-Parent Households in Fifth Street
| Children | Married-Couple Families | Single-Parent Households |
| No Children | 0 (0.0%) | 0 (0.0%) |
| 1 or 2 Children | 0 (0.0%) | 0 (0.0%) |
| 3 or 4 Children | 0 (0.0%) | 0 (0.0%) |
| 5 or more Children | 0 (0.0%) | 0 (0.0%) |
| Total | 0 (0.0%) | 0 (0.0%) |
Race in Fifth Street
The most populous races in Fifth Street are Hispanic or Latino (1,321 | 86.7%), White / Caucasian (625 | 41.0%), and Two or more Races (407 | 26.7%).
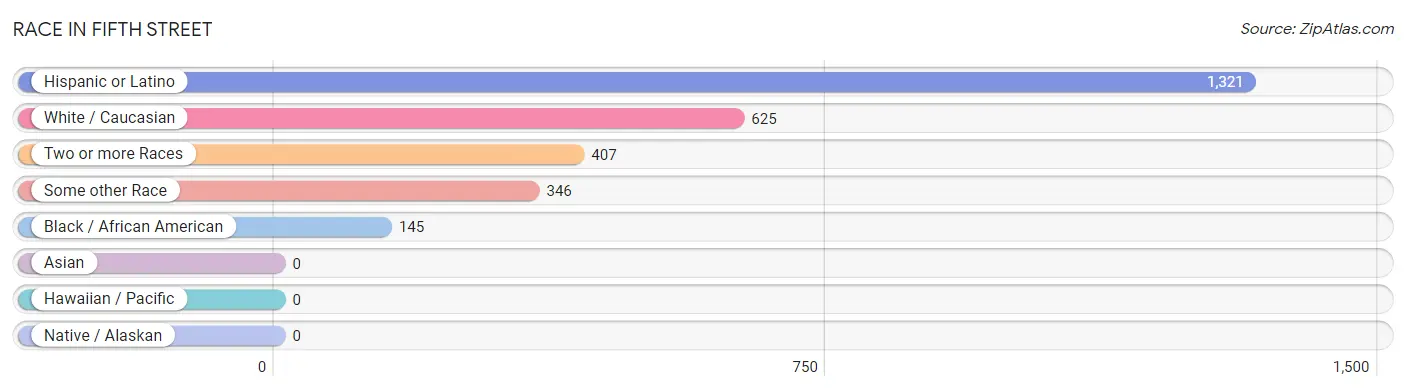
| Race | # Population | % Population |
| Asian | 0 | 0.0% |
| Black / African American | 145 | 9.5% |
| Hawaiian / Pacific | 0 | 0.0% |
| Hispanic or Latino | 1,321 | 86.7% |
| Native / Alaskan | 0 | 0.0% |
| White / Caucasian | 625 | 41.0% |
| Two or more Races | 407 | 26.7% |
| Some other Race | 346 | 22.7% |
| Total | 1,523 | 100.0% |
Ancestry in Fifth Street
The most populous ancestries reported in Fifth Street are Mexican (1,173 | 77.0%), American (151 | 9.9%), Central American (148 | 9.7%), Salvadoran (148 | 9.7%), and German (24 | 1.6%), together accounting for 107.9% of all Fifth Street residents.
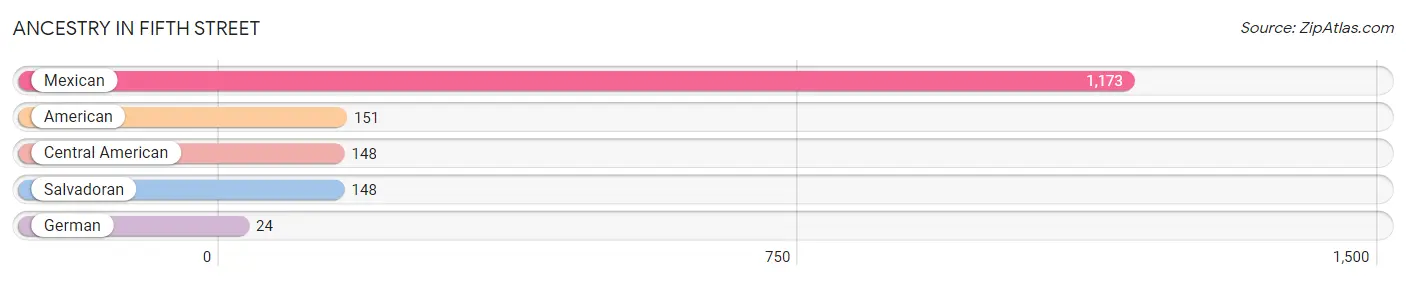
| Ancestry | # Population | % Population |
| American | 151 | 9.9% |
| Central American | 148 | 9.7% |
| German | 24 | 1.6% |
| Mexican | 1,173 | 77.0% |
| Salvadoran | 148 | 9.7% | View All 5 Rows |
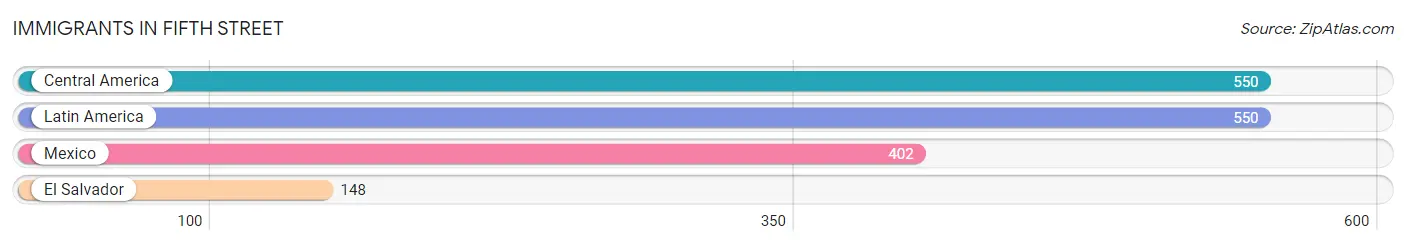
Immigrants in Fifth Street
The most numerous immigrant groups reported in Fifth Street came from Central America (550 | 36.1%), Latin America (550 | 36.1%), Mexico (402 | 26.4%), and El Salvador (148 | 9.7%), together accounting for 108.3% of all Fifth Street residents.
| Immigration Origin | # Population | % Population |
| Central America | 550 | 36.1% |
| El Salvador | 148 | 9.7% |
| Latin America | 550 | 36.1% |
| Mexico | 402 | 26.4% | View All 4 Rows |
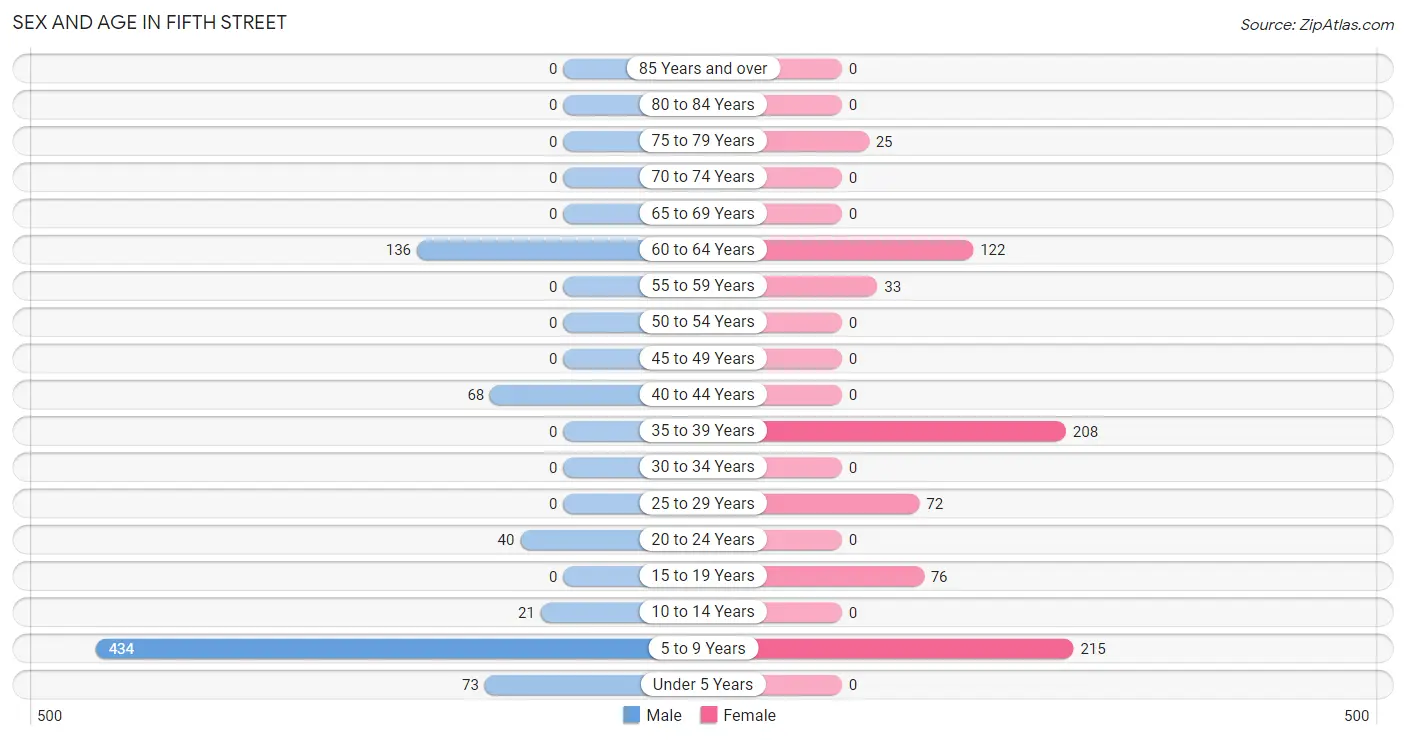
Sex and Age in Fifth Street
Sex and Age in Fifth Street
The most populous age groups in Fifth Street are 5 to 9 Years (434 | 56.2%) for men and 5 to 9 Years (215 | 28.6%) for women.
| Age Bracket | Male | Female |
| Under 5 Years | 73 (9.5%) | 0 (0.0%) |
| 5 to 9 Years | 434 (56.2%) | 215 (28.6%) |
| 10 to 14 Years | 21 (2.7%) | 0 (0.0%) |
| 15 to 19 Years | 0 (0.0%) | 76 (10.1%) |
| 20 to 24 Years | 40 (5.2%) | 0 (0.0%) |
| 25 to 29 Years | 0 (0.0%) | 72 (9.6%) |
| 30 to 34 Years | 0 (0.0%) | 0 (0.0%) |
| 35 to 39 Years | 0 (0.0%) | 208 (27.7%) |
| 40 to 44 Years | 68 (8.8%) | 0 (0.0%) |
| 45 to 49 Years | 0 (0.0%) | 0 (0.0%) |
| 50 to 54 Years | 0 (0.0%) | 0 (0.0%) |
| 55 to 59 Years | 0 (0.0%) | 33 (4.4%) |
| 60 to 64 Years | 136 (17.6%) | 122 (16.3%) |
| 65 to 69 Years | 0 (0.0%) | 0 (0.0%) |
| 70 to 74 Years | 0 (0.0%) | 0 (0.0%) |
| 75 to 79 Years | 0 (0.0%) | 25 (3.3%) |
| 80 to 84 Years | 0 (0.0%) | 0 (0.0%) |
| 85 Years and over | 0 (0.0%) | 0 (0.0%) |
| Total | 772 (100.0%) | 751 (100.0%) |
Families and Households in Fifth Street
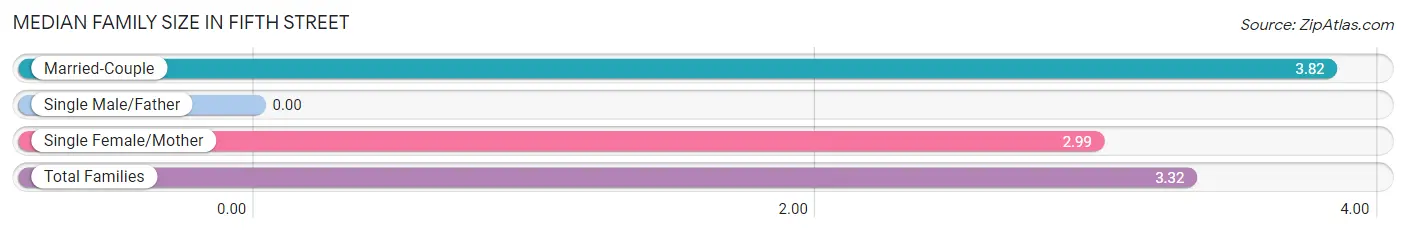
Median Family Size in Fifth Street
| Family Type | # Families | Family Size |
| Married-Couple | 146 (39.9%) | 3.82 |
| Single Male/Father | 0 (0.0%) | - |
| Single Female/Mother | 220 (60.1%) | 2.99 |
| Total Families | 366 (100.0%) | 3.32 |
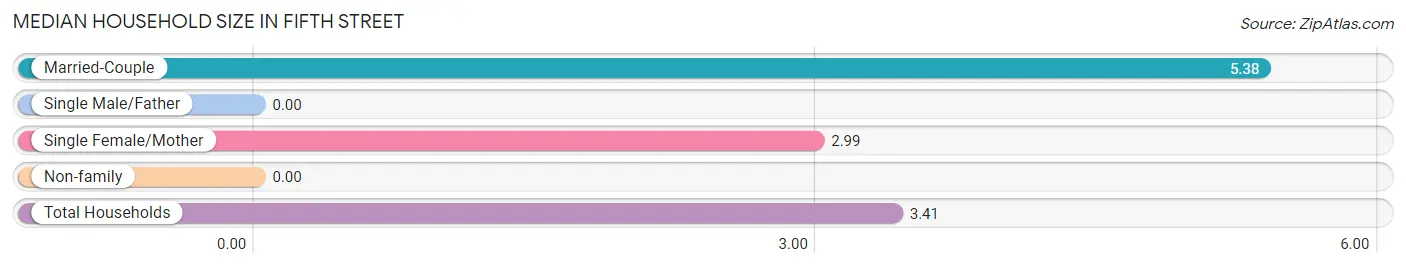
Median Household Size in Fifth Street
| Household Type | # Households | Household Size |
| Married-Couple | 146 (32.7%) | 5.38 |
| Single Male/Father | 0 (0.0%) | - |
| Single Female/Mother | 220 (49.2%) | 2.99 |
| Non-family | 81 (18.1%) | - |
| Total Households | 447 (100.0%) | 3.41 |
Household Size by Marriage Status in Fifth Street
Out of a total of 447 households in Fifth Street, 366 (81.9%) are family households, while 81 (18.1%) are nonfamily households. The most numerous type of family households are 3-person households, comprising 148, and the most common type of nonfamily households are 1-person households, comprising 81.
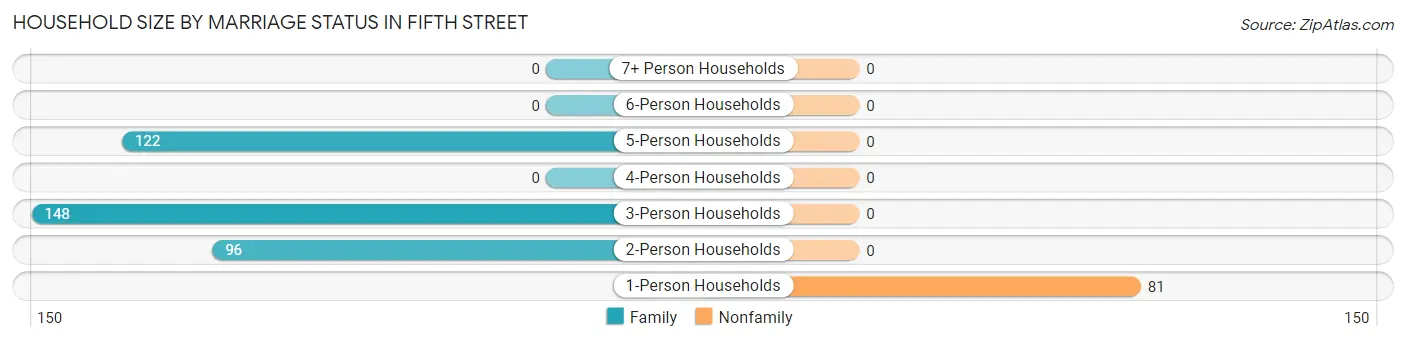
| Household Size | Family Households | Nonfamily Households |
| 1-Person Households | - | 81 (18.1%) |
| 2-Person Households | 96 (21.5%) | 0 (0.0%) |
| 3-Person Households | 148 (33.1%) | 0 (0.0%) |
| 4-Person Households | 0 (0.0%) | 0 (0.0%) |
| 5-Person Households | 122 (27.3%) | 0 (0.0%) |
| 6-Person Households | 0 (0.0%) | 0 (0.0%) |
| 7+ Person Households | 0 (0.0%) | 0 (0.0%) |
| Total | 366 (81.9%) | 81 (18.1%) |
Female Fertility in Fifth Street
Fertility by Age in Fifth Street
| Age Bracket | Women with Births | Births / 1,000 Women |
| 15 to 19 years | 0 (0.0%) | 0.0 |
| 20 to 34 years | 0 (0.0%) | 0.0 |
| 35 to 50 years | 0 (0.0%) | 0.0 |
| Total | 0 (0.0%) | 0.0 |
Fertility by Age by Marriage Status in Fifth Street

| Age Bracket | Married | Unmarried |
| 15 to 19 years | 0 (0.0%) | 0 (0.0%) |
| 20 to 34 years | 0 (0.0%) | 0 (0.0%) |
| 35 to 50 years | 0 (0.0%) | 0 (0.0%) |
| Total | 0 (0.0%) | 0 (0.0%) |
Fertility by Education in Fifth Street
| Educational Attainment | Women with Births | Births / 1,000 Women |
| Less than High School | 0 (0.0%) | 0.0 |
| High School Diploma | 0 (0.0%) | 0.0 |
| College or Associate's Degree | 0 (0.0%) | 0.0 |
| Bachelor's Degree | 0 (0.0%) | 0.0 |
| Graduate Degree | 0 (0.0%) | 0.0 |
| Total | 0 (0.0%) | 0.0 |
Fertility by Education by Marriage Status in Fifth Street
| Educational Attainment | Married | Unmarried |
| Less than High School | 0 (0.0%) | 0 (0.0%) |
| High School Diploma | 0 (0.0%) | 0 (0.0%) |
| College or Associate's Degree | 0 (0.0%) | 0 (0.0%) |
| Bachelor's Degree | 0 (0.0%) | 0 (0.0%) |
| Graduate Degree | 0 (0.0%) | 0 (0.0%) |
| Total | 0 (0.0%) | 0 (0.0%) |
Employment Characteristics in Fifth Street
Employment by Class of Employer in Fifth Street
Among the 441 employed individuals in Fifth Street, private company employees (348 | 78.9%), and self-employed (not incorporated) (93 | 21.1%) make up the most common classes of employment.
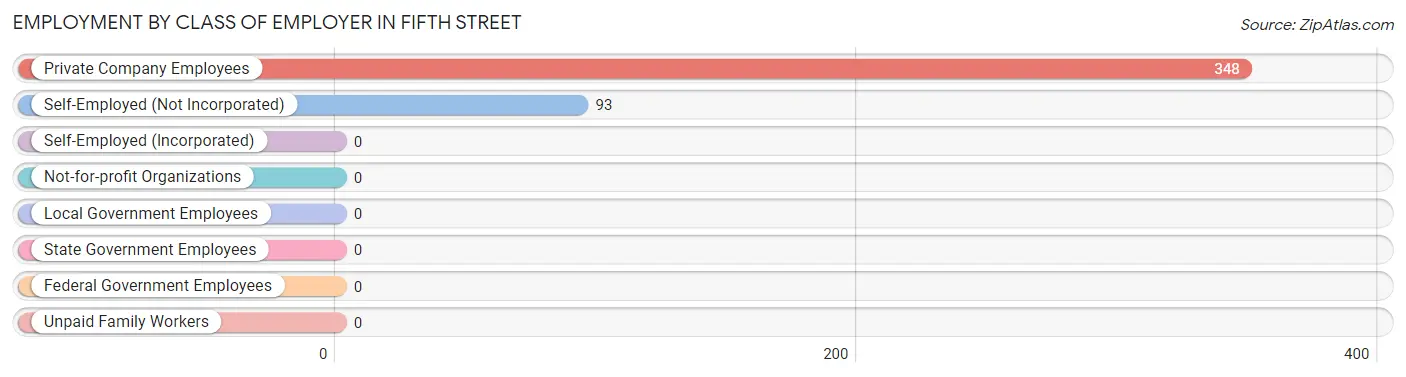
| Employer Class | # Employees | % Employees |
| Private Company Employees | 348 | 78.9% |
| Self-Employed (Incorporated) | 0 | 0.0% |
| Self-Employed (Not Incorporated) | 93 | 21.1% |
| Not-for-profit Organizations | 0 | 0.0% |
| Local Government Employees | 0 | 0.0% |
| State Government Employees | 0 | 0.0% |
| Federal Government Employees | 0 | 0.0% |
| Unpaid Family Workers | 0 | 0.0% |
| Total | 441 | 100.0% |
Employment Status by Age in Fifth Street
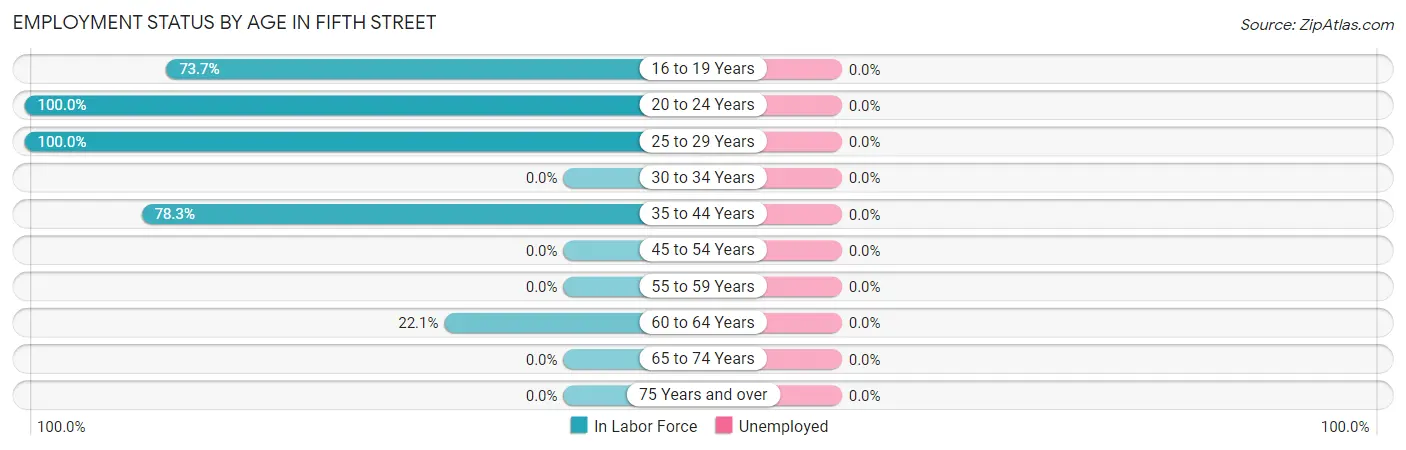
| Age Bracket | In Labor Force | Unemployed |
| 16 to 19 Years | 56 (73.7%) | 0 (0.0%) |
| 20 to 24 Years | 40 (100.0%) | 0 (0.0%) |
| 25 to 29 Years | 72 (100.0%) | 0 (0.0%) |
| 30 to 34 Years | 0 (0.0%) | 0 (0.0%) |
| 35 to 44 Years | 216 (78.3%) | 0 (0.0%) |
| 45 to 54 Years | 0 (0.0%) | 0 (0.0%) |
| 55 to 59 Years | 0 (0.0%) | 0 (0.0%) |
| 60 to 64 Years | 57 (22.1%) | 0 (0.0%) |
| 65 to 74 Years | 0 (0.0%) | 0 (0.0%) |
| 75 Years and over | 0 (0.0%) | 0 (0.0%) |
| Total | 441 (56.5%) | 0 (0.0%) |
Employment Status by Educational Attainment in Fifth Street

| Educational Attainment | In Labor Force | Unemployed |
| Less than High School | 78 (31.1%) | 0 (0.0%) |
| High School Diploma | 0 (0.0%) | 0 (0.0%) |
| College / Associate Degree | 220 (100.0%) | 0 (0.0%) |
| Bachelor's Degree or higher | 47 (100.0%) | 0 (0.0%) |
| Total | 345 (54.0%) | 0 (0.0%) |
Employment Occupations by Sex in Fifth Street
Management, Business, Science and Arts Occupations
The most common Management, Business, Science and Arts occupations in Fifth Street are , and Management (72 | 16.3%).
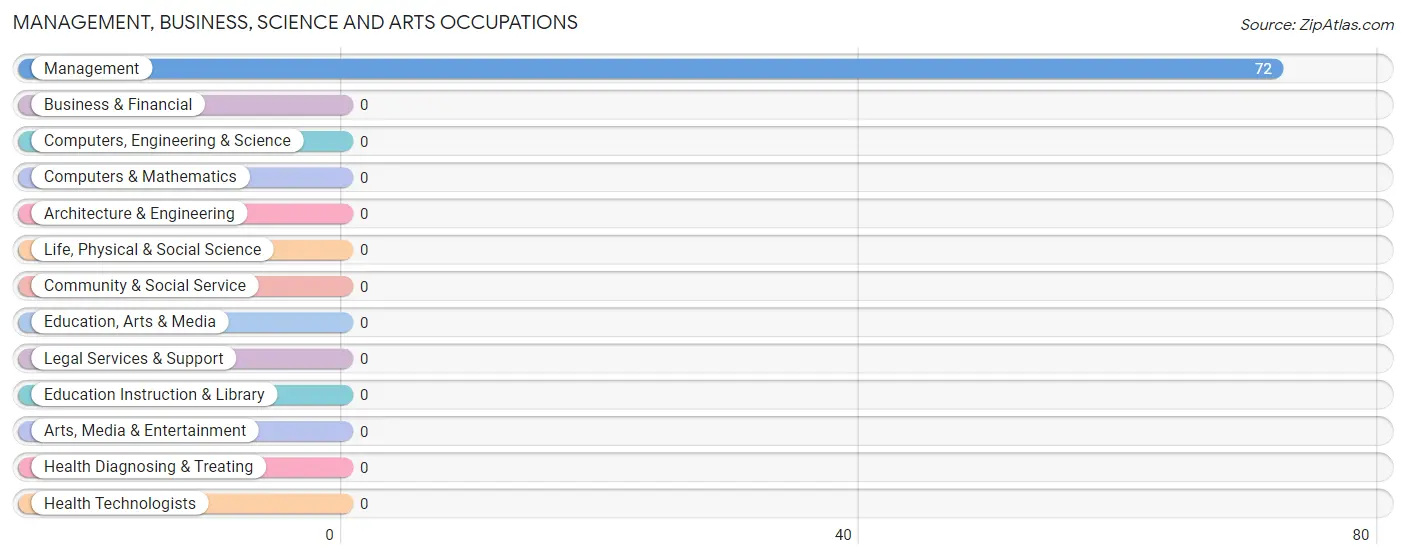
Management, Business, Science and Arts Occupations by Sex
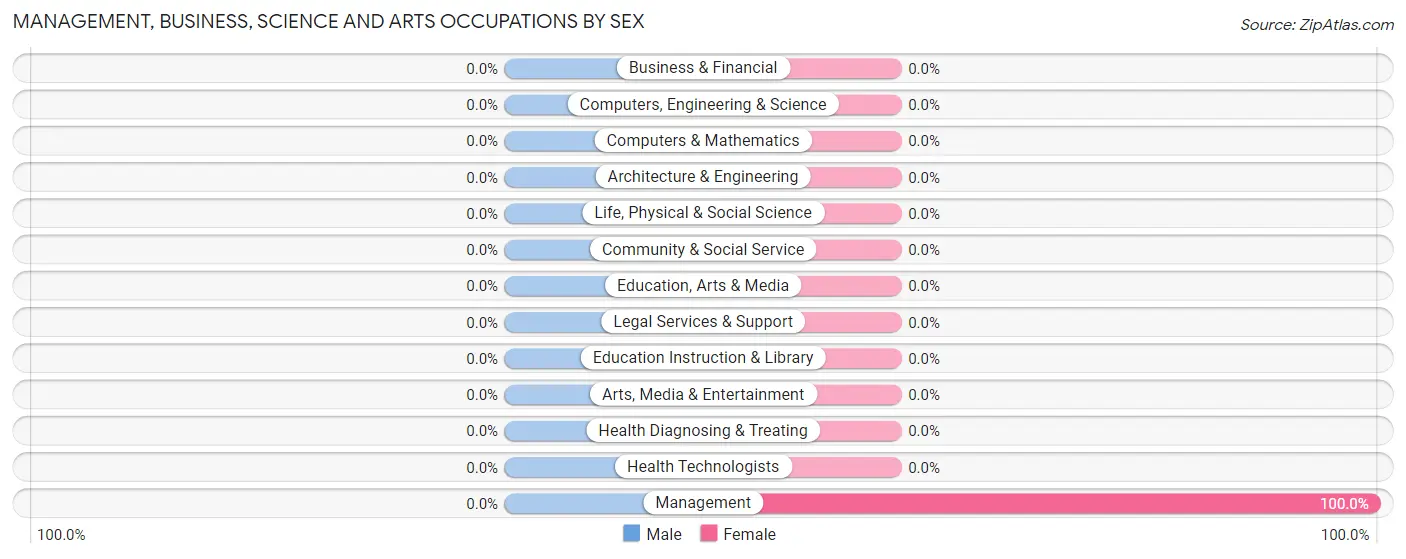
| Occupation | Male | Female |
| Management | 0 (0.0%) | 72 (100.0%) |
| Business & Financial | 0 (0.0%) | 0 (0.0%) |
| Computers, Engineering & Science | 0 (0.0%) | 0 (0.0%) |
| Computers & Mathematics | 0 (0.0%) | 0 (0.0%) |
| Architecture & Engineering | 0 (0.0%) | 0 (0.0%) |
| Life, Physical & Social Science | 0 (0.0%) | 0 (0.0%) |
| Community & Social Service | 0 (0.0%) | 0 (0.0%) |
| Education, Arts & Media | 0 (0.0%) | 0 (0.0%) |
| Legal Services & Support | 0 (0.0%) | 0 (0.0%) |
| Education Instruction & Library | 0 (0.0%) | 0 (0.0%) |
| Arts, Media & Entertainment | 0 (0.0%) | 0 (0.0%) |
| Health Diagnosing & Treating | 0 (0.0%) | 0 (0.0%) |
| Health Technologists | 0 (0.0%) | 0 (0.0%) |
| Total (Category) | 0 (0.0%) | 72 (100.0%) |
| Total (Overall) | 165 (37.4%) | 276 (62.6%) |
Services Occupations
The most common Services occupations in Fifth Street are , and Cleaning & Maintenance (21 | 4.8%).
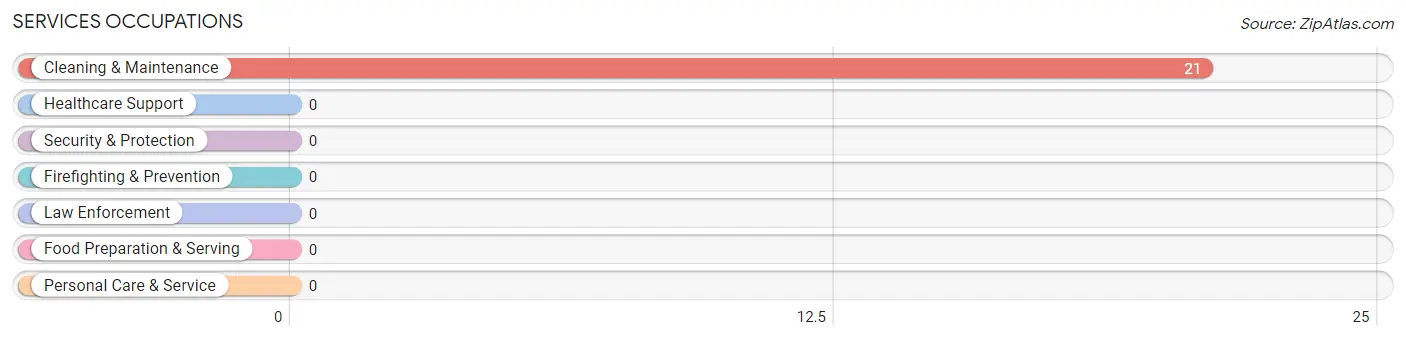
Services Occupations by Sex
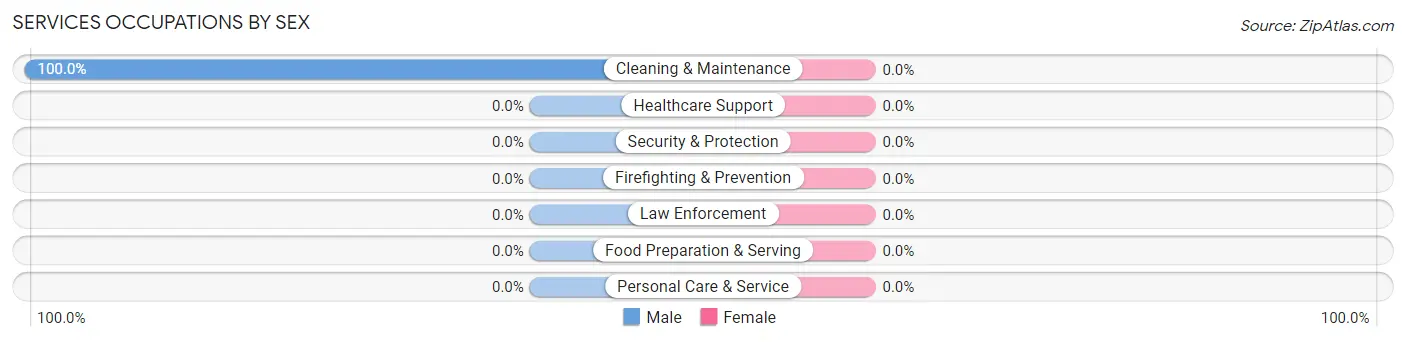
| Occupation | Male | Female |
| Healthcare Support | 0 (0.0%) | 0 (0.0%) |
| Security & Protection | 0 (0.0%) | 0 (0.0%) |
| Firefighting & Prevention | 0 (0.0%) | 0 (0.0%) |
| Law Enforcement | 0 (0.0%) | 0 (0.0%) |
| Food Preparation & Serving | 0 (0.0%) | 0 (0.0%) |
| Cleaning & Maintenance | 21 (100.0%) | 0 (0.0%) |
| Personal Care & Service | 0 (0.0%) | 0 (0.0%) |
| Total (Category) | 21 (100.0%) | 0 (0.0%) |
| Total (Overall) | 165 (37.4%) | 276 (62.6%) |
Sales and Office Occupations
The most common Sales and Office occupations in Fifth Street are , and Office & Administration (148 | 33.6%).

Sales and Office Occupations by Sex

| Occupation | Male | Female |
| Sales & Related | 0 (0.0%) | 0 (0.0%) |
| Office & Administration | 0 (0.0%) | 148 (100.0%) |
| Total (Category) | 0 (0.0%) | 148 (100.0%) |
| Total (Overall) | 165 (37.4%) | 276 (62.6%) |
Natural Resources, Construction and Maintenance Occupations
The most common Natural Resources, Construction and Maintenance occupations in Fifth Street are , and Construction & Extraction (87 | 19.7%).

Natural Resources, Construction and Maintenance Occupations by Sex

| Occupation | Male | Female |
| Farming, Fishing & Forestry | 0 (0.0%) | 0 (0.0%) |
| Construction & Extraction | 87 (100.0%) | 0 (0.0%) |
| Installation, Maintenance & Repair | 0 (0.0%) | 0 (0.0%) |
| Total (Category) | 87 (100.0%) | 0 (0.0%) |
| Total (Overall) | 165 (37.4%) | 276 (62.6%) |
Production, Transportation and Moving Occupations
The most common Production, Transportation and Moving occupations in Fifth Street are , and Production (113 | 25.6%).
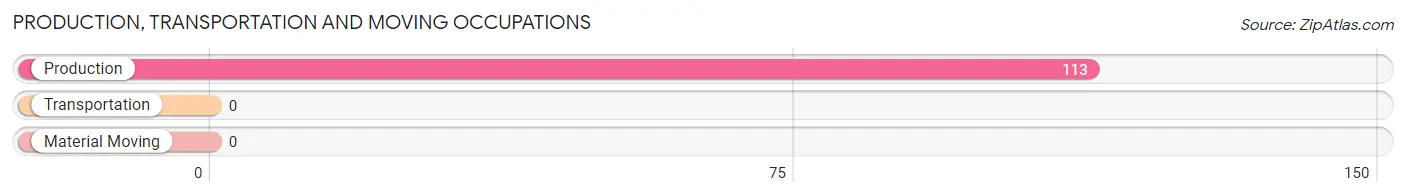
Production, Transportation and Moving Occupations by Sex
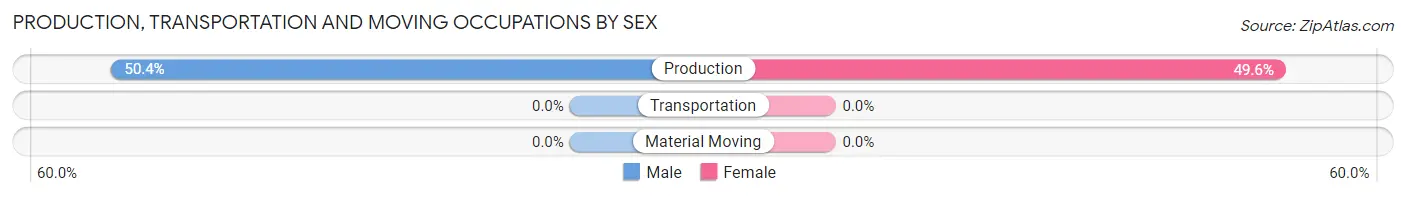
| Occupation | Male | Female |
| Production | 57 (50.4%) | 56 (49.6%) |
| Transportation | 0 (0.0%) | 0 (0.0%) |
| Material Moving | 0 (0.0%) | 0 (0.0%) |
| Total (Category) | 57 (50.4%) | 56 (49.6%) |
| Total (Overall) | 165 (37.4%) | 276 (62.6%) |
Employment Industries by Sex in Fifth Street
Employment Industries in Fifth Street
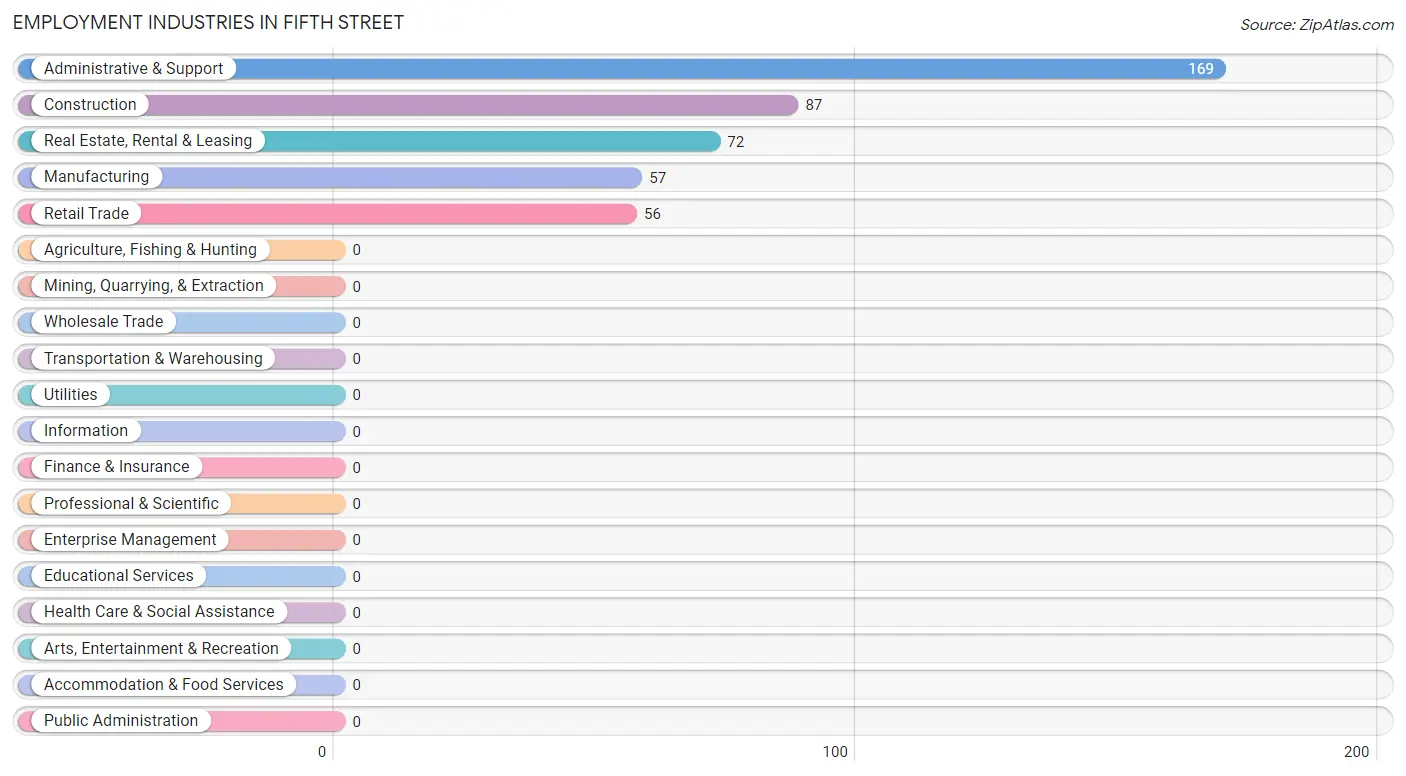
The major employment industries in Fifth Street include Administrative & Support (169 | 38.3%), Construction (87 | 19.7%), Real Estate, Rental & Leasing (72 | 16.3%), Manufacturing (57 | 12.9%), and Retail Trade (56 | 12.7%).
Employment Industries by Sex in Fifth Street
The Fifth Street industries that see more men than women are Construction (100.0%), Manufacturing (100.0%), and Administrative & Support (12.4%), whereas the industries that tend to have a higher number of women are Retail Trade (100.0%), Real Estate, Rental & Leasing (100.0%), and Administrative & Support (87.6%).
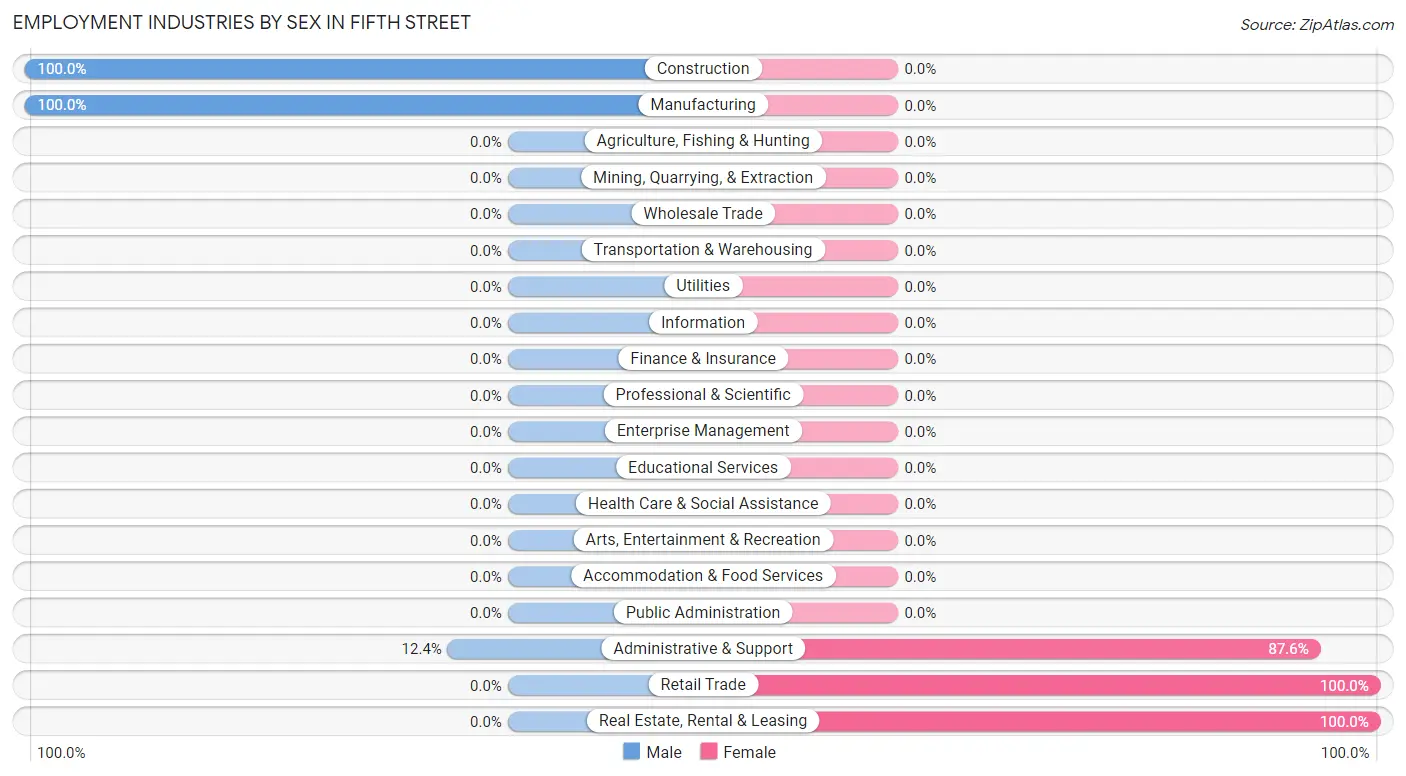
| Industry | Male | Female |
| Agriculture, Fishing & Hunting | 0 (0.0%) | 0 (0.0%) |
| Mining, Quarrying, & Extraction | 0 (0.0%) | 0 (0.0%) |
| Construction | 87 (100.0%) | 0 (0.0%) |
| Manufacturing | 57 (100.0%) | 0 (0.0%) |
| Wholesale Trade | 0 (0.0%) | 0 (0.0%) |
| Retail Trade | 0 (0.0%) | 56 (100.0%) |
| Transportation & Warehousing | 0 (0.0%) | 0 (0.0%) |
| Utilities | 0 (0.0%) | 0 (0.0%) |
| Information | 0 (0.0%) | 0 (0.0%) |
| Finance & Insurance | 0 (0.0%) | 0 (0.0%) |
| Real Estate, Rental & Leasing | 0 (0.0%) | 72 (100.0%) |
| Professional & Scientific | 0 (0.0%) | 0 (0.0%) |
| Enterprise Management | 0 (0.0%) | 0 (0.0%) |
| Administrative & Support | 21 (12.4%) | 148 (87.6%) |
| Educational Services | 0 (0.0%) | 0 (0.0%) |
| Health Care & Social Assistance | 0 (0.0%) | 0 (0.0%) |
| Arts, Entertainment & Recreation | 0 (0.0%) | 0 (0.0%) |
| Accommodation & Food Services | 0 (0.0%) | 0 (0.0%) |
| Public Administration | 0 (0.0%) | 0 (0.0%) |
| Total | 165 (37.4%) | 276 (62.6%) |
Education in Fifth Street
School Enrollment in Fifth Street
The most common levels of schooling among the 704 students in Fifth Street are elementary school (376 | 53.4%), nursery / preschool (182 | 25.9%), and high school (76 | 10.8%).
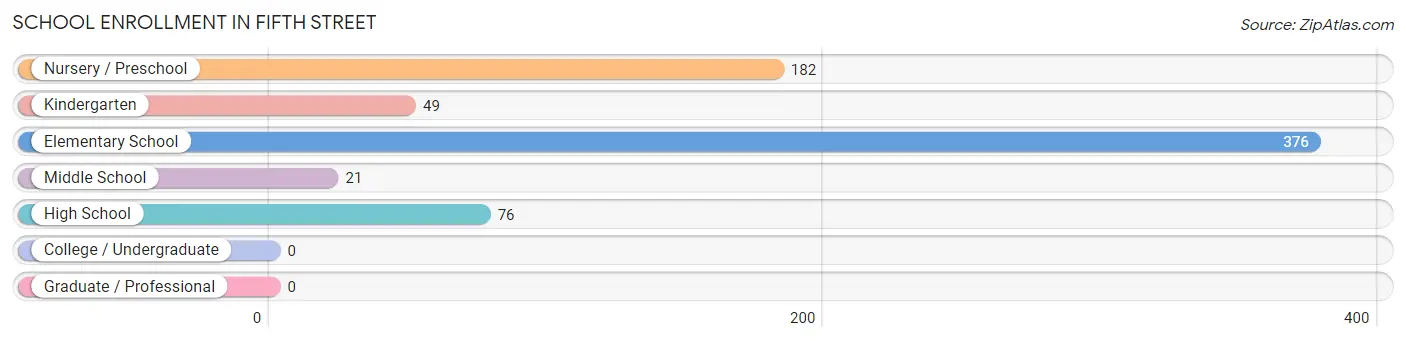
| School Level | # Students | % Students |
| Nursery / Preschool | 182 | 25.9% |
| Kindergarten | 49 | 7.0% |
| Elementary School | 376 | 53.4% |
| Middle School | 21 | 3.0% |
| High School | 76 | 10.8% |
| College / Undergraduate | 0 | 0.0% |
| Graduate / Professional | 0 | 0.0% |
| Total | 704 | 100.0% |
School Enrollment by Age by Funding Source in Fifth Street
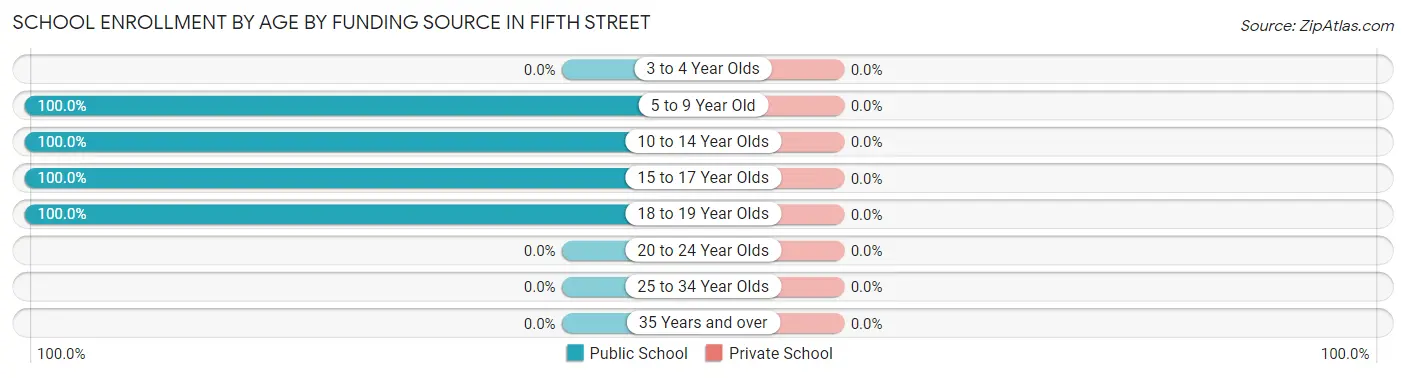
| Age Bracket | Public School | Private School |
| 3 to 4 Year Olds | 0 (0.0%) | 0 (0.0%) |
| 5 to 9 Year Old | 607 (100.0%) | 0 (0.0%) |
| 10 to 14 Year Olds | 21 (100.0%) | 0 (0.0%) |
| 15 to 17 Year Olds | 20 (100.0%) | 0 (0.0%) |
| 18 to 19 Year Olds | 56 (100.0%) | 0 (0.0%) |
| 20 to 24 Year Olds | 0 (0.0%) | 0 (0.0%) |
| 25 to 34 Year Olds | 0 (0.0%) | 0 (0.0%) |
| 35 Years and over | 0 (0.0%) | 0 (0.0%) |
| Total | 704 (100.0%) | 0 (0.0%) |
Educational Attainment by Field of Study in Fifth Street
, and science & technology (47 | 100.0%) are the most common fields of study among 47 individuals in Fifth Street who have obtained a bachelor's degree or higher.
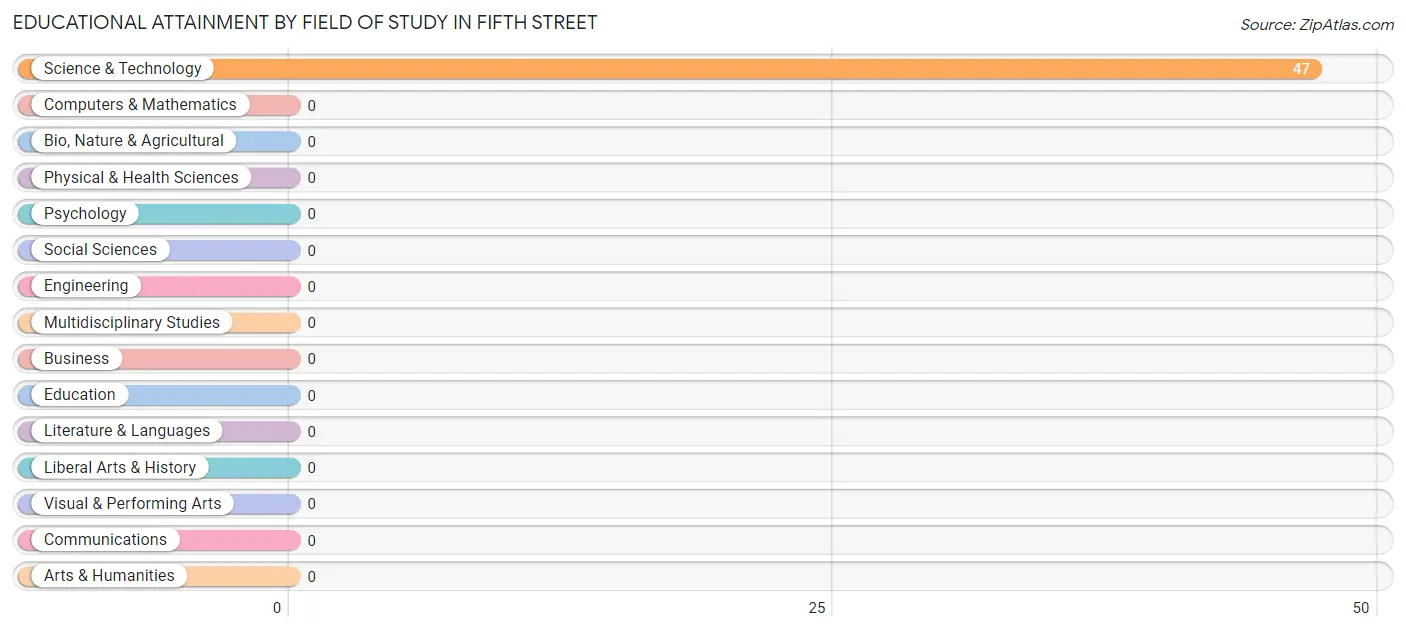
| Field of Study | # Graduates | % Graduates |
| Computers & Mathematics | 0 | 0.0% |
| Bio, Nature & Agricultural | 0 | 0.0% |
| Physical & Health Sciences | 0 | 0.0% |
| Psychology | 0 | 0.0% |
| Social Sciences | 0 | 0.0% |
| Engineering | 0 | 0.0% |
| Multidisciplinary Studies | 0 | 0.0% |
| Science & Technology | 47 | 100.0% |
| Business | 0 | 0.0% |
| Education | 0 | 0.0% |
| Literature & Languages | 0 | 0.0% |
| Liberal Arts & History | 0 | 0.0% |
| Visual & Performing Arts | 0 | 0.0% |
| Communications | 0 | 0.0% |
| Arts & Humanities | 0 | 0.0% |
| Total | 47 | 100.0% |
Transportation & Commute in Fifth Street
Vehicle Availability by Sex in Fifth Street
The most prevalent vehicle ownership categories in Fifth Street are males with 3 vehicles (87, accounting for 52.7%) and females with 3 vehicles (0, making up 31.5%).
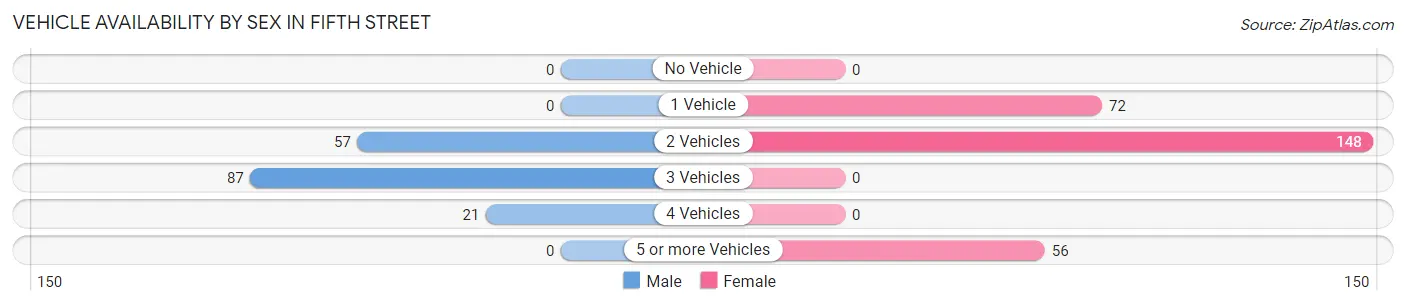
| Vehicles Available | Male | Female |
| No Vehicle | 0 (0.0%) | 0 (0.0%) |
| 1 Vehicle | 0 (0.0%) | 72 (26.1%) |
| 2 Vehicles | 57 (34.5%) | 148 (53.6%) |
| 3 Vehicles | 87 (52.7%) | 0 (0.0%) |
| 4 Vehicles | 21 (12.7%) | 0 (0.0%) |
| 5 or more Vehicles | 0 (0.0%) | 56 (20.3%) |
| Total | 165 (100.0%) | 276 (100.0%) |
Commute Time in Fifth Street
The most frequently occuring commute durations in Fifth Street are 15 to 19 minutes (204 commuters, 46.3%), 45 to 59 minutes (159 commuters, 36.0%), and 10 to 14 minutes (57 commuters, 12.9%).
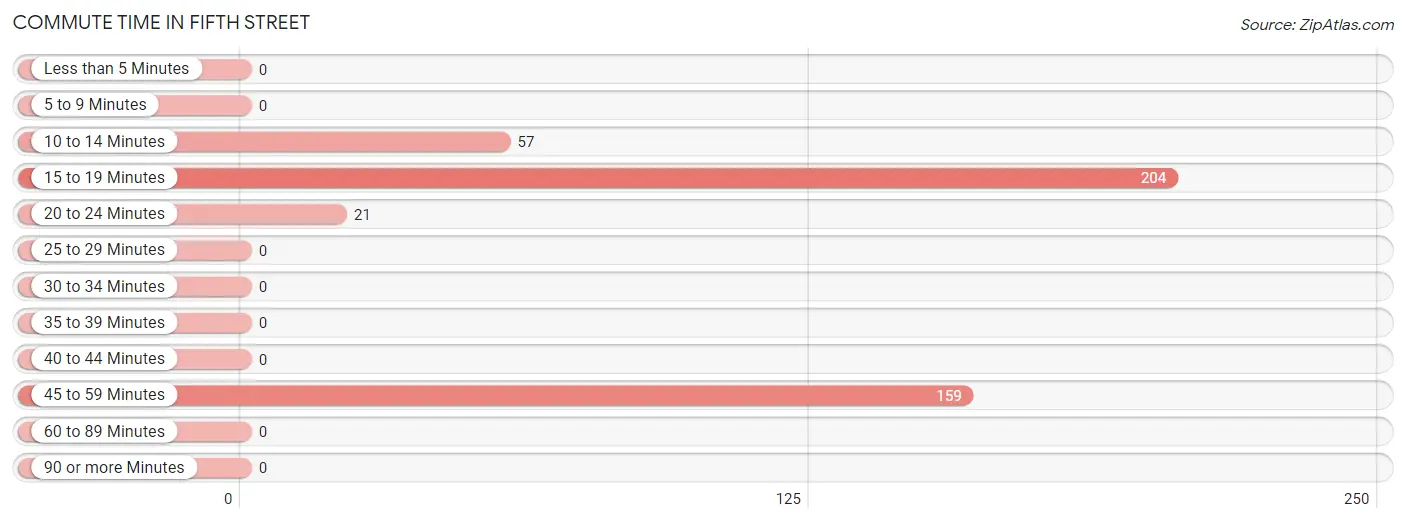
| Commute Time | # Commuters | % Commuters |
| Less than 5 Minutes | 0 | 0.0% |
| 5 to 9 Minutes | 0 | 0.0% |
| 10 to 14 Minutes | 57 | 12.9% |
| 15 to 19 Minutes | 204 | 46.3% |
| 20 to 24 Minutes | 21 | 4.8% |
| 25 to 29 Minutes | 0 | 0.0% |
| 30 to 34 Minutes | 0 | 0.0% |
| 35 to 39 Minutes | 0 | 0.0% |
| 40 to 44 Minutes | 0 | 0.0% |
| 45 to 59 Minutes | 159 | 36.0% |
| 60 to 89 Minutes | 0 | 0.0% |
| 90 or more Minutes | 0 | 0.0% |
Commute Time by Sex in Fifth Street
The most common commute times in Fifth Street are 45 to 59 minutes (87 commuters, 52.7%) for males and 15 to 19 minutes (204 commuters, 73.9%) for females.
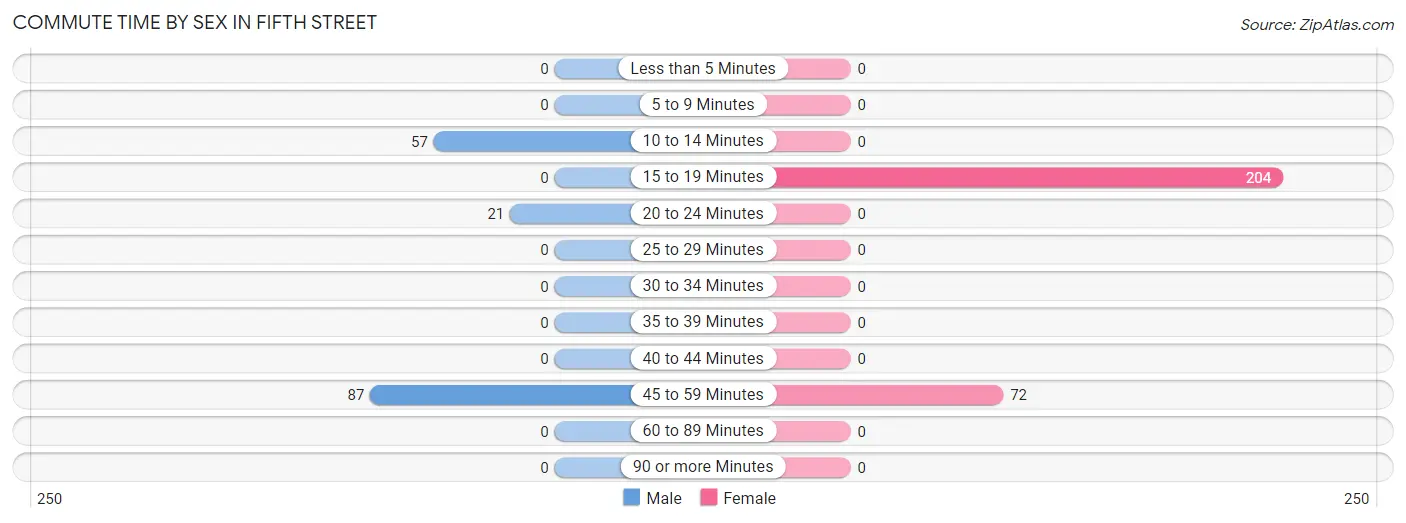
| Commute Time | Male | Female |
| Less than 5 Minutes | 0 (0.0%) | 0 (0.0%) |
| 5 to 9 Minutes | 0 (0.0%) | 0 (0.0%) |
| 10 to 14 Minutes | 57 (34.5%) | 0 (0.0%) |
| 15 to 19 Minutes | 0 (0.0%) | 204 (73.9%) |
| 20 to 24 Minutes | 21 (12.7%) | 0 (0.0%) |
| 25 to 29 Minutes | 0 (0.0%) | 0 (0.0%) |
| 30 to 34 Minutes | 0 (0.0%) | 0 (0.0%) |
| 35 to 39 Minutes | 0 (0.0%) | 0 (0.0%) |
| 40 to 44 Minutes | 0 (0.0%) | 0 (0.0%) |
| 45 to 59 Minutes | 87 (52.7%) | 72 (26.1%) |
| 60 to 89 Minutes | 0 (0.0%) | 0 (0.0%) |
| 90 or more Minutes | 0 (0.0%) | 0 (0.0%) |
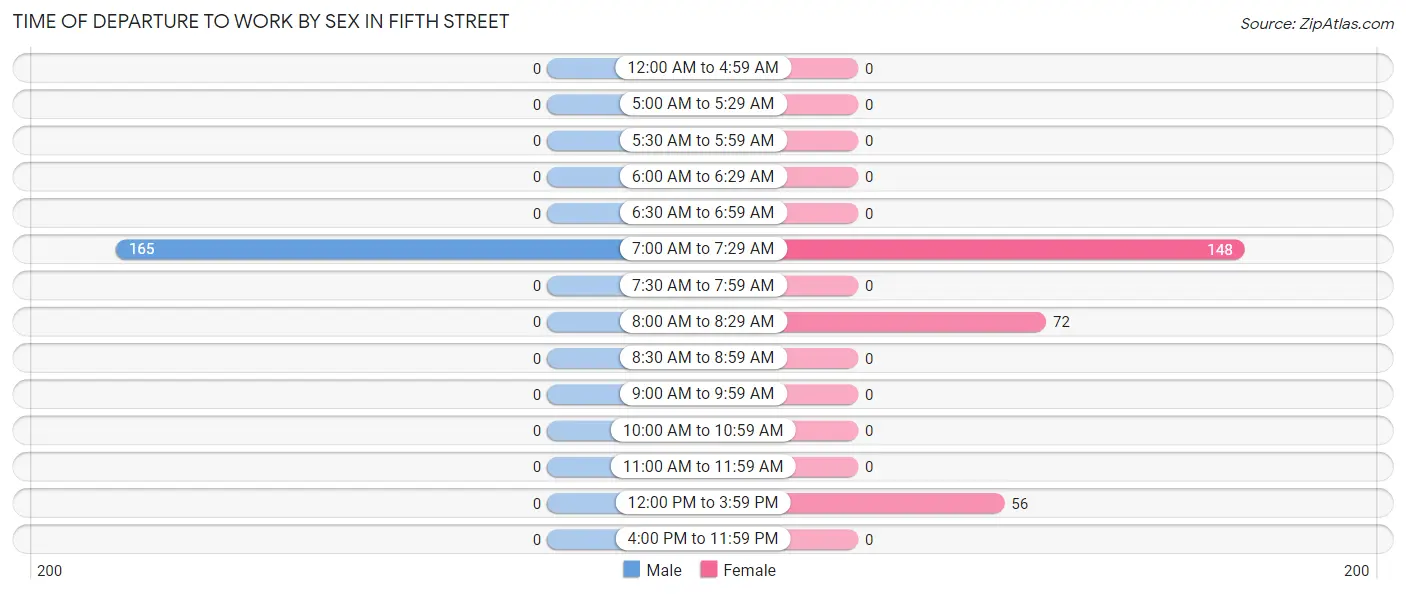
Time of Departure to Work by Sex in Fifth Street
The most frequent times of departure to work in Fifth Street are 7:00 AM to 7:29 AM (165, 100.0%) for males and 7:00 AM to 7:29 AM (148, 53.6%) for females.
| Time of Departure | Male | Female |
| 12:00 AM to 4:59 AM | 0 (0.0%) | 0 (0.0%) |
| 5:00 AM to 5:29 AM | 0 (0.0%) | 0 (0.0%) |
| 5:30 AM to 5:59 AM | 0 (0.0%) | 0 (0.0%) |
| 6:00 AM to 6:29 AM | 0 (0.0%) | 0 (0.0%) |
| 6:30 AM to 6:59 AM | 0 (0.0%) | 0 (0.0%) |
| 7:00 AM to 7:29 AM | 165 (100.0%) | 148 (53.6%) |
| 7:30 AM to 7:59 AM | 0 (0.0%) | 0 (0.0%) |
| 8:00 AM to 8:29 AM | 0 (0.0%) | 72 (26.1%) |
| 8:30 AM to 8:59 AM | 0 (0.0%) | 0 (0.0%) |
| 9:00 AM to 9:59 AM | 0 (0.0%) | 0 (0.0%) |
| 10:00 AM to 10:59 AM | 0 (0.0%) | 0 (0.0%) |
| 11:00 AM to 11:59 AM | 0 (0.0%) | 0 (0.0%) |
| 12:00 PM to 3:59 PM | 0 (0.0%) | 56 (20.3%) |
| 4:00 PM to 11:59 PM | 0 (0.0%) | 0 (0.0%) |
| Total | 165 (100.0%) | 276 (100.0%) |
Housing Occupancy in Fifth Street
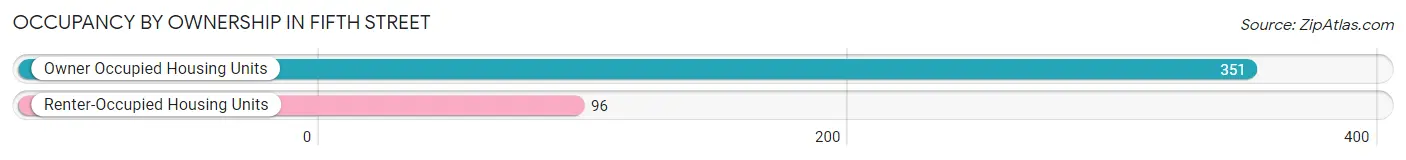
Occupancy by Ownership in Fifth Street
Of the total 447 dwellings in Fifth Street, owner-occupied units account for 351 (78.5%), while renter-occupied units make up 96 (21.5%).
| Occupancy | # Housing Units | % Housing Units |
| Owner Occupied Housing Units | 351 | 78.5% |
| Renter-Occupied Housing Units | 96 | 21.5% |
| Total Occupied Housing Units | 447 | 100.0% |
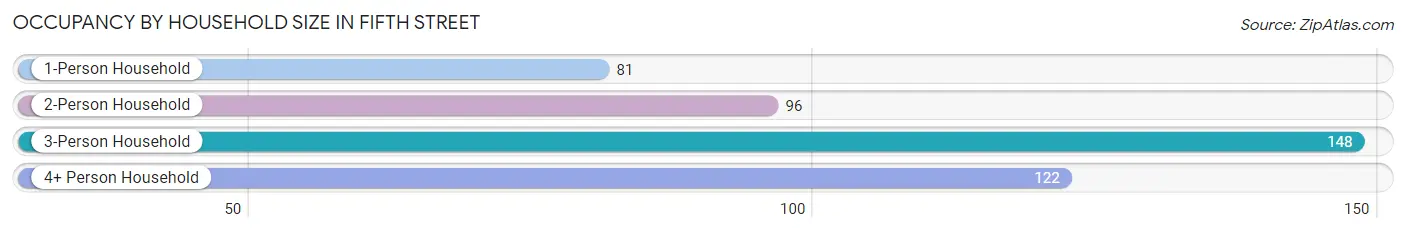
Occupancy by Household Size in Fifth Street
| Household Size | # Housing Units | % Housing Units |
| 1-Person Household | 81 | 18.1% |
| 2-Person Household | 96 | 21.5% |
| 3-Person Household | 148 | 33.1% |
| 4+ Person Household | 122 | 27.3% |
| Total Housing Units | 447 | 100.0% |
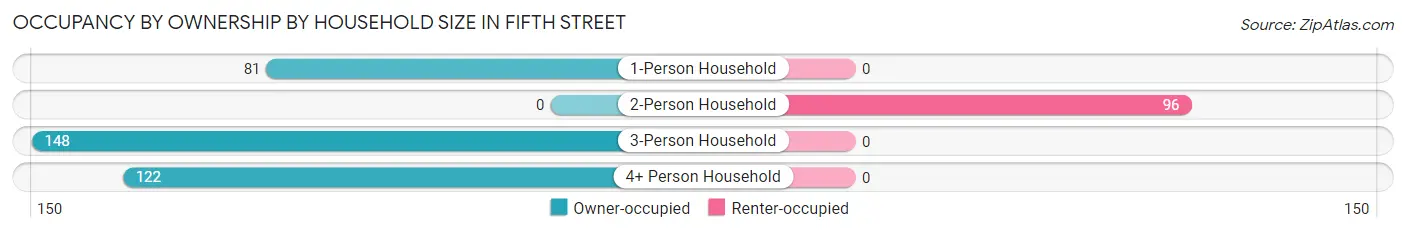
Occupancy by Ownership by Household Size in Fifth Street
| Household Size | Owner-occupied | Renter-occupied |
| 1-Person Household | 81 (100.0%) | 0 (0.0%) |
| 2-Person Household | 0 (0.0%) | 96 (100.0%) |
| 3-Person Household | 148 (100.0%) | 0 (0.0%) |
| 4+ Person Household | 122 (100.0%) | 0 (0.0%) |
| Total Housing Units | 351 (78.5%) | 96 (21.5%) |
Occupancy by Educational Attainment in Fifth Street
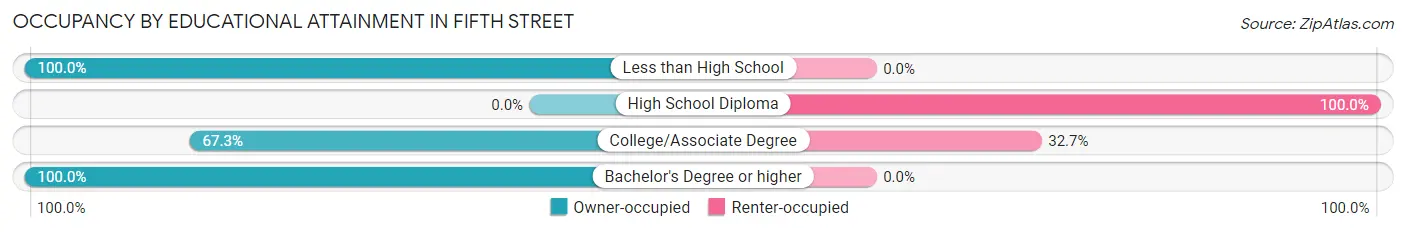
| Household Size | Owner-occupied | Renter-occupied |
| Less than High School | 156 (100.0%) | 0 (0.0%) |
| High School Diploma | 0 (0.0%) | 24 (100.0%) |
| College/Associate Degree | 148 (67.3%) | 72 (32.7%) |
| Bachelor's Degree or higher | 47 (100.0%) | 0 (0.0%) |
Occupancy by Age of Householder in Fifth Street
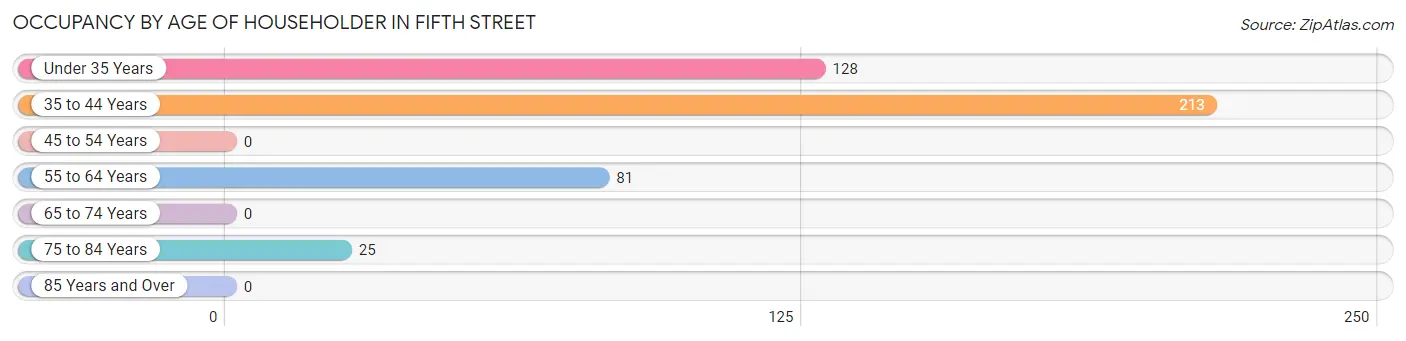
| Age Bracket | # Households | % Households |
| Under 35 Years | 128 | 28.6% |
| 35 to 44 Years | 213 | 47.6% |
| 45 to 54 Years | 0 | 0.0% |
| 55 to 64 Years | 81 | 18.1% |
| 65 to 74 Years | 0 | 0.0% |
| 75 to 84 Years | 25 | 5.6% |
| 85 Years and Over | 0 | 0.0% |
| Total | 447 | 100.0% |
Housing Finances in Fifth Street
Median Income by Occupancy in Fifth Street
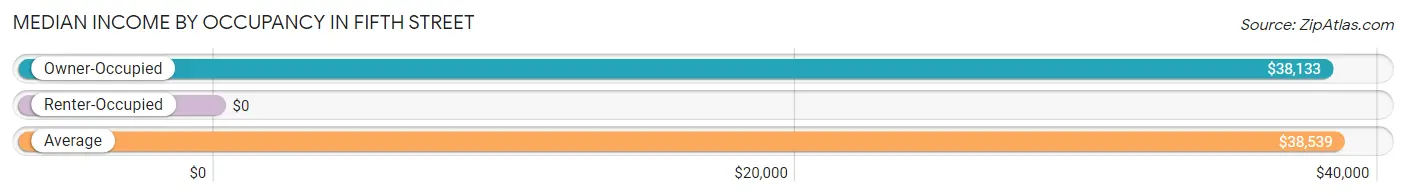
| Occupancy Type | # Households | Median Income |
| Owner-Occupied | 351 (78.5%) | $38,133 |
| Renter-Occupied | 96 (21.5%) | $0 |
| Average | 447 (100.0%) | $38,539 |
Occupancy by Householder Income Bracket in Fifth Street
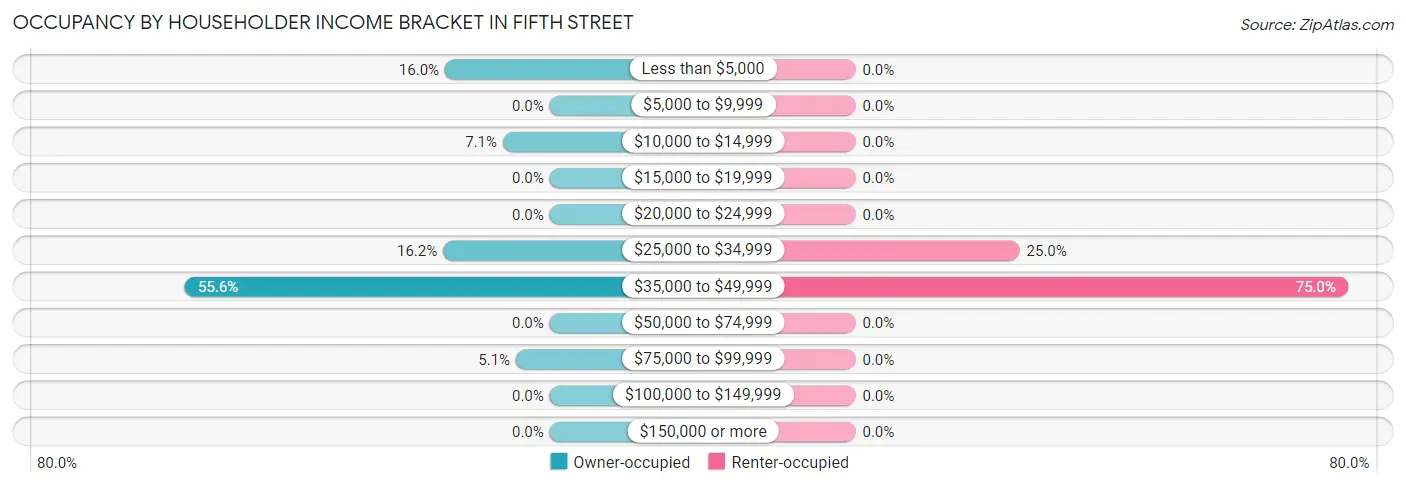
| Income Bracket | Owner-occupied | Renter-occupied |
| Less than $5,000 | 56 (16.0%) | 0 (0.0%) |
| $5,000 to $9,999 | 0 (0.0%) | 0 (0.0%) |
| $10,000 to $14,999 | 25 (7.1%) | 0 (0.0%) |
| $15,000 to $19,999 | 0 (0.0%) | 0 (0.0%) |
| $20,000 to $24,999 | 0 (0.0%) | 0 (0.0%) |
| $25,000 to $34,999 | 57 (16.2%) | 24 (25.0%) |
| $35,000 to $49,999 | 195 (55.6%) | 72 (75.0%) |
| $50,000 to $74,999 | 0 (0.0%) | 0 (0.0%) |
| $75,000 to $99,999 | 18 (5.1%) | 0 (0.0%) |
| $100,000 to $149,999 | 0 (0.0%) | 0 (0.0%) |
| $150,000 or more | 0 (0.0%) | 0 (0.0%) |
| Total | 351 (100.0%) | 96 (100.0%) |
Monthly Housing Cost Tiers in Fifth Street
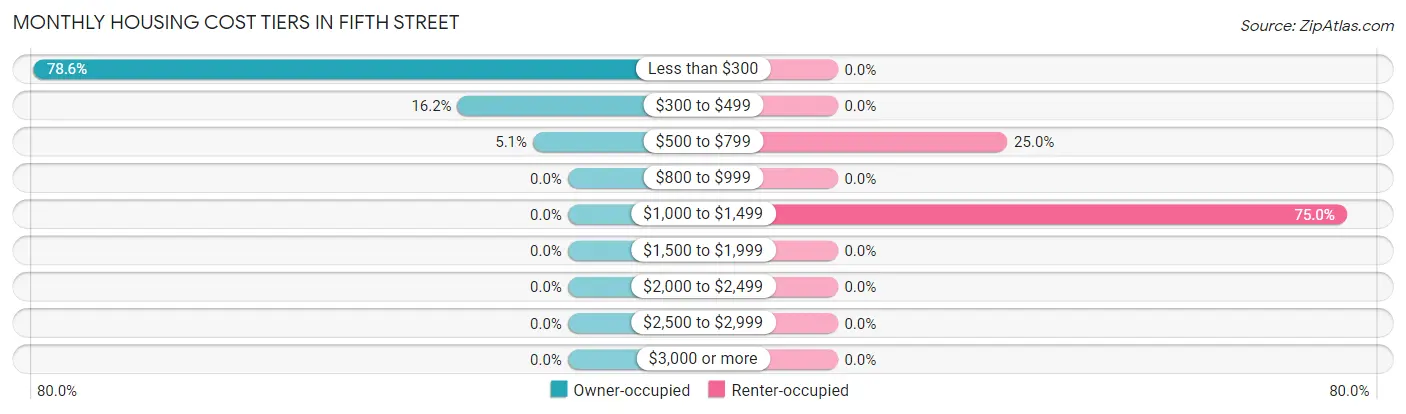
| Monthly Cost | Owner-occupied | Renter-occupied |
| Less than $300 | 276 (78.6%) | 0 (0.0%) |
| $300 to $499 | 57 (16.2%) | 0 (0.0%) |
| $500 to $799 | 18 (5.1%) | 24 (25.0%) |
| $800 to $999 | 0 (0.0%) | 0 (0.0%) |
| $1,000 to $1,499 | 0 (0.0%) | 72 (75.0%) |
| $1,500 to $1,999 | 0 (0.0%) | 0 (0.0%) |
| $2,000 to $2,499 | 0 (0.0%) | 0 (0.0%) |
| $2,500 to $2,999 | 0 (0.0%) | 0 (0.0%) |
| $3,000 or more | 0 (0.0%) | 0 (0.0%) |
| Total | 351 (100.0%) | 96 (100.0%) |
Physical Housing Characteristics in Fifth Street
Housing Structures in Fifth Street
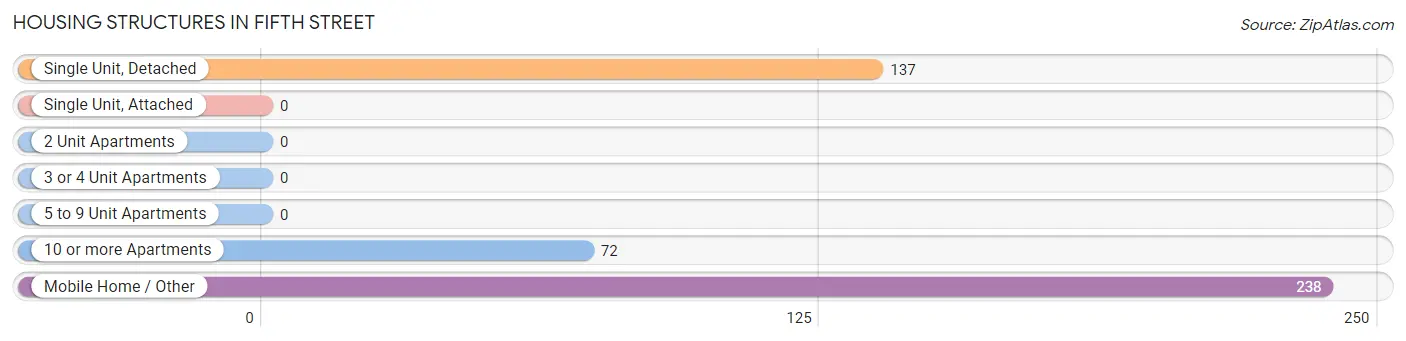
| Structure Type | # Housing Units | % Housing Units |
| Single Unit, Detached | 137 | 30.6% |
| Single Unit, Attached | 0 | 0.0% |
| 2 Unit Apartments | 0 | 0.0% |
| 3 or 4 Unit Apartments | 0 | 0.0% |
| 5 to 9 Unit Apartments | 0 | 0.0% |
| 10 or more Apartments | 72 | 16.1% |
| Mobile Home / Other | 238 | 53.2% |
| Total | 447 | 100.0% |
Housing Structures by Occupancy in Fifth Street
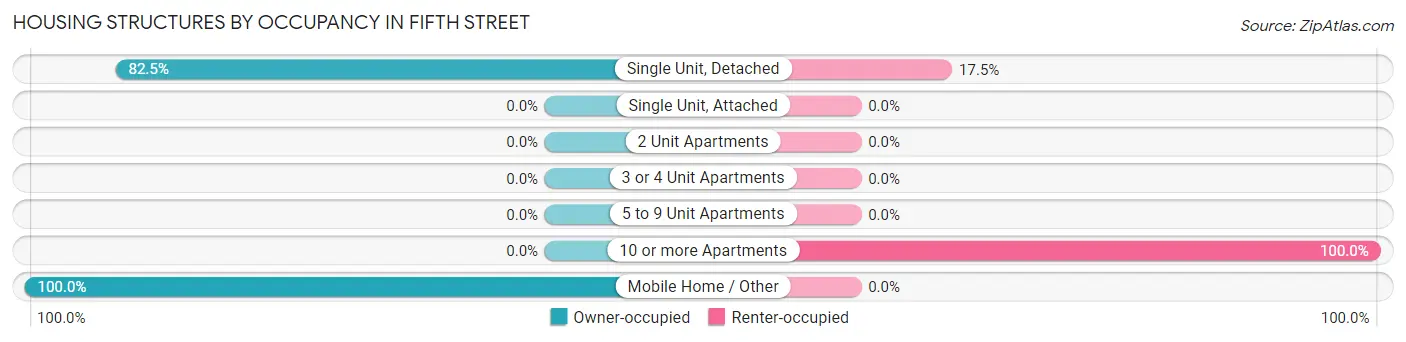
| Structure Type | Owner-occupied | Renter-occupied |
| Single Unit, Detached | 113 (82.5%) | 24 (17.5%) |
| Single Unit, Attached | 0 (0.0%) | 0 (0.0%) |
| 2 Unit Apartments | 0 (0.0%) | 0 (0.0%) |
| 3 or 4 Unit Apartments | 0 (0.0%) | 0 (0.0%) |
| 5 to 9 Unit Apartments | 0 (0.0%) | 0 (0.0%) |
| 10 or more Apartments | 0 (0.0%) | 72 (100.0%) |
| Mobile Home / Other | 238 (100.0%) | 0 (0.0%) |
| Total | 351 (78.5%) | 96 (21.5%) |
Housing Structures by Number of Rooms in Fifth Street
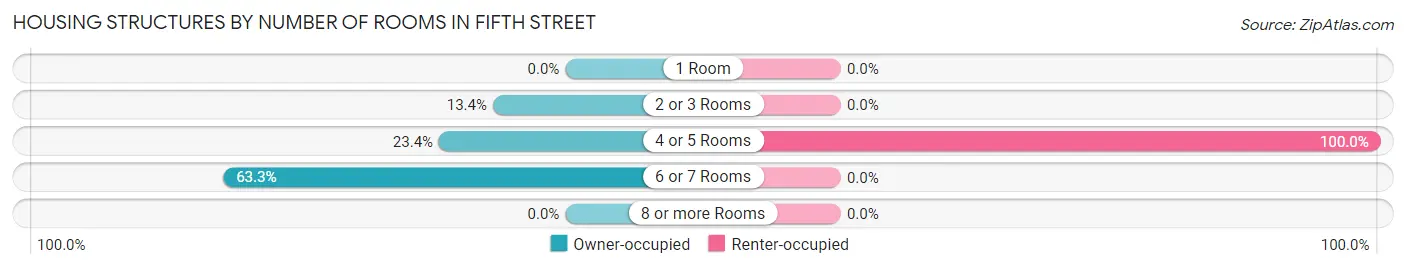
| Number of Rooms | Owner-occupied | Renter-occupied |
| 1 Room | 0 (0.0%) | 0 (0.0%) |
| 2 or 3 Rooms | 47 (13.4%) | 0 (0.0%) |
| 4 or 5 Rooms | 82 (23.4%) | 96 (100.0%) |
| 6 or 7 Rooms | 222 (63.2%) | 0 (0.0%) |
| 8 or more Rooms | 0 (0.0%) | 0 (0.0%) |
| Total | 351 (100.0%) | 96 (100.0%) |
Housing Structure by Heating Type in Fifth Street
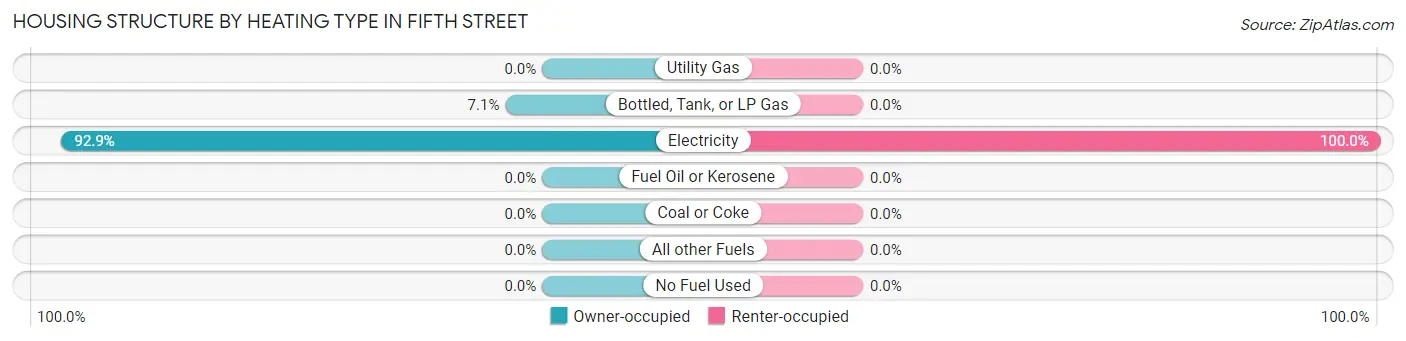
| Heating Type | Owner-occupied | Renter-occupied |
| Utility Gas | 0 (0.0%) | 0 (0.0%) |
| Bottled, Tank, or LP Gas | 25 (7.1%) | 0 (0.0%) |
| Electricity | 326 (92.9%) | 96 (100.0%) |
| Fuel Oil or Kerosene | 0 (0.0%) | 0 (0.0%) |
| Coal or Coke | 0 (0.0%) | 0 (0.0%) |
| All other Fuels | 0 (0.0%) | 0 (0.0%) |
| No Fuel Used | 0 (0.0%) | 0 (0.0%) |
| Total | 351 (100.0%) | 96 (100.0%) |
Household Vehicle Usage in Fifth Street
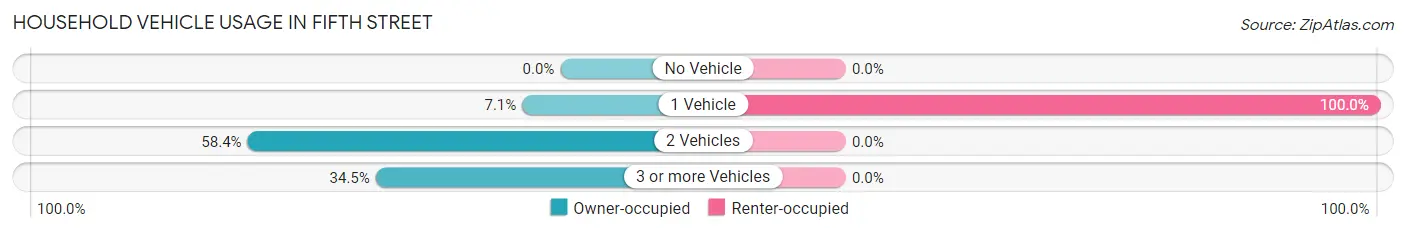
| Vehicles per Household | Owner-occupied | Renter-occupied |
| No Vehicle | 0 (0.0%) | 0 (0.0%) |
| 1 Vehicle | 25 (7.1%) | 96 (100.0%) |
| 2 Vehicles | 205 (58.4%) | 0 (0.0%) |
| 3 or more Vehicles | 121 (34.5%) | 0 (0.0%) |
| Total | 351 (100.0%) | 96 (100.0%) |
Real Estate & Mortgages in Fifth Street
Real Estate and Mortgage Overview in Fifth Street
| Characteristic | Without Mortgage | With Mortgage |
| Housing Units | 351 | 0 |
| Median Property Value | $19,000 | $0 |
| Median Household Income | $38,133 | $0 |
| Monthly Housing Costs | $266 | $0 |
| Real Estate Taxes | $199 | $0 |
Property Value by Mortgage Status in Fifth Street
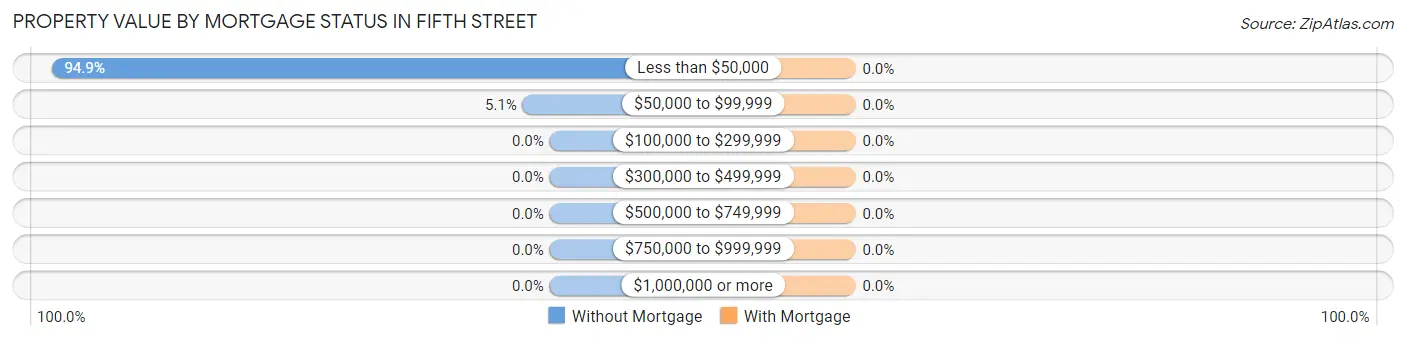
| Property Value | Without Mortgage | With Mortgage |
| Less than $50,000 | 333 (94.9%) | 0 (0.0%) |
| $50,000 to $99,999 | 18 (5.1%) | 0 (0.0%) |
| $100,000 to $299,999 | 0 (0.0%) | 0 (0.0%) |
| $300,000 to $499,999 | 0 (0.0%) | 0 (0.0%) |
| $500,000 to $749,999 | 0 (0.0%) | 0 (0.0%) |
| $750,000 to $999,999 | 0 (0.0%) | 0 (0.0%) |
| $1,000,000 or more | 0 (0.0%) | 0 (0.0%) |
| Total | 351 (100.0%) | 0 (0.0%) |
Household Income by Mortgage Status in Fifth Street
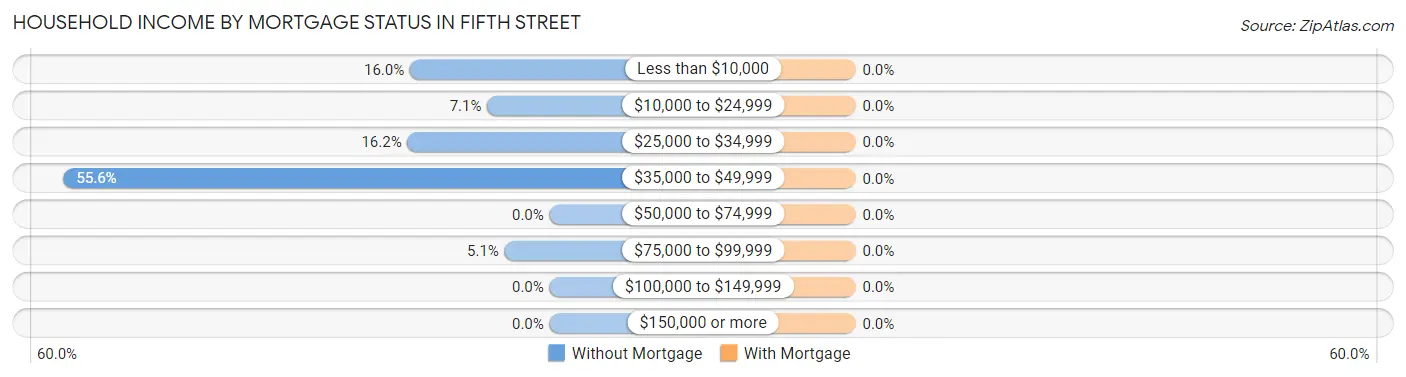
| Household Income | Without Mortgage | With Mortgage |
| Less than $10,000 | 56 (16.0%) | 0 (0.0%) |
| $10,000 to $24,999 | 25 (7.1%) | 0 (0.0%) |
| $25,000 to $34,999 | 57 (16.2%) | 0 (0.0%) |
| $35,000 to $49,999 | 195 (55.6%) | 0 (0.0%) |
| $50,000 to $74,999 | 0 (0.0%) | 0 (0.0%) |
| $75,000 to $99,999 | 18 (5.1%) | 0 (0.0%) |
| $100,000 to $149,999 | 0 (0.0%) | 0 (0.0%) |
| $150,000 or more | 0 (0.0%) | 0 (0.0%) |
| Total | 351 (100.0%) | 0 (0.0%) |
Property Value to Household Income Ratio in Fifth Street

| Value-to-Income Ratio | Without Mortgage | With Mortgage |
| Less than 2.0x | 295 (84.1%) | 0 (0.0%) |
| 2.0x to 2.9x | 0 (0.0%) | 0 (0.0%) |
| 3.0x to 3.9x | 0 (0.0%) | 0 (0.0%) |
| 4.0x or more | 56 (16.0%) | 0 (0.0%) |
| Total | 351 (100.0%) | 0 (0.0%) |
Real Estate Taxes by Mortgage Status in Fifth Street
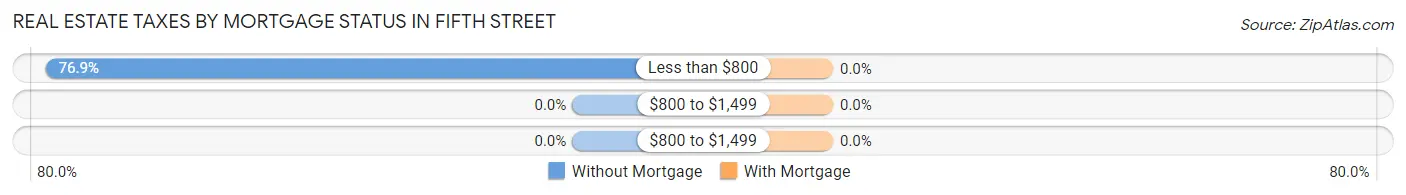
| Property Taxes | Without Mortgage | With Mortgage |
| Less than $800 | 270 (76.9%) | 0 (0.0%) |
| $800 to $1,499 | 0 (0.0%) | 0 (0.0%) |
| $800 to $1,499 | 0 (0.0%) | 0 (0.0%) |
| Total | 351 (100.0%) | 0 (0.0%) |
Health & Disability in Fifth Street
Health Insurance Coverage by Age in Fifth Street
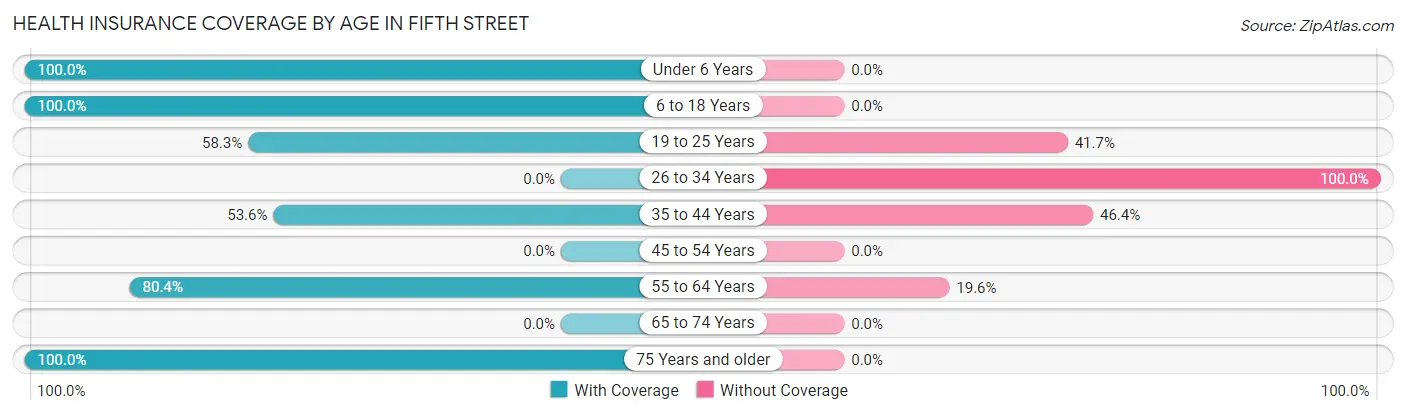
| Age Bracket | With Coverage | Without Coverage |
| Under 6 Years | 297 (100.0%) | 0 (0.0%) |
| 6 to 18 Years | 466 (100.0%) | 0 (0.0%) |
| 19 to 25 Years | 56 (58.3%) | 40 (41.7%) |
| 26 to 34 Years | 0 (0.0%) | 72 (100.0%) |
| 35 to 44 Years | 148 (53.6%) | 128 (46.4%) |
| 45 to 54 Years | 0 (0.0%) | 0 (0.0%) |
| 55 to 64 Years | 234 (80.4%) | 57 (19.6%) |
| 65 to 74 Years | 0 (0.0%) | 0 (0.0%) |
| 75 Years and older | 25 (100.0%) | 0 (0.0%) |
| Total | 1,226 (80.5%) | 297 (19.5%) |
Health Insurance Coverage by Citizenship Status in Fifth Street

| Citizenship Status | With Coverage | Without Coverage |
| Native Born | 297 (100.0%) | 0 (0.0%) |
| Foreign Born, Citizen | 466 (100.0%) | 0 (0.0%) |
| Foreign Born, not a Citizen | 56 (58.3%) | 40 (41.7%) |
Health Insurance Coverage by Household Income in Fifth Street
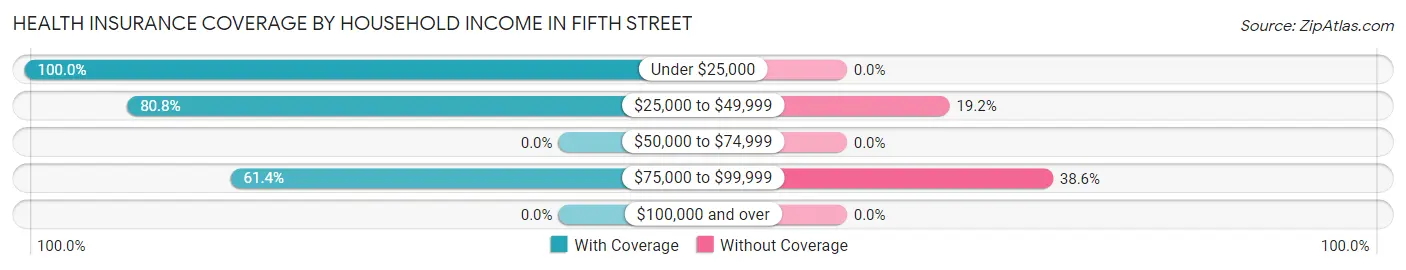
| Household Income | With Coverage | Without Coverage |
| Under $25,000 | 81 (100.0%) | 0 (0.0%) |
| $25,000 to $49,999 | 1,083 (80.8%) | 258 (19.2%) |
| $50,000 to $74,999 | 0 (0.0%) | 0 (0.0%) |
| $75,000 to $99,999 | 62 (61.4%) | 39 (38.6%) |
| $100,000 and over | 0 (0.0%) | 0 (0.0%) |
Public vs Private Health Insurance Coverage by Age in Fifth Street
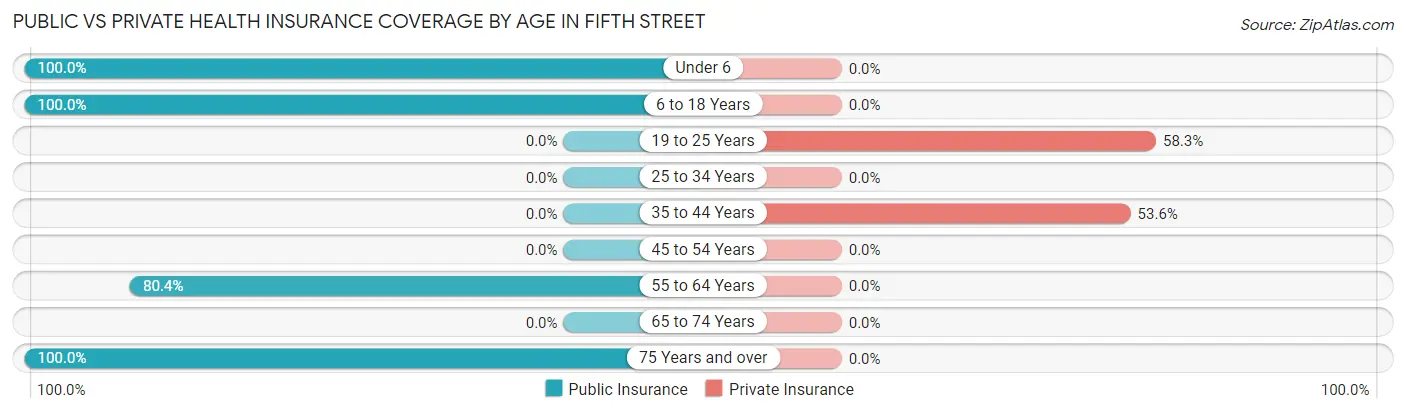
| Age Bracket | Public Insurance | Private Insurance |
| Under 6 | 297 (100.0%) | 0 (0.0%) |
| 6 to 18 Years | 466 (100.0%) | 0 (0.0%) |
| 19 to 25 Years | 0 (0.0%) | 56 (58.3%) |
| 25 to 34 Years | 0 (0.0%) | 0 (0.0%) |
| 35 to 44 Years | 0 (0.0%) | 148 (53.6%) |
| 45 to 54 Years | 0 (0.0%) | 0 (0.0%) |
| 55 to 64 Years | 234 (80.4%) | 0 (0.0%) |
| 65 to 74 Years | 0 (0.0%) | 0 (0.0%) |
| 75 Years and over | 25 (100.0%) | 0 (0.0%) |
| Total | 1,022 (67.1%) | 204 (13.4%) |
Disability Status by Sex by Age in Fifth Street
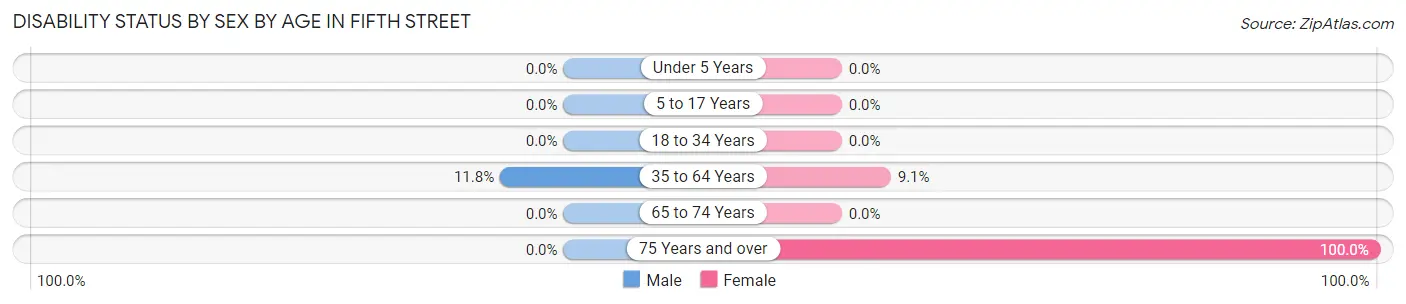
| Age Bracket | Male | Female |
| Under 5 Years | 0 (0.0%) | 0 (0.0%) |
| 5 to 17 Years | 0 (0.0%) | 0 (0.0%) |
| 18 to 34 Years | 0 (0.0%) | 0 (0.0%) |
| 35 to 64 Years | 24 (11.8%) | 33 (9.1%) |
| 65 to 74 Years | 0 (0.0%) | 0 (0.0%) |
| 75 Years and over | 0 (0.0%) | 25 (100.0%) |
Disability Class by Sex by Age in Fifth Street
Disability Class: Hearing Difficulty
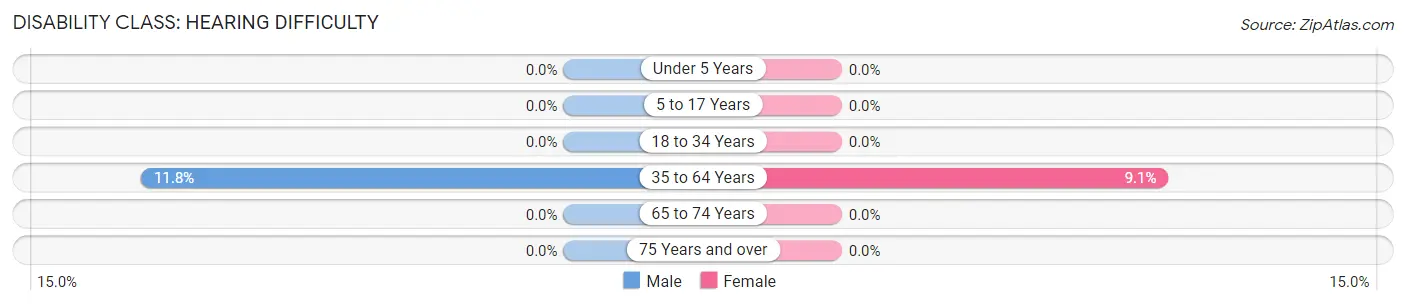
| Age Bracket | Male | Female |
| Under 5 Years | 0 (0.0%) | 0 (0.0%) |
| 5 to 17 Years | 0 (0.0%) | 0 (0.0%) |
| 18 to 34 Years | 0 (0.0%) | 0 (0.0%) |
| 35 to 64 Years | 24 (11.8%) | 33 (9.1%) |
| 65 to 74 Years | 0 (0.0%) | 0 (0.0%) |
| 75 Years and over | 0 (0.0%) | 0 (0.0%) |
Disability Class: Vision Difficulty
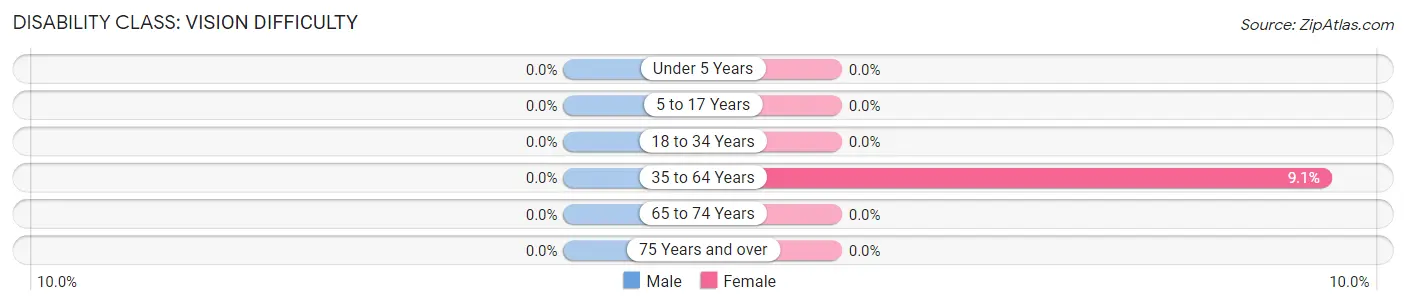
| Age Bracket | Male | Female |
| Under 5 Years | 0 (0.0%) | 0 (0.0%) |
| 5 to 17 Years | 0 (0.0%) | 0 (0.0%) |
| 18 to 34 Years | 0 (0.0%) | 0 (0.0%) |
| 35 to 64 Years | 0 (0.0%) | 33 (9.1%) |
| 65 to 74 Years | 0 (0.0%) | 0 (0.0%) |
| 75 Years and over | 0 (0.0%) | 0 (0.0%) |
Disability Class: Cognitive Difficulty
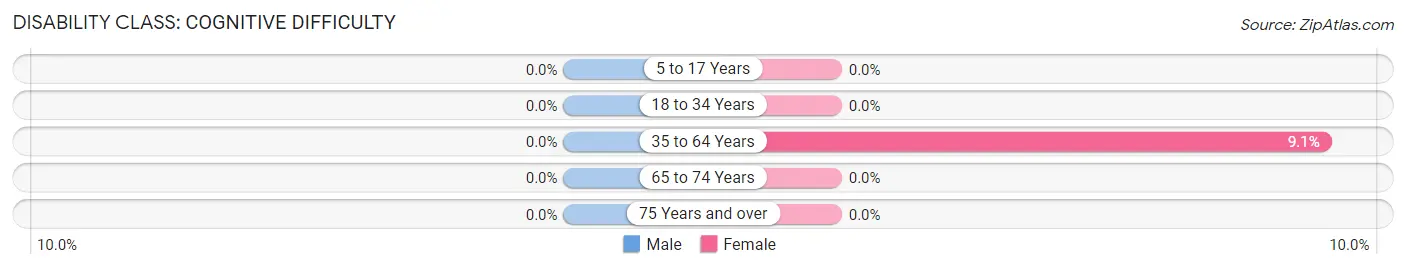
| Age Bracket | Male | Female |
| 5 to 17 Years | 0 (0.0%) | 0 (0.0%) |
| 18 to 34 Years | 0 (0.0%) | 0 (0.0%) |
| 35 to 64 Years | 0 (0.0%) | 33 (9.1%) |
| 65 to 74 Years | 0 (0.0%) | 0 (0.0%) |
| 75 Years and over | 0 (0.0%) | 0 (0.0%) |
Disability Class: Ambulatory Difficulty

| Age Bracket | Male | Female |
| 5 to 17 Years | 0 (0.0%) | 0 (0.0%) |
| 18 to 34 Years | 0 (0.0%) | 0 (0.0%) |
| 35 to 64 Years | 0 (0.0%) | 33 (9.1%) |
| 65 to 74 Years | 0 (0.0%) | 0 (0.0%) |
| 75 Years and over | 0 (0.0%) | 25 (100.0%) |
Disability Class: Self-Care Difficulty

| Age Bracket | Male | Female |
| 5 to 17 Years | 0 (0.0%) | 0 (0.0%) |
| 18 to 34 Years | 0 (0.0%) | 0 (0.0%) |
| 35 to 64 Years | 0 (0.0%) | 0 (0.0%) |
| 65 to 74 Years | 0 (0.0%) | 0 (0.0%) |
| 75 Years and over | 0 (0.0%) | 0 (0.0%) |
Technology Access in Fifth Street
Computing Device Access in Fifth Street
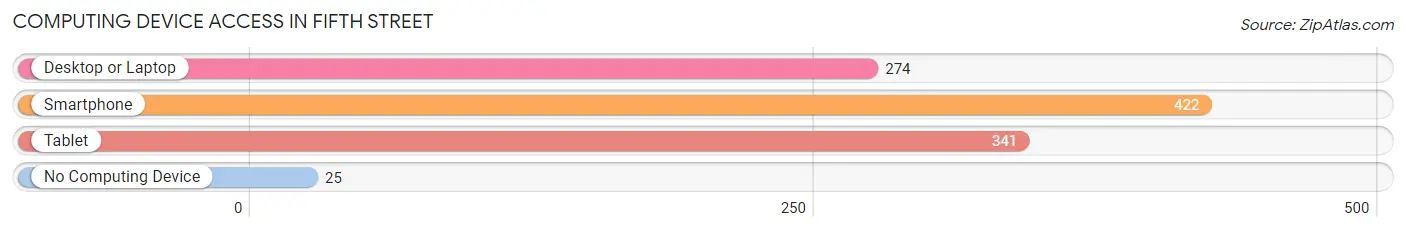
| Device Type | # Households | % Households |
| Desktop or Laptop | 274 | 61.3% |
| Smartphone | 422 | 94.4% |
| Tablet | 341 | 76.3% |
| No Computing Device | 25 | 5.6% |
| Total | 447 | 100.0% |
Internet Access in Fifth Street
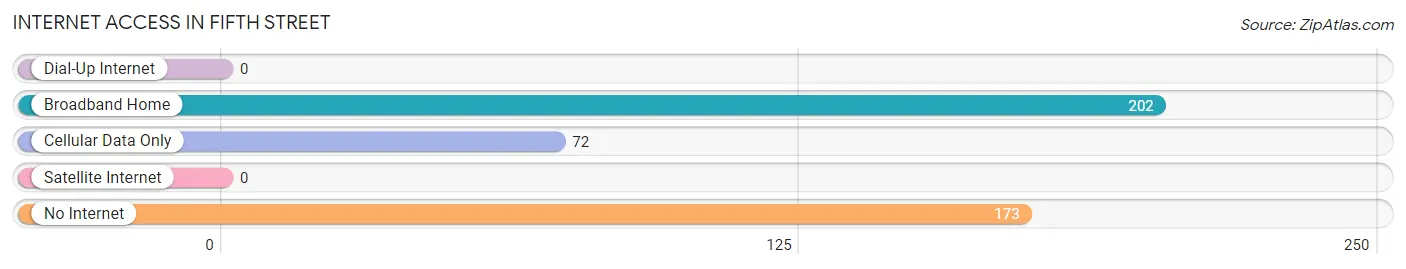
| Internet Type | # Households | % Households |
| Dial-Up Internet | 0 | 0.0% |
| Broadband Home | 202 | 45.2% |
| Cellular Data Only | 72 | 16.1% |
| Satellite Internet | 0 | 0.0% |
| No Internet | 173 | 38.7% |
| Total | 447 | 100.0% |
Fifth Street Summary
Fifth Street is a small town located in the state of Texas, United States. It is situated in the county of Collin, and is part of the Dallas-Fort Worth-Arlington metropolitan area. The town has a population of approximately 1,000 people, and is located about 25 miles north of Dallas.
History
The town of Fifth Street was founded in 1872 by a group of settlers from the nearby town of McKinney. The settlers were looking for a place to settle and start a new life, and they chose the area around Fifth Street because of its proximity to the railroad. The town was named after the fifth street that ran through the area, and it quickly grew into a thriving community.
The town was home to a variety of businesses, including a general store, a blacksmith shop, a livery stable, and a hotel. The town also had a school, a post office, and a church. The town was a popular stop for travelers, and it was also a popular destination for farmers and ranchers.
In the early 1900s, the town began to decline as the railroad moved away and the population began to move away as well. The town was eventually abandoned in the 1950s, and it remained largely forgotten until the late 1990s when it was rediscovered by a group of local historians.
Geography
Fifth Street is located in the northern part of Collin County, Texas. It is situated about 25 miles north of Dallas, and is bordered by the towns of McKinney, Anna, and Melissa. The town is located in a rural area, and is surrounded by rolling hills and farmland. The town is located on the banks of the Trinity River, and is home to a variety of wildlife, including deer, wild turkeys, and other small animals.
Economy
The economy of Fifth Street is largely based on agriculture and tourism. The town is home to a variety of farms, and the surrounding area is known for its production of hay, corn, and other crops. The town is also home to a number of small businesses, including a general store, a restaurant, and a bed and breakfast.
The town is also a popular destination for tourists, and it is home to a variety of attractions, including a historic church, a museum, and a number of antique stores. The town is also home to a number of festivals and events throughout the year, including the annual Fourth of July celebration.
Demographics
As of the 2010 census, the population of Fifth Street was 1,000 people. The town is predominantly white, with about 90% of the population being Caucasian. The town also has a small Hispanic population, with about 5% of the population being of Hispanic or Latino origin. The median household income in the town is $45,000, and the median home value is $150,000.
Common Questions
What is Per Capita Income in Fifth Street?
Per Capita income in Fifth Street is $9,976.
What is the Median Family Income in Fifth Street?
Median Family Income in Fifth Street is $39,223.
What is the Median Household income in Fifth Street?
Median Household Income in Fifth Street is $38,539.
What is Income or Wage Gap in Fifth Street?
Income or Wage Gap in Fifth Street is 38.7%.
Women in Fifth Street earn 61.3 cents for every dollar earned by a man.
What is Inequality or Gini Index in Fifth Street?
Inequality or Gini Index in Fifth Street is 0.24.
What is the Total Population of Fifth Street?
Total Population of Fifth Street is 1,523.
What is the Total Male Population of Fifth Street?
Total Male Population of Fifth Street is 772.
What is the Total Female Population of Fifth Street?
Total Female Population of Fifth Street is 751.
What is the Ratio of Males per 100 Females in Fifth Street?
There are 102.80 Males per 100 Females in Fifth Street.
What is the Ratio of Females per 100 Males in Fifth Street?
There are 97.28 Females per 100 Males in Fifth Street.
What is the Median Population Age in Fifth Street?
Median Population Age in Fifth Street is 17.9 Years.
What is the Average Family Size in Fifth Street
Average Family Size in Fifth Street is 3.3 People.
What is the Average Household Size in Fifth Street
Average Household Size in Fifth Street is 3.4 People.
How Large is the Labor Force in Fifth Street?
There are 441 People in the Labor Forcein in Fifth Street.
What is the Percentage of People in the Labor Force in Fifth Street?
56.5% of People are in the Labor Force in Fifth Street.