Fabrica, TX Map & Demographics
Fabrica Map
Fabrica Overview
$10,706
PER CAPITA INCOME
$35,784
AVG HOUSEHOLD INCOME
0.23
INEQUALITY / GINI INDEX
918
TOTAL POPULATION
526
MALE POPULATION
392
FEMALE POPULATION
134.18
MALES / 100 FEMALES
74.52
FEMALES / 100 MALES
31.4
MEDIAN AGE
4.7
AVG FAMILY SIZE
3.6
AVG HOUSEHOLD SIZE
256
LABOR FORCE [ PEOPLE ]
41.0%
PERCENT IN LABOR FORCE
12.5%
UNEMPLOYMENT RATE
Income in Fabrica
Income Overview in Fabrica
| Characteristic | Number | Measure |
| Per Capita Income | 918 | $10,706 |
| Median Family Income | 123 | $0 |
| Mean Family Income | 123 | $18,602 |
| Median Household Income | 256 | $35,784 |
| Mean Household Income | 256 | $32,113 |
| Income Deficit | 123 | $0 |
| Wage / Income Gap (%) | 918 | 0.00% |
| Wage / Income Gap ($) | 918 | 100.00¢ per $1 |
| Gini / Inequality Index | 918 | 0.23 |
Earnings by Sex in Fabrica
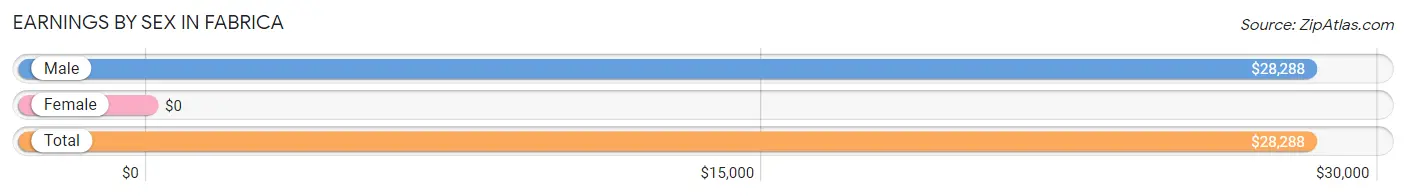
| Sex | Number | Average Earnings |
| Male | 326 (100.0%) | $28,288 |
| Female | 0 (0.0%) | $0 |
| Total | 326 (100.0%) | $28,288 |
Earnings by Sex by Income Bracket in Fabrica
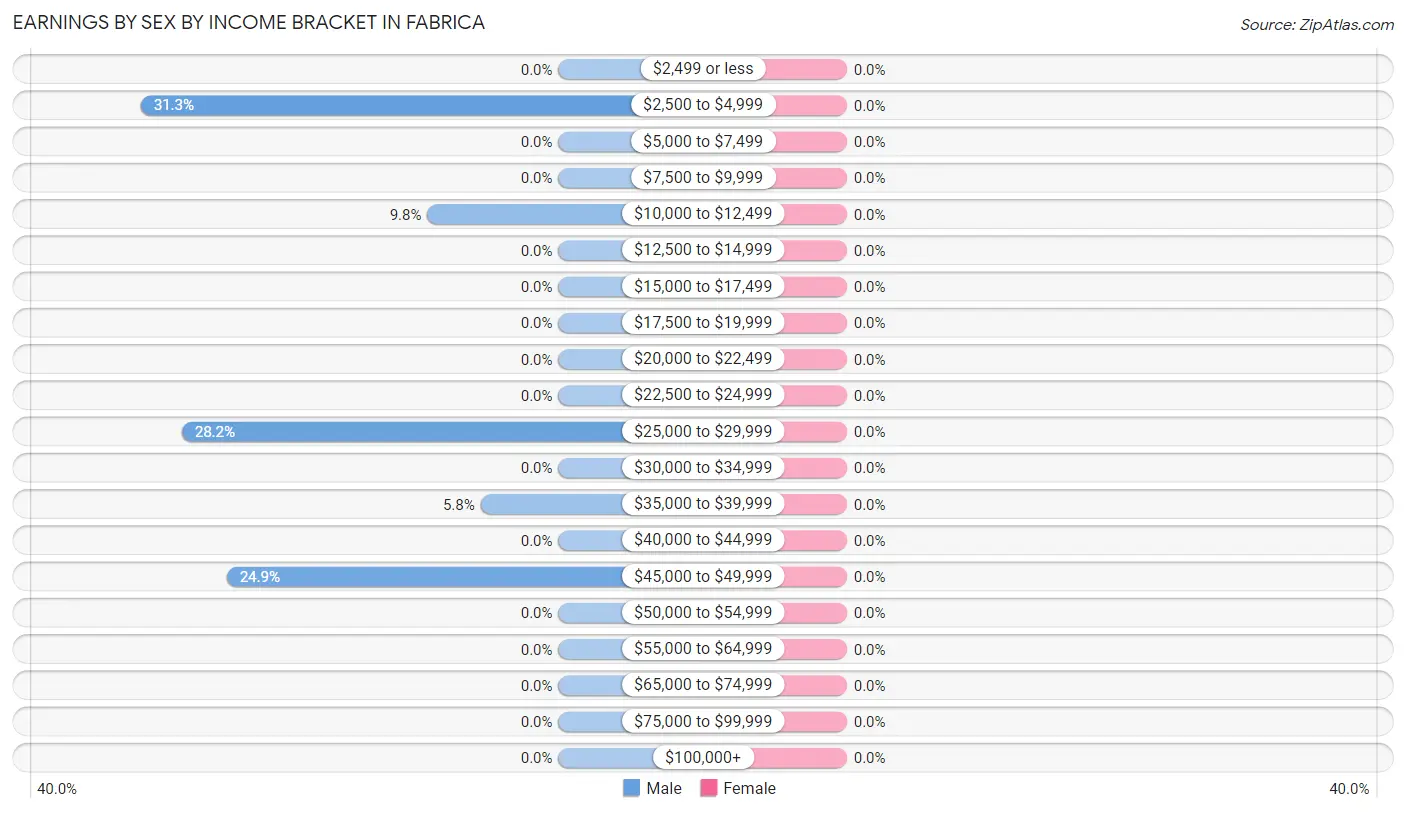
| Income | Male | Female |
| $2,499 or less | 0 (0.0%) | 0 (0.0%) |
| $2,500 to $4,999 | 102 (31.3%) | 0 (0.0%) |
| $5,000 to $7,499 | 0 (0.0%) | 0 (0.0%) |
| $7,500 to $9,999 | 0 (0.0%) | 0 (0.0%) |
| $10,000 to $12,499 | 32 (9.8%) | 0 (0.0%) |
| $12,500 to $14,999 | 0 (0.0%) | 0 (0.0%) |
| $15,000 to $17,499 | 0 (0.0%) | 0 (0.0%) |
| $17,500 to $19,999 | 0 (0.0%) | 0 (0.0%) |
| $20,000 to $22,499 | 0 (0.0%) | 0 (0.0%) |
| $22,500 to $24,999 | 0 (0.0%) | 0 (0.0%) |
| $25,000 to $29,999 | 92 (28.2%) | 0 (0.0%) |
| $30,000 to $34,999 | 0 (0.0%) | 0 (0.0%) |
| $35,000 to $39,999 | 19 (5.8%) | 0 (0.0%) |
| $40,000 to $44,999 | 0 (0.0%) | 0 (0.0%) |
| $45,000 to $49,999 | 81 (24.8%) | 0 (0.0%) |
| $50,000 to $54,999 | 0 (0.0%) | 0 (0.0%) |
| $55,000 to $64,999 | 0 (0.0%) | 0 (0.0%) |
| $65,000 to $74,999 | 0 (0.0%) | 0 (0.0%) |
| $75,000 to $99,999 | 0 (0.0%) | 0 (0.0%) |
| $100,000+ | 0 (0.0%) | 0 (0.0%) |
| Total | 326 (100.0%) | 0 (0.0%) |
Earnings by Sex by Educational Attainment in Fabrica
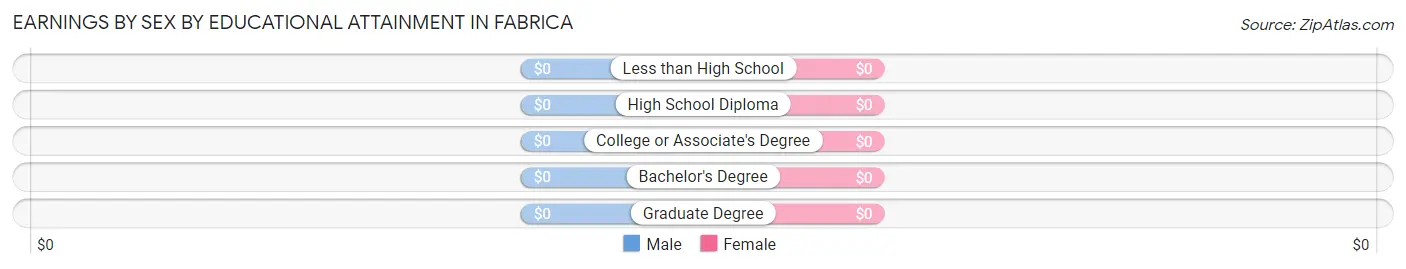
| Educational Attainment | Male Income | Female Income |
| Less than High School | - | - |
| High School Diploma | - | - |
| College or Associate's Degree | - | - |
| Bachelor's Degree | - | - |
| Graduate Degree | - | - |
| Total | $28,288 | $0 |
Family Income in Fabrica
Family Income Brackets in Fabrica
According to the Fabrica family income data, there are 36 families falling into the less than $10,000 income range, which is the most common income bracket and makes up 29.3% of all families.
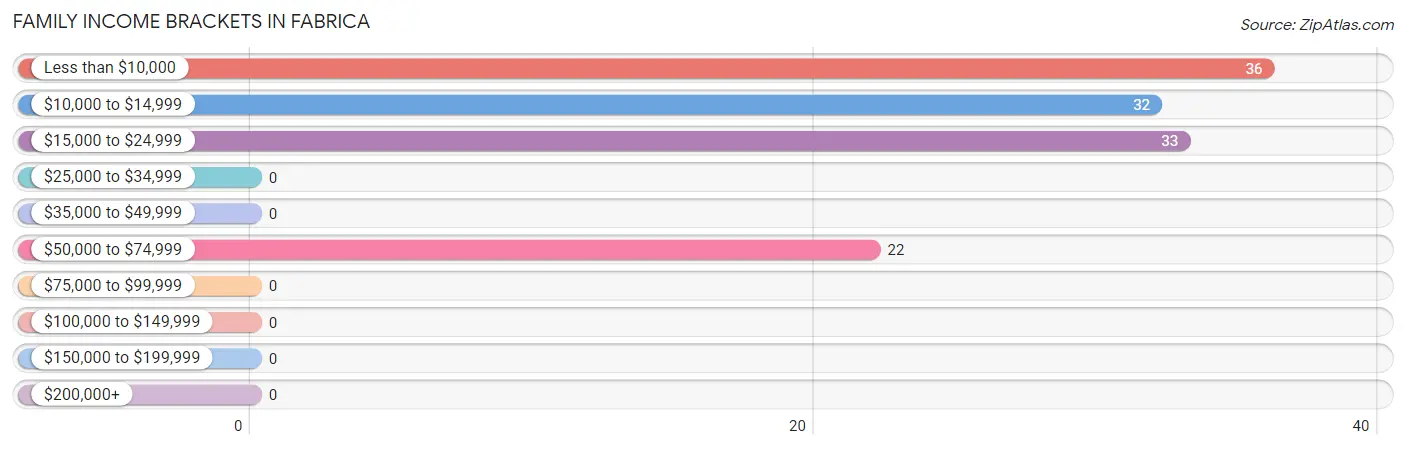
| Income Bracket | # Families | % Families |
| Less than $10,000 | 36 | 29.3% |
| $10,000 to $14,999 | 32 | 26.0% |
| $15,000 to $24,999 | 33 | 26.8% |
| $25,000 to $34,999 | 0 | 0.0% |
| $35,000 to $49,999 | 0 | 0.0% |
| $50,000 to $74,999 | 22 | 17.9% |
| $75,000 to $99,999 | 0 | 0.0% |
| $100,000 to $149,999 | 0 | 0.0% |
| $150,000 to $199,999 | 0 | 0.0% |
| $200,000+ | 0 | 0.0% |
Family Income by Famaliy Size in Fabrica
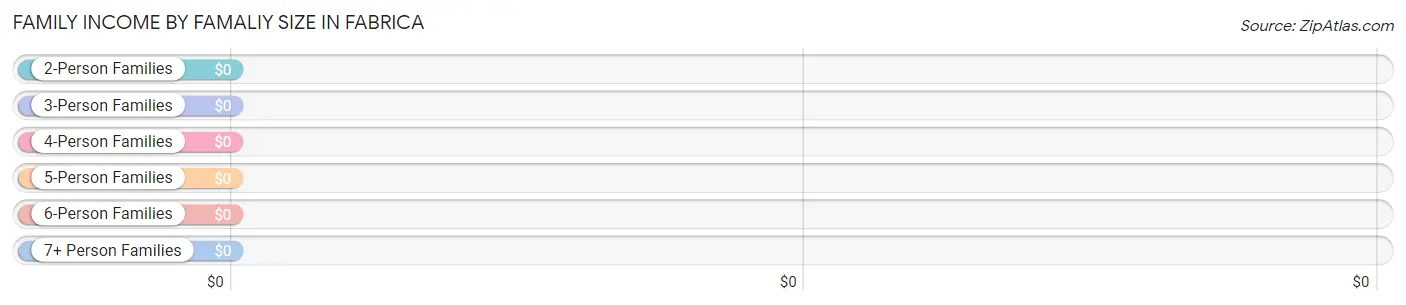
| Income Bracket | # Families | Median Income |
| 2-Person Families | 87 (70.7%) | $0 |
| 3-Person Families | 0 (0.0%) | $0 |
| 4-Person Families | 0 (0.0%) | $0 |
| 5-Person Families | 0 (0.0%) | $0 |
| 6-Person Families | 36 (29.3%) | $0 |
| 7+ Person Families | 0 (0.0%) | $0 |
| Total | 123 (100.0%) | $0 |
Family Income by Number of Earners in Fabrica
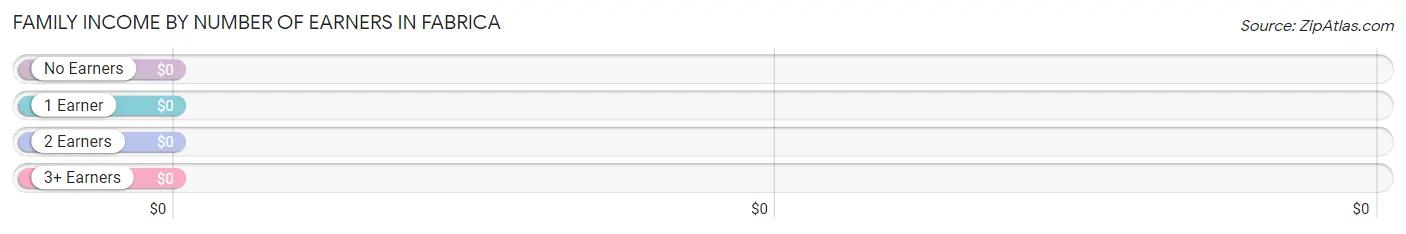
| Number of Earners | # Families | Median Income |
| No Earners | 69 (56.1%) | $0 |
| 1 Earner | 54 (43.9%) | $0 |
| 2 Earners | 0 (0.0%) | $0 |
| 3+ Earners | 0 (0.0%) | $0 |
| Total | 123 (100.0%) | $0 |
Household Income in Fabrica
Household Income Brackets in Fabrica
With 138 households falling in the category, the $35,000 to $49,999 income range is the most frequent in Fabrica, accounting for 53.9% of all households.
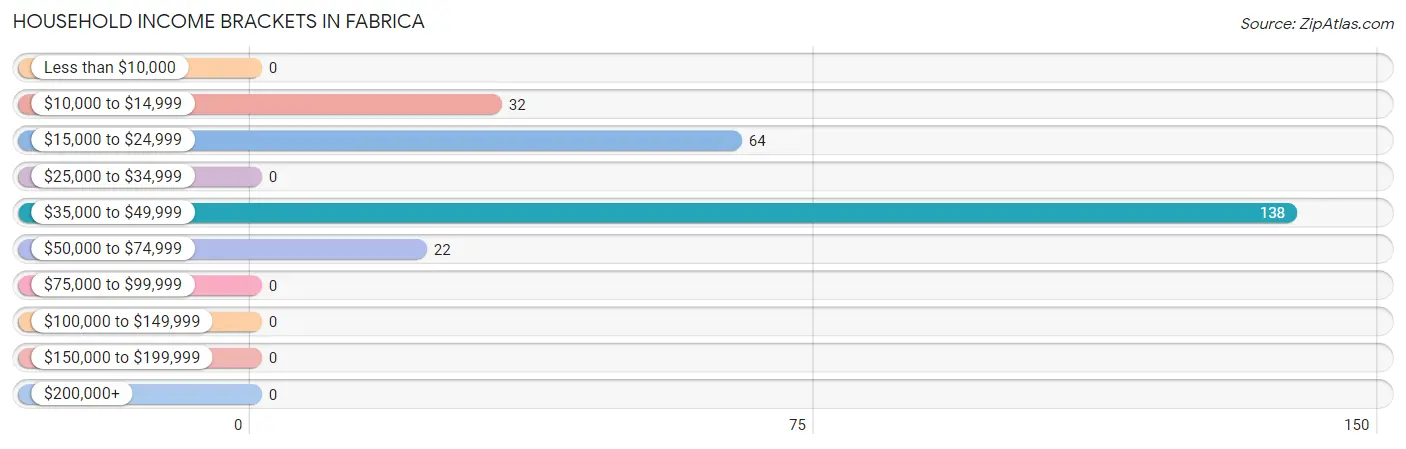
| Income Bracket | # Households | % Households |
| Less than $10,000 | 0 | 0.0% |
| $10,000 to $14,999 | 32 | 12.5% |
| $15,000 to $24,999 | 64 | 25.0% |
| $25,000 to $34,999 | 0 | 0.0% |
| $35,000 to $49,999 | 138 | 53.9% |
| $50,000 to $74,999 | 22 | 8.6% |
| $75,000 to $99,999 | 0 | 0.0% |
| $100,000 to $149,999 | 0 | 0.0% |
| $150,000 to $199,999 | 0 | 0.0% |
| $200,000+ | 0 | 0.0% |
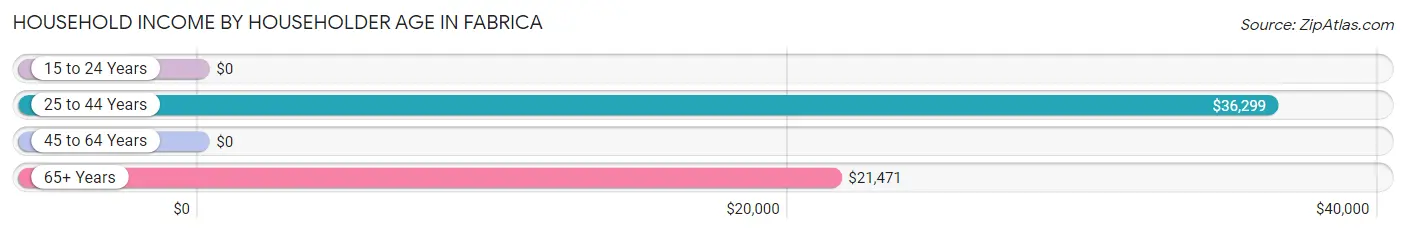
Household Income by Householder Age in Fabrica
The median household income in Fabrica is $35,784, with the highest median household income of $36,299 found in the 25 to 44 years age bracket for the primary householder. A total of 170 households (66.4%) fall into this category.
| Income Bracket | # Households | Median Income |
| 15 to 24 Years | 0 (0.0%) | $0 |
| 25 to 44 Years | 170 (66.4%) | $36,299 |
| 45 to 64 Years | 0 (0.0%) | $0 |
| 65+ Years | 86 (33.6%) | $21,471 |
| Total | 256 (100.0%) | $35,784 |
Poverty in Fabrica
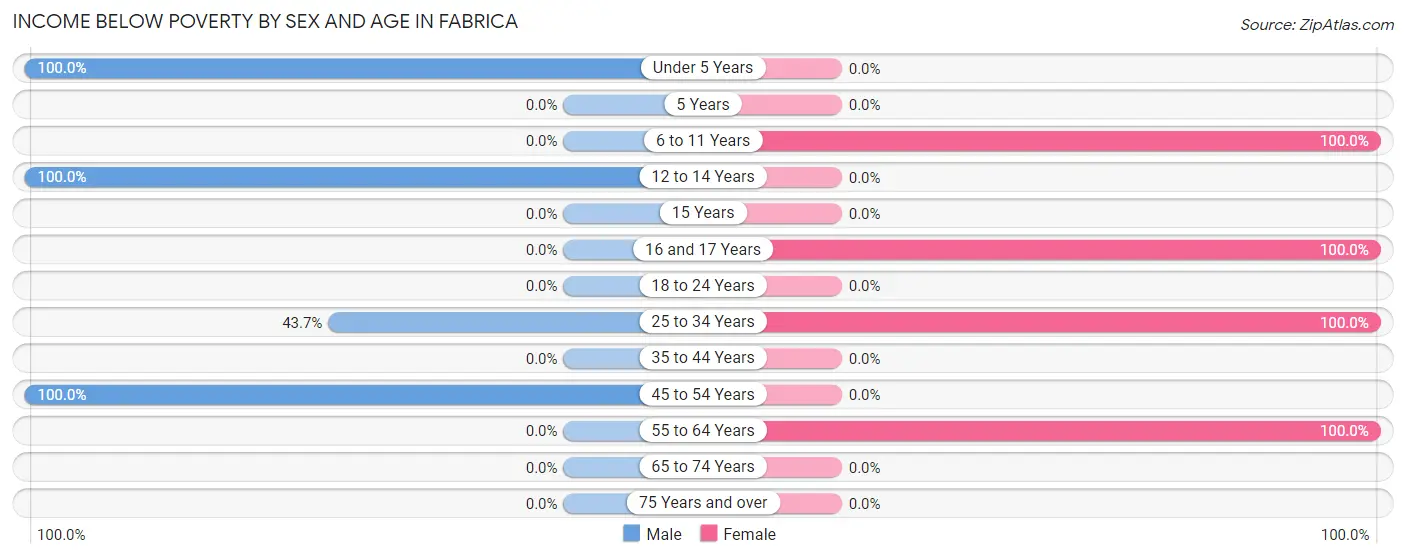
Income Below Poverty by Sex and Age in Fabrica
With 54.7% poverty level for males and 81.4% for females among the residents of Fabrica, under 5 year old males and 6 to 11 year old females are the most vulnerable to poverty, with 75 males (100.0%) and 172 females (100.0%) in their respective age groups living below the poverty level.
| Age Bracket | Male | Female |
| Under 5 Years | 75 (100.0%) | 0 (0.0%) |
| 5 Years | 0 (0.0%) | 0 (0.0%) |
| 6 to 11 Years | 0 (0.0%) | 172 (100.0%) |
| 12 to 14 Years | 47 (100.0%) | 0 (0.0%) |
| 15 Years | 0 (0.0%) | 0 (0.0%) |
| 16 and 17 Years | 0 (0.0%) | 93 (100.0%) |
| 18 to 24 Years | 0 (0.0%) | 0 (0.0%) |
| 25 to 34 Years | 134 (43.6%) | 36 (100.0%) |
| 35 to 44 Years | 0 (0.0%) | 0 (0.0%) |
| 45 to 54 Years | 32 (100.0%) | 0 (0.0%) |
| 55 to 64 Years | 0 (0.0%) | 18 (100.0%) |
| 65 to 74 Years | 0 (0.0%) | 0 (0.0%) |
| 75 Years and over | 0 (0.0%) | 0 (0.0%) |
| Total | 288 (54.7%) | 319 (81.4%) |
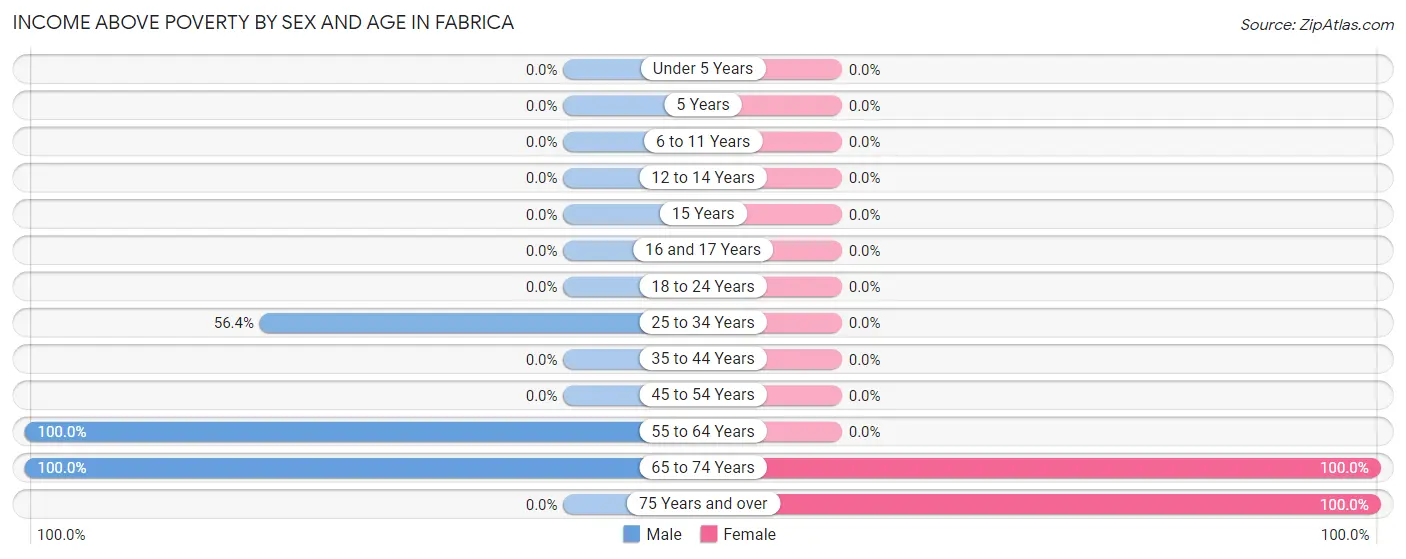
Income Above Poverty by Sex and Age in Fabrica
According to the poverty statistics in Fabrica, males aged 55 to 64 years and females aged 65 to 74 years are the age groups that are most secure financially, with 100.0% of males and 100.0% of females in these age groups living above the poverty line.
| Age Bracket | Male | Female |
| Under 5 Years | 0 (0.0%) | 0 (0.0%) |
| 5 Years | 0 (0.0%) | 0 (0.0%) |
| 6 to 11 Years | 0 (0.0%) | 0 (0.0%) |
| 12 to 14 Years | 0 (0.0%) | 0 (0.0%) |
| 15 Years | 0 (0.0%) | 0 (0.0%) |
| 16 and 17 Years | 0 (0.0%) | 0 (0.0%) |
| 18 to 24 Years | 0 (0.0%) | 0 (0.0%) |
| 25 to 34 Years | 173 (56.4%) | 0 (0.0%) |
| 35 to 44 Years | 0 (0.0%) | 0 (0.0%) |
| 45 to 54 Years | 0 (0.0%) | 0 (0.0%) |
| 55 to 64 Years | 19 (100.0%) | 0 (0.0%) |
| 65 to 74 Years | 46 (100.0%) | 33 (100.0%) |
| 75 Years and over | 0 (0.0%) | 40 (100.0%) |
| Total | 238 (45.3%) | 73 (18.6%) |
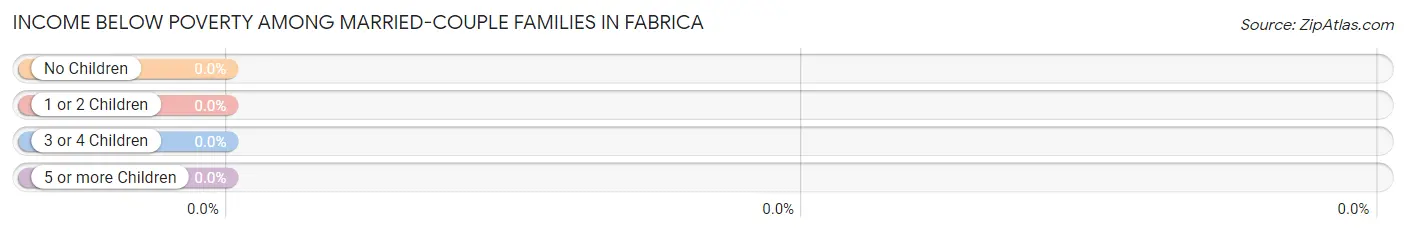
Income Below Poverty Among Married-Couple Families in Fabrica
| Children | Above Poverty | Below Poverty |
| No Children | 33 (100.0%) | 0 (0.0%) |
| 1 or 2 Children | 0 (0.0%) | 0 (0.0%) |
| 3 or 4 Children | 0 (0.0%) | 0 (0.0%) |
| 5 or more Children | 0 (0.0%) | 0 (0.0%) |
| Total | 33 (100.0%) | 0 (0.0%) |
Income Below Poverty Among Single-Parent Households in Fabrica
According to the poverty data in Fabrica, 100.0% or 32 single-father households and 62.1% or 36 single-mother households are living below the poverty line. Among single-father households, those with no children have the highest poverty rate, with 32 households (100.0%) experiencing poverty. Likewise, among single-mother households, those with 5 or more children have the highest poverty rate, with 36 households (100.0%) falling below the poverty line.
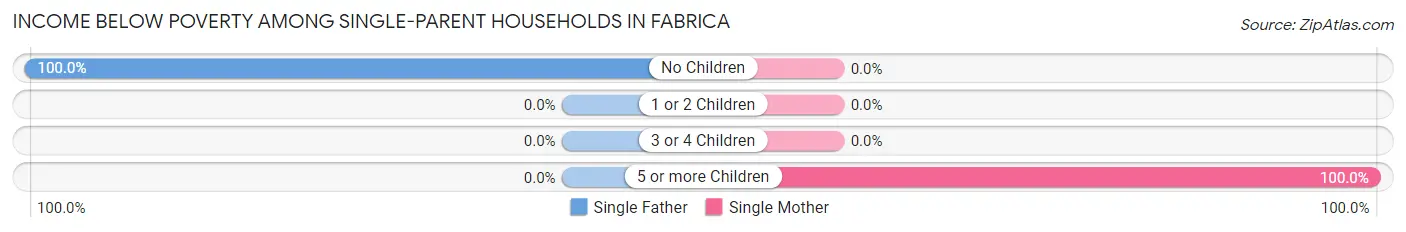
| Children | Single Father | Single Mother |
| No Children | 32 (100.0%) | 0 (0.0%) |
| 1 or 2 Children | 0 (0.0%) | 0 (0.0%) |
| 3 or 4 Children | 0 (0.0%) | 0 (0.0%) |
| 5 or more Children | 0 (0.0%) | 36 (100.0%) |
| Total | 32 (100.0%) | 36 (62.1%) |
Income Below Poverty Among Married-Couple vs Single-Parent Households in Fabrica
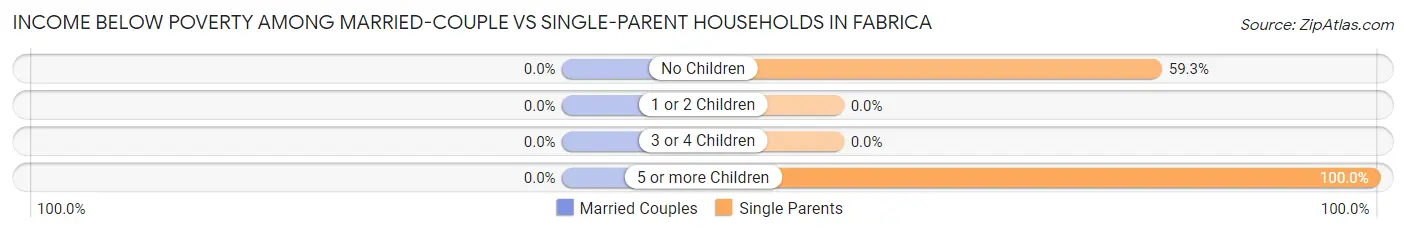
| Children | Married-Couple Families | Single-Parent Households |
| No Children | 0 (0.0%) | 32 (59.3%) |
| 1 or 2 Children | 0 (0.0%) | 0 (0.0%) |
| 3 or 4 Children | 0 (0.0%) | 0 (0.0%) |
| 5 or more Children | 0 (0.0%) | 36 (100.0%) |
| Total | 0 (0.0%) | 68 (75.6%) |
Race in Fabrica
The most populous races in Fabrica are Hispanic or Latino (918 | 100.0%), Two or more Races (504 | 54.9%), and White / Caucasian (364 | 39.7%).
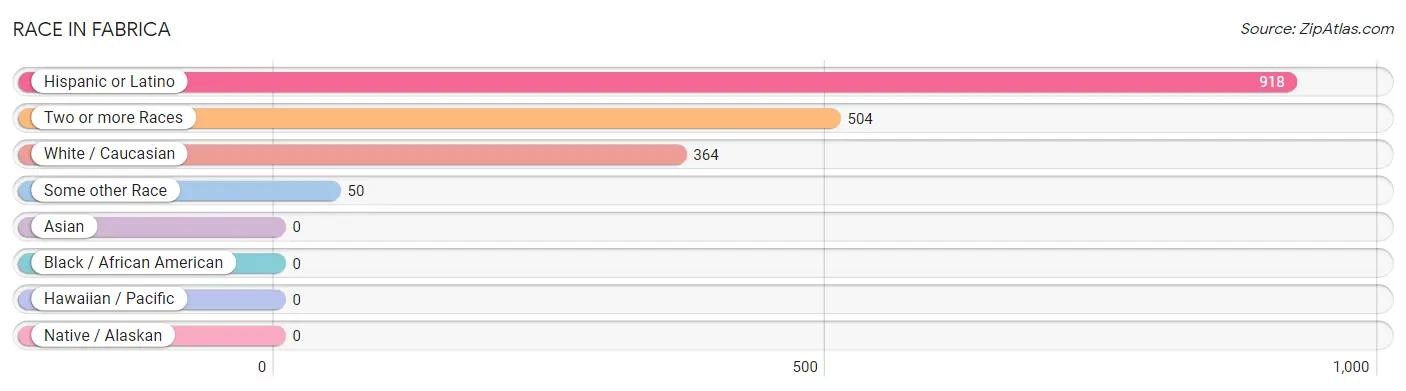
| Race | # Population | % Population |
| Asian | 0 | 0.0% |
| Black / African American | 0 | 0.0% |
| Hawaiian / Pacific | 0 | 0.0% |
| Hispanic or Latino | 918 | 100.0% |
| Native / Alaskan | 0 | 0.0% |
| White / Caucasian | 364 | 39.7% |
| Two or more Races | 504 | 54.9% |
| Some other Race | 50 | 5.4% |
| Total | 918 | 100.0% |
Ancestry in Fabrica
The most populous ancestries reported in Fabrica are , and Mexican (918 | 100.0%), together accounting for 100.0% of all Fabrica residents.

| Ancestry | # Population | % Population |
| Mexican | 918 | 100.0% | View All 1 Rows |
Immigrants in Fabrica
The most numerous immigrant groups reported in Fabrica came from Central America (215 | 23.4%), Latin America (215 | 23.4%), and Mexico (215 | 23.4%), together accounting for 70.3% of all Fabrica residents.
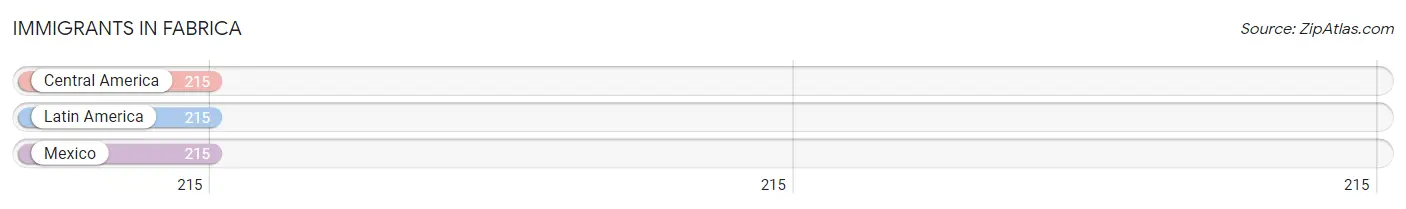
| Immigration Origin | # Population | % Population |
| Central America | 215 | 23.4% |
| Latin America | 215 | 23.4% |
| Mexico | 215 | 23.4% | View All 3 Rows |
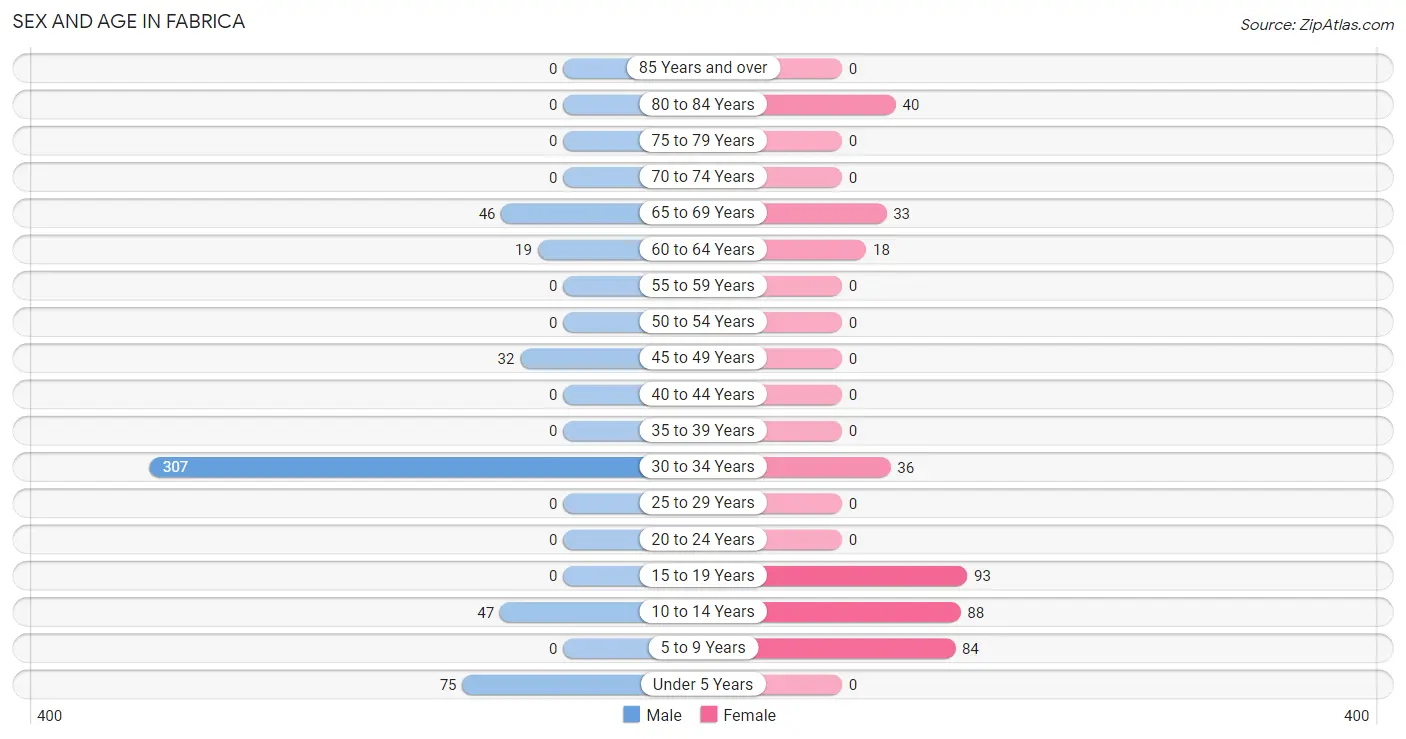
Sex and Age in Fabrica
Sex and Age in Fabrica
The most populous age groups in Fabrica are 30 to 34 Years (307 | 58.4%) for men and 15 to 19 Years (93 | 23.7%) for women.
| Age Bracket | Male | Female |
| Under 5 Years | 75 (14.3%) | 0 (0.0%) |
| 5 to 9 Years | 0 (0.0%) | 84 (21.4%) |
| 10 to 14 Years | 47 (8.9%) | 88 (22.5%) |
| 15 to 19 Years | 0 (0.0%) | 93 (23.7%) |
| 20 to 24 Years | 0 (0.0%) | 0 (0.0%) |
| 25 to 29 Years | 0 (0.0%) | 0 (0.0%) |
| 30 to 34 Years | 307 (58.4%) | 36 (9.2%) |
| 35 to 39 Years | 0 (0.0%) | 0 (0.0%) |
| 40 to 44 Years | 0 (0.0%) | 0 (0.0%) |
| 45 to 49 Years | 32 (6.1%) | 0 (0.0%) |
| 50 to 54 Years | 0 (0.0%) | 0 (0.0%) |
| 55 to 59 Years | 0 (0.0%) | 0 (0.0%) |
| 60 to 64 Years | 19 (3.6%) | 18 (4.6%) |
| 65 to 69 Years | 46 (8.7%) | 33 (8.4%) |
| 70 to 74 Years | 0 (0.0%) | 0 (0.0%) |
| 75 to 79 Years | 0 (0.0%) | 0 (0.0%) |
| 80 to 84 Years | 0 (0.0%) | 40 (10.2%) |
| 85 Years and over | 0 (0.0%) | 0 (0.0%) |
| Total | 526 (100.0%) | 392 (100.0%) |
Families and Households in Fabrica
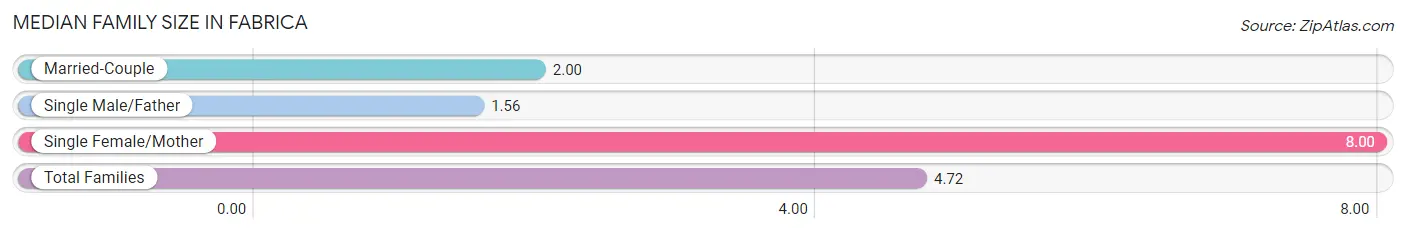
Median Family Size in Fabrica
The median family size in Fabrica is 4.72 persons per family, with single female/mother families (58 | 47.1%) accounting for the largest median family size of 8 persons per family. On the other hand, single male/father families (32 | 26.0%) represent the smallest median family size with 1.56 persons per family.
| Family Type | # Families | Family Size |
| Married-Couple | 33 (26.8%) | 2.00 |
| Single Male/Father | 32 (26.0%) | 1.56 |
| Single Female/Mother | 58 (47.1%) | 8.00 |
| Total Families | 123 (100.0%) | 4.72 |
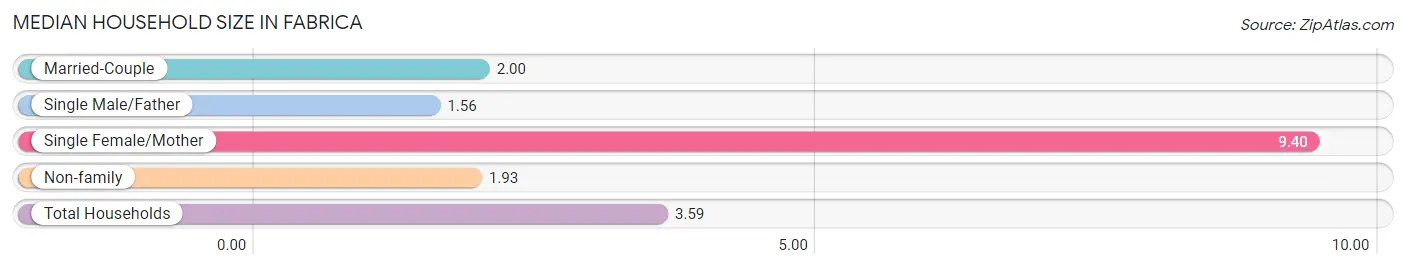
Median Household Size in Fabrica
The median household size in Fabrica is 3.59 persons per household, with single female/mother households (58 | 22.7%) accounting for the largest median household size of 9.4 persons per household. single male/father households (32 | 12.5%) represent the smallest median household size with 1.56 persons per household.
| Household Type | # Households | Household Size |
| Married-Couple | 33 (12.9%) | 2.00 |
| Single Male/Father | 32 (12.5%) | 1.56 |
| Single Female/Mother | 58 (22.7%) | 9.40 |
| Non-family | 133 (51.9%) | 1.93 |
| Total Households | 256 (100.0%) | 3.59 |
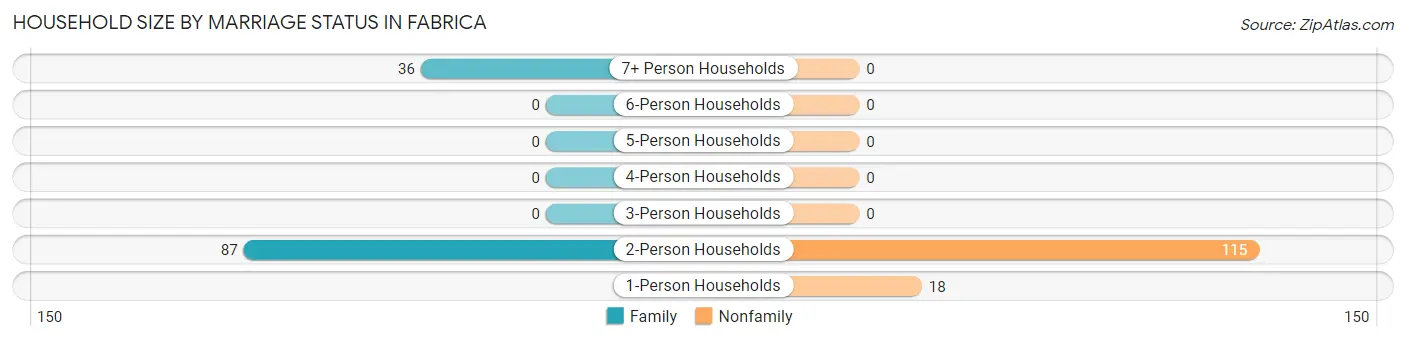
Household Size by Marriage Status in Fabrica
Out of a total of 256 households in Fabrica, 123 (48.0%) are family households, while 133 (51.9%) are nonfamily households. The most numerous type of family households are 2-person households, comprising 87, and the most common type of nonfamily households are 2-person households, comprising 115.
| Household Size | Family Households | Nonfamily Households |
| 1-Person Households | - | 18 (7.0%) |
| 2-Person Households | 87 (34.0%) | 115 (44.9%) |
| 3-Person Households | 0 (0.0%) | 0 (0.0%) |
| 4-Person Households | 0 (0.0%) | 0 (0.0%) |
| 5-Person Households | 0 (0.0%) | 0 (0.0%) |
| 6-Person Households | 0 (0.0%) | 0 (0.0%) |
| 7+ Person Households | 36 (14.1%) | 0 (0.0%) |
| Total | 123 (48.0%) | 133 (51.9%) |
Female Fertility in Fabrica
Fertility by Age in Fabrica
| Age Bracket | Women with Births | Births / 1,000 Women |
| 15 to 19 years | 0 (0.0%) | 0.0 |
| 20 to 34 years | 0 (0.0%) | 0.0 |
| 35 to 50 years | 0 (0.0%) | 0.0 |
| Total | 0 (0.0%) | 0.0 |
Fertility by Age by Marriage Status in Fabrica
| Age Bracket | Married | Unmarried |
| 15 to 19 years | 0 (0.0%) | 0 (0.0%) |
| 20 to 34 years | 0 (0.0%) | 0 (0.0%) |
| 35 to 50 years | 0 (0.0%) | 0 (0.0%) |
| Total | 0 (0.0%) | 0 (0.0%) |
Fertility by Education in Fabrica
| Educational Attainment | Women with Births | Births / 1,000 Women |
| Less than High School | 0 (0.0%) | 0.0 |
| High School Diploma | 0 (0.0%) | 0.0 |
| College or Associate's Degree | 0 (0.0%) | 0.0 |
| Bachelor's Degree | 0 (0.0%) | 0.0 |
| Graduate Degree | 0 (0.0%) | 0.0 |
| Total | 0 (0.0%) | 0.0 |
Fertility by Education by Marriage Status in Fabrica
| Educational Attainment | Married | Unmarried |
| Less than High School | 0 (0.0%) | 0 (0.0%) |
| High School Diploma | 0 (0.0%) | 0 (0.0%) |
| College or Associate's Degree | 0 (0.0%) | 0 (0.0%) |
| Bachelor's Degree | 0 (0.0%) | 0 (0.0%) |
| Graduate Degree | 0 (0.0%) | 0 (0.0%) |
| Total | 0 (0.0%) | 0 (0.0%) |
Employment Characteristics in Fabrica
Employment by Class of Employer in Fabrica
Among the 224 employed individuals in Fabrica, , and private company employees (224 | 100.0%) make up the most common classes of employment.
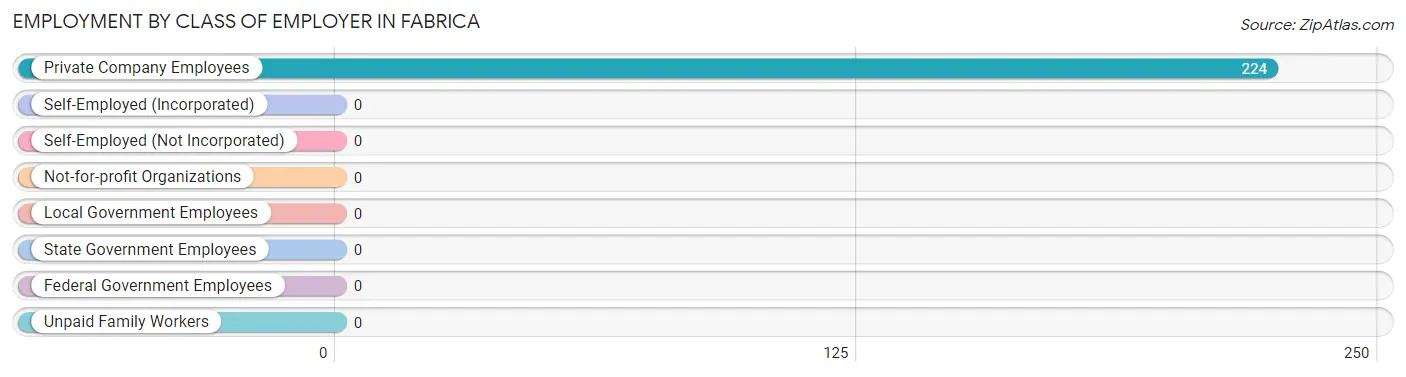
| Employer Class | # Employees | % Employees |
| Private Company Employees | 224 | 100.0% |
| Self-Employed (Incorporated) | 0 | 0.0% |
| Self-Employed (Not Incorporated) | 0 | 0.0% |
| Not-for-profit Organizations | 0 | 0.0% |
| Local Government Employees | 0 | 0.0% |
| State Government Employees | 0 | 0.0% |
| Federal Government Employees | 0 | 0.0% |
| Unpaid Family Workers | 0 | 0.0% |
| Total | 224 | 100.0% |
Employment Status by Age in Fabrica
According to the labor force statistics for Fabrica, out of the total population over 16 years of age (624), 41.0% or 256 individuals are in the labor force, with 12.5% or 32 of them unemployed. The age group with the highest labor force participation rate is 45 to 54 years, with 100.0% or 32 individuals in the labor force. Within the labor force, the 45 to 54 years age range has the highest percentage of unemployed individuals, with 100.0% or 32 of them being unemployed.
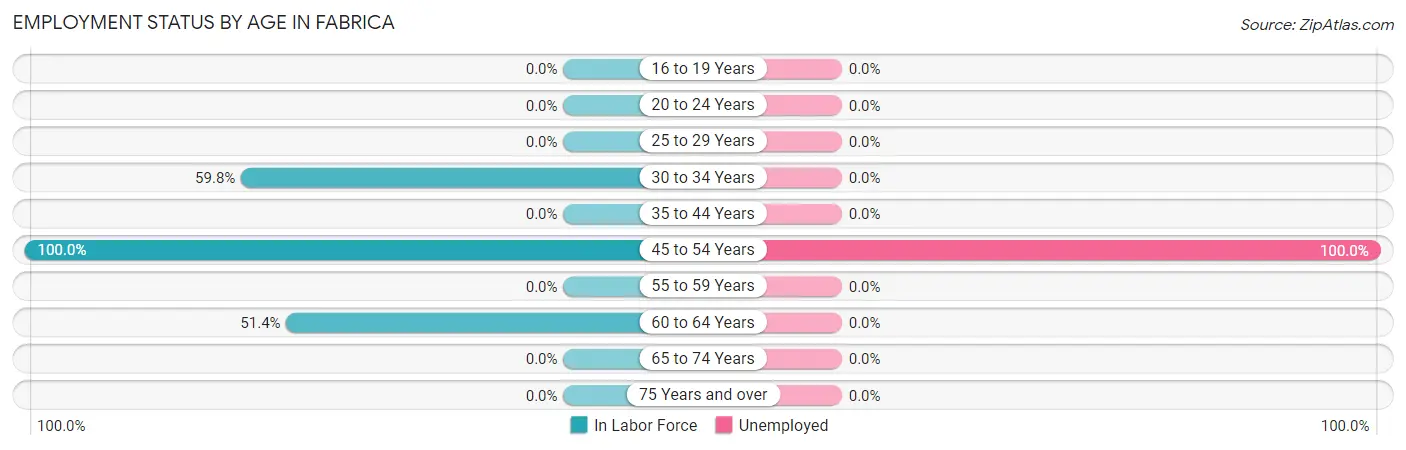
| Age Bracket | In Labor Force | Unemployed |
| 16 to 19 Years | 0 (0.0%) | 0 (0.0%) |
| 20 to 24 Years | 0 (0.0%) | 0 (0.0%) |
| 25 to 29 Years | 0 (0.0%) | 0 (0.0%) |
| 30 to 34 Years | 205 (59.8%) | 0 (0.0%) |
| 35 to 44 Years | 0 (0.0%) | 0 (0.0%) |
| 45 to 54 Years | 32 (100.0%) | 32 (100.0%) |
| 55 to 59 Years | 0 (0.0%) | 0 (0.0%) |
| 60 to 64 Years | 19 (51.4%) | 0 (0.0%) |
| 65 to 74 Years | 0 (0.0%) | 0 (0.0%) |
| 75 Years and over | 0 (0.0%) | 0 (0.0%) |
| Total | 256 (41.0%) | 32 (12.5%) |
Employment Status by Educational Attainment in Fabrica
According to labor force statistics for Fabrica, 62.1% of individuals (256) out of the total population between 25 and 64 years of age (412) are in the labor force, with 12.5% or 32 of them being unemployed. The group with the highest labor force participation rate are those with the educational attainment of high school diploma, with 100.0% or 143 individuals in the labor force. Within the labor force, individuals with high school diploma education have the highest percentage of unemployment, with 22.4% or 32 of them being unemployed.
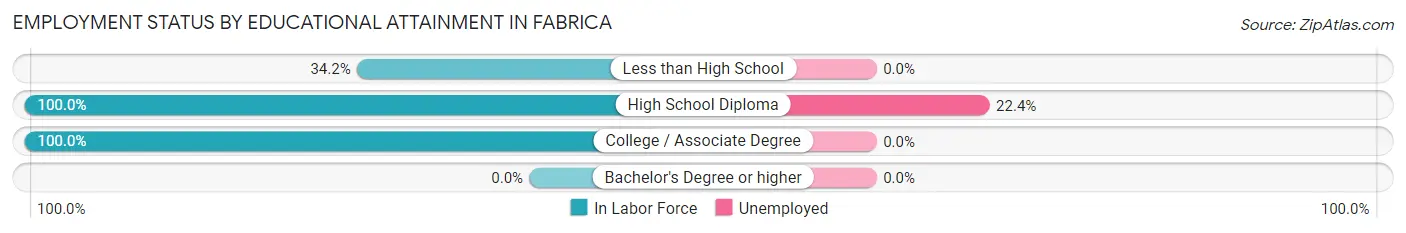
| Educational Attainment | In Labor Force | Unemployed |
| Less than High School | 81 (34.2%) | 0 (0.0%) |
| High School Diploma | 143 (100.0%) | 32 (22.4%) |
| College / Associate Degree | 32 (100.0%) | 0 (0.0%) |
| Bachelor's Degree or higher | 0 (0.0%) | 0 (0.0%) |
| Total | 256 (62.1%) | 52 (12.5%) |
Employment Occupations by Sex in Fabrica
Management, Business, Science and Arts Occupations
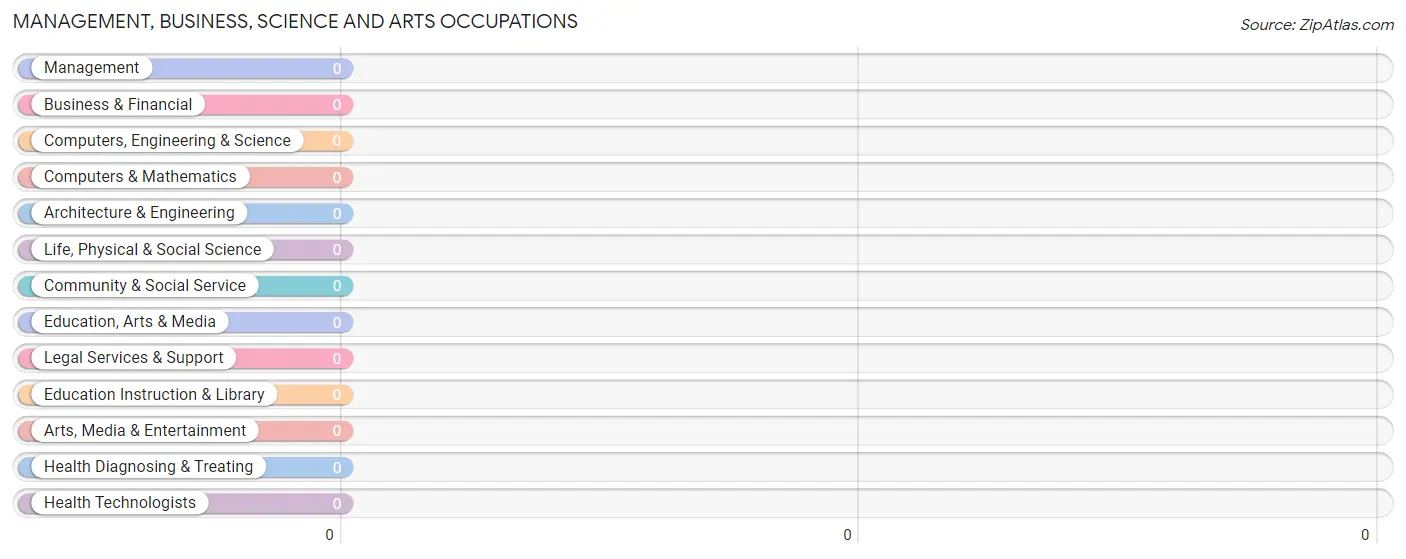
Management, Business, Science and Arts Occupations by Sex
| Occupation | Male | Female |
| Management | 0 (0.0%) | 0 (0.0%) |
| Business & Financial | 0 (0.0%) | 0 (0.0%) |
| Computers, Engineering & Science | 0 (0.0%) | 0 (0.0%) |
| Computers & Mathematics | 0 (0.0%) | 0 (0.0%) |
| Architecture & Engineering | 0 (0.0%) | 0 (0.0%) |
| Life, Physical & Social Science | 0 (0.0%) | 0 (0.0%) |
| Community & Social Service | 0 (0.0%) | 0 (0.0%) |
| Education, Arts & Media | 0 (0.0%) | 0 (0.0%) |
| Legal Services & Support | 0 (0.0%) | 0 (0.0%) |
| Education Instruction & Library | 0 (0.0%) | 0 (0.0%) |
| Arts, Media & Entertainment | 0 (0.0%) | 0 (0.0%) |
| Health Diagnosing & Treating | 0 (0.0%) | 0 (0.0%) |
| Health Technologists | 0 (0.0%) | 0 (0.0%) |
| Total (Category) | 0 (0.0%) | 0 (0.0%) |
| Total (Overall) | 224 (100.0%) | 0 (0.0%) |
Services Occupations
Services Occupations by Sex
| Occupation | Male | Female |
| Healthcare Support | 0 (0.0%) | 0 (0.0%) |
| Security & Protection | 0 (0.0%) | 0 (0.0%) |
| Firefighting & Prevention | 0 (0.0%) | 0 (0.0%) |
| Law Enforcement | 0 (0.0%) | 0 (0.0%) |
| Food Preparation & Serving | 0 (0.0%) | 0 (0.0%) |
| Cleaning & Maintenance | 0 (0.0%) | 0 (0.0%) |
| Personal Care & Service | 0 (0.0%) | 0 (0.0%) |
| Total (Category) | 0 (0.0%) | 0 (0.0%) |
| Total (Overall) | 224 (100.0%) | 0 (0.0%) |
Sales and Office Occupations
The most common Sales and Office occupations in Fabrica are , and Sales & Related (32 | 14.3%).
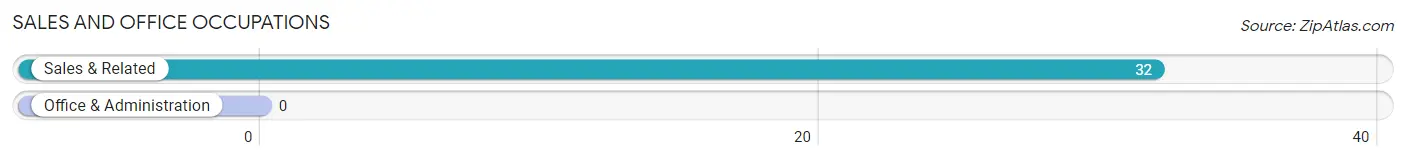
Sales and Office Occupations by Sex
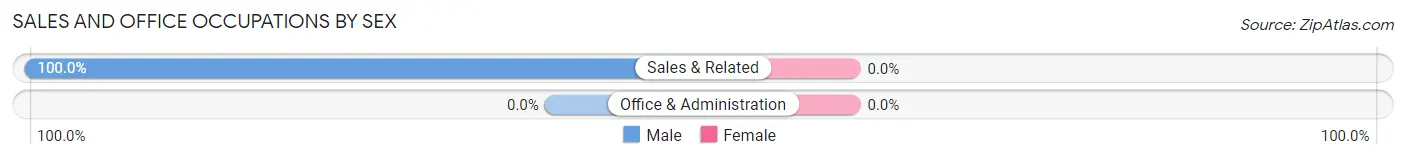
| Occupation | Male | Female |
| Sales & Related | 32 (100.0%) | 0 (0.0%) |
| Office & Administration | 0 (0.0%) | 0 (0.0%) |
| Total (Category) | 32 (100.0%) | 0 (0.0%) |
| Total (Overall) | 224 (100.0%) | 0 (0.0%) |
Natural Resources, Construction and Maintenance Occupations
Natural Resources, Construction and Maintenance Occupations by Sex
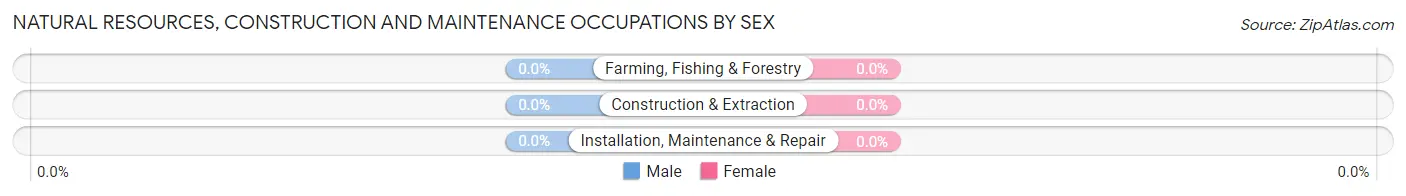
| Occupation | Male | Female |
| Farming, Fishing & Forestry | 0 (0.0%) | 0 (0.0%) |
| Construction & Extraction | 0 (0.0%) | 0 (0.0%) |
| Installation, Maintenance & Repair | 0 (0.0%) | 0 (0.0%) |
| Total (Category) | 0 (0.0%) | 0 (0.0%) |
| Total (Overall) | 224 (100.0%) | 0 (0.0%) |
Production, Transportation and Moving Occupations
The most common Production, Transportation and Moving occupations in Fabrica are Material Moving (92 | 41.1%), Transportation (81 | 36.2%), and Production (19 | 8.5%).
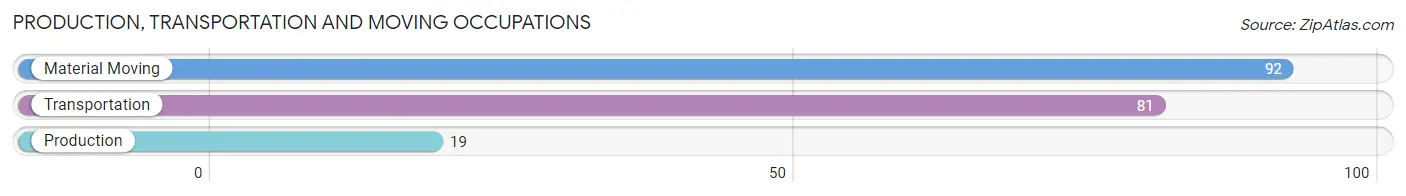
Production, Transportation and Moving Occupations by Sex
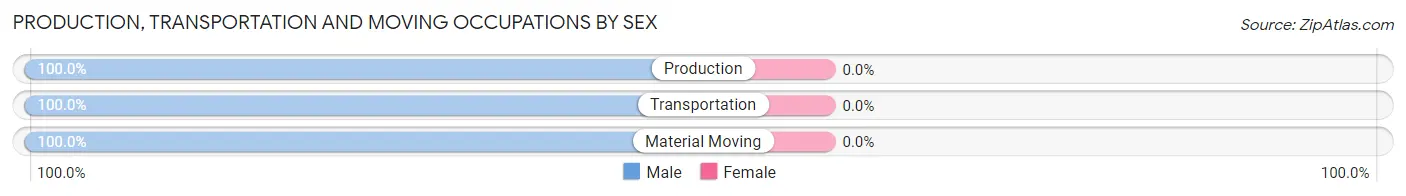
| Occupation | Male | Female |
| Production | 19 (100.0%) | 0 (0.0%) |
| Transportation | 81 (100.0%) | 0 (0.0%) |
| Material Moving | 92 (100.0%) | 0 (0.0%) |
| Total (Category) | 192 (100.0%) | 0 (0.0%) |
| Total (Overall) | 224 (100.0%) | 0 (0.0%) |
Employment Industries by Sex in Fabrica
Employment Industries in Fabrica
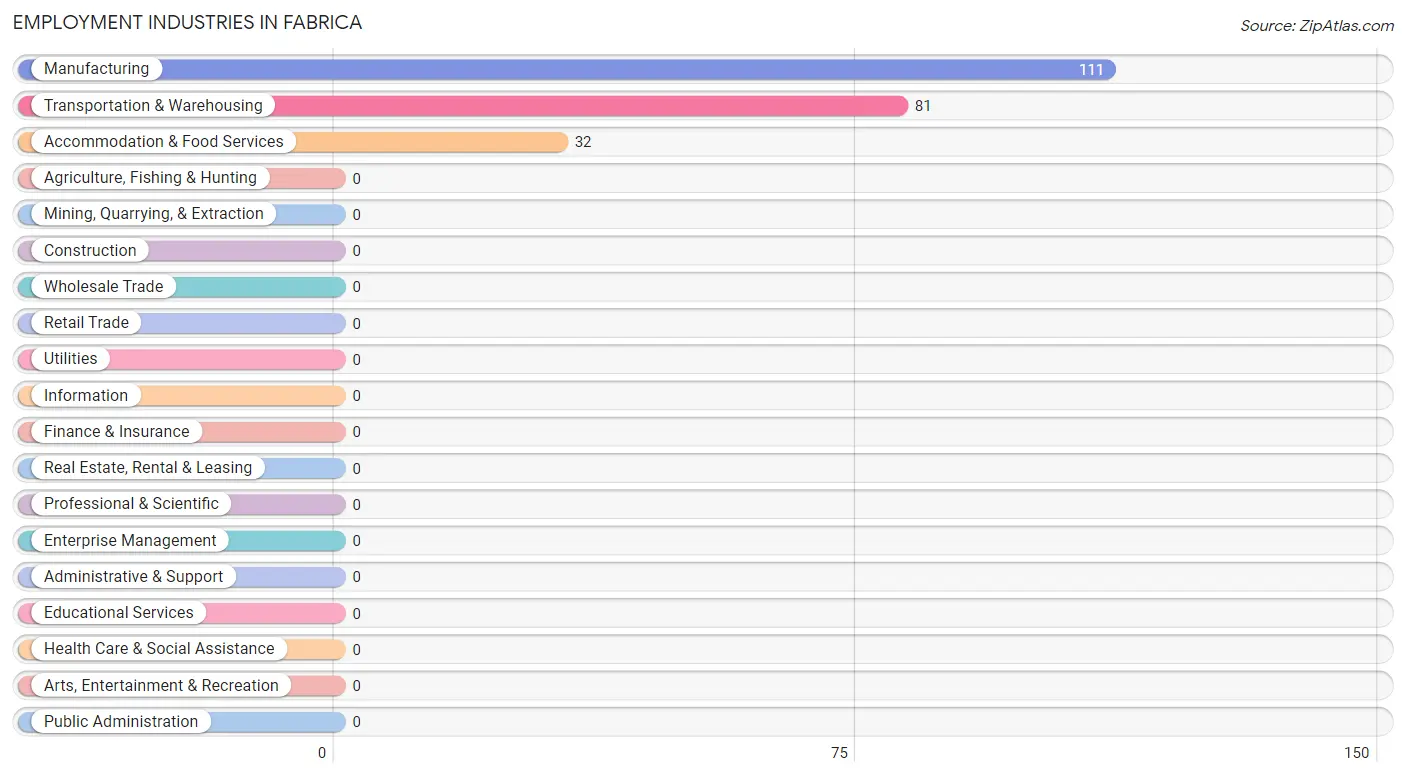
The major employment industries in Fabrica include Manufacturing (111 | 49.5%), Transportation & Warehousing (81 | 36.2%), and Accommodation & Food Services (32 | 14.3%).
Employment Industries by Sex in Fabrica
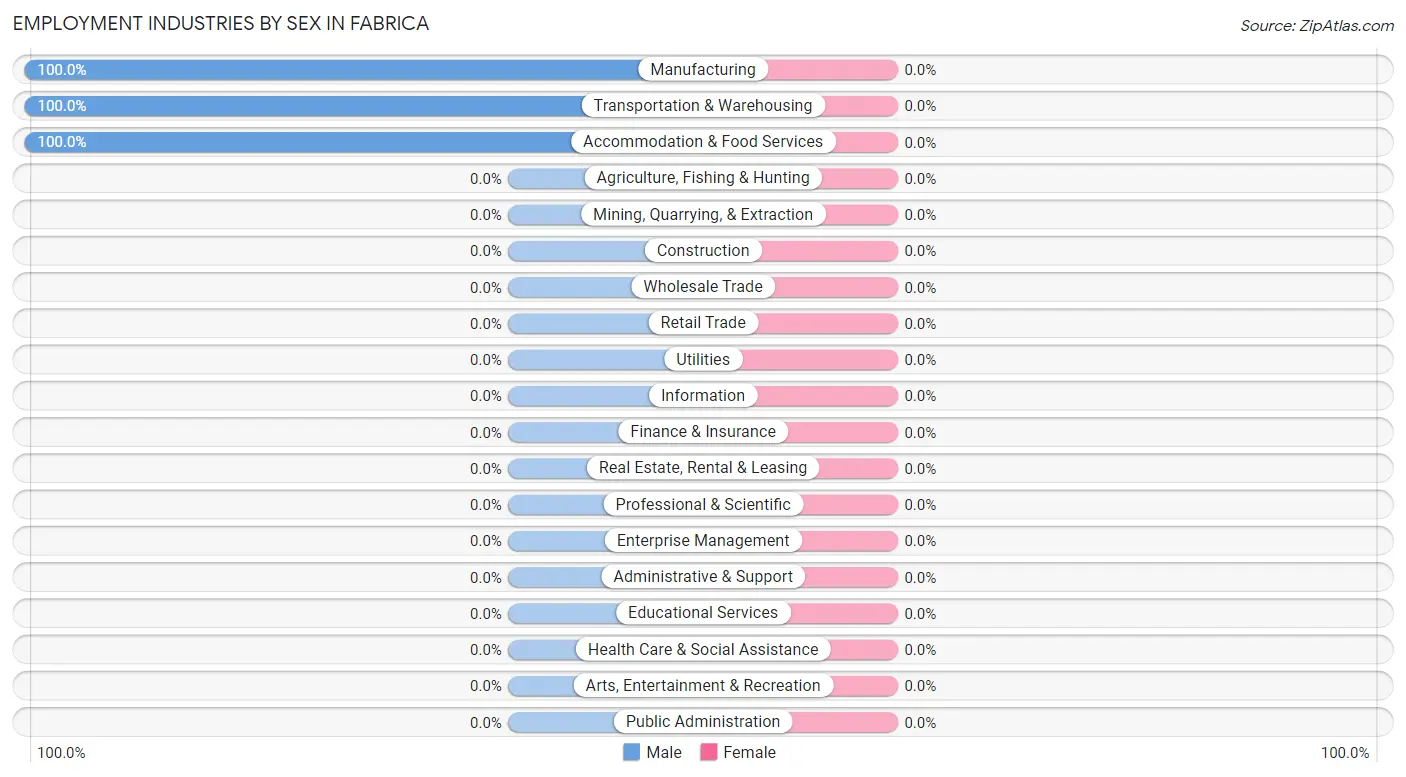
| Industry | Male | Female |
| Agriculture, Fishing & Hunting | 0 (0.0%) | 0 (0.0%) |
| Mining, Quarrying, & Extraction | 0 (0.0%) | 0 (0.0%) |
| Construction | 0 (0.0%) | 0 (0.0%) |
| Manufacturing | 111 (100.0%) | 0 (0.0%) |
| Wholesale Trade | 0 (0.0%) | 0 (0.0%) |
| Retail Trade | 0 (0.0%) | 0 (0.0%) |
| Transportation & Warehousing | 81 (100.0%) | 0 (0.0%) |
| Utilities | 0 (0.0%) | 0 (0.0%) |
| Information | 0 (0.0%) | 0 (0.0%) |
| Finance & Insurance | 0 (0.0%) | 0 (0.0%) |
| Real Estate, Rental & Leasing | 0 (0.0%) | 0 (0.0%) |
| Professional & Scientific | 0 (0.0%) | 0 (0.0%) |
| Enterprise Management | 0 (0.0%) | 0 (0.0%) |
| Administrative & Support | 0 (0.0%) | 0 (0.0%) |
| Educational Services | 0 (0.0%) | 0 (0.0%) |
| Health Care & Social Assistance | 0 (0.0%) | 0 (0.0%) |
| Arts, Entertainment & Recreation | 0 (0.0%) | 0 (0.0%) |
| Accommodation & Food Services | 32 (100.0%) | 0 (0.0%) |
| Public Administration | 0 (0.0%) | 0 (0.0%) |
| Total | 224 (100.0%) | 0 (0.0%) |
Education in Fabrica
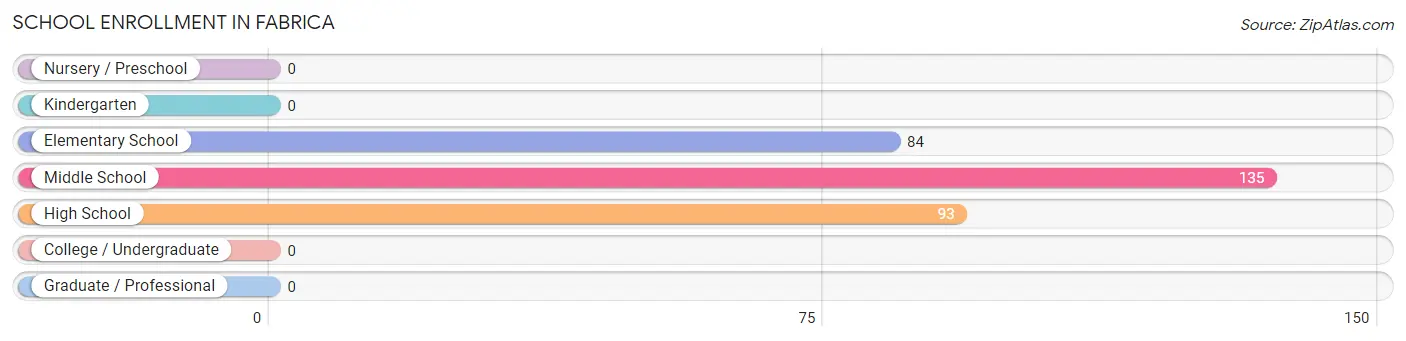
School Enrollment in Fabrica
The most common levels of schooling among the 312 students in Fabrica are middle school (135 | 43.3%), high school (93 | 29.8%), and elementary school (84 | 26.9%).
| School Level | # Students | % Students |
| Nursery / Preschool | 0 | 0.0% |
| Kindergarten | 0 | 0.0% |
| Elementary School | 84 | 26.9% |
| Middle School | 135 | 43.3% |
| High School | 93 | 29.8% |
| College / Undergraduate | 0 | 0.0% |
| Graduate / Professional | 0 | 0.0% |
| Total | 312 | 100.0% |
School Enrollment by Age by Funding Source in Fabrica
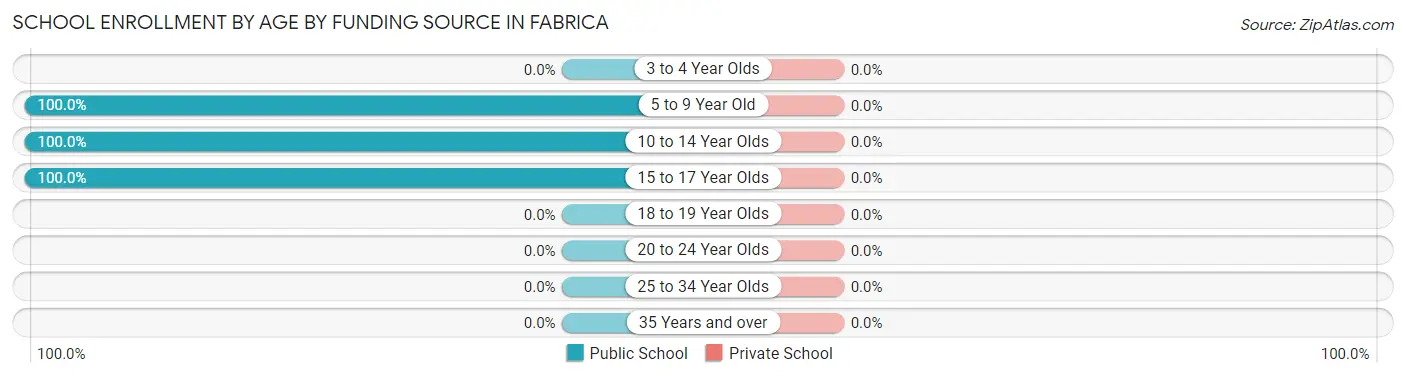
| Age Bracket | Public School | Private School |
| 3 to 4 Year Olds | 0 (0.0%) | 0 (0.0%) |
| 5 to 9 Year Old | 84 (100.0%) | 0 (0.0%) |
| 10 to 14 Year Olds | 135 (100.0%) | 0 (0.0%) |
| 15 to 17 Year Olds | 93 (100.0%) | 0 (0.0%) |
| 18 to 19 Year Olds | 0 (0.0%) | 0 (0.0%) |
| 20 to 24 Year Olds | 0 (0.0%) | 0 (0.0%) |
| 25 to 34 Year Olds | 0 (0.0%) | 0 (0.0%) |
| 35 Years and over | 0 (0.0%) | 0 (0.0%) |
| Total | 312 (100.0%) | 0 (0.0%) |
Educational Attainment by Field of Study in Fabrica
, and science & technology (13 | 100.0%) are the most common fields of study among 13 individuals in Fabrica who have obtained a bachelor's degree or higher.
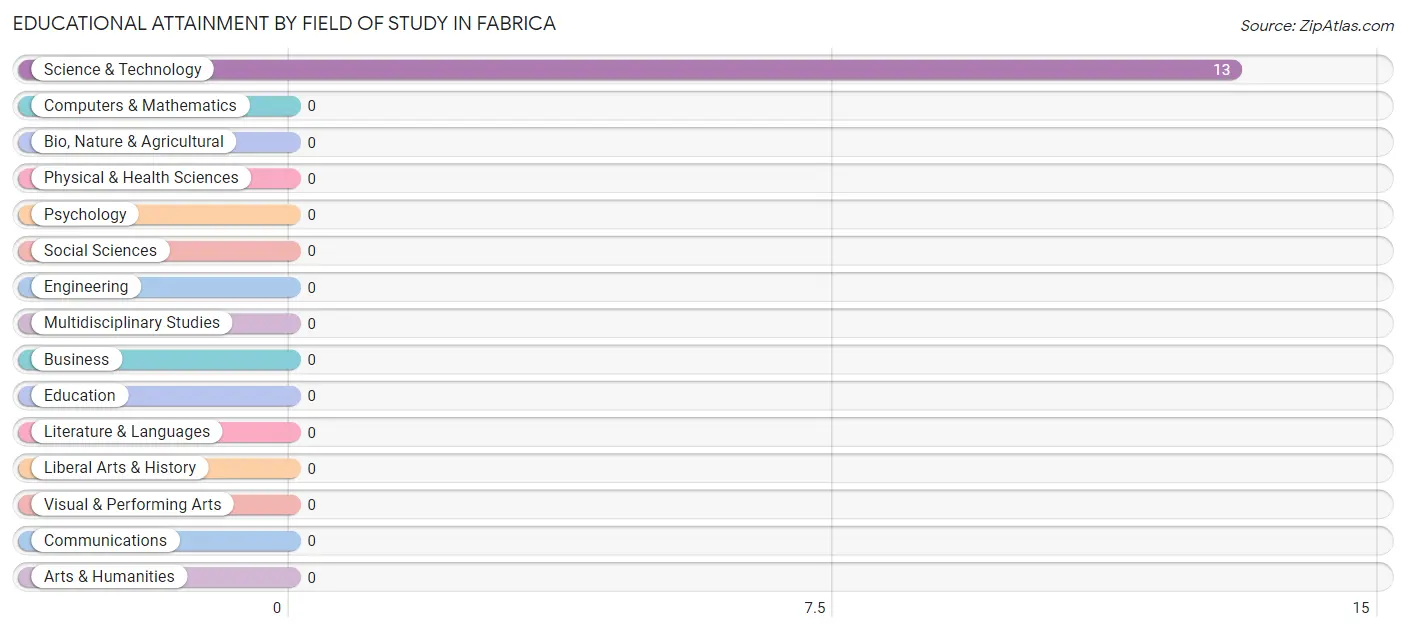
| Field of Study | # Graduates | % Graduates |
| Computers & Mathematics | 0 | 0.0% |
| Bio, Nature & Agricultural | 0 | 0.0% |
| Physical & Health Sciences | 0 | 0.0% |
| Psychology | 0 | 0.0% |
| Social Sciences | 0 | 0.0% |
| Engineering | 0 | 0.0% |
| Multidisciplinary Studies | 0 | 0.0% |
| Science & Technology | 13 | 100.0% |
| Business | 0 | 0.0% |
| Education | 0 | 0.0% |
| Literature & Languages | 0 | 0.0% |
| Liberal Arts & History | 0 | 0.0% |
| Visual & Performing Arts | 0 | 0.0% |
| Communications | 0 | 0.0% |
| Arts & Humanities | 0 | 0.0% |
| Total | 13 | 100.0% |
Transportation & Commute in Fabrica
Vehicle Availability by Sex in Fabrica
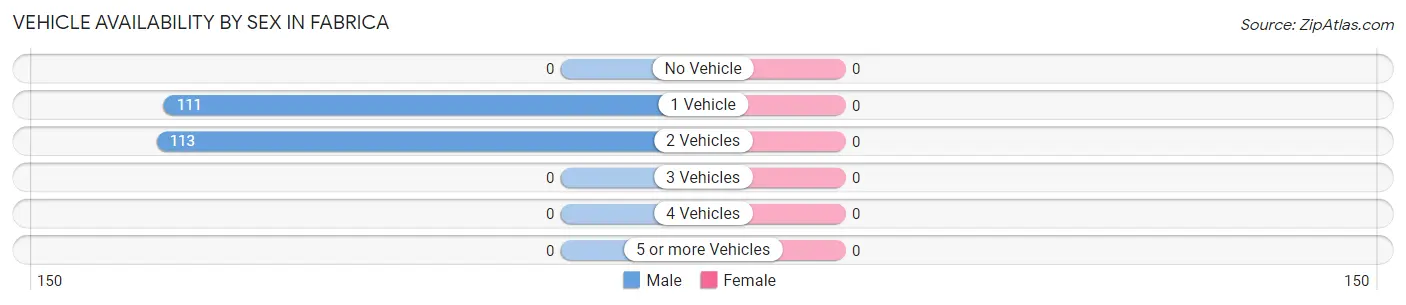
| Vehicles Available | Male | Female |
| No Vehicle | 0 (0.0%) | 0 (0.0%) |
| 1 Vehicle | 111 (49.5%) | 0 (0.0%) |
| 2 Vehicles | 113 (50.4%) | 0 (0.0%) |
| 3 Vehicles | 0 (0.0%) | 0 (0.0%) |
| 4 Vehicles | 0 (0.0%) | 0 (0.0%) |
| 5 or more Vehicles | 0 (0.0%) | 0 (0.0%) |
| Total | 224 (100.0%) | 0 (0.0%) |
Commute Time in Fabrica
The most frequently occuring commute durations in Fabrica are 60 to 89 minutes (100 commuters, 44.6%), 10 to 14 minutes (92 commuters, 41.1%), and 15 to 19 minutes (32 commuters, 14.3%).
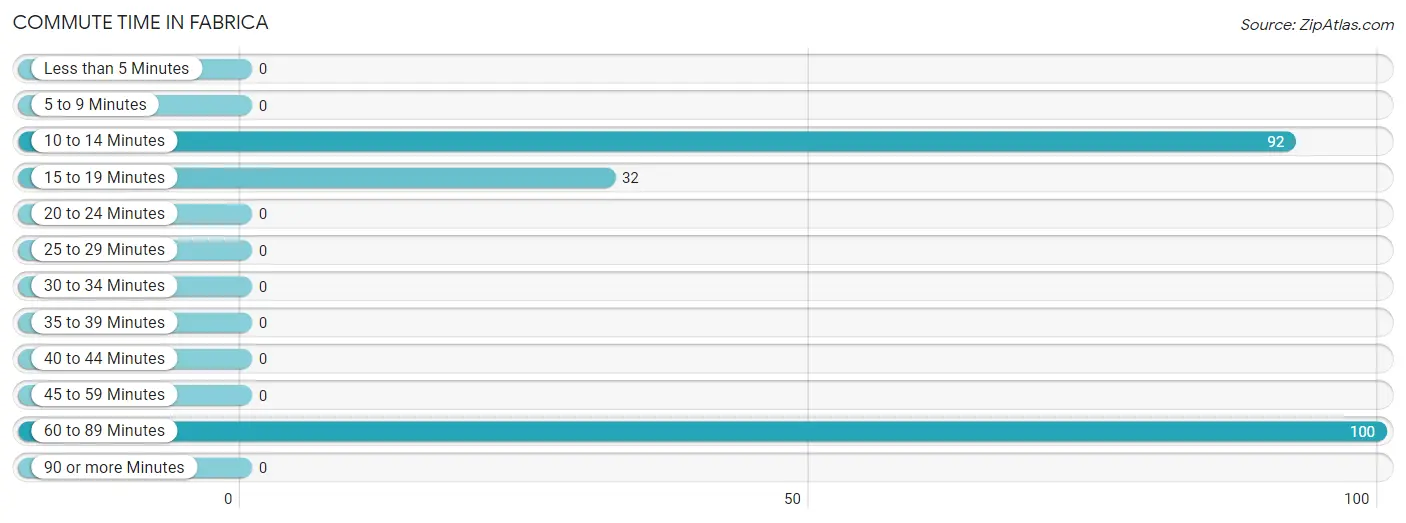
| Commute Time | # Commuters | % Commuters |
| Less than 5 Minutes | 0 | 0.0% |
| 5 to 9 Minutes | 0 | 0.0% |
| 10 to 14 Minutes | 92 | 41.1% |
| 15 to 19 Minutes | 32 | 14.3% |
| 20 to 24 Minutes | 0 | 0.0% |
| 25 to 29 Minutes | 0 | 0.0% |
| 30 to 34 Minutes | 0 | 0.0% |
| 35 to 39 Minutes | 0 | 0.0% |
| 40 to 44 Minutes | 0 | 0.0% |
| 45 to 59 Minutes | 0 | 0.0% |
| 60 to 89 Minutes | 100 | 44.6% |
| 90 or more Minutes | 0 | 0.0% |
Commute Time by Sex in Fabrica
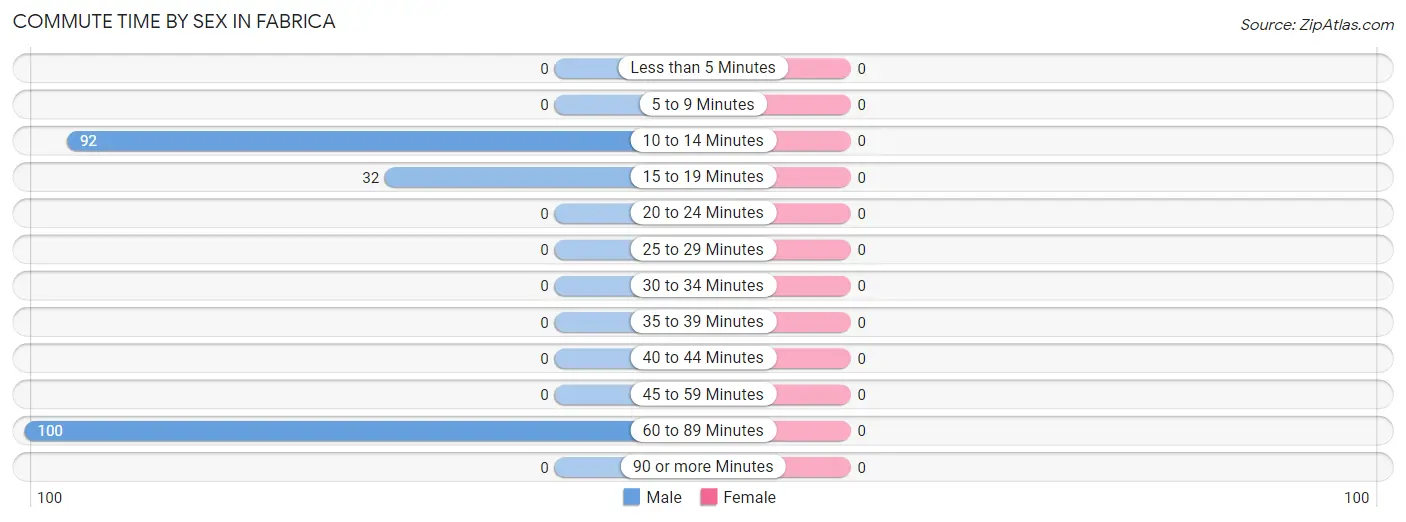
| Commute Time | Male | Female |
| Less than 5 Minutes | 0 (0.0%) | 0 (0.0%) |
| 5 to 9 Minutes | 0 (0.0%) | 0 (0.0%) |
| 10 to 14 Minutes | 92 (41.1%) | 0 (0.0%) |
| 15 to 19 Minutes | 32 (14.3%) | 0 (0.0%) |
| 20 to 24 Minutes | 0 (0.0%) | 0 (0.0%) |
| 25 to 29 Minutes | 0 (0.0%) | 0 (0.0%) |
| 30 to 34 Minutes | 0 (0.0%) | 0 (0.0%) |
| 35 to 39 Minutes | 0 (0.0%) | 0 (0.0%) |
| 40 to 44 Minutes | 0 (0.0%) | 0 (0.0%) |
| 45 to 59 Minutes | 0 (0.0%) | 0 (0.0%) |
| 60 to 89 Minutes | 100 (44.6%) | 0 (0.0%) |
| 90 or more Minutes | 0 (0.0%) | 0 (0.0%) |
Time of Departure to Work by Sex in Fabrica
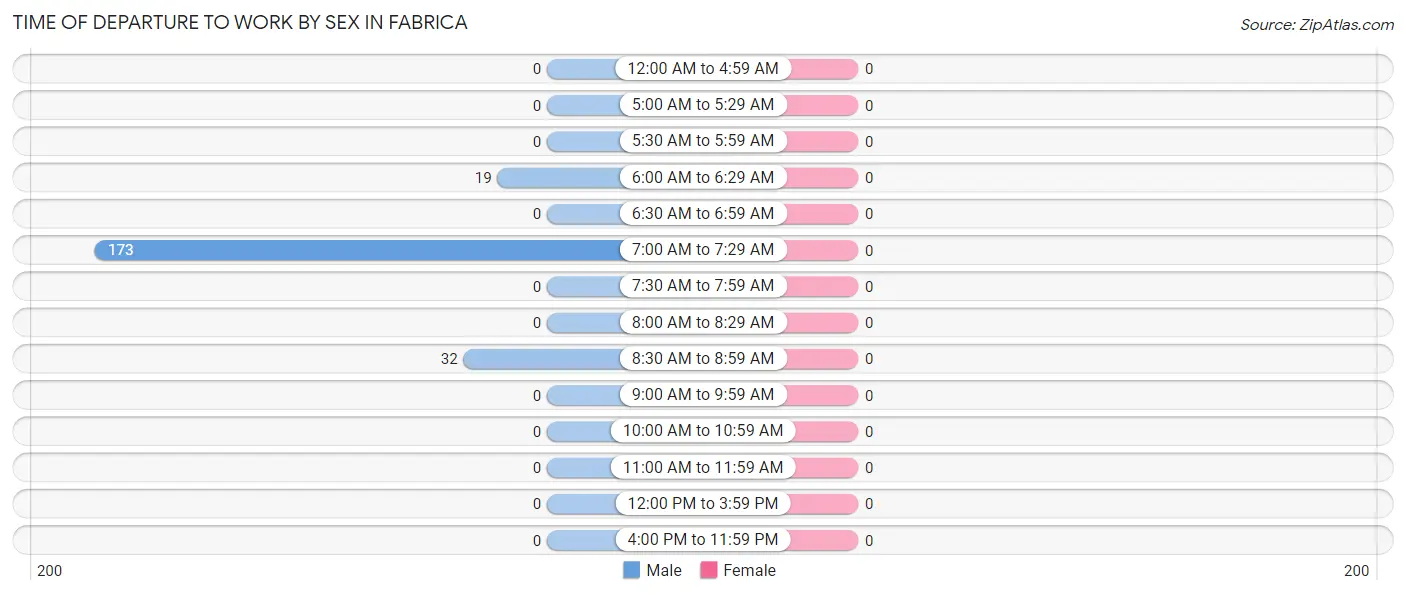
| Time of Departure | Male | Female |
| 12:00 AM to 4:59 AM | 0 (0.0%) | 0 (0.0%) |
| 5:00 AM to 5:29 AM | 0 (0.0%) | 0 (0.0%) |
| 5:30 AM to 5:59 AM | 0 (0.0%) | 0 (0.0%) |
| 6:00 AM to 6:29 AM | 19 (8.5%) | 0 (0.0%) |
| 6:30 AM to 6:59 AM | 0 (0.0%) | 0 (0.0%) |
| 7:00 AM to 7:29 AM | 173 (77.2%) | 0 (0.0%) |
| 7:30 AM to 7:59 AM | 0 (0.0%) | 0 (0.0%) |
| 8:00 AM to 8:29 AM | 0 (0.0%) | 0 (0.0%) |
| 8:30 AM to 8:59 AM | 32 (14.3%) | 0 (0.0%) |
| 9:00 AM to 9:59 AM | 0 (0.0%) | 0 (0.0%) |
| 10:00 AM to 10:59 AM | 0 (0.0%) | 0 (0.0%) |
| 11:00 AM to 11:59 AM | 0 (0.0%) | 0 (0.0%) |
| 12:00 PM to 3:59 PM | 0 (0.0%) | 0 (0.0%) |
| 4:00 PM to 11:59 PM | 0 (0.0%) | 0 (0.0%) |
| Total | 224 (100.0%) | 0 (0.0%) |
Housing Occupancy in Fabrica
Occupancy by Ownership in Fabrica
Of the total 256 dwellings in Fabrica, owner-occupied units account for 211 (82.4%), while renter-occupied units make up 45 (17.6%).
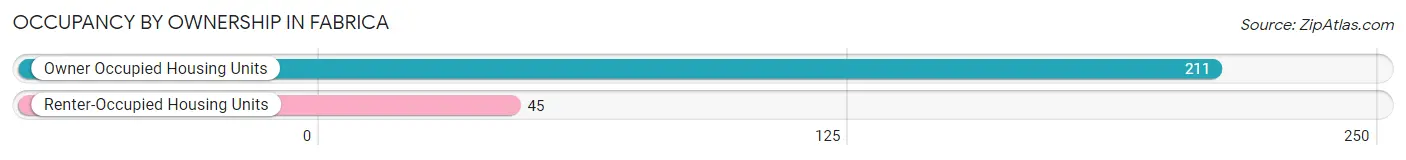
| Occupancy | # Housing Units | % Housing Units |
| Owner Occupied Housing Units | 211 | 82.4% |
| Renter-Occupied Housing Units | 45 | 17.6% |
| Total Occupied Housing Units | 256 | 100.0% |
Occupancy by Household Size in Fabrica
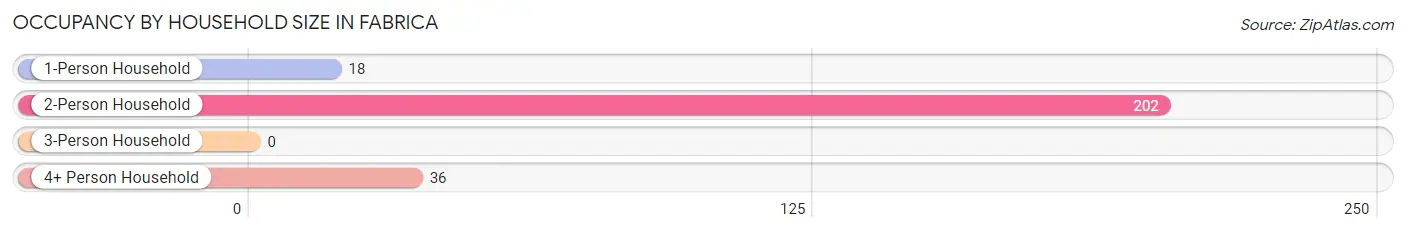
| Household Size | # Housing Units | % Housing Units |
| 1-Person Household | 18 | 7.0% |
| 2-Person Household | 202 | 78.9% |
| 3-Person Household | 0 | 0.0% |
| 4+ Person Household | 36 | 14.1% |
| Total Housing Units | 256 | 100.0% |
Occupancy by Ownership by Household Size in Fabrica
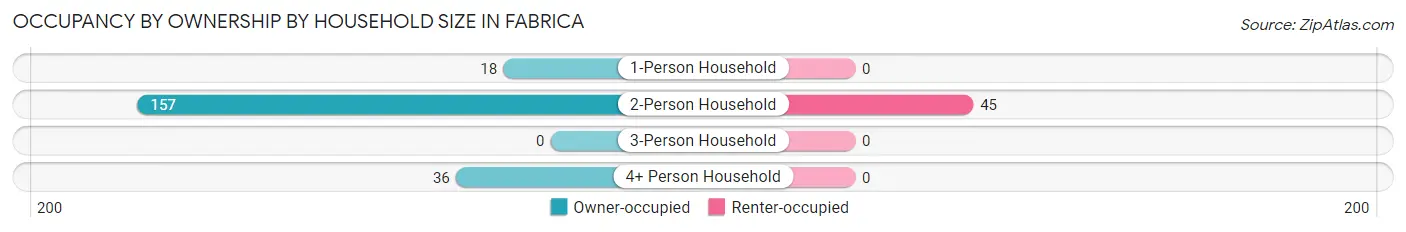
| Household Size | Owner-occupied | Renter-occupied |
| 1-Person Household | 18 (100.0%) | 0 (0.0%) |
| 2-Person Household | 157 (77.7%) | 45 (22.3%) |
| 3-Person Household | 0 (0.0%) | 0 (0.0%) |
| 4+ Person Household | 36 (100.0%) | 0 (0.0%) |
| Total Housing Units | 211 (82.4%) | 45 (17.6%) |
Occupancy by Educational Attainment in Fabrica
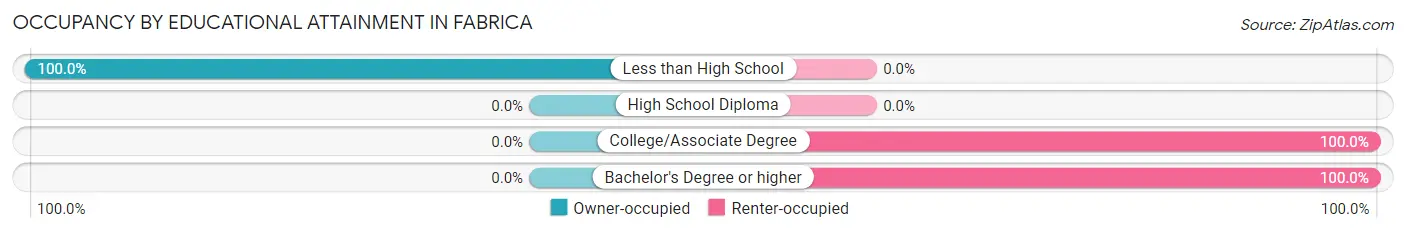
| Household Size | Owner-occupied | Renter-occupied |
| Less than High School | 211 (100.0%) | 0 (0.0%) |
| High School Diploma | 0 (0.0%) | 0 (0.0%) |
| College/Associate Degree | 0 (0.0%) | 32 (100.0%) |
| Bachelor's Degree or higher | 0 (0.0%) | 13 (100.0%) |
Occupancy by Age of Householder in Fabrica
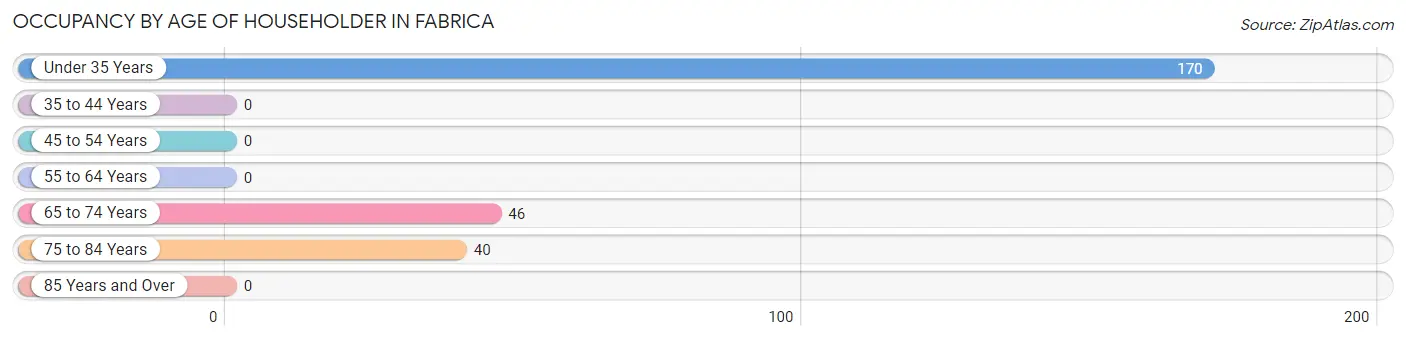
| Age Bracket | # Households | % Households |
| Under 35 Years | 170 | 66.4% |
| 35 to 44 Years | 0 | 0.0% |
| 45 to 54 Years | 0 | 0.0% |
| 55 to 64 Years | 0 | 0.0% |
| 65 to 74 Years | 46 | 18.0% |
| 75 to 84 Years | 40 | 15.6% |
| 85 Years and Over | 0 | 0.0% |
| Total | 256 | 100.0% |
Housing Finances in Fabrica
Median Income by Occupancy in Fabrica
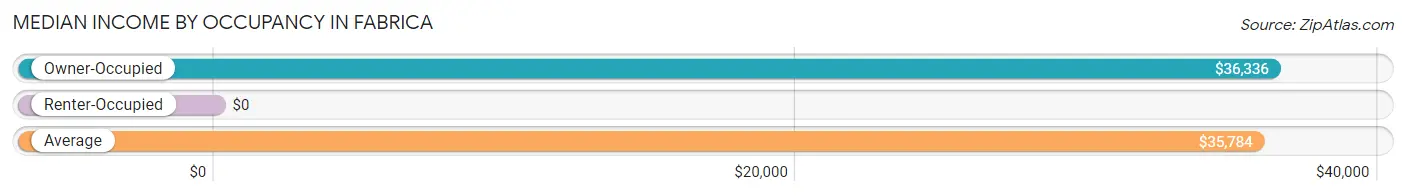
| Occupancy Type | # Households | Median Income |
| Owner-Occupied | 211 (82.4%) | $36,336 |
| Renter-Occupied | 45 (17.6%) | $0 |
| Average | 256 (100.0%) | $35,784 |
Occupancy by Householder Income Bracket in Fabrica
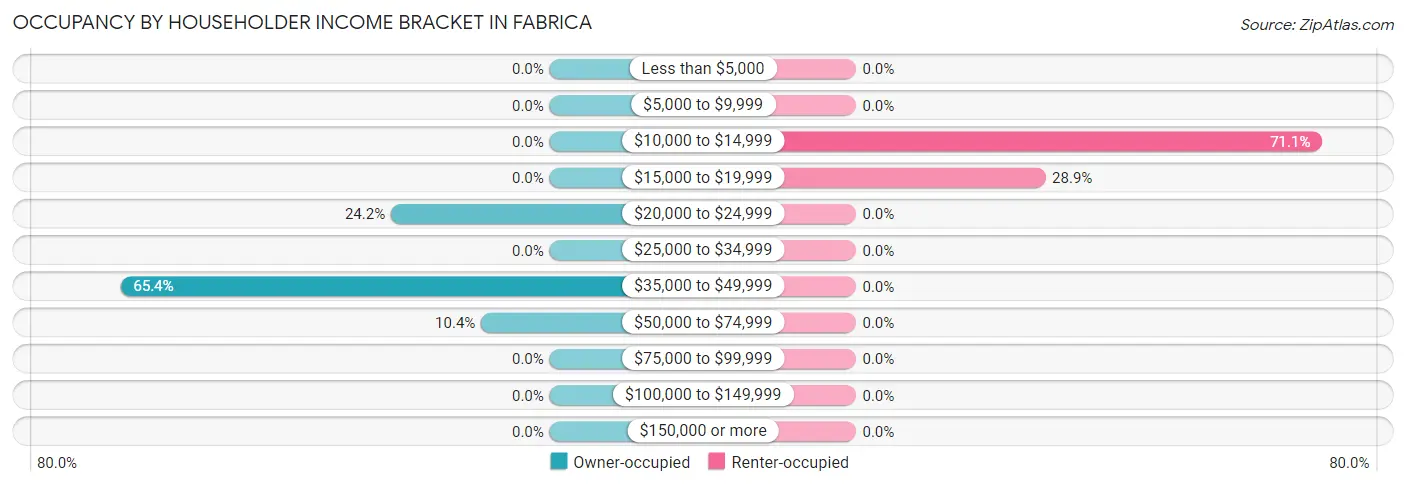
| Income Bracket | Owner-occupied | Renter-occupied |
| Less than $5,000 | 0 (0.0%) | 0 (0.0%) |
| $5,000 to $9,999 | 0 (0.0%) | 0 (0.0%) |
| $10,000 to $14,999 | 0 (0.0%) | 32 (71.1%) |
| $15,000 to $19,999 | 0 (0.0%) | 13 (28.9%) |
| $20,000 to $24,999 | 51 (24.2%) | 0 (0.0%) |
| $25,000 to $34,999 | 0 (0.0%) | 0 (0.0%) |
| $35,000 to $49,999 | 138 (65.4%) | 0 (0.0%) |
| $50,000 to $74,999 | 22 (10.4%) | 0 (0.0%) |
| $75,000 to $99,999 | 0 (0.0%) | 0 (0.0%) |
| $100,000 to $149,999 | 0 (0.0%) | 0 (0.0%) |
| $150,000 or more | 0 (0.0%) | 0 (0.0%) |
| Total | 211 (100.0%) | 45 (100.0%) |
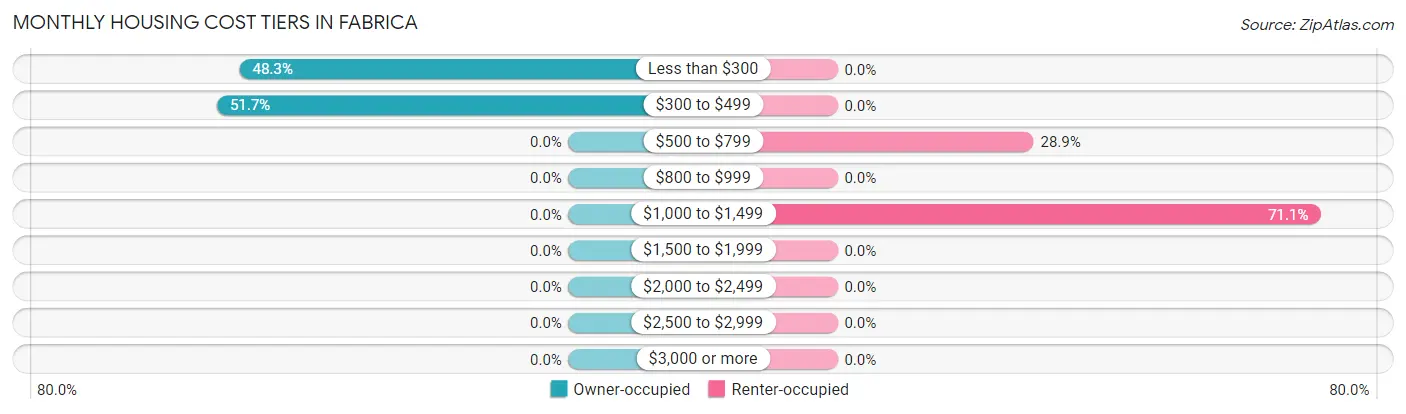
Monthly Housing Cost Tiers in Fabrica
| Monthly Cost | Owner-occupied | Renter-occupied |
| Less than $300 | 102 (48.3%) | 0 (0.0%) |
| $300 to $499 | 109 (51.7%) | 0 (0.0%) |
| $500 to $799 | 0 (0.0%) | 13 (28.9%) |
| $800 to $999 | 0 (0.0%) | 0 (0.0%) |
| $1,000 to $1,499 | 0 (0.0%) | 32 (71.1%) |
| $1,500 to $1,999 | 0 (0.0%) | 0 (0.0%) |
| $2,000 to $2,499 | 0 (0.0%) | 0 (0.0%) |
| $2,500 to $2,999 | 0 (0.0%) | 0 (0.0%) |
| $3,000 or more | 0 (0.0%) | 0 (0.0%) |
| Total | 211 (100.0%) | 45 (100.0%) |
Physical Housing Characteristics in Fabrica
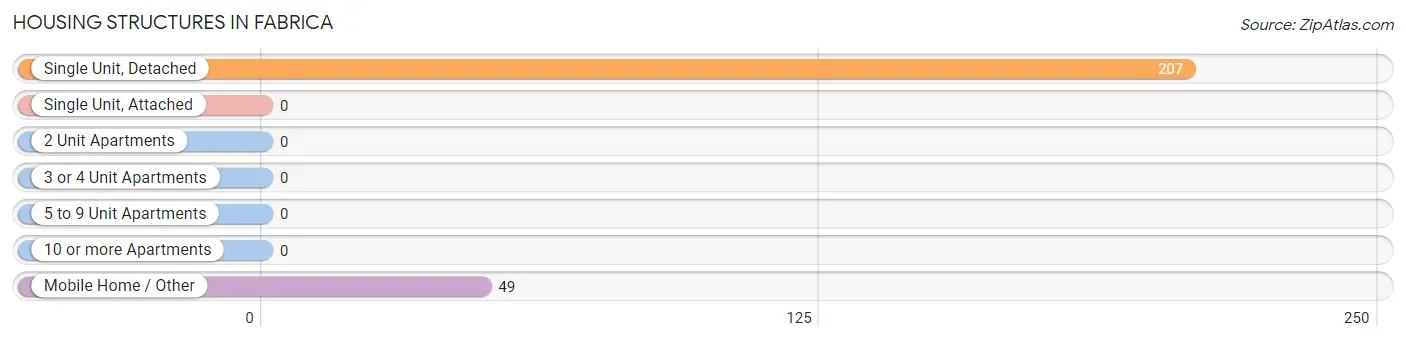
Housing Structures in Fabrica
| Structure Type | # Housing Units | % Housing Units |
| Single Unit, Detached | 207 | 80.9% |
| Single Unit, Attached | 0 | 0.0% |
| 2 Unit Apartments | 0 | 0.0% |
| 3 or 4 Unit Apartments | 0 | 0.0% |
| 5 to 9 Unit Apartments | 0 | 0.0% |
| 10 or more Apartments | 0 | 0.0% |
| Mobile Home / Other | 49 | 19.1% |
| Total | 256 | 100.0% |
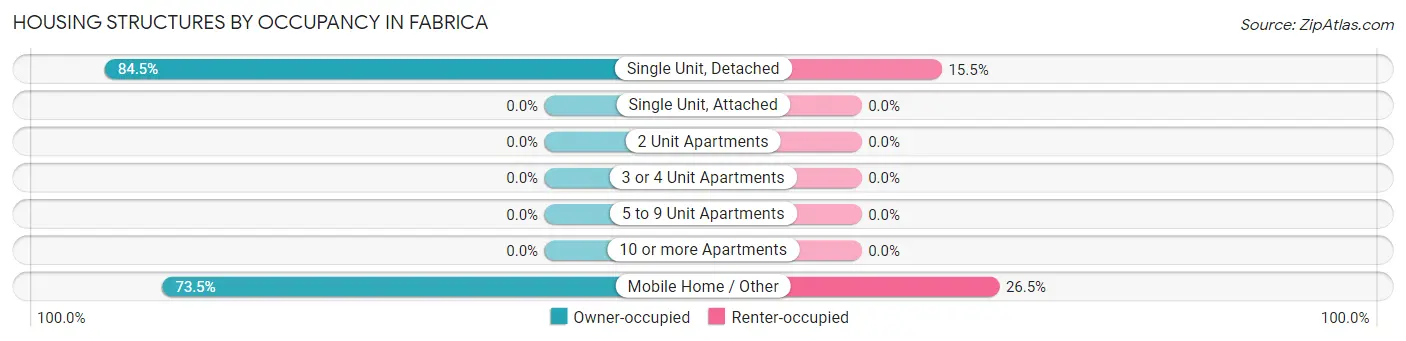
Housing Structures by Occupancy in Fabrica
| Structure Type | Owner-occupied | Renter-occupied |
| Single Unit, Detached | 175 (84.5%) | 32 (15.5%) |
| Single Unit, Attached | 0 (0.0%) | 0 (0.0%) |
| 2 Unit Apartments | 0 (0.0%) | 0 (0.0%) |
| 3 or 4 Unit Apartments | 0 (0.0%) | 0 (0.0%) |
| 5 to 9 Unit Apartments | 0 (0.0%) | 0 (0.0%) |
| 10 or more Apartments | 0 (0.0%) | 0 (0.0%) |
| Mobile Home / Other | 36 (73.5%) | 13 (26.5%) |
| Total | 211 (82.4%) | 45 (17.6%) |
Housing Structures by Number of Rooms in Fabrica
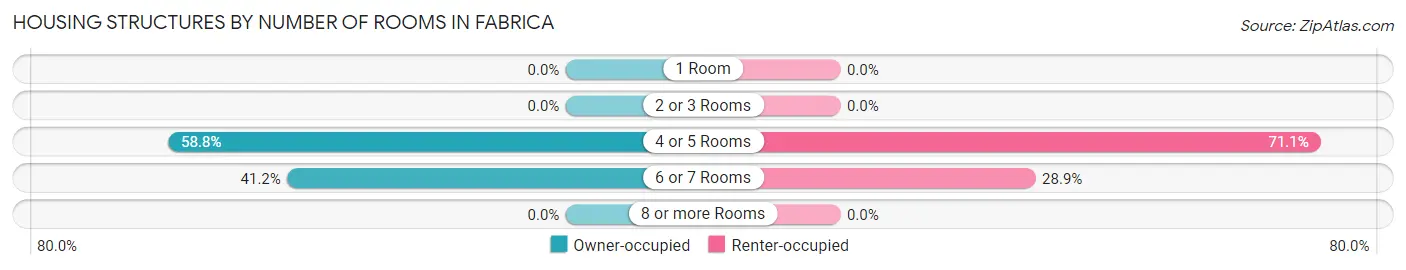
| Number of Rooms | Owner-occupied | Renter-occupied |
| 1 Room | 0 (0.0%) | 0 (0.0%) |
| 2 or 3 Rooms | 0 (0.0%) | 0 (0.0%) |
| 4 or 5 Rooms | 124 (58.8%) | 32 (71.1%) |
| 6 or 7 Rooms | 87 (41.2%) | 13 (28.9%) |
| 8 or more Rooms | 0 (0.0%) | 0 (0.0%) |
| Total | 211 (100.0%) | 45 (100.0%) |
Housing Structure by Heating Type in Fabrica
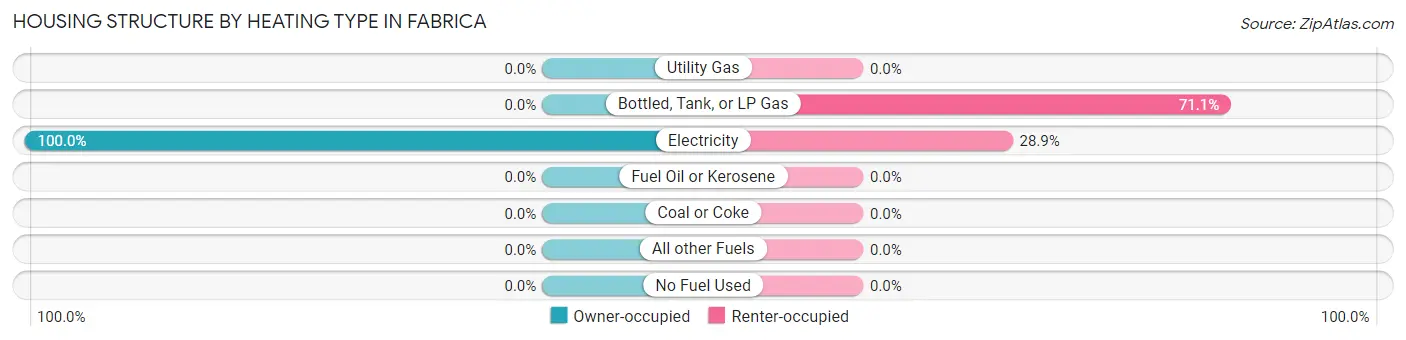
| Heating Type | Owner-occupied | Renter-occupied |
| Utility Gas | 0 (0.0%) | 0 (0.0%) |
| Bottled, Tank, or LP Gas | 0 (0.0%) | 32 (71.1%) |
| Electricity | 211 (100.0%) | 13 (28.9%) |
| Fuel Oil or Kerosene | 0 (0.0%) | 0 (0.0%) |
| Coal or Coke | 0 (0.0%) | 0 (0.0%) |
| All other Fuels | 0 (0.0%) | 0 (0.0%) |
| No Fuel Used | 0 (0.0%) | 0 (0.0%) |
| Total | 211 (100.0%) | 45 (100.0%) |
Household Vehicle Usage in Fabrica
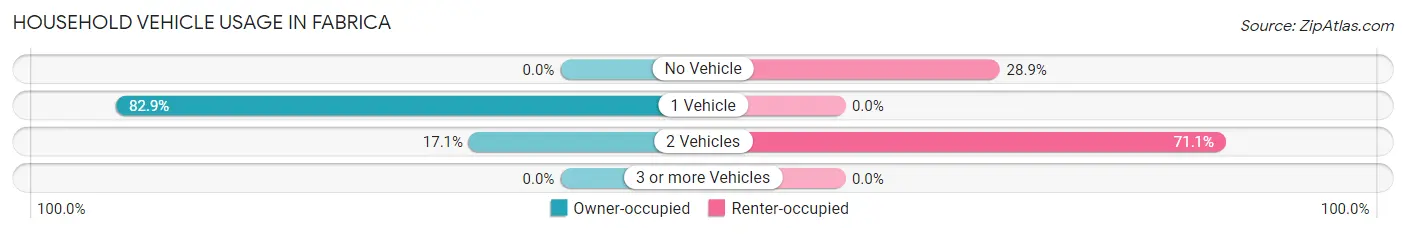
| Vehicles per Household | Owner-occupied | Renter-occupied |
| No Vehicle | 0 (0.0%) | 13 (28.9%) |
| 1 Vehicle | 175 (82.9%) | 0 (0.0%) |
| 2 Vehicles | 36 (17.1%) | 32 (71.1%) |
| 3 or more Vehicles | 0 (0.0%) | 0 (0.0%) |
| Total | 211 (100.0%) | 45 (100.0%) |
Real Estate & Mortgages in Fabrica
Real Estate and Mortgage Overview in Fabrica
| Characteristic | Without Mortgage | With Mortgage |
| Housing Units | 178 | 33 |
| Median Property Value | $93,000 | $0 |
| Median Household Income | $36,740 | $0 |
| Monthly Housing Costs | $244 | $0 |
| Real Estate Taxes | $485 | $0 |
Property Value by Mortgage Status in Fabrica
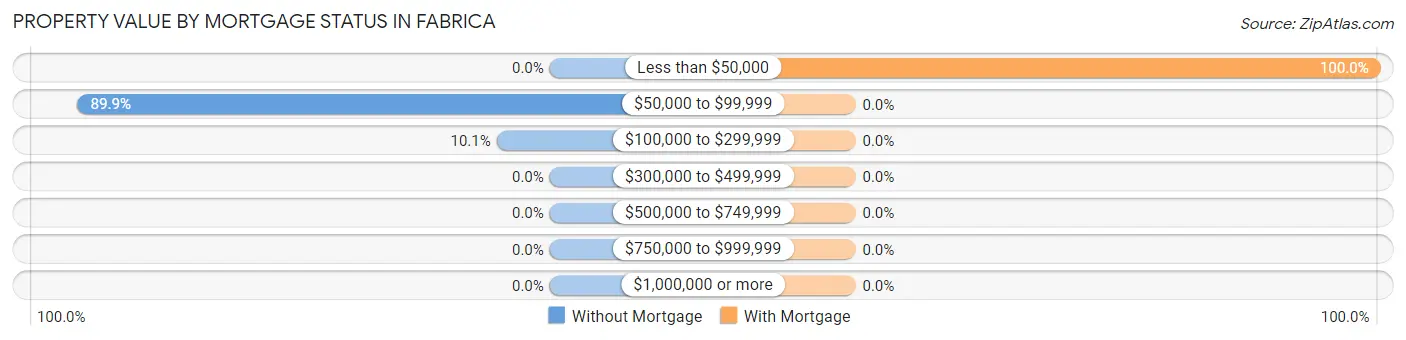
| Property Value | Without Mortgage | With Mortgage |
| Less than $50,000 | 0 (0.0%) | 33 (100.0%) |
| $50,000 to $99,999 | 160 (89.9%) | 0 (0.0%) |
| $100,000 to $299,999 | 18 (10.1%) | 0 (0.0%) |
| $300,000 to $499,999 | 0 (0.0%) | 0 (0.0%) |
| $500,000 to $749,999 | 0 (0.0%) | 0 (0.0%) |
| $750,000 to $999,999 | 0 (0.0%) | 0 (0.0%) |
| $1,000,000 or more | 0 (0.0%) | 0 (0.0%) |
| Total | 178 (100.0%) | 33 (100.0%) |
Household Income by Mortgage Status in Fabrica
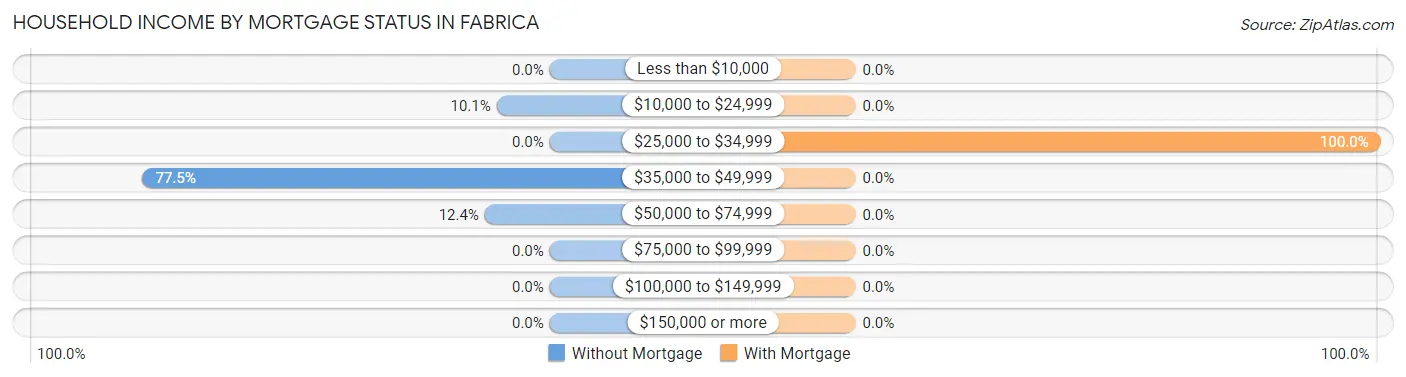
| Household Income | Without Mortgage | With Mortgage |
| Less than $10,000 | 0 (0.0%) | 0 (0.0%) |
| $10,000 to $24,999 | 18 (10.1%) | 0 (0.0%) |
| $25,000 to $34,999 | 0 (0.0%) | 33 (100.0%) |
| $35,000 to $49,999 | 138 (77.5%) | 0 (0.0%) |
| $50,000 to $74,999 | 22 (12.4%) | 0 (0.0%) |
| $75,000 to $99,999 | 0 (0.0%) | 0 (0.0%) |
| $100,000 to $149,999 | 0 (0.0%) | 0 (0.0%) |
| $150,000 or more | 0 (0.0%) | 0 (0.0%) |
| Total | 178 (100.0%) | 33 (100.0%) |
Property Value to Household Income Ratio in Fabrica
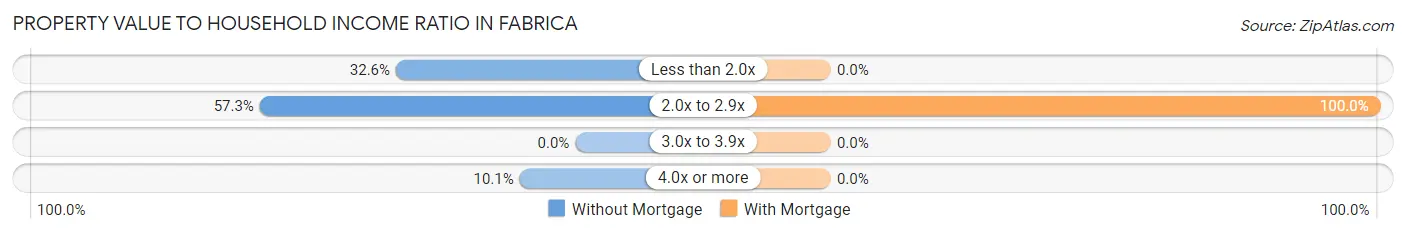
| Value-to-Income Ratio | Without Mortgage | With Mortgage |
| Less than 2.0x | 58 (32.6%) | 0 (0.0%) |
| 2.0x to 2.9x | 102 (57.3%) | 33 (100.0%) |
| 3.0x to 3.9x | 0 (0.0%) | 0 (0.0%) |
| 4.0x or more | 18 (10.1%) | 0 (0.0%) |
| Total | 178 (100.0%) | 33 (100.0%) |
Real Estate Taxes by Mortgage Status in Fabrica
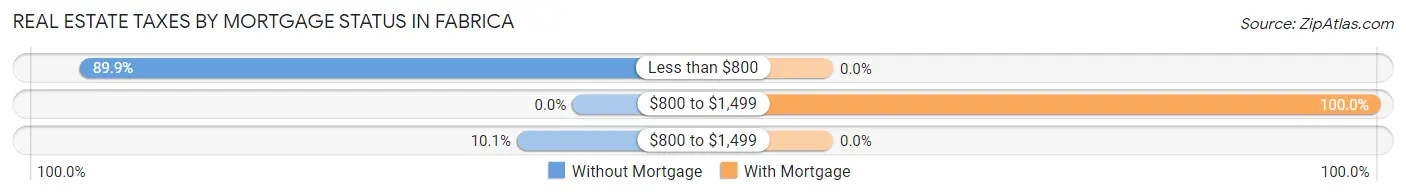
| Property Taxes | Without Mortgage | With Mortgage |
| Less than $800 | 160 (89.9%) | 0 (0.0%) |
| $800 to $1,499 | 0 (0.0%) | 33 (100.0%) |
| $800 to $1,499 | 18 (10.1%) | 0 (0.0%) |
| Total | 178 (100.0%) | 33 (100.0%) |
Health & Disability in Fabrica
Health Insurance Coverage by Age in Fabrica
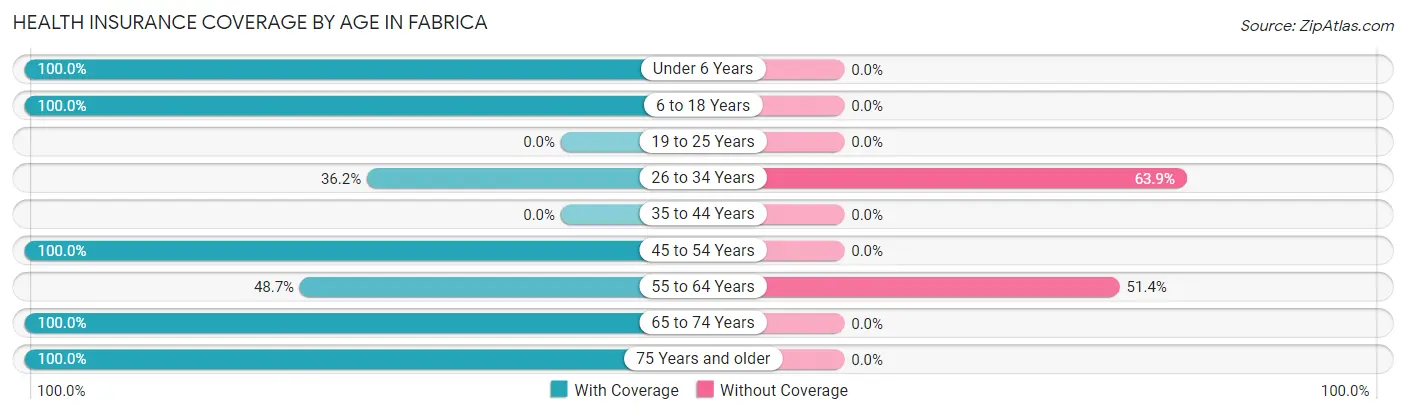
| Age Bracket | With Coverage | Without Coverage |
| Under 6 Years | 75 (100.0%) | 0 (0.0%) |
| 6 to 18 Years | 312 (100.0%) | 0 (0.0%) |
| 19 to 25 Years | 0 (0.0%) | 0 (0.0%) |
| 26 to 34 Years | 124 (36.1%) | 219 (63.8%) |
| 35 to 44 Years | 0 (0.0%) | 0 (0.0%) |
| 45 to 54 Years | 32 (100.0%) | 0 (0.0%) |
| 55 to 64 Years | 18 (48.6%) | 19 (51.3%) |
| 65 to 74 Years | 79 (100.0%) | 0 (0.0%) |
| 75 Years and older | 40 (100.0%) | 0 (0.0%) |
| Total | 680 (74.1%) | 238 (25.9%) |
Health Insurance Coverage by Citizenship Status in Fabrica
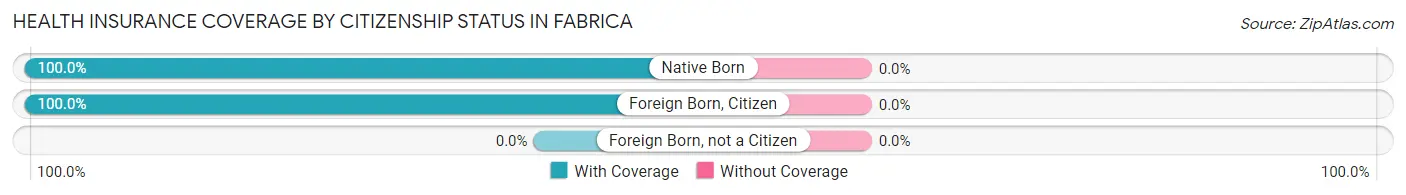
| Citizenship Status | With Coverage | Without Coverage |
| Native Born | 75 (100.0%) | 0 (0.0%) |
| Foreign Born, Citizen | 312 (100.0%) | 0 (0.0%) |
| Foreign Born, not a Citizen | 0 (0.0%) | 0 (0.0%) |
Health Insurance Coverage by Household Income in Fabrica
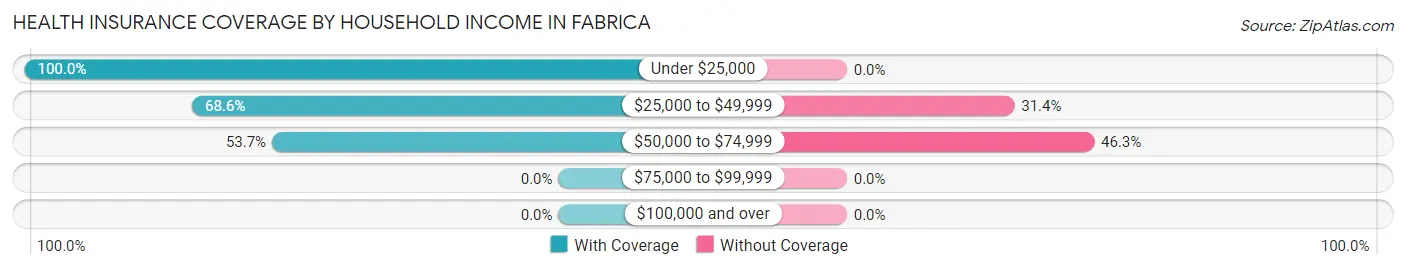
| Household Income | With Coverage | Without Coverage |
| Under $25,000 | 179 (100.0%) | 0 (0.0%) |
| $25,000 to $49,999 | 479 (68.6%) | 219 (31.4%) |
| $50,000 to $74,999 | 22 (53.7%) | 19 (46.3%) |
| $75,000 to $99,999 | 0 (0.0%) | 0 (0.0%) |
| $100,000 and over | 0 (0.0%) | 0 (0.0%) |
Public vs Private Health Insurance Coverage by Age in Fabrica
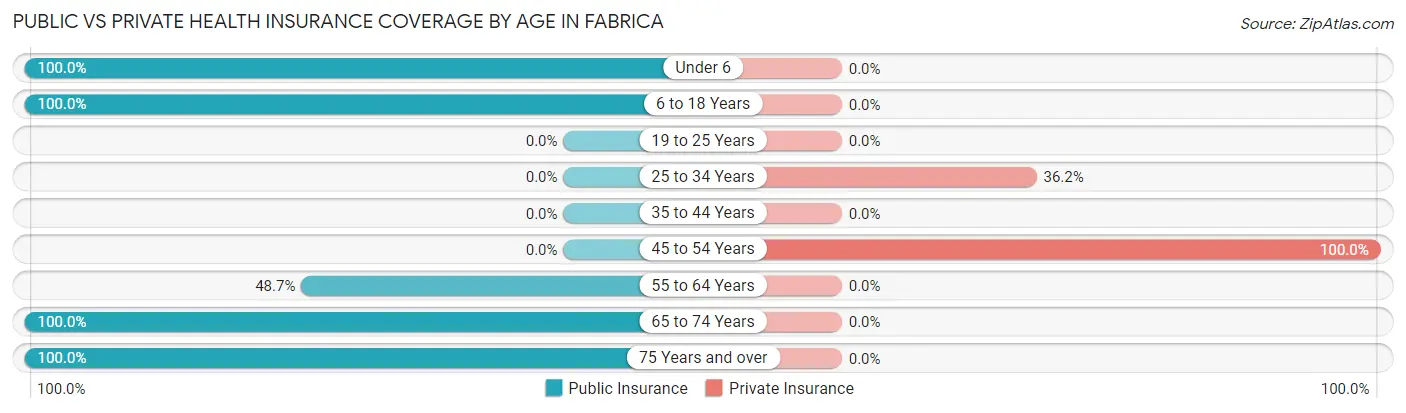
| Age Bracket | Public Insurance | Private Insurance |
| Under 6 | 75 (100.0%) | 0 (0.0%) |
| 6 to 18 Years | 312 (100.0%) | 0 (0.0%) |
| 19 to 25 Years | 0 (0.0%) | 0 (0.0%) |
| 25 to 34 Years | 0 (0.0%) | 124 (36.1%) |
| 35 to 44 Years | 0 (0.0%) | 0 (0.0%) |
| 45 to 54 Years | 0 (0.0%) | 32 (100.0%) |
| 55 to 64 Years | 18 (48.6%) | 0 (0.0%) |
| 65 to 74 Years | 79 (100.0%) | 0 (0.0%) |
| 75 Years and over | 40 (100.0%) | 0 (0.0%) |
| Total | 524 (57.1%) | 156 (17.0%) |
Disability Status by Sex by Age in Fabrica
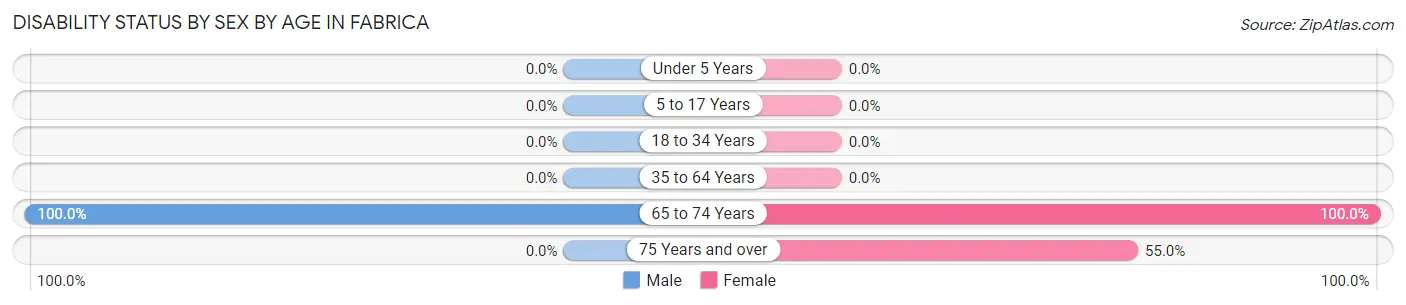
| Age Bracket | Male | Female |
| Under 5 Years | 0 (0.0%) | 0 (0.0%) |
| 5 to 17 Years | 0 (0.0%) | 0 (0.0%) |
| 18 to 34 Years | 0 (0.0%) | 0 (0.0%) |
| 35 to 64 Years | 0 (0.0%) | 0 (0.0%) |
| 65 to 74 Years | 46 (100.0%) | 33 (100.0%) |
| 75 Years and over | 0 (0.0%) | 22 (55.0%) |
Disability Class by Sex by Age in Fabrica
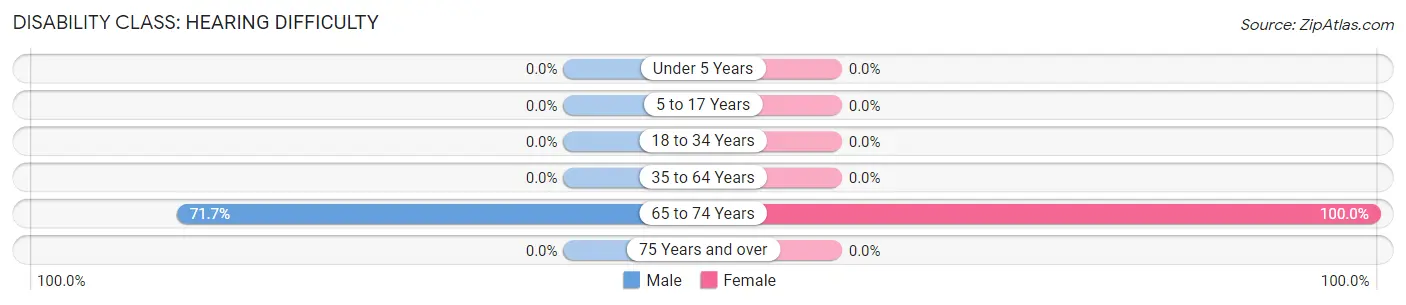
Disability Class: Hearing Difficulty
| Age Bracket | Male | Female |
| Under 5 Years | 0 (0.0%) | 0 (0.0%) |
| 5 to 17 Years | 0 (0.0%) | 0 (0.0%) |
| 18 to 34 Years | 0 (0.0%) | 0 (0.0%) |
| 35 to 64 Years | 0 (0.0%) | 0 (0.0%) |
| 65 to 74 Years | 33 (71.7%) | 33 (100.0%) |
| 75 Years and over | 0 (0.0%) | 0 (0.0%) |
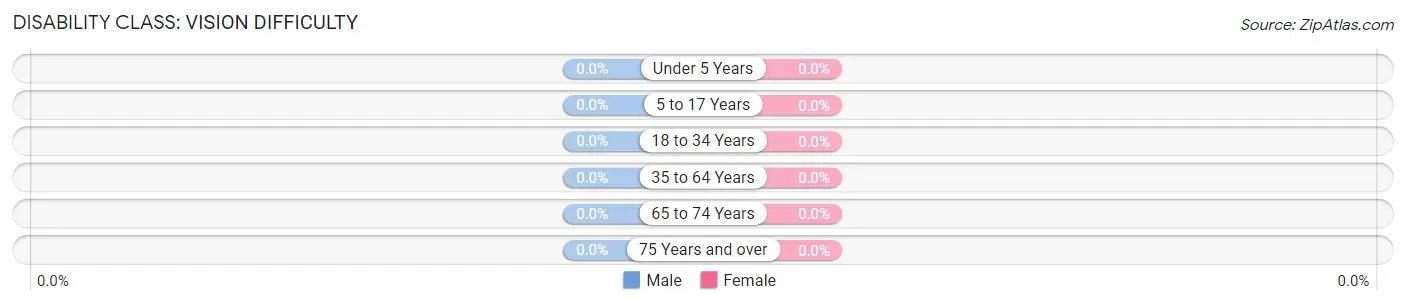
Disability Class: Vision Difficulty
| Age Bracket | Male | Female |
| Under 5 Years | 0 (0.0%) | 0 (0.0%) |
| 5 to 17 Years | 0 (0.0%) | 0 (0.0%) |
| 18 to 34 Years | 0 (0.0%) | 0 (0.0%) |
| 35 to 64 Years | 0 (0.0%) | 0 (0.0%) |
| 65 to 74 Years | 0 (0.0%) | 0 (0.0%) |
| 75 Years and over | 0 (0.0%) | 0 (0.0%) |
Disability Class: Cognitive Difficulty

| Age Bracket | Male | Female |
| 5 to 17 Years | 0 (0.0%) | 0 (0.0%) |
| 18 to 34 Years | 0 (0.0%) | 0 (0.0%) |
| 35 to 64 Years | 0 (0.0%) | 0 (0.0%) |
| 65 to 74 Years | 33 (71.7%) | 0 (0.0%) |
| 75 Years and over | 0 (0.0%) | 0 (0.0%) |
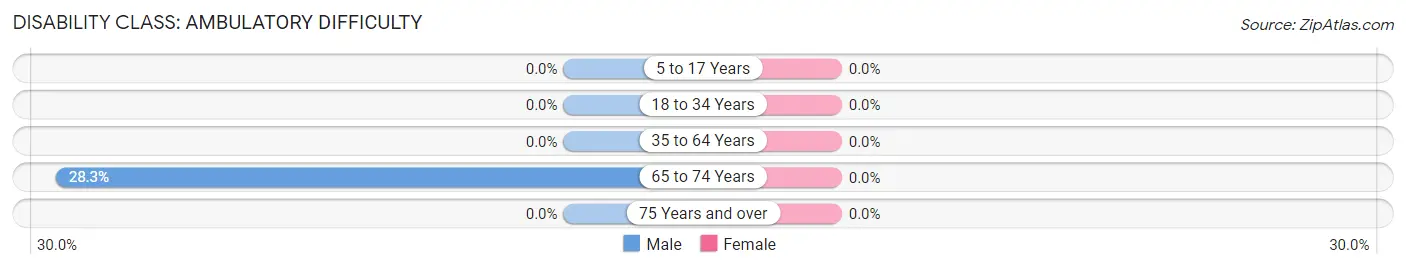
Disability Class: Ambulatory Difficulty
| Age Bracket | Male | Female |
| 5 to 17 Years | 0 (0.0%) | 0 (0.0%) |
| 18 to 34 Years | 0 (0.0%) | 0 (0.0%) |
| 35 to 64 Years | 0 (0.0%) | 0 (0.0%) |
| 65 to 74 Years | 13 (28.3%) | 0 (0.0%) |
| 75 Years and over | 0 (0.0%) | 0 (0.0%) |
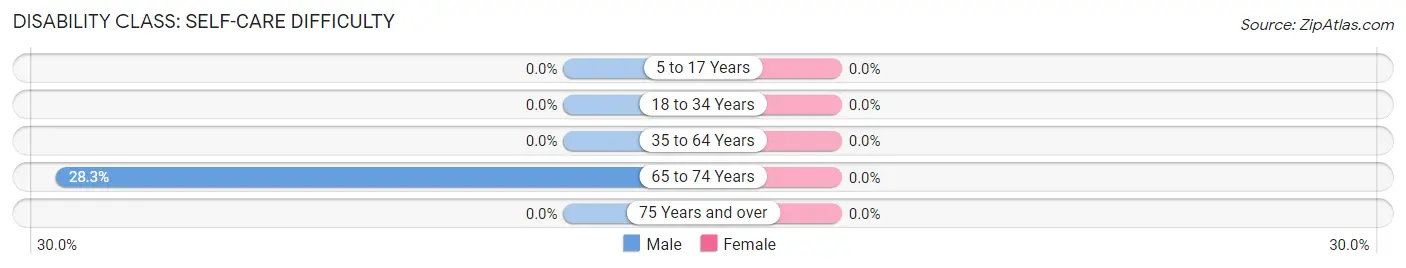
Disability Class: Self-Care Difficulty
| Age Bracket | Male | Female |
| 5 to 17 Years | 0 (0.0%) | 0 (0.0%) |
| 18 to 34 Years | 0 (0.0%) | 0 (0.0%) |
| 35 to 64 Years | 0 (0.0%) | 0 (0.0%) |
| 65 to 74 Years | 13 (28.3%) | 0 (0.0%) |
| 75 Years and over | 0 (0.0%) | 0 (0.0%) |
Technology Access in Fabrica
Computing Device Access in Fabrica
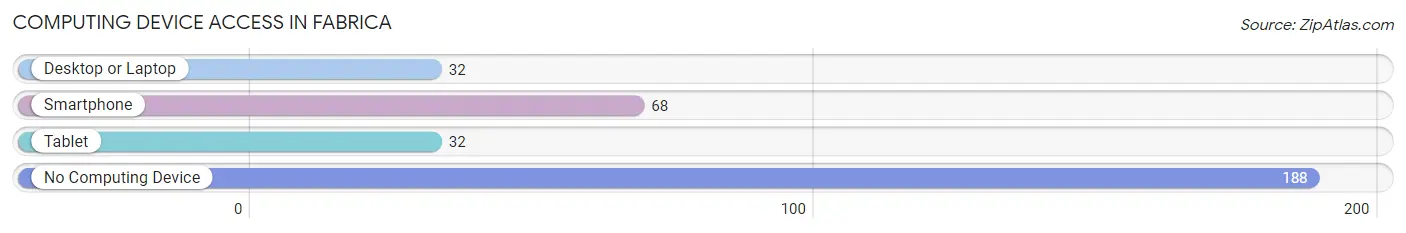
| Device Type | # Households | % Households |
| Desktop or Laptop | 32 | 12.5% |
| Smartphone | 68 | 26.6% |
| Tablet | 32 | 12.5% |
| No Computing Device | 188 | 73.4% |
| Total | 256 | 100.0% |
Internet Access in Fabrica
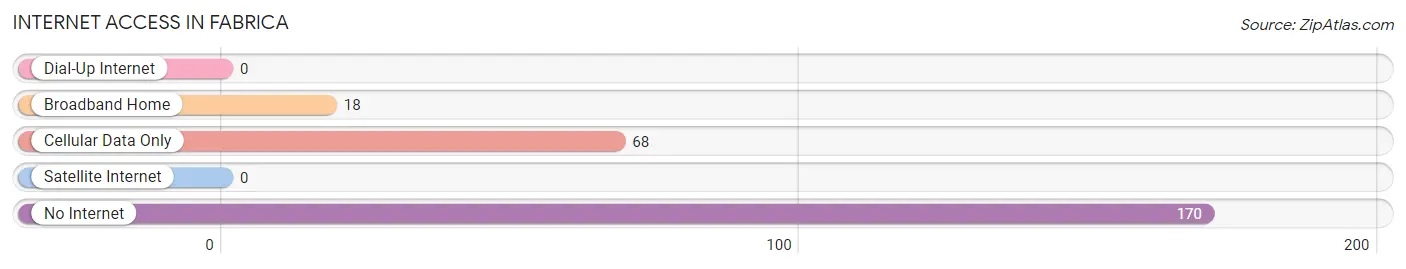
| Internet Type | # Households | % Households |
| Dial-Up Internet | 0 | 0.0% |
| Broadband Home | 18 | 7.0% |
| Cellular Data Only | 68 | 26.6% |
| Satellite Internet | 0 | 0.0% |
| No Internet | 170 | 66.4% |
| Total | 256 | 100.0% |
Fabrica Summary
Fabrica, Texas is a small town located in the southeastern corner of Texas, in the United States. It is situated in the county of Cameron, and is part of the Brownsville–Harlingen Metropolitan Statistical Area. The town has a population of just over 1,000 people, and is known for its rural charm and friendly atmosphere.
Geography
Fabrica is located in the southeastern corner of Texas, in Cameron County. It is situated at the intersection of State Highway 4 and Farm to Market Road 803, about 10 miles south of Brownsville. The town is surrounded by agricultural land, and is located in the Rio Grande Valley. The climate in Fabrica is subtropical, with hot summers and mild winters.
Economy
The economy of Fabrica is largely based on agriculture. The town is surrounded by agricultural land, and many of the residents are employed in the farming industry. The town also has a few small businesses, including a grocery store, a gas station, and a few restaurants.
Demographics
As of the 2010 census, the population of Fabrica was 1,072. The racial makeup of the town was 94.3% Hispanic or Latino, 4.2% White, 0.3% African American, 0.2% Native American, 0.1% Asian, and 0.9% from other races. The median household income was $20,972, and the median family income was $25,000.
History
Fabrica was founded in the late 19th century by a group of Mexican immigrants. The town was originally called “La Fabrica”, which means “the factory” in Spanish. The town was named after a local factory that was built in the area. The factory was used to produce cotton and other agricultural products.
In the early 20th century, Fabrica was a thriving agricultural community. The town was home to several cotton gins, and the local economy was largely based on the production of cotton. However, the Great Depression of the 1930s caused the town to suffer economically. Many of the local businesses closed, and the population of the town declined.
In the 1950s, the economy of Fabrica began to improve. The town was home to several small businesses, and the population began to grow. In the late 20th century, the town experienced a period of growth and development. The population of the town increased, and new businesses opened in the area.
Today, Fabrica is a small but thriving town. The town is known for its rural charm and friendly atmosphere. The local economy is still largely based on agriculture, but the town also has a few small businesses. The population of the town is slowly increasing, and the town is becoming a popular destination for tourists and retirees.
Common Questions
What is Per Capita Income in Fabrica?
Per Capita income in Fabrica is $10,706.
What is the Median Household income in Fabrica?
Median Household Income in Fabrica is $35,784.
What is Inequality or Gini Index in Fabrica?
Inequality or Gini Index in Fabrica is 0.23.
What is the Total Population of Fabrica?
Total Population of Fabrica is 918.
What is the Total Male Population of Fabrica?
Total Male Population of Fabrica is 526.
What is the Total Female Population of Fabrica?
Total Female Population of Fabrica is 392.
What is the Ratio of Males per 100 Females in Fabrica?
There are 134.18 Males per 100 Females in Fabrica.
What is the Ratio of Females per 100 Males in Fabrica?
There are 74.52 Females per 100 Males in Fabrica.
What is the Median Population Age in Fabrica?
Median Population Age in Fabrica is 31.4 Years.
What is the Average Family Size in Fabrica
Average Family Size in Fabrica is 4.7 People.
What is the Average Household Size in Fabrica
Average Household Size in Fabrica is 3.6 People.
How Large is the Labor Force in Fabrica?
There are 256 People in the Labor Forcein in Fabrica.
What is the Percentage of People in the Labor Force in Fabrica?
41.0% of People are in the Labor Force in Fabrica.
What is the Unemployment Rate in Fabrica?
Unemployment Rate in Fabrica is 12.5%.