East Globe, AZ Map & Demographics
East Globe Map
East Globe Overview
$20,870
PER CAPITA INCOME
$62,337
AVG FAMILY INCOME
$64,375
AVG HOUSEHOLD INCOME
40.5%
WAGE / INCOME GAP [ % ]
59.5¢/ $1
WAGE / INCOME GAP [ $ ]
0.19
INEQUALITY / GINI INDEX
246
TOTAL POPULATION
122
MALE POPULATION
124
FEMALE POPULATION
98.39
MALES / 100 FEMALES
101.64
FEMALES / 100 MALES
46.6
MEDIAN AGE
2.6
AVG FAMILY SIZE
2.7
AVG HOUSEHOLD SIZE
94
LABOR FORCE [ PEOPLE ]
57.0%
PERCENT IN LABOR FORCE
8.5%
UNEMPLOYMENT RATE
Income in East Globe
Income Overview in East Globe
Per Capita Income in East Globe is $20,870, while median incomes of families and households are $62,337 and $64,375 respectively.
| Characteristic | Number | Measure |
| Per Capita Income | 246 | $20,870 |
| Median Family Income | 79 | $62,337 |
| Mean Family Income | 79 | $60,552 |
| Median Household Income | 92 | $64,375 |
| Mean Household Income | 92 | $63,239 |
| Income Deficit | 79 | $0 |
| Wage / Income Gap (%) | 246 | 40.50% |
| Wage / Income Gap ($) | 246 | 59.50¢ per $1 |
| Gini / Inequality Index | 246 | 0.19 |
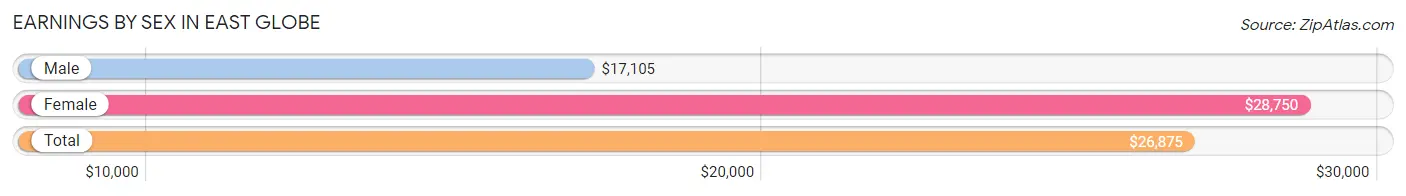
Earnings by Sex in East Globe
Average Earnings in East Globe are $26,875, $17,105 for men and $28,750 for women, a difference of 40.5%.
| Sex | Number | Average Earnings |
| Male | 68 (60.7%) | $17,105 |
| Female | 44 (39.3%) | $28,750 |
| Total | 112 (100.0%) | $26,875 |
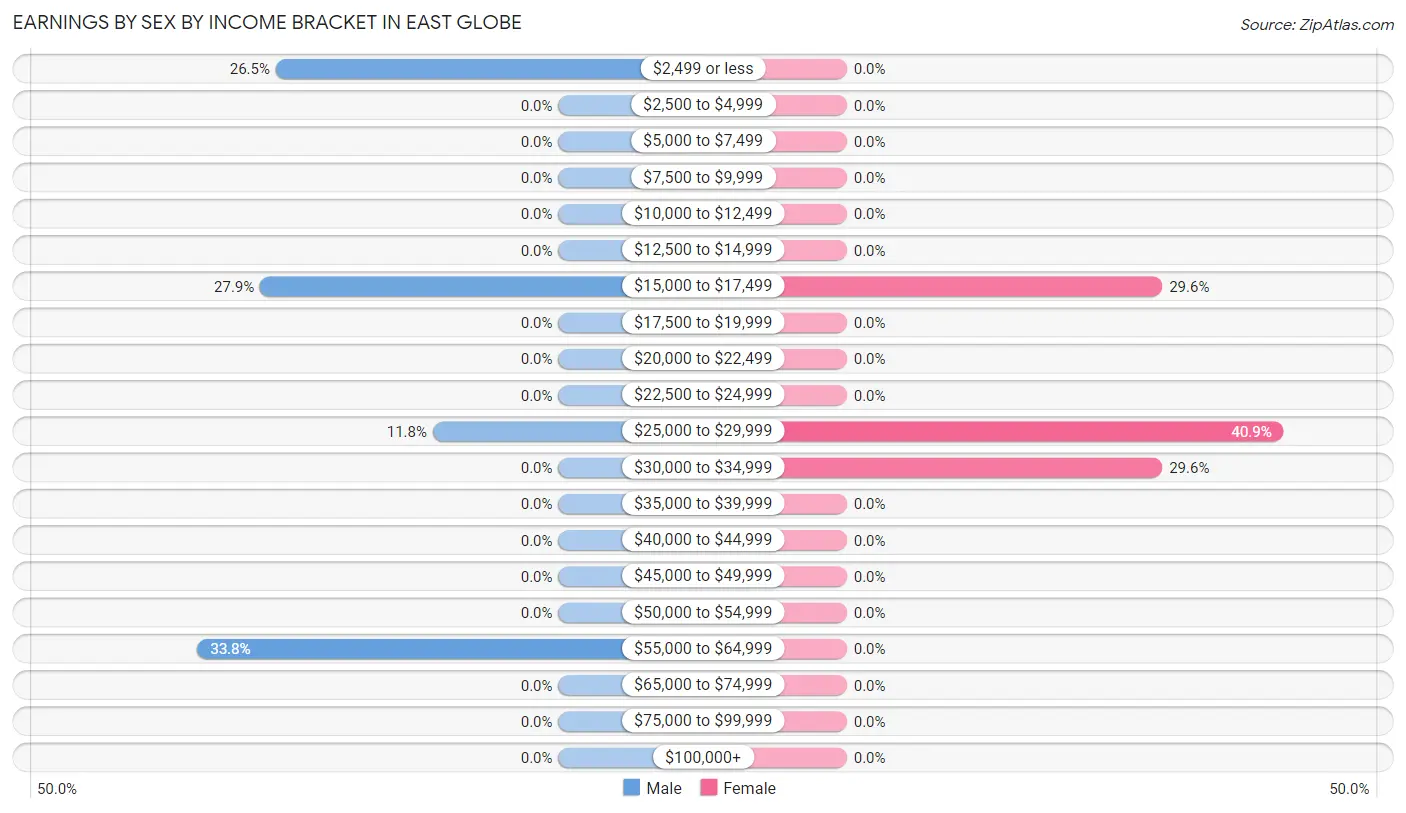
Earnings by Sex by Income Bracket in East Globe
The most common earnings brackets in East Globe are $55,000 to $64,999 for men (23 | 33.8%) and $25,000 to $29,999 for women (18 | 40.9%).
| Income | Male | Female |
| $2,499 or less | 18 (26.5%) | 0 (0.0%) |
| $2,500 to $4,999 | 0 (0.0%) | 0 (0.0%) |
| $5,000 to $7,499 | 0 (0.0%) | 0 (0.0%) |
| $7,500 to $9,999 | 0 (0.0%) | 0 (0.0%) |
| $10,000 to $12,499 | 0 (0.0%) | 0 (0.0%) |
| $12,500 to $14,999 | 0 (0.0%) | 0 (0.0%) |
| $15,000 to $17,499 | 19 (27.9%) | 13 (29.5%) |
| $17,500 to $19,999 | 0 (0.0%) | 0 (0.0%) |
| $20,000 to $22,499 | 0 (0.0%) | 0 (0.0%) |
| $22,500 to $24,999 | 0 (0.0%) | 0 (0.0%) |
| $25,000 to $29,999 | 8 (11.8%) | 18 (40.9%) |
| $30,000 to $34,999 | 0 (0.0%) | 13 (29.5%) |
| $35,000 to $39,999 | 0 (0.0%) | 0 (0.0%) |
| $40,000 to $44,999 | 0 (0.0%) | 0 (0.0%) |
| $45,000 to $49,999 | 0 (0.0%) | 0 (0.0%) |
| $50,000 to $54,999 | 0 (0.0%) | 0 (0.0%) |
| $55,000 to $64,999 | 23 (33.8%) | 0 (0.0%) |
| $65,000 to $74,999 | 0 (0.0%) | 0 (0.0%) |
| $75,000 to $99,999 | 0 (0.0%) | 0 (0.0%) |
| $100,000+ | 0 (0.0%) | 0 (0.0%) |
| Total | 68 (100.0%) | 44 (100.0%) |
Earnings by Sex by Educational Attainment in East Globe
| Educational Attainment | Male Income | Female Income |
| Less than High School | - | - |
| High School Diploma | - | - |
| College or Associate's Degree | - | - |
| Bachelor's Degree | - | - |
| Graduate Degree | - | - |
| Total | $17,105 | $28,750 |
Family Income in East Globe
Family Income Brackets in East Globe
According to the East Globe family income data, there are 43 families falling into the $50,000 to $74,999 income range, which is the most common income bracket and makes up 54.4% of all families.
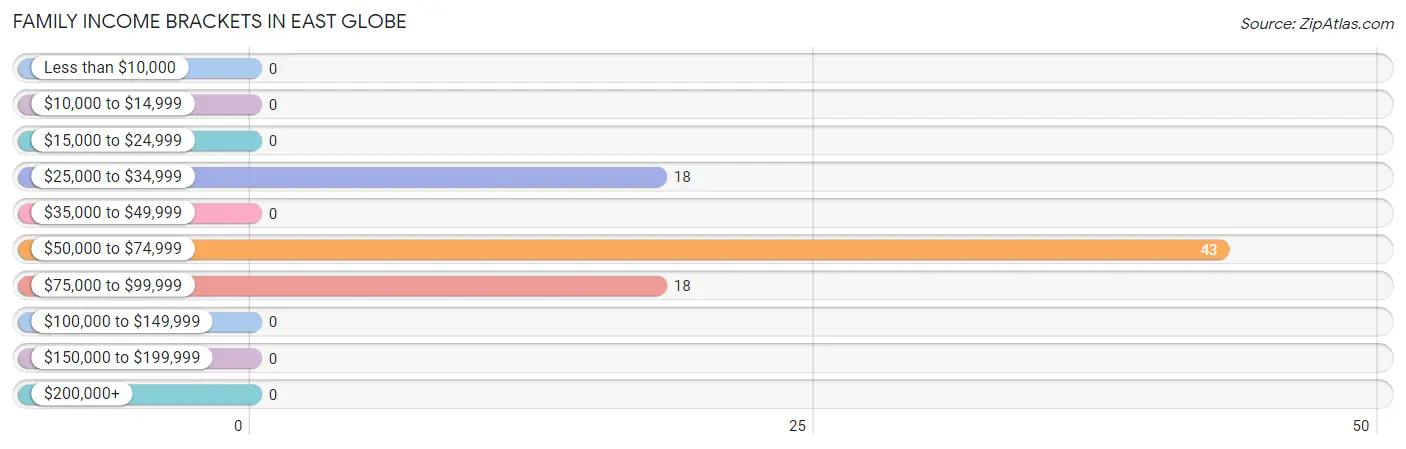
| Income Bracket | # Families | % Families |
| Less than $10,000 | 0 | 0.0% |
| $10,000 to $14,999 | 0 | 0.0% |
| $15,000 to $24,999 | 0 | 0.0% |
| $25,000 to $34,999 | 18 | 22.8% |
| $35,000 to $49,999 | 0 | 0.0% |
| $50,000 to $74,999 | 43 | 54.4% |
| $75,000 to $99,999 | 18 | 22.8% |
| $100,000 to $149,999 | 0 | 0.0% |
| $150,000 to $199,999 | 0 | 0.0% |
| $200,000+ | 0 | 0.0% |
Family Income by Famaliy Size in East Globe
| Income Bracket | # Families | Median Income |
| 2-Person Families | 41 (51.9%) | $0 |
| 3-Person Families | 38 (48.1%) | $0 |
| 4-Person Families | 0 (0.0%) | $0 |
| 5-Person Families | 0 (0.0%) | $0 |
| 6-Person Families | 0 (0.0%) | $0 |
| 7+ Person Families | 0 (0.0%) | $0 |
| Total | 79 (100.0%) | $62,337 |
Family Income by Number of Earners in East Globe
| Number of Earners | # Families | Median Income |
| No Earners | 18 (22.8%) | $0 |
| 1 Earner | 38 (48.1%) | $0 |
| 2 Earners | 23 (29.1%) | $0 |
| 3+ Earners | 0 (0.0%) | $0 |
| Total | 79 (100.0%) | $62,337 |
Household Income in East Globe
Household Income Brackets in East Globe
With 41 households falling in the category, the $75,000 to $99,999 income range is the most frequent in East Globe, accounting for 44.6% of all households.
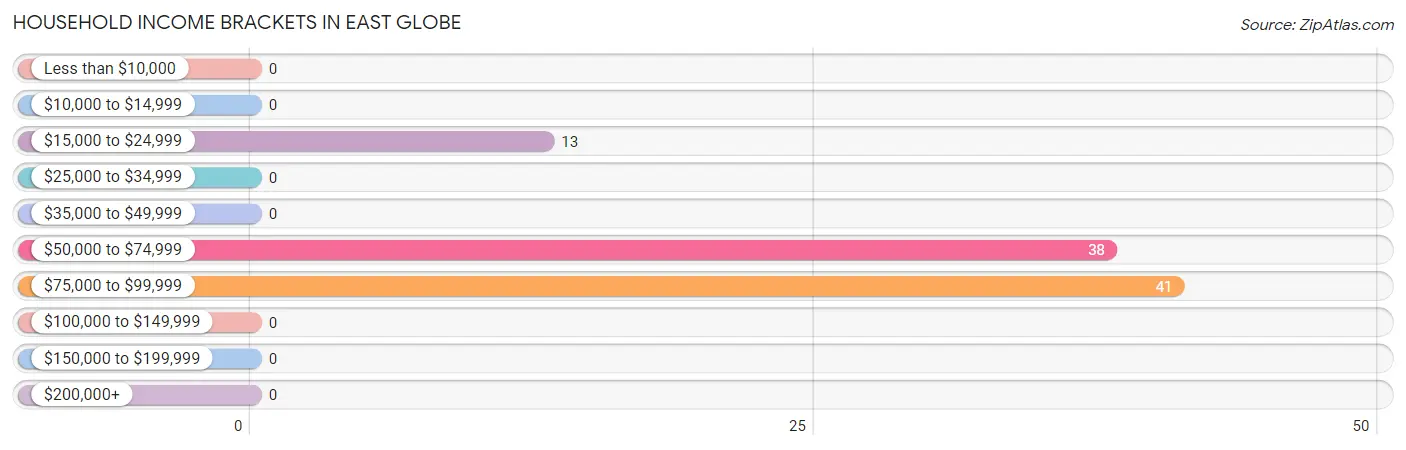
| Income Bracket | # Households | % Households |
| Less than $10,000 | 0 | 0.0% |
| $10,000 to $14,999 | 0 | 0.0% |
| $15,000 to $24,999 | 13 | 14.1% |
| $25,000 to $34,999 | 0 | 0.0% |
| $35,000 to $49,999 | 0 | 0.0% |
| $50,000 to $74,999 | 38 | 41.3% |
| $75,000 to $99,999 | 41 | 44.6% |
| $100,000 to $149,999 | 0 | 0.0% |
| $150,000 to $199,999 | 0 | 0.0% |
| $200,000+ | 0 | 0.0% |
Household Income by Householder Age in East Globe
The median household income in East Globe is $64,375, with the highest median household income of $64,063 found in the 65+ years age bracket for the primary householder. A total of 51 households (55.4%) fall into this category.
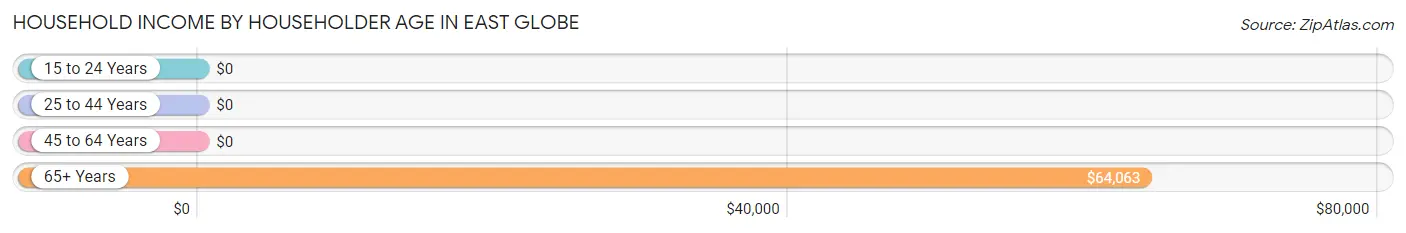
| Income Bracket | # Households | Median Income |
| 15 to 24 Years | 0 (0.0%) | $0 |
| 25 to 44 Years | 0 (0.0%) | $0 |
| 45 to 64 Years | 41 (44.6%) | $0 |
| 65+ Years | 51 (55.4%) | $64,063 |
| Total | 92 (100.0%) | $64,375 |
Poverty in East Globe
Income Below Poverty by Sex and Age in East Globe
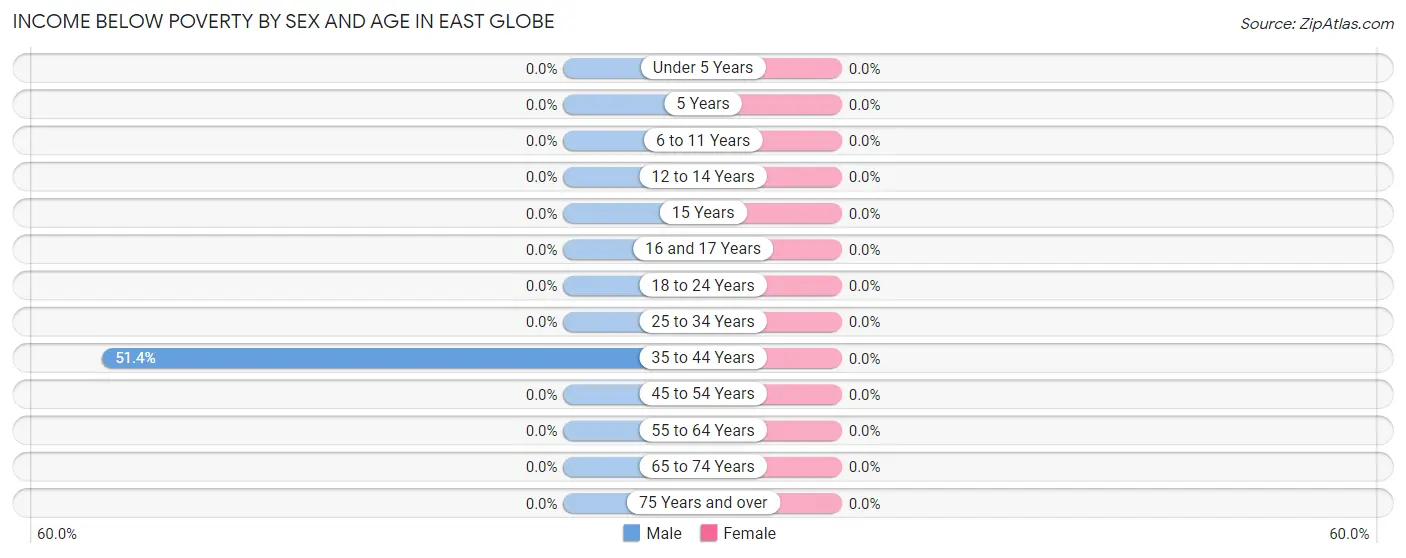
| Age Bracket | Male | Female |
| Under 5 Years | 0 (0.0%) | 0 (0.0%) |
| 5 Years | 0 (0.0%) | 0 (0.0%) |
| 6 to 11 Years | 0 (0.0%) | 0 (0.0%) |
| 12 to 14 Years | 0 (0.0%) | 0 (0.0%) |
| 15 Years | 0 (0.0%) | 0 (0.0%) |
| 16 and 17 Years | 0 (0.0%) | 0 (0.0%) |
| 18 to 24 Years | 0 (0.0%) | 0 (0.0%) |
| 25 to 34 Years | 0 (0.0%) | 0 (0.0%) |
| 35 to 44 Years | 19 (51.3%) | 0 (0.0%) |
| 45 to 54 Years | 0 (0.0%) | 0 (0.0%) |
| 55 to 64 Years | 0 (0.0%) | 0 (0.0%) |
| 65 to 74 Years | 0 (0.0%) | 0 (0.0%) |
| 75 Years and over | 0 (0.0%) | 0 (0.0%) |
| Total | 19 (15.6%) | 0 (0.0%) |
Income Above Poverty by Sex and Age in East Globe
According to the poverty statistics in East Globe, males aged 6 to 11 years and females aged 6 to 11 years are the age groups that are most secure financially, with 100.0% of males and 100.0% of females in these age groups living above the poverty line.
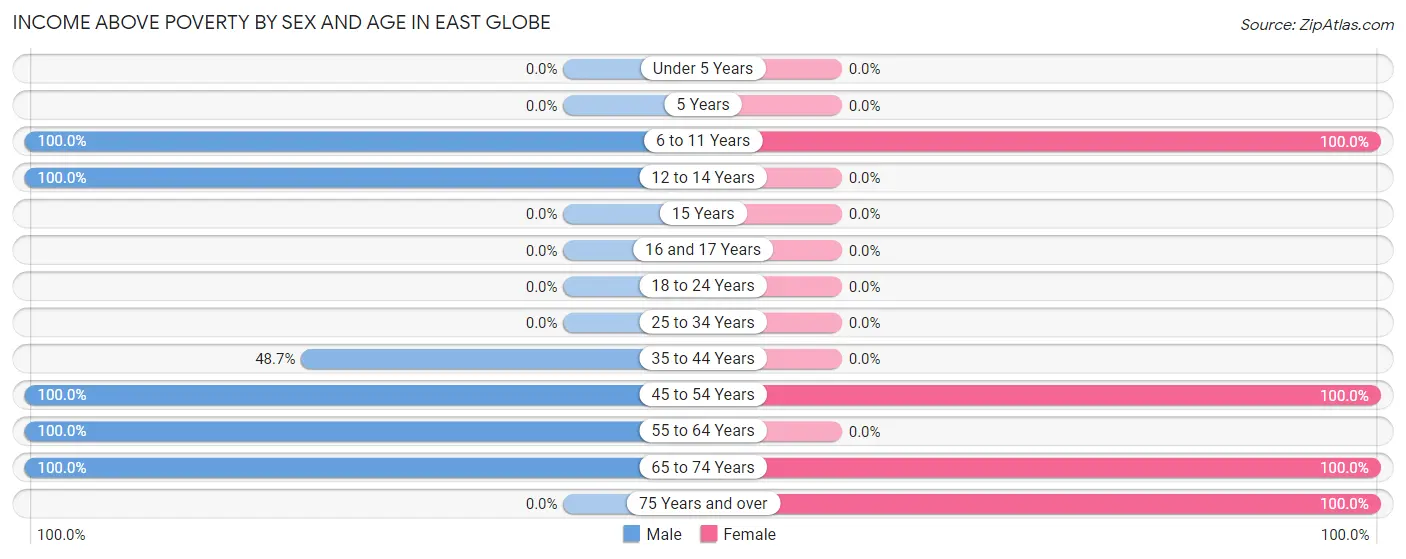
| Age Bracket | Male | Female |
| Under 5 Years | 0 (0.0%) | 0 (0.0%) |
| 5 Years | 0 (0.0%) | 0 (0.0%) |
| 6 to 11 Years | 24 (100.0%) | 42 (100.0%) |
| 12 to 14 Years | 15 (100.0%) | 0 (0.0%) |
| 15 Years | 0 (0.0%) | 0 (0.0%) |
| 16 and 17 Years | 0 (0.0%) | 0 (0.0%) |
| 18 to 24 Years | 0 (0.0%) | 0 (0.0%) |
| 25 to 34 Years | 0 (0.0%) | 0 (0.0%) |
| 35 to 44 Years | 18 (48.6%) | 0 (0.0%) |
| 45 to 54 Years | 8 (100.0%) | 31 (100.0%) |
| 55 to 64 Years | 23 (100.0%) | 0 (0.0%) |
| 65 to 74 Years | 15 (100.0%) | 31 (100.0%) |
| 75 Years and over | 0 (0.0%) | 20 (100.0%) |
| Total | 103 (84.4%) | 124 (100.0%) |
Income Below Poverty Among Married-Couple Families in East Globe
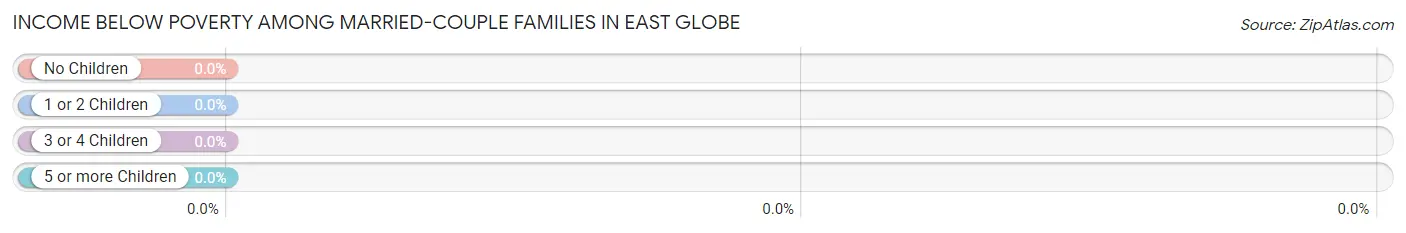
| Children | Above Poverty | Below Poverty |
| No Children | 18 (100.0%) | 0 (0.0%) |
| 1 or 2 Children | 0 (0.0%) | 0 (0.0%) |
| 3 or 4 Children | 0 (0.0%) | 0 (0.0%) |
| 5 or more Children | 0 (0.0%) | 0 (0.0%) |
| Total | 18 (100.0%) | 0 (0.0%) |
Income Below Poverty Among Single-Parent Households in East Globe
| Children | Single Father | Single Mother |
| No Children | 0 (0.0%) | 0 (0.0%) |
| 1 or 2 Children | 0 (0.0%) | 0 (0.0%) |
| 3 or 4 Children | 0 (0.0%) | 0 (0.0%) |
| 5 or more Children | 0 (0.0%) | 0 (0.0%) |
| Total | 0 (0.0%) | 0 (0.0%) |
Income Below Poverty Among Married-Couple vs Single-Parent Households in East Globe
| Children | Married-Couple Families | Single-Parent Households |
| No Children | 0 (0.0%) | 0 (0.0%) |
| 1 or 2 Children | 0 (0.0%) | 0 (0.0%) |
| 3 or 4 Children | 0 (0.0%) | 0 (0.0%) |
| 5 or more Children | 0 (0.0%) | 0 (0.0%) |
| Total | 0 (0.0%) | 0 (0.0%) |
Race in East Globe
The most populous races in East Globe are Native / Alaskan (231 | 93.9%), and White / Caucasian (15 | 6.1%).
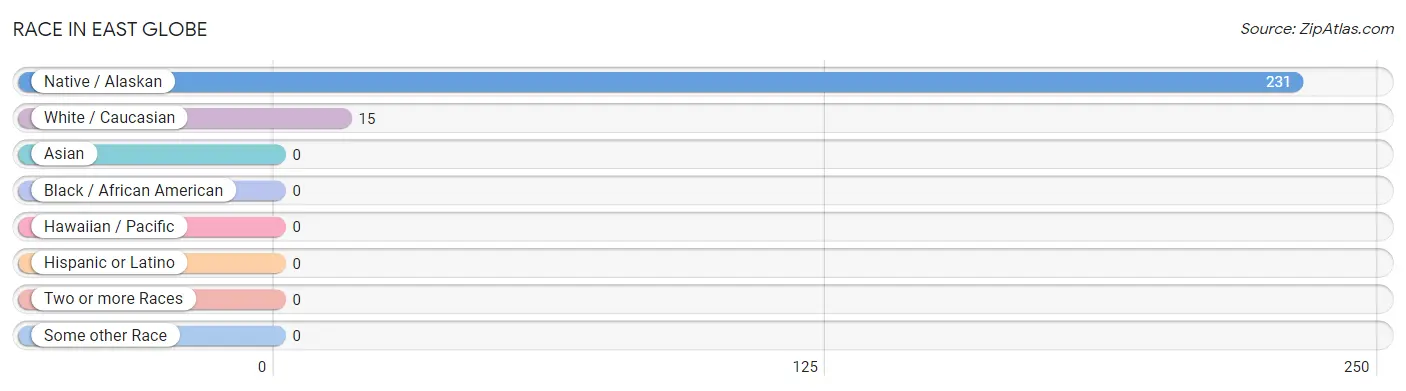
| Race | # Population | % Population |
| Asian | 0 | 0.0% |
| Black / African American | 0 | 0.0% |
| Hawaiian / Pacific | 0 | 0.0% |
| Hispanic or Latino | 0 | 0.0% |
| Native / Alaskan | 231 | 93.9% |
| White / Caucasian | 15 | 6.1% |
| Two or more Races | 0 | 0.0% |
| Some other Race | 0 | 0.0% |
| Total | 246 | 100.0% |
Ancestry in East Globe
The most populous ancestries reported in East Globe are Apache (64 | 26.0%), and Navajo (60 | 24.4%), together accounting for 50.4% of all East Globe residents.
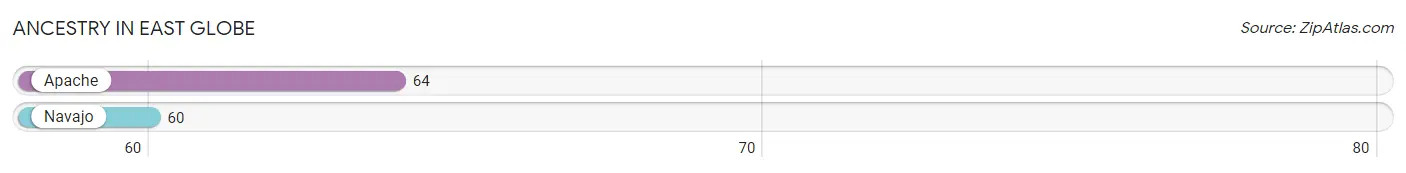
| Ancestry | # Population | % Population |
| Apache | 64 | 26.0% |
| Navajo | 60 | 24.4% | View All 2 Rows |
Immigrants in East Globe

| Immigration Origin | # Population | % Population | View All 0 Rows |
Sex and Age in East Globe
Sex and Age in East Globe
The most populous age groups in East Globe are 10 to 14 Years (39 | 32.0%) for men and 10 to 14 Years (42 | 33.9%) for women.
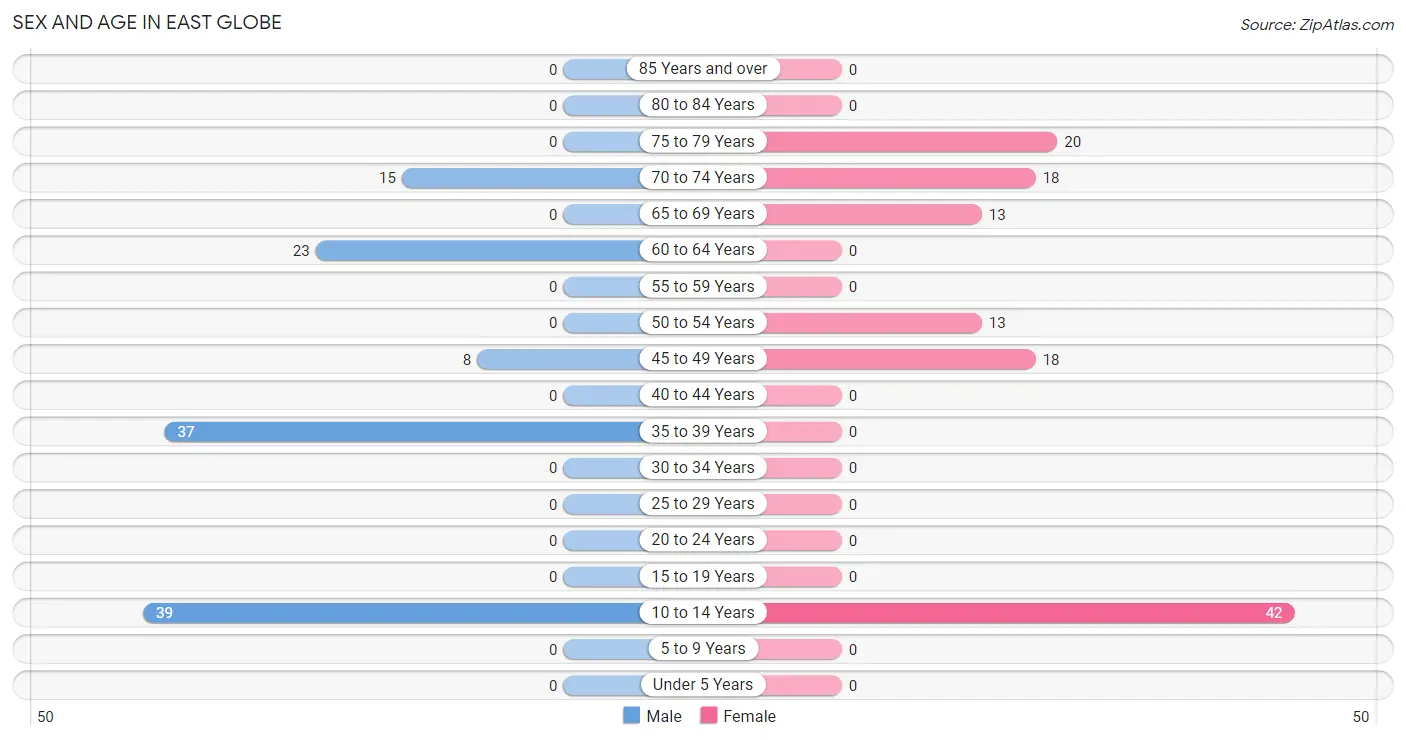
| Age Bracket | Male | Female |
| Under 5 Years | 0 (0.0%) | 0 (0.0%) |
| 5 to 9 Years | 0 (0.0%) | 0 (0.0%) |
| 10 to 14 Years | 39 (32.0%) | 42 (33.9%) |
| 15 to 19 Years | 0 (0.0%) | 0 (0.0%) |
| 20 to 24 Years | 0 (0.0%) | 0 (0.0%) |
| 25 to 29 Years | 0 (0.0%) | 0 (0.0%) |
| 30 to 34 Years | 0 (0.0%) | 0 (0.0%) |
| 35 to 39 Years | 37 (30.3%) | 0 (0.0%) |
| 40 to 44 Years | 0 (0.0%) | 0 (0.0%) |
| 45 to 49 Years | 8 (6.6%) | 18 (14.5%) |
| 50 to 54 Years | 0 (0.0%) | 13 (10.5%) |
| 55 to 59 Years | 0 (0.0%) | 0 (0.0%) |
| 60 to 64 Years | 23 (18.9%) | 0 (0.0%) |
| 65 to 69 Years | 0 (0.0%) | 13 (10.5%) |
| 70 to 74 Years | 15 (12.3%) | 18 (14.5%) |
| 75 to 79 Years | 0 (0.0%) | 20 (16.1%) |
| 80 to 84 Years | 0 (0.0%) | 0 (0.0%) |
| 85 Years and over | 0 (0.0%) | 0 (0.0%) |
| Total | 122 (100.0%) | 124 (100.0%) |
Families and Households in East Globe
Median Family Size in East Globe
The median family size in East Globe is 2.61 persons per family, with single female/mother families (38 | 48.1%) accounting for the largest median family size of 3.47 persons per family. On the other hand, single male/father families (23 | 29.1%) represent the smallest median family size with 1.78 persons per family.
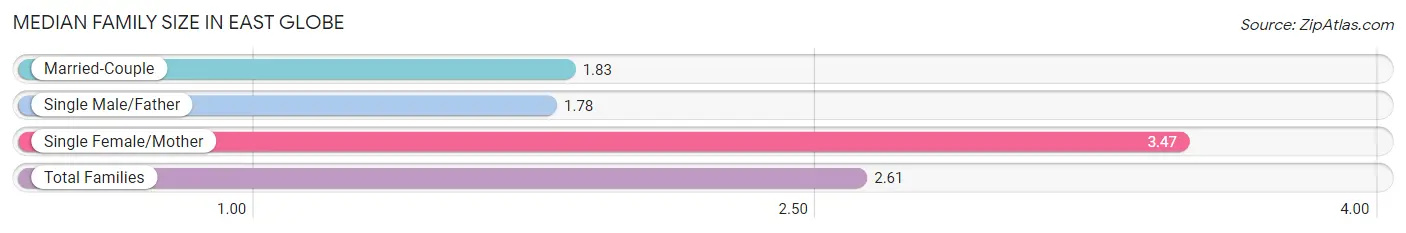
| Family Type | # Families | Family Size |
| Married-Couple | 18 (22.8%) | 1.83 |
| Single Male/Father | 23 (29.1%) | 1.78 |
| Single Female/Mother | 38 (48.1%) | 3.47 |
| Total Families | 79 (100.0%) | 2.61 |
Median Household Size in East Globe
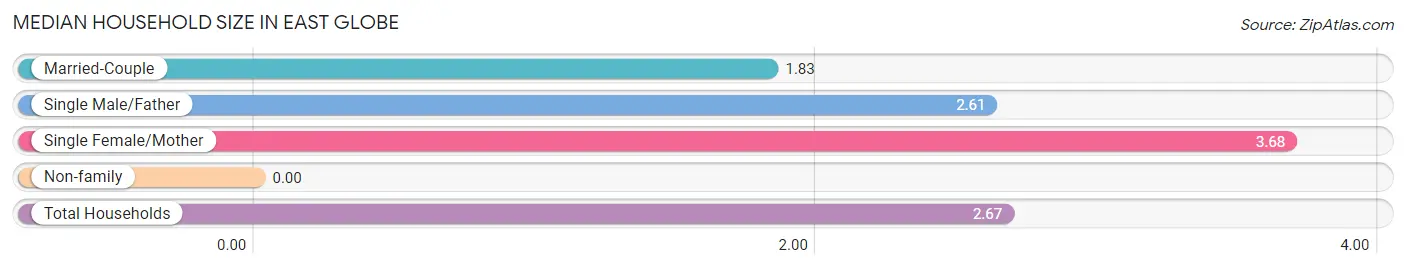
| Household Type | # Households | Household Size |
| Married-Couple | 18 (19.6%) | 1.83 |
| Single Male/Father | 23 (25.0%) | 2.61 |
| Single Female/Mother | 38 (41.3%) | 3.68 |
| Non-family | 13 (14.1%) | - |
| Total Households | 92 (100.0%) | 2.67 |
Household Size by Marriage Status in East Globe
Out of a total of 92 households in East Globe, 79 (85.9%) are family households, while 13 (14.1%) are nonfamily households. The most numerous type of family households are 3-person households, comprising 43, and the most common type of nonfamily households are 1-person households, comprising 13.
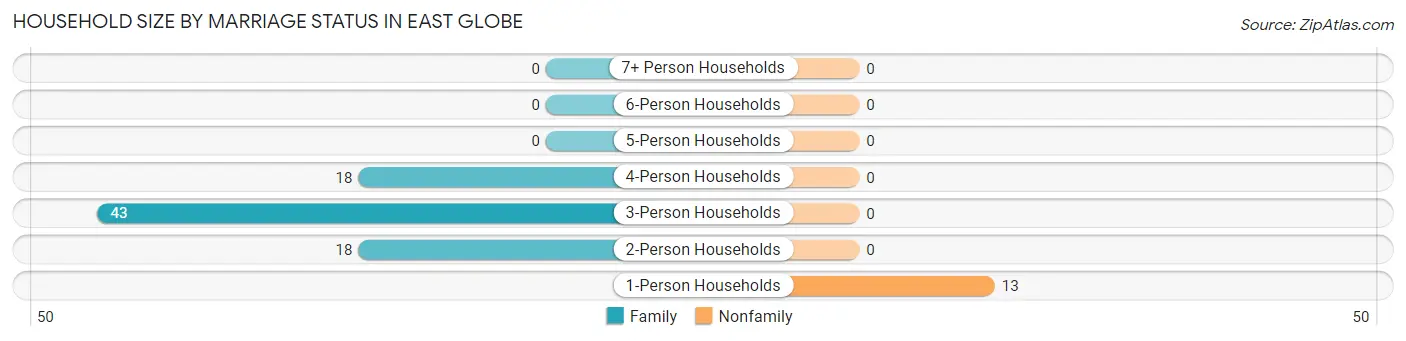
| Household Size | Family Households | Nonfamily Households |
| 1-Person Households | - | 13 (14.1%) |
| 2-Person Households | 18 (19.6%) | 0 (0.0%) |
| 3-Person Households | 43 (46.7%) | 0 (0.0%) |
| 4-Person Households | 18 (19.6%) | 0 (0.0%) |
| 5-Person Households | 0 (0.0%) | 0 (0.0%) |
| 6-Person Households | 0 (0.0%) | 0 (0.0%) |
| 7+ Person Households | 0 (0.0%) | 0 (0.0%) |
| Total | 79 (85.9%) | 13 (14.1%) |
Female Fertility in East Globe
Fertility by Age in East Globe
| Age Bracket | Women with Births | Births / 1,000 Women |
| 15 to 19 years | 0 (0.0%) | 0.0 |
| 20 to 34 years | 0 (0.0%) | 0.0 |
| 35 to 50 years | 0 (0.0%) | 0.0 |
| Total | 0 (0.0%) | 0.0 |
Fertility by Age by Marriage Status in East Globe
| Age Bracket | Married | Unmarried |
| 15 to 19 years | 0 (0.0%) | 0 (0.0%) |
| 20 to 34 years | 0 (0.0%) | 0 (0.0%) |
| 35 to 50 years | 0 (0.0%) | 0 (0.0%) |
| Total | 0 (0.0%) | 0 (0.0%) |
Fertility by Education in East Globe
| Educational Attainment | Women with Births | Births / 1,000 Women |
| Less than High School | 0 (0.0%) | 0.0 |
| High School Diploma | 0 (0.0%) | 0.0 |
| College or Associate's Degree | 0 (0.0%) | 0.0 |
| Bachelor's Degree | 0 (0.0%) | 0.0 |
| Graduate Degree | 0 (0.0%) | 0.0 |
| Total | 0 (0.0%) | 0.0 |
Fertility by Education by Marriage Status in East Globe
| Educational Attainment | Married | Unmarried |
| Less than High School | 0 (0.0%) | 0 (0.0%) |
| High School Diploma | 0 (0.0%) | 0 (0.0%) |
| College or Associate's Degree | 0 (0.0%) | 0 (0.0%) |
| Bachelor's Degree | 0 (0.0%) | 0 (0.0%) |
| Graduate Degree | 0 (0.0%) | 0 (0.0%) |
| Total | 0 (0.0%) | 0 (0.0%) |
Employment Characteristics in East Globe
Employment by Class of Employer in East Globe
Among the 86 employed individuals in East Globe, private company employees (55 | 63.9%), self-employed (not incorporated) (18 | 20.9%), and local government employees (13 | 15.1%) make up the most common classes of employment.
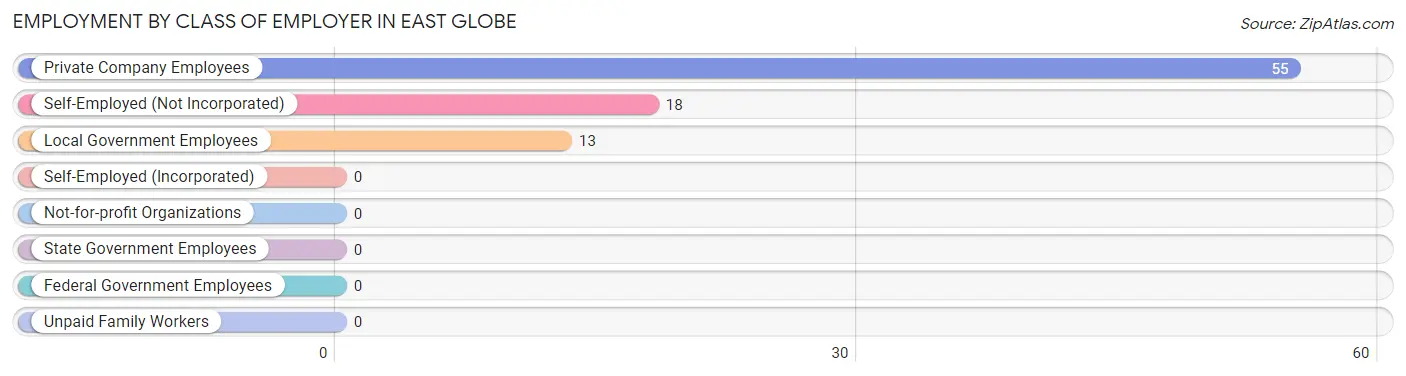
| Employer Class | # Employees | % Employees |
| Private Company Employees | 55 | 63.9% |
| Self-Employed (Incorporated) | 0 | 0.0% |
| Self-Employed (Not Incorporated) | 18 | 20.9% |
| Not-for-profit Organizations | 0 | 0.0% |
| Local Government Employees | 13 | 15.1% |
| State Government Employees | 0 | 0.0% |
| Federal Government Employees | 0 | 0.0% |
| Unpaid Family Workers | 0 | 0.0% |
| Total | 86 | 100.0% |
Employment Status by Age in East Globe
According to the labor force statistics for East Globe, out of the total population over 16 years of age (165), 57.0% or 94 individuals are in the labor force, with 8.5% or 8 of them unemployed. The age group with the highest labor force participation rate is 35 to 44 years, with 100.0% or 37 individuals in the labor force. Within the labor force, the 45 to 54 years age range has the highest percentage of unemployed individuals, with 38.1% or 8 of them being unemployed.
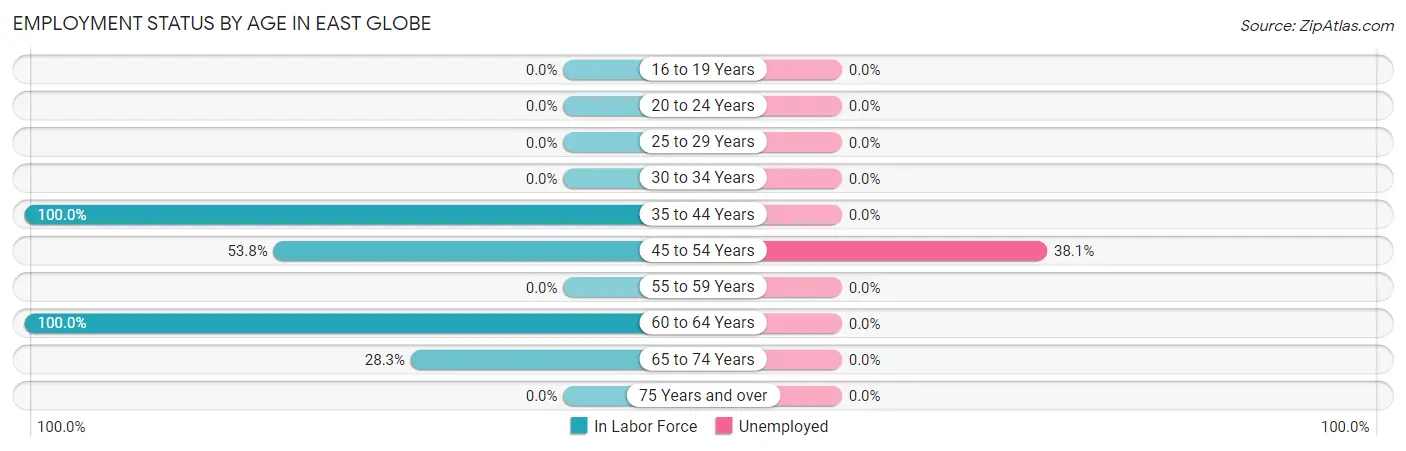
| Age Bracket | In Labor Force | Unemployed |
| 16 to 19 Years | 0 (0.0%) | 0 (0.0%) |
| 20 to 24 Years | 0 (0.0%) | 0 (0.0%) |
| 25 to 29 Years | 0 (0.0%) | 0 (0.0%) |
| 30 to 34 Years | 0 (0.0%) | 0 (0.0%) |
| 35 to 44 Years | 37 (100.0%) | 0 (0.0%) |
| 45 to 54 Years | 21 (53.8%) | 8 (38.1%) |
| 55 to 59 Years | 0 (0.0%) | 0 (0.0%) |
| 60 to 64 Years | 23 (100.0%) | 0 (0.0%) |
| 65 to 74 Years | 13 (28.3%) | 0 (0.0%) |
| 75 Years and over | 0 (0.0%) | 0 (0.0%) |
| Total | 94 (57.0%) | 8 (8.5%) |
Employment Status by Educational Attainment in East Globe
According to labor force statistics for East Globe, 81.8% of individuals (81) out of the total population between 25 and 64 years of age (99) are in the labor force, with 9.9% or 8 of them being unemployed. The group with the highest labor force participation rate are those with the educational attainment of less than high school, with 100.0% or 49 individuals in the labor force. Within the labor force, individuals with less than high school education have the highest percentage of unemployment, with 16.3% or 8 of them being unemployed.
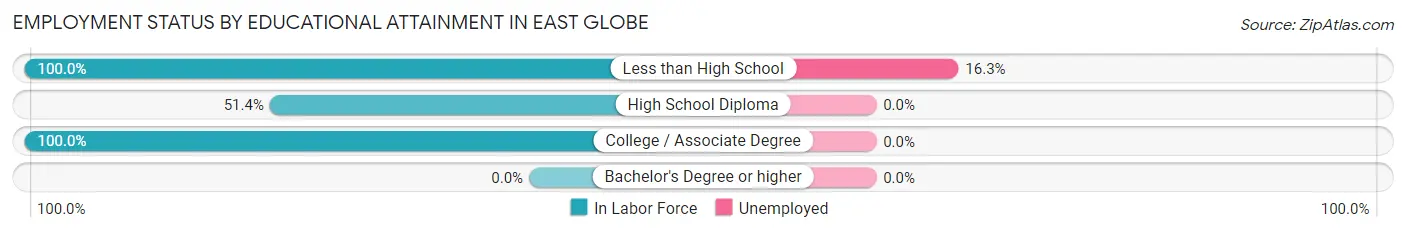
| Educational Attainment | In Labor Force | Unemployed |
| Less than High School | 49 (100.0%) | 8 (16.3%) |
| High School Diploma | 19 (51.4%) | 0 (0.0%) |
| College / Associate Degree | 13 (100.0%) | 0 (0.0%) |
| Bachelor's Degree or higher | 0 (0.0%) | 0 (0.0%) |
| Total | 81 (81.8%) | 10 (9.9%) |
Employment Occupations by Sex in East Globe
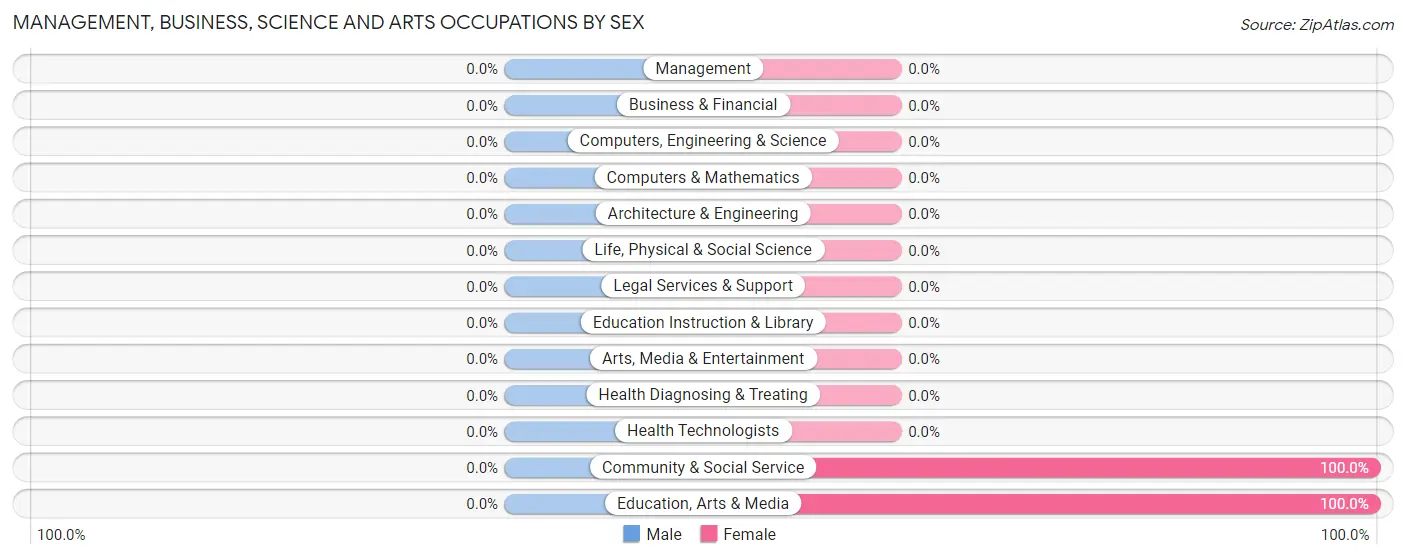
Management, Business, Science and Arts Occupations
The most common Management, Business, Science and Arts occupations in East Globe are Community & Social Service (13 | 15.1%), and Education, Arts & Media (13 | 15.1%).
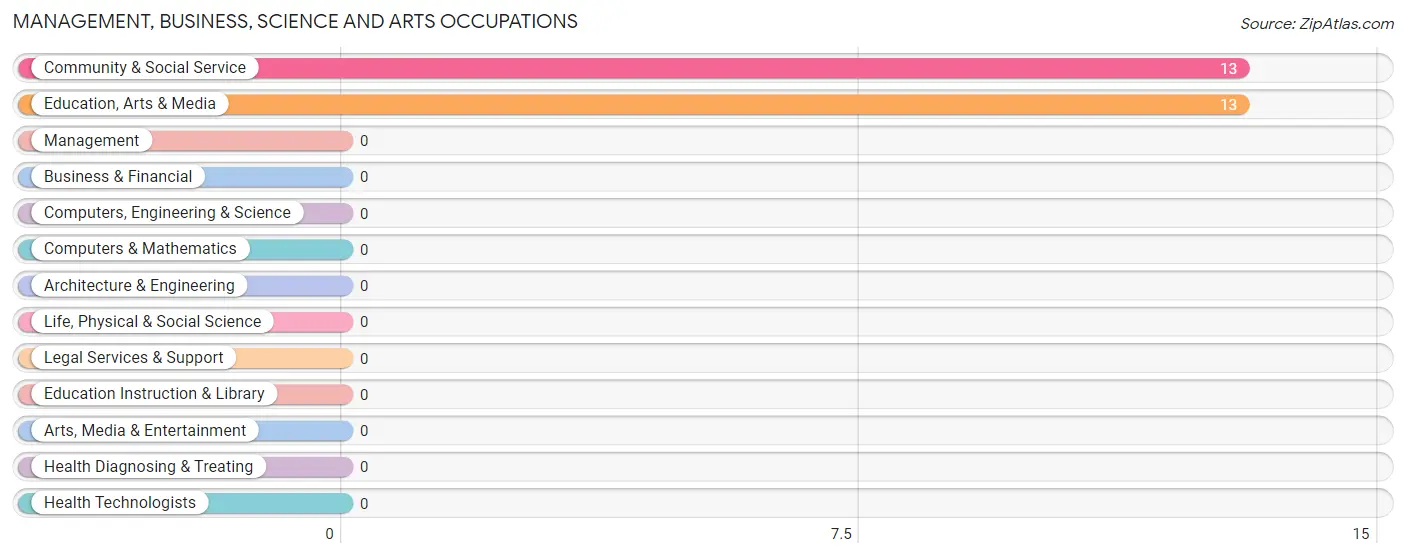
Management, Business, Science and Arts Occupations by Sex
| Occupation | Male | Female |
| Management | 0 (0.0%) | 0 (0.0%) |
| Business & Financial | 0 (0.0%) | 0 (0.0%) |
| Computers, Engineering & Science | 0 (0.0%) | 0 (0.0%) |
| Computers & Mathematics | 0 (0.0%) | 0 (0.0%) |
| Architecture & Engineering | 0 (0.0%) | 0 (0.0%) |
| Life, Physical & Social Science | 0 (0.0%) | 0 (0.0%) |
| Community & Social Service | 0 (0.0%) | 13 (100.0%) |
| Education, Arts & Media | 0 (0.0%) | 13 (100.0%) |
| Legal Services & Support | 0 (0.0%) | 0 (0.0%) |
| Education Instruction & Library | 0 (0.0%) | 0 (0.0%) |
| Arts, Media & Entertainment | 0 (0.0%) | 0 (0.0%) |
| Health Diagnosing & Treating | 0 (0.0%) | 0 (0.0%) |
| Health Technologists | 0 (0.0%) | 0 (0.0%) |
| Total (Category) | 0 (0.0%) | 13 (100.0%) |
| Total (Overall) | 60 (69.8%) | 26 (30.2%) |
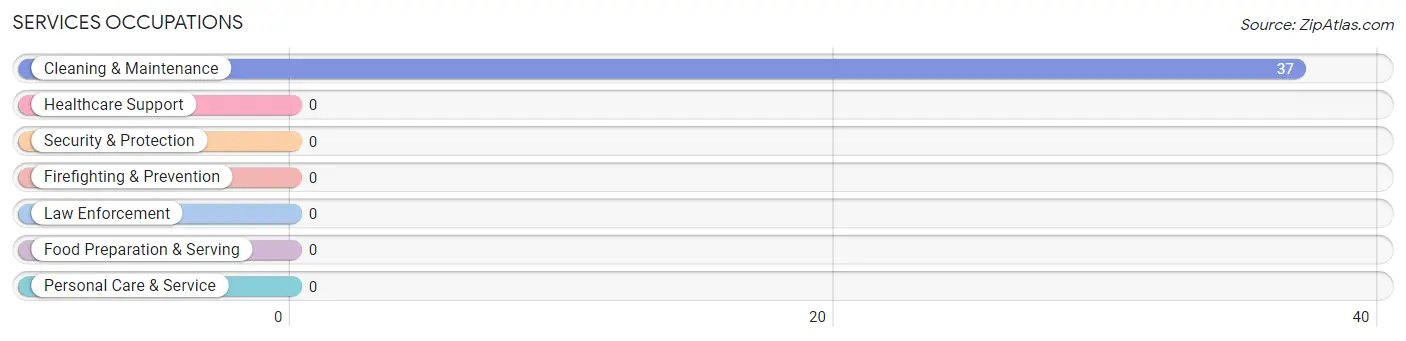
Services Occupations
The most common Services occupations in East Globe are , and Cleaning & Maintenance (37 | 43.0%).
Services Occupations by Sex
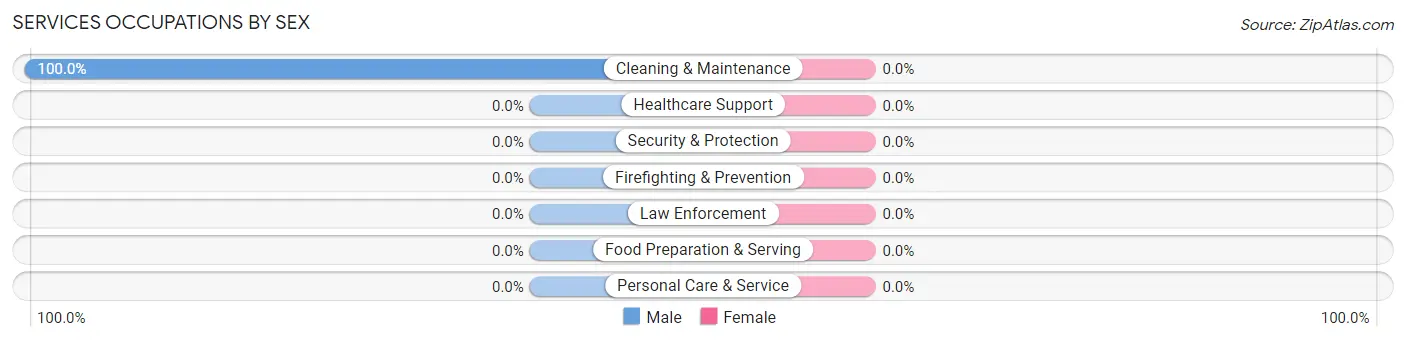
| Occupation | Male | Female |
| Healthcare Support | 0 (0.0%) | 0 (0.0%) |
| Security & Protection | 0 (0.0%) | 0 (0.0%) |
| Firefighting & Prevention | 0 (0.0%) | 0 (0.0%) |
| Law Enforcement | 0 (0.0%) | 0 (0.0%) |
| Food Preparation & Serving | 0 (0.0%) | 0 (0.0%) |
| Cleaning & Maintenance | 37 (100.0%) | 0 (0.0%) |
| Personal Care & Service | 0 (0.0%) | 0 (0.0%) |
| Total (Category) | 37 (100.0%) | 0 (0.0%) |
| Total (Overall) | 60 (69.8%) | 26 (30.2%) |
Sales and Office Occupations
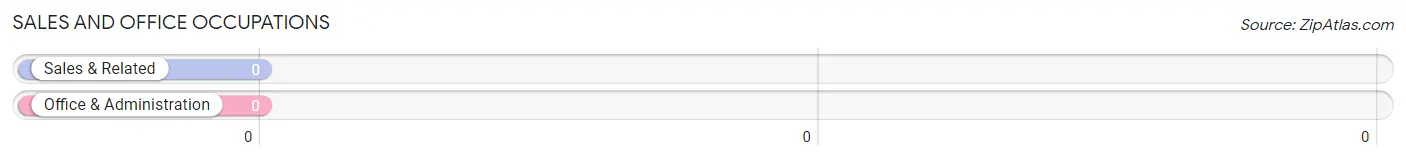
Sales and Office Occupations by Sex
| Occupation | Male | Female |
| Sales & Related | 0 (0.0%) | 0 (0.0%) |
| Office & Administration | 0 (0.0%) | 0 (0.0%) |
| Total (Category) | 0 (0.0%) | 0 (0.0%) |
| Total (Overall) | 60 (69.8%) | 26 (30.2%) |
Natural Resources, Construction and Maintenance Occupations
Natural Resources, Construction and Maintenance Occupations by Sex
| Occupation | Male | Female |
| Farming, Fishing & Forestry | 0 (0.0%) | 0 (0.0%) |
| Construction & Extraction | 0 (0.0%) | 0 (0.0%) |
| Installation, Maintenance & Repair | 0 (0.0%) | 0 (0.0%) |
| Total (Category) | 0 (0.0%) | 0 (0.0%) |
| Total (Overall) | 60 (69.8%) | 26 (30.2%) |
Production, Transportation and Moving Occupations
The most common Production, Transportation and Moving occupations in East Globe are , and Production (36 | 41.9%).
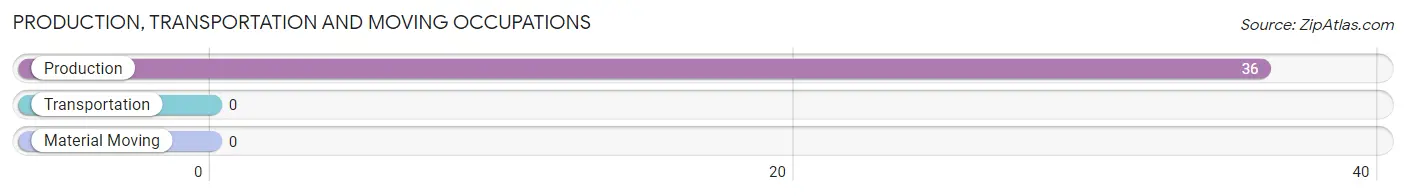
Production, Transportation and Moving Occupations by Sex
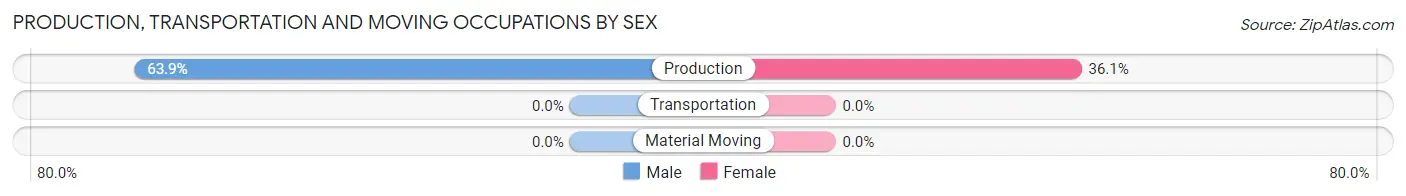
| Occupation | Male | Female |
| Production | 23 (63.9%) | 13 (36.1%) |
| Transportation | 0 (0.0%) | 0 (0.0%) |
| Material Moving | 0 (0.0%) | 0 (0.0%) |
| Total (Category) | 23 (63.9%) | 13 (36.1%) |
| Total (Overall) | 60 (69.8%) | 26 (30.2%) |
Employment Industries by Sex in East Globe
Employment Industries in East Globe
The major employment industries in East Globe include Administrative & Support (37 | 43.0%), Health Care & Social Assistance (26 | 30.2%), and Transportation & Warehousing (23 | 26.7%).
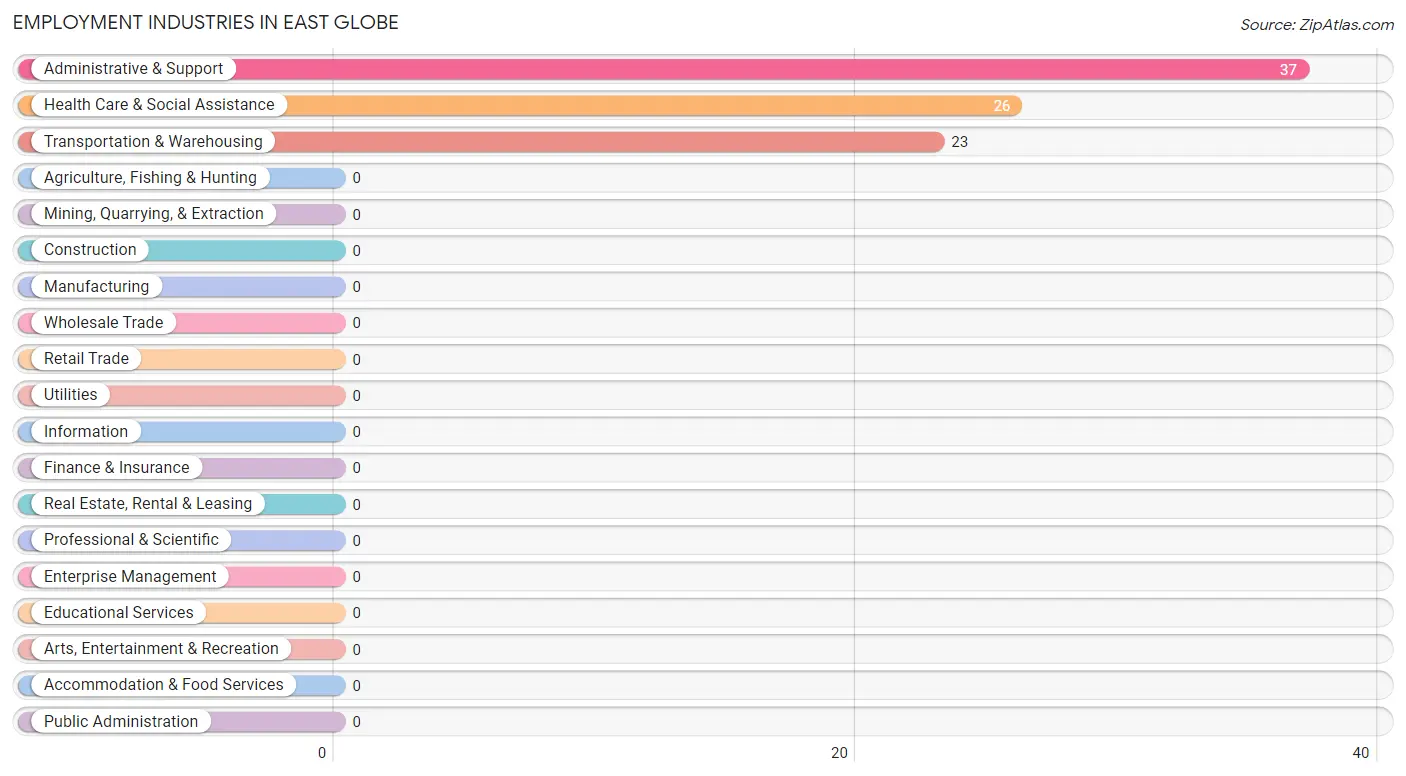
Employment Industries by Sex in East Globe
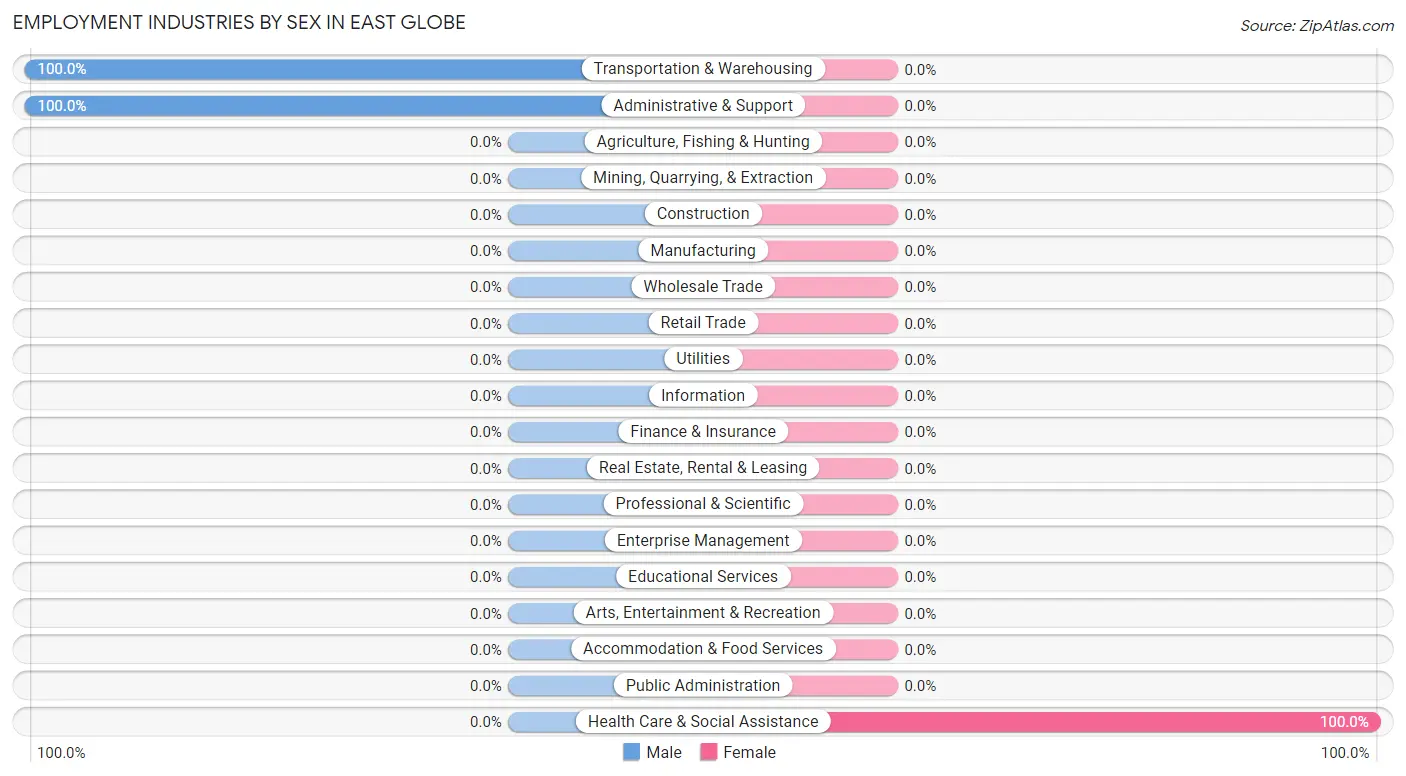
| Industry | Male | Female |
| Agriculture, Fishing & Hunting | 0 (0.0%) | 0 (0.0%) |
| Mining, Quarrying, & Extraction | 0 (0.0%) | 0 (0.0%) |
| Construction | 0 (0.0%) | 0 (0.0%) |
| Manufacturing | 0 (0.0%) | 0 (0.0%) |
| Wholesale Trade | 0 (0.0%) | 0 (0.0%) |
| Retail Trade | 0 (0.0%) | 0 (0.0%) |
| Transportation & Warehousing | 23 (100.0%) | 0 (0.0%) |
| Utilities | 0 (0.0%) | 0 (0.0%) |
| Information | 0 (0.0%) | 0 (0.0%) |
| Finance & Insurance | 0 (0.0%) | 0 (0.0%) |
| Real Estate, Rental & Leasing | 0 (0.0%) | 0 (0.0%) |
| Professional & Scientific | 0 (0.0%) | 0 (0.0%) |
| Enterprise Management | 0 (0.0%) | 0 (0.0%) |
| Administrative & Support | 37 (100.0%) | 0 (0.0%) |
| Educational Services | 0 (0.0%) | 0 (0.0%) |
| Health Care & Social Assistance | 0 (0.0%) | 26 (100.0%) |
| Arts, Entertainment & Recreation | 0 (0.0%) | 0 (0.0%) |
| Accommodation & Food Services | 0 (0.0%) | 0 (0.0%) |
| Public Administration | 0 (0.0%) | 0 (0.0%) |
| Total | 60 (69.8%) | 26 (30.2%) |
Education in East Globe
School Enrollment in East Globe
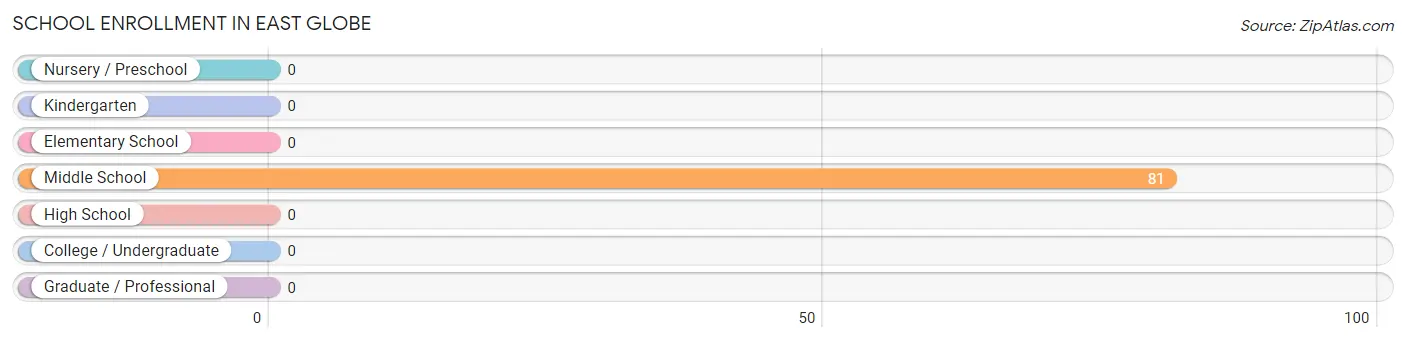
| School Level | # Students | % Students |
| Nursery / Preschool | 0 | 0.0% |
| Kindergarten | 0 | 0.0% |
| Elementary School | 0 | 0.0% |
| Middle School | 81 | 100.0% |
| High School | 0 | 0.0% |
| College / Undergraduate | 0 | 0.0% |
| Graduate / Professional | 0 | 0.0% |
| Total | 81 | 100.0% |
School Enrollment by Age by Funding Source in East Globe
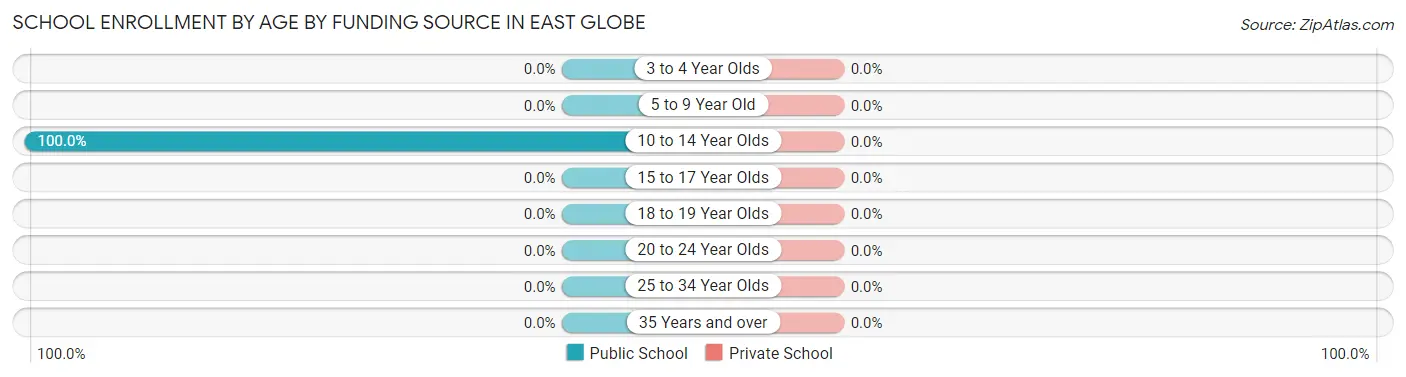
| Age Bracket | Public School | Private School |
| 3 to 4 Year Olds | 0 (0.0%) | 0 (0.0%) |
| 5 to 9 Year Old | 0 (0.0%) | 0 (0.0%) |
| 10 to 14 Year Olds | 81 (100.0%) | 0 (0.0%) |
| 15 to 17 Year Olds | 0 (0.0%) | 0 (0.0%) |
| 18 to 19 Year Olds | 0 (0.0%) | 0 (0.0%) |
| 20 to 24 Year Olds | 0 (0.0%) | 0 (0.0%) |
| 25 to 34 Year Olds | 0 (0.0%) | 0 (0.0%) |
| 35 Years and over | 0 (0.0%) | 0 (0.0%) |
| Total | 81 (100.0%) | 0 (0.0%) |
Educational Attainment by Field of Study in East Globe
, and science & technology (20 | 100.0%) are the most common fields of study among 20 individuals in East Globe who have obtained a bachelor's degree or higher.
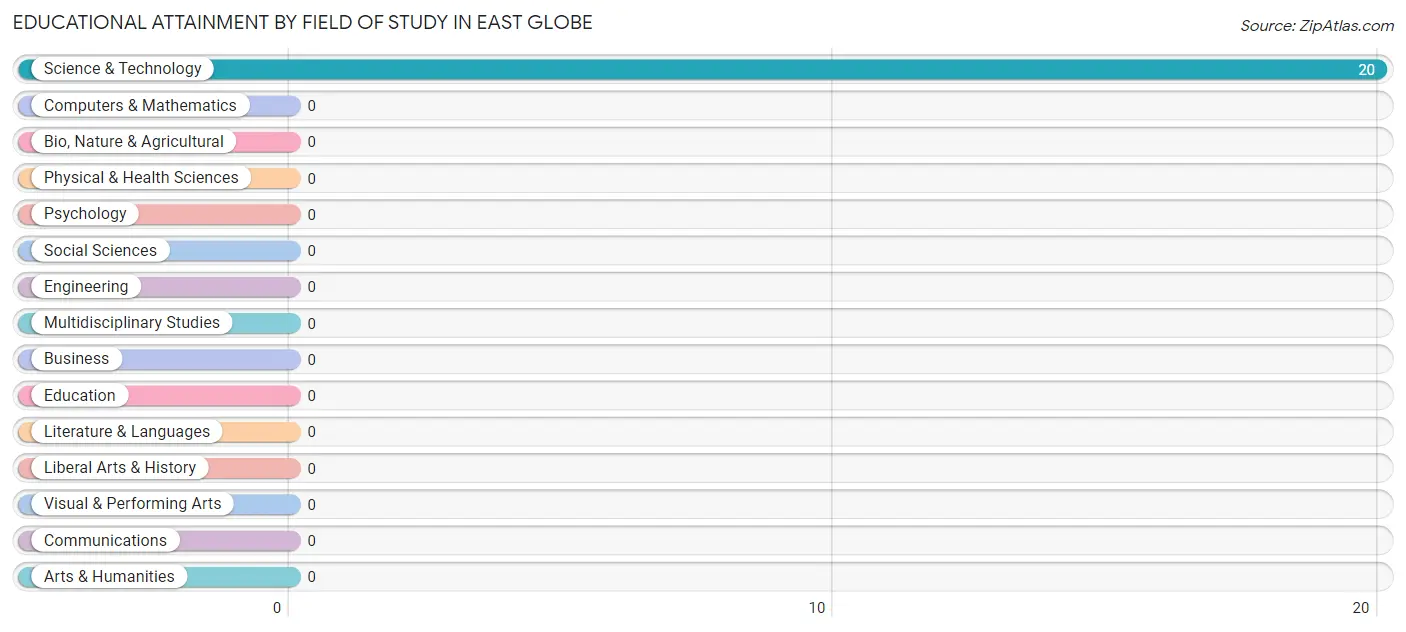
| Field of Study | # Graduates | % Graduates |
| Computers & Mathematics | 0 | 0.0% |
| Bio, Nature & Agricultural | 0 | 0.0% |
| Physical & Health Sciences | 0 | 0.0% |
| Psychology | 0 | 0.0% |
| Social Sciences | 0 | 0.0% |
| Engineering | 0 | 0.0% |
| Multidisciplinary Studies | 0 | 0.0% |
| Science & Technology | 20 | 100.0% |
| Business | 0 | 0.0% |
| Education | 0 | 0.0% |
| Literature & Languages | 0 | 0.0% |
| Liberal Arts & History | 0 | 0.0% |
| Visual & Performing Arts | 0 | 0.0% |
| Communications | 0 | 0.0% |
| Arts & Humanities | 0 | 0.0% |
| Total | 20 | 100.0% |
Transportation & Commute in East Globe
Vehicle Availability by Sex in East Globe
The most prevalent vehicle ownership categories in East Globe are males with no vehicle (60, accounting for 100.0%) and females with no vehicle (0, making up 230.8%).
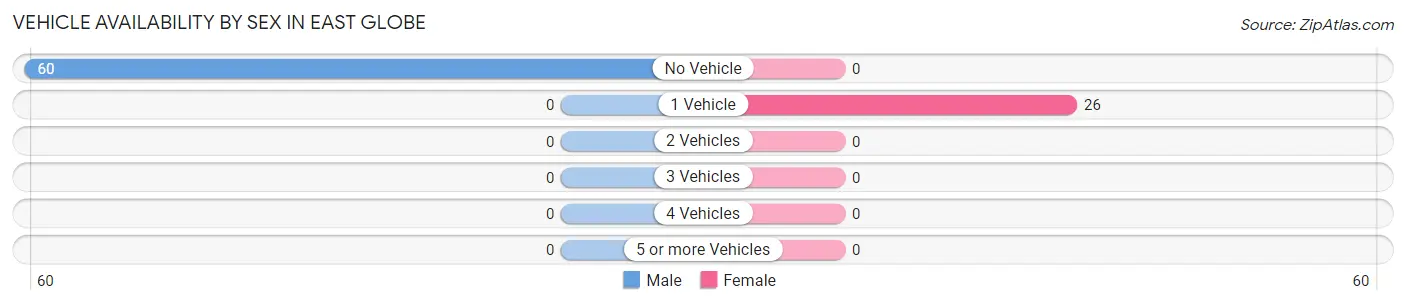
| Vehicles Available | Male | Female |
| No Vehicle | 60 (100.0%) | 0 (0.0%) |
| 1 Vehicle | 0 (0.0%) | 26 (100.0%) |
| 2 Vehicles | 0 (0.0%) | 0 (0.0%) |
| 3 Vehicles | 0 (0.0%) | 0 (0.0%) |
| 4 Vehicles | 0 (0.0%) | 0 (0.0%) |
| 5 or more Vehicles | 0 (0.0%) | 0 (0.0%) |
| Total | 60 (100.0%) | 26 (100.0%) |
Commute Time in East Globe
The most frequently occuring commute durations in East Globe are 15 to 19 minutes (26 commuters, 30.2%), 45 to 59 minutes (23 commuters, 26.7%), and 10 to 14 minutes (19 commuters, 22.1%).
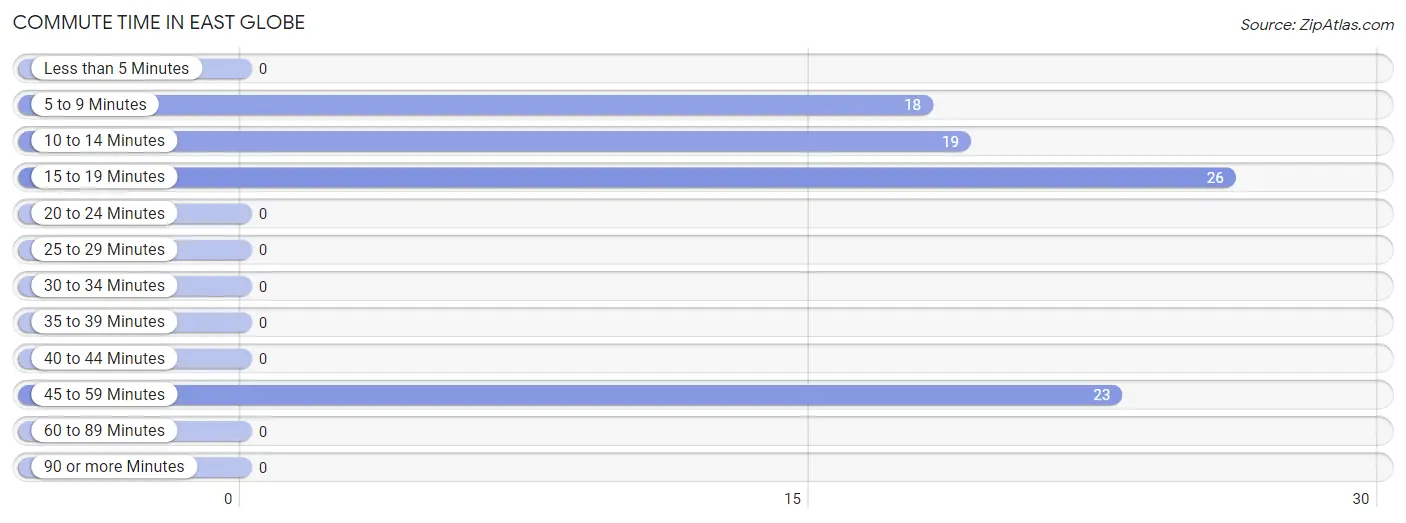
| Commute Time | # Commuters | % Commuters |
| Less than 5 Minutes | 0 | 0.0% |
| 5 to 9 Minutes | 18 | 20.9% |
| 10 to 14 Minutes | 19 | 22.1% |
| 15 to 19 Minutes | 26 | 30.2% |
| 20 to 24 Minutes | 0 | 0.0% |
| 25 to 29 Minutes | 0 | 0.0% |
| 30 to 34 Minutes | 0 | 0.0% |
| 35 to 39 Minutes | 0 | 0.0% |
| 40 to 44 Minutes | 0 | 0.0% |
| 45 to 59 Minutes | 23 | 26.7% |
| 60 to 89 Minutes | 0 | 0.0% |
| 90 or more Minutes | 0 | 0.0% |
Commute Time by Sex in East Globe
The most common commute times in East Globe are 45 to 59 minutes (23 commuters, 38.3%) for males and 15 to 19 minutes (26 commuters, 100.0%) for females.
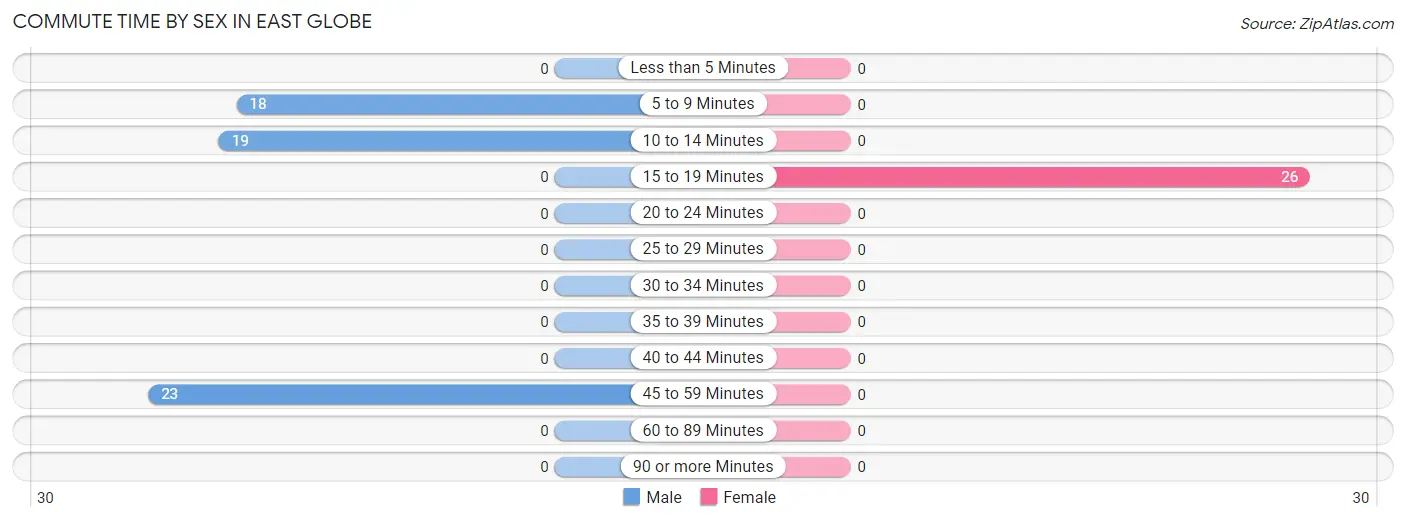
| Commute Time | Male | Female |
| Less than 5 Minutes | 0 (0.0%) | 0 (0.0%) |
| 5 to 9 Minutes | 18 (30.0%) | 0 (0.0%) |
| 10 to 14 Minutes | 19 (31.7%) | 0 (0.0%) |
| 15 to 19 Minutes | 0 (0.0%) | 26 (100.0%) |
| 20 to 24 Minutes | 0 (0.0%) | 0 (0.0%) |
| 25 to 29 Minutes | 0 (0.0%) | 0 (0.0%) |
| 30 to 34 Minutes | 0 (0.0%) | 0 (0.0%) |
| 35 to 39 Minutes | 0 (0.0%) | 0 (0.0%) |
| 40 to 44 Minutes | 0 (0.0%) | 0 (0.0%) |
| 45 to 59 Minutes | 23 (38.3%) | 0 (0.0%) |
| 60 to 89 Minutes | 0 (0.0%) | 0 (0.0%) |
| 90 or more Minutes | 0 (0.0%) | 0 (0.0%) |
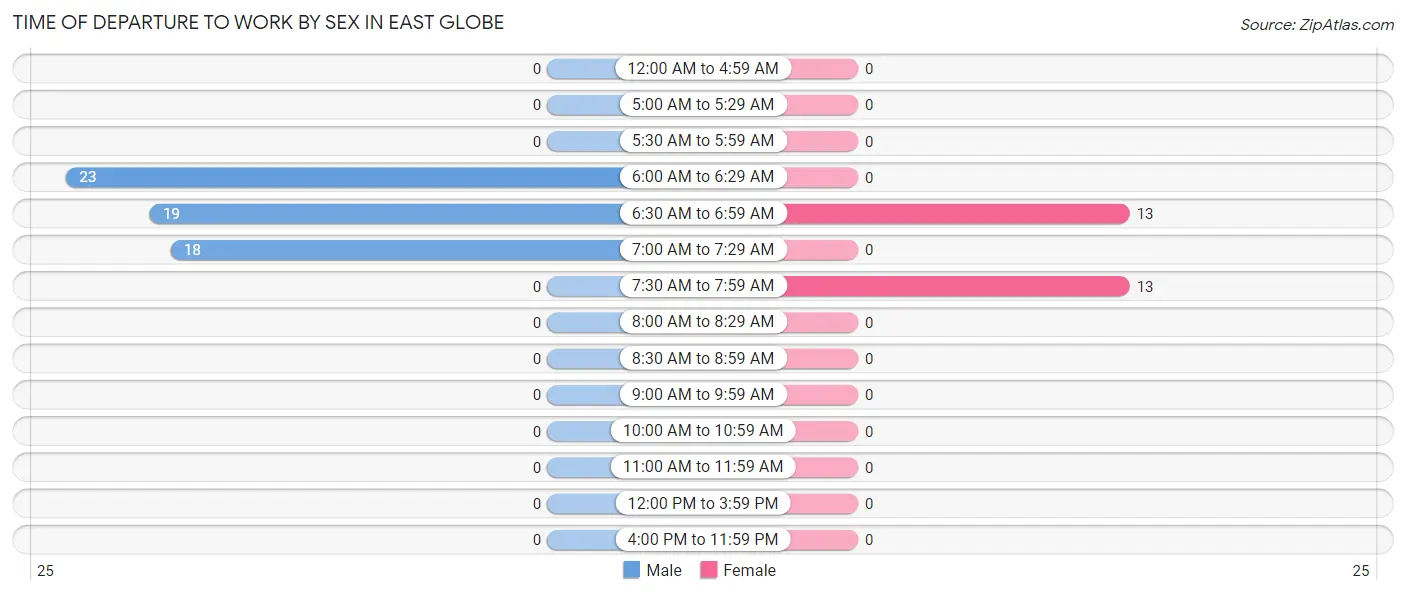
Time of Departure to Work by Sex in East Globe
The most frequent times of departure to work in East Globe are 6:00 AM to 6:29 AM (23, 38.3%) for males and 6:30 AM to 6:59 AM (13, 50.0%) for females.
| Time of Departure | Male | Female |
| 12:00 AM to 4:59 AM | 0 (0.0%) | 0 (0.0%) |
| 5:00 AM to 5:29 AM | 0 (0.0%) | 0 (0.0%) |
| 5:30 AM to 5:59 AM | 0 (0.0%) | 0 (0.0%) |
| 6:00 AM to 6:29 AM | 23 (38.3%) | 0 (0.0%) |
| 6:30 AM to 6:59 AM | 19 (31.7%) | 13 (50.0%) |
| 7:00 AM to 7:29 AM | 18 (30.0%) | 0 (0.0%) |
| 7:30 AM to 7:59 AM | 0 (0.0%) | 13 (50.0%) |
| 8:00 AM to 8:29 AM | 0 (0.0%) | 0 (0.0%) |
| 8:30 AM to 8:59 AM | 0 (0.0%) | 0 (0.0%) |
| 9:00 AM to 9:59 AM | 0 (0.0%) | 0 (0.0%) |
| 10:00 AM to 10:59 AM | 0 (0.0%) | 0 (0.0%) |
| 11:00 AM to 11:59 AM | 0 (0.0%) | 0 (0.0%) |
| 12:00 PM to 3:59 PM | 0 (0.0%) | 0 (0.0%) |
| 4:00 PM to 11:59 PM | 0 (0.0%) | 0 (0.0%) |
| Total | 60 (100.0%) | 26 (100.0%) |
Housing Occupancy in East Globe
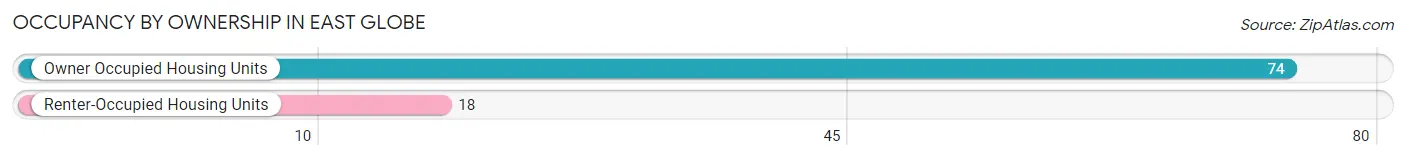
Occupancy by Ownership in East Globe
Of the total 92 dwellings in East Globe, owner-occupied units account for 74 (80.4%), while renter-occupied units make up 18 (19.6%).
| Occupancy | # Housing Units | % Housing Units |
| Owner Occupied Housing Units | 74 | 80.4% |
| Renter-Occupied Housing Units | 18 | 19.6% |
| Total Occupied Housing Units | 92 | 100.0% |
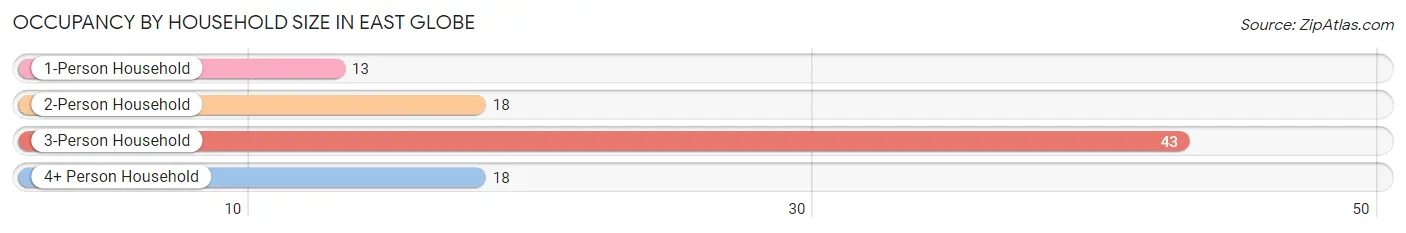
Occupancy by Household Size in East Globe
| Household Size | # Housing Units | % Housing Units |
| 1-Person Household | 13 | 14.1% |
| 2-Person Household | 18 | 19.6% |
| 3-Person Household | 43 | 46.7% |
| 4+ Person Household | 18 | 19.6% |
| Total Housing Units | 92 | 100.0% |
Occupancy by Ownership by Household Size in East Globe
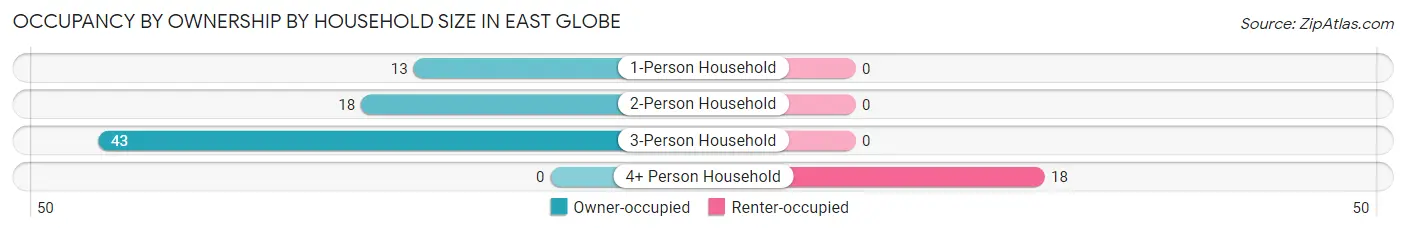
| Household Size | Owner-occupied | Renter-occupied |
| 1-Person Household | 13 (100.0%) | 0 (0.0%) |
| 2-Person Household | 18 (100.0%) | 0 (0.0%) |
| 3-Person Household | 43 (100.0%) | 0 (0.0%) |
| 4+ Person Household | 0 (0.0%) | 18 (100.0%) |
| Total Housing Units | 74 (80.4%) | 18 (19.6%) |
Occupancy by Educational Attainment in East Globe
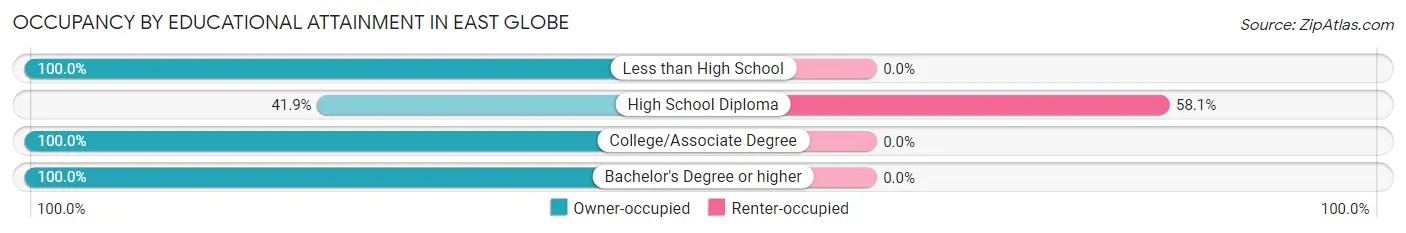
| Household Size | Owner-occupied | Renter-occupied |
| Less than High School | 23 (100.0%) | 0 (0.0%) |
| High School Diploma | 13 (41.9%) | 18 (58.1%) |
| College/Associate Degree | 18 (100.0%) | 0 (0.0%) |
| Bachelor's Degree or higher | 20 (100.0%) | 0 (0.0%) |
Occupancy by Age of Householder in East Globe
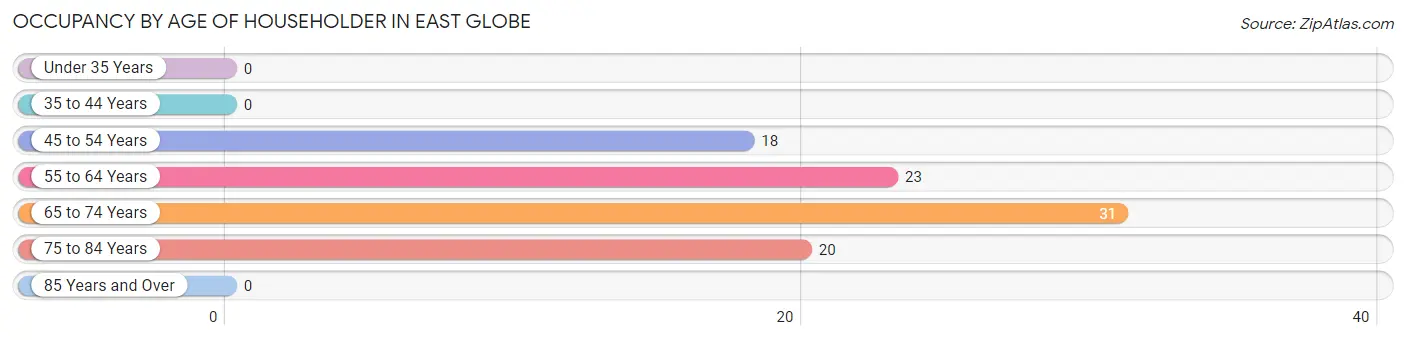
| Age Bracket | # Households | % Households |
| Under 35 Years | 0 | 0.0% |
| 35 to 44 Years | 0 | 0.0% |
| 45 to 54 Years | 18 | 19.6% |
| 55 to 64 Years | 23 | 25.0% |
| 65 to 74 Years | 31 | 33.7% |
| 75 to 84 Years | 20 | 21.7% |
| 85 Years and Over | 0 | 0.0% |
| Total | 92 | 100.0% |
Housing Finances in East Globe
Median Income by Occupancy in East Globe
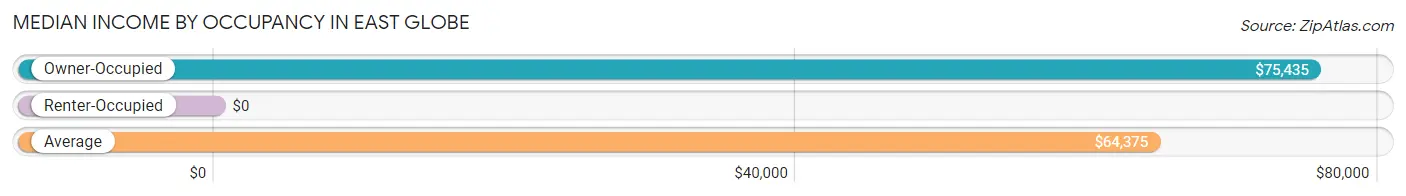
| Occupancy Type | # Households | Median Income |
| Owner-Occupied | 74 (80.4%) | $75,435 |
| Renter-Occupied | 18 (19.6%) | $0 |
| Average | 92 (100.0%) | $64,375 |
Occupancy by Householder Income Bracket in East Globe
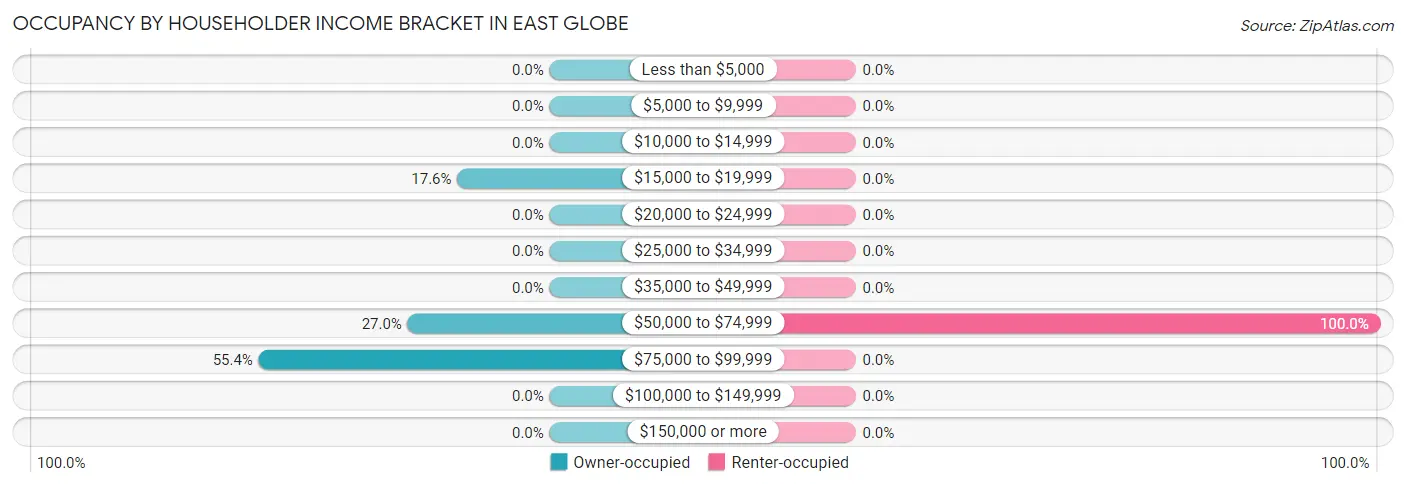
| Income Bracket | Owner-occupied | Renter-occupied |
| Less than $5,000 | 0 (0.0%) | 0 (0.0%) |
| $5,000 to $9,999 | 0 (0.0%) | 0 (0.0%) |
| $10,000 to $14,999 | 0 (0.0%) | 0 (0.0%) |
| $15,000 to $19,999 | 13 (17.6%) | 0 (0.0%) |
| $20,000 to $24,999 | 0 (0.0%) | 0 (0.0%) |
| $25,000 to $34,999 | 0 (0.0%) | 0 (0.0%) |
| $35,000 to $49,999 | 0 (0.0%) | 0 (0.0%) |
| $50,000 to $74,999 | 20 (27.0%) | 18 (100.0%) |
| $75,000 to $99,999 | 41 (55.4%) | 0 (0.0%) |
| $100,000 to $149,999 | 0 (0.0%) | 0 (0.0%) |
| $150,000 or more | 0 (0.0%) | 0 (0.0%) |
| Total | 74 (100.0%) | 18 (100.0%) |
Monthly Housing Cost Tiers in East Globe
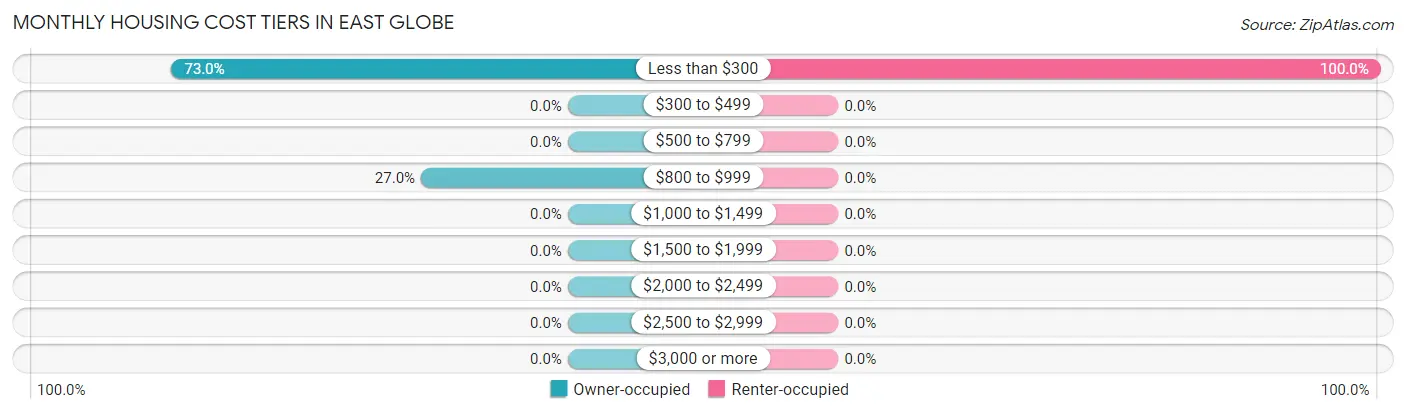
| Monthly Cost | Owner-occupied | Renter-occupied |
| Less than $300 | 54 (73.0%) | 18 (100.0%) |
| $300 to $499 | 0 (0.0%) | 0 (0.0%) |
| $500 to $799 | 0 (0.0%) | 0 (0.0%) |
| $800 to $999 | 20 (27.0%) | 0 (0.0%) |
| $1,000 to $1,499 | 0 (0.0%) | 0 (0.0%) |
| $1,500 to $1,999 | 0 (0.0%) | 0 (0.0%) |
| $2,000 to $2,499 | 0 (0.0%) | 0 (0.0%) |
| $2,500 to $2,999 | 0 (0.0%) | 0 (0.0%) |
| $3,000 or more | 0 (0.0%) | 0 (0.0%) |
| Total | 74 (100.0%) | 18 (100.0%) |
Physical Housing Characteristics in East Globe
Housing Structures in East Globe
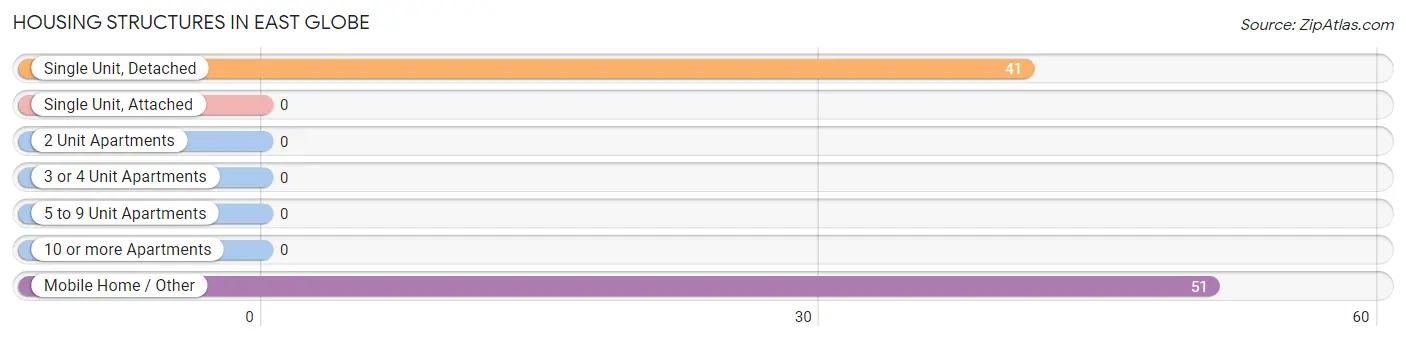
| Structure Type | # Housing Units | % Housing Units |
| Single Unit, Detached | 41 | 44.6% |
| Single Unit, Attached | 0 | 0.0% |
| 2 Unit Apartments | 0 | 0.0% |
| 3 or 4 Unit Apartments | 0 | 0.0% |
| 5 to 9 Unit Apartments | 0 | 0.0% |
| 10 or more Apartments | 0 | 0.0% |
| Mobile Home / Other | 51 | 55.4% |
| Total | 92 | 100.0% |
Housing Structures by Occupancy in East Globe
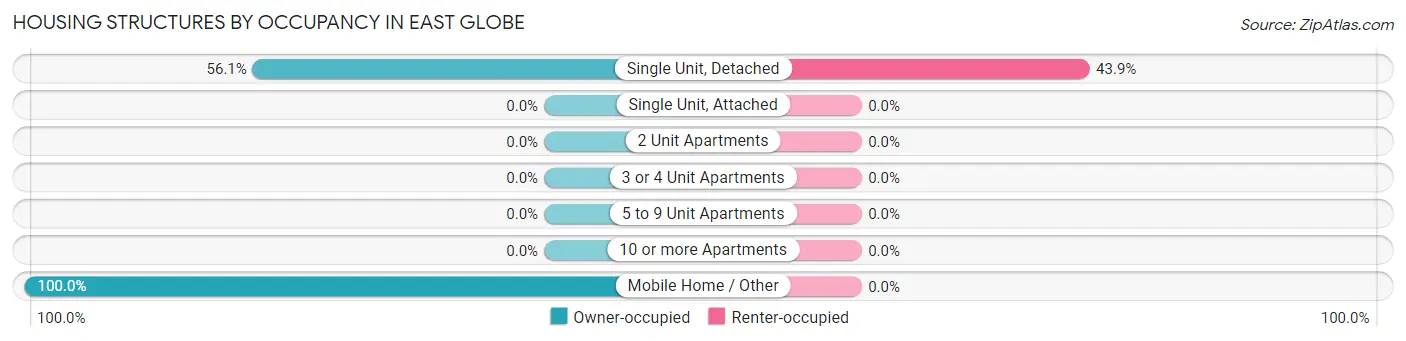
| Structure Type | Owner-occupied | Renter-occupied |
| Single Unit, Detached | 23 (56.1%) | 18 (43.9%) |
| Single Unit, Attached | 0 (0.0%) | 0 (0.0%) |
| 2 Unit Apartments | 0 (0.0%) | 0 (0.0%) |
| 3 or 4 Unit Apartments | 0 (0.0%) | 0 (0.0%) |
| 5 to 9 Unit Apartments | 0 (0.0%) | 0 (0.0%) |
| 10 or more Apartments | 0 (0.0%) | 0 (0.0%) |
| Mobile Home / Other | 51 (100.0%) | 0 (0.0%) |
| Total | 74 (80.4%) | 18 (19.6%) |
Housing Structures by Number of Rooms in East Globe
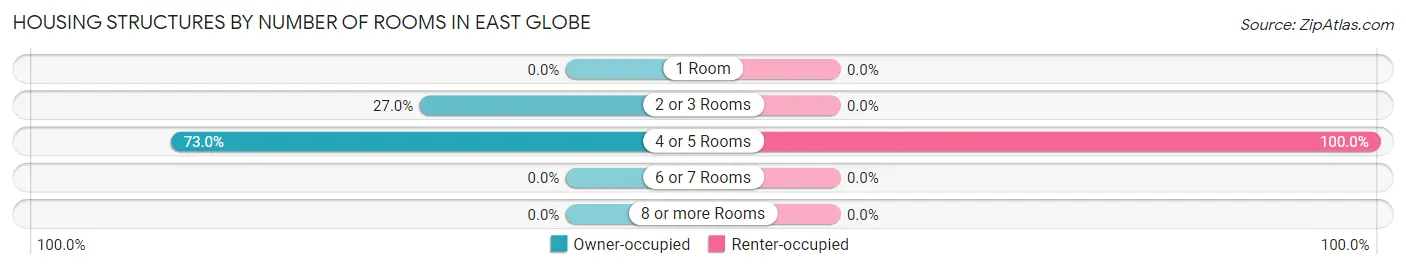
| Number of Rooms | Owner-occupied | Renter-occupied |
| 1 Room | 0 (0.0%) | 0 (0.0%) |
| 2 or 3 Rooms | 20 (27.0%) | 0 (0.0%) |
| 4 or 5 Rooms | 54 (73.0%) | 18 (100.0%) |
| 6 or 7 Rooms | 0 (0.0%) | 0 (0.0%) |
| 8 or more Rooms | 0 (0.0%) | 0 (0.0%) |
| Total | 74 (100.0%) | 18 (100.0%) |
Housing Structure by Heating Type in East Globe
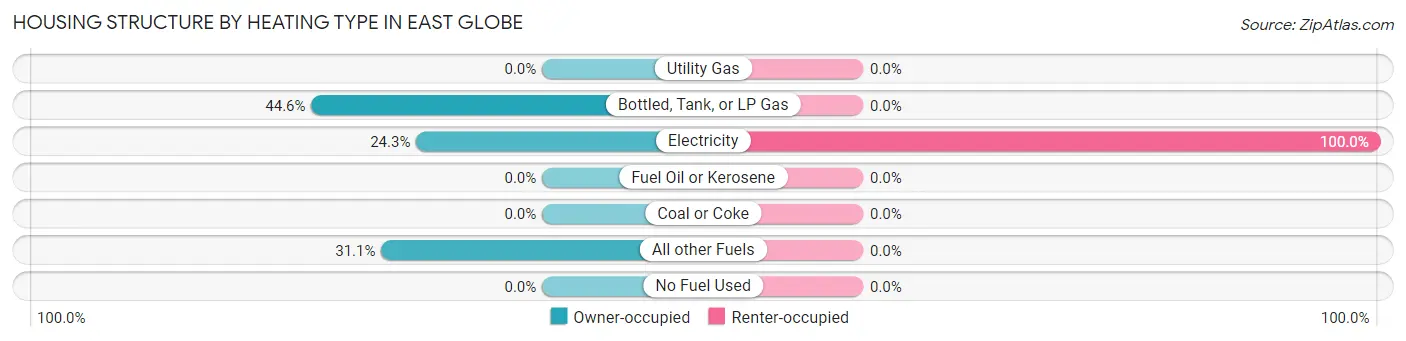
| Heating Type | Owner-occupied | Renter-occupied |
| Utility Gas | 0 (0.0%) | 0 (0.0%) |
| Bottled, Tank, or LP Gas | 33 (44.6%) | 0 (0.0%) |
| Electricity | 18 (24.3%) | 18 (100.0%) |
| Fuel Oil or Kerosene | 0 (0.0%) | 0 (0.0%) |
| Coal or Coke | 0 (0.0%) | 0 (0.0%) |
| All other Fuels | 23 (31.1%) | 0 (0.0%) |
| No Fuel Used | 0 (0.0%) | 0 (0.0%) |
| Total | 74 (100.0%) | 18 (100.0%) |
Household Vehicle Usage in East Globe
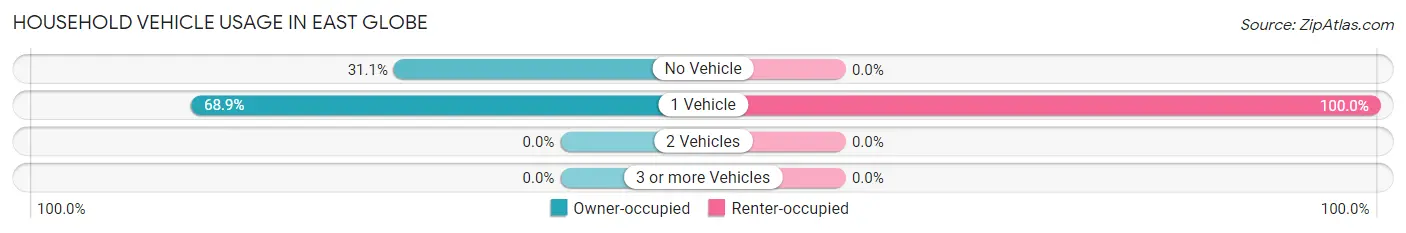
| Vehicles per Household | Owner-occupied | Renter-occupied |
| No Vehicle | 23 (31.1%) | 0 (0.0%) |
| 1 Vehicle | 51 (68.9%) | 18 (100.0%) |
| 2 Vehicles | 0 (0.0%) | 0 (0.0%) |
| 3 or more Vehicles | 0 (0.0%) | 0 (0.0%) |
| Total | 74 (100.0%) | 18 (100.0%) |
Real Estate & Mortgages in East Globe
Real Estate and Mortgage Overview in East Globe
| Characteristic | Without Mortgage | With Mortgage |
| Housing Units | 54 | 20 |
| Median Property Value | - | - |
| Median Household Income | $76,522 | $0 |
| Monthly Housing Costs | - | - |
| Real Estate Taxes | - | - |
Property Value by Mortgage Status in East Globe
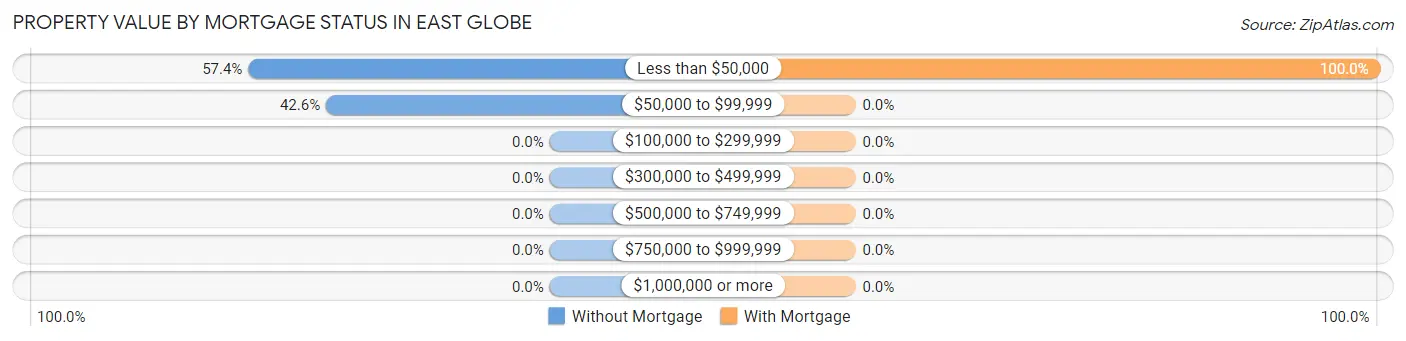
| Property Value | Without Mortgage | With Mortgage |
| Less than $50,000 | 31 (57.4%) | 20 (100.0%) |
| $50,000 to $99,999 | 23 (42.6%) | 0 (0.0%) |
| $100,000 to $299,999 | 0 (0.0%) | 0 (0.0%) |
| $300,000 to $499,999 | 0 (0.0%) | 0 (0.0%) |
| $500,000 to $749,999 | 0 (0.0%) | 0 (0.0%) |
| $750,000 to $999,999 | 0 (0.0%) | 0 (0.0%) |
| $1,000,000 or more | 0 (0.0%) | 0 (0.0%) |
| Total | 54 (100.0%) | 20 (100.0%) |
Household Income by Mortgage Status in East Globe
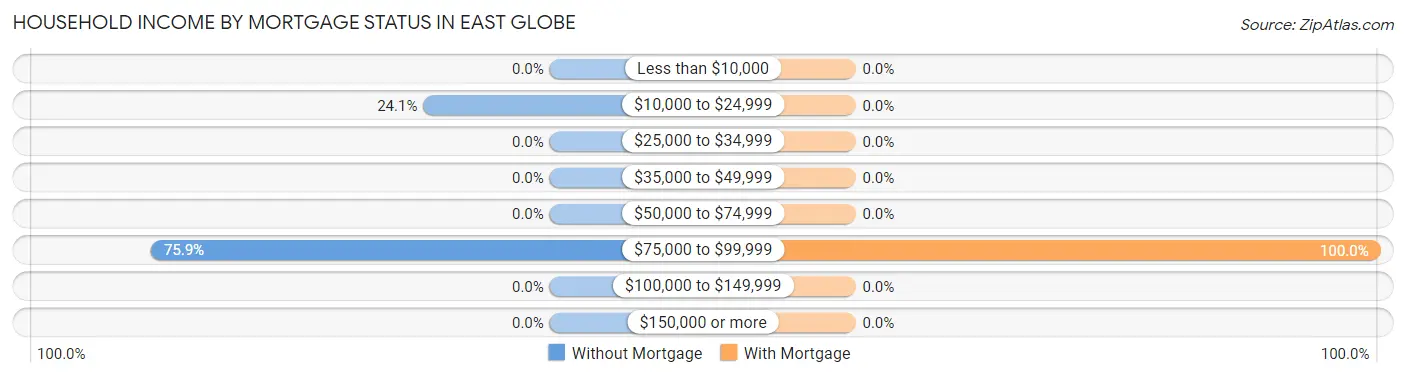
| Household Income | Without Mortgage | With Mortgage |
| Less than $10,000 | 0 (0.0%) | 0 (0.0%) |
| $10,000 to $24,999 | 13 (24.1%) | 0 (0.0%) |
| $25,000 to $34,999 | 0 (0.0%) | 0 (0.0%) |
| $35,000 to $49,999 | 0 (0.0%) | 0 (0.0%) |
| $50,000 to $74,999 | 0 (0.0%) | 0 (0.0%) |
| $75,000 to $99,999 | 41 (75.9%) | 20 (100.0%) |
| $100,000 to $149,999 | 0 (0.0%) | 0 (0.0%) |
| $150,000 or more | 0 (0.0%) | 0 (0.0%) |
| Total | 54 (100.0%) | 20 (100.0%) |
Property Value to Household Income Ratio in East Globe
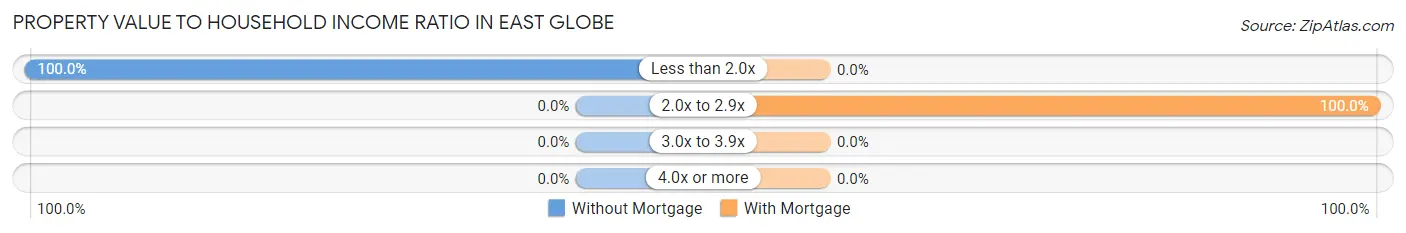
| Value-to-Income Ratio | Without Mortgage | With Mortgage |
| Less than 2.0x | 54 (100.0%) | 0 (0.0%) |
| 2.0x to 2.9x | 0 (0.0%) | 20 (100.0%) |
| 3.0x to 3.9x | 0 (0.0%) | 0 (0.0%) |
| 4.0x or more | 0 (0.0%) | 0 (0.0%) |
| Total | 54 (100.0%) | 20 (100.0%) |
Real Estate Taxes by Mortgage Status in East Globe
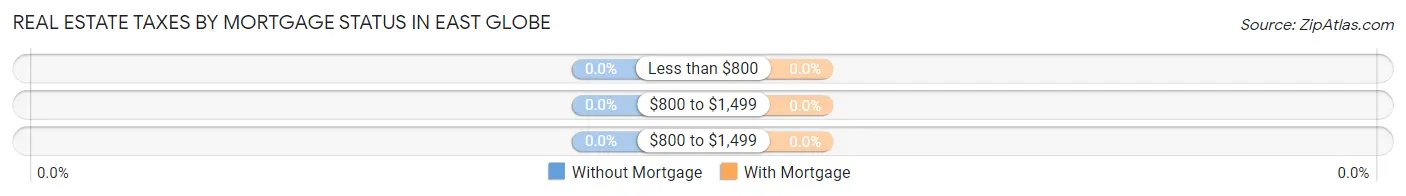
| Property Taxes | Without Mortgage | With Mortgage |
| Less than $800 | 0 (0.0%) | 0 (0.0%) |
| $800 to $1,499 | 0 (0.0%) | 0 (0.0%) |
| $800 to $1,499 | 0 (0.0%) | 0 (0.0%) |
| Total | 54 (100.0%) | 20 (100.0%) |
Health & Disability in East Globe
Health Insurance Coverage by Age in East Globe
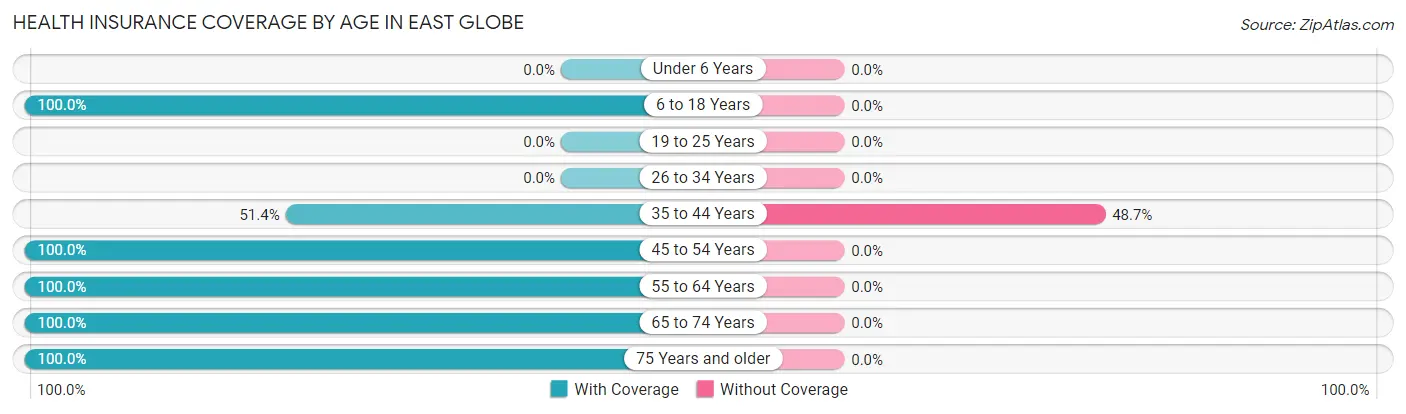
| Age Bracket | With Coverage | Without Coverage |
| Under 6 Years | 0 (0.0%) | 0 (0.0%) |
| 6 to 18 Years | 81 (100.0%) | 0 (0.0%) |
| 19 to 25 Years | 0 (0.0%) | 0 (0.0%) |
| 26 to 34 Years | 0 (0.0%) | 0 (0.0%) |
| 35 to 44 Years | 19 (51.3%) | 18 (48.6%) |
| 45 to 54 Years | 39 (100.0%) | 0 (0.0%) |
| 55 to 64 Years | 23 (100.0%) | 0 (0.0%) |
| 65 to 74 Years | 46 (100.0%) | 0 (0.0%) |
| 75 Years and older | 20 (100.0%) | 0 (0.0%) |
| Total | 228 (92.7%) | 18 (7.3%) |
Health Insurance Coverage by Citizenship Status in East Globe
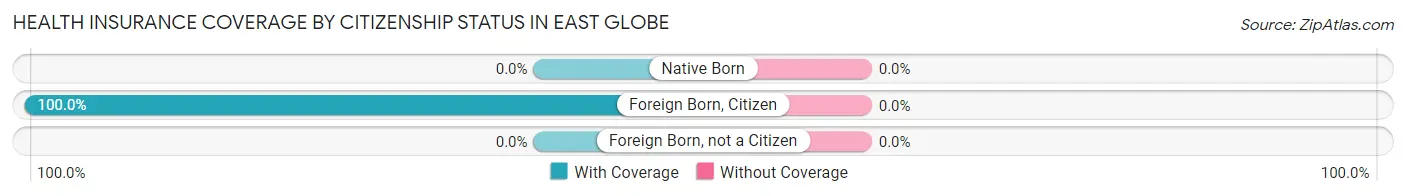
| Citizenship Status | With Coverage | Without Coverage |
| Native Born | 0 (0.0%) | 0 (0.0%) |
| Foreign Born, Citizen | 81 (100.0%) | 0 (0.0%) |
| Foreign Born, not a Citizen | 0 (0.0%) | 0 (0.0%) |
Health Insurance Coverage by Household Income in East Globe
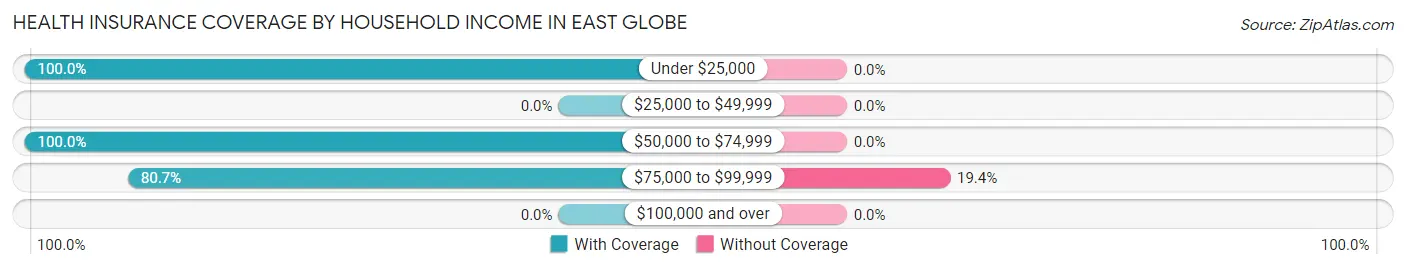
| Household Income | With Coverage | Without Coverage |
| Under $25,000 | 13 (100.0%) | 0 (0.0%) |
| $25,000 to $49,999 | 0 (0.0%) | 0 (0.0%) |
| $50,000 to $74,999 | 140 (100.0%) | 0 (0.0%) |
| $75,000 to $99,999 | 75 (80.6%) | 18 (19.4%) |
| $100,000 and over | 0 (0.0%) | 0 (0.0%) |
Public vs Private Health Insurance Coverage by Age in East Globe
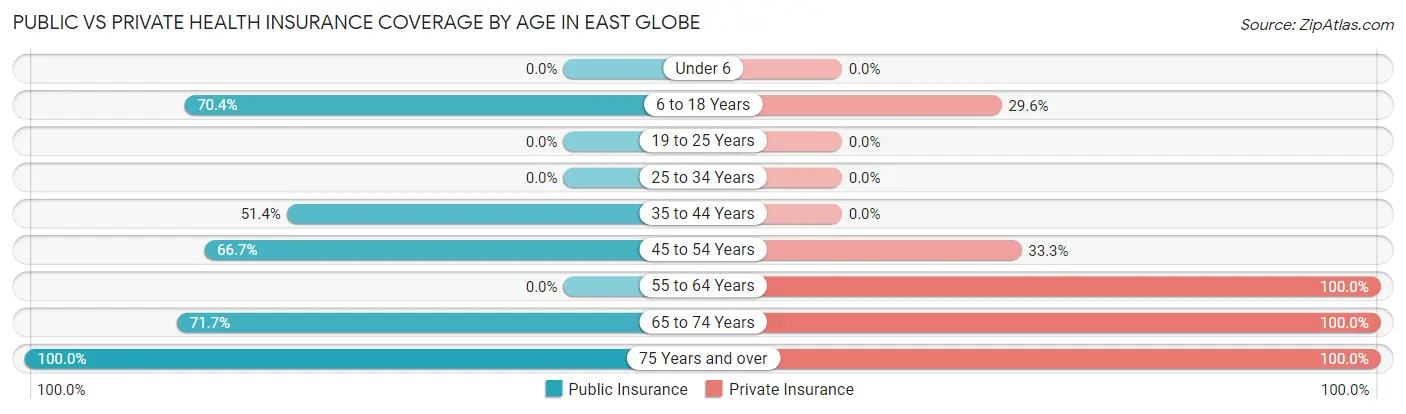
| Age Bracket | Public Insurance | Private Insurance |
| Under 6 | 0 (0.0%) | 0 (0.0%) |
| 6 to 18 Years | 57 (70.4%) | 24 (29.6%) |
| 19 to 25 Years | 0 (0.0%) | 0 (0.0%) |
| 25 to 34 Years | 0 (0.0%) | 0 (0.0%) |
| 35 to 44 Years | 19 (51.3%) | 0 (0.0%) |
| 45 to 54 Years | 26 (66.7%) | 13 (33.3%) |
| 55 to 64 Years | 0 (0.0%) | 23 (100.0%) |
| 65 to 74 Years | 33 (71.7%) | 46 (100.0%) |
| 75 Years and over | 20 (100.0%) | 20 (100.0%) |
| Total | 155 (63.0%) | 126 (51.2%) |
Disability Status by Sex by Age in East Globe
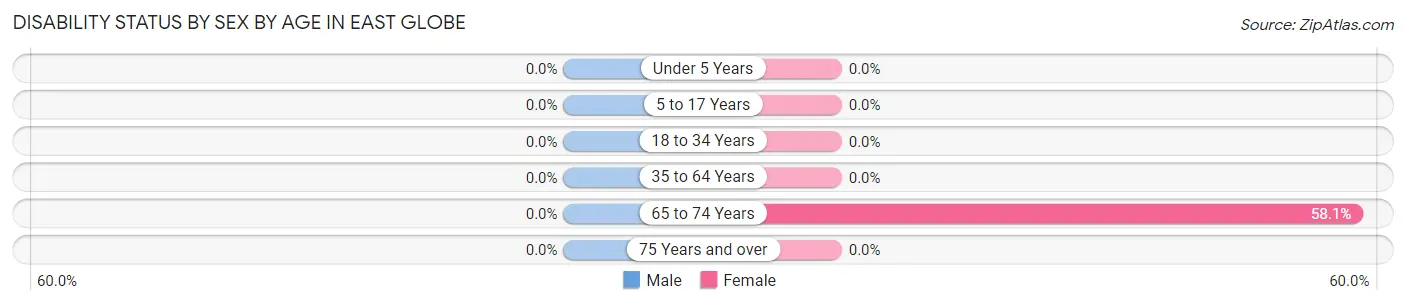
| Age Bracket | Male | Female |
| Under 5 Years | 0 (0.0%) | 0 (0.0%) |
| 5 to 17 Years | 0 (0.0%) | 0 (0.0%) |
| 18 to 34 Years | 0 (0.0%) | 0 (0.0%) |
| 35 to 64 Years | 0 (0.0%) | 0 (0.0%) |
| 65 to 74 Years | 0 (0.0%) | 18 (58.1%) |
| 75 Years and over | 0 (0.0%) | 0 (0.0%) |
Disability Class by Sex by Age in East Globe
Disability Class: Hearing Difficulty
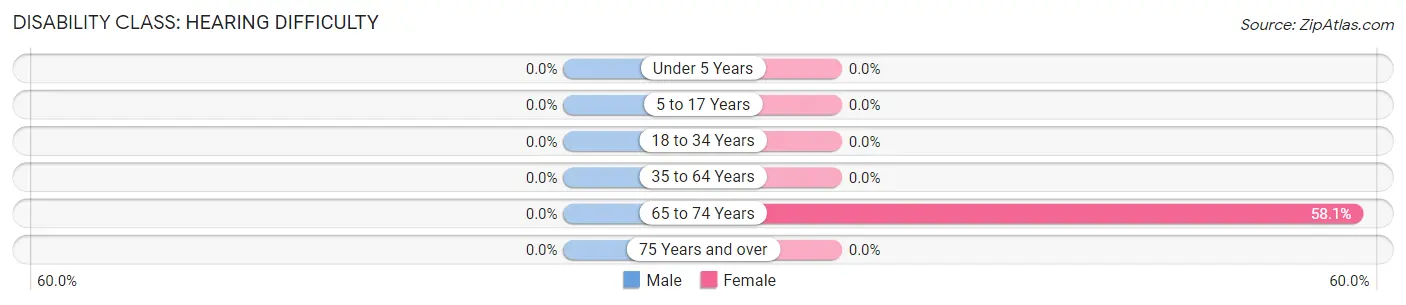
| Age Bracket | Male | Female |
| Under 5 Years | 0 (0.0%) | 0 (0.0%) |
| 5 to 17 Years | 0 (0.0%) | 0 (0.0%) |
| 18 to 34 Years | 0 (0.0%) | 0 (0.0%) |
| 35 to 64 Years | 0 (0.0%) | 0 (0.0%) |
| 65 to 74 Years | 0 (0.0%) | 18 (58.1%) |
| 75 Years and over | 0 (0.0%) | 0 (0.0%) |
Disability Class: Vision Difficulty
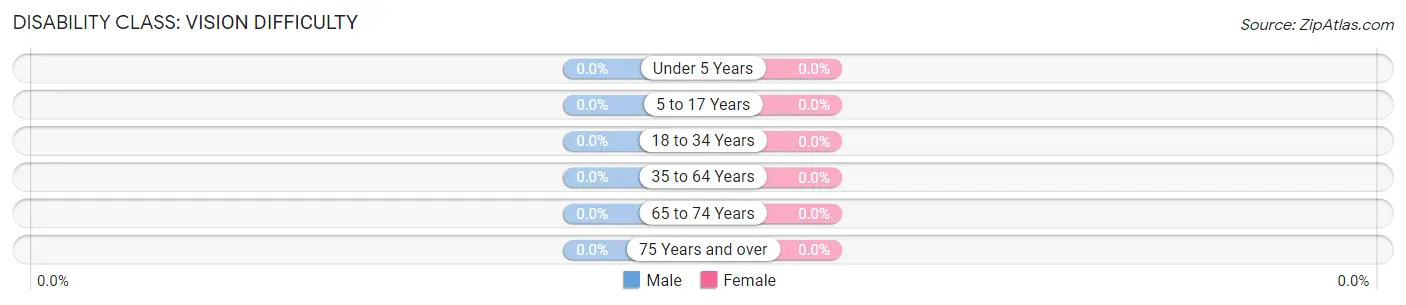
| Age Bracket | Male | Female |
| Under 5 Years | 0 (0.0%) | 0 (0.0%) |
| 5 to 17 Years | 0 (0.0%) | 0 (0.0%) |
| 18 to 34 Years | 0 (0.0%) | 0 (0.0%) |
| 35 to 64 Years | 0 (0.0%) | 0 (0.0%) |
| 65 to 74 Years | 0 (0.0%) | 0 (0.0%) |
| 75 Years and over | 0 (0.0%) | 0 (0.0%) |
Disability Class: Cognitive Difficulty
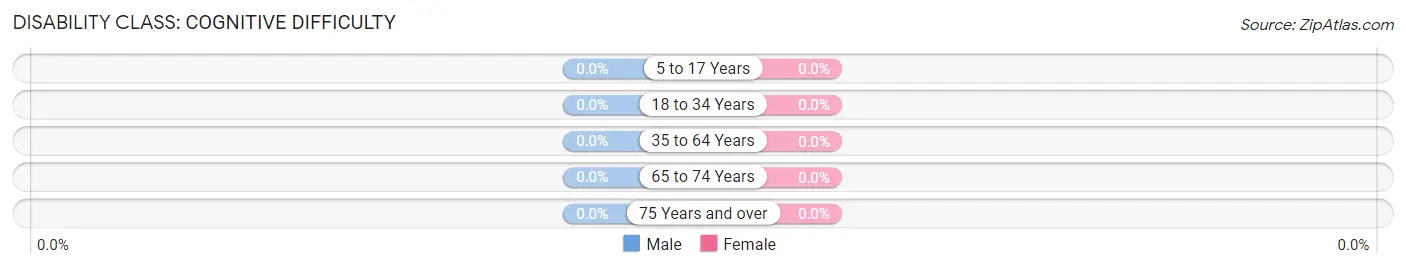
| Age Bracket | Male | Female |
| 5 to 17 Years | 0 (0.0%) | 0 (0.0%) |
| 18 to 34 Years | 0 (0.0%) | 0 (0.0%) |
| 35 to 64 Years | 0 (0.0%) | 0 (0.0%) |
| 65 to 74 Years | 0 (0.0%) | 0 (0.0%) |
| 75 Years and over | 0 (0.0%) | 0 (0.0%) |
Disability Class: Ambulatory Difficulty
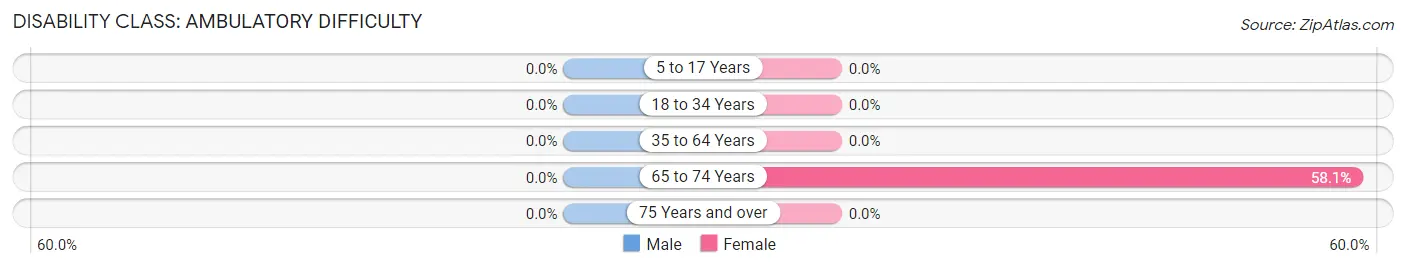
| Age Bracket | Male | Female |
| 5 to 17 Years | 0 (0.0%) | 0 (0.0%) |
| 18 to 34 Years | 0 (0.0%) | 0 (0.0%) |
| 35 to 64 Years | 0 (0.0%) | 0 (0.0%) |
| 65 to 74 Years | 0 (0.0%) | 18 (58.1%) |
| 75 Years and over | 0 (0.0%) | 0 (0.0%) |
Disability Class: Self-Care Difficulty
| Age Bracket | Male | Female |
| 5 to 17 Years | 0 (0.0%) | 0 (0.0%) |
| 18 to 34 Years | 0 (0.0%) | 0 (0.0%) |
| 35 to 64 Years | 0 (0.0%) | 0 (0.0%) |
| 65 to 74 Years | 0 (0.0%) | 0 (0.0%) |
| 75 Years and over | 0 (0.0%) | 0 (0.0%) |
Technology Access in East Globe
Computing Device Access in East Globe
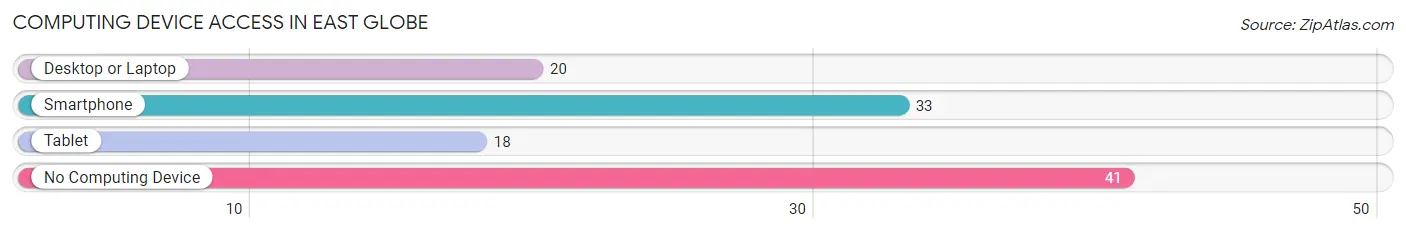
| Device Type | # Households | % Households |
| Desktop or Laptop | 20 | 21.7% |
| Smartphone | 33 | 35.9% |
| Tablet | 18 | 19.6% |
| No Computing Device | 41 | 44.6% |
| Total | 92 | 100.0% |
Internet Access in East Globe
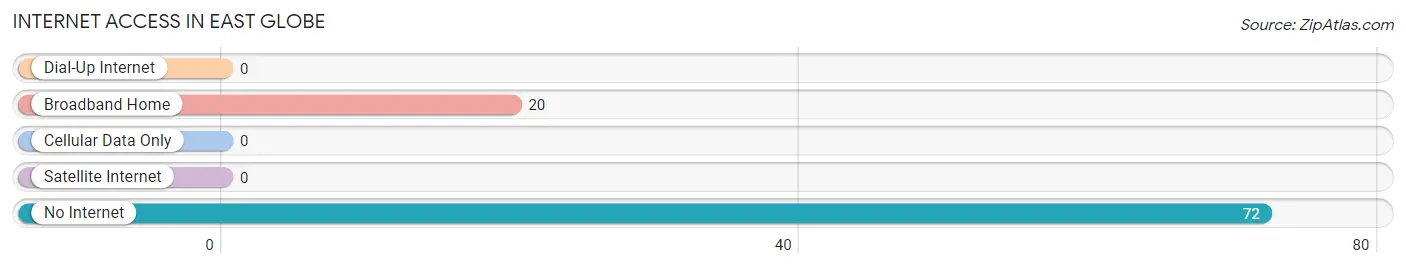
| Internet Type | # Households | % Households |
| Dial-Up Internet | 0 | 0.0% |
| Broadband Home | 20 | 21.7% |
| Cellular Data Only | 0 | 0.0% |
| Satellite Internet | 0 | 0.0% |
| No Internet | 72 | 78.3% |
| Total | 92 | 100.0% |
East Globe Summary
Introduction
East Globe, Arizona is a small town located in the Gila County of Arizona. It is situated in the Tonto National Forest and is surrounded by the Superstition Mountains. The town is located at an elevation of 2,845 feet and has a population of 1,922 people as of the 2010 census. The town is known for its rich history, diverse geography, and vibrant economy.
History
East Globe was founded in 1876 by a group of miners who were searching for gold in the area. The town was originally called “Globe City” and was the first settlement in the area. The town was renamed “East Globe” in 1882 when the post office was established. The town was a major mining center in the late 19th century and early 20th century. The town was also home to a number of saloons, hotels, and stores.
The town experienced a period of decline in the early 20th century due to the decline of the mining industry. However, the town experienced a resurgence in the late 20th century due to the growth of tourism in the area. The town is now home to a number of tourist attractions, including the Superstition Mountain Museum and the Apache Trail.
Geography
East Globe is located in the Gila County of Arizona. The town is situated in the Tonto National Forest and is surrounded by the Superstition Mountains. The town is located at an elevation of 2,845 feet and has a total area of 1.2 square miles. The town is located near the Salt River and is home to a number of creeks and streams. The town is also home to a number of wildlife species, including deer, elk, and mountain lions.
Economy
East Globe is a small town with a vibrant economy. The town is home to a number of businesses, including restaurants, stores, and tourist attractions. The town is also home to a number of manufacturing companies, including a copper smelter and a paper mill. The town is also home to a number of mining companies, including a copper mine and a gold mine. The town is also home to a number of agricultural businesses, including a cattle ranch and a dairy farm.
Demographics
As of the 2010 census, East Globe had a population of 1,922 people. The town has a median age of 39.7 years and a median household income of $41,944. The town is predominantly white, with 87.3% of the population identifying as white. The town is also home to a number of other ethnicities, including Native American (4.2%), Hispanic (3.7%), and Asian (2.2%). The town is also home to a number of religious denominations, including Catholic (25.2%), Baptist (17.2%), and Methodist (14.2%).
Conclusion
East Globe, Arizona is a small town located in the Gila County of Arizona. The town is known for its rich history, diverse geography, and vibrant economy. The town is home to a number of businesses, including restaurants, stores, and tourist attractions. The town is also home to a number of manufacturing companies, mining companies, and agricultural businesses. The town has a population of 1,922 people and is predominantly white. The town is also home to a number of other ethnicities and religious denominations.
Common Questions
What is Per Capita Income in East Globe?
Per Capita income in East Globe is $20,870.
What is the Median Family Income in East Globe?
Median Family Income in East Globe is $62,337.
What is the Median Household income in East Globe?
Median Household Income in East Globe is $64,375.
What is Income or Wage Gap in East Globe?
Income or Wage Gap in East Globe is 40.5%.
Women in East Globe earn 59.5 cents for every dollar earned by a man.
What is Inequality or Gini Index in East Globe?
Inequality or Gini Index in East Globe is 0.19.
What is the Total Population of East Globe?
Total Population of East Globe is 246.
What is the Total Male Population of East Globe?
Total Male Population of East Globe is 122.
What is the Total Female Population of East Globe?
Total Female Population of East Globe is 124.
What is the Ratio of Males per 100 Females in East Globe?
There are 98.39 Males per 100 Females in East Globe.
What is the Ratio of Females per 100 Males in East Globe?
There are 101.64 Females per 100 Males in East Globe.
What is the Median Population Age in East Globe?
Median Population Age in East Globe is 46.6 Years.
What is the Average Family Size in East Globe
Average Family Size in East Globe is 2.6 People.
What is the Average Household Size in East Globe
Average Household Size in East Globe is 2.7 People.
How Large is the Labor Force in East Globe?
There are 94 People in the Labor Forcein in East Globe.
What is the Percentage of People in the Labor Force in East Globe?
57.0% of People are in the Labor Force in East Globe.
What is the Unemployment Rate in East Globe?
Unemployment Rate in East Globe is 8.5%.