Belvoir, NC Map & Demographics
Belvoir Map
Belvoir Overview
$22,404
PER CAPITA INCOME
$42,000
AVG FAMILY INCOME
$41,300
AVG HOUSEHOLD INCOME
0.36
INEQUALITY / GINI INDEX
169
TOTAL POPULATION
63
MALE POPULATION
106
FEMALE POPULATION
59.43
MALES / 100 FEMALES
168.25
FEMALES / 100 MALES
31.0
MEDIAN AGE
2.1
AVG FAMILY SIZE
1.9
AVG HOUSEHOLD SIZE
88
LABOR FORCE [ PEOPLE ]
71.0%
PERCENT IN LABOR FORCE
Income in Belvoir
Income Overview in Belvoir
Per Capita Income in Belvoir is $22,404, while median incomes of families and households are $42,000 and $41,300 respectively.
| Characteristic | Number | Measure |
| Per Capita Income | 169 | $22,404 |
| Median Family Income | 74 | $42,000 |
| Mean Family Income | 74 | $52,364 |
| Median Household Income | 88 | $41,300 |
| Mean Household Income | 88 | $46,165 |
| Income Deficit | 74 | $0 |
| Wage / Income Gap (%) | 169 | 0.00% |
| Wage / Income Gap ($) | 169 | 100.00¢ per $1 |
| Gini / Inequality Index | 169 | 0.36 |
Earnings by Sex in Belvoir
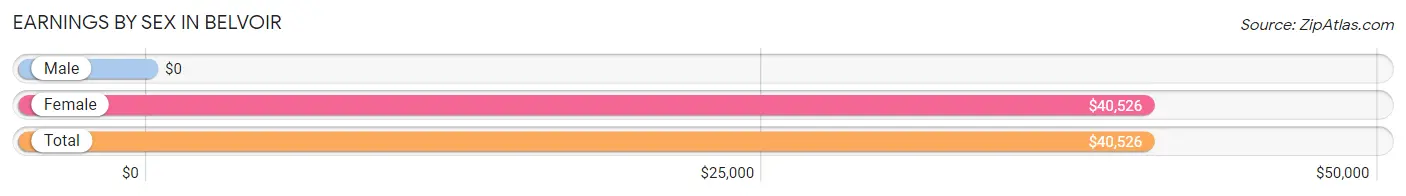
| Sex | Number | Average Earnings |
| Male | 28 (31.8%) | $0 |
| Female | 60 (68.2%) | $40,526 |
| Total | 88 (100.0%) | $40,526 |
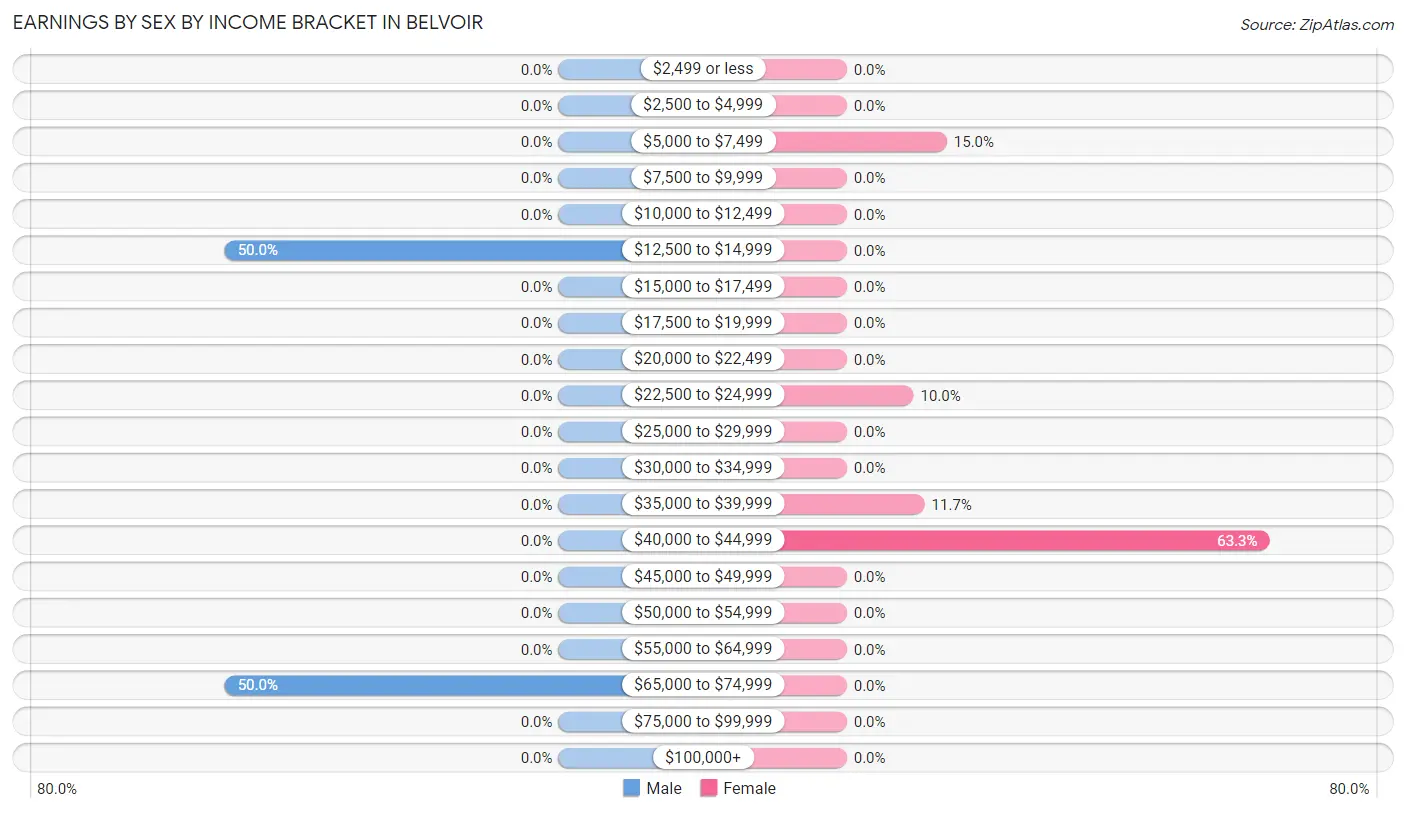
Earnings by Sex by Income Bracket in Belvoir
The most common earnings brackets in Belvoir are $12,500 to $14,999 for men (14 | 50.0%) and $40,000 to $44,999 for women (38 | 63.3%).
| Income | Male | Female |
| $2,499 or less | 0 (0.0%) | 0 (0.0%) |
| $2,500 to $4,999 | 0 (0.0%) | 0 (0.0%) |
| $5,000 to $7,499 | 0 (0.0%) | 9 (15.0%) |
| $7,500 to $9,999 | 0 (0.0%) | 0 (0.0%) |
| $10,000 to $12,499 | 0 (0.0%) | 0 (0.0%) |
| $12,500 to $14,999 | 14 (50.0%) | 0 (0.0%) |
| $15,000 to $17,499 | 0 (0.0%) | 0 (0.0%) |
| $17,500 to $19,999 | 0 (0.0%) | 0 (0.0%) |
| $20,000 to $22,499 | 0 (0.0%) | 0 (0.0%) |
| $22,500 to $24,999 | 0 (0.0%) | 6 (10.0%) |
| $25,000 to $29,999 | 0 (0.0%) | 0 (0.0%) |
| $30,000 to $34,999 | 0 (0.0%) | 0 (0.0%) |
| $35,000 to $39,999 | 0 (0.0%) | 7 (11.7%) |
| $40,000 to $44,999 | 0 (0.0%) | 38 (63.3%) |
| $45,000 to $49,999 | 0 (0.0%) | 0 (0.0%) |
| $50,000 to $54,999 | 0 (0.0%) | 0 (0.0%) |
| $55,000 to $64,999 | 0 (0.0%) | 0 (0.0%) |
| $65,000 to $74,999 | 14 (50.0%) | 0 (0.0%) |
| $75,000 to $99,999 | 0 (0.0%) | 0 (0.0%) |
| $100,000+ | 0 (0.0%) | 0 (0.0%) |
| Total | 28 (100.0%) | 60 (100.0%) |
Earnings by Sex by Educational Attainment in Belvoir
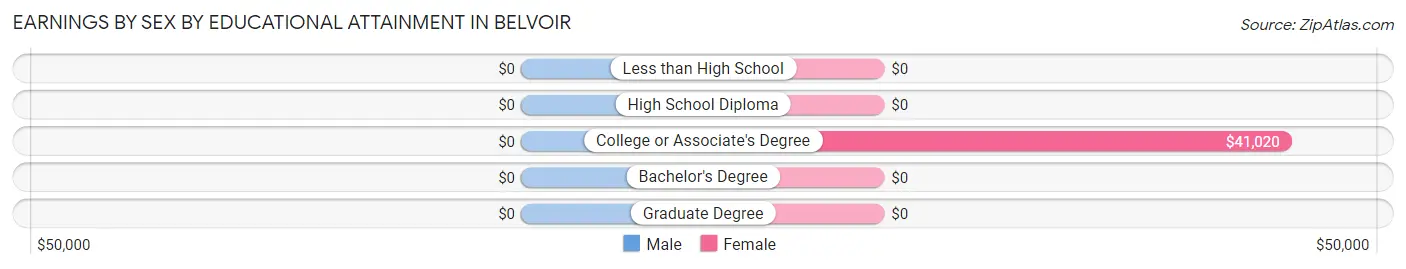
| Educational Attainment | Male Income | Female Income |
| Less than High School | - | - |
| High School Diploma | - | - |
| College or Associate's Degree | - | - |
| Bachelor's Degree | - | - |
| Graduate Degree | - | - |
| Total | - | - |
Family Income in Belvoir
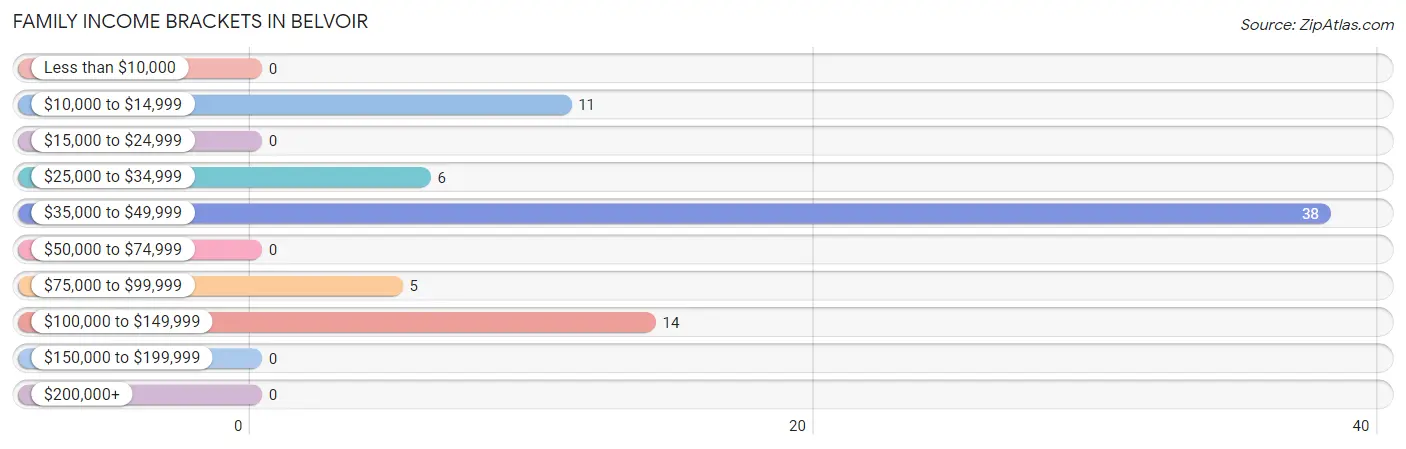
Family Income Brackets in Belvoir
According to the Belvoir family income data, there are 38 families falling into the $35,000 to $49,999 income range, which is the most common income bracket and makes up 51.3% of all families.
| Income Bracket | # Families | % Families |
| Less than $10,000 | 0 | 0.0% |
| $10,000 to $14,999 | 11 | 14.9% |
| $15,000 to $24,999 | 0 | 0.0% |
| $25,000 to $34,999 | 6 | 8.1% |
| $35,000 to $49,999 | 38 | 51.4% |
| $50,000 to $74,999 | 0 | 0.0% |
| $75,000 to $99,999 | 5 | 6.8% |
| $100,000 to $149,999 | 14 | 18.9% |
| $150,000 to $199,999 | 0 | 0.0% |
| $200,000+ | 0 | 0.0% |
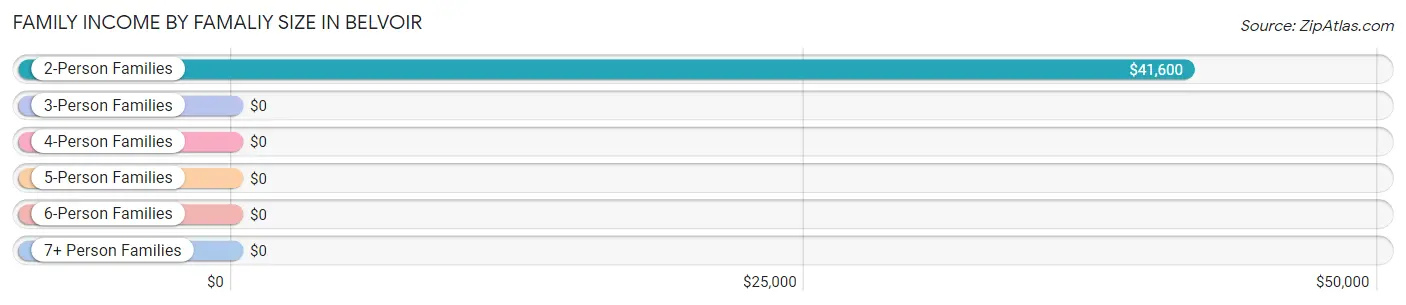
Family Income by Famaliy Size in Belvoir
2-person families (54 | 73.0%) account for the highest median family income in Belvoir with $41,600 per family, while 2-person families (54 | 73.0%) have the highest median income of $20,800 per family member.
| Income Bracket | # Families | Median Income |
| 2-Person Families | 54 (73.0%) | $41,600 |
| 3-Person Families | 20 (27.0%) | $0 |
| 4-Person Families | 0 (0.0%) | $0 |
| 5-Person Families | 0 (0.0%) | $0 |
| 6-Person Families | 0 (0.0%) | $0 |
| 7+ Person Families | 0 (0.0%) | $0 |
| Total | 74 (100.0%) | $42,000 |
Family Income by Number of Earners in Belvoir
| Number of Earners | # Families | Median Income |
| No Earners | 16 (21.6%) | $0 |
| 1 Earner | 31 (41.9%) | $0 |
| 2 Earners | 27 (36.5%) | $0 |
| 3+ Earners | 0 (0.0%) | $0 |
| Total | 74 (100.0%) | $42,000 |
Household Income in Belvoir
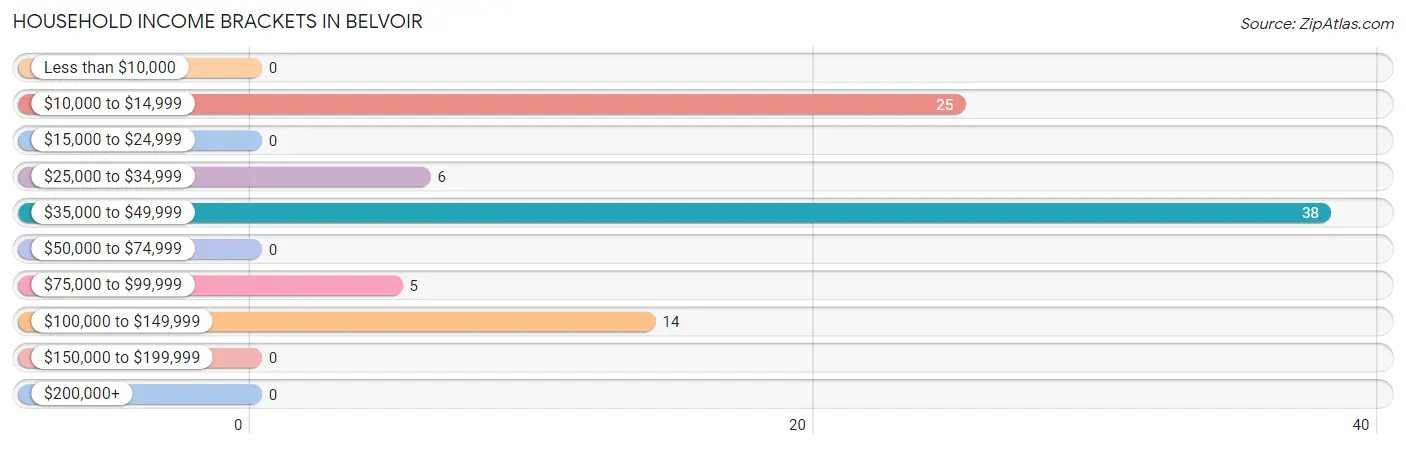
Household Income Brackets in Belvoir
With 38 households falling in the category, the $35,000 to $49,999 income range is the most frequent in Belvoir, accounting for 43.2% of all households.
| Income Bracket | # Households | % Households |
| Less than $10,000 | 0 | 0.0% |
| $10,000 to $14,999 | 25 | 28.4% |
| $15,000 to $24,999 | 0 | 0.0% |
| $25,000 to $34,999 | 6 | 6.8% |
| $35,000 to $49,999 | 38 | 43.2% |
| $50,000 to $74,999 | 0 | 0.0% |
| $75,000 to $99,999 | 5 | 5.7% |
| $100,000 to $149,999 | 14 | 15.9% |
| $150,000 to $199,999 | 0 | 0.0% |
| $200,000+ | 0 | 0.0% |
Household Income by Householder Age in Belvoir
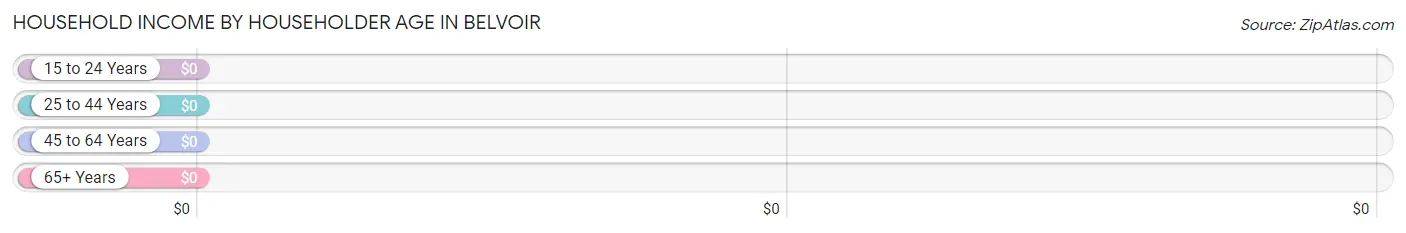
| Income Bracket | # Households | Median Income |
| 15 to 24 Years | 0 (0.0%) | $0 |
| 25 to 44 Years | 45 (51.1%) | $0 |
| 45 to 64 Years | 38 (43.2%) | $0 |
| 65+ Years | 5 (5.7%) | $0 |
| Total | 88 (100.0%) | $41,300 |
Poverty in Belvoir
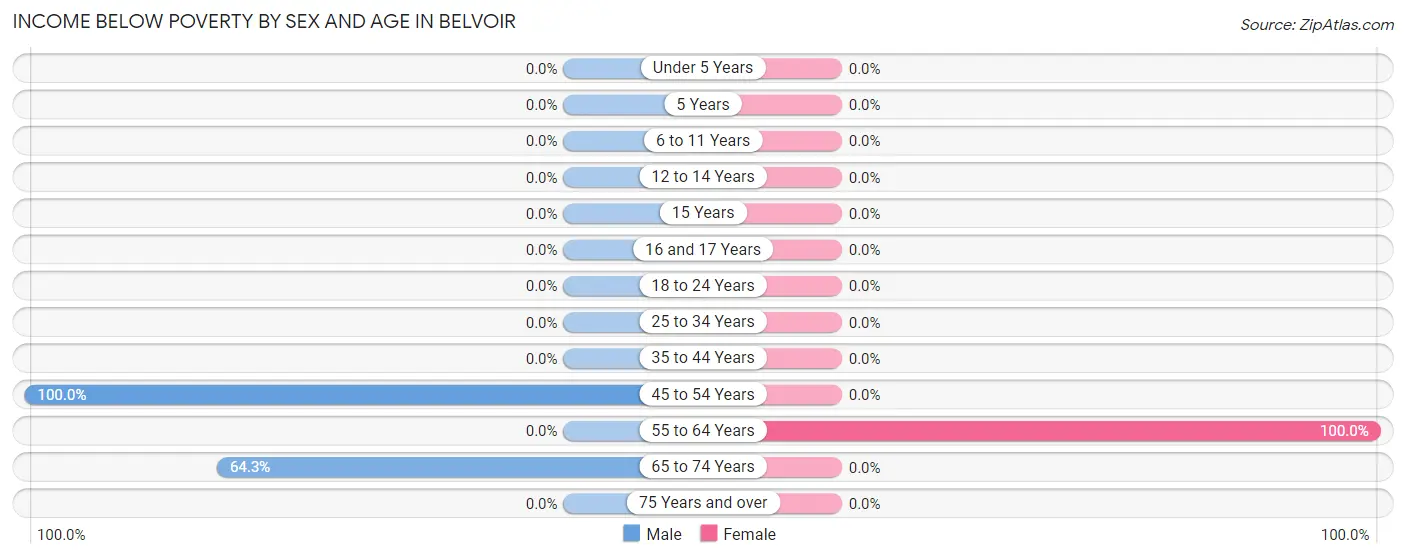
Income Below Poverty by Sex and Age in Belvoir
With 36.5% poverty level for males and 10.4% for females among the residents of Belvoir, 45 to 54 year old males and 55 to 64 year old females are the most vulnerable to poverty, with 14 males (100.0%) and 11 females (100.0%) in their respective age groups living below the poverty level.
| Age Bracket | Male | Female |
| Under 5 Years | 0 (0.0%) | 0 (0.0%) |
| 5 Years | 0 (0.0%) | 0 (0.0%) |
| 6 to 11 Years | 0 (0.0%) | 0 (0.0%) |
| 12 to 14 Years | 0 (0.0%) | 0 (0.0%) |
| 15 Years | 0 (0.0%) | 0 (0.0%) |
| 16 and 17 Years | 0 (0.0%) | 0 (0.0%) |
| 18 to 24 Years | 0 (0.0%) | 0 (0.0%) |
| 25 to 34 Years | 0 (0.0%) | 0 (0.0%) |
| 35 to 44 Years | 0 (0.0%) | 0 (0.0%) |
| 45 to 54 Years | 14 (100.0%) | 0 (0.0%) |
| 55 to 64 Years | 0 (0.0%) | 11 (100.0%) |
| 65 to 74 Years | 9 (64.3%) | 0 (0.0%) |
| 75 Years and over | 0 (0.0%) | 0 (0.0%) |
| Total | 23 (36.5%) | 11 (10.4%) |
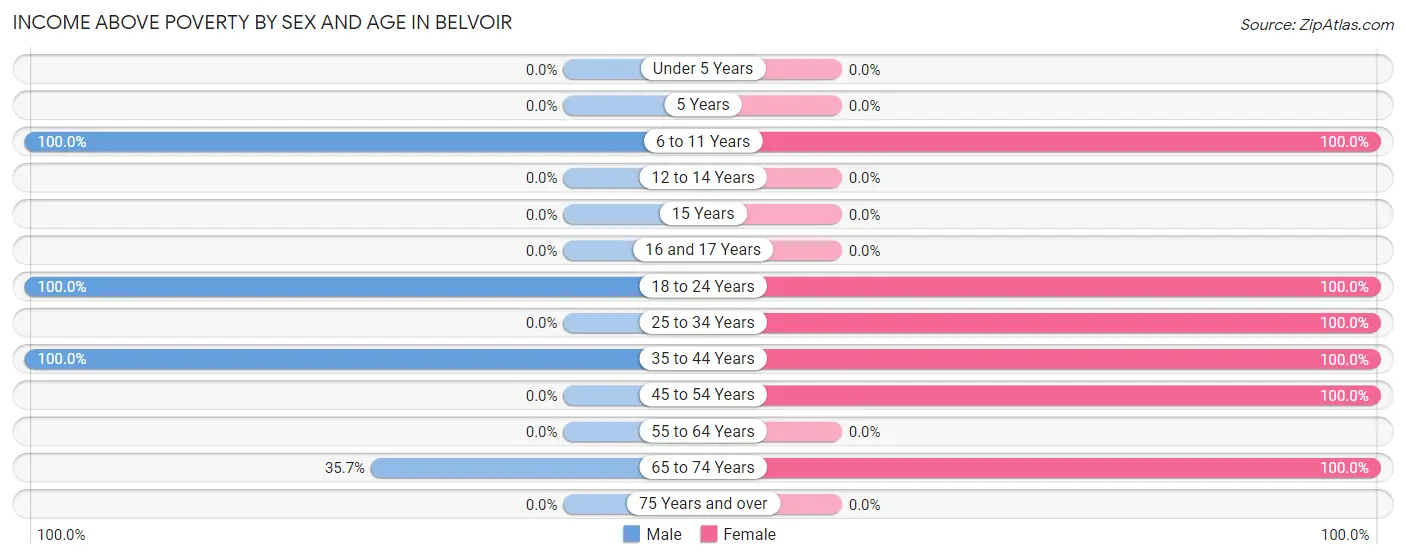
Income Above Poverty by Sex and Age in Belvoir
According to the poverty statistics in Belvoir, males aged 6 to 11 years and females aged 6 to 11 years are the age groups that are most secure financially, with 100.0% of males and 100.0% of females in these age groups living above the poverty line.
| Age Bracket | Male | Female |
| Under 5 Years | 0 (0.0%) | 0 (0.0%) |
| 5 Years | 0 (0.0%) | 0 (0.0%) |
| 6 to 11 Years | 15 (100.0%) | 30 (100.0%) |
| 12 to 14 Years | 0 (0.0%) | 0 (0.0%) |
| 15 Years | 0 (0.0%) | 0 (0.0%) |
| 16 and 17 Years | 0 (0.0%) | 0 (0.0%) |
| 18 to 24 Years | 6 (100.0%) | 9 (100.0%) |
| 25 to 34 Years | 0 (0.0%) | 32 (100.0%) |
| 35 to 44 Years | 14 (100.0%) | 6 (100.0%) |
| 45 to 54 Years | 0 (0.0%) | 13 (100.0%) |
| 55 to 64 Years | 0 (0.0%) | 0 (0.0%) |
| 65 to 74 Years | 5 (35.7%) | 5 (100.0%) |
| 75 Years and over | 0 (0.0%) | 0 (0.0%) |
| Total | 40 (63.5%) | 95 (89.6%) |
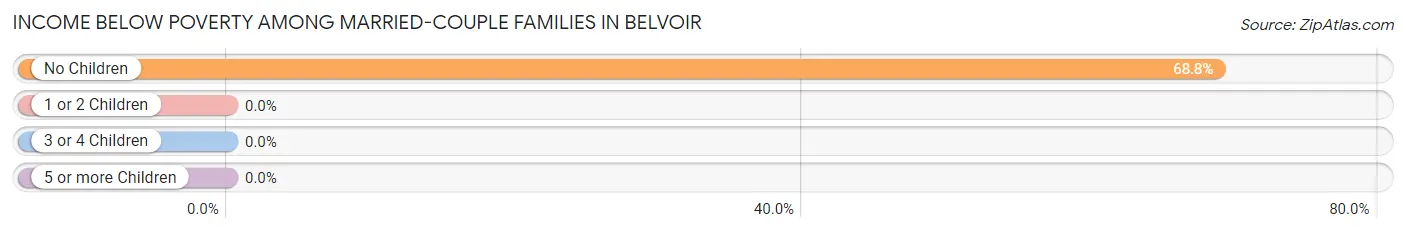
Income Below Poverty Among Married-Couple Families in Belvoir
The poverty statistics for married-couple families in Belvoir show that 36.7% or 11 of the total 30 families live below the poverty line. Families with no children have the highest poverty rate of 68.8%, comprising of 11 families. On the other hand, families with 1 or 2 children have the lowest poverty rate of 0.0%, which includes 0 families.
| Children | Above Poverty | Below Poverty |
| No Children | 5 (31.2%) | 11 (68.8%) |
| 1 or 2 Children | 14 (100.0%) | 0 (0.0%) |
| 3 or 4 Children | 0 (0.0%) | 0 (0.0%) |
| 5 or more Children | 0 (0.0%) | 0 (0.0%) |
| Total | 19 (63.3%) | 11 (36.7%) |
Income Below Poverty Among Single-Parent Households in Belvoir
| Children | Single Father | Single Mother |
| No Children | 0 (0.0%) | 0 (0.0%) |
| 1 or 2 Children | 0 (0.0%) | 0 (0.0%) |
| 3 or 4 Children | 0 (0.0%) | 0 (0.0%) |
| 5 or more Children | 0 (0.0%) | 0 (0.0%) |
| Total | 0 (0.0%) | 0 (0.0%) |
Income Below Poverty Among Married-Couple vs Single-Parent Households in Belvoir
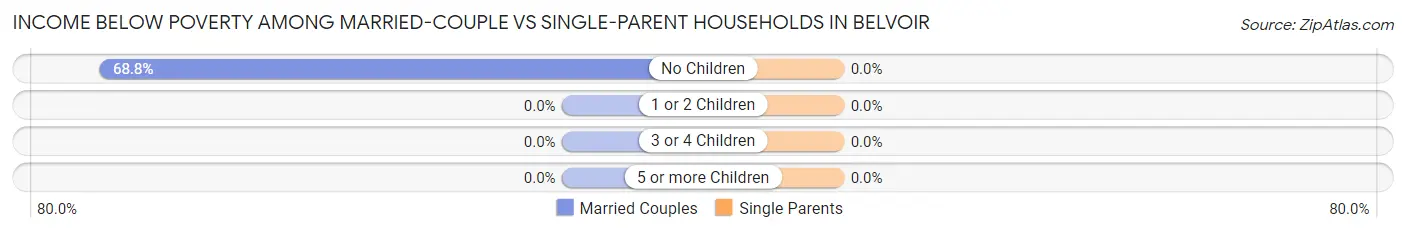
| Children | Married-Couple Families | Single-Parent Households |
| No Children | 11 (68.8%) | 0 (0.0%) |
| 1 or 2 Children | 0 (0.0%) | 0 (0.0%) |
| 3 or 4 Children | 0 (0.0%) | 0 (0.0%) |
| 5 or more Children | 0 (0.0%) | 0 (0.0%) |
| Total | 11 (36.7%) | 0 (0.0%) |
Race in Belvoir
The most populous races in Belvoir are White / Caucasian (88 | 52.1%), Black / African American (81 | 47.9%), and Hispanic or Latino (7 | 4.1%).
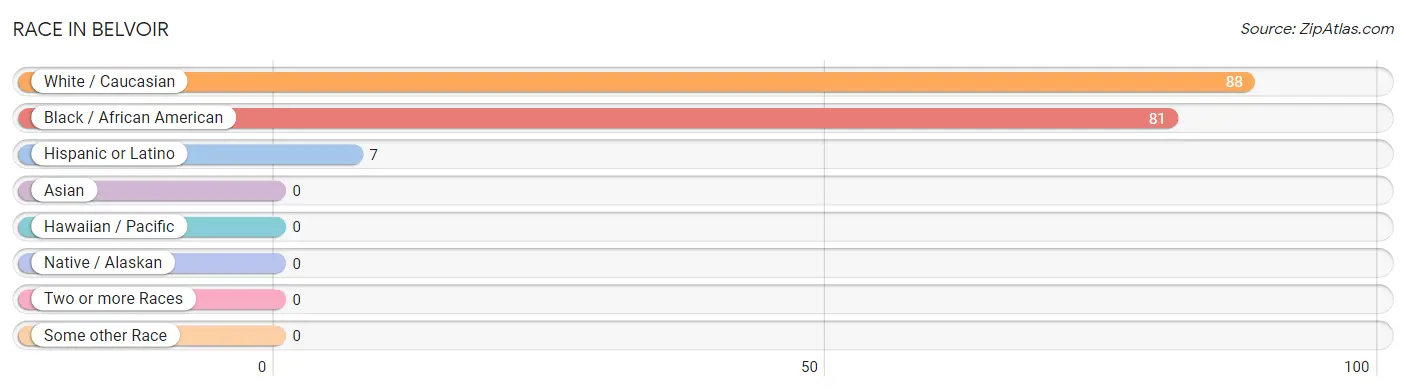
| Race | # Population | % Population |
| Asian | 0 | 0.0% |
| Black / African American | 81 | 47.9% |
| Hawaiian / Pacific | 0 | 0.0% |
| Hispanic or Latino | 7 | 4.1% |
| Native / Alaskan | 0 | 0.0% |
| White / Caucasian | 88 | 52.1% |
| Two or more Races | 0 | 0.0% |
| Some other Race | 0 | 0.0% |
| Total | 169 | 100.0% |
Ancestry in Belvoir
The most populous ancestries reported in Belvoir are American (52 | 30.8%), English (29 | 17.2%), and Mexican (7 | 4.1%), together accounting for 52.1% of all Belvoir residents.
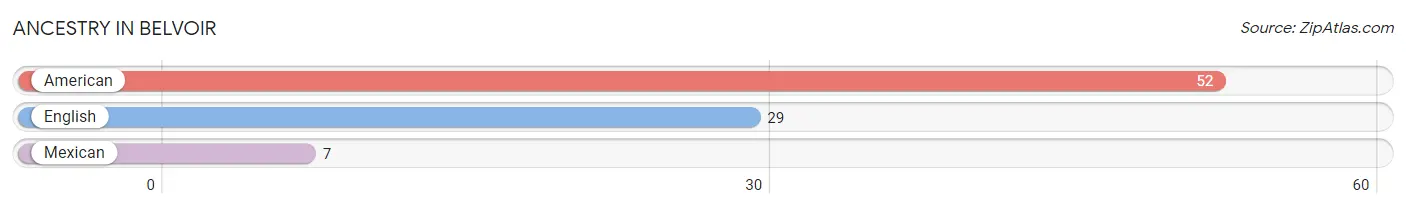
| Ancestry | # Population | % Population |
| American | 52 | 30.8% |
| English | 29 | 17.2% |
| Mexican | 7 | 4.1% | View All 3 Rows |
Immigrants in Belvoir

| Immigration Origin | # Population | % Population | View All 0 Rows |
Sex and Age in Belvoir
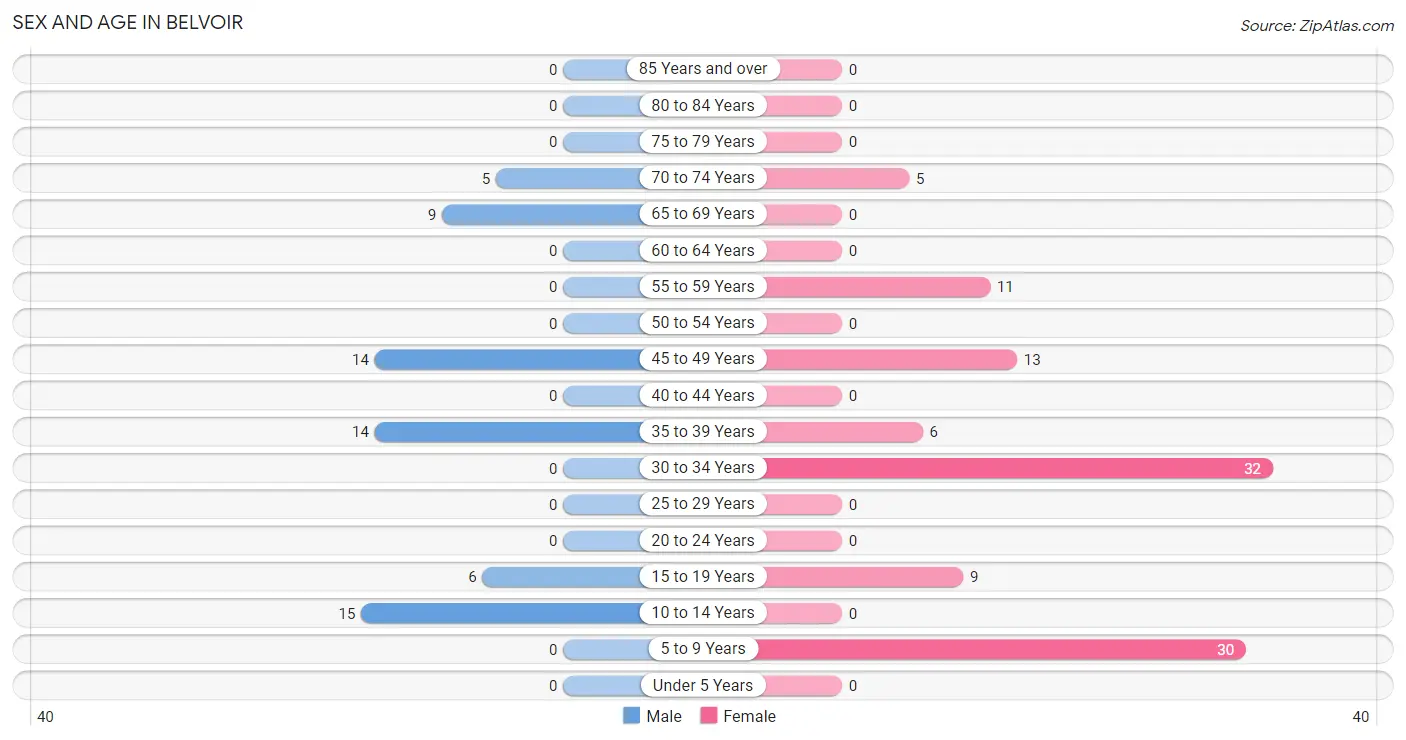
Sex and Age in Belvoir
The most populous age groups in Belvoir are 10 to 14 Years (15 | 23.8%) for men and 30 to 34 Years (32 | 30.2%) for women.
| Age Bracket | Male | Female |
| Under 5 Years | 0 (0.0%) | 0 (0.0%) |
| 5 to 9 Years | 0 (0.0%) | 30 (28.3%) |
| 10 to 14 Years | 15 (23.8%) | 0 (0.0%) |
| 15 to 19 Years | 6 (9.5%) | 9 (8.5%) |
| 20 to 24 Years | 0 (0.0%) | 0 (0.0%) |
| 25 to 29 Years | 0 (0.0%) | 0 (0.0%) |
| 30 to 34 Years | 0 (0.0%) | 32 (30.2%) |
| 35 to 39 Years | 14 (22.2%) | 6 (5.7%) |
| 40 to 44 Years | 0 (0.0%) | 0 (0.0%) |
| 45 to 49 Years | 14 (22.2%) | 13 (12.3%) |
| 50 to 54 Years | 0 (0.0%) | 0 (0.0%) |
| 55 to 59 Years | 0 (0.0%) | 11 (10.4%) |
| 60 to 64 Years | 0 (0.0%) | 0 (0.0%) |
| 65 to 69 Years | 9 (14.3%) | 0 (0.0%) |
| 70 to 74 Years | 5 (7.9%) | 5 (4.7%) |
| 75 to 79 Years | 0 (0.0%) | 0 (0.0%) |
| 80 to 84 Years | 0 (0.0%) | 0 (0.0%) |
| 85 Years and over | 0 (0.0%) | 0 (0.0%) |
| Total | 63 (100.0%) | 106 (100.0%) |
Families and Households in Belvoir
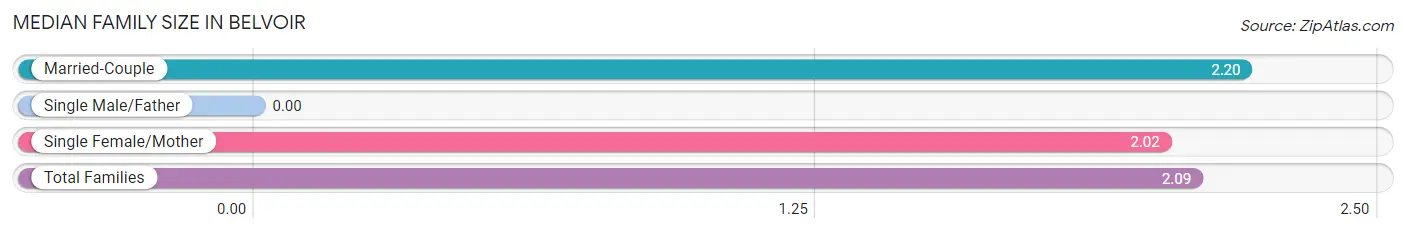
Median Family Size in Belvoir
| Family Type | # Families | Family Size |
| Married-Couple | 30 (40.5%) | 2.20 |
| Single Male/Father | 0 (0.0%) | - |
| Single Female/Mother | 44 (59.5%) | 2.02 |
| Total Families | 74 (100.0%) | 2.09 |
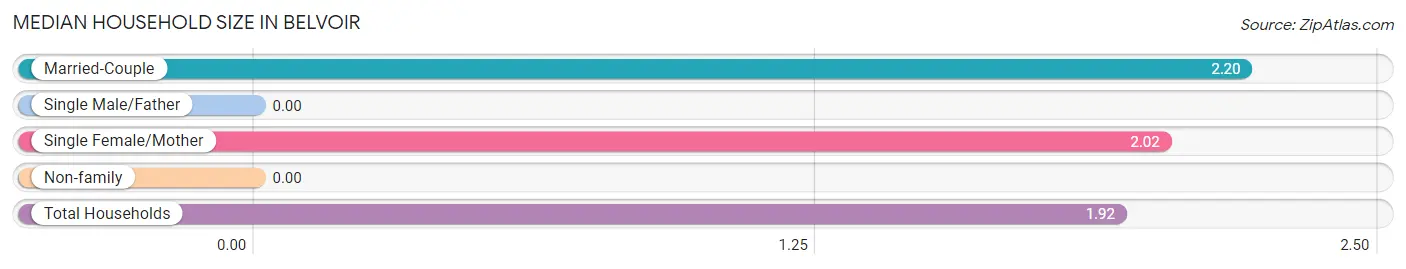
Median Household Size in Belvoir
| Household Type | # Households | Household Size |
| Married-Couple | 30 (34.1%) | 2.20 |
| Single Male/Father | 0 (0.0%) | - |
| Single Female/Mother | 44 (50.0%) | 2.02 |
| Non-family | 14 (15.9%) | - |
| Total Households | 88 (100.0%) | 1.92 |
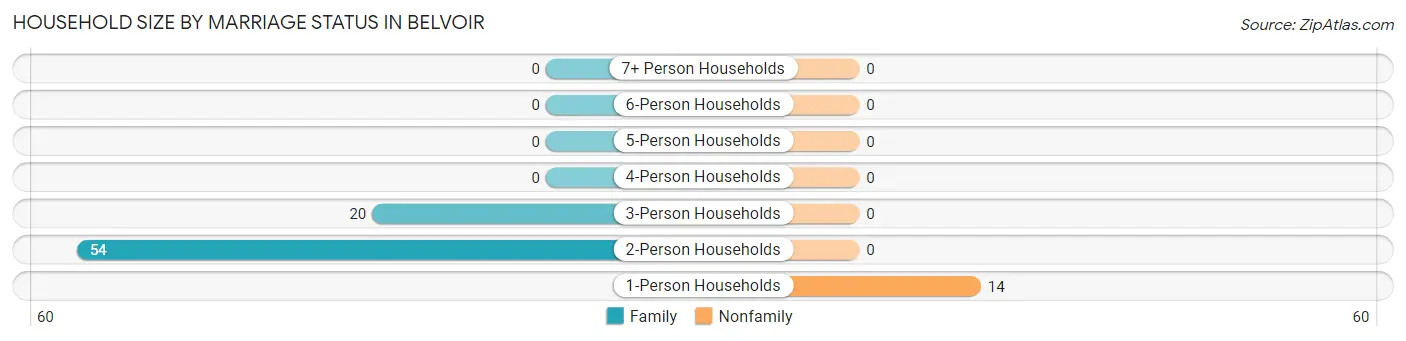
Household Size by Marriage Status in Belvoir
Out of a total of 88 households in Belvoir, 74 (84.1%) are family households, while 14 (15.9%) are nonfamily households. The most numerous type of family households are 2-person households, comprising 54, and the most common type of nonfamily households are 1-person households, comprising 14.
| Household Size | Family Households | Nonfamily Households |
| 1-Person Households | - | 14 (15.9%) |
| 2-Person Households | 54 (61.4%) | 0 (0.0%) |
| 3-Person Households | 20 (22.7%) | 0 (0.0%) |
| 4-Person Households | 0 (0.0%) | 0 (0.0%) |
| 5-Person Households | 0 (0.0%) | 0 (0.0%) |
| 6-Person Households | 0 (0.0%) | 0 (0.0%) |
| 7+ Person Households | 0 (0.0%) | 0 (0.0%) |
| Total | 74 (84.1%) | 14 (15.9%) |
Female Fertility in Belvoir
Fertility by Age in Belvoir
| Age Bracket | Women with Births | Births / 1,000 Women |
| 15 to 19 years | 0 (0.0%) | 0.0 |
| 20 to 34 years | 0 (0.0%) | 0.0 |
| 35 to 50 years | 0 (0.0%) | 0.0 |
| Total | 0 (0.0%) | 0.0 |
Fertility by Age by Marriage Status in Belvoir
| Age Bracket | Married | Unmarried |
| 15 to 19 years | 0 (0.0%) | 0 (0.0%) |
| 20 to 34 years | 0 (0.0%) | 0 (0.0%) |
| 35 to 50 years | 0 (0.0%) | 0 (0.0%) |
| Total | 0 (0.0%) | 0 (0.0%) |
Fertility by Education in Belvoir
| Educational Attainment | Women with Births | Births / 1,000 Women |
| Less than High School | 0 (0.0%) | 0.0 |
| High School Diploma | 0 (0.0%) | 0.0 |
| College or Associate's Degree | 0 (0.0%) | 0.0 |
| Bachelor's Degree | 0 (0.0%) | 0.0 |
| Graduate Degree | 0 (0.0%) | 0.0 |
| Total | 0 (0.0%) | 0.0 |
Fertility by Education by Marriage Status in Belvoir
| Educational Attainment | Married | Unmarried |
| Less than High School | 0 (0.0%) | 0 (0.0%) |
| High School Diploma | 0 (0.0%) | 0 (0.0%) |
| College or Associate's Degree | 0 (0.0%) | 0 (0.0%) |
| Bachelor's Degree | 0 (0.0%) | 0 (0.0%) |
| Graduate Degree | 0 (0.0%) | 0 (0.0%) |
| Total | 0 (0.0%) | 0 (0.0%) |
Employment Characteristics in Belvoir
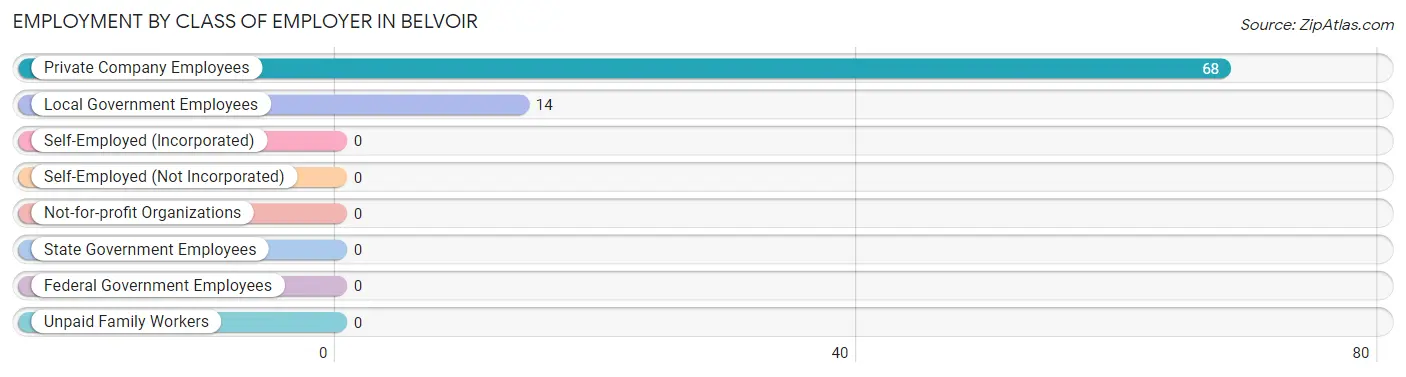
Employment by Class of Employer in Belvoir
Among the 82 employed individuals in Belvoir, private company employees (68 | 82.9%), and local government employees (14 | 17.1%) make up the most common classes of employment.
| Employer Class | # Employees | % Employees |
| Private Company Employees | 68 | 82.9% |
| Self-Employed (Incorporated) | 0 | 0.0% |
| Self-Employed (Not Incorporated) | 0 | 0.0% |
| Not-for-profit Organizations | 0 | 0.0% |
| Local Government Employees | 14 | 17.1% |
| State Government Employees | 0 | 0.0% |
| Federal Government Employees | 0 | 0.0% |
| Unpaid Family Workers | 0 | 0.0% |
| Total | 82 | 100.0% |
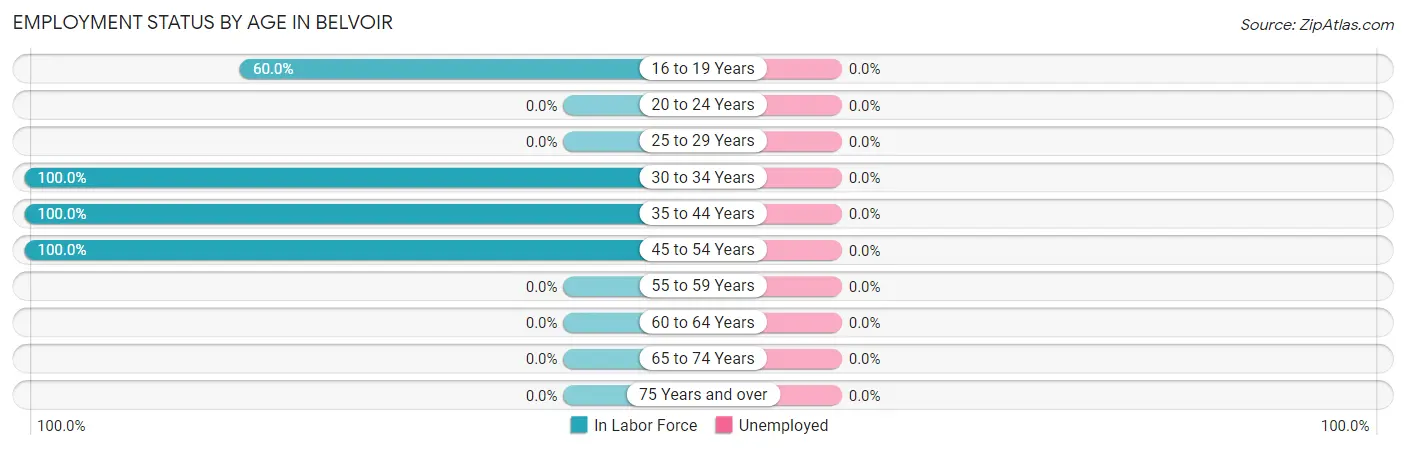
Employment Status by Age in Belvoir
| Age Bracket | In Labor Force | Unemployed |
| 16 to 19 Years | 9 (60.0%) | 0 (0.0%) |
| 20 to 24 Years | 0 (0.0%) | 0 (0.0%) |
| 25 to 29 Years | 0 (0.0%) | 0 (0.0%) |
| 30 to 34 Years | 32 (100.0%) | 0 (0.0%) |
| 35 to 44 Years | 20 (100.0%) | 0 (0.0%) |
| 45 to 54 Years | 27 (100.0%) | 0 (0.0%) |
| 55 to 59 Years | 0 (0.0%) | 0 (0.0%) |
| 60 to 64 Years | 0 (0.0%) | 0 (0.0%) |
| 65 to 74 Years | 0 (0.0%) | 0 (0.0%) |
| 75 Years and over | 0 (0.0%) | 0 (0.0%) |
| Total | 88 (71.0%) | 0 (0.0%) |
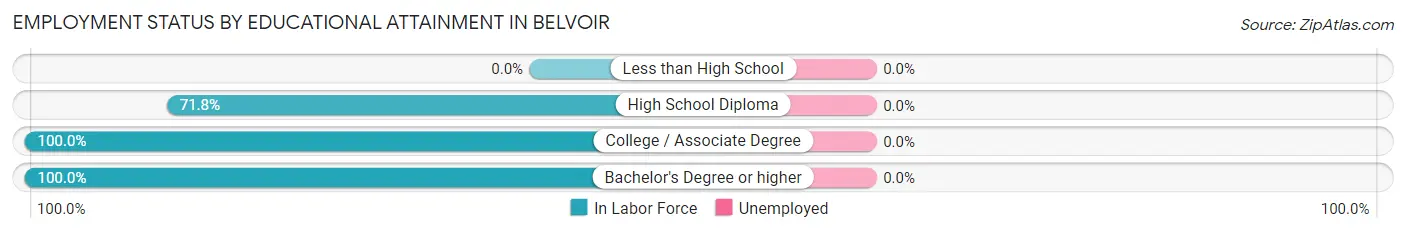
Employment Status by Educational Attainment in Belvoir
| Educational Attainment | In Labor Force | Unemployed |
| Less than High School | 0 (0.0%) | 0 (0.0%) |
| High School Diploma | 28 (71.8%) | 0 (0.0%) |
| College / Associate Degree | 45 (100.0%) | 0 (0.0%) |
| Bachelor's Degree or higher | 6 (100.0%) | 0 (0.0%) |
| Total | 79 (87.8%) | 0 (0.0%) |
Employment Occupations by Sex in Belvoir
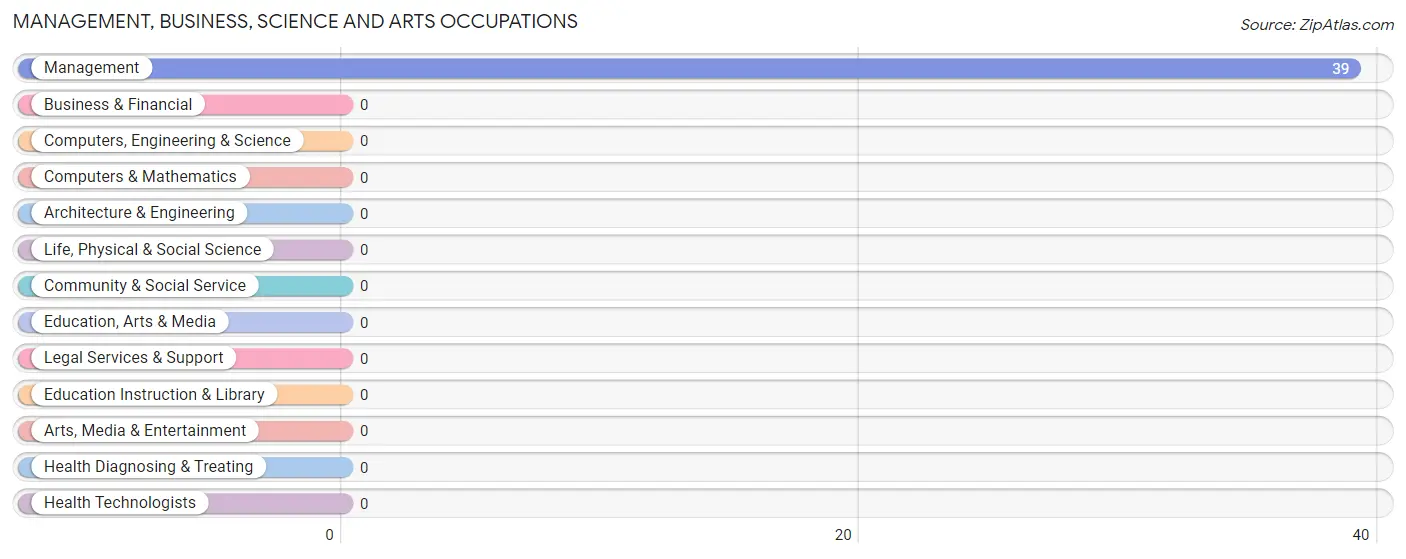
Management, Business, Science and Arts Occupations
The most common Management, Business, Science and Arts occupations in Belvoir are , and Management (39 | 44.3%).
Management, Business, Science and Arts Occupations by Sex
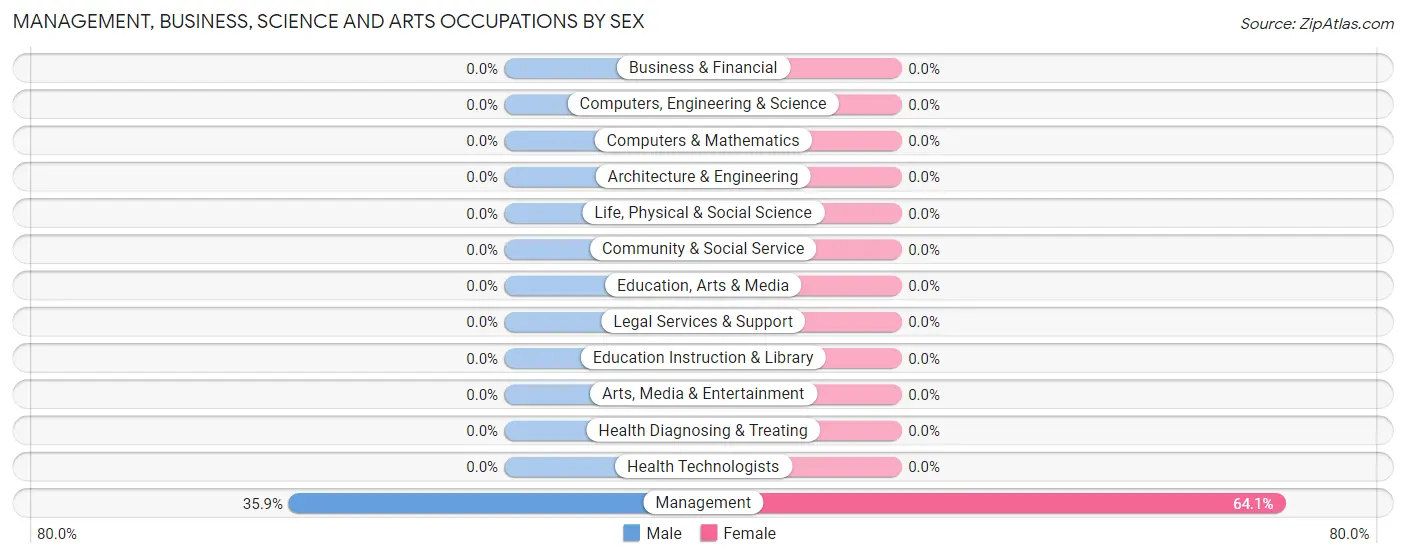
| Occupation | Male | Female |
| Management | 14 (35.9%) | 25 (64.1%) |
| Business & Financial | 0 (0.0%) | 0 (0.0%) |
| Computers, Engineering & Science | 0 (0.0%) | 0 (0.0%) |
| Computers & Mathematics | 0 (0.0%) | 0 (0.0%) |
| Architecture & Engineering | 0 (0.0%) | 0 (0.0%) |
| Life, Physical & Social Science | 0 (0.0%) | 0 (0.0%) |
| Community & Social Service | 0 (0.0%) | 0 (0.0%) |
| Education, Arts & Media | 0 (0.0%) | 0 (0.0%) |
| Legal Services & Support | 0 (0.0%) | 0 (0.0%) |
| Education Instruction & Library | 0 (0.0%) | 0 (0.0%) |
| Arts, Media & Entertainment | 0 (0.0%) | 0 (0.0%) |
| Health Diagnosing & Treating | 0 (0.0%) | 0 (0.0%) |
| Health Technologists | 0 (0.0%) | 0 (0.0%) |
| Total (Category) | 14 (35.9%) | 25 (64.1%) |
| Total (Overall) | 28 (31.8%) | 60 (68.2%) |
Services Occupations
The most common Services occupations in Belvoir are Food Preparation & Serving (14 | 15.9%), Security & Protection (6 | 6.8%), and Law Enforcement (6 | 6.8%).
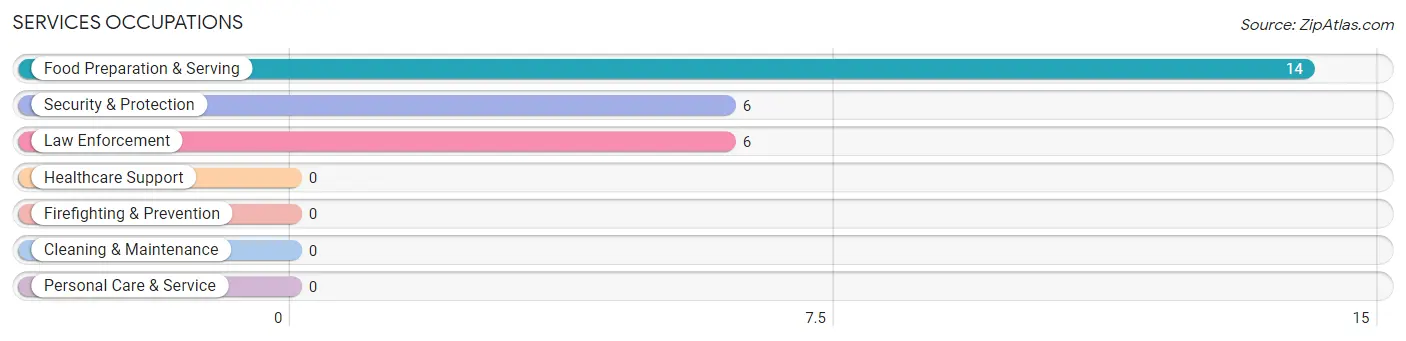
Services Occupations by Sex
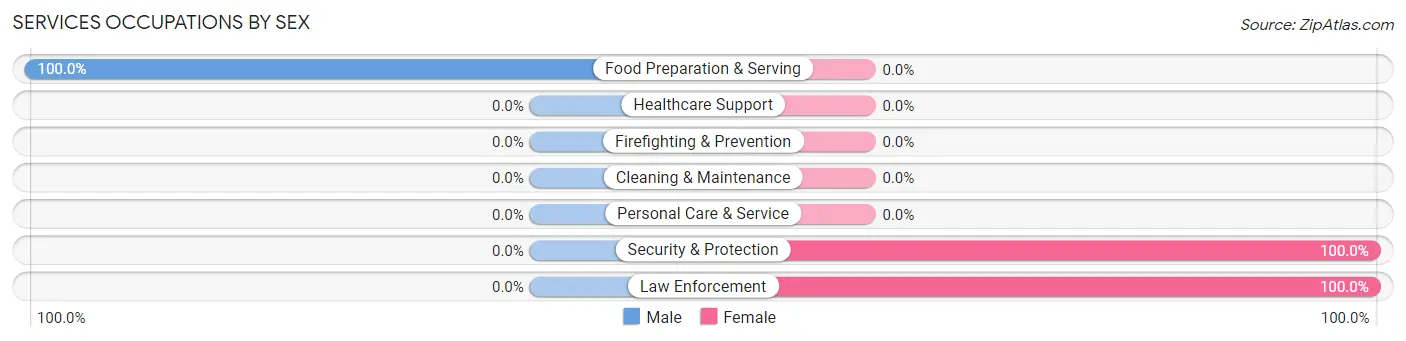
| Occupation | Male | Female |
| Healthcare Support | 0 (0.0%) | 0 (0.0%) |
| Security & Protection | 0 (0.0%) | 6 (100.0%) |
| Firefighting & Prevention | 0 (0.0%) | 0 (0.0%) |
| Law Enforcement | 0 (0.0%) | 6 (100.0%) |
| Food Preparation & Serving | 14 (100.0%) | 0 (0.0%) |
| Cleaning & Maintenance | 0 (0.0%) | 0 (0.0%) |
| Personal Care & Service | 0 (0.0%) | 0 (0.0%) |
| Total (Category) | 14 (70.0%) | 6 (30.0%) |
| Total (Overall) | 28 (31.8%) | 60 (68.2%) |
Sales and Office Occupations
The most common Sales and Office occupations in Belvoir are Office & Administration (20 | 22.7%), and Sales & Related (9 | 10.2%).
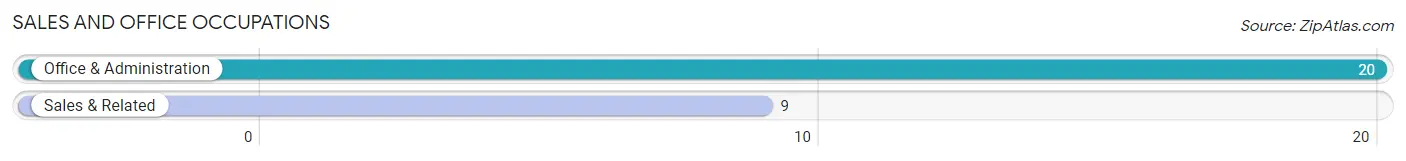
Sales and Office Occupations by Sex
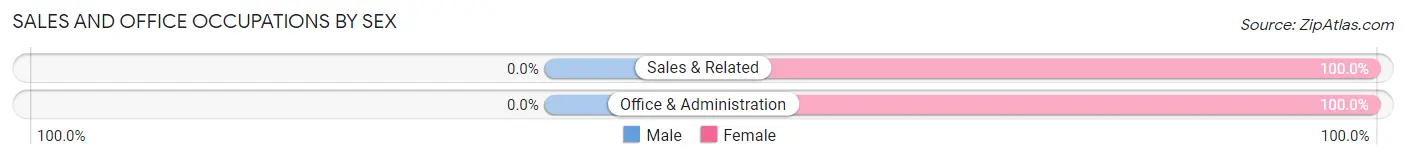
| Occupation | Male | Female |
| Sales & Related | 0 (0.0%) | 9 (100.0%) |
| Office & Administration | 0 (0.0%) | 20 (100.0%) |
| Total (Category) | 0 (0.0%) | 29 (100.0%) |
| Total (Overall) | 28 (31.8%) | 60 (68.2%) |
Natural Resources, Construction and Maintenance Occupations
Natural Resources, Construction and Maintenance Occupations by Sex
| Occupation | Male | Female |
| Farming, Fishing & Forestry | 0 (0.0%) | 0 (0.0%) |
| Construction & Extraction | 0 (0.0%) | 0 (0.0%) |
| Installation, Maintenance & Repair | 0 (0.0%) | 0 (0.0%) |
| Total (Category) | 0 (0.0%) | 0 (0.0%) |
| Total (Overall) | 28 (31.8%) | 60 (68.2%) |
Production, Transportation and Moving Occupations
Production, Transportation and Moving Occupations by Sex
| Occupation | Male | Female |
| Production | 0 (0.0%) | 0 (0.0%) |
| Transportation | 0 (0.0%) | 0 (0.0%) |
| Material Moving | 0 (0.0%) | 0 (0.0%) |
| Total (Category) | 0 (0.0%) | 0 (0.0%) |
| Total (Overall) | 28 (31.8%) | 60 (68.2%) |
Employment Industries by Sex in Belvoir
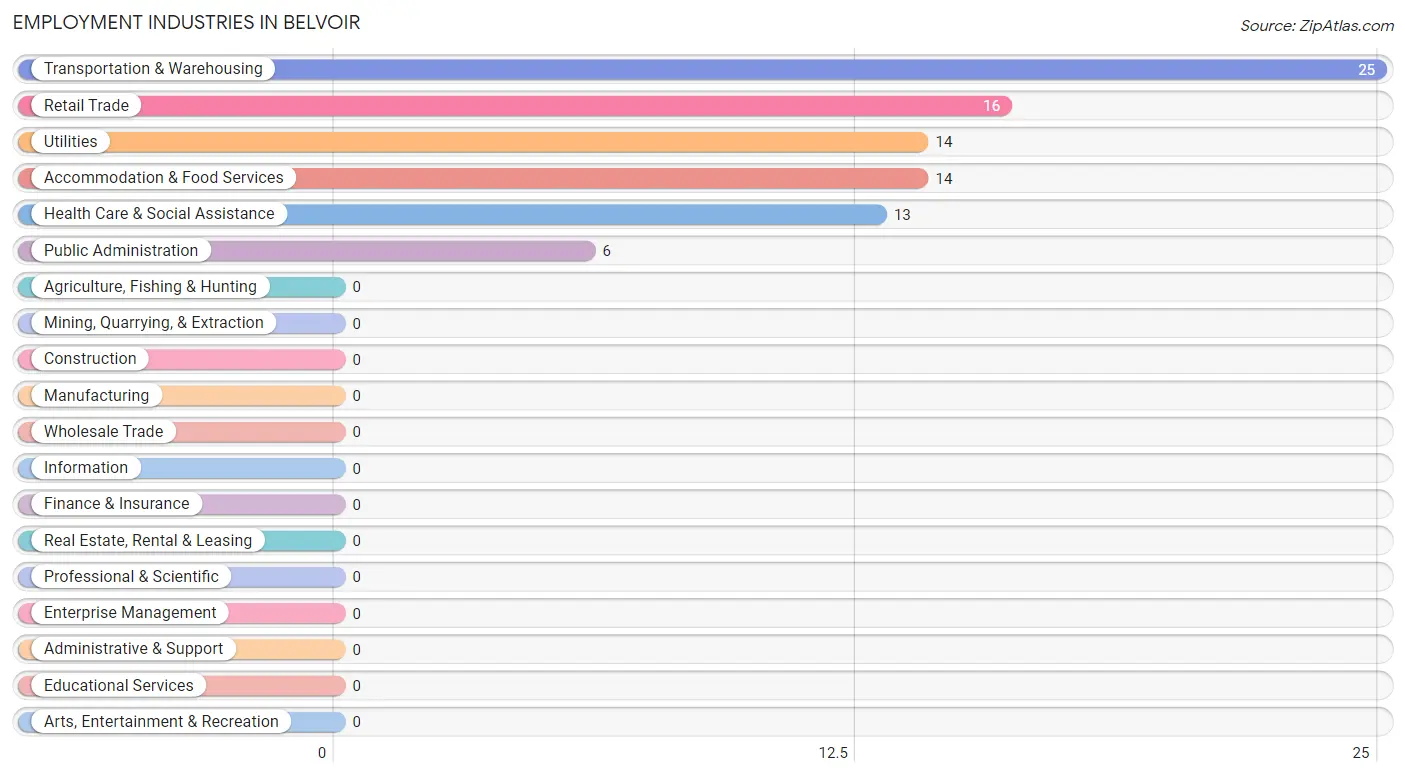
Employment Industries in Belvoir
The major employment industries in Belvoir include Transportation & Warehousing (25 | 28.4%), Retail Trade (16 | 18.2%), Utilities (14 | 15.9%), Accommodation & Food Services (14 | 15.9%), and Health Care & Social Assistance (13 | 14.8%).
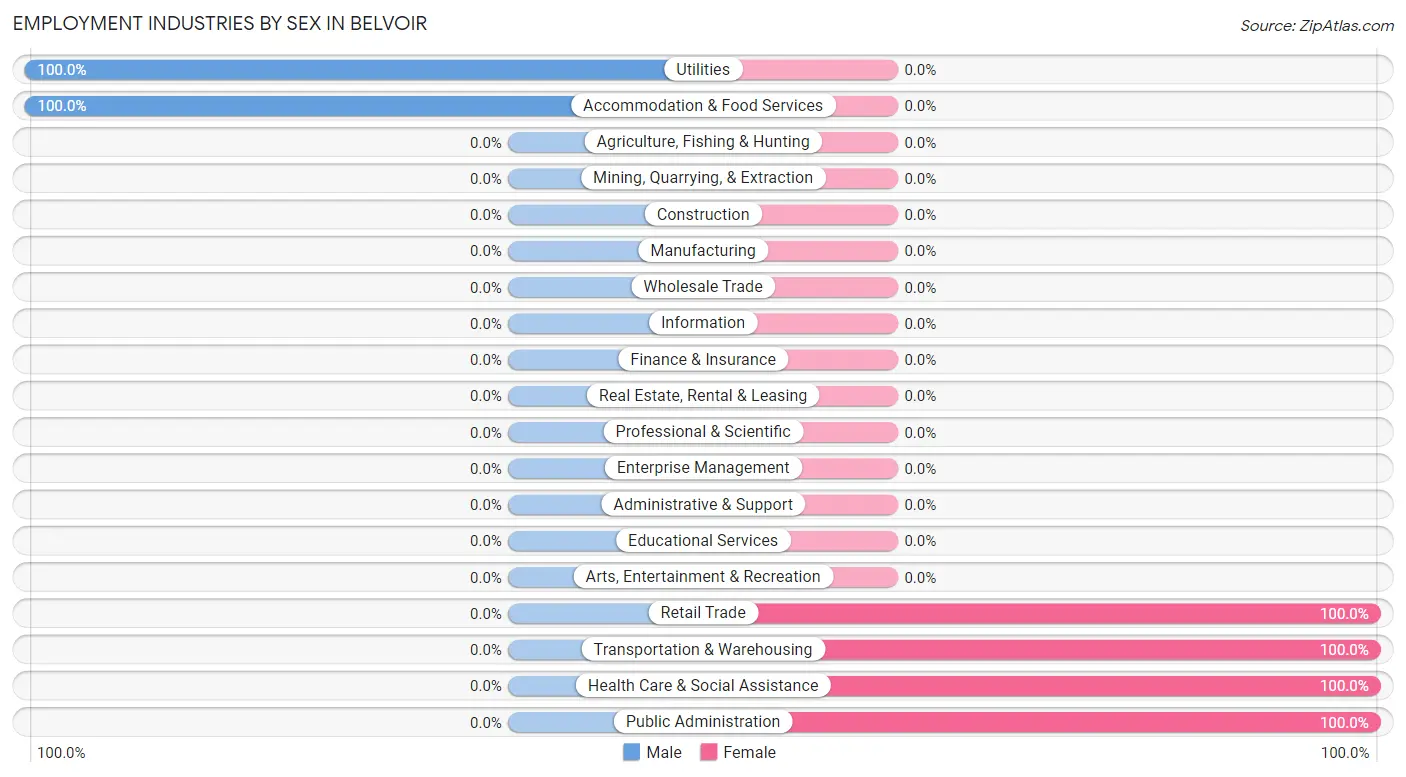
Employment Industries by Sex in Belvoir
The Belvoir industries that see more men than women are Utilities (100.0%), and Accommodation & Food Services (100.0%), whereas the industries that tend to have a higher number of women are Retail Trade (100.0%), Transportation & Warehousing (100.0%), and Health Care & Social Assistance (100.0%).
| Industry | Male | Female |
| Agriculture, Fishing & Hunting | 0 (0.0%) | 0 (0.0%) |
| Mining, Quarrying, & Extraction | 0 (0.0%) | 0 (0.0%) |
| Construction | 0 (0.0%) | 0 (0.0%) |
| Manufacturing | 0 (0.0%) | 0 (0.0%) |
| Wholesale Trade | 0 (0.0%) | 0 (0.0%) |
| Retail Trade | 0 (0.0%) | 16 (100.0%) |
| Transportation & Warehousing | 0 (0.0%) | 25 (100.0%) |
| Utilities | 14 (100.0%) | 0 (0.0%) |
| Information | 0 (0.0%) | 0 (0.0%) |
| Finance & Insurance | 0 (0.0%) | 0 (0.0%) |
| Real Estate, Rental & Leasing | 0 (0.0%) | 0 (0.0%) |
| Professional & Scientific | 0 (0.0%) | 0 (0.0%) |
| Enterprise Management | 0 (0.0%) | 0 (0.0%) |
| Administrative & Support | 0 (0.0%) | 0 (0.0%) |
| Educational Services | 0 (0.0%) | 0 (0.0%) |
| Health Care & Social Assistance | 0 (0.0%) | 13 (100.0%) |
| Arts, Entertainment & Recreation | 0 (0.0%) | 0 (0.0%) |
| Accommodation & Food Services | 14 (100.0%) | 0 (0.0%) |
| Public Administration | 0 (0.0%) | 6 (100.0%) |
| Total | 28 (31.8%) | 60 (68.2%) |
Education in Belvoir
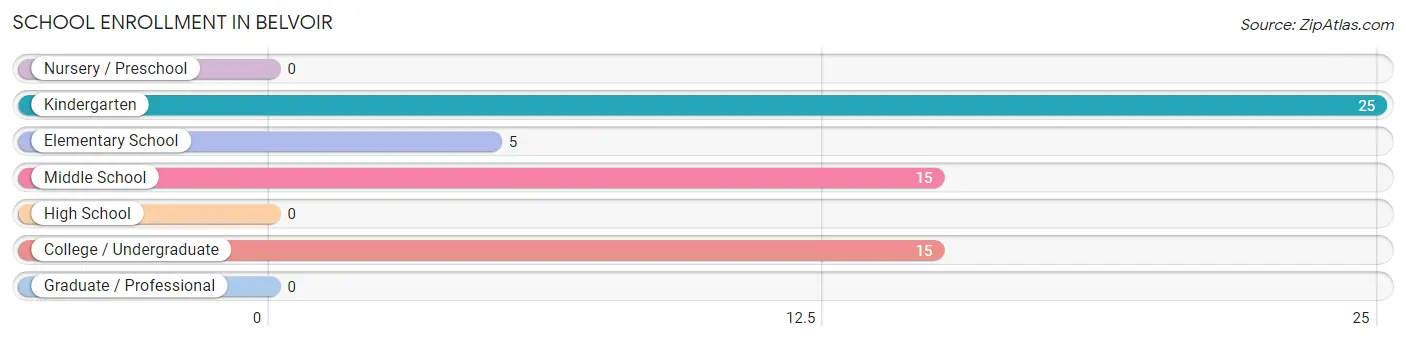
School Enrollment in Belvoir
The most common levels of schooling among the 60 students in Belvoir are kindergarten (25 | 41.7%), middle school (15 | 25.0%), and college / undergraduate (15 | 25.0%).
| School Level | # Students | % Students |
| Nursery / Preschool | 0 | 0.0% |
| Kindergarten | 25 | 41.7% |
| Elementary School | 5 | 8.3% |
| Middle School | 15 | 25.0% |
| High School | 0 | 0.0% |
| College / Undergraduate | 15 | 25.0% |
| Graduate / Professional | 0 | 0.0% |
| Total | 60 | 100.0% |
School Enrollment by Age by Funding Source in Belvoir
Out of a total of 60 students who are enrolled in schools in Belvoir, 9 (15.0%) attend a private institution, while the remaining 51 (85.0%) are enrolled in public schools. The age group of 18 to 19 year olds has the highest likelihood of being enrolled in private schools, with 9 (60.0% in the age bracket) enrolled. Conversely, the age group of 5 to 9 year old has the lowest likelihood of being enrolled in a private school, with 30 (100.0% in the age bracket) attending a public institution.
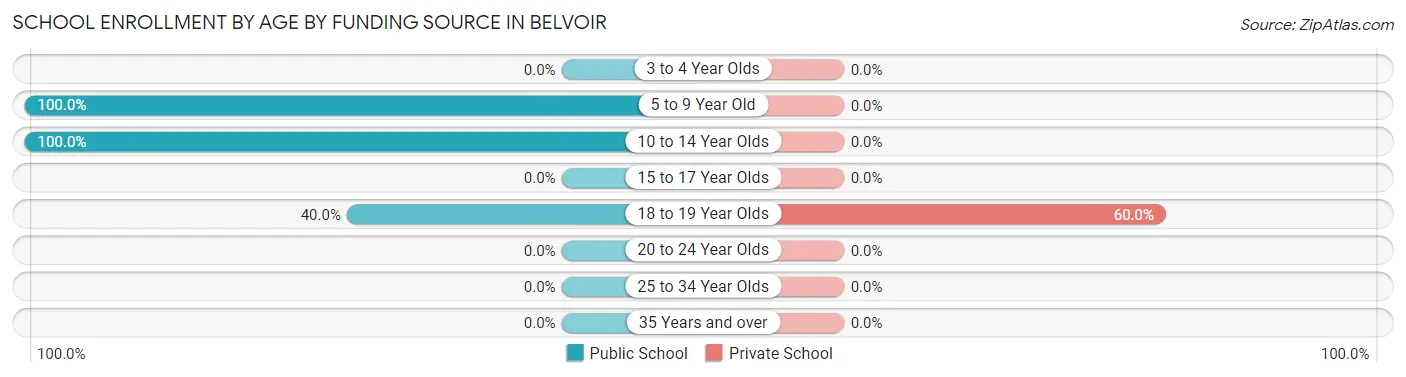
| Age Bracket | Public School | Private School |
| 3 to 4 Year Olds | 0 (0.0%) | 0 (0.0%) |
| 5 to 9 Year Old | 30 (100.0%) | 0 (0.0%) |
| 10 to 14 Year Olds | 15 (100.0%) | 0 (0.0%) |
| 15 to 17 Year Olds | 0 (0.0%) | 0 (0.0%) |
| 18 to 19 Year Olds | 6 (40.0%) | 9 (60.0%) |
| 20 to 24 Year Olds | 0 (0.0%) | 0 (0.0%) |
| 25 to 34 Year Olds | 0 (0.0%) | 0 (0.0%) |
| 35 Years and over | 0 (0.0%) | 0 (0.0%) |
| Total | 51 (85.0%) | 9 (15.0%) |
Educational Attainment by Field of Study in Belvoir
, and science & technology (6 | 100.0%) are the most common fields of study among 6 individuals in Belvoir who have obtained a bachelor's degree or higher.
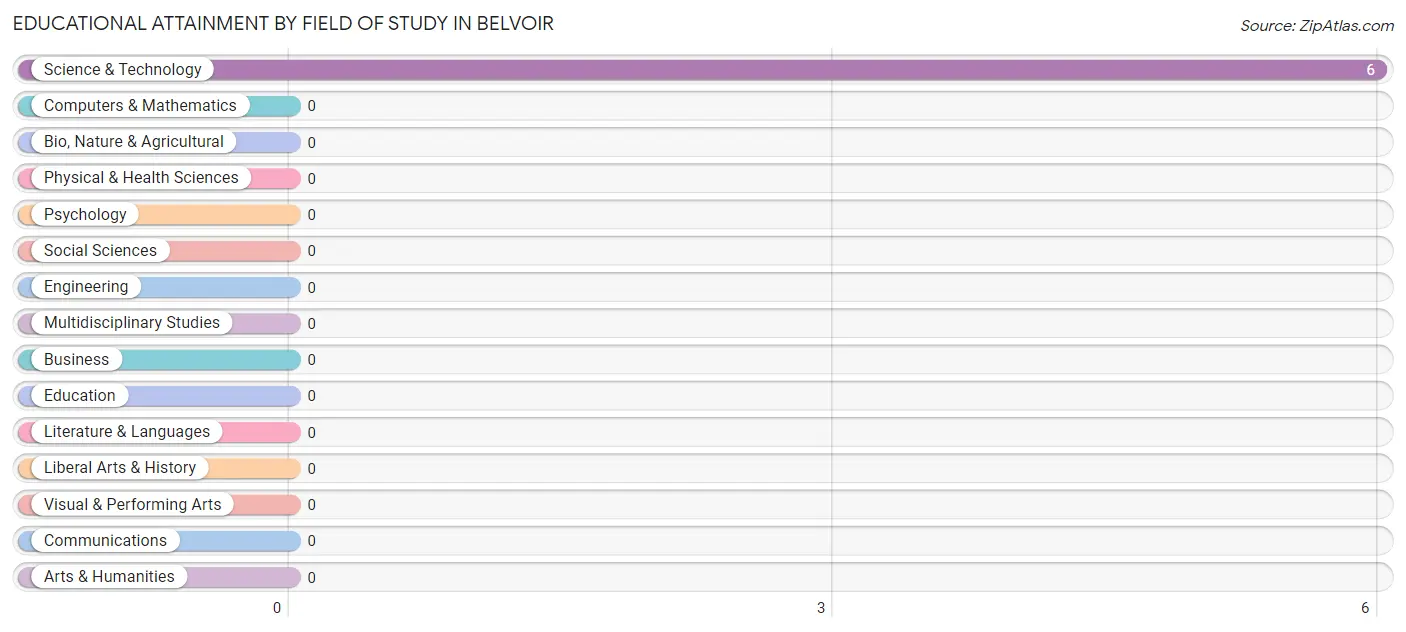
| Field of Study | # Graduates | % Graduates |
| Computers & Mathematics | 0 | 0.0% |
| Bio, Nature & Agricultural | 0 | 0.0% |
| Physical & Health Sciences | 0 | 0.0% |
| Psychology | 0 | 0.0% |
| Social Sciences | 0 | 0.0% |
| Engineering | 0 | 0.0% |
| Multidisciplinary Studies | 0 | 0.0% |
| Science & Technology | 6 | 100.0% |
| Business | 0 | 0.0% |
| Education | 0 | 0.0% |
| Literature & Languages | 0 | 0.0% |
| Liberal Arts & History | 0 | 0.0% |
| Visual & Performing Arts | 0 | 0.0% |
| Communications | 0 | 0.0% |
| Arts & Humanities | 0 | 0.0% |
| Total | 6 | 100.0% |
Transportation & Commute in Belvoir
Vehicle Availability by Sex in Belvoir
The most prevalent vehicle ownership categories in Belvoir are males with 1 vehicle (14, accounting for 50.0%) and females with 1 vehicle (25, making up 25.9%).
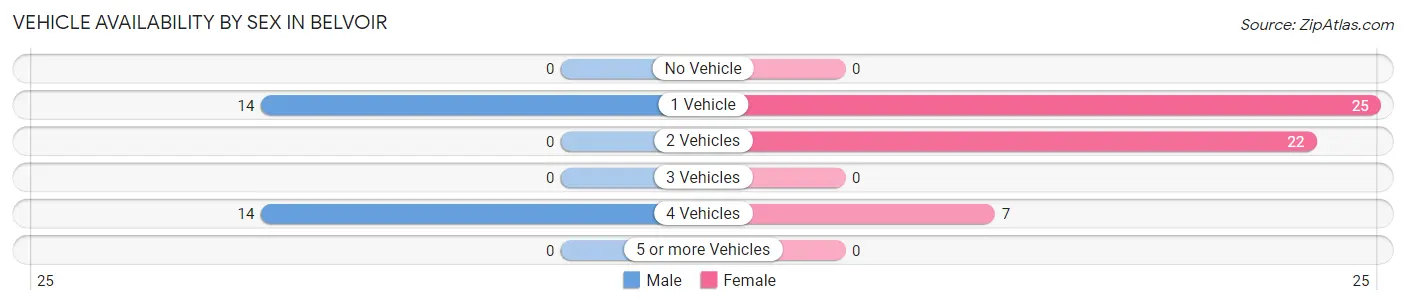
| Vehicles Available | Male | Female |
| No Vehicle | 0 (0.0%) | 0 (0.0%) |
| 1 Vehicle | 14 (50.0%) | 25 (46.3%) |
| 2 Vehicles | 0 (0.0%) | 22 (40.7%) |
| 3 Vehicles | 0 (0.0%) | 0 (0.0%) |
| 4 Vehicles | 14 (50.0%) | 7 (13.0%) |
| 5 or more Vehicles | 0 (0.0%) | 0 (0.0%) |
| Total | 28 (100.0%) | 54 (100.0%) |
Commute Time in Belvoir
The most frequently occuring commute durations in Belvoir are 20 to 24 minutes (36 commuters, 43.9%), 10 to 14 minutes (25 commuters, 30.5%), and 30 to 34 minutes (21 commuters, 25.6%).
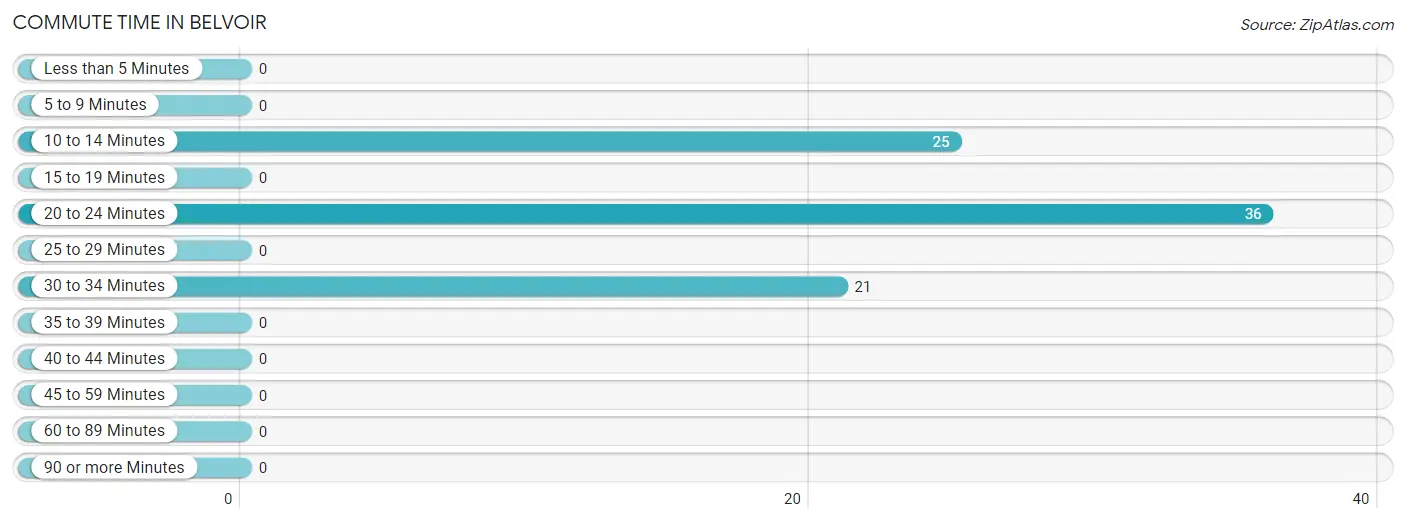
| Commute Time | # Commuters | % Commuters |
| Less than 5 Minutes | 0 | 0.0% |
| 5 to 9 Minutes | 0 | 0.0% |
| 10 to 14 Minutes | 25 | 30.5% |
| 15 to 19 Minutes | 0 | 0.0% |
| 20 to 24 Minutes | 36 | 43.9% |
| 25 to 29 Minutes | 0 | 0.0% |
| 30 to 34 Minutes | 21 | 25.6% |
| 35 to 39 Minutes | 0 | 0.0% |
| 40 to 44 Minutes | 0 | 0.0% |
| 45 to 59 Minutes | 0 | 0.0% |
| 60 to 89 Minutes | 0 | 0.0% |
| 90 or more Minutes | 0 | 0.0% |
Commute Time by Sex in Belvoir
The most common commute times in Belvoir are 20 to 24 minutes (14 commuters, 50.0%) for males and 10 to 14 minutes (25 commuters, 46.3%) for females.
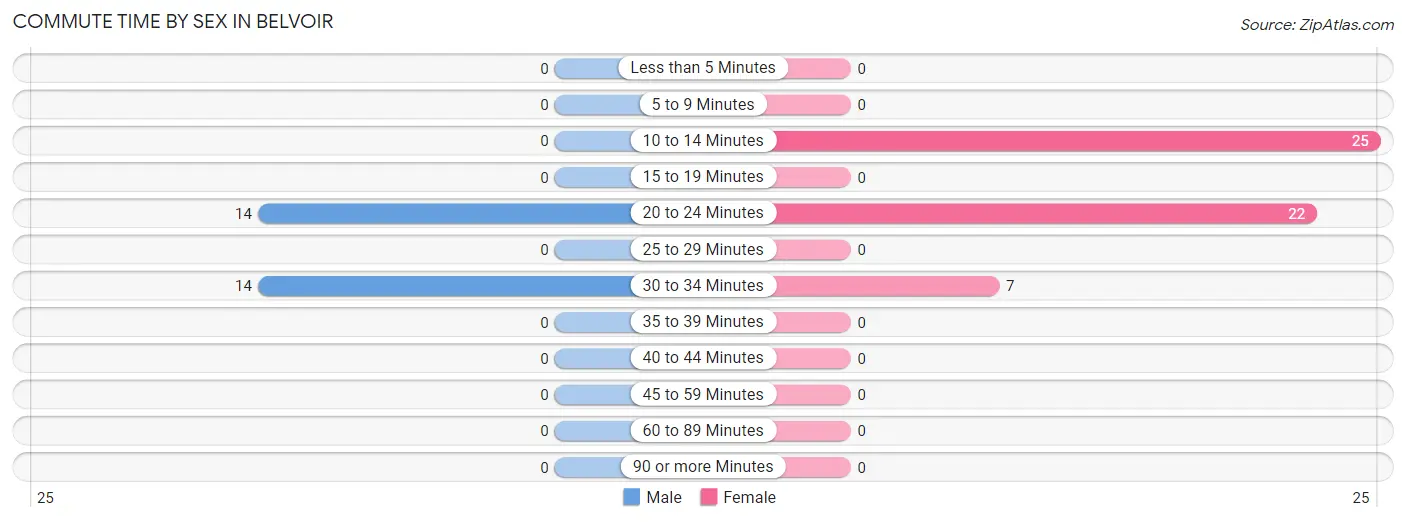
| Commute Time | Male | Female |
| Less than 5 Minutes | 0 (0.0%) | 0 (0.0%) |
| 5 to 9 Minutes | 0 (0.0%) | 0 (0.0%) |
| 10 to 14 Minutes | 0 (0.0%) | 25 (46.3%) |
| 15 to 19 Minutes | 0 (0.0%) | 0 (0.0%) |
| 20 to 24 Minutes | 14 (50.0%) | 22 (40.7%) |
| 25 to 29 Minutes | 0 (0.0%) | 0 (0.0%) |
| 30 to 34 Minutes | 14 (50.0%) | 7 (13.0%) |
| 35 to 39 Minutes | 0 (0.0%) | 0 (0.0%) |
| 40 to 44 Minutes | 0 (0.0%) | 0 (0.0%) |
| 45 to 59 Minutes | 0 (0.0%) | 0 (0.0%) |
| 60 to 89 Minutes | 0 (0.0%) | 0 (0.0%) |
| 90 or more Minutes | 0 (0.0%) | 0 (0.0%) |
Time of Departure to Work by Sex in Belvoir
The most frequent times of departure to work in Belvoir are 6:00 AM to 6:29 AM (14, 50.0%) for males and 12:00 AM to 4:59 AM (25, 46.3%) for females.
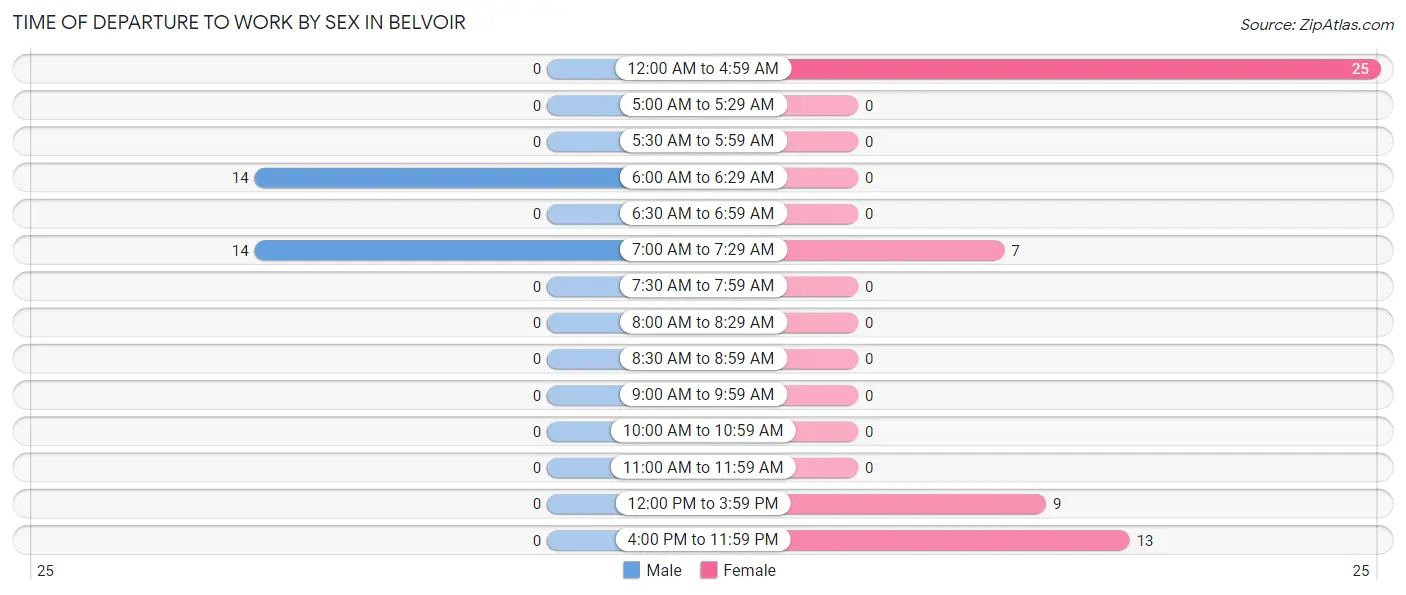
| Time of Departure | Male | Female |
| 12:00 AM to 4:59 AM | 0 (0.0%) | 25 (46.3%) |
| 5:00 AM to 5:29 AM | 0 (0.0%) | 0 (0.0%) |
| 5:30 AM to 5:59 AM | 0 (0.0%) | 0 (0.0%) |
| 6:00 AM to 6:29 AM | 14 (50.0%) | 0 (0.0%) |
| 6:30 AM to 6:59 AM | 0 (0.0%) | 0 (0.0%) |
| 7:00 AM to 7:29 AM | 14 (50.0%) | 7 (13.0%) |
| 7:30 AM to 7:59 AM | 0 (0.0%) | 0 (0.0%) |
| 8:00 AM to 8:29 AM | 0 (0.0%) | 0 (0.0%) |
| 8:30 AM to 8:59 AM | 0 (0.0%) | 0 (0.0%) |
| 9:00 AM to 9:59 AM | 0 (0.0%) | 0 (0.0%) |
| 10:00 AM to 10:59 AM | 0 (0.0%) | 0 (0.0%) |
| 11:00 AM to 11:59 AM | 0 (0.0%) | 0 (0.0%) |
| 12:00 PM to 3:59 PM | 0 (0.0%) | 9 (16.7%) |
| 4:00 PM to 11:59 PM | 0 (0.0%) | 13 (24.1%) |
| Total | 28 (100.0%) | 54 (100.0%) |
Housing Occupancy in Belvoir
Occupancy by Ownership in Belvoir
Of the total 88 dwellings in Belvoir, owner-occupied units account for 29 (33.0%), while renter-occupied units make up 59 (67.0%).
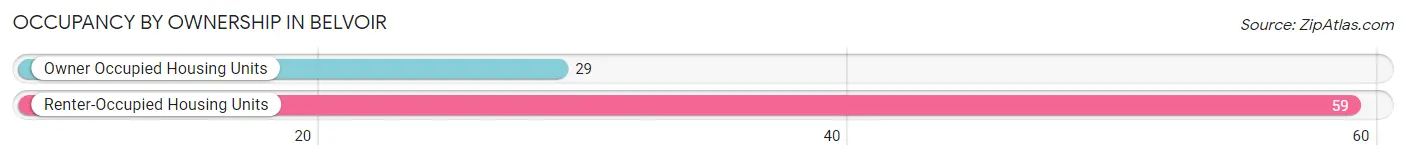
| Occupancy | # Housing Units | % Housing Units |
| Owner Occupied Housing Units | 29 | 33.0% |
| Renter-Occupied Housing Units | 59 | 67.0% |
| Total Occupied Housing Units | 88 | 100.0% |
Occupancy by Household Size in Belvoir
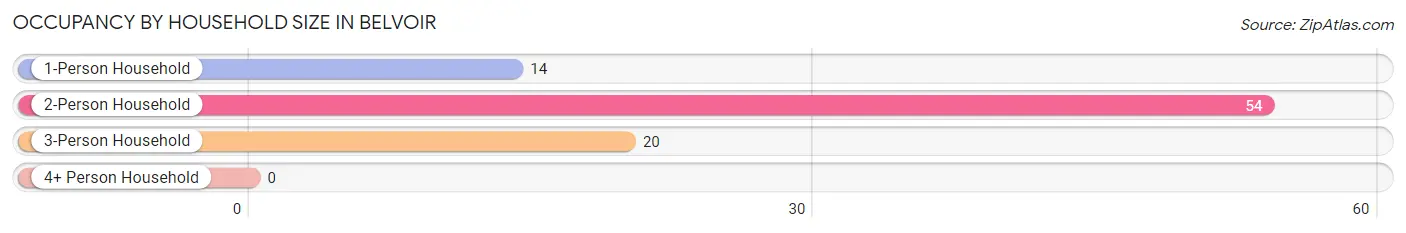
| Household Size | # Housing Units | % Housing Units |
| 1-Person Household | 14 | 15.9% |
| 2-Person Household | 54 | 61.4% |
| 3-Person Household | 20 | 22.7% |
| 4+ Person Household | 0 | 0.0% |
| Total Housing Units | 88 | 100.0% |
Occupancy by Ownership by Household Size in Belvoir
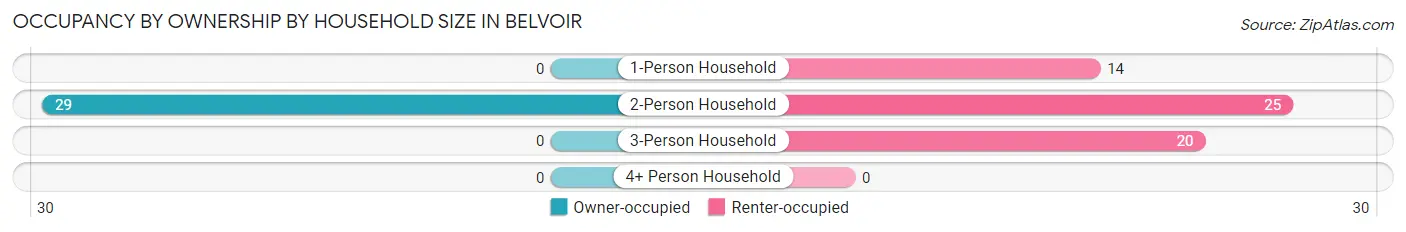
| Household Size | Owner-occupied | Renter-occupied |
| 1-Person Household | 0 (0.0%) | 14 (100.0%) |
| 2-Person Household | 29 (53.7%) | 25 (46.3%) |
| 3-Person Household | 0 (0.0%) | 20 (100.0%) |
| 4+ Person Household | 0 (0.0%) | 0 (0.0%) |
| Total Housing Units | 29 (33.0%) | 59 (67.0%) |
Occupancy by Educational Attainment in Belvoir
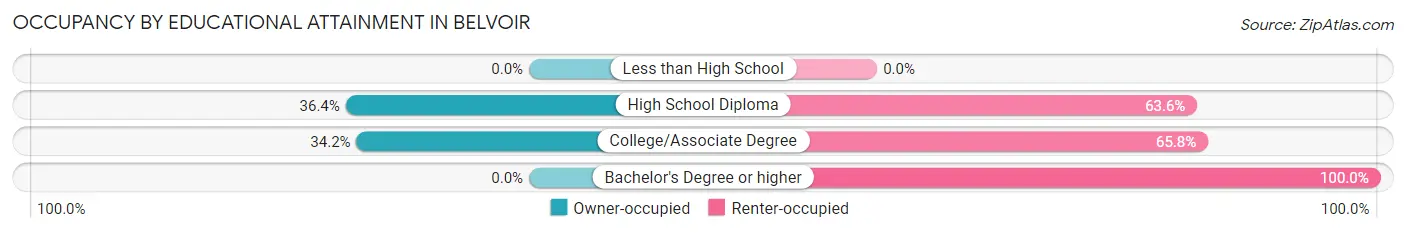
| Household Size | Owner-occupied | Renter-occupied |
| Less than High School | 0 (0.0%) | 0 (0.0%) |
| High School Diploma | 16 (36.4%) | 28 (63.6%) |
| College/Associate Degree | 13 (34.2%) | 25 (65.8%) |
| Bachelor's Degree or higher | 0 (0.0%) | 6 (100.0%) |
Occupancy by Age of Householder in Belvoir
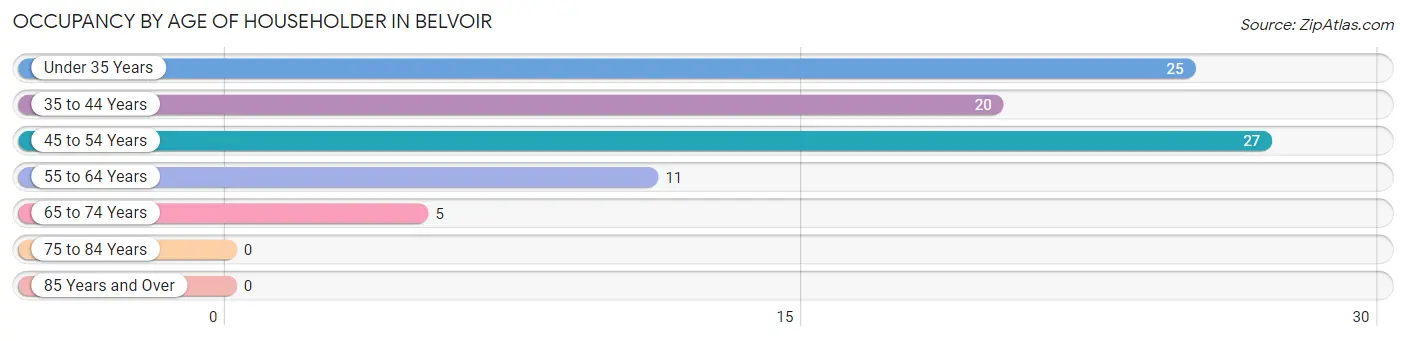
| Age Bracket | # Households | % Households |
| Under 35 Years | 25 | 28.4% |
| 35 to 44 Years | 20 | 22.7% |
| 45 to 54 Years | 27 | 30.7% |
| 55 to 64 Years | 11 | 12.5% |
| 65 to 74 Years | 5 | 5.7% |
| 75 to 84 Years | 0 | 0.0% |
| 85 Years and Over | 0 | 0.0% |
| Total | 88 | 100.0% |
Housing Finances in Belvoir
Median Income by Occupancy in Belvoir
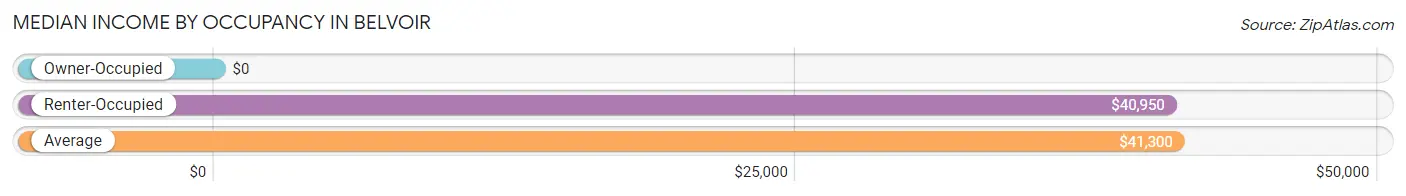
| Occupancy Type | # Households | Median Income |
| Owner-Occupied | 29 (33.0%) | $0 |
| Renter-Occupied | 59 (67.0%) | $40,950 |
| Average | 88 (100.0%) | $41,300 |
Occupancy by Householder Income Bracket in Belvoir
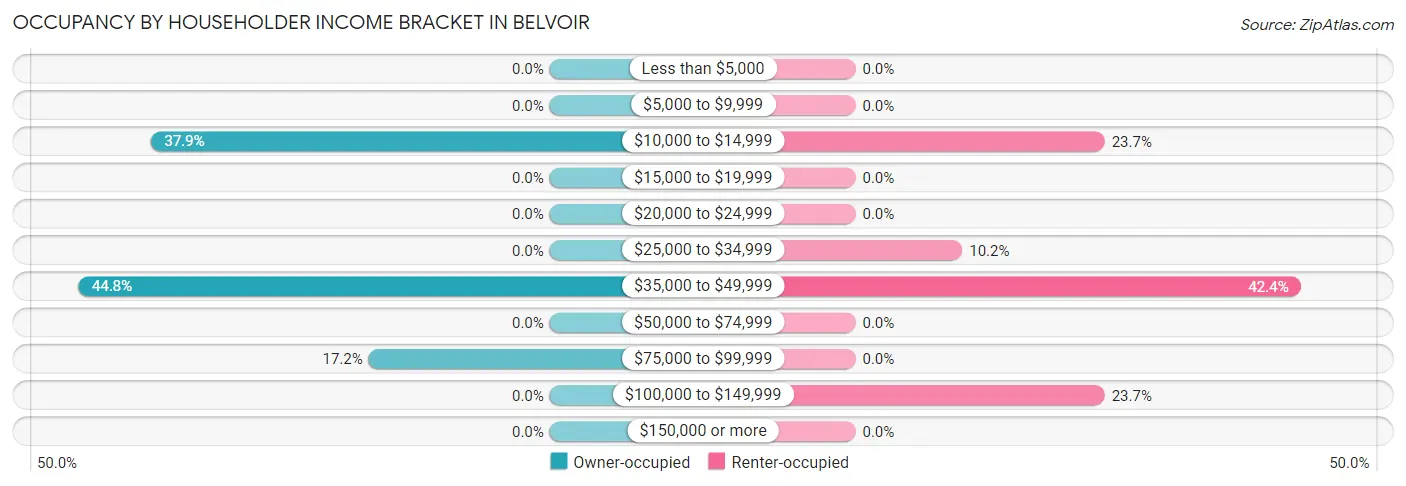
| Income Bracket | Owner-occupied | Renter-occupied |
| Less than $5,000 | 0 (0.0%) | 0 (0.0%) |
| $5,000 to $9,999 | 0 (0.0%) | 0 (0.0%) |
| $10,000 to $14,999 | 11 (37.9%) | 14 (23.7%) |
| $15,000 to $19,999 | 0 (0.0%) | 0 (0.0%) |
| $20,000 to $24,999 | 0 (0.0%) | 0 (0.0%) |
| $25,000 to $34,999 | 0 (0.0%) | 6 (10.2%) |
| $35,000 to $49,999 | 13 (44.8%) | 25 (42.4%) |
| $50,000 to $74,999 | 0 (0.0%) | 0 (0.0%) |
| $75,000 to $99,999 | 5 (17.2%) | 0 (0.0%) |
| $100,000 to $149,999 | 0 (0.0%) | 14 (23.7%) |
| $150,000 or more | 0 (0.0%) | 0 (0.0%) |
| Total | 29 (100.0%) | 59 (100.0%) |
Monthly Housing Cost Tiers in Belvoir
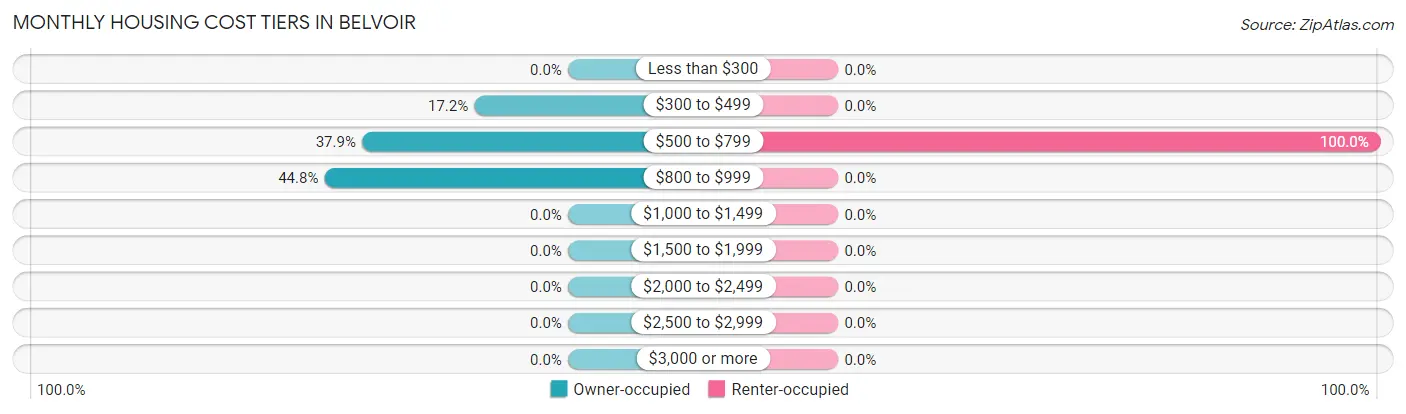
| Monthly Cost | Owner-occupied | Renter-occupied |
| Less than $300 | 0 (0.0%) | 0 (0.0%) |
| $300 to $499 | 5 (17.2%) | 0 (0.0%) |
| $500 to $799 | 11 (37.9%) | 59 (100.0%) |
| $800 to $999 | 13 (44.8%) | 0 (0.0%) |
| $1,000 to $1,499 | 0 (0.0%) | 0 (0.0%) |
| $1,500 to $1,999 | 0 (0.0%) | 0 (0.0%) |
| $2,000 to $2,499 | 0 (0.0%) | 0 (0.0%) |
| $2,500 to $2,999 | 0 (0.0%) | 0 (0.0%) |
| $3,000 or more | 0 (0.0%) | 0 (0.0%) |
| Total | 29 (100.0%) | 59 (100.0%) |
Physical Housing Characteristics in Belvoir
Housing Structures in Belvoir
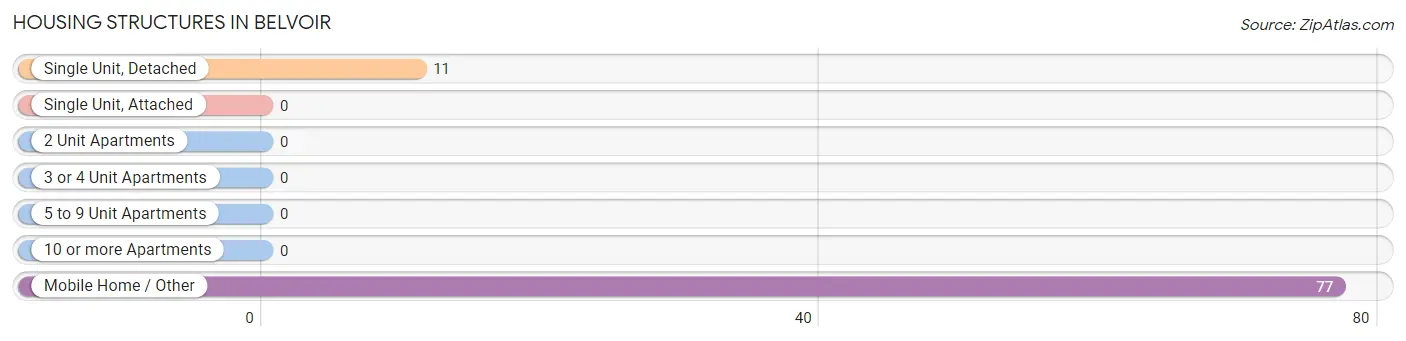
| Structure Type | # Housing Units | % Housing Units |
| Single Unit, Detached | 11 | 12.5% |
| Single Unit, Attached | 0 | 0.0% |
| 2 Unit Apartments | 0 | 0.0% |
| 3 or 4 Unit Apartments | 0 | 0.0% |
| 5 to 9 Unit Apartments | 0 | 0.0% |
| 10 or more Apartments | 0 | 0.0% |
| Mobile Home / Other | 77 | 87.5% |
| Total | 88 | 100.0% |
Housing Structures by Occupancy in Belvoir
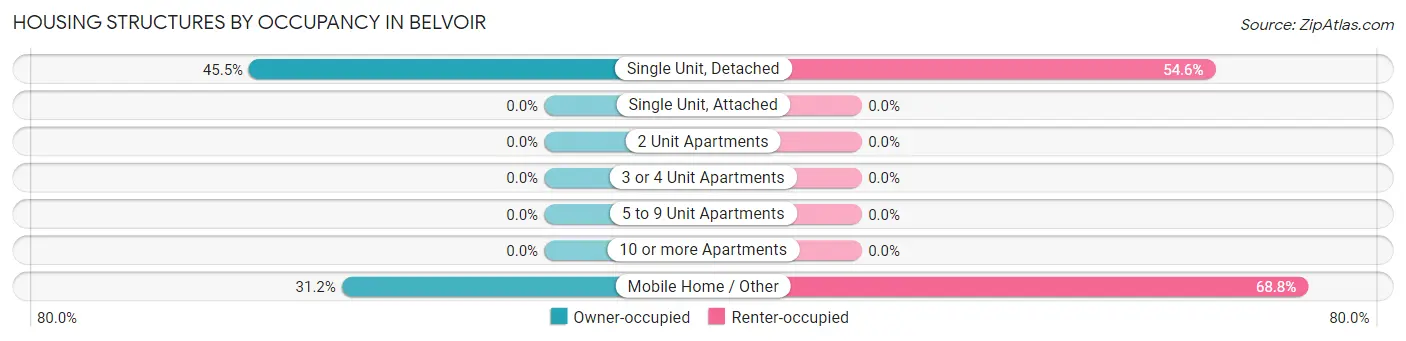
| Structure Type | Owner-occupied | Renter-occupied |
| Single Unit, Detached | 5 (45.5%) | 6 (54.5%) |
| Single Unit, Attached | 0 (0.0%) | 0 (0.0%) |
| 2 Unit Apartments | 0 (0.0%) | 0 (0.0%) |
| 3 or 4 Unit Apartments | 0 (0.0%) | 0 (0.0%) |
| 5 to 9 Unit Apartments | 0 (0.0%) | 0 (0.0%) |
| 10 or more Apartments | 0 (0.0%) | 0 (0.0%) |
| Mobile Home / Other | 24 (31.2%) | 53 (68.8%) |
| Total | 29 (33.0%) | 59 (67.0%) |
Housing Structures by Number of Rooms in Belvoir
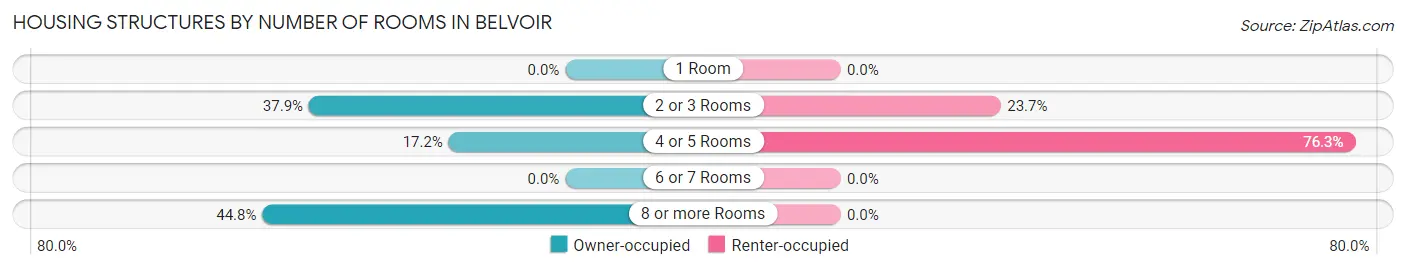
| Number of Rooms | Owner-occupied | Renter-occupied |
| 1 Room | 0 (0.0%) | 0 (0.0%) |
| 2 or 3 Rooms | 11 (37.9%) | 14 (23.7%) |
| 4 or 5 Rooms | 5 (17.2%) | 45 (76.3%) |
| 6 or 7 Rooms | 0 (0.0%) | 0 (0.0%) |
| 8 or more Rooms | 13 (44.8%) | 0 (0.0%) |
| Total | 29 (100.0%) | 59 (100.0%) |
Housing Structure by Heating Type in Belvoir
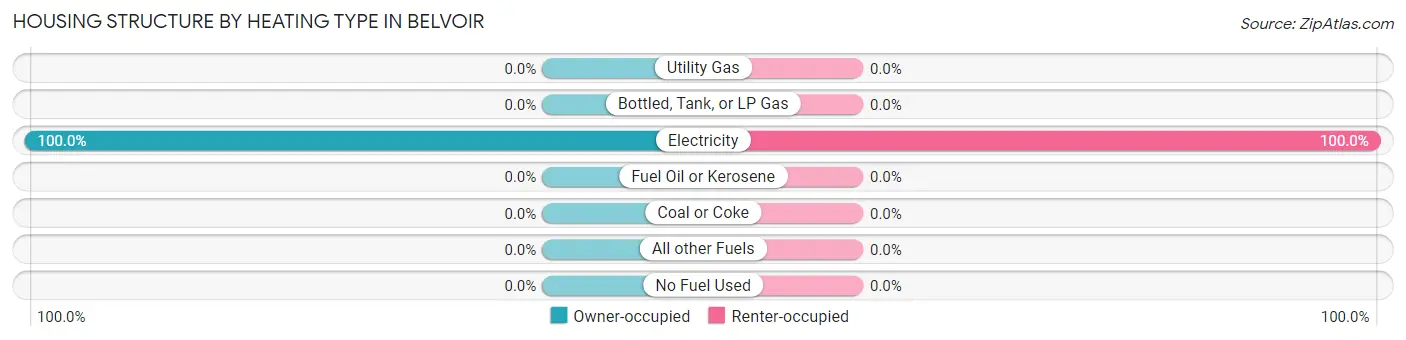
| Heating Type | Owner-occupied | Renter-occupied |
| Utility Gas | 0 (0.0%) | 0 (0.0%) |
| Bottled, Tank, or LP Gas | 0 (0.0%) | 0 (0.0%) |
| Electricity | 29 (100.0%) | 59 (100.0%) |
| Fuel Oil or Kerosene | 0 (0.0%) | 0 (0.0%) |
| Coal or Coke | 0 (0.0%) | 0 (0.0%) |
| All other Fuels | 0 (0.0%) | 0 (0.0%) |
| No Fuel Used | 0 (0.0%) | 0 (0.0%) |
| Total | 29 (100.0%) | 59 (100.0%) |
Household Vehicle Usage in Belvoir
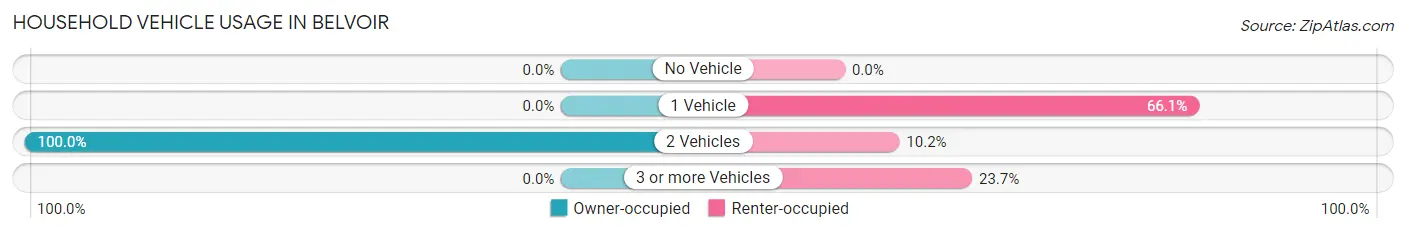
| Vehicles per Household | Owner-occupied | Renter-occupied |
| No Vehicle | 0 (0.0%) | 0 (0.0%) |
| 1 Vehicle | 0 (0.0%) | 39 (66.1%) |
| 2 Vehicles | 29 (100.0%) | 6 (10.2%) |
| 3 or more Vehicles | 0 (0.0%) | 14 (23.7%) |
| Total | 29 (100.0%) | 59 (100.0%) |
Real Estate & Mortgages in Belvoir
Real Estate and Mortgage Overview in Belvoir
| Characteristic | Without Mortgage | With Mortgage |
| Housing Units | 5 | 24 |
| Median Property Value | - | - |
| Median Household Income | - | - |
| Monthly Housing Costs | - | - |
| Real Estate Taxes | - | - |
Property Value by Mortgage Status in Belvoir
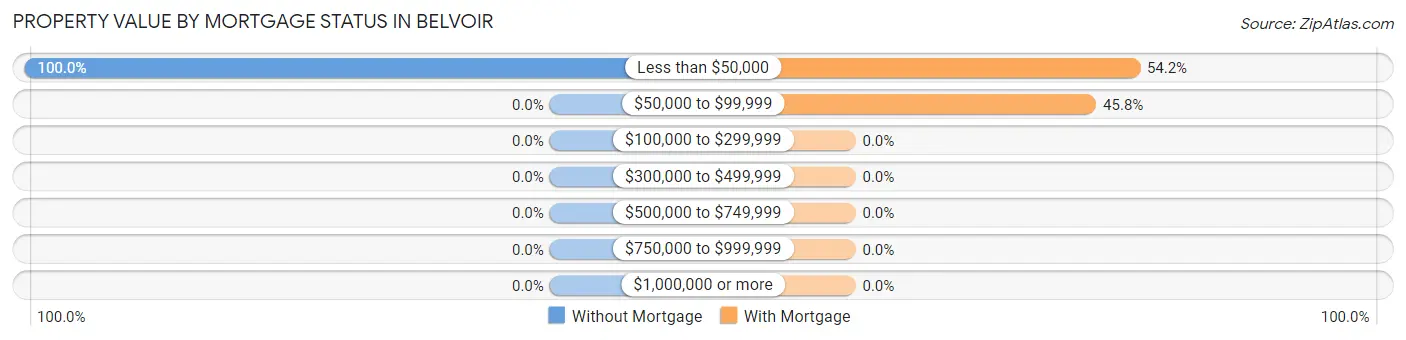
| Property Value | Without Mortgage | With Mortgage |
| Less than $50,000 | 5 (100.0%) | 13 (54.2%) |
| $50,000 to $99,999 | 0 (0.0%) | 11 (45.8%) |
| $100,000 to $299,999 | 0 (0.0%) | 0 (0.0%) |
| $300,000 to $499,999 | 0 (0.0%) | 0 (0.0%) |
| $500,000 to $749,999 | 0 (0.0%) | 0 (0.0%) |
| $750,000 to $999,999 | 0 (0.0%) | 0 (0.0%) |
| $1,000,000 or more | 0 (0.0%) | 0 (0.0%) |
| Total | 5 (100.0%) | 24 (100.0%) |
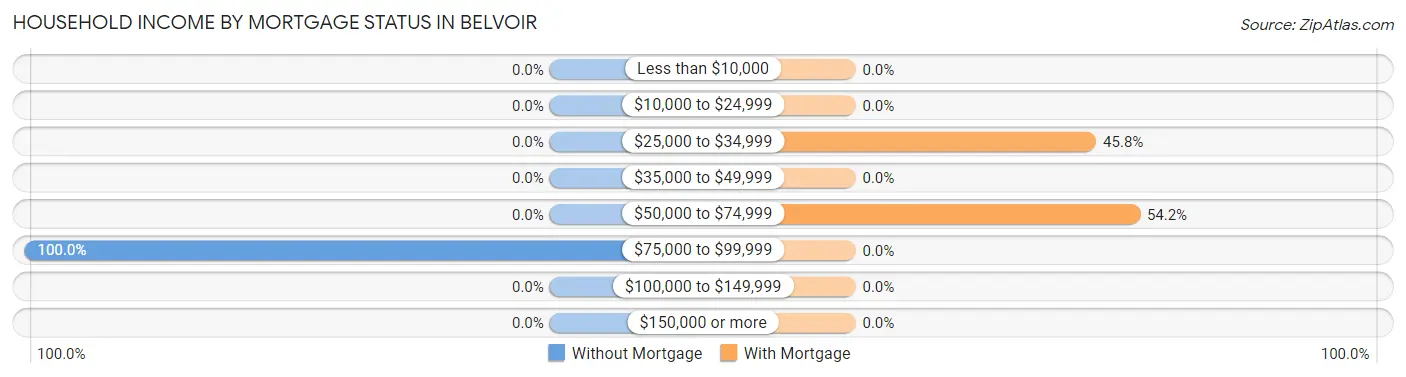
Household Income by Mortgage Status in Belvoir
| Household Income | Without Mortgage | With Mortgage |
| Less than $10,000 | 0 (0.0%) | 0 (0.0%) |
| $10,000 to $24,999 | 0 (0.0%) | 0 (0.0%) |
| $25,000 to $34,999 | 0 (0.0%) | 11 (45.8%) |
| $35,000 to $49,999 | 0 (0.0%) | 0 (0.0%) |
| $50,000 to $74,999 | 0 (0.0%) | 13 (54.2%) |
| $75,000 to $99,999 | 5 (100.0%) | 0 (0.0%) |
| $100,000 to $149,999 | 0 (0.0%) | 0 (0.0%) |
| $150,000 or more | 0 (0.0%) | 0 (0.0%) |
| Total | 5 (100.0%) | 24 (100.0%) |
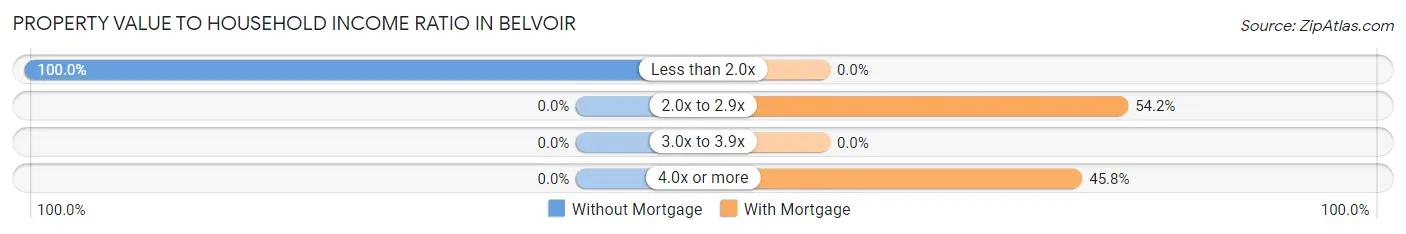
Property Value to Household Income Ratio in Belvoir
| Value-to-Income Ratio | Without Mortgage | With Mortgage |
| Less than 2.0x | 5 (100.0%) | 0 (0.0%) |
| 2.0x to 2.9x | 0 (0.0%) | 13 (54.2%) |
| 3.0x to 3.9x | 0 (0.0%) | 0 (0.0%) |
| 4.0x or more | 0 (0.0%) | 11 (45.8%) |
| Total | 5 (100.0%) | 24 (100.0%) |
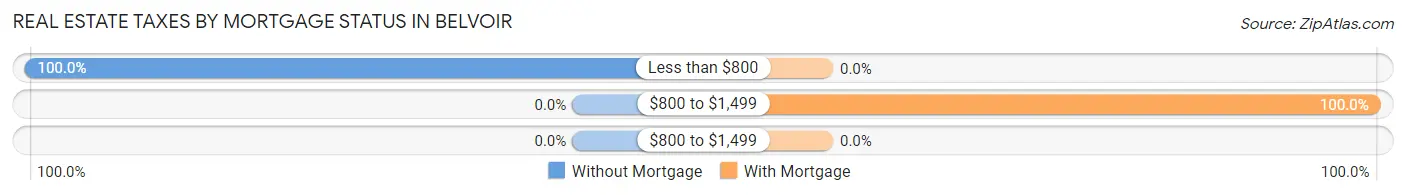
Real Estate Taxes by Mortgage Status in Belvoir
| Property Taxes | Without Mortgage | With Mortgage |
| Less than $800 | 5 (100.0%) | 0 (0.0%) |
| $800 to $1,499 | 0 (0.0%) | 24 (100.0%) |
| $800 to $1,499 | 0 (0.0%) | 0 (0.0%) |
| Total | 5 (100.0%) | 24 (100.0%) |
Health & Disability in Belvoir
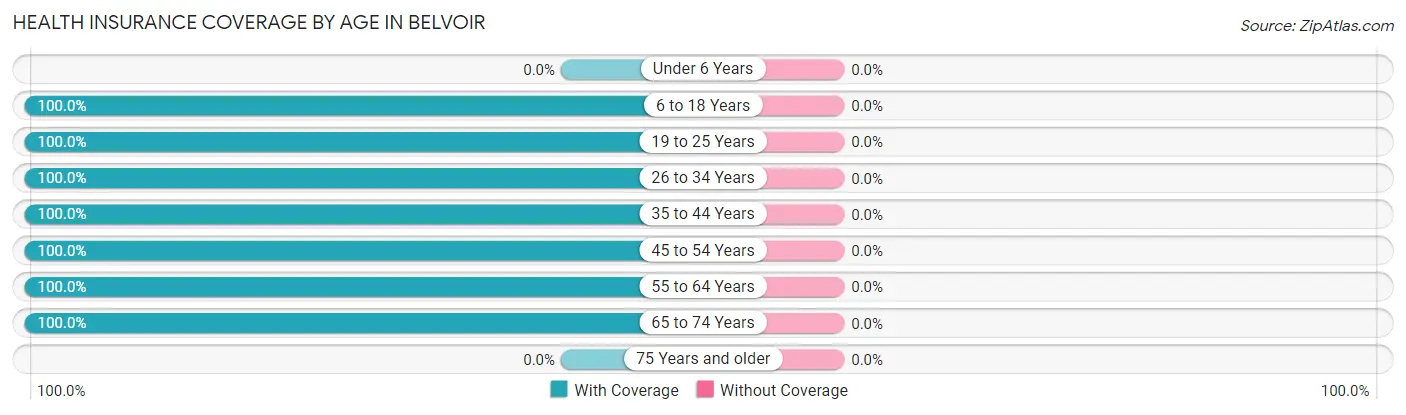
Health Insurance Coverage by Age in Belvoir
| Age Bracket | With Coverage | Without Coverage |
| Under 6 Years | 0 (0.0%) | 0 (0.0%) |
| 6 to 18 Years | 51 (100.0%) | 0 (0.0%) |
| 19 to 25 Years | 9 (100.0%) | 0 (0.0%) |
| 26 to 34 Years | 32 (100.0%) | 0 (0.0%) |
| 35 to 44 Years | 20 (100.0%) | 0 (0.0%) |
| 45 to 54 Years | 27 (100.0%) | 0 (0.0%) |
| 55 to 64 Years | 11 (100.0%) | 0 (0.0%) |
| 65 to 74 Years | 19 (100.0%) | 0 (0.0%) |
| 75 Years and older | 0 (0.0%) | 0 (0.0%) |
| Total | 169 (100.0%) | 0 (0.0%) |
Health Insurance Coverage by Citizenship Status in Belvoir
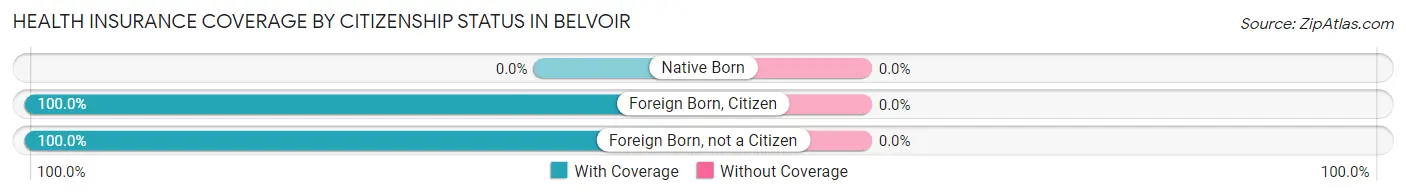
| Citizenship Status | With Coverage | Without Coverage |
| Native Born | 0 (0.0%) | 0 (0.0%) |
| Foreign Born, Citizen | 51 (100.0%) | 0 (0.0%) |
| Foreign Born, not a Citizen | 9 (100.0%) | 0 (0.0%) |
Health Insurance Coverage by Household Income in Belvoir
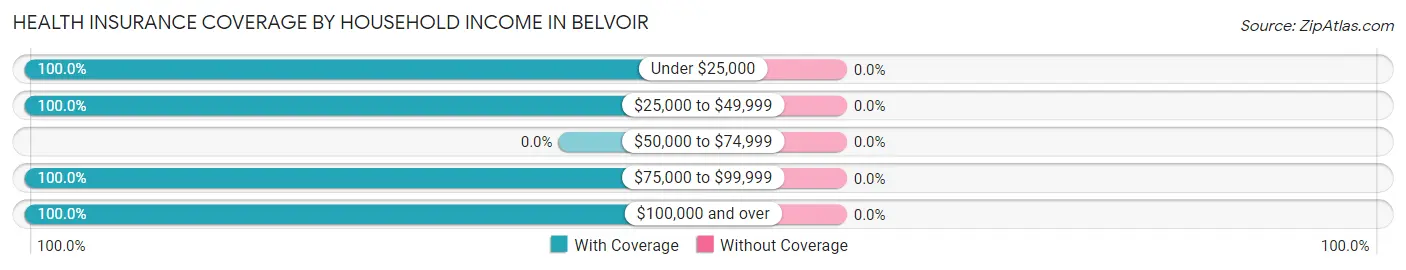
| Household Income | With Coverage | Without Coverage |
| Under $25,000 | 34 (100.0%) | 0 (0.0%) |
| $25,000 to $49,999 | 89 (100.0%) | 0 (0.0%) |
| $50,000 to $74,999 | 0 (0.0%) | 0 (0.0%) |
| $75,000 to $99,999 | 10 (100.0%) | 0 (0.0%) |
| $100,000 and over | 36 (100.0%) | 0 (0.0%) |
Public vs Private Health Insurance Coverage by Age in Belvoir
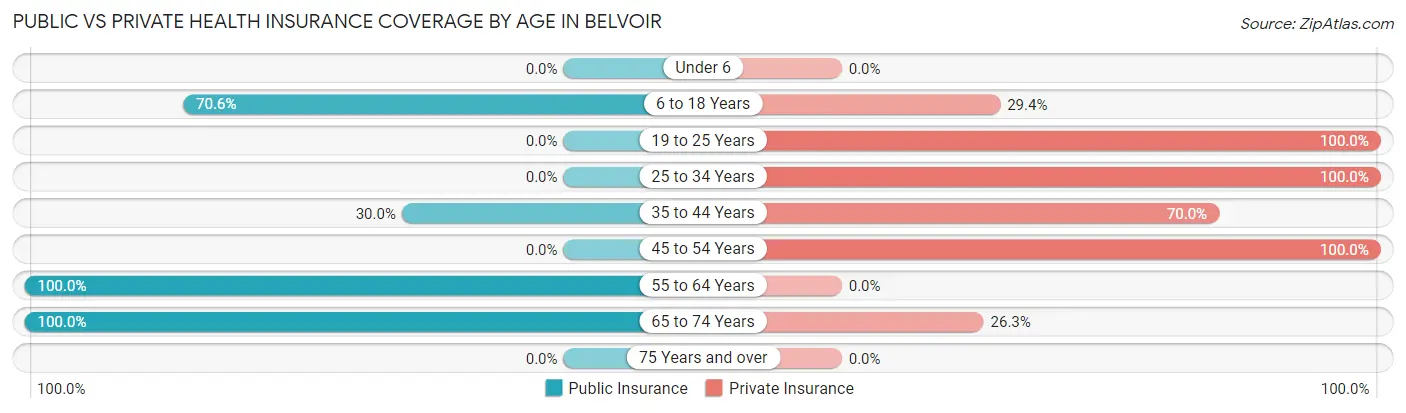
| Age Bracket | Public Insurance | Private Insurance |
| Under 6 | 0 (0.0%) | 0 (0.0%) |
| 6 to 18 Years | 36 (70.6%) | 15 (29.4%) |
| 19 to 25 Years | 0 (0.0%) | 9 (100.0%) |
| 25 to 34 Years | 0 (0.0%) | 32 (100.0%) |
| 35 to 44 Years | 6 (30.0%) | 14 (70.0%) |
| 45 to 54 Years | 0 (0.0%) | 27 (100.0%) |
| 55 to 64 Years | 11 (100.0%) | 0 (0.0%) |
| 65 to 74 Years | 19 (100.0%) | 5 (26.3%) |
| 75 Years and over | 0 (0.0%) | 0 (0.0%) |
| Total | 72 (42.6%) | 102 (60.4%) |
Disability Status by Sex by Age in Belvoir
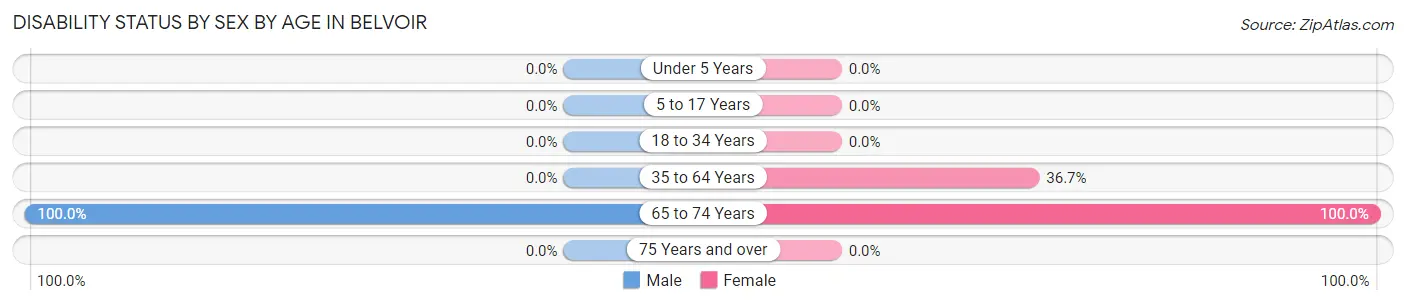
| Age Bracket | Male | Female |
| Under 5 Years | 0 (0.0%) | 0 (0.0%) |
| 5 to 17 Years | 0 (0.0%) | 0 (0.0%) |
| 18 to 34 Years | 0 (0.0%) | 0 (0.0%) |
| 35 to 64 Years | 0 (0.0%) | 11 (36.7%) |
| 65 to 74 Years | 14 (100.0%) | 5 (100.0%) |
| 75 Years and over | 0 (0.0%) | 0 (0.0%) |
Disability Class by Sex by Age in Belvoir
Disability Class: Hearing Difficulty
| Age Bracket | Male | Female |
| Under 5 Years | 0 (0.0%) | 0 (0.0%) |
| 5 to 17 Years | 0 (0.0%) | 0 (0.0%) |
| 18 to 34 Years | 0 (0.0%) | 0 (0.0%) |
| 35 to 64 Years | 0 (0.0%) | 0 (0.0%) |
| 65 to 74 Years | 0 (0.0%) | 0 (0.0%) |
| 75 Years and over | 0 (0.0%) | 0 (0.0%) |
Disability Class: Vision Difficulty
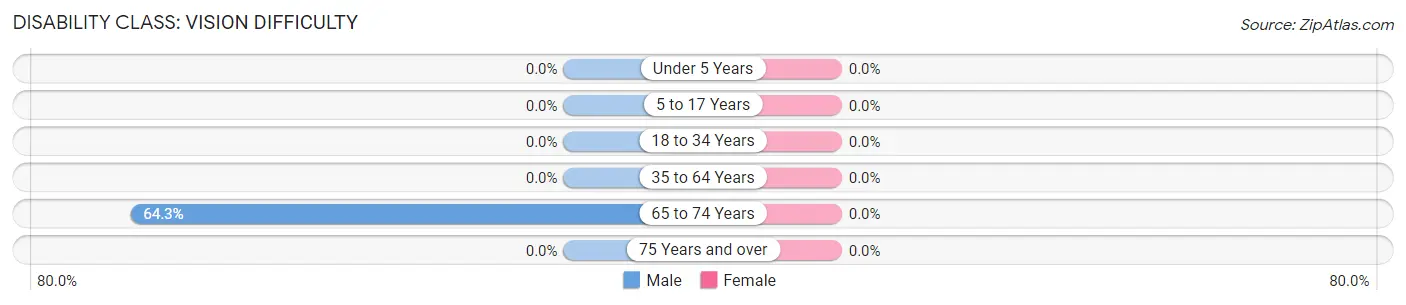
| Age Bracket | Male | Female |
| Under 5 Years | 0 (0.0%) | 0 (0.0%) |
| 5 to 17 Years | 0 (0.0%) | 0 (0.0%) |
| 18 to 34 Years | 0 (0.0%) | 0 (0.0%) |
| 35 to 64 Years | 0 (0.0%) | 0 (0.0%) |
| 65 to 74 Years | 9 (64.3%) | 0 (0.0%) |
| 75 Years and over | 0 (0.0%) | 0 (0.0%) |
Disability Class: Cognitive Difficulty
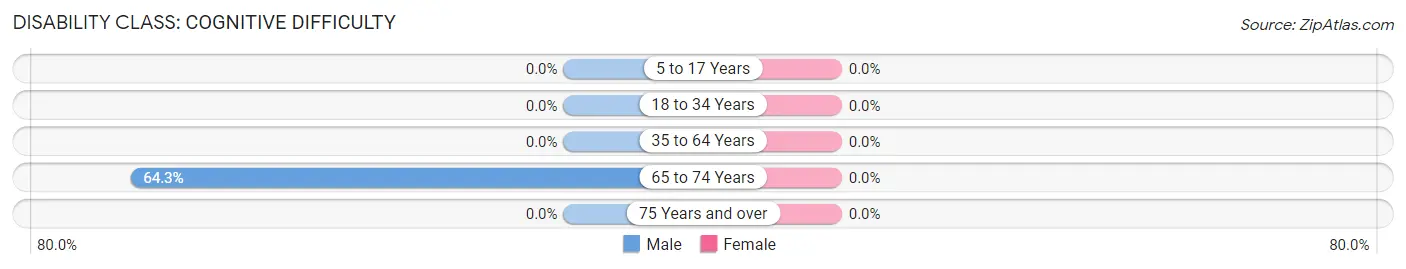
| Age Bracket | Male | Female |
| 5 to 17 Years | 0 (0.0%) | 0 (0.0%) |
| 18 to 34 Years | 0 (0.0%) | 0 (0.0%) |
| 35 to 64 Years | 0 (0.0%) | 0 (0.0%) |
| 65 to 74 Years | 9 (64.3%) | 0 (0.0%) |
| 75 Years and over | 0 (0.0%) | 0 (0.0%) |
Disability Class: Ambulatory Difficulty
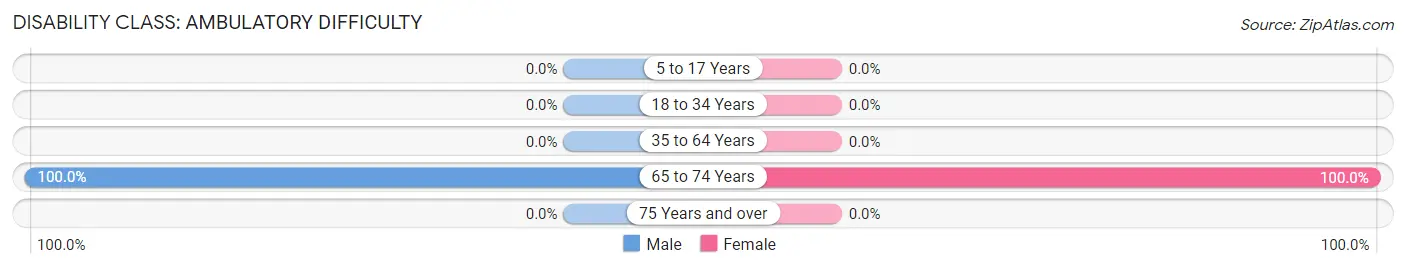
| Age Bracket | Male | Female |
| 5 to 17 Years | 0 (0.0%) | 0 (0.0%) |
| 18 to 34 Years | 0 (0.0%) | 0 (0.0%) |
| 35 to 64 Years | 0 (0.0%) | 0 (0.0%) |
| 65 to 74 Years | 14 (100.0%) | 5 (100.0%) |
| 75 Years and over | 0 (0.0%) | 0 (0.0%) |
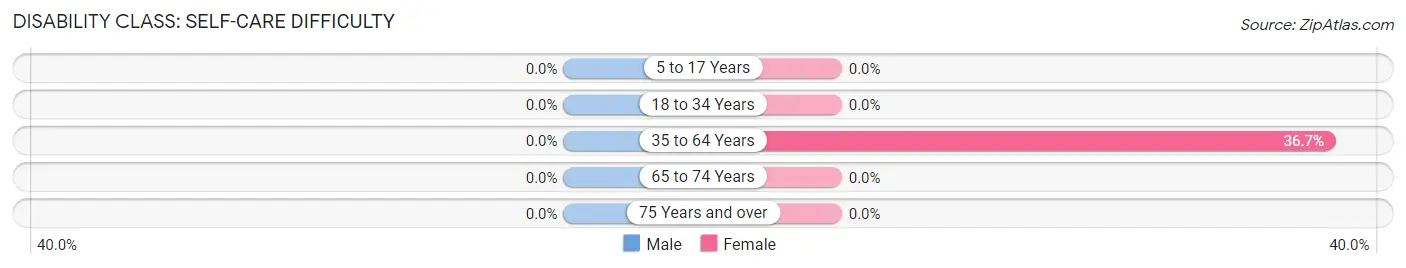
Disability Class: Self-Care Difficulty
| Age Bracket | Male | Female |
| 5 to 17 Years | 0 (0.0%) | 0 (0.0%) |
| 18 to 34 Years | 0 (0.0%) | 0 (0.0%) |
| 35 to 64 Years | 0 (0.0%) | 11 (36.7%) |
| 65 to 74 Years | 0 (0.0%) | 0 (0.0%) |
| 75 Years and over | 0 (0.0%) | 0 (0.0%) |
Technology Access in Belvoir
Computing Device Access in Belvoir
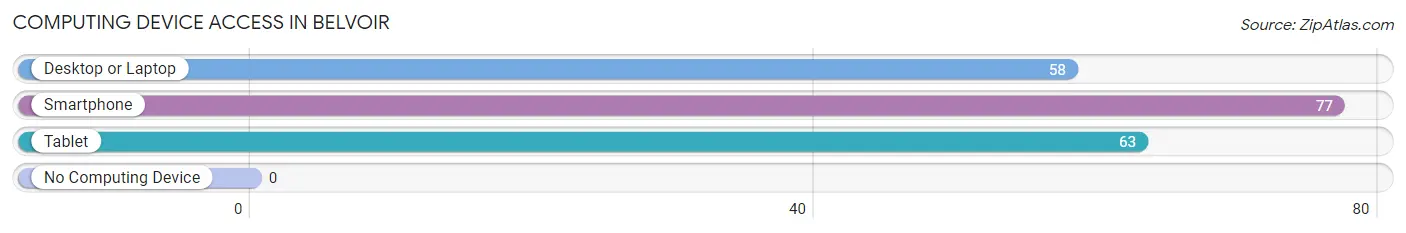
| Device Type | # Households | % Households |
| Desktop or Laptop | 58 | 65.9% |
| Smartphone | 77 | 87.5% |
| Tablet | 63 | 71.6% |
| No Computing Device | 0 | 0.0% |
| Total | 88 | 100.0% |
Internet Access in Belvoir
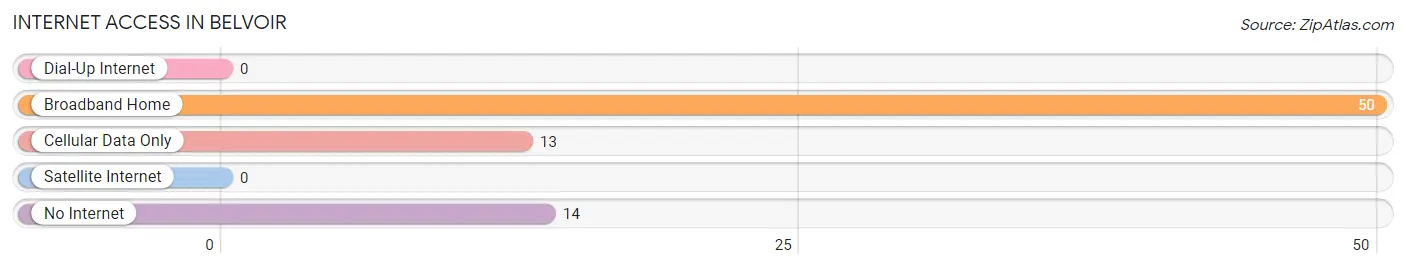
| Internet Type | # Households | % Households |
| Dial-Up Internet | 0 | 0.0% |
| Broadband Home | 50 | 56.8% |
| Cellular Data Only | 13 | 14.8% |
| Satellite Internet | 0 | 0.0% |
| No Internet | 14 | 15.9% |
| Total | 88 | 100.0% |
Belvoir Summary
Belvoir is a small unincorporated community located in Craven County, North Carolina. It is situated on the Neuse River, approximately 20 miles east of New Bern. Belvoir is a rural community with a population of approximately 500 people.
History
Belvoir was first settled in the late 1700s by a group of settlers from Scotland. The settlement was originally known as “Belvoir Plantation” and was owned by the Bell family. The Bells were a prominent family in the area and were involved in the local politics and economy. The plantation was a large agricultural operation and was the main source of income for the Bells.
In the early 1800s, the plantation was sold to the Craven County government and the land was divided into smaller parcels. The area was then developed into a small community and the name was changed to Belvoir.
The community grew slowly over the years and by the mid-1900s, Belvoir had become a small rural community. The population remained relatively stable until the late 1990s when the population began to decline.
Geography
Belvoir is located in Craven County, North Carolina. It is situated on the Neuse River, approximately 20 miles east of New Bern. The community is surrounded by rural farmland and is located in a predominantly rural area.
The climate in Belvoir is humid subtropical, with hot, humid summers and mild winters. The average annual temperature is around 70 degrees Fahrenheit. The average annual precipitation is around 50 inches.
Economy
The economy of Belvoir is largely based on agriculture. The area is home to several farms and agricultural businesses. The main crops grown in the area are corn, soybeans, and cotton.
In addition to agriculture, Belvoir is home to several small businesses. These businesses include a convenience store, a gas station, a restaurant, and a few other small businesses.
Demographics
As of the 2010 census, the population of Belvoir was 498. The racial makeup of the community was 94.4% White, 3.2% African American, 0.2% Native American, 0.2% Asian, and 1.8% from other races.
The median household income in Belvoir was $35,625, and the median family income was $41,250. The per capita income was $17,845. Approximately 15.3% of the population was below the poverty line.
Belvoir is a small rural community with a population of approximately 500 people. The economy is largely based on agriculture and small businesses. The population is predominantly White, with a small percentage of African Americans and other races. The median household income is slightly below the national average.
Common Questions
What is Per Capita Income in Belvoir?
Per Capita income in Belvoir is $22,404.
What is the Median Family Income in Belvoir?
Median Family Income in Belvoir is $42,000.
What is the Median Household income in Belvoir?
Median Household Income in Belvoir is $41,300.
What is Inequality or Gini Index in Belvoir?
Inequality or Gini Index in Belvoir is 0.36.
What is the Total Population of Belvoir?
Total Population of Belvoir is 169.
What is the Total Male Population of Belvoir?
Total Male Population of Belvoir is 63.
What is the Total Female Population of Belvoir?
Total Female Population of Belvoir is 106.
What is the Ratio of Males per 100 Females in Belvoir?
There are 59.43 Males per 100 Females in Belvoir.
What is the Ratio of Females per 100 Males in Belvoir?
There are 168.25 Females per 100 Males in Belvoir.
What is the Median Population Age in Belvoir?
Median Population Age in Belvoir is 31.0 Years.
What is the Average Family Size in Belvoir
Average Family Size in Belvoir is 2.1 People.
What is the Average Household Size in Belvoir
Average Household Size in Belvoir is 1.9 People.
How Large is the Labor Force in Belvoir?
There are 88 People in the Labor Forcein in Belvoir.
What is the Percentage of People in the Labor Force in Belvoir?
71.0% of People are in the Labor Force in Belvoir.