Engelhard, NC Map & Demographics
Engelhard Map
Engelhard Overview
$17,089
PER CAPITA INCOME
$50,675
AVG FAMILY INCOME
$35,192
AVG HOUSEHOLD INCOME
0.20
INEQUALITY / GINI INDEX
254
TOTAL POPULATION
124
MALE POPULATION
130
FEMALE POPULATION
95.38
MALES / 100 FEMALES
104.84
FEMALES / 100 MALES
62.9
MEDIAN AGE
2.0
AVG FAMILY SIZE
2.0
AVG HOUSEHOLD SIZE
125
LABOR FORCE [ PEOPLE ]
49.2%
PERCENT IN LABOR FORCE
Engelhard Zip Codes
Engelhard Area Codes
Income in Engelhard
Income Overview in Engelhard
Per Capita Income in Engelhard is $17,089, while median incomes of families and households are $50,675 and $35,192 respectively.
| Characteristic | Number | Measure |
| Per Capita Income | 254 | $17,089 |
| Median Family Income | 73 | $50,675 |
| Mean Family Income | 73 | $40,627 |
| Median Household Income | 124 | $35,192 |
| Mean Household Income | 124 | $36,249 |
| Income Deficit | 73 | $0 |
| Wage / Income Gap (%) | 254 | 0.00% |
| Wage / Income Gap ($) | 254 | 100.00¢ per $1 |
| Gini / Inequality Index | 254 | 0.20 |
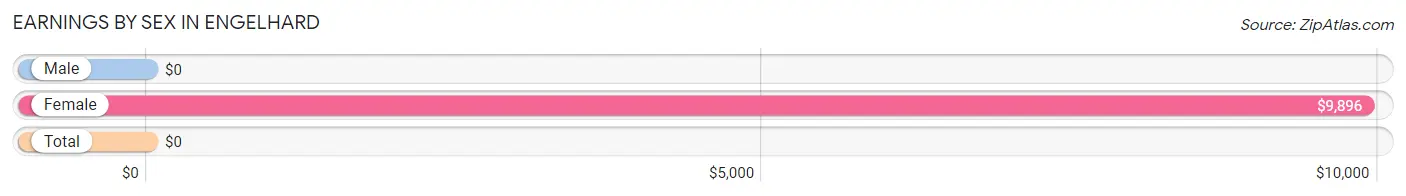
Earnings by Sex in Engelhard
| Sex | Number | Average Earnings |
| Male | 105 (57.1%) | $0 |
| Female | 79 (42.9%) | $9,896 |
| Total | 184 (100.0%) | $0 |
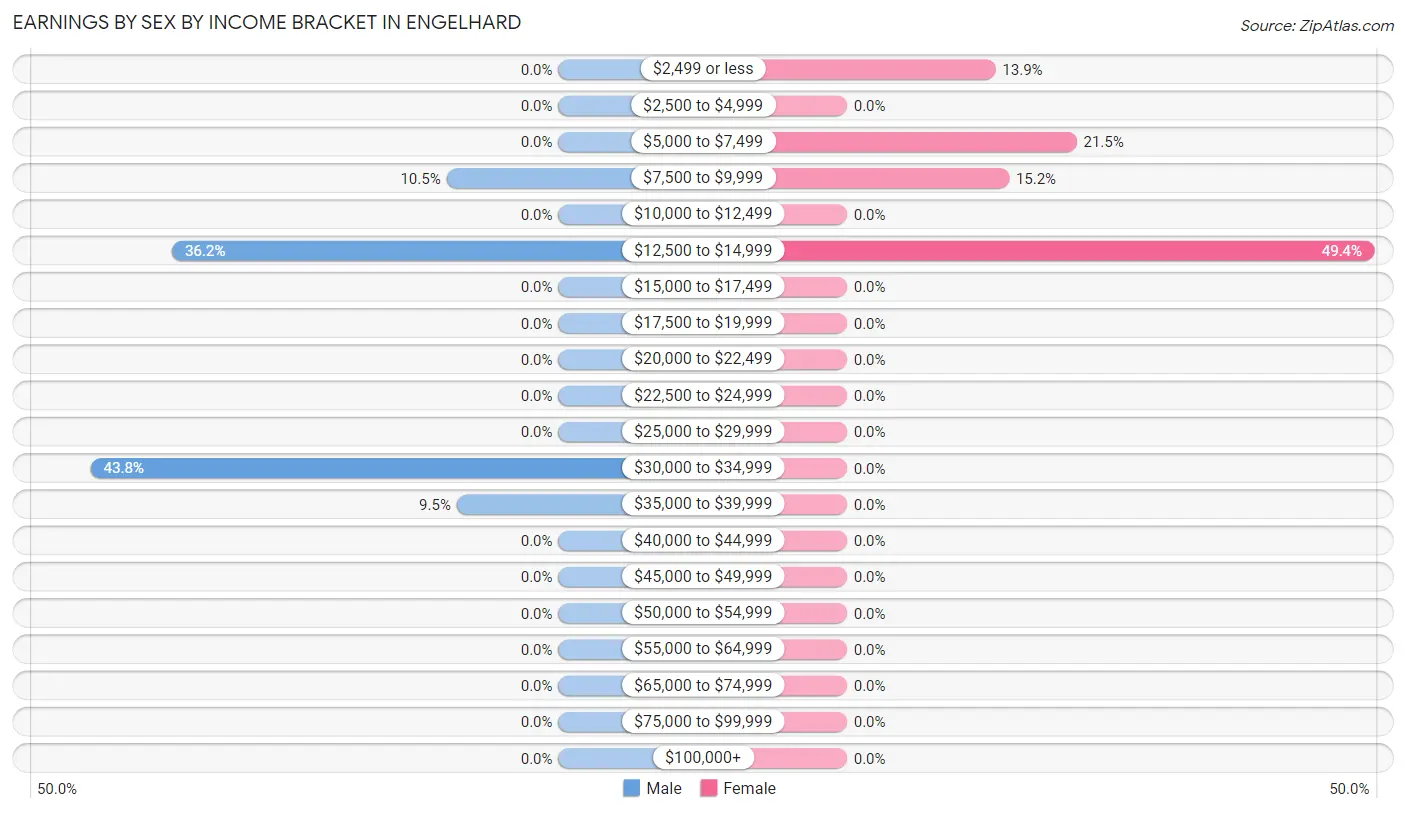
Earnings by Sex by Income Bracket in Engelhard
The most common earnings brackets in Engelhard are $30,000 to $34,999 for men (46 | 43.8%) and $12,500 to $14,999 for women (39 | 49.4%).
| Income | Male | Female |
| $2,499 or less | 0 (0.0%) | 11 (13.9%) |
| $2,500 to $4,999 | 0 (0.0%) | 0 (0.0%) |
| $5,000 to $7,499 | 0 (0.0%) | 17 (21.5%) |
| $7,500 to $9,999 | 11 (10.5%) | 12 (15.2%) |
| $10,000 to $12,499 | 0 (0.0%) | 0 (0.0%) |
| $12,500 to $14,999 | 38 (36.2%) | 39 (49.4%) |
| $15,000 to $17,499 | 0 (0.0%) | 0 (0.0%) |
| $17,500 to $19,999 | 0 (0.0%) | 0 (0.0%) |
| $20,000 to $22,499 | 0 (0.0%) | 0 (0.0%) |
| $22,500 to $24,999 | 0 (0.0%) | 0 (0.0%) |
| $25,000 to $29,999 | 0 (0.0%) | 0 (0.0%) |
| $30,000 to $34,999 | 46 (43.8%) | 0 (0.0%) |
| $35,000 to $39,999 | 10 (9.5%) | 0 (0.0%) |
| $40,000 to $44,999 | 0 (0.0%) | 0 (0.0%) |
| $45,000 to $49,999 | 0 (0.0%) | 0 (0.0%) |
| $50,000 to $54,999 | 0 (0.0%) | 0 (0.0%) |
| $55,000 to $64,999 | 0 (0.0%) | 0 (0.0%) |
| $65,000 to $74,999 | 0 (0.0%) | 0 (0.0%) |
| $75,000 to $99,999 | 0 (0.0%) | 0 (0.0%) |
| $100,000+ | 0 (0.0%) | 0 (0.0%) |
| Total | 105 (100.0%) | 79 (100.0%) |
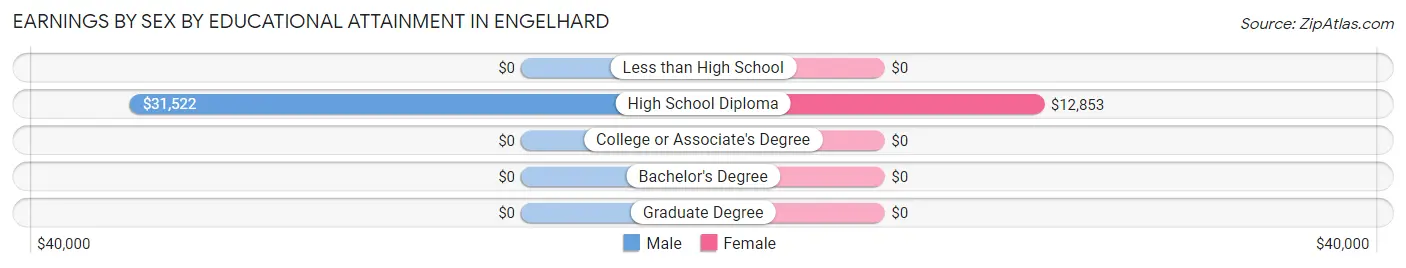
Earnings by Sex by Educational Attainment in Engelhard
| Educational Attainment | Male Income | Female Income |
| Less than High School | - | - |
| High School Diploma | $31,522 | $12,853 |
| College or Associate's Degree | - | - |
| Bachelor's Degree | - | - |
| Graduate Degree | - | - |
| Total | - | - |
Family Income in Engelhard
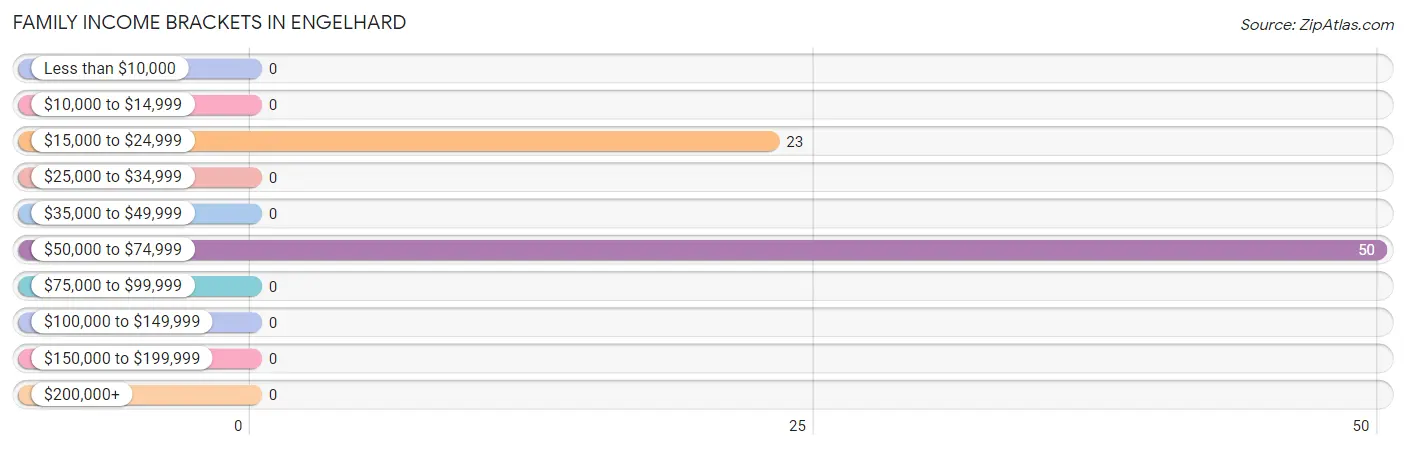
Family Income Brackets in Engelhard
According to the Engelhard family income data, there are 50 families falling into the $50,000 to $74,999 income range, which is the most common income bracket and makes up 68.5% of all families.
| Income Bracket | # Families | % Families |
| Less than $10,000 | 0 | 0.0% |
| $10,000 to $14,999 | 0 | 0.0% |
| $15,000 to $24,999 | 23 | 31.5% |
| $25,000 to $34,999 | 0 | 0.0% |
| $35,000 to $49,999 | 0 | 0.0% |
| $50,000 to $74,999 | 50 | 68.5% |
| $75,000 to $99,999 | 0 | 0.0% |
| $100,000 to $149,999 | 0 | 0.0% |
| $150,000 to $199,999 | 0 | 0.0% |
| $200,000+ | 0 | 0.0% |
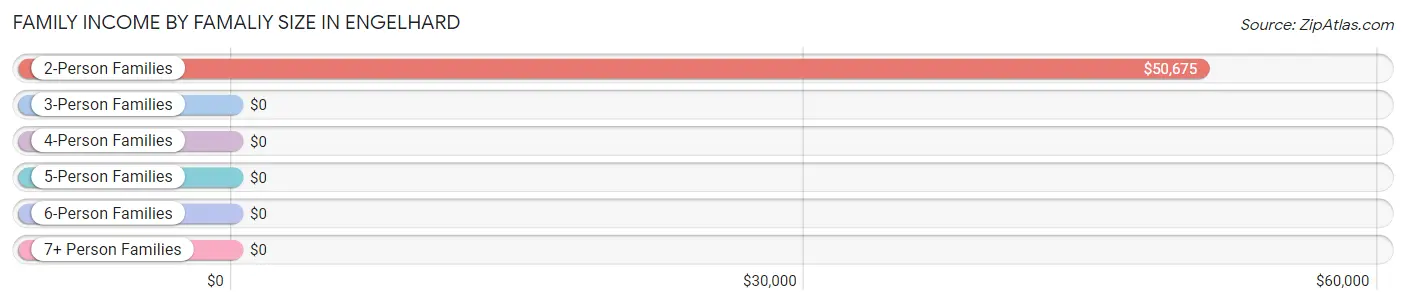
Family Income by Famaliy Size in Engelhard
2-person families (73 | 100.0%) account for the highest median family income in Engelhard with $50,675 per family, while 2-person families (73 | 100.0%) have the highest median income of $25,338 per family member.
| Income Bracket | # Families | Median Income |
| 2-Person Families | 73 (100.0%) | $50,675 |
| 3-Person Families | 0 (0.0%) | $0 |
| 4-Person Families | 0 (0.0%) | $0 |
| 5-Person Families | 0 (0.0%) | $0 |
| 6-Person Families | 0 (0.0%) | $0 |
| 7+ Person Families | 0 (0.0%) | $0 |
| Total | 73 (100.0%) | $50,675 |
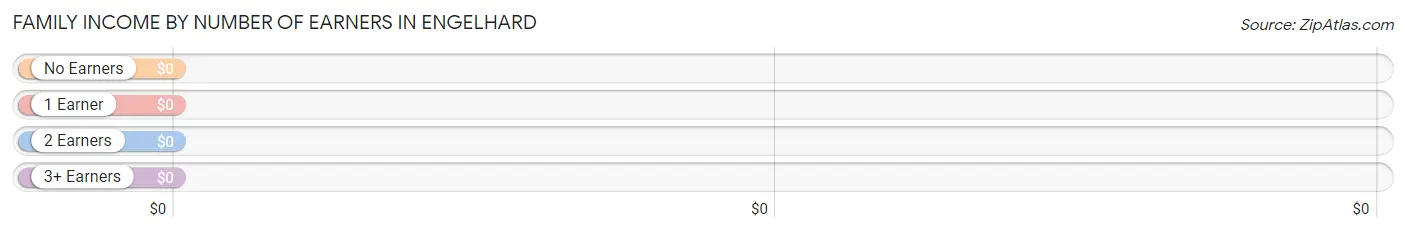
Family Income by Number of Earners in Engelhard
| Number of Earners | # Families | Median Income |
| No Earners | 11 (15.1%) | $0 |
| 1 Earner | 40 (54.8%) | $0 |
| 2 Earners | 22 (30.1%) | $0 |
| 3+ Earners | 0 (0.0%) | $0 |
| Total | 73 (100.0%) | $50,675 |
Household Income in Engelhard
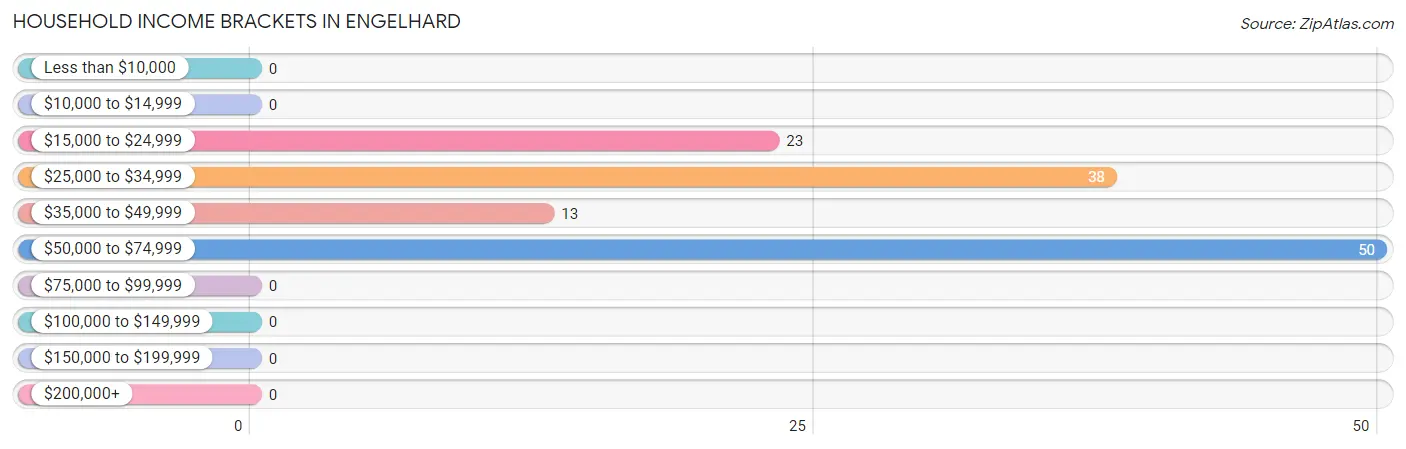
Household Income Brackets in Engelhard
With 50 households falling in the category, the $50,000 to $74,999 income range is the most frequent in Engelhard, accounting for 40.3% of all households.
| Income Bracket | # Households | % Households |
| Less than $10,000 | 0 | 0.0% |
| $10,000 to $14,999 | 0 | 0.0% |
| $15,000 to $24,999 | 23 | 18.5% |
| $25,000 to $34,999 | 38 | 30.6% |
| $35,000 to $49,999 | 13 | 10.5% |
| $50,000 to $74,999 | 50 | 40.3% |
| $75,000 to $99,999 | 0 | 0.0% |
| $100,000 to $149,999 | 0 | 0.0% |
| $150,000 to $199,999 | 0 | 0.0% |
| $200,000+ | 0 | 0.0% |
Household Income by Householder Age in Engelhard
The median household income in Engelhard is $35,192, with the highest median household income of $35,288 found in the 45 to 64 years age bracket for the primary householder. A total of 103 households (83.1%) fall into this category.
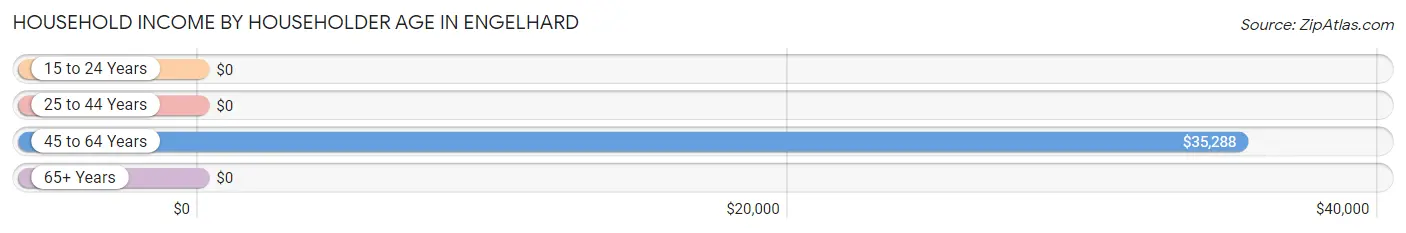
| Income Bracket | # Households | Median Income |
| 15 to 24 Years | 0 (0.0%) | $0 |
| 25 to 44 Years | 0 (0.0%) | $0 |
| 45 to 64 Years | 103 (83.1%) | $35,288 |
| 65+ Years | 21 (16.9%) | $0 |
| Total | 124 (100.0%) | $35,192 |
Poverty in Engelhard
Income Below Poverty by Sex and Age in Engelhard
With 39.5% poverty level for males and 52.3% for females among the residents of Engelhard, 55 to 64 year old males and 35 to 44 year old females are the most vulnerable to poverty, with 49 males (59.8%) and 17 females (100.0%) in their respective age groups living below the poverty level.
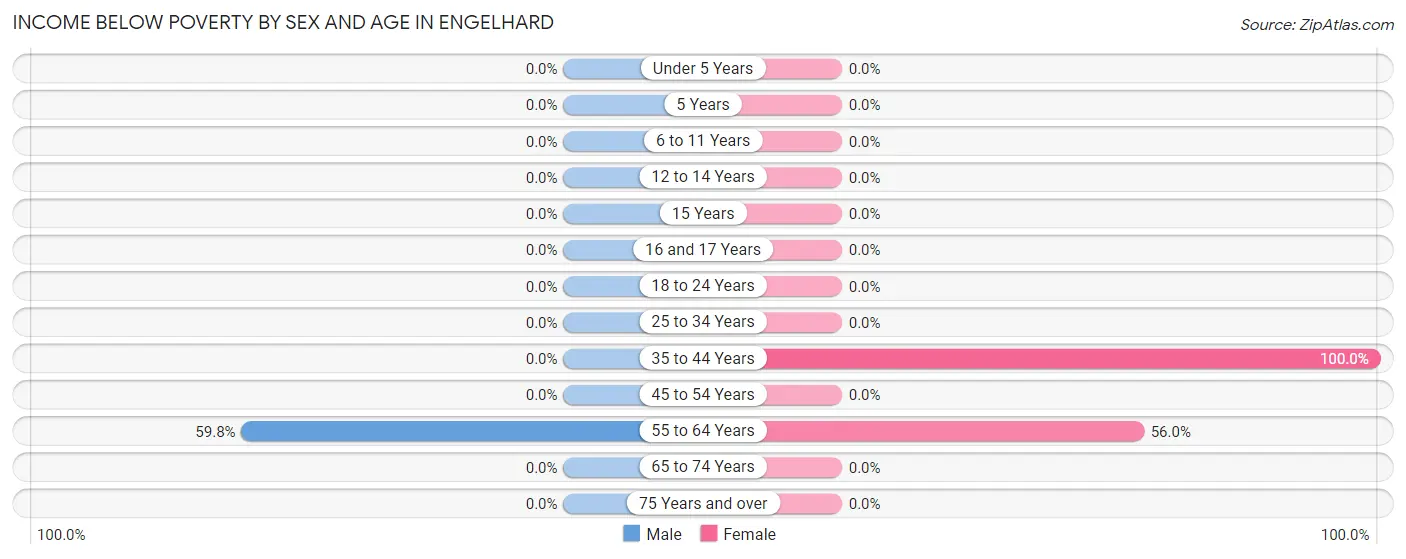
| Age Bracket | Male | Female |
| Under 5 Years | 0 (0.0%) | 0 (0.0%) |
| 5 Years | 0 (0.0%) | 0 (0.0%) |
| 6 to 11 Years | 0 (0.0%) | 0 (0.0%) |
| 12 to 14 Years | 0 (0.0%) | 0 (0.0%) |
| 15 Years | 0 (0.0%) | 0 (0.0%) |
| 16 and 17 Years | 0 (0.0%) | 0 (0.0%) |
| 18 to 24 Years | 0 (0.0%) | 0 (0.0%) |
| 25 to 34 Years | 0 (0.0%) | 0 (0.0%) |
| 35 to 44 Years | 0 (0.0%) | 17 (100.0%) |
| 45 to 54 Years | 0 (0.0%) | 0 (0.0%) |
| 55 to 64 Years | 49 (59.8%) | 51 (56.0%) |
| 65 to 74 Years | 0 (0.0%) | 0 (0.0%) |
| 75 Years and over | 0 (0.0%) | 0 (0.0%) |
| Total | 49 (39.5%) | 68 (52.3%) |
Income Above Poverty by Sex and Age in Engelhard
According to the poverty statistics in Engelhard, males aged 45 to 54 years and females aged 65 to 74 years are the age groups that are most secure financially, with 100.0% of males and 100.0% of females in these age groups living above the poverty line.
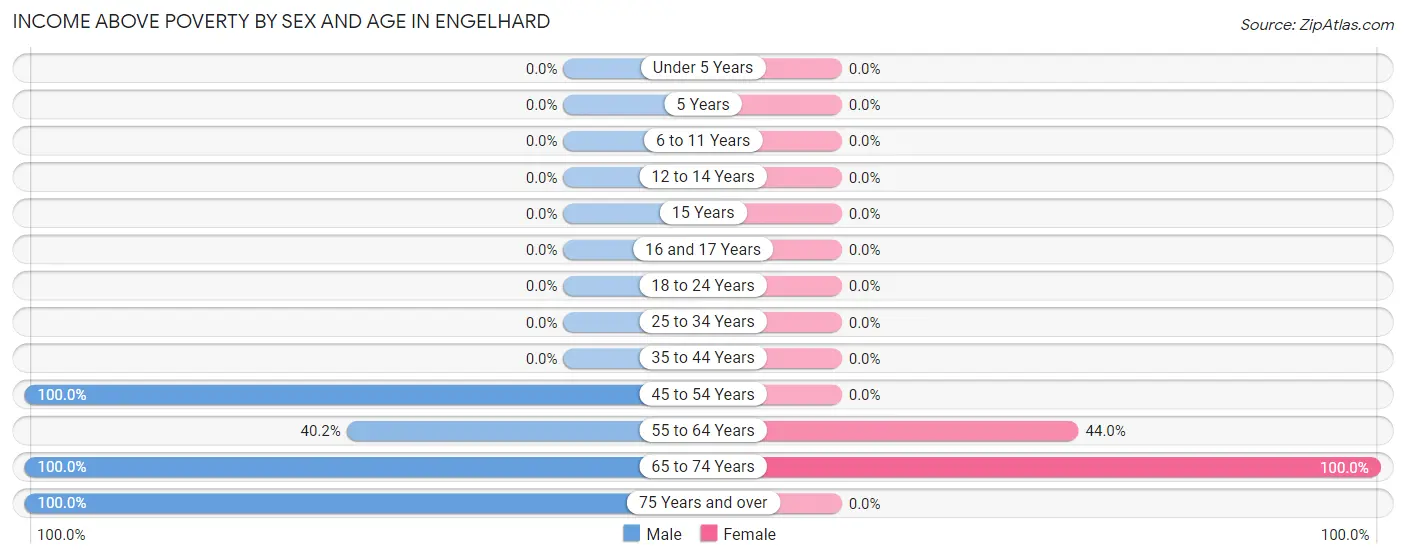
| Age Bracket | Male | Female |
| Under 5 Years | 0 (0.0%) | 0 (0.0%) |
| 5 Years | 0 (0.0%) | 0 (0.0%) |
| 6 to 11 Years | 0 (0.0%) | 0 (0.0%) |
| 12 to 14 Years | 0 (0.0%) | 0 (0.0%) |
| 15 Years | 0 (0.0%) | 0 (0.0%) |
| 16 and 17 Years | 0 (0.0%) | 0 (0.0%) |
| 18 to 24 Years | 0 (0.0%) | 0 (0.0%) |
| 25 to 34 Years | 0 (0.0%) | 0 (0.0%) |
| 35 to 44 Years | 0 (0.0%) | 0 (0.0%) |
| 45 to 54 Years | 13 (100.0%) | 0 (0.0%) |
| 55 to 64 Years | 33 (40.2%) | 40 (44.0%) |
| 65 to 74 Years | 10 (100.0%) | 22 (100.0%) |
| 75 Years and over | 19 (100.0%) | 0 (0.0%) |
| Total | 75 (60.5%) | 62 (47.7%) |
Income Below Poverty Among Married-Couple Families in Engelhard
The poverty statistics for married-couple families in Engelhard show that 16.4% or 12 of the total 73 families live below the poverty line. Families with no children have the highest poverty rate of 16.4%, comprising of 12 families. On the other hand, families with no children have the lowest poverty rate of 16.4%, which includes 12 families.
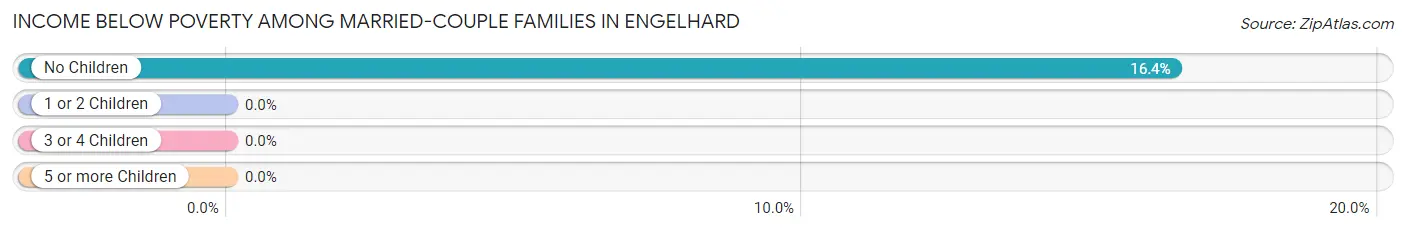
| Children | Above Poverty | Below Poverty |
| No Children | 61 (83.6%) | 12 (16.4%) |
| 1 or 2 Children | 0 (0.0%) | 0 (0.0%) |
| 3 or 4 Children | 0 (0.0%) | 0 (0.0%) |
| 5 or more Children | 0 (0.0%) | 0 (0.0%) |
| Total | 61 (83.6%) | 12 (16.4%) |
Income Below Poverty Among Single-Parent Households in Engelhard
| Children | Single Father | Single Mother |
| No Children | 0 (0.0%) | 0 (0.0%) |
| 1 or 2 Children | 0 (0.0%) | 0 (0.0%) |
| 3 or 4 Children | 0 (0.0%) | 0 (0.0%) |
| 5 or more Children | 0 (0.0%) | 0 (0.0%) |
| Total | 0 (0.0%) | 0 (0.0%) |
Income Below Poverty Among Married-Couple vs Single-Parent Households in Engelhard
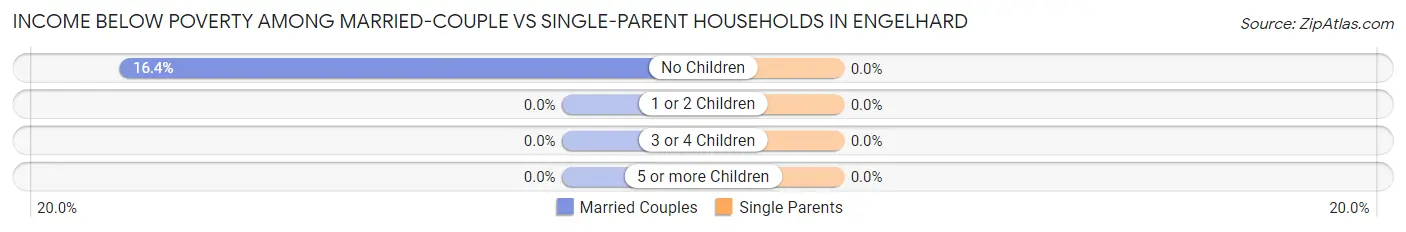
| Children | Married-Couple Families | Single-Parent Households |
| No Children | 12 (16.4%) | 0 (0.0%) |
| 1 or 2 Children | 0 (0.0%) | 0 (0.0%) |
| 3 or 4 Children | 0 (0.0%) | 0 (0.0%) |
| 5 or more Children | 0 (0.0%) | 0 (0.0%) |
| Total | 12 (16.4%) | 0 (0.0%) |
Race in Engelhard
The most populous races in Engelhard are White / Caucasian (237 | 93.3%), Hispanic or Latino (17 | 6.7%), and Two or more Races (17 | 6.7%).
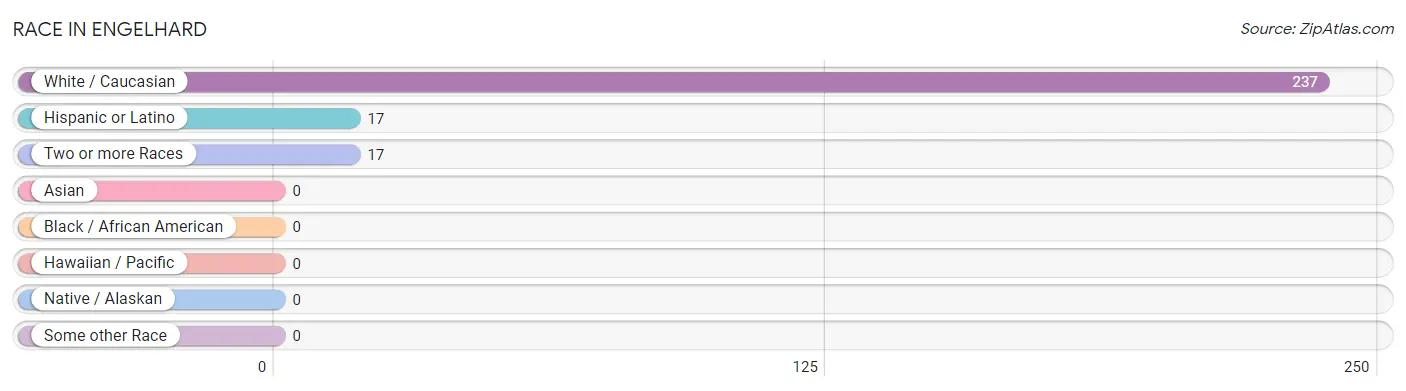
| Race | # Population | % Population |
| Asian | 0 | 0.0% |
| Black / African American | 0 | 0.0% |
| Hawaiian / Pacific | 0 | 0.0% |
| Hispanic or Latino | 17 | 6.7% |
| Native / Alaskan | 0 | 0.0% |
| White / Caucasian | 237 | 93.3% |
| Two or more Races | 17 | 6.7% |
| Some other Race | 0 | 0.0% |
| Total | 254 | 100.0% |
Ancestry in Engelhard
The most populous ancestries reported in Engelhard are American (61 | 24.0%), English (46 | 18.1%), Scotch-Irish (40 | 15.8%), and Cuban (17 | 6.7%), together accounting for 64.6% of all Engelhard residents.
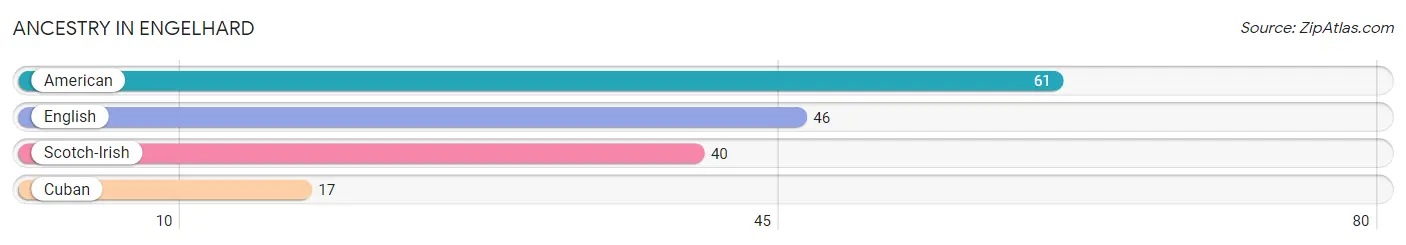
| Ancestry | # Population | % Population |
| American | 61 | 24.0% |
| Cuban | 17 | 6.7% |
| English | 46 | 18.1% |
| Scotch-Irish | 40 | 15.8% | View All 4 Rows |
Immigrants in Engelhard

| Immigration Origin | # Population | % Population | View All 0 Rows |
Sex and Age in Engelhard
Sex and Age in Engelhard
The most populous age groups in Engelhard are 60 to 64 Years (71 | 57.3%) for men and 55 to 59 Years (51 | 39.2%) for women.
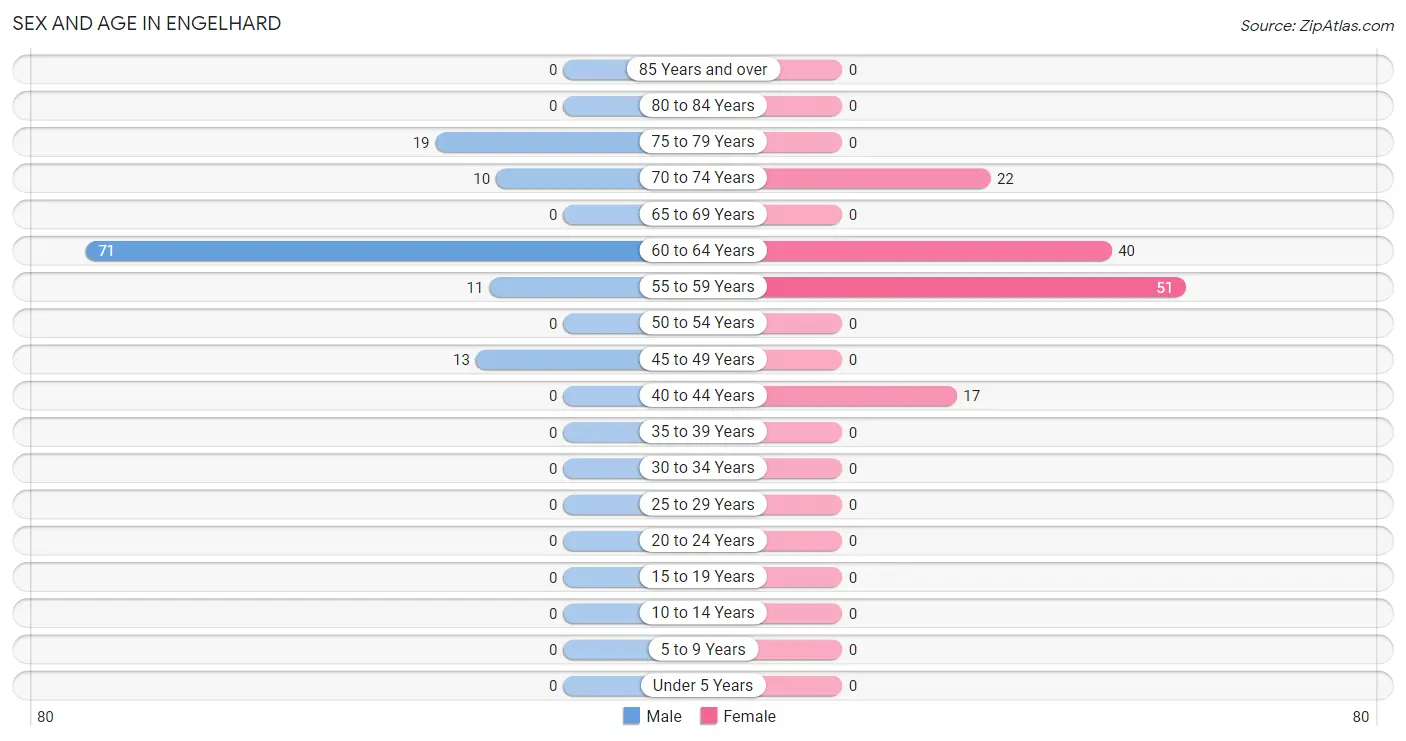
| Age Bracket | Male | Female |
| Under 5 Years | 0 (0.0%) | 0 (0.0%) |
| 5 to 9 Years | 0 (0.0%) | 0 (0.0%) |
| 10 to 14 Years | 0 (0.0%) | 0 (0.0%) |
| 15 to 19 Years | 0 (0.0%) | 0 (0.0%) |
| 20 to 24 Years | 0 (0.0%) | 0 (0.0%) |
| 25 to 29 Years | 0 (0.0%) | 0 (0.0%) |
| 30 to 34 Years | 0 (0.0%) | 0 (0.0%) |
| 35 to 39 Years | 0 (0.0%) | 0 (0.0%) |
| 40 to 44 Years | 0 (0.0%) | 17 (13.1%) |
| 45 to 49 Years | 13 (10.5%) | 0 (0.0%) |
| 50 to 54 Years | 0 (0.0%) | 0 (0.0%) |
| 55 to 59 Years | 11 (8.9%) | 51 (39.2%) |
| 60 to 64 Years | 71 (57.3%) | 40 (30.8%) |
| 65 to 69 Years | 0 (0.0%) | 0 (0.0%) |
| 70 to 74 Years | 10 (8.1%) | 22 (16.9%) |
| 75 to 79 Years | 19 (15.3%) | 0 (0.0%) |
| 80 to 84 Years | 0 (0.0%) | 0 (0.0%) |
| 85 Years and over | 0 (0.0%) | 0 (0.0%) |
| Total | 124 (100.0%) | 130 (100.0%) |
Families and Households in Engelhard
Median Family Size in Engelhard
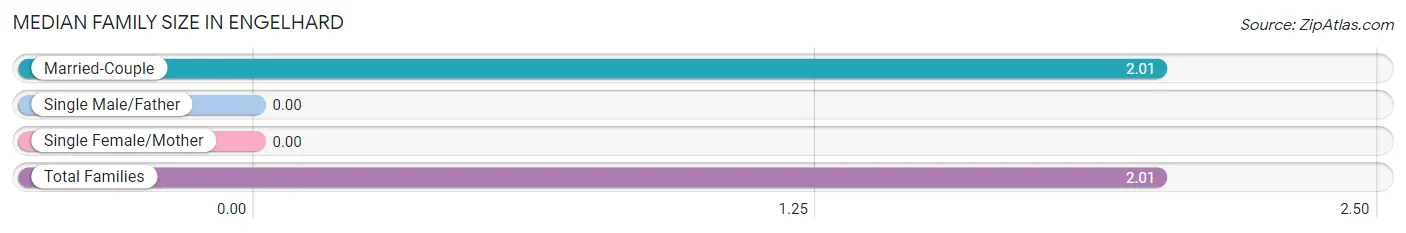
| Family Type | # Families | Family Size |
| Married-Couple | 73 (100.0%) | 2.01 |
| Single Male/Father | 0 (0.0%) | - |
| Single Female/Mother | 0 (0.0%) | - |
| Total Families | 73 (100.0%) | 2.01 |
Median Household Size in Engelhard
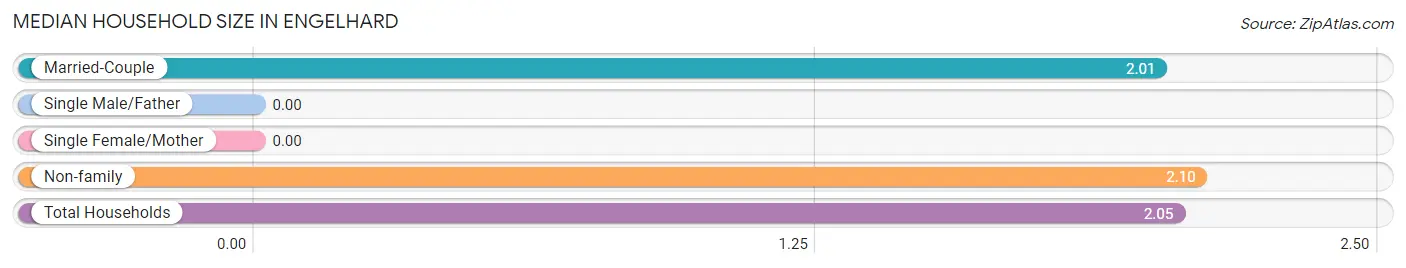
| Household Type | # Households | Household Size |
| Married-Couple | 73 (58.9%) | 2.01 |
| Single Male/Father | 0 (0.0%) | - |
| Single Female/Mother | 0 (0.0%) | - |
| Non-family | 51 (41.1%) | 2.10 |
| Total Households | 124 (100.0%) | 2.05 |
Household Size by Marriage Status in Engelhard
Out of a total of 124 households in Engelhard, 73 (58.9%) are family households, while 51 (41.1%) are nonfamily households. The most numerous type of family households are 2-person households, comprising 73, and the most common type of nonfamily households are 2-person households, comprising 51.
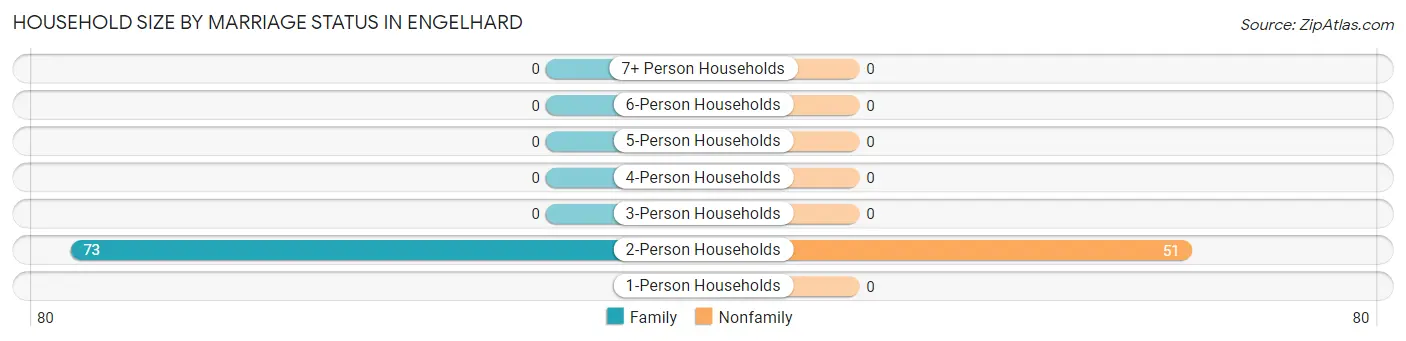
| Household Size | Family Households | Nonfamily Households |
| 1-Person Households | - | 0 (0.0%) |
| 2-Person Households | 73 (58.9%) | 51 (41.1%) |
| 3-Person Households | 0 (0.0%) | 0 (0.0%) |
| 4-Person Households | 0 (0.0%) | 0 (0.0%) |
| 5-Person Households | 0 (0.0%) | 0 (0.0%) |
| 6-Person Households | 0 (0.0%) | 0 (0.0%) |
| 7+ Person Households | 0 (0.0%) | 0 (0.0%) |
| Total | 73 (58.9%) | 51 (41.1%) |
Female Fertility in Engelhard
Fertility by Age in Engelhard
| Age Bracket | Women with Births | Births / 1,000 Women |
| 15 to 19 years | 0 (0.0%) | 0.0 |
| 20 to 34 years | 0 (0.0%) | 0.0 |
| 35 to 50 years | 0 (0.0%) | 0.0 |
| Total | 0 (0.0%) | 0.0 |
Fertility by Age by Marriage Status in Engelhard
| Age Bracket | Married | Unmarried |
| 15 to 19 years | 0 (0.0%) | 0 (0.0%) |
| 20 to 34 years | 0 (0.0%) | 0 (0.0%) |
| 35 to 50 years | 0 (0.0%) | 0 (0.0%) |
| Total | 0 (0.0%) | 0 (0.0%) |
Fertility by Education in Engelhard
| Educational Attainment | Women with Births | Births / 1,000 Women |
| Less than High School | 0 (0.0%) | 0.0 |
| High School Diploma | 0 (0.0%) | 0.0 |
| College or Associate's Degree | 0 (0.0%) | 0.0 |
| Bachelor's Degree | 0 (0.0%) | 0.0 |
| Graduate Degree | 0 (0.0%) | 0.0 |
| Total | 0 (0.0%) | 0.0 |
Fertility by Education by Marriage Status in Engelhard
| Educational Attainment | Married | Unmarried |
| Less than High School | 0 (0.0%) | 0 (0.0%) |
| High School Diploma | 0 (0.0%) | 0 (0.0%) |
| College or Associate's Degree | 0 (0.0%) | 0 (0.0%) |
| Bachelor's Degree | 0 (0.0%) | 0 (0.0%) |
| Graduate Degree | 0 (0.0%) | 0 (0.0%) |
| Total | 0 (0.0%) | 0 (0.0%) |
Employment Characteristics in Engelhard
Employment by Class of Employer in Engelhard
Among the 125 employed individuals in Engelhard, private company employees (53 | 42.4%), self-employed (not incorporated) (39 | 31.2%), and not-for-profit organizations (33 | 26.4%) make up the most common classes of employment.
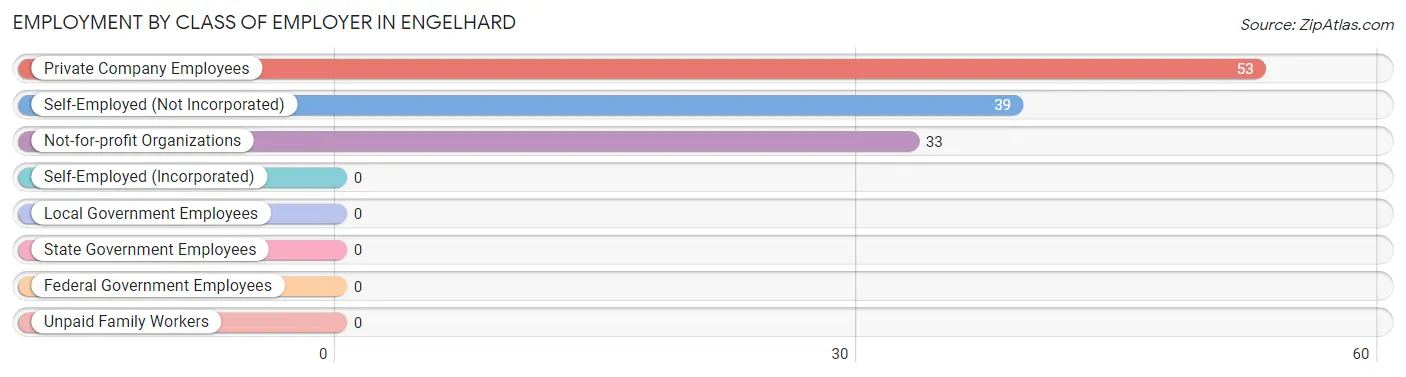
| Employer Class | # Employees | % Employees |
| Private Company Employees | 53 | 42.4% |
| Self-Employed (Incorporated) | 0 | 0.0% |
| Self-Employed (Not Incorporated) | 39 | 31.2% |
| Not-for-profit Organizations | 33 | 26.4% |
| Local Government Employees | 0 | 0.0% |
| State Government Employees | 0 | 0.0% |
| Federal Government Employees | 0 | 0.0% |
| Unpaid Family Workers | 0 | 0.0% |
| Total | 125 | 100.0% |
Employment Status by Age in Engelhard
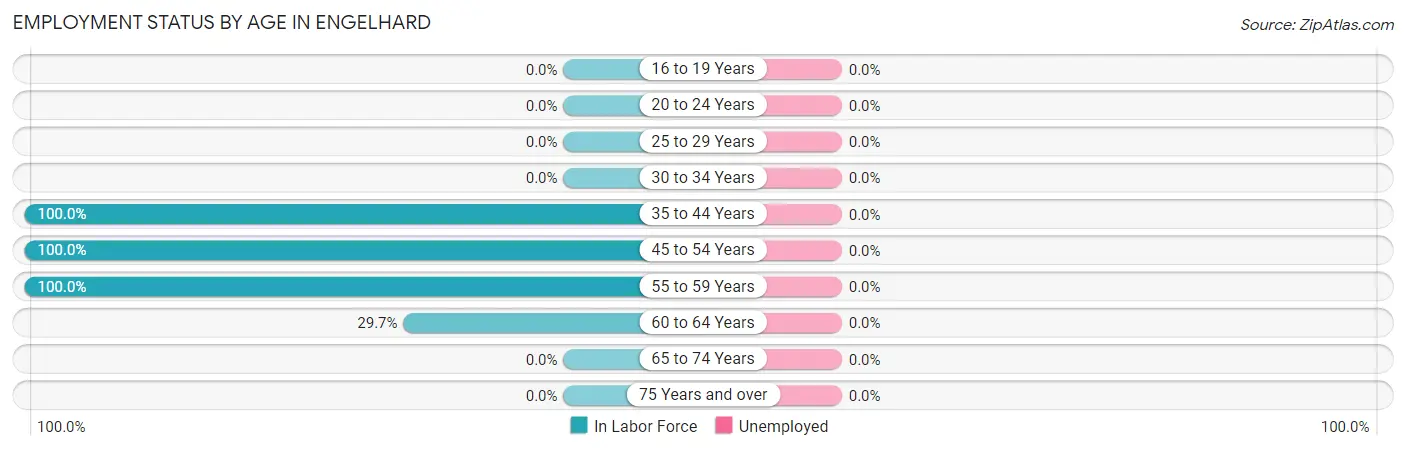
| Age Bracket | In Labor Force | Unemployed |
| 16 to 19 Years | 0 (0.0%) | 0 (0.0%) |
| 20 to 24 Years | 0 (0.0%) | 0 (0.0%) |
| 25 to 29 Years | 0 (0.0%) | 0 (0.0%) |
| 30 to 34 Years | 0 (0.0%) | 0 (0.0%) |
| 35 to 44 Years | 17 (100.0%) | 0 (0.0%) |
| 45 to 54 Years | 13 (100.0%) | 0 (0.0%) |
| 55 to 59 Years | 62 (100.0%) | 0 (0.0%) |
| 60 to 64 Years | 33 (29.7%) | 0 (0.0%) |
| 65 to 74 Years | 0 (0.0%) | 0 (0.0%) |
| 75 Years and over | 0 (0.0%) | 0 (0.0%) |
| Total | 125 (49.2%) | 0 (0.0%) |
Employment Status by Educational Attainment in Engelhard
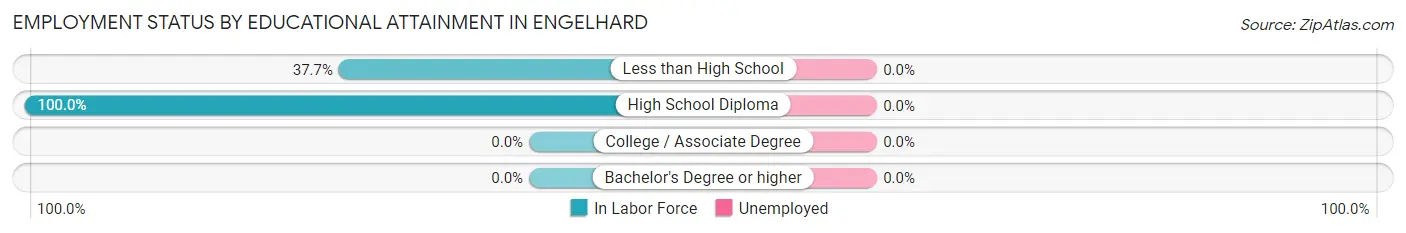
| Educational Attainment | In Labor Force | Unemployed |
| Less than High School | 23 (37.7%) | 0 (0.0%) |
| High School Diploma | 102 (100.0%) | 0 (0.0%) |
| College / Associate Degree | 0 (0.0%) | 0 (0.0%) |
| Bachelor's Degree or higher | 0 (0.0%) | 0 (0.0%) |
| Total | 125 (61.6%) | 0 (0.0%) |
Employment Occupations by Sex in Engelhard
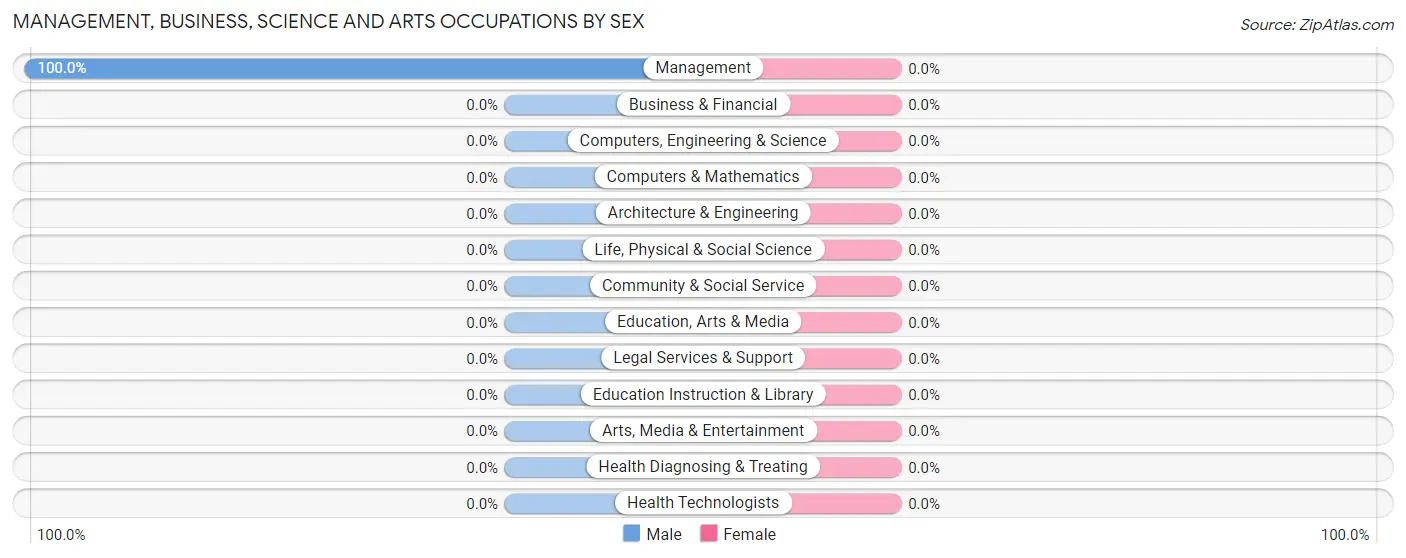
Management, Business, Science and Arts Occupations
The most common Management, Business, Science and Arts occupations in Engelhard are , and Management (33 | 26.4%).
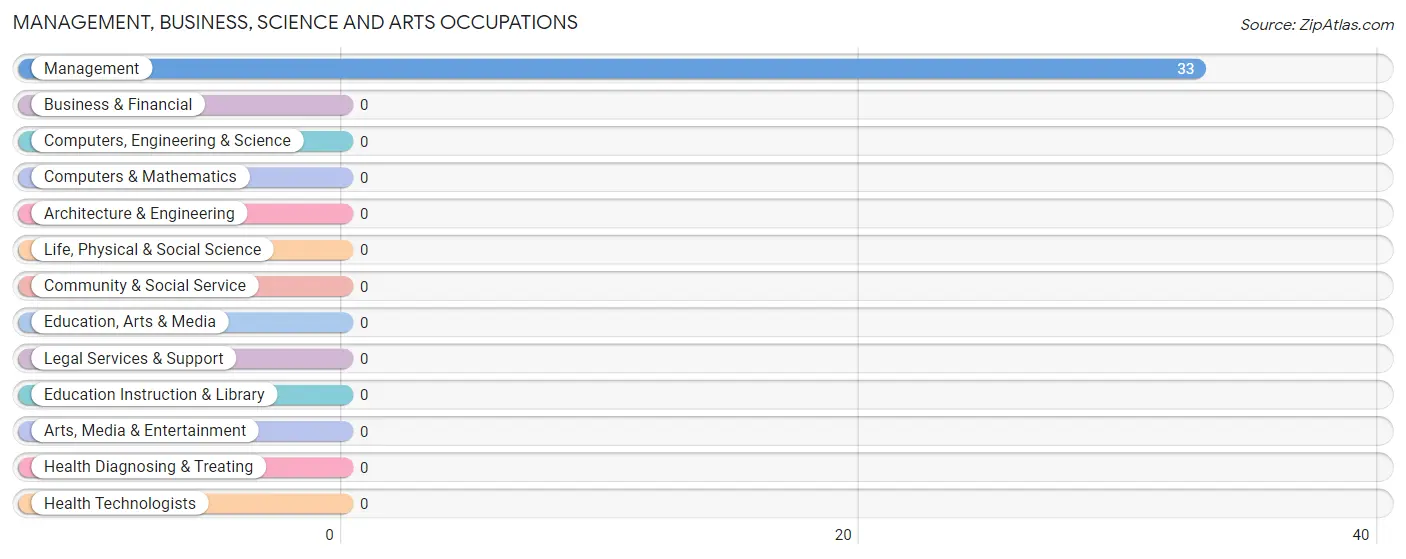
Management, Business, Science and Arts Occupations by Sex
| Occupation | Male | Female |
| Management | 33 (100.0%) | 0 (0.0%) |
| Business & Financial | 0 (0.0%) | 0 (0.0%) |
| Computers, Engineering & Science | 0 (0.0%) | 0 (0.0%) |
| Computers & Mathematics | 0 (0.0%) | 0 (0.0%) |
| Architecture & Engineering | 0 (0.0%) | 0 (0.0%) |
| Life, Physical & Social Science | 0 (0.0%) | 0 (0.0%) |
| Community & Social Service | 0 (0.0%) | 0 (0.0%) |
| Education, Arts & Media | 0 (0.0%) | 0 (0.0%) |
| Legal Services & Support | 0 (0.0%) | 0 (0.0%) |
| Education Instruction & Library | 0 (0.0%) | 0 (0.0%) |
| Arts, Media & Entertainment | 0 (0.0%) | 0 (0.0%) |
| Health Diagnosing & Treating | 0 (0.0%) | 0 (0.0%) |
| Health Technologists | 0 (0.0%) | 0 (0.0%) |
| Total (Category) | 33 (100.0%) | 0 (0.0%) |
| Total (Overall) | 57 (45.6%) | 68 (54.4%) |
Services Occupations
The most common Services occupations in Engelhard are , and Food Preparation & Serving (17 | 13.6%).
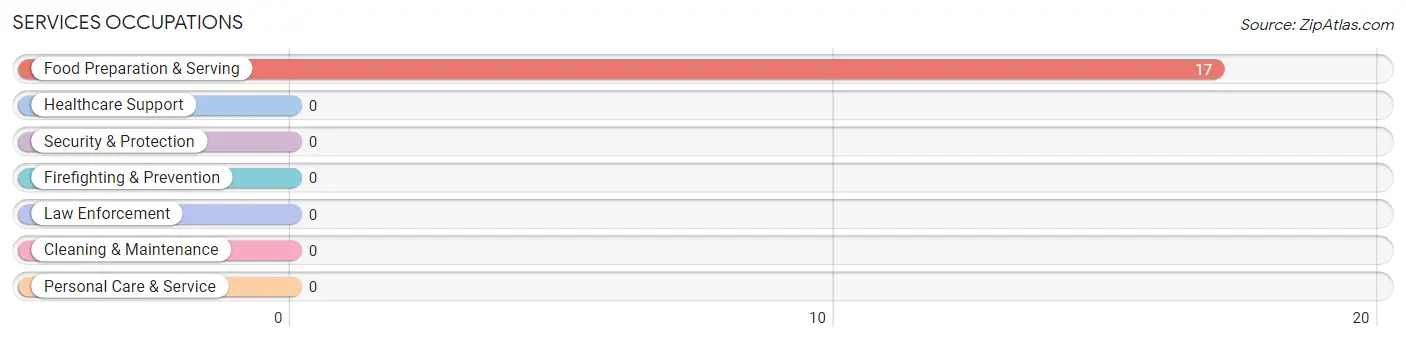
Services Occupations by Sex
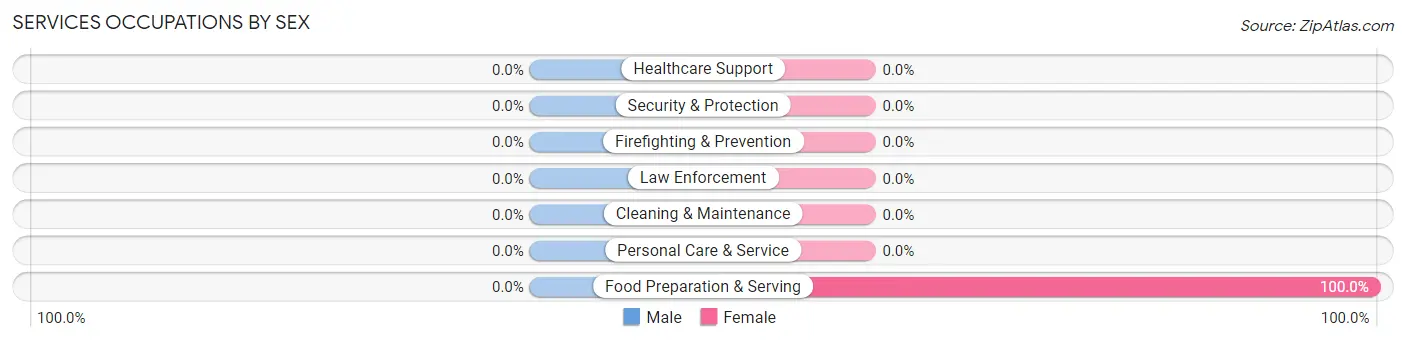
| Occupation | Male | Female |
| Healthcare Support | 0 (0.0%) | 0 (0.0%) |
| Security & Protection | 0 (0.0%) | 0 (0.0%) |
| Firefighting & Prevention | 0 (0.0%) | 0 (0.0%) |
| Law Enforcement | 0 (0.0%) | 0 (0.0%) |
| Food Preparation & Serving | 0 (0.0%) | 17 (100.0%) |
| Cleaning & Maintenance | 0 (0.0%) | 0 (0.0%) |
| Personal Care & Service | 0 (0.0%) | 0 (0.0%) |
| Total (Category) | 0 (0.0%) | 17 (100.0%) |
| Total (Overall) | 57 (45.6%) | 68 (54.4%) |
Sales and Office Occupations
The most common Sales and Office occupations in Engelhard are , and Sales & Related (51 | 40.8%).
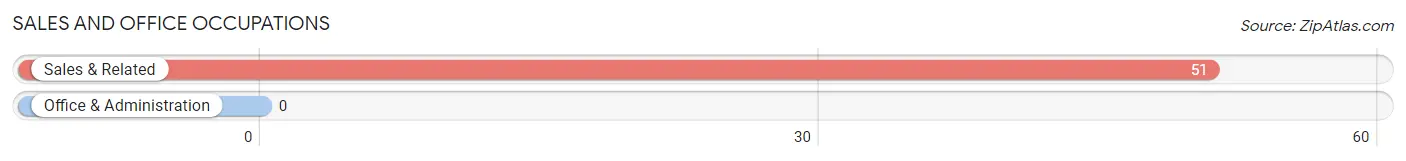
Sales and Office Occupations by Sex
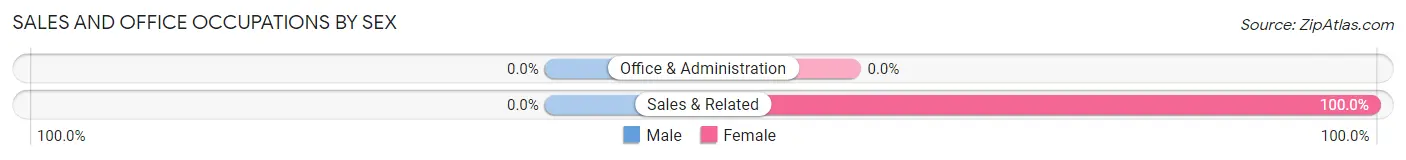
| Occupation | Male | Female |
| Sales & Related | 0 (0.0%) | 51 (100.0%) |
| Office & Administration | 0 (0.0%) | 0 (0.0%) |
| Total (Category) | 0 (0.0%) | 51 (100.0%) |
| Total (Overall) | 57 (45.6%) | 68 (54.4%) |
Natural Resources, Construction and Maintenance Occupations
The most common Natural Resources, Construction and Maintenance occupations in Engelhard are , and Construction & Extraction (11 | 8.8%).
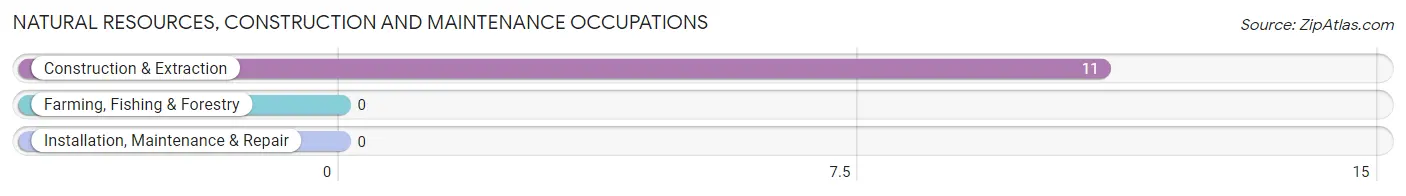
Natural Resources, Construction and Maintenance Occupations by Sex
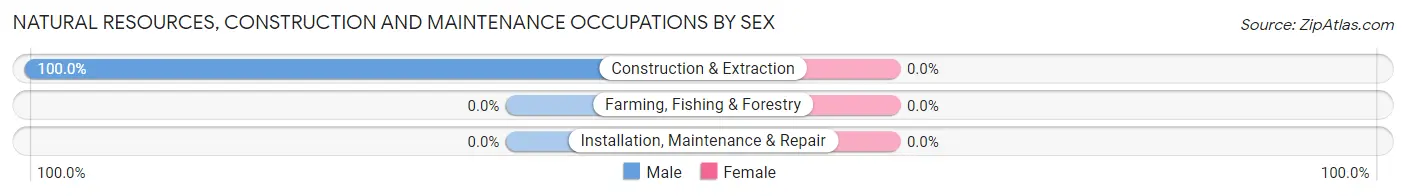
| Occupation | Male | Female |
| Farming, Fishing & Forestry | 0 (0.0%) | 0 (0.0%) |
| Construction & Extraction | 11 (100.0%) | 0 (0.0%) |
| Installation, Maintenance & Repair | 0 (0.0%) | 0 (0.0%) |
| Total (Category) | 11 (100.0%) | 0 (0.0%) |
| Total (Overall) | 57 (45.6%) | 68 (54.4%) |
Production, Transportation and Moving Occupations
The most common Production, Transportation and Moving occupations in Engelhard are , and Transportation (13 | 10.4%).
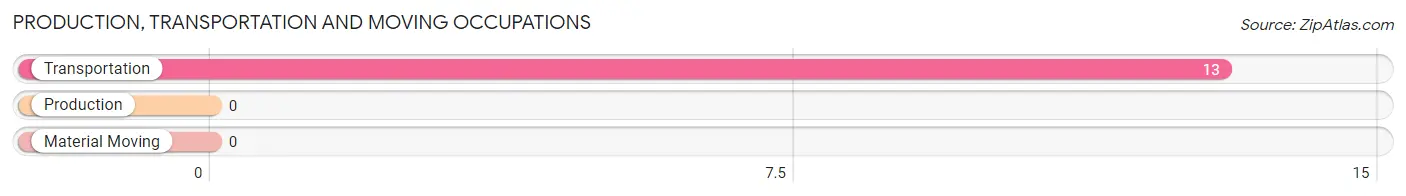
Production, Transportation and Moving Occupations by Sex
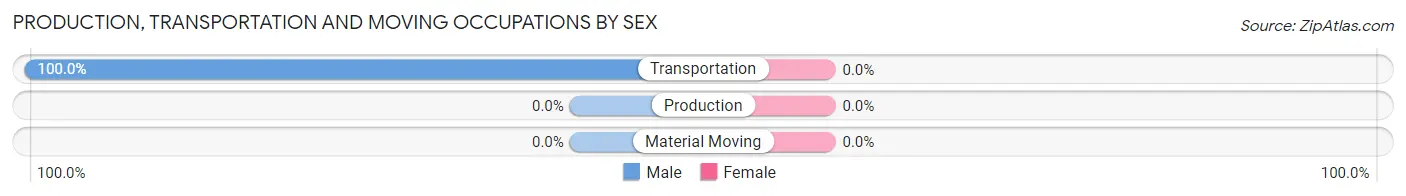
| Occupation | Male | Female |
| Production | 0 (0.0%) | 0 (0.0%) |
| Transportation | 13 (100.0%) | 0 (0.0%) |
| Material Moving | 0 (0.0%) | 0 (0.0%) |
| Total (Category) | 13 (100.0%) | 0 (0.0%) |
| Total (Overall) | 57 (45.6%) | 68 (54.4%) |
Employment Industries by Sex in Engelhard
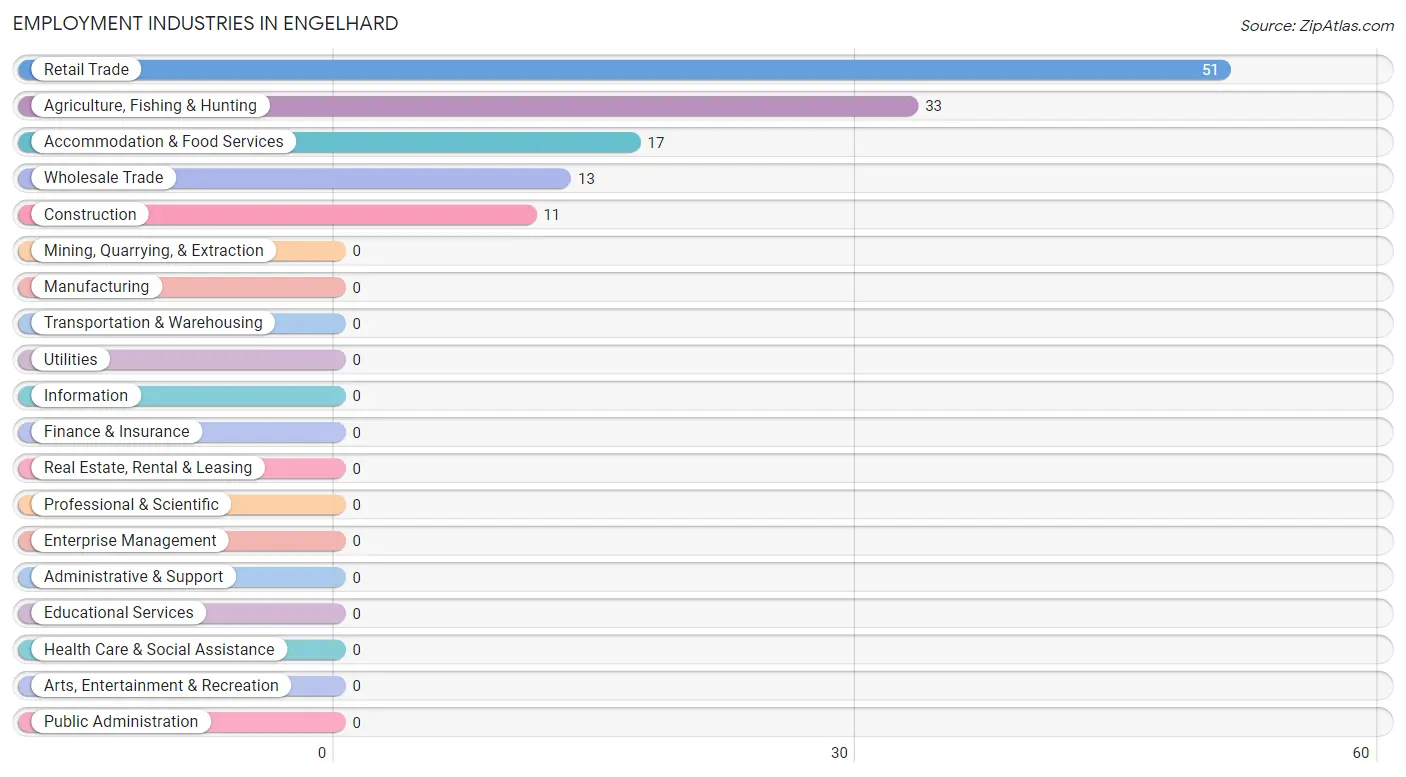
Employment Industries in Engelhard
The major employment industries in Engelhard include Retail Trade (51 | 40.8%), Agriculture, Fishing & Hunting (33 | 26.4%), Accommodation & Food Services (17 | 13.6%), Wholesale Trade (13 | 10.4%), and Construction (11 | 8.8%).
Employment Industries by Sex in Engelhard
The Engelhard industries that see more men than women are Agriculture, Fishing & Hunting (100.0%), Construction (100.0%), and Wholesale Trade (100.0%), whereas the industries that tend to have a higher number of women are Retail Trade (100.0%), and Accommodation & Food Services (100.0%).
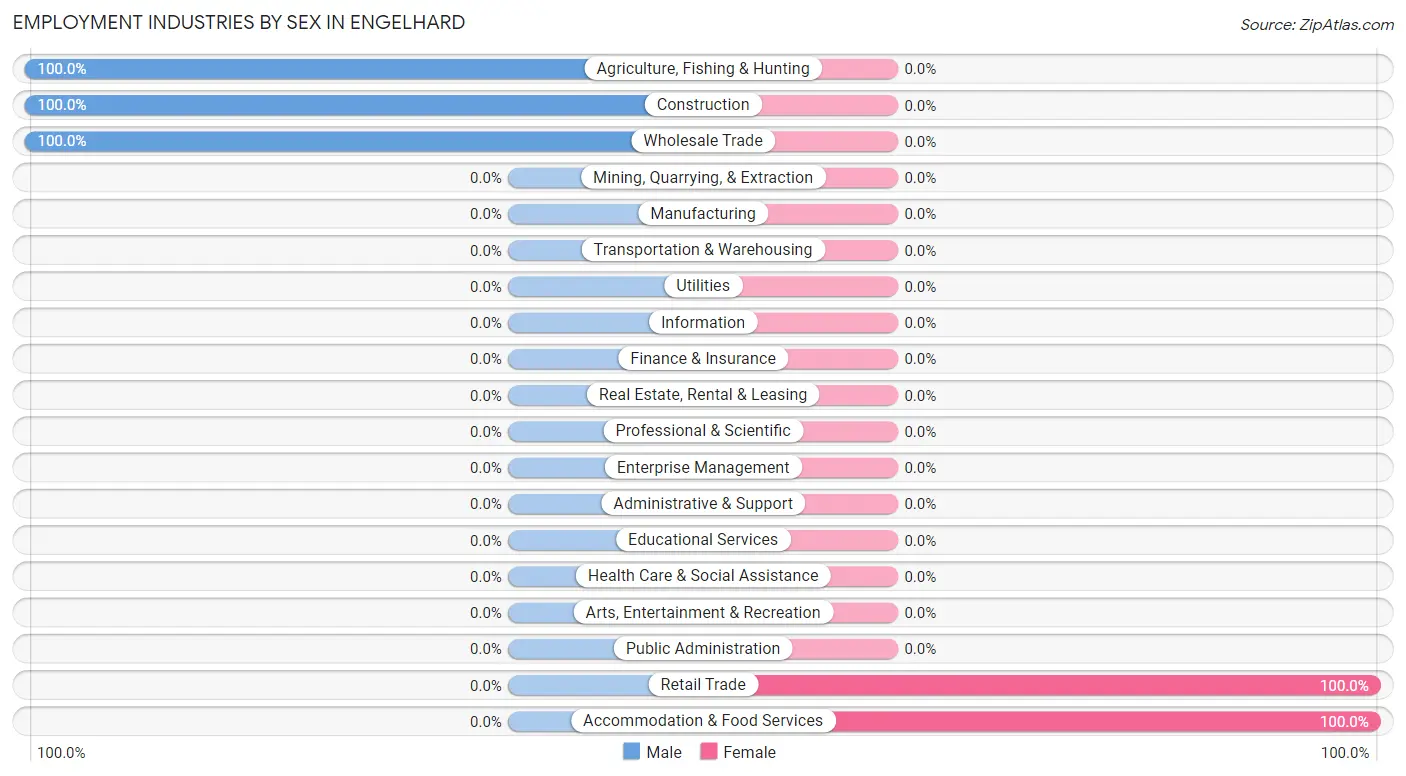
| Industry | Male | Female |
| Agriculture, Fishing & Hunting | 33 (100.0%) | 0 (0.0%) |
| Mining, Quarrying, & Extraction | 0 (0.0%) | 0 (0.0%) |
| Construction | 11 (100.0%) | 0 (0.0%) |
| Manufacturing | 0 (0.0%) | 0 (0.0%) |
| Wholesale Trade | 13 (100.0%) | 0 (0.0%) |
| Retail Trade | 0 (0.0%) | 51 (100.0%) |
| Transportation & Warehousing | 0 (0.0%) | 0 (0.0%) |
| Utilities | 0 (0.0%) | 0 (0.0%) |
| Information | 0 (0.0%) | 0 (0.0%) |
| Finance & Insurance | 0 (0.0%) | 0 (0.0%) |
| Real Estate, Rental & Leasing | 0 (0.0%) | 0 (0.0%) |
| Professional & Scientific | 0 (0.0%) | 0 (0.0%) |
| Enterprise Management | 0 (0.0%) | 0 (0.0%) |
| Administrative & Support | 0 (0.0%) | 0 (0.0%) |
| Educational Services | 0 (0.0%) | 0 (0.0%) |
| Health Care & Social Assistance | 0 (0.0%) | 0 (0.0%) |
| Arts, Entertainment & Recreation | 0 (0.0%) | 0 (0.0%) |
| Accommodation & Food Services | 0 (0.0%) | 17 (100.0%) |
| Public Administration | 0 (0.0%) | 0 (0.0%) |
| Total | 57 (45.6%) | 68 (54.4%) |
Education in Engelhard
School Enrollment in Engelhard
| School Level | # Students | % Students |
| Nursery / Preschool | 0 | 0.0% |
| Kindergarten | 0 | 0.0% |
| Elementary School | 0 | 0.0% |
| Middle School | 0 | 0.0% |
| High School | 0 | 0.0% |
| College / Undergraduate | 0 | 0.0% |
| Graduate / Professional | 0 | 0.0% |
| Total | 0 | 0.0% |
School Enrollment by Age by Funding Source in Engelhard
| Age Bracket | Public School | Private School |
| 3 to 4 Year Olds | 0 (0.0%) | 0 (0.0%) |
| 5 to 9 Year Old | 0 (0.0%) | 0 (0.0%) |
| 10 to 14 Year Olds | 0 (0.0%) | 0 (0.0%) |
| 15 to 17 Year Olds | 0 (0.0%) | 0 (0.0%) |
| 18 to 19 Year Olds | 0 (0.0%) | 0 (0.0%) |
| 20 to 24 Year Olds | 0 (0.0%) | 0 (0.0%) |
| 25 to 34 Year Olds | 0 (0.0%) | 0 (0.0%) |
| 35 Years and over | 0 (0.0%) | 0 (0.0%) |
| Total | 0 (0.0%) | 0 (0.0%) |
Educational Attainment by Field of Study in Engelhard
, and science & technology (40 | 100.0%) are the most common fields of study among 40 individuals in Engelhard who have obtained a bachelor's degree or higher.
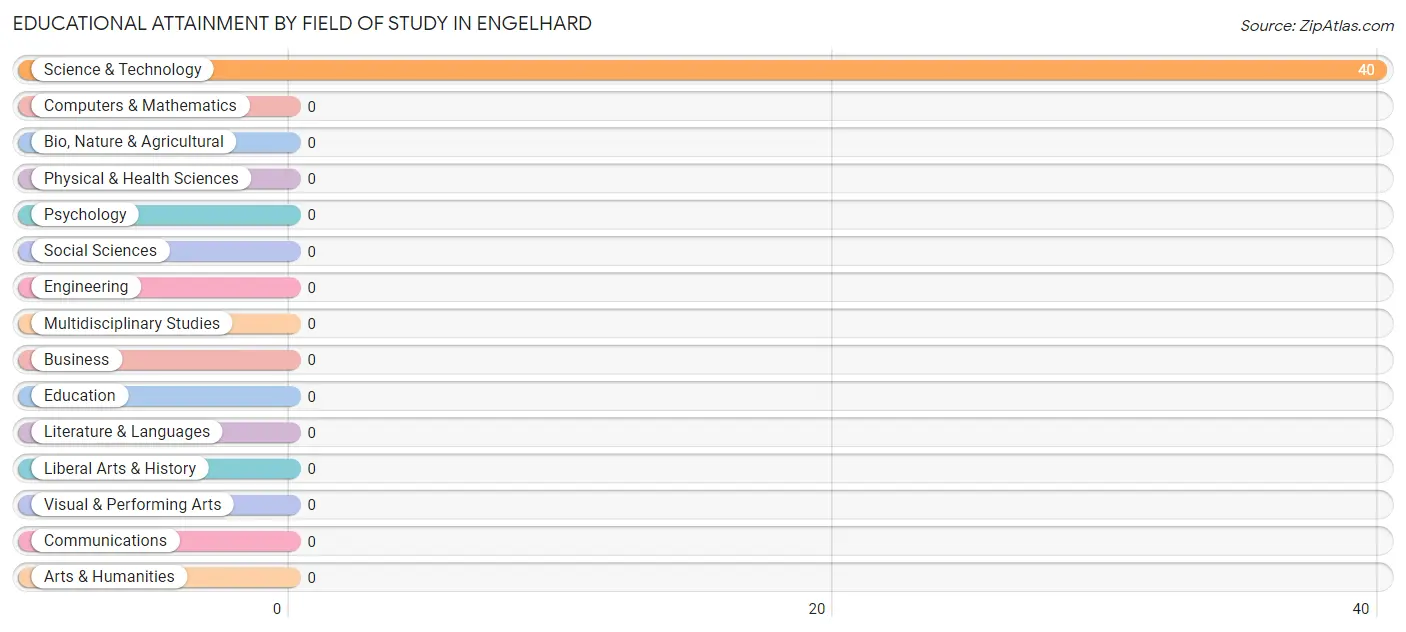
| Field of Study | # Graduates | % Graduates |
| Computers & Mathematics | 0 | 0.0% |
| Bio, Nature & Agricultural | 0 | 0.0% |
| Physical & Health Sciences | 0 | 0.0% |
| Psychology | 0 | 0.0% |
| Social Sciences | 0 | 0.0% |
| Engineering | 0 | 0.0% |
| Multidisciplinary Studies | 0 | 0.0% |
| Science & Technology | 40 | 100.0% |
| Business | 0 | 0.0% |
| Education | 0 | 0.0% |
| Literature & Languages | 0 | 0.0% |
| Liberal Arts & History | 0 | 0.0% |
| Visual & Performing Arts | 0 | 0.0% |
| Communications | 0 | 0.0% |
| Arts & Humanities | 0 | 0.0% |
| Total | 40 | 100.0% |
Transportation & Commute in Engelhard
Vehicle Availability by Sex in Engelhard
The most prevalent vehicle ownership categories in Engelhard are males with 1 vehicle (46, accounting for 80.7%) and females with 1 vehicle (17, making up 67.6%).
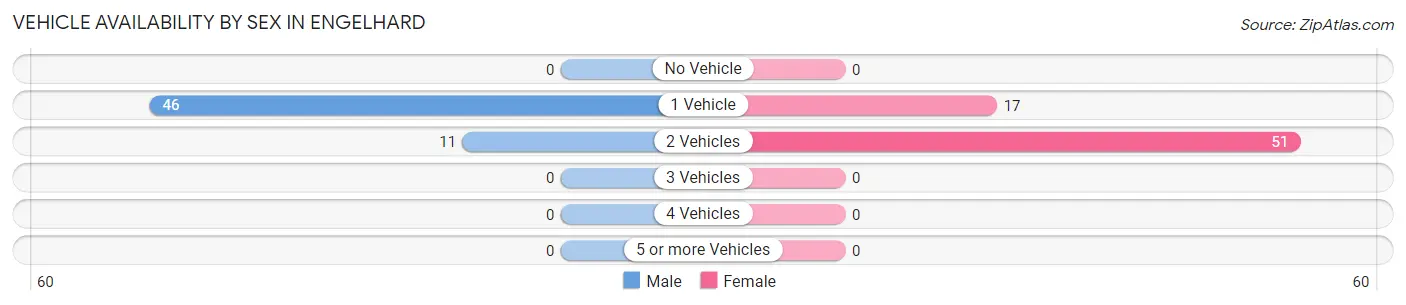
| Vehicles Available | Male | Female |
| No Vehicle | 0 (0.0%) | 0 (0.0%) |
| 1 Vehicle | 46 (80.7%) | 17 (25.0%) |
| 2 Vehicles | 11 (19.3%) | 51 (75.0%) |
| 3 Vehicles | 0 (0.0%) | 0 (0.0%) |
| 4 Vehicles | 0 (0.0%) | 0 (0.0%) |
| 5 or more Vehicles | 0 (0.0%) | 0 (0.0%) |
| Total | 57 (100.0%) | 68 (100.0%) |
Commute Time in Engelhard
The most frequently occuring commute durations in Engelhard are less than 5 minutes (39 commuters, 31.2%), 10 to 14 minutes (33 commuters, 26.4%), and 5 to 9 minutes (28 commuters, 22.4%).
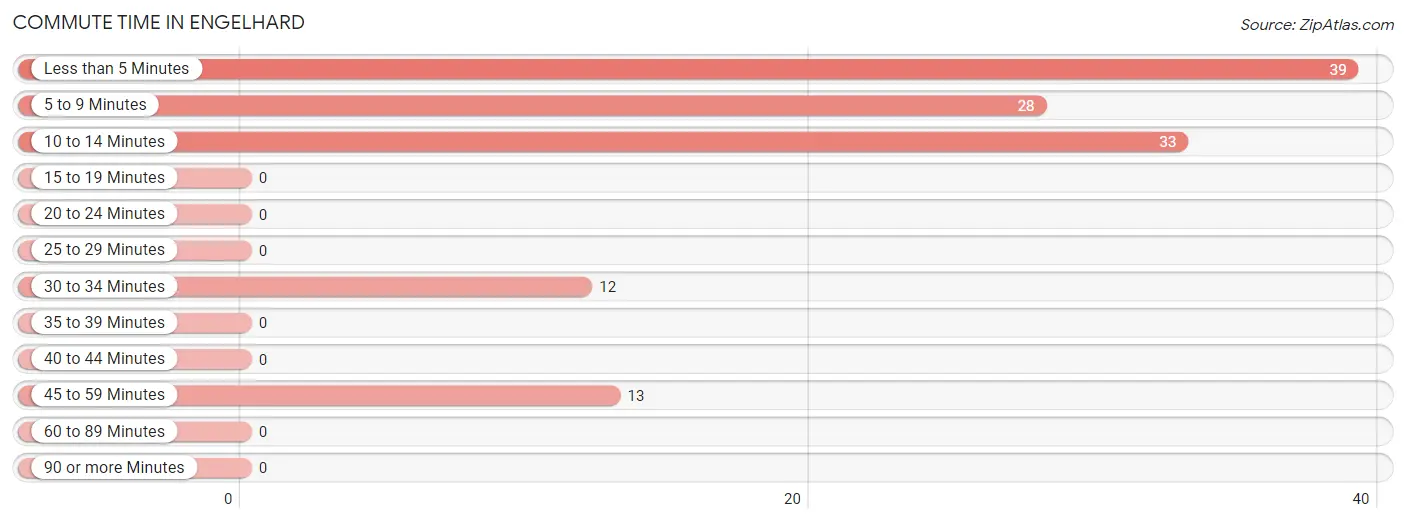
| Commute Time | # Commuters | % Commuters |
| Less than 5 Minutes | 39 | 31.2% |
| 5 to 9 Minutes | 28 | 22.4% |
| 10 to 14 Minutes | 33 | 26.4% |
| 15 to 19 Minutes | 0 | 0.0% |
| 20 to 24 Minutes | 0 | 0.0% |
| 25 to 29 Minutes | 0 | 0.0% |
| 30 to 34 Minutes | 12 | 9.6% |
| 35 to 39 Minutes | 0 | 0.0% |
| 40 to 44 Minutes | 0 | 0.0% |
| 45 to 59 Minutes | 13 | 10.4% |
| 60 to 89 Minutes | 0 | 0.0% |
| 90 or more Minutes | 0 | 0.0% |
Commute Time by Sex in Engelhard
The most common commute times in Engelhard are 10 to 14 minutes (33 commuters, 57.9%) for males and less than 5 minutes (39 commuters, 57.4%) for females.
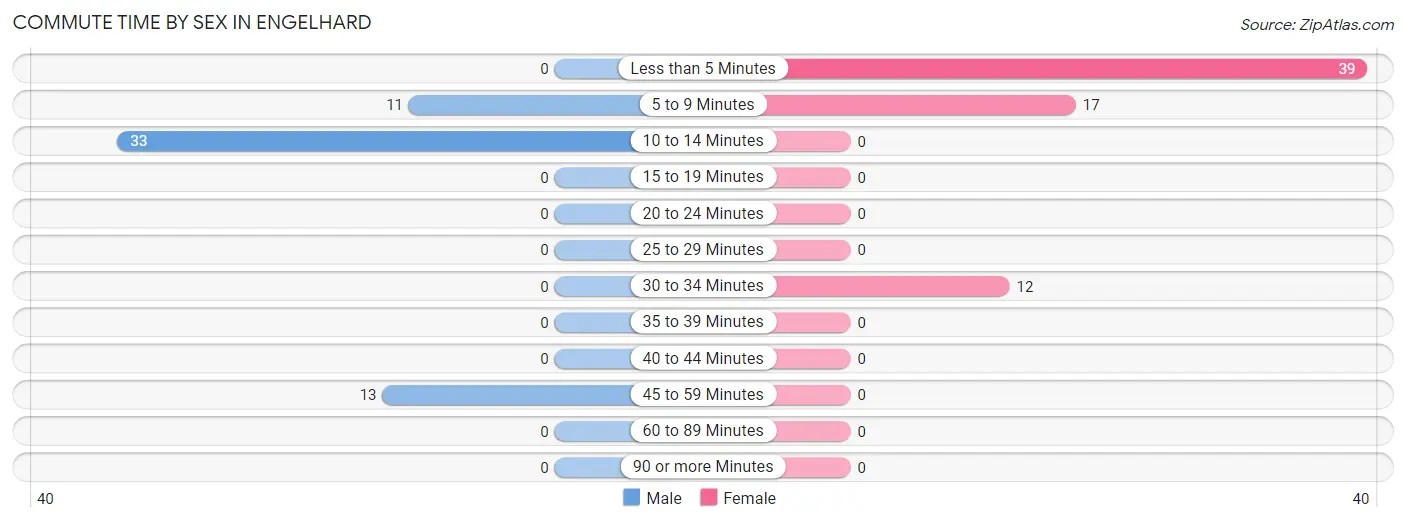
| Commute Time | Male | Female |
| Less than 5 Minutes | 0 (0.0%) | 39 (57.4%) |
| 5 to 9 Minutes | 11 (19.3%) | 17 (25.0%) |
| 10 to 14 Minutes | 33 (57.9%) | 0 (0.0%) |
| 15 to 19 Minutes | 0 (0.0%) | 0 (0.0%) |
| 20 to 24 Minutes | 0 (0.0%) | 0 (0.0%) |
| 25 to 29 Minutes | 0 (0.0%) | 0 (0.0%) |
| 30 to 34 Minutes | 0 (0.0%) | 12 (17.6%) |
| 35 to 39 Minutes | 0 (0.0%) | 0 (0.0%) |
| 40 to 44 Minutes | 0 (0.0%) | 0 (0.0%) |
| 45 to 59 Minutes | 13 (22.8%) | 0 (0.0%) |
| 60 to 89 Minutes | 0 (0.0%) | 0 (0.0%) |
| 90 or more Minutes | 0 (0.0%) | 0 (0.0%) |
Time of Departure to Work by Sex in Engelhard
The most frequent times of departure to work in Engelhard are 7:00 AM to 7:29 AM (57, 100.0%) for males and 7:00 AM to 7:29 AM (51, 75.0%) for females.
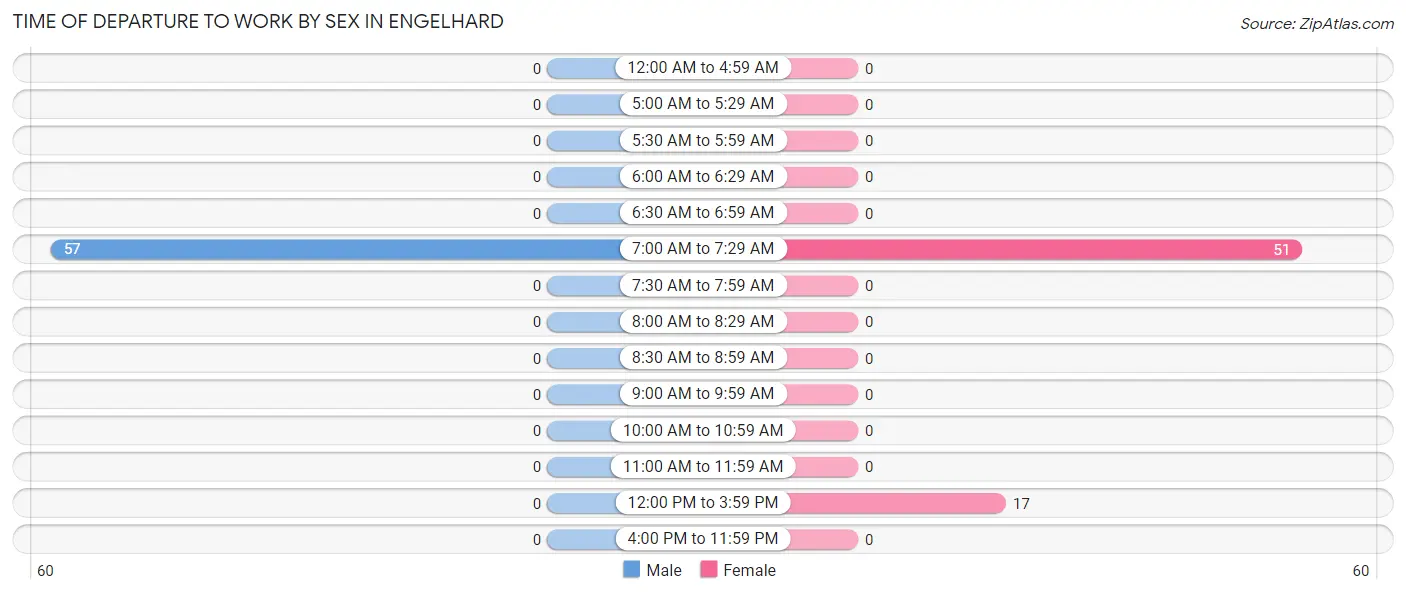
| Time of Departure | Male | Female |
| 12:00 AM to 4:59 AM | 0 (0.0%) | 0 (0.0%) |
| 5:00 AM to 5:29 AM | 0 (0.0%) | 0 (0.0%) |
| 5:30 AM to 5:59 AM | 0 (0.0%) | 0 (0.0%) |
| 6:00 AM to 6:29 AM | 0 (0.0%) | 0 (0.0%) |
| 6:30 AM to 6:59 AM | 0 (0.0%) | 0 (0.0%) |
| 7:00 AM to 7:29 AM | 57 (100.0%) | 51 (75.0%) |
| 7:30 AM to 7:59 AM | 0 (0.0%) | 0 (0.0%) |
| 8:00 AM to 8:29 AM | 0 (0.0%) | 0 (0.0%) |
| 8:30 AM to 8:59 AM | 0 (0.0%) | 0 (0.0%) |
| 9:00 AM to 9:59 AM | 0 (0.0%) | 0 (0.0%) |
| 10:00 AM to 10:59 AM | 0 (0.0%) | 0 (0.0%) |
| 11:00 AM to 11:59 AM | 0 (0.0%) | 0 (0.0%) |
| 12:00 PM to 3:59 PM | 0 (0.0%) | 17 (25.0%) |
| 4:00 PM to 11:59 PM | 0 (0.0%) | 0 (0.0%) |
| Total | 57 (100.0%) | 68 (100.0%) |
Housing Occupancy in Engelhard
Occupancy by Ownership in Engelhard
Of the total 124 dwellings in Engelhard, owner-occupied units account for 61 (49.2%), while renter-occupied units make up 63 (50.8%).
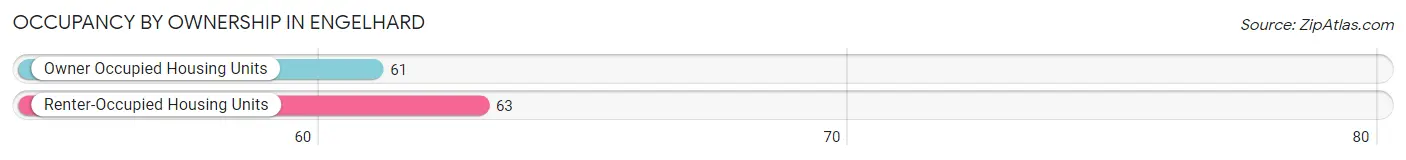
| Occupancy | # Housing Units | % Housing Units |
| Owner Occupied Housing Units | 61 | 49.2% |
| Renter-Occupied Housing Units | 63 | 50.8% |
| Total Occupied Housing Units | 124 | 100.0% |
Occupancy by Household Size in Engelhard
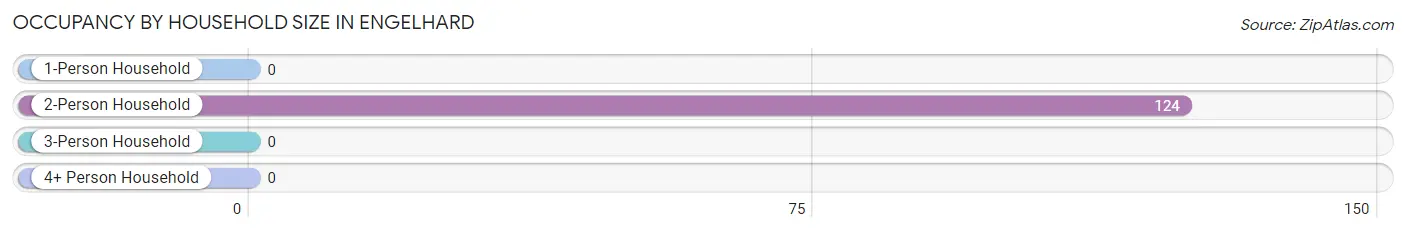
| Household Size | # Housing Units | % Housing Units |
| 1-Person Household | 0 | 0.0% |
| 2-Person Household | 124 | 100.0% |
| 3-Person Household | 0 | 0.0% |
| 4+ Person Household | 0 | 0.0% |
| Total Housing Units | 124 | 100.0% |
Occupancy by Ownership by Household Size in Engelhard
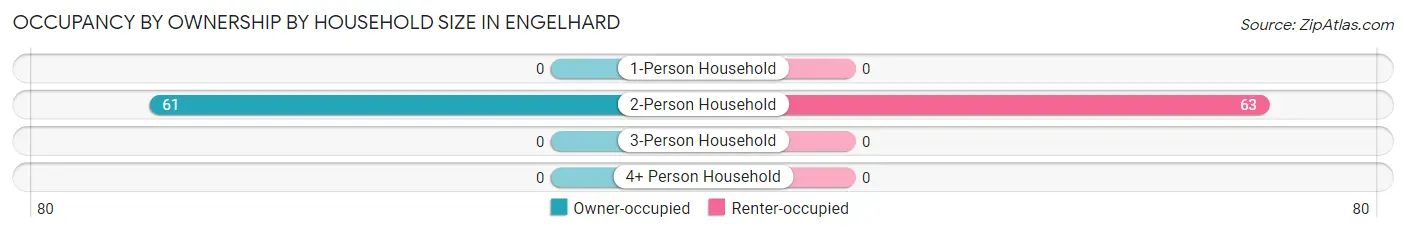
| Household Size | Owner-occupied | Renter-occupied |
| 1-Person Household | 0 (0.0%) | 0 (0.0%) |
| 2-Person Household | 61 (49.2%) | 63 (50.8%) |
| 3-Person Household | 0 (0.0%) | 0 (0.0%) |
| 4+ Person Household | 0 (0.0%) | 0 (0.0%) |
| Total Housing Units | 61 (49.2%) | 63 (50.8%) |
Occupancy by Educational Attainment in Engelhard
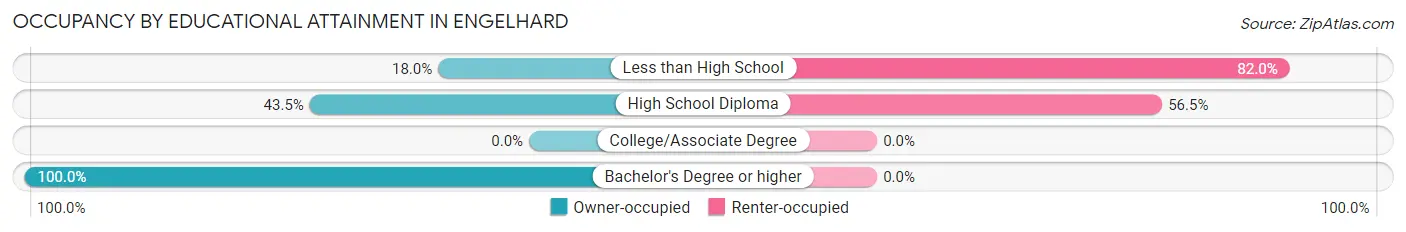
| Household Size | Owner-occupied | Renter-occupied |
| Less than High School | 11 (18.0%) | 50 (82.0%) |
| High School Diploma | 10 (43.5%) | 13 (56.5%) |
| College/Associate Degree | 0 (0.0%) | 0 (0.0%) |
| Bachelor's Degree or higher | 40 (100.0%) | 0 (0.0%) |
Occupancy by Age of Householder in Engelhard
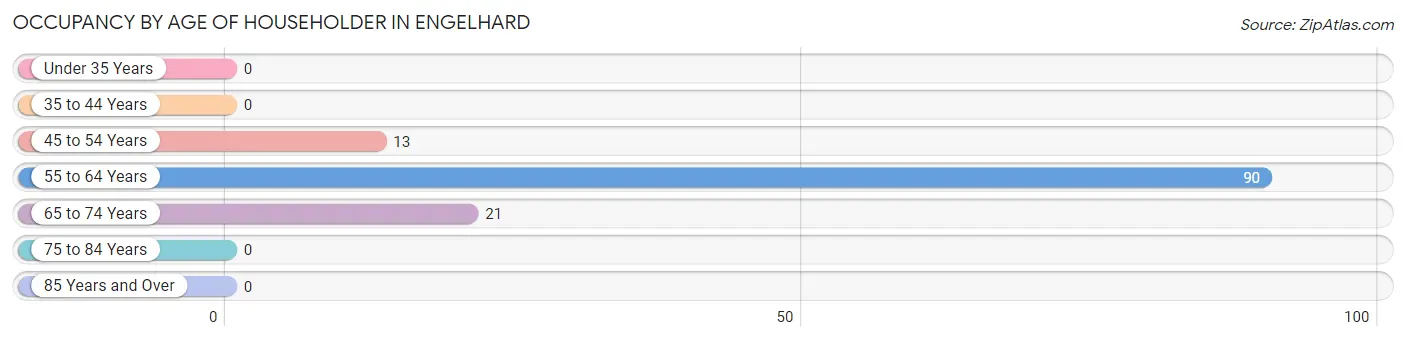
| Age Bracket | # Households | % Households |
| Under 35 Years | 0 | 0.0% |
| 35 to 44 Years | 0 | 0.0% |
| 45 to 54 Years | 13 | 10.5% |
| 55 to 64 Years | 90 | 72.6% |
| 65 to 74 Years | 21 | 16.9% |
| 75 to 84 Years | 0 | 0.0% |
| 85 Years and Over | 0 | 0.0% |
| Total | 124 | 100.0% |
Housing Finances in Engelhard
Median Income by Occupancy in Engelhard
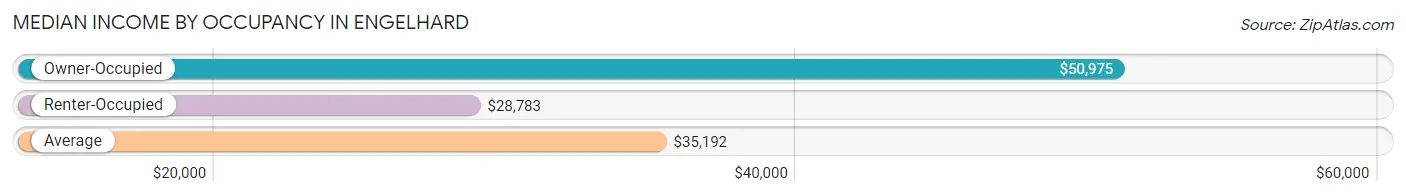
| Occupancy Type | # Households | Median Income |
| Owner-Occupied | 61 (49.2%) | $50,975 |
| Renter-Occupied | 63 (50.8%) | $28,783 |
| Average | 124 (100.0%) | $35,192 |
Occupancy by Householder Income Bracket in Engelhard
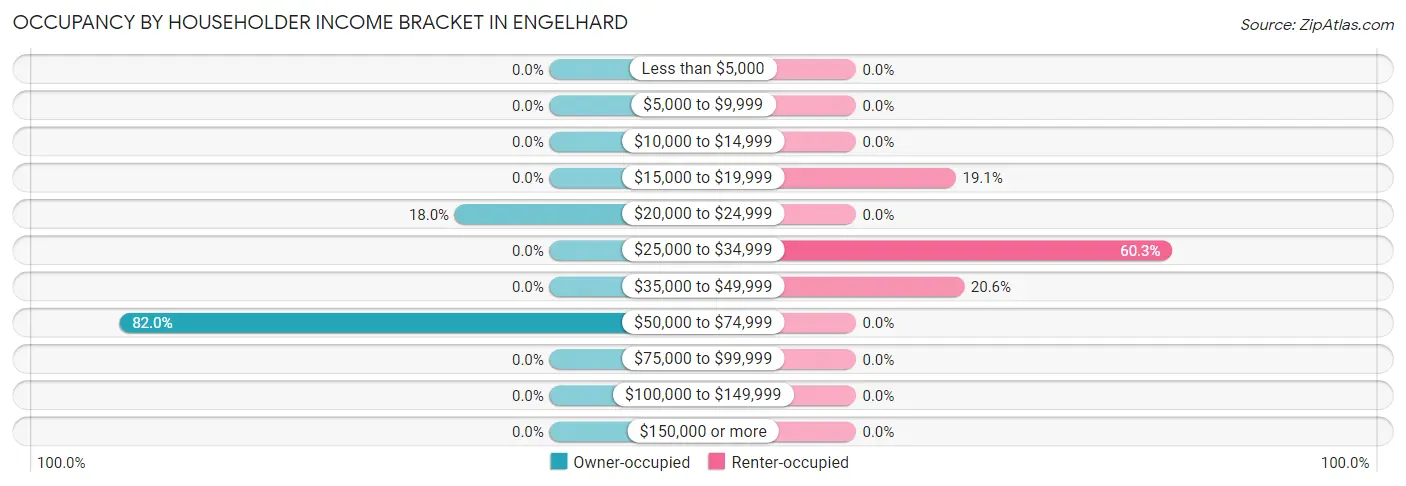
| Income Bracket | Owner-occupied | Renter-occupied |
| Less than $5,000 | 0 (0.0%) | 0 (0.0%) |
| $5,000 to $9,999 | 0 (0.0%) | 0 (0.0%) |
| $10,000 to $14,999 | 0 (0.0%) | 0 (0.0%) |
| $15,000 to $19,999 | 0 (0.0%) | 12 (19.1%) |
| $20,000 to $24,999 | 11 (18.0%) | 0 (0.0%) |
| $25,000 to $34,999 | 0 (0.0%) | 38 (60.3%) |
| $35,000 to $49,999 | 0 (0.0%) | 13 (20.6%) |
| $50,000 to $74,999 | 50 (82.0%) | 0 (0.0%) |
| $75,000 to $99,999 | 0 (0.0%) | 0 (0.0%) |
| $100,000 to $149,999 | 0 (0.0%) | 0 (0.0%) |
| $150,000 or more | 0 (0.0%) | 0 (0.0%) |
| Total | 61 (100.0%) | 63 (100.0%) |
Monthly Housing Cost Tiers in Engelhard
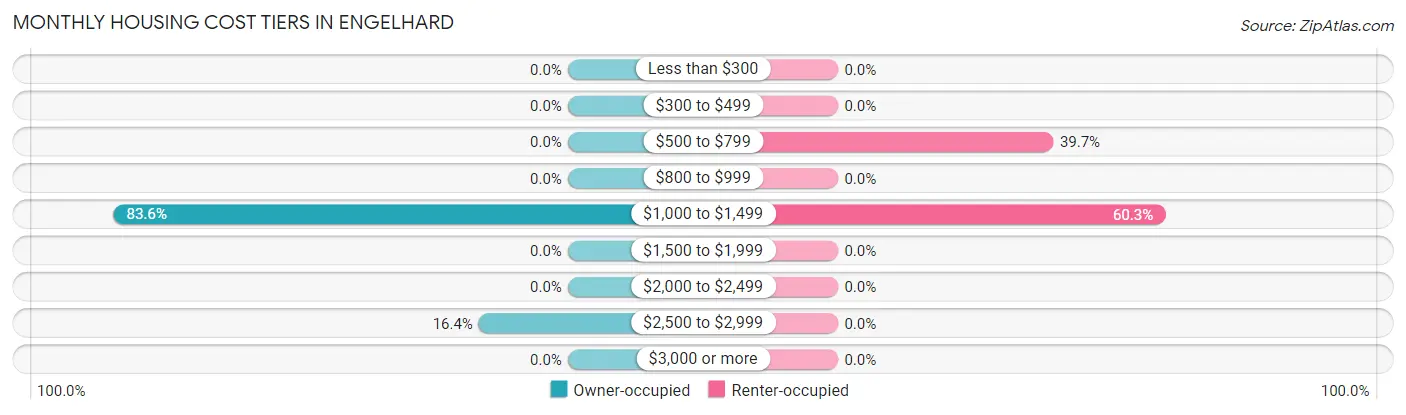
| Monthly Cost | Owner-occupied | Renter-occupied |
| Less than $300 | 0 (0.0%) | 0 (0.0%) |
| $300 to $499 | 0 (0.0%) | 0 (0.0%) |
| $500 to $799 | 0 (0.0%) | 25 (39.7%) |
| $800 to $999 | 0 (0.0%) | 0 (0.0%) |
| $1,000 to $1,499 | 51 (83.6%) | 38 (60.3%) |
| $1,500 to $1,999 | 0 (0.0%) | 0 (0.0%) |
| $2,000 to $2,499 | 0 (0.0%) | 0 (0.0%) |
| $2,500 to $2,999 | 10 (16.4%) | 0 (0.0%) |
| $3,000 or more | 0 (0.0%) | 0 (0.0%) |
| Total | 61 (100.0%) | 63 (100.0%) |
Physical Housing Characteristics in Engelhard
Housing Structures in Engelhard
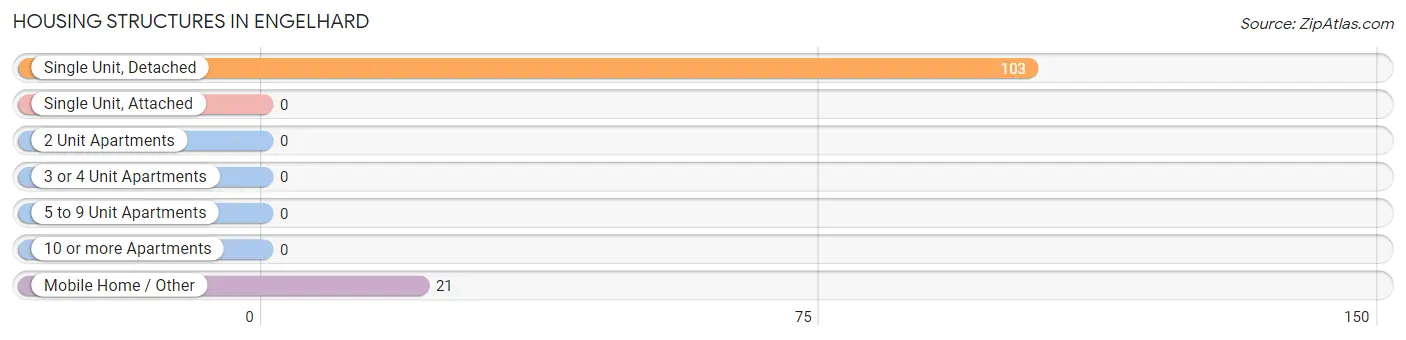
| Structure Type | # Housing Units | % Housing Units |
| Single Unit, Detached | 103 | 83.1% |
| Single Unit, Attached | 0 | 0.0% |
| 2 Unit Apartments | 0 | 0.0% |
| 3 or 4 Unit Apartments | 0 | 0.0% |
| 5 to 9 Unit Apartments | 0 | 0.0% |
| 10 or more Apartments | 0 | 0.0% |
| Mobile Home / Other | 21 | 16.9% |
| Total | 124 | 100.0% |
Housing Structures by Occupancy in Engelhard
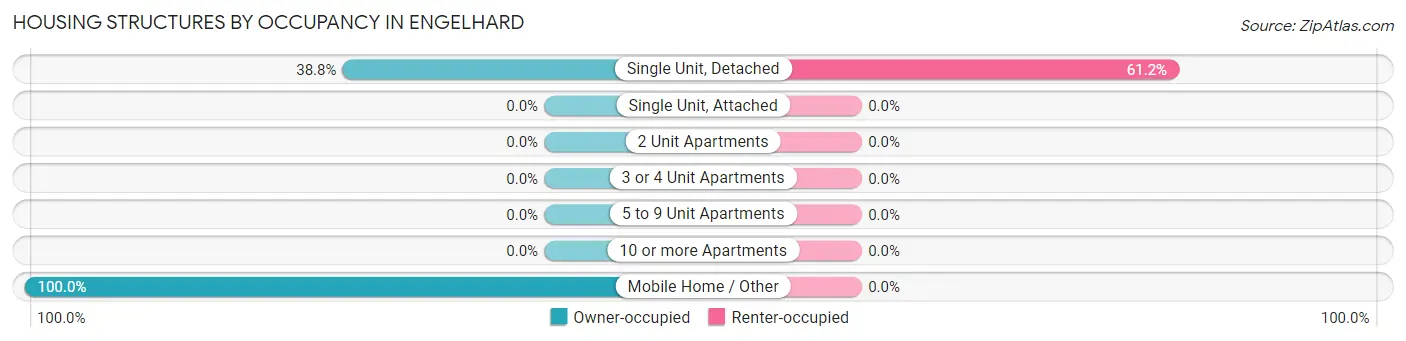
| Structure Type | Owner-occupied | Renter-occupied |
| Single Unit, Detached | 40 (38.8%) | 63 (61.2%) |
| Single Unit, Attached | 0 (0.0%) | 0 (0.0%) |
| 2 Unit Apartments | 0 (0.0%) | 0 (0.0%) |
| 3 or 4 Unit Apartments | 0 (0.0%) | 0 (0.0%) |
| 5 to 9 Unit Apartments | 0 (0.0%) | 0 (0.0%) |
| 10 or more Apartments | 0 (0.0%) | 0 (0.0%) |
| Mobile Home / Other | 21 (100.0%) | 0 (0.0%) |
| Total | 61 (49.2%) | 63 (50.8%) |
Housing Structures by Number of Rooms in Engelhard
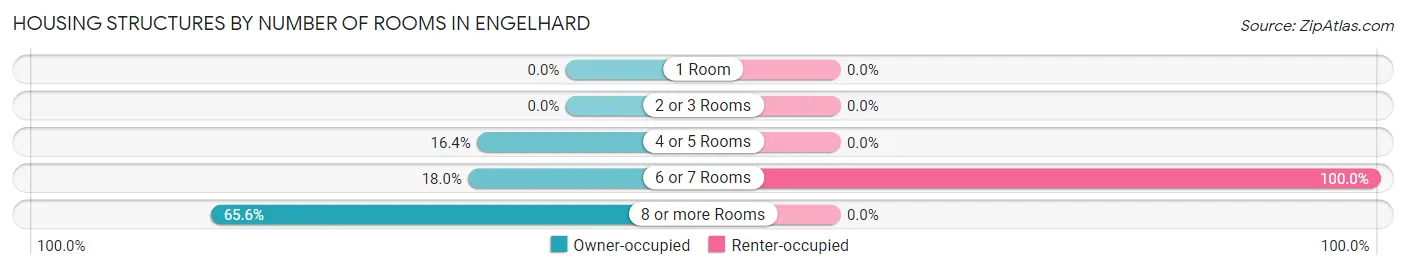
| Number of Rooms | Owner-occupied | Renter-occupied |
| 1 Room | 0 (0.0%) | 0 (0.0%) |
| 2 or 3 Rooms | 0 (0.0%) | 0 (0.0%) |
| 4 or 5 Rooms | 10 (16.4%) | 0 (0.0%) |
| 6 or 7 Rooms | 11 (18.0%) | 63 (100.0%) |
| 8 or more Rooms | 40 (65.6%) | 0 (0.0%) |
| Total | 61 (100.0%) | 63 (100.0%) |
Housing Structure by Heating Type in Engelhard
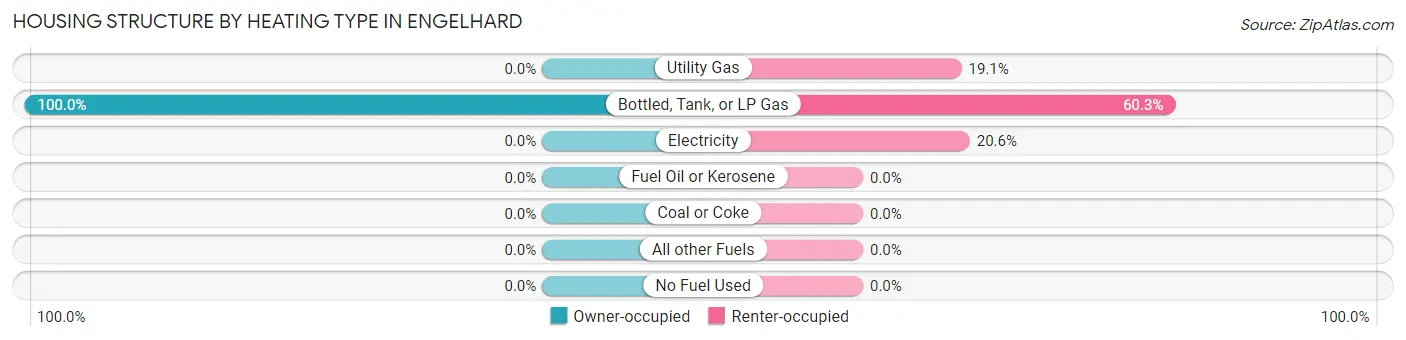
| Heating Type | Owner-occupied | Renter-occupied |
| Utility Gas | 0 (0.0%) | 12 (19.1%) |
| Bottled, Tank, or LP Gas | 61 (100.0%) | 38 (60.3%) |
| Electricity | 0 (0.0%) | 13 (20.6%) |
| Fuel Oil or Kerosene | 0 (0.0%) | 0 (0.0%) |
| Coal or Coke | 0 (0.0%) | 0 (0.0%) |
| All other Fuels | 0 (0.0%) | 0 (0.0%) |
| No Fuel Used | 0 (0.0%) | 0 (0.0%) |
| Total | 61 (100.0%) | 63 (100.0%) |
Household Vehicle Usage in Engelhard
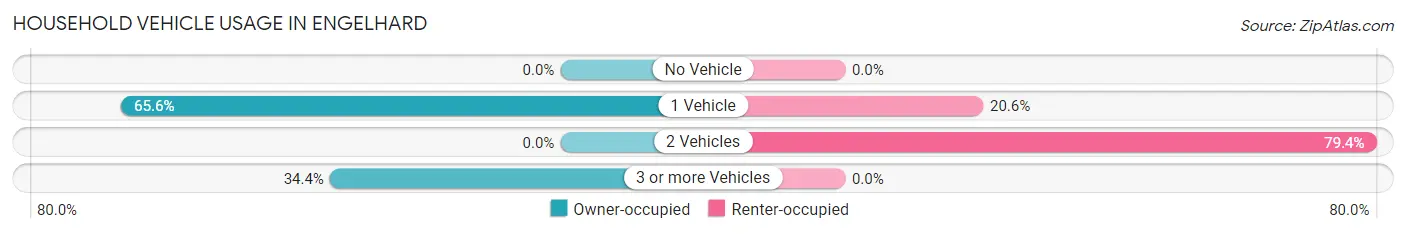
| Vehicles per Household | Owner-occupied | Renter-occupied |
| No Vehicle | 0 (0.0%) | 0 (0.0%) |
| 1 Vehicle | 40 (65.6%) | 13 (20.6%) |
| 2 Vehicles | 0 (0.0%) | 50 (79.4%) |
| 3 or more Vehicles | 21 (34.4%) | 0 (0.0%) |
| Total | 61 (100.0%) | 63 (100.0%) |
Real Estate & Mortgages in Engelhard
Real Estate and Mortgage Overview in Engelhard
| Characteristic | Without Mortgage | With Mortgage |
| Housing Units | 21 | 40 |
| Median Property Value | - | - |
| Median Household Income | - | - |
| Monthly Housing Costs | - | - |
| Real Estate Taxes | - | - |
Property Value by Mortgage Status in Engelhard
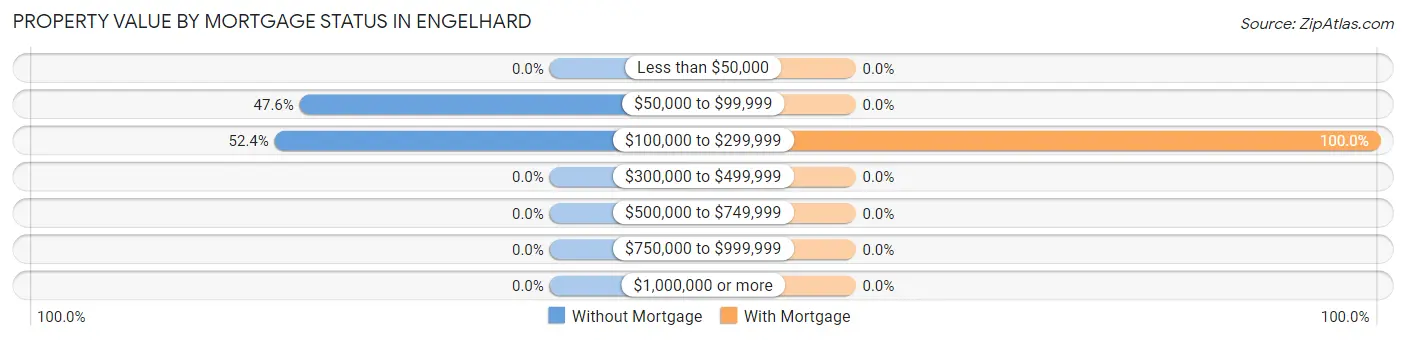
| Property Value | Without Mortgage | With Mortgage |
| Less than $50,000 | 0 (0.0%) | 0 (0.0%) |
| $50,000 to $99,999 | 10 (47.6%) | 0 (0.0%) |
| $100,000 to $299,999 | 11 (52.4%) | 40 (100.0%) |
| $300,000 to $499,999 | 0 (0.0%) | 0 (0.0%) |
| $500,000 to $749,999 | 0 (0.0%) | 0 (0.0%) |
| $750,000 to $999,999 | 0 (0.0%) | 0 (0.0%) |
| $1,000,000 or more | 0 (0.0%) | 0 (0.0%) |
| Total | 21 (100.0%) | 40 (100.0%) |
Household Income by Mortgage Status in Engelhard
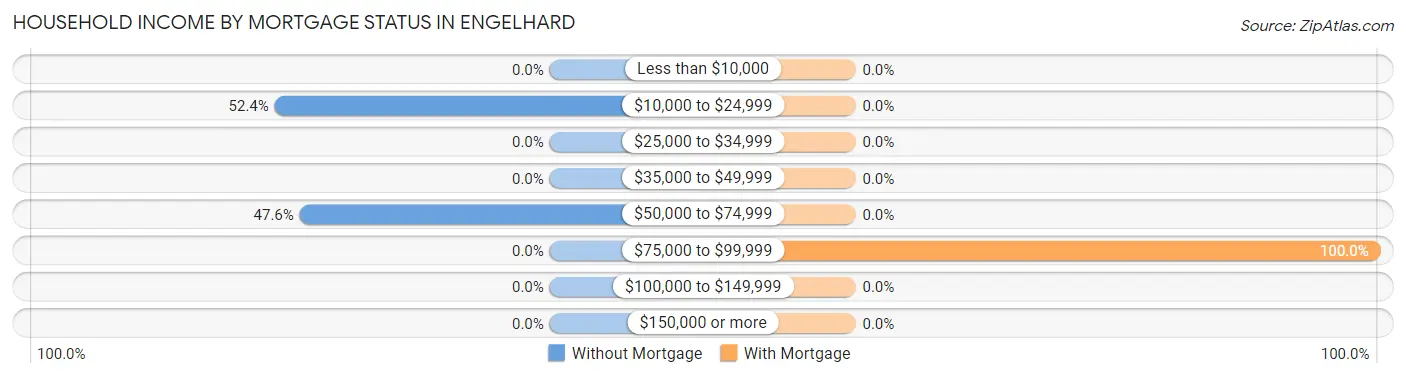
| Household Income | Without Mortgage | With Mortgage |
| Less than $10,000 | 0 (0.0%) | 0 (0.0%) |
| $10,000 to $24,999 | 11 (52.4%) | 0 (0.0%) |
| $25,000 to $34,999 | 0 (0.0%) | 0 (0.0%) |
| $35,000 to $49,999 | 0 (0.0%) | 0 (0.0%) |
| $50,000 to $74,999 | 10 (47.6%) | 0 (0.0%) |
| $75,000 to $99,999 | 0 (0.0%) | 40 (100.0%) |
| $100,000 to $149,999 | 0 (0.0%) | 0 (0.0%) |
| $150,000 or more | 0 (0.0%) | 0 (0.0%) |
| Total | 21 (100.0%) | 40 (100.0%) |
Property Value to Household Income Ratio in Engelhard
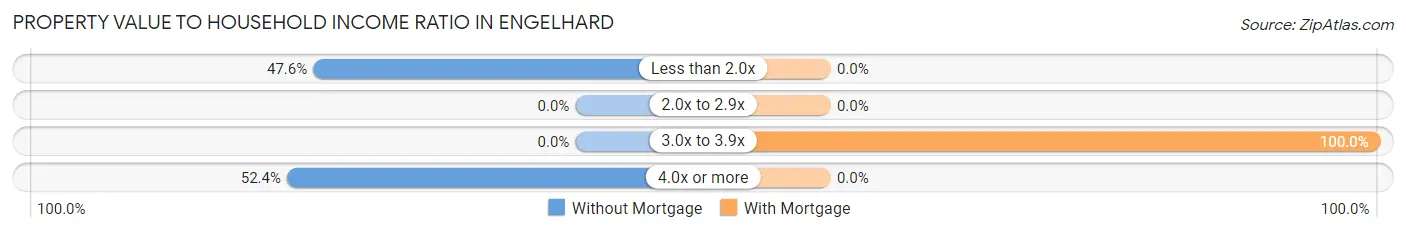
| Value-to-Income Ratio | Without Mortgage | With Mortgage |
| Less than 2.0x | 10 (47.6%) | 0 (0.0%) |
| 2.0x to 2.9x | 0 (0.0%) | 0 (0.0%) |
| 3.0x to 3.9x | 0 (0.0%) | 40 (100.0%) |
| 4.0x or more | 11 (52.4%) | 0 (0.0%) |
| Total | 21 (100.0%) | 40 (100.0%) |
Real Estate Taxes by Mortgage Status in Engelhard
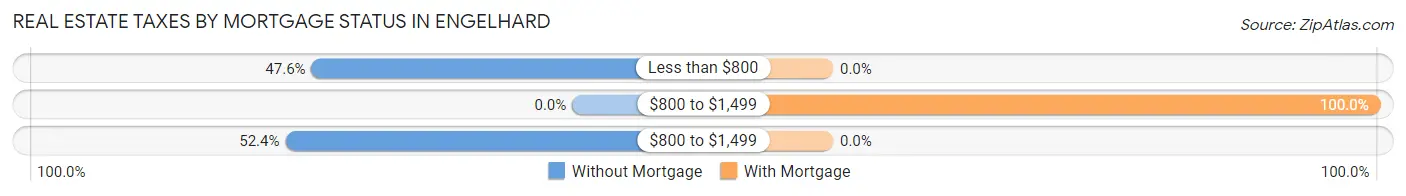
| Property Taxes | Without Mortgage | With Mortgage |
| Less than $800 | 10 (47.6%) | 0 (0.0%) |
| $800 to $1,499 | 0 (0.0%) | 40 (100.0%) |
| $800 to $1,499 | 11 (52.4%) | 0 (0.0%) |
| Total | 21 (100.0%) | 40 (100.0%) |
Health & Disability in Engelhard
Health Insurance Coverage by Age in Engelhard
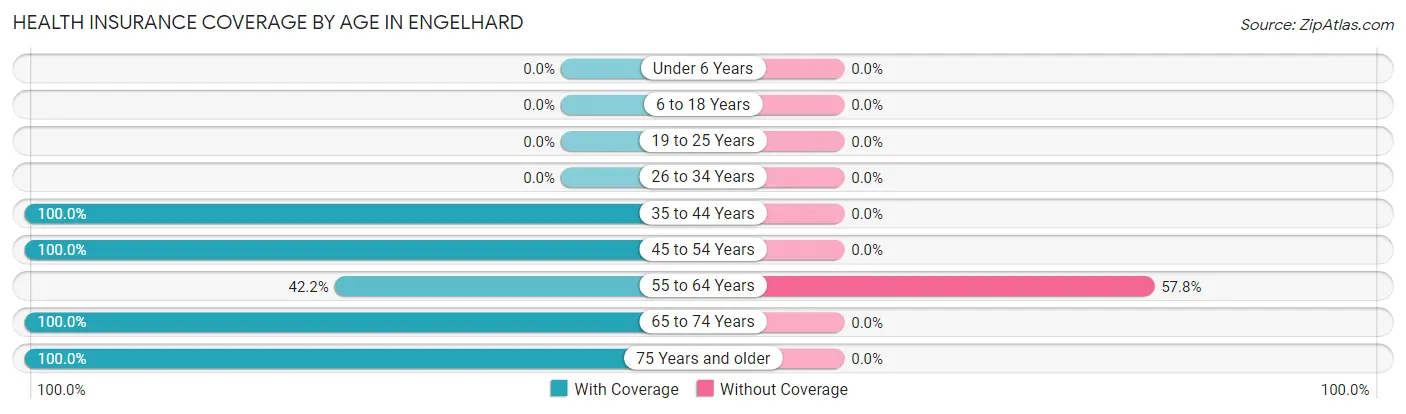
| Age Bracket | With Coverage | Without Coverage |
| Under 6 Years | 0 (0.0%) | 0 (0.0%) |
| 6 to 18 Years | 0 (0.0%) | 0 (0.0%) |
| 19 to 25 Years | 0 (0.0%) | 0 (0.0%) |
| 26 to 34 Years | 0 (0.0%) | 0 (0.0%) |
| 35 to 44 Years | 17 (100.0%) | 0 (0.0%) |
| 45 to 54 Years | 13 (100.0%) | 0 (0.0%) |
| 55 to 64 Years | 73 (42.2%) | 100 (57.8%) |
| 65 to 74 Years | 32 (100.0%) | 0 (0.0%) |
| 75 Years and older | 19 (100.0%) | 0 (0.0%) |
| Total | 154 (60.6%) | 100 (39.4%) |
Health Insurance Coverage by Citizenship Status in Engelhard
| Citizenship Status | With Coverage | Without Coverage |
| Native Born | 0 (0.0%) | 0 (0.0%) |
| Foreign Born, Citizen | 0 (0.0%) | 0 (0.0%) |
| Foreign Born, not a Citizen | 0 (0.0%) | 0 (0.0%) |
Health Insurance Coverage by Household Income in Engelhard
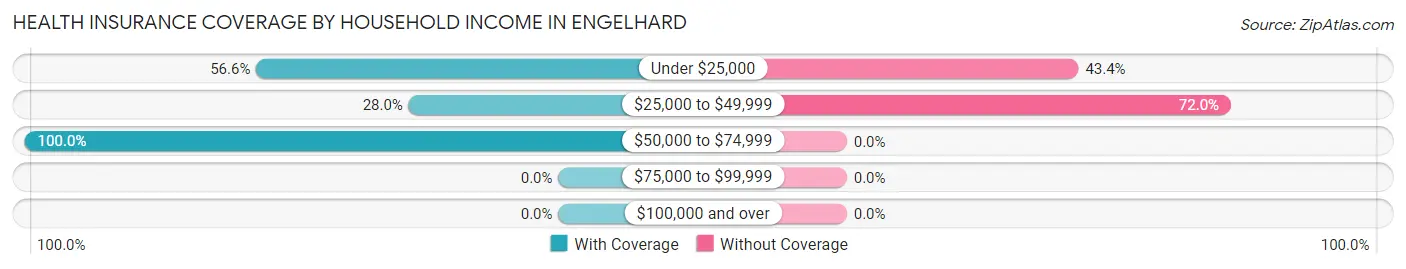
| Household Income | With Coverage | Without Coverage |
| Under $25,000 | 30 (56.6%) | 23 (43.4%) |
| $25,000 to $49,999 | 30 (28.0%) | 77 (72.0%) |
| $50,000 to $74,999 | 94 (100.0%) | 0 (0.0%) |
| $75,000 to $99,999 | 0 (0.0%) | 0 (0.0%) |
| $100,000 and over | 0 (0.0%) | 0 (0.0%) |
Public vs Private Health Insurance Coverage by Age in Engelhard
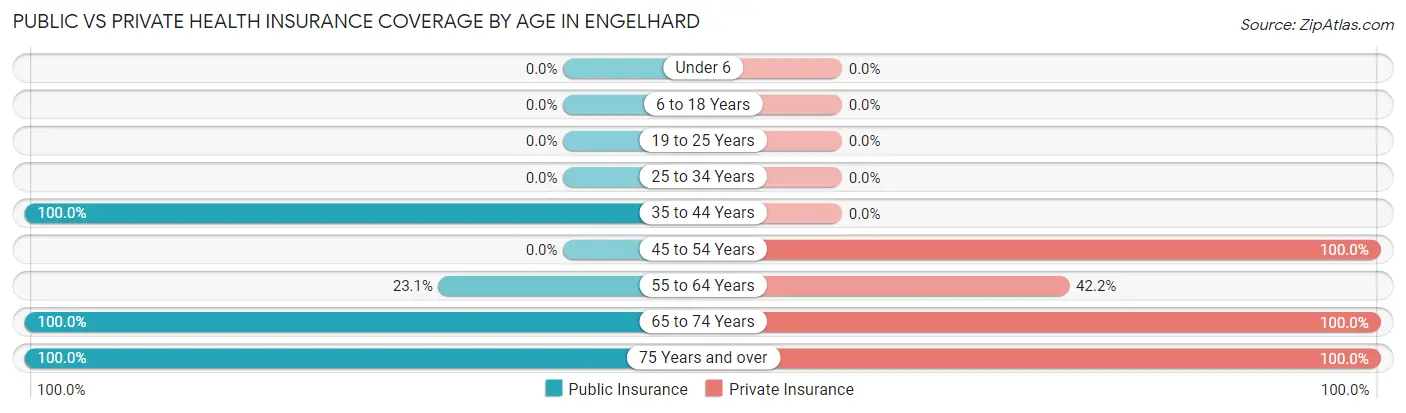
| Age Bracket | Public Insurance | Private Insurance |
| Under 6 | 0 (0.0%) | 0 (0.0%) |
| 6 to 18 Years | 0 (0.0%) | 0 (0.0%) |
| 19 to 25 Years | 0 (0.0%) | 0 (0.0%) |
| 25 to 34 Years | 0 (0.0%) | 0 (0.0%) |
| 35 to 44 Years | 17 (100.0%) | 0 (0.0%) |
| 45 to 54 Years | 0 (0.0%) | 13 (100.0%) |
| 55 to 64 Years | 40 (23.1%) | 73 (42.2%) |
| 65 to 74 Years | 32 (100.0%) | 32 (100.0%) |
| 75 Years and over | 19 (100.0%) | 19 (100.0%) |
| Total | 108 (42.5%) | 137 (53.9%) |
Disability Status by Sex by Age in Engelhard
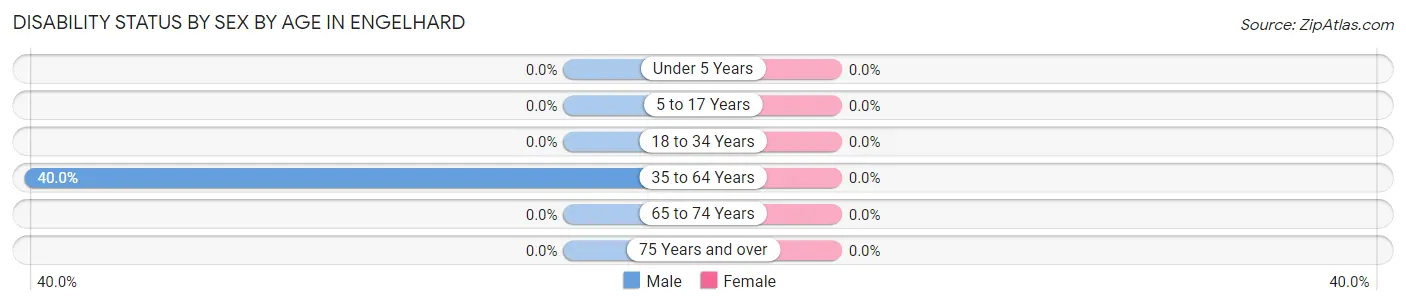
| Age Bracket | Male | Female |
| Under 5 Years | 0 (0.0%) | 0 (0.0%) |
| 5 to 17 Years | 0 (0.0%) | 0 (0.0%) |
| 18 to 34 Years | 0 (0.0%) | 0 (0.0%) |
| 35 to 64 Years | 38 (40.0%) | 0 (0.0%) |
| 65 to 74 Years | 0 (0.0%) | 0 (0.0%) |
| 75 Years and over | 0 (0.0%) | 0 (0.0%) |
Disability Class by Sex by Age in Engelhard
Disability Class: Hearing Difficulty
| Age Bracket | Male | Female |
| Under 5 Years | 0 (0.0%) | 0 (0.0%) |
| 5 to 17 Years | 0 (0.0%) | 0 (0.0%) |
| 18 to 34 Years | 0 (0.0%) | 0 (0.0%) |
| 35 to 64 Years | 0 (0.0%) | 0 (0.0%) |
| 65 to 74 Years | 0 (0.0%) | 0 (0.0%) |
| 75 Years and over | 0 (0.0%) | 0 (0.0%) |
Disability Class: Vision Difficulty
| Age Bracket | Male | Female |
| Under 5 Years | 0 (0.0%) | 0 (0.0%) |
| 5 to 17 Years | 0 (0.0%) | 0 (0.0%) |
| 18 to 34 Years | 0 (0.0%) | 0 (0.0%) |
| 35 to 64 Years | 0 (0.0%) | 0 (0.0%) |
| 65 to 74 Years | 0 (0.0%) | 0 (0.0%) |
| 75 Years and over | 0 (0.0%) | 0 (0.0%) |
Disability Class: Cognitive Difficulty
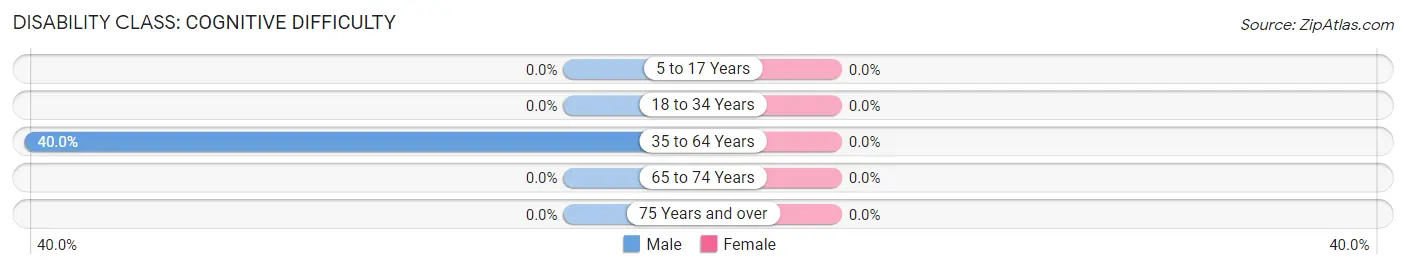
| Age Bracket | Male | Female |
| 5 to 17 Years | 0 (0.0%) | 0 (0.0%) |
| 18 to 34 Years | 0 (0.0%) | 0 (0.0%) |
| 35 to 64 Years | 38 (40.0%) | 0 (0.0%) |
| 65 to 74 Years | 0 (0.0%) | 0 (0.0%) |
| 75 Years and over | 0 (0.0%) | 0 (0.0%) |
Disability Class: Ambulatory Difficulty
| Age Bracket | Male | Female |
| 5 to 17 Years | 0 (0.0%) | 0 (0.0%) |
| 18 to 34 Years | 0 (0.0%) | 0 (0.0%) |
| 35 to 64 Years | 0 (0.0%) | 0 (0.0%) |
| 65 to 74 Years | 0 (0.0%) | 0 (0.0%) |
| 75 Years and over | 0 (0.0%) | 0 (0.0%) |
Disability Class: Self-Care Difficulty
| Age Bracket | Male | Female |
| 5 to 17 Years | 0 (0.0%) | 0 (0.0%) |
| 18 to 34 Years | 0 (0.0%) | 0 (0.0%) |
| 35 to 64 Years | 0 (0.0%) | 0 (0.0%) |
| 65 to 74 Years | 0 (0.0%) | 0 (0.0%) |
| 75 Years and over | 0 (0.0%) | 0 (0.0%) |
Technology Access in Engelhard
Computing Device Access in Engelhard
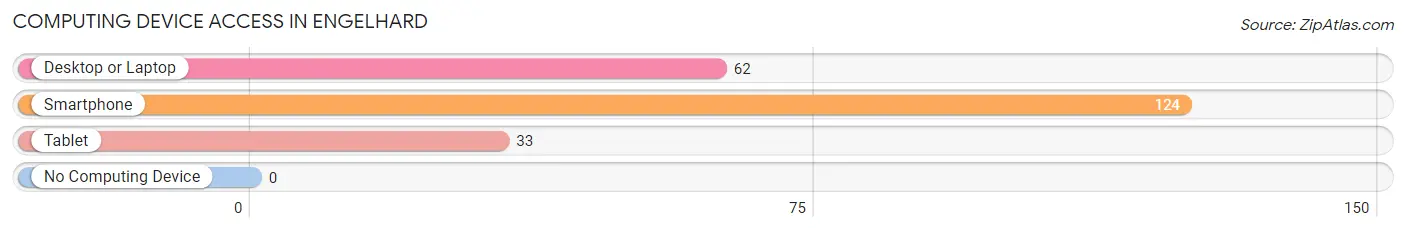
| Device Type | # Households | % Households |
| Desktop or Laptop | 62 | 50.0% |
| Smartphone | 124 | 100.0% |
| Tablet | 33 | 26.6% |
| No Computing Device | 0 | 0.0% |
| Total | 124 | 100.0% |
Internet Access in Engelhard
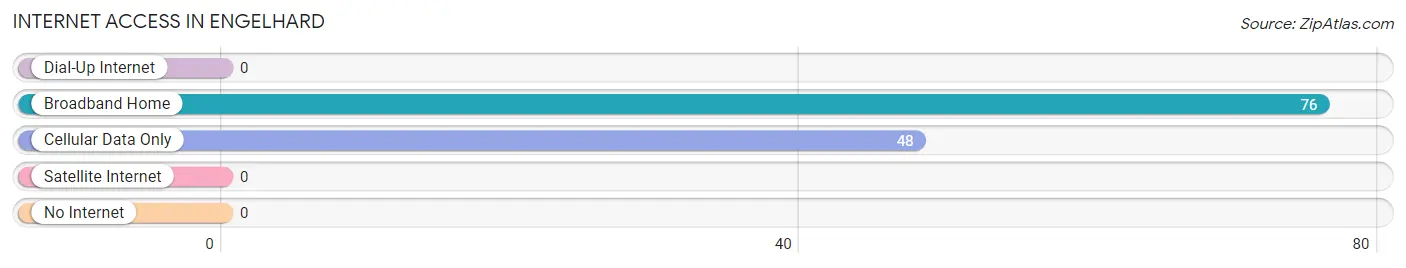
| Internet Type | # Households | % Households |
| Dial-Up Internet | 0 | 0.0% |
| Broadband Home | 76 | 61.3% |
| Cellular Data Only | 48 | 38.7% |
| Satellite Internet | 0 | 0.0% |
| No Internet | 0 | 0.0% |
| Total | 124 | 100.0% |
Engelhard Summary
Engelhard is a small town located in Hyde County, North Carolina. It is situated on the banks of the Pamlico Sound, and is part of the Outer Banks region. The town has a population of approximately 1,000 people, and is known for its fishing and seafood industry.
Geography
Engelhard is located in Hyde County, North Carolina, on the banks of the Pamlico Sound. The town is situated on the eastern side of the Outer Banks, and is bordered by the towns of Swan Quarter and Fairfield. The town is located approximately 30 miles south of the city of New Bern, and is approximately 50 miles north of the city of Wilmington. The town is situated on a peninsula, and is surrounded by water on three sides. The town is located in a humid subtropical climate zone, and experiences hot, humid summers and mild winters.
Economy
Engelhard is a small town with a population of approximately 1,000 people. The town is known for its fishing and seafood industry, and is home to several seafood processing plants. The town is also home to a number of small businesses, including restaurants, retail stores, and a marina. The town is also home to a number of tourist attractions, including a museum, a lighthouse, and a wildlife refuge.
Demographics
As of the 2010 census, the population of Engelhard was 1,000 people. The racial makeup of the town was 94.2% White, 3.2% African American, 0.7% Native American, 0.3% Asian, and 1.6% from other races. The median household income in Engelhard was $30,000, and the median family income was $35,000. The per capita income in Engelhard was $14,000.
Conclusion
Engelhard is a small town located in Hyde County, North Carolina. It is situated on the banks of the Pamlico Sound, and is part of the Outer Banks region. The town has a population of approximately 1,000 people, and is known for its fishing and seafood industry. The town is home to a number of small businesses, including restaurants, retail stores, and a marina. The town is also home to a number of tourist attractions, including a museum, a lighthouse, and a wildlife refuge. The racial makeup of the town is 94.2% White, 3.2% African American, 0.7% Native American, 0.3% Asian, and 1.6% from other races. The median household income in Engelhard was $30,000, and the median family income was $35,000. The per capita income in Engelhard was $14,000.
Common Questions
What is Per Capita Income in Engelhard?
Per Capita income in Engelhard is $17,089.
What is the Median Family Income in Engelhard?
Median Family Income in Engelhard is $50,675.
What is the Median Household income in Engelhard?
Median Household Income in Engelhard is $35,192.
What is Inequality or Gini Index in Engelhard?
Inequality or Gini Index in Engelhard is 0.20.
What is the Total Population of Engelhard?
Total Population of Engelhard is 254.
What is the Total Male Population of Engelhard?
Total Male Population of Engelhard is 124.
What is the Total Female Population of Engelhard?
Total Female Population of Engelhard is 130.
What is the Ratio of Males per 100 Females in Engelhard?
There are 95.38 Males per 100 Females in Engelhard.
What is the Ratio of Females per 100 Males in Engelhard?
There are 104.84 Females per 100 Males in Engelhard.
What is the Median Population Age in Engelhard?
Median Population Age in Engelhard is 62.9 Years.
What is the Average Family Size in Engelhard
Average Family Size in Engelhard is 2.0 People.
What is the Average Household Size in Engelhard
Average Household Size in Engelhard is 2.0 People.
How Large is the Labor Force in Engelhard?
There are 125 People in the Labor Forcein in Engelhard.
What is the Percentage of People in the Labor Force in Engelhard?
49.2% of People are in the Labor Force in Engelhard.