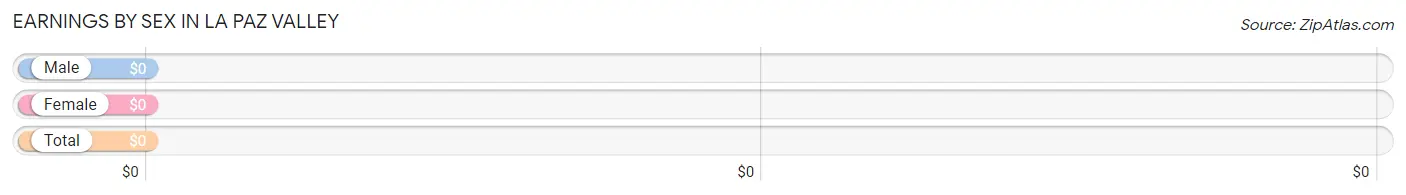
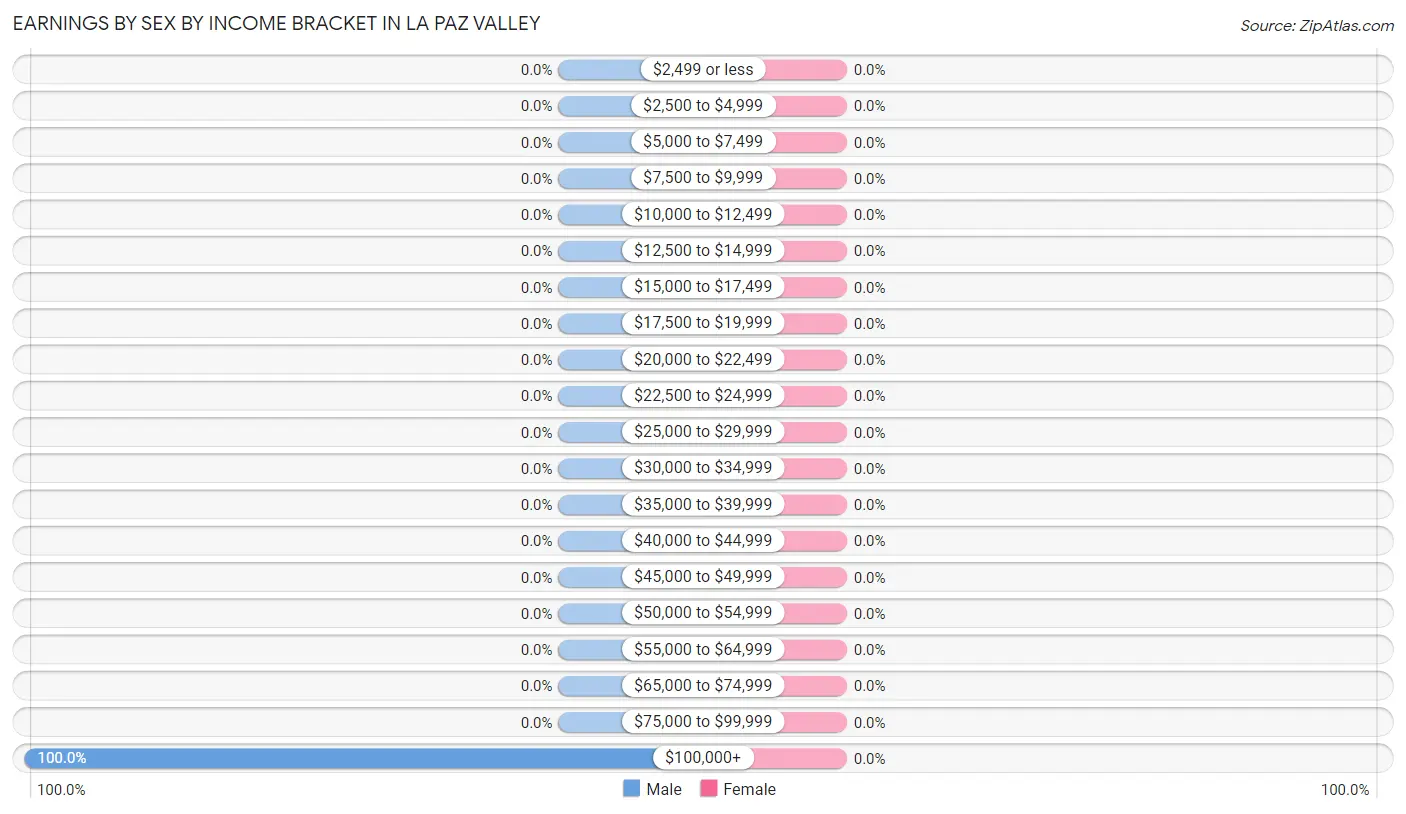
Earnings by Sex by Income Bracket in La Paz Valley
Income
Male
Female
$2,499 or less
0 (0.0%)
0 (0.0%)
$2,500 to $4,999
0 (0.0%)
0 (0.0%)
$5,000 to $7,499
0 (0.0%)
0 (0.0%)
$7,500 to $9,999
0 (0.0%)
0 (0.0%)
$10,000 to $12,499
0 (0.0%)
0 (0.0%)
$12,500 to $14,999
0 (0.0%)
0 (0.0%)
$15,000 to $17,499
0 (0.0%)
0 (0.0%)
$17,500 to $19,999
0 (0.0%)
0 (0.0%)
$20,000 to $22,499
0 (0.0%)
0 (0.0%)
$22,500 to $24,999
0 (0.0%)
0 (0.0%)
$25,000 to $29,999
0 (0.0%)
0 (0.0%)
$30,000 to $34,999
0 (0.0%)
0 (0.0%)
$35,000 to $39,999
0 (0.0%)
0 (0.0%)
$40,000 to $44,999
0 (0.0%)
0 (0.0%)
$45,000 to $49,999
0 (0.0%)
0 (0.0%)
$50,000 to $54,999
0 (0.0%)
0 (0.0%)
$55,000 to $64,999
0 (0.0%)
0 (0.0%)
$65,000 to $74,999
0 (0.0%)
0 (0.0%)
$75,000 to $99,999
0 (0.0%)
0 (0.0%)
$100,000+
44 (100.0%)
0 (0.0%)
Total
44 (100.0%)
0 (0.0%)
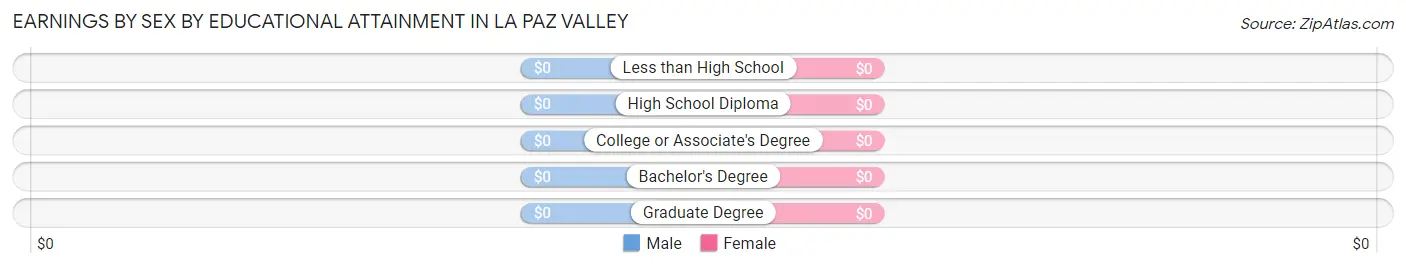
Earnings by Sex by Educational Attainment in La Paz Valley
Educational Attainment
Male Income
Female Income
Less than High School
-
-
High School Diploma
-
-
College or Associate's Degree
-
-
Bachelor's Degree
-
-
Graduate Degree
-
-
Total
-
-
Family Income in La Paz Valley
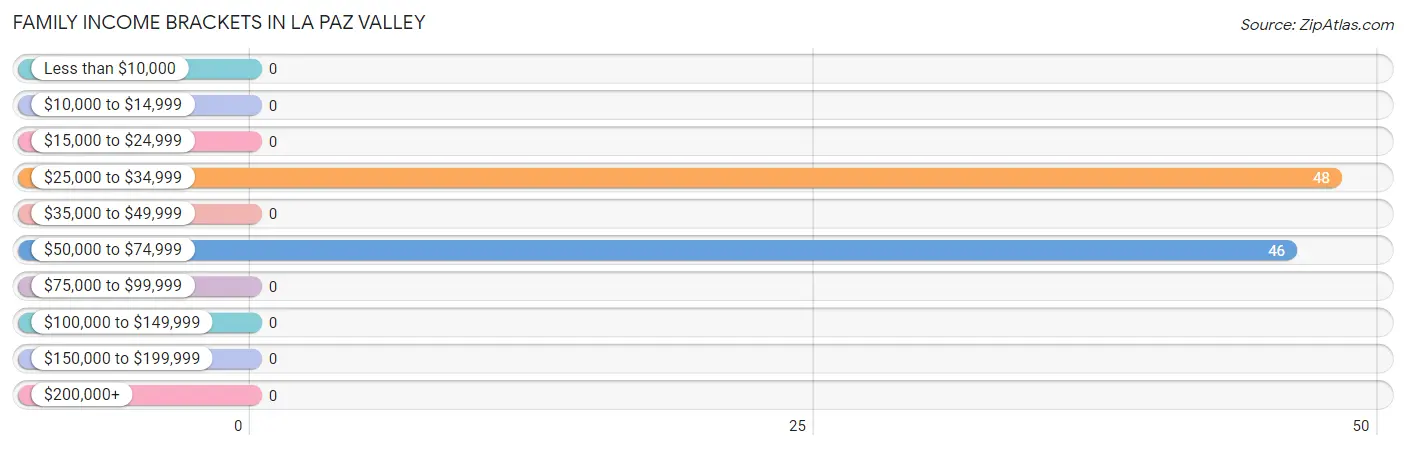
Family Income Brackets in La Paz Valley
According to the La Paz Valley family income data, there are 48 families falling into the $25,000 to $34,999 income range, which is the most common income bracket and makes up 51.1% of all families.
Income Bracket
# Families
% Families
Less than $10,000
0
0.0%
$10,000 to $14,999
0
0.0%
$15,000 to $24,999
0
0.0%
$25,000 to $34,999
48
51.1%
$35,000 to $49,999
0
0.0%
$50,000 to $74,999
46
48.9%
$75,000 to $99,999
0
0.0%
$100,000 to $149,999
0
0.0%
$150,000 to $199,999
0
0.0%
$200,000+
0
0.0%
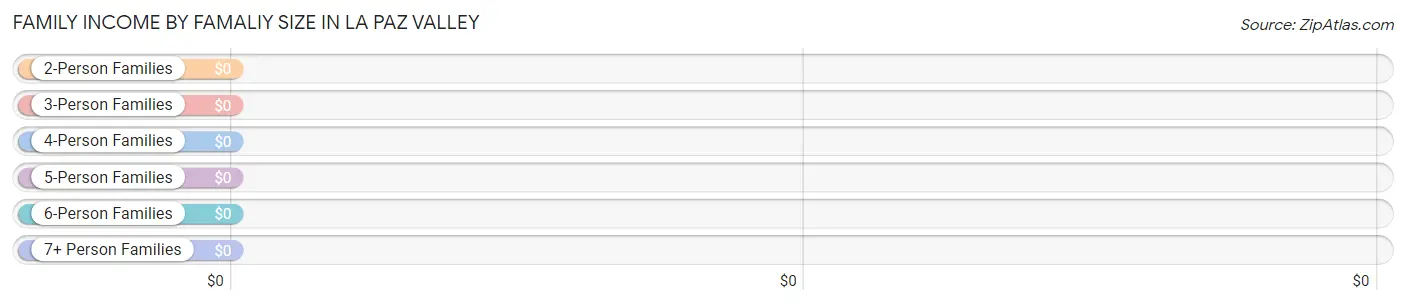
Family Income by Famaliy Size in La Paz Valley
Income Bracket
# Families
Median Income
2-Person Families
94 (100.0%)
$0
3-Person Families
0 (0.0%)
$0
4-Person Families
0 (0.0%)
$0
5-Person Families
0 (0.0%)
$0
6-Person Families
0 (0.0%)
$0
7+ Person Families
0 (0.0%)
$0
Total
94 (100.0%)
$0
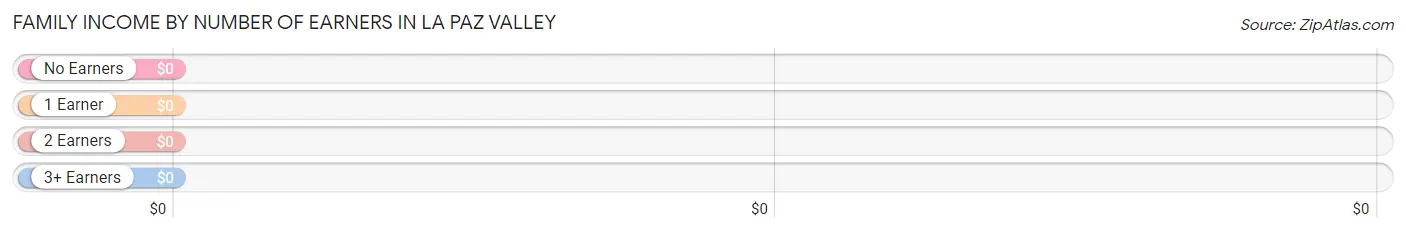
Family Income by Number of Earners in La Paz Valley
Number of Earners
# Families
Median Income
No Earners
94 (100.0%)
$0
1 Earner
0 (0.0%)
$0
2 Earners
0 (0.0%)
$0
3+ Earners
0 (0.0%)
$0
Total
94 (100.0%)
$0
Household Income in La Paz Valley
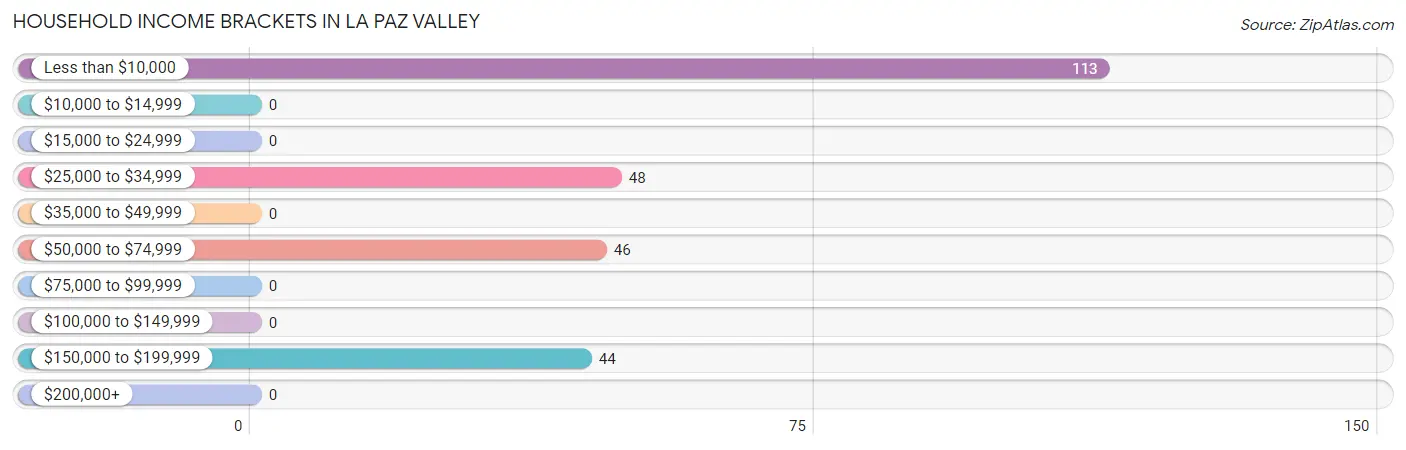
Household Income Brackets in La Paz Valley
With 113 households falling in the category, the less than $10,000 income range is the most frequent in La Paz Valley, accounting for 45.0% of all households.
Income Bracket
# Households
% Households
Less than $10,000
113
45.0%
$10,000 to $14,999
0
0.0%
$15,000 to $24,999
0
0.0%
$25,000 to $34,999
48
19.1%
$35,000 to $49,999
0
0.0%
$50,000 to $74,999
46
18.3%
$75,000 to $99,999
0
0.0%
$100,000 to $149,999
0
0.0%
$150,000 to $199,999
44
17.5%
$200,000+
0
0.0%
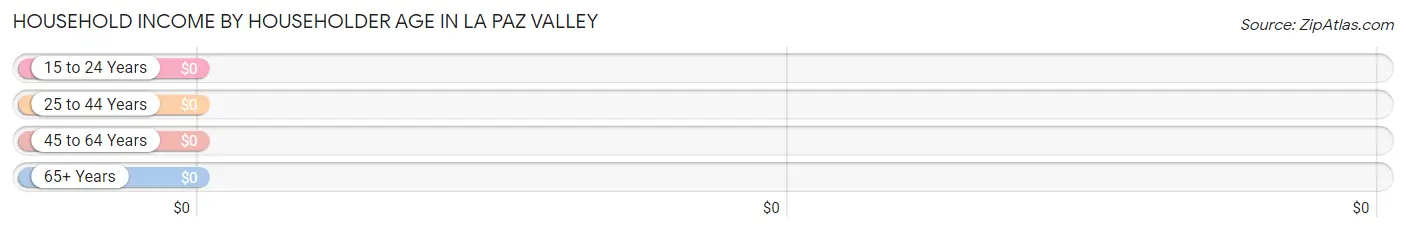
Household Income by Householder Age in La Paz Valley
Income Bracket
# Households
Median Income
15 to 24 Years
66 (26.3%)
$0
25 to 44 Years
0 (0.0%)
$0
45 to 64 Years
44 (17.5%)
$0
65+ Years
141 (56.2%)
$0
Total
251 (100.0%)
$0
Poverty in La Paz Valley
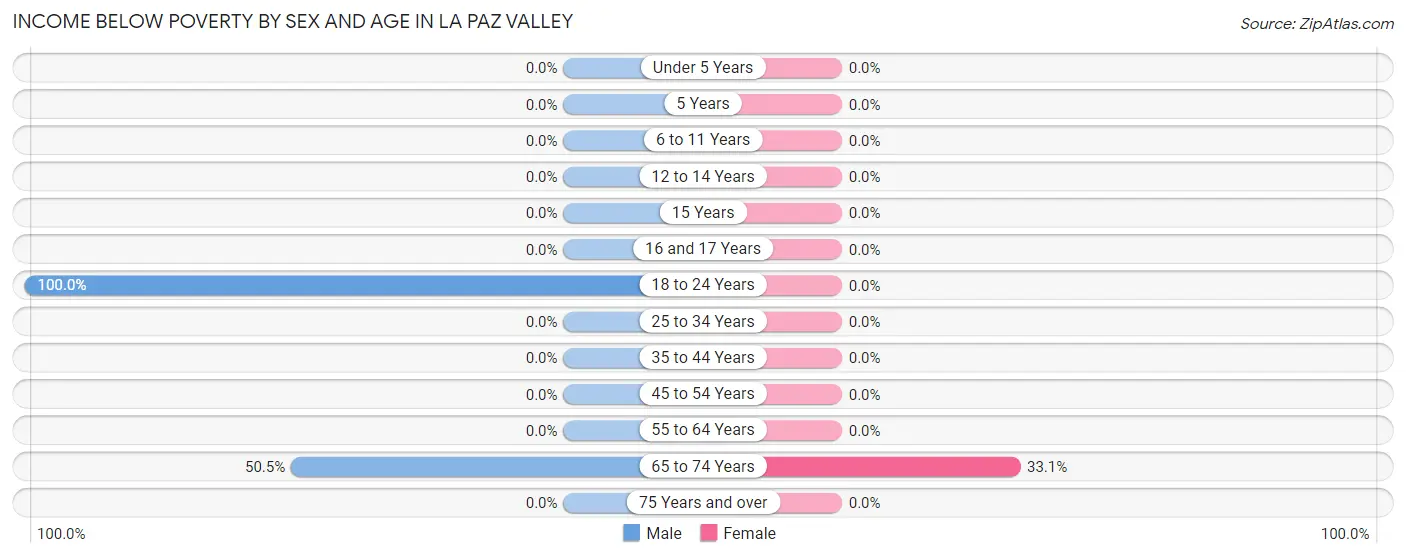
Income Below Poverty by Sex and Age in La Paz Valley
With 34.2% poverty level for males and 33.1% for females among the residents of La Paz Valley, 18 to 24 year old males and 65 to 74 year old females are the most vulnerable to poverty, with 66 males (100.0%) and 46 females (33.1%) in their respective age groups living below the poverty level.
Age Bracket
Male
Female
Under 5 Years
0 (0.0%)
0 (0.0%)
5 Years
0 (0.0%)
0 (0.0%)
6 to 11 Years
0 (0.0%)
0 (0.0%)
12 to 14 Years
0 (0.0%)
0 (0.0%)
15 Years
0 (0.0%)
0 (0.0%)
16 and 17 Years
0 (0.0%)
0 (0.0%)
18 to 24 Years
66 (100.0%)
0 (0.0%)
25 to 34 Years
0 (0.0%)
0 (0.0%)
35 to 44 Years
0 (0.0%)
0 (0.0%)
45 to 54 Years
0 (0.0%)
0 (0.0%)
55 to 64 Years
0 (0.0%)
0 (0.0%)
65 to 74 Years
47 (50.5%)
46 (33.1%)
75 Years and over
0 (0.0%)
0 (0.0%)
Total
113 (34.2%)
46 (33.1%)
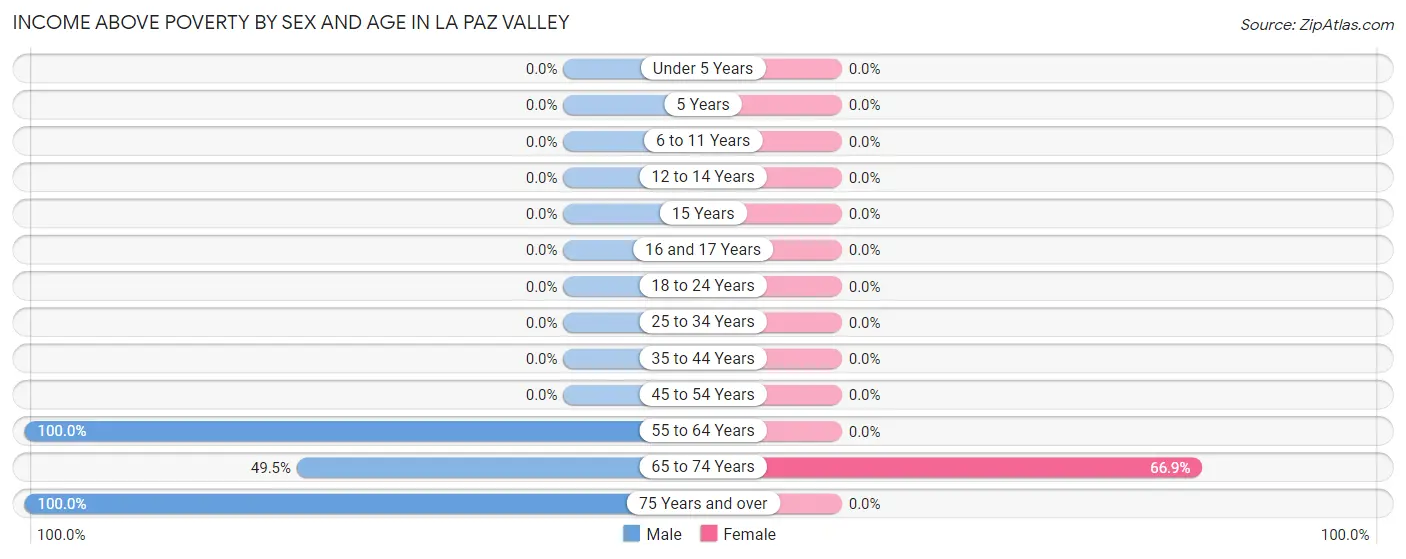
Income Above Poverty by Sex and Age in La Paz Valley
According to the poverty statistics in La Paz Valley, males aged 55 to 64 years and females aged 65 to 74 years are the age groups that are most secure financially, with 100.0% of males and 66.9% of females in these age groups living above the poverty line.
Age Bracket
Male
Female
Under 5 Years
0 (0.0%)
0 (0.0%)
5 Years
0 (0.0%)
0 (0.0%)
6 to 11 Years
0 (0.0%)
0 (0.0%)
12 to 14 Years
0 (0.0%)
0 (0.0%)
15 Years
0 (0.0%)
0 (0.0%)
16 and 17 Years
0 (0.0%)
0 (0.0%)
18 to 24 Years
0 (0.0%)
0 (0.0%)
25 to 34 Years
0 (0.0%)
0 (0.0%)
35 to 44 Years
0 (0.0%)
0 (0.0%)
45 to 54 Years
0 (0.0%)
0 (0.0%)
55 to 64 Years
44 (100.0%)
0 (0.0%)
65 to 74 Years
46 (49.5%)
93 (66.9%)
75 Years and over
127 (100.0%)
0 (0.0%)
Total
217 (65.8%)
93 (66.9%)
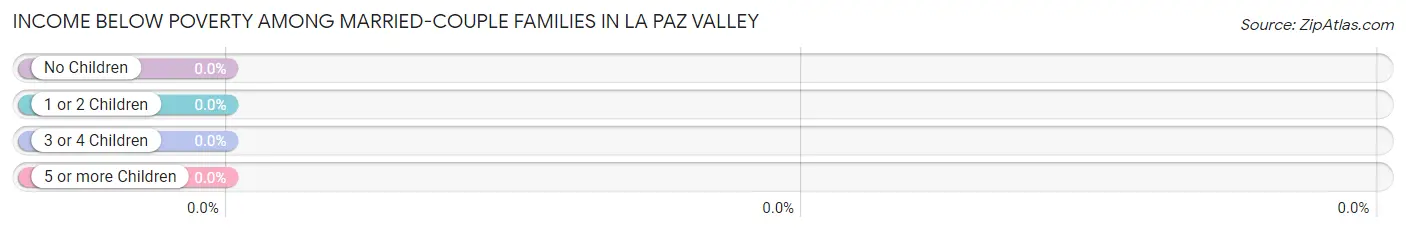
Income Below Poverty Among Married-Couple Families in La Paz Valley
Children
Above Poverty
Below Poverty
No Children
94 (100.0%)
0 (0.0%)
1 or 2 Children
0 (0.0%)
0 (0.0%)
3 or 4 Children
0 (0.0%)
0 (0.0%)
5 or more Children
0 (0.0%)
0 (0.0%)
Total
94 (100.0%)
0 (0.0%)
Income Below Poverty Among Single-Parent Households in La Paz Valley
Children
Single Father
Single Mother
No Children
0 (0.0%)
0 (0.0%)
1 or 2 Children
0 (0.0%)
0 (0.0%)
3 or 4 Children
0 (0.0%)
0 (0.0%)
5 or more Children
0 (0.0%)
0 (0.0%)
Total
0 (0.0%)
0 (0.0%)
Income Below Poverty Among Married-Couple vs Single-Parent Households in La Paz Valley
Children
Married-Couple Families
Single-Parent Households
No Children
0 (0.0%)
0 (0.0%)
1 or 2 Children
0 (0.0%)
0 (0.0%)
3 or 4 Children
0 (0.0%)
0 (0.0%)
5 or more Children
0 (0.0%)
0 (0.0%)
Total
0 (0.0%)
0 (0.0%)
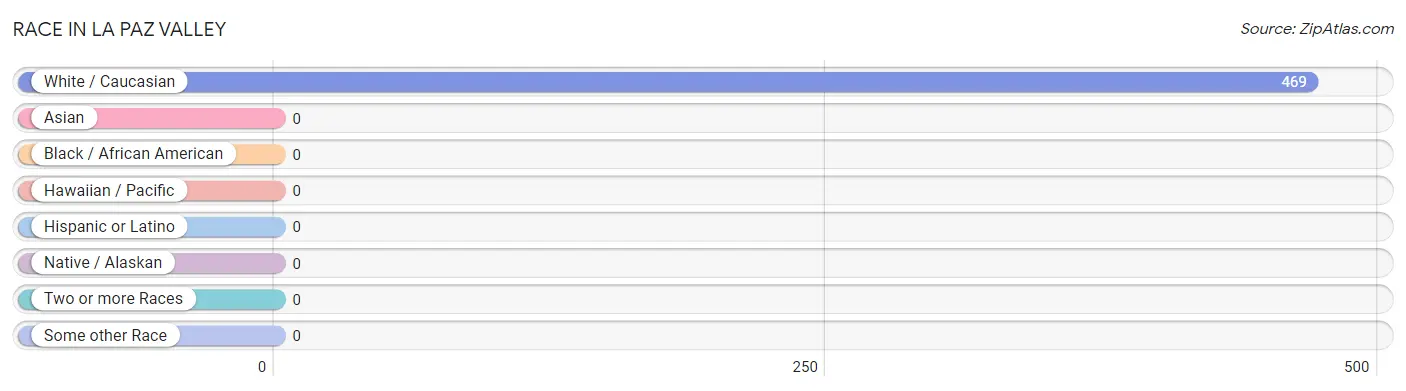
Race in La Paz Valley
The most populous races in La Paz Valley are , and White / Caucasian (469 | 100.0%).
Race
# Population
% Population
Asian
0
0.0%
Black / African American
0
0.0%
Hawaiian / Pacific
0
0.0%
Hispanic or Latino
0
0.0%
Native / Alaskan
0
0.0%
White / Caucasian
469
100.0%
Two or more Races
0
0.0%
Some other Race
0
0.0%
Total
469
100.0%
Ancestry in La Paz Valley
The most populous ancestries reported in La Paz Valley are , and Polish (44 | 9.4%), together accounting for 9.4% of all La Paz Valley residents.
Ancestry
# Population
% Population
Polish
44
9.4%
View All 1 Rows
Immigrants in La Paz Valley
Immigration Origin
# Population
% Population
View All 0 Rows
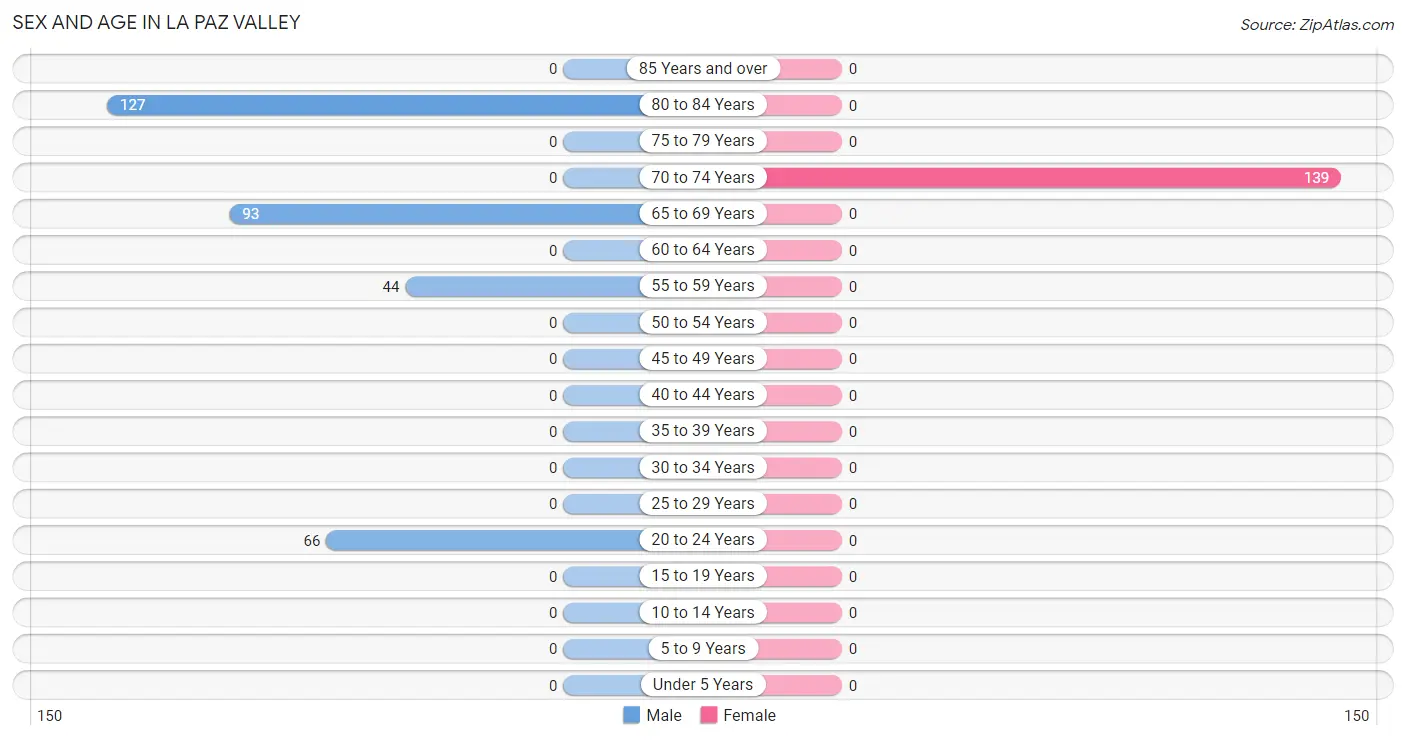
Sex and Age in La Paz Valley
Sex and Age in La Paz Valley
The most populous age groups in La Paz Valley are 80 to 84 Years (127 | 38.5%) for men and 70 to 74 Years (139 | 100.0%) for women.
Age Bracket
Male
Female
Under 5 Years
0 (0.0%)
0 (0.0%)
5 to 9 Years
0 (0.0%)
0 (0.0%)
10 to 14 Years
0 (0.0%)
0 (0.0%)
15 to 19 Years
0 (0.0%)
0 (0.0%)
20 to 24 Years
66 (20.0%)
0 (0.0%)
25 to 29 Years
0 (0.0%)
0 (0.0%)
30 to 34 Years
0 (0.0%)
0 (0.0%)
35 to 39 Years
0 (0.0%)
0 (0.0%)
40 to 44 Years
0 (0.0%)
0 (0.0%)
45 to 49 Years
0 (0.0%)
0 (0.0%)
50 to 54 Years
0 (0.0%)
0 (0.0%)
55 to 59 Years
44 (13.3%)
0 (0.0%)
60 to 64 Years
0 (0.0%)
0 (0.0%)
65 to 69 Years
93 (28.2%)
0 (0.0%)
70 to 74 Years
0 (0.0%)
139 (100.0%)
75 to 79 Years
0 (0.0%)
0 (0.0%)
80 to 84 Years
127 (38.5%)
0 (0.0%)
85 Years and over
0 (0.0%)
0 (0.0%)
Total
330 (100.0%)
139 (100.0%)
Families and Households in La Paz Valley
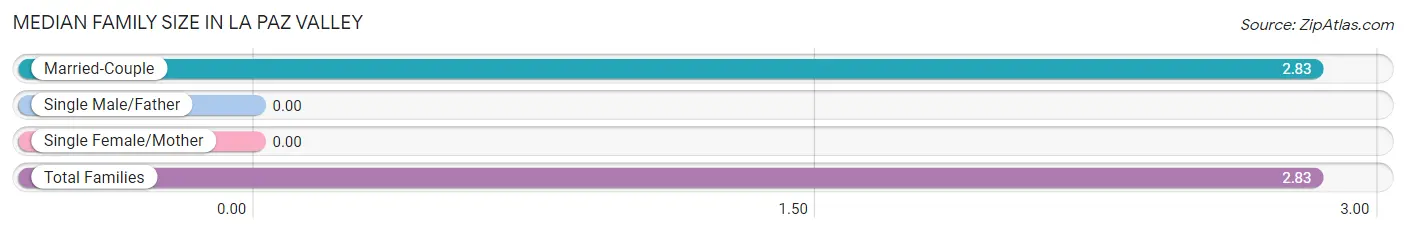
Median Family Size in La Paz Valley
Family Type
# Families
Family Size
Married-Couple
94 (100.0%)
2.83
Single Male/Father
0 (0.0%)
-
Single Female/Mother
0 (0.0%)
-
Total Families
94 (100.0%)
2.83
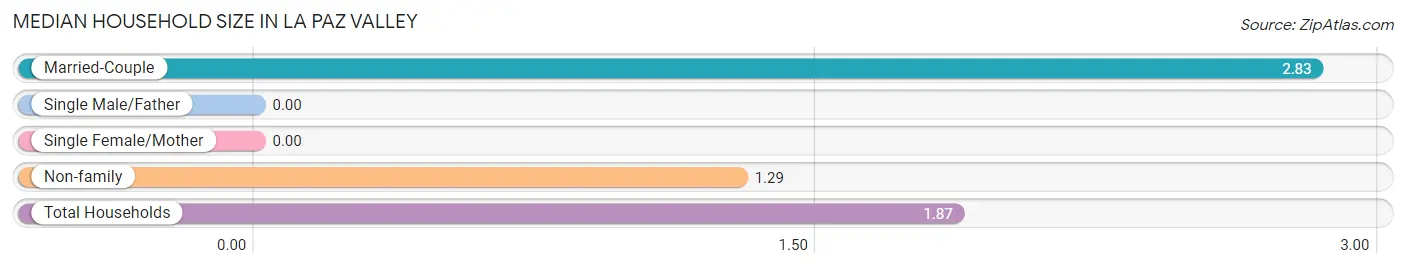
Median Household Size in La Paz Valley
Household Type
# Households
Household Size
Married-Couple
94 (37.4%)
2.83
Single Male/Father
0 (0.0%)
-
Single Female/Mother
0 (0.0%)
-
Non-family
157 (62.5%)
1.29
Total Households
251 (100.0%)
1.87
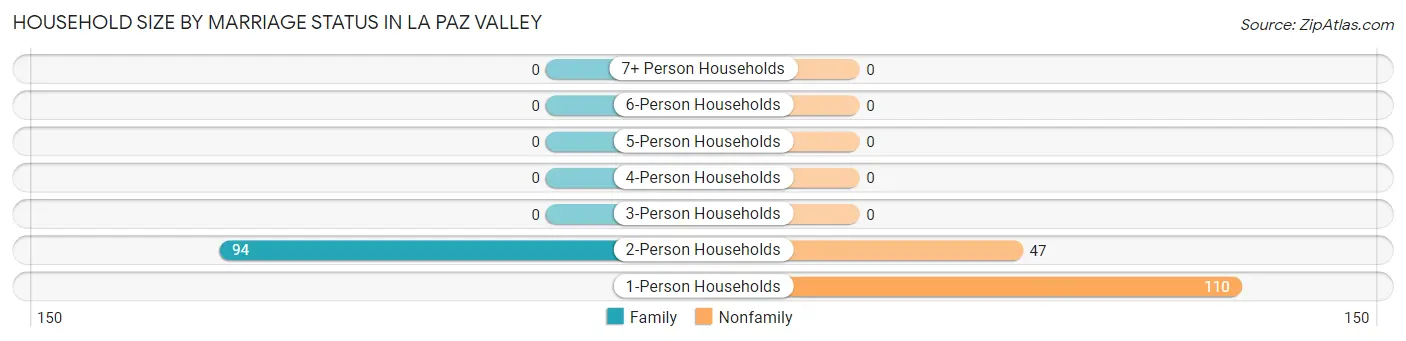
Household Size by Marriage Status in La Paz Valley
Out of a total of 251 households in La Paz Valley, 94 (37.4%) are family households, while 157 (62.5%) are nonfamily households. The most numerous type of family households are 2-person households, comprising 94, and the most common type of nonfamily households are 1-person households, comprising 110.
Household Size
Family Households
Nonfamily Households
1-Person Households
-
110 (43.8%)
2-Person Households
94 (37.4%)
47 (18.7%)
3-Person Households
0 (0.0%)
0 (0.0%)
4-Person Households
0 (0.0%)
0 (0.0%)
5-Person Households
0 (0.0%)
0 (0.0%)
6-Person Households
0 (0.0%)
0 (0.0%)
7+ Person Households
0 (0.0%)
0 (0.0%)
Total
94 (37.4%)
157 (62.5%)
Female Fertility in La Paz Valley
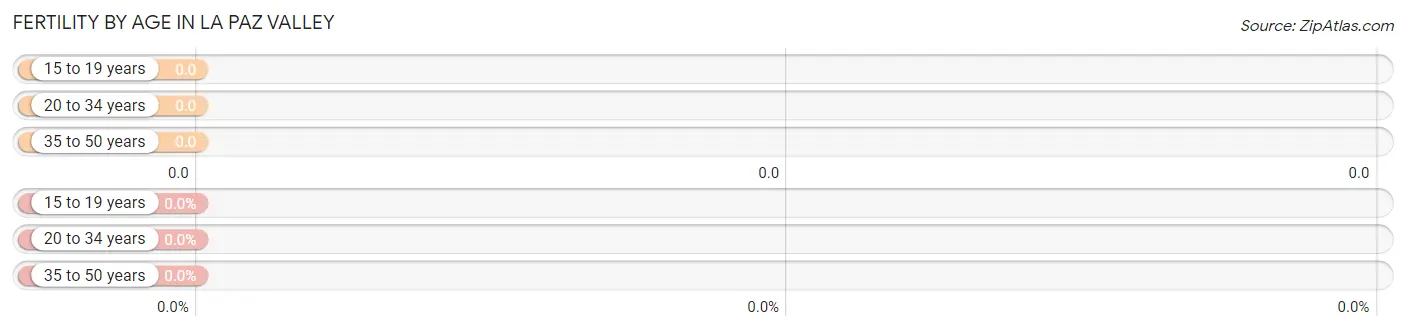
Fertility by Age in La Paz Valley
Age Bracket
Women with Births
Births / 1,000 Women
15 to 19 years
0 (0.0%)
0.0
20 to 34 years
0 (0.0%)
0.0
35 to 50 years
0 (0.0%)
0.0
Total
0 (0.0%)
0.0
Fertility by Age by Marriage Status in La Paz Valley
Age Bracket
Married
Unmarried
15 to 19 years
0 (0.0%)
0 (0.0%)
20 to 34 years
0 (0.0%)
0 (0.0%)
35 to 50 years
0 (0.0%)
0 (0.0%)
Total
0 (0.0%)
0 (0.0%)
Fertility by Education in La Paz Valley
Educational Attainment
Women with Births
Births / 1,000 Women
Less than High School
0 (0.0%)
0.0
High School Diploma
0 (0.0%)
0.0
College or Associate's Degree
0 (0.0%)
0.0
Bachelor's Degree
0 (0.0%)
0.0
Graduate Degree
0 (0.0%)
0.0
Total
0 (0.0%)
0.0
Fertility by Education by Marriage Status in La Paz Valley
Educational Attainment
Married
Unmarried
Less than High School
0 (0.0%)
0 (0.0%)
High School Diploma
0 (0.0%)
0 (0.0%)
College or Associate's Degree
0 (0.0%)
0 (0.0%)
Bachelor's Degree
0 (0.0%)
0 (0.0%)
Graduate Degree
0 (0.0%)
0 (0.0%)
Total
0 (0.0%)
0 (0.0%)
Employment Characteristics in La Paz Valley
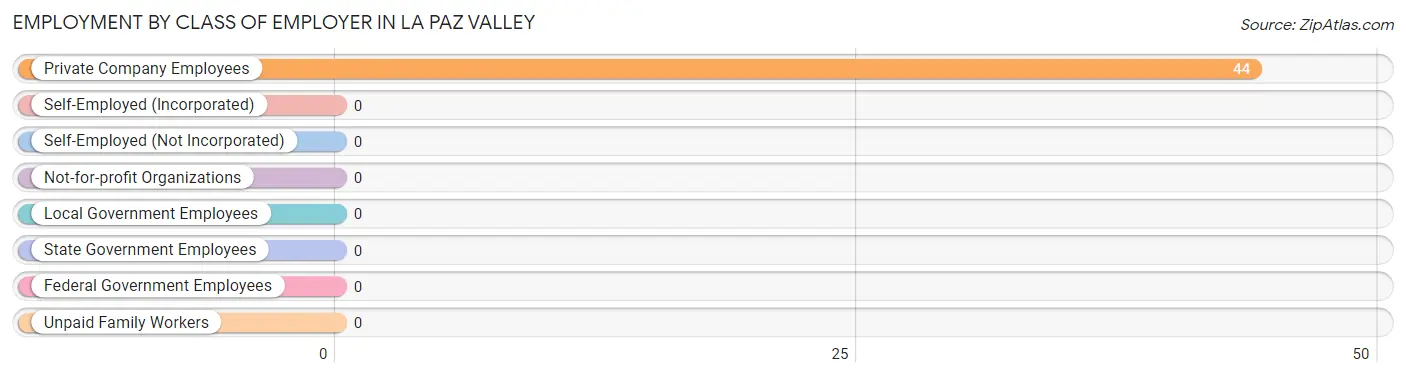
Employment by Class of Employer in La Paz Valley
Among the 44 employed individuals in La Paz Valley, , and private company employees (44 | 100.0%) make up the most common classes of employment.
Employer Class
# Employees
% Employees
Private Company Employees
44
100.0%
Self-Employed (Incorporated)
0
0.0%
Self-Employed (Not Incorporated)
0
0.0%
Not-for-profit Organizations
0
0.0%
Local Government Employees
0
0.0%
State Government Employees
0
0.0%
Federal Government Employees
0
0.0%
Unpaid Family Workers
0
0.0%
Total
44
100.0%
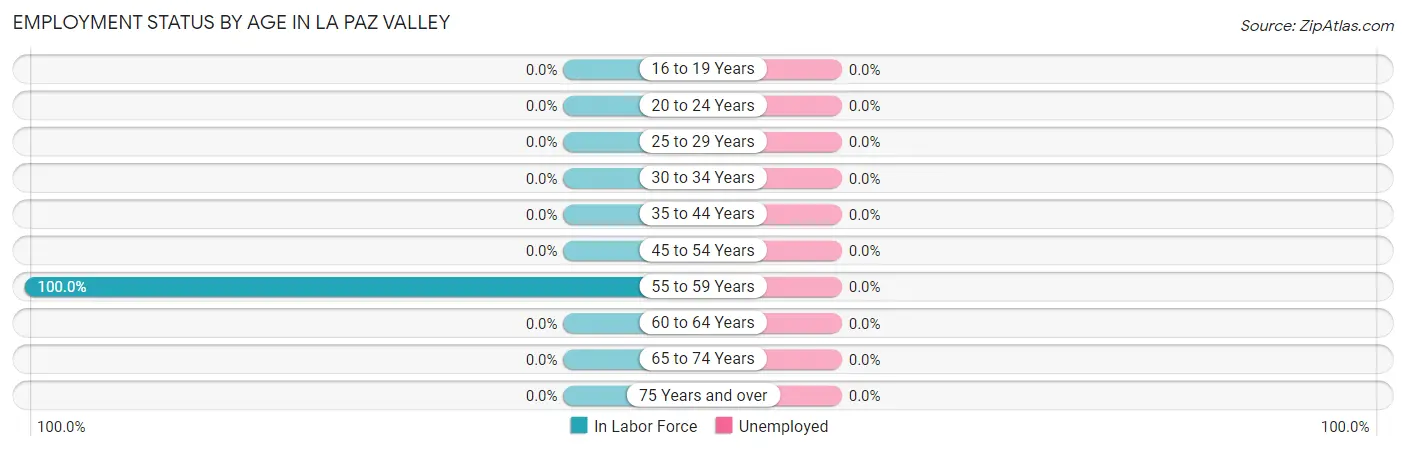
Employment Status by Age in La Paz Valley
Age Bracket
In Labor Force
Unemployed
16 to 19 Years
0 (0.0%)
0 (0.0%)
20 to 24 Years
0 (0.0%)
0 (0.0%)
25 to 29 Years
0 (0.0%)
0 (0.0%)
30 to 34 Years
0 (0.0%)
0 (0.0%)
35 to 44 Years
0 (0.0%)
0 (0.0%)
45 to 54 Years
0 (0.0%)
0 (0.0%)
55 to 59 Years
44 (100.0%)
0 (0.0%)
60 to 64 Years
0 (0.0%)
0 (0.0%)
65 to 74 Years
0 (0.0%)
0 (0.0%)
75 Years and over
0 (0.0%)
0 (0.0%)
Total
44 (9.4%)
0 (0.0%)
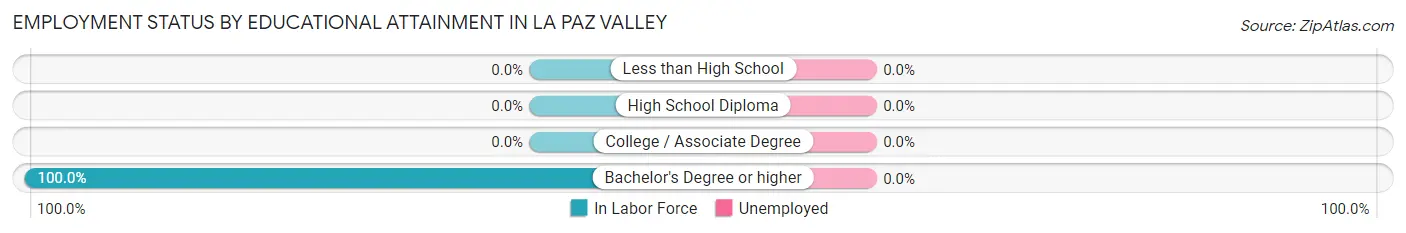
Employment Status by Educational Attainment in La Paz Valley
Educational Attainment
In Labor Force
Unemployed
Less than High School
0 (0.0%)
0 (0.0%)
High School Diploma
0 (0.0%)
0 (0.0%)
College / Associate Degree
0 (0.0%)
0 (0.0%)
Bachelor's Degree or higher
44 (100.0%)
0 (0.0%)
Total
44 (100.0%)
0 (0.0%)
Employment Occupations by Sex in La Paz Valley
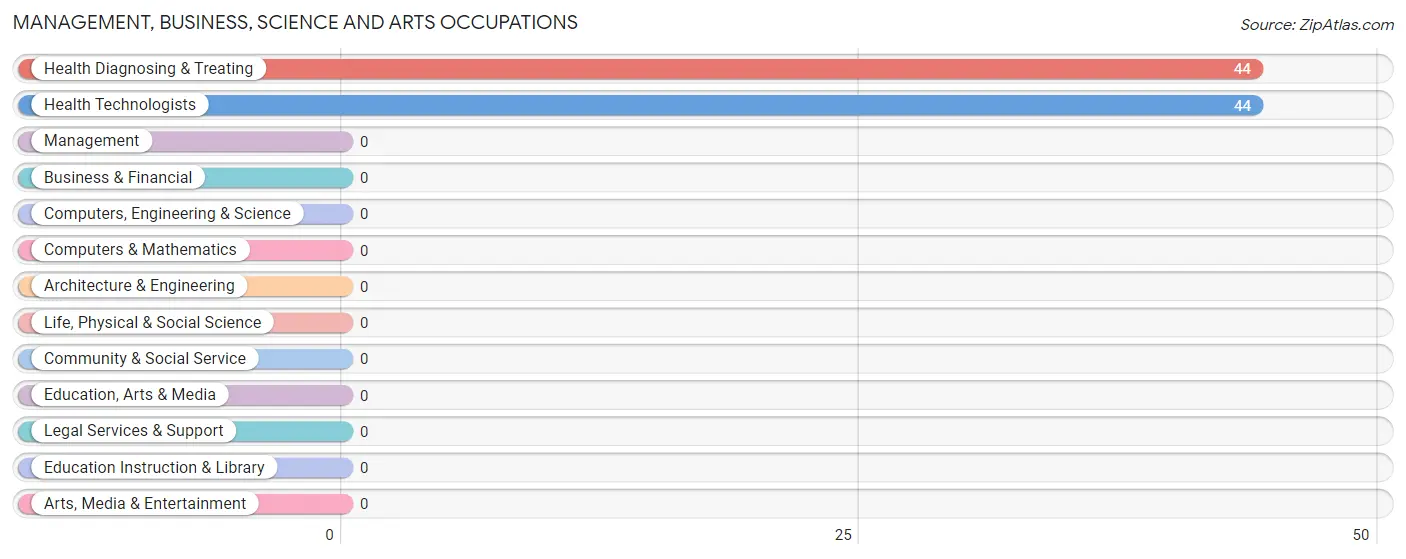
Management, Business, Science and Arts Occupations
The most common Management, Business, Science and Arts occupations in La Paz Valley are Health Diagnosing & Treating (44 | 100.0%), and Health Technologists (44 | 100.0%).
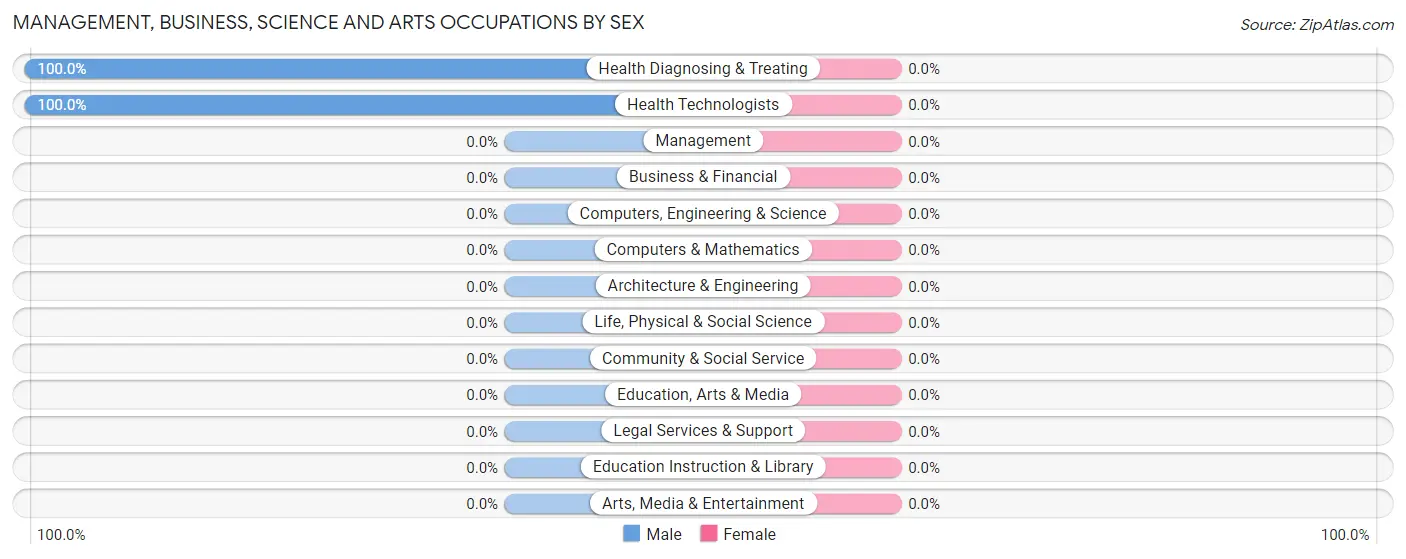
Management, Business, Science and Arts Occupations by Sex
Occupation
Male
Female
Management
0 (0.0%)
0 (0.0%)
Business & Financial
0 (0.0%)
0 (0.0%)
Computers, Engineering & Science
0 (0.0%)
0 (0.0%)
Computers & Mathematics
0 (0.0%)
0 (0.0%)
Architecture & Engineering
0 (0.0%)
0 (0.0%)
Life, Physical & Social Science
0 (0.0%)
0 (0.0%)
Community & Social Service
0 (0.0%)
0 (0.0%)
Education, Arts & Media
0 (0.0%)
0 (0.0%)
Legal Services & Support
0 (0.0%)
0 (0.0%)
Education Instruction & Library
0 (0.0%)
0 (0.0%)
Arts, Media & Entertainment
0 (0.0%)
0 (0.0%)
Health Diagnosing & Treating
44 (100.0%)
0 (0.0%)
Health Technologists
44 (100.0%)
0 (0.0%)
Total (Category)
44 (100.0%)
0 (0.0%)
Total (Overall)
44 (100.0%)
0 (0.0%)
Services Occupations
Services Occupations by Sex
Occupation
Male
Female
Healthcare Support
0 (0.0%)
0 (0.0%)
Security & Protection
0 (0.0%)
0 (0.0%)
Firefighting & Prevention
0 (0.0%)
0 (0.0%)
Law Enforcement
0 (0.0%)
0 (0.0%)
Food Preparation & Serving
0 (0.0%)
0 (0.0%)
Cleaning & Maintenance
0 (0.0%)
0 (0.0%)
Personal Care & Service
0 (0.0%)
0 (0.0%)
Total (Category)
0 (0.0%)
0 (0.0%)
Total (Overall)
44 (100.0%)
0 (0.0%)
Sales and Office Occupations
Sales and Office Occupations by Sex
Occupation
Male
Female
Sales & Related
0 (0.0%)
0 (0.0%)
Office & Administration
0 (0.0%)
0 (0.0%)
Total (Category)
0 (0.0%)
0 (0.0%)
Total (Overall)
44 (100.0%)
0 (0.0%)
Natural Resources, Construction and Maintenance Occupations
Natural Resources, Construction and Maintenance Occupations by Sex
Occupation
Male
Female
Farming, Fishing & Forestry
0 (0.0%)
0 (0.0%)
Construction & Extraction
0 (0.0%)
0 (0.0%)
Installation, Maintenance & Repair
0 (0.0%)
0 (0.0%)
Total (Category)
0 (0.0%)
0 (0.0%)
Total (Overall)
44 (100.0%)
0 (0.0%)
Production, Transportation and Moving Occupations
Production, Transportation and Moving Occupations by Sex
Occupation
Male
Female
Production
0 (0.0%)
0 (0.0%)
Transportation
0 (0.0%)
0 (0.0%)
Material Moving
0 (0.0%)
0 (0.0%)
Total (Category)
0 (0.0%)
0 (0.0%)
Total (Overall)
44 (100.0%)
0 (0.0%)
Employment Industries by Sex in La Paz Valley
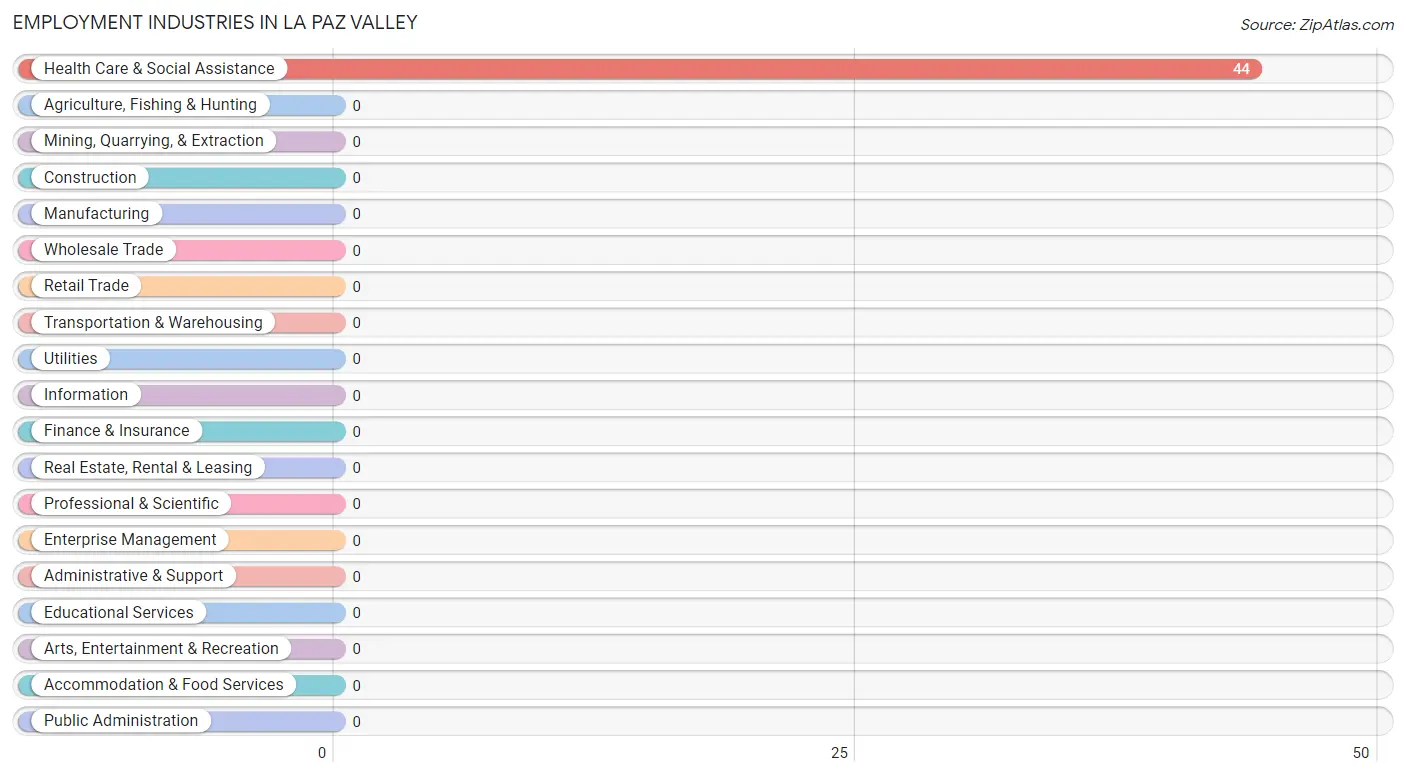
Employment Industries in La Paz Valley
The major employment industries in La Paz Valley include , and Health Care & Social Assistance (44 | 100.0%).
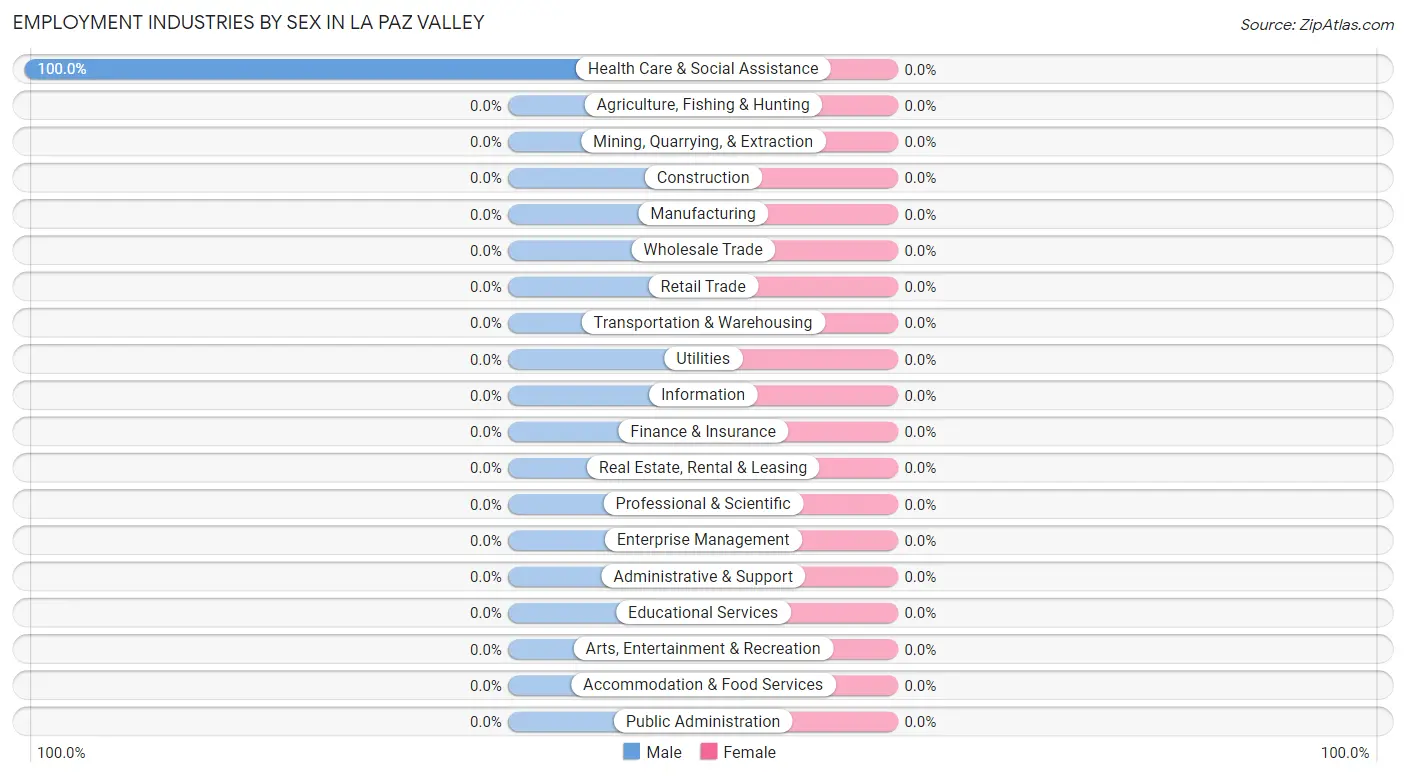
Employment Industries by Sex in La Paz Valley
Industry
Male
Female
Agriculture, Fishing & Hunting
0 (0.0%)
0 (0.0%)
Mining, Quarrying, & Extraction
0 (0.0%)
0 (0.0%)
Construction
0 (0.0%)
0 (0.0%)
Manufacturing
0 (0.0%)
0 (0.0%)
Wholesale Trade
0 (0.0%)
0 (0.0%)
Retail Trade
0 (0.0%)
0 (0.0%)
Transportation & Warehousing
0 (0.0%)
0 (0.0%)
Utilities
0 (0.0%)
0 (0.0%)
Information
0 (0.0%)
0 (0.0%)
Finance & Insurance
0 (0.0%)
0 (0.0%)
Real Estate, Rental & Leasing
0 (0.0%)
0 (0.0%)
Professional & Scientific
0 (0.0%)
0 (0.0%)
Enterprise Management
0 (0.0%)
0 (0.0%)
Administrative & Support
0 (0.0%)
0 (0.0%)
Educational Services
0 (0.0%)
0 (0.0%)
Health Care & Social Assistance
44 (100.0%)
0 (0.0%)
Arts, Entertainment & Recreation
0 (0.0%)
0 (0.0%)
Accommodation & Food Services
0 (0.0%)
0 (0.0%)
Public Administration
0 (0.0%)
0 (0.0%)
Total
44 (100.0%)
0 (0.0%)
Education in La Paz Valley
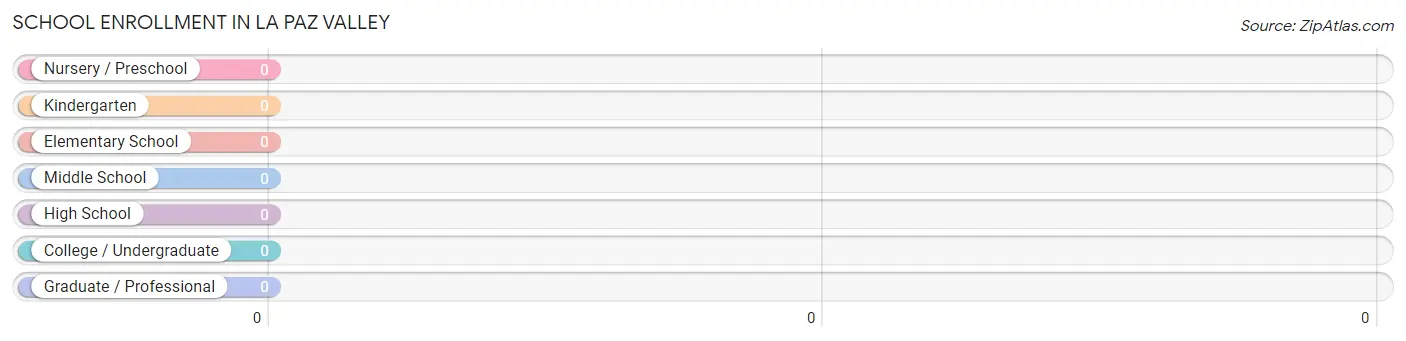
School Enrollment in La Paz Valley
School Level
# Students
% Students
Nursery / Preschool
0
0.0%
Kindergarten
0
0.0%
Elementary School
0
0.0%
Middle School
0
0.0%
High School
0
0.0%
College / Undergraduate
0
0.0%
Graduate / Professional
0
0.0%
Total
0
0.0%
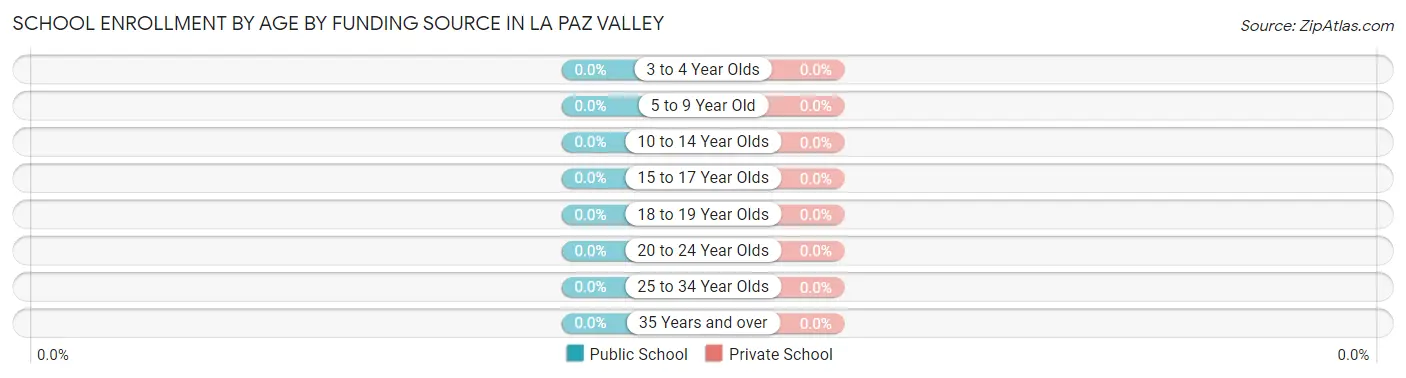
School Enrollment by Age by Funding Source in La Paz Valley
Age Bracket
Public School
Private School
3 to 4 Year Olds
0 (0.0%)
0 (0.0%)
5 to 9 Year Old
0 (0.0%)
0 (0.0%)
10 to 14 Year Olds
0 (0.0%)
0 (0.0%)
15 to 17 Year Olds
0 (0.0%)
0 (0.0%)
18 to 19 Year Olds
0 (0.0%)
0 (0.0%)
20 to 24 Year Olds
0 (0.0%)
0 (0.0%)
25 to 34 Year Olds
0 (0.0%)
0 (0.0%)
35 Years and over
0 (0.0%)
0 (0.0%)
Total
0 (0.0%)
0 (0.0%)
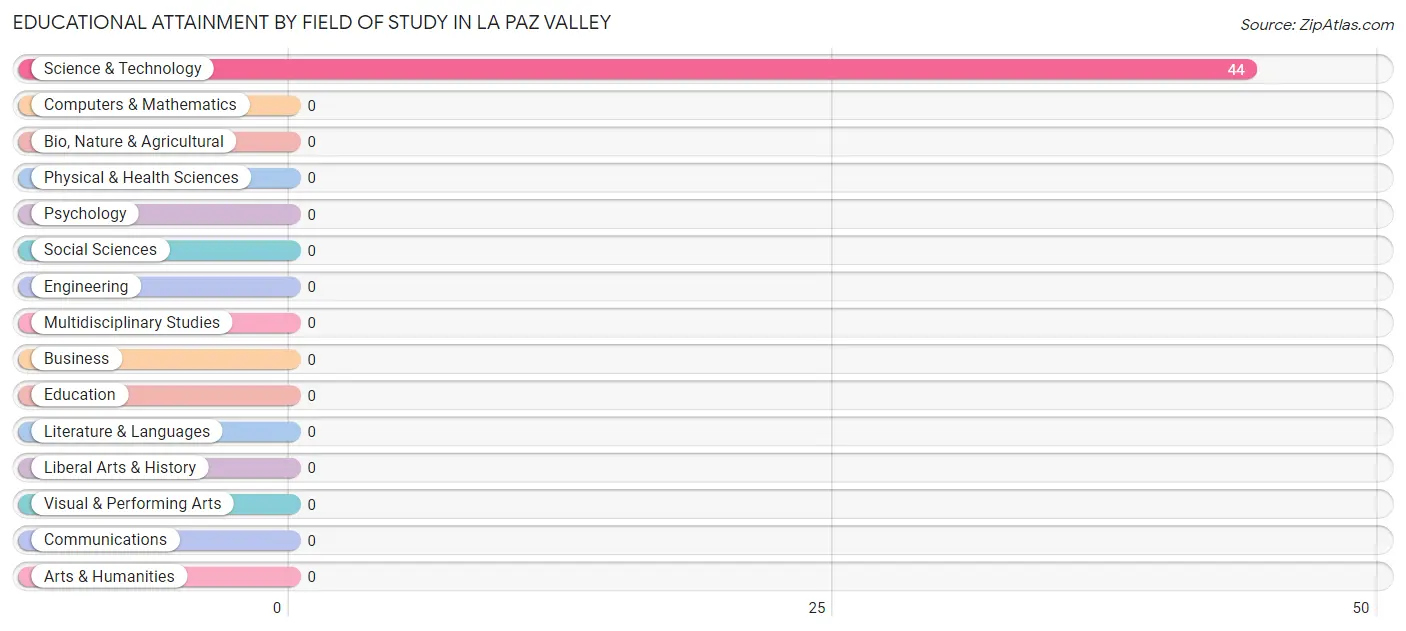
Educational Attainment by Field of Study in La Paz Valley
, and science & technology (44 | 100.0%) are the most common fields of study among 44 individuals in La Paz Valley who have obtained a bachelor's degree or higher.
Field of Study
# Graduates
% Graduates
Computers & Mathematics
0
0.0%
Bio, Nature & Agricultural
0
0.0%
Physical & Health Sciences
0
0.0%
Psychology
0
0.0%
Social Sciences
0
0.0%
Engineering
0
0.0%
Multidisciplinary Studies
0
0.0%
Science & Technology
44
100.0%
Business
0
0.0%
Education
0
0.0%
Literature & Languages
0
0.0%
Liberal Arts & History
0
0.0%
Visual & Performing Arts
0
0.0%
Communications
0
0.0%
Arts & Humanities
0
0.0%
Total
44
100.0%
Transportation & Commute in La Paz Valley
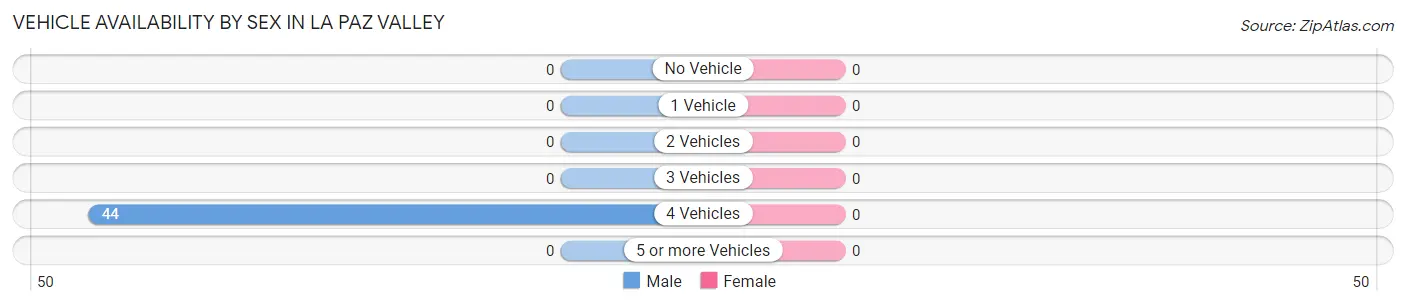
Vehicle Availability by Sex in La Paz Valley
Vehicles Available
Male
Female
No Vehicle
0 (0.0%)
0 (0.0%)
1 Vehicle
0 (0.0%)
0 (0.0%)
2 Vehicles
0 (0.0%)
0 (0.0%)
3 Vehicles
0 (0.0%)
0 (0.0%)
4 Vehicles
44 (100.0%)
0 (0.0%)
5 or more Vehicles
0 (0.0%)
0 (0.0%)
Total
44 (100.0%)
0 (0.0%)
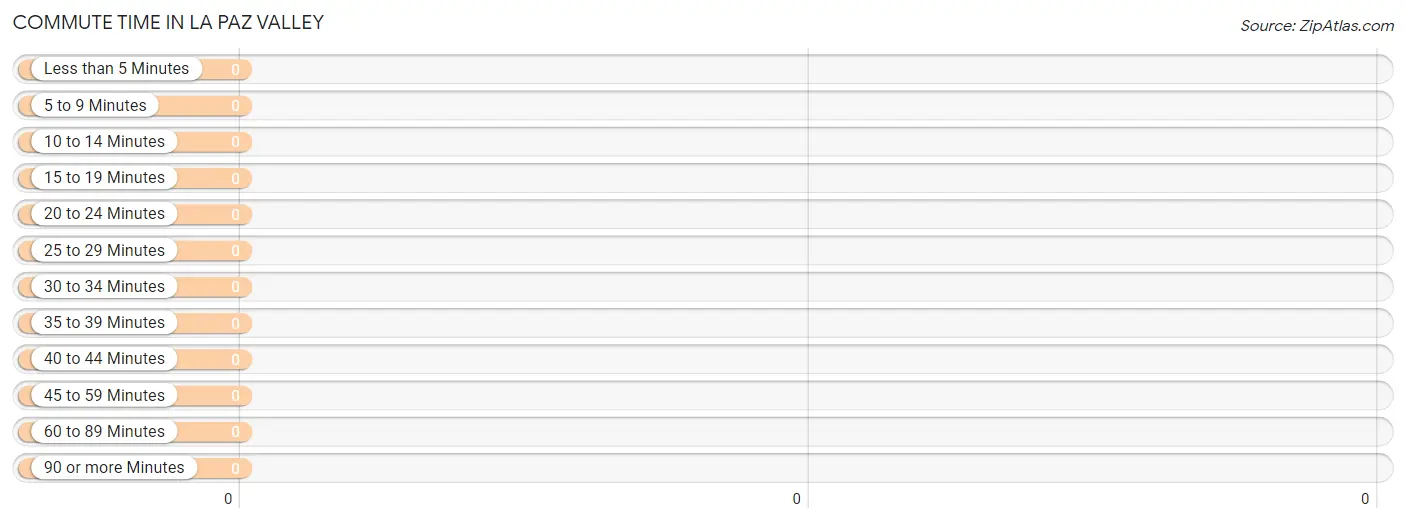
Commute Time in La Paz Valley
Commute Time
# Commuters
% Commuters
Less than 5 Minutes
0
0.0%
5 to 9 Minutes
0
0.0%
10 to 14 Minutes
0
0.0%
15 to 19 Minutes
0
0.0%
20 to 24 Minutes
0
0.0%
25 to 29 Minutes
0
0.0%
30 to 34 Minutes
0
0.0%
35 to 39 Minutes
0
0.0%
40 to 44 Minutes
0
0.0%
45 to 59 Minutes
0
0.0%
60 to 89 Minutes
0
0.0%
90 or more Minutes
0
0.0%
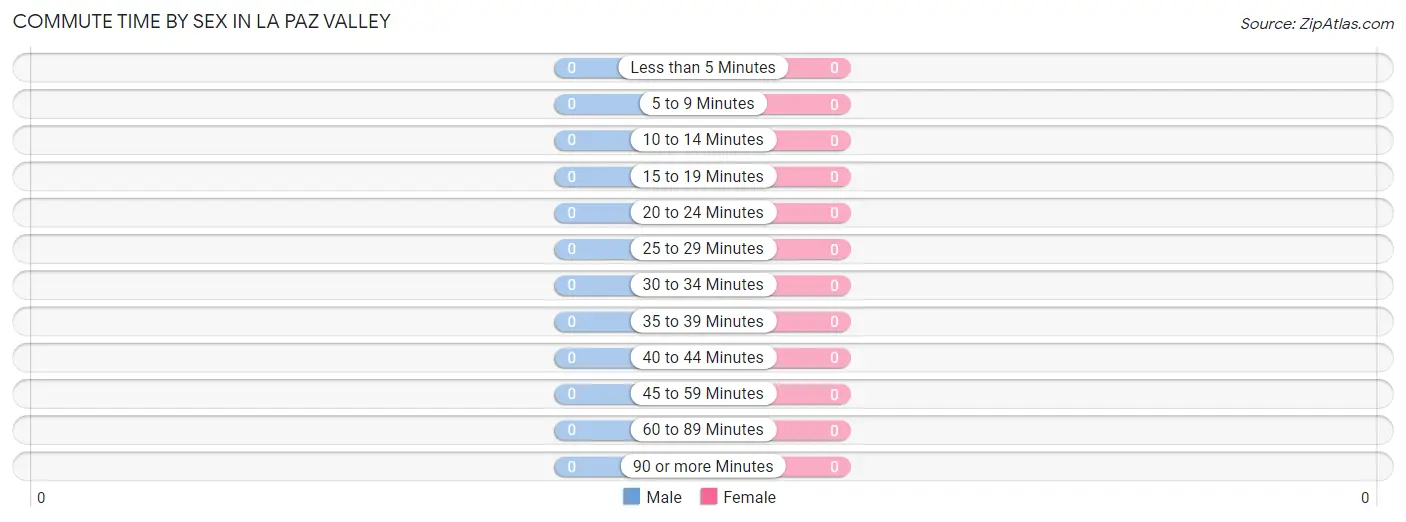
Commute Time by Sex in La Paz Valley
Commute Time
Male
Female
Less than 5 Minutes
0 (0.0%)
0 (0.0%)
5 to 9 Minutes
0 (0.0%)
0 (0.0%)
10 to 14 Minutes
0 (0.0%)
0 (0.0%)
15 to 19 Minutes
0 (0.0%)
0 (0.0%)
20 to 24 Minutes
0 (0.0%)
0 (0.0%)
25 to 29 Minutes
0 (0.0%)
0 (0.0%)
30 to 34 Minutes
0 (0.0%)
0 (0.0%)
35 to 39 Minutes
0 (0.0%)
0 (0.0%)
40 to 44 Minutes
0 (0.0%)
0 (0.0%)
45 to 59 Minutes
0 (0.0%)
0 (0.0%)
60 to 89 Minutes
0 (0.0%)
0 (0.0%)
90 or more Minutes
0 (0.0%)
0 (0.0%)
Time of Departure to Work by Sex in La Paz Valley
Time of Departure
Male
Female
12:00 AM to 4:59 AM
0 (0.0%)
0 (0.0%)
5:00 AM to 5:29 AM
0 (0.0%)
0 (0.0%)
5:30 AM to 5:59 AM
0 (0.0%)
0 (0.0%)
6:00 AM to 6:29 AM
0 (0.0%)
0 (0.0%)
6:30 AM to 6:59 AM
0 (0.0%)
0 (0.0%)
7:00 AM to 7:29 AM
0 (0.0%)
0 (0.0%)
7:30 AM to 7:59 AM
0 (0.0%)
0 (0.0%)
8:00 AM to 8:29 AM
0 (0.0%)
0 (0.0%)
8:30 AM to 8:59 AM
0 (0.0%)
0 (0.0%)
9:00 AM to 9:59 AM
0 (0.0%)
0 (0.0%)
10:00 AM to 10:59 AM
0 (0.0%)
0 (0.0%)
11:00 AM to 11:59 AM
0 (0.0%)
0 (0.0%)
12:00 PM to 3:59 PM
0 (0.0%)
0 (0.0%)
4:00 PM to 11:59 PM
0 (0.0%)
0 (0.0%)
Total
0 (0.0%)
0 (0.0%)
Housing Occupancy in La Paz Valley
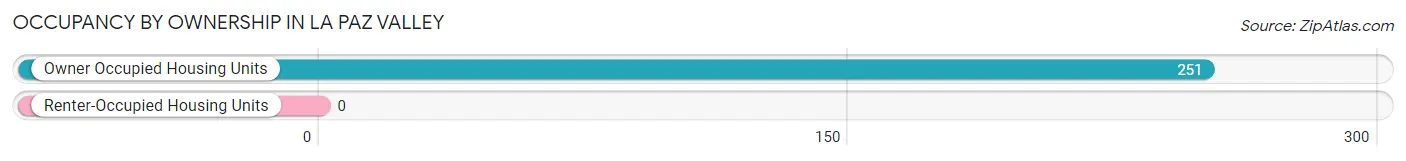
Occupancy by Ownership in La Paz Valley
Of the total 251 dwellings in La Paz Valley, owner-occupied units account for 251 (100.0%), while renter-occupied units make up 0 (0.0%).
Occupancy
# Housing Units
% Housing Units
Owner Occupied Housing Units
251
100.0%
Renter-Occupied Housing Units
0
0.0%
Total Occupied Housing Units
251
100.0%
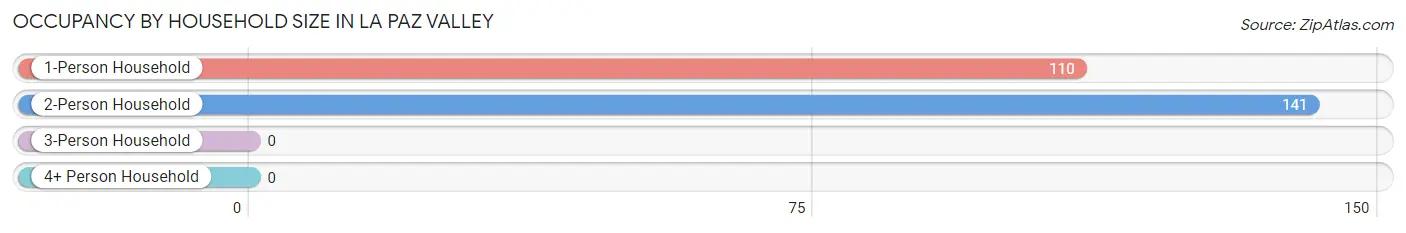
Occupancy by Household Size in La Paz Valley
Household Size
# Housing Units
% Housing Units
1-Person Household
110
43.8%
2-Person Household
141
56.2%
3-Person Household
0
0.0%
4+ Person Household
0
0.0%
Total Housing Units
251
100.0%
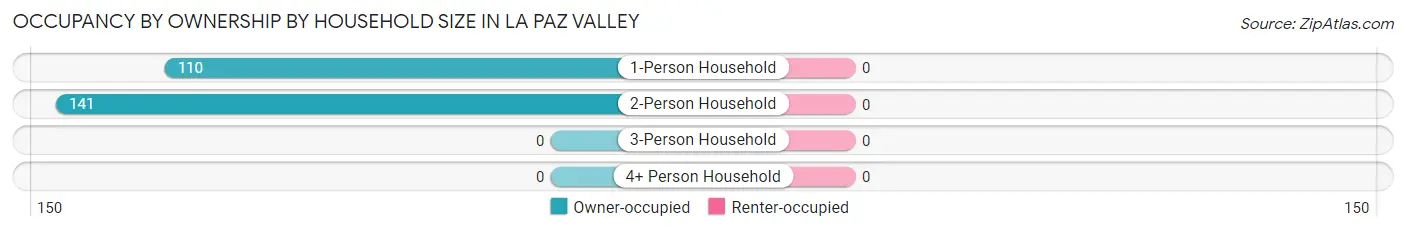
Occupancy by Ownership by Household Size in La Paz Valley
Household Size
Owner-occupied
Renter-occupied
1-Person Household
110 (100.0%)
0 (0.0%)
2-Person Household
141 (100.0%)
0 (0.0%)
3-Person Household
0 (0.0%)
0 (0.0%)
4+ Person Household
0 (0.0%)
0 (0.0%)
Total Housing Units
251 (100.0%)
0 (0.0%)
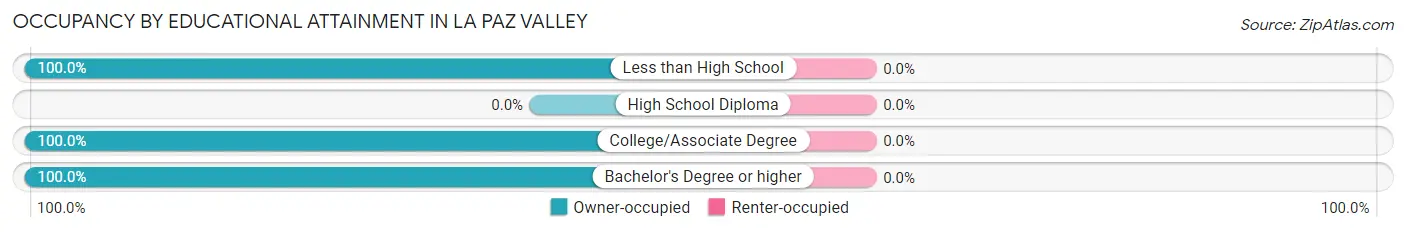
Occupancy by Educational Attainment in La Paz Valley
Household Size
Owner-occupied
Renter-occupied
Less than High School
66 (100.0%)
0 (0.0%)
High School Diploma
0 (0.0%)
0 (0.0%)
College/Associate Degree
141 (100.0%)
0 (0.0%)
Bachelor's Degree or higher
44 (100.0%)
0 (0.0%)
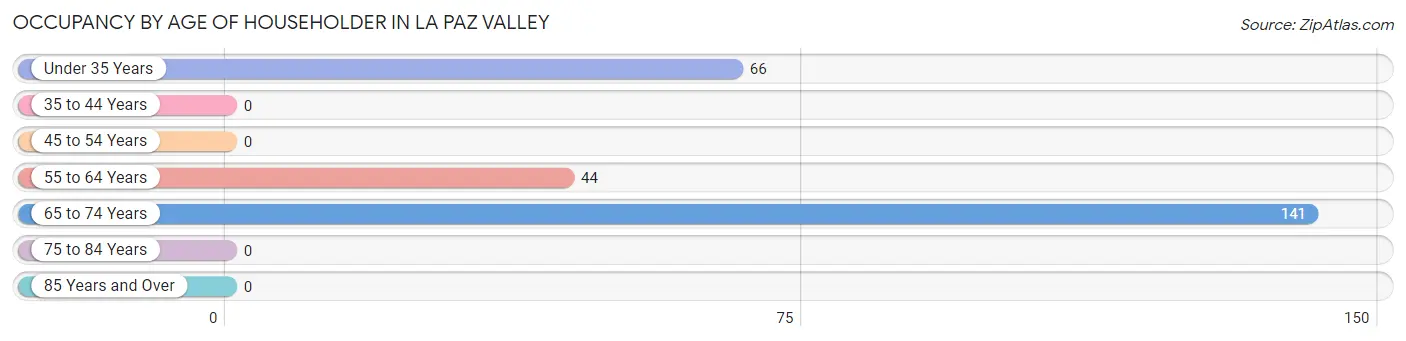
Occupancy by Age of Householder in La Paz Valley
Age Bracket
# Households
% Households
Under 35 Years
66
26.3%
35 to 44 Years
0
0.0%
45 to 54 Years
0
0.0%
55 to 64 Years
44
17.5%
65 to 74 Years
141
56.2%
75 to 84 Years
0
0.0%
85 Years and Over
0
0.0%
Total
251
100.0%
Housing Finances in La Paz Valley
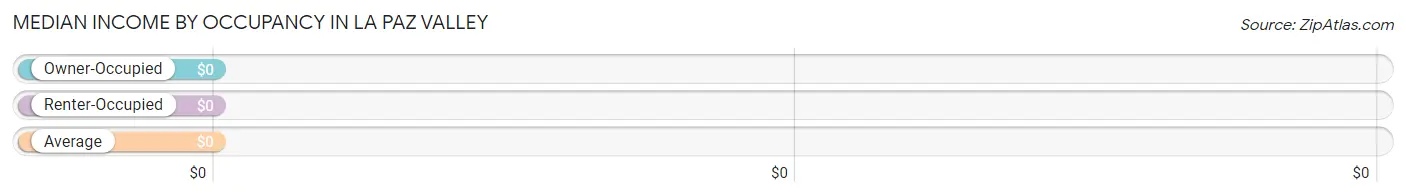
Median Income by Occupancy in La Paz Valley
Occupancy Type
# Households
Median Income
Owner-Occupied
251 (100.0%)
$0
Renter-Occupied
0 (0.0%)
$0
Average
251 (100.0%)
$0
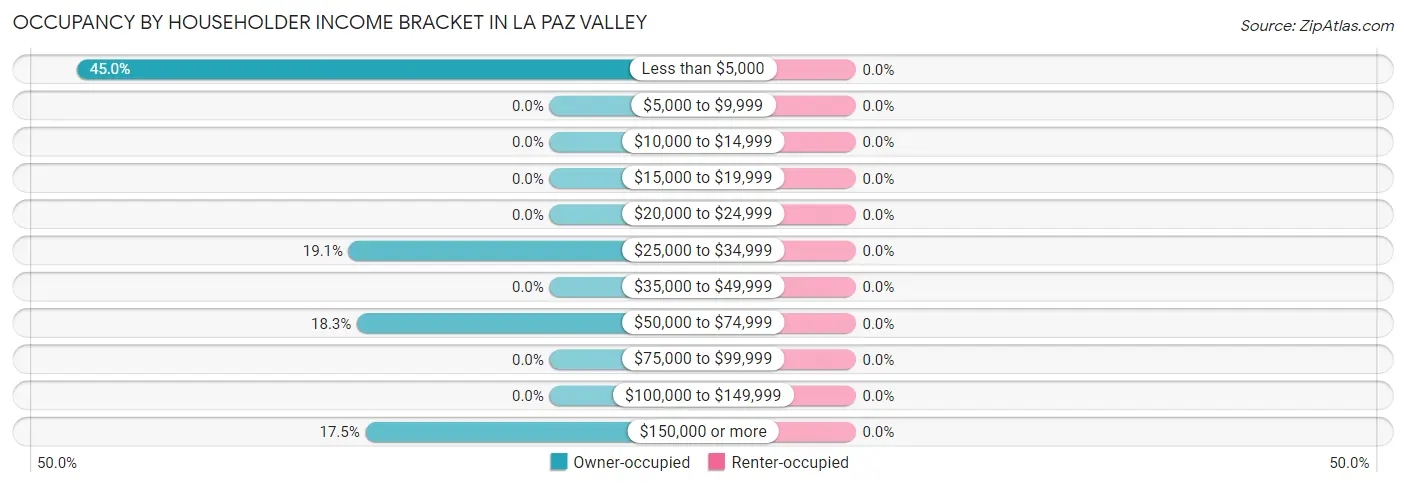
Occupancy by Householder Income Bracket in La Paz Valley
Income Bracket
Owner-occupied
Renter-occupied
Less than $5,000
113 (45.0%)
0 (0.0%)
$5,000 to $9,999
0 (0.0%)
0 (0.0%)
$10,000 to $14,999
0 (0.0%)
0 (0.0%)
$15,000 to $19,999
0 (0.0%)
0 (0.0%)
$20,000 to $24,999
0 (0.0%)
0 (0.0%)
$25,000 to $34,999
48 (19.1%)
0 (0.0%)
$35,000 to $49,999
0 (0.0%)
0 (0.0%)
$50,000 to $74,999
46 (18.3%)
0 (0.0%)
$75,000 to $99,999
0 (0.0%)
0 (0.0%)
$100,000 to $149,999
0 (0.0%)
0 (0.0%)
$150,000 or more
44 (17.5%)
0 (0.0%)
Total
251 (100.0%)
0 (0.0%)
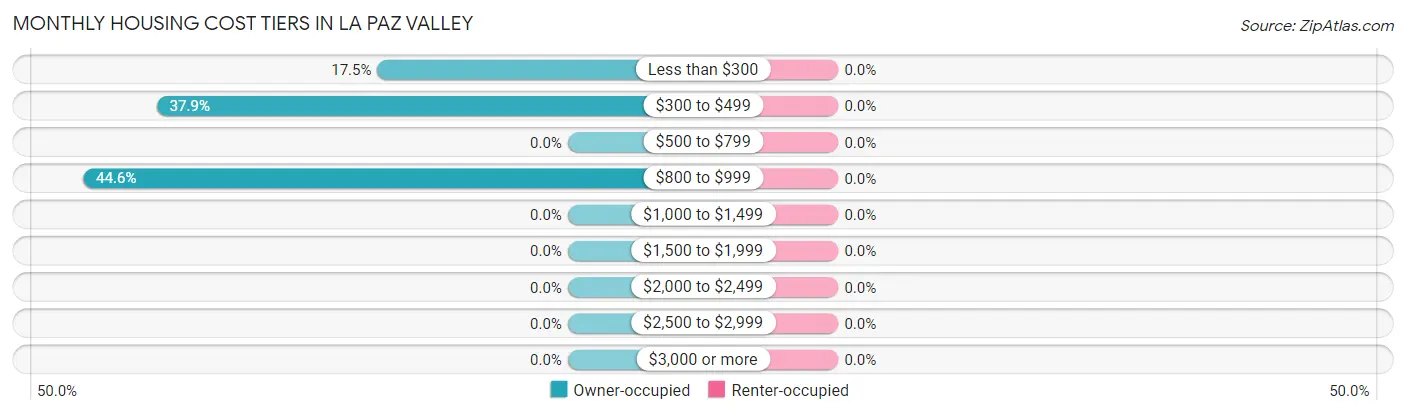
Monthly Housing Cost Tiers in La Paz Valley
Monthly Cost
Owner-occupied
Renter-occupied
Less than $300
44 (17.5%)
0 (0.0%)
$300 to $499
95 (37.9%)
0 (0.0%)
$500 to $799
0 (0.0%)
0 (0.0%)
$800 to $999
112 (44.6%)
0 (0.0%)
$1,000 to $1,499
0 (0.0%)
0 (0.0%)
$1,500 to $1,999
0 (0.0%)
0 (0.0%)
$2,000 to $2,499
0 (0.0%)
0 (0.0%)
$2,500 to $2,999
0 (0.0%)
0 (0.0%)
$3,000 or more
0 (0.0%)
0 (0.0%)
Total
251 (100.0%)
0 (0.0%)
Physical Housing Characteristics in La Paz Valley
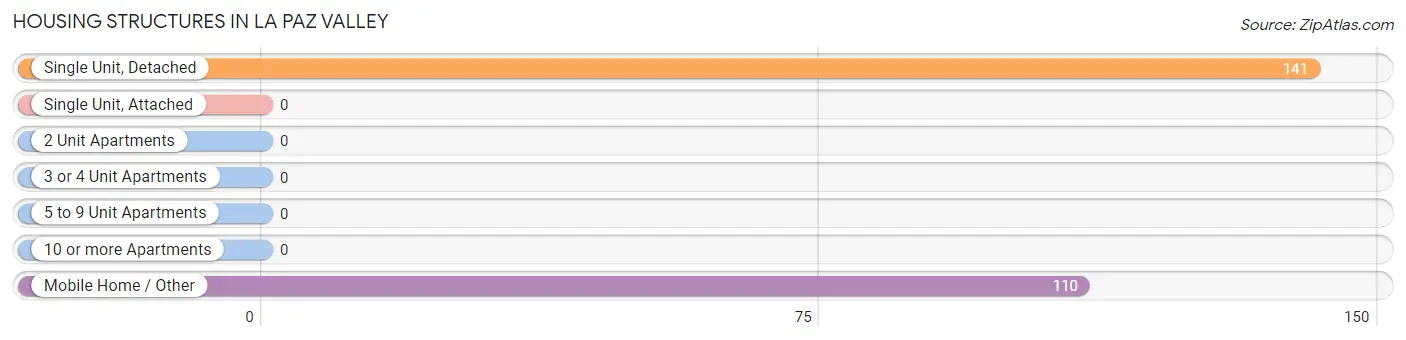
Housing Structures in La Paz Valley
Structure Type
# Housing Units
% Housing Units
Single Unit, Detached
141
56.2%
Single Unit, Attached
0
0.0%
2 Unit Apartments
0
0.0%
3 or 4 Unit Apartments
0
0.0%
5 to 9 Unit Apartments
0
0.0%
10 or more Apartments
0
0.0%
Mobile Home / Other
110
43.8%
Total
251
100.0%
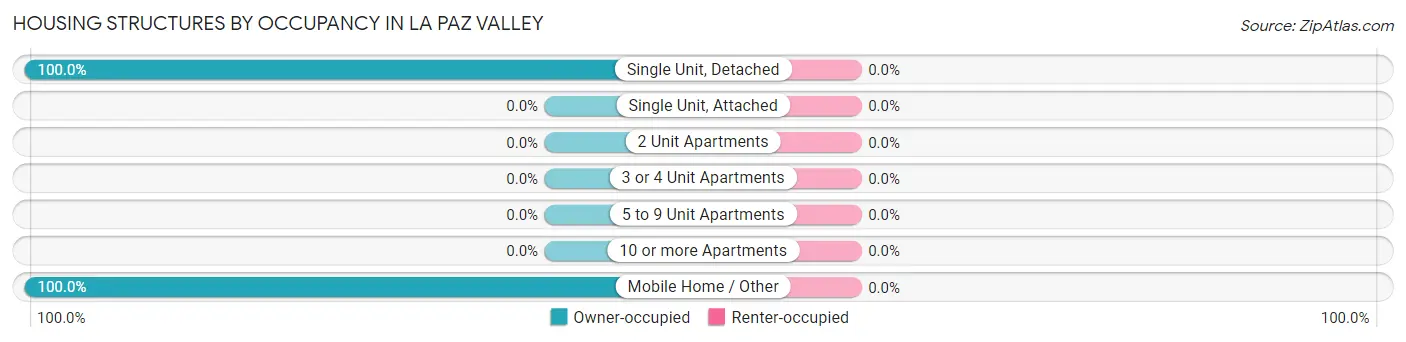
Housing Structures by Occupancy in La Paz Valley
Structure Type
Owner-occupied
Renter-occupied
Single Unit, Detached
141 (100.0%)
0 (0.0%)
Single Unit, Attached
0 (0.0%)
0 (0.0%)
2 Unit Apartments
0 (0.0%)
0 (0.0%)
3 or 4 Unit Apartments
0 (0.0%)
0 (0.0%)
5 to 9 Unit Apartments
0 (0.0%)
0 (0.0%)
10 or more Apartments
0 (0.0%)
0 (0.0%)
Mobile Home / Other
110 (100.0%)
0 (0.0%)
Total
251 (100.0%)
0 (0.0%)
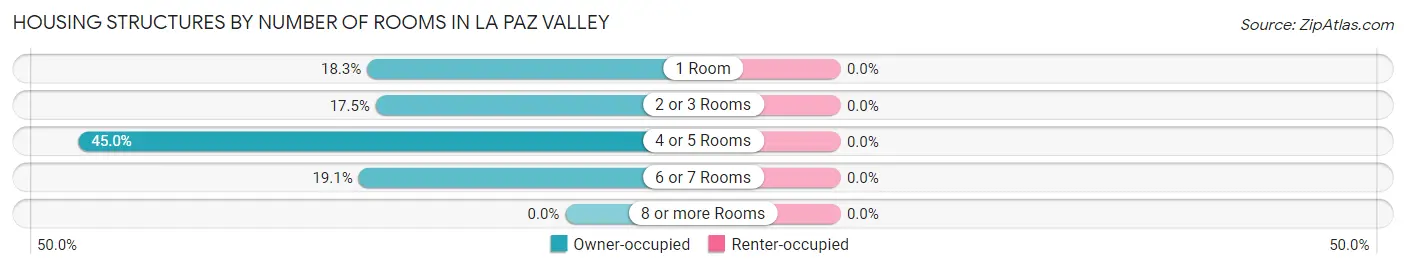
Housing Structures by Number of Rooms in La Paz Valley
Number of Rooms
Owner-occupied
Renter-occupied
1 Room
46 (18.3%)
0 (0.0%)
2 or 3 Rooms
44 (17.5%)
0 (0.0%)
4 or 5 Rooms
113 (45.0%)
0 (0.0%)
6 or 7 Rooms
48 (19.1%)
0 (0.0%)
8 or more Rooms
0 (0.0%)
0 (0.0%)
Total
251 (100.0%)
0 (0.0%)
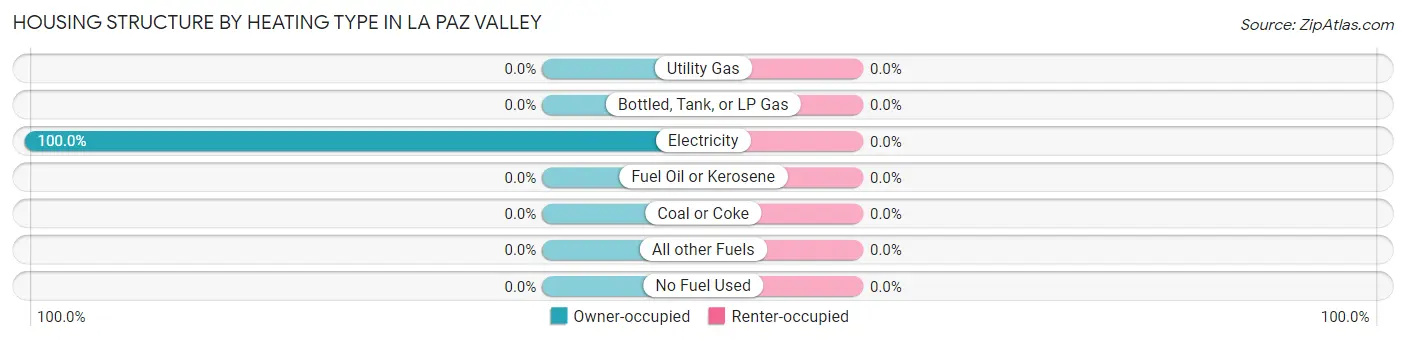
Housing Structure by Heating Type in La Paz Valley
Heating Type
Owner-occupied
Renter-occupied
Utility Gas
0 (0.0%)
0 (0.0%)
Bottled, Tank, or LP Gas
0 (0.0%)
0 (0.0%)
Electricity
251 (100.0%)
0 (0.0%)
Fuel Oil or Kerosene
0 (0.0%)
0 (0.0%)
Coal or Coke
0 (0.0%)
0 (0.0%)
All other Fuels
0 (0.0%)
0 (0.0%)
No Fuel Used
0 (0.0%)
0 (0.0%)
Total
251 (100.0%)
0 (0.0%)
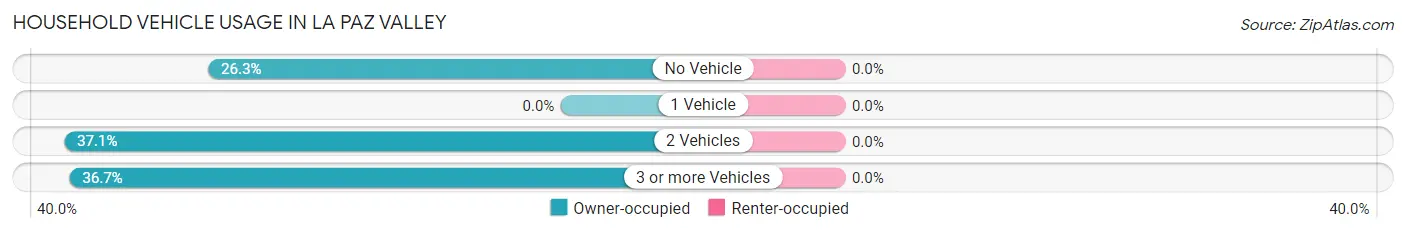
Household Vehicle Usage in La Paz Valley
Vehicles per Household
Owner-occupied
Renter-occupied
No Vehicle
66 (26.3%)
0 (0.0%)
1 Vehicle
0 (0.0%)
0 (0.0%)
2 Vehicles
93 (37.0%)
0 (0.0%)
3 or more Vehicles
92 (36.6%)
0 (0.0%)
Total
251 (100.0%)
0 (0.0%)
Real Estate & Mortgages in La Paz Valley
Real Estate and Mortgage Overview in La Paz Valley
Characteristic
Without Mortgage
With Mortgage
Housing Units
139
112
Median Property Value
-
-
Median Household Income
-
-
Monthly Housing Costs
$313
$0
Real Estate Taxes
-
-
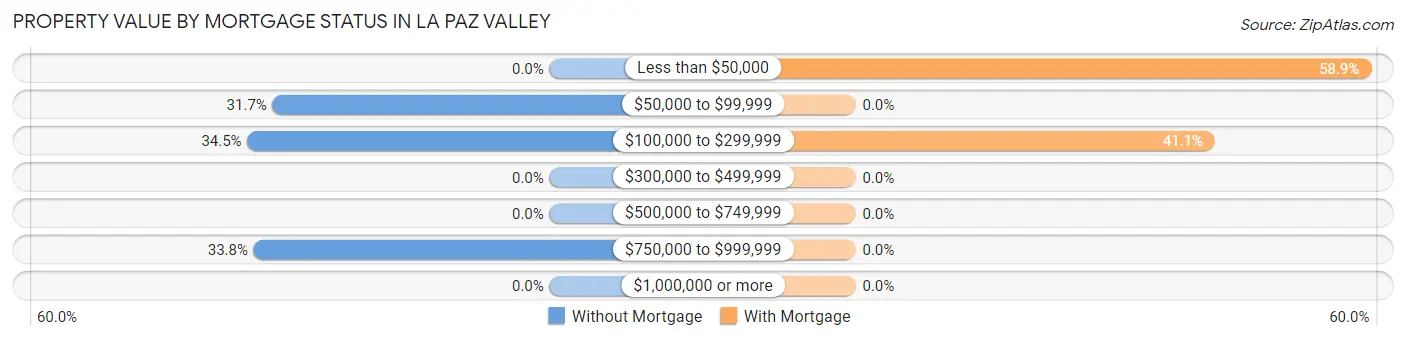
Property Value by Mortgage Status in La Paz Valley
Property Value
Without Mortgage
With Mortgage
Less than $50,000
0 (0.0%)
66 (58.9%)
$50,000 to $99,999
44 (31.7%)
0 (0.0%)
$100,000 to $299,999
48 (34.5%)
46 (41.1%)
$300,000 to $499,999
0 (0.0%)
0 (0.0%)
$500,000 to $749,999
0 (0.0%)
0 (0.0%)
$750,000 to $999,999
47 (33.8%)
0 (0.0%)
$1,000,000 or more
0 (0.0%)
0 (0.0%)
Total
139 (100.0%)
112 (100.0%)
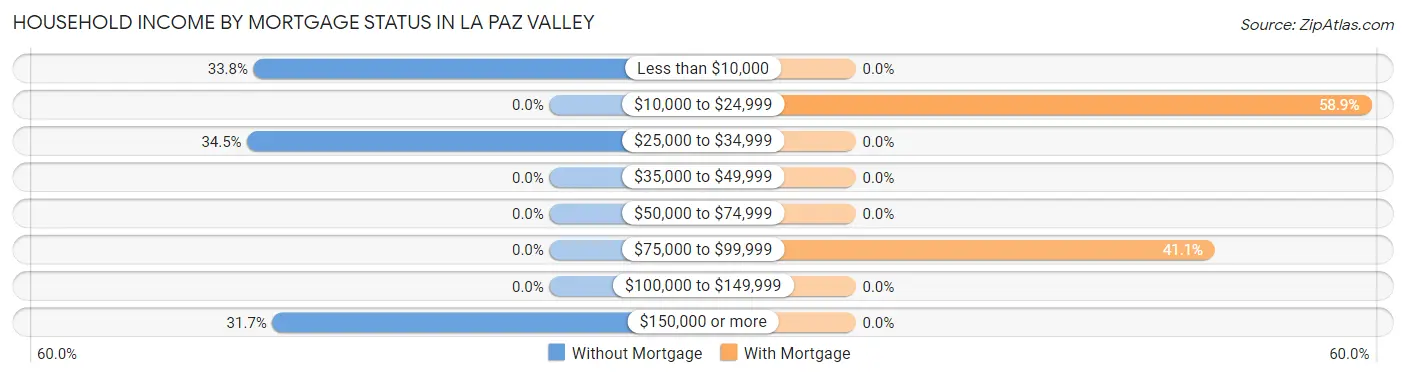
Household Income by Mortgage Status in La Paz Valley
Household Income
Without Mortgage
With Mortgage
Less than $10,000
47 (33.8%)
0 (0.0%)
$10,000 to $24,999
0 (0.0%)
66 (58.9%)
$25,000 to $34,999
48 (34.5%)
0 (0.0%)
$35,000 to $49,999
0 (0.0%)
0 (0.0%)
$50,000 to $74,999
0 (0.0%)
0 (0.0%)
$75,000 to $99,999
0 (0.0%)
46 (41.1%)
$100,000 to $149,999
0 (0.0%)
0 (0.0%)
$150,000 or more
44 (31.7%)
0 (0.0%)
Total
139 (100.0%)
112 (100.0%)
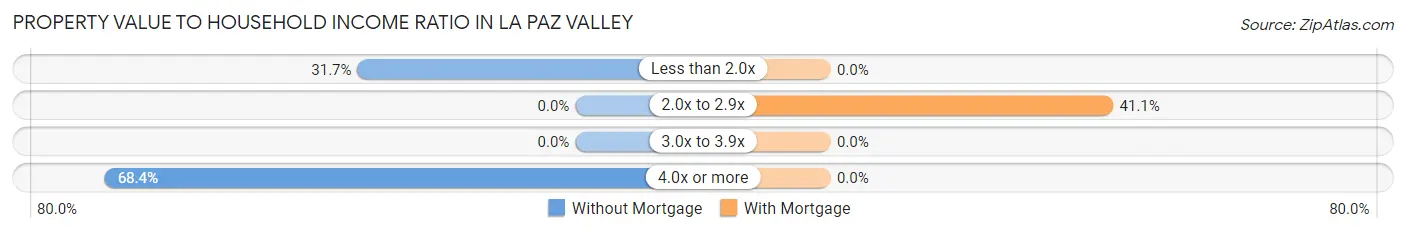
Property Value to Household Income Ratio in La Paz Valley
Value-to-Income Ratio
Without Mortgage
With Mortgage
Less than 2.0x
44 (31.7%)
0 (0.0%)
2.0x to 2.9x
0 (0.0%)
46 (41.1%)
3.0x to 3.9x
0 (0.0%)
0 (0.0%)
4.0x or more
95 (68.3%)
0 (0.0%)
Total
139 (100.0%)
112 (100.0%)
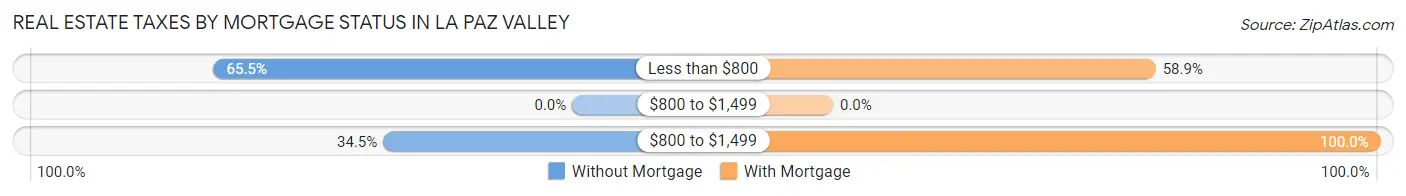
Real Estate Taxes by Mortgage Status in La Paz Valley
Property Taxes
Without Mortgage
With Mortgage
Less than $800
91 (65.5%)
66 (58.9%)
$800 to $1,499
0 (0.0%)
0 (0.0%)
$800 to $1,499
48 (34.5%)
112 (100.0%)
Total
139 (100.0%)
112 (100.0%)
Health & Disability in La Paz Valley
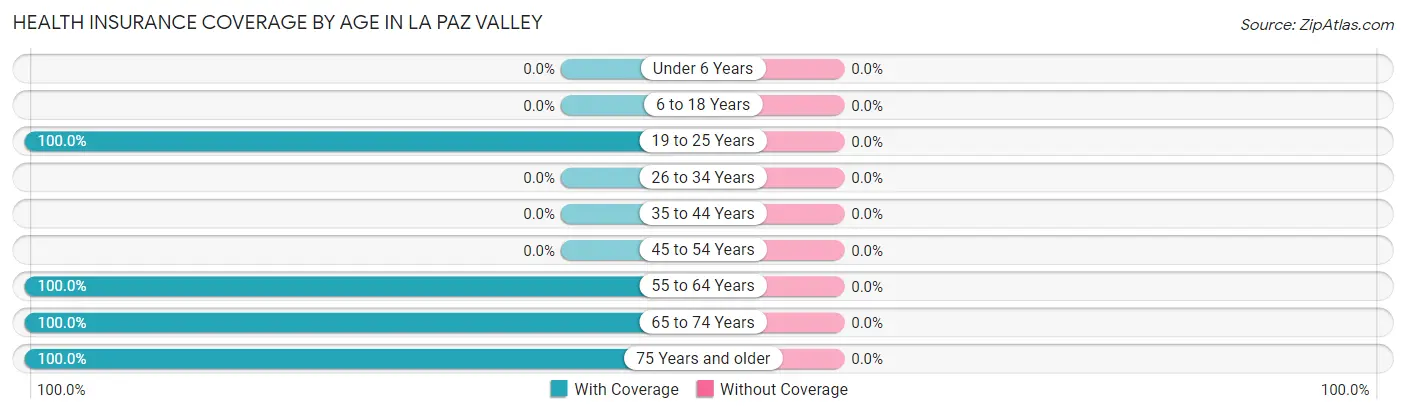
Health Insurance Coverage by Age in La Paz Valley
Age Bracket
With Coverage
Without Coverage
Under 6 Years
0 (0.0%)
0 (0.0%)
6 to 18 Years
0 (0.0%)
0 (0.0%)
19 to 25 Years
66 (100.0%)
0 (0.0%)
26 to 34 Years
0 (0.0%)
0 (0.0%)
35 to 44 Years
0 (0.0%)
0 (0.0%)
45 to 54 Years
0 (0.0%)
0 (0.0%)
55 to 64 Years
44 (100.0%)
0 (0.0%)
65 to 74 Years
232 (100.0%)
0 (0.0%)
75 Years and older
127 (100.0%)
0 (0.0%)
Total
469 (100.0%)
0 (0.0%)
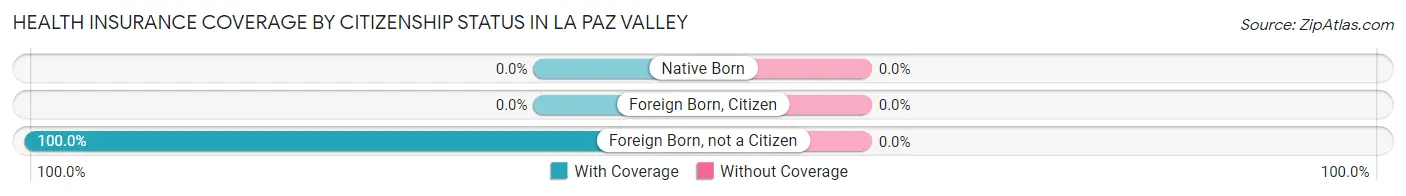
Health Insurance Coverage by Citizenship Status in La Paz Valley
Citizenship Status
With Coverage
Without Coverage
Native Born
0 (0.0%)
0 (0.0%)
Foreign Born, Citizen
0 (0.0%)
0 (0.0%)
Foreign Born, not a Citizen
66 (100.0%)
0 (0.0%)
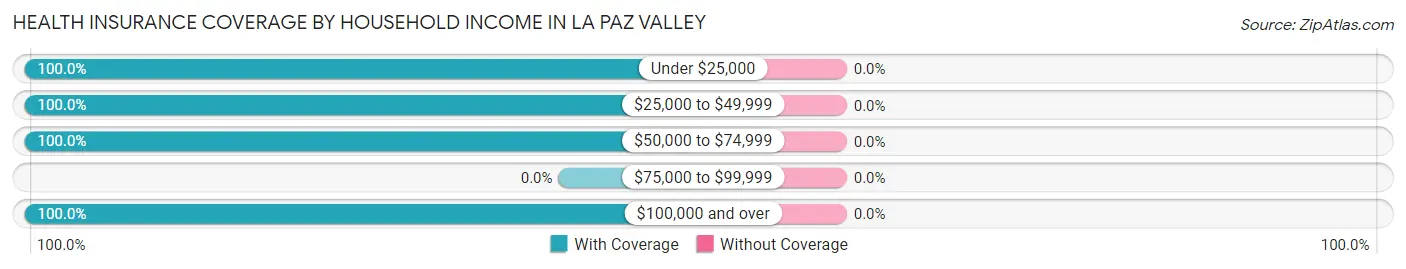
Health Insurance Coverage by Household Income in La Paz Valley
Household Income
With Coverage
Without Coverage
Under $25,000
159 (100.0%)
0 (0.0%)
$25,000 to $49,999
175 (100.0%)
0 (0.0%)
$50,000 to $74,999
91 (100.0%)
0 (0.0%)
$75,000 to $99,999
0 (0.0%)
0 (0.0%)
$100,000 and over
44 (100.0%)
0 (0.0%)
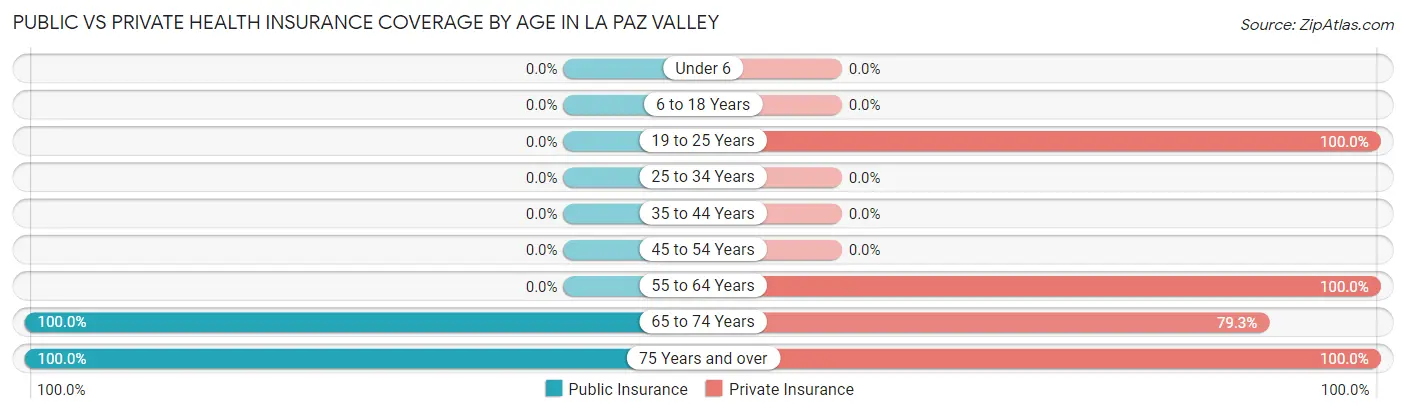
Public vs Private Health Insurance Coverage by Age in La Paz Valley
Age Bracket
Public Insurance
Private Insurance
Under 6
0 (0.0%)
0 (0.0%)
6 to 18 Years
0 (0.0%)
0 (0.0%)
19 to 25 Years
0 (0.0%)
66 (100.0%)
25 to 34 Years
0 (0.0%)
0 (0.0%)
35 to 44 Years
0 (0.0%)
0 (0.0%)
45 to 54 Years
0 (0.0%)
0 (0.0%)
55 to 64 Years
0 (0.0%)
44 (100.0%)
65 to 74 Years
232 (100.0%)
184 (79.3%)
75 Years and over
127 (100.0%)
127 (100.0%)
Total
359 (76.5%)
421 (89.8%)
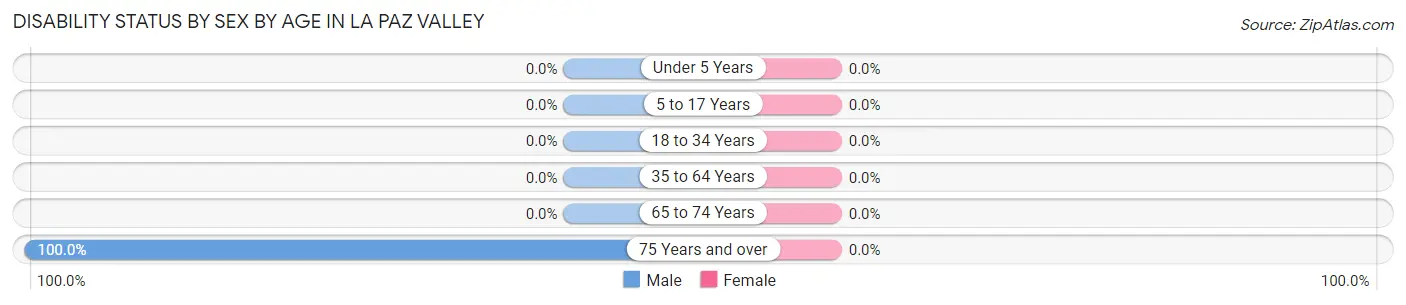
Disability Status by Sex by Age in La Paz Valley
Age Bracket
Male
Female
Under 5 Years
0 (0.0%)
0 (0.0%)
5 to 17 Years
0 (0.0%)
0 (0.0%)
18 to 34 Years
0 (0.0%)
0 (0.0%)
35 to 64 Years
0 (0.0%)
0 (0.0%)
65 to 74 Years
0 (0.0%)
0 (0.0%)
75 Years and over
127 (100.0%)
0 (0.0%)
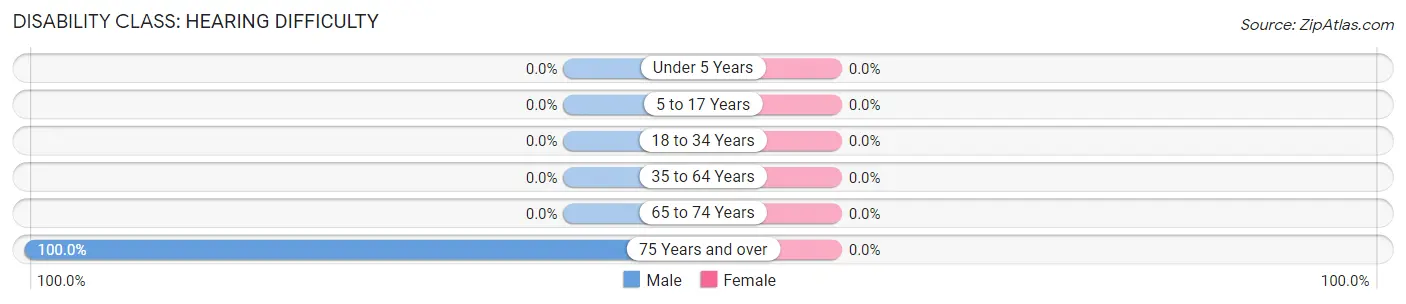
Disability Class by Sex by Age in La Paz Valley
Disability Class: Hearing Difficulty
Age Bracket
Male
Female
Under 5 Years
0 (0.0%)
0 (0.0%)
5 to 17 Years
0 (0.0%)
0 (0.0%)
18 to 34 Years
0 (0.0%)
0 (0.0%)
35 to 64 Years
0 (0.0%)
0 (0.0%)
65 to 74 Years
0 (0.0%)
0 (0.0%)
75 Years and over
127 (100.0%)
0 (0.0%)
Disability Class: Vision Difficulty
Age Bracket
Male
Female
Under 5 Years
0 (0.0%)
0 (0.0%)
5 to 17 Years
0 (0.0%)
0 (0.0%)
18 to 34 Years
0 (0.0%)
0 (0.0%)
35 to 64 Years
0 (0.0%)
0 (0.0%)
65 to 74 Years
0 (0.0%)
0 (0.0%)
75 Years and over
0 (0.0%)
0 (0.0%)
Disability Class: Cognitive Difficulty
Age Bracket
Male
Female
5 to 17 Years
0 (0.0%)
0 (0.0%)
18 to 34 Years
0 (0.0%)
0 (0.0%)
35 to 64 Years
0 (0.0%)
0 (0.0%)
65 to 74 Years
0 (0.0%)
0 (0.0%)
75 Years and over
127 (100.0%)
0 (0.0%)
Disability Class: Ambulatory Difficulty
Age Bracket
Male
Female
5 to 17 Years
0 (0.0%)
0 (0.0%)
18 to 34 Years
0 (0.0%)
0 (0.0%)
35 to 64 Years
0 (0.0%)
0 (0.0%)
65 to 74 Years
0 (0.0%)
0 (0.0%)
75 Years and over
127 (100.0%)
0 (0.0%)
Disability Class: Self-Care Difficulty
Age Bracket
Male
Female
5 to 17 Years
0 (0.0%)
0 (0.0%)
18 to 34 Years
0 (0.0%)
0 (0.0%)
35 to 64 Years
0 (0.0%)
0 (0.0%)
65 to 74 Years
0 (0.0%)
0 (0.0%)
75 Years and over
0 (0.0%)
0 (0.0%)
Technology Access in La Paz Valley
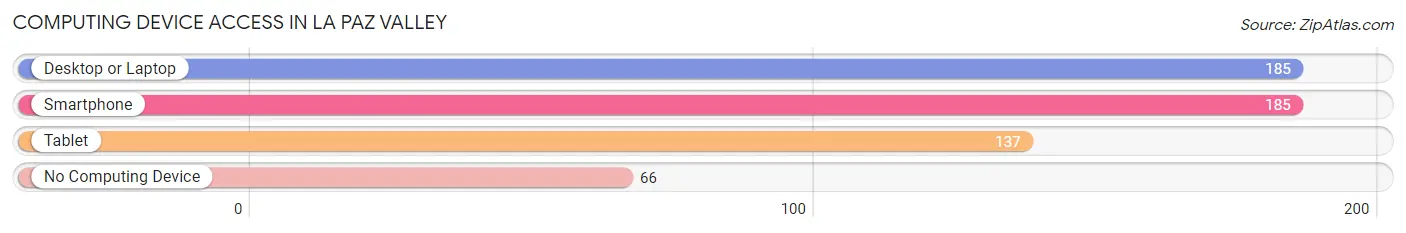
Computing Device Access in La Paz Valley
Device Type
# Households
% Households
Desktop or Laptop
185
73.7%
Smartphone
185
73.7%
Tablet
137
54.6%
No Computing Device
66
26.3%
Total
251
100.0%
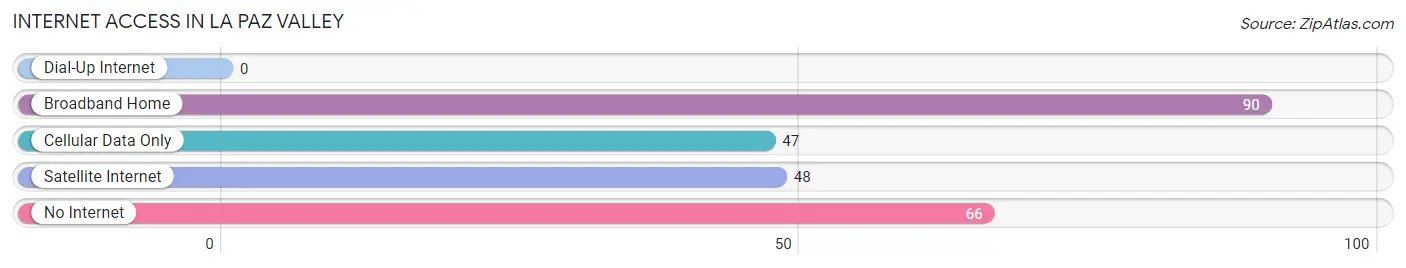
Internet Access in La Paz Valley
Internet Type
# Households
% Households
Dial-Up Internet
0
0.0%
Broadband Home
90
35.9%
Cellular Data Only
47
18.7%
Satellite Internet
48
19.1%
No Internet
66
26.3%
Total
251
100.0%
La Paz Valley Summary
La Paz Valley is a small rural community located in the Sonoran Desert of southwestern Arizona. It is situated in the La Paz County, which is bordered by Yuma County to the west, Maricopa County to the north, and Pima County to the east. The valley is located approximately 40 miles south of Phoenix and is home to a population of approximately 1,500 people.
Geography
La Paz Valley is located in the Sonoran Desert of southwestern Arizona. The valley is situated in the La Paz County, which is bordered by Yuma County to the west, Maricopa County to the north, and Pima County to the east. The valley is located approximately 40 miles south of Phoenix and is home to a population of approximately 1,500 people. The valley is surrounded by the Gila Mountains to the east, the Harquahala Mountains to the west, and the Buckskin Mountains to the south. The valley is characterized by its flat terrain and is home to a variety of desert vegetation, including creosote bush, mesquite, and palo verde.
History
The La Paz Valley has a long and rich history. The area was first inhabited by the Hohokam people, who were a Native American tribe that lived in the area from approximately 300 BC to 1450 AD. The Hohokam were known for their irrigation systems and their extensive trade networks. The area was later inhabited by the Yavapai and Apache tribes, who were displaced by the Spanish in the late 1700s. The area was then settled by Mexican ranchers in the early 1800s. The area was then annexed by the United States in 1854 as part of the Gadsden Purchase.
The area was then settled by American ranchers in the late 1800s. The town of La Paz was established in 1883 and was named after the Mexican city of La Paz. The town was a popular stop for travelers on the Southern Pacific Railroad. The town was also home to a number of mines, including the La Paz Mine, which was one of the largest gold mines in the area. The town was also home to a number of other businesses, including a hotel, a general store, and a post office.
Economy
The economy of La Paz Valley is largely based on agriculture and tourism. The area is home to a number of farms and ranches, which produce a variety of crops, including cotton, alfalfa, and wheat. The area is also home to a number of tourist attractions, including the La Paz County Historical Museum, the La Paz County Fairgrounds, and the La Paz Valley Wildlife Refuge. The area is also home to a number of businesses, including restaurants, hotels, and retail stores.
Demographics
As of the 2010 census, the population of La Paz Valley was 1,500. The population is largely composed of White (77.3%), Hispanic (17.3%), and Native American (3.3%) individuals. The median household income in the area is $35,000, and the median age is 37. The area is largely rural, with only a small portion of the population living in urban areas. The area is served by the La Paz County School District, which includes two elementary schools, one middle school, and one high school.
Common Questions
What is Per Capita Income in La Paz Valley?
Per Capita income in La Paz Valley is $30,817.
What is Inequality or Gini Index in La Paz Valley?
Inequality or Gini Index in La Paz Valley is 0.66.
What is the Total Population of La Paz Valley?
Total Population of La Paz Valley is 469.
What is the Total Male Population of La Paz Valley?
Total Male Population of La Paz Valley is 330.
What is the Total Female Population of La Paz Valley?
Total Female Population of La Paz Valley is 139.
What is the Ratio of Males per 100 Females in La Paz Valley?
There are 237.41 Males per 100 Females in La Paz Valley.
What is the Ratio of Females per 100 Males in La Paz Valley?
There are 42.12 Females per 100 Males in La Paz Valley.
What is the Median Population Age in La Paz Valley?
Median Population Age in La Paz Valley is 70.7 Years.
What is the Average Family Size in La Paz Valley
Average Family Size in La Paz Valley is 2.8 People.
What is the Average Household Size in La Paz Valley
Average Household Size in La Paz Valley is 1.9 People.
How Large is the Labor Force in La Paz Valley?
There are 44 People in the Labor Forcein in La Paz Valley.
What is the Percentage of People in the Labor Force in La Paz Valley?
9.4% of People are in the Labor Force in La Paz Valley.
Report Title
Report Link
HTML Copy & Paste Link
Social Media
Copy and paste the folowing code into any webpage where you would like this interactive chart to display