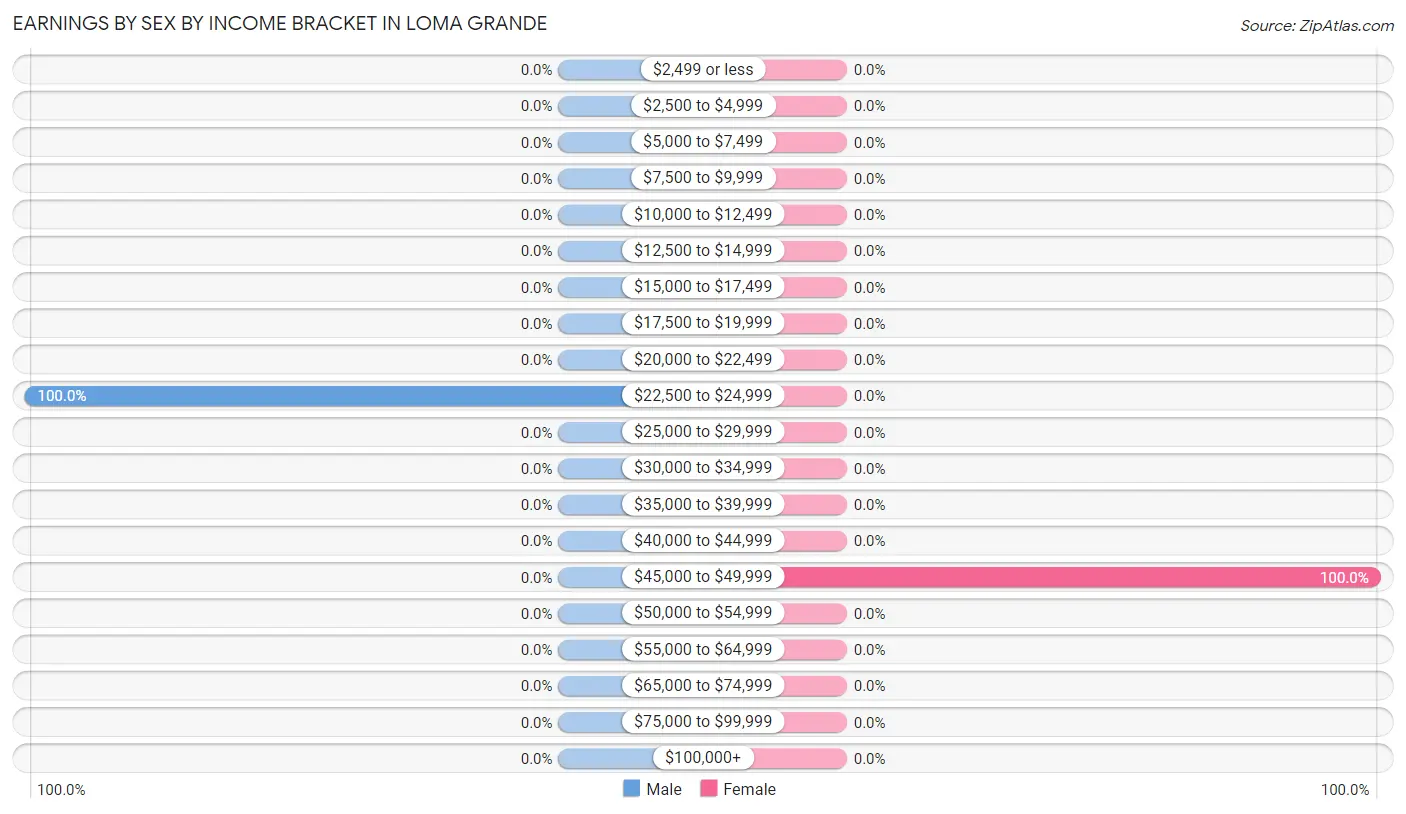
The most common earnings brackets in Loma Grande are $22,500 to $24,999 for men (59 | 100.0%) and $45,000 to $49,999 for women (70 | 100.0%).
Income
Male
Female
$2,499 or less
0 (0.0%)
0 (0.0%)
$2,500 to $4,999
0 (0.0%)
0 (0.0%)
$5,000 to $7,499
0 (0.0%)
0 (0.0%)
$7,500 to $9,999
0 (0.0%)
0 (0.0%)
$10,000 to $12,499
0 (0.0%)
0 (0.0%)
$12,500 to $14,999
0 (0.0%)
0 (0.0%)
$15,000 to $17,499
0 (0.0%)
0 (0.0%)
$17,500 to $19,999
0 (0.0%)
0 (0.0%)
$20,000 to $22,499
0 (0.0%)
0 (0.0%)
$22,500 to $24,999
59 (100.0%)
0 (0.0%)
$25,000 to $29,999
0 (0.0%)
0 (0.0%)
$30,000 to $34,999
0 (0.0%)
0 (0.0%)
$35,000 to $39,999
0 (0.0%)
0 (0.0%)
$40,000 to $44,999
0 (0.0%)
0 (0.0%)
$45,000 to $49,999
0 (0.0%)
70 (100.0%)
$50,000 to $54,999
0 (0.0%)
0 (0.0%)
$55,000 to $64,999
0 (0.0%)
0 (0.0%)
$65,000 to $74,999
0 (0.0%)
0 (0.0%)
$75,000 to $99,999
0 (0.0%)
0 (0.0%)
$100,000+
0 (0.0%)
0 (0.0%)
Total
59 (100.0%)
70 (100.0%)
Earnings by Sex by Educational Attainment in Loma Grande
Educational Attainment
Male Income
Female Income
Less than High School
-
-
High School Diploma
-
-
College or Associate's Degree
-
-
Bachelor's Degree
-
-
Graduate Degree
-
-
Total
-
-
Family Income in Loma Grande
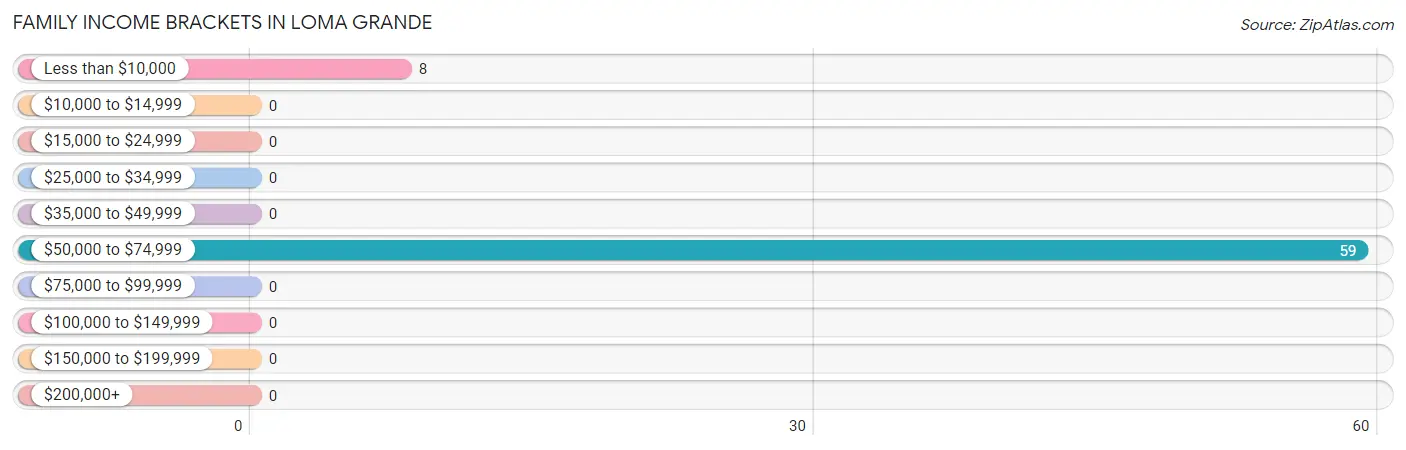
Family Income Brackets in Loma Grande
According to the Loma Grande family income data, there are 59 families falling into the $50,000 to $74,999 income range, which is the most common income bracket and makes up 88.1% of all families.
Income Bracket
# Families
% Families
Less than $10,000
8
11.9%
$10,000 to $14,999
0
0.0%
$15,000 to $24,999
0
0.0%
$25,000 to $34,999
0
0.0%
$35,000 to $49,999
0
0.0%
$50,000 to $74,999
59
88.1%
$75,000 to $99,999
0
0.0%
$100,000 to $149,999
0
0.0%
$150,000 to $199,999
0
0.0%
$200,000+
0
0.0%
Family Income by Famaliy Size in Loma Grande
Income Bracket
# Families
Median Income
2-Person Families
59 (88.1%)
$0
3-Person Families
0 (0.0%)
$0
4-Person Families
0 (0.0%)
$0
5-Person Families
8 (11.9%)
$0
6-Person Families
0 (0.0%)
$0
7+ Person Families
0 (0.0%)
$0
Total
67 (100.0%)
$0
Family Income by Number of Earners in Loma Grande
Number of Earners
# Families
Median Income
No Earners
8 (11.9%)
$0
1 Earner
0 (0.0%)
$0
2 Earners
59 (88.1%)
$0
3+ Earners
0 (0.0%)
$0
Total
67 (100.0%)
$0
Household Income in Loma Grande
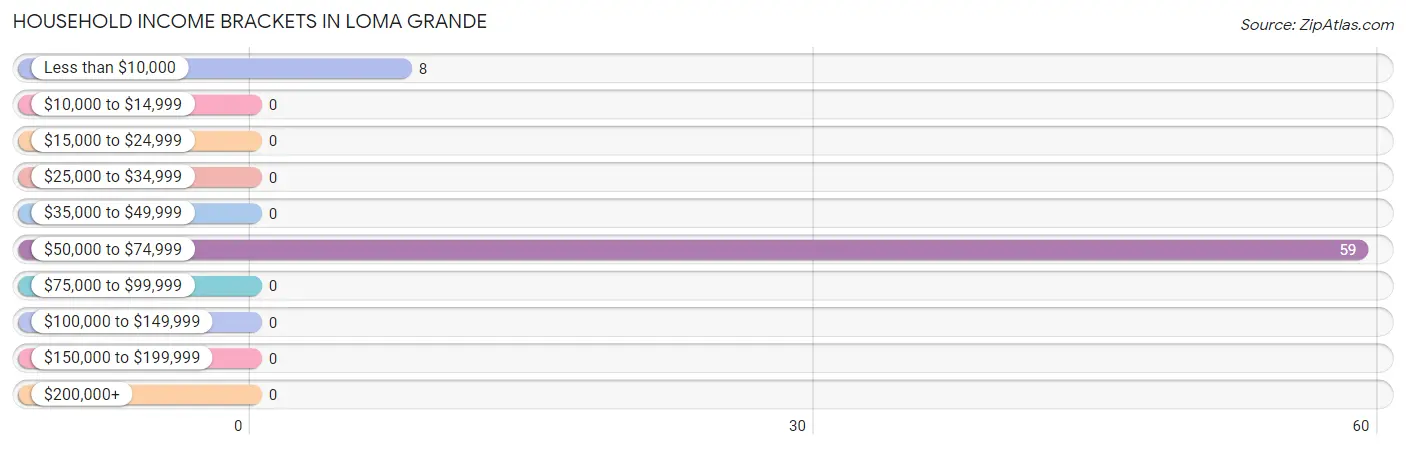
Household Income Brackets in Loma Grande
With 59 households falling in the category, the $50,000 to $74,999 income range is the most frequent in Loma Grande, accounting for 88.1% of all households.
Income Bracket
# Households
% Households
Less than $10,000
8
11.9%
$10,000 to $14,999
0
0.0%
$15,000 to $24,999
0
0.0%
$25,000 to $34,999
0
0.0%
$35,000 to $49,999
0
0.0%
$50,000 to $74,999
59
88.1%
$75,000 to $99,999
0
0.0%
$100,000 to $149,999
0
0.0%
$150,000 to $199,999
0
0.0%
$200,000+
0
0.0%
Household Income by Householder Age in Loma Grande
Income Bracket
# Households
Median Income
15 to 24 Years
0 (0.0%)
$0
25 to 44 Years
67 (100.0%)
$0
45 to 64 Years
0 (0.0%)
$0
65+ Years
0 (0.0%)
$0
Total
67 (100.0%)
$0
Poverty in Loma Grande
Income Below Poverty by Sex and Age in Loma Grande
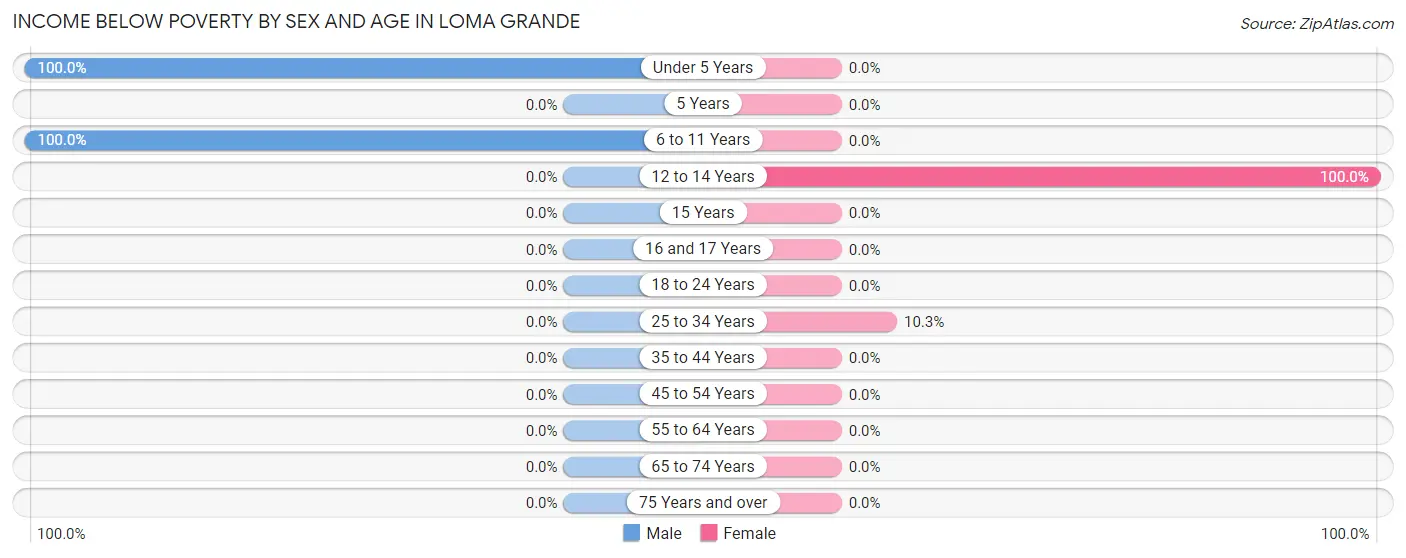
With 46.9% poverty level for males and 29.3% for females among the residents of Loma Grande, under 5 year old males and 12 to 14 year old females are the most vulnerable to poverty, with 24 males (100.0%) and 21 females (100.0%) in their respective age groups living below the poverty level.
Age Bracket
Male
Female
Under 5 Years
24 (100.0%)
0 (0.0%)
5 Years
0 (0.0%)
0 (0.0%)
6 to 11 Years
28 (100.0%)
0 (0.0%)
12 to 14 Years
0 (0.0%)
21 (100.0%)
15 Years
0 (0.0%)
0 (0.0%)
16 and 17 Years
0 (0.0%)
0 (0.0%)
18 to 24 Years
0 (0.0%)
0 (0.0%)
25 to 34 Years
0 (0.0%)
8 (10.3%)
35 to 44 Years
0 (0.0%)
0 (0.0%)
45 to 54 Years
0 (0.0%)
0 (0.0%)
55 to 64 Years
0 (0.0%)
0 (0.0%)
65 to 74 Years
0 (0.0%)
0 (0.0%)
75 Years and over
0 (0.0%)
0 (0.0%)
Total
52 (46.9%)
29 (29.3%)
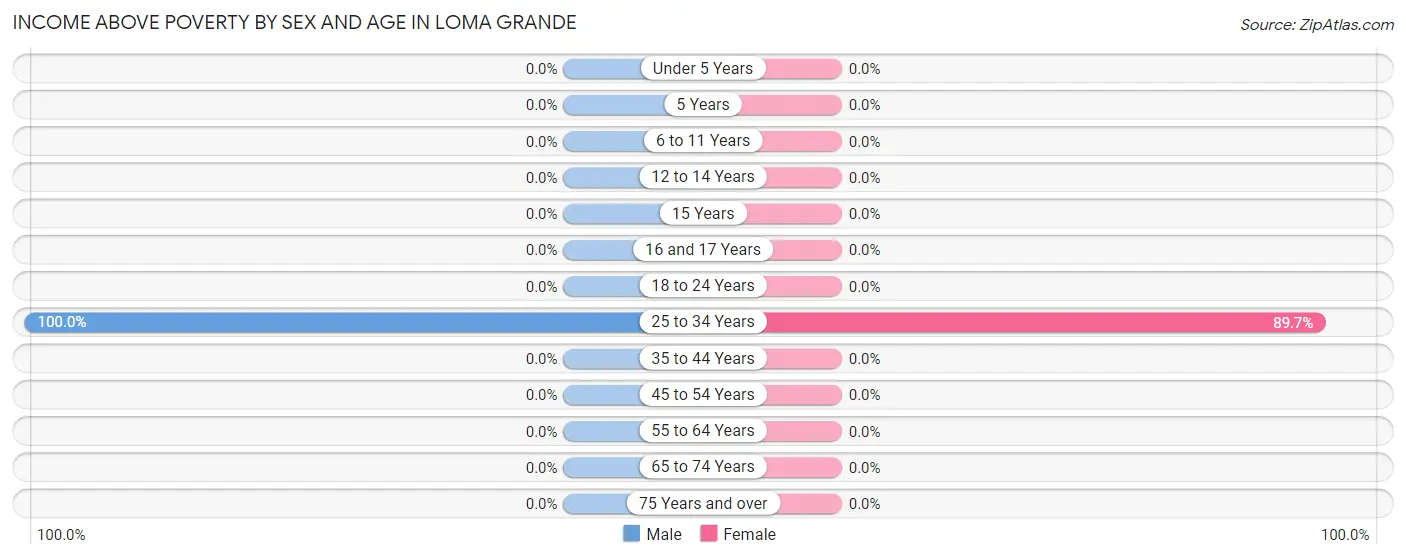
Income Above Poverty by Sex and Age in Loma Grande
According to the poverty statistics in Loma Grande, males aged 25 to 34 years and females aged 25 to 34 years are the age groups that are most secure financially, with 100.0% of males and 89.7% of females in these age groups living above the poverty line.
Age Bracket
Male
Female
Under 5 Years
0 (0.0%)
0 (0.0%)
5 Years
0 (0.0%)
0 (0.0%)
6 to 11 Years
0 (0.0%)
0 (0.0%)
12 to 14 Years
0 (0.0%)
0 (0.0%)
15 Years
0 (0.0%)
0 (0.0%)
16 and 17 Years
0 (0.0%)
0 (0.0%)
18 to 24 Years
0 (0.0%)
0 (0.0%)
25 to 34 Years
59 (100.0%)
70 (89.7%)
35 to 44 Years
0 (0.0%)
0 (0.0%)
45 to 54 Years
0 (0.0%)
0 (0.0%)
55 to 64 Years
0 (0.0%)
0 (0.0%)
65 to 74 Years
0 (0.0%)
0 (0.0%)
75 Years and over
0 (0.0%)
0 (0.0%)
Total
59 (53.1%)
70 (70.7%)
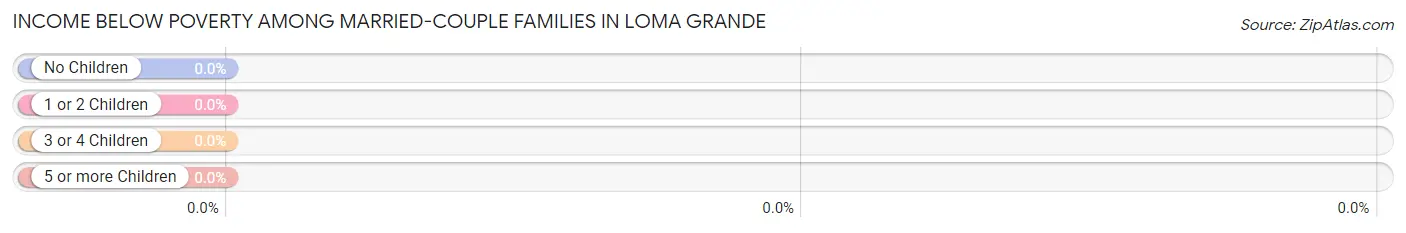
Income Below Poverty Among Married-Couple Families in Loma Grande
Children
Above Poverty
Below Poverty
No Children
59 (100.0%)
0 (0.0%)
1 or 2 Children
0 (0.0%)
0 (0.0%)
3 or 4 Children
0 (0.0%)
0 (0.0%)
5 or more Children
0 (0.0%)
0 (0.0%)
Total
59 (100.0%)
0 (0.0%)
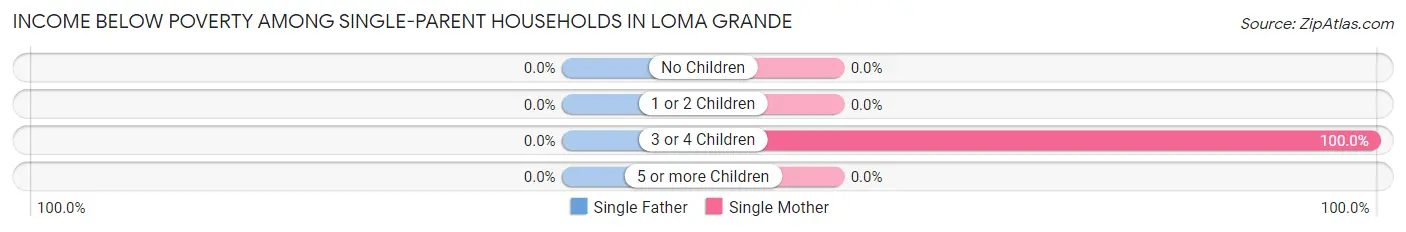
Income Below Poverty Among Single-Parent Households in Loma Grande
Children
Single Father
Single Mother
No Children
0 (0.0%)
0 (0.0%)
1 or 2 Children
0 (0.0%)
0 (0.0%)
3 or 4 Children
0 (0.0%)
8 (100.0%)
5 or more Children
0 (0.0%)
0 (0.0%)
Total
0 (0.0%)
8 (100.0%)
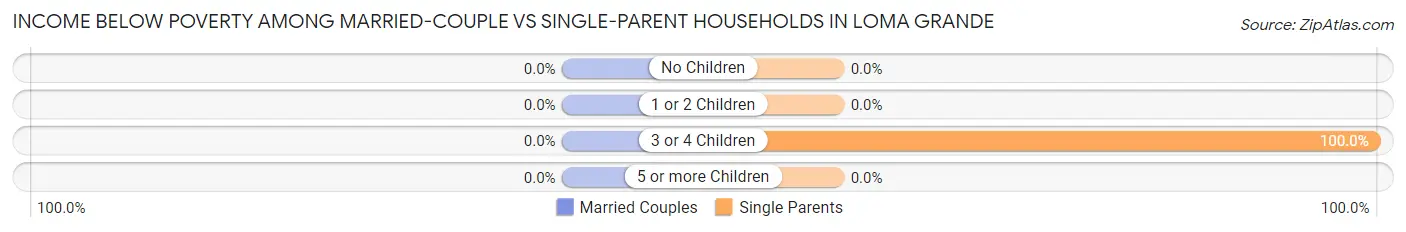
Income Below Poverty Among Married-Couple vs Single-Parent Households in Loma Grande
Children
Married-Couple Families
Single-Parent Households
No Children
0 (0.0%)
0 (0.0%)
1 or 2 Children
0 (0.0%)
0 (0.0%)
3 or 4 Children
0 (0.0%)
8 (100.0%)
5 or more Children
0 (0.0%)
0 (0.0%)
Total
0 (0.0%)
8 (100.0%)
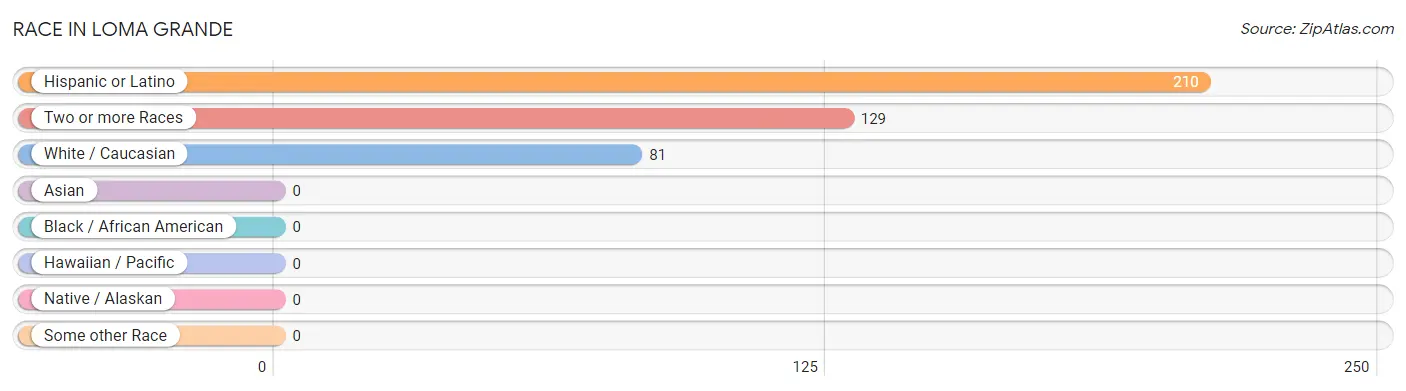
Race in Loma Grande
The most populous races in Loma Grande are Hispanic or Latino (210 | 100.0%), Two or more Races (129 | 61.4%), and White / Caucasian (81 | 38.6%).
Race
# Population
% Population
Asian
0
0.0%
Black / African American
0
0.0%
Hawaiian / Pacific
0
0.0%
Hispanic or Latino
210
100.0%
Native / Alaskan
0
0.0%
White / Caucasian
81
38.6%
Two or more Races
129
61.4%
Some other Race
0
0.0%
Total
210
100.0%
Ancestry in Loma Grande
The most populous ancestries reported in Loma Grande are , and Mexican (210 | 100.0%), together accounting for 100.0% of all Loma Grande residents.
Ancestry
# Population
% Population
Mexican
210
100.0%
View All 1 Rows
Immigrants in Loma Grande
Immigration Origin
# Population
% Population
View All 0 Rows
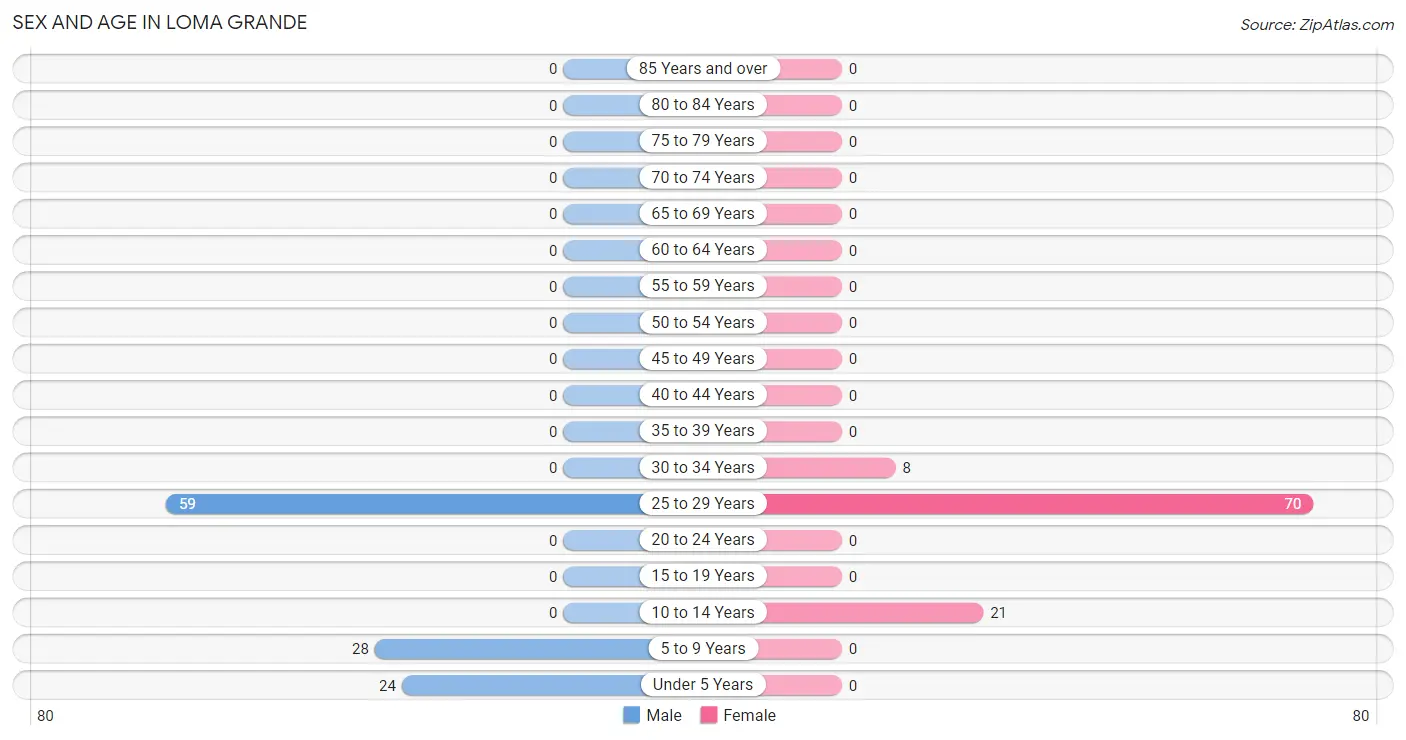
Sex and Age in Loma Grande
Sex and Age in Loma Grande
The most populous age groups in Loma Grande are 25 to 29 Years (59 | 53.1%) for men and 25 to 29 Years (70 | 70.7%) for women.
Age Bracket
Male
Female
Under 5 Years
24 (21.6%)
0 (0.0%)
5 to 9 Years
28 (25.2%)
0 (0.0%)
10 to 14 Years
0 (0.0%)
21 (21.2%)
15 to 19 Years
0 (0.0%)
0 (0.0%)
20 to 24 Years
0 (0.0%)
0 (0.0%)
25 to 29 Years
59 (53.1%)
70 (70.7%)
30 to 34 Years
0 (0.0%)
8 (8.1%)
35 to 39 Years
0 (0.0%)
0 (0.0%)
40 to 44 Years
0 (0.0%)
0 (0.0%)
45 to 49 Years
0 (0.0%)
0 (0.0%)
50 to 54 Years
0 (0.0%)
0 (0.0%)
55 to 59 Years
0 (0.0%)
0 (0.0%)
60 to 64 Years
0 (0.0%)
0 (0.0%)
65 to 69 Years
0 (0.0%)
0 (0.0%)
70 to 74 Years
0 (0.0%)
0 (0.0%)
75 to 79 Years
0 (0.0%)
0 (0.0%)
80 to 84 Years
0 (0.0%)
0 (0.0%)
85 Years and over
0 (0.0%)
0 (0.0%)
Total
111 (100.0%)
99 (100.0%)
Families and Households in Loma Grande
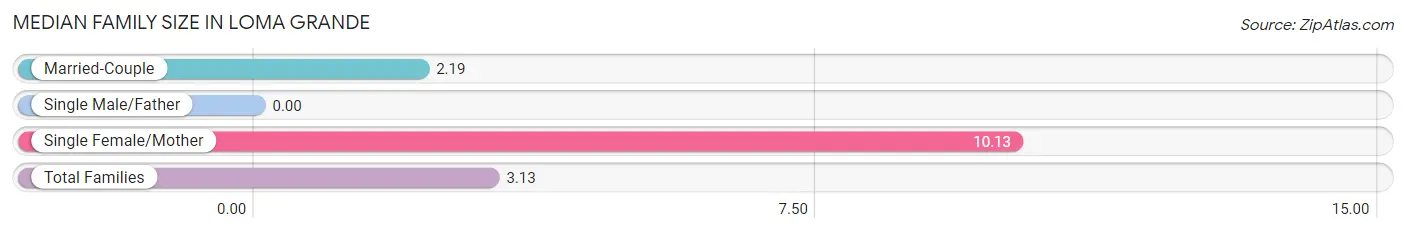
Median Family Size in Loma Grande
Family Type
# Families
Family Size
Married-Couple
59 (88.1%)
2.19
Single Male/Father
0 (0.0%)
-
Single Female/Mother
8 (11.9%)
10.13
Total Families
67 (100.0%)
3.13
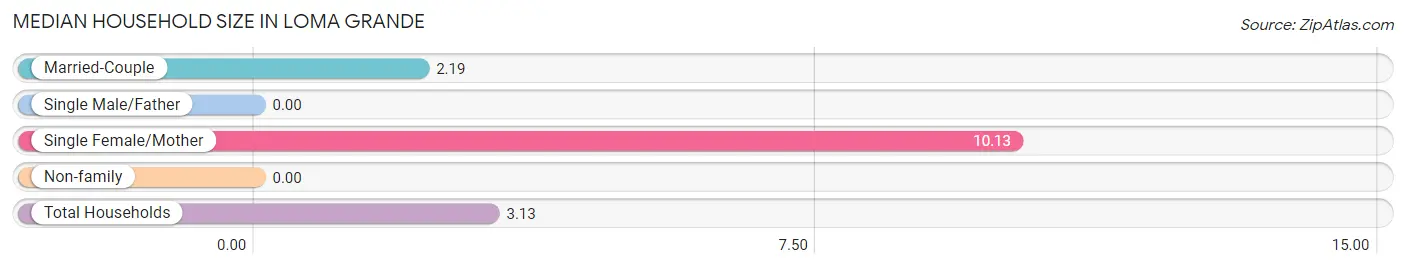
Median Household Size in Loma Grande
Household Type
# Households
Household Size
Married-Couple
59 (88.1%)
2.19
Single Male/Father
0 (0.0%)
-
Single Female/Mother
8 (11.9%)
10.13
Non-family
0 (0.0%)
-
Total Households
67 (100.0%)
3.13
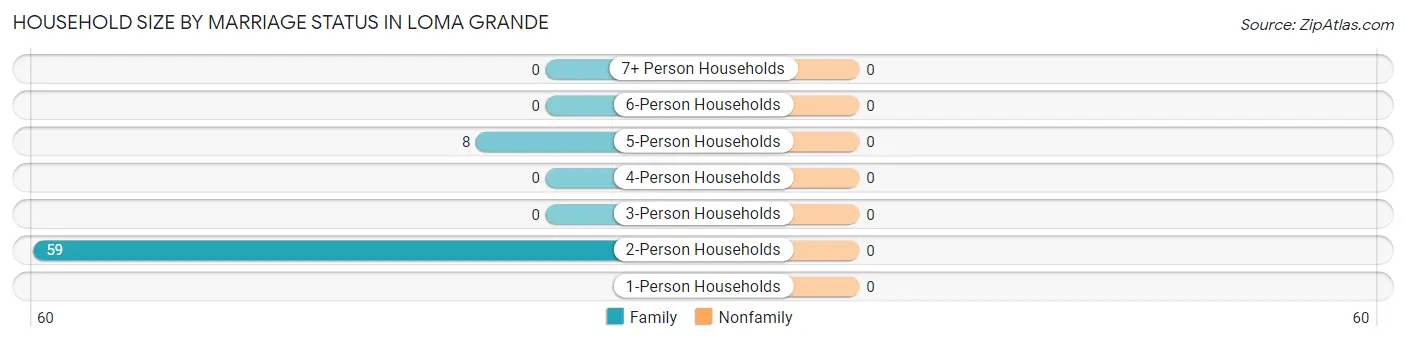
Household Size by Marriage Status in Loma Grande
Household Size
Family Households
Nonfamily Households
1-Person Households
-
0 (0.0%)
2-Person Households
59 (88.1%)
0 (0.0%)
3-Person Households
0 (0.0%)
0 (0.0%)
4-Person Households
0 (0.0%)
0 (0.0%)
5-Person Households
8 (11.9%)
0 (0.0%)
6-Person Households
0 (0.0%)
0 (0.0%)
7+ Person Households
0 (0.0%)
0 (0.0%)
Total
67 (100.0%)
0 (0.0%)
Female Fertility in Loma Grande
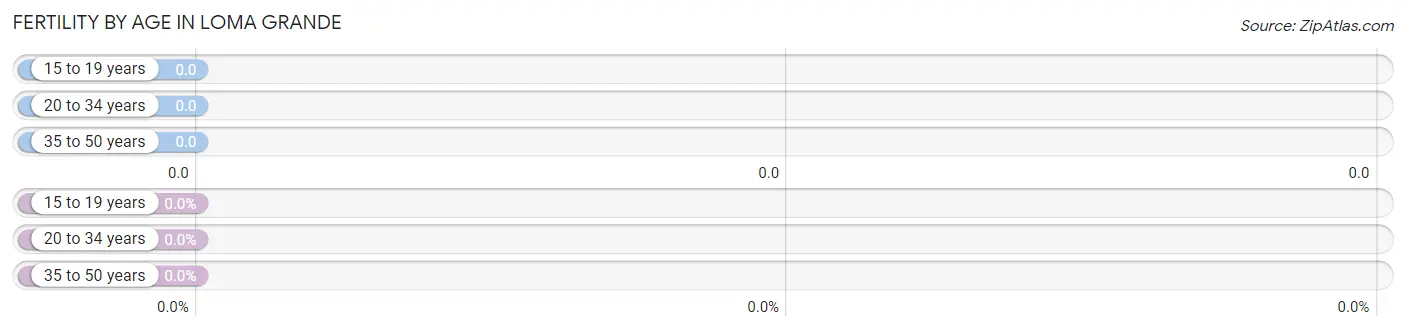
Fertility by Age in Loma Grande
Age Bracket
Women with Births
Births / 1,000 Women
15 to 19 years
0 (0.0%)
0.0
20 to 34 years
0 (0.0%)
0.0
35 to 50 years
0 (0.0%)
0.0
Total
0 (0.0%)
0.0
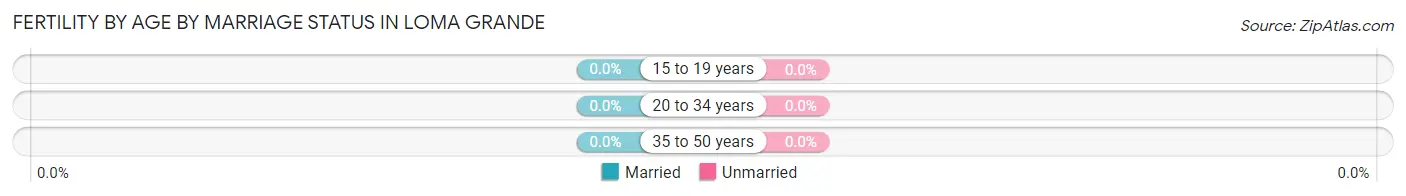
Fertility by Age by Marriage Status in Loma Grande
Age Bracket
Married
Unmarried
15 to 19 years
0 (0.0%)
0 (0.0%)
20 to 34 years
0 (0.0%)
0 (0.0%)
35 to 50 years
0 (0.0%)
0 (0.0%)
Total
0 (0.0%)
0 (0.0%)
Fertility by Education in Loma Grande
Educational Attainment
Women with Births
Births / 1,000 Women
Less than High School
0 (0.0%)
0.0
High School Diploma
0 (0.0%)
0.0
College or Associate's Degree
0 (0.0%)
0.0
Bachelor's Degree
0 (0.0%)
0.0
Graduate Degree
0 (0.0%)
0.0
Total
0 (0.0%)
0.0
Fertility by Education by Marriage Status in Loma Grande
Educational Attainment
Married
Unmarried
Less than High School
0 (0.0%)
0 (0.0%)
High School Diploma
0 (0.0%)
0 (0.0%)
College or Associate's Degree
0 (0.0%)
0 (0.0%)
Bachelor's Degree
0 (0.0%)
0 (0.0%)
Graduate Degree
0 (0.0%)
0 (0.0%)
Total
0 (0.0%)
0 (0.0%)
Employment Characteristics in Loma Grande
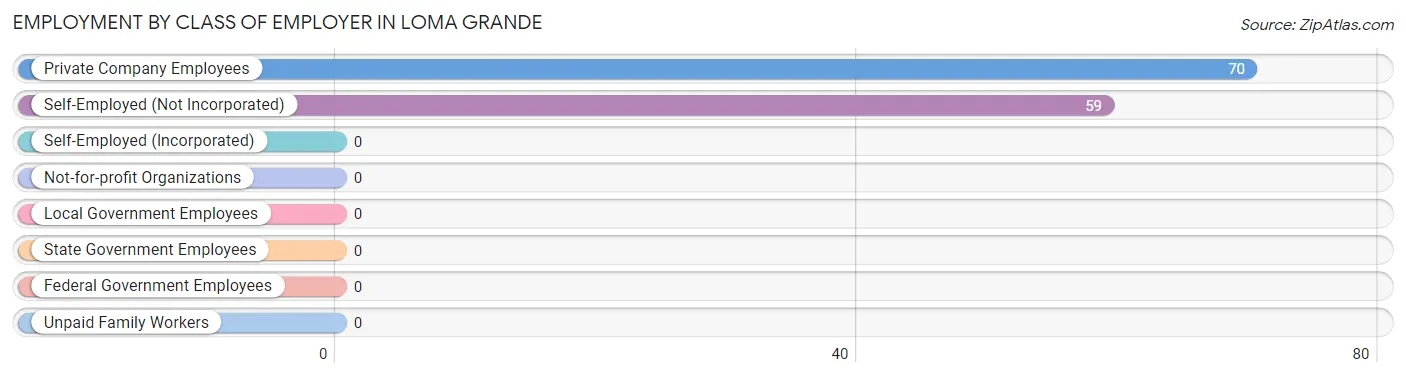
Employment by Class of Employer in Loma Grande
Among the 129 employed individuals in Loma Grande, private company employees (70 | 54.3%), and self-employed (not incorporated) (59 | 45.7%) make up the most common classes of employment.
Employer Class
# Employees
% Employees
Private Company Employees
70
54.3%
Self-Employed (Incorporated)
0
0.0%
Self-Employed (Not Incorporated)
59
45.7%
Not-for-profit Organizations
0
0.0%
Local Government Employees
0
0.0%
State Government Employees
0
0.0%
Federal Government Employees
0
0.0%
Unpaid Family Workers
0
0.0%
Total
129
100.0%
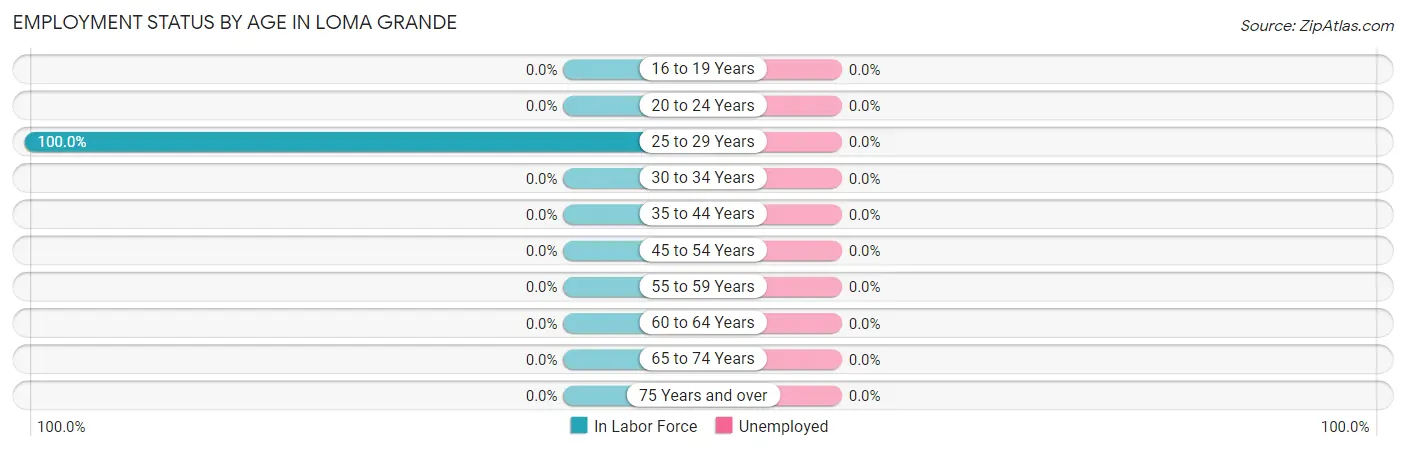
Employment Status by Age in Loma Grande
Age Bracket
In Labor Force
Unemployed
16 to 19 Years
0 (0.0%)
0 (0.0%)
20 to 24 Years
0 (0.0%)
0 (0.0%)
25 to 29 Years
129 (100.0%)
0 (0.0%)
30 to 34 Years
0 (0.0%)
0 (0.0%)
35 to 44 Years
0 (0.0%)
0 (0.0%)
45 to 54 Years
0 (0.0%)
0 (0.0%)
55 to 59 Years
0 (0.0%)
0 (0.0%)
60 to 64 Years
0 (0.0%)
0 (0.0%)
65 to 74 Years
0 (0.0%)
0 (0.0%)
75 Years and over
0 (0.0%)
0 (0.0%)
Total
129 (94.2%)
0 (0.0%)
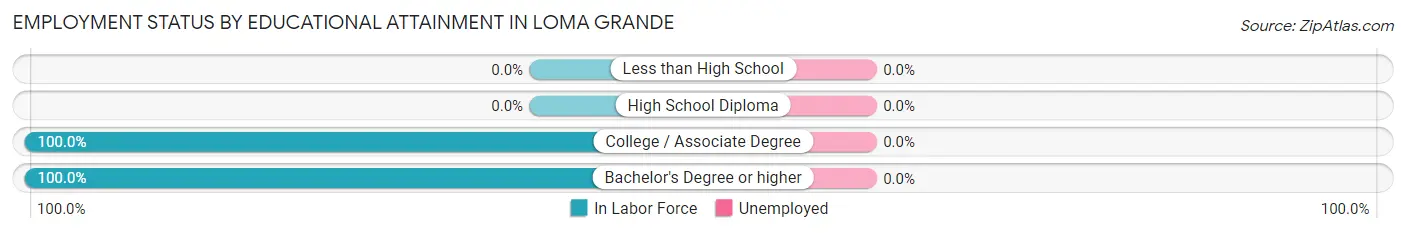
Employment Status by Educational Attainment in Loma Grande
Educational Attainment
In Labor Force
Unemployed
Less than High School
0 (0.0%)
0 (0.0%)
High School Diploma
0 (0.0%)
0 (0.0%)
College / Associate Degree
59 (100.0%)
0 (0.0%)
Bachelor's Degree or higher
70 (100.0%)
0 (0.0%)
Total
129 (94.2%)
0 (0.0%)
Employment Occupations by Sex in Loma Grande
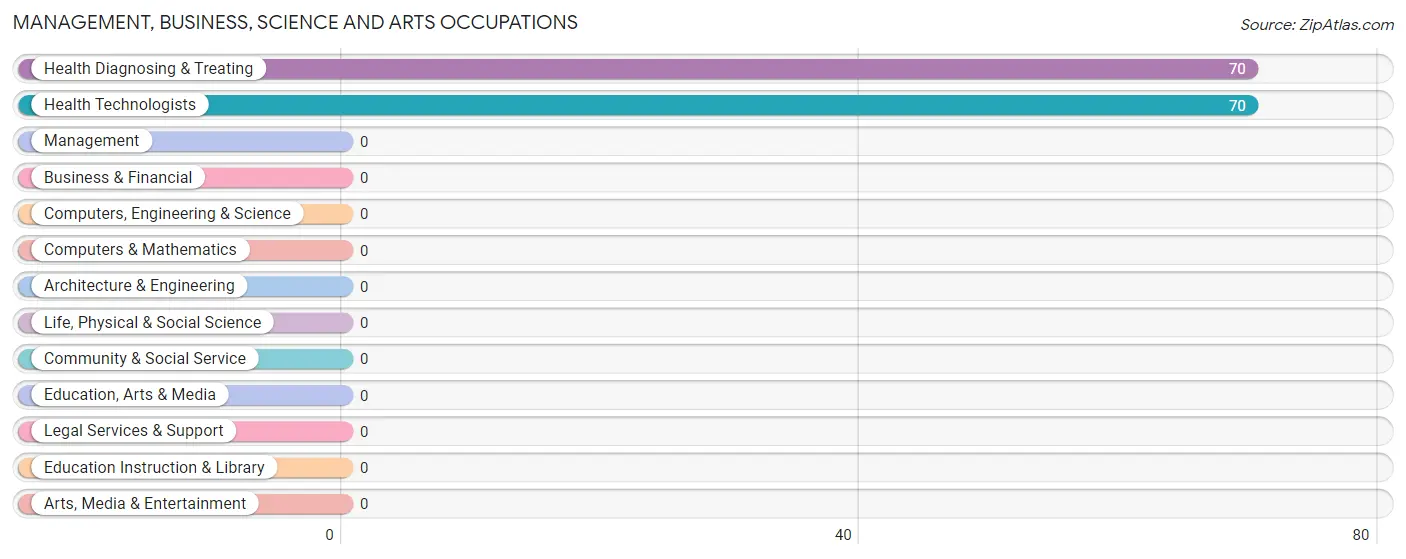
Management, Business, Science and Arts Occupations
The most common Management, Business, Science and Arts occupations in Loma Grande are Health Diagnosing & Treating (70 | 54.3%), and Health Technologists (70 | 54.3%).
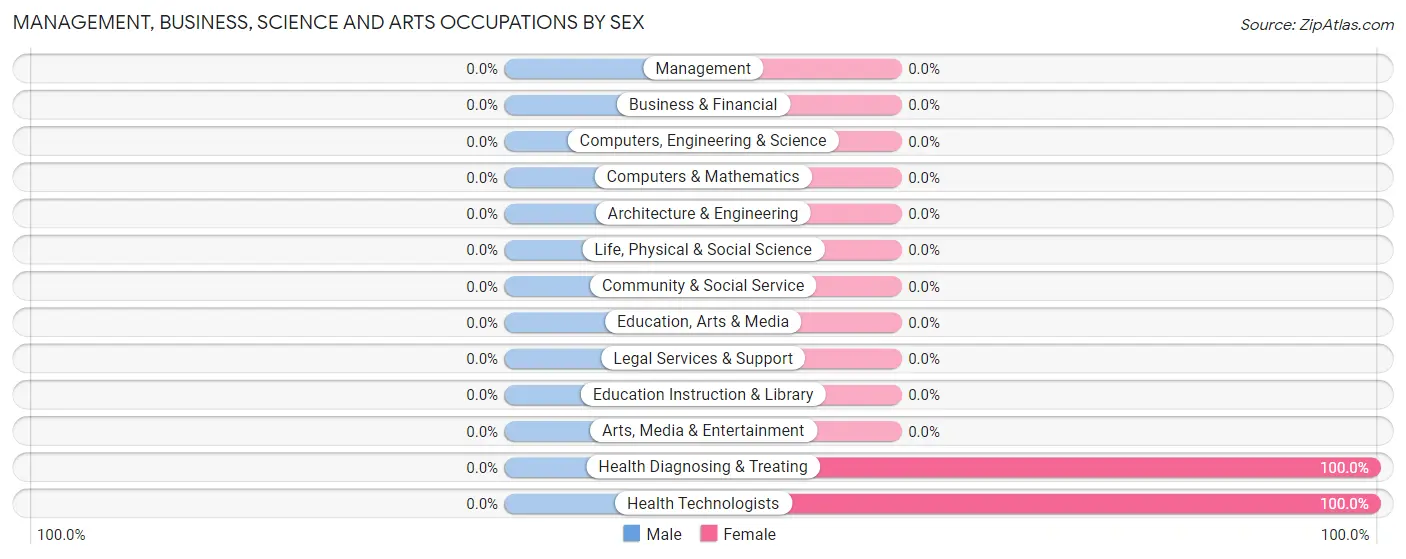
Management, Business, Science and Arts Occupations by Sex
Occupation
Male
Female
Management
0 (0.0%)
0 (0.0%)
Business & Financial
0 (0.0%)
0 (0.0%)
Computers, Engineering & Science
0 (0.0%)
0 (0.0%)
Computers & Mathematics
0 (0.0%)
0 (0.0%)
Architecture & Engineering
0 (0.0%)
0 (0.0%)
Life, Physical & Social Science
0 (0.0%)
0 (0.0%)
Community & Social Service
0 (0.0%)
0 (0.0%)
Education, Arts & Media
0 (0.0%)
0 (0.0%)
Legal Services & Support
0 (0.0%)
0 (0.0%)
Education Instruction & Library
0 (0.0%)
0 (0.0%)
Arts, Media & Entertainment
0 (0.0%)
0 (0.0%)
Health Diagnosing & Treating
0 (0.0%)
70 (100.0%)
Health Technologists
0 (0.0%)
70 (100.0%)
Total (Category)
0 (0.0%)
70 (100.0%)
Total (Overall)
59 (45.7%)
70 (54.3%)
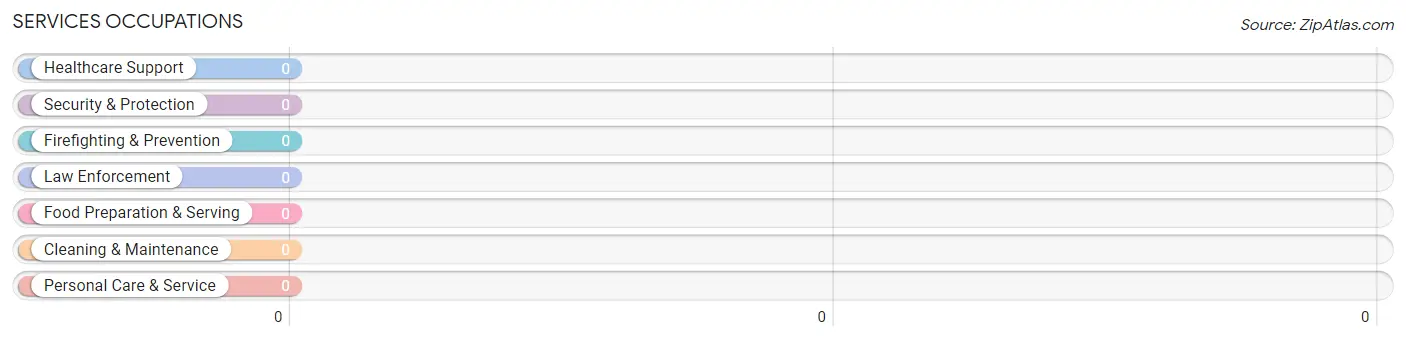
Services Occupations
Services Occupations by Sex
Occupation
Male
Female
Healthcare Support
0 (0.0%)
0 (0.0%)
Security & Protection
0 (0.0%)
0 (0.0%)
Firefighting & Prevention
0 (0.0%)
0 (0.0%)
Law Enforcement
0 (0.0%)
0 (0.0%)
Food Preparation & Serving
0 (0.0%)
0 (0.0%)
Cleaning & Maintenance
0 (0.0%)
0 (0.0%)
Personal Care & Service
0 (0.0%)
0 (0.0%)
Total (Category)
0 (0.0%)
0 (0.0%)
Total (Overall)
59 (45.7%)
70 (54.3%)
Sales and Office Occupations
Sales and Office Occupations by Sex
Occupation
Male
Female
Sales & Related
0 (0.0%)
0 (0.0%)
Office & Administration
0 (0.0%)
0 (0.0%)
Total (Category)
0 (0.0%)
0 (0.0%)
Total (Overall)
59 (45.7%)
70 (54.3%)
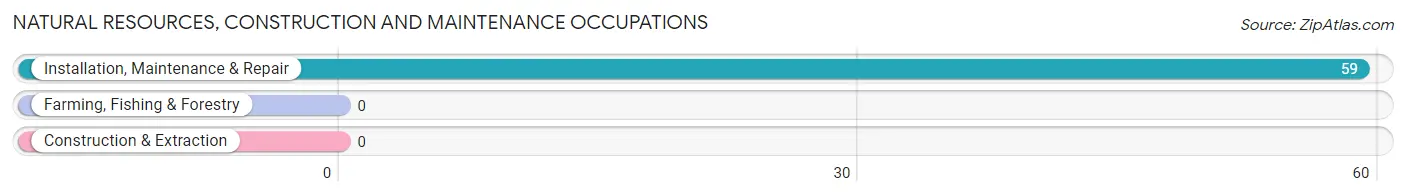
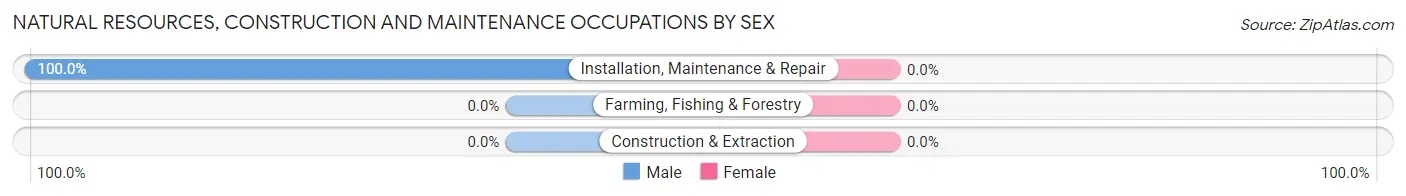
Natural Resources, Construction and Maintenance Occupations
The most common Natural Resources, Construction and Maintenance occupations in Loma Grande are , and Installation, Maintenance & Repair (59 | 45.7%).
Natural Resources, Construction and Maintenance Occupations by Sex
Occupation
Male
Female
Farming, Fishing & Forestry
0 (0.0%)
0 (0.0%)
Construction & Extraction
0 (0.0%)
0 (0.0%)
Installation, Maintenance & Repair
59 (100.0%)
0 (0.0%)
Total (Category)
59 (100.0%)
0 (0.0%)
Total (Overall)
59 (45.7%)
70 (54.3%)
Production, Transportation and Moving Occupations
Production, Transportation and Moving Occupations by Sex
Occupation
Male
Female
Production
0 (0.0%)
0 (0.0%)
Transportation
0 (0.0%)
0 (0.0%)
Material Moving
0 (0.0%)
0 (0.0%)
Total (Category)
0 (0.0%)
0 (0.0%)
Total (Overall)
59 (45.7%)
70 (54.3%)
Employment Industries by Sex in Loma Grande
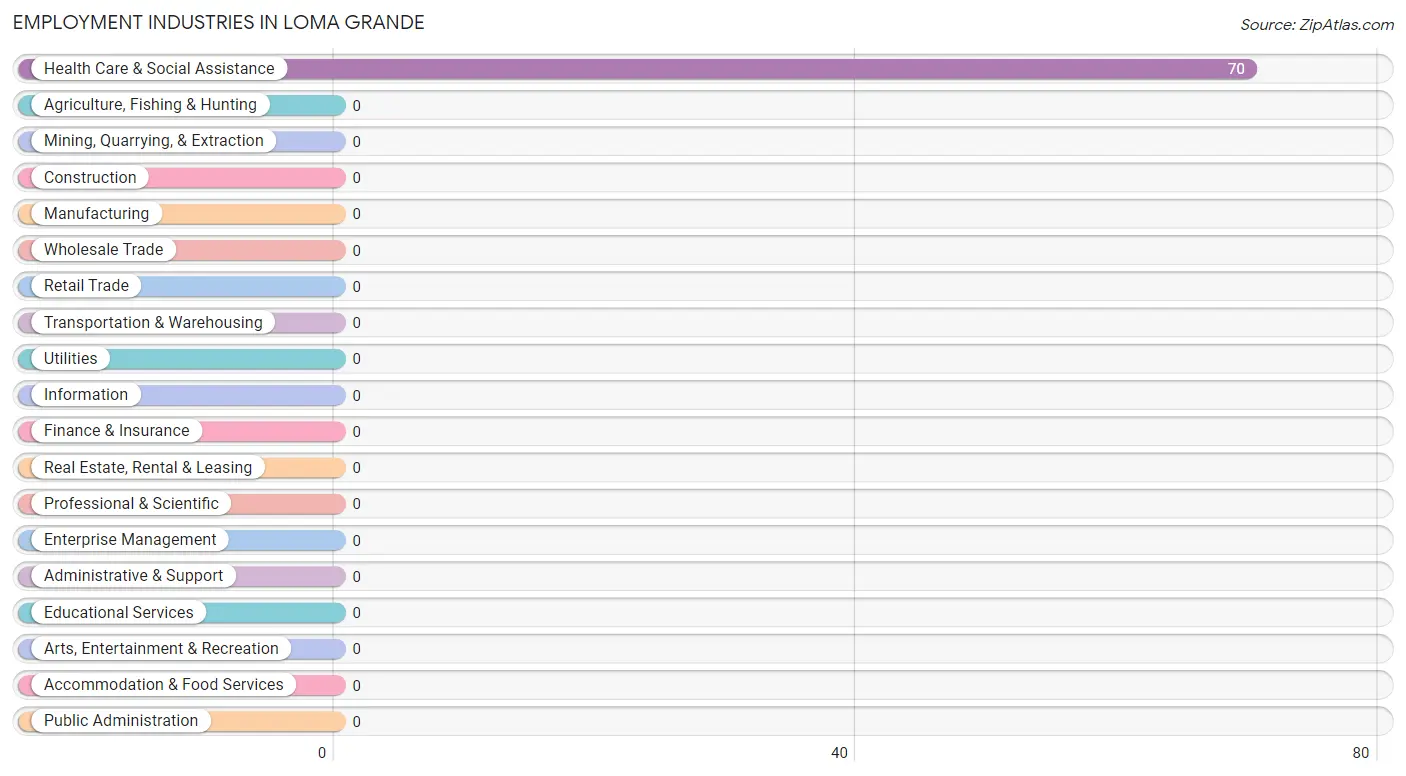
Employment Industries in Loma Grande
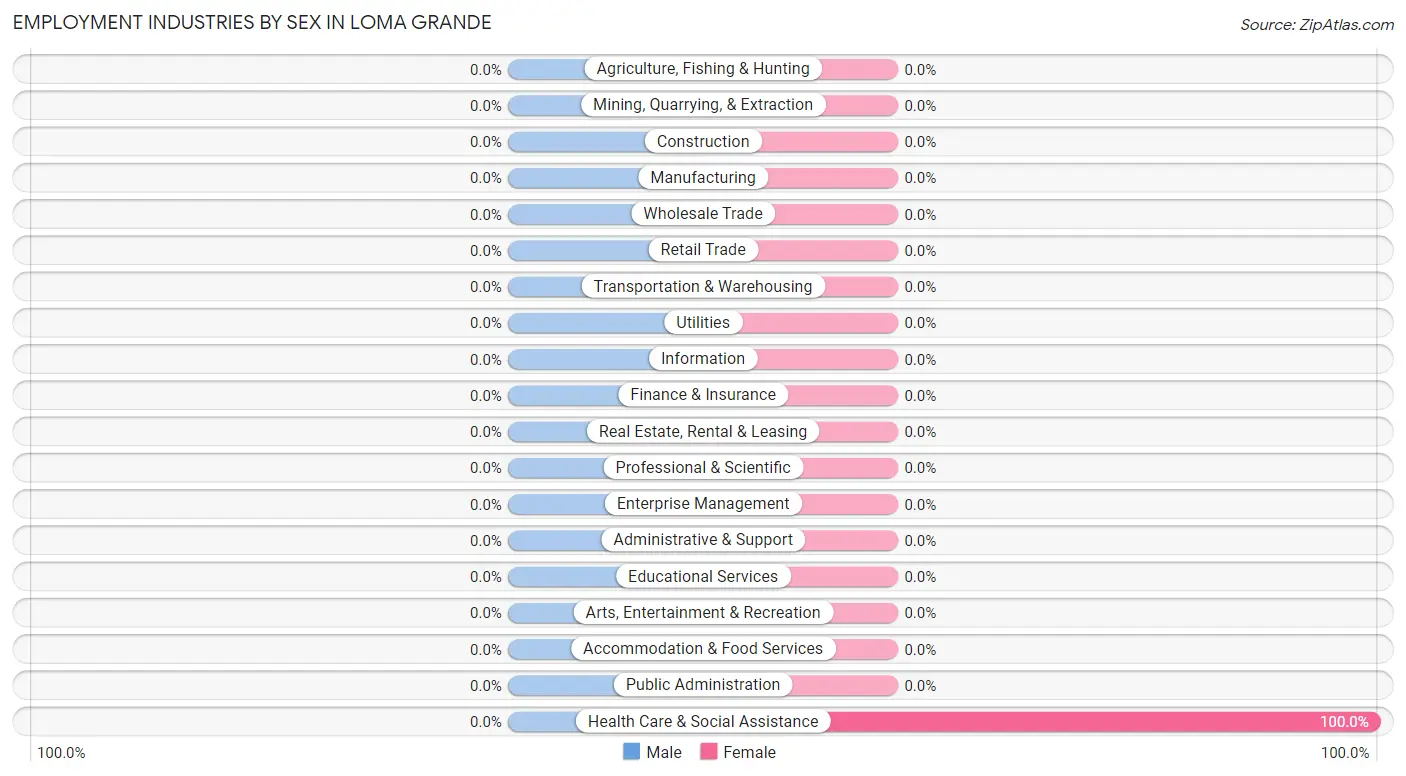
The major employment industries in Loma Grande include , and Health Care & Social Assistance (70 | 54.3%).
Employment Industries by Sex in Loma Grande
Industry
Male
Female
Agriculture, Fishing & Hunting
0 (0.0%)
0 (0.0%)
Mining, Quarrying, & Extraction
0 (0.0%)
0 (0.0%)
Construction
0 (0.0%)
0 (0.0%)
Manufacturing
0 (0.0%)
0 (0.0%)
Wholesale Trade
0 (0.0%)
0 (0.0%)
Retail Trade
0 (0.0%)
0 (0.0%)
Transportation & Warehousing
0 (0.0%)
0 (0.0%)
Utilities
0 (0.0%)
0 (0.0%)
Information
0 (0.0%)
0 (0.0%)
Finance & Insurance
0 (0.0%)
0 (0.0%)
Real Estate, Rental & Leasing
0 (0.0%)
0 (0.0%)
Professional & Scientific
0 (0.0%)
0 (0.0%)
Enterprise Management
0 (0.0%)
0 (0.0%)
Administrative & Support
0 (0.0%)
0 (0.0%)
Educational Services
0 (0.0%)
0 (0.0%)
Health Care & Social Assistance
0 (0.0%)
70 (100.0%)
Arts, Entertainment & Recreation
0 (0.0%)
0 (0.0%)
Accommodation & Food Services
0 (0.0%)
0 (0.0%)
Public Administration
0 (0.0%)
0 (0.0%)
Total
59 (45.7%)
70 (54.3%)
Education in Loma Grande
School Enrollment in Loma Grande
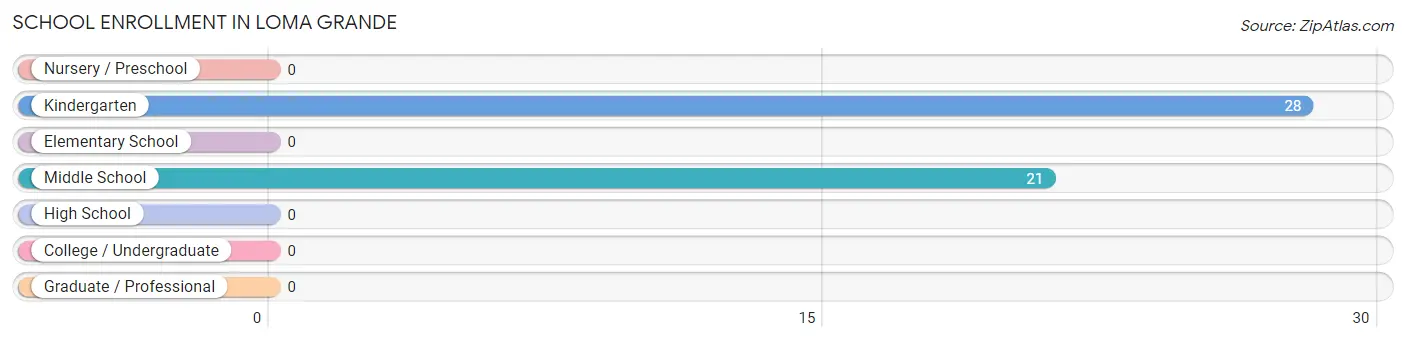
The most common levels of schooling among the 49 students in Loma Grande are kindergarten (28 | 57.1%), and middle school (21 | 42.9%).
School Level
# Students
% Students
Nursery / Preschool
0
0.0%
Kindergarten
28
57.1%
Elementary School
0
0.0%
Middle School
21
42.9%
High School
0
0.0%
College / Undergraduate
0
0.0%
Graduate / Professional
0
0.0%
Total
49
100.0%
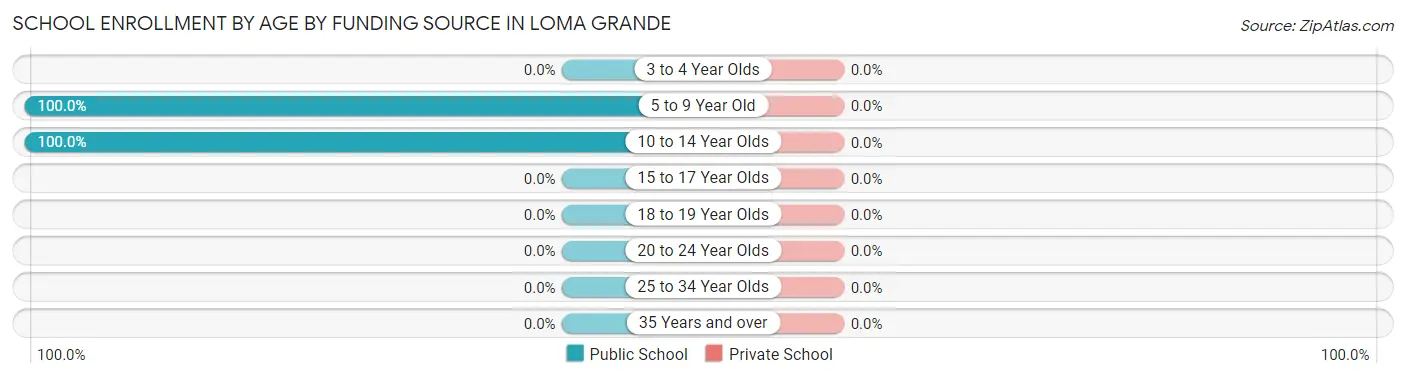
School Enrollment by Age by Funding Source in Loma Grande
Age Bracket
Public School
Private School
3 to 4 Year Olds
0 (0.0%)
0 (0.0%)
5 to 9 Year Old
28 (100.0%)
0 (0.0%)
10 to 14 Year Olds
21 (100.0%)
0 (0.0%)
15 to 17 Year Olds
0 (0.0%)
0 (0.0%)
18 to 19 Year Olds
0 (0.0%)
0 (0.0%)
20 to 24 Year Olds
0 (0.0%)
0 (0.0%)
25 to 34 Year Olds
0 (0.0%)
0 (0.0%)
35 Years and over
0 (0.0%)
0 (0.0%)
Total
49 (100.0%)
0 (0.0%)
Educational Attainment by Field of Study in Loma Grande
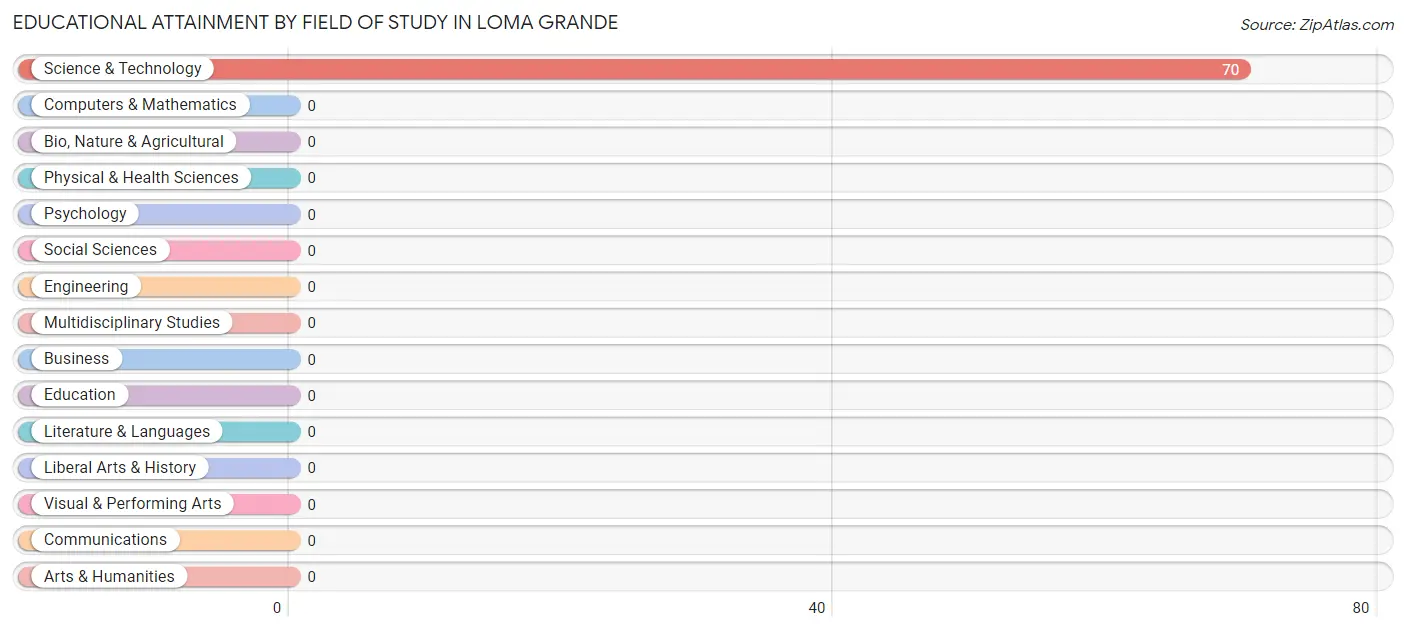
, and science & technology (70 | 100.0%) are the most common fields of study among 70 individuals in Loma Grande who have obtained a bachelor's degree or higher.
Field of Study
# Graduates
% Graduates
Computers & Mathematics
0
0.0%
Bio, Nature & Agricultural
0
0.0%
Physical & Health Sciences
0
0.0%
Psychology
0
0.0%
Social Sciences
0
0.0%
Engineering
0
0.0%
Multidisciplinary Studies
0
0.0%
Science & Technology
70
100.0%
Business
0
0.0%
Education
0
0.0%
Literature & Languages
0
0.0%
Liberal Arts & History
0
0.0%
Visual & Performing Arts
0
0.0%
Communications
0
0.0%
Arts & Humanities
0
0.0%
Total
70
100.0%
Transportation & Commute in Loma Grande
Vehicle Availability by Sex in Loma Grande
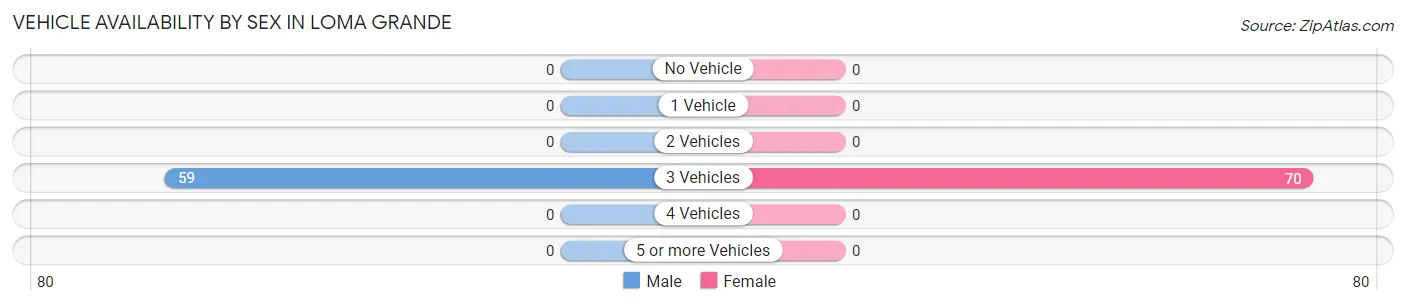
The most prevalent vehicle ownership categories in Loma Grande are males with 3 vehicles (59, accounting for 100.0%) and females with 3 vehicles (70, making up 84.3%).
Vehicles Available
Male
Female
No Vehicle
0 (0.0%)
0 (0.0%)
1 Vehicle
0 (0.0%)
0 (0.0%)
2 Vehicles
0 (0.0%)
0 (0.0%)
3 Vehicles
59 (100.0%)
70 (100.0%)
4 Vehicles
0 (0.0%)
0 (0.0%)
5 or more Vehicles
0 (0.0%)
0 (0.0%)
Total
59 (100.0%)
70 (100.0%)
Commute Time in Loma Grande
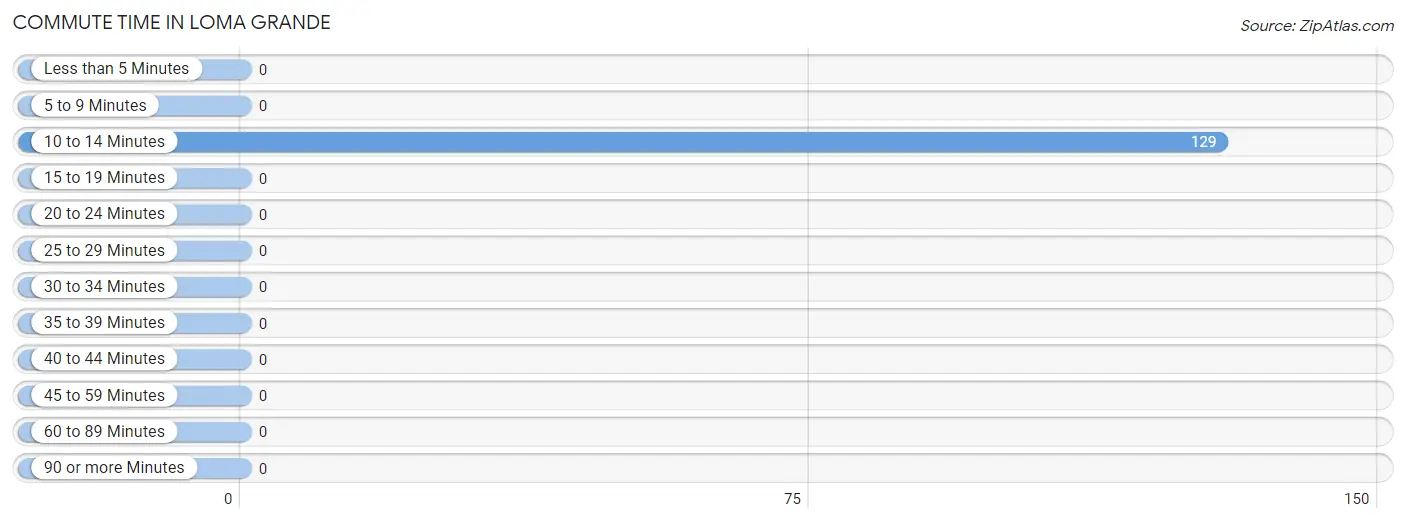
The most frequently occuring commute durations in Loma Grande are 10 to 14 minutes (129 commuters, 100.0%), less than 5 minutes (0 commuters, 0.0%), and 5 to 9 minutes (0 commuters, 0.0%).
Commute Time
# Commuters
% Commuters
Less than 5 Minutes
0
0.0%
5 to 9 Minutes
0
0.0%
10 to 14 Minutes
129
100.0%
15 to 19 Minutes
0
0.0%
20 to 24 Minutes
0
0.0%
25 to 29 Minutes
0
0.0%
30 to 34 Minutes
0
0.0%
35 to 39 Minutes
0
0.0%
40 to 44 Minutes
0
0.0%
45 to 59 Minutes
0
0.0%
60 to 89 Minutes
0
0.0%
90 or more Minutes
0
0.0%
Commute Time by Sex in Loma Grande
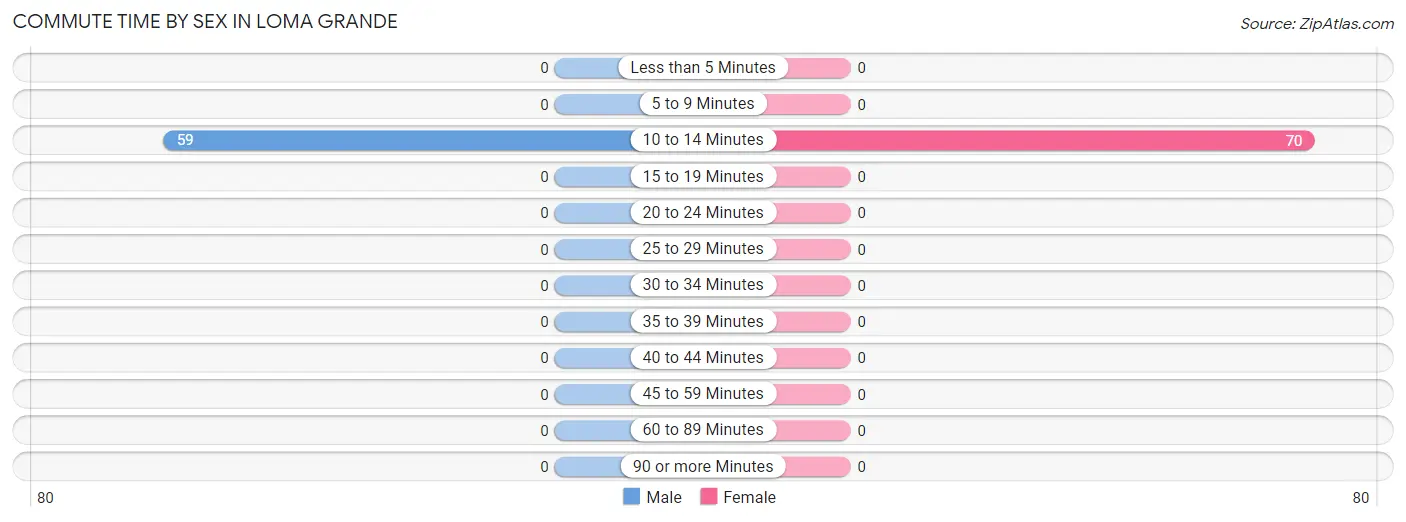
The most common commute times in Loma Grande are 10 to 14 minutes (59 commuters, 100.0%) for males and 10 to 14 minutes (70 commuters, 100.0%) for females.
Commute Time
Male
Female
Less than 5 Minutes
0 (0.0%)
0 (0.0%)
5 to 9 Minutes
0 (0.0%)
0 (0.0%)
10 to 14 Minutes
59 (100.0%)
70 (100.0%)
15 to 19 Minutes
0 (0.0%)
0 (0.0%)
20 to 24 Minutes
0 (0.0%)
0 (0.0%)
25 to 29 Minutes
0 (0.0%)
0 (0.0%)
30 to 34 Minutes
0 (0.0%)
0 (0.0%)
35 to 39 Minutes
0 (0.0%)
0 (0.0%)
40 to 44 Minutes
0 (0.0%)
0 (0.0%)
45 to 59 Minutes
0 (0.0%)
0 (0.0%)
60 to 89 Minutes
0 (0.0%)
0 (0.0%)
90 or more Minutes
0 (0.0%)
0 (0.0%)
Time of Departure to Work by Sex in Loma Grande
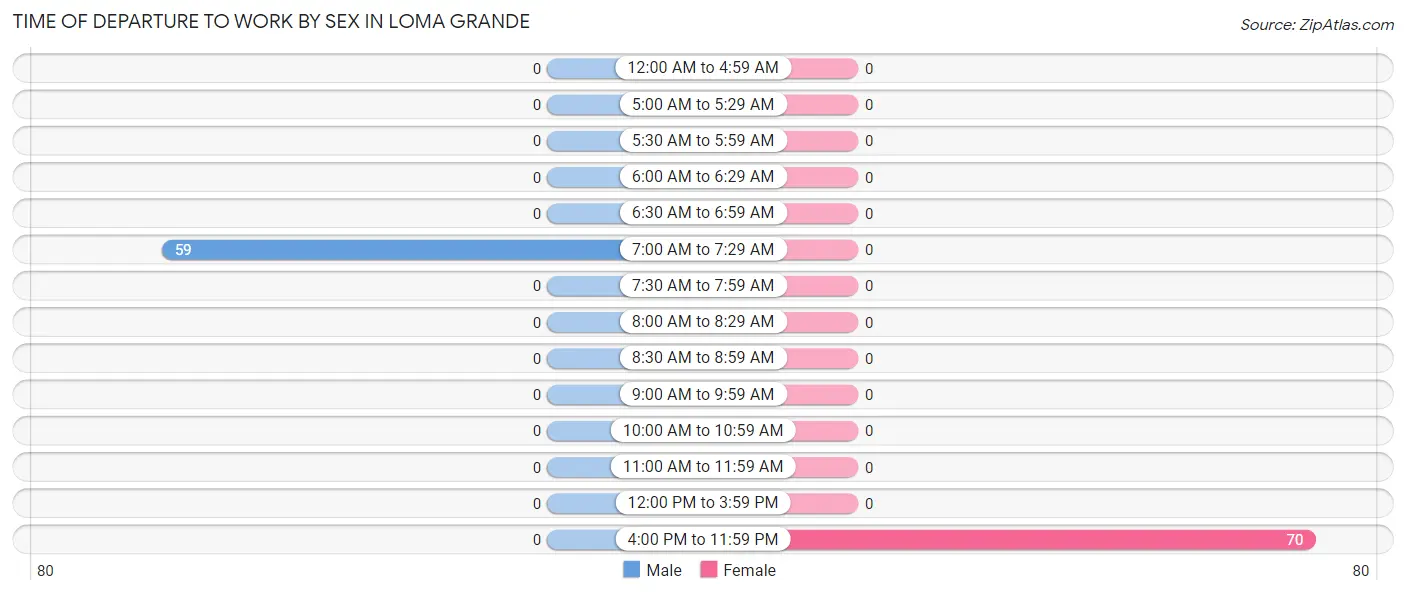
The most frequent times of departure to work in Loma Grande are 7:00 AM to 7:29 AM (59, 100.0%) for males and 4:00 PM to 11:59 PM (70, 100.0%) for females.
Time of Departure
Male
Female
12:00 AM to 4:59 AM
0 (0.0%)
0 (0.0%)
5:00 AM to 5:29 AM
0 (0.0%)
0 (0.0%)
5:30 AM to 5:59 AM
0 (0.0%)
0 (0.0%)
6:00 AM to 6:29 AM
0 (0.0%)
0 (0.0%)
6:30 AM to 6:59 AM
0 (0.0%)
0 (0.0%)
7:00 AM to 7:29 AM
59 (100.0%)
0 (0.0%)
7:30 AM to 7:59 AM
0 (0.0%)
0 (0.0%)
8:00 AM to 8:29 AM
0 (0.0%)
0 (0.0%)
8:30 AM to 8:59 AM
0 (0.0%)
0 (0.0%)
9:00 AM to 9:59 AM
0 (0.0%)
0 (0.0%)
10:00 AM to 10:59 AM
0 (0.0%)
0 (0.0%)
11:00 AM to 11:59 AM
0 (0.0%)
0 (0.0%)
12:00 PM to 3:59 PM
0 (0.0%)
0 (0.0%)
4:00 PM to 11:59 PM
0 (0.0%)
70 (100.0%)
Total
59 (100.0%)
70 (100.0%)
Housing Occupancy in Loma Grande
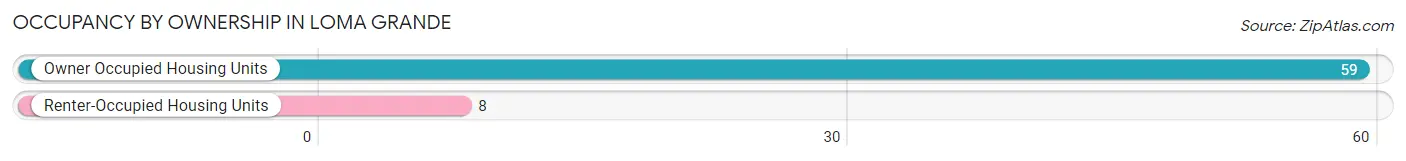
Occupancy by Ownership in Loma Grande
Of the total 67 dwellings in Loma Grande, owner-occupied units account for 59 (88.1%), while renter-occupied units make up 8 (11.9%).
Occupancy
# Housing Units
% Housing Units
Owner Occupied Housing Units
59
88.1%
Renter-Occupied Housing Units
8
11.9%
Total Occupied Housing Units
67
100.0%
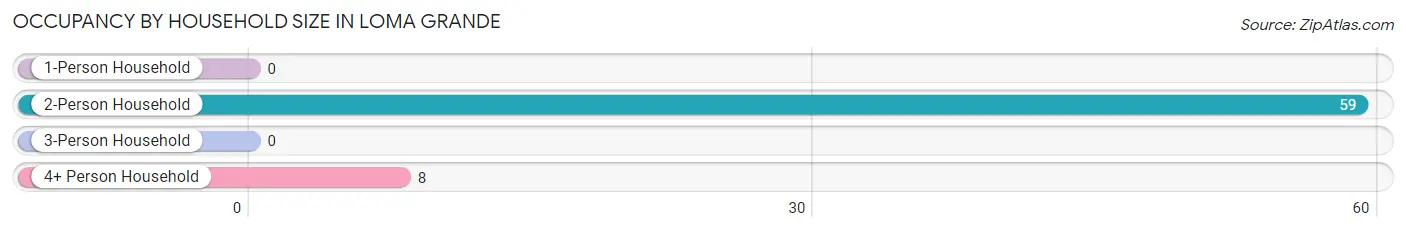
Occupancy by Household Size in Loma Grande
Household Size
# Housing Units
% Housing Units
1-Person Household
0
0.0%
2-Person Household
59
88.1%
3-Person Household
0
0.0%
4+ Person Household
8
11.9%
Total Housing Units
67
100.0%
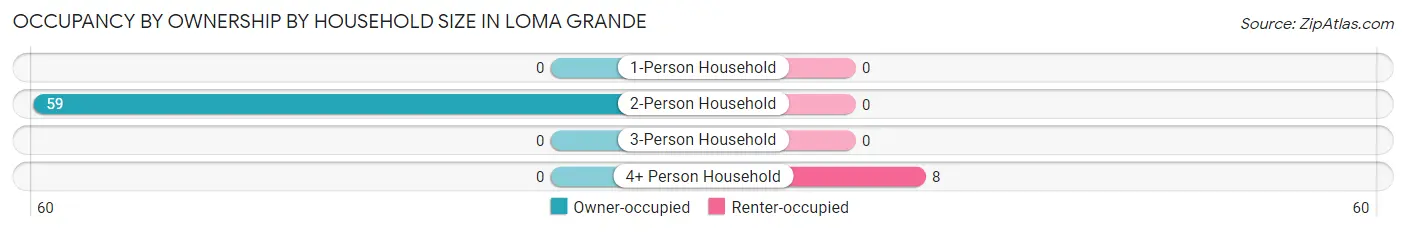
Occupancy by Ownership by Household Size in Loma Grande
Household Size
Owner-occupied
Renter-occupied
1-Person Household
0 (0.0%)
0 (0.0%)
2-Person Household
59 (100.0%)
0 (0.0%)
3-Person Household
0 (0.0%)
0 (0.0%)
4+ Person Household
0 (0.0%)
8 (100.0%)
Total Housing Units
59 (88.1%)
8 (11.9%)
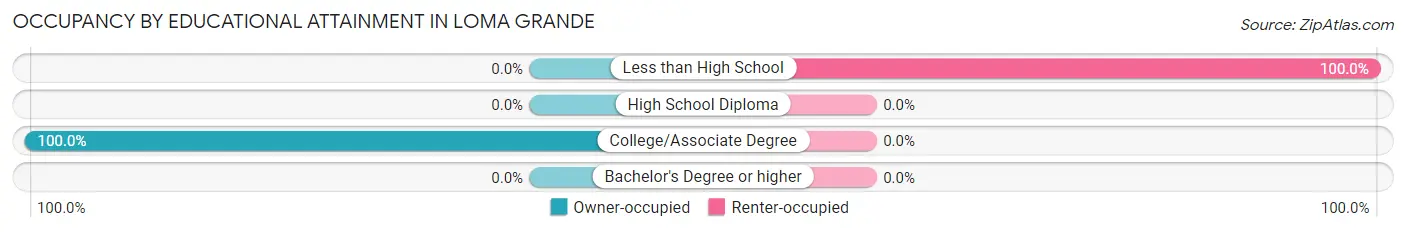
Occupancy by Educational Attainment in Loma Grande
Household Size
Owner-occupied
Renter-occupied
Less than High School
0 (0.0%)
8 (100.0%)
High School Diploma
0 (0.0%)
0 (0.0%)
College/Associate Degree
59 (100.0%)
0 (0.0%)
Bachelor's Degree or higher
0 (0.0%)
0 (0.0%)
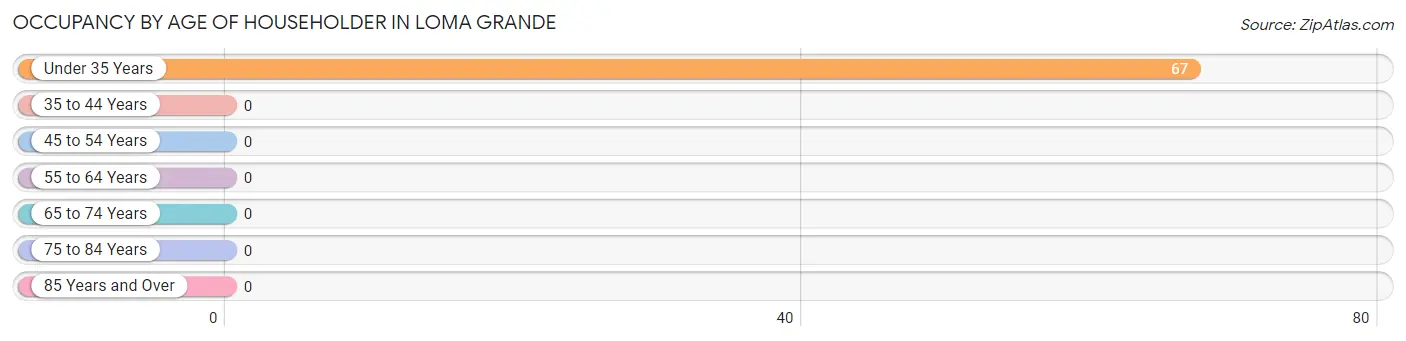
Occupancy by Age of Householder in Loma Grande
Age Bracket
# Households
% Households
Under 35 Years
67
100.0%
35 to 44 Years
0
0.0%
45 to 54 Years
0
0.0%
55 to 64 Years
0
0.0%
65 to 74 Years
0
0.0%
75 to 84 Years
0
0.0%
85 Years and Over
0
0.0%
Total
67
100.0%
Housing Finances in Loma Grande
Median Income by Occupancy in Loma Grande
Occupancy Type
# Households
Median Income
Owner-Occupied
59 (88.1%)
$0
Renter-Occupied
8 (11.9%)
$0
Average
67 (100.0%)
$0
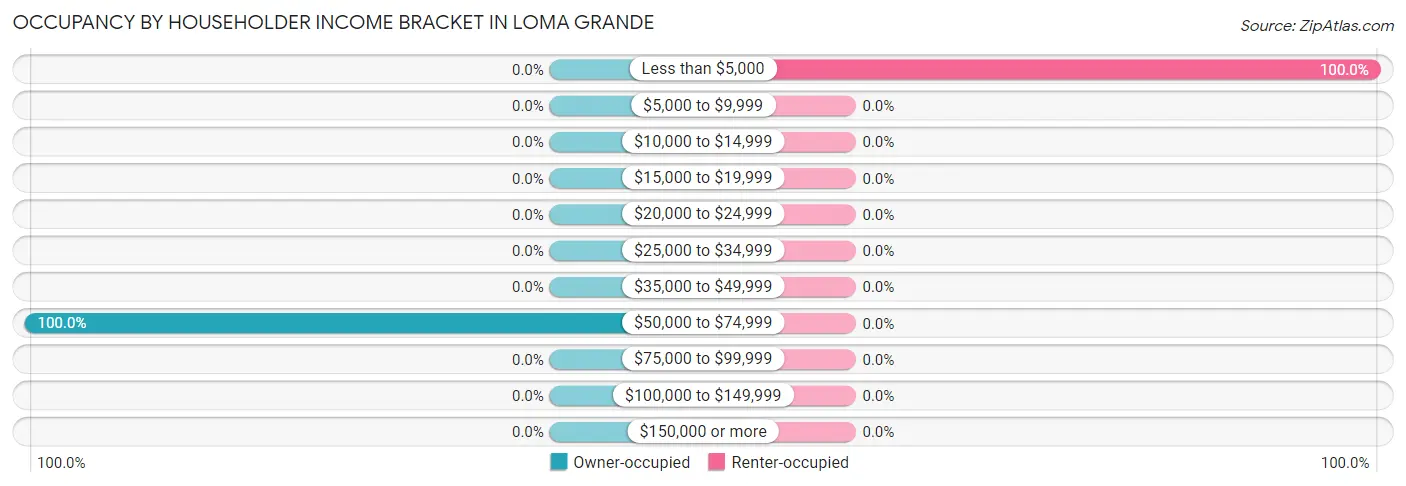
Occupancy by Householder Income Bracket in Loma Grande
Income Bracket
Owner-occupied
Renter-occupied
Less than $5,000
0 (0.0%)
8 (100.0%)
$5,000 to $9,999
0 (0.0%)
0 (0.0%)
$10,000 to $14,999
0 (0.0%)
0 (0.0%)
$15,000 to $19,999
0 (0.0%)
0 (0.0%)
$20,000 to $24,999
0 (0.0%)
0 (0.0%)
$25,000 to $34,999
0 (0.0%)
0 (0.0%)
$35,000 to $49,999
0 (0.0%)
0 (0.0%)
$50,000 to $74,999
59 (100.0%)
0 (0.0%)
$75,000 to $99,999
0 (0.0%)
0 (0.0%)
$100,000 to $149,999
0 (0.0%)
0 (0.0%)
$150,000 or more
0 (0.0%)
0 (0.0%)
Total
59 (100.0%)
8 (100.0%)
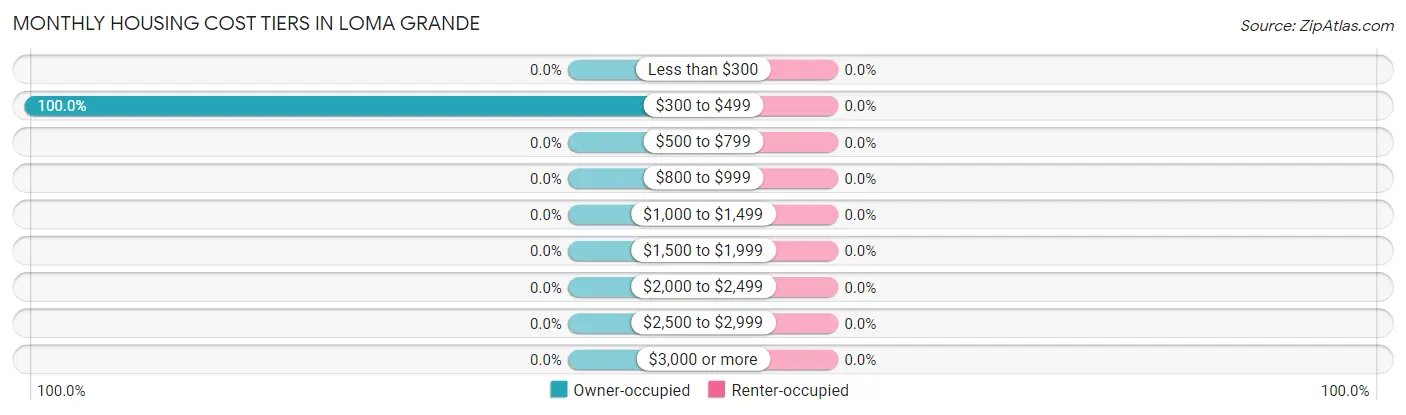
Monthly Housing Cost Tiers in Loma Grande
Monthly Cost
Owner-occupied
Renter-occupied
Less than $300
0 (0.0%)
0 (0.0%)
$300 to $499
59 (100.0%)
0 (0.0%)
$500 to $799
0 (0.0%)
0 (0.0%)
$800 to $999
0 (0.0%)
0 (0.0%)
$1,000 to $1,499
0 (0.0%)
0 (0.0%)
$1,500 to $1,999
0 (0.0%)
0 (0.0%)
$2,000 to $2,499
0 (0.0%)
0 (0.0%)
$2,500 to $2,999
0 (0.0%)
0 (0.0%)
$3,000 or more
0 (0.0%)
0 (0.0%)
Total
59 (100.0%)
8 (100.0%)
Physical Housing Characteristics in Loma Grande
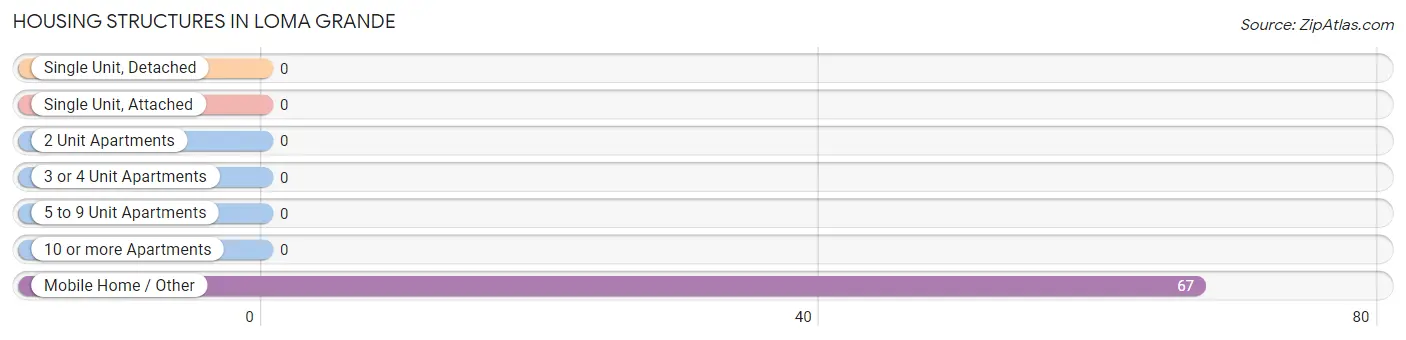
Housing Structures in Loma Grande
Structure Type
# Housing Units
% Housing Units
Single Unit, Detached
0
0.0%
Single Unit, Attached
0
0.0%
2 Unit Apartments
0
0.0%
3 or 4 Unit Apartments
0
0.0%
5 to 9 Unit Apartments
0
0.0%
10 or more Apartments
0
0.0%
Mobile Home / Other
67
100.0%
Total
67
100.0%
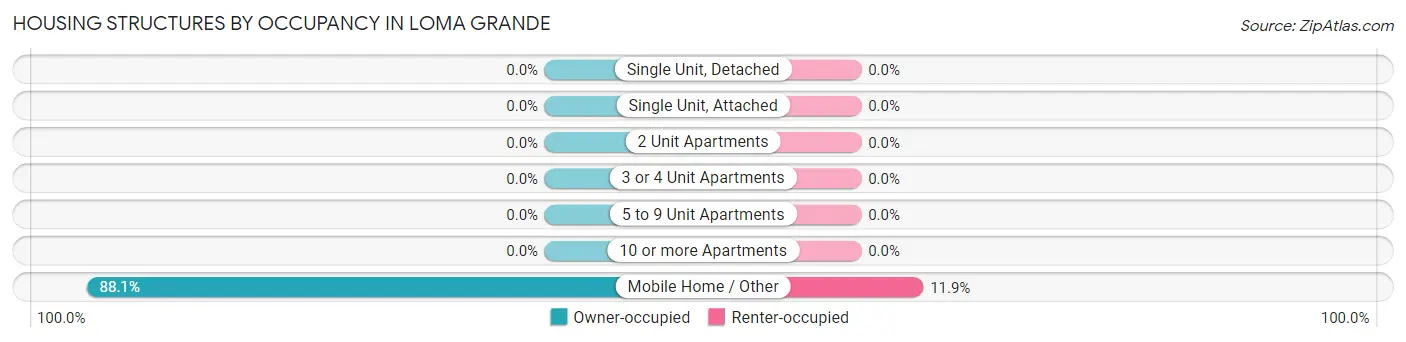
Housing Structures by Occupancy in Loma Grande
Structure Type
Owner-occupied
Renter-occupied
Single Unit, Detached
0 (0.0%)
0 (0.0%)
Single Unit, Attached
0 (0.0%)
0 (0.0%)
2 Unit Apartments
0 (0.0%)
0 (0.0%)
3 or 4 Unit Apartments
0 (0.0%)
0 (0.0%)
5 to 9 Unit Apartments
0 (0.0%)
0 (0.0%)
10 or more Apartments
0 (0.0%)
0 (0.0%)
Mobile Home / Other
59 (88.1%)
8 (11.9%)
Total
59 (88.1%)
8 (11.9%)
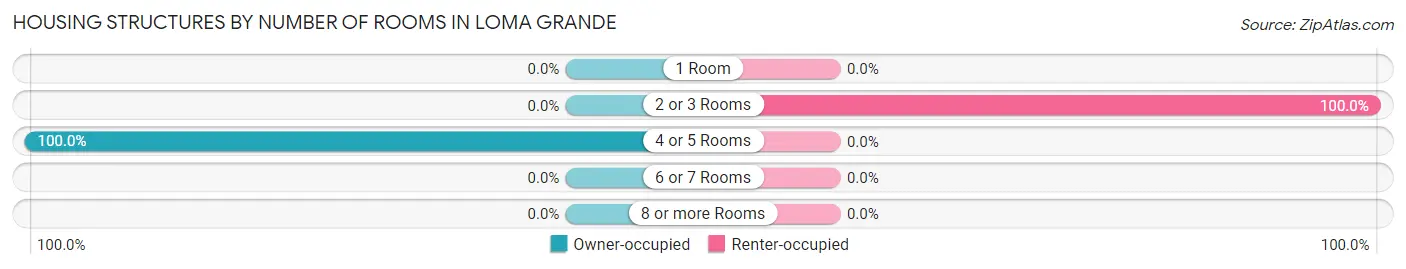
Housing Structures by Number of Rooms in Loma Grande
Number of Rooms
Owner-occupied
Renter-occupied
1 Room
0 (0.0%)
0 (0.0%)
2 or 3 Rooms
0 (0.0%)
8 (100.0%)
4 or 5 Rooms
59 (100.0%)
0 (0.0%)
6 or 7 Rooms
0 (0.0%)
0 (0.0%)
8 or more Rooms
0 (0.0%)
0 (0.0%)
Total
59 (100.0%)
8 (100.0%)
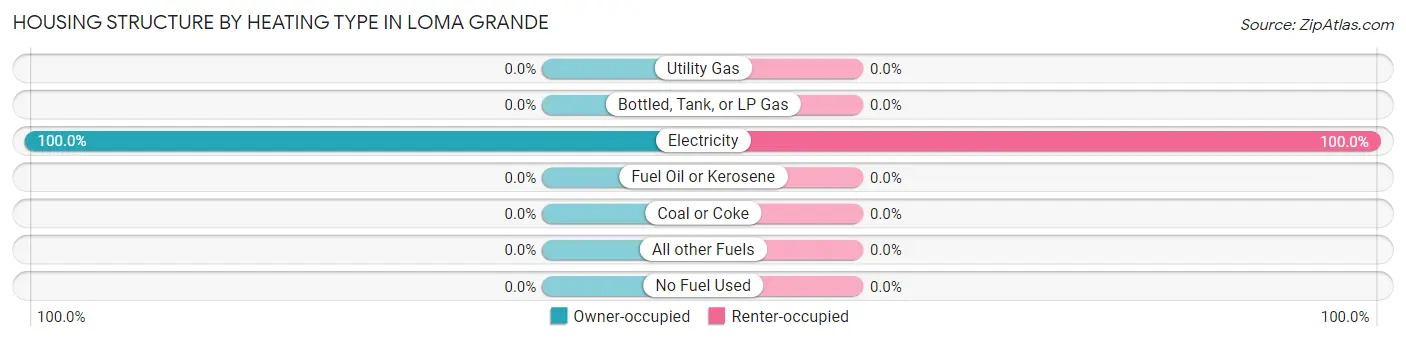
Housing Structure by Heating Type in Loma Grande
Heating Type
Owner-occupied
Renter-occupied
Utility Gas
0 (0.0%)
0 (0.0%)
Bottled, Tank, or LP Gas
0 (0.0%)
0 (0.0%)
Electricity
59 (100.0%)
8 (100.0%)
Fuel Oil or Kerosene
0 (0.0%)
0 (0.0%)
Coal or Coke
0 (0.0%)
0 (0.0%)
All other Fuels
0 (0.0%)
0 (0.0%)
No Fuel Used
0 (0.0%)
0 (0.0%)
Total
59 (100.0%)
8 (100.0%)
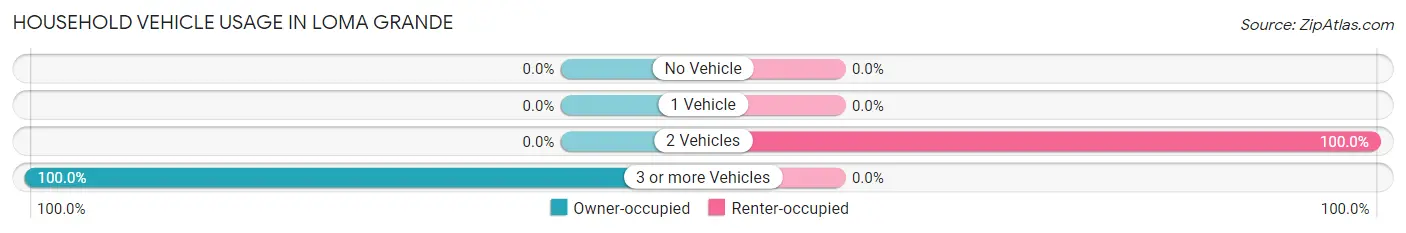
Household Vehicle Usage in Loma Grande
Vehicles per Household
Owner-occupied
Renter-occupied
No Vehicle
0 (0.0%)
0 (0.0%)
1 Vehicle
0 (0.0%)
0 (0.0%)
2 Vehicles
0 (0.0%)
8 (100.0%)
3 or more Vehicles
59 (100.0%)
0 (0.0%)
Total
59 (100.0%)
8 (100.0%)
Real Estate & Mortgages in Loma Grande
Real Estate and Mortgage Overview in Loma Grande
Characteristic
Without Mortgage
With Mortgage
Housing Units
59
0
Median Property Value
-
-
Median Household Income
-
-
Monthly Housing Costs
-
-
Real Estate Taxes
-
-
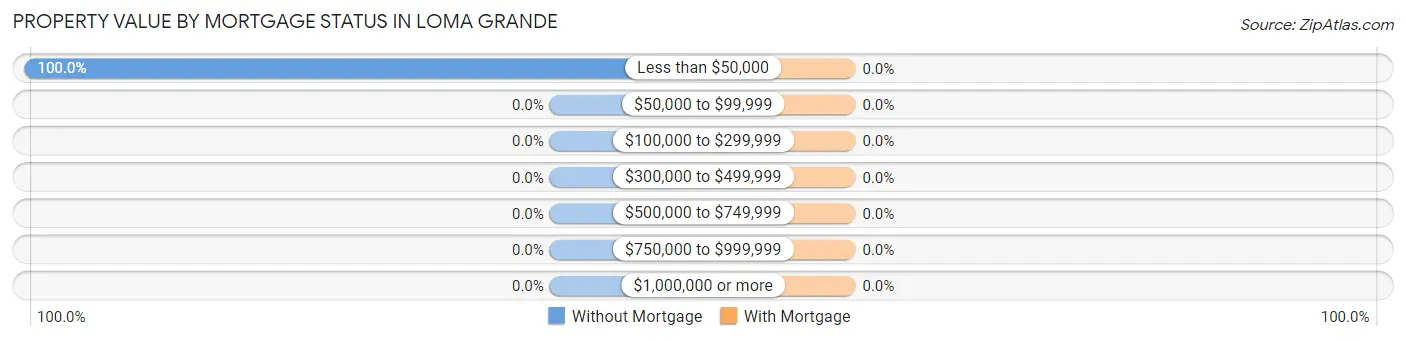
Property Value by Mortgage Status in Loma Grande
Property Value
Without Mortgage
With Mortgage
Less than $50,000
59 (100.0%)
0 (0.0%)
$50,000 to $99,999
0 (0.0%)
0 (0.0%)
$100,000 to $299,999
0 (0.0%)
0 (0.0%)
$300,000 to $499,999
0 (0.0%)
0 (0.0%)
$500,000 to $749,999
0 (0.0%)
0 (0.0%)
$750,000 to $999,999
0 (0.0%)
0 (0.0%)
$1,000,000 or more
0 (0.0%)
0 (0.0%)
Total
59 (100.0%)
0 (0.0%)
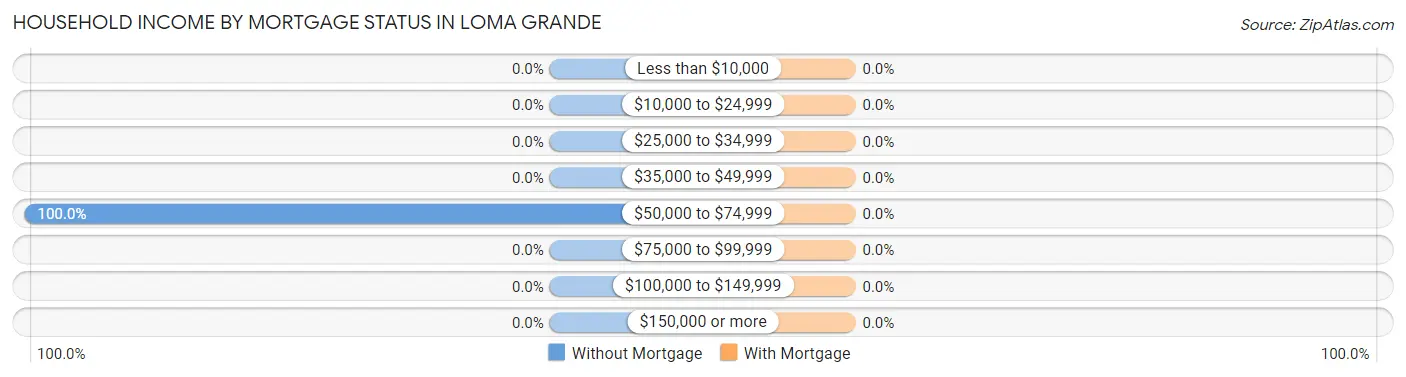
Household Income by Mortgage Status in Loma Grande
Household Income
Without Mortgage
With Mortgage
Less than $10,000
0 (0.0%)
0 (0.0%)
$10,000 to $24,999
0 (0.0%)
0 (0.0%)
$25,000 to $34,999
0 (0.0%)
0 (0.0%)
$35,000 to $49,999
0 (0.0%)
0 (0.0%)
$50,000 to $74,999
59 (100.0%)
0 (0.0%)
$75,000 to $99,999
0 (0.0%)
0 (0.0%)
$100,000 to $149,999
0 (0.0%)
0 (0.0%)
$150,000 or more
0 (0.0%)
0 (0.0%)
Total
59 (100.0%)
0 (0.0%)
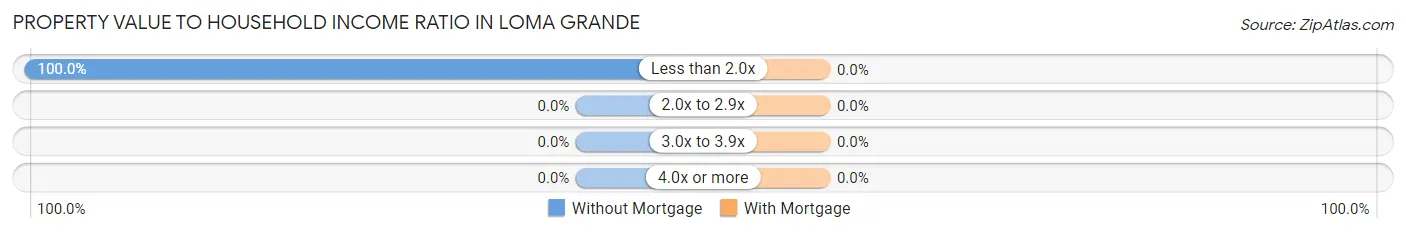
Property Value to Household Income Ratio in Loma Grande
Value-to-Income Ratio
Without Mortgage
With Mortgage
Less than 2.0x
59 (100.0%)
0 (0.0%)
2.0x to 2.9x
0 (0.0%)
0 (0.0%)
3.0x to 3.9x
0 (0.0%)
0 (0.0%)
4.0x or more
0 (0.0%)
0 (0.0%)
Total
59 (100.0%)
0 (0.0%)
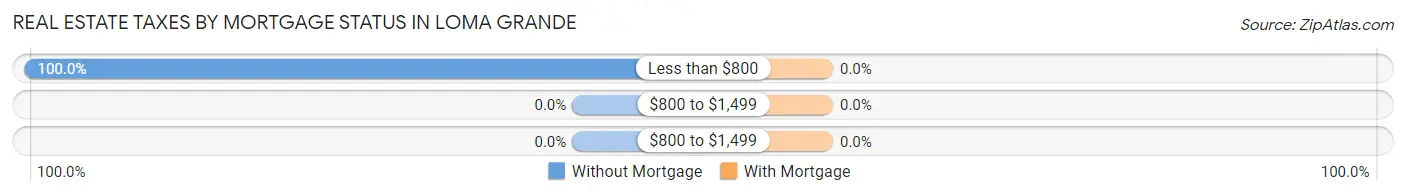
Real Estate Taxes by Mortgage Status in Loma Grande
Property Taxes
Without Mortgage
With Mortgage
Less than $800
59 (100.0%)
0 (0.0%)
$800 to $1,499
0 (0.0%)
0 (0.0%)
$800 to $1,499
0 (0.0%)
0 (0.0%)
Total
59 (100.0%)
0 (0.0%)
Health & Disability in Loma Grande
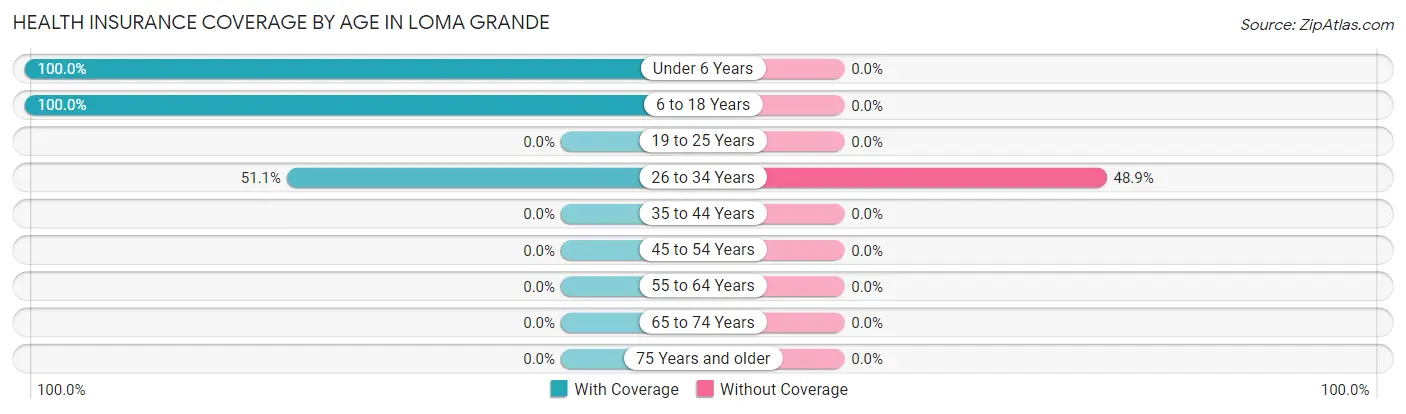
Health Insurance Coverage by Age in Loma Grande
Age Bracket
With Coverage
Without Coverage
Under 6 Years
24 (100.0%)
0 (0.0%)
6 to 18 Years
49 (100.0%)
0 (0.0%)
19 to 25 Years
0 (0.0%)
0 (0.0%)
26 to 34 Years
70 (51.1%)
67 (48.9%)
35 to 44 Years
0 (0.0%)
0 (0.0%)
45 to 54 Years
0 (0.0%)
0 (0.0%)
55 to 64 Years
0 (0.0%)
0 (0.0%)
65 to 74 Years
0 (0.0%)
0 (0.0%)
75 Years and older
0 (0.0%)
0 (0.0%)
Total
143 (68.1%)
67 (31.9%)
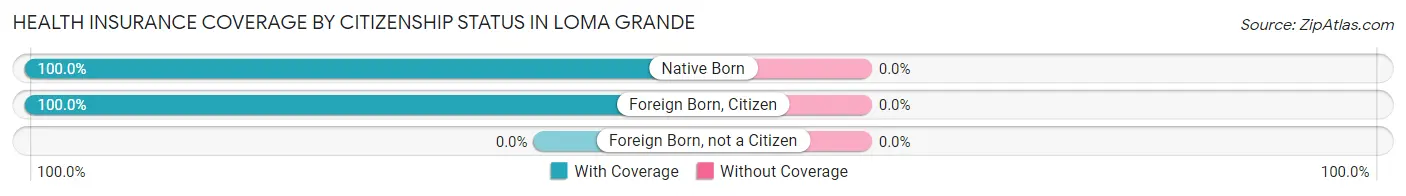
Health Insurance Coverage by Citizenship Status in Loma Grande
Citizenship Status
With Coverage
Without Coverage
Native Born
24 (100.0%)
0 (0.0%)
Foreign Born, Citizen
49 (100.0%)
0 (0.0%)
Foreign Born, not a Citizen
0 (0.0%)
0 (0.0%)
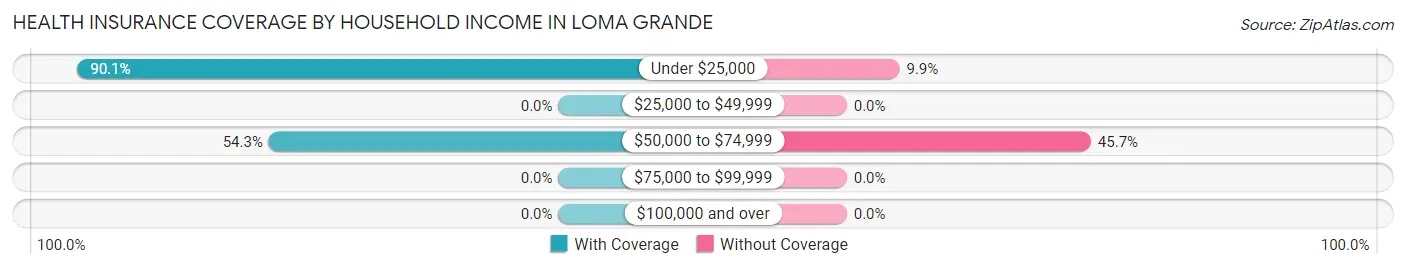
Health Insurance Coverage by Household Income in Loma Grande
Household Income
With Coverage
Without Coverage
Under $25,000
73 (90.1%)
8 (9.9%)
$25,000 to $49,999
0 (0.0%)
0 (0.0%)
$50,000 to $74,999
70 (54.3%)
59 (45.7%)
$75,000 to $99,999
0 (0.0%)
0 (0.0%)
$100,000 and over
0 (0.0%)
0 (0.0%)
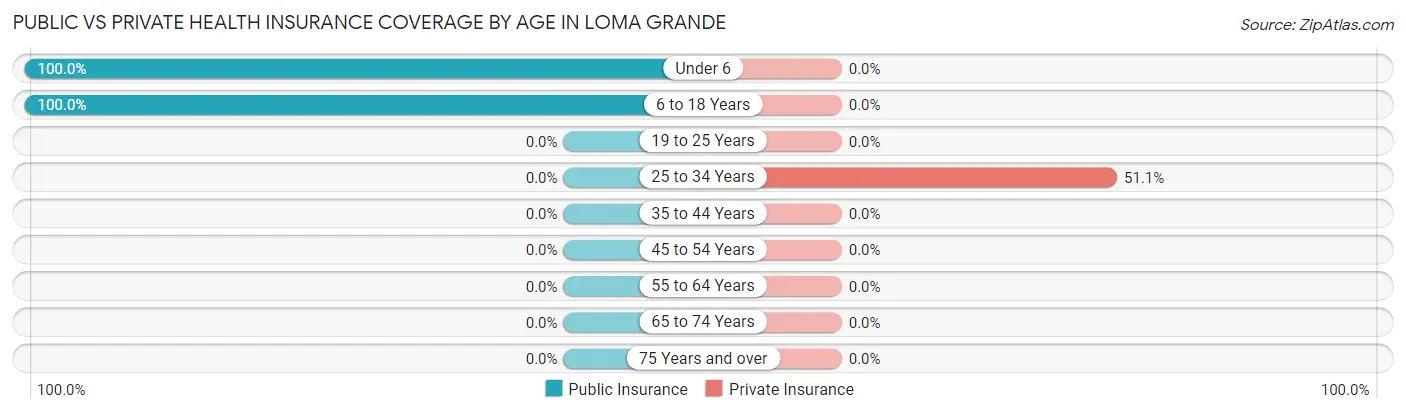
Public vs Private Health Insurance Coverage by Age in Loma Grande
Age Bracket
Public Insurance
Private Insurance
Under 6
24 (100.0%)
0 (0.0%)
6 to 18 Years
49 (100.0%)
0 (0.0%)
19 to 25 Years
0 (0.0%)
0 (0.0%)
25 to 34 Years
0 (0.0%)
70 (51.1%)
35 to 44 Years
0 (0.0%)
0 (0.0%)
45 to 54 Years
0 (0.0%)
0 (0.0%)
55 to 64 Years
0 (0.0%)
0 (0.0%)
65 to 74 Years
0 (0.0%)
0 (0.0%)
75 Years and over
0 (0.0%)
0 (0.0%)
Total
73 (34.8%)
70 (33.3%)
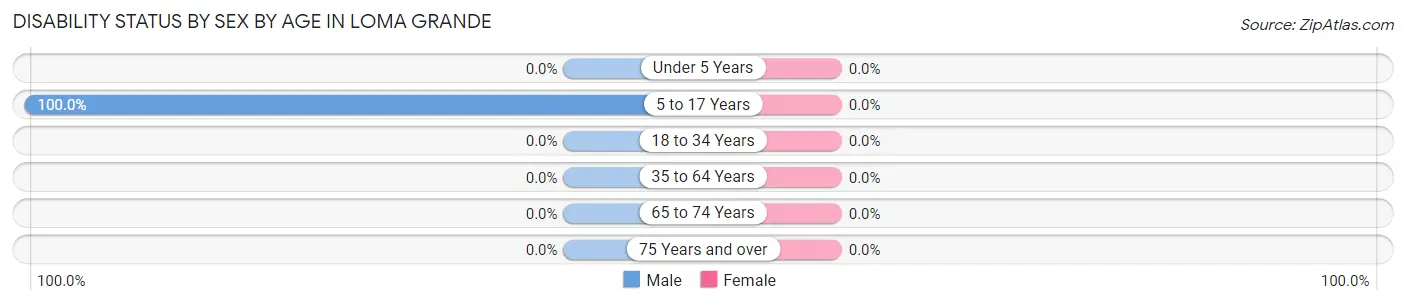
Disability Status by Sex by Age in Loma Grande
Age Bracket
Male
Female
Under 5 Years
0 (0.0%)
0 (0.0%)
5 to 17 Years
28 (100.0%)
0 (0.0%)
18 to 34 Years
0 (0.0%)
0 (0.0%)
35 to 64 Years
0 (0.0%)
0 (0.0%)
65 to 74 Years
0 (0.0%)
0 (0.0%)
75 Years and over
0 (0.0%)
0 (0.0%)
Disability Class by Sex by Age in Loma Grande
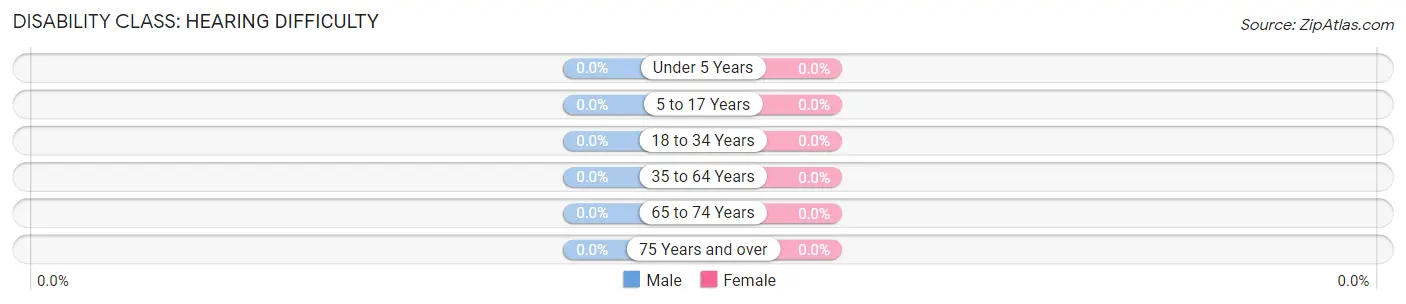
Disability Class: Hearing Difficulty
Age Bracket
Male
Female
Under 5 Years
0 (0.0%)
0 (0.0%)
5 to 17 Years
0 (0.0%)
0 (0.0%)
18 to 34 Years
0 (0.0%)
0 (0.0%)
35 to 64 Years
0 (0.0%)
0 (0.0%)
65 to 74 Years
0 (0.0%)
0 (0.0%)
75 Years and over
0 (0.0%)
0 (0.0%)
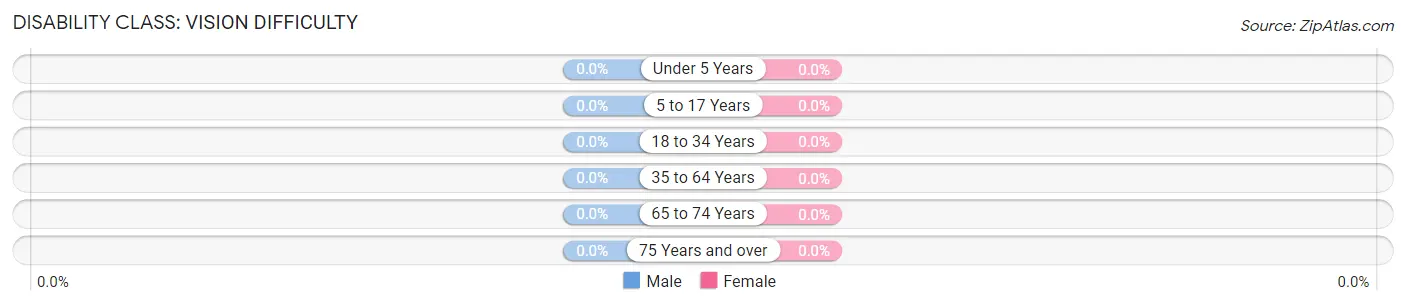
Disability Class: Vision Difficulty
Age Bracket
Male
Female
Under 5 Years
0 (0.0%)
0 (0.0%)
5 to 17 Years
0 (0.0%)
0 (0.0%)
18 to 34 Years
0 (0.0%)
0 (0.0%)
35 to 64 Years
0 (0.0%)
0 (0.0%)
65 to 74 Years
0 (0.0%)
0 (0.0%)
75 Years and over
0 (0.0%)
0 (0.0%)
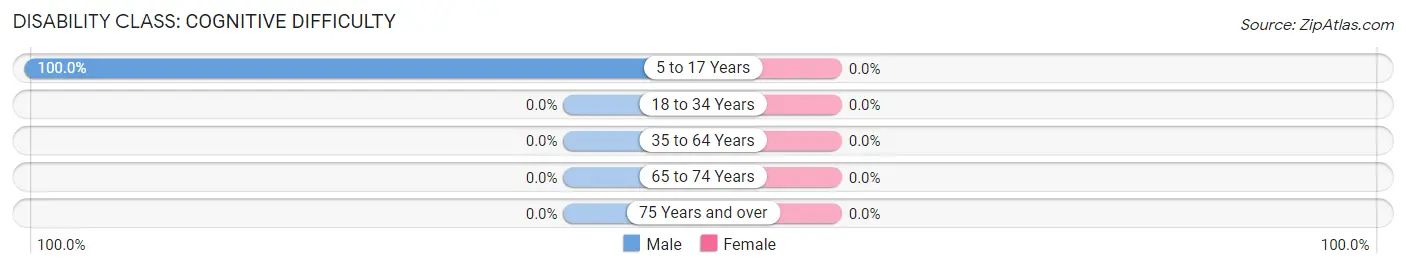
Disability Class: Cognitive Difficulty
Age Bracket
Male
Female
5 to 17 Years
28 (100.0%)
0 (0.0%)
18 to 34 Years
0 (0.0%)
0 (0.0%)
35 to 64 Years
0 (0.0%)
0 (0.0%)
65 to 74 Years
0 (0.0%)
0 (0.0%)
75 Years and over
0 (0.0%)
0 (0.0%)
Disability Class: Ambulatory Difficulty
Age Bracket
Male
Female
5 to 17 Years
0 (0.0%)
0 (0.0%)
18 to 34 Years
0 (0.0%)
0 (0.0%)
35 to 64 Years
0 (0.0%)
0 (0.0%)
65 to 74 Years
0 (0.0%)
0 (0.0%)
75 Years and over
0 (0.0%)
0 (0.0%)
Disability Class: Self-Care Difficulty
Age Bracket
Male
Female
5 to 17 Years
0 (0.0%)
0 (0.0%)
18 to 34 Years
0 (0.0%)
0 (0.0%)
35 to 64 Years
0 (0.0%)
0 (0.0%)
65 to 74 Years
0 (0.0%)
0 (0.0%)
75 Years and over
0 (0.0%)
0 (0.0%)
Technology Access in Loma Grande
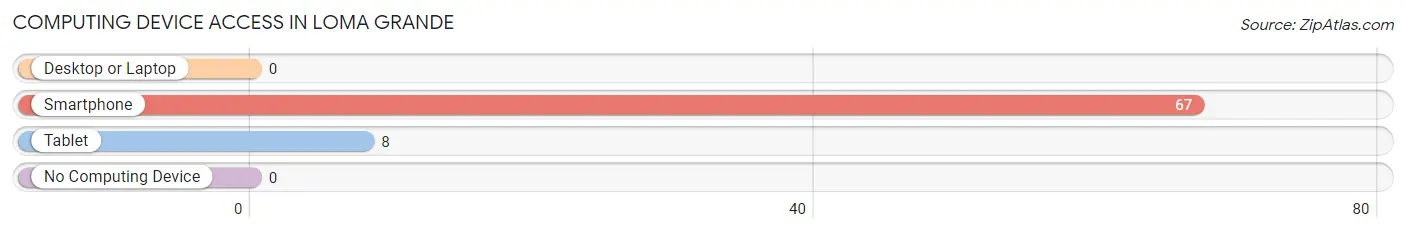
Computing Device Access in Loma Grande
Device Type
# Households
% Households
Desktop or Laptop
0
0.0%
Smartphone
67
100.0%
Tablet
8
11.9%
No Computing Device
0
0.0%
Total
67
100.0%
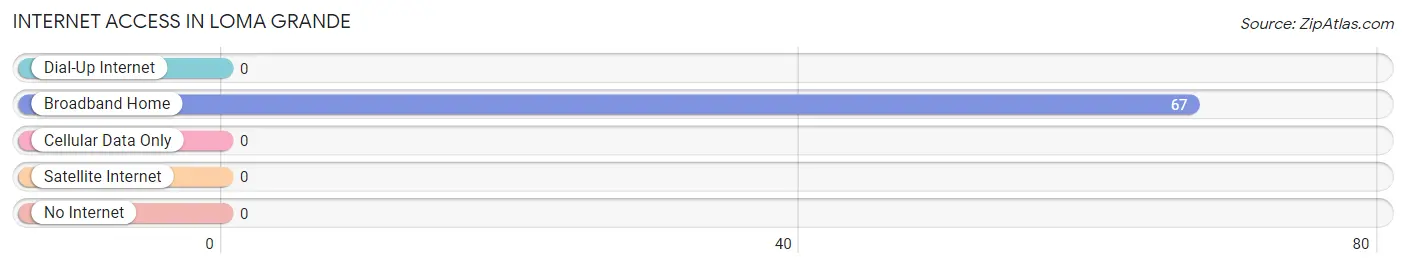
Internet Access in Loma Grande
Internet Type
# Households
% Households
Dial-Up Internet
0
0.0%
Broadband Home
67
100.0%
Cellular Data Only
0
0.0%
Satellite Internet
0
0.0%
No Internet
0
0.0%
Total
67
100.0%
Loma Grande Summary
Loma Grande is a small unincorporated community located in Starr County, Texas. It is situated on the banks of the Rio Grande, just south of the city of Rio Grande City. The community is part of the Rio Grande City-Roma Consolidated Independent School District.
History
Loma Grande was founded in the late 19th century by a group of Mexican settlers. The settlers were attracted to the area due to its fertile soil and abundant water supply from the Rio Grande. The community was originally known as “La Loma”, which translates to “the hill” in English. The name was later changed to Loma Grande to distinguish it from other nearby settlements.
The community grew steadily throughout the early 20th century, and by the 1950s it had become a thriving agricultural center. The town was home to several small businesses, including a general store, a post office, and a school.
Geography
Loma Grande is located in Starr County, Texas, on the banks of the Rio Grande. The community is situated approximately 10 miles south of the city of Rio Grande City. The terrain in the area is mostly flat, with some rolling hills. The climate is semi-arid, with hot summers and mild winters.
Economy
The economy of Loma Grande is largely based on agriculture. The area is known for its production of cotton, corn, sorghum, and other crops. The community is also home to several small businesses, including a general store, a post office, and a school.
Demographics
As of the 2010 census, the population of Loma Grande was 1,845. The racial makeup of the community was 97.3% Hispanic or Latino, 0.9% White, 0.2% African American, 0.1% Native American, 0.1% Asian, and 1.4% from other races. The median household income was $20,917, and the median family income was $25,917.
Conclusion
Loma Grande is a small unincorporated community located in Starr County, Texas. It is situated on the banks of the Rio Grande, just south of the city of Rio Grande City. The community is part of the Rio Grande City-Roma Consolidated Independent School District. The economy of Loma Grande is largely based on agriculture, and the population is predominantly Hispanic or Latino. The community is home to several small businesses, including a general store, a post office, and a school.
Common Questions
What is Inequality or Gini Index in Loma Grande?
Inequality or Gini Index in Loma Grande is 0.12.
What is the Total Population of Loma Grande?
Total Population of Loma Grande is 210.
What is the Total Male Population of Loma Grande?
Total Male Population of Loma Grande is 111.
What is the Total Female Population of Loma Grande?
Total Female Population of Loma Grande is 99.
What is the Ratio of Males per 100 Females in Loma Grande?
There are 112.12 Males per 100 Females in Loma Grande.
What is the Ratio of Females per 100 Males in Loma Grande?
There are 89.19 Females per 100 Males in Loma Grande.
What is the Median Population Age in Loma Grande?
Median Population Age in Loma Grande is 27.5 Years.
What is the Average Family Size in Loma Grande
Average Family Size in Loma Grande is 3.1 People.
What is the Average Household Size in Loma Grande
Average Household Size in Loma Grande is 3.1 People.
How Large is the Labor Force in Loma Grande?
There are 129 People in the Labor Forcein in Loma Grande.
What is the Percentage of People in the Labor Force in Loma Grande?
94.2% of People are in the Labor Force in Loma Grande.
Report Title
Report Link
HTML Copy & Paste Link
Social Media
Copy and paste the folowing code into any webpage where you would like this interactive chart to display