North Acomita Village, NM Map & Demographics
North Acomita Village Map
North Acomita Village Overview
$11,086
PER CAPITA INCOME
0.39
INEQUALITY / GINI INDEX
229
TOTAL POPULATION
73
MALE POPULATION
156
FEMALE POPULATION
46.79
MALES / 100 FEMALES
213.70
FEMALES / 100 MALES
38.3
MEDIAN AGE
6.4
AVG FAMILY SIZE
5.3
AVG HOUSEHOLD SIZE
79
LABOR FORCE [ PEOPLE ]
43.6%
PERCENT IN LABOR FORCE
11.4%
UNEMPLOYMENT RATE
Income in North Acomita Village
Income Overview in North Acomita Village
| Characteristic | Number | Measure |
| Per Capita Income | 229 | $11,086 |
| Median Family Income | 30 | $0 |
| Mean Family Income | 30 | $68,660 |
| Median Household Income | 38 | $0 |
| Mean Household Income | 38 | $56,787 |
| Income Deficit | 30 | $0 |
| Wage / Income Gap (%) | 229 | 0.00% |
| Wage / Income Gap ($) | 229 | 100.00¢ per $1 |
| Gini / Inequality Index | 229 | 0.39 |
Earnings by Sex in North Acomita Village
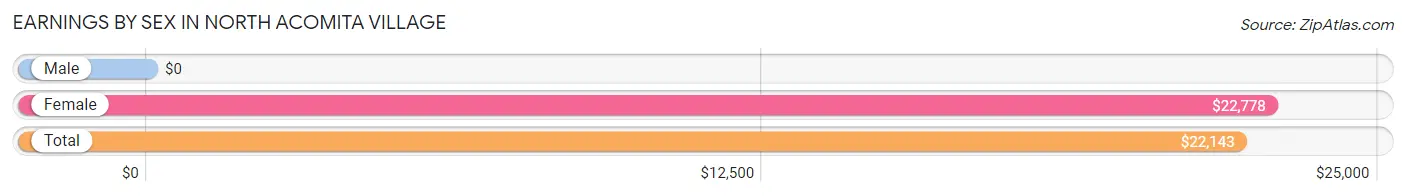
| Sex | Number | Average Earnings |
| Male | 18 (25.7%) | $0 |
| Female | 52 (74.3%) | $22,778 |
| Total | 70 (100.0%) | $22,143 |
Earnings by Sex by Income Bracket in North Acomita Village
The most common earnings brackets in North Acomita Village are $5,000 to $7,499 for men (11 | 61.1%) and $25,000 to $29,999 for women (10 | 19.2%).
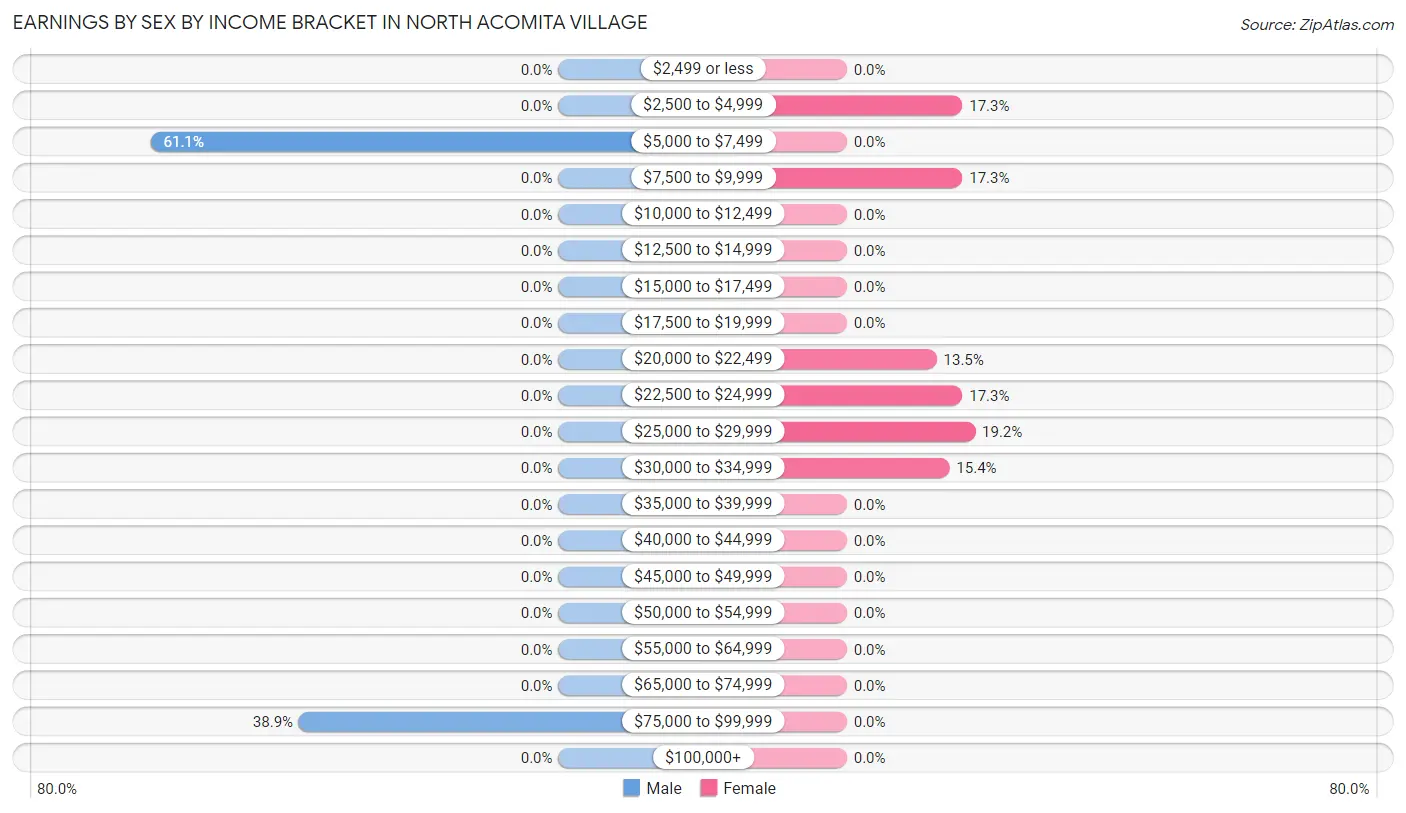
| Income | Male | Female |
| $2,499 or less | 0 (0.0%) | 0 (0.0%) |
| $2,500 to $4,999 | 0 (0.0%) | 9 (17.3%) |
| $5,000 to $7,499 | 11 (61.1%) | 0 (0.0%) |
| $7,500 to $9,999 | 0 (0.0%) | 9 (17.3%) |
| $10,000 to $12,499 | 0 (0.0%) | 0 (0.0%) |
| $12,500 to $14,999 | 0 (0.0%) | 0 (0.0%) |
| $15,000 to $17,499 | 0 (0.0%) | 0 (0.0%) |
| $17,500 to $19,999 | 0 (0.0%) | 0 (0.0%) |
| $20,000 to $22,499 | 0 (0.0%) | 7 (13.5%) |
| $22,500 to $24,999 | 0 (0.0%) | 9 (17.3%) |
| $25,000 to $29,999 | 0 (0.0%) | 10 (19.2%) |
| $30,000 to $34,999 | 0 (0.0%) | 8 (15.4%) |
| $35,000 to $39,999 | 0 (0.0%) | 0 (0.0%) |
| $40,000 to $44,999 | 0 (0.0%) | 0 (0.0%) |
| $45,000 to $49,999 | 0 (0.0%) | 0 (0.0%) |
| $50,000 to $54,999 | 0 (0.0%) | 0 (0.0%) |
| $55,000 to $64,999 | 0 (0.0%) | 0 (0.0%) |
| $65,000 to $74,999 | 0 (0.0%) | 0 (0.0%) |
| $75,000 to $99,999 | 7 (38.9%) | 0 (0.0%) |
| $100,000+ | 0 (0.0%) | 0 (0.0%) |
| Total | 18 (100.0%) | 52 (100.0%) |
Earnings by Sex by Educational Attainment in North Acomita Village
| Educational Attainment | Male Income | Female Income |
| Less than High School | - | - |
| High School Diploma | - | - |
| College or Associate's Degree | - | - |
| Bachelor's Degree | - | - |
| Graduate Degree | - | - |
| Total | - | - |
Family Income in North Acomita Village
Family Income Brackets in North Acomita Village
According to the North Acomita Village family income data, there are 9 families falling into the $25,000 to $34,999 income range, which is the most common income bracket and makes up 30.0% of all families.
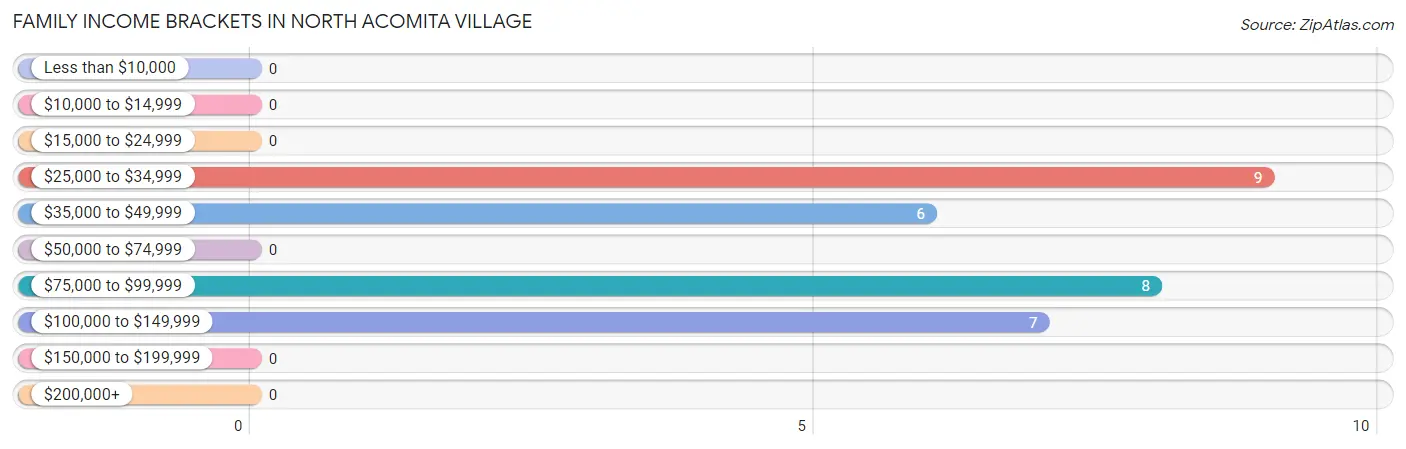
| Income Bracket | # Families | % Families |
| Less than $10,000 | 0 | 0.0% |
| $10,000 to $14,999 | 0 | 0.0% |
| $15,000 to $24,999 | 0 | 0.0% |
| $25,000 to $34,999 | 9 | 30.0% |
| $35,000 to $49,999 | 6 | 20.0% |
| $50,000 to $74,999 | 0 | 0.0% |
| $75,000 to $99,999 | 8 | 26.7% |
| $100,000 to $149,999 | 7 | 23.3% |
| $150,000 to $199,999 | 0 | 0.0% |
| $200,000+ | 0 | 0.0% |
Family Income by Famaliy Size in North Acomita Village
| Income Bracket | # Families | Median Income |
| 2-Person Families | 7 (23.3%) | $0 |
| 3-Person Families | 0 (0.0%) | $0 |
| 4-Person Families | 17 (56.7%) | $0 |
| 5-Person Families | 0 (0.0%) | $0 |
| 6-Person Families | 0 (0.0%) | $0 |
| 7+ Person Families | 6 (20.0%) | $0 |
| Total | 30 (100.0%) | $0 |
Family Income by Number of Earners in North Acomita Village
| Number of Earners | # Families | Median Income |
| No Earners | 0 (0.0%) | $0 |
| 1 Earner | 0 (0.0%) | $0 |
| 2 Earners | 30 (100.0%) | $0 |
| 3+ Earners | 0 (0.0%) | $0 |
| Total | 30 (100.0%) | $0 |
Household Income in North Acomita Village
Household Income Brackets in North Acomita Village
With 9 households falling in the category, the $25,000 to $34,999 income range is the most frequent in North Acomita Village, accounting for 23.7% of all households.
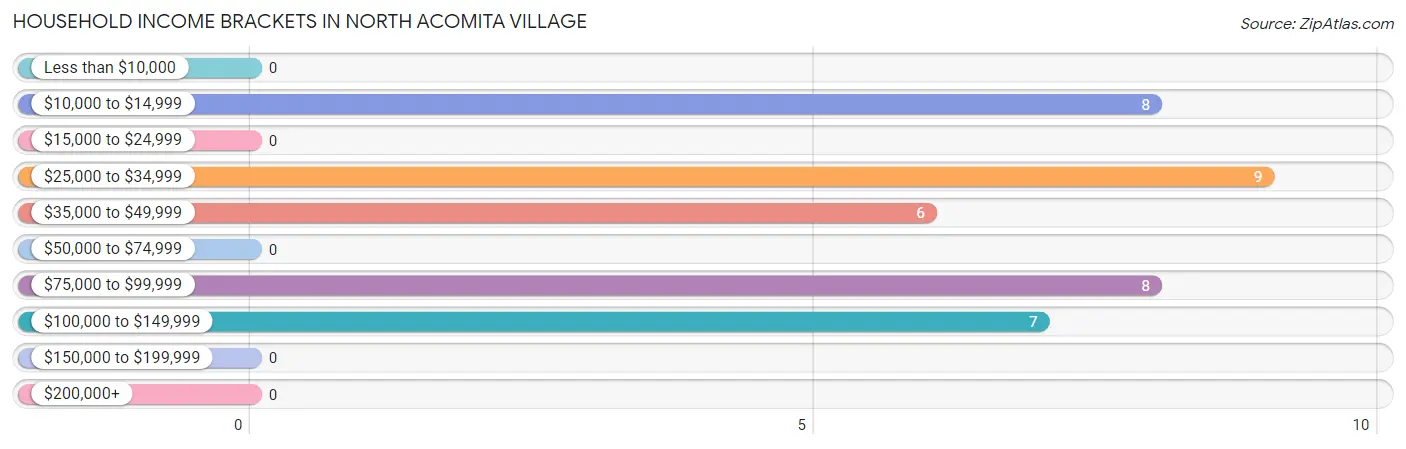
| Income Bracket | # Households | % Households |
| Less than $10,000 | 0 | 0.0% |
| $10,000 to $14,999 | 8 | 21.1% |
| $15,000 to $24,999 | 0 | 0.0% |
| $25,000 to $34,999 | 9 | 23.7% |
| $35,000 to $49,999 | 6 | 15.8% |
| $50,000 to $74,999 | 0 | 0.0% |
| $75,000 to $99,999 | 8 | 21.1% |
| $100,000 to $149,999 | 7 | 18.4% |
| $150,000 to $199,999 | 0 | 0.0% |
| $200,000+ | 0 | 0.0% |
Household Income by Householder Age in North Acomita Village
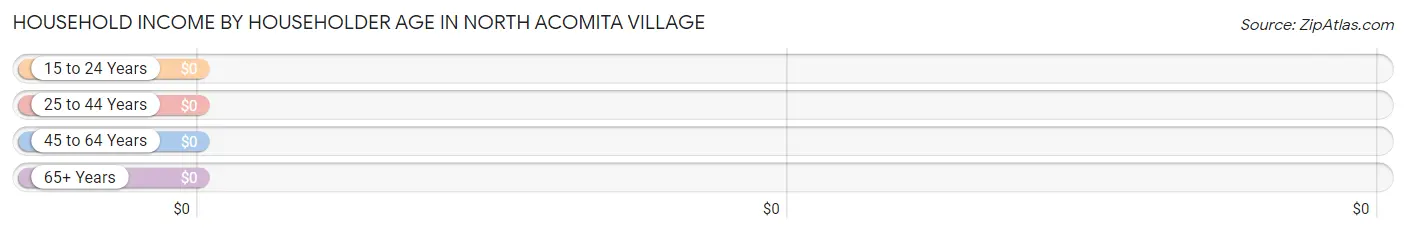
| Income Bracket | # Households | Median Income |
| 15 to 24 Years | 0 (0.0%) | $0 |
| 25 to 44 Years | 15 (39.5%) | $0 |
| 45 to 64 Years | 17 (44.7%) | $0 |
| 65+ Years | 6 (15.8%) | $0 |
| Total | 38 (100.0%) | $0 |
Poverty in North Acomita Village
Income Below Poverty by Sex and Age in North Acomita Village
With 47.5% poverty level for males and 77.5% for females among the residents of North Acomita Village, under 5 year old males and 5 year old females are the most vulnerable to poverty, with 1 males (100.0%) and 8 females (100.0%) in their respective age groups living below the poverty level.
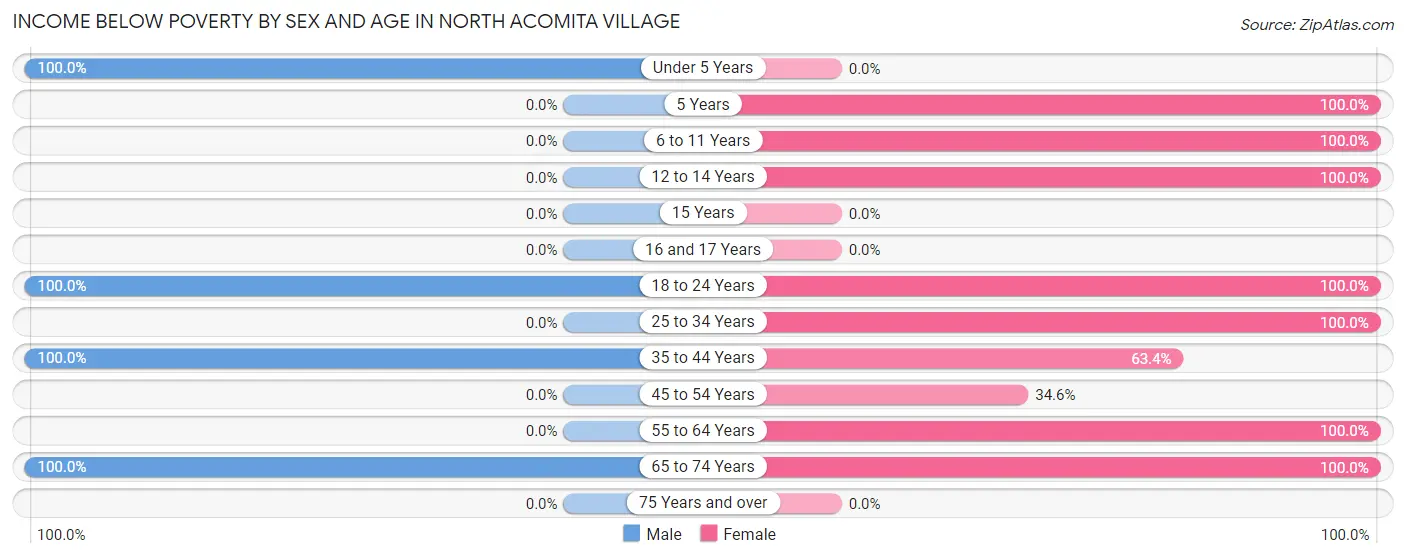
| Age Bracket | Male | Female |
| Under 5 Years | 1 (100.0%) | 0 (0.0%) |
| 5 Years | 0 (0.0%) | 8 (100.0%) |
| 6 to 11 Years | 0 (0.0%) | 18 (100.0%) |
| 12 to 14 Years | 0 (0.0%) | 7 (100.0%) |
| 15 Years | 0 (0.0%) | 0 (0.0%) |
| 16 and 17 Years | 0 (0.0%) | 0 (0.0%) |
| 18 to 24 Years | 12 (100.0%) | 19 (100.0%) |
| 25 to 34 Years | 0 (0.0%) | 9 (100.0%) |
| 35 to 44 Years | 9 (100.0%) | 26 (63.4%) |
| 45 to 54 Years | 0 (0.0%) | 9 (34.6%) |
| 55 to 64 Years | 0 (0.0%) | 8 (100.0%) |
| 65 to 74 Years | 6 (100.0%) | 6 (100.0%) |
| 75 Years and over | 0 (0.0%) | 0 (0.0%) |
| Total | 28 (47.5%) | 110 (77.5%) |
Income Above Poverty by Sex and Age in North Acomita Village
According to the poverty statistics in North Acomita Village, males aged 45 to 54 years and females aged 45 to 54 years are the age groups that are most secure financially, with 100.0% of males and 65.4% of females in these age groups living above the poverty line.
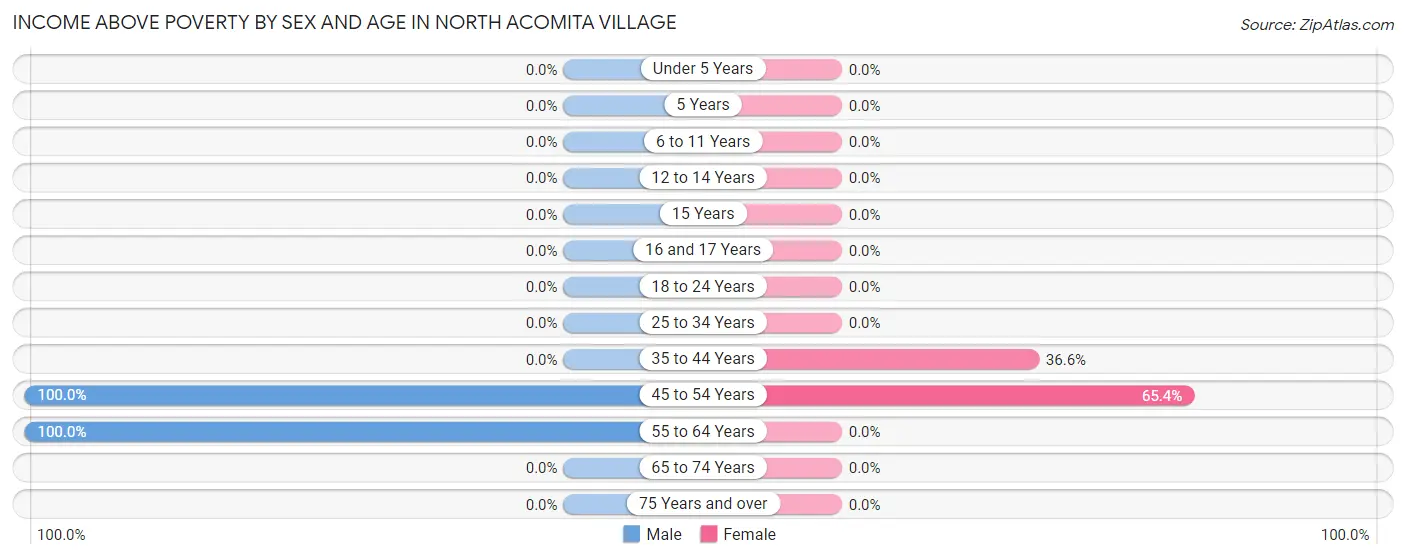
| Age Bracket | Male | Female |
| Under 5 Years | 0 (0.0%) | 0 (0.0%) |
| 5 Years | 0 (0.0%) | 0 (0.0%) |
| 6 to 11 Years | 0 (0.0%) | 0 (0.0%) |
| 12 to 14 Years | 0 (0.0%) | 0 (0.0%) |
| 15 Years | 0 (0.0%) | 0 (0.0%) |
| 16 and 17 Years | 0 (0.0%) | 0 (0.0%) |
| 18 to 24 Years | 0 (0.0%) | 0 (0.0%) |
| 25 to 34 Years | 0 (0.0%) | 0 (0.0%) |
| 35 to 44 Years | 0 (0.0%) | 15 (36.6%) |
| 45 to 54 Years | 18 (100.0%) | 17 (65.4%) |
| 55 to 64 Years | 13 (100.0%) | 0 (0.0%) |
| 65 to 74 Years | 0 (0.0%) | 0 (0.0%) |
| 75 Years and over | 0 (0.0%) | 0 (0.0%) |
| Total | 31 (52.5%) | 32 (22.5%) |
Income Below Poverty Among Married-Couple Families in North Acomita Village
The poverty statistics for married-couple families in North Acomita Village show that 46.2% or 6 of the total 13 families live below the poverty line. Families with 1 or 2 children have the highest poverty rate of 100.0%, comprising of 6 families. On the other hand, families with no children have the lowest poverty rate of 0.0%, which includes 0 families.
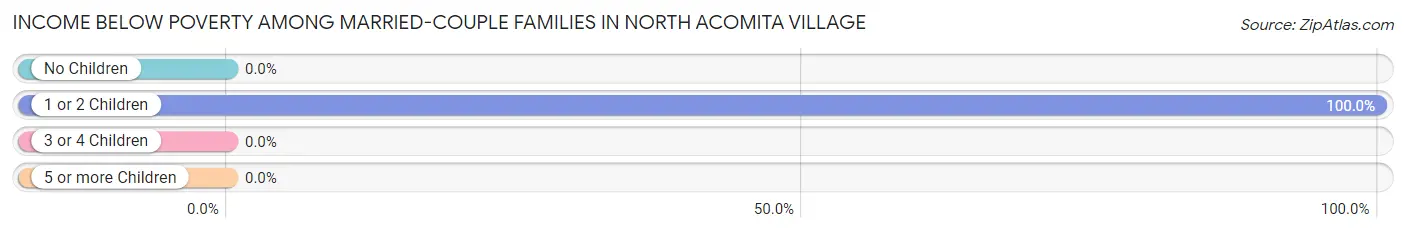
| Children | Above Poverty | Below Poverty |
| No Children | 7 (100.0%) | 0 (0.0%) |
| 1 or 2 Children | 0 (0.0%) | 6 (100.0%) |
| 3 or 4 Children | 0 (0.0%) | 0 (0.0%) |
| 5 or more Children | 0 (0.0%) | 0 (0.0%) |
| Total | 7 (53.8%) | 6 (46.2%) |
Income Below Poverty Among Single-Parent Households in North Acomita Village
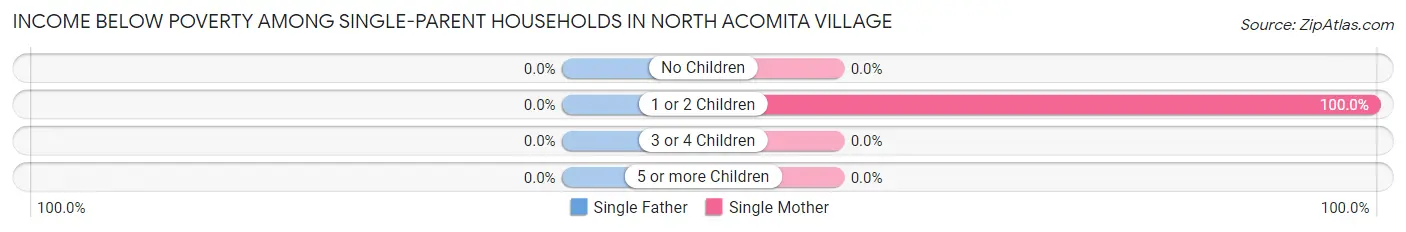
| Children | Single Father | Single Mother |
| No Children | 0 (0.0%) | 0 (0.0%) |
| 1 or 2 Children | 0 (0.0%) | 9 (100.0%) |
| 3 or 4 Children | 0 (0.0%) | 0 (0.0%) |
| 5 or more Children | 0 (0.0%) | 0 (0.0%) |
| Total | 0 (0.0%) | 9 (52.9%) |
Income Below Poverty Among Married-Couple vs Single-Parent Households in North Acomita Village
The poverty data for North Acomita Village shows that 6 of the married-couple family households (46.2%) and 9 of the single-parent households (52.9%) are living below the poverty level. Within the married-couple family households, those with 1 or 2 children have the highest poverty rate, with 6 households (100.0%) falling below the poverty line. Among the single-parent households, those with 1 or 2 children have the highest poverty rate, with 9 household (100.0%) living below poverty.
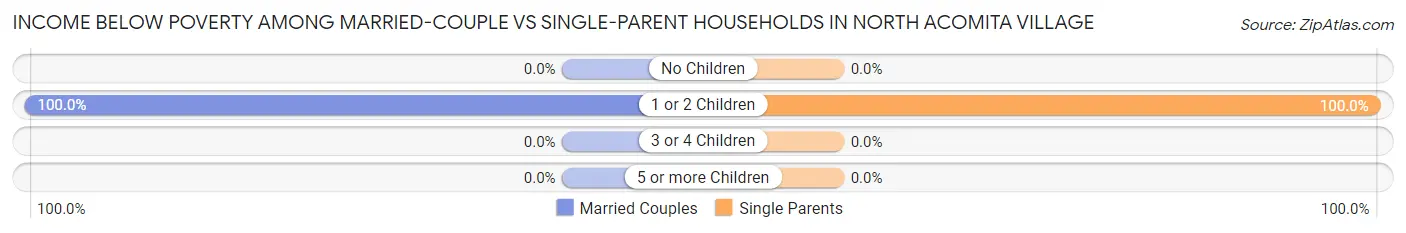
| Children | Married-Couple Families | Single-Parent Households |
| No Children | 0 (0.0%) | 0 (0.0%) |
| 1 or 2 Children | 6 (100.0%) | 9 (100.0%) |
| 3 or 4 Children | 0 (0.0%) | 0 (0.0%) |
| 5 or more Children | 0 (0.0%) | 0 (0.0%) |
| Total | 6 (46.2%) | 9 (52.9%) |
Race in North Acomita Village
The most populous races in North Acomita Village are Native / Alaskan (201 | 87.8%), Hawaiian / Pacific (14 | 6.1%), and Hispanic or Latino (14 | 6.1%).
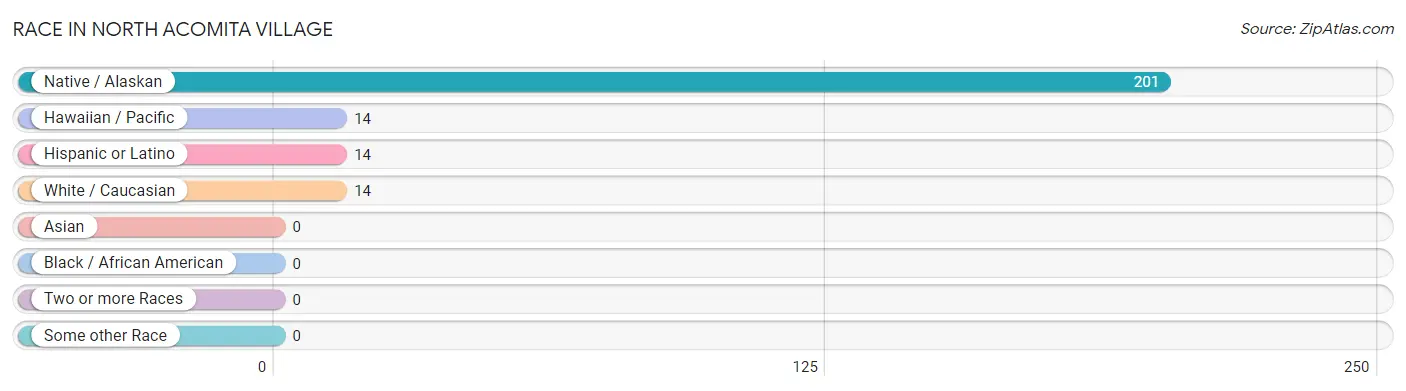
| Race | # Population | % Population |
| Asian | 0 | 0.0% |
| Black / African American | 0 | 0.0% |
| Hawaiian / Pacific | 14 | 6.1% |
| Hispanic or Latino | 14 | 6.1% |
| Native / Alaskan | 201 | 87.8% |
| White / Caucasian | 14 | 6.1% |
| Two or more Races | 0 | 0.0% |
| Some other Race | 0 | 0.0% |
| Total | 229 | 100.0% |
Ancestry in North Acomita Village
The most populous ancestries reported in North Acomita Village are Pueblo (201 | 87.8%), Mexican (14 | 6.1%), and Samoan (14 | 6.1%), together accounting for 100.0% of all North Acomita Village residents.
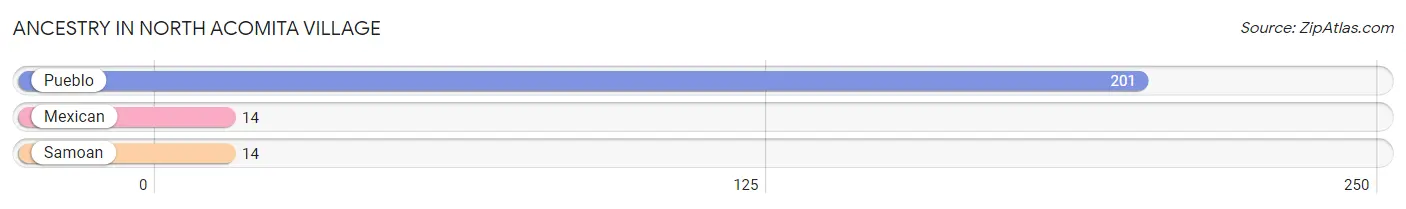
| Ancestry | # Population | % Population |
| Mexican | 14 | 6.1% |
| Pueblo | 201 | 87.8% |
| Samoan | 14 | 6.1% | View All 3 Rows |
Immigrants in North Acomita Village

| Immigration Origin | # Population | % Population | View All 0 Rows |
Sex and Age in North Acomita Village
Sex and Age in North Acomita Village
The most populous age groups in North Acomita Village are 15 to 19 Years (14 | 19.2%) for men and 40 to 44 Years (28 | 17.9%) for women.
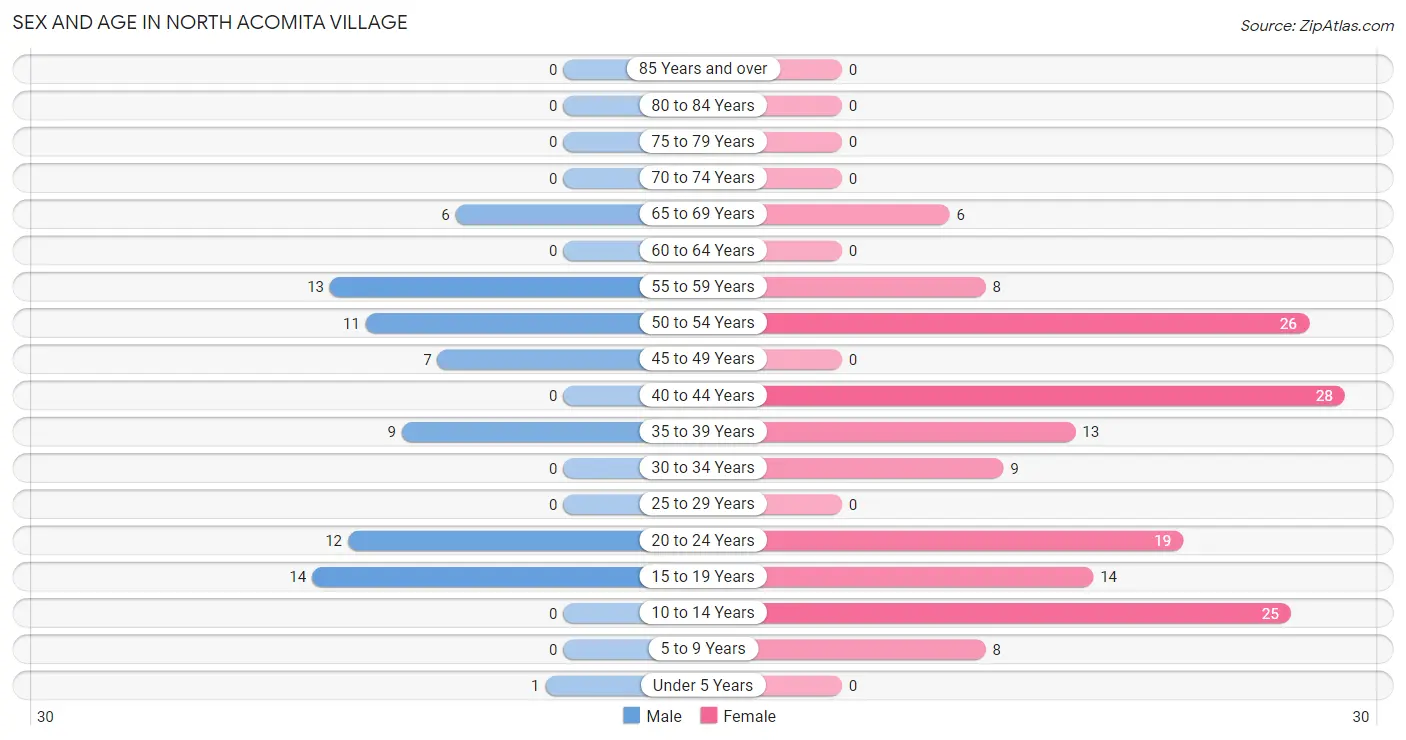
| Age Bracket | Male | Female |
| Under 5 Years | 1 (1.4%) | 0 (0.0%) |
| 5 to 9 Years | 0 (0.0%) | 8 (5.1%) |
| 10 to 14 Years | 0 (0.0%) | 25 (16.0%) |
| 15 to 19 Years | 14 (19.2%) | 14 (9.0%) |
| 20 to 24 Years | 12 (16.4%) | 19 (12.2%) |
| 25 to 29 Years | 0 (0.0%) | 0 (0.0%) |
| 30 to 34 Years | 0 (0.0%) | 9 (5.8%) |
| 35 to 39 Years | 9 (12.3%) | 13 (8.3%) |
| 40 to 44 Years | 0 (0.0%) | 28 (17.9%) |
| 45 to 49 Years | 7 (9.6%) | 0 (0.0%) |
| 50 to 54 Years | 11 (15.1%) | 26 (16.7%) |
| 55 to 59 Years | 13 (17.8%) | 8 (5.1%) |
| 60 to 64 Years | 0 (0.0%) | 0 (0.0%) |
| 65 to 69 Years | 6 (8.2%) | 6 (3.8%) |
| 70 to 74 Years | 0 (0.0%) | 0 (0.0%) |
| 75 to 79 Years | 0 (0.0%) | 0 (0.0%) |
| 80 to 84 Years | 0 (0.0%) | 0 (0.0%) |
| 85 Years and over | 0 (0.0%) | 0 (0.0%) |
| Total | 73 (100.0%) | 156 (100.0%) |
Families and Households in North Acomita Village
Median Family Size in North Acomita Village
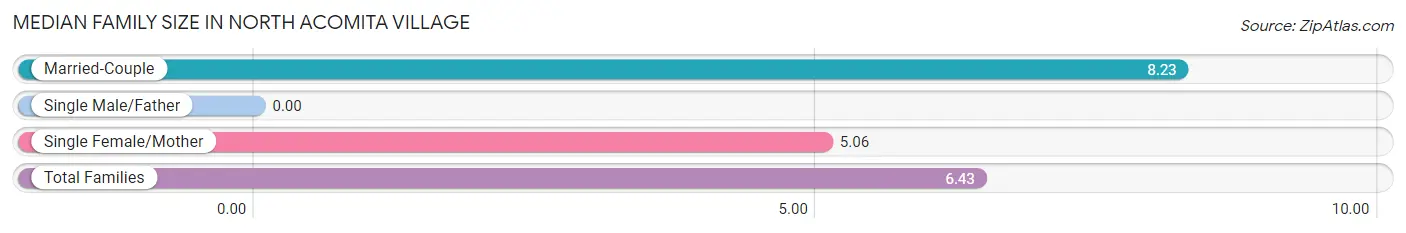
| Family Type | # Families | Family Size |
| Married-Couple | 13 (43.3%) | 8.23 |
| Single Male/Father | 0 (0.0%) | - |
| Single Female/Mother | 17 (56.7%) | 5.06 |
| Total Families | 30 (100.0%) | 6.43 |
Median Household Size in North Acomita Village
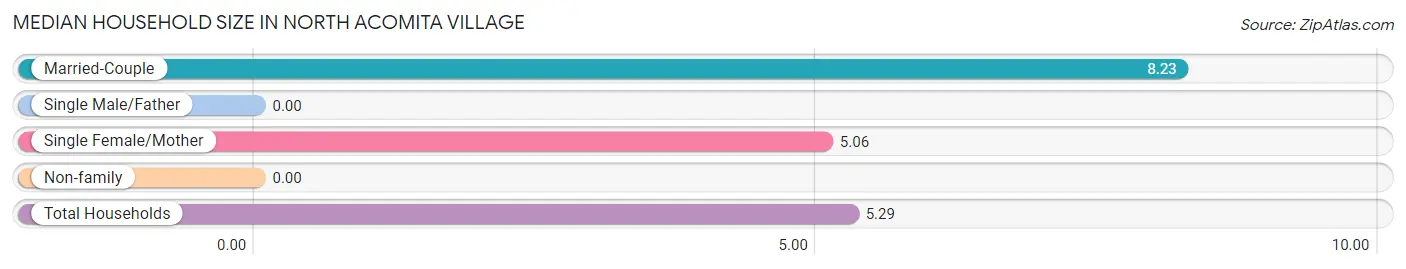
| Household Type | # Households | Household Size |
| Married-Couple | 13 (34.2%) | 8.23 |
| Single Male/Father | 0 (0.0%) | - |
| Single Female/Mother | 17 (44.7%) | 5.06 |
| Non-family | 8 (21.0%) | - |
| Total Households | 38 (100.0%) | 5.29 |
Household Size by Marriage Status in North Acomita Village
Out of a total of 38 households in North Acomita Village, 30 (78.9%) are family households, while 8 (21.0%) are nonfamily households. The most numerous type of family households are 4-person households, comprising 17, and the most common type of nonfamily households are 1-person households, comprising 8.
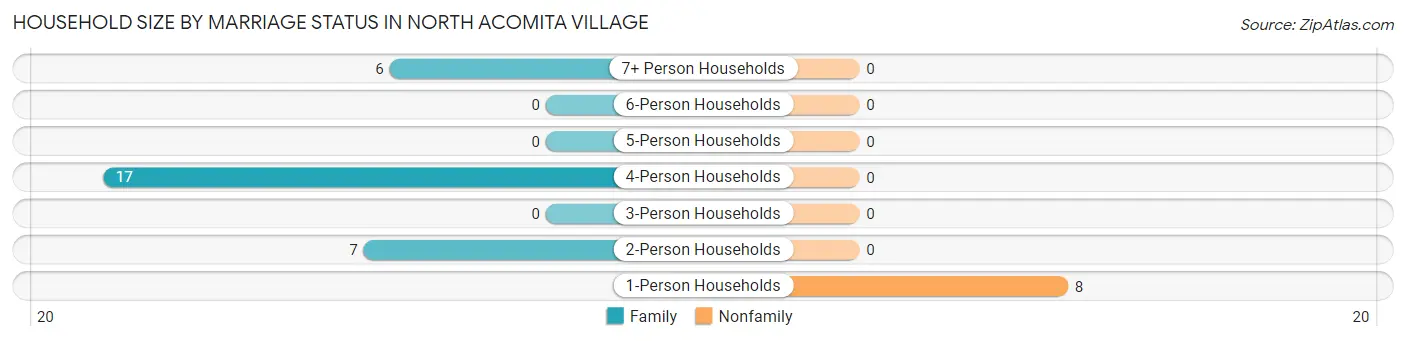
| Household Size | Family Households | Nonfamily Households |
| 1-Person Households | - | 8 (21.0%) |
| 2-Person Households | 7 (18.4%) | 0 (0.0%) |
| 3-Person Households | 0 (0.0%) | 0 (0.0%) |
| 4-Person Households | 17 (44.7%) | 0 (0.0%) |
| 5-Person Households | 0 (0.0%) | 0 (0.0%) |
| 6-Person Households | 0 (0.0%) | 0 (0.0%) |
| 7+ Person Households | 6 (15.8%) | 0 (0.0%) |
| Total | 30 (78.9%) | 8 (21.0%) |
Female Fertility in North Acomita Village
Fertility by Age in North Acomita Village
Average fertility rate in North Acomita Village is 100.0 births per 1,000 women. Women in the age bracket of 20 to 34 years have the highest fertility rate with 357.0 births per 1,000 women. Women in the age bracket of 20 to 34 years acount for 100.0% of all women with births.
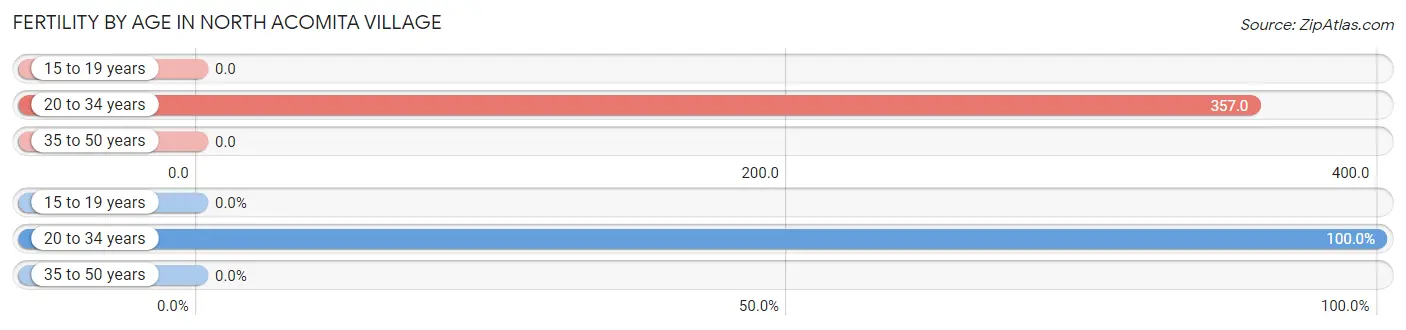
| Age Bracket | Women with Births | Births / 1,000 Women |
| 15 to 19 years | 0 (0.0%) | 0.0 |
| 20 to 34 years | 10 (100.0%) | 357.0 |
| 35 to 50 years | 0 (0.0%) | 0.0 |
| Total | 10 (100.0%) | 100.0 |
Fertility by Age by Marriage Status in North Acomita Village
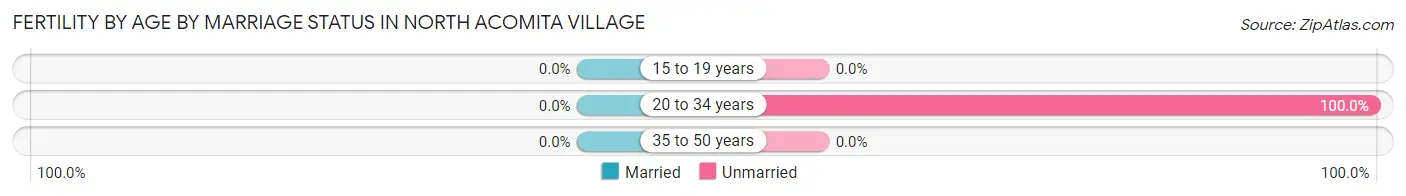
| Age Bracket | Married | Unmarried |
| 15 to 19 years | 0 (0.0%) | 0 (0.0%) |
| 20 to 34 years | 0 (0.0%) | 10 (100.0%) |
| 35 to 50 years | 0 (0.0%) | 0 (0.0%) |
| Total | 0 (0.0%) | 10 (100.0%) |
Fertility by Education in North Acomita Village
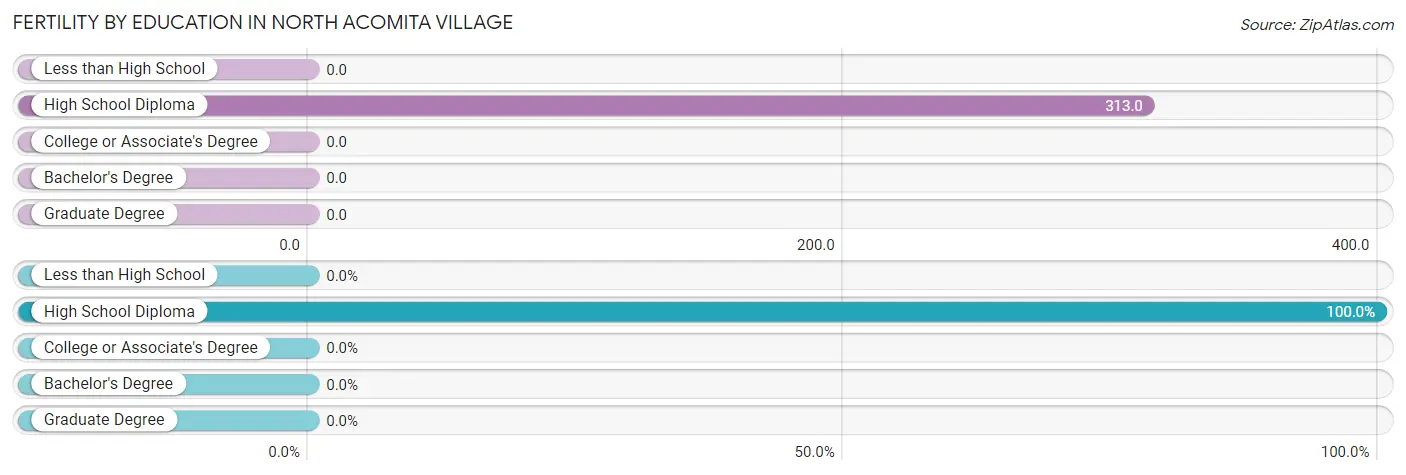
| Educational Attainment | Women with Births | Births / 1,000 Women |
| Less than High School | 0 (0.0%) | 0.0 |
| High School Diploma | 10 (100.0%) | 313.0 |
| College or Associate's Degree | 0 (0.0%) | 0.0 |
| Bachelor's Degree | 0 (0.0%) | 0.0 |
| Graduate Degree | 0 (0.0%) | 0.0 |
| Total | 10 (100.0%) | 100.0 |
Fertility by Education by Marriage Status in North Acomita Village
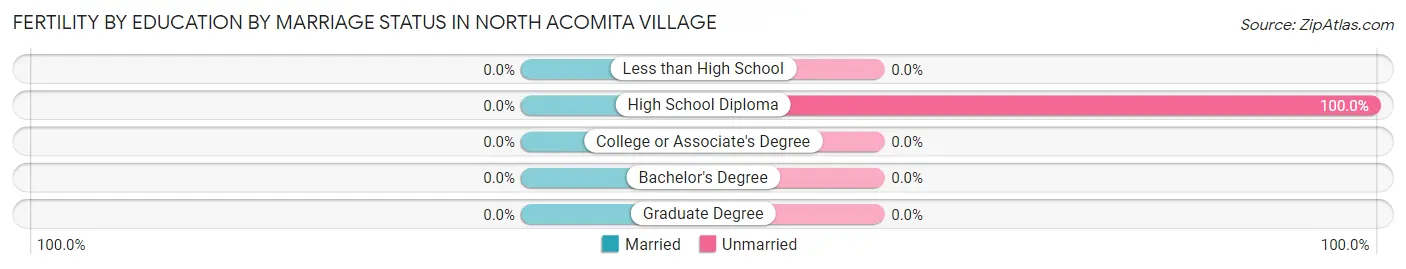
| Educational Attainment | Married | Unmarried |
| Less than High School | 0 (0.0%) | 0 (0.0%) |
| High School Diploma | 0 (0.0%) | 10 (100.0%) |
| College or Associate's Degree | 0 (0.0%) | 0 (0.0%) |
| Bachelor's Degree | 0 (0.0%) | 0 (0.0%) |
| Graduate Degree | 0 (0.0%) | 0 (0.0%) |
| Total | 0 (0.0%) | 10 (100.0%) |
Employment Characteristics in North Acomita Village
Employment by Class of Employer in North Acomita Village
Among the 70 employed individuals in North Acomita Village, private company employees (27 | 38.6%), not-for-profit organizations (10 | 14.3%), and self-employed (not incorporated) (9 | 12.9%) make up the most common classes of employment.
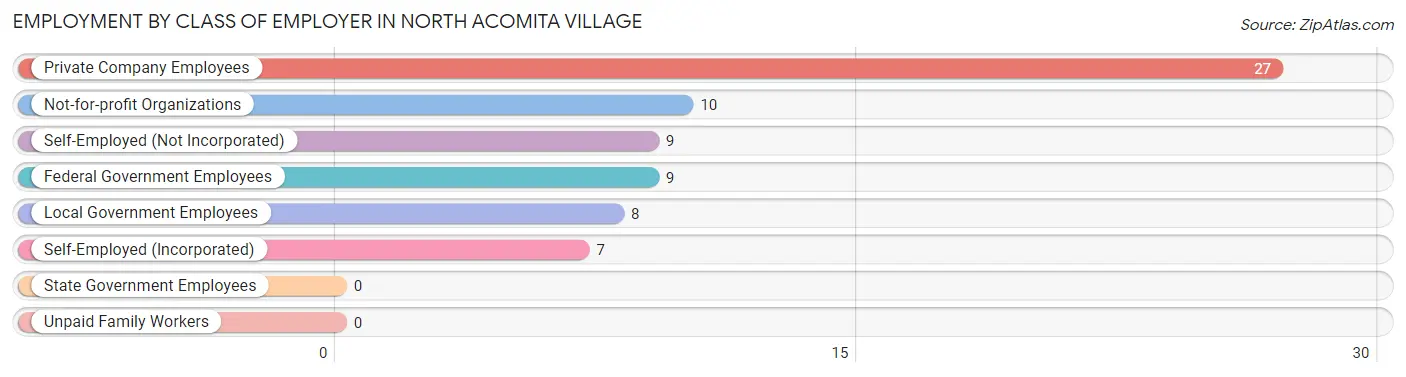
| Employer Class | # Employees | % Employees |
| Private Company Employees | 27 | 38.6% |
| Self-Employed (Incorporated) | 7 | 10.0% |
| Self-Employed (Not Incorporated) | 9 | 12.9% |
| Not-for-profit Organizations | 10 | 14.3% |
| Local Government Employees | 8 | 11.4% |
| State Government Employees | 0 | 0.0% |
| Federal Government Employees | 9 | 12.9% |
| Unpaid Family Workers | 0 | 0.0% |
| Total | 70 | 100.0% |
Employment Status by Age in North Acomita Village
According to the labor force statistics for North Acomita Village, out of the total population over 16 years of age (181), 43.6% or 79 individuals are in the labor force, with 11.4% or 9 of them unemployed. The age group with the highest labor force participation rate is 30 to 34 years, with 100.0% or 9 individuals in the labor force. Within the labor force, the 35 to 44 years age range has the highest percentage of unemployed individuals, with 37.5% or 9 of them being unemployed.
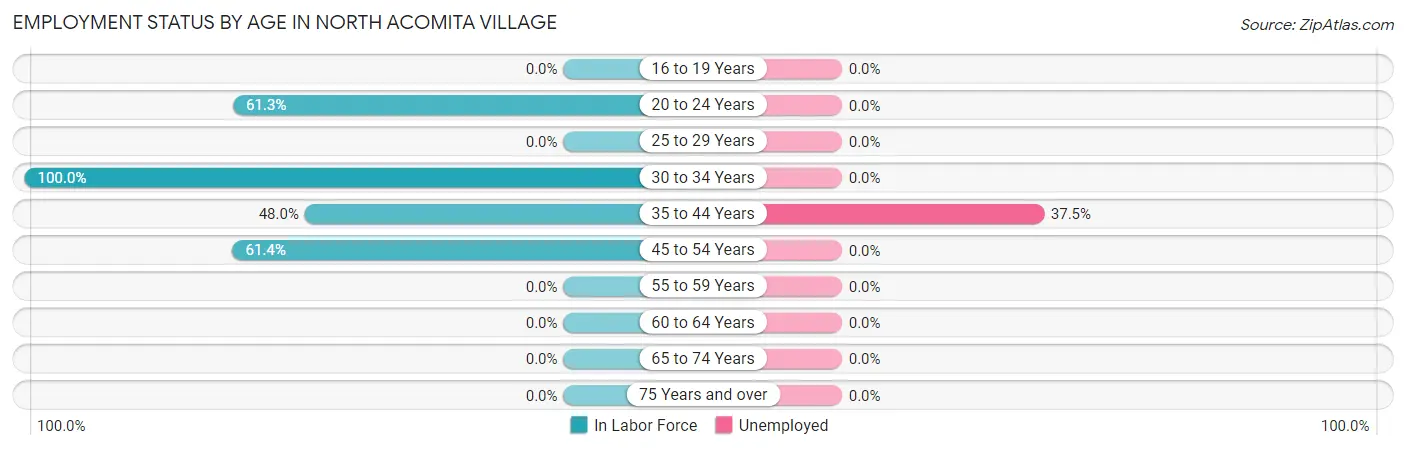
| Age Bracket | In Labor Force | Unemployed |
| 16 to 19 Years | 0 (0.0%) | 0 (0.0%) |
| 20 to 24 Years | 19 (61.3%) | 0 (0.0%) |
| 25 to 29 Years | 0 (0.0%) | 0 (0.0%) |
| 30 to 34 Years | 9 (100.0%) | 0 (0.0%) |
| 35 to 44 Years | 24 (48.0%) | 9 (37.5%) |
| 45 to 54 Years | 27 (61.4%) | 0 (0.0%) |
| 55 to 59 Years | 0 (0.0%) | 0 (0.0%) |
| 60 to 64 Years | 0 (0.0%) | 0 (0.0%) |
| 65 to 74 Years | 0 (0.0%) | 0 (0.0%) |
| 75 Years and over | 0 (0.0%) | 0 (0.0%) |
| Total | 79 (43.6%) | 9 (11.4%) |
Employment Status by Educational Attainment in North Acomita Village
According to labor force statistics for North Acomita Village, 48.4% of individuals (60) out of the total population between 25 and 64 years of age (124) are in the labor force, with 15.0% or 9 of them being unemployed. The group with the highest labor force participation rate are those with the educational attainment of college / associate degree, with 76.4% or 42 individuals in the labor force. Within the labor force, individuals with high school diploma education have the highest percentage of unemployment, with 50.0% or 9 of them being unemployed.
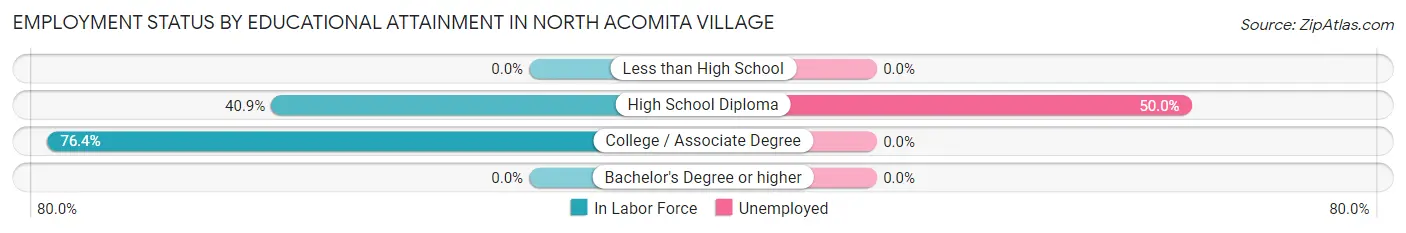
| Educational Attainment | In Labor Force | Unemployed |
| Less than High School | 0 (0.0%) | 0 (0.0%) |
| High School Diploma | 18 (40.9%) | 22 (50.0%) |
| College / Associate Degree | 42 (76.4%) | 0 (0.0%) |
| Bachelor's Degree or higher | 0 (0.0%) | 0 (0.0%) |
| Total | 60 (48.4%) | 19 (15.0%) |
Employment Occupations by Sex in North Acomita Village
Management, Business, Science and Arts Occupations
The most common Management, Business, Science and Arts occupations in North Acomita Village are Community & Social Service (7 | 10.0%), and Arts, Media & Entertainment (7 | 10.0%).
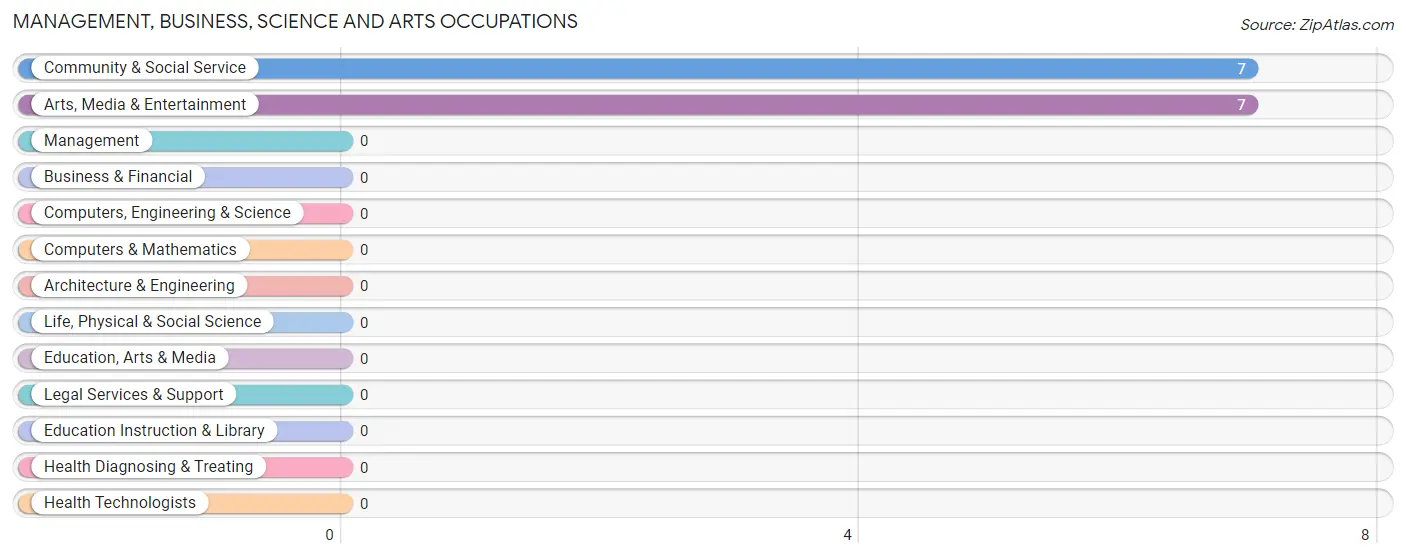
Management, Business, Science and Arts Occupations by Sex
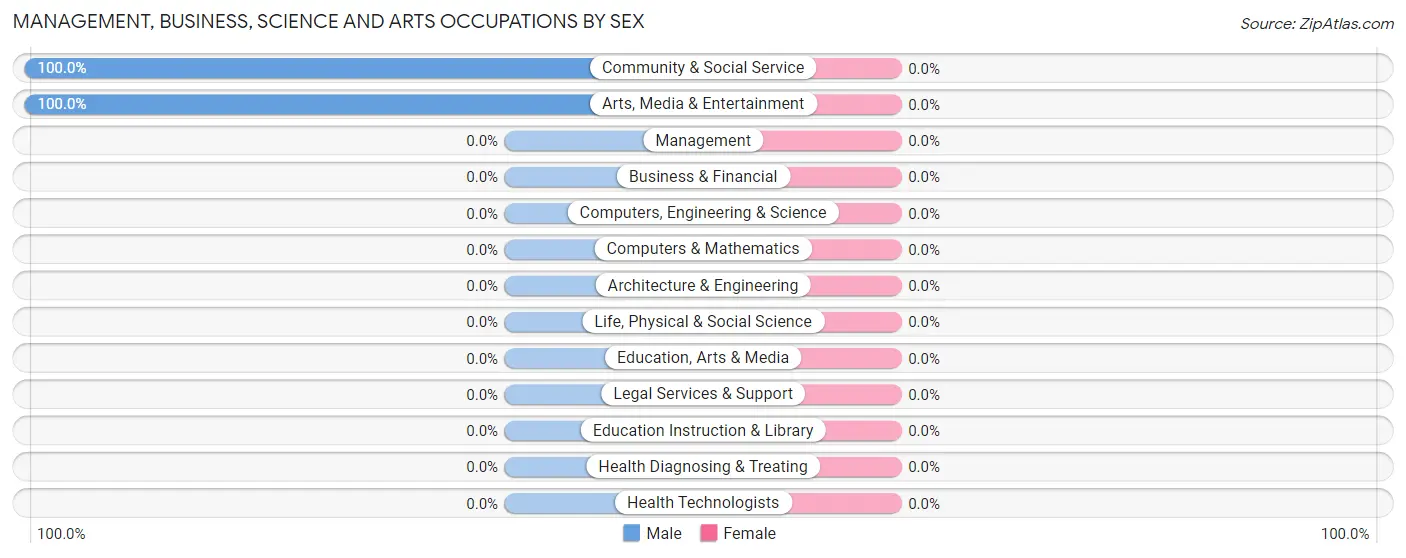
| Occupation | Male | Female |
| Management | 0 (0.0%) | 0 (0.0%) |
| Business & Financial | 0 (0.0%) | 0 (0.0%) |
| Computers, Engineering & Science | 0 (0.0%) | 0 (0.0%) |
| Computers & Mathematics | 0 (0.0%) | 0 (0.0%) |
| Architecture & Engineering | 0 (0.0%) | 0 (0.0%) |
| Life, Physical & Social Science | 0 (0.0%) | 0 (0.0%) |
| Community & Social Service | 7 (100.0%) | 0 (0.0%) |
| Education, Arts & Media | 0 (0.0%) | 0 (0.0%) |
| Legal Services & Support | 0 (0.0%) | 0 (0.0%) |
| Education Instruction & Library | 0 (0.0%) | 0 (0.0%) |
| Arts, Media & Entertainment | 7 (100.0%) | 0 (0.0%) |
| Health Diagnosing & Treating | 0 (0.0%) | 0 (0.0%) |
| Health Technologists | 0 (0.0%) | 0 (0.0%) |
| Total (Category) | 7 (100.0%) | 0 (0.0%) |
| Total (Overall) | 18 (25.7%) | 52 (74.3%) |
Services Occupations
The most common Services occupations in North Acomita Village are Cleaning & Maintenance (24 | 34.3%), Security & Protection (9 | 12.9%), and Firefighting & Prevention (9 | 12.9%).
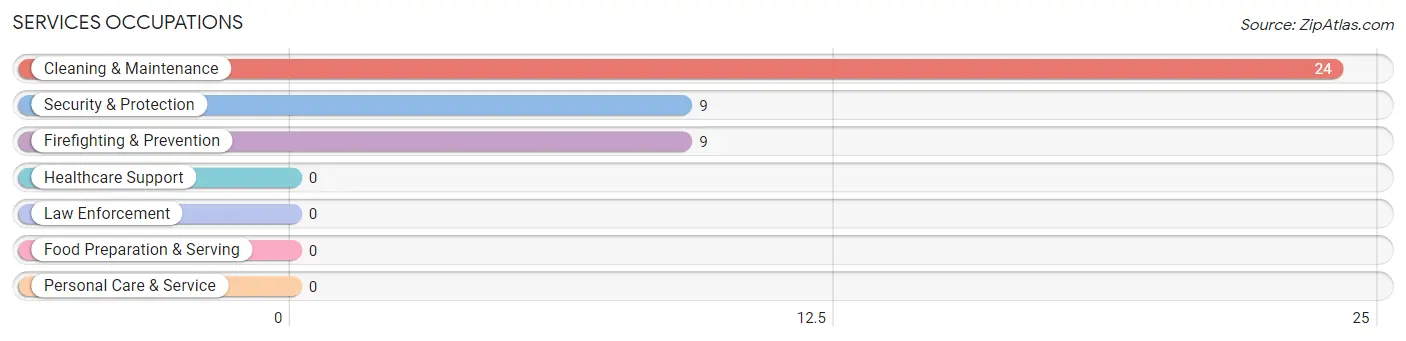
Services Occupations by Sex
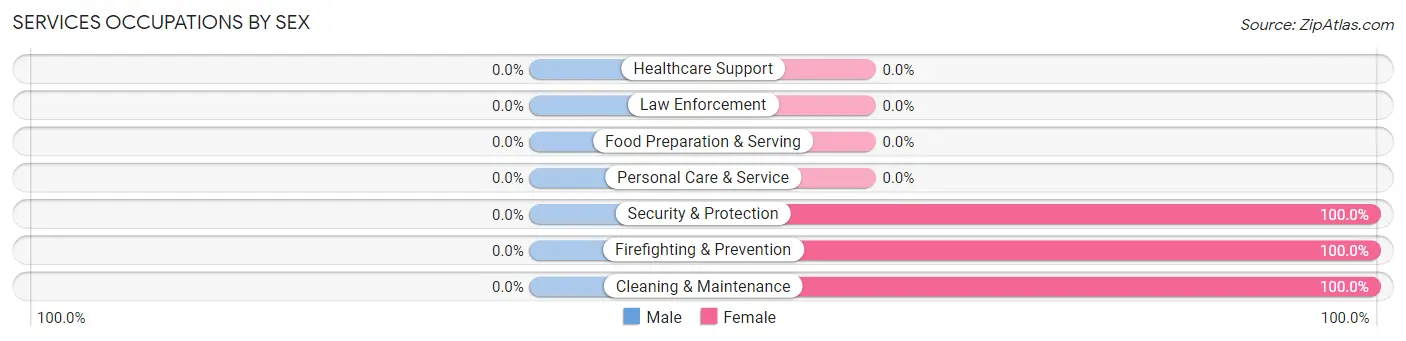
| Occupation | Male | Female |
| Healthcare Support | 0 (0.0%) | 0 (0.0%) |
| Security & Protection | 0 (0.0%) | 9 (100.0%) |
| Firefighting & Prevention | 0 (0.0%) | 9 (100.0%) |
| Law Enforcement | 0 (0.0%) | 0 (0.0%) |
| Food Preparation & Serving | 0 (0.0%) | 0 (0.0%) |
| Cleaning & Maintenance | 0 (0.0%) | 24 (100.0%) |
| Personal Care & Service | 0 (0.0%) | 0 (0.0%) |
| Total (Category) | 0 (0.0%) | 33 (100.0%) |
| Total (Overall) | 18 (25.7%) | 52 (74.3%) |
Sales and Office Occupations
The most common Sales and Office occupations in North Acomita Village are , and Office & Administration (10 | 14.3%).
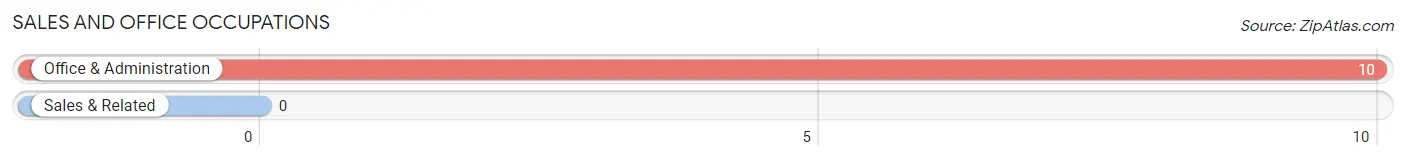
Sales and Office Occupations by Sex
| Occupation | Male | Female |
| Sales & Related | 0 (0.0%) | 0 (0.0%) |
| Office & Administration | 0 (0.0%) | 10 (100.0%) |
| Total (Category) | 0 (0.0%) | 10 (100.0%) |
| Total (Overall) | 18 (25.7%) | 52 (74.3%) |
Natural Resources, Construction and Maintenance Occupations
The most common Natural Resources, Construction and Maintenance occupations in North Acomita Village are , and Construction & Extraction (9 | 12.9%).
Natural Resources, Construction and Maintenance Occupations by Sex
| Occupation | Male | Female |
| Farming, Fishing & Forestry | 0 (0.0%) | 0 (0.0%) |
| Construction & Extraction | 0 (0.0%) | 9 (100.0%) |
| Installation, Maintenance & Repair | 0 (0.0%) | 0 (0.0%) |
| Total (Category) | 0 (0.0%) | 9 (100.0%) |
| Total (Overall) | 18 (25.7%) | 52 (74.3%) |
Production, Transportation and Moving Occupations
The most common Production, Transportation and Moving occupations in North Acomita Village are , and Production (11 | 15.7%).
Production, Transportation and Moving Occupations by Sex
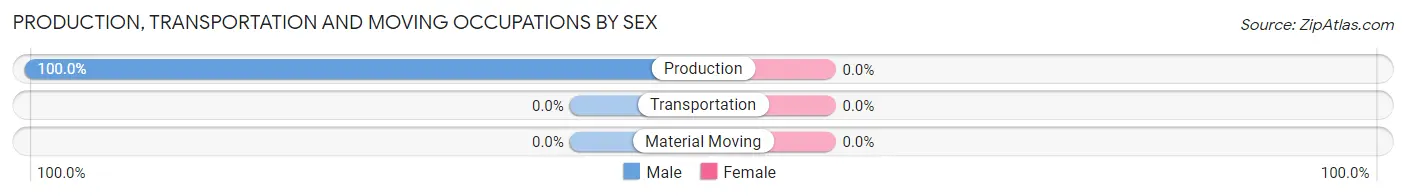
| Occupation | Male | Female |
| Production | 11 (100.0%) | 0 (0.0%) |
| Transportation | 0 (0.0%) | 0 (0.0%) |
| Material Moving | 0 (0.0%) | 0 (0.0%) |
| Total (Category) | 11 (100.0%) | 0 (0.0%) |
| Total (Overall) | 18 (25.7%) | 52 (74.3%) |
Employment Industries by Sex in North Acomita Village
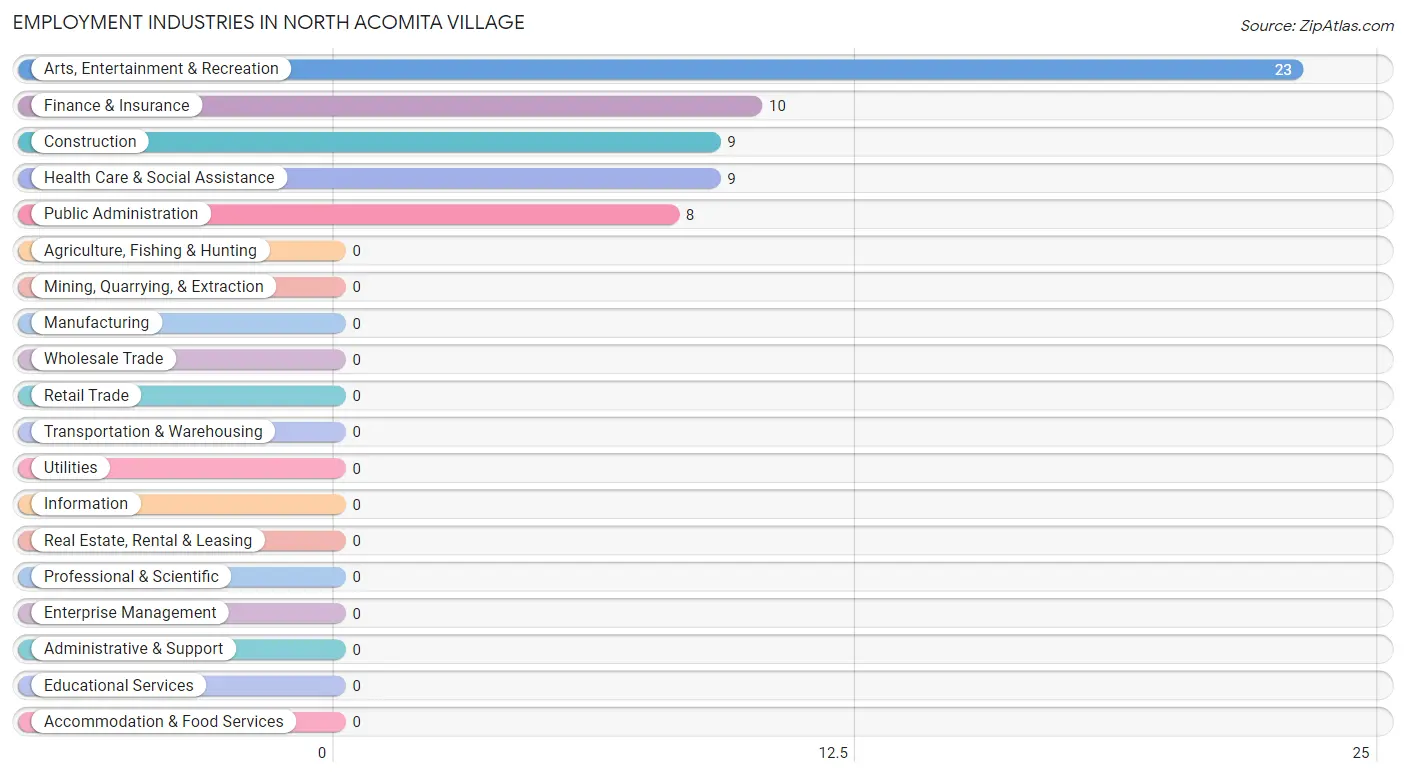
Employment Industries in North Acomita Village
The major employment industries in North Acomita Village include Arts, Entertainment & Recreation (23 | 32.9%), Finance & Insurance (10 | 14.3%), Construction (9 | 12.9%), Health Care & Social Assistance (9 | 12.9%), and Public Administration (8 | 11.4%).
Employment Industries by Sex in North Acomita Village
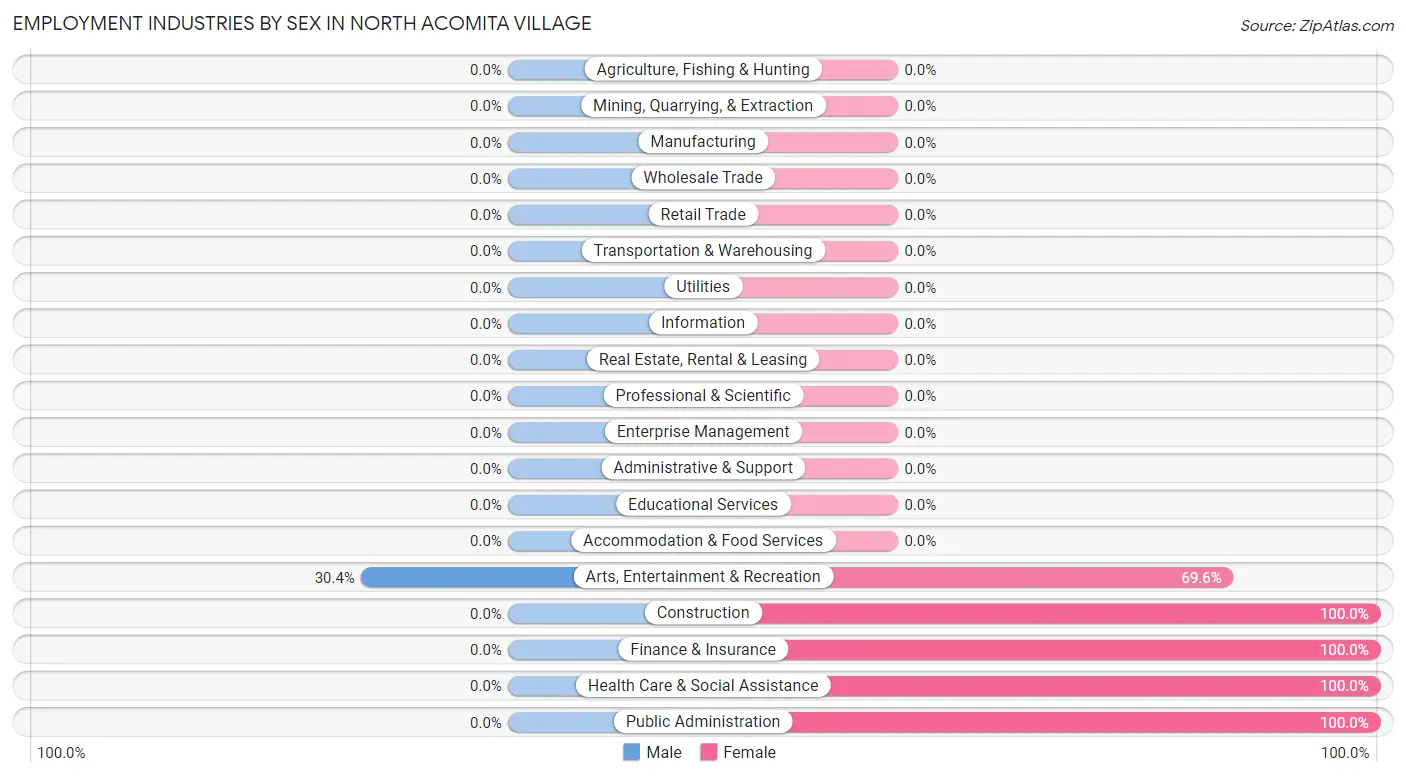
| Industry | Male | Female |
| Agriculture, Fishing & Hunting | 0 (0.0%) | 0 (0.0%) |
| Mining, Quarrying, & Extraction | 0 (0.0%) | 0 (0.0%) |
| Construction | 0 (0.0%) | 9 (100.0%) |
| Manufacturing | 0 (0.0%) | 0 (0.0%) |
| Wholesale Trade | 0 (0.0%) | 0 (0.0%) |
| Retail Trade | 0 (0.0%) | 0 (0.0%) |
| Transportation & Warehousing | 0 (0.0%) | 0 (0.0%) |
| Utilities | 0 (0.0%) | 0 (0.0%) |
| Information | 0 (0.0%) | 0 (0.0%) |
| Finance & Insurance | 0 (0.0%) | 10 (100.0%) |
| Real Estate, Rental & Leasing | 0 (0.0%) | 0 (0.0%) |
| Professional & Scientific | 0 (0.0%) | 0 (0.0%) |
| Enterprise Management | 0 (0.0%) | 0 (0.0%) |
| Administrative & Support | 0 (0.0%) | 0 (0.0%) |
| Educational Services | 0 (0.0%) | 0 (0.0%) |
| Health Care & Social Assistance | 0 (0.0%) | 9 (100.0%) |
| Arts, Entertainment & Recreation | 7 (30.4%) | 16 (69.6%) |
| Accommodation & Food Services | 0 (0.0%) | 0 (0.0%) |
| Public Administration | 0 (0.0%) | 8 (100.0%) |
| Total | 18 (25.7%) | 52 (74.3%) |
Education in North Acomita Village
School Enrollment in North Acomita Village
The most common levels of schooling among the 89 students in North Acomita Village are high school (28 | 31.5%), college / undergraduate (28 | 31.5%), and elementary school (18 | 20.2%).
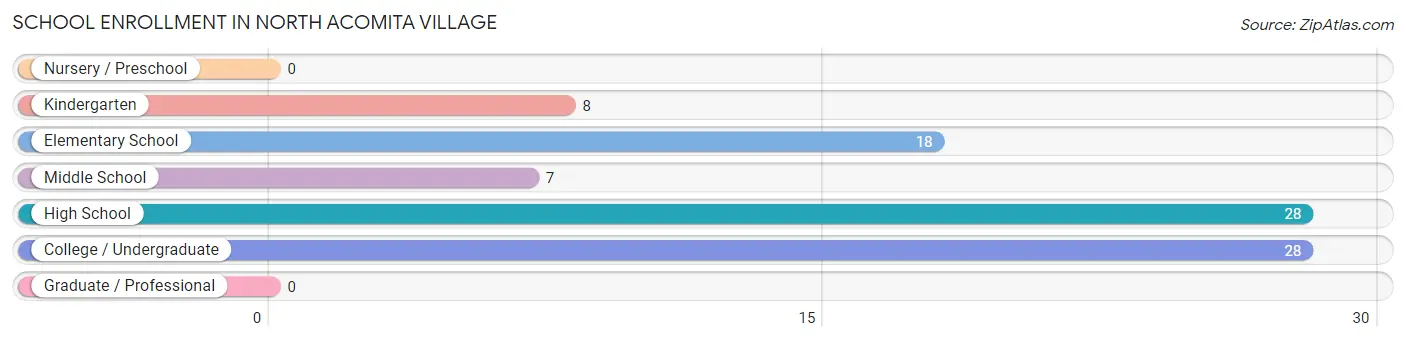
| School Level | # Students | % Students |
| Nursery / Preschool | 0 | 0.0% |
| Kindergarten | 8 | 9.0% |
| Elementary School | 18 | 20.2% |
| Middle School | 7 | 7.9% |
| High School | 28 | 31.5% |
| College / Undergraduate | 28 | 31.5% |
| Graduate / Professional | 0 | 0.0% |
| Total | 89 | 100.0% |
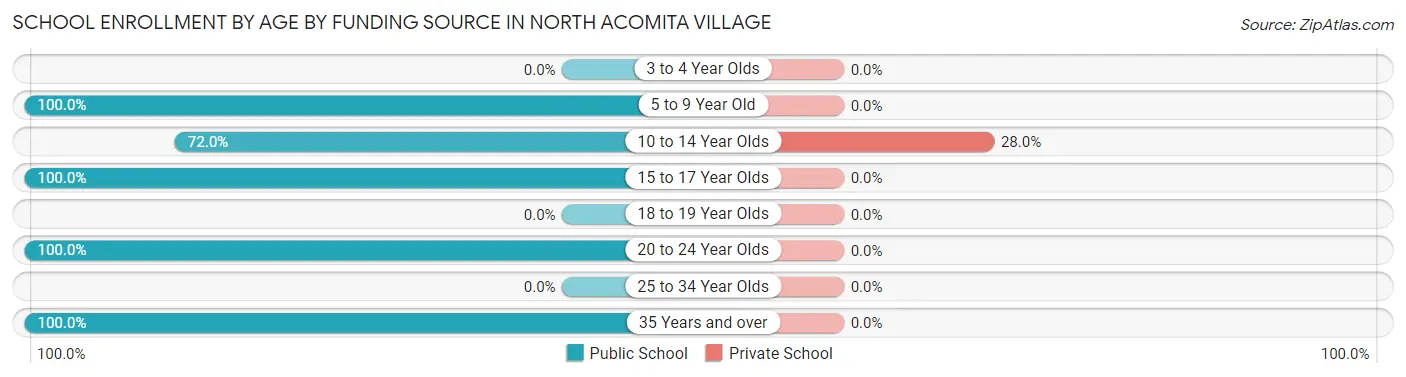
School Enrollment by Age by Funding Source in North Acomita Village
Out of a total of 89 students who are enrolled in schools in North Acomita Village, 7 (7.9%) attend a private institution, while the remaining 82 (92.1%) are enrolled in public schools. The age group of 10 to 14 year olds has the highest likelihood of being enrolled in private schools, with 7 (28.0% in the age bracket) enrolled. Conversely, the age group of 5 to 9 year old has the lowest likelihood of being enrolled in a private school, with 8 (100.0% in the age bracket) attending a public institution.
| Age Bracket | Public School | Private School |
| 3 to 4 Year Olds | 0 (0.0%) | 0 (0.0%) |
| 5 to 9 Year Old | 8 (100.0%) | 0 (0.0%) |
| 10 to 14 Year Olds | 18 (72.0%) | 7 (28.0%) |
| 15 to 17 Year Olds | 28 (100.0%) | 0 (0.0%) |
| 18 to 19 Year Olds | 0 (0.0%) | 0 (0.0%) |
| 20 to 24 Year Olds | 21 (100.0%) | 0 (0.0%) |
| 25 to 34 Year Olds | 0 (0.0%) | 0 (0.0%) |
| 35 Years and over | 7 (100.0%) | 0 (0.0%) |
| Total | 82 (92.1%) | 7 (7.9%) |
Educational Attainment by Field of Study in North Acomita Village
, and science & technology (17 | 100.0%) are the most common fields of study among 17 individuals in North Acomita Village who have obtained a bachelor's degree or higher.
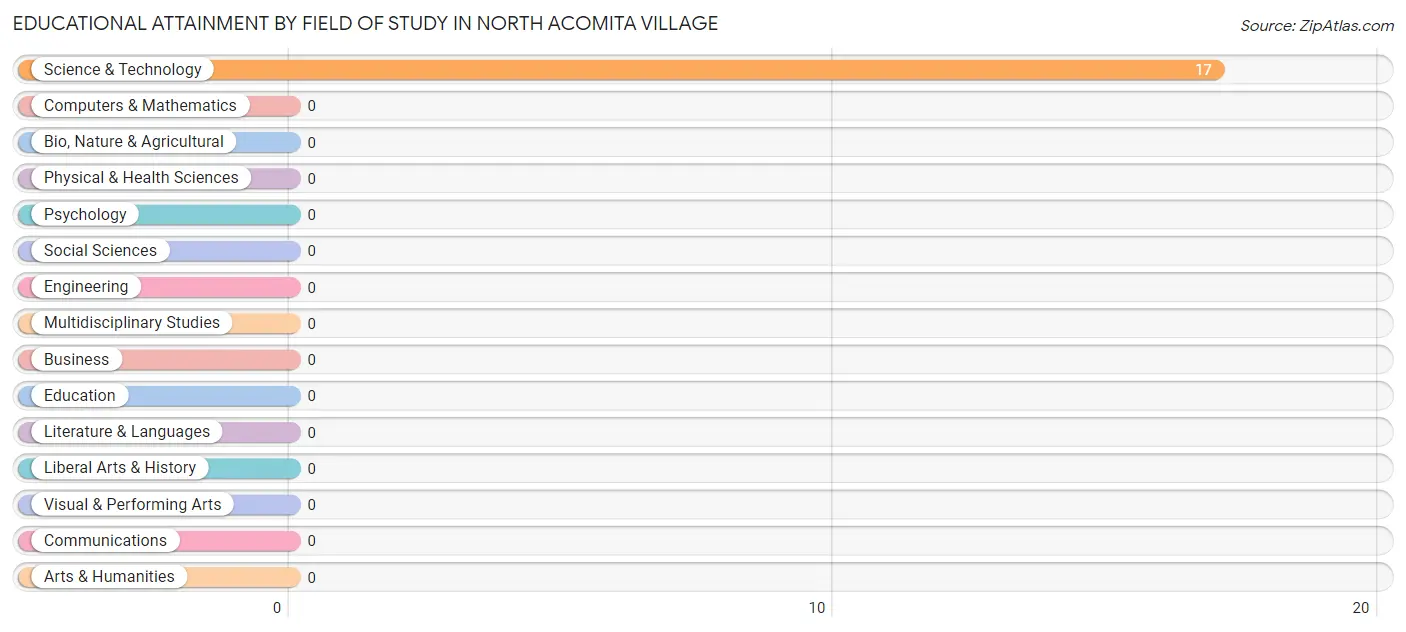
| Field of Study | # Graduates | % Graduates |
| Computers & Mathematics | 0 | 0.0% |
| Bio, Nature & Agricultural | 0 | 0.0% |
| Physical & Health Sciences | 0 | 0.0% |
| Psychology | 0 | 0.0% |
| Social Sciences | 0 | 0.0% |
| Engineering | 0 | 0.0% |
| Multidisciplinary Studies | 0 | 0.0% |
| Science & Technology | 17 | 100.0% |
| Business | 0 | 0.0% |
| Education | 0 | 0.0% |
| Literature & Languages | 0 | 0.0% |
| Liberal Arts & History | 0 | 0.0% |
| Visual & Performing Arts | 0 | 0.0% |
| Communications | 0 | 0.0% |
| Arts & Humanities | 0 | 0.0% |
| Total | 17 | 100.0% |
Transportation & Commute in North Acomita Village
Vehicle Availability by Sex in North Acomita Village
The most prevalent vehicle ownership categories in North Acomita Village are males with 3 vehicles (11, accounting for 61.1%) and females with 3 vehicles (27, making up 21.1%).
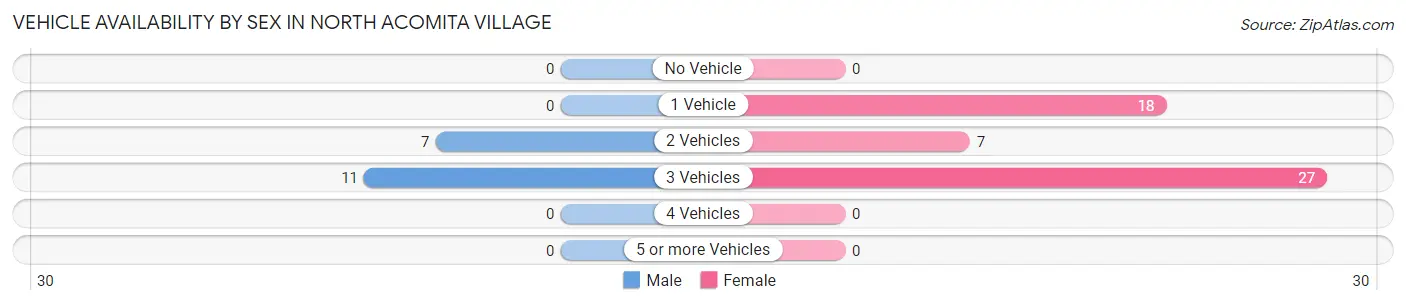
| Vehicles Available | Male | Female |
| No Vehicle | 0 (0.0%) | 0 (0.0%) |
| 1 Vehicle | 0 (0.0%) | 18 (34.6%) |
| 2 Vehicles | 7 (38.9%) | 7 (13.5%) |
| 3 Vehicles | 11 (61.1%) | 27 (51.9%) |
| 4 Vehicles | 0 (0.0%) | 0 (0.0%) |
| 5 or more Vehicles | 0 (0.0%) | 0 (0.0%) |
| Total | 18 (100.0%) | 52 (100.0%) |
Commute Time in North Acomita Village
The most frequently occuring commute durations in North Acomita Village are 60 to 89 minutes (28 commuters, 44.4%), 10 to 14 minutes (10 commuters, 15.9%), and 15 to 19 minutes (9 commuters, 14.3%).
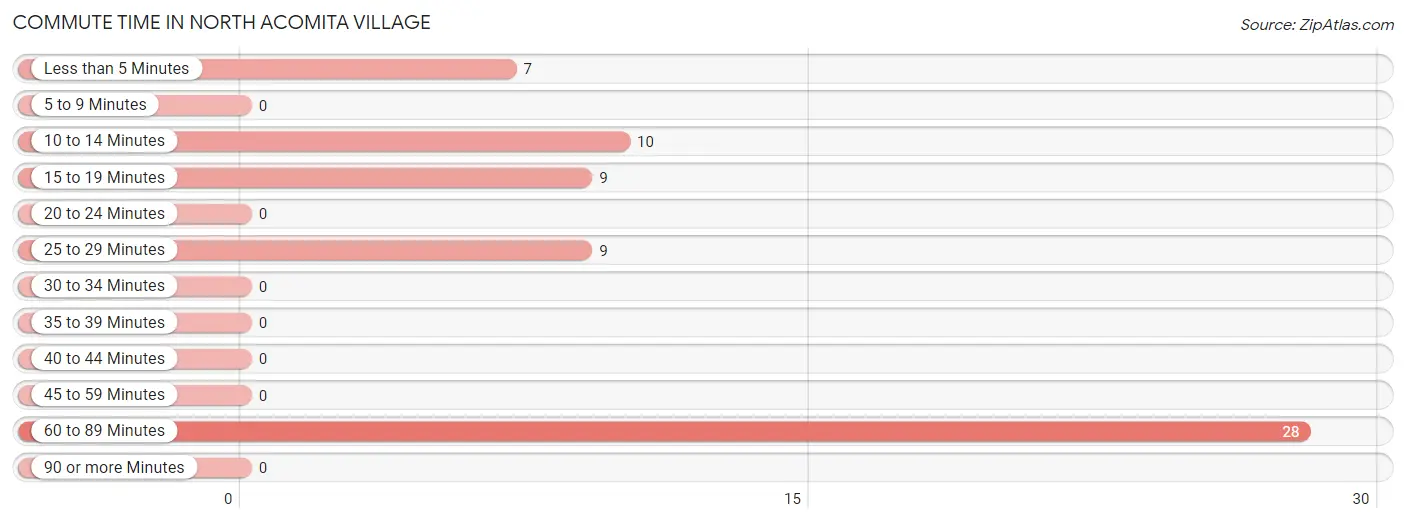
| Commute Time | # Commuters | % Commuters |
| Less than 5 Minutes | 7 | 11.1% |
| 5 to 9 Minutes | 0 | 0.0% |
| 10 to 14 Minutes | 10 | 15.9% |
| 15 to 19 Minutes | 9 | 14.3% |
| 20 to 24 Minutes | 0 | 0.0% |
| 25 to 29 Minutes | 9 | 14.3% |
| 30 to 34 Minutes | 0 | 0.0% |
| 35 to 39 Minutes | 0 | 0.0% |
| 40 to 44 Minutes | 0 | 0.0% |
| 45 to 59 Minutes | 0 | 0.0% |
| 60 to 89 Minutes | 28 | 44.4% |
| 90 or more Minutes | 0 | 0.0% |
Commute Time by Sex in North Acomita Village
The most common commute times in North Acomita Village are 60 to 89 minutes (11 commuters, 100.0%) for males and 60 to 89 minutes (17 commuters, 32.7%) for females.
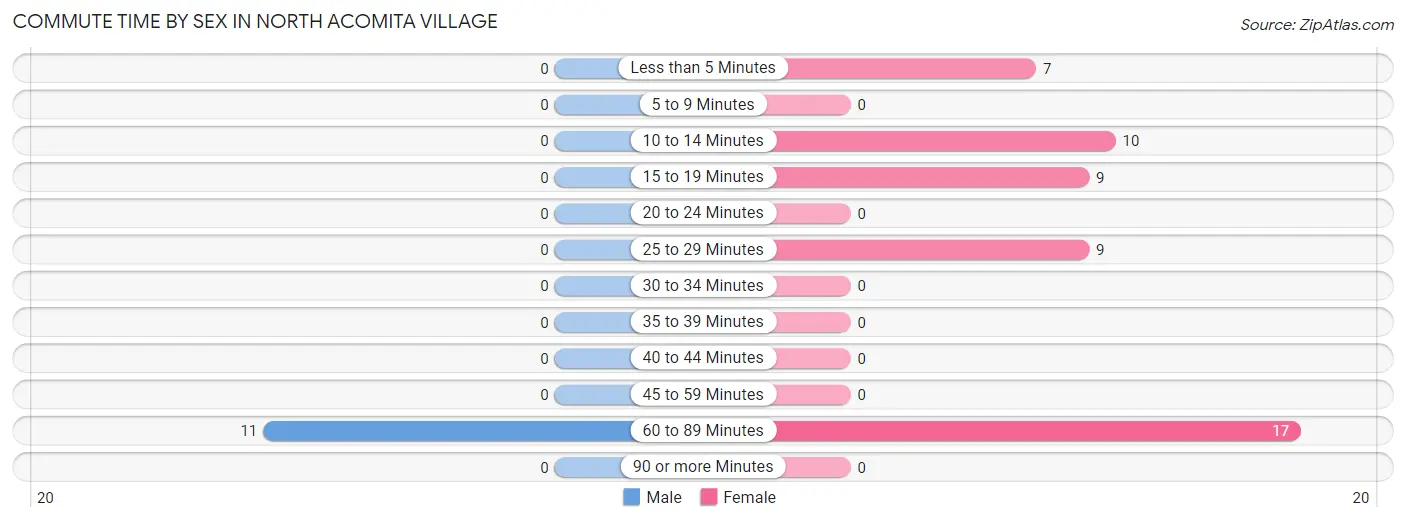
| Commute Time | Male | Female |
| Less than 5 Minutes | 0 (0.0%) | 7 (13.5%) |
| 5 to 9 Minutes | 0 (0.0%) | 0 (0.0%) |
| 10 to 14 Minutes | 0 (0.0%) | 10 (19.2%) |
| 15 to 19 Minutes | 0 (0.0%) | 9 (17.3%) |
| 20 to 24 Minutes | 0 (0.0%) | 0 (0.0%) |
| 25 to 29 Minutes | 0 (0.0%) | 9 (17.3%) |
| 30 to 34 Minutes | 0 (0.0%) | 0 (0.0%) |
| 35 to 39 Minutes | 0 (0.0%) | 0 (0.0%) |
| 40 to 44 Minutes | 0 (0.0%) | 0 (0.0%) |
| 45 to 59 Minutes | 0 (0.0%) | 0 (0.0%) |
| 60 to 89 Minutes | 11 (100.0%) | 17 (32.7%) |
| 90 or more Minutes | 0 (0.0%) | 0 (0.0%) |
Time of Departure to Work by Sex in North Acomita Village
The most frequent times of departure to work in North Acomita Village are 6:30 AM to 6:59 AM (11, 100.0%) for males and 9:00 AM to 9:59 AM (18, 34.6%) for females.
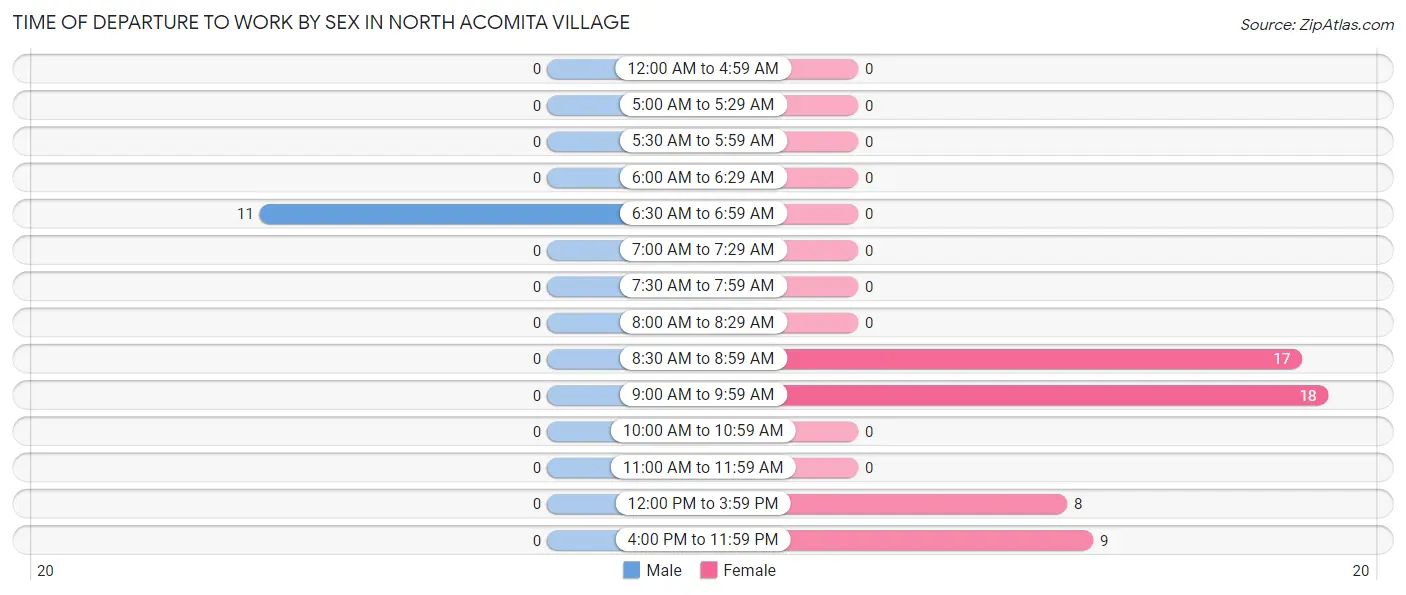
| Time of Departure | Male | Female |
| 12:00 AM to 4:59 AM | 0 (0.0%) | 0 (0.0%) |
| 5:00 AM to 5:29 AM | 0 (0.0%) | 0 (0.0%) |
| 5:30 AM to 5:59 AM | 0 (0.0%) | 0 (0.0%) |
| 6:00 AM to 6:29 AM | 0 (0.0%) | 0 (0.0%) |
| 6:30 AM to 6:59 AM | 11 (100.0%) | 0 (0.0%) |
| 7:00 AM to 7:29 AM | 0 (0.0%) | 0 (0.0%) |
| 7:30 AM to 7:59 AM | 0 (0.0%) | 0 (0.0%) |
| 8:00 AM to 8:29 AM | 0 (0.0%) | 0 (0.0%) |
| 8:30 AM to 8:59 AM | 0 (0.0%) | 17 (32.7%) |
| 9:00 AM to 9:59 AM | 0 (0.0%) | 18 (34.6%) |
| 10:00 AM to 10:59 AM | 0 (0.0%) | 0 (0.0%) |
| 11:00 AM to 11:59 AM | 0 (0.0%) | 0 (0.0%) |
| 12:00 PM to 3:59 PM | 0 (0.0%) | 8 (15.4%) |
| 4:00 PM to 11:59 PM | 0 (0.0%) | 9 (17.3%) |
| Total | 11 (100.0%) | 52 (100.0%) |
Housing Occupancy in North Acomita Village
Occupancy by Ownership in North Acomita Village
Of the total 38 dwellings in North Acomita Village, owner-occupied units account for 38 (100.0%), while renter-occupied units make up 0 (0.0%).
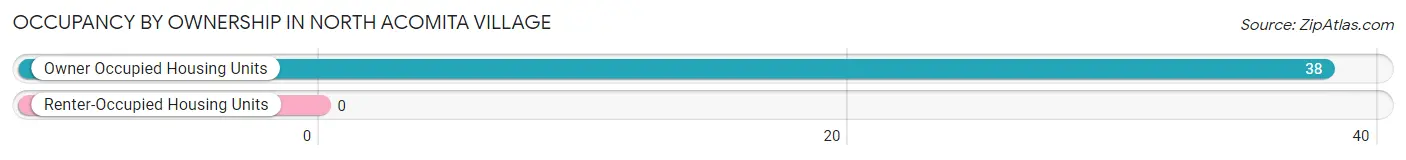
| Occupancy | # Housing Units | % Housing Units |
| Owner Occupied Housing Units | 38 | 100.0% |
| Renter-Occupied Housing Units | 0 | 0.0% |
| Total Occupied Housing Units | 38 | 100.0% |
Occupancy by Household Size in North Acomita Village
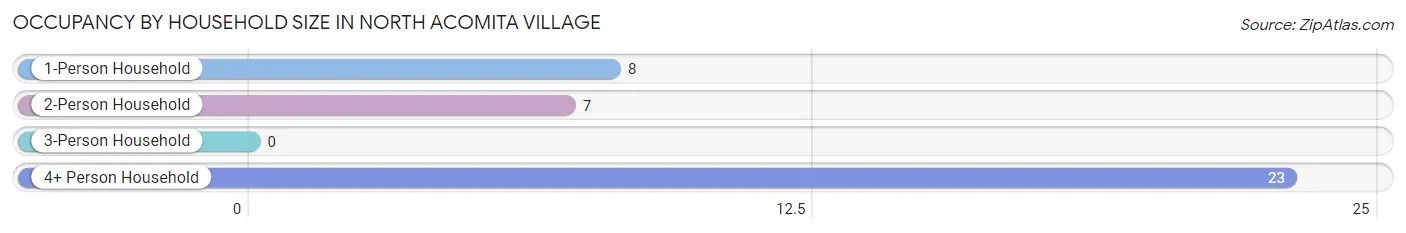
| Household Size | # Housing Units | % Housing Units |
| 1-Person Household | 8 | 21.0% |
| 2-Person Household | 7 | 18.4% |
| 3-Person Household | 0 | 0.0% |
| 4+ Person Household | 23 | 60.5% |
| Total Housing Units | 38 | 100.0% |
Occupancy by Ownership by Household Size in North Acomita Village
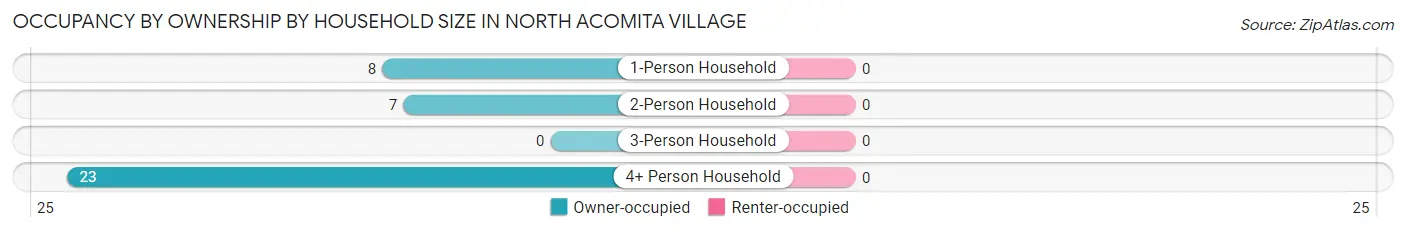
| Household Size | Owner-occupied | Renter-occupied |
| 1-Person Household | 8 (100.0%) | 0 (0.0%) |
| 2-Person Household | 7 (100.0%) | 0 (0.0%) |
| 3-Person Household | 0 (0.0%) | 0 (0.0%) |
| 4+ Person Household | 23 (100.0%) | 0 (0.0%) |
| Total Housing Units | 38 (100.0%) | 0 (0.0%) |
Occupancy by Educational Attainment in North Acomita Village
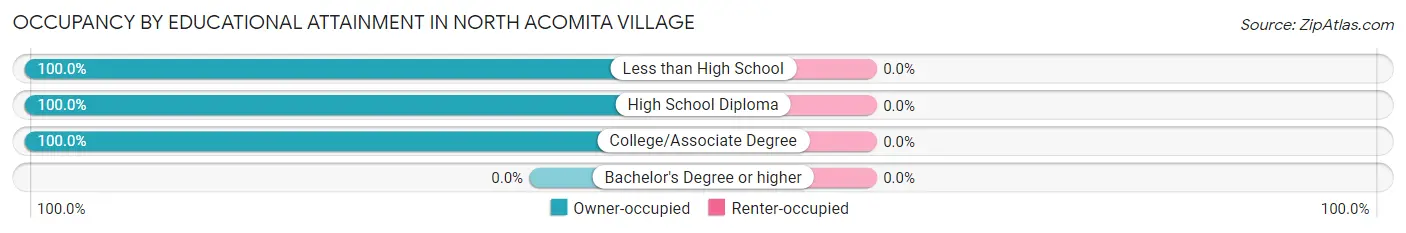
| Household Size | Owner-occupied | Renter-occupied |
| Less than High School | 8 (100.0%) | 0 (0.0%) |
| High School Diploma | 9 (100.0%) | 0 (0.0%) |
| College/Associate Degree | 21 (100.0%) | 0 (0.0%) |
| Bachelor's Degree or higher | 0 (0.0%) | 0 (0.0%) |
Occupancy by Age of Householder in North Acomita Village
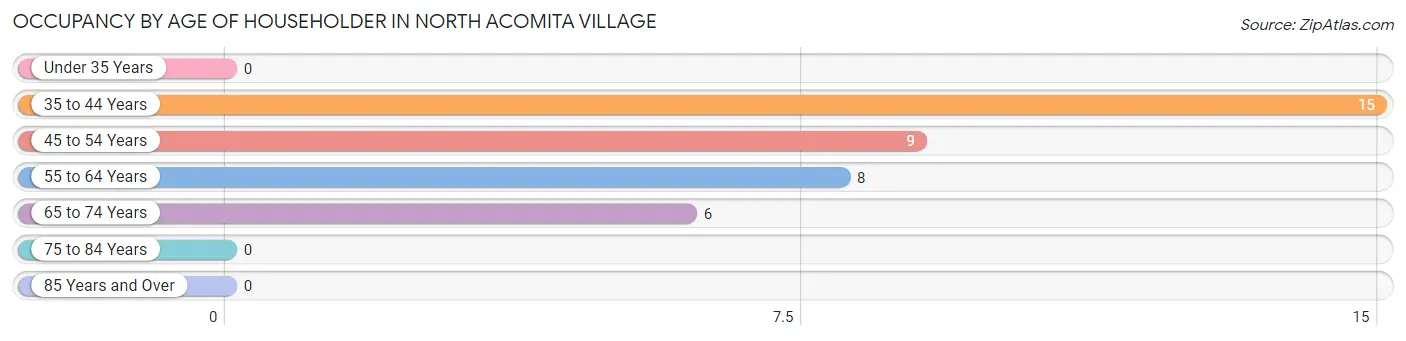
| Age Bracket | # Households | % Households |
| Under 35 Years | 0 | 0.0% |
| 35 to 44 Years | 15 | 39.5% |
| 45 to 54 Years | 9 | 23.7% |
| 55 to 64 Years | 8 | 21.0% |
| 65 to 74 Years | 6 | 15.8% |
| 75 to 84 Years | 0 | 0.0% |
| 85 Years and Over | 0 | 0.0% |
| Total | 38 | 100.0% |
Housing Finances in North Acomita Village
Median Income by Occupancy in North Acomita Village
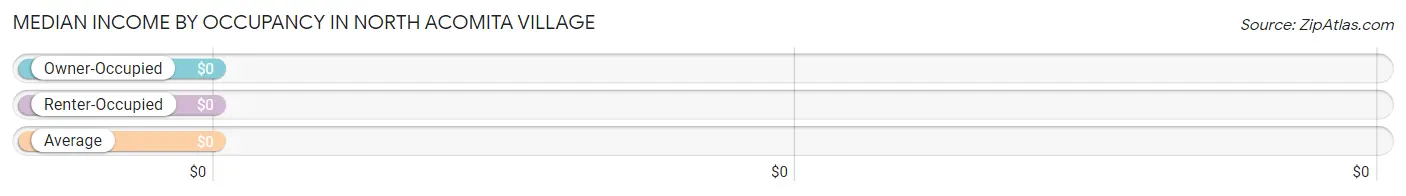
| Occupancy Type | # Households | Median Income |
| Owner-Occupied | 38 (100.0%) | $0 |
| Renter-Occupied | 0 (0.0%) | $0 |
| Average | 38 (100.0%) | $0 |
Occupancy by Householder Income Bracket in North Acomita Village
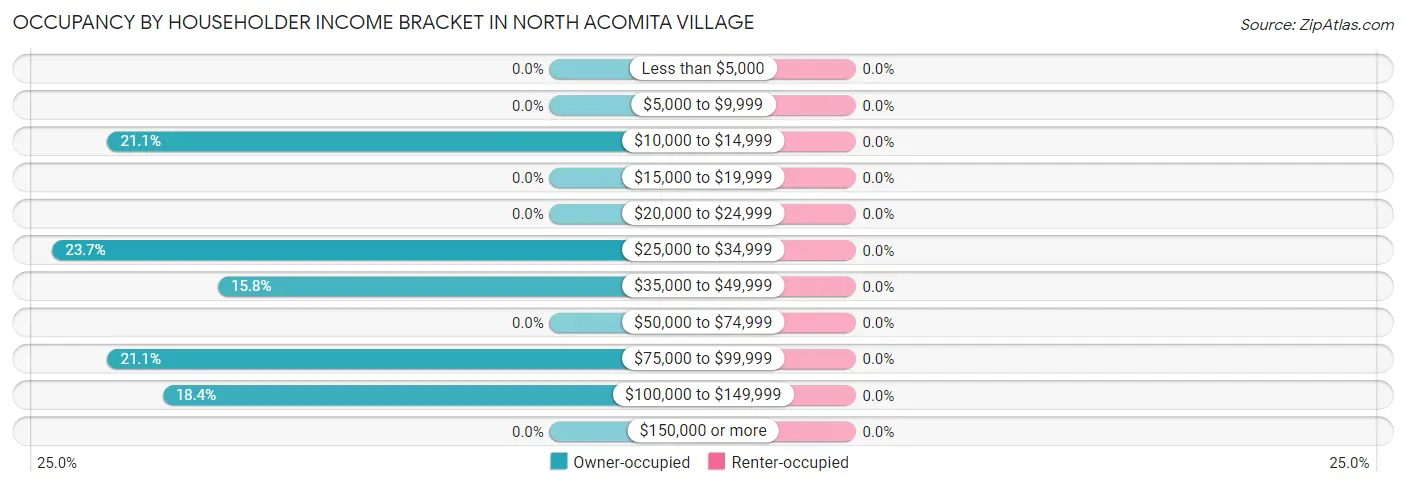
| Income Bracket | Owner-occupied | Renter-occupied |
| Less than $5,000 | 0 (0.0%) | 0 (0.0%) |
| $5,000 to $9,999 | 0 (0.0%) | 0 (0.0%) |
| $10,000 to $14,999 | 8 (21.0%) | 0 (0.0%) |
| $15,000 to $19,999 | 0 (0.0%) | 0 (0.0%) |
| $20,000 to $24,999 | 0 (0.0%) | 0 (0.0%) |
| $25,000 to $34,999 | 9 (23.7%) | 0 (0.0%) |
| $35,000 to $49,999 | 6 (15.8%) | 0 (0.0%) |
| $50,000 to $74,999 | 0 (0.0%) | 0 (0.0%) |
| $75,000 to $99,999 | 8 (21.0%) | 0 (0.0%) |
| $100,000 to $149,999 | 7 (18.4%) | 0 (0.0%) |
| $150,000 or more | 0 (0.0%) | 0 (0.0%) |
| Total | 38 (100.0%) | 0 (0.0%) |
Monthly Housing Cost Tiers in North Acomita Village
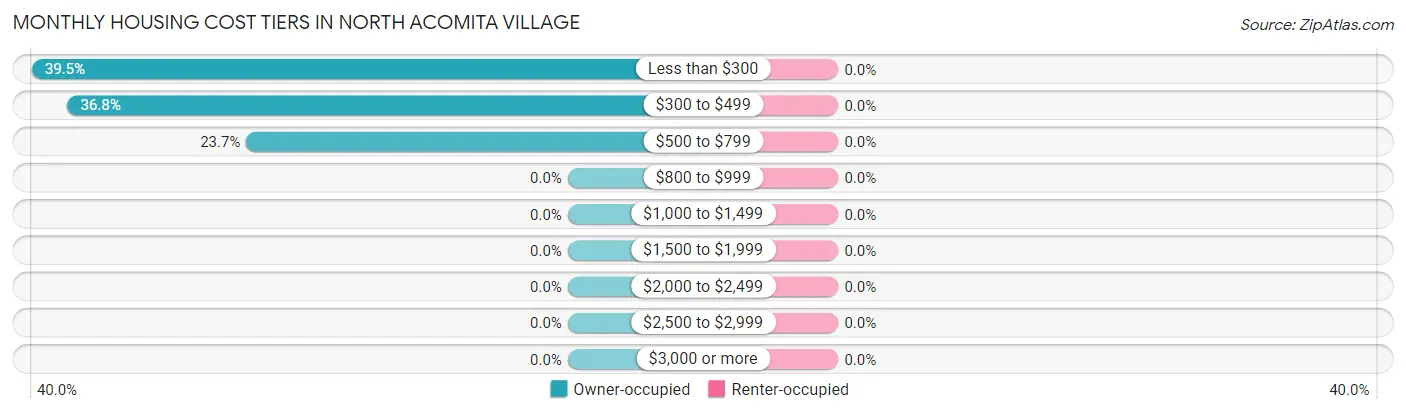
| Monthly Cost | Owner-occupied | Renter-occupied |
| Less than $300 | 15 (39.5%) | 0 (0.0%) |
| $300 to $499 | 14 (36.8%) | 0 (0.0%) |
| $500 to $799 | 9 (23.7%) | 0 (0.0%) |
| $800 to $999 | 0 (0.0%) | 0 (0.0%) |
| $1,000 to $1,499 | 0 (0.0%) | 0 (0.0%) |
| $1,500 to $1,999 | 0 (0.0%) | 0 (0.0%) |
| $2,000 to $2,499 | 0 (0.0%) | 0 (0.0%) |
| $2,500 to $2,999 | 0 (0.0%) | 0 (0.0%) |
| $3,000 or more | 0 (0.0%) | 0 (0.0%) |
| Total | 38 (100.0%) | 0 (0.0%) |
Physical Housing Characteristics in North Acomita Village
Housing Structures in North Acomita Village
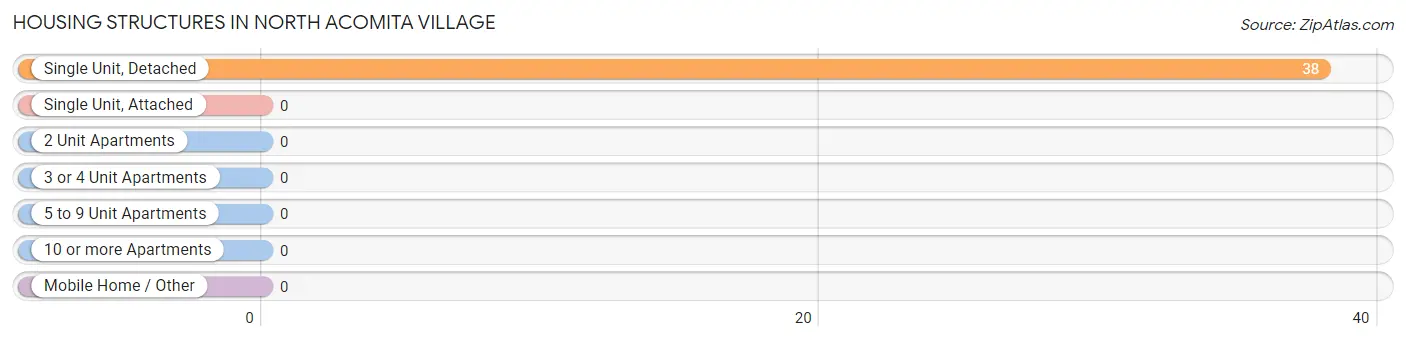
| Structure Type | # Housing Units | % Housing Units |
| Single Unit, Detached | 38 | 100.0% |
| Single Unit, Attached | 0 | 0.0% |
| 2 Unit Apartments | 0 | 0.0% |
| 3 or 4 Unit Apartments | 0 | 0.0% |
| 5 to 9 Unit Apartments | 0 | 0.0% |
| 10 or more Apartments | 0 | 0.0% |
| Mobile Home / Other | 0 | 0.0% |
| Total | 38 | 100.0% |
Housing Structures by Occupancy in North Acomita Village
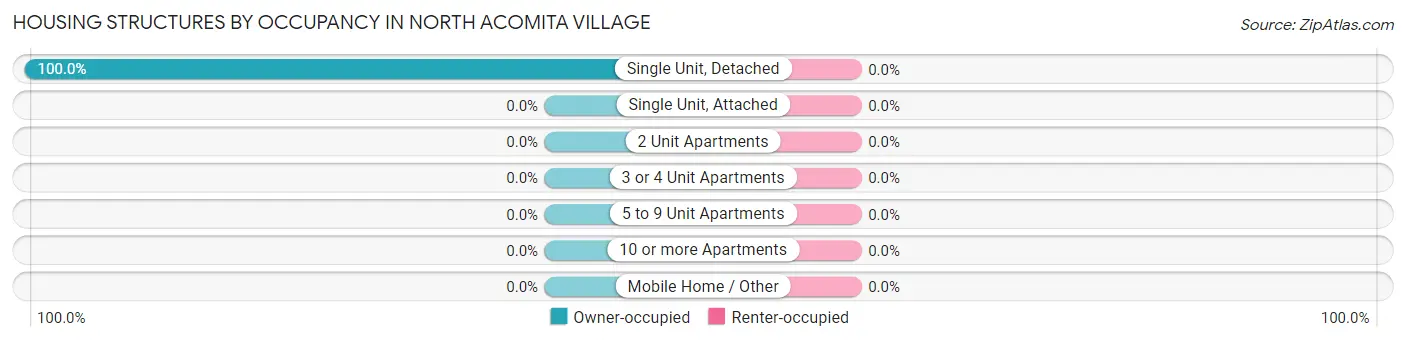
| Structure Type | Owner-occupied | Renter-occupied |
| Single Unit, Detached | 38 (100.0%) | 0 (0.0%) |
| Single Unit, Attached | 0 (0.0%) | 0 (0.0%) |
| 2 Unit Apartments | 0 (0.0%) | 0 (0.0%) |
| 3 or 4 Unit Apartments | 0 (0.0%) | 0 (0.0%) |
| 5 to 9 Unit Apartments | 0 (0.0%) | 0 (0.0%) |
| 10 or more Apartments | 0 (0.0%) | 0 (0.0%) |
| Mobile Home / Other | 0 (0.0%) | 0 (0.0%) |
| Total | 38 (100.0%) | 0 (0.0%) |
Housing Structures by Number of Rooms in North Acomita Village
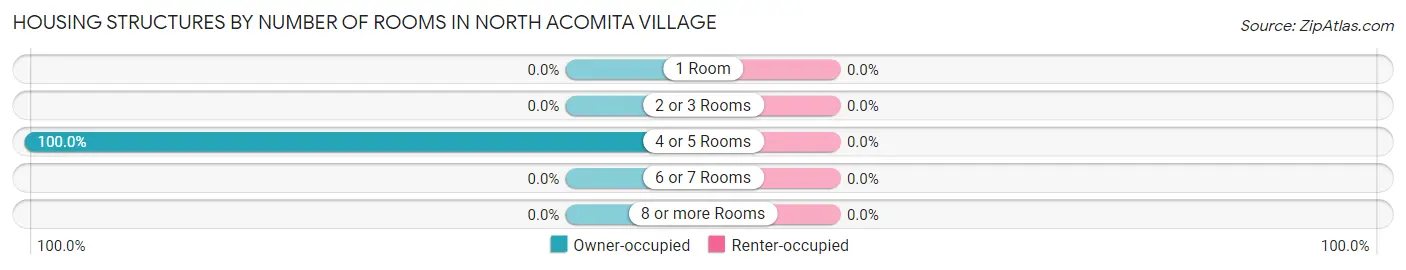
| Number of Rooms | Owner-occupied | Renter-occupied |
| 1 Room | 0 (0.0%) | 0 (0.0%) |
| 2 or 3 Rooms | 0 (0.0%) | 0 (0.0%) |
| 4 or 5 Rooms | 38 (100.0%) | 0 (0.0%) |
| 6 or 7 Rooms | 0 (0.0%) | 0 (0.0%) |
| 8 or more Rooms | 0 (0.0%) | 0 (0.0%) |
| Total | 38 (100.0%) | 0 (0.0%) |
Housing Structure by Heating Type in North Acomita Village
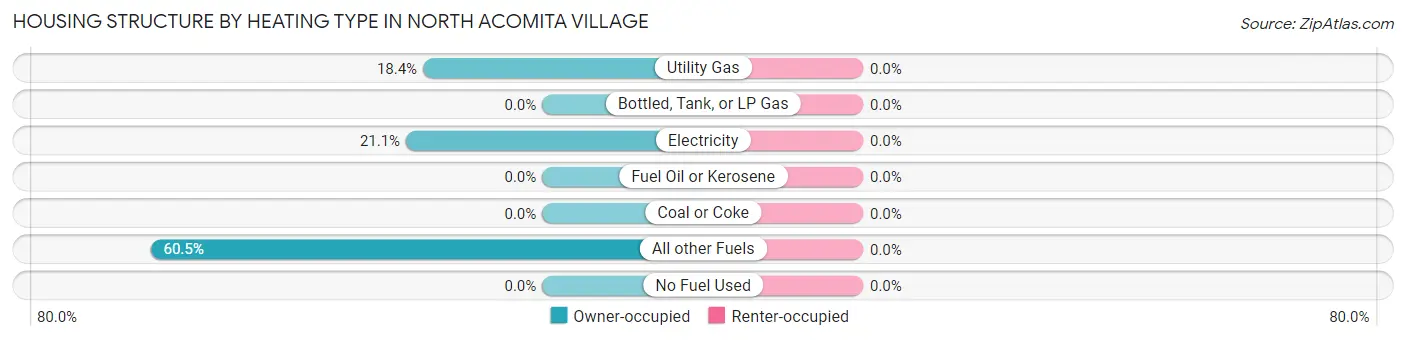
| Heating Type | Owner-occupied | Renter-occupied |
| Utility Gas | 7 (18.4%) | 0 (0.0%) |
| Bottled, Tank, or LP Gas | 0 (0.0%) | 0 (0.0%) |
| Electricity | 8 (21.0%) | 0 (0.0%) |
| Fuel Oil or Kerosene | 0 (0.0%) | 0 (0.0%) |
| Coal or Coke | 0 (0.0%) | 0 (0.0%) |
| All other Fuels | 23 (60.5%) | 0 (0.0%) |
| No Fuel Used | 0 (0.0%) | 0 (0.0%) |
| Total | 38 (100.0%) | 0 (0.0%) |
Household Vehicle Usage in North Acomita Village
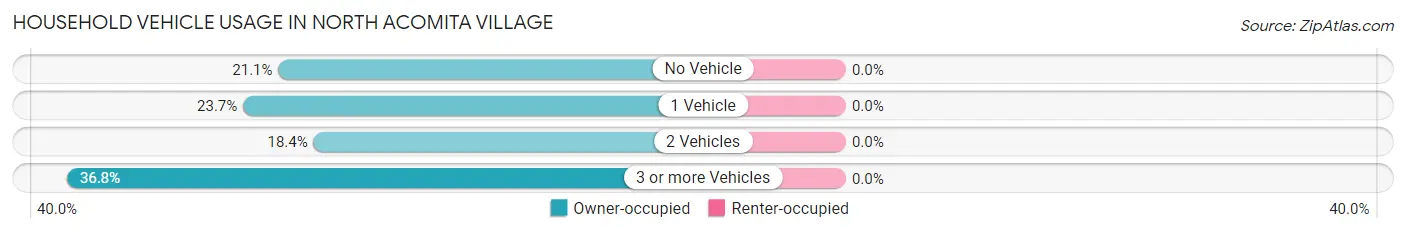
| Vehicles per Household | Owner-occupied | Renter-occupied |
| No Vehicle | 8 (21.0%) | 0 (0.0%) |
| 1 Vehicle | 9 (23.7%) | 0 (0.0%) |
| 2 Vehicles | 7 (18.4%) | 0 (0.0%) |
| 3 or more Vehicles | 14 (36.8%) | 0 (0.0%) |
| Total | 38 (100.0%) | 0 (0.0%) |
Real Estate & Mortgages in North Acomita Village
Real Estate and Mortgage Overview in North Acomita Village
| Characteristic | Without Mortgage | With Mortgage |
| Housing Units | 38 | 0 |
| Median Property Value | $26,900 | $0 |
| Median Household Income | - | - |
| Monthly Housing Costs | $333 | $0 |
| Real Estate Taxes | - | - |
Property Value by Mortgage Status in North Acomita Village
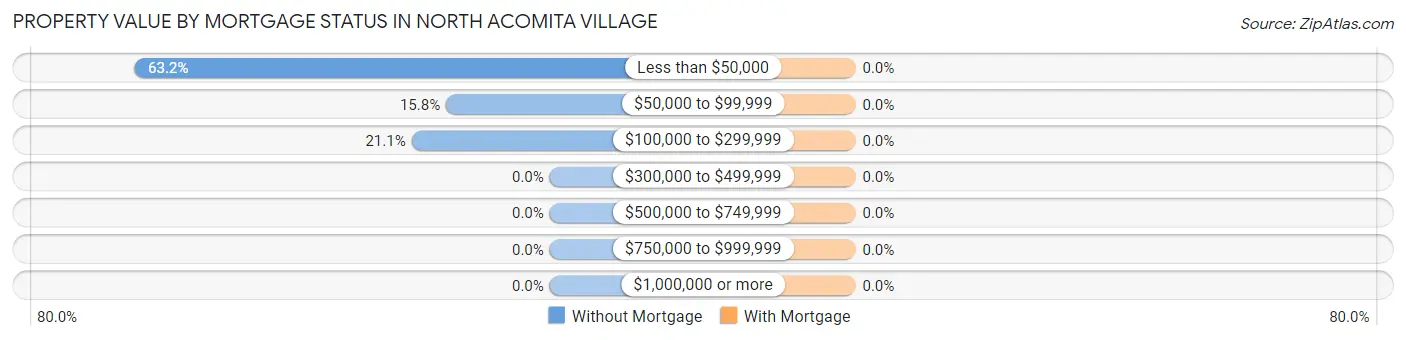
| Property Value | Without Mortgage | With Mortgage |
| Less than $50,000 | 24 (63.2%) | 0 (0.0%) |
| $50,000 to $99,999 | 6 (15.8%) | 0 (0.0%) |
| $100,000 to $299,999 | 8 (21.0%) | 0 (0.0%) |
| $300,000 to $499,999 | 0 (0.0%) | 0 (0.0%) |
| $500,000 to $749,999 | 0 (0.0%) | 0 (0.0%) |
| $750,000 to $999,999 | 0 (0.0%) | 0 (0.0%) |
| $1,000,000 or more | 0 (0.0%) | 0 (0.0%) |
| Total | 38 (100.0%) | 0 (0.0%) |
Household Income by Mortgage Status in North Acomita Village
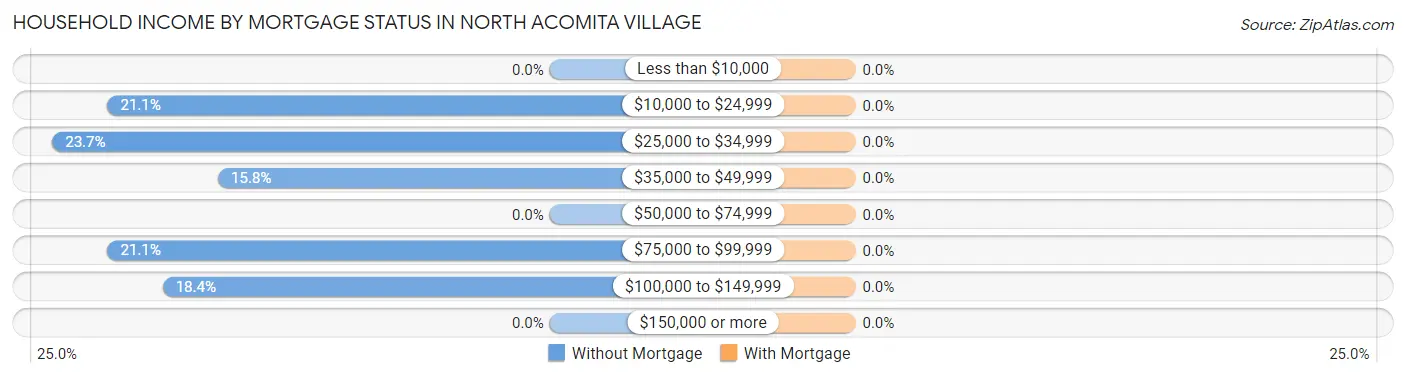
| Household Income | Without Mortgage | With Mortgage |
| Less than $10,000 | 0 (0.0%) | 0 (0.0%) |
| $10,000 to $24,999 | 8 (21.0%) | 0 (0.0%) |
| $25,000 to $34,999 | 9 (23.7%) | 0 (0.0%) |
| $35,000 to $49,999 | 6 (15.8%) | 0 (0.0%) |
| $50,000 to $74,999 | 0 (0.0%) | 0 (0.0%) |
| $75,000 to $99,999 | 8 (21.0%) | 0 (0.0%) |
| $100,000 to $149,999 | 7 (18.4%) | 0 (0.0%) |
| $150,000 or more | 0 (0.0%) | 0 (0.0%) |
| Total | 38 (100.0%) | 0 (0.0%) |
Property Value to Household Income Ratio in North Acomita Village
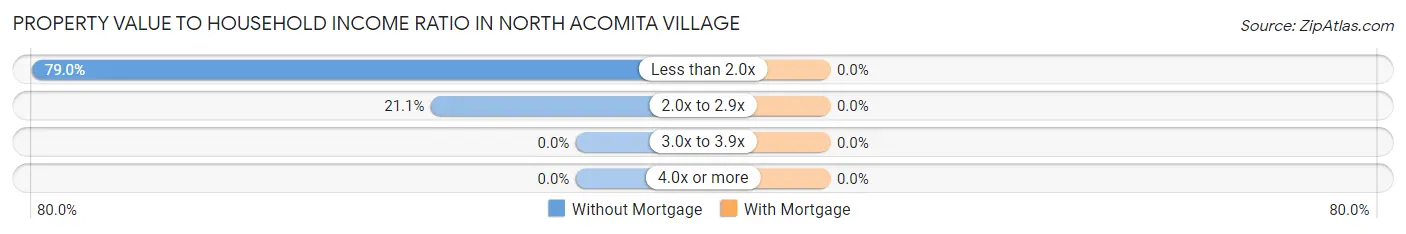
| Value-to-Income Ratio | Without Mortgage | With Mortgage |
| Less than 2.0x | 30 (78.9%) | 0 (0.0%) |
| 2.0x to 2.9x | 8 (21.0%) | 0 (0.0%) |
| 3.0x to 3.9x | 0 (0.0%) | 0 (0.0%) |
| 4.0x or more | 0 (0.0%) | 0 (0.0%) |
| Total | 38 (100.0%) | 0 (0.0%) |
Real Estate Taxes by Mortgage Status in North Acomita Village
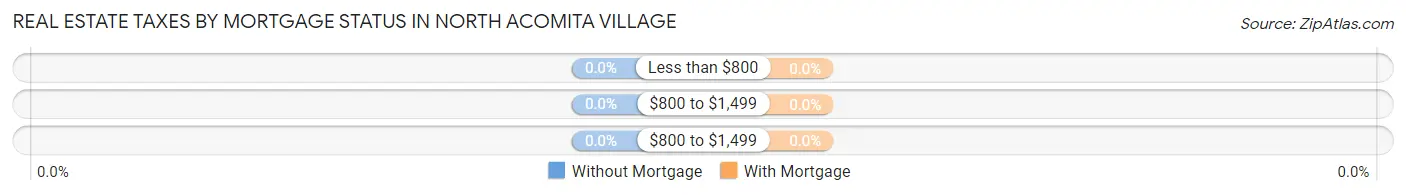
| Property Taxes | Without Mortgage | With Mortgage |
| Less than $800 | 0 (0.0%) | 0 (0.0%) |
| $800 to $1,499 | 0 (0.0%) | 0 (0.0%) |
| $800 to $1,499 | 0 (0.0%) | 0 (0.0%) |
| Total | 38 (100.0%) | 0 (0.0%) |
Health & Disability in North Acomita Village
Health Insurance Coverage by Age in North Acomita Village
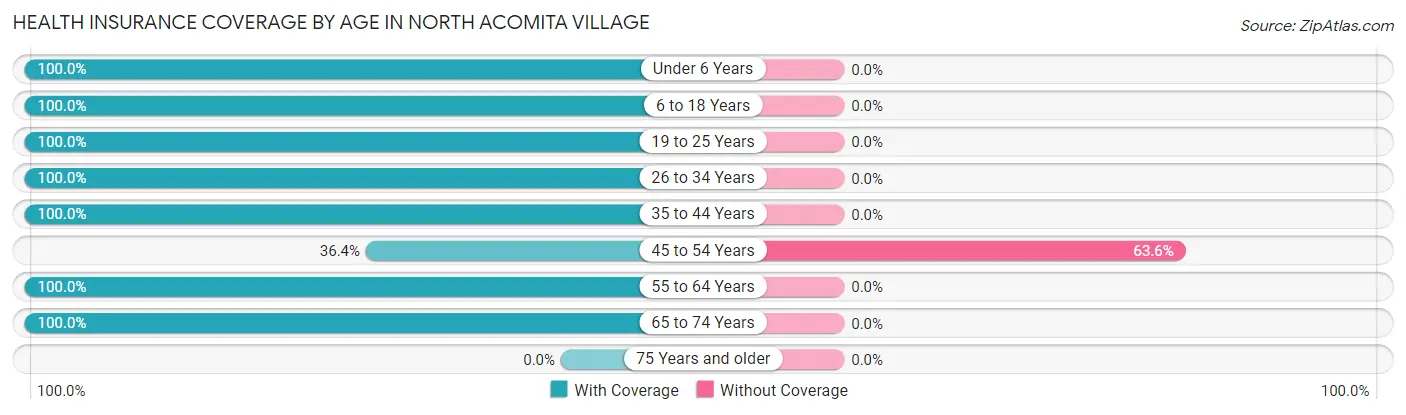
| Age Bracket | With Coverage | Without Coverage |
| Under 6 Years | 9 (100.0%) | 0 (0.0%) |
| 6 to 18 Years | 25 (100.0%) | 0 (0.0%) |
| 19 to 25 Years | 31 (100.0%) | 0 (0.0%) |
| 26 to 34 Years | 9 (100.0%) | 0 (0.0%) |
| 35 to 44 Years | 50 (100.0%) | 0 (0.0%) |
| 45 to 54 Years | 16 (36.4%) | 28 (63.6%) |
| 55 to 64 Years | 21 (100.0%) | 0 (0.0%) |
| 65 to 74 Years | 12 (100.0%) | 0 (0.0%) |
| 75 Years and older | 0 (0.0%) | 0 (0.0%) |
| Total | 173 (86.1%) | 28 (13.9%) |
Health Insurance Coverage by Citizenship Status in North Acomita Village
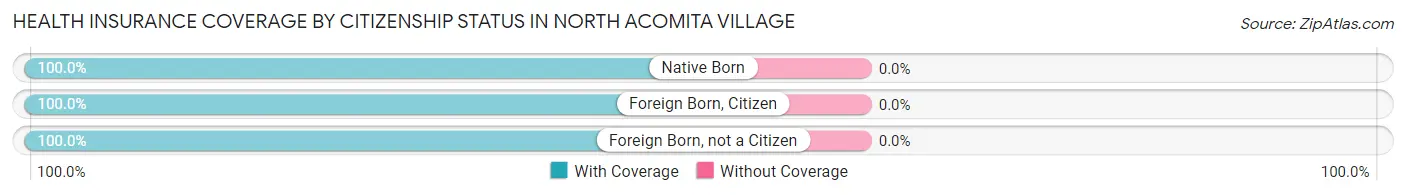
| Citizenship Status | With Coverage | Without Coverage |
| Native Born | 9 (100.0%) | 0 (0.0%) |
| Foreign Born, Citizen | 25 (100.0%) | 0 (0.0%) |
| Foreign Born, not a Citizen | 31 (100.0%) | 0 (0.0%) |
Health Insurance Coverage by Household Income in North Acomita Village
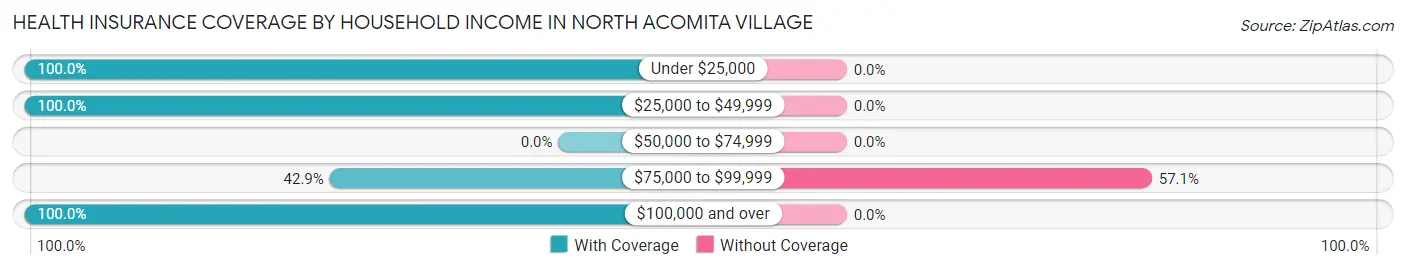
| Household Income | With Coverage | Without Coverage |
| Under $25,000 | 8 (100.0%) | 0 (0.0%) |
| $25,000 to $49,999 | 130 (100.0%) | 0 (0.0%) |
| $50,000 to $74,999 | 0 (0.0%) | 0 (0.0%) |
| $75,000 to $99,999 | 21 (42.9%) | 28 (57.1%) |
| $100,000 and over | 14 (100.0%) | 0 (0.0%) |
Public vs Private Health Insurance Coverage by Age in North Acomita Village
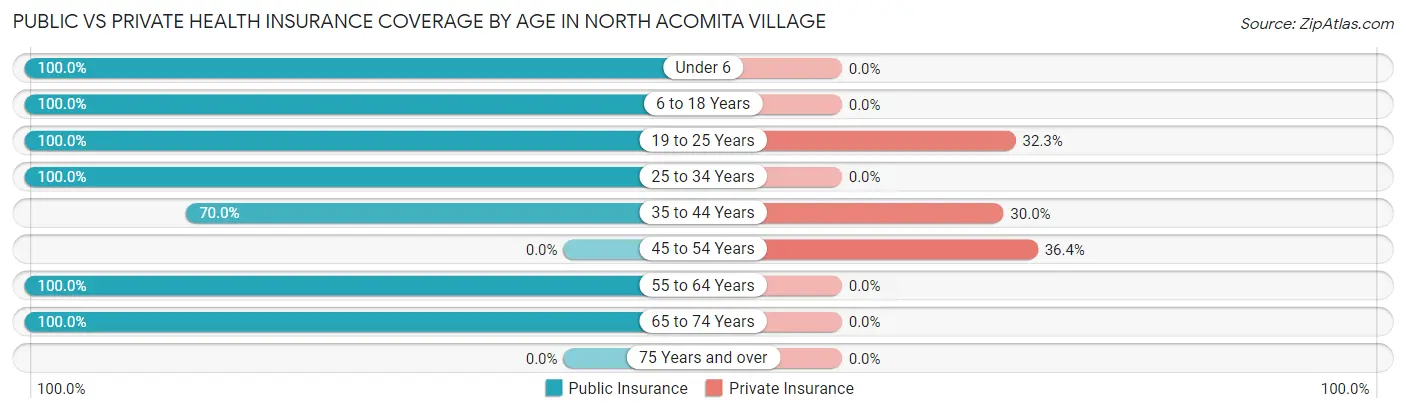
| Age Bracket | Public Insurance | Private Insurance |
| Under 6 | 9 (100.0%) | 0 (0.0%) |
| 6 to 18 Years | 25 (100.0%) | 0 (0.0%) |
| 19 to 25 Years | 31 (100.0%) | 10 (32.3%) |
| 25 to 34 Years | 9 (100.0%) | 0 (0.0%) |
| 35 to 44 Years | 35 (70.0%) | 15 (30.0%) |
| 45 to 54 Years | 0 (0.0%) | 16 (36.4%) |
| 55 to 64 Years | 21 (100.0%) | 0 (0.0%) |
| 65 to 74 Years | 12 (100.0%) | 0 (0.0%) |
| 75 Years and over | 0 (0.0%) | 0 (0.0%) |
| Total | 142 (70.7%) | 41 (20.4%) |
Disability Status by Sex by Age in North Acomita Village
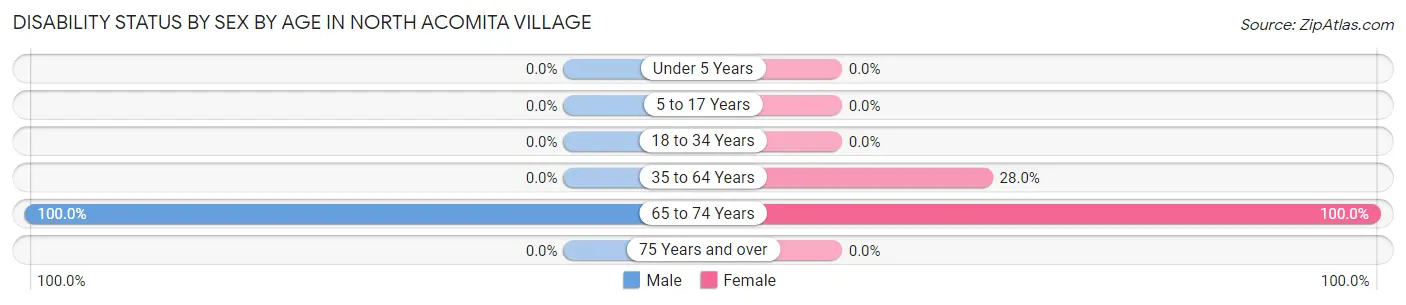
| Age Bracket | Male | Female |
| Under 5 Years | 0 (0.0%) | 0 (0.0%) |
| 5 to 17 Years | 0 (0.0%) | 0 (0.0%) |
| 18 to 34 Years | 0 (0.0%) | 0 (0.0%) |
| 35 to 64 Years | 0 (0.0%) | 21 (28.0%) |
| 65 to 74 Years | 6 (100.0%) | 6 (100.0%) |
| 75 Years and over | 0 (0.0%) | 0 (0.0%) |
Disability Class by Sex by Age in North Acomita Village
Disability Class: Hearing Difficulty
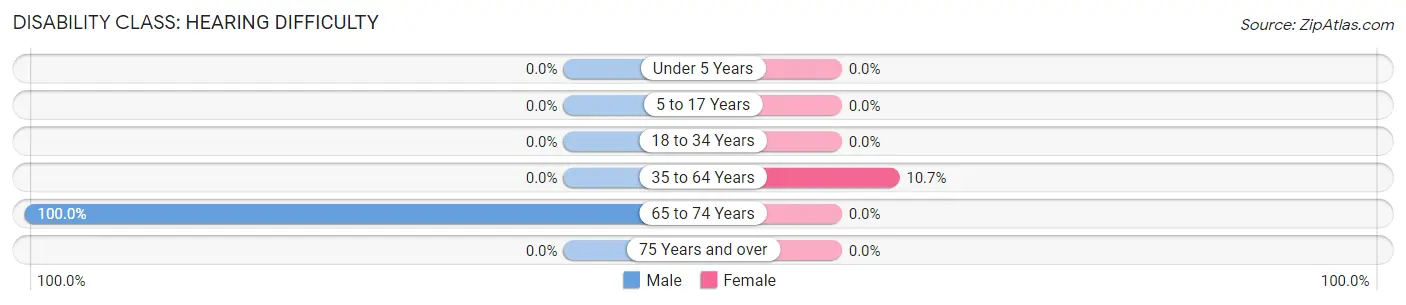
| Age Bracket | Male | Female |
| Under 5 Years | 0 (0.0%) | 0 (0.0%) |
| 5 to 17 Years | 0 (0.0%) | 0 (0.0%) |
| 18 to 34 Years | 0 (0.0%) | 0 (0.0%) |
| 35 to 64 Years | 0 (0.0%) | 8 (10.7%) |
| 65 to 74 Years | 6 (100.0%) | 0 (0.0%) |
| 75 Years and over | 0 (0.0%) | 0 (0.0%) |
Disability Class: Vision Difficulty
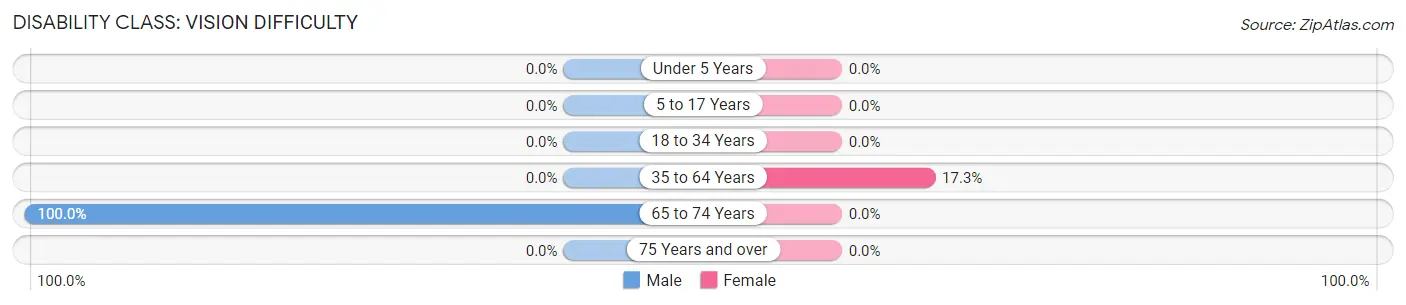
| Age Bracket | Male | Female |
| Under 5 Years | 0 (0.0%) | 0 (0.0%) |
| 5 to 17 Years | 0 (0.0%) | 0 (0.0%) |
| 18 to 34 Years | 0 (0.0%) | 0 (0.0%) |
| 35 to 64 Years | 0 (0.0%) | 13 (17.3%) |
| 65 to 74 Years | 6 (100.0%) | 0 (0.0%) |
| 75 Years and over | 0 (0.0%) | 0 (0.0%) |
Disability Class: Cognitive Difficulty
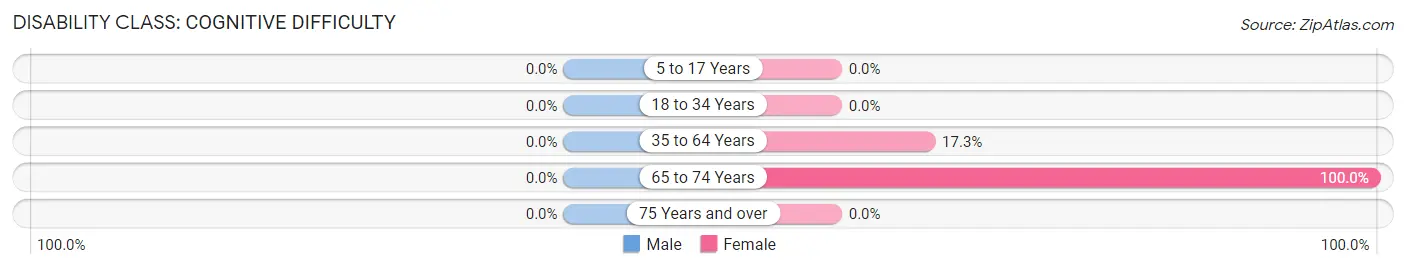
| Age Bracket | Male | Female |
| 5 to 17 Years | 0 (0.0%) | 0 (0.0%) |
| 18 to 34 Years | 0 (0.0%) | 0 (0.0%) |
| 35 to 64 Years | 0 (0.0%) | 13 (17.3%) |
| 65 to 74 Years | 0 (0.0%) | 6 (100.0%) |
| 75 Years and over | 0 (0.0%) | 0 (0.0%) |
Disability Class: Ambulatory Difficulty
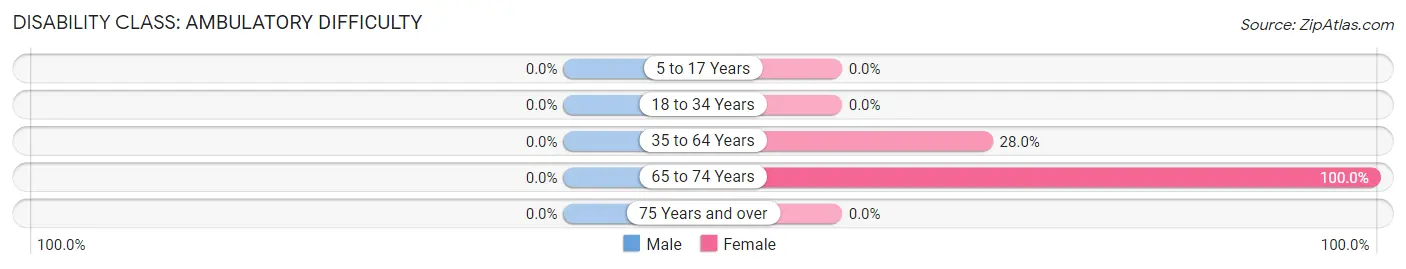
| Age Bracket | Male | Female |
| 5 to 17 Years | 0 (0.0%) | 0 (0.0%) |
| 18 to 34 Years | 0 (0.0%) | 0 (0.0%) |
| 35 to 64 Years | 0 (0.0%) | 21 (28.0%) |
| 65 to 74 Years | 0 (0.0%) | 6 (100.0%) |
| 75 Years and over | 0 (0.0%) | 0 (0.0%) |
Disability Class: Self-Care Difficulty
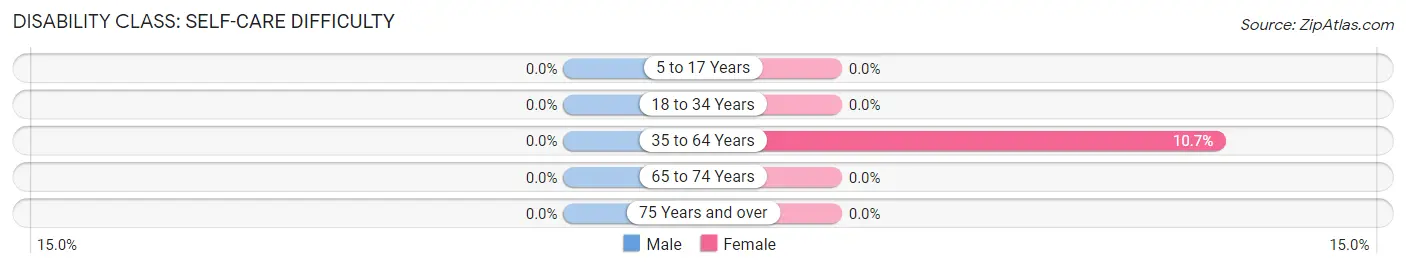
| Age Bracket | Male | Female |
| 5 to 17 Years | 0 (0.0%) | 0 (0.0%) |
| 18 to 34 Years | 0 (0.0%) | 0 (0.0%) |
| 35 to 64 Years | 0 (0.0%) | 8 (10.7%) |
| 65 to 74 Years | 0 (0.0%) | 0 (0.0%) |
| 75 Years and over | 0 (0.0%) | 0 (0.0%) |
Technology Access in North Acomita Village
Computing Device Access in North Acomita Village
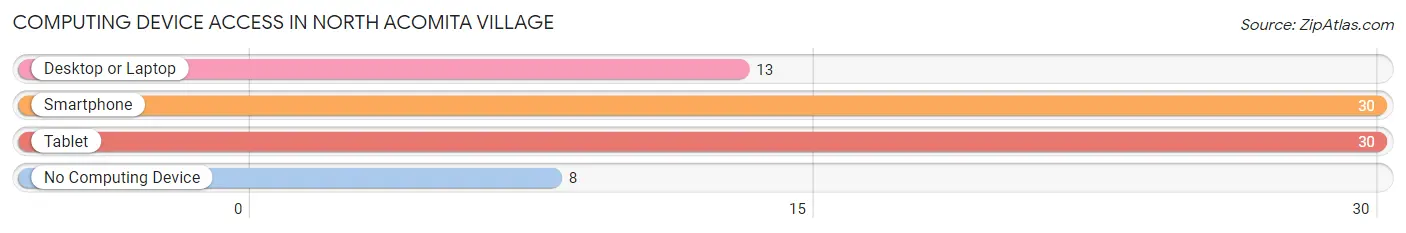
| Device Type | # Households | % Households |
| Desktop or Laptop | 13 | 34.2% |
| Smartphone | 30 | 78.9% |
| Tablet | 30 | 78.9% |
| No Computing Device | 8 | 21.0% |
| Total | 38 | 100.0% |
Internet Access in North Acomita Village
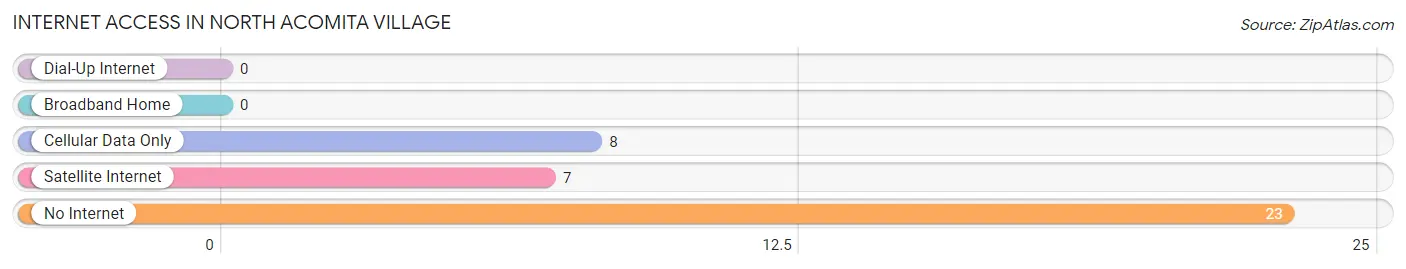
| Internet Type | # Households | % Households |
| Dial-Up Internet | 0 | 0.0% |
| Broadband Home | 0 | 0.0% |
| Cellular Data Only | 8 | 21.0% |
| Satellite Internet | 7 | 18.4% |
| No Internet | 23 | 60.5% |
| Total | 38 | 100.0% |
North Acomita Village Summary
North Acomita Village is a small unincorporated community located in Cibola County, New Mexico. It is situated in the western part of the state, approximately 25 miles south of Grants and 40 miles west of Albuquerque. The village is located on the Acoma Indian Reservation, which is home to the Acoma Pueblo people. The population of North Acomita Village was estimated to be 1,072 in 2019.
Geography
North Acomita Village is located in the western part of New Mexico, in Cibola County. It is situated on the Acoma Indian Reservation, which is located in the western part of the state, approximately 25 miles south of Grants and 40 miles west of Albuquerque. The village is located at an elevation of 5,890 feet above sea level. The climate in the area is semi-arid, with hot summers and cold winters.
The village is surrounded by the Acoma Indian Reservation, which covers an area of approximately 4,500 square miles. The reservation is home to the Acoma Pueblo people, who have lived in the area for centuries. The reservation is also home to a variety of wildlife, including deer, elk, antelope, and bighorn sheep.
History
North Acomita Village was established in the late 19th century by the Acoma Pueblo people. The village was originally known as Acomita, but the name was changed to North Acomita Village in the early 20th century. The village was established as a trading post for the Acoma Pueblo people, and it served as a hub for the local economy.
The village was also a center for religious and cultural activities for the Acoma Pueblo people. The village was home to a number of churches, including the San Esteban del Rey Mission, which was established in 1629. The mission was the first Catholic mission in the area, and it served as a center for religious and cultural activities for the Acoma Pueblo people.
Economy
The economy of North Acomita Village is largely based on tourism and agriculture. The village is home to a number of tourist attractions, including the Acoma Pueblo, which is a UNESCO World Heritage Site. The village is also home to a number of restaurants, shops, and other businesses.
Agriculture is also an important part of the local economy. The Acoma Pueblo people grow a variety of crops, including corn, beans, squash, and melons. Livestock is also raised in the area, including sheep, goats, and cattle.
Demographics
The population of North Acomita Village was estimated to be 1,072 in 2019. The majority of the population is Native American, with the Acoma Pueblo people making up the majority of the population. The village also has a small Hispanic population, as well as a small number of non-Hispanic whites.
The median household income in North Acomita Village is $25,000, which is lower than the national average. The poverty rate in the village is also higher than the national average, with approximately 33% of the population living below the poverty line.
Conclusion
North Acomita Village is a small unincorporated community located in Cibola County, New Mexico. It is situated on the Acoma Indian Reservation, which is home to the Acoma Pueblo people. The population of North Acomita Village was estimated to be 1,072 in 2019. The economy of the village is largely based on tourism and agriculture, with the Acoma Pueblo people growing a variety of crops and raising livestock. The majority of the population is Native American, with the Acoma Pueblo people making up the majority of the population. The median household income in North Acomita Village is $25,000, which is lower than the national average.
Common Questions
What is Per Capita Income in North Acomita Village?
Per Capita income in North Acomita Village is $11,086.
What is Inequality or Gini Index in North Acomita Village?
Inequality or Gini Index in North Acomita Village is 0.39.
What is the Total Population of North Acomita Village?
Total Population of North Acomita Village is 229.
What is the Total Male Population of North Acomita Village?
Total Male Population of North Acomita Village is 73.
What is the Total Female Population of North Acomita Village?
Total Female Population of North Acomita Village is 156.
What is the Ratio of Males per 100 Females in North Acomita Village?
There are 46.79 Males per 100 Females in North Acomita Village.
What is the Ratio of Females per 100 Males in North Acomita Village?
There are 213.70 Females per 100 Males in North Acomita Village.
What is the Median Population Age in North Acomita Village?
Median Population Age in North Acomita Village is 38.3 Years.
What is the Average Family Size in North Acomita Village
Average Family Size in North Acomita Village is 6.4 People.
What is the Average Household Size in North Acomita Village
Average Household Size in North Acomita Village is 5.3 People.
How Large is the Labor Force in North Acomita Village?
There are 79 People in the Labor Forcein in North Acomita Village.
What is the Percentage of People in the Labor Force in North Acomita Village?
43.6% of People are in the Labor Force in North Acomita Village.
What is the Unemployment Rate in North Acomita Village?
Unemployment Rate in North Acomita Village is 11.4%.