Sabana, PR Map & Demographics
Sabana Map
Sabana Overview
$7,611
PER CAPITA INCOME
$18,906
AVG FAMILY INCOME
$17,422
AVG HOUSEHOLD INCOME
0.34
INEQUALITY / GINI INDEX
965
TOTAL POPULATION
475
MALE POPULATION
490
FEMALE POPULATION
96.94
MALES / 100 FEMALES
103.16
FEMALES / 100 MALES
33.7
MEDIAN AGE
3.7
AVG FAMILY SIZE
3.2
AVG HOUSEHOLD SIZE
328
LABOR FORCE [ PEOPLE ]
42.3%
PERCENT IN LABOR FORCE
21.6%
UNEMPLOYMENT RATE
Income in Sabana
Income Overview in Sabana
Per Capita Income in Sabana is $7,611, while median incomes of families and households are $18,906 and $17,422 respectively.
| Characteristic | Number | Measure |
| Per Capita Income | 965 | $7,611 |
| Median Family Income | 218 | $18,906 |
| Mean Family Income | 218 | $21,521 |
| Median Household Income | 303 | $17,422 |
| Mean Household Income | 303 | $21,077 |
| Income Deficit | 218 | $0 |
| Wage / Income Gap (%) | 965 | 0.00% |
| Wage / Income Gap ($) | 965 | 100.00¢ per $1 |
| Gini / Inequality Index | 965 | 0.34 |
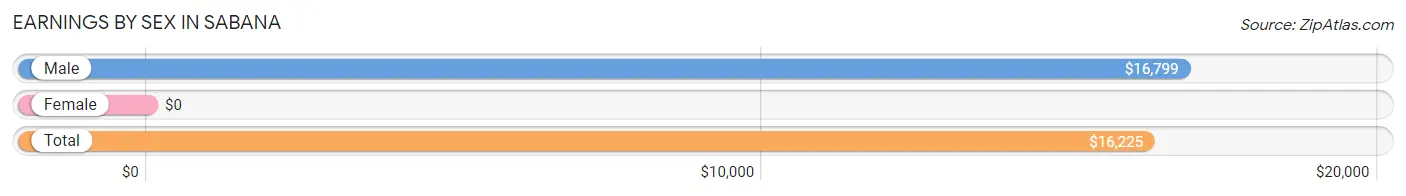
Earnings by Sex in Sabana
| Sex | Number | Average Earnings |
| Male | 239 (80.2%) | $16,799 |
| Female | 59 (19.8%) | $0 |
| Total | 298 (100.0%) | $16,225 |
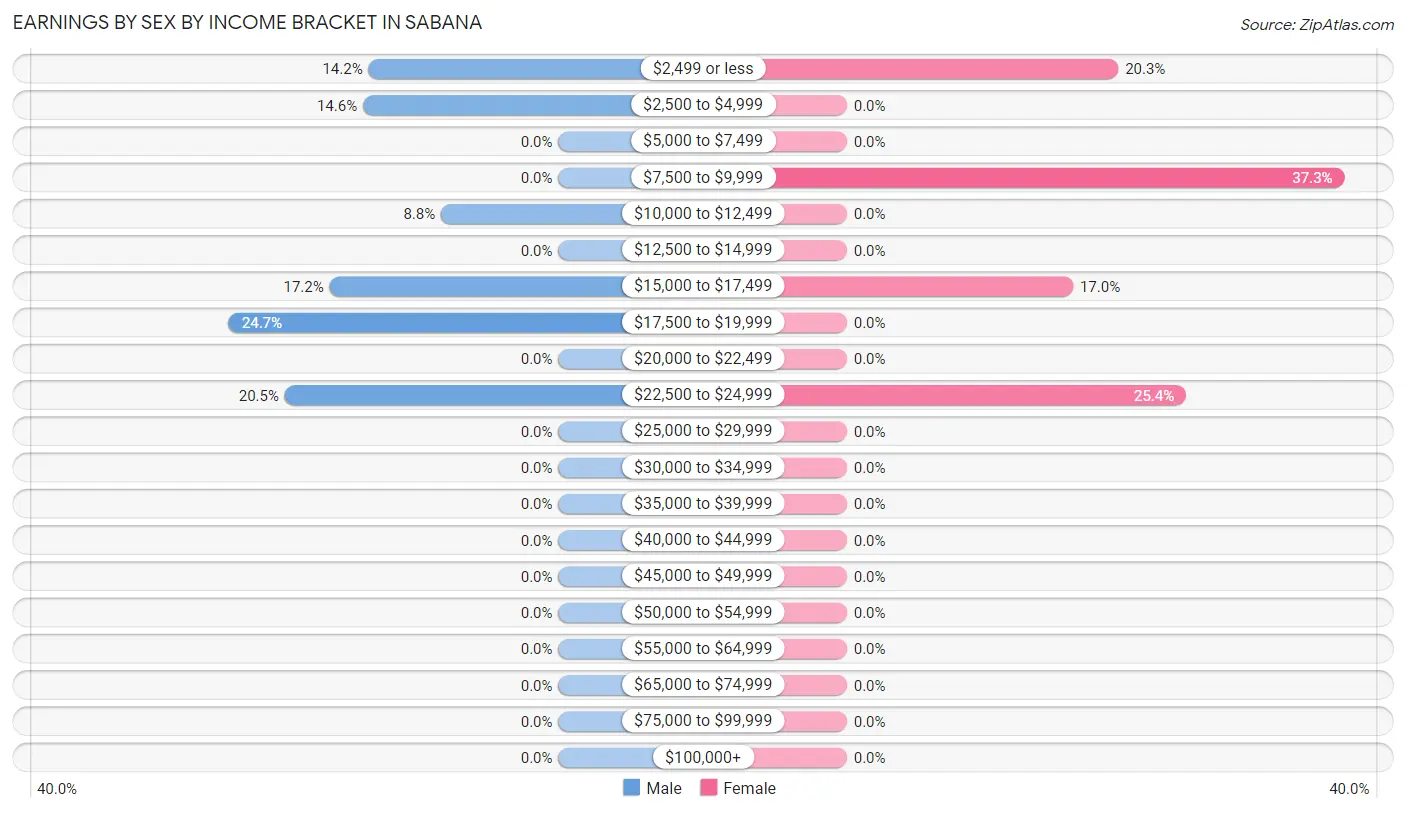
Earnings by Sex by Income Bracket in Sabana
The most common earnings brackets in Sabana are $17,500 to $19,999 for men (59 | 24.7%) and $7,500 to $9,999 for women (22 | 37.3%).
| Income | Male | Female |
| $2,499 or less | 34 (14.2%) | 12 (20.3%) |
| $2,500 to $4,999 | 35 (14.6%) | 0 (0.0%) |
| $5,000 to $7,499 | 0 (0.0%) | 0 (0.0%) |
| $7,500 to $9,999 | 0 (0.0%) | 22 (37.3%) |
| $10,000 to $12,499 | 21 (8.8%) | 0 (0.0%) |
| $12,500 to $14,999 | 0 (0.0%) | 0 (0.0%) |
| $15,000 to $17,499 | 41 (17.2%) | 10 (17.0%) |
| $17,500 to $19,999 | 59 (24.7%) | 0 (0.0%) |
| $20,000 to $22,499 | 0 (0.0%) | 0 (0.0%) |
| $22,500 to $24,999 | 49 (20.5%) | 15 (25.4%) |
| $25,000 to $29,999 | 0 (0.0%) | 0 (0.0%) |
| $30,000 to $34,999 | 0 (0.0%) | 0 (0.0%) |
| $35,000 to $39,999 | 0 (0.0%) | 0 (0.0%) |
| $40,000 to $44,999 | 0 (0.0%) | 0 (0.0%) |
| $45,000 to $49,999 | 0 (0.0%) | 0 (0.0%) |
| $50,000 to $54,999 | 0 (0.0%) | 0 (0.0%) |
| $55,000 to $64,999 | 0 (0.0%) | 0 (0.0%) |
| $65,000 to $74,999 | 0 (0.0%) | 0 (0.0%) |
| $75,000 to $99,999 | 0 (0.0%) | 0 (0.0%) |
| $100,000+ | 0 (0.0%) | 0 (0.0%) |
| Total | 239 (100.0%) | 59 (100.0%) |
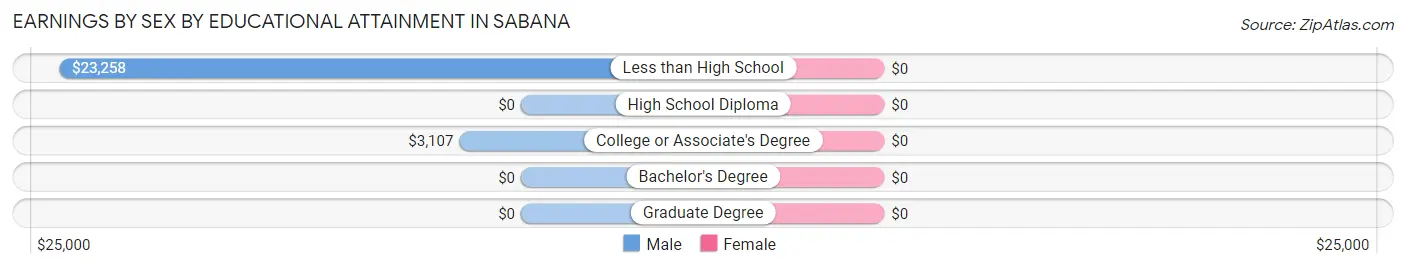
Earnings by Sex by Educational Attainment in Sabana
| Educational Attainment | Male Income | Female Income |
| Less than High School | $23,258 | $0 |
| High School Diploma | - | - |
| College or Associate's Degree | $3,107 | $0 |
| Bachelor's Degree | - | - |
| Graduate Degree | - | - |
| Total | $15,865 | $0 |
Family Income in Sabana
Family Income Brackets in Sabana
According to the Sabana family income data, there are 103 families falling into the $15,000 to $24,999 income range, which is the most common income bracket and makes up 47.2% of all families.
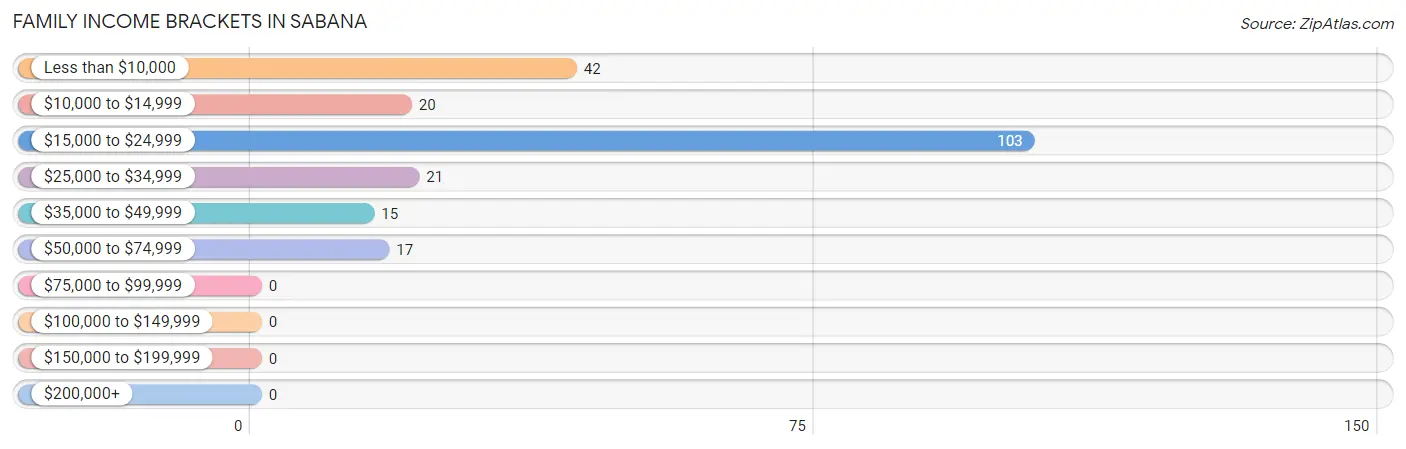
| Income Bracket | # Families | % Families |
| Less than $10,000 | 42 | 19.3% |
| $10,000 to $14,999 | 20 | 9.2% |
| $15,000 to $24,999 | 103 | 47.2% |
| $25,000 to $34,999 | 21 | 9.6% |
| $35,000 to $49,999 | 15 | 6.9% |
| $50,000 to $74,999 | 17 | 7.8% |
| $75,000 to $99,999 | 0 | 0.0% |
| $100,000 to $149,999 | 0 | 0.0% |
| $150,000 to $199,999 | 0 | 0.0% |
| $200,000+ | 0 | 0.0% |
Family Income by Famaliy Size in Sabana
2-person families (104 | 47.7%) account for the highest median family income in Sabana with $21,250 per family, while 2-person families (104 | 47.7%) have the highest median income of $10,625 per family member.
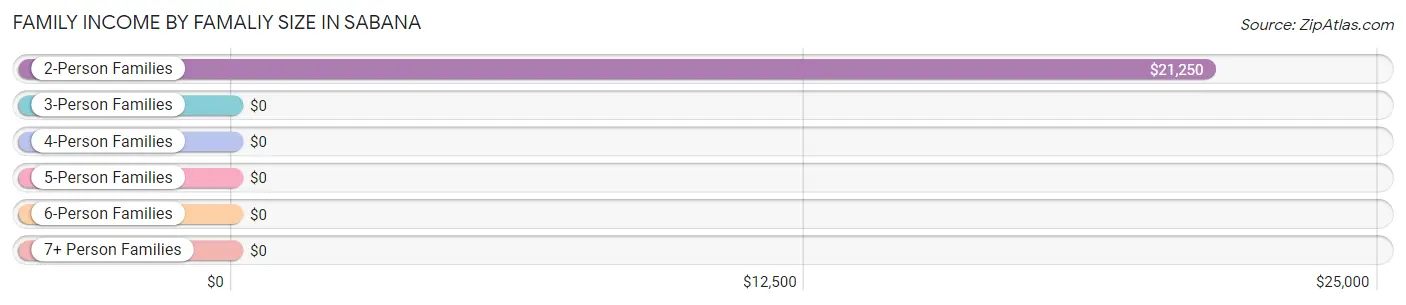
| Income Bracket | # Families | Median Income |
| 2-Person Families | 104 (47.7%) | $21,250 |
| 3-Person Families | 47 (21.6%) | $0 |
| 4-Person Families | 50 (22.9%) | $0 |
| 5-Person Families | 17 (7.8%) | $0 |
| 6-Person Families | 0 (0.0%) | $0 |
| 7+ Person Families | 0 (0.0%) | $0 |
| Total | 218 (100.0%) | $18,906 |
Family Income by Number of Earners in Sabana
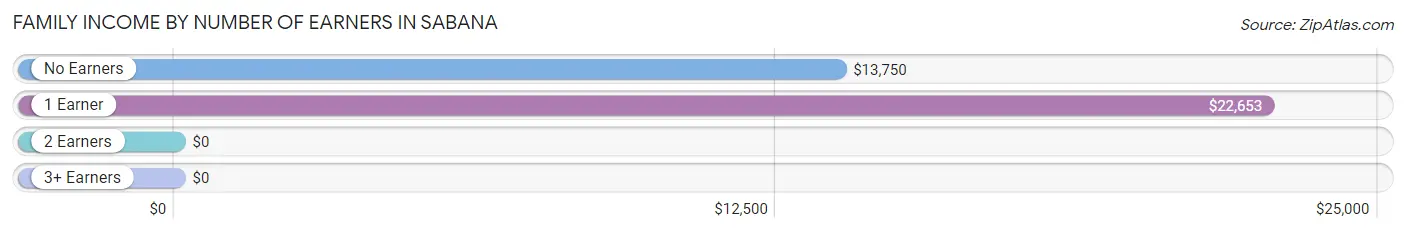
| Number of Earners | # Families | Median Income |
| No Earners | 52 (23.8%) | $13,750 |
| 1 Earner | 134 (61.5%) | $22,653 |
| 2 Earners | 32 (14.7%) | $0 |
| 3+ Earners | 0 (0.0%) | $0 |
| Total | 218 (100.0%) | $18,906 |
Household Income in Sabana
Household Income Brackets in Sabana
With 129 households falling in the category, the $15,000 to $24,999 income range is the most frequent in Sabana, accounting for 42.6% of all households.
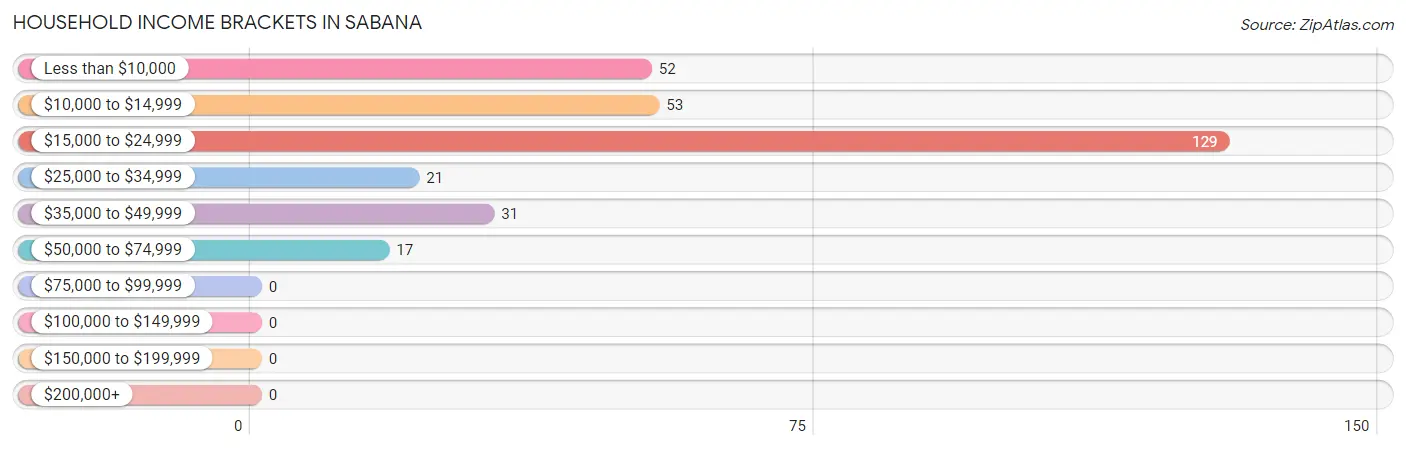
| Income Bracket | # Households | % Households |
| Less than $10,000 | 52 | 17.2% |
| $10,000 to $14,999 | 53 | 17.5% |
| $15,000 to $24,999 | 129 | 42.6% |
| $25,000 to $34,999 | 21 | 6.9% |
| $35,000 to $49,999 | 31 | 10.2% |
| $50,000 to $74,999 | 17 | 5.6% |
| $75,000 to $99,999 | 0 | 0.0% |
| $100,000 to $149,999 | 0 | 0.0% |
| $150,000 to $199,999 | 0 | 0.0% |
| $200,000+ | 0 | 0.0% |
Household Income by Householder Age in Sabana
The median household income in Sabana is $17,422, with the highest median household income of $23,561 found in the 25 to 44 years age bracket for the primary householder. A total of 70 households (23.1%) fall into this category. Meanwhile, the 15 to 24 years age bracket for the primary householder has the lowest median household income of $0, with 12 households (4.0%) in this group.
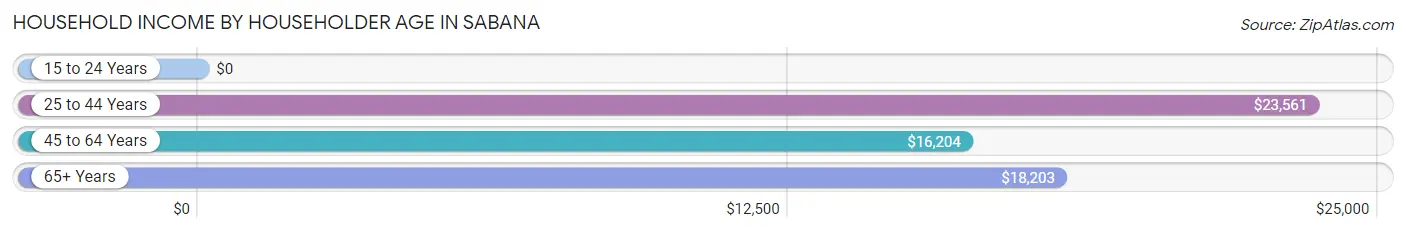
| Income Bracket | # Households | Median Income |
| 15 to 24 Years | 12 (4.0%) | $0 |
| 25 to 44 Years | 70 (23.1%) | $23,561 |
| 45 to 64 Years | 84 (27.7%) | $16,204 |
| 65+ Years | 137 (45.2%) | $18,203 |
| Total | 303 (100.0%) | $17,422 |
Poverty in Sabana
Income Below Poverty by Sex and Age in Sabana
With 67.8% poverty level for males and 65.9% for females among the residents of Sabana, 6 to 11 year old males and 5 year old females are the most vulnerable to poverty, with 19 males (100.0%) and 21 females (100.0%) in their respective age groups living below the poverty level.
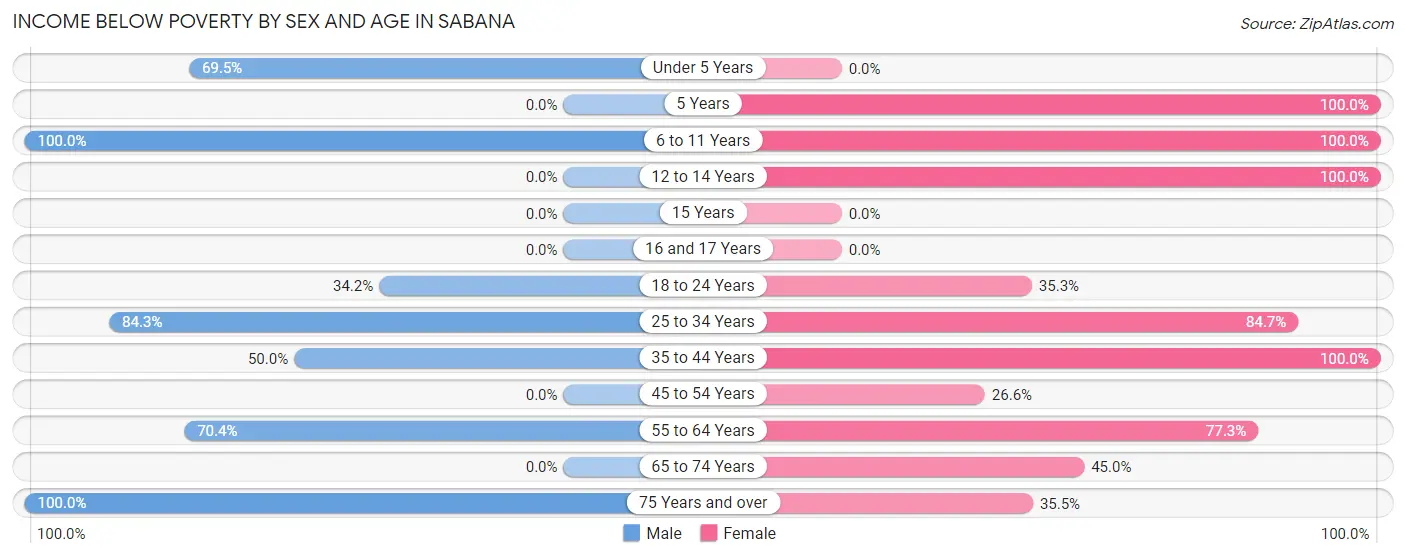
| Age Bracket | Male | Female |
| Under 5 Years | 41 (69.5%) | 0 (0.0%) |
| 5 Years | 0 (0.0%) | 21 (100.0%) |
| 6 to 11 Years | 19 (100.0%) | 34 (100.0%) |
| 12 to 14 Years | 0 (0.0%) | 57 (100.0%) |
| 15 Years | 0 (0.0%) | 0 (0.0%) |
| 16 and 17 Years | 0 (0.0%) | 0 (0.0%) |
| 18 to 24 Years | 26 (34.2%) | 12 (35.3%) |
| 25 to 34 Years | 86 (84.3%) | 83 (84.7%) |
| 35 to 44 Years | 37 (50.0%) | 16 (100.0%) |
| 45 to 54 Years | 0 (0.0%) | 17 (26.6%) |
| 55 to 64 Years | 76 (70.4%) | 34 (77.3%) |
| 65 to 74 Years | 0 (0.0%) | 27 (45.0%) |
| 75 Years and over | 37 (100.0%) | 22 (35.5%) |
| Total | 322 (67.8%) | 323 (65.9%) |
Income Above Poverty by Sex and Age in Sabana
According to the poverty statistics in Sabana, males aged 18 to 24 years and females aged 45 to 54 years are the age groups that are most secure financially, with 65.8% of males and 73.4% of females in these age groups living above the poverty line.
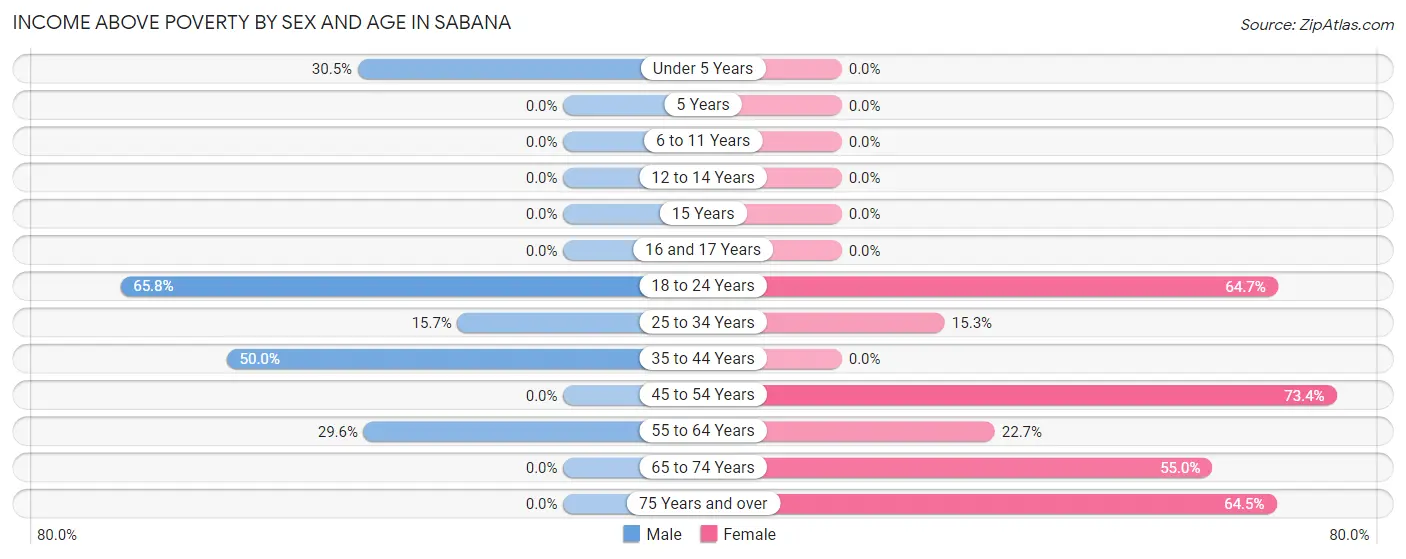
| Age Bracket | Male | Female |
| Under 5 Years | 18 (30.5%) | 0 (0.0%) |
| 5 Years | 0 (0.0%) | 0 (0.0%) |
| 6 to 11 Years | 0 (0.0%) | 0 (0.0%) |
| 12 to 14 Years | 0 (0.0%) | 0 (0.0%) |
| 15 Years | 0 (0.0%) | 0 (0.0%) |
| 16 and 17 Years | 0 (0.0%) | 0 (0.0%) |
| 18 to 24 Years | 50 (65.8%) | 22 (64.7%) |
| 25 to 34 Years | 16 (15.7%) | 15 (15.3%) |
| 35 to 44 Years | 37 (50.0%) | 0 (0.0%) |
| 45 to 54 Years | 0 (0.0%) | 47 (73.4%) |
| 55 to 64 Years | 32 (29.6%) | 10 (22.7%) |
| 65 to 74 Years | 0 (0.0%) | 33 (55.0%) |
| 75 Years and over | 0 (0.0%) | 40 (64.5%) |
| Total | 153 (32.2%) | 167 (34.1%) |
Income Below Poverty Among Married-Couple Families in Sabana
The poverty statistics for married-couple families in Sabana show that 100.0% or 88 of the total 88 families live below the poverty line. Families with no children have the highest poverty rate of 100.0%, comprising of 34 families. On the other hand, families with no children have the lowest poverty rate of 100.0%, which includes 34 families.
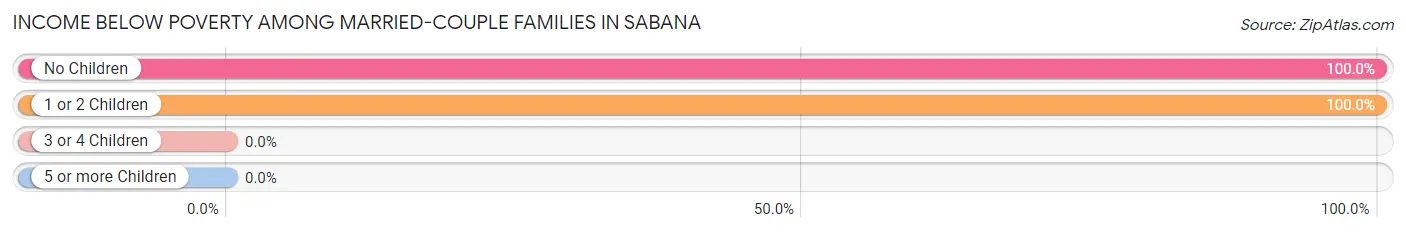
| Children | Above Poverty | Below Poverty |
| No Children | 0 (0.0%) | 34 (100.0%) |
| 1 or 2 Children | 0 (0.0%) | 54 (100.0%) |
| 3 or 4 Children | 0 (0.0%) | 0 (0.0%) |
| 5 or more Children | 0 (0.0%) | 0 (0.0%) |
| Total | 0 (0.0%) | 88 (100.0%) |
Income Below Poverty Among Single-Parent Households in Sabana
According to the poverty data in Sabana, 51.5% or 17 single-father households and 28.9% or 28 single-mother households are living below the poverty line. Among single-father households, those with 3 or 4 children have the highest poverty rate, with 17 households (100.0%) experiencing poverty. Likewise, among single-mother households, those with 1 or 2 children have the highest poverty rate, with 12 households (100.0%) falling below the poverty line.
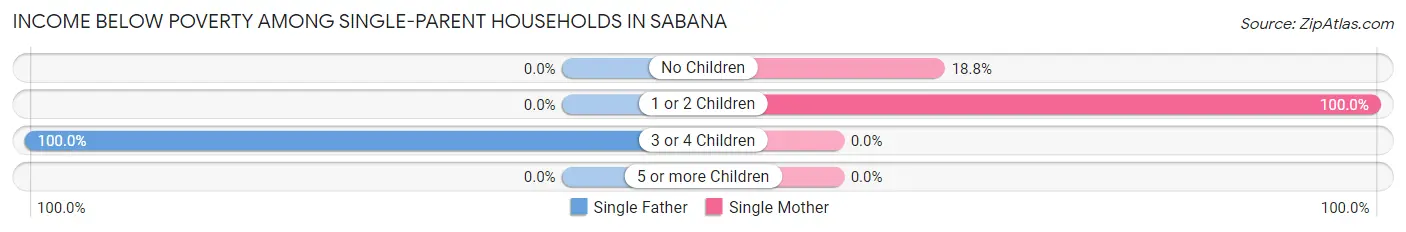
| Children | Single Father | Single Mother |
| No Children | 0 (0.0%) | 16 (18.8%) |
| 1 or 2 Children | 0 (0.0%) | 12 (100.0%) |
| 3 or 4 Children | 17 (100.0%) | 0 (0.0%) |
| 5 or more Children | 0 (0.0%) | 0 (0.0%) |
| Total | 17 (51.5%) | 28 (28.9%) |
Income Below Poverty Among Married-Couple vs Single-Parent Households in Sabana
The poverty data for Sabana shows that 88 of the married-couple family households (100.0%) and 45 of the single-parent households (34.6%) are living below the poverty level. Within the married-couple family households, those with no children have the highest poverty rate, with 34 households (100.0%) falling below the poverty line. Among the single-parent households, those with 3 or 4 children have the highest poverty rate, with 17 household (100.0%) living below poverty.
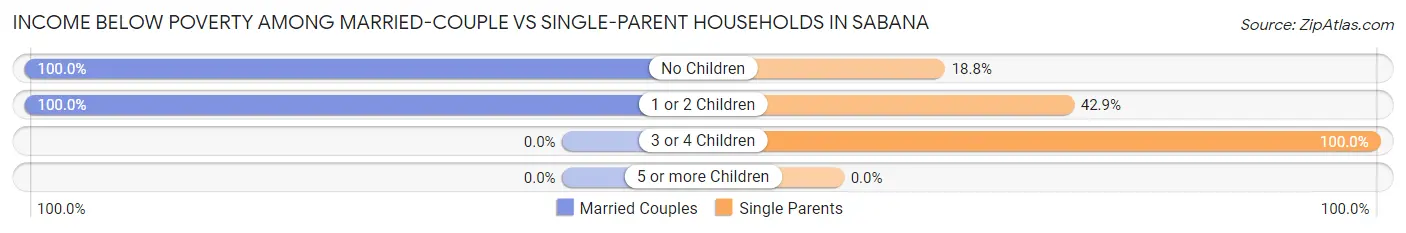
| Children | Married-Couple Families | Single-Parent Households |
| No Children | 34 (100.0%) | 16 (18.8%) |
| 1 or 2 Children | 54 (100.0%) | 12 (42.9%) |
| 3 or 4 Children | 0 (0.0%) | 17 (100.0%) |
| 5 or more Children | 0 (0.0%) | 0 (0.0%) |
| Total | 88 (100.0%) | 45 (34.6%) |
Race in Sabana
The most populous races in Sabana are Hispanic or Latino (878 | 91.0%), Some other Race (443 | 45.9%), and Two or more Races (260 | 26.9%).
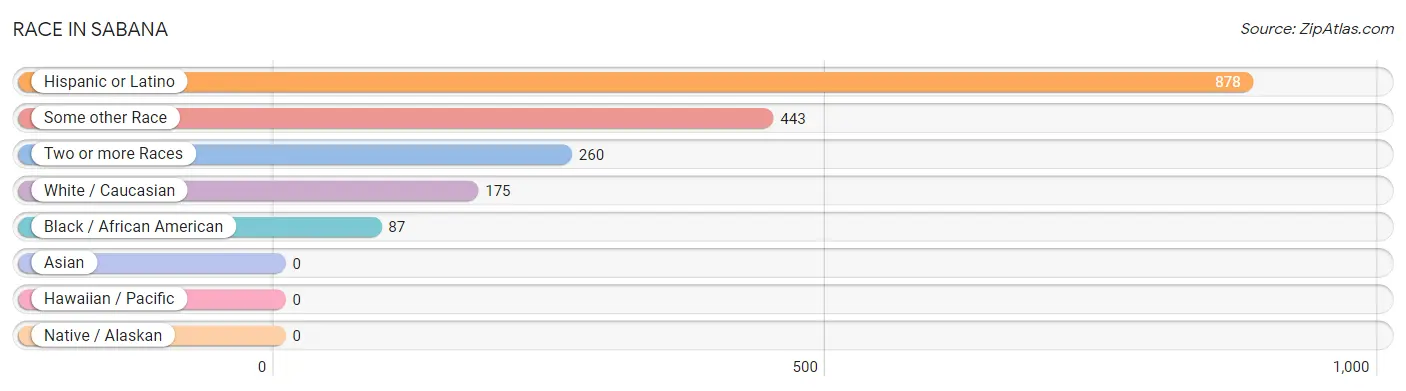
| Race | # Population | % Population |
| Asian | 0 | 0.0% |
| Black / African American | 87 | 9.0% |
| Hawaiian / Pacific | 0 | 0.0% |
| Hispanic or Latino | 878 | 91.0% |
| Native / Alaskan | 0 | 0.0% |
| White / Caucasian | 175 | 18.1% |
| Two or more Races | 260 | 26.9% |
| Some other Race | 443 | 45.9% |
| Total | 965 | 100.0% |
Ancestry in Sabana
The most populous ancestries reported in Sabana are Puerto Rican (878 | 91.0%), and American (15 | 1.5%), together accounting for 92.5% of all Sabana residents.
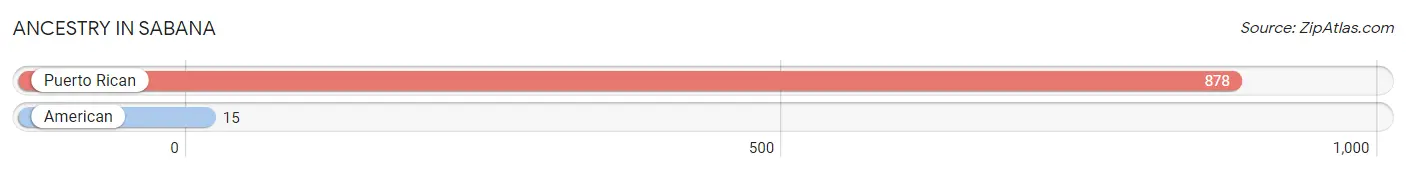
| Ancestry | # Population | % Population |
| American | 15 | 1.5% |
| Puerto Rican | 878 | 91.0% | View All 2 Rows |
Immigrants in Sabana

| Immigration Origin | # Population | % Population | View All 0 Rows |
Sex and Age in Sabana
Sex and Age in Sabana
The most populous age groups in Sabana are 20 to 24 Years (76 | 16.0%) for men and 10 to 14 Years (74 | 15.1%) for women.
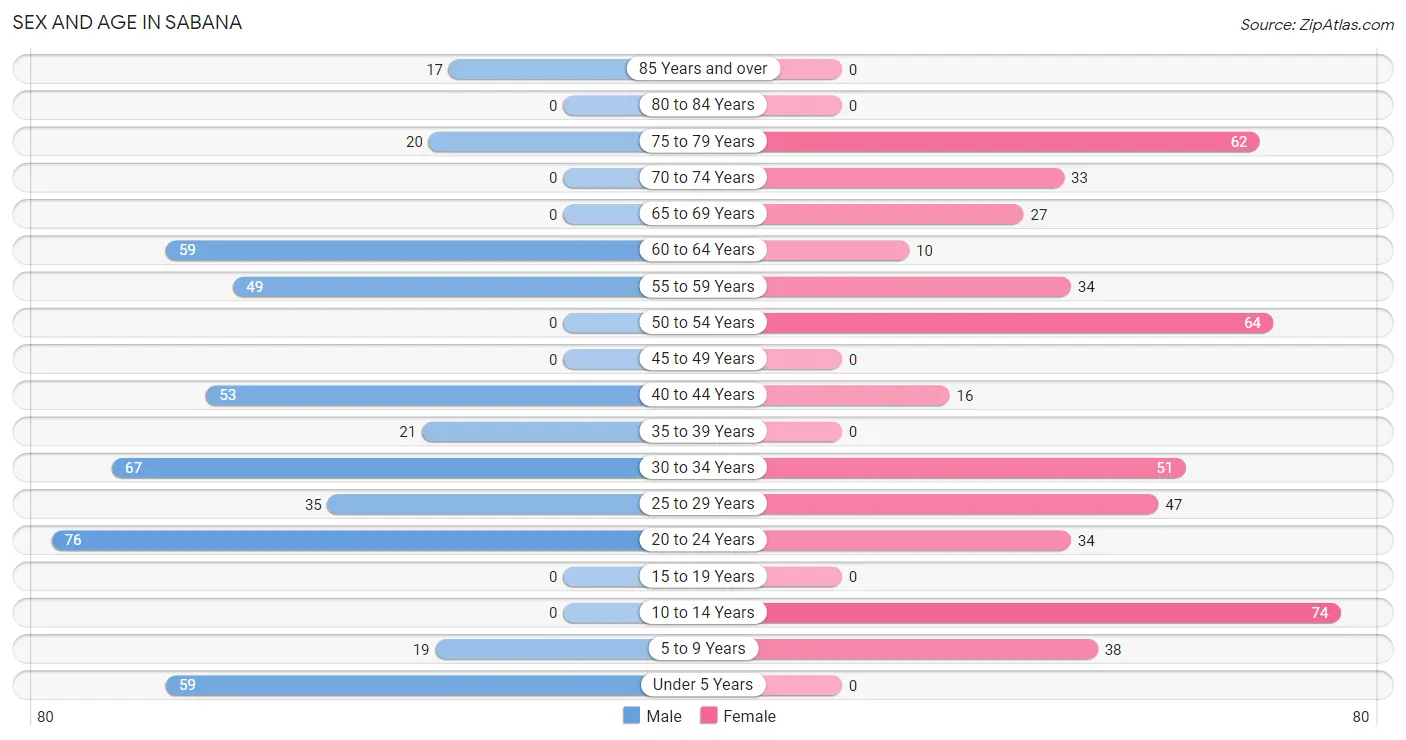
| Age Bracket | Male | Female |
| Under 5 Years | 59 (12.4%) | 0 (0.0%) |
| 5 to 9 Years | 19 (4.0%) | 38 (7.8%) |
| 10 to 14 Years | 0 (0.0%) | 74 (15.1%) |
| 15 to 19 Years | 0 (0.0%) | 0 (0.0%) |
| 20 to 24 Years | 76 (16.0%) | 34 (6.9%) |
| 25 to 29 Years | 35 (7.4%) | 47 (9.6%) |
| 30 to 34 Years | 67 (14.1%) | 51 (10.4%) |
| 35 to 39 Years | 21 (4.4%) | 0 (0.0%) |
| 40 to 44 Years | 53 (11.2%) | 16 (3.3%) |
| 45 to 49 Years | 0 (0.0%) | 0 (0.0%) |
| 50 to 54 Years | 0 (0.0%) | 64 (13.1%) |
| 55 to 59 Years | 49 (10.3%) | 34 (6.9%) |
| 60 to 64 Years | 59 (12.4%) | 10 (2.0%) |
| 65 to 69 Years | 0 (0.0%) | 27 (5.5%) |
| 70 to 74 Years | 0 (0.0%) | 33 (6.7%) |
| 75 to 79 Years | 20 (4.2%) | 62 (12.7%) |
| 80 to 84 Years | 0 (0.0%) | 0 (0.0%) |
| 85 Years and over | 17 (3.6%) | 0 (0.0%) |
| Total | 475 (100.0%) | 490 (100.0%) |
Families and Households in Sabana
Median Family Size in Sabana
The median family size in Sabana is 3.72 persons per family, with married-couple families (88 | 40.4%) accounting for the largest median family size of 4.17 persons per family. On the other hand, single male/father families (33 | 15.1%) represent the smallest median family size with 3.12 persons per family.
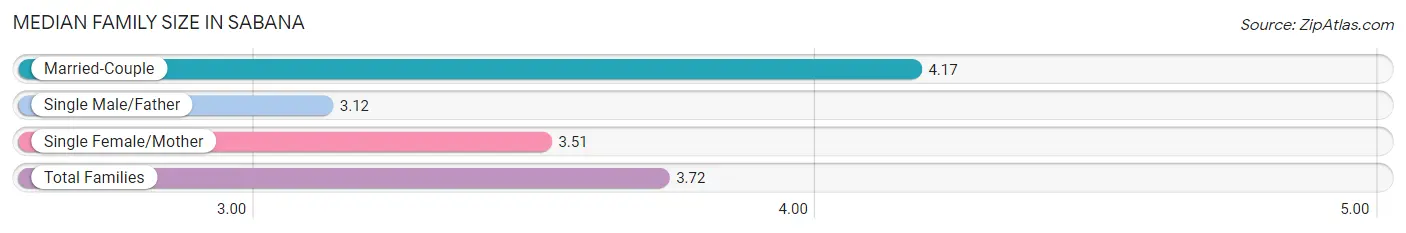
| Family Type | # Families | Family Size |
| Married-Couple | 88 (40.4%) | 4.17 |
| Single Male/Father | 33 (15.1%) | 3.12 |
| Single Female/Mother | 97 (44.5%) | 3.51 |
| Total Families | 218 (100.0%) | 3.72 |
Median Household Size in Sabana
The median household size in Sabana is 3.18 persons per household, with single male/father households (33 | 10.9%) accounting for the largest median household size of 4.24 persons per household. non-family households (85 | 28.1%) represent the smallest median household size with 1.19 persons per household.
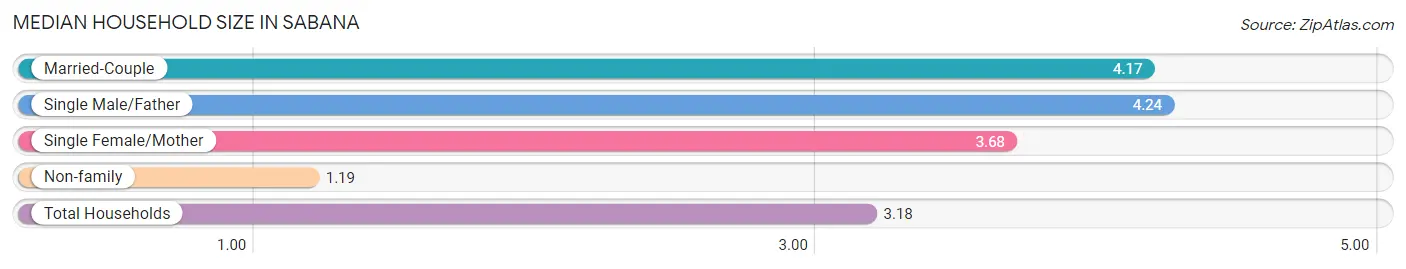
| Household Type | # Households | Household Size |
| Married-Couple | 88 (29.0%) | 4.17 |
| Single Male/Father | 33 (10.9%) | 4.24 |
| Single Female/Mother | 97 (32.0%) | 3.68 |
| Non-family | 85 (28.1%) | 1.19 |
| Total Households | 303 (100.0%) | 3.18 |
Household Size by Marriage Status in Sabana
Out of a total of 303 households in Sabana, 218 (72.0%) are family households, while 85 (28.1%) are nonfamily households. The most numerous type of family households are 3-person households, comprising 79, and the most common type of nonfamily households are 1-person households, comprising 72.
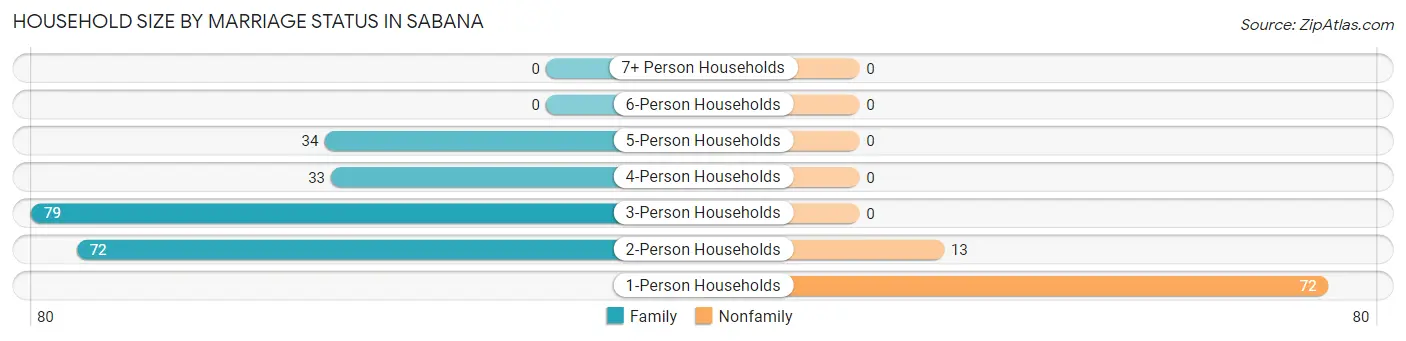
| Household Size | Family Households | Nonfamily Households |
| 1-Person Households | - | 72 (23.8%) |
| 2-Person Households | 72 (23.8%) | 13 (4.3%) |
| 3-Person Households | 79 (26.1%) | 0 (0.0%) |
| 4-Person Households | 33 (10.9%) | 0 (0.0%) |
| 5-Person Households | 34 (11.2%) | 0 (0.0%) |
| 6-Person Households | 0 (0.0%) | 0 (0.0%) |
| 7+ Person Households | 0 (0.0%) | 0 (0.0%) |
| Total | 218 (72.0%) | 85 (28.1%) |
Female Fertility in Sabana
Fertility by Age in Sabana
| Age Bracket | Women with Births | Births / 1,000 Women |
| 15 to 19 years | 0 (0.0%) | 0.0 |
| 20 to 34 years | 0 (0.0%) | 0.0 |
| 35 to 50 years | 0 (0.0%) | 0.0 |
| Total | 0 (0.0%) | 0.0 |
Fertility by Age by Marriage Status in Sabana
| Age Bracket | Married | Unmarried |
| 15 to 19 years | 0 (0.0%) | 0 (0.0%) |
| 20 to 34 years | 0 (0.0%) | 0 (0.0%) |
| 35 to 50 years | 0 (0.0%) | 0 (0.0%) |
| Total | 0 (0.0%) | 0 (0.0%) |
Fertility by Education in Sabana
| Educational Attainment | Women with Births | Births / 1,000 Women |
| Less than High School | 0 (0.0%) | 0.0 |
| High School Diploma | 0 (0.0%) | 0.0 |
| College or Associate's Degree | 0 (0.0%) | 0.0 |
| Bachelor's Degree | 0 (0.0%) | 0.0 |
| Graduate Degree | 0 (0.0%) | 0.0 |
| Total | 0 (0.0%) | 0.0 |
Fertility by Education by Marriage Status in Sabana
| Educational Attainment | Married | Unmarried |
| Less than High School | 0 (0.0%) | 0 (0.0%) |
| High School Diploma | 0 (0.0%) | 0 (0.0%) |
| College or Associate's Degree | 0 (0.0%) | 0 (0.0%) |
| Bachelor's Degree | 0 (0.0%) | 0 (0.0%) |
| Graduate Degree | 0 (0.0%) | 0 (0.0%) |
| Total | 0 (0.0%) | 0 (0.0%) |
Employment Characteristics in Sabana
Employment by Class of Employer in Sabana
Among the 257 employed individuals in Sabana, private company employees (140 | 54.5%), and self-employed (not incorporated) (117 | 45.5%) make up the most common classes of employment.
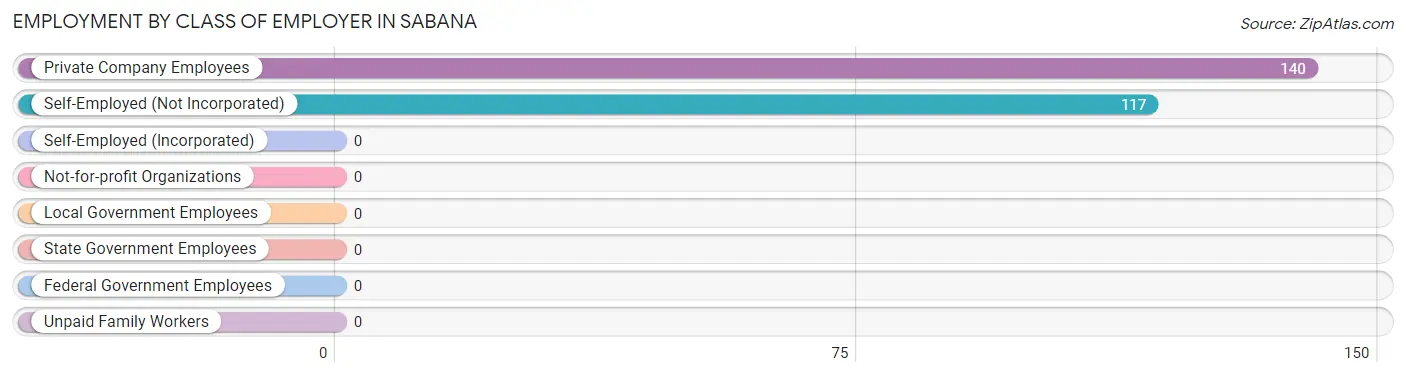
| Employer Class | # Employees | % Employees |
| Private Company Employees | 140 | 54.5% |
| Self-Employed (Incorporated) | 0 | 0.0% |
| Self-Employed (Not Incorporated) | 117 | 45.5% |
| Not-for-profit Organizations | 0 | 0.0% |
| Local Government Employees | 0 | 0.0% |
| State Government Employees | 0 | 0.0% |
| Federal Government Employees | 0 | 0.0% |
| Unpaid Family Workers | 0 | 0.0% |
| Total | 257 | 100.0% |
Employment Status by Age in Sabana
According to the labor force statistics for Sabana, out of the total population over 16 years of age (775), 42.3% or 328 individuals are in the labor force, with 21.6% or 71 of them unemployed. The age group with the highest labor force participation rate is 20 to 24 years, with 100.0% or 110 individuals in the labor force. Within the labor force, the 60 to 64 years age range has the highest percentage of unemployed individuals, with 63.0% or 17 of them being unemployed.
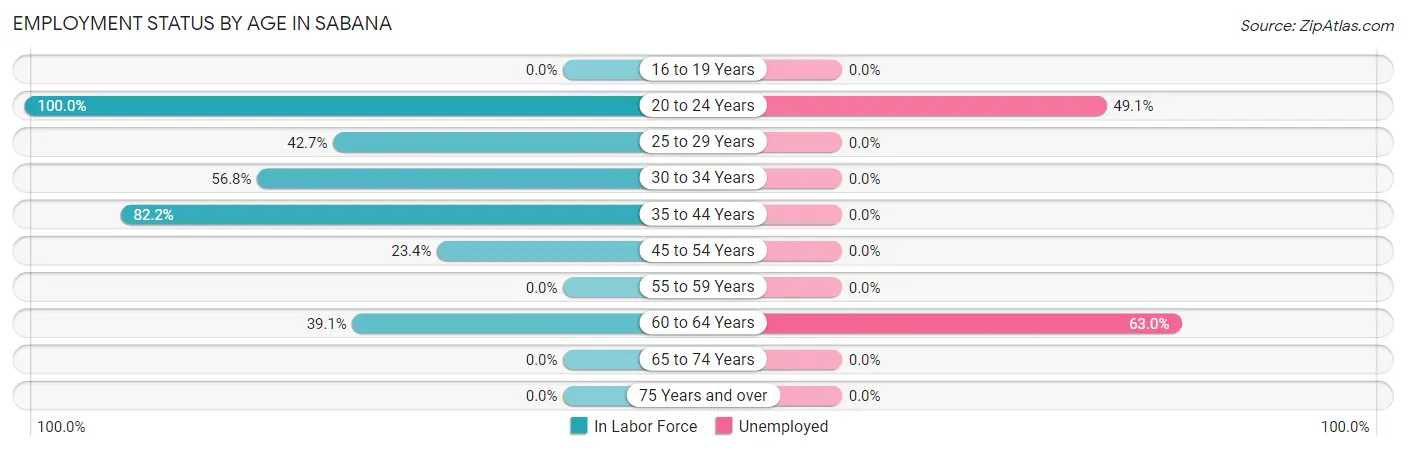
| Age Bracket | In Labor Force | Unemployed |
| 16 to 19 Years | 0 (0.0%) | 0 (0.0%) |
| 20 to 24 Years | 110 (100.0%) | 54 (49.1%) |
| 25 to 29 Years | 35 (42.7%) | 0 (0.0%) |
| 30 to 34 Years | 67 (56.8%) | 0 (0.0%) |
| 35 to 44 Years | 74 (82.2%) | 0 (0.0%) |
| 45 to 54 Years | 15 (23.4%) | 0 (0.0%) |
| 55 to 59 Years | 0 (0.0%) | 0 (0.0%) |
| 60 to 64 Years | 27 (39.1%) | 17 (63.0%) |
| 65 to 74 Years | 0 (0.0%) | 0 (0.0%) |
| 75 Years and over | 0 (0.0%) | 0 (0.0%) |
| Total | 328 (42.3%) | 71 (21.6%) |
Employment Status by Educational Attainment in Sabana
According to labor force statistics for Sabana, 43.1% of individuals (218) out of the total population between 25 and 64 years of age (506) are in the labor force, with 7.8% or 17 of them being unemployed. The group with the highest labor force participation rate are those with the educational attainment of college / associate degree, with 67.6% or 100 individuals in the labor force. Within the labor force, individuals with less than high school education have the highest percentage of unemployment, with 28.3% or 17 of them being unemployed.
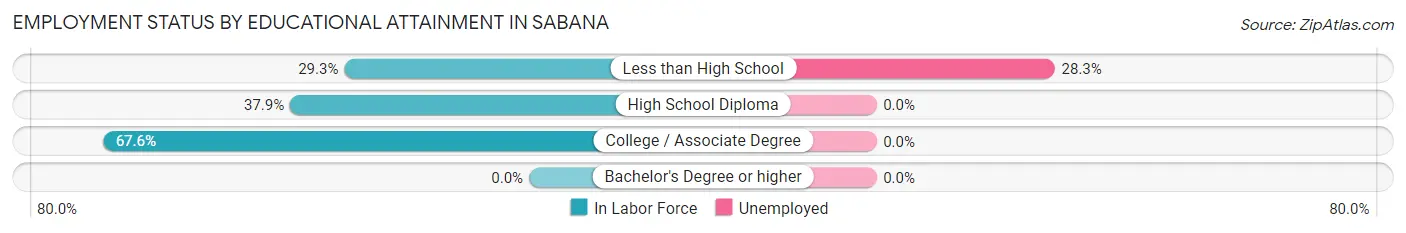
| Educational Attainment | In Labor Force | Unemployed |
| Less than High School | 60 (29.3%) | 58 (28.3%) |
| High School Diploma | 58 (37.9%) | 0 (0.0%) |
| College / Associate Degree | 100 (67.6%) | 0 (0.0%) |
| Bachelor's Degree or higher | 0 (0.0%) | 0 (0.0%) |
| Total | 218 (43.1%) | 39 (7.8%) |
Employment Occupations by Sex in Sabana
Management, Business, Science and Arts Occupations
Management, Business, Science and Arts Occupations by Sex
| Occupation | Male | Female |
| Management | 0 (0.0%) | 0 (0.0%) |
| Business & Financial | 0 (0.0%) | 0 (0.0%) |
| Computers, Engineering & Science | 0 (0.0%) | 0 (0.0%) |
| Computers & Mathematics | 0 (0.0%) | 0 (0.0%) |
| Architecture & Engineering | 0 (0.0%) | 0 (0.0%) |
| Life, Physical & Social Science | 0 (0.0%) | 0 (0.0%) |
| Community & Social Service | 0 (0.0%) | 0 (0.0%) |
| Education, Arts & Media | 0 (0.0%) | 0 (0.0%) |
| Legal Services & Support | 0 (0.0%) | 0 (0.0%) |
| Education Instruction & Library | 0 (0.0%) | 0 (0.0%) |
| Arts, Media & Entertainment | 0 (0.0%) | 0 (0.0%) |
| Health Diagnosing & Treating | 0 (0.0%) | 0 (0.0%) |
| Health Technologists | 0 (0.0%) | 0 (0.0%) |
| Total (Category) | 0 (0.0%) | 0 (0.0%) |
| Total (Overall) | 198 (77.0%) | 59 (23.0%) |
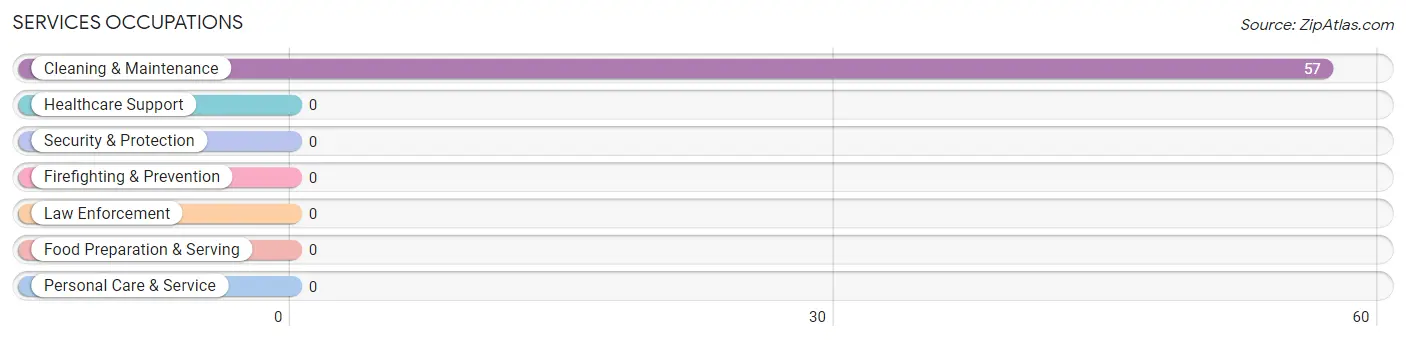
Services Occupations
The most common Services occupations in Sabana are , and Cleaning & Maintenance (57 | 22.2%).
Services Occupations by Sex
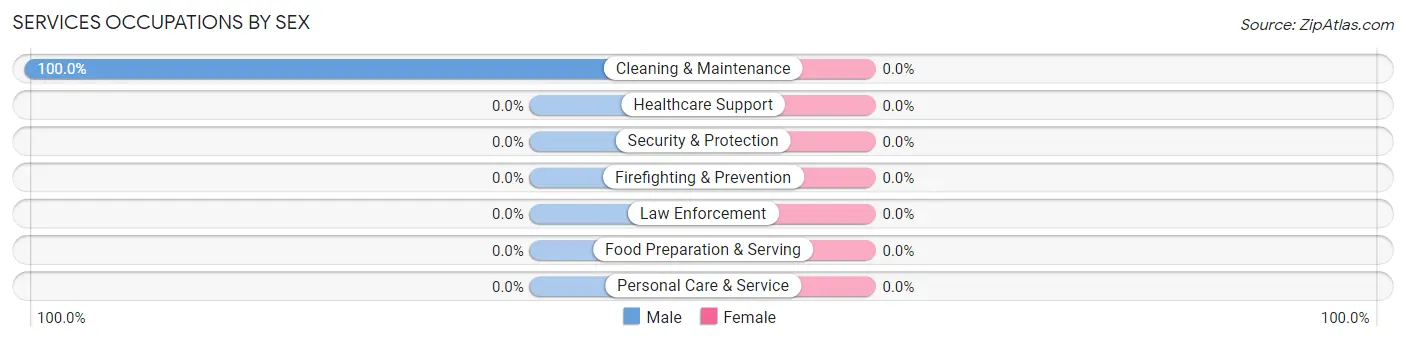
| Occupation | Male | Female |
| Healthcare Support | 0 (0.0%) | 0 (0.0%) |
| Security & Protection | 0 (0.0%) | 0 (0.0%) |
| Firefighting & Prevention | 0 (0.0%) | 0 (0.0%) |
| Law Enforcement | 0 (0.0%) | 0 (0.0%) |
| Food Preparation & Serving | 0 (0.0%) | 0 (0.0%) |
| Cleaning & Maintenance | 57 (100.0%) | 0 (0.0%) |
| Personal Care & Service | 0 (0.0%) | 0 (0.0%) |
| Total (Category) | 57 (100.0%) | 0 (0.0%) |
| Total (Overall) | 198 (77.0%) | 59 (23.0%) |
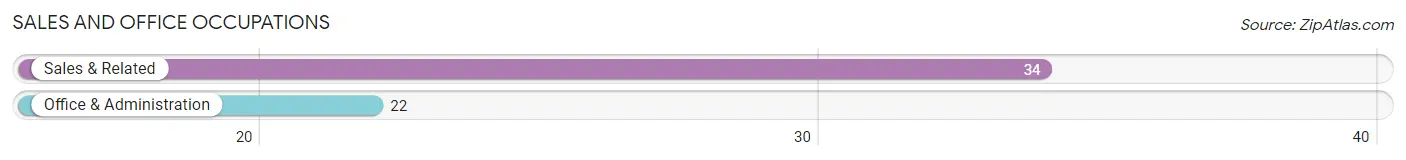
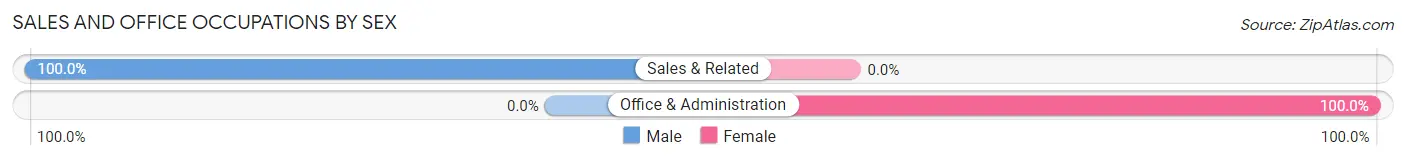
Sales and Office Occupations
The most common Sales and Office occupations in Sabana are Sales & Related (34 | 13.2%), and Office & Administration (22 | 8.6%).
Sales and Office Occupations by Sex
| Occupation | Male | Female |
| Sales & Related | 34 (100.0%) | 0 (0.0%) |
| Office & Administration | 0 (0.0%) | 22 (100.0%) |
| Total (Category) | 34 (60.7%) | 22 (39.3%) |
| Total (Overall) | 198 (77.0%) | 59 (23.0%) |
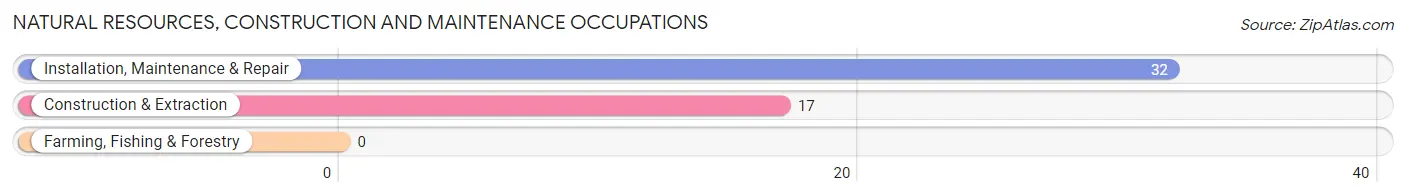
Natural Resources, Construction and Maintenance Occupations
The most common Natural Resources, Construction and Maintenance occupations in Sabana are Installation, Maintenance & Repair (32 | 12.4%), and Construction & Extraction (17 | 6.6%).
Natural Resources, Construction and Maintenance Occupations by Sex
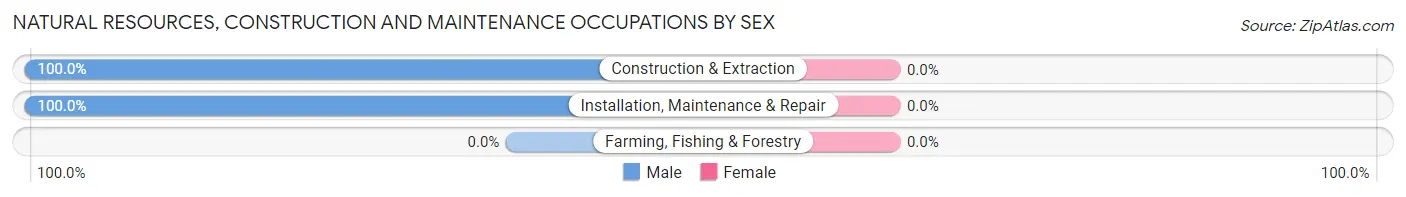
| Occupation | Male | Female |
| Farming, Fishing & Forestry | 0 (0.0%) | 0 (0.0%) |
| Construction & Extraction | 17 (100.0%) | 0 (0.0%) |
| Installation, Maintenance & Repair | 32 (100.0%) | 0 (0.0%) |
| Total (Category) | 49 (100.0%) | 0 (0.0%) |
| Total (Overall) | 198 (77.0%) | 59 (23.0%) |
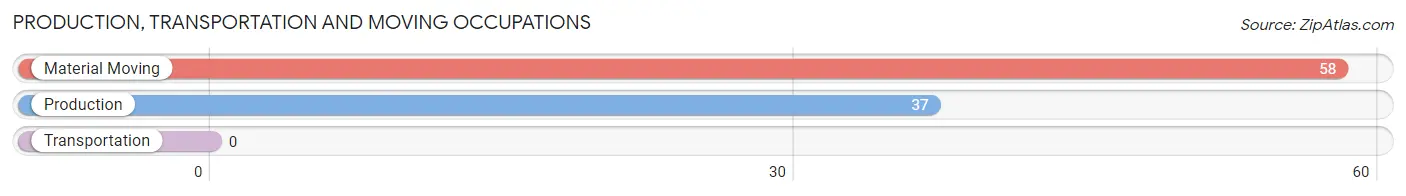
Production, Transportation and Moving Occupations
The most common Production, Transportation and Moving occupations in Sabana are Material Moving (58 | 22.6%), and Production (37 | 14.4%).
Production, Transportation and Moving Occupations by Sex
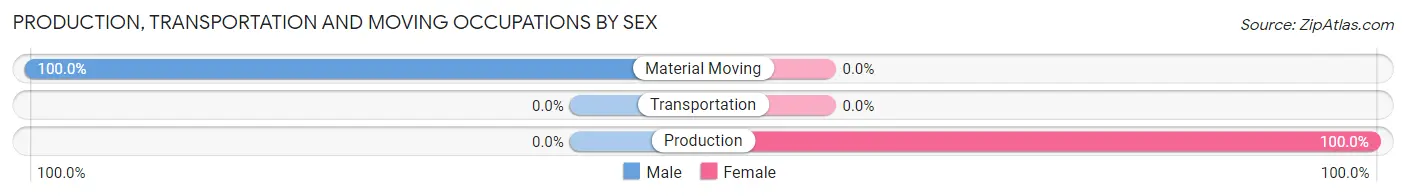
| Occupation | Male | Female |
| Production | 0 (0.0%) | 37 (100.0%) |
| Transportation | 0 (0.0%) | 0 (0.0%) |
| Material Moving | 58 (100.0%) | 0 (0.0%) |
| Total (Category) | 58 (61.1%) | 37 (39.0%) |
| Total (Overall) | 198 (77.0%) | 59 (23.0%) |
Employment Industries by Sex in Sabana
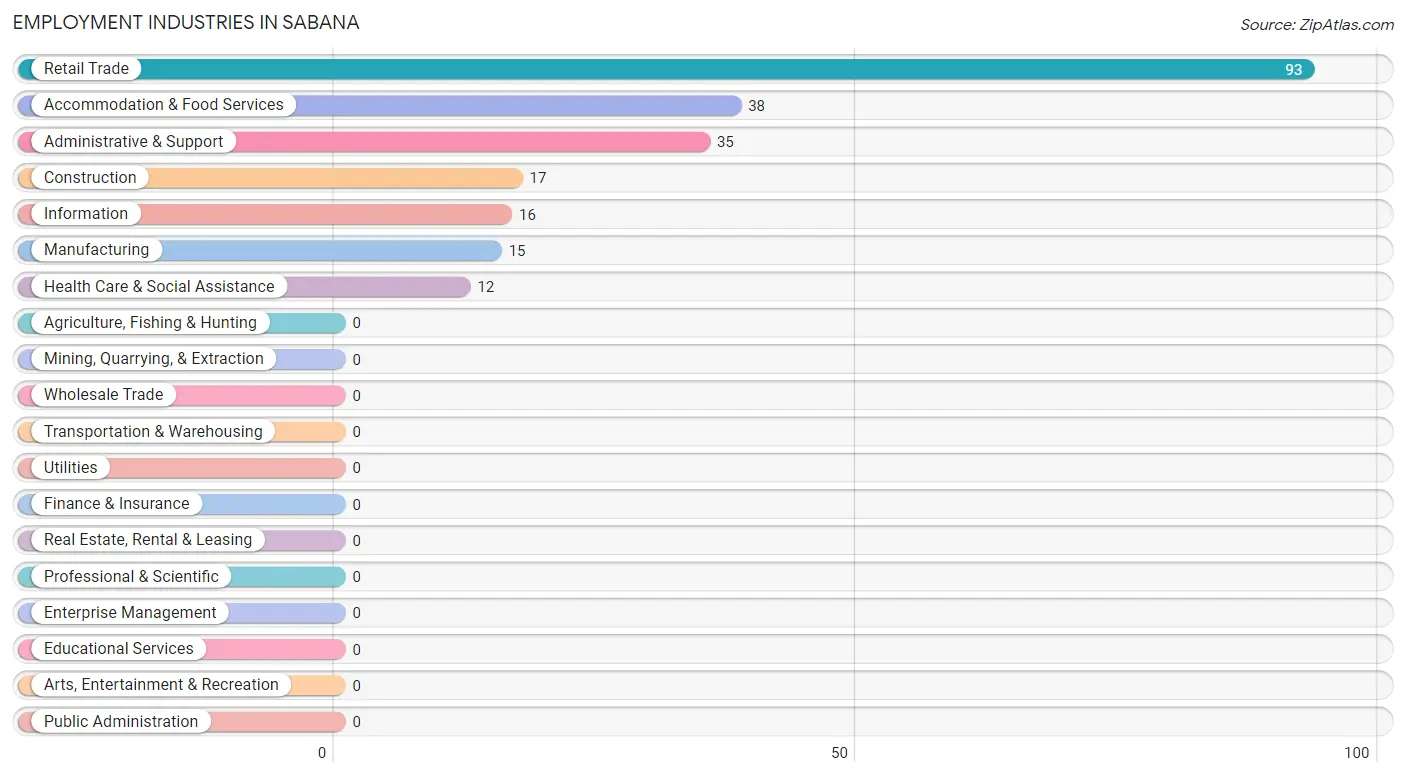
Employment Industries in Sabana
The major employment industries in Sabana include Retail Trade (93 | 36.2%), Accommodation & Food Services (38 | 14.8%), Administrative & Support (35 | 13.6%), Construction (17 | 6.6%), and Information (16 | 6.2%).
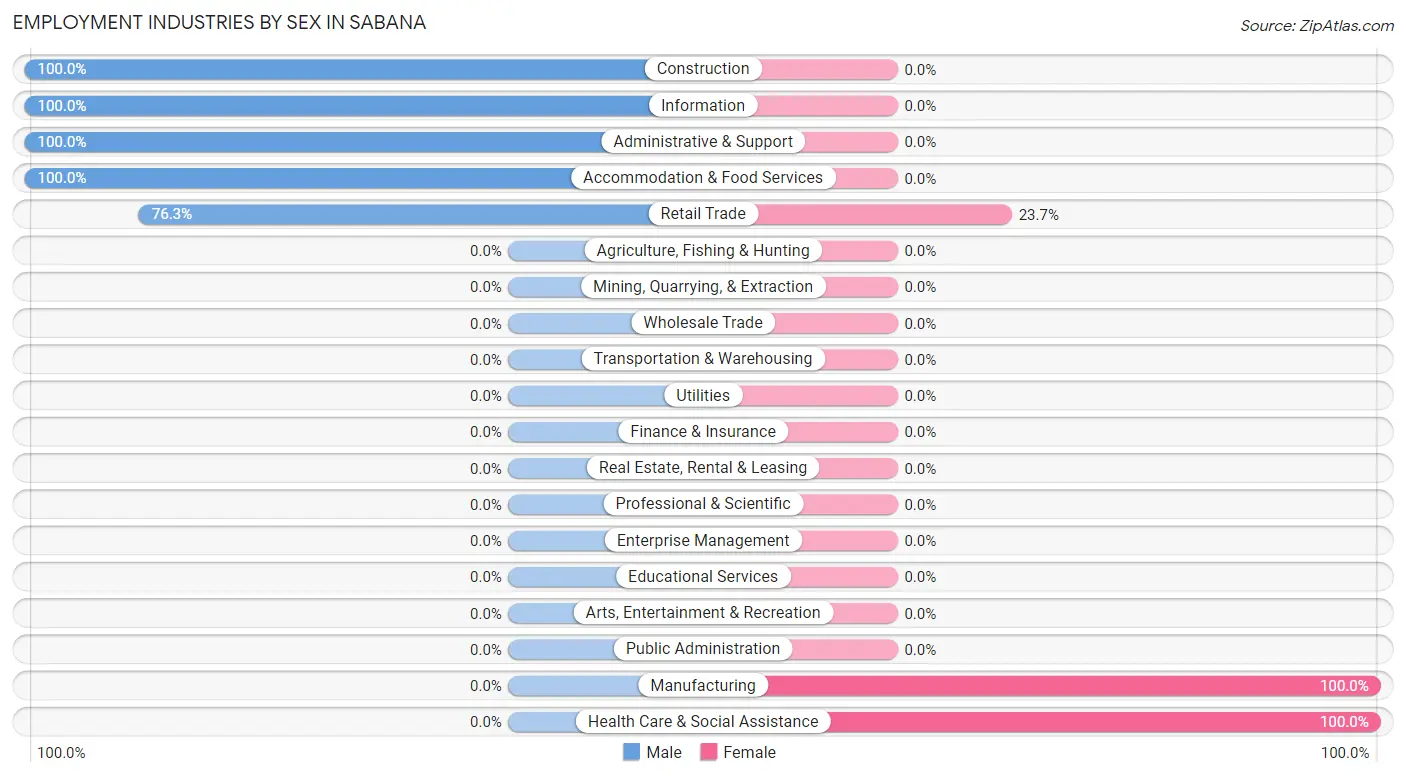
Employment Industries by Sex in Sabana
The Sabana industries that see more men than women are Construction (100.0%), Information (100.0%), and Administrative & Support (100.0%), whereas the industries that tend to have a higher number of women are Manufacturing (100.0%), Health Care & Social Assistance (100.0%), and Retail Trade (23.7%).
| Industry | Male | Female |
| Agriculture, Fishing & Hunting | 0 (0.0%) | 0 (0.0%) |
| Mining, Quarrying, & Extraction | 0 (0.0%) | 0 (0.0%) |
| Construction | 17 (100.0%) | 0 (0.0%) |
| Manufacturing | 0 (0.0%) | 15 (100.0%) |
| Wholesale Trade | 0 (0.0%) | 0 (0.0%) |
| Retail Trade | 71 (76.3%) | 22 (23.7%) |
| Transportation & Warehousing | 0 (0.0%) | 0 (0.0%) |
| Utilities | 0 (0.0%) | 0 (0.0%) |
| Information | 16 (100.0%) | 0 (0.0%) |
| Finance & Insurance | 0 (0.0%) | 0 (0.0%) |
| Real Estate, Rental & Leasing | 0 (0.0%) | 0 (0.0%) |
| Professional & Scientific | 0 (0.0%) | 0 (0.0%) |
| Enterprise Management | 0 (0.0%) | 0 (0.0%) |
| Administrative & Support | 35 (100.0%) | 0 (0.0%) |
| Educational Services | 0 (0.0%) | 0 (0.0%) |
| Health Care & Social Assistance | 0 (0.0%) | 12 (100.0%) |
| Arts, Entertainment & Recreation | 0 (0.0%) | 0 (0.0%) |
| Accommodation & Food Services | 38 (100.0%) | 0 (0.0%) |
| Public Administration | 0 (0.0%) | 0 (0.0%) |
| Total | 198 (77.0%) | 59 (23.0%) |
Education in Sabana
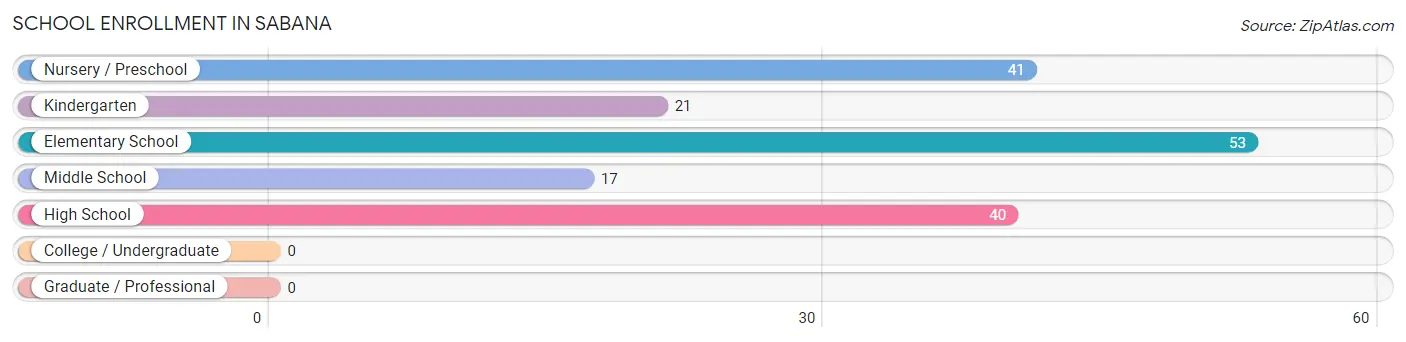
School Enrollment in Sabana
The most common levels of schooling among the 172 students in Sabana are elementary school (53 | 30.8%), nursery / preschool (41 | 23.8%), and high school (40 | 23.3%).
| School Level | # Students | % Students |
| Nursery / Preschool | 41 | 23.8% |
| Kindergarten | 21 | 12.2% |
| Elementary School | 53 | 30.8% |
| Middle School | 17 | 9.9% |
| High School | 40 | 23.3% |
| College / Undergraduate | 0 | 0.0% |
| Graduate / Professional | 0 | 0.0% |
| Total | 172 | 100.0% |
School Enrollment by Age by Funding Source in Sabana
Out of a total of 172 students who are enrolled in schools in Sabana, 21 (12.2%) attend a private institution, while the remaining 151 (87.8%) are enrolled in public schools. The age group of 5 to 9 year old has the highest likelihood of being enrolled in private schools, with 21 (36.8% in the age bracket) enrolled. Conversely, the age group of 3 to 4 year olds has the lowest likelihood of being enrolled in a private school, with 41 (100.0% in the age bracket) attending a public institution.
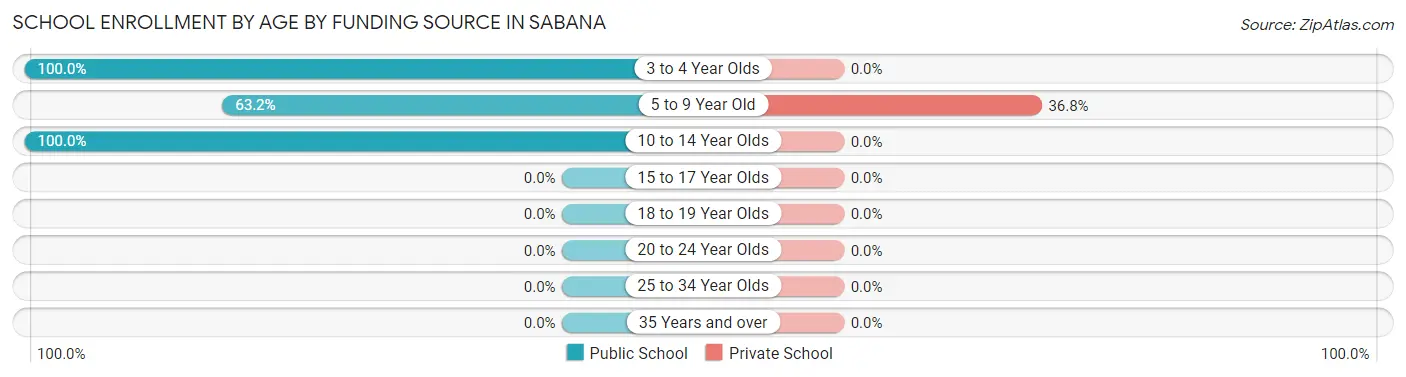
| Age Bracket | Public School | Private School |
| 3 to 4 Year Olds | 41 (100.0%) | 0 (0.0%) |
| 5 to 9 Year Old | 36 (63.2%) | 21 (36.8%) |
| 10 to 14 Year Olds | 74 (100.0%) | 0 (0.0%) |
| 15 to 17 Year Olds | 0 (0.0%) | 0 (0.0%) |
| 18 to 19 Year Olds | 0 (0.0%) | 0 (0.0%) |
| 20 to 24 Year Olds | 0 (0.0%) | 0 (0.0%) |
| 25 to 34 Year Olds | 0 (0.0%) | 0 (0.0%) |
| 35 Years and over | 0 (0.0%) | 0 (0.0%) |
| Total | 151 (87.8%) | 21 (12.2%) |
Educational Attainment by Field of Study in Sabana
, and science & technology (21 | 100.0%) are the most common fields of study among 21 individuals in Sabana who have obtained a bachelor's degree or higher.
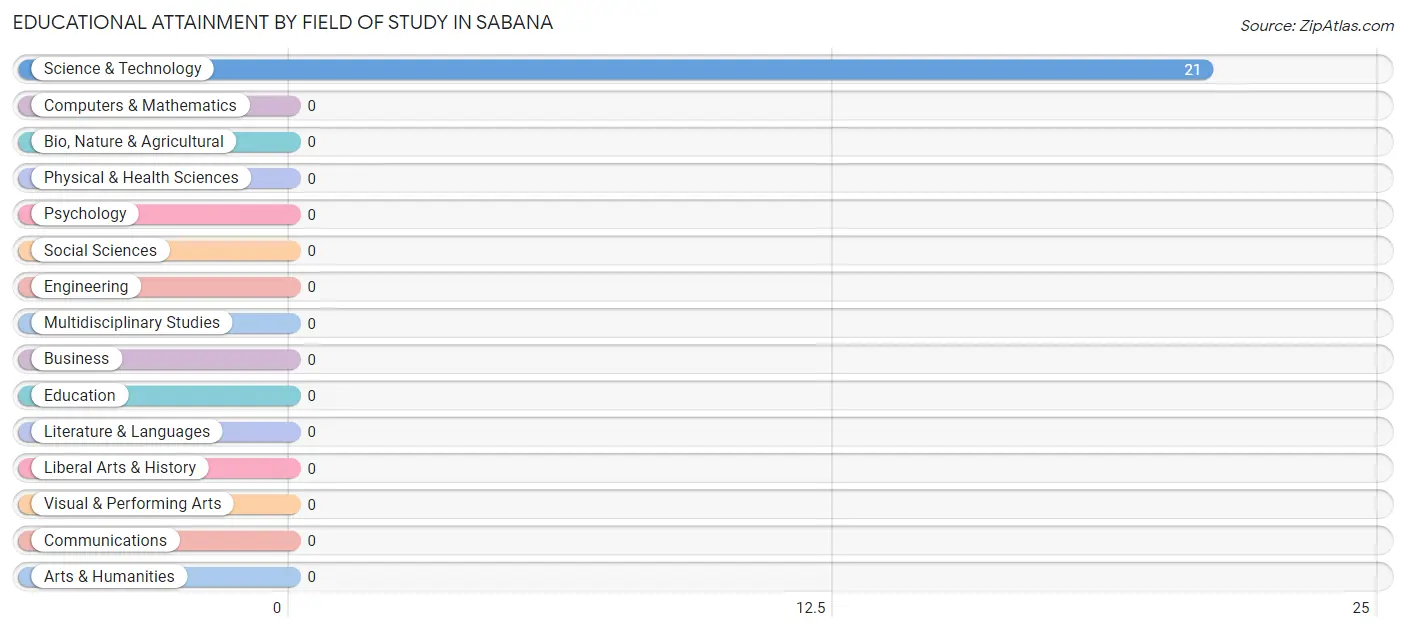
| Field of Study | # Graduates | % Graduates |
| Computers & Mathematics | 0 | 0.0% |
| Bio, Nature & Agricultural | 0 | 0.0% |
| Physical & Health Sciences | 0 | 0.0% |
| Psychology | 0 | 0.0% |
| Social Sciences | 0 | 0.0% |
| Engineering | 0 | 0.0% |
| Multidisciplinary Studies | 0 | 0.0% |
| Science & Technology | 21 | 100.0% |
| Business | 0 | 0.0% |
| Education | 0 | 0.0% |
| Literature & Languages | 0 | 0.0% |
| Liberal Arts & History | 0 | 0.0% |
| Visual & Performing Arts | 0 | 0.0% |
| Communications | 0 | 0.0% |
| Arts & Humanities | 0 | 0.0% |
| Total | 21 | 100.0% |
Transportation & Commute in Sabana
Vehicle Availability by Sex in Sabana
The most prevalent vehicle ownership categories in Sabana are males with 2 vehicles (110, accounting for 55.6%) and females with 2 vehicles (22, making up 186.4%).
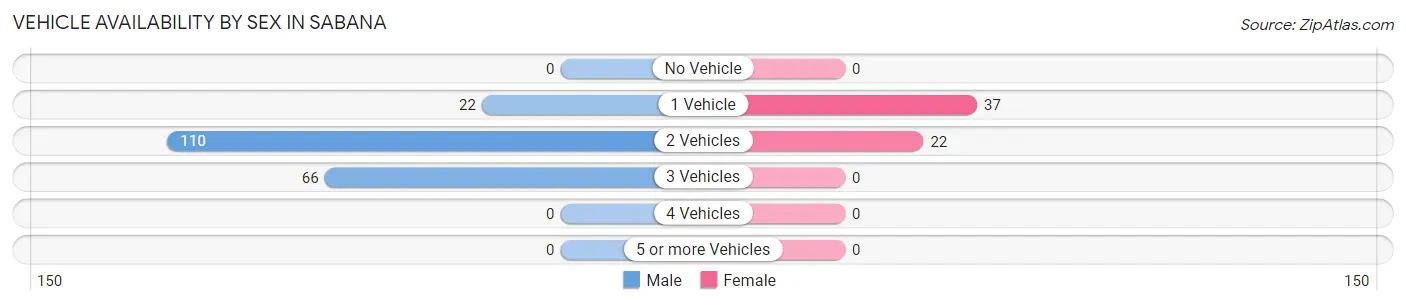
| Vehicles Available | Male | Female |
| No Vehicle | 0 (0.0%) | 0 (0.0%) |
| 1 Vehicle | 22 (11.1%) | 37 (62.7%) |
| 2 Vehicles | 110 (55.6%) | 22 (37.3%) |
| 3 Vehicles | 66 (33.3%) | 0 (0.0%) |
| 4 Vehicles | 0 (0.0%) | 0 (0.0%) |
| 5 or more Vehicles | 0 (0.0%) | 0 (0.0%) |
| Total | 198 (100.0%) | 59 (100.0%) |
Commute Time in Sabana
The most frequently occuring commute durations in Sabana are 10 to 14 minutes (72 commuters, 28.0%), 15 to 19 minutes (55 commuters, 21.4%), and 20 to 24 minutes (52 commuters, 20.2%).
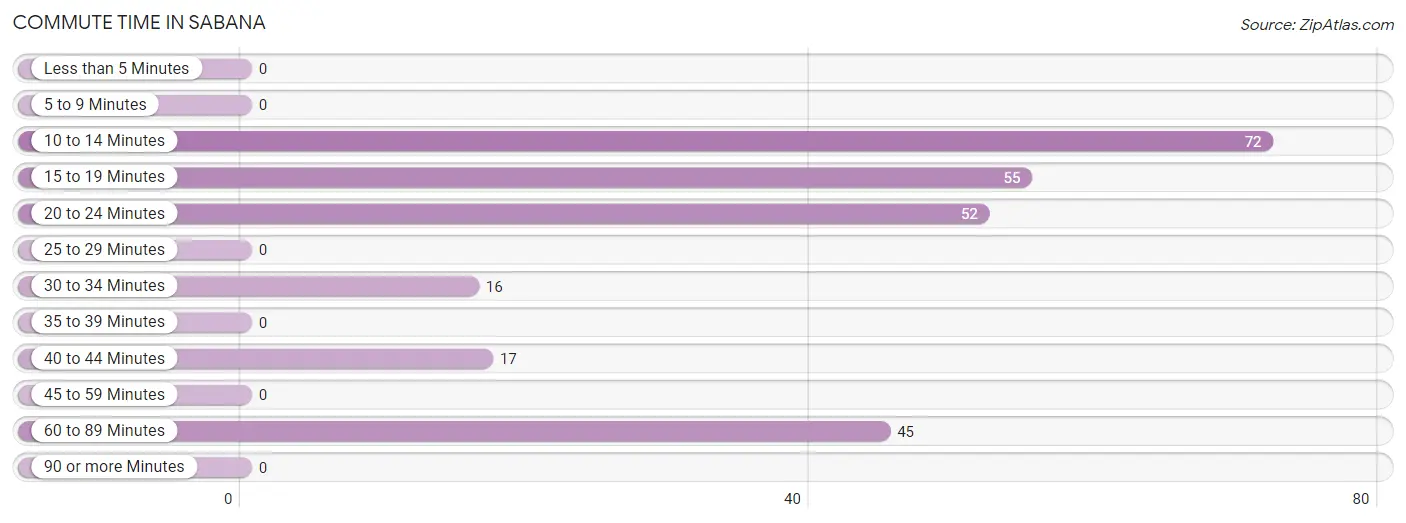
| Commute Time | # Commuters | % Commuters |
| Less than 5 Minutes | 0 | 0.0% |
| 5 to 9 Minutes | 0 | 0.0% |
| 10 to 14 Minutes | 72 | 28.0% |
| 15 to 19 Minutes | 55 | 21.4% |
| 20 to 24 Minutes | 52 | 20.2% |
| 25 to 29 Minutes | 0 | 0.0% |
| 30 to 34 Minutes | 16 | 6.2% |
| 35 to 39 Minutes | 0 | 0.0% |
| 40 to 44 Minutes | 17 | 6.6% |
| 45 to 59 Minutes | 0 | 0.0% |
| 60 to 89 Minutes | 45 | 17.5% |
| 90 or more Minutes | 0 | 0.0% |
Commute Time by Sex in Sabana
The most common commute times in Sabana are 10 to 14 minutes (50 commuters, 25.3%) for males and 10 to 14 minutes (22 commuters, 37.3%) for females.
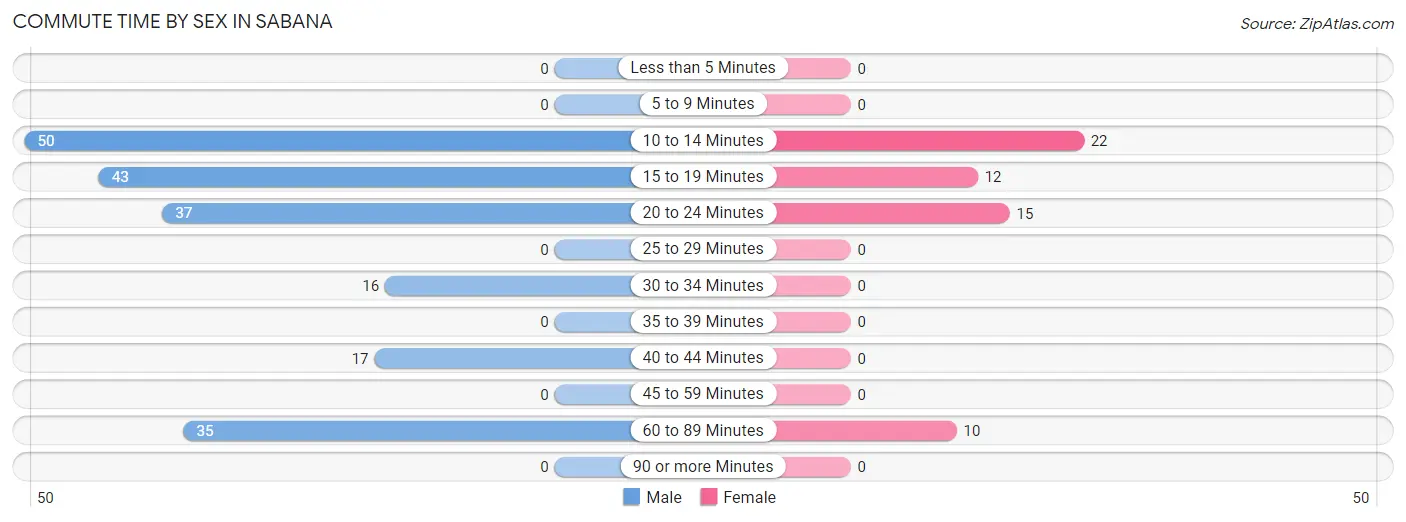
| Commute Time | Male | Female |
| Less than 5 Minutes | 0 (0.0%) | 0 (0.0%) |
| 5 to 9 Minutes | 0 (0.0%) | 0 (0.0%) |
| 10 to 14 Minutes | 50 (25.3%) | 22 (37.3%) |
| 15 to 19 Minutes | 43 (21.7%) | 12 (20.3%) |
| 20 to 24 Minutes | 37 (18.7%) | 15 (25.4%) |
| 25 to 29 Minutes | 0 (0.0%) | 0 (0.0%) |
| 30 to 34 Minutes | 16 (8.1%) | 0 (0.0%) |
| 35 to 39 Minutes | 0 (0.0%) | 0 (0.0%) |
| 40 to 44 Minutes | 17 (8.6%) | 0 (0.0%) |
| 45 to 59 Minutes | 0 (0.0%) | 0 (0.0%) |
| 60 to 89 Minutes | 35 (17.7%) | 10 (17.0%) |
| 90 or more Minutes | 0 (0.0%) | 0 (0.0%) |
Time of Departure to Work by Sex in Sabana
The most frequent times of departure to work in Sabana are 7:00 AM to 7:29 AM (94, 47.5%) for males and 7:00 AM to 7:29 AM (22, 37.3%) for females.
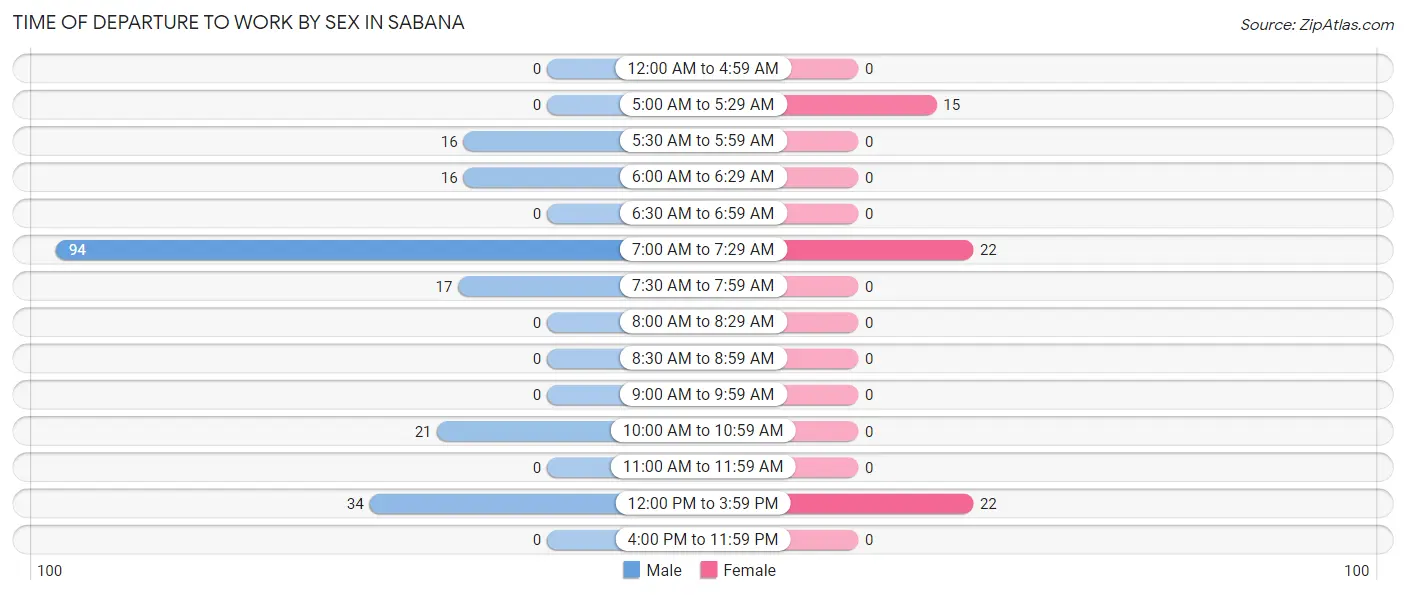
| Time of Departure | Male | Female |
| 12:00 AM to 4:59 AM | 0 (0.0%) | 0 (0.0%) |
| 5:00 AM to 5:29 AM | 0 (0.0%) | 15 (25.4%) |
| 5:30 AM to 5:59 AM | 16 (8.1%) | 0 (0.0%) |
| 6:00 AM to 6:29 AM | 16 (8.1%) | 0 (0.0%) |
| 6:30 AM to 6:59 AM | 0 (0.0%) | 0 (0.0%) |
| 7:00 AM to 7:29 AM | 94 (47.5%) | 22 (37.3%) |
| 7:30 AM to 7:59 AM | 17 (8.6%) | 0 (0.0%) |
| 8:00 AM to 8:29 AM | 0 (0.0%) | 0 (0.0%) |
| 8:30 AM to 8:59 AM | 0 (0.0%) | 0 (0.0%) |
| 9:00 AM to 9:59 AM | 0 (0.0%) | 0 (0.0%) |
| 10:00 AM to 10:59 AM | 21 (10.6%) | 0 (0.0%) |
| 11:00 AM to 11:59 AM | 0 (0.0%) | 0 (0.0%) |
| 12:00 PM to 3:59 PM | 34 (17.2%) | 22 (37.3%) |
| 4:00 PM to 11:59 PM | 0 (0.0%) | 0 (0.0%) |
| Total | 198 (100.0%) | 59 (100.0%) |
Housing Occupancy in Sabana
Occupancy by Ownership in Sabana
Of the total 303 dwellings in Sabana, owner-occupied units account for 270 (89.1%), while renter-occupied units make up 33 (10.9%).
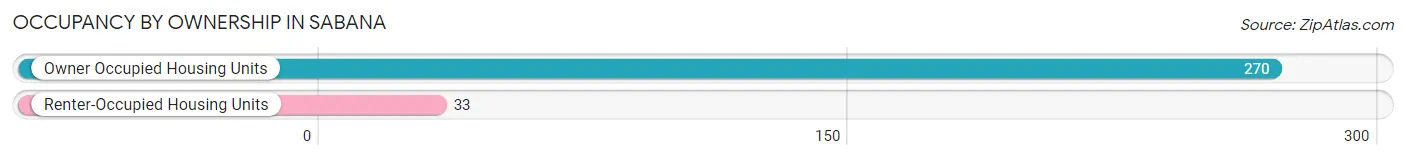
| Occupancy | # Housing Units | % Housing Units |
| Owner Occupied Housing Units | 270 | 89.1% |
| Renter-Occupied Housing Units | 33 | 10.9% |
| Total Occupied Housing Units | 303 | 100.0% |
Occupancy by Household Size in Sabana
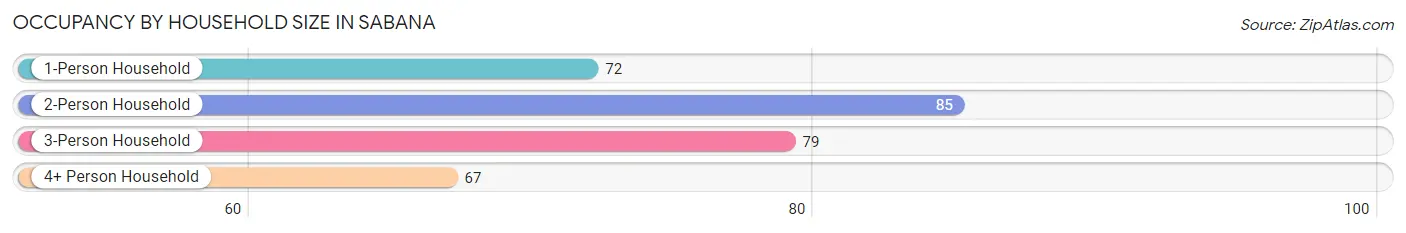
| Household Size | # Housing Units | % Housing Units |
| 1-Person Household | 72 | 23.8% |
| 2-Person Household | 85 | 28.1% |
| 3-Person Household | 79 | 26.1% |
| 4+ Person Household | 67 | 22.1% |
| Total Housing Units | 303 | 100.0% |
Occupancy by Ownership by Household Size in Sabana
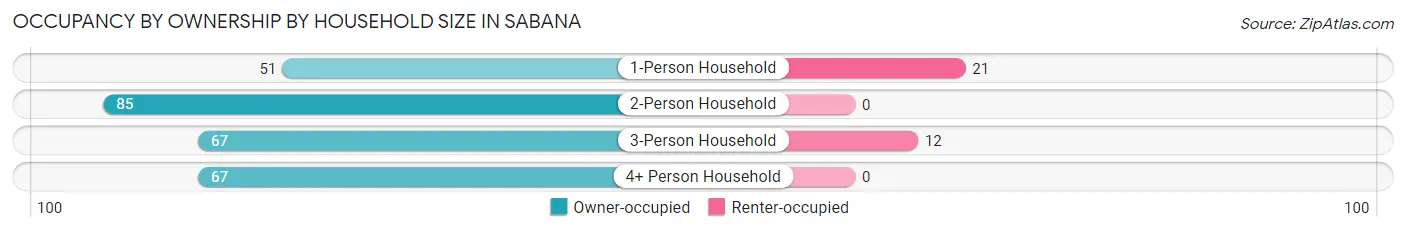
| Household Size | Owner-occupied | Renter-occupied |
| 1-Person Household | 51 (70.8%) | 21 (29.2%) |
| 2-Person Household | 85 (100.0%) | 0 (0.0%) |
| 3-Person Household | 67 (84.8%) | 12 (15.2%) |
| 4+ Person Household | 67 (100.0%) | 0 (0.0%) |
| Total Housing Units | 270 (89.1%) | 33 (10.9%) |
Occupancy by Educational Attainment in Sabana
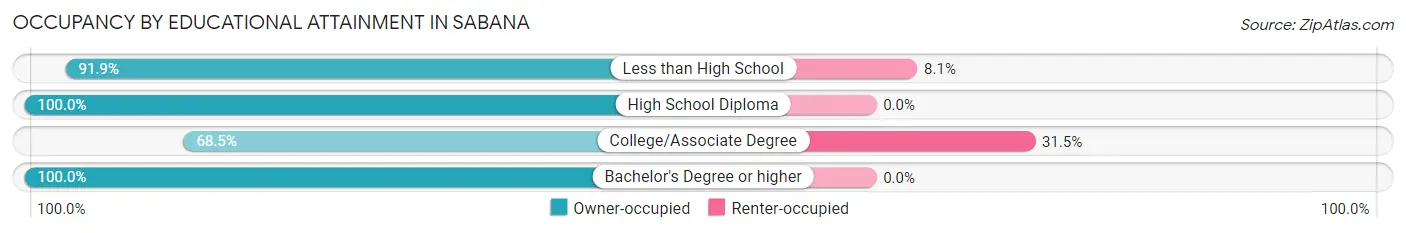
| Household Size | Owner-occupied | Renter-occupied |
| Less than High School | 113 (91.9%) | 10 (8.1%) |
| High School Diploma | 86 (100.0%) | 0 (0.0%) |
| College/Associate Degree | 50 (68.5%) | 23 (31.5%) |
| Bachelor's Degree or higher | 21 (100.0%) | 0 (0.0%) |
Occupancy by Age of Householder in Sabana
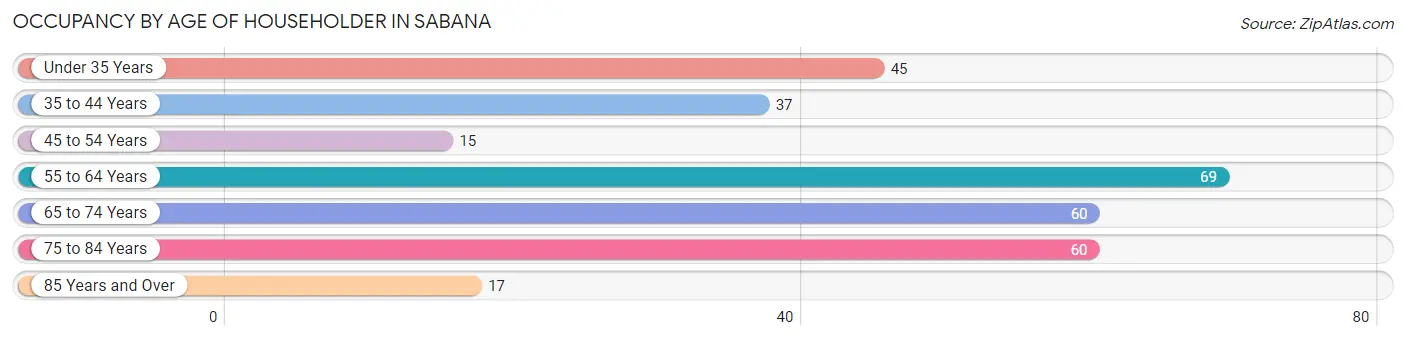
| Age Bracket | # Households | % Households |
| Under 35 Years | 45 | 14.8% |
| 35 to 44 Years | 37 | 12.2% |
| 45 to 54 Years | 15 | 5.0% |
| 55 to 64 Years | 69 | 22.8% |
| 65 to 74 Years | 60 | 19.8% |
| 75 to 84 Years | 60 | 19.8% |
| 85 Years and Over | 17 | 5.6% |
| Total | 303 | 100.0% |
Housing Finances in Sabana
Median Income by Occupancy in Sabana
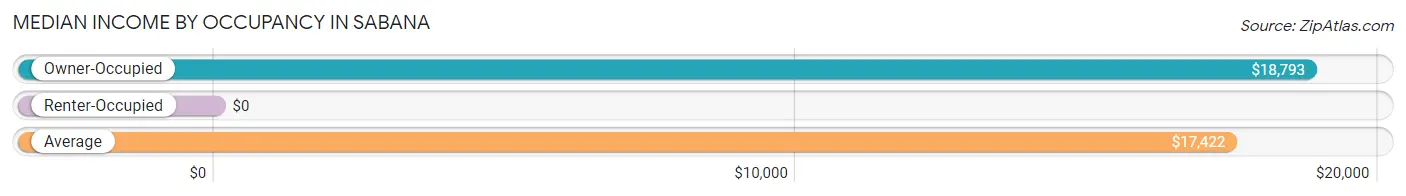
| Occupancy Type | # Households | Median Income |
| Owner-Occupied | 270 (89.1%) | $18,793 |
| Renter-Occupied | 33 (10.9%) | $0 |
| Average | 303 (100.0%) | $17,422 |
Occupancy by Householder Income Bracket in Sabana
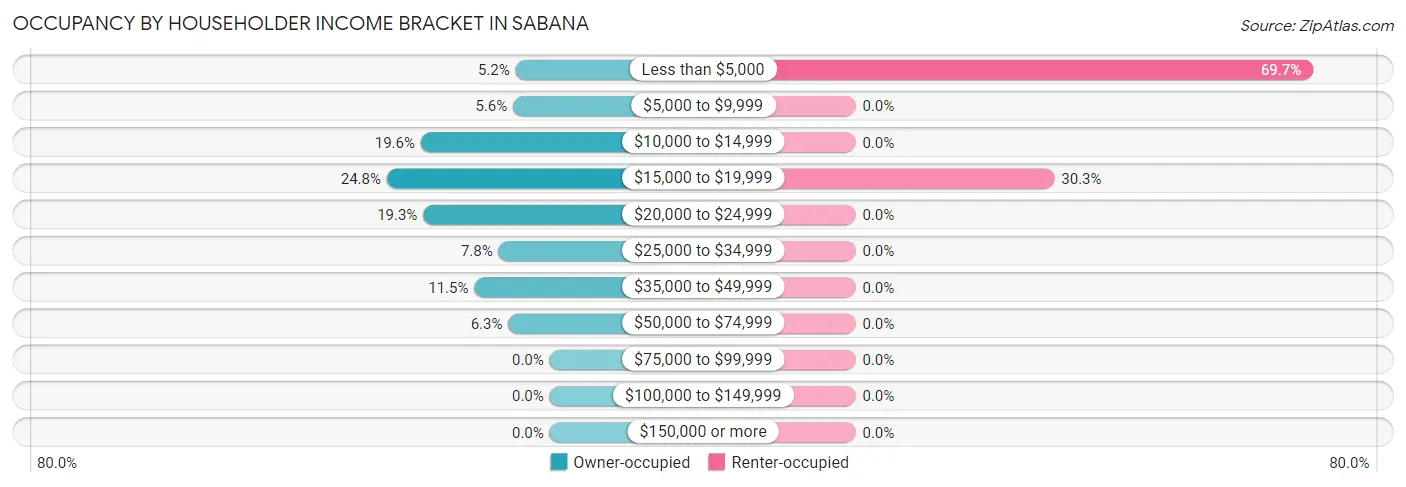
| Income Bracket | Owner-occupied | Renter-occupied |
| Less than $5,000 | 14 (5.2%) | 23 (69.7%) |
| $5,000 to $9,999 | 15 (5.6%) | 0 (0.0%) |
| $10,000 to $14,999 | 53 (19.6%) | 0 (0.0%) |
| $15,000 to $19,999 | 67 (24.8%) | 10 (30.3%) |
| $20,000 to $24,999 | 52 (19.3%) | 0 (0.0%) |
| $25,000 to $34,999 | 21 (7.8%) | 0 (0.0%) |
| $35,000 to $49,999 | 31 (11.5%) | 0 (0.0%) |
| $50,000 to $74,999 | 17 (6.3%) | 0 (0.0%) |
| $75,000 to $99,999 | 0 (0.0%) | 0 (0.0%) |
| $100,000 to $149,999 | 0 (0.0%) | 0 (0.0%) |
| $150,000 or more | 0 (0.0%) | 0 (0.0%) |
| Total | 270 (100.0%) | 33 (100.0%) |
Monthly Housing Cost Tiers in Sabana
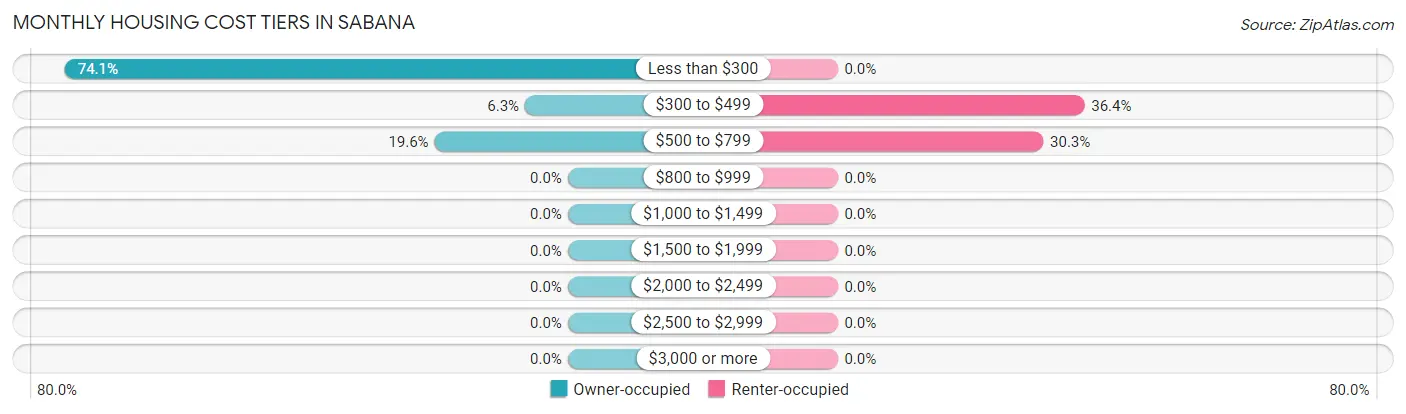
| Monthly Cost | Owner-occupied | Renter-occupied |
| Less than $300 | 200 (74.1%) | 0 (0.0%) |
| $300 to $499 | 17 (6.3%) | 12 (36.4%) |
| $500 to $799 | 53 (19.6%) | 10 (30.3%) |
| $800 to $999 | 0 (0.0%) | 0 (0.0%) |
| $1,000 to $1,499 | 0 (0.0%) | 0 (0.0%) |
| $1,500 to $1,999 | 0 (0.0%) | 0 (0.0%) |
| $2,000 to $2,499 | 0 (0.0%) | 0 (0.0%) |
| $2,500 to $2,999 | 0 (0.0%) | 0 (0.0%) |
| $3,000 or more | 0 (0.0%) | 0 (0.0%) |
| Total | 270 (100.0%) | 33 (100.0%) |
Physical Housing Characteristics in Sabana
Housing Structures in Sabana
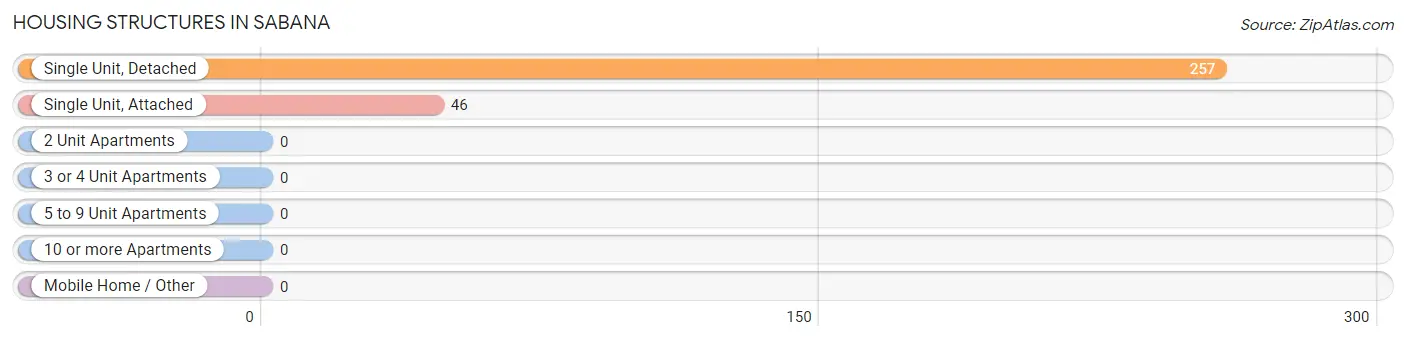
| Structure Type | # Housing Units | % Housing Units |
| Single Unit, Detached | 257 | 84.8% |
| Single Unit, Attached | 46 | 15.2% |
| 2 Unit Apartments | 0 | 0.0% |
| 3 or 4 Unit Apartments | 0 | 0.0% |
| 5 to 9 Unit Apartments | 0 | 0.0% |
| 10 or more Apartments | 0 | 0.0% |
| Mobile Home / Other | 0 | 0.0% |
| Total | 303 | 100.0% |
Housing Structures by Occupancy in Sabana
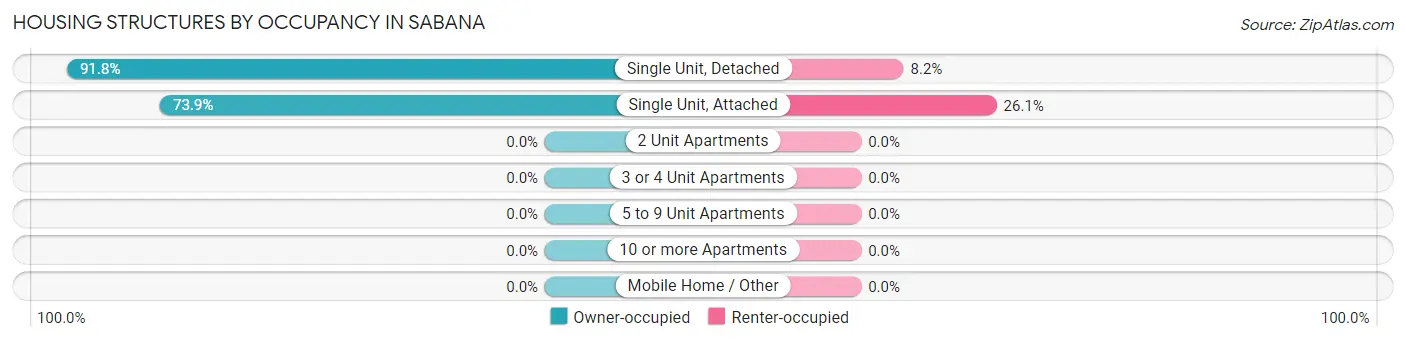
| Structure Type | Owner-occupied | Renter-occupied |
| Single Unit, Detached | 236 (91.8%) | 21 (8.2%) |
| Single Unit, Attached | 34 (73.9%) | 12 (26.1%) |
| 2 Unit Apartments | 0 (0.0%) | 0 (0.0%) |
| 3 or 4 Unit Apartments | 0 (0.0%) | 0 (0.0%) |
| 5 to 9 Unit Apartments | 0 (0.0%) | 0 (0.0%) |
| 10 or more Apartments | 0 (0.0%) | 0 (0.0%) |
| Mobile Home / Other | 0 (0.0%) | 0 (0.0%) |
| Total | 270 (89.1%) | 33 (10.9%) |
Housing Structures by Number of Rooms in Sabana
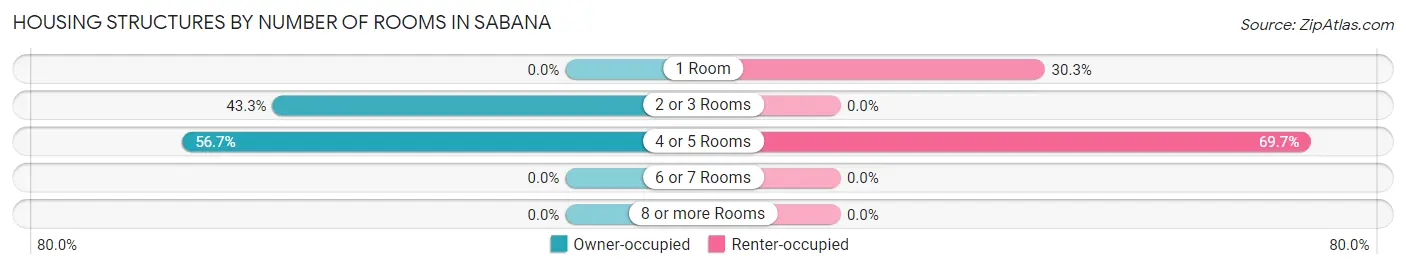
| Number of Rooms | Owner-occupied | Renter-occupied |
| 1 Room | 0 (0.0%) | 10 (30.3%) |
| 2 or 3 Rooms | 117 (43.3%) | 0 (0.0%) |
| 4 or 5 Rooms | 153 (56.7%) | 23 (69.7%) |
| 6 or 7 Rooms | 0 (0.0%) | 0 (0.0%) |
| 8 or more Rooms | 0 (0.0%) | 0 (0.0%) |
| Total | 270 (100.0%) | 33 (100.0%) |
Housing Structure by Heating Type in Sabana
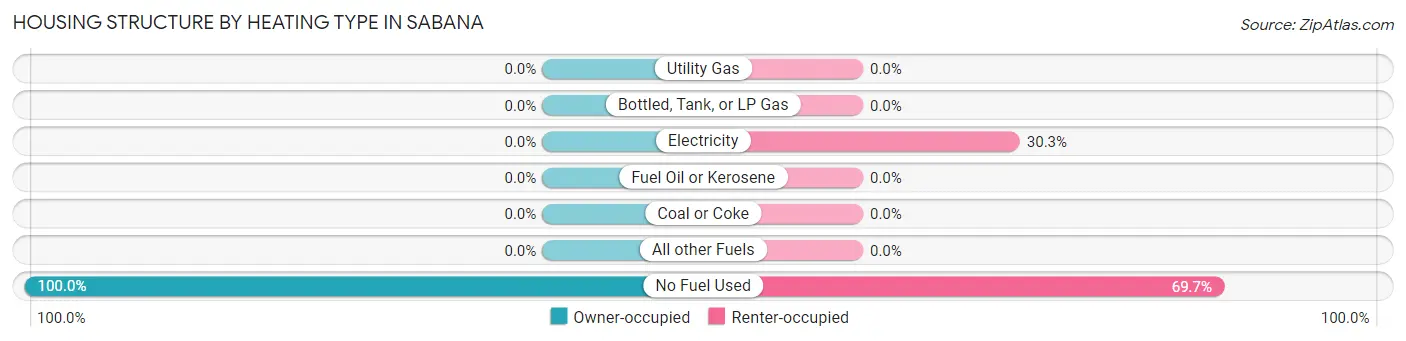
| Heating Type | Owner-occupied | Renter-occupied |
| Utility Gas | 0 (0.0%) | 0 (0.0%) |
| Bottled, Tank, or LP Gas | 0 (0.0%) | 0 (0.0%) |
| Electricity | 0 (0.0%) | 10 (30.3%) |
| Fuel Oil or Kerosene | 0 (0.0%) | 0 (0.0%) |
| Coal or Coke | 0 (0.0%) | 0 (0.0%) |
| All other Fuels | 0 (0.0%) | 0 (0.0%) |
| No Fuel Used | 270 (100.0%) | 23 (69.7%) |
| Total | 270 (100.0%) | 33 (100.0%) |
Household Vehicle Usage in Sabana
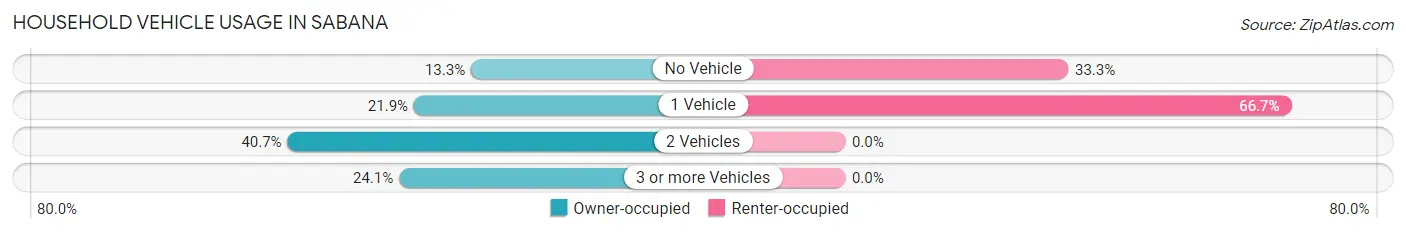
| Vehicles per Household | Owner-occupied | Renter-occupied |
| No Vehicle | 36 (13.3%) | 11 (33.3%) |
| 1 Vehicle | 59 (21.8%) | 22 (66.7%) |
| 2 Vehicles | 110 (40.7%) | 0 (0.0%) |
| 3 or more Vehicles | 65 (24.1%) | 0 (0.0%) |
| Total | 270 (100.0%) | 33 (100.0%) |
Real Estate & Mortgages in Sabana
Real Estate and Mortgage Overview in Sabana
| Characteristic | Without Mortgage | With Mortgage |
| Housing Units | 233 | 37 |
| Median Property Value | $85,800 | $0 |
| Median Household Income | $19,009 | $0 |
| Monthly Housing Costs | $139 | $0 |
| Real Estate Taxes | - | - |
Property Value by Mortgage Status in Sabana
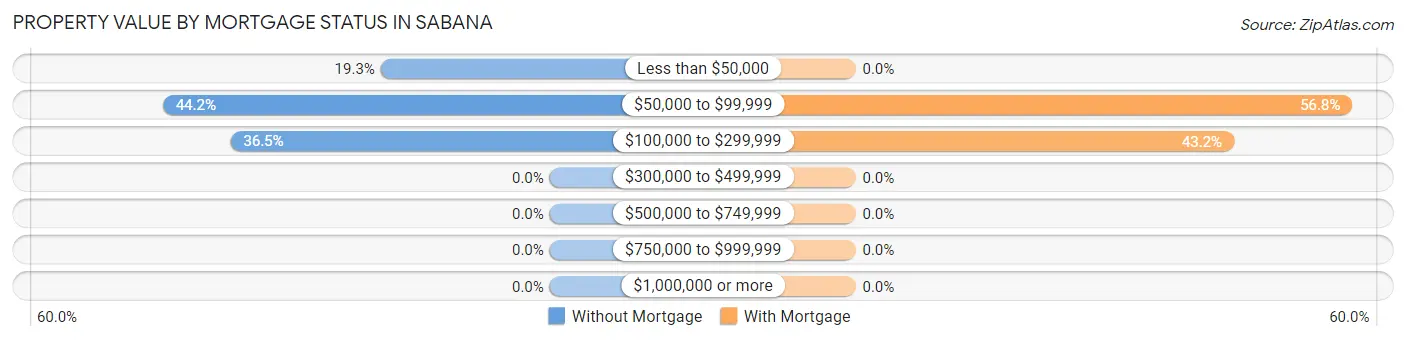
| Property Value | Without Mortgage | With Mortgage |
| Less than $50,000 | 45 (19.3%) | 0 (0.0%) |
| $50,000 to $99,999 | 103 (44.2%) | 21 (56.8%) |
| $100,000 to $299,999 | 85 (36.5%) | 16 (43.2%) |
| $300,000 to $499,999 | 0 (0.0%) | 0 (0.0%) |
| $500,000 to $749,999 | 0 (0.0%) | 0 (0.0%) |
| $750,000 to $999,999 | 0 (0.0%) | 0 (0.0%) |
| $1,000,000 or more | 0 (0.0%) | 0 (0.0%) |
| Total | 233 (100.0%) | 37 (100.0%) |
Household Income by Mortgage Status in Sabana
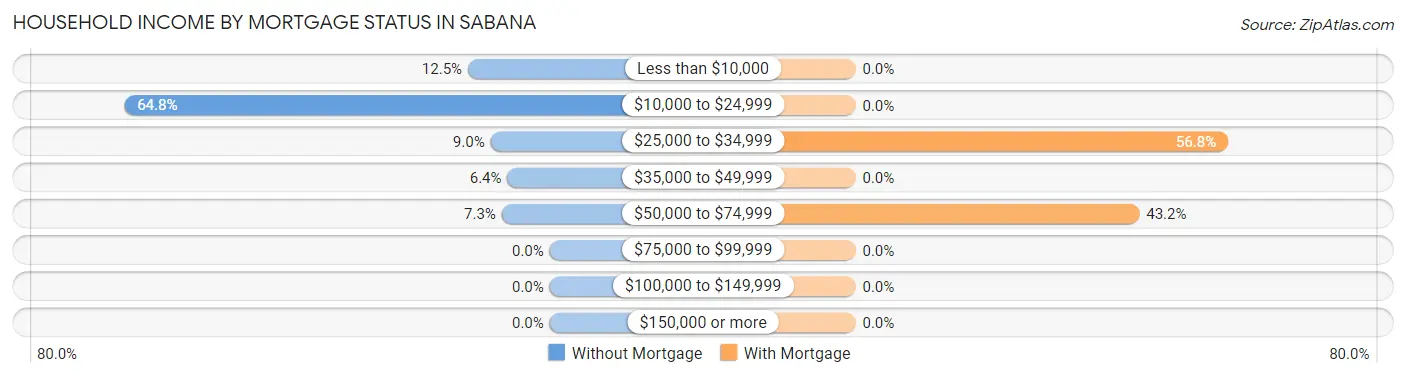
| Household Income | Without Mortgage | With Mortgage |
| Less than $10,000 | 29 (12.4%) | 0 (0.0%) |
| $10,000 to $24,999 | 151 (64.8%) | 0 (0.0%) |
| $25,000 to $34,999 | 21 (9.0%) | 21 (56.8%) |
| $35,000 to $49,999 | 15 (6.4%) | 0 (0.0%) |
| $50,000 to $74,999 | 17 (7.3%) | 16 (43.2%) |
| $75,000 to $99,999 | 0 (0.0%) | 0 (0.0%) |
| $100,000 to $149,999 | 0 (0.0%) | 0 (0.0%) |
| $150,000 or more | 0 (0.0%) | 0 (0.0%) |
| Total | 233 (100.0%) | 37 (100.0%) |
Property Value to Household Income Ratio in Sabana
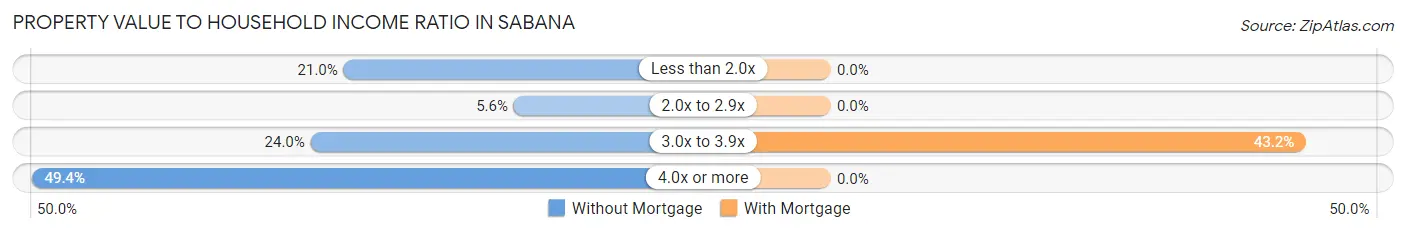
| Value-to-Income Ratio | Without Mortgage | With Mortgage |
| Less than 2.0x | 49 (21.0%) | 0 (0.0%) |
| 2.0x to 2.9x | 13 (5.6%) | 0 (0.0%) |
| 3.0x to 3.9x | 56 (24.0%) | 16 (43.2%) |
| 4.0x or more | 115 (49.4%) | 0 (0.0%) |
| Total | 233 (100.0%) | 37 (100.0%) |
Real Estate Taxes by Mortgage Status in Sabana
| Property Taxes | Without Mortgage | With Mortgage |
| Less than $800 | 0 (0.0%) | 0 (0.0%) |
| $800 to $1,499 | 0 (0.0%) | 0 (0.0%) |
| $800 to $1,499 | 0 (0.0%) | 0 (0.0%) |
| Total | 233 (100.0%) | 37 (100.0%) |
Health & Disability in Sabana
Health Insurance Coverage by Age in Sabana
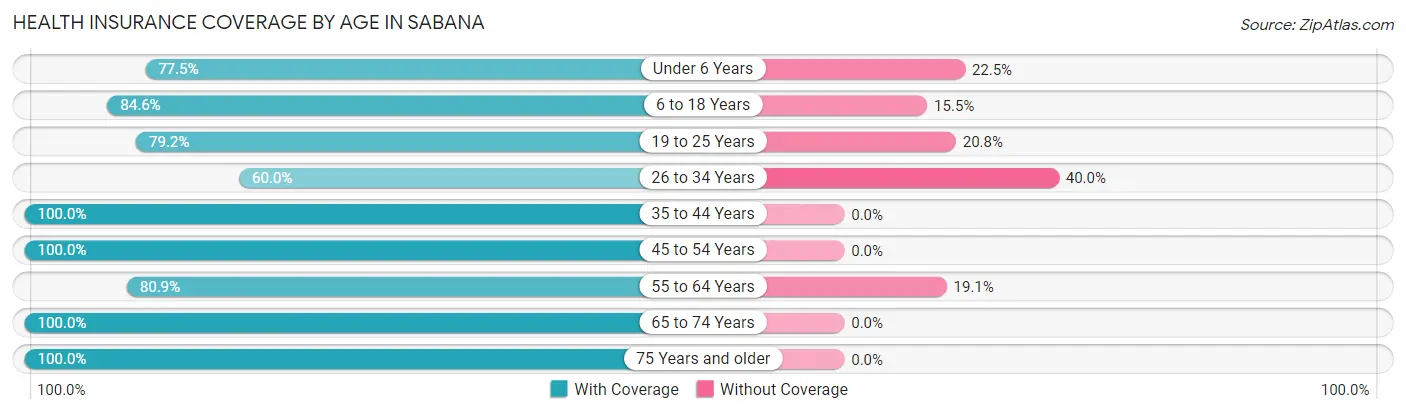
| Age Bracket | With Coverage | Without Coverage |
| Under 6 Years | 62 (77.5%) | 18 (22.5%) |
| 6 to 18 Years | 93 (84.6%) | 17 (15.4%) |
| 19 to 25 Years | 99 (79.2%) | 26 (20.8%) |
| 26 to 34 Years | 111 (60.0%) | 74 (40.0%) |
| 35 to 44 Years | 90 (100.0%) | 0 (0.0%) |
| 45 to 54 Years | 64 (100.0%) | 0 (0.0%) |
| 55 to 64 Years | 123 (80.9%) | 29 (19.1%) |
| 65 to 74 Years | 60 (100.0%) | 0 (0.0%) |
| 75 Years and older | 99 (100.0%) | 0 (0.0%) |
| Total | 801 (83.0%) | 164 (17.0%) |
Health Insurance Coverage by Citizenship Status in Sabana
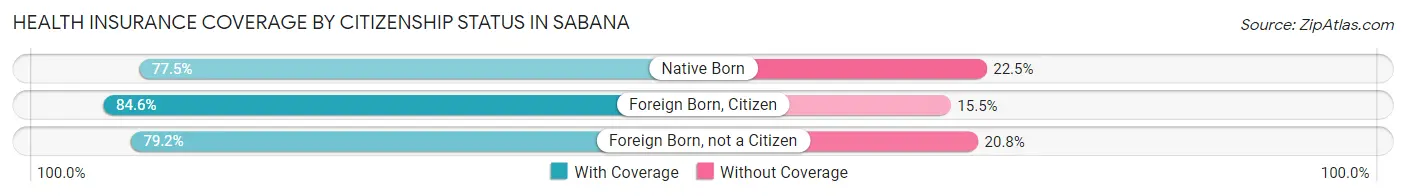
| Citizenship Status | With Coverage | Without Coverage |
| Native Born | 62 (77.5%) | 18 (22.5%) |
| Foreign Born, Citizen | 93 (84.6%) | 17 (15.4%) |
| Foreign Born, not a Citizen | 99 (79.2%) | 26 (20.8%) |
Health Insurance Coverage by Household Income in Sabana
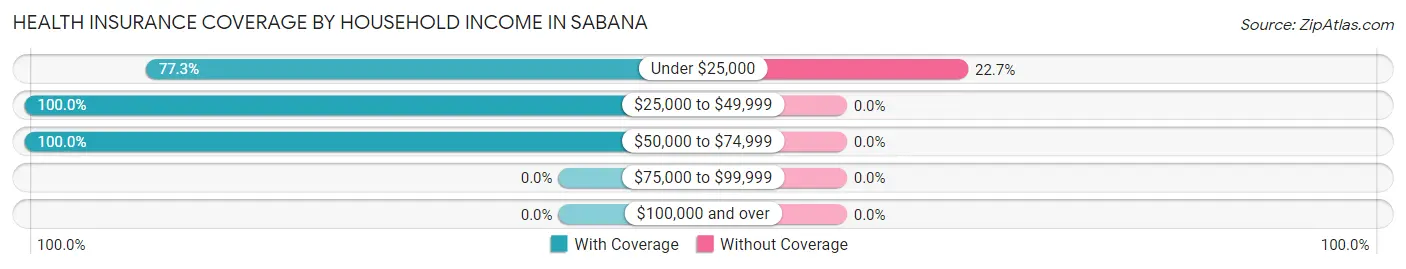
| Household Income | With Coverage | Without Coverage |
| Under $25,000 | 558 (77.3%) | 164 (22.7%) |
| $25,000 to $49,999 | 144 (100.0%) | 0 (0.0%) |
| $50,000 to $74,999 | 99 (100.0%) | 0 (0.0%) |
| $75,000 to $99,999 | 0 (0.0%) | 0 (0.0%) |
| $100,000 and over | 0 (0.0%) | 0 (0.0%) |
Public vs Private Health Insurance Coverage by Age in Sabana
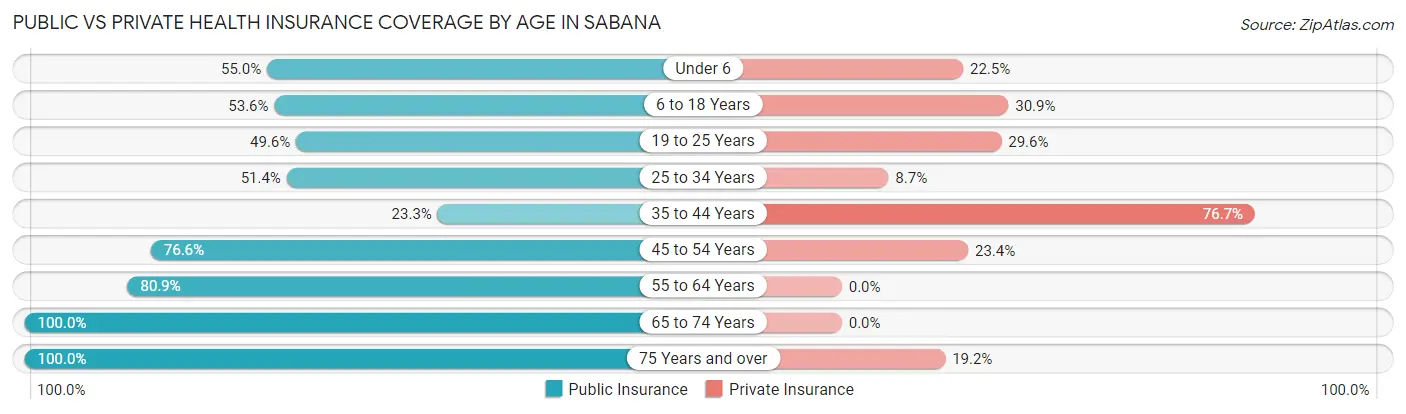
| Age Bracket | Public Insurance | Private Insurance |
| Under 6 | 44 (55.0%) | 18 (22.5%) |
| 6 to 18 Years | 59 (53.6%) | 34 (30.9%) |
| 19 to 25 Years | 62 (49.6%) | 37 (29.6%) |
| 25 to 34 Years | 95 (51.3%) | 16 (8.6%) |
| 35 to 44 Years | 21 (23.3%) | 69 (76.7%) |
| 45 to 54 Years | 49 (76.6%) | 15 (23.4%) |
| 55 to 64 Years | 123 (80.9%) | 0 (0.0%) |
| 65 to 74 Years | 60 (100.0%) | 0 (0.0%) |
| 75 Years and over | 99 (100.0%) | 19 (19.2%) |
| Total | 612 (63.4%) | 208 (21.5%) |
Disability Status by Sex by Age in Sabana
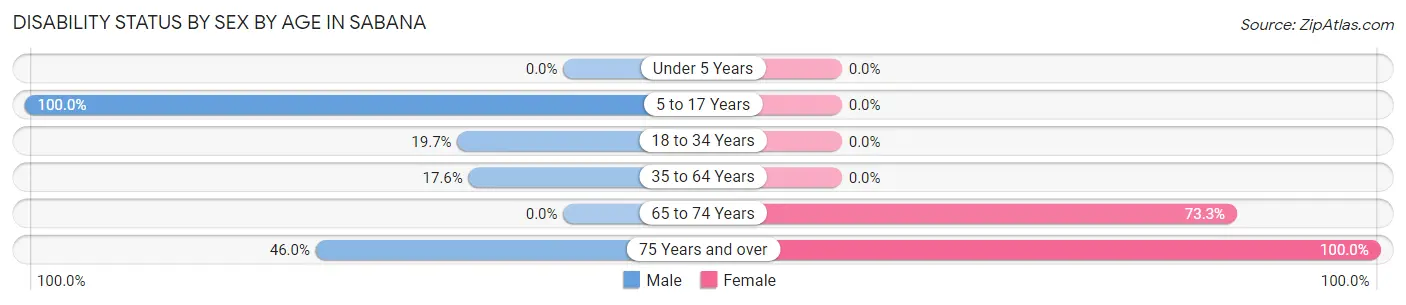
| Age Bracket | Male | Female |
| Under 5 Years | 0 (0.0%) | 0 (0.0%) |
| 5 to 17 Years | 19 (100.0%) | 0 (0.0%) |
| 18 to 34 Years | 35 (19.7%) | 0 (0.0%) |
| 35 to 64 Years | 32 (17.6%) | 0 (0.0%) |
| 65 to 74 Years | 0 (0.0%) | 44 (73.3%) |
| 75 Years and over | 17 (46.0%) | 62 (100.0%) |
Disability Class by Sex by Age in Sabana
Disability Class: Hearing Difficulty
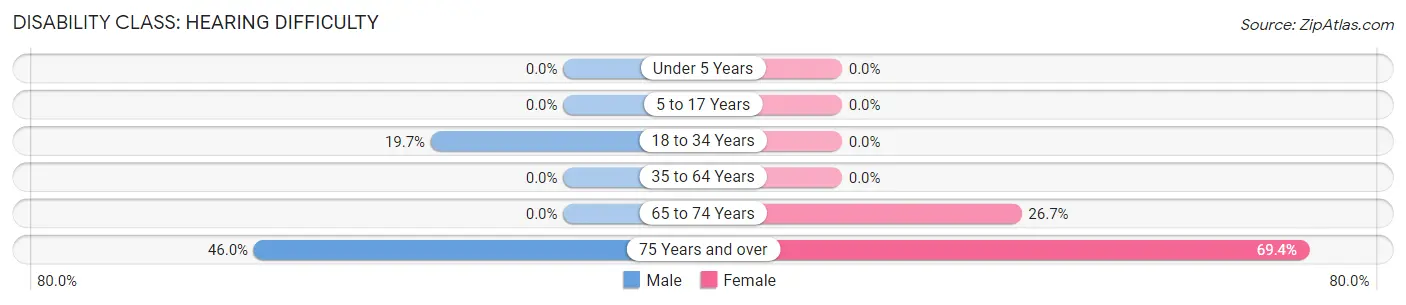
| Age Bracket | Male | Female |
| Under 5 Years | 0 (0.0%) | 0 (0.0%) |
| 5 to 17 Years | 0 (0.0%) | 0 (0.0%) |
| 18 to 34 Years | 35 (19.7%) | 0 (0.0%) |
| 35 to 64 Years | 0 (0.0%) | 0 (0.0%) |
| 65 to 74 Years | 0 (0.0%) | 16 (26.7%) |
| 75 Years and over | 17 (46.0%) | 43 (69.4%) |
Disability Class: Vision Difficulty
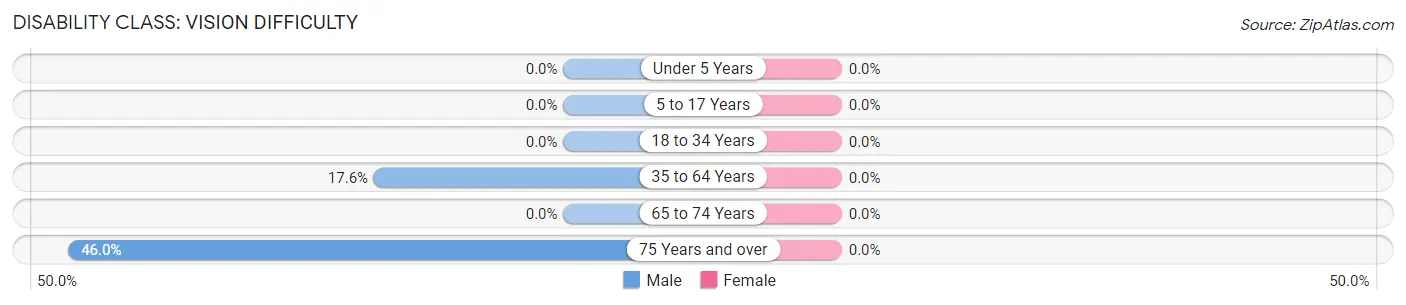
| Age Bracket | Male | Female |
| Under 5 Years | 0 (0.0%) | 0 (0.0%) |
| 5 to 17 Years | 0 (0.0%) | 0 (0.0%) |
| 18 to 34 Years | 0 (0.0%) | 0 (0.0%) |
| 35 to 64 Years | 32 (17.6%) | 0 (0.0%) |
| 65 to 74 Years | 0 (0.0%) | 0 (0.0%) |
| 75 Years and over | 17 (46.0%) | 0 (0.0%) |
Disability Class: Cognitive Difficulty
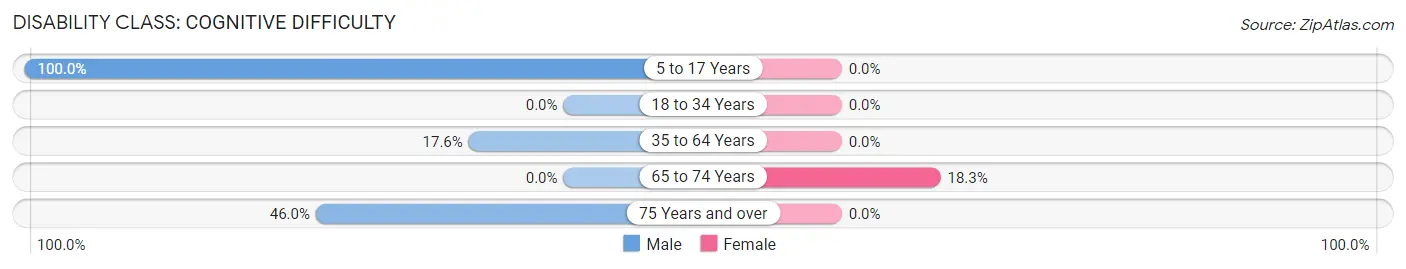
| Age Bracket | Male | Female |
| 5 to 17 Years | 19 (100.0%) | 0 (0.0%) |
| 18 to 34 Years | 0 (0.0%) | 0 (0.0%) |
| 35 to 64 Years | 32 (17.6%) | 0 (0.0%) |
| 65 to 74 Years | 0 (0.0%) | 11 (18.3%) |
| 75 Years and over | 17 (46.0%) | 0 (0.0%) |
Disability Class: Ambulatory Difficulty
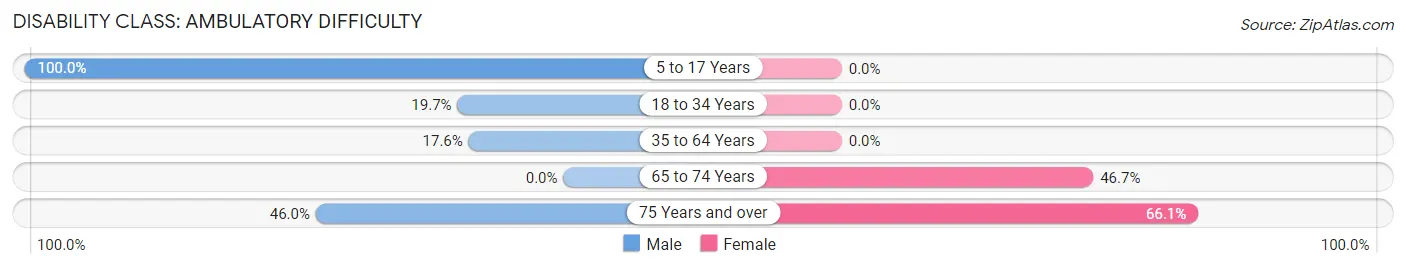
| Age Bracket | Male | Female |
| 5 to 17 Years | 19 (100.0%) | 0 (0.0%) |
| 18 to 34 Years | 35 (19.7%) | 0 (0.0%) |
| 35 to 64 Years | 32 (17.6%) | 0 (0.0%) |
| 65 to 74 Years | 0 (0.0%) | 28 (46.7%) |
| 75 Years and over | 17 (46.0%) | 41 (66.1%) |
Disability Class: Self-Care Difficulty
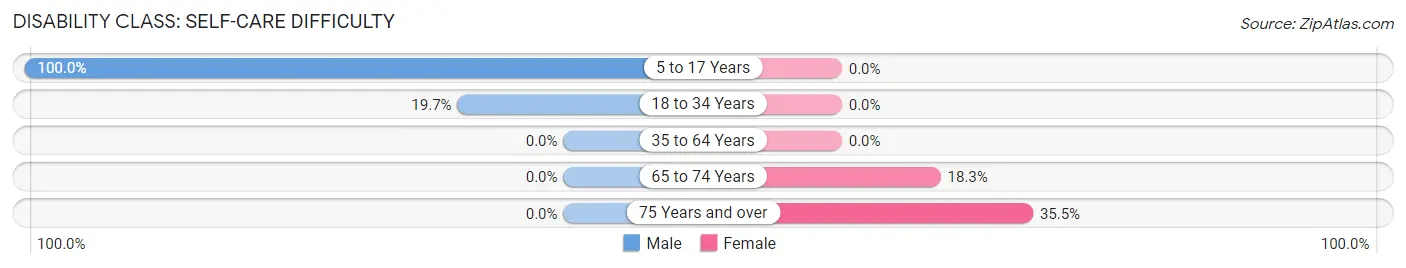
| Age Bracket | Male | Female |
| 5 to 17 Years | 19 (100.0%) | 0 (0.0%) |
| 18 to 34 Years | 35 (19.7%) | 0 (0.0%) |
| 35 to 64 Years | 0 (0.0%) | 0 (0.0%) |
| 65 to 74 Years | 0 (0.0%) | 11 (18.3%) |
| 75 Years and over | 0 (0.0%) | 22 (35.5%) |
Technology Access in Sabana
Computing Device Access in Sabana
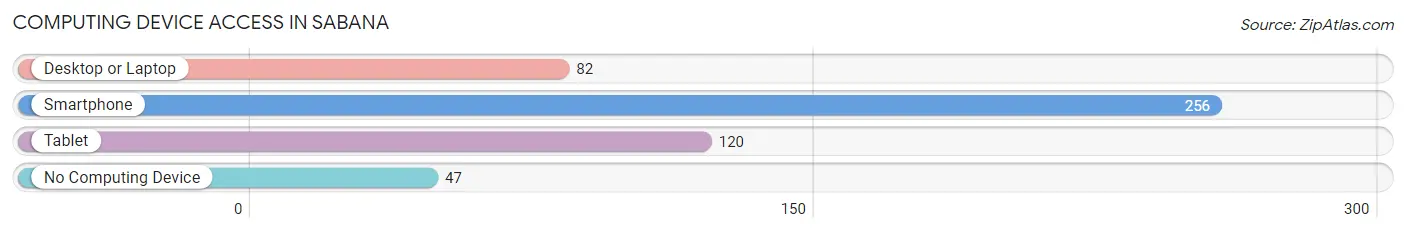
| Device Type | # Households | % Households |
| Desktop or Laptop | 82 | 27.1% |
| Smartphone | 256 | 84.5% |
| Tablet | 120 | 39.6% |
| No Computing Device | 47 | 15.5% |
| Total | 303 | 100.0% |
Internet Access in Sabana
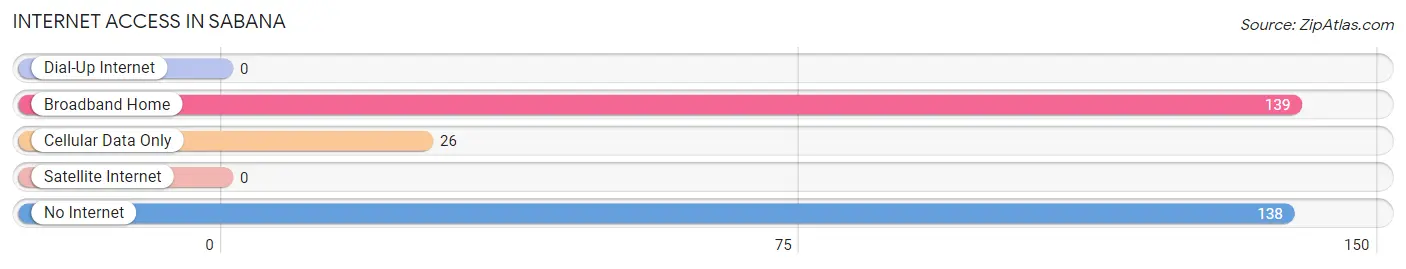
| Internet Type | # Households | % Households |
| Dial-Up Internet | 0 | 0.0% |
| Broadband Home | 139 | 45.9% |
| Cellular Data Only | 26 | 8.6% |
| Satellite Internet | 0 | 0.0% |
| No Internet | 138 | 45.5% |
| Total | 303 | 100.0% |
Sabana Summary
Sabana, Puerto Rico is a small municipality located in the northern region of the island. It is part of the San Juan-Caguas-Guaynabo Metropolitan Statistical Area and is home to approximately 8,000 people. The municipality is known for its rich history, diverse geography, vibrant economy, and unique demographics.
History
The history of Sabana dates back to the 16th century when it was founded by Spanish settlers. The original settlement was called San Antonio de la Sabana and was located near the current town of Sabana Grande. The settlement was destroyed by a hurricane in 1599 and the survivors moved to the current location of Sabana. The town was officially founded in 1620 and was part of the municipality of San Germán until 1831 when it became an independent municipality.
Sabana has a long history of agricultural production, particularly of sugar cane. The town was home to several sugar mills and was an important center of the sugar industry in Puerto Rico. The town also had a thriving tobacco industry in the 19th century.
Geography
Sabana is located in the northern region of Puerto Rico, in the San Juan-Caguas-Guaynabo Metropolitan Statistical Area. The municipality is bordered by the municipalities of San Germán, Lajas, and San Sebastián. The terrain of Sabana is mostly flat with some hills in the northern part of the municipality. The climate is tropical with an average temperature of 79°F (26°C).
The municipality is home to several rivers, including the Río Grande de Manatí, Río Grande de Arecibo, and Río Grande de San Germán. The municipality also has several small lakes, including Lago de la Sabana and Lago de la Torrecilla.
Economy
The economy of Sabana is largely based on agriculture, particularly the production of sugar cane, tobacco, and coffee. The municipality is also home to several small businesses, including restaurants, shops, and hotels.
The municipality is home to several industrial parks, including the Sabana Industrial Park and the Sabana Grande Industrial Park. These parks are home to several manufacturing companies, including pharmaceutical companies, food processing companies, and electronics companies.
Demographics
As of the 2010 census, the population of Sabana was 8,072. The population is mostly of Puerto Rican descent, with a small percentage of African and European descent. The majority of the population is Roman Catholic, with a small percentage of other religious affiliations.
The median household income in Sabana is $17,845, which is lower than the national average. The unemployment rate in the municipality is 11.2%, which is higher than the national average.
Conclusion
Sabana, Puerto Rico is a small municipality located in the northern region of the island. It is known for its rich history, diverse geography, vibrant economy, and unique demographics. The municipality is home to several small businesses, industrial parks, and agricultural production. The population of Sabana is mostly of Puerto Rican descent, with a small percentage of African and European descent. The median household income in Sabana is lower than the national average and the unemployment rate is higher than the national average.
Common Questions
What is Per Capita Income in Sabana?
Per Capita income in Sabana is $7,611.
What is the Median Family Income in Sabana?
Median Family Income in Sabana is $18,906.
What is the Median Household income in Sabana?
Median Household Income in Sabana is $17,422.
What is Inequality or Gini Index in Sabana?
Inequality or Gini Index in Sabana is 0.34.
What is the Total Population of Sabana?
Total Population of Sabana is 965.
What is the Total Male Population of Sabana?
Total Male Population of Sabana is 475.
What is the Total Female Population of Sabana?
Total Female Population of Sabana is 490.
What is the Ratio of Males per 100 Females in Sabana?
There are 96.94 Males per 100 Females in Sabana.
What is the Ratio of Females per 100 Males in Sabana?
There are 103.16 Females per 100 Males in Sabana.
What is the Median Population Age in Sabana?
Median Population Age in Sabana is 33.7 Years.
What is the Average Family Size in Sabana
Average Family Size in Sabana is 3.7 People.
What is the Average Household Size in Sabana
Average Household Size in Sabana is 3.2 People.
How Large is the Labor Force in Sabana?
There are 328 People in the Labor Forcein in Sabana.
What is the Percentage of People in the Labor Force in Sabana?
42.3% of People are in the Labor Force in Sabana.
What is the Unemployment Rate in Sabana?
Unemployment Rate in Sabana is 21.6%.