Newport Center, VT Map & Demographics
Newport Center Map
Newport Center Overview
$25,171
PER CAPITA INCOME
0.43
INEQUALITY / GINI INDEX
199
TOTAL POPULATION
94
MALE POPULATION
105
FEMALE POPULATION
89.52
MALES / 100 FEMALES
111.70
FEMALES / 100 MALES
32.6
MEDIAN AGE
2.1
AVG FAMILY SIZE
1.6
AVG HOUSEHOLD SIZE
99
LABOR FORCE [ PEOPLE ]
60.0%
PERCENT IN LABOR FORCE
7.1%
UNEMPLOYMENT RATE
Newport Center Zip Codes
Newport Center Area Codes
Income in Newport Center
Income Overview in Newport Center
| Characteristic | Number | Measure |
| Per Capita Income | 199 | $25,171 |
| Median Family Income | 50 | $0 |
| Mean Family Income | 50 | $34,740 |
| Median Household Income | 123 | $0 |
| Mean Household Income | 123 | $40,028 |
| Income Deficit | 50 | $0 |
| Wage / Income Gap (%) | 199 | 0.00% |
| Wage / Income Gap ($) | 199 | 100.00¢ per $1 |
| Gini / Inequality Index | 199 | 0.43 |
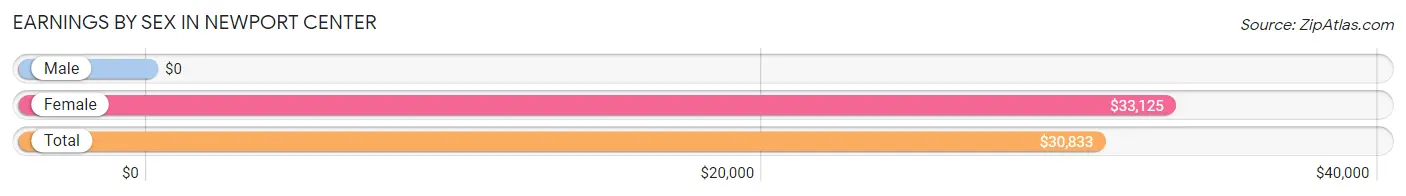
Earnings by Sex in Newport Center
| Sex | Number | Average Earnings |
| Male | 64 (55.2%) | $0 |
| Female | 52 (44.8%) | $33,125 |
| Total | 116 (100.0%) | $30,833 |
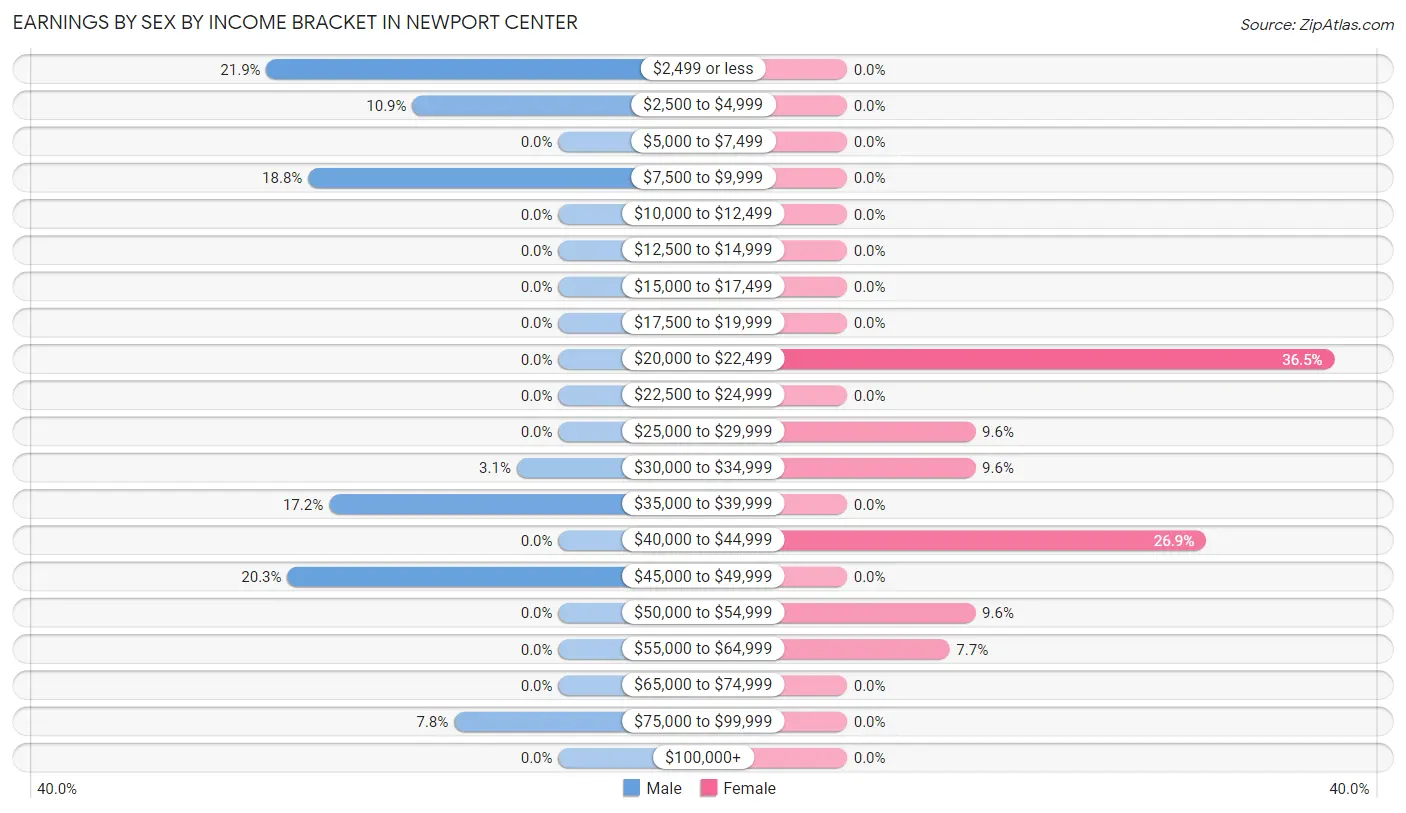
Earnings by Sex by Income Bracket in Newport Center
The most common earnings brackets in Newport Center are $2,499 or less for men (14 | 21.9%) and $20,000 to $22,499 for women (19 | 36.5%).
| Income | Male | Female |
| $2,499 or less | 14 (21.9%) | 0 (0.0%) |
| $2,500 to $4,999 | 7 (10.9%) | 0 (0.0%) |
| $5,000 to $7,499 | 0 (0.0%) | 0 (0.0%) |
| $7,500 to $9,999 | 12 (18.8%) | 0 (0.0%) |
| $10,000 to $12,499 | 0 (0.0%) | 0 (0.0%) |
| $12,500 to $14,999 | 0 (0.0%) | 0 (0.0%) |
| $15,000 to $17,499 | 0 (0.0%) | 0 (0.0%) |
| $17,500 to $19,999 | 0 (0.0%) | 0 (0.0%) |
| $20,000 to $22,499 | 0 (0.0%) | 19 (36.5%) |
| $22,500 to $24,999 | 0 (0.0%) | 0 (0.0%) |
| $25,000 to $29,999 | 0 (0.0%) | 5 (9.6%) |
| $30,000 to $34,999 | 2 (3.1%) | 5 (9.6%) |
| $35,000 to $39,999 | 11 (17.2%) | 0 (0.0%) |
| $40,000 to $44,999 | 0 (0.0%) | 14 (26.9%) |
| $45,000 to $49,999 | 13 (20.3%) | 0 (0.0%) |
| $50,000 to $54,999 | 0 (0.0%) | 5 (9.6%) |
| $55,000 to $64,999 | 0 (0.0%) | 4 (7.7%) |
| $65,000 to $74,999 | 0 (0.0%) | 0 (0.0%) |
| $75,000 to $99,999 | 5 (7.8%) | 0 (0.0%) |
| $100,000+ | 0 (0.0%) | 0 (0.0%) |
| Total | 64 (100.0%) | 52 (100.0%) |
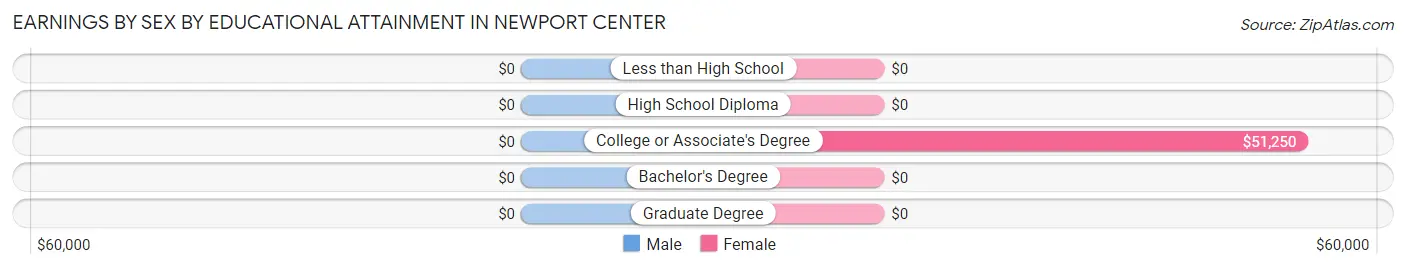
Earnings by Sex by Educational Attainment in Newport Center
| Educational Attainment | Male Income | Female Income |
| Less than High School | - | - |
| High School Diploma | - | - |
| College or Associate's Degree | - | - |
| Bachelor's Degree | - | - |
| Graduate Degree | - | - |
| Total | $35,909 | $34,688 |
Family Income in Newport Center
Family Income Brackets in Newport Center
According to the Newport Center family income data, there are 25 families falling into the less than $10,000 income range, which is the most common income bracket and makes up 50.0% of all families.
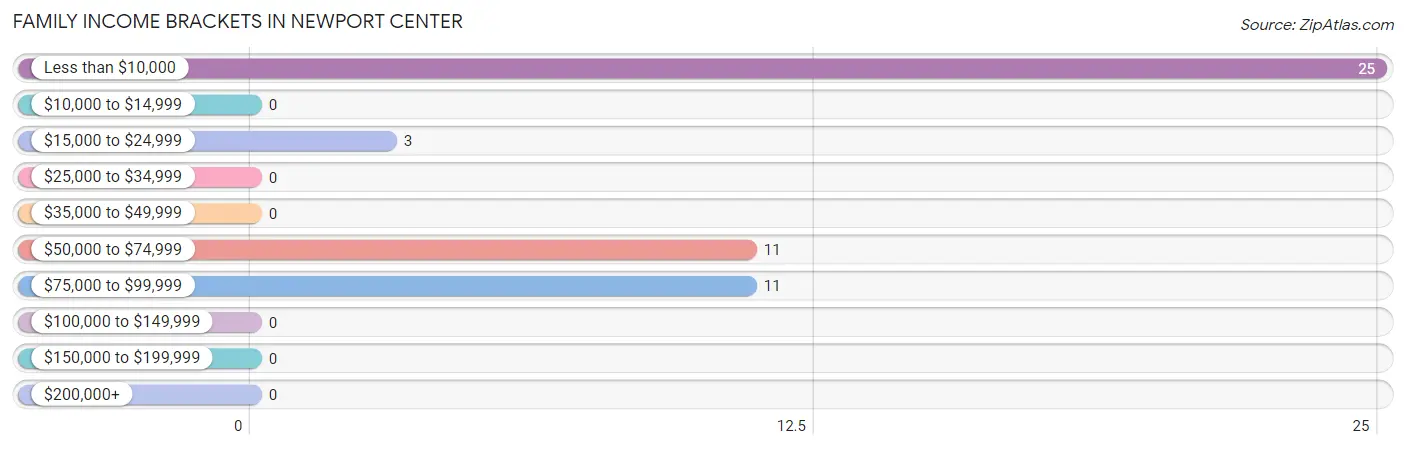
| Income Bracket | # Families | % Families |
| Less than $10,000 | 25 | 50.0% |
| $10,000 to $14,999 | 0 | 0.0% |
| $15,000 to $24,999 | 3 | 6.0% |
| $25,000 to $34,999 | 0 | 0.0% |
| $35,000 to $49,999 | 0 | 0.0% |
| $50,000 to $74,999 | 11 | 22.0% |
| $75,000 to $99,999 | 11 | 22.0% |
| $100,000 to $149,999 | 0 | 0.0% |
| $150,000 to $199,999 | 0 | 0.0% |
| $200,000+ | 0 | 0.0% |
Family Income by Famaliy Size in Newport Center
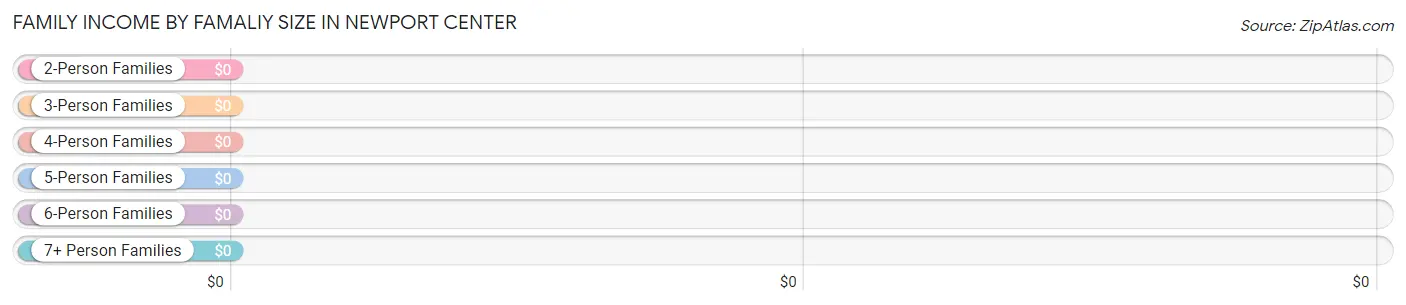
| Income Bracket | # Families | Median Income |
| 2-Person Families | 50 (100.0%) | $0 |
| 3-Person Families | 0 (0.0%) | $0 |
| 4-Person Families | 0 (0.0%) | $0 |
| 5-Person Families | 0 (0.0%) | $0 |
| 6-Person Families | 0 (0.0%) | $0 |
| 7+ Person Families | 0 (0.0%) | $0 |
| Total | 50 (100.0%) | $0 |
Family Income by Number of Earners in Newport Center
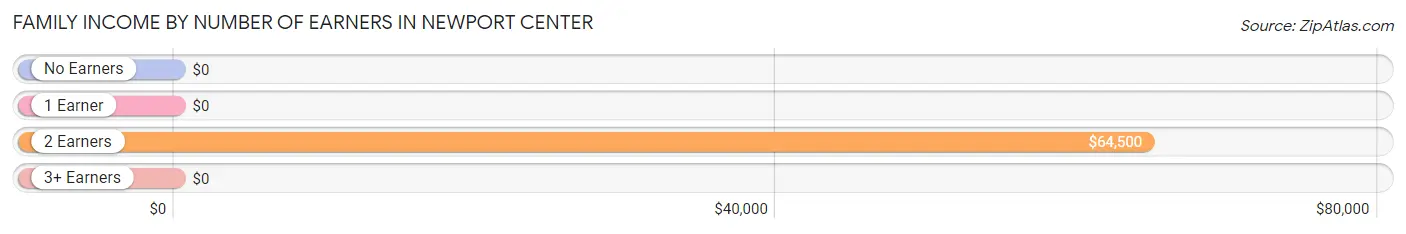
| Number of Earners | # Families | Median Income |
| No Earners | 24 (48.0%) | $0 |
| 1 Earner | 16 (32.0%) | $0 |
| 2 Earners | 10 (20.0%) | $64,500 |
| 3+ Earners | 0 (0.0%) | $0 |
| Total | 50 (100.0%) | $0 |
Household Income in Newport Center
Household Income Brackets in Newport Center
With 48 households falling in the category, the $15,000 to $24,999 income range is the most frequent in Newport Center, accounting for 39.0% of all households.
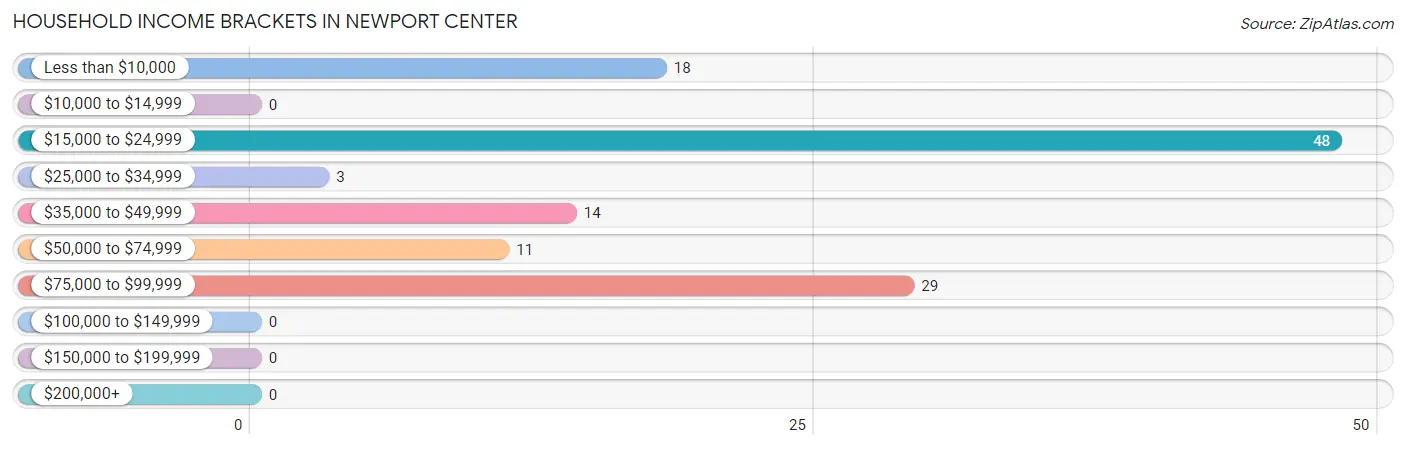
| Income Bracket | # Households | % Households |
| Less than $10,000 | 18 | 14.6% |
| $10,000 to $14,999 | 0 | 0.0% |
| $15,000 to $24,999 | 48 | 39.0% |
| $25,000 to $34,999 | 3 | 2.4% |
| $35,000 to $49,999 | 14 | 11.4% |
| $50,000 to $74,999 | 11 | 8.9% |
| $75,000 to $99,999 | 29 | 23.6% |
| $100,000 to $149,999 | 0 | 0.0% |
| $150,000 to $199,999 | 0 | 0.0% |
| $200,000+ | 0 | 0.0% |
Household Income by Householder Age in Newport Center
The median household income in Newport Center is $0, with the highest median household income of $75,625 found in the 45 to 64 years age bracket for the primary householder. A total of 24 households (19.5%) fall into this category. Meanwhile, the 15 to 24 years age bracket for the primary householder has the lowest median household income of $0, with 33 households (26.8%) in this group.
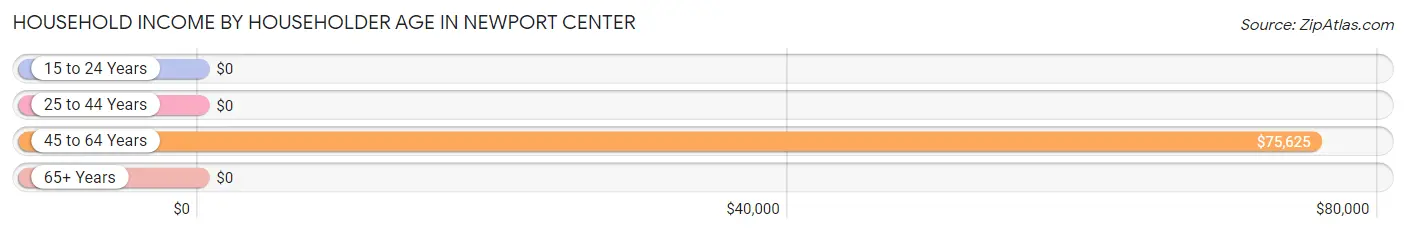
| Income Bracket | # Households | Median Income |
| 15 to 24 Years | 33 (26.8%) | $0 |
| 25 to 44 Years | 25 (20.3%) | $0 |
| 45 to 64 Years | 24 (19.5%) | $75,625 |
| 65+ Years | 41 (33.3%) | $0 |
| Total | 123 (100.0%) | $0 |
Poverty in Newport Center
Income Below Poverty by Sex and Age in Newport Center
With 46.8% poverty level for males and 24.8% for females among the residents of Newport Center, under 5 year old males and 25 to 34 year old females are the most vulnerable to poverty, with 5 males (100.0%) and 24 females (100.0%) in their respective age groups living below the poverty level.
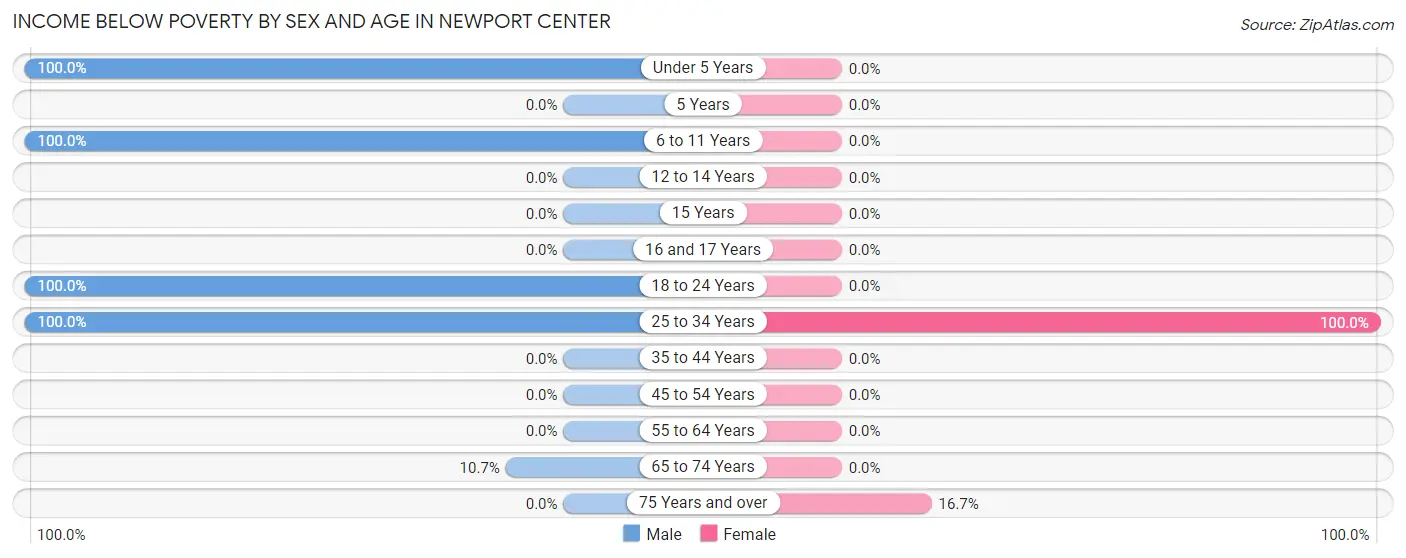
| Age Bracket | Male | Female |
| Under 5 Years | 5 (100.0%) | 0 (0.0%) |
| 5 Years | 0 (0.0%) | 0 (0.0%) |
| 6 to 11 Years | 15 (100.0%) | 0 (0.0%) |
| 12 to 14 Years | 0 (0.0%) | 0 (0.0%) |
| 15 Years | 0 (0.0%) | 0 (0.0%) |
| 16 and 17 Years | 0 (0.0%) | 0 (0.0%) |
| 18 to 24 Years | 14 (100.0%) | 0 (0.0%) |
| 25 to 34 Years | 7 (100.0%) | 24 (100.0%) |
| 35 to 44 Years | 0 (0.0%) | 0 (0.0%) |
| 45 to 54 Years | 0 (0.0%) | 0 (0.0%) |
| 55 to 64 Years | 0 (0.0%) | 0 (0.0%) |
| 65 to 74 Years | 3 (10.7%) | 0 (0.0%) |
| 75 Years and over | 0 (0.0%) | 2 (16.7%) |
| Total | 44 (46.8%) | 26 (24.8%) |
Income Above Poverty by Sex and Age in Newport Center
According to the poverty statistics in Newport Center, males aged 45 to 54 years and females aged 12 to 14 years are the age groups that are most secure financially, with 100.0% of males and 100.0% of females in these age groups living above the poverty line.
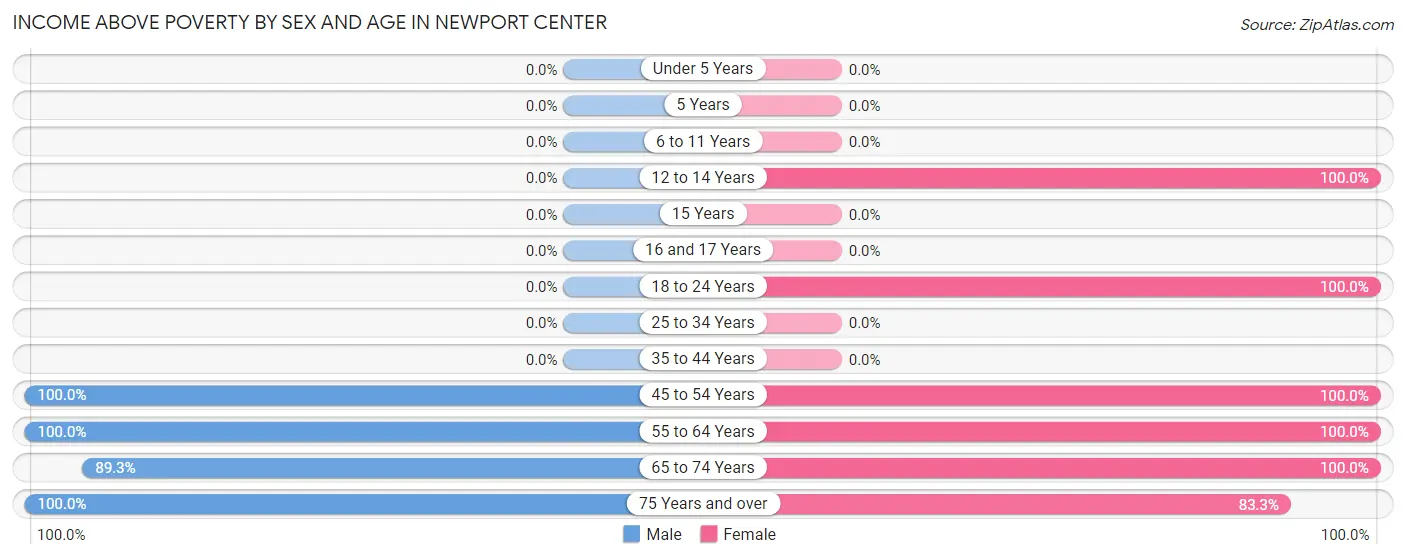
| Age Bracket | Male | Female |
| Under 5 Years | 0 (0.0%) | 0 (0.0%) |
| 5 Years | 0 (0.0%) | 0 (0.0%) |
| 6 to 11 Years | 0 (0.0%) | 0 (0.0%) |
| 12 to 14 Years | 0 (0.0%) | 14 (100.0%) |
| 15 Years | 0 (0.0%) | 0 (0.0%) |
| 16 and 17 Years | 0 (0.0%) | 0 (0.0%) |
| 18 to 24 Years | 0 (0.0%) | 33 (100.0%) |
| 25 to 34 Years | 0 (0.0%) | 0 (0.0%) |
| 35 to 44 Years | 0 (0.0%) | 0 (0.0%) |
| 45 to 54 Years | 2 (100.0%) | 11 (100.0%) |
| 55 to 64 Years | 20 (100.0%) | 8 (100.0%) |
| 65 to 74 Years | 25 (89.3%) | 3 (100.0%) |
| 75 Years and over | 3 (100.0%) | 10 (83.3%) |
| Total | 50 (53.2%) | 79 (75.2%) |
Income Below Poverty Among Married-Couple Families in Newport Center
The poverty statistics for married-couple families in Newport Center show that 15.0% or 3 of the total 20 families live below the poverty line. Families with no children have the highest poverty rate of 15.0%, comprising of 3 families. On the other hand, families with no children have the lowest poverty rate of 15.0%, which includes 3 families.
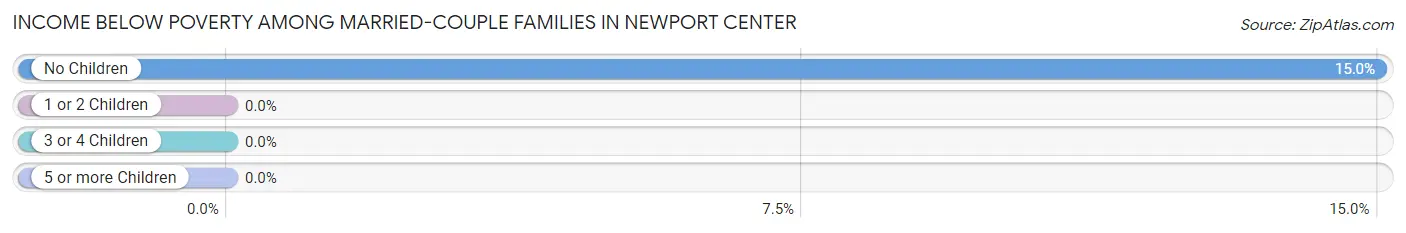
| Children | Above Poverty | Below Poverty |
| No Children | 17 (85.0%) | 3 (15.0%) |
| 1 or 2 Children | 0 (0.0%) | 0 (0.0%) |
| 3 or 4 Children | 0 (0.0%) | 0 (0.0%) |
| 5 or more Children | 0 (0.0%) | 0 (0.0%) |
| Total | 17 (85.0%) | 3 (15.0%) |
Income Below Poverty Among Single-Parent Households in Newport Center
According to the poverty data in Newport Center, 100.0% or 7 single-father households and 78.3% or 18 single-mother households are living below the poverty line. Among single-father households, those with 1 or 2 children have the highest poverty rate, with 7 households (100.0%) experiencing poverty. Likewise, among single-mother households, those with 1 or 2 children have the highest poverty rate, with 18 households (78.3%) falling below the poverty line.
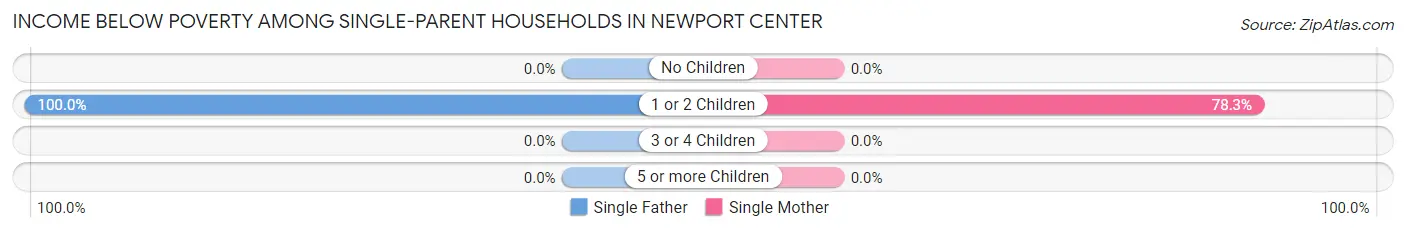
| Children | Single Father | Single Mother |
| No Children | 0 (0.0%) | 0 (0.0%) |
| 1 or 2 Children | 7 (100.0%) | 18 (78.3%) |
| 3 or 4 Children | 0 (0.0%) | 0 (0.0%) |
| 5 or more Children | 0 (0.0%) | 0 (0.0%) |
| Total | 7 (100.0%) | 18 (78.3%) |
Income Below Poverty Among Married-Couple vs Single-Parent Households in Newport Center
The poverty data for Newport Center shows that 3 of the married-couple family households (15.0%) and 25 of the single-parent households (83.3%) are living below the poverty level. Within the married-couple family households, those with no children have the highest poverty rate, with 3 households (15.0%) falling below the poverty line. Among the single-parent households, those with 1 or 2 children have the highest poverty rate, with 25 household (83.3%) living below poverty.
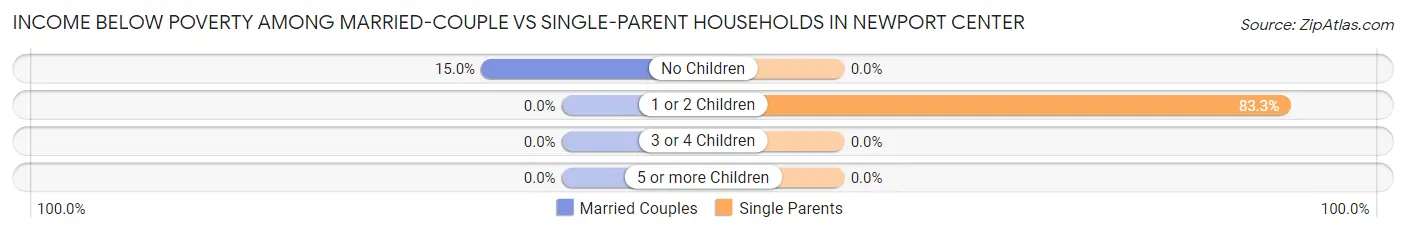
| Children | Married-Couple Families | Single-Parent Households |
| No Children | 3 (15.0%) | 0 (0.0%) |
| 1 or 2 Children | 0 (0.0%) | 25 (83.3%) |
| 3 or 4 Children | 0 (0.0%) | 0 (0.0%) |
| 5 or more Children | 0 (0.0%) | 0 (0.0%) |
| Total | 3 (15.0%) | 25 (83.3%) |
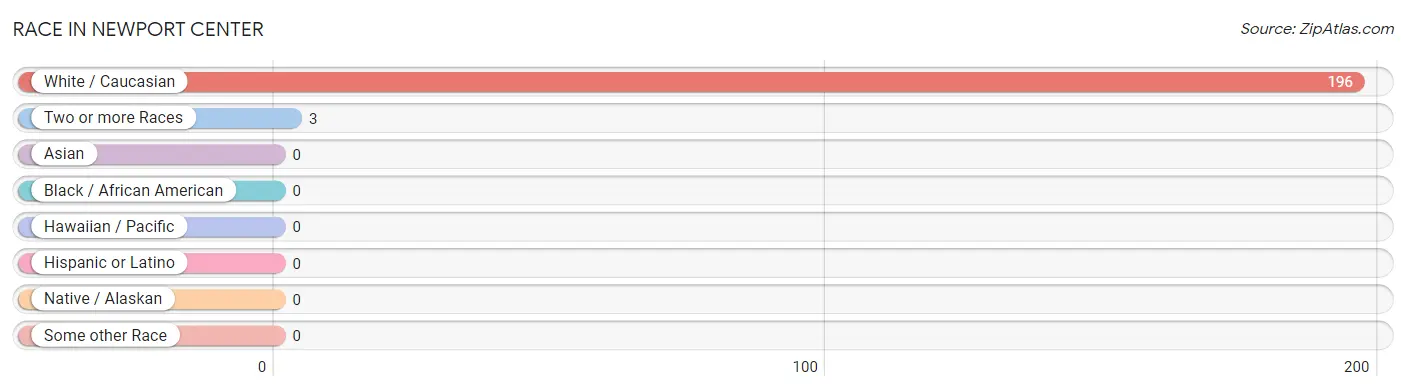
Race in Newport Center
The most populous races in Newport Center are White / Caucasian (196 | 98.5%), and Two or more Races (3 | 1.5%).
| Race | # Population | % Population |
| Asian | 0 | 0.0% |
| Black / African American | 0 | 0.0% |
| Hawaiian / Pacific | 0 | 0.0% |
| Hispanic or Latino | 0 | 0.0% |
| Native / Alaskan | 0 | 0.0% |
| White / Caucasian | 196 | 98.5% |
| Two or more Races | 3 | 1.5% |
| Some other Race | 0 | 0.0% |
| Total | 199 | 100.0% |
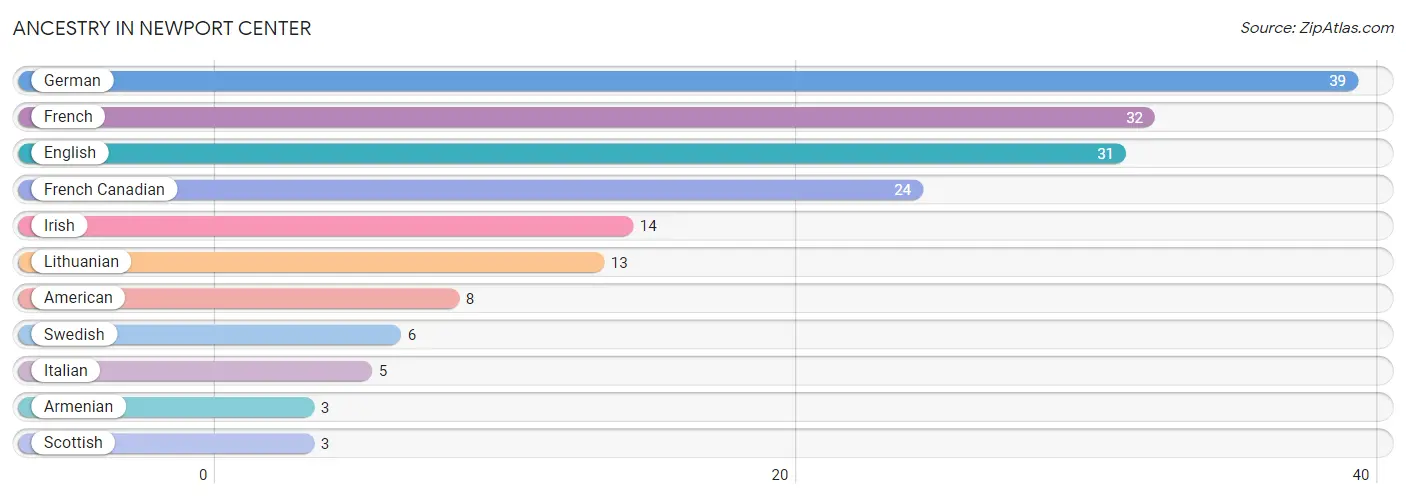
Ancestry in Newport Center
The most populous ancestries reported in Newport Center are German (39 | 19.6%), French (32 | 16.1%), English (31 | 15.6%), French Canadian (24 | 12.1%), and Irish (14 | 7.0%), together accounting for 70.4% of all Newport Center residents.
| Ancestry | # Population | % Population |
| American | 8 | 4.0% |
| Armenian | 3 | 1.5% |
| English | 31 | 15.6% |
| French | 32 | 16.1% |
| French Canadian | 24 | 12.1% |
| German | 39 | 19.6% |
| Irish | 14 | 7.0% |
| Italian | 5 | 2.5% |
| Lithuanian | 13 | 6.5% |
| Scottish | 3 | 1.5% |
| Swedish | 6 | 3.0% | View All 11 Rows |
Immigrants in Newport Center

| Immigration Origin | # Population | % Population | View All 0 Rows |
Sex and Age in Newport Center
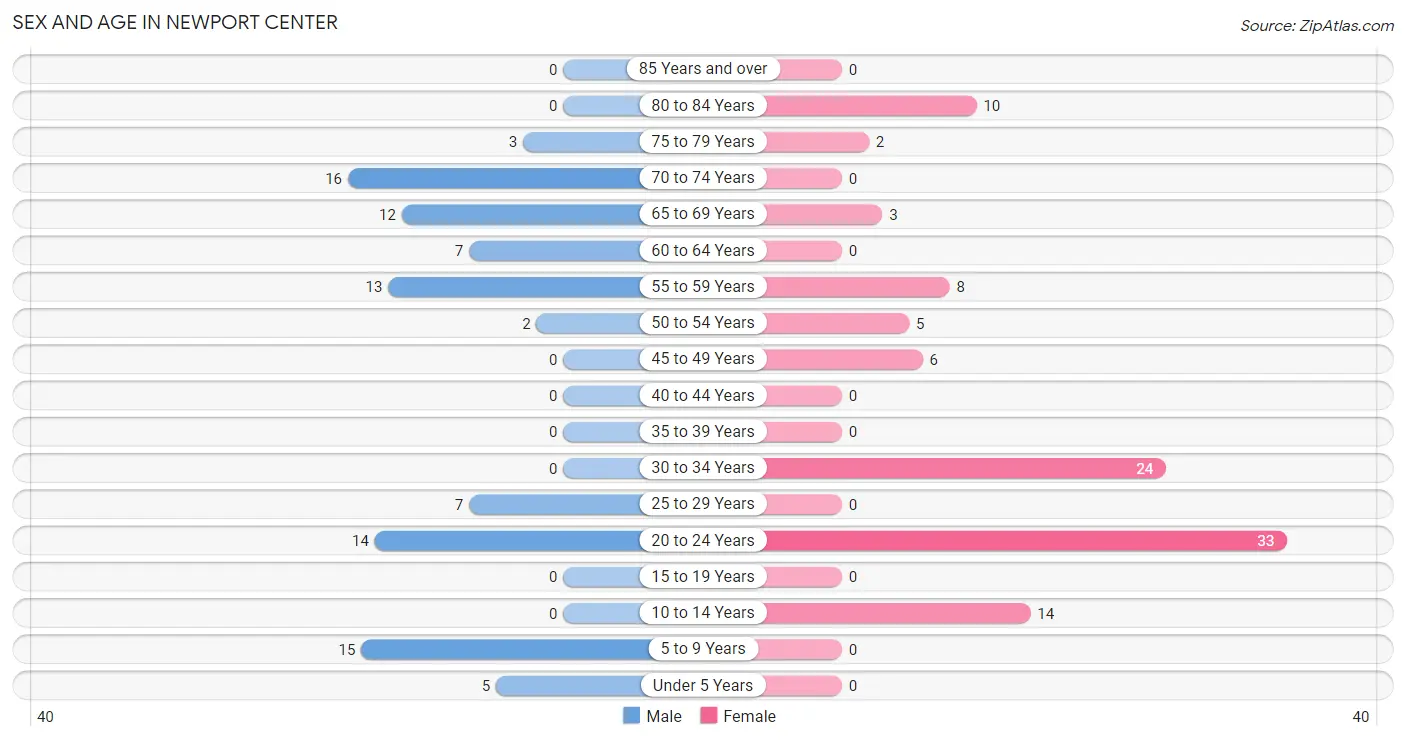
Sex and Age in Newport Center
The most populous age groups in Newport Center are 70 to 74 Years (16 | 17.0%) for men and 20 to 24 Years (33 | 31.4%) for women.
| Age Bracket | Male | Female |
| Under 5 Years | 5 (5.3%) | 0 (0.0%) |
| 5 to 9 Years | 15 (16.0%) | 0 (0.0%) |
| 10 to 14 Years | 0 (0.0%) | 14 (13.3%) |
| 15 to 19 Years | 0 (0.0%) | 0 (0.0%) |
| 20 to 24 Years | 14 (14.9%) | 33 (31.4%) |
| 25 to 29 Years | 7 (7.4%) | 0 (0.0%) |
| 30 to 34 Years | 0 (0.0%) | 24 (22.9%) |
| 35 to 39 Years | 0 (0.0%) | 0 (0.0%) |
| 40 to 44 Years | 0 (0.0%) | 0 (0.0%) |
| 45 to 49 Years | 0 (0.0%) | 6 (5.7%) |
| 50 to 54 Years | 2 (2.1%) | 5 (4.8%) |
| 55 to 59 Years | 13 (13.8%) | 8 (7.6%) |
| 60 to 64 Years | 7 (7.4%) | 0 (0.0%) |
| 65 to 69 Years | 12 (12.8%) | 3 (2.9%) |
| 70 to 74 Years | 16 (17.0%) | 0 (0.0%) |
| 75 to 79 Years | 3 (3.2%) | 2 (1.9%) |
| 80 to 84 Years | 0 (0.0%) | 10 (9.5%) |
| 85 Years and over | 0 (0.0%) | 0 (0.0%) |
| Total | 94 (100.0%) | 105 (100.0%) |
Families and Households in Newport Center
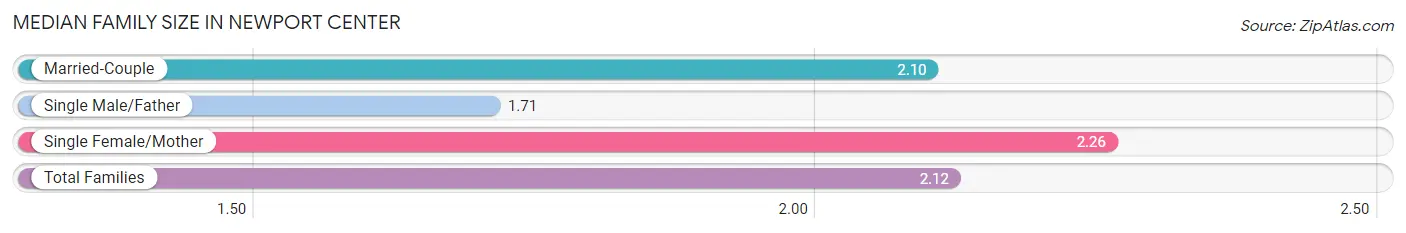
Median Family Size in Newport Center
The median family size in Newport Center is 2.12 persons per family, with single female/mother families (23 | 46.0%) accounting for the largest median family size of 2.26 persons per family. On the other hand, single male/father families (7 | 14.0%) represent the smallest median family size with 1.71 persons per family.
| Family Type | # Families | Family Size |
| Married-Couple | 20 (40.0%) | 2.10 |
| Single Male/Father | 7 (14.0%) | 1.71 |
| Single Female/Mother | 23 (46.0%) | 2.26 |
| Total Families | 50 (100.0%) | 2.12 |
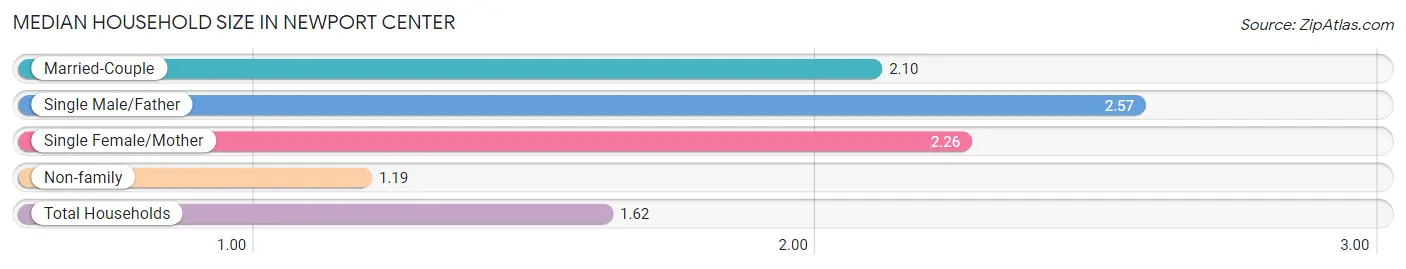
Median Household Size in Newport Center
The median household size in Newport Center is 1.62 persons per household, with single male/father households (7 | 5.7%) accounting for the largest median household size of 2.57 persons per household. non-family households (73 | 59.4%) represent the smallest median household size with 1.19 persons per household.
| Household Type | # Households | Household Size |
| Married-Couple | 20 (16.3%) | 2.10 |
| Single Male/Father | 7 (5.7%) | 2.57 |
| Single Female/Mother | 23 (18.7%) | 2.26 |
| Non-family | 73 (59.4%) | 1.19 |
| Total Households | 123 (100.0%) | 1.62 |
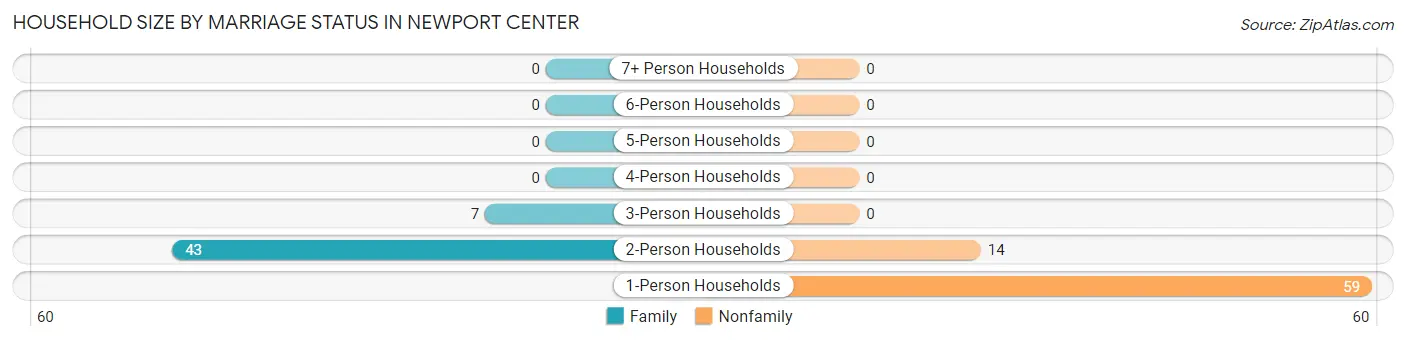
Household Size by Marriage Status in Newport Center
Out of a total of 123 households in Newport Center, 50 (40.6%) are family households, while 73 (59.4%) are nonfamily households. The most numerous type of family households are 2-person households, comprising 43, and the most common type of nonfamily households are 1-person households, comprising 59.
| Household Size | Family Households | Nonfamily Households |
| 1-Person Households | - | 59 (48.0%) |
| 2-Person Households | 43 (35.0%) | 14 (11.4%) |
| 3-Person Households | 7 (5.7%) | 0 (0.0%) |
| 4-Person Households | 0 (0.0%) | 0 (0.0%) |
| 5-Person Households | 0 (0.0%) | 0 (0.0%) |
| 6-Person Households | 0 (0.0%) | 0 (0.0%) |
| 7+ Person Households | 0 (0.0%) | 0 (0.0%) |
| Total | 50 (40.6%) | 73 (59.4%) |
Female Fertility in Newport Center
Fertility by Age in Newport Center
| Age Bracket | Women with Births | Births / 1,000 Women |
| 15 to 19 years | 0 (0.0%) | 0.0 |
| 20 to 34 years | 0 (0.0%) | 0.0 |
| 35 to 50 years | 0 (0.0%) | 0.0 |
| Total | 0 (0.0%) | 0.0 |
Fertility by Age by Marriage Status in Newport Center
| Age Bracket | Married | Unmarried |
| 15 to 19 years | 0 (0.0%) | 0 (0.0%) |
| 20 to 34 years | 0 (0.0%) | 0 (0.0%) |
| 35 to 50 years | 0 (0.0%) | 0 (0.0%) |
| Total | 0 (0.0%) | 0 (0.0%) |
Fertility by Education in Newport Center
| Educational Attainment | Women with Births | Births / 1,000 Women |
| Less than High School | 0 (0.0%) | 0.0 |
| High School Diploma | 0 (0.0%) | 0.0 |
| College or Associate's Degree | 0 (0.0%) | 0.0 |
| Bachelor's Degree | 0 (0.0%) | 0.0 |
| Graduate Degree | 0 (0.0%) | 0.0 |
| Total | 0 (0.0%) | 0.0 |
Fertility by Education by Marriage Status in Newport Center
| Educational Attainment | Married | Unmarried |
| Less than High School | 0 (0.0%) | 0 (0.0%) |
| High School Diploma | 0 (0.0%) | 0 (0.0%) |
| College or Associate's Degree | 0 (0.0%) | 0 (0.0%) |
| Bachelor's Degree | 0 (0.0%) | 0 (0.0%) |
| Graduate Degree | 0 (0.0%) | 0 (0.0%) |
| Total | 0 (0.0%) | 0 (0.0%) |
Employment Characteristics in Newport Center
Employment by Class of Employer in Newport Center
Among the 92 employed individuals in Newport Center, private company employees (67 | 72.8%), self-employed (not incorporated) (15 | 16.3%), and not-for-profit organizations (10 | 10.9%) make up the most common classes of employment.
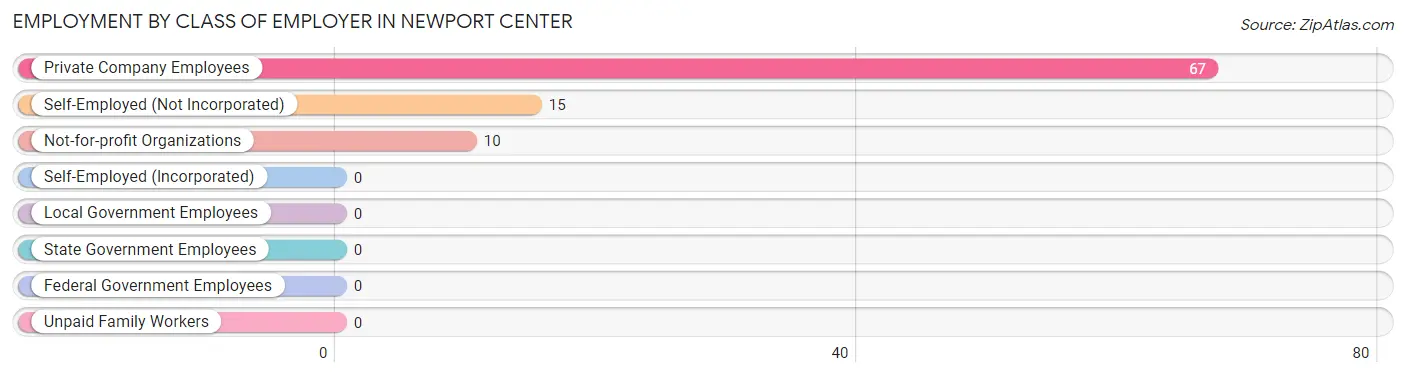
| Employer Class | # Employees | % Employees |
| Private Company Employees | 67 | 72.8% |
| Self-Employed (Incorporated) | 0 | 0.0% |
| Self-Employed (Not Incorporated) | 15 | 16.3% |
| Not-for-profit Organizations | 10 | 10.9% |
| Local Government Employees | 0 | 0.0% |
| State Government Employees | 0 | 0.0% |
| Federal Government Employees | 0 | 0.0% |
| Unpaid Family Workers | 0 | 0.0% |
| Total | 92 | 100.0% |
Employment Status by Age in Newport Center
According to the labor force statistics for Newport Center, out of the total population over 16 years of age (165), 60.0% or 99 individuals are in the labor force, with 7.1% or 7 of them unemployed. The age group with the highest labor force participation rate is 20 to 24 years, with 100.0% or 47 individuals in the labor force. Within the labor force, the 25 to 29 years age range has the highest percentage of unemployed individuals, with 100.0% or 7 of them being unemployed.
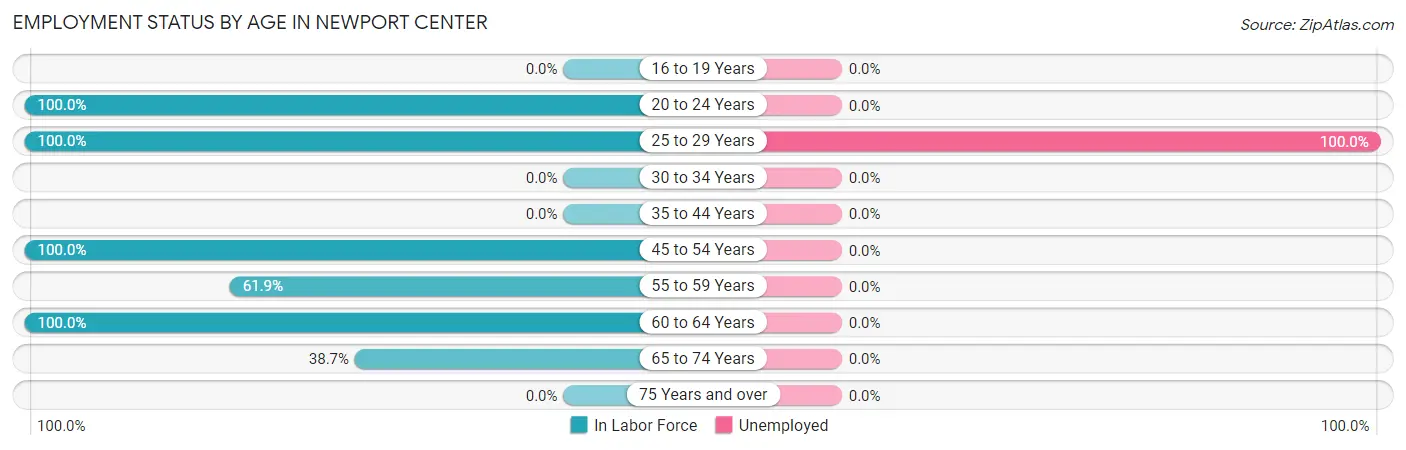
| Age Bracket | In Labor Force | Unemployed |
| 16 to 19 Years | 0 (0.0%) | 0 (0.0%) |
| 20 to 24 Years | 47 (100.0%) | 0 (0.0%) |
| 25 to 29 Years | 7 (100.0%) | 7 (100.0%) |
| 30 to 34 Years | 0 (0.0%) | 0 (0.0%) |
| 35 to 44 Years | 0 (0.0%) | 0 (0.0%) |
| 45 to 54 Years | 13 (100.0%) | 0 (0.0%) |
| 55 to 59 Years | 13 (61.9%) | 0 (0.0%) |
| 60 to 64 Years | 7 (100.0%) | 0 (0.0%) |
| 65 to 74 Years | 12 (38.7%) | 0 (0.0%) |
| 75 Years and over | 0 (0.0%) | 0 (0.0%) |
| Total | 99 (60.0%) | 7 (7.1%) |
Employment Status by Educational Attainment in Newport Center
According to labor force statistics for Newport Center, 55.6% of individuals (40) out of the total population between 25 and 64 years of age (72) are in the labor force, with 17.5% or 7 of them being unemployed. The group with the highest labor force participation rate are those with the educational attainment of less than high school, with 77.8% or 14 individuals in the labor force. Within the labor force, individuals with less than high school education have the highest percentage of unemployment, with 50.0% or 7 of them being unemployed.
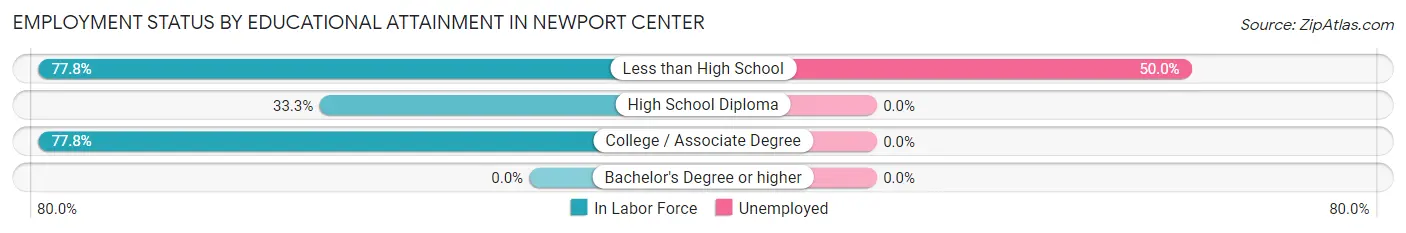
| Educational Attainment | In Labor Force | Unemployed |
| Less than High School | 14 (77.8%) | 9 (50.0%) |
| High School Diploma | 12 (33.3%) | 0 (0.0%) |
| College / Associate Degree | 14 (77.8%) | 0 (0.0%) |
| Bachelor's Degree or higher | 0 (0.0%) | 0 (0.0%) |
| Total | 40 (55.6%) | 13 (17.5%) |
Employment Occupations by Sex in Newport Center
Management, Business, Science and Arts Occupations
The most common Management, Business, Science and Arts occupations in Newport Center are , and Business & Financial (5 | 5.4%).
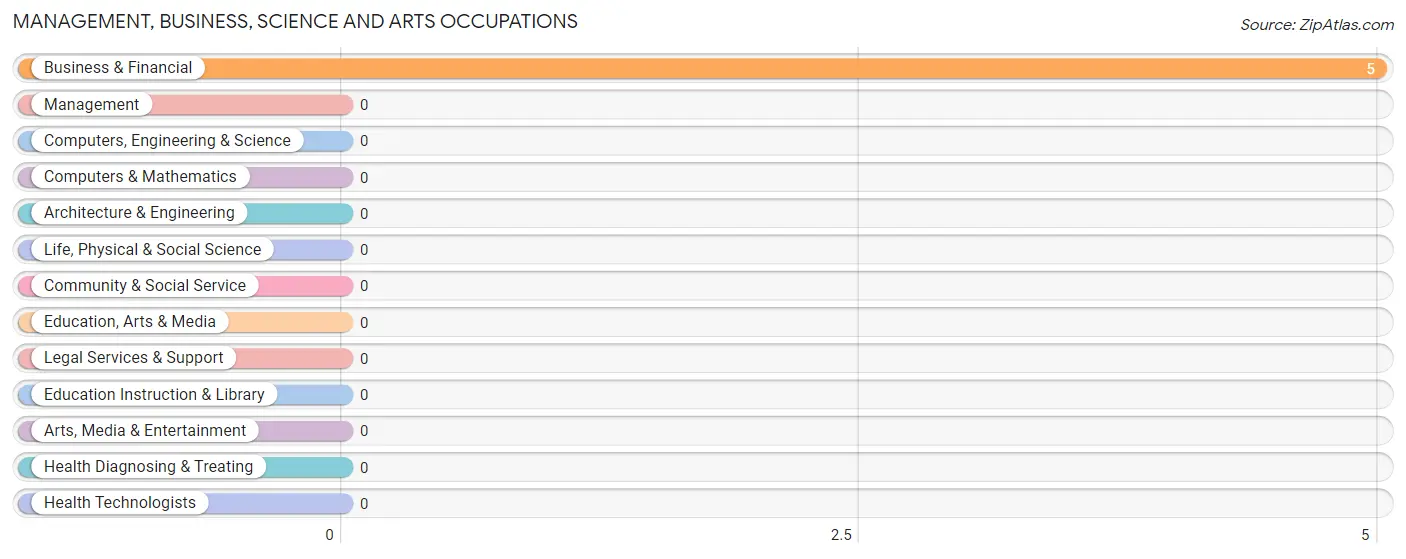
Management, Business, Science and Arts Occupations by Sex
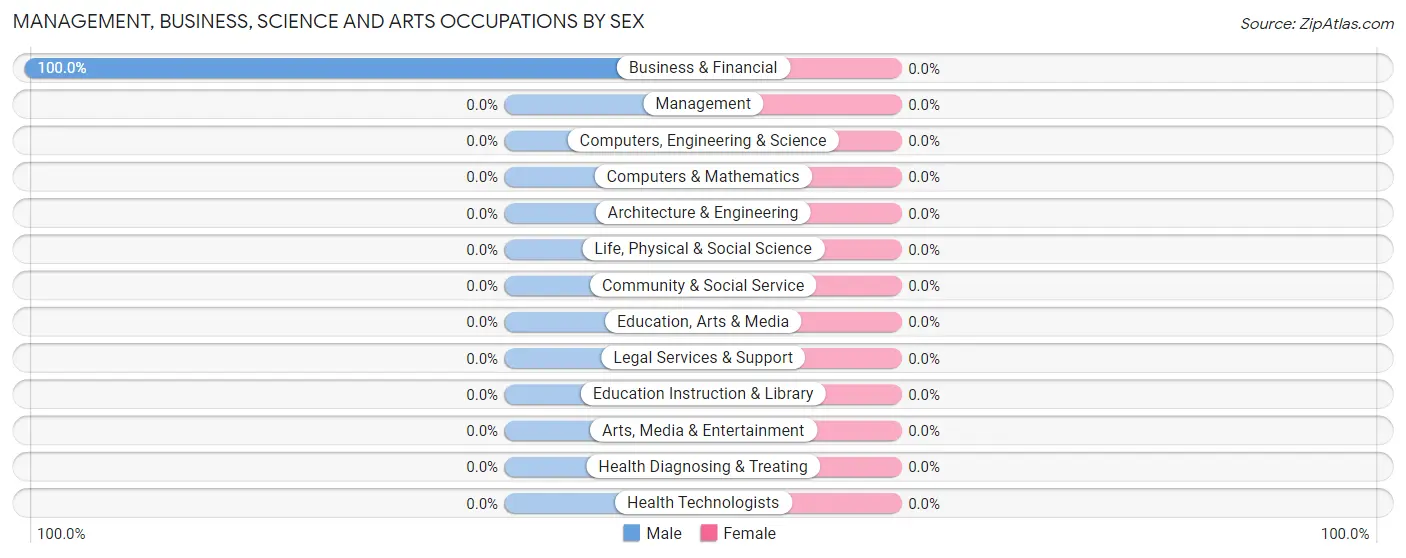
| Occupation | Male | Female |
| Management | 0 (0.0%) | 0 (0.0%) |
| Business & Financial | 5 (100.0%) | 0 (0.0%) |
| Computers, Engineering & Science | 0 (0.0%) | 0 (0.0%) |
| Computers & Mathematics | 0 (0.0%) | 0 (0.0%) |
| Architecture & Engineering | 0 (0.0%) | 0 (0.0%) |
| Life, Physical & Social Science | 0 (0.0%) | 0 (0.0%) |
| Community & Social Service | 0 (0.0%) | 0 (0.0%) |
| Education, Arts & Media | 0 (0.0%) | 0 (0.0%) |
| Legal Services & Support | 0 (0.0%) | 0 (0.0%) |
| Education Instruction & Library | 0 (0.0%) | 0 (0.0%) |
| Arts, Media & Entertainment | 0 (0.0%) | 0 (0.0%) |
| Health Diagnosing & Treating | 0 (0.0%) | 0 (0.0%) |
| Health Technologists | 0 (0.0%) | 0 (0.0%) |
| Total (Category) | 5 (100.0%) | 0 (0.0%) |
| Total (Overall) | 44 (47.8%) | 48 (52.2%) |
Services Occupations
The most common Services occupations in Newport Center are , and Food Preparation & Serving (38 | 41.3%).
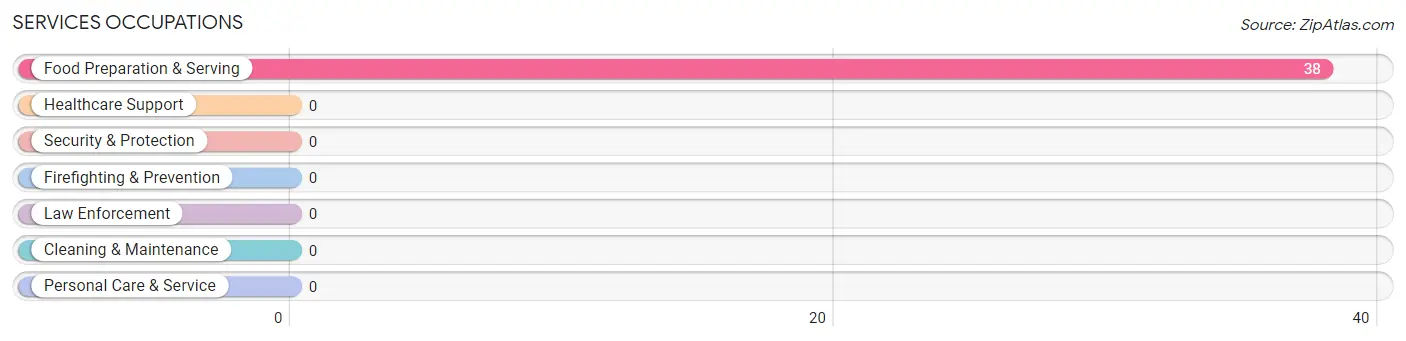
Services Occupations by Sex
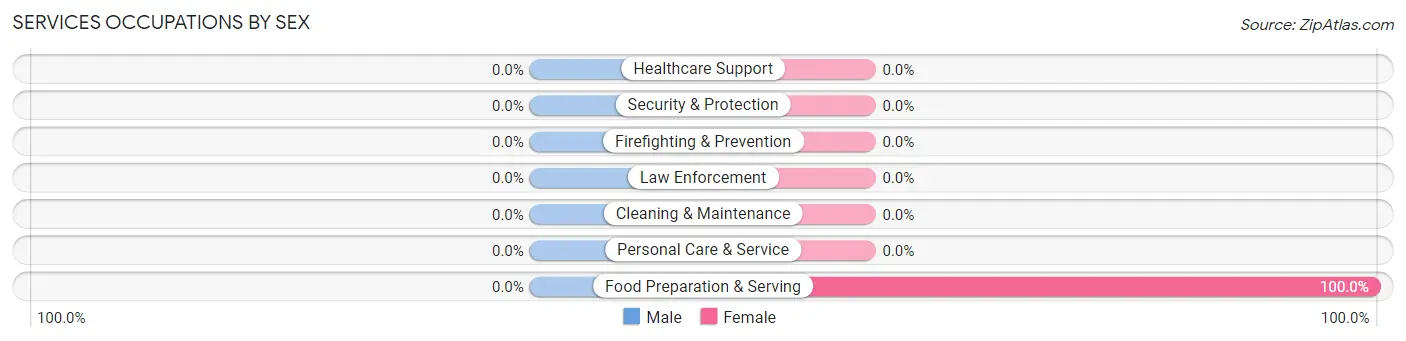
| Occupation | Male | Female |
| Healthcare Support | 0 (0.0%) | 0 (0.0%) |
| Security & Protection | 0 (0.0%) | 0 (0.0%) |
| Firefighting & Prevention | 0 (0.0%) | 0 (0.0%) |
| Law Enforcement | 0 (0.0%) | 0 (0.0%) |
| Food Preparation & Serving | 0 (0.0%) | 38 (100.0%) |
| Cleaning & Maintenance | 0 (0.0%) | 0 (0.0%) |
| Personal Care & Service | 0 (0.0%) | 0 (0.0%) |
| Total (Category) | 0 (0.0%) | 38 (100.0%) |
| Total (Overall) | 44 (47.8%) | 48 (52.2%) |
Sales and Office Occupations
The most common Sales and Office occupations in Newport Center are Sales & Related (16 | 17.4%), and Office & Administration (5 | 5.4%).
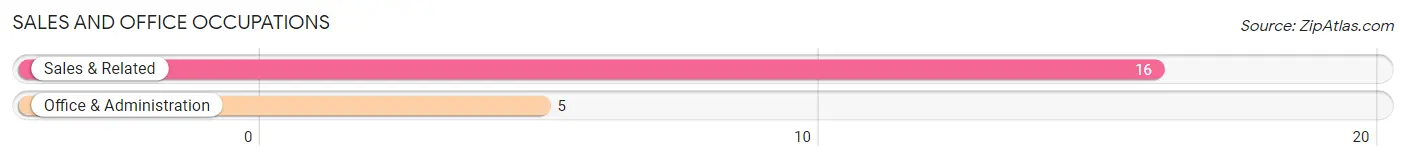
Sales and Office Occupations by Sex
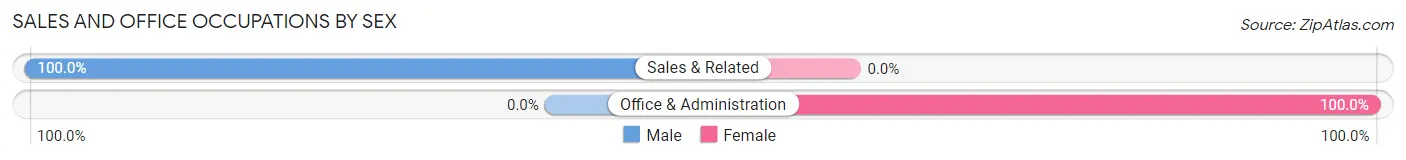
| Occupation | Male | Female |
| Sales & Related | 16 (100.0%) | 0 (0.0%) |
| Office & Administration | 0 (0.0%) | 5 (100.0%) |
| Total (Category) | 16 (76.2%) | 5 (23.8%) |
| Total (Overall) | 44 (47.8%) | 48 (52.2%) |
Natural Resources, Construction and Maintenance Occupations
The most common Natural Resources, Construction and Maintenance occupations in Newport Center are Construction & Extraction (14 | 15.2%), and Installation, Maintenance & Repair (2 | 2.2%).
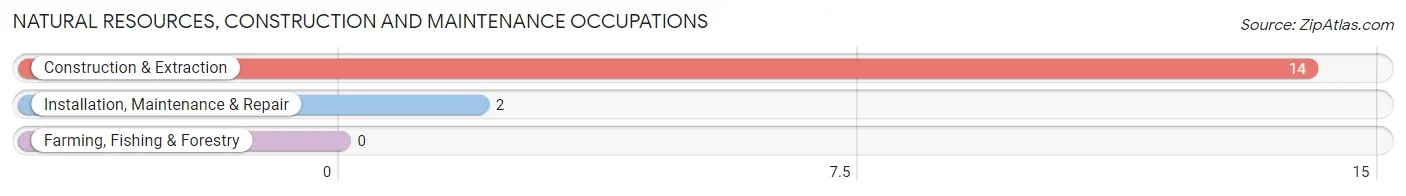
Natural Resources, Construction and Maintenance Occupations by Sex
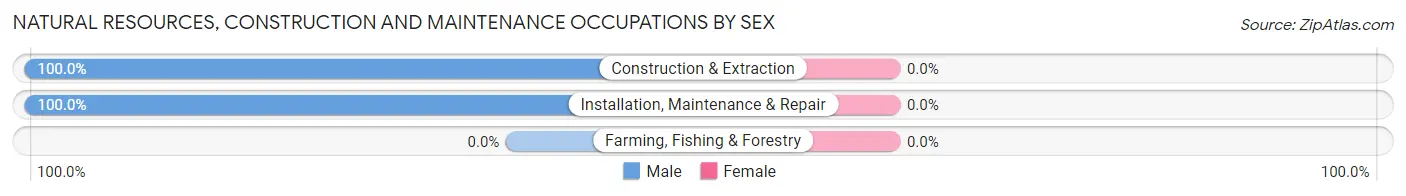
| Occupation | Male | Female |
| Farming, Fishing & Forestry | 0 (0.0%) | 0 (0.0%) |
| Construction & Extraction | 14 (100.0%) | 0 (0.0%) |
| Installation, Maintenance & Repair | 2 (100.0%) | 0 (0.0%) |
| Total (Category) | 16 (100.0%) | 0 (0.0%) |
| Total (Overall) | 44 (47.8%) | 48 (52.2%) |
Production, Transportation and Moving Occupations
The most common Production, Transportation and Moving occupations in Newport Center are , and Production (12 | 13.0%).
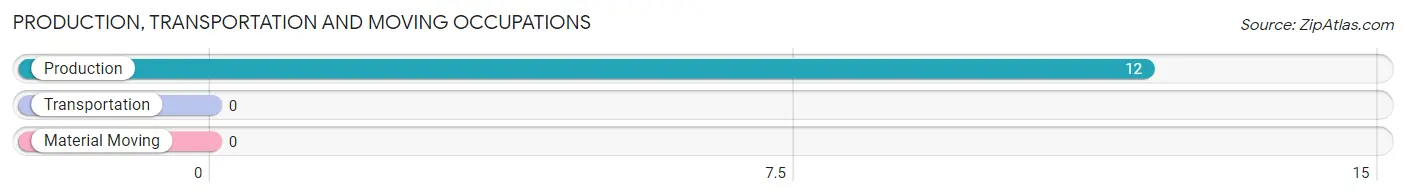
Production, Transportation and Moving Occupations by Sex
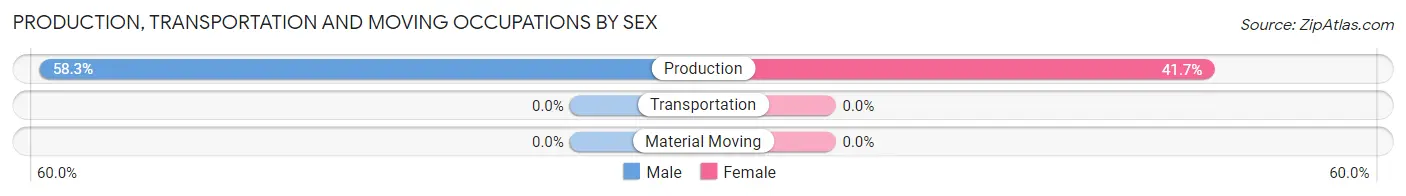
| Occupation | Male | Female |
| Production | 7 (58.3%) | 5 (41.7%) |
| Transportation | 0 (0.0%) | 0 (0.0%) |
| Material Moving | 0 (0.0%) | 0 (0.0%) |
| Total (Category) | 7 (58.3%) | 5 (41.7%) |
| Total (Overall) | 44 (47.8%) | 48 (52.2%) |
Employment Industries by Sex in Newport Center
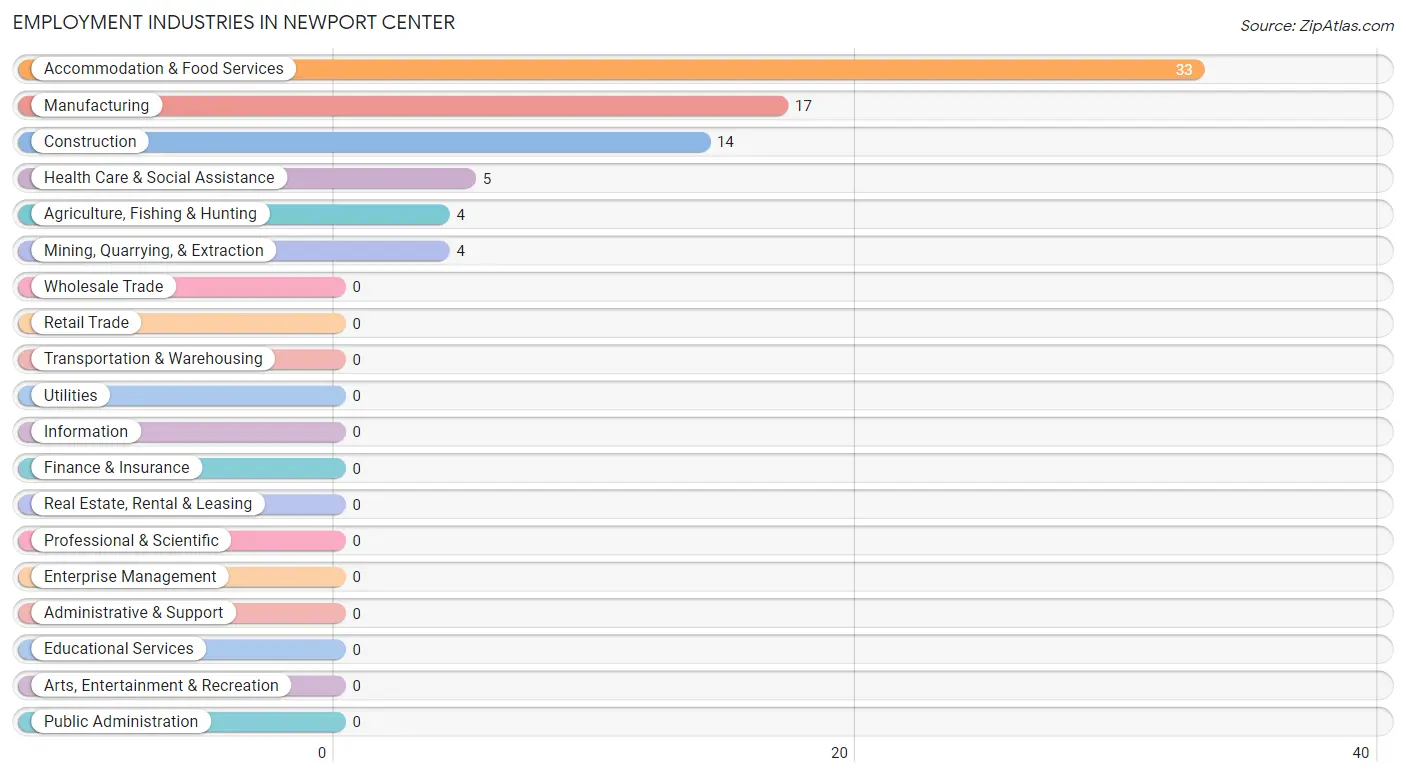
Employment Industries in Newport Center
The major employment industries in Newport Center include Accommodation & Food Services (33 | 35.9%), Manufacturing (17 | 18.5%), Construction (14 | 15.2%), Health Care & Social Assistance (5 | 5.4%), and Agriculture, Fishing & Hunting (4 | 4.3%).
Employment Industries by Sex in Newport Center
The Newport Center industries that see more men than women are Mining, Quarrying, & Extraction (100.0%), Construction (100.0%), and Manufacturing (70.6%), whereas the industries that tend to have a higher number of women are Agriculture, Fishing & Hunting (100.0%), Health Care & Social Assistance (100.0%), and Accommodation & Food Services (100.0%).
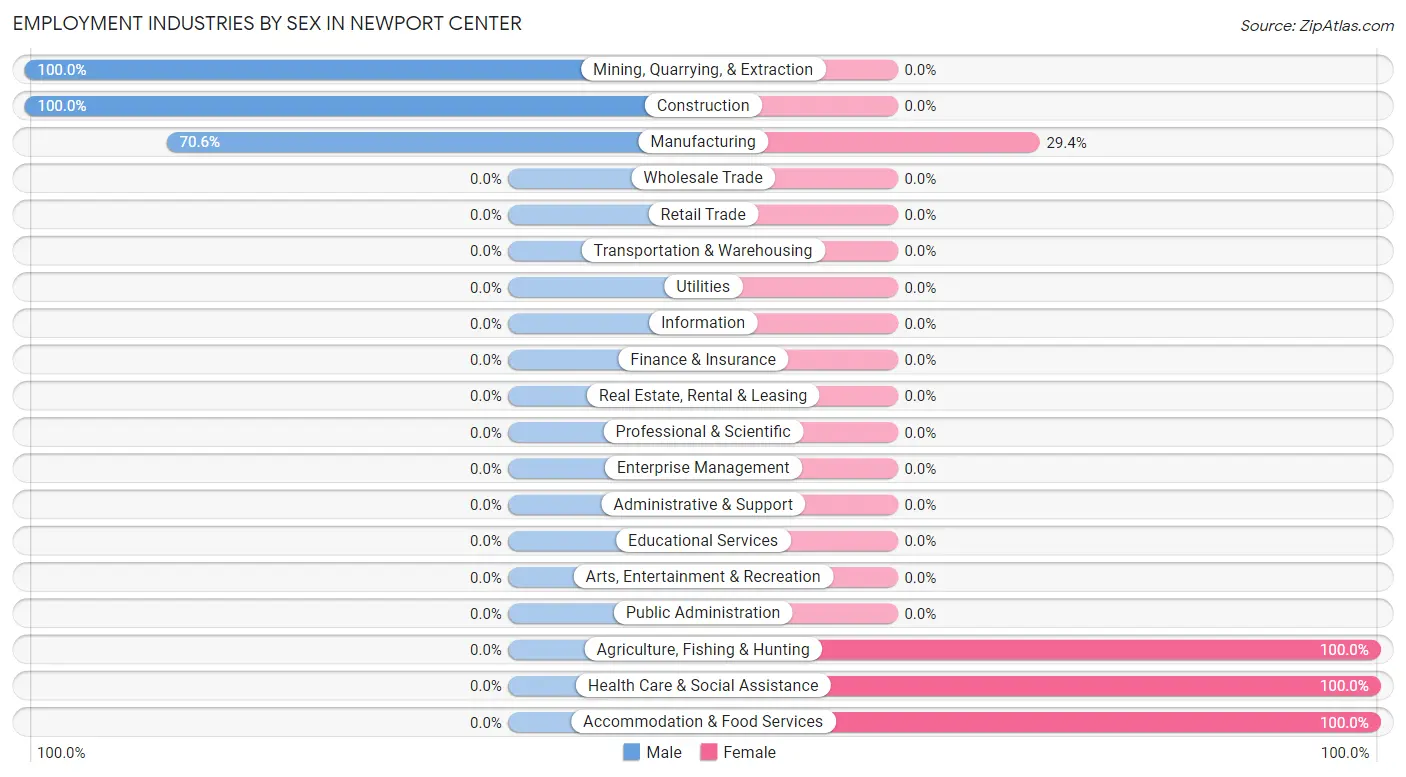
| Industry | Male | Female |
| Agriculture, Fishing & Hunting | 0 (0.0%) | 4 (100.0%) |
| Mining, Quarrying, & Extraction | 4 (100.0%) | 0 (0.0%) |
| Construction | 14 (100.0%) | 0 (0.0%) |
| Manufacturing | 12 (70.6%) | 5 (29.4%) |
| Wholesale Trade | 0 (0.0%) | 0 (0.0%) |
| Retail Trade | 0 (0.0%) | 0 (0.0%) |
| Transportation & Warehousing | 0 (0.0%) | 0 (0.0%) |
| Utilities | 0 (0.0%) | 0 (0.0%) |
| Information | 0 (0.0%) | 0 (0.0%) |
| Finance & Insurance | 0 (0.0%) | 0 (0.0%) |
| Real Estate, Rental & Leasing | 0 (0.0%) | 0 (0.0%) |
| Professional & Scientific | 0 (0.0%) | 0 (0.0%) |
| Enterprise Management | 0 (0.0%) | 0 (0.0%) |
| Administrative & Support | 0 (0.0%) | 0 (0.0%) |
| Educational Services | 0 (0.0%) | 0 (0.0%) |
| Health Care & Social Assistance | 0 (0.0%) | 5 (100.0%) |
| Arts, Entertainment & Recreation | 0 (0.0%) | 0 (0.0%) |
| Accommodation & Food Services | 0 (0.0%) | 33 (100.0%) |
| Public Administration | 0 (0.0%) | 0 (0.0%) |
| Total | 44 (47.8%) | 48 (52.2%) |
Education in Newport Center
School Enrollment in Newport Center
The most common levels of schooling among the 29 students in Newport Center are elementary school (15 | 51.7%), and high school (14 | 48.3%).
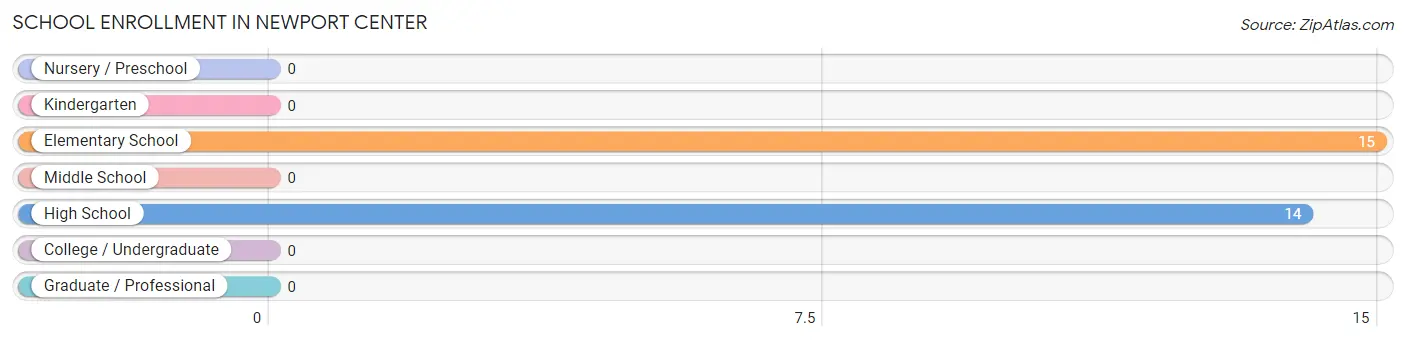
| School Level | # Students | % Students |
| Nursery / Preschool | 0 | 0.0% |
| Kindergarten | 0 | 0.0% |
| Elementary School | 15 | 51.7% |
| Middle School | 0 | 0.0% |
| High School | 14 | 48.3% |
| College / Undergraduate | 0 | 0.0% |
| Graduate / Professional | 0 | 0.0% |
| Total | 29 | 100.0% |
School Enrollment by Age by Funding Source in Newport Center
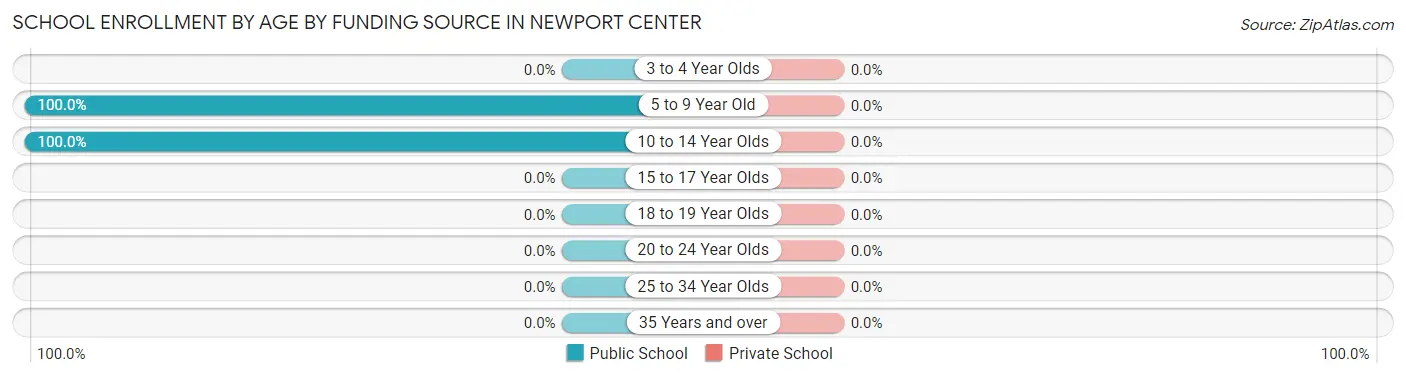
| Age Bracket | Public School | Private School |
| 3 to 4 Year Olds | 0 (0.0%) | 0 (0.0%) |
| 5 to 9 Year Old | 15 (100.0%) | 0 (0.0%) |
| 10 to 14 Year Olds | 14 (100.0%) | 0 (0.0%) |
| 15 to 17 Year Olds | 0 (0.0%) | 0 (0.0%) |
| 18 to 19 Year Olds | 0 (0.0%) | 0 (0.0%) |
| 20 to 24 Year Olds | 0 (0.0%) | 0 (0.0%) |
| 25 to 34 Year Olds | 0 (0.0%) | 0 (0.0%) |
| 35 Years and over | 0 (0.0%) | 0 (0.0%) |
| Total | 29 (100.0%) | 0 (0.0%) |
Educational Attainment by Field of Study in Newport Center
, and science & technology (13 | 100.0%) are the most common fields of study among 13 individuals in Newport Center who have obtained a bachelor's degree or higher.

| Field of Study | # Graduates | % Graduates |
| Computers & Mathematics | 0 | 0.0% |
| Bio, Nature & Agricultural | 0 | 0.0% |
| Physical & Health Sciences | 0 | 0.0% |
| Psychology | 0 | 0.0% |
| Social Sciences | 0 | 0.0% |
| Engineering | 0 | 0.0% |
| Multidisciplinary Studies | 0 | 0.0% |
| Science & Technology | 13 | 100.0% |
| Business | 0 | 0.0% |
| Education | 0 | 0.0% |
| Literature & Languages | 0 | 0.0% |
| Liberal Arts & History | 0 | 0.0% |
| Visual & Performing Arts | 0 | 0.0% |
| Communications | 0 | 0.0% |
| Arts & Humanities | 0 | 0.0% |
| Total | 13 | 100.0% |
Transportation & Commute in Newport Center
Vehicle Availability by Sex in Newport Center
The most prevalent vehicle ownership categories in Newport Center are males with no vehicle (14, accounting for 31.8%) and females with no vehicle (33, making up 29.2%).
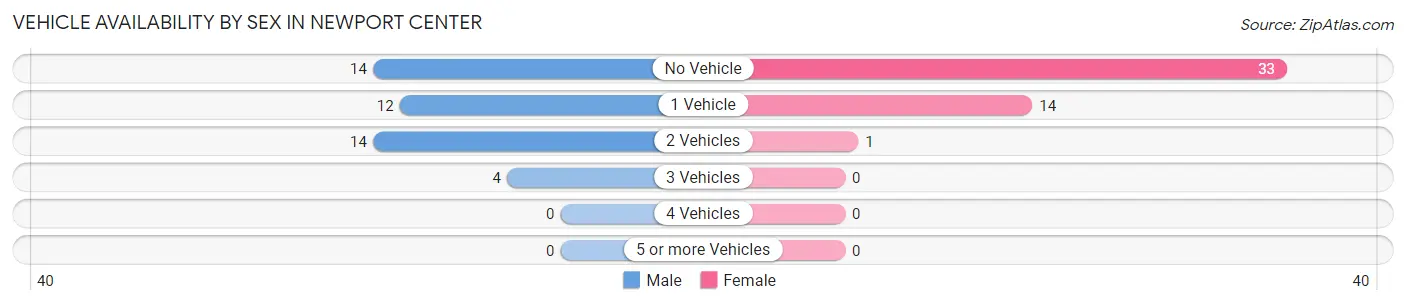
| Vehicles Available | Male | Female |
| No Vehicle | 14 (31.8%) | 33 (68.8%) |
| 1 Vehicle | 12 (27.3%) | 14 (29.2%) |
| 2 Vehicles | 14 (31.8%) | 1 (2.1%) |
| 3 Vehicles | 4 (9.1%) | 0 (0.0%) |
| 4 Vehicles | 0 (0.0%) | 0 (0.0%) |
| 5 or more Vehicles | 0 (0.0%) | 0 (0.0%) |
| Total | 44 (100.0%) | 48 (100.0%) |
Commute Time in Newport Center
The most frequently occuring commute durations in Newport Center are 15 to 19 minutes (19 commuters, 23.7%), 30 to 34 minutes (19 commuters, 23.7%), and 20 to 24 minutes (17 commuters, 21.2%).
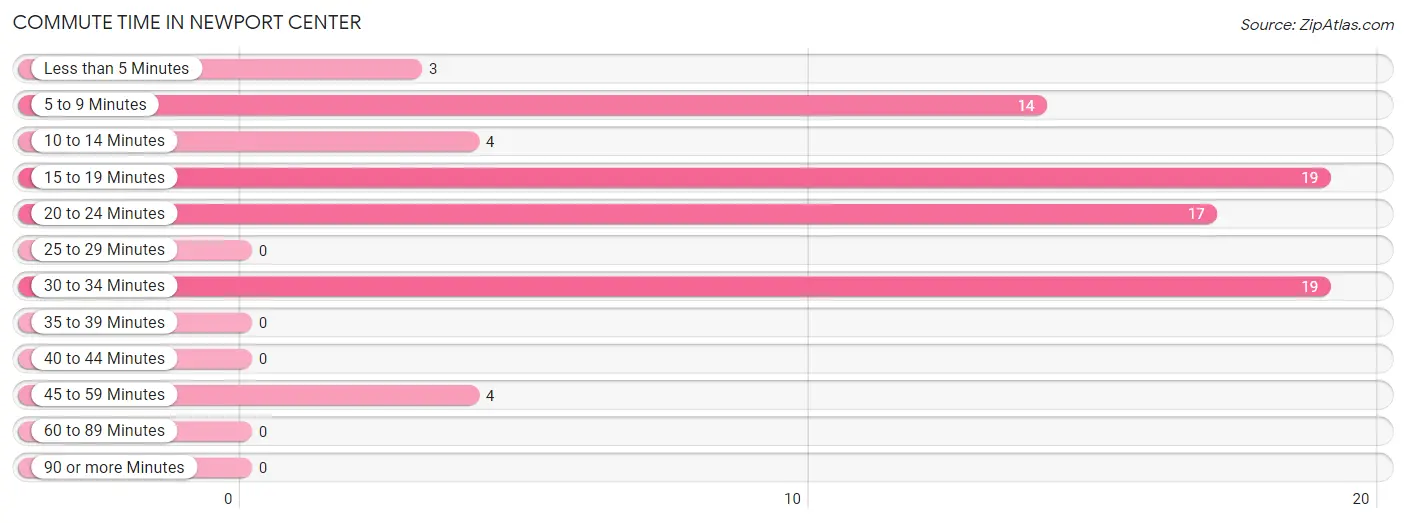
| Commute Time | # Commuters | % Commuters |
| Less than 5 Minutes | 3 | 3.7% |
| 5 to 9 Minutes | 14 | 17.5% |
| 10 to 14 Minutes | 4 | 5.0% |
| 15 to 19 Minutes | 19 | 23.7% |
| 20 to 24 Minutes | 17 | 21.2% |
| 25 to 29 Minutes | 0 | 0.0% |
| 30 to 34 Minutes | 19 | 23.7% |
| 35 to 39 Minutes | 0 | 0.0% |
| 40 to 44 Minutes | 0 | 0.0% |
| 45 to 59 Minutes | 4 | 5.0% |
| 60 to 89 Minutes | 0 | 0.0% |
| 90 or more Minutes | 0 | 0.0% |
Commute Time by Sex in Newport Center
The most common commute times in Newport Center are 5 to 9 minutes (14 commuters, 43.8%) for males and 15 to 19 minutes (19 commuters, 39.6%) for females.
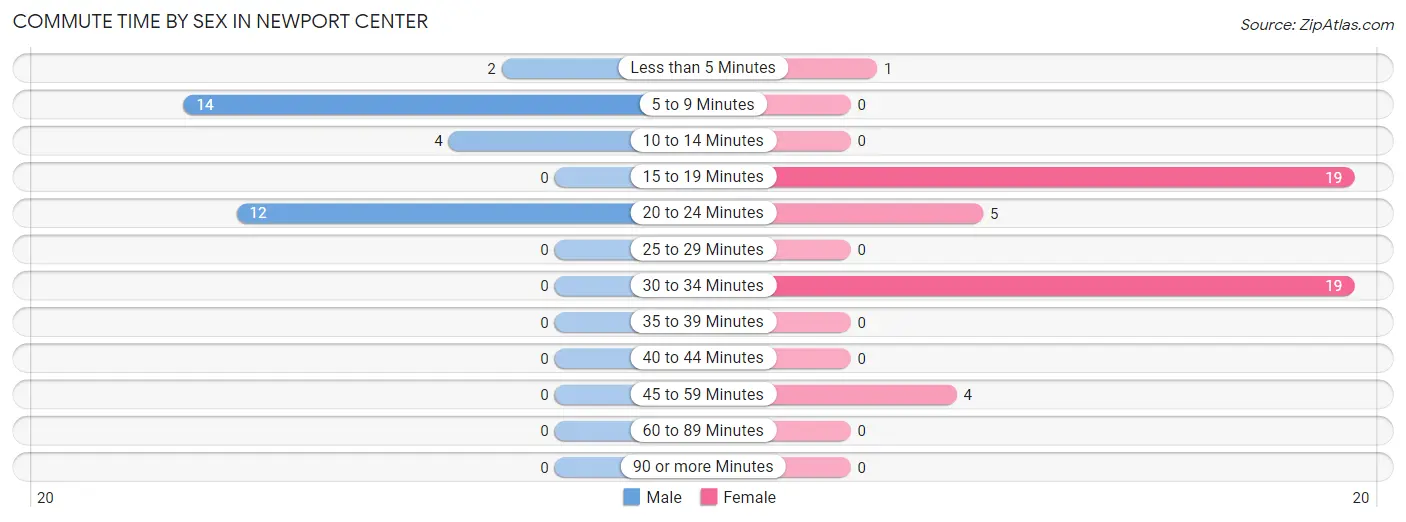
| Commute Time | Male | Female |
| Less than 5 Minutes | 2 (6.2%) | 1 (2.1%) |
| 5 to 9 Minutes | 14 (43.8%) | 0 (0.0%) |
| 10 to 14 Minutes | 4 (12.5%) | 0 (0.0%) |
| 15 to 19 Minutes | 0 (0.0%) | 19 (39.6%) |
| 20 to 24 Minutes | 12 (37.5%) | 5 (10.4%) |
| 25 to 29 Minutes | 0 (0.0%) | 0 (0.0%) |
| 30 to 34 Minutes | 0 (0.0%) | 19 (39.6%) |
| 35 to 39 Minutes | 0 (0.0%) | 0 (0.0%) |
| 40 to 44 Minutes | 0 (0.0%) | 0 (0.0%) |
| 45 to 59 Minutes | 0 (0.0%) | 4 (8.3%) |
| 60 to 89 Minutes | 0 (0.0%) | 0 (0.0%) |
| 90 or more Minutes | 0 (0.0%) | 0 (0.0%) |
Time of Departure to Work by Sex in Newport Center
The most frequent times of departure to work in Newport Center are 5:00 AM to 5:29 AM (14, 43.8%) for males and 6:30 AM to 6:59 AM (19, 39.6%) for females.
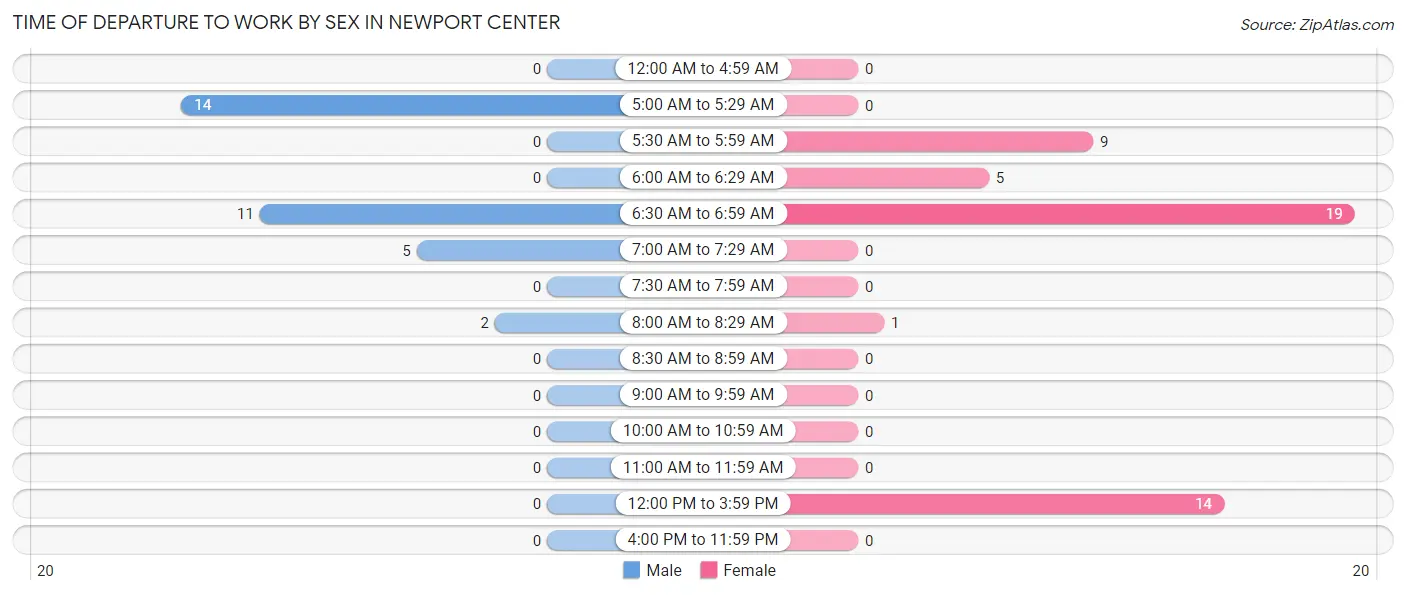
| Time of Departure | Male | Female |
| 12:00 AM to 4:59 AM | 0 (0.0%) | 0 (0.0%) |
| 5:00 AM to 5:29 AM | 14 (43.8%) | 0 (0.0%) |
| 5:30 AM to 5:59 AM | 0 (0.0%) | 9 (18.8%) |
| 6:00 AM to 6:29 AM | 0 (0.0%) | 5 (10.4%) |
| 6:30 AM to 6:59 AM | 11 (34.4%) | 19 (39.6%) |
| 7:00 AM to 7:29 AM | 5 (15.6%) | 0 (0.0%) |
| 7:30 AM to 7:59 AM | 0 (0.0%) | 0 (0.0%) |
| 8:00 AM to 8:29 AM | 2 (6.2%) | 1 (2.1%) |
| 8:30 AM to 8:59 AM | 0 (0.0%) | 0 (0.0%) |
| 9:00 AM to 9:59 AM | 0 (0.0%) | 0 (0.0%) |
| 10:00 AM to 10:59 AM | 0 (0.0%) | 0 (0.0%) |
| 11:00 AM to 11:59 AM | 0 (0.0%) | 0 (0.0%) |
| 12:00 PM to 3:59 PM | 0 (0.0%) | 14 (29.2%) |
| 4:00 PM to 11:59 PM | 0 (0.0%) | 0 (0.0%) |
| Total | 32 (100.0%) | 48 (100.0%) |
Housing Occupancy in Newport Center
Occupancy by Ownership in Newport Center
Of the total 123 dwellings in Newport Center, owner-occupied units account for 47 (38.2%), while renter-occupied units make up 76 (61.8%).
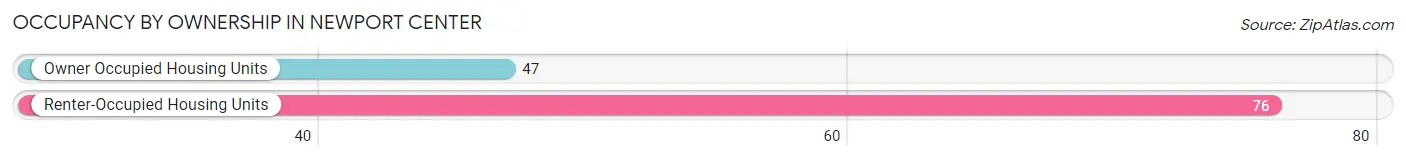
| Occupancy | # Housing Units | % Housing Units |
| Owner Occupied Housing Units | 47 | 38.2% |
| Renter-Occupied Housing Units | 76 | 61.8% |
| Total Occupied Housing Units | 123 | 100.0% |
Occupancy by Household Size in Newport Center
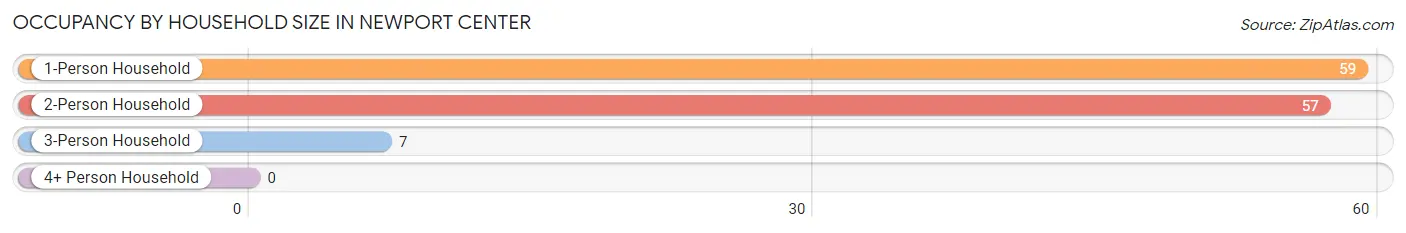
| Household Size | # Housing Units | % Housing Units |
| 1-Person Household | 59 | 48.0% |
| 2-Person Household | 57 | 46.3% |
| 3-Person Household | 7 | 5.7% |
| 4+ Person Household | 0 | 0.0% |
| Total Housing Units | 123 | 100.0% |
Occupancy by Ownership by Household Size in Newport Center
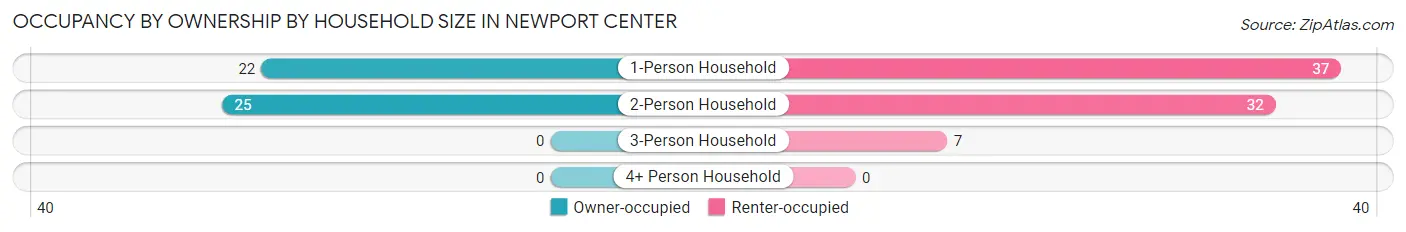
| Household Size | Owner-occupied | Renter-occupied |
| 1-Person Household | 22 (37.3%) | 37 (62.7%) |
| 2-Person Household | 25 (43.9%) | 32 (56.1%) |
| 3-Person Household | 0 (0.0%) | 7 (100.0%) |
| 4+ Person Household | 0 (0.0%) | 0 (0.0%) |
| Total Housing Units | 47 (38.2%) | 76 (61.8%) |
Occupancy by Educational Attainment in Newport Center
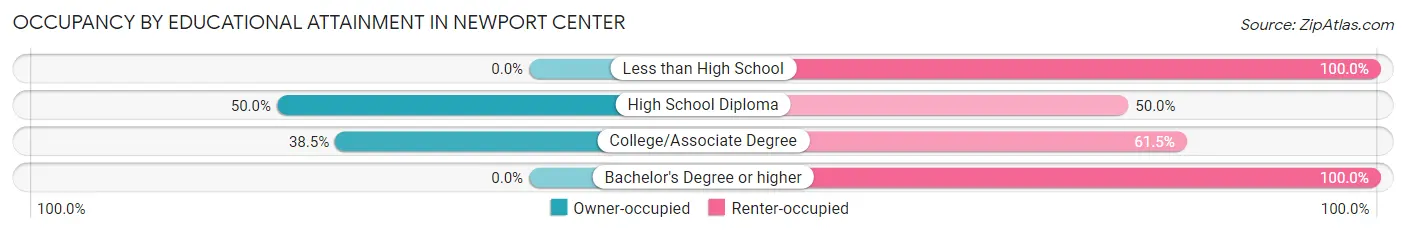
| Household Size | Owner-occupied | Renter-occupied |
| Less than High School | 0 (0.0%) | 7 (100.0%) |
| High School Diploma | 32 (50.0%) | 32 (50.0%) |
| College/Associate Degree | 15 (38.5%) | 24 (61.5%) |
| Bachelor's Degree or higher | 0 (0.0%) | 13 (100.0%) |
Occupancy by Age of Householder in Newport Center
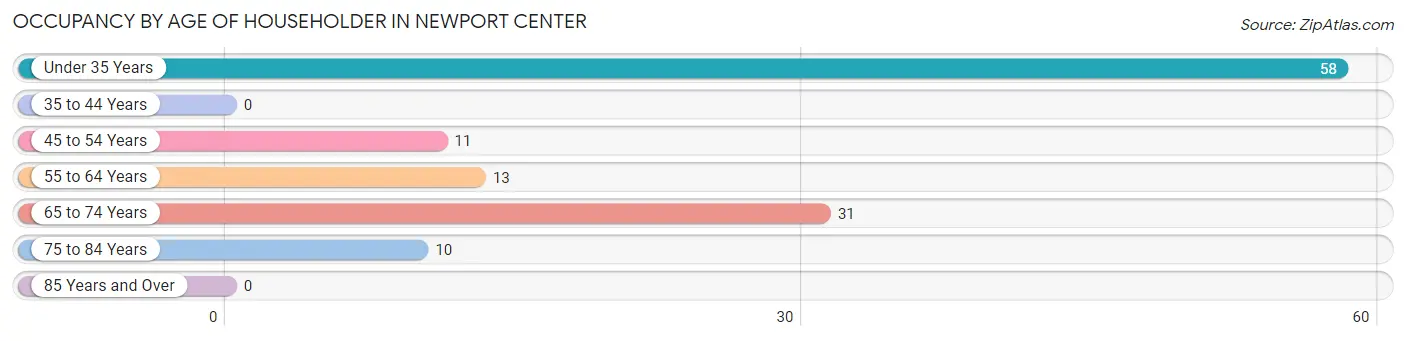
| Age Bracket | # Households | % Households |
| Under 35 Years | 58 | 47.1% |
| 35 to 44 Years | 0 | 0.0% |
| 45 to 54 Years | 11 | 8.9% |
| 55 to 64 Years | 13 | 10.6% |
| 65 to 74 Years | 31 | 25.2% |
| 75 to 84 Years | 10 | 8.1% |
| 85 Years and Over | 0 | 0.0% |
| Total | 123 | 100.0% |
Housing Finances in Newport Center
Median Income by Occupancy in Newport Center
| Occupancy Type | # Households | Median Income |
| Owner-Occupied | 47 (38.2%) | $0 |
| Renter-Occupied | 76 (61.8%) | $0 |
| Average | 123 (100.0%) | $0 |
Occupancy by Householder Income Bracket in Newport Center
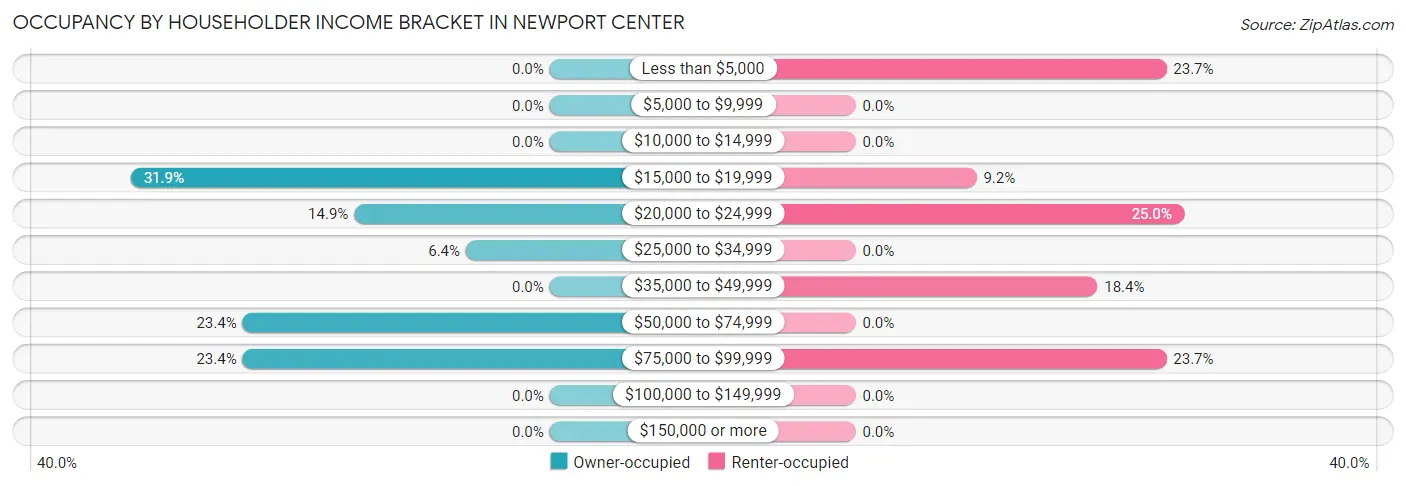
| Income Bracket | Owner-occupied | Renter-occupied |
| Less than $5,000 | 0 (0.0%) | 18 (23.7%) |
| $5,000 to $9,999 | 0 (0.0%) | 0 (0.0%) |
| $10,000 to $14,999 | 0 (0.0%) | 0 (0.0%) |
| $15,000 to $19,999 | 15 (31.9%) | 7 (9.2%) |
| $20,000 to $24,999 | 7 (14.9%) | 19 (25.0%) |
| $25,000 to $34,999 | 3 (6.4%) | 0 (0.0%) |
| $35,000 to $49,999 | 0 (0.0%) | 14 (18.4%) |
| $50,000 to $74,999 | 11 (23.4%) | 0 (0.0%) |
| $75,000 to $99,999 | 11 (23.4%) | 18 (23.7%) |
| $100,000 to $149,999 | 0 (0.0%) | 0 (0.0%) |
| $150,000 or more | 0 (0.0%) | 0 (0.0%) |
| Total | 47 (100.0%) | 76 (100.0%) |
Monthly Housing Cost Tiers in Newport Center
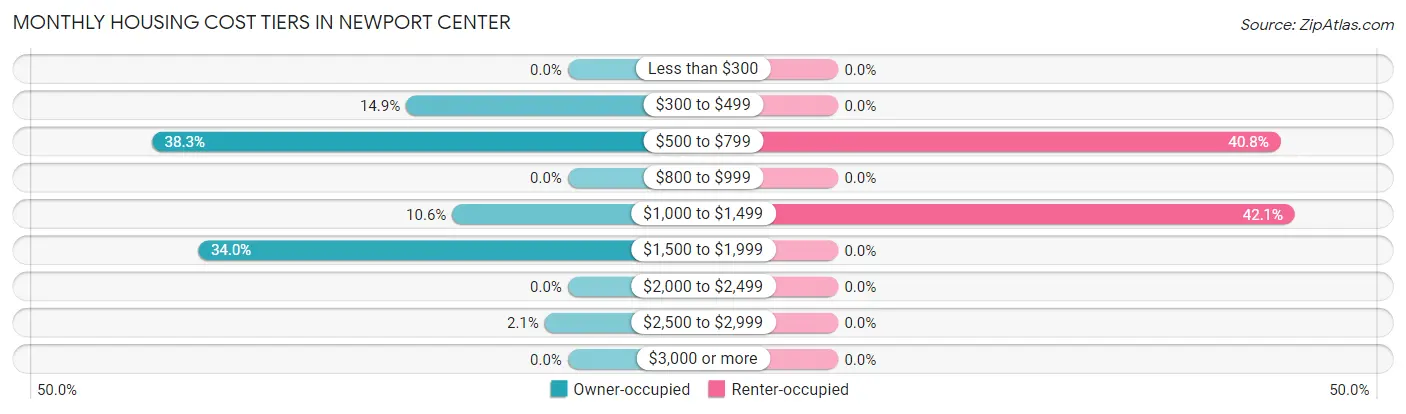
| Monthly Cost | Owner-occupied | Renter-occupied |
| Less than $300 | 0 (0.0%) | 0 (0.0%) |
| $300 to $499 | 7 (14.9%) | 0 (0.0%) |
| $500 to $799 | 18 (38.3%) | 31 (40.8%) |
| $800 to $999 | 0 (0.0%) | 0 (0.0%) |
| $1,000 to $1,499 | 5 (10.6%) | 32 (42.1%) |
| $1,500 to $1,999 | 16 (34.0%) | 0 (0.0%) |
| $2,000 to $2,499 | 0 (0.0%) | 0 (0.0%) |
| $2,500 to $2,999 | 1 (2.1%) | 0 (0.0%) |
| $3,000 or more | 0 (0.0%) | 0 (0.0%) |
| Total | 47 (100.0%) | 76 (100.0%) |
Physical Housing Characteristics in Newport Center
Housing Structures in Newport Center
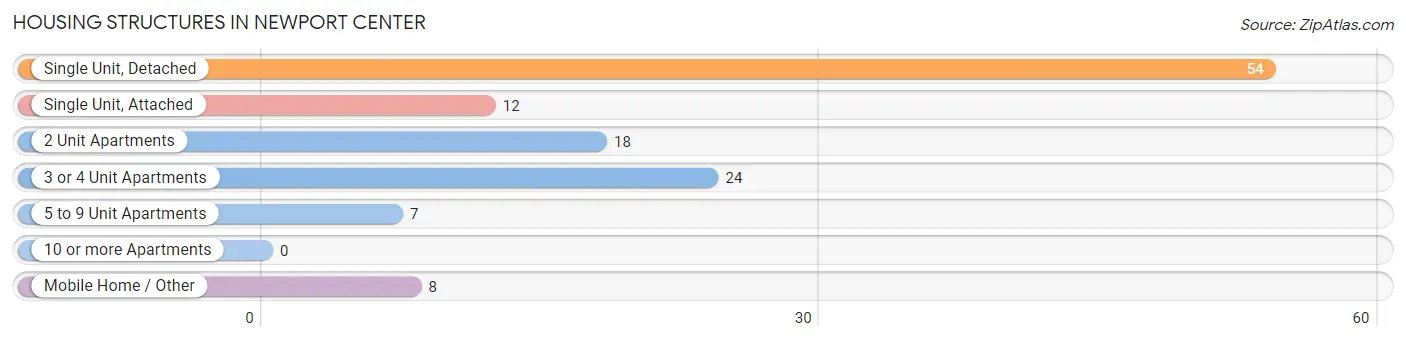
| Structure Type | # Housing Units | % Housing Units |
| Single Unit, Detached | 54 | 43.9% |
| Single Unit, Attached | 12 | 9.8% |
| 2 Unit Apartments | 18 | 14.6% |
| 3 or 4 Unit Apartments | 24 | 19.5% |
| 5 to 9 Unit Apartments | 7 | 5.7% |
| 10 or more Apartments | 0 | 0.0% |
| Mobile Home / Other | 8 | 6.5% |
| Total | 123 | 100.0% |
Housing Structures by Occupancy in Newport Center
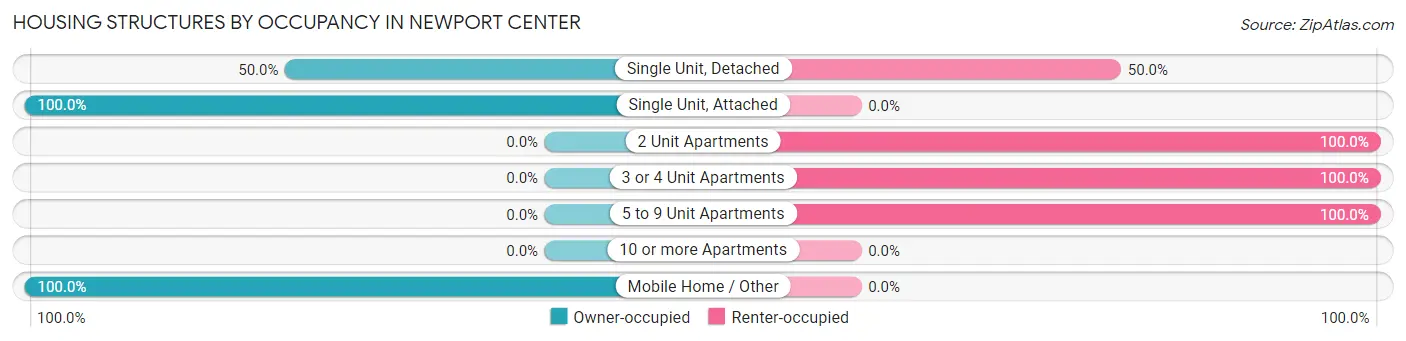
| Structure Type | Owner-occupied | Renter-occupied |
| Single Unit, Detached | 27 (50.0%) | 27 (50.0%) |
| Single Unit, Attached | 12 (100.0%) | 0 (0.0%) |
| 2 Unit Apartments | 0 (0.0%) | 18 (100.0%) |
| 3 or 4 Unit Apartments | 0 (0.0%) | 24 (100.0%) |
| 5 to 9 Unit Apartments | 0 (0.0%) | 7 (100.0%) |
| 10 or more Apartments | 0 (0.0%) | 0 (0.0%) |
| Mobile Home / Other | 8 (100.0%) | 0 (0.0%) |
| Total | 47 (38.2%) | 76 (61.8%) |
Housing Structures by Number of Rooms in Newport Center
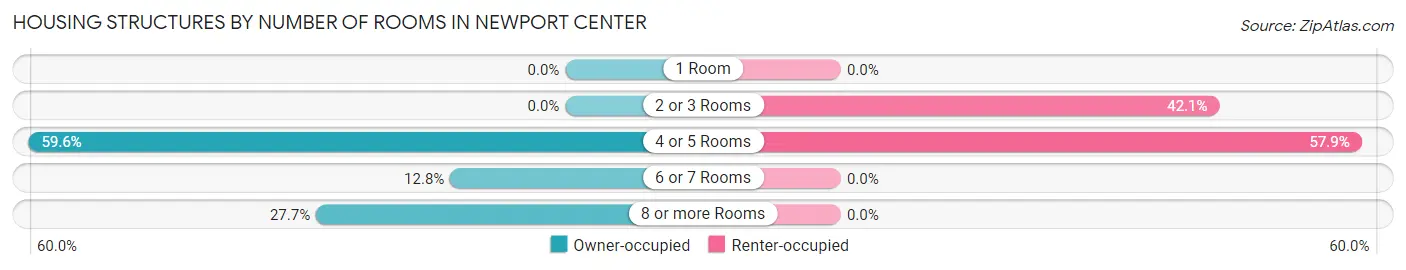
| Number of Rooms | Owner-occupied | Renter-occupied |
| 1 Room | 0 (0.0%) | 0 (0.0%) |
| 2 or 3 Rooms | 0 (0.0%) | 32 (42.1%) |
| 4 or 5 Rooms | 28 (59.6%) | 44 (57.9%) |
| 6 or 7 Rooms | 6 (12.8%) | 0 (0.0%) |
| 8 or more Rooms | 13 (27.7%) | 0 (0.0%) |
| Total | 47 (100.0%) | 76 (100.0%) |
Housing Structure by Heating Type in Newport Center
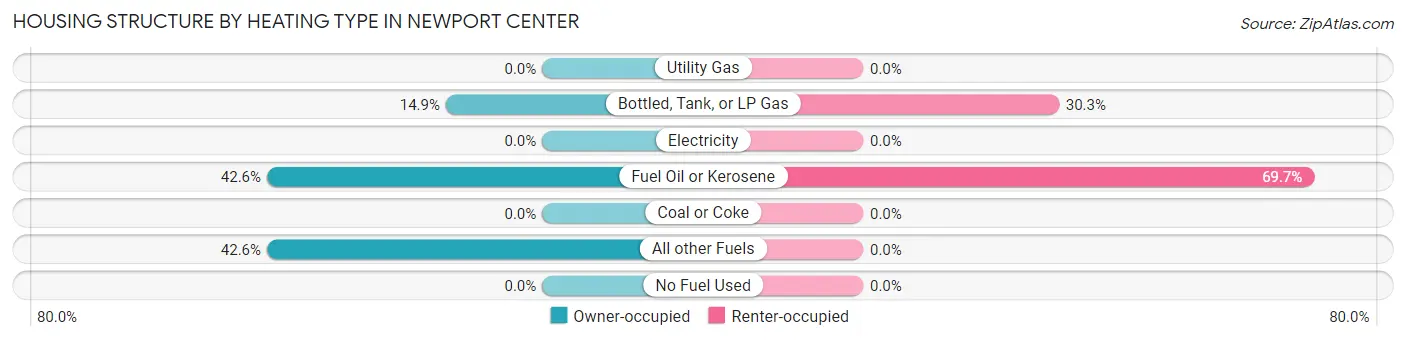
| Heating Type | Owner-occupied | Renter-occupied |
| Utility Gas | 0 (0.0%) | 0 (0.0%) |
| Bottled, Tank, or LP Gas | 7 (14.9%) | 23 (30.3%) |
| Electricity | 0 (0.0%) | 0 (0.0%) |
| Fuel Oil or Kerosene | 20 (42.5%) | 53 (69.7%) |
| Coal or Coke | 0 (0.0%) | 0 (0.0%) |
| All other Fuels | 20 (42.5%) | 0 (0.0%) |
| No Fuel Used | 0 (0.0%) | 0 (0.0%) |
| Total | 47 (100.0%) | 76 (100.0%) |
Household Vehicle Usage in Newport Center
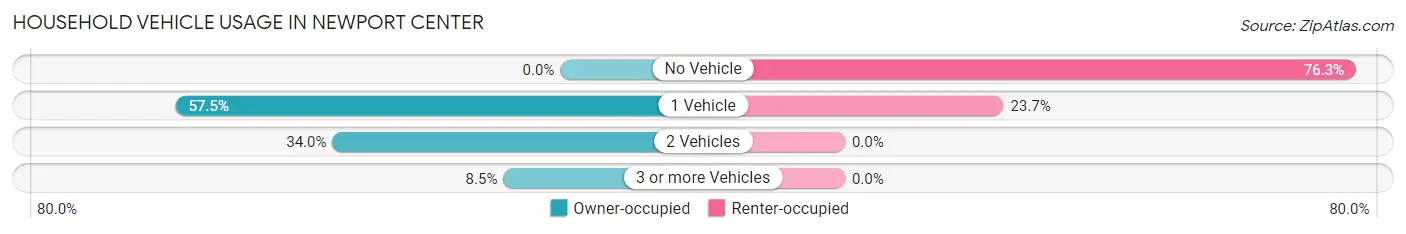
| Vehicles per Household | Owner-occupied | Renter-occupied |
| No Vehicle | 0 (0.0%) | 58 (76.3%) |
| 1 Vehicle | 27 (57.5%) | 18 (23.7%) |
| 2 Vehicles | 16 (34.0%) | 0 (0.0%) |
| 3 or more Vehicles | 4 (8.5%) | 0 (0.0%) |
| Total | 47 (100.0%) | 76 (100.0%) |
Real Estate & Mortgages in Newport Center
Real Estate and Mortgage Overview in Newport Center
| Characteristic | Without Mortgage | With Mortgage |
| Housing Units | 25 | 22 |
| Median Property Value | $101,800 | $141,200 |
| Median Household Income | - | - |
| Monthly Housing Costs | $617 | $0 |
| Real Estate Taxes | $1,156 | $0 |
Property Value by Mortgage Status in Newport Center
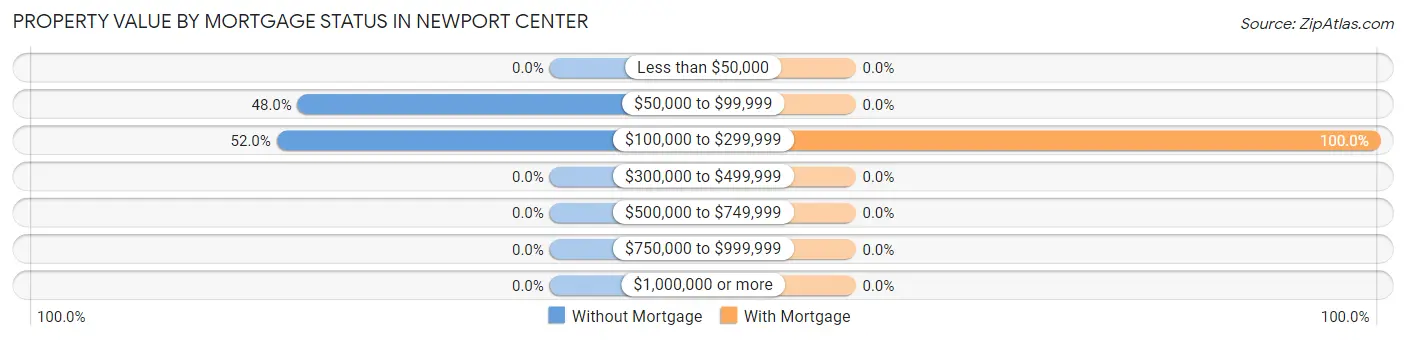
| Property Value | Without Mortgage | With Mortgage |
| Less than $50,000 | 0 (0.0%) | 0 (0.0%) |
| $50,000 to $99,999 | 12 (48.0%) | 0 (0.0%) |
| $100,000 to $299,999 | 13 (52.0%) | 22 (100.0%) |
| $300,000 to $499,999 | 0 (0.0%) | 0 (0.0%) |
| $500,000 to $749,999 | 0 (0.0%) | 0 (0.0%) |
| $750,000 to $999,999 | 0 (0.0%) | 0 (0.0%) |
| $1,000,000 or more | 0 (0.0%) | 0 (0.0%) |
| Total | 25 (100.0%) | 22 (100.0%) |
Household Income by Mortgage Status in Newport Center
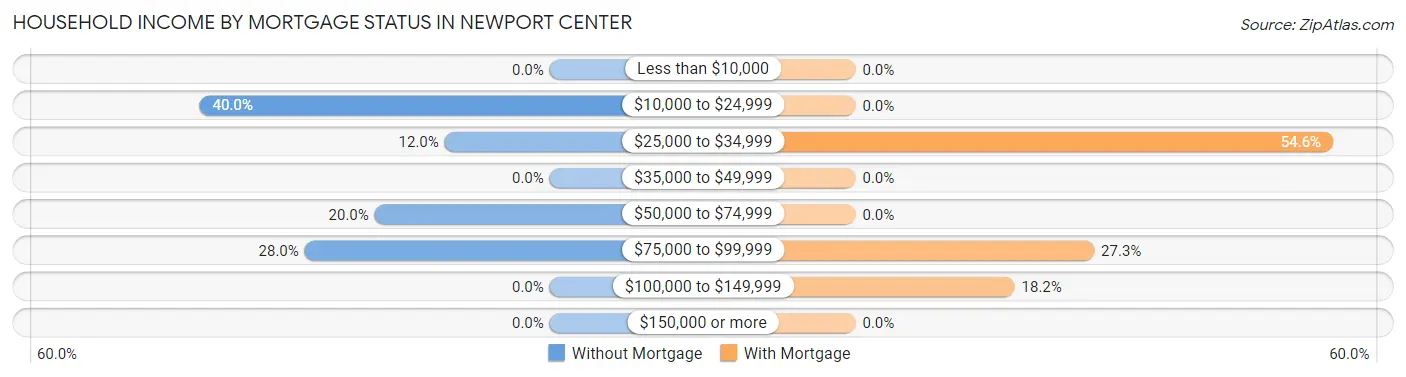
| Household Income | Without Mortgage | With Mortgage |
| Less than $10,000 | 0 (0.0%) | 0 (0.0%) |
| $10,000 to $24,999 | 10 (40.0%) | 0 (0.0%) |
| $25,000 to $34,999 | 3 (12.0%) | 12 (54.5%) |
| $35,000 to $49,999 | 0 (0.0%) | 0 (0.0%) |
| $50,000 to $74,999 | 5 (20.0%) | 0 (0.0%) |
| $75,000 to $99,999 | 7 (28.0%) | 6 (27.3%) |
| $100,000 to $149,999 | 0 (0.0%) | 4 (18.2%) |
| $150,000 or more | 0 (0.0%) | 0 (0.0%) |
| Total | 25 (100.0%) | 22 (100.0%) |
Property Value to Household Income Ratio in Newport Center
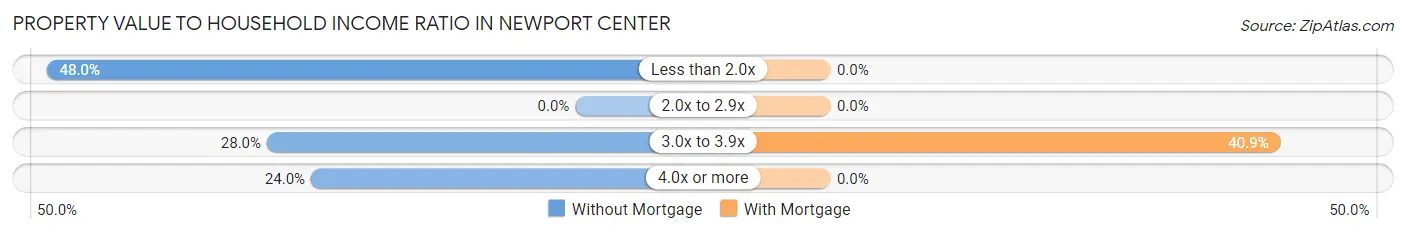
| Value-to-Income Ratio | Without Mortgage | With Mortgage |
| Less than 2.0x | 12 (48.0%) | 0 (0.0%) |
| 2.0x to 2.9x | 0 (0.0%) | 0 (0.0%) |
| 3.0x to 3.9x | 7 (28.0%) | 9 (40.9%) |
| 4.0x or more | 6 (24.0%) | 0 (0.0%) |
| Total | 25 (100.0%) | 22 (100.0%) |
Real Estate Taxes by Mortgage Status in Newport Center
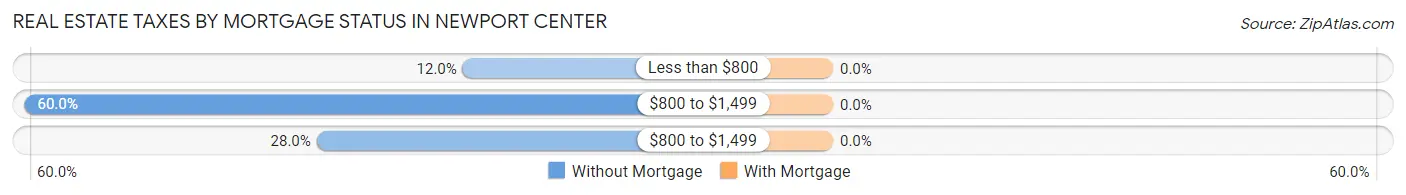
| Property Taxes | Without Mortgage | With Mortgage |
| Less than $800 | 3 (12.0%) | 0 (0.0%) |
| $800 to $1,499 | 15 (60.0%) | 0 (0.0%) |
| $800 to $1,499 | 7 (28.0%) | 0 (0.0%) |
| Total | 25 (100.0%) | 22 (100.0%) |
Health & Disability in Newport Center
Health Insurance Coverage by Age in Newport Center
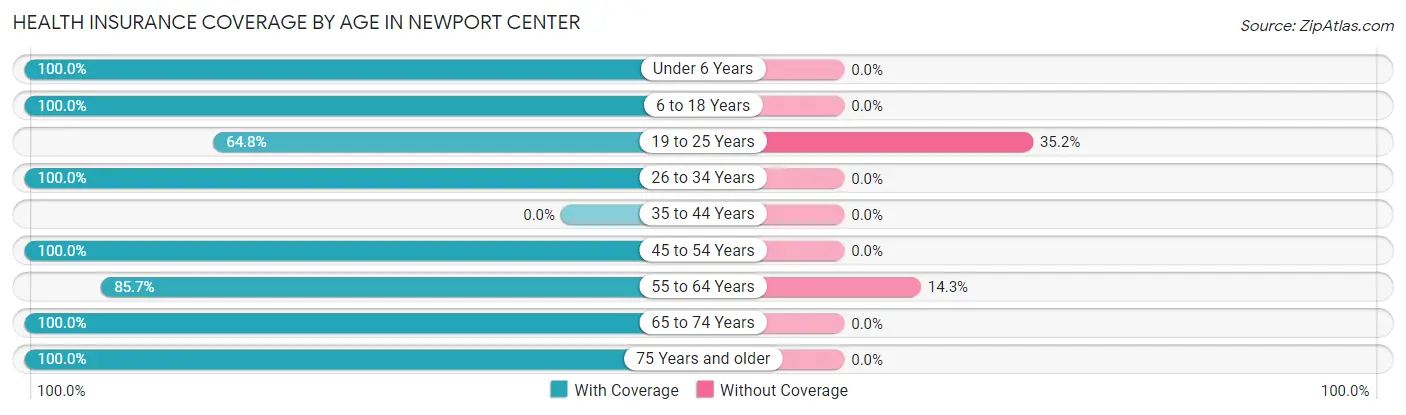
| Age Bracket | With Coverage | Without Coverage |
| Under 6 Years | 5 (100.0%) | 0 (0.0%) |
| 6 to 18 Years | 29 (100.0%) | 0 (0.0%) |
| 19 to 25 Years | 35 (64.8%) | 19 (35.2%) |
| 26 to 34 Years | 24 (100.0%) | 0 (0.0%) |
| 35 to 44 Years | 0 (0.0%) | 0 (0.0%) |
| 45 to 54 Years | 13 (100.0%) | 0 (0.0%) |
| 55 to 64 Years | 24 (85.7%) | 4 (14.3%) |
| 65 to 74 Years | 31 (100.0%) | 0 (0.0%) |
| 75 Years and older | 15 (100.0%) | 0 (0.0%) |
| Total | 176 (88.4%) | 23 (11.6%) |
Health Insurance Coverage by Citizenship Status in Newport Center
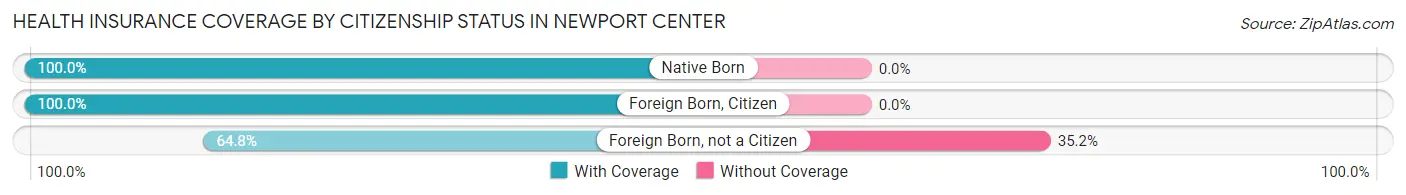
| Citizenship Status | With Coverage | Without Coverage |
| Native Born | 5 (100.0%) | 0 (0.0%) |
| Foreign Born, Citizen | 29 (100.0%) | 0 (0.0%) |
| Foreign Born, not a Citizen | 35 (64.8%) | 19 (35.2%) |
Health Insurance Coverage by Household Income in Newport Center
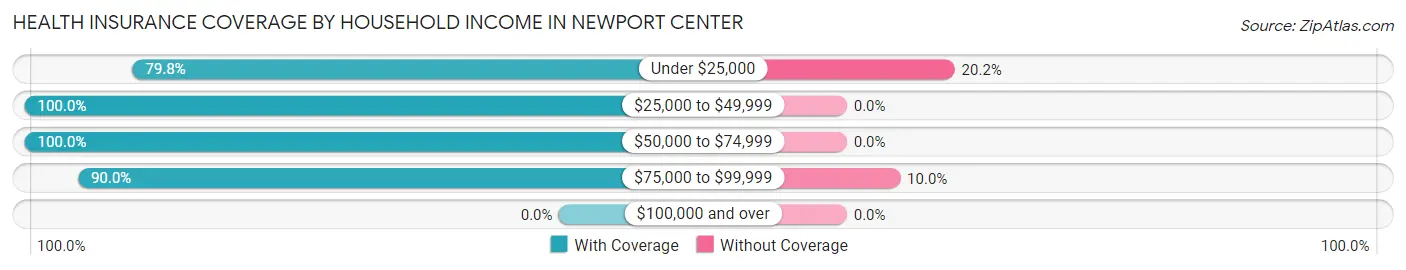
| Household Income | With Coverage | Without Coverage |
| Under $25,000 | 75 (79.8%) | 19 (20.2%) |
| $25,000 to $49,999 | 31 (100.0%) | 0 (0.0%) |
| $50,000 to $74,999 | 34 (100.0%) | 0 (0.0%) |
| $75,000 to $99,999 | 36 (90.0%) | 4 (10.0%) |
| $100,000 and over | 0 (0.0%) | 0 (0.0%) |
Public vs Private Health Insurance Coverage by Age in Newport Center
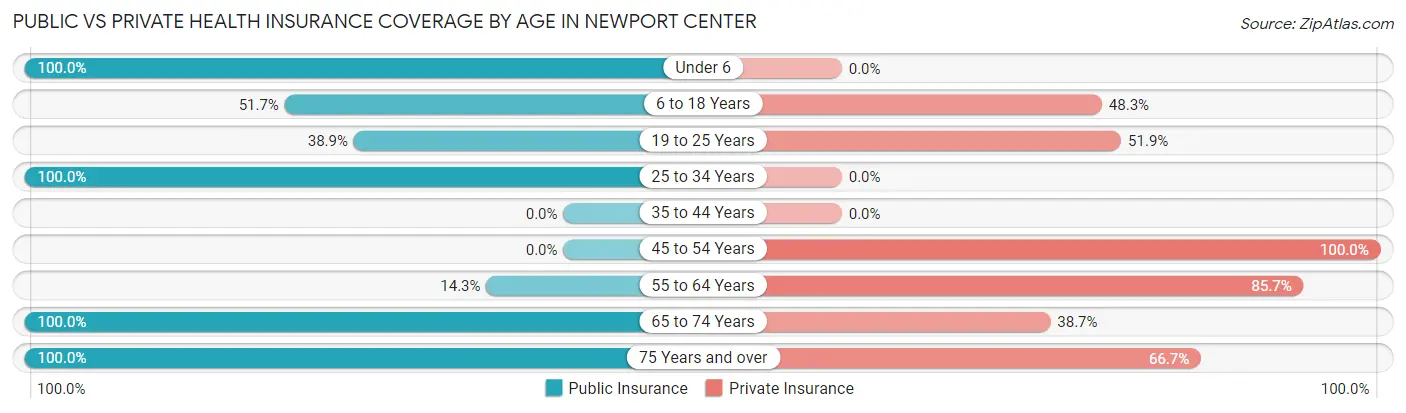
| Age Bracket | Public Insurance | Private Insurance |
| Under 6 | 5 (100.0%) | 0 (0.0%) |
| 6 to 18 Years | 15 (51.7%) | 14 (48.3%) |
| 19 to 25 Years | 21 (38.9%) | 28 (51.8%) |
| 25 to 34 Years | 24 (100.0%) | 0 (0.0%) |
| 35 to 44 Years | 0 (0.0%) | 0 (0.0%) |
| 45 to 54 Years | 0 (0.0%) | 13 (100.0%) |
| 55 to 64 Years | 4 (14.3%) | 24 (85.7%) |
| 65 to 74 Years | 31 (100.0%) | 12 (38.7%) |
| 75 Years and over | 15 (100.0%) | 10 (66.7%) |
| Total | 115 (57.8%) | 101 (50.7%) |
Disability Status by Sex by Age in Newport Center
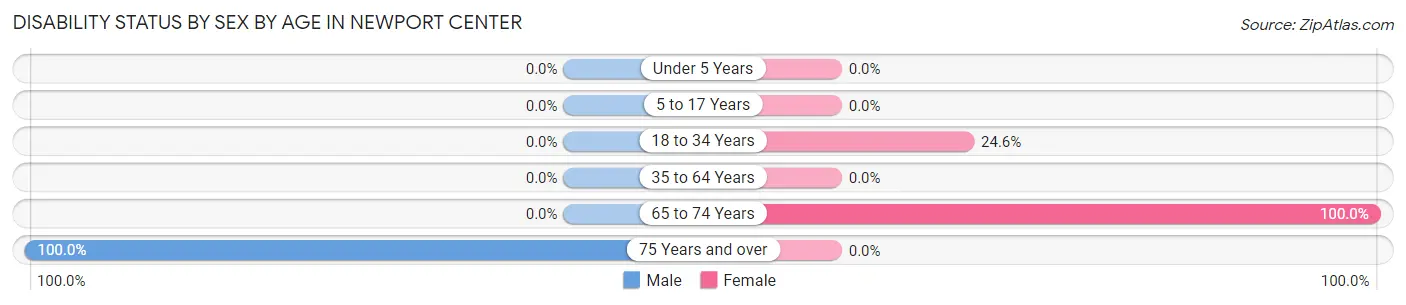
| Age Bracket | Male | Female |
| Under 5 Years | 0 (0.0%) | 0 (0.0%) |
| 5 to 17 Years | 0 (0.0%) | 0 (0.0%) |
| 18 to 34 Years | 0 (0.0%) | 14 (24.6%) |
| 35 to 64 Years | 0 (0.0%) | 0 (0.0%) |
| 65 to 74 Years | 0 (0.0%) | 3 (100.0%) |
| 75 Years and over | 3 (100.0%) | 0 (0.0%) |
Disability Class by Sex by Age in Newport Center
Disability Class: Hearing Difficulty
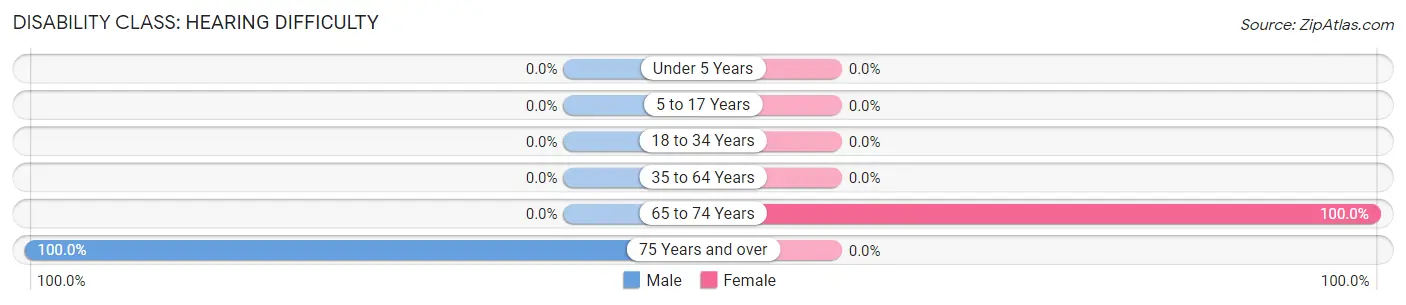
| Age Bracket | Male | Female |
| Under 5 Years | 0 (0.0%) | 0 (0.0%) |
| 5 to 17 Years | 0 (0.0%) | 0 (0.0%) |
| 18 to 34 Years | 0 (0.0%) | 0 (0.0%) |
| 35 to 64 Years | 0 (0.0%) | 0 (0.0%) |
| 65 to 74 Years | 0 (0.0%) | 3 (100.0%) |
| 75 Years and over | 3 (100.0%) | 0 (0.0%) |
Disability Class: Vision Difficulty
| Age Bracket | Male | Female |
| Under 5 Years | 0 (0.0%) | 0 (0.0%) |
| 5 to 17 Years | 0 (0.0%) | 0 (0.0%) |
| 18 to 34 Years | 0 (0.0%) | 0 (0.0%) |
| 35 to 64 Years | 0 (0.0%) | 0 (0.0%) |
| 65 to 74 Years | 0 (0.0%) | 0 (0.0%) |
| 75 Years and over | 0 (0.0%) | 0 (0.0%) |
Disability Class: Cognitive Difficulty
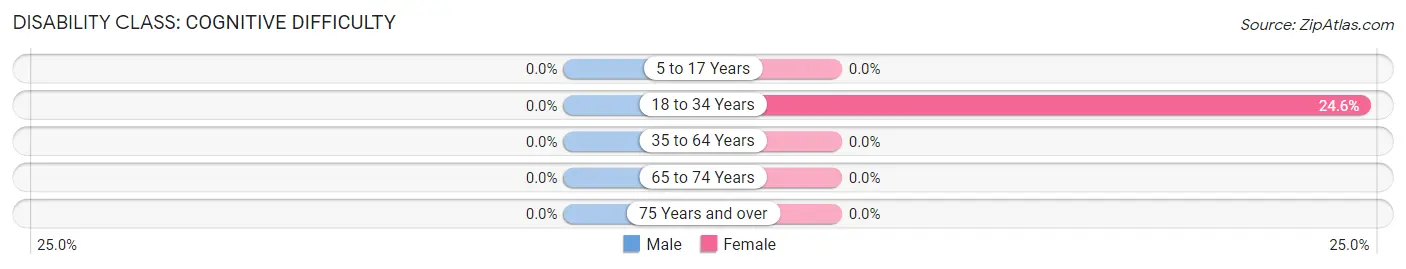
| Age Bracket | Male | Female |
| 5 to 17 Years | 0 (0.0%) | 0 (0.0%) |
| 18 to 34 Years | 0 (0.0%) | 14 (24.6%) |
| 35 to 64 Years | 0 (0.0%) | 0 (0.0%) |
| 65 to 74 Years | 0 (0.0%) | 0 (0.0%) |
| 75 Years and over | 0 (0.0%) | 0 (0.0%) |
Disability Class: Ambulatory Difficulty
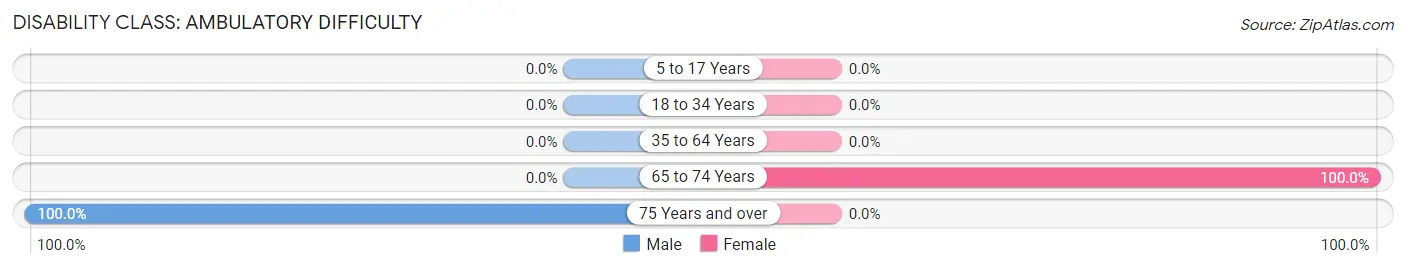
| Age Bracket | Male | Female |
| 5 to 17 Years | 0 (0.0%) | 0 (0.0%) |
| 18 to 34 Years | 0 (0.0%) | 0 (0.0%) |
| 35 to 64 Years | 0 (0.0%) | 0 (0.0%) |
| 65 to 74 Years | 0 (0.0%) | 3 (100.0%) |
| 75 Years and over | 3 (100.0%) | 0 (0.0%) |
Disability Class: Self-Care Difficulty
| Age Bracket | Male | Female |
| 5 to 17 Years | 0 (0.0%) | 0 (0.0%) |
| 18 to 34 Years | 0 (0.0%) | 0 (0.0%) |
| 35 to 64 Years | 0 (0.0%) | 0 (0.0%) |
| 65 to 74 Years | 0 (0.0%) | 0 (0.0%) |
| 75 Years and over | 0 (0.0%) | 0 (0.0%) |
Technology Access in Newport Center
Computing Device Access in Newport Center
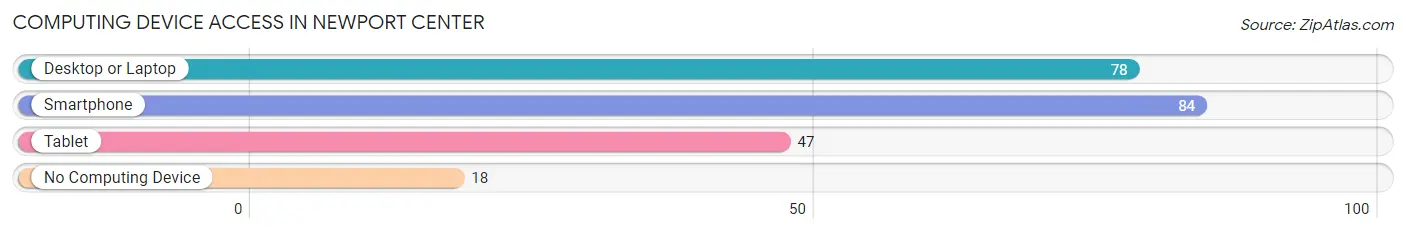
| Device Type | # Households | % Households |
| Desktop or Laptop | 78 | 63.4% |
| Smartphone | 84 | 68.3% |
| Tablet | 47 | 38.2% |
| No Computing Device | 18 | 14.6% |
| Total | 123 | 100.0% |
Internet Access in Newport Center
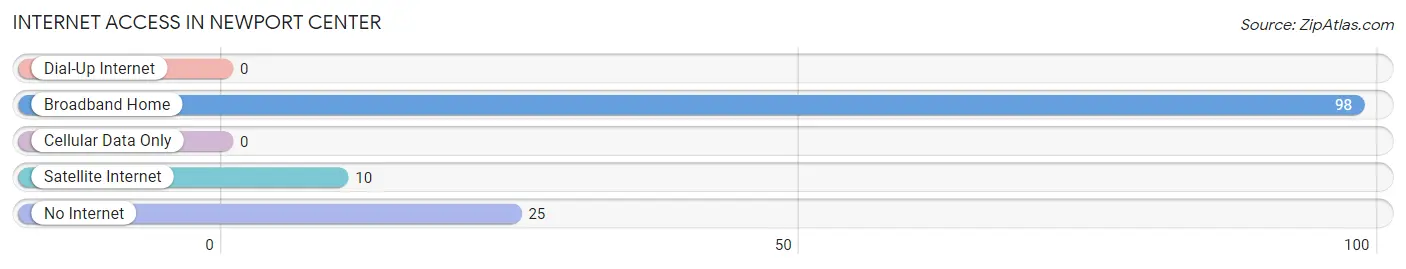
| Internet Type | # Households | % Households |
| Dial-Up Internet | 0 | 0.0% |
| Broadband Home | 98 | 79.7% |
| Cellular Data Only | 0 | 0.0% |
| Satellite Internet | 10 | 8.1% |
| No Internet | 25 | 20.3% |
| Total | 123 | 100.0% |
Newport Center Summary
Newport Center is a small unincorporated village located in the town of Newport, Vermont. It is situated in the northeast corner of the state, near the Canadian border. The village is home to a population of approximately 1,000 people, and is the county seat of Orleans County.
History
The area that is now Newport Center was first settled in 1790 by a group of settlers from Massachusetts. The village was originally known as “Newport”, and was incorporated in 1820. The village was renamed “Newport Center” in 1836, when the county seat was moved from nearby Derby to Newport Center.
The village was an important center of commerce and industry in the 19th century. It was home to several mills, including a sawmill, gristmill, and a woolen mill. The village also had a blacksmith shop, a tannery, and a general store.
In the late 19th century, the village was home to a thriving lumber industry. The lumber was used to build homes, barns, and other structures throughout the region. The lumber industry declined in the early 20th century, and the village’s economy shifted to agriculture and tourism.
Geography
Newport Center is located in the northeast corner of Vermont, near the Canadian border. The village is situated in the Green Mountains, and is surrounded by rolling hills and forests. The village is located on the banks of the Clyde River, which flows through the center of town.
The village is located approximately 25 miles from the city of Burlington, and is about a two-hour drive from Montreal, Canada. The nearest major airport is located in Burlington.
Economy
The economy of Newport Center is largely based on agriculture and tourism. The village is home to several farms, which produce a variety of crops, including corn, hay, and apples. The village is also home to several small businesses, including restaurants, shops, and a grocery store.
The village is a popular tourist destination, and is home to several attractions, including a museum, a historic inn, and a golf course. The village also hosts several festivals and events throughout the year, including the Newport County Fair and the Newport County Music Festival.
Demographics
As of the 2010 census, the population of Newport Center was 1,000. The population is predominantly white (97.2%), with a small minority population (2.8%). The median household income is $41,250, and the median age is 43.
The village is home to several churches, including the United Church of Christ, the Episcopal Church, and the Catholic Church. The village is also home to a public library, a post office, and a fire station.
Conclusion
Newport Center is a small unincorporated village located in the northeast corner of Vermont. The village is home to a population of approximately 1,000 people, and is the county seat of Orleans County. The village is an important center of commerce and industry, and is home to several farms, businesses, and attractions. The village is a popular tourist destination, and is home to several churches, a public library, a post office, and a fire station. The population is predominantly white, with a small minority population. The median household income is $41,250, and the median age is 43.
Common Questions
What is Per Capita Income in Newport Center?
Per Capita income in Newport Center is $25,171.
What is Inequality or Gini Index in Newport Center?
Inequality or Gini Index in Newport Center is 0.43.
What is the Total Population of Newport Center?
Total Population of Newport Center is 199.
What is the Total Male Population of Newport Center?
Total Male Population of Newport Center is 94.
What is the Total Female Population of Newport Center?
Total Female Population of Newport Center is 105.
What is the Ratio of Males per 100 Females in Newport Center?
There are 89.52 Males per 100 Females in Newport Center.
What is the Ratio of Females per 100 Males in Newport Center?
There are 111.70 Females per 100 Males in Newport Center.
What is the Median Population Age in Newport Center?
Median Population Age in Newport Center is 32.6 Years.
What is the Average Family Size in Newport Center
Average Family Size in Newport Center is 2.1 People.
What is the Average Household Size in Newport Center
Average Household Size in Newport Center is 1.6 People.
How Large is the Labor Force in Newport Center?
There are 99 People in the Labor Forcein in Newport Center.
What is the Percentage of People in the Labor Force in Newport Center?
60.0% of People are in the Labor Force in Newport Center.
What is the Unemployment Rate in Newport Center?
Unemployment Rate in Newport Center is 7.1%.