Bethpage, TN Map & Demographics
Bethpage Map
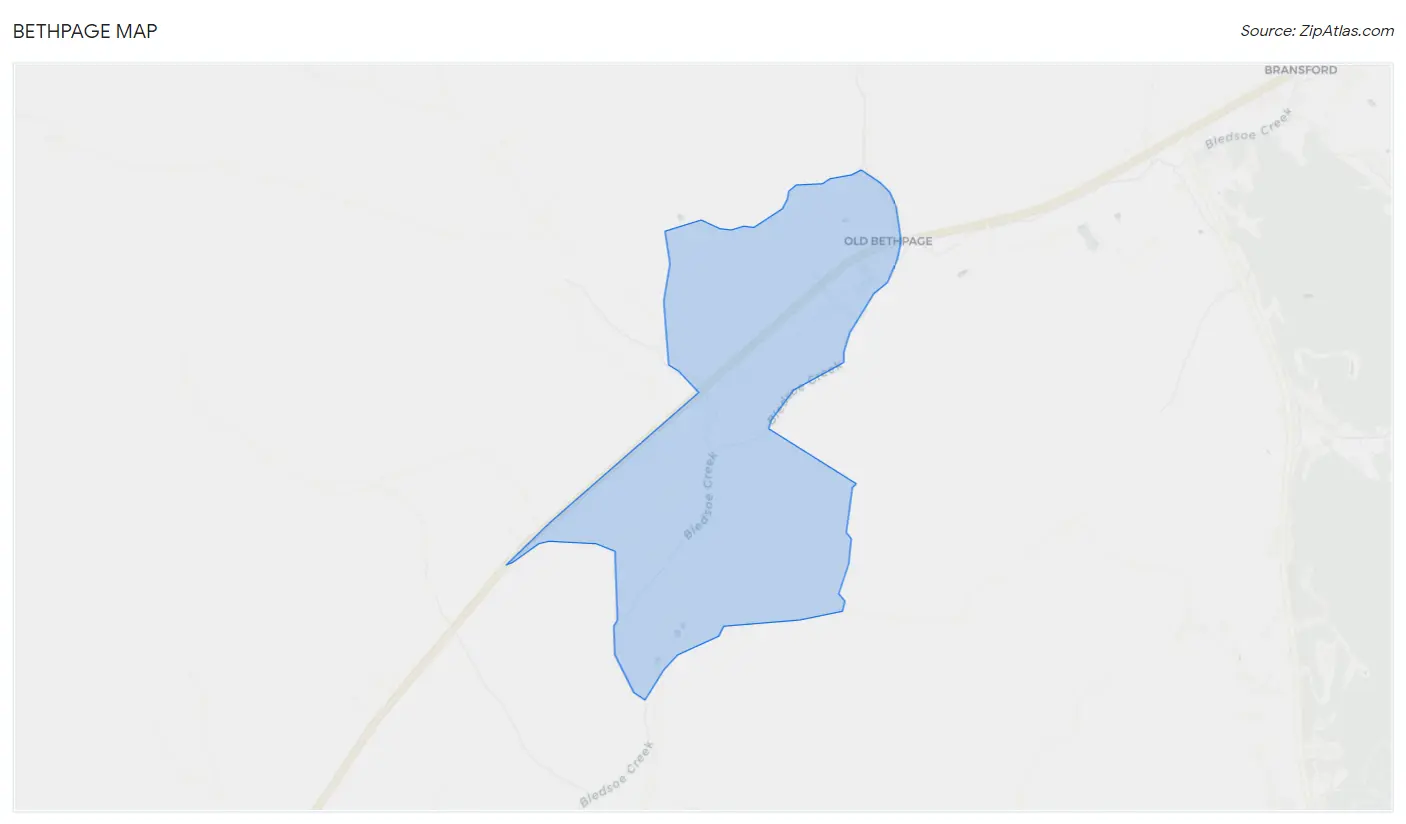
Bethpage Overview
$15,264
PER CAPITA INCOME
$8,766
FAMILY INCOME DEFICIT
0.45
INEQUALITY / GINI INDEX
276
TOTAL POPULATION
97
MALE POPULATION
179
FEMALE POPULATION
54.19
MALES / 100 FEMALES
184.54
FEMALES / 100 MALES
40.3
MEDIAN AGE
3.6
AVG FAMILY SIZE
3.3
AVG HOUSEHOLD SIZE
49
LABOR FORCE [ PEOPLE ]
32.0%
PERCENT IN LABOR FORCE
Bethpage Zip Codes
Bethpage Area Codes
Income in Bethpage
Income Overview in Bethpage
| Characteristic | Number | Measure |
| Per Capita Income | 276 | $15,264 |
| Median Family Income | 74 | $0 |
| Mean Family Income | 74 | $51,607 |
| Median Household Income | 84 | $0 |
| Mean Household Income | 84 | $50,019 |
| Income Deficit | 74 | $8,766 |
| Wage / Income Gap (%) | 276 | 0.00% |
| Wage / Income Gap ($) | 276 | 100.00¢ per $1 |
| Gini / Inequality Index | 276 | 0.45 |
Earnings by Sex in Bethpage
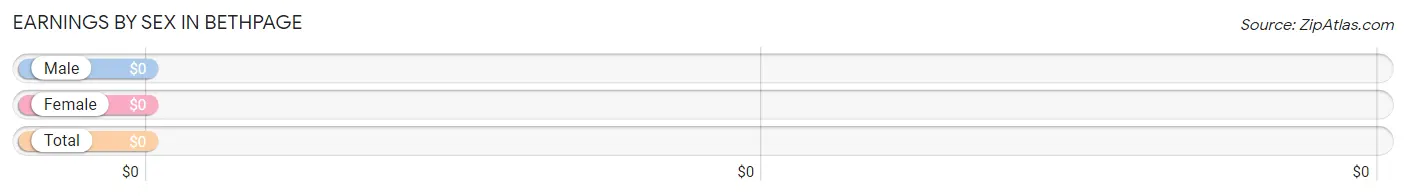
| Sex | Number | Average Earnings |
| Male | 27 (47.4%) | $0 |
| Female | 30 (52.6%) | $0 |
| Total | 57 (100.0%) | $0 |
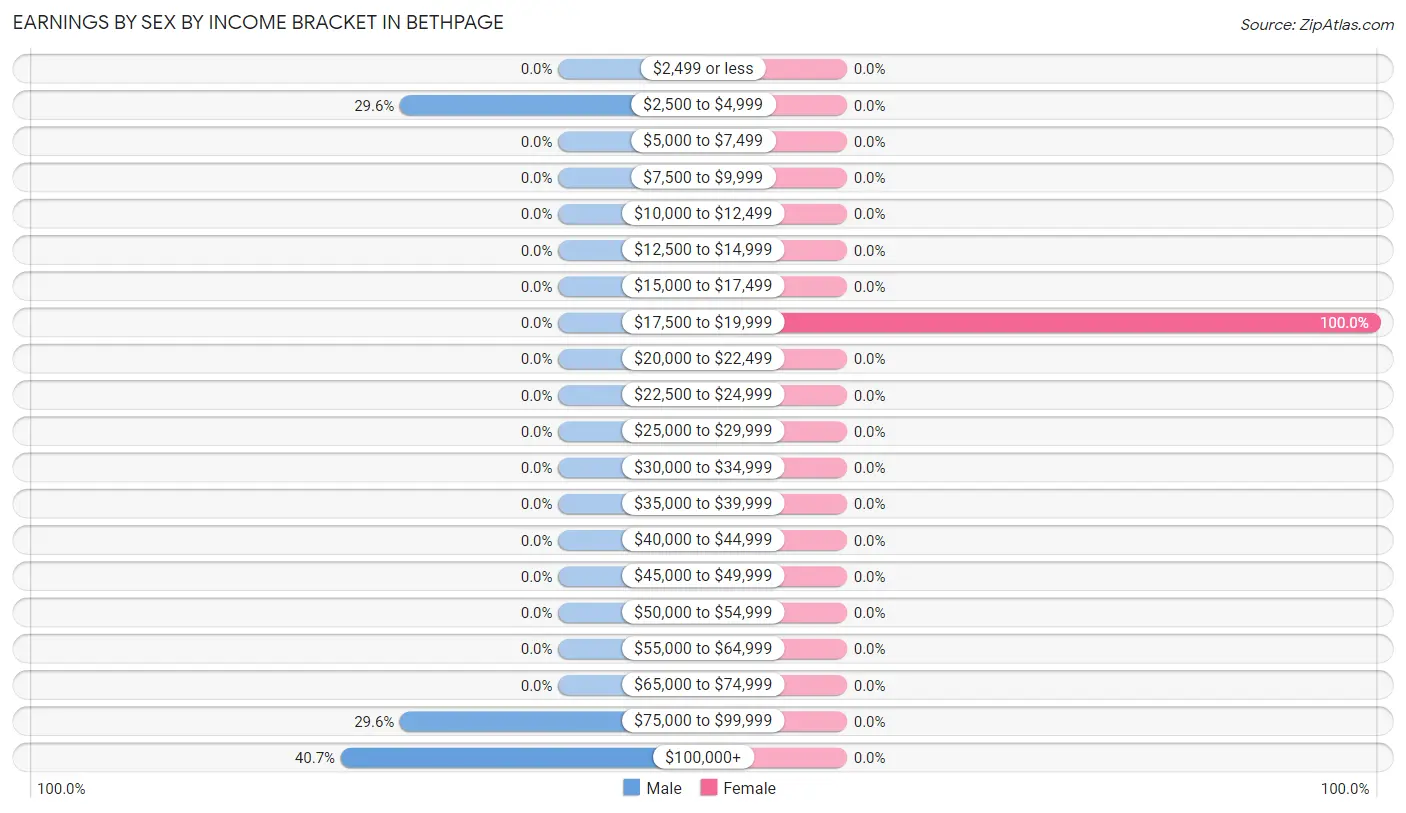
Earnings by Sex by Income Bracket in Bethpage
The most common earnings brackets in Bethpage are $100,000+ for men (11 | 40.7%) and $17,500 to $19,999 for women (30 | 100.0%).
| Income | Male | Female |
| $2,499 or less | 0 (0.0%) | 0 (0.0%) |
| $2,500 to $4,999 | 8 (29.6%) | 0 (0.0%) |
| $5,000 to $7,499 | 0 (0.0%) | 0 (0.0%) |
| $7,500 to $9,999 | 0 (0.0%) | 0 (0.0%) |
| $10,000 to $12,499 | 0 (0.0%) | 0 (0.0%) |
| $12,500 to $14,999 | 0 (0.0%) | 0 (0.0%) |
| $15,000 to $17,499 | 0 (0.0%) | 0 (0.0%) |
| $17,500 to $19,999 | 0 (0.0%) | 30 (100.0%) |
| $20,000 to $22,499 | 0 (0.0%) | 0 (0.0%) |
| $22,500 to $24,999 | 0 (0.0%) | 0 (0.0%) |
| $25,000 to $29,999 | 0 (0.0%) | 0 (0.0%) |
| $30,000 to $34,999 | 0 (0.0%) | 0 (0.0%) |
| $35,000 to $39,999 | 0 (0.0%) | 0 (0.0%) |
| $40,000 to $44,999 | 0 (0.0%) | 0 (0.0%) |
| $45,000 to $49,999 | 0 (0.0%) | 0 (0.0%) |
| $50,000 to $54,999 | 0 (0.0%) | 0 (0.0%) |
| $55,000 to $64,999 | 0 (0.0%) | 0 (0.0%) |
| $65,000 to $74,999 | 0 (0.0%) | 0 (0.0%) |
| $75,000 to $99,999 | 8 (29.6%) | 0 (0.0%) |
| $100,000+ | 11 (40.7%) | 0 (0.0%) |
| Total | 27 (100.0%) | 30 (100.0%) |
Earnings by Sex by Educational Attainment in Bethpage
| Educational Attainment | Male Income | Female Income |
| Less than High School | - | - |
| High School Diploma | - | - |
| College or Associate's Degree | - | - |
| Bachelor's Degree | - | - |
| Graduate Degree | - | - |
| Total | - | - |
Family Income in Bethpage
Family Income Brackets in Bethpage
According to the Bethpage family income data, there are 34 families falling into the $15,000 to $24,999 income range, which is the most common income bracket and makes up 46.0% of all families.
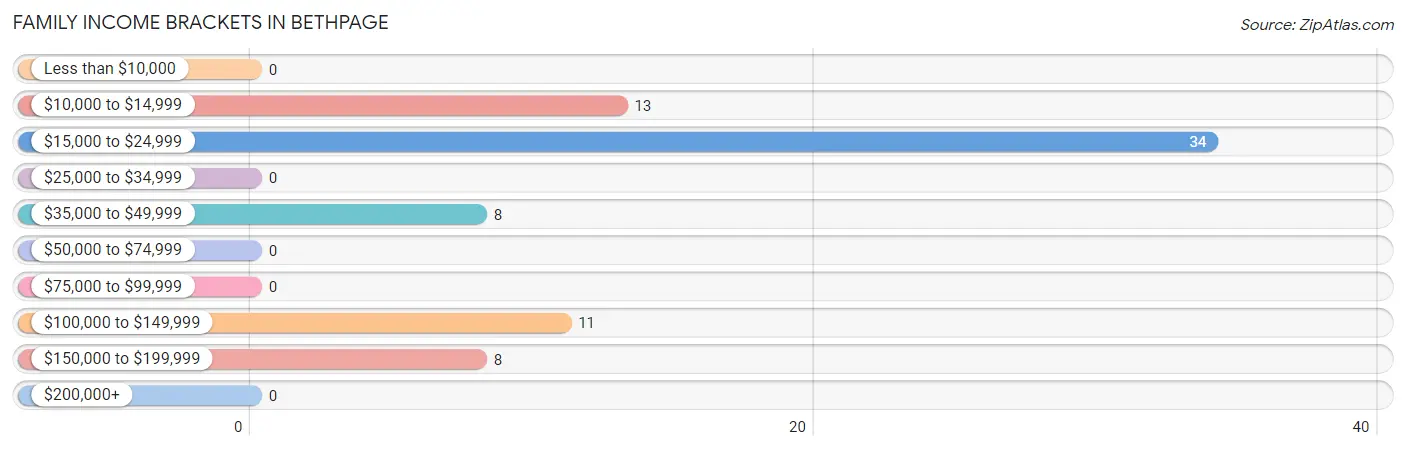
| Income Bracket | # Families | % Families |
| Less than $10,000 | 0 | 0.0% |
| $10,000 to $14,999 | 13 | 17.6% |
| $15,000 to $24,999 | 34 | 45.9% |
| $25,000 to $34,999 | 0 | 0.0% |
| $35,000 to $49,999 | 8 | 10.8% |
| $50,000 to $74,999 | 0 | 0.0% |
| $75,000 to $99,999 | 0 | 0.0% |
| $100,000 to $149,999 | 11 | 14.9% |
| $150,000 to $199,999 | 8 | 10.8% |
| $200,000+ | 0 | 0.0% |
Family Income by Famaliy Size in Bethpage
| Income Bracket | # Families | Median Income |
| 2-Person Families | 29 (39.2%) | $0 |
| 3-Person Families | 15 (20.3%) | $0 |
| 4-Person Families | 0 (0.0%) | $0 |
| 5-Person Families | 30 (40.5%) | $0 |
| 6-Person Families | 0 (0.0%) | $0 |
| 7+ Person Families | 0 (0.0%) | $0 |
| Total | 74 (100.0%) | $0 |
Family Income by Number of Earners in Bethpage
| Number of Earners | # Families | Median Income |
| No Earners | 17 (23.0%) | $0 |
| 1 Earner | 57 (77.0%) | $0 |
| 2 Earners | 0 (0.0%) | $0 |
| 3+ Earners | 0 (0.0%) | $0 |
| Total | 74 (100.0%) | $0 |
Household Income in Bethpage
Household Income Brackets in Bethpage
With 34 households falling in the category, the $15,000 to $24,999 income range is the most frequent in Bethpage, accounting for 40.5% of all households.
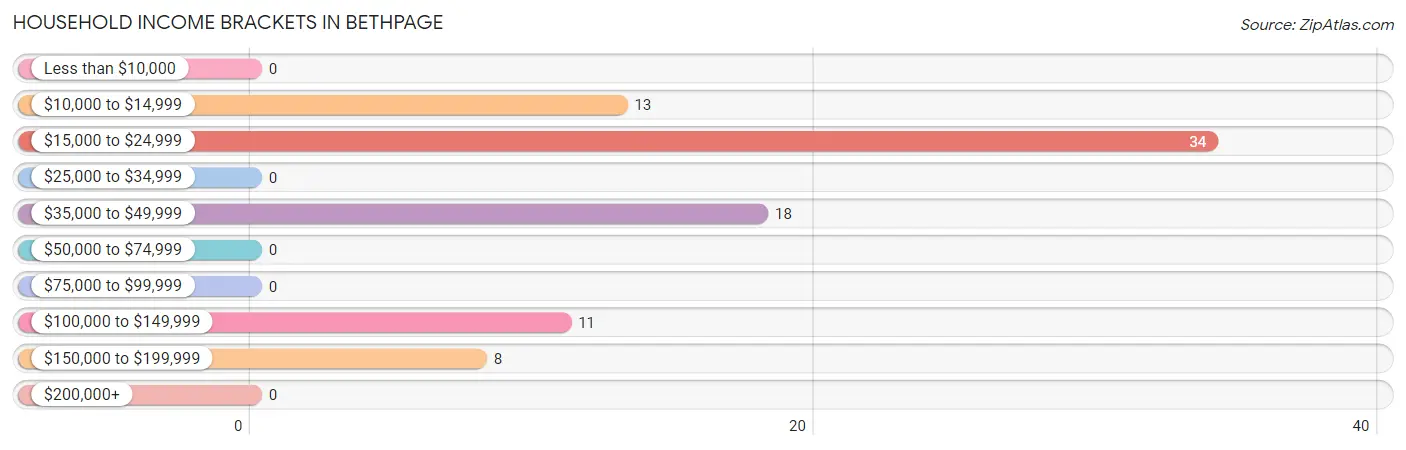
| Income Bracket | # Households | % Households |
| Less than $10,000 | 0 | 0.0% |
| $10,000 to $14,999 | 13 | 15.5% |
| $15,000 to $24,999 | 34 | 40.5% |
| $25,000 to $34,999 | 0 | 0.0% |
| $35,000 to $49,999 | 18 | 21.4% |
| $50,000 to $74,999 | 0 | 0.0% |
| $75,000 to $99,999 | 0 | 0.0% |
| $100,000 to $149,999 | 11 | 13.1% |
| $150,000 to $199,999 | 8 | 9.5% |
| $200,000+ | 0 | 0.0% |
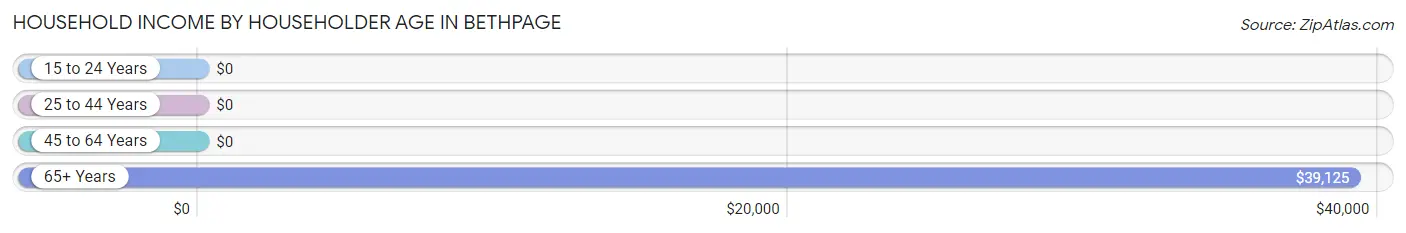
Household Income by Householder Age in Bethpage
The median household income in Bethpage is $0, with the highest median household income of $39,125 found in the 65+ years age bracket for the primary householder. A total of 39 households (46.4%) fall into this category.
| Income Bracket | # Households | Median Income |
| 15 to 24 Years | 0 (0.0%) | $0 |
| 25 to 44 Years | 0 (0.0%) | $0 |
| 45 to 64 Years | 45 (53.6%) | $0 |
| 65+ Years | 39 (46.4%) | $39,125 |
| Total | 84 (100.0%) | $0 |
Poverty in Bethpage
Income Below Poverty by Sex and Age in Bethpage
With 50.5% poverty level for males and 83.8% for females among the residents of Bethpage, 6 to 11 year old males and 6 to 11 year old females are the most vulnerable to poverty, with 31 males (100.0%) and 67 females (100.0%) in their respective age groups living below the poverty level.
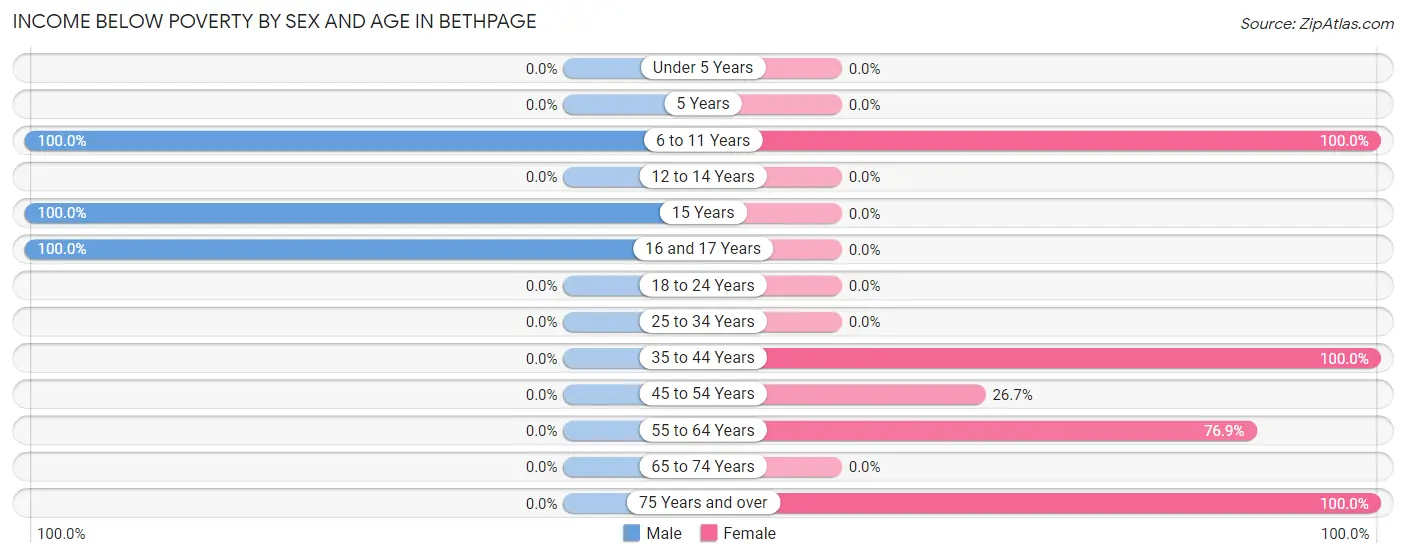
| Age Bracket | Male | Female |
| Under 5 Years | 0 (0.0%) | 0 (0.0%) |
| 5 Years | 0 (0.0%) | 0 (0.0%) |
| 6 to 11 Years | 31 (100.0%) | 67 (100.0%) |
| 12 to 14 Years | 0 (0.0%) | 0 (0.0%) |
| 15 Years | 14 (100.0%) | 0 (0.0%) |
| 16 and 17 Years | 4 (100.0%) | 0 (0.0%) |
| 18 to 24 Years | 0 (0.0%) | 0 (0.0%) |
| 25 to 34 Years | 0 (0.0%) | 0 (0.0%) |
| 35 to 44 Years | 0 (0.0%) | 36 (100.0%) |
| 45 to 54 Years | 0 (0.0%) | 4 (26.7%) |
| 55 to 64 Years | 0 (0.0%) | 30 (76.9%) |
| 65 to 74 Years | 0 (0.0%) | 0 (0.0%) |
| 75 Years and over | 0 (0.0%) | 13 (100.0%) |
| Total | 49 (50.5%) | 150 (83.8%) |
Income Above Poverty by Sex and Age in Bethpage
According to the poverty statistics in Bethpage, males aged 12 to 14 years and females aged 65 to 74 years are the age groups that are most secure financially, with 100.0% of males and 100.0% of females in these age groups living above the poverty line.
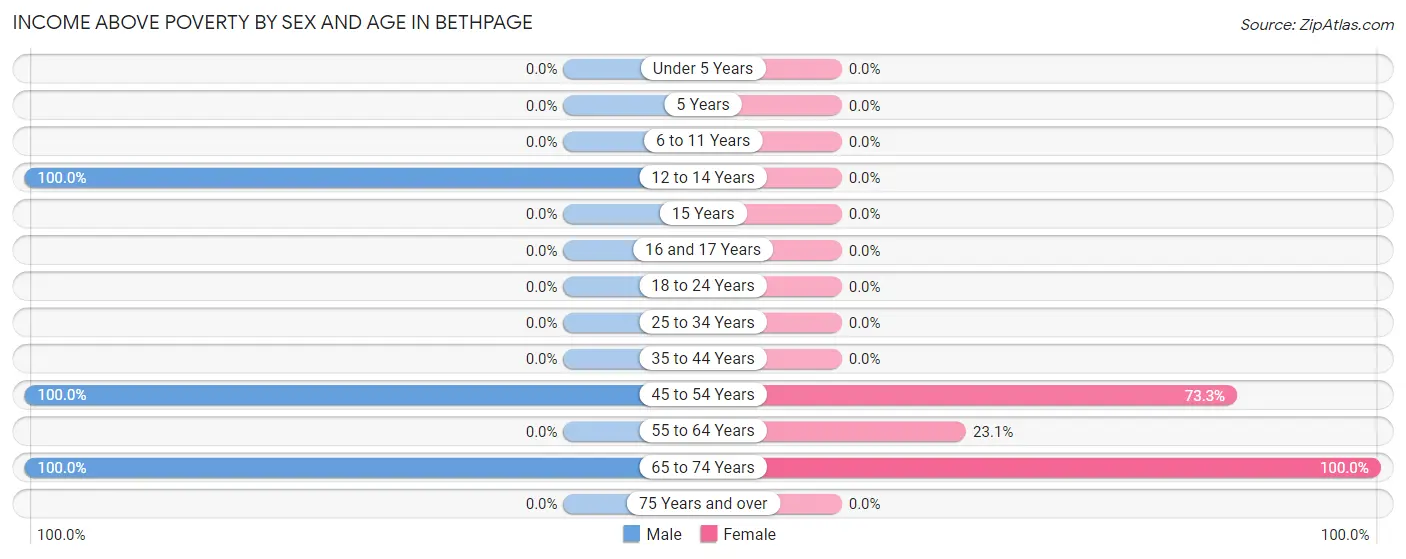
| Age Bracket | Male | Female |
| Under 5 Years | 0 (0.0%) | 0 (0.0%) |
| 5 Years | 0 (0.0%) | 0 (0.0%) |
| 6 to 11 Years | 0 (0.0%) | 0 (0.0%) |
| 12 to 14 Years | 11 (100.0%) | 0 (0.0%) |
| 15 Years | 0 (0.0%) | 0 (0.0%) |
| 16 and 17 Years | 0 (0.0%) | 0 (0.0%) |
| 18 to 24 Years | 0 (0.0%) | 0 (0.0%) |
| 25 to 34 Years | 0 (0.0%) | 0 (0.0%) |
| 35 to 44 Years | 0 (0.0%) | 0 (0.0%) |
| 45 to 54 Years | 11 (100.0%) | 11 (73.3%) |
| 55 to 64 Years | 0 (0.0%) | 9 (23.1%) |
| 65 to 74 Years | 26 (100.0%) | 9 (100.0%) |
| 75 Years and over | 0 (0.0%) | 0 (0.0%) |
| Total | 48 (49.5%) | 29 (16.2%) |
Income Below Poverty Among Married-Couple Families in Bethpage
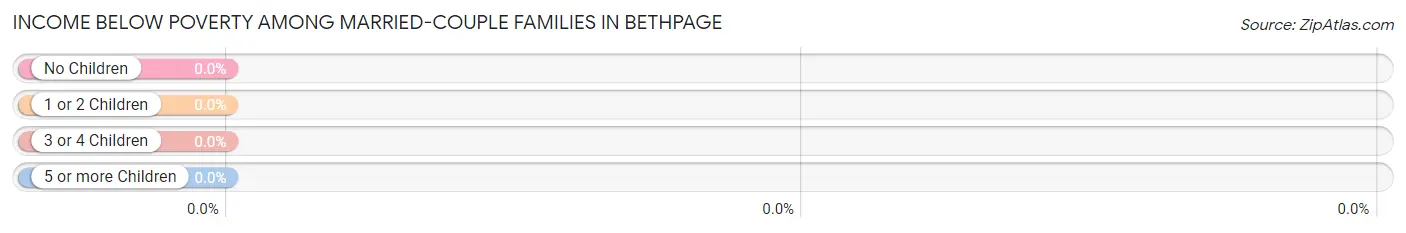
| Children | Above Poverty | Below Poverty |
| No Children | 16 (100.0%) | 0 (0.0%) |
| 1 or 2 Children | 11 (100.0%) | 0 (0.0%) |
| 3 or 4 Children | 0 (0.0%) | 0 (0.0%) |
| 5 or more Children | 0 (0.0%) | 0 (0.0%) |
| Total | 27 (100.0%) | 0 (0.0%) |
Income Below Poverty Among Single-Parent Households in Bethpage
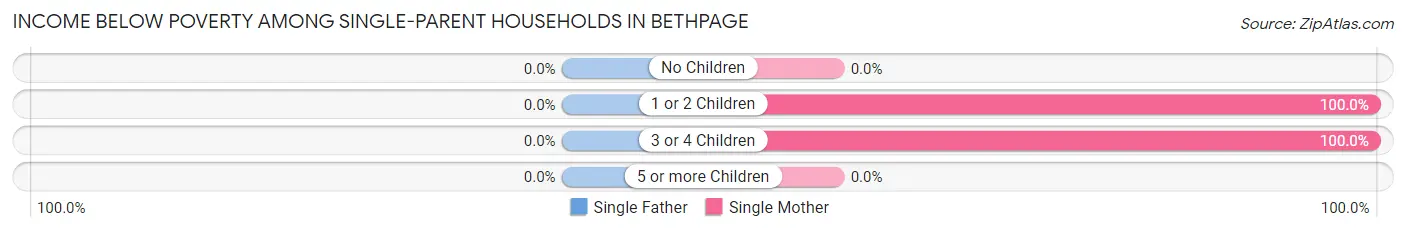
| Children | Single Father | Single Mother |
| No Children | 0 (0.0%) | 0 (0.0%) |
| 1 or 2 Children | 0 (0.0%) | 17 (100.0%) |
| 3 or 4 Children | 0 (0.0%) | 30 (100.0%) |
| 5 or more Children | 0 (0.0%) | 0 (0.0%) |
| Total | 0 (0.0%) | 47 (100.0%) |
Income Below Poverty Among Married-Couple vs Single-Parent Households in Bethpage
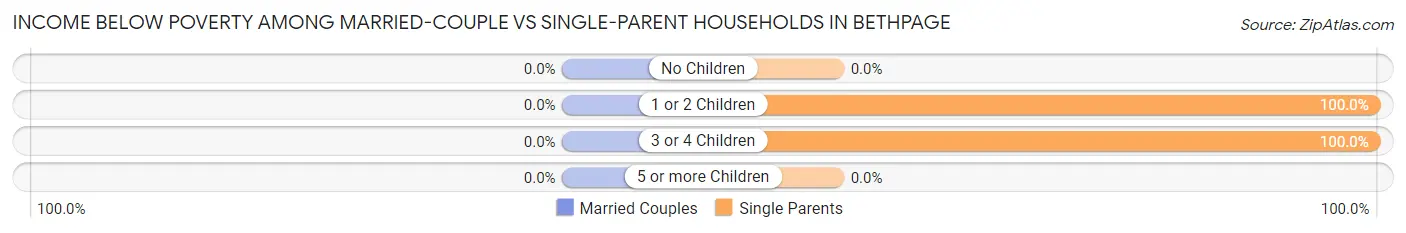
| Children | Married-Couple Families | Single-Parent Households |
| No Children | 0 (0.0%) | 0 (0.0%) |
| 1 or 2 Children | 0 (0.0%) | 17 (100.0%) |
| 3 or 4 Children | 0 (0.0%) | 30 (100.0%) |
| 5 or more Children | 0 (0.0%) | 0 (0.0%) |
| Total | 0 (0.0%) | 47 (100.0%) |
Race in Bethpage
The most populous races in Bethpage are , and White / Caucasian (276 | 100.0%).
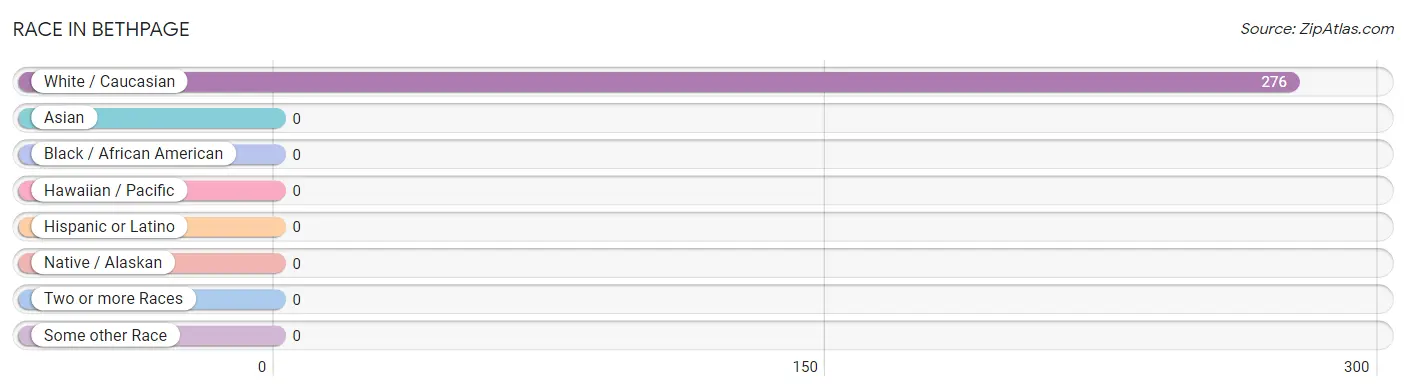
| Race | # Population | % Population |
| Asian | 0 | 0.0% |
| Black / African American | 0 | 0.0% |
| Hawaiian / Pacific | 0 | 0.0% |
| Hispanic or Latino | 0 | 0.0% |
| Native / Alaskan | 0 | 0.0% |
| White / Caucasian | 276 | 100.0% |
| Two or more Races | 0 | 0.0% |
| Some other Race | 0 | 0.0% |
| Total | 276 | 100.0% |
Ancestry in Bethpage
The most populous ancestries reported in Bethpage are Swedish (160 | 58.0%), German (81 | 29.3%), English (33 | 12.0%), Welsh (27 | 9.8%), and Irish (22 | 8.0%), together accounting for 117.0% of all Bethpage residents.
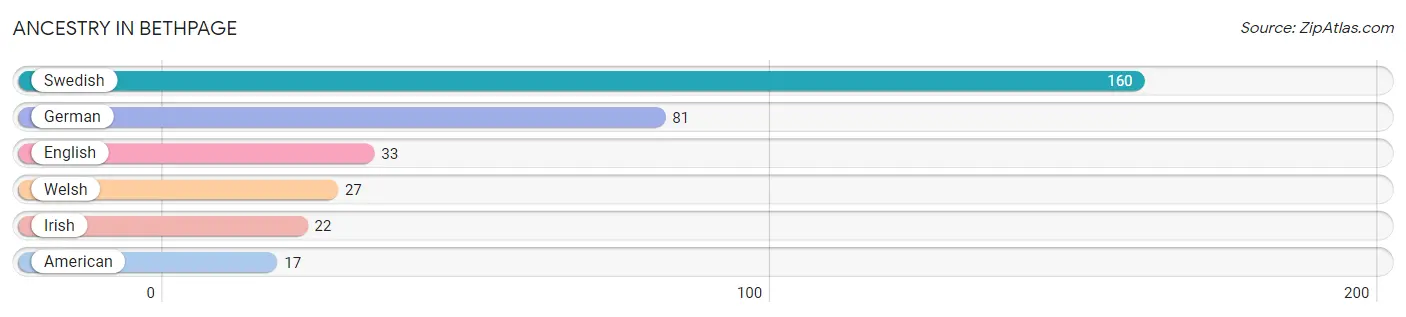
| Ancestry | # Population | % Population |
| American | 17 | 6.2% |
| English | 33 | 12.0% |
| German | 81 | 29.3% |
| Irish | 22 | 8.0% |
| Swedish | 160 | 58.0% |
| Welsh | 27 | 9.8% | View All 6 Rows |
Immigrants in Bethpage

| Immigration Origin | # Population | % Population | View All 0 Rows |
Sex and Age in Bethpage
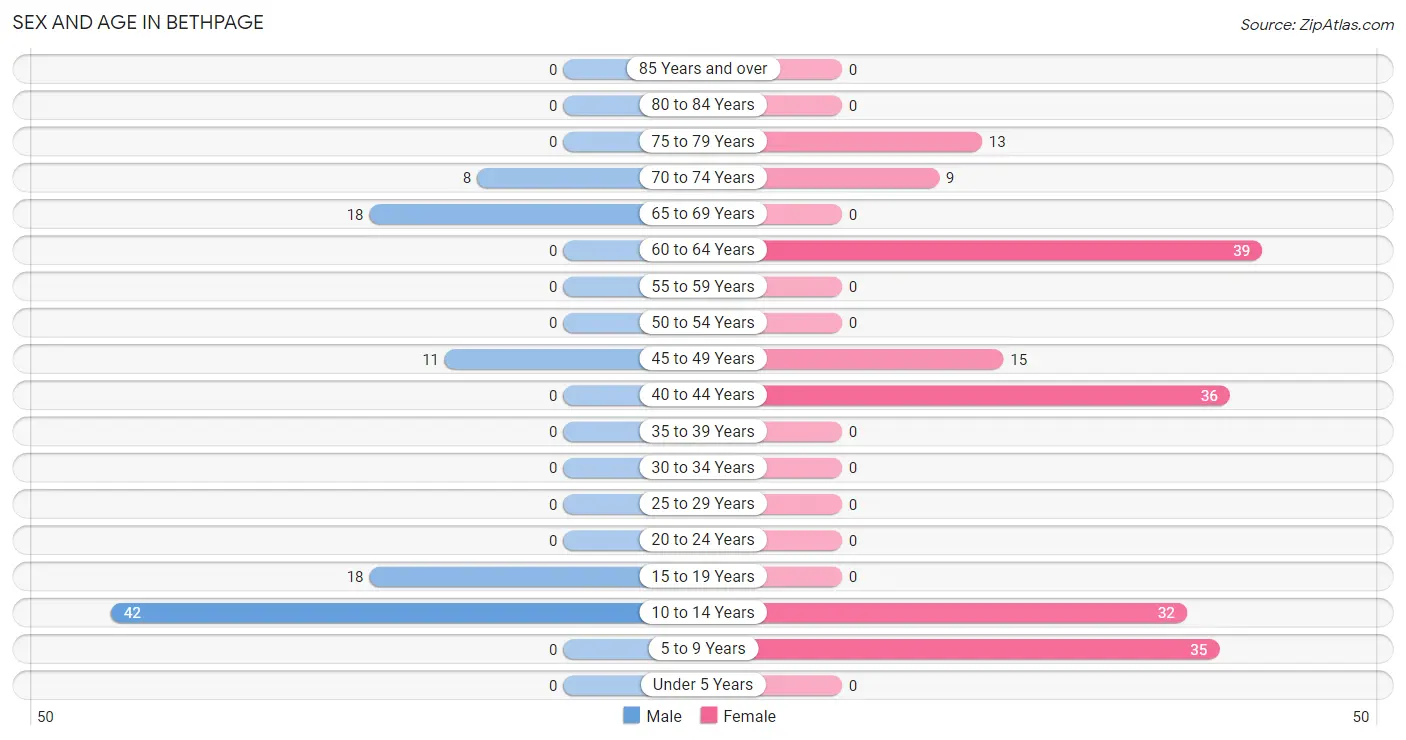
Sex and Age in Bethpage
The most populous age groups in Bethpage are 10 to 14 Years (42 | 43.3%) for men and 60 to 64 Years (39 | 21.8%) for women.
| Age Bracket | Male | Female |
| Under 5 Years | 0 (0.0%) | 0 (0.0%) |
| 5 to 9 Years | 0 (0.0%) | 35 (19.6%) |
| 10 to 14 Years | 42 (43.3%) | 32 (17.9%) |
| 15 to 19 Years | 18 (18.6%) | 0 (0.0%) |
| 20 to 24 Years | 0 (0.0%) | 0 (0.0%) |
| 25 to 29 Years | 0 (0.0%) | 0 (0.0%) |
| 30 to 34 Years | 0 (0.0%) | 0 (0.0%) |
| 35 to 39 Years | 0 (0.0%) | 0 (0.0%) |
| 40 to 44 Years | 0 (0.0%) | 36 (20.1%) |
| 45 to 49 Years | 11 (11.3%) | 15 (8.4%) |
| 50 to 54 Years | 0 (0.0%) | 0 (0.0%) |
| 55 to 59 Years | 0 (0.0%) | 0 (0.0%) |
| 60 to 64 Years | 0 (0.0%) | 39 (21.8%) |
| 65 to 69 Years | 18 (18.6%) | 0 (0.0%) |
| 70 to 74 Years | 8 (8.3%) | 9 (5.0%) |
| 75 to 79 Years | 0 (0.0%) | 13 (7.3%) |
| 80 to 84 Years | 0 (0.0%) | 0 (0.0%) |
| 85 Years and over | 0 (0.0%) | 0 (0.0%) |
| Total | 97 (100.0%) | 179 (100.0%) |
Families and Households in Bethpage
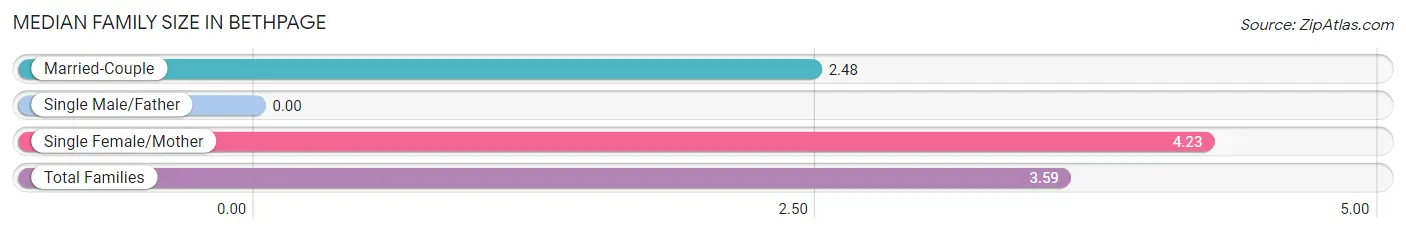
Median Family Size in Bethpage
| Family Type | # Families | Family Size |
| Married-Couple | 27 (36.5%) | 2.48 |
| Single Male/Father | 0 (0.0%) | - |
| Single Female/Mother | 47 (63.5%) | 4.23 |
| Total Families | 74 (100.0%) | 3.59 |
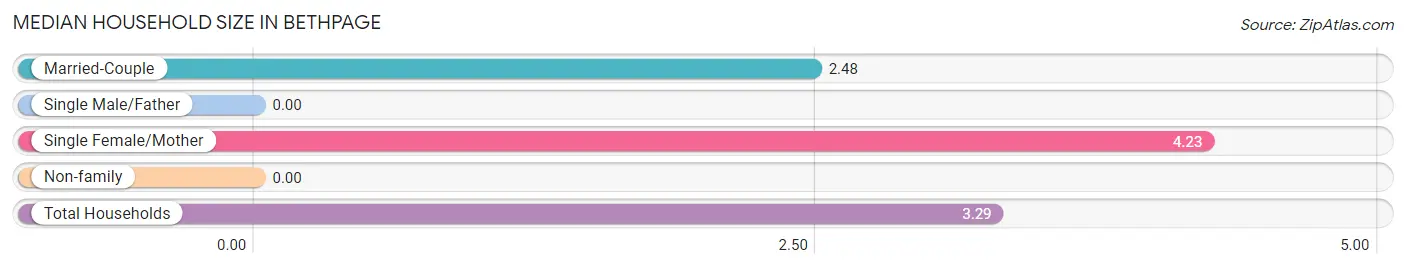
Median Household Size in Bethpage
| Household Type | # Households | Household Size |
| Married-Couple | 27 (32.1%) | 2.48 |
| Single Male/Father | 0 (0.0%) | - |
| Single Female/Mother | 47 (55.9%) | 4.23 |
| Non-family | 10 (11.9%) | - |
| Total Households | 84 (100.0%) | 3.29 |
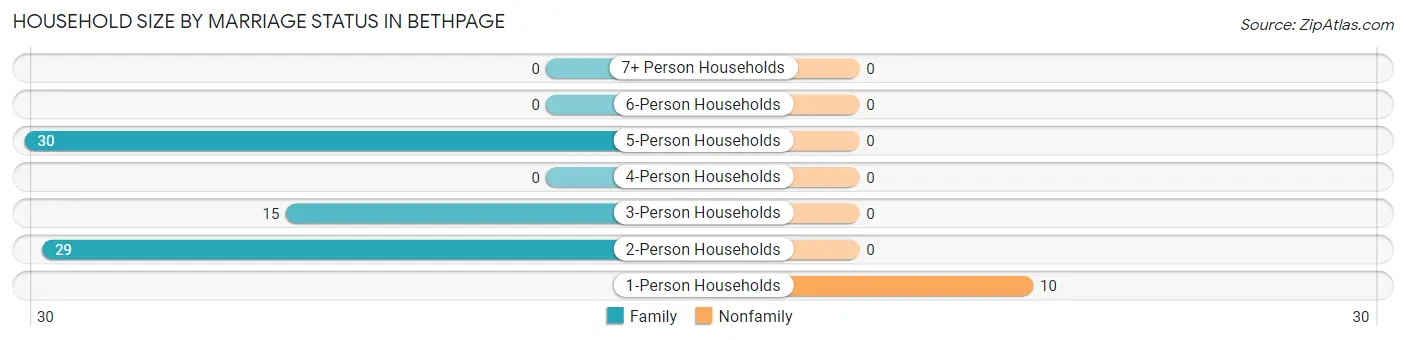
Household Size by Marriage Status in Bethpage
Out of a total of 84 households in Bethpage, 74 (88.1%) are family households, while 10 (11.9%) are nonfamily households. The most numerous type of family households are 5-person households, comprising 30, and the most common type of nonfamily households are 1-person households, comprising 10.
| Household Size | Family Households | Nonfamily Households |
| 1-Person Households | - | 10 (11.9%) |
| 2-Person Households | 29 (34.5%) | 0 (0.0%) |
| 3-Person Households | 15 (17.9%) | 0 (0.0%) |
| 4-Person Households | 0 (0.0%) | 0 (0.0%) |
| 5-Person Households | 30 (35.7%) | 0 (0.0%) |
| 6-Person Households | 0 (0.0%) | 0 (0.0%) |
| 7+ Person Households | 0 (0.0%) | 0 (0.0%) |
| Total | 74 (88.1%) | 10 (11.9%) |
Female Fertility in Bethpage
Fertility by Age in Bethpage
| Age Bracket | Women with Births | Births / 1,000 Women |
| 15 to 19 years | 0 (0.0%) | 0.0 |
| 20 to 34 years | 0 (0.0%) | 0.0 |
| 35 to 50 years | 0 (0.0%) | 0.0 |
| Total | 0 (0.0%) | 0.0 |
Fertility by Age by Marriage Status in Bethpage
| Age Bracket | Married | Unmarried |
| 15 to 19 years | 0 (0.0%) | 0 (0.0%) |
| 20 to 34 years | 0 (0.0%) | 0 (0.0%) |
| 35 to 50 years | 0 (0.0%) | 0 (0.0%) |
| Total | 0 (0.0%) | 0 (0.0%) |
Fertility by Education in Bethpage
| Educational Attainment | Women with Births | Births / 1,000 Women |
| Less than High School | 0 (0.0%) | 0.0 |
| High School Diploma | 0 (0.0%) | 0.0 |
| College or Associate's Degree | 0 (0.0%) | 0.0 |
| Bachelor's Degree | 0 (0.0%) | 0.0 |
| Graduate Degree | 0 (0.0%) | 0.0 |
| Total | 0 (0.0%) | 0.0 |
Fertility by Education by Marriage Status in Bethpage
| Educational Attainment | Married | Unmarried |
| Less than High School | 0 (0.0%) | 0 (0.0%) |
| High School Diploma | 0 (0.0%) | 0 (0.0%) |
| College or Associate's Degree | 0 (0.0%) | 0 (0.0%) |
| Bachelor's Degree | 0 (0.0%) | 0 (0.0%) |
| Graduate Degree | 0 (0.0%) | 0 (0.0%) |
| Total | 0 (0.0%) | 0 (0.0%) |
Employment Characteristics in Bethpage
Employment by Class of Employer in Bethpage
Among the 49 employed individuals in Bethpage, self-employed (not incorporated) (38 | 77.5%), and federal government employees (11 | 22.5%) make up the most common classes of employment.
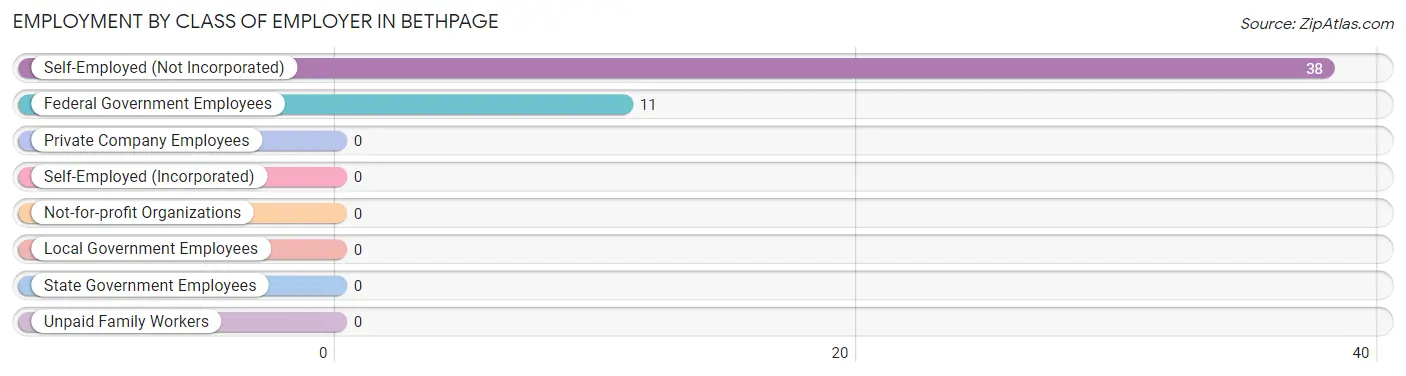
| Employer Class | # Employees | % Employees |
| Private Company Employees | 0 | 0.0% |
| Self-Employed (Incorporated) | 0 | 0.0% |
| Self-Employed (Not Incorporated) | 38 | 77.5% |
| Not-for-profit Organizations | 0 | 0.0% |
| Local Government Employees | 0 | 0.0% |
| State Government Employees | 0 | 0.0% |
| Federal Government Employees | 11 | 22.5% |
| Unpaid Family Workers | 0 | 0.0% |
| Total | 49 | 100.0% |
Employment Status by Age in Bethpage
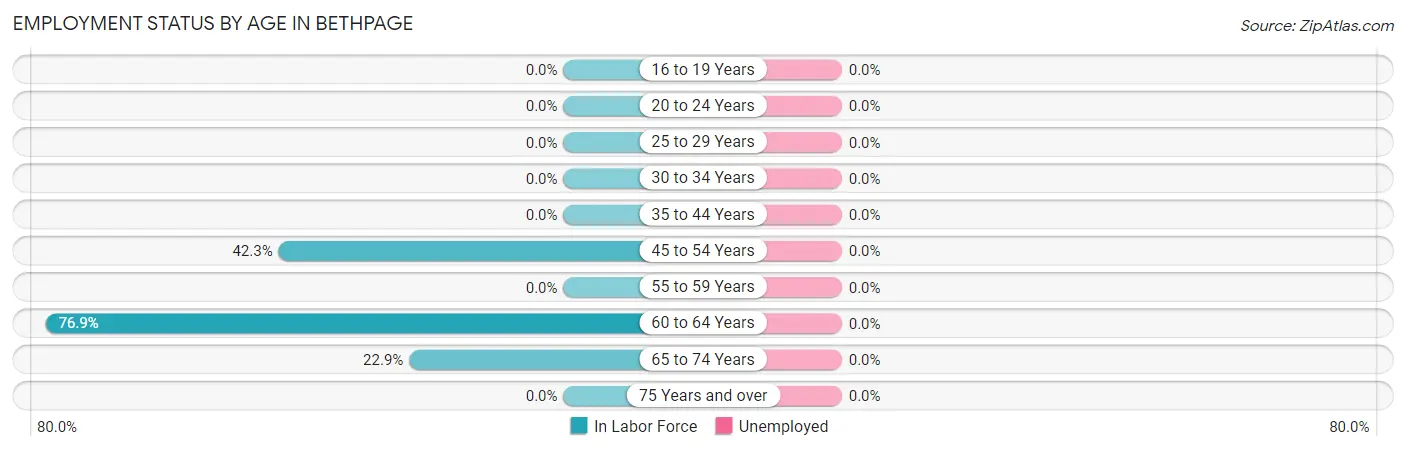
| Age Bracket | In Labor Force | Unemployed |
| 16 to 19 Years | 0 (0.0%) | 0 (0.0%) |
| 20 to 24 Years | 0 (0.0%) | 0 (0.0%) |
| 25 to 29 Years | 0 (0.0%) | 0 (0.0%) |
| 30 to 34 Years | 0 (0.0%) | 0 (0.0%) |
| 35 to 44 Years | 0 (0.0%) | 0 (0.0%) |
| 45 to 54 Years | 11 (42.3%) | 0 (0.0%) |
| 55 to 59 Years | 0 (0.0%) | 0 (0.0%) |
| 60 to 64 Years | 30 (76.9%) | 0 (0.0%) |
| 65 to 74 Years | 8 (22.9%) | 0 (0.0%) |
| 75 Years and over | 0 (0.0%) | 0 (0.0%) |
| Total | 49 (32.0%) | 0 (0.0%) |
Employment Status by Educational Attainment in Bethpage
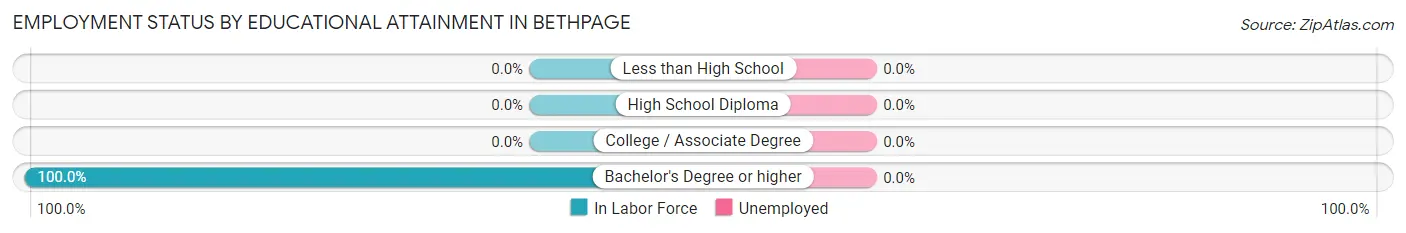
| Educational Attainment | In Labor Force | Unemployed |
| Less than High School | 0 (0.0%) | 0 (0.0%) |
| High School Diploma | 0 (0.0%) | 0 (0.0%) |
| College / Associate Degree | 0 (0.0%) | 0 (0.0%) |
| Bachelor's Degree or higher | 41 (100.0%) | 0 (0.0%) |
| Total | 41 (40.6%) | 0 (0.0%) |
Employment Occupations by Sex in Bethpage
Management, Business, Science and Arts Occupations
The most common Management, Business, Science and Arts occupations in Bethpage are Health Diagnosing & Treating (11 | 22.5%), and Health Technologists (11 | 22.5%).
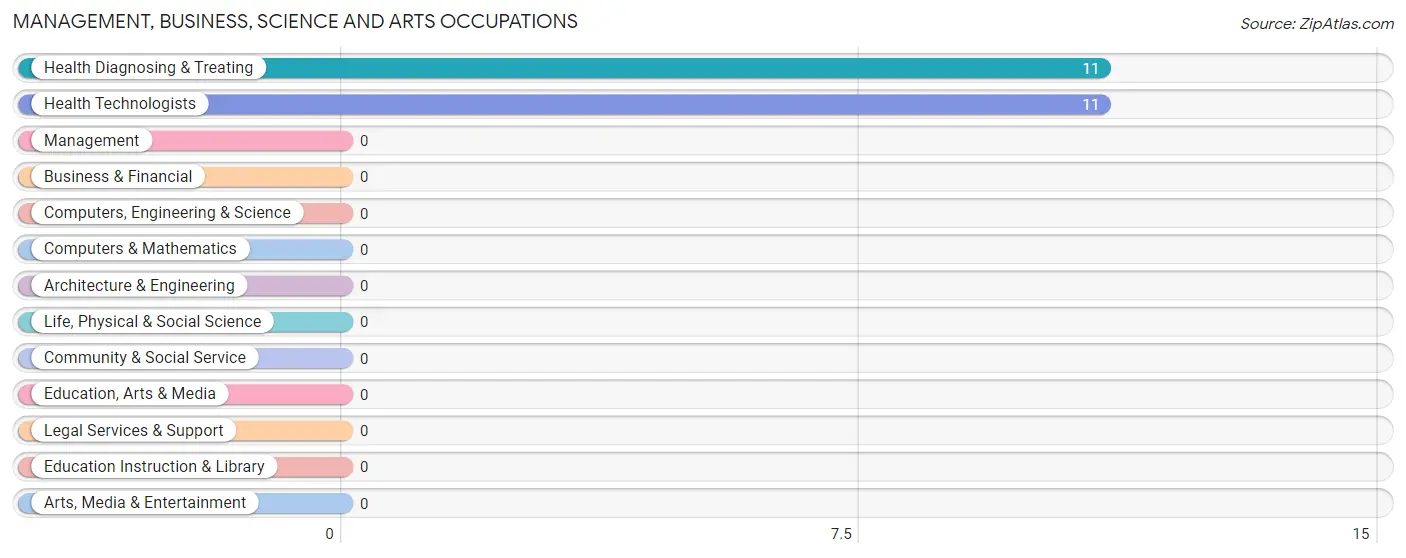
Management, Business, Science and Arts Occupations by Sex
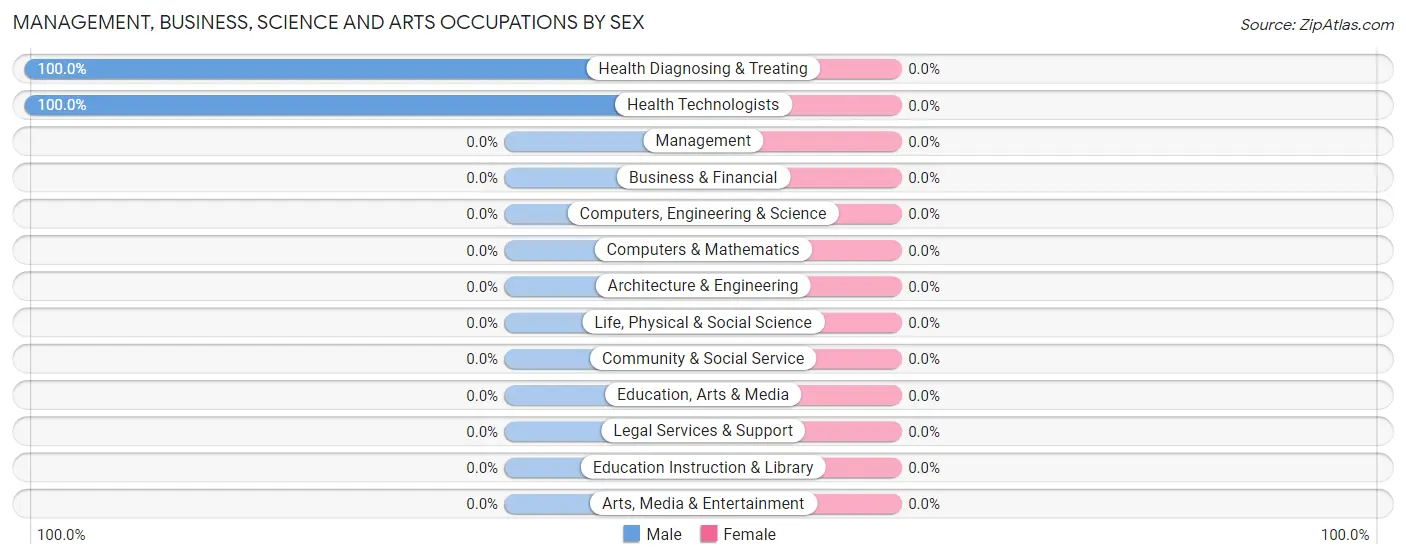
| Occupation | Male | Female |
| Management | 0 (0.0%) | 0 (0.0%) |
| Business & Financial | 0 (0.0%) | 0 (0.0%) |
| Computers, Engineering & Science | 0 (0.0%) | 0 (0.0%) |
| Computers & Mathematics | 0 (0.0%) | 0 (0.0%) |
| Architecture & Engineering | 0 (0.0%) | 0 (0.0%) |
| Life, Physical & Social Science | 0 (0.0%) | 0 (0.0%) |
| Community & Social Service | 0 (0.0%) | 0 (0.0%) |
| Education, Arts & Media | 0 (0.0%) | 0 (0.0%) |
| Legal Services & Support | 0 (0.0%) | 0 (0.0%) |
| Education Instruction & Library | 0 (0.0%) | 0 (0.0%) |
| Arts, Media & Entertainment | 0 (0.0%) | 0 (0.0%) |
| Health Diagnosing & Treating | 11 (100.0%) | 0 (0.0%) |
| Health Technologists | 11 (100.0%) | 0 (0.0%) |
| Total (Category) | 11 (100.0%) | 0 (0.0%) |
| Total (Overall) | 19 (38.8%) | 30 (61.2%) |
Services Occupations
The most common Services occupations in Bethpage are , and Healthcare Support (30 | 61.2%).
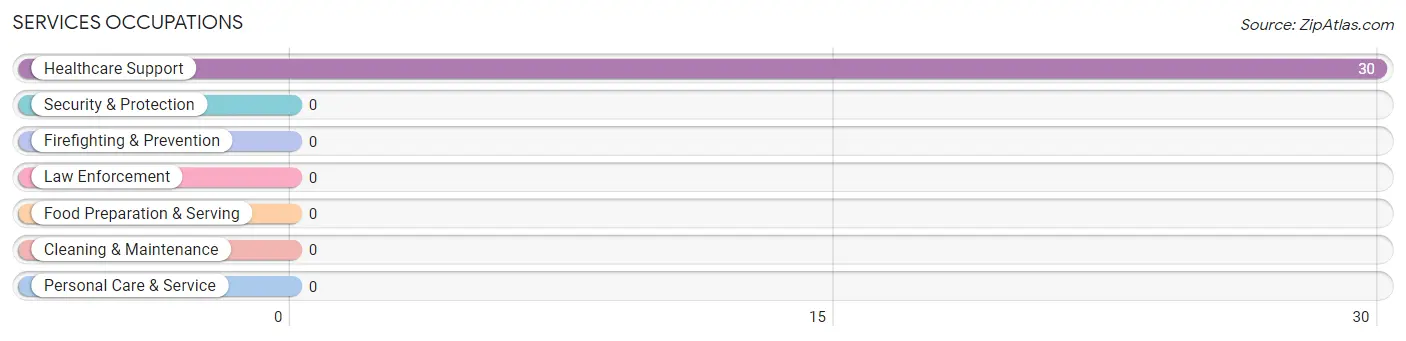
Services Occupations by Sex
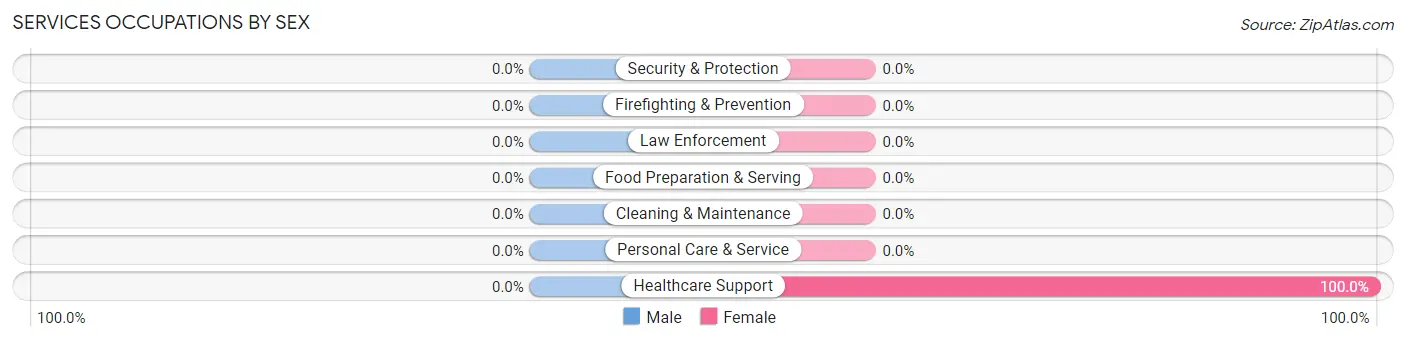
| Occupation | Male | Female |
| Healthcare Support | 0 (0.0%) | 30 (100.0%) |
| Security & Protection | 0 (0.0%) | 0 (0.0%) |
| Firefighting & Prevention | 0 (0.0%) | 0 (0.0%) |
| Law Enforcement | 0 (0.0%) | 0 (0.0%) |
| Food Preparation & Serving | 0 (0.0%) | 0 (0.0%) |
| Cleaning & Maintenance | 0 (0.0%) | 0 (0.0%) |
| Personal Care & Service | 0 (0.0%) | 0 (0.0%) |
| Total (Category) | 0 (0.0%) | 30 (100.0%) |
| Total (Overall) | 19 (38.8%) | 30 (61.2%) |
Sales and Office Occupations
The most common Sales and Office occupations in Bethpage are , and Sales & Related (8 | 16.3%).
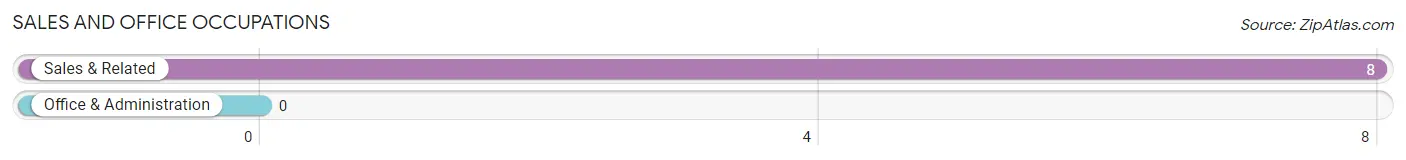
Sales and Office Occupations by Sex
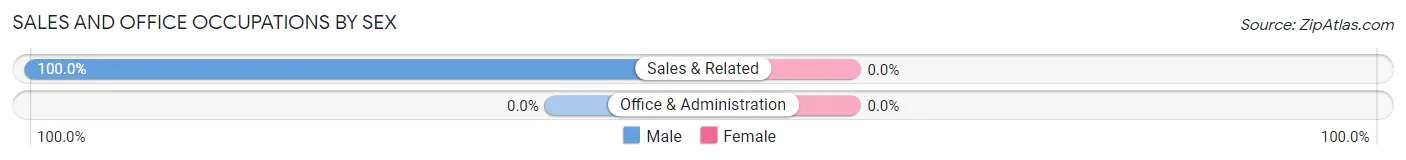
| Occupation | Male | Female |
| Sales & Related | 8 (100.0%) | 0 (0.0%) |
| Office & Administration | 0 (0.0%) | 0 (0.0%) |
| Total (Category) | 8 (100.0%) | 0 (0.0%) |
| Total (Overall) | 19 (38.8%) | 30 (61.2%) |
Natural Resources, Construction and Maintenance Occupations
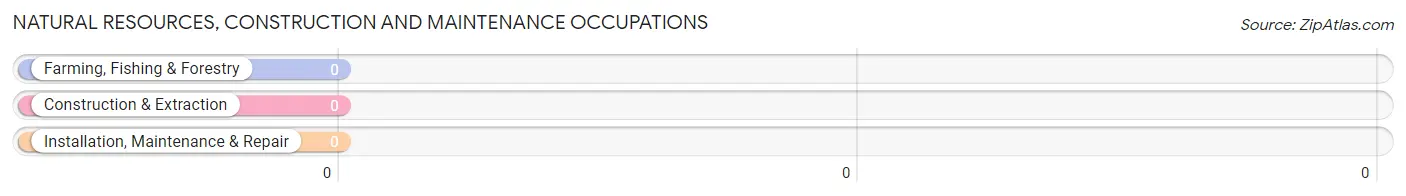
Natural Resources, Construction and Maintenance Occupations by Sex
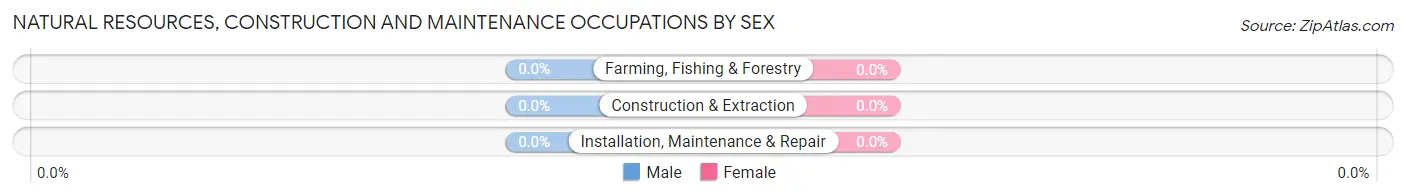
| Occupation | Male | Female |
| Farming, Fishing & Forestry | 0 (0.0%) | 0 (0.0%) |
| Construction & Extraction | 0 (0.0%) | 0 (0.0%) |
| Installation, Maintenance & Repair | 0 (0.0%) | 0 (0.0%) |
| Total (Category) | 0 (0.0%) | 0 (0.0%) |
| Total (Overall) | 19 (38.8%) | 30 (61.2%) |
Production, Transportation and Moving Occupations
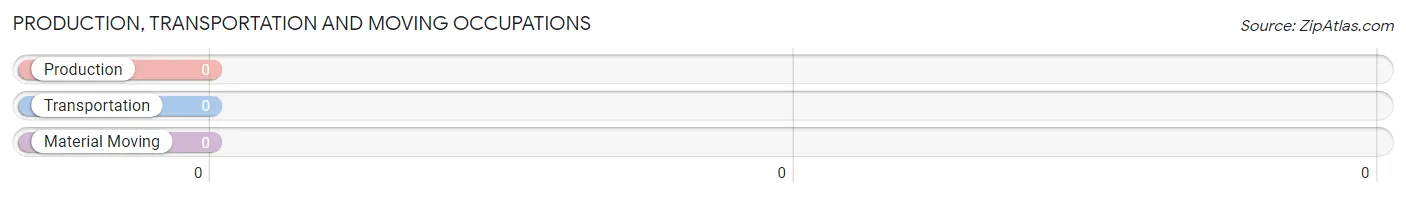
Production, Transportation and Moving Occupations by Sex
| Occupation | Male | Female |
| Production | 0 (0.0%) | 0 (0.0%) |
| Transportation | 0 (0.0%) | 0 (0.0%) |
| Material Moving | 0 (0.0%) | 0 (0.0%) |
| Total (Category) | 0 (0.0%) | 0 (0.0%) |
| Total (Overall) | 19 (38.8%) | 30 (61.2%) |
Employment Industries by Sex in Bethpage
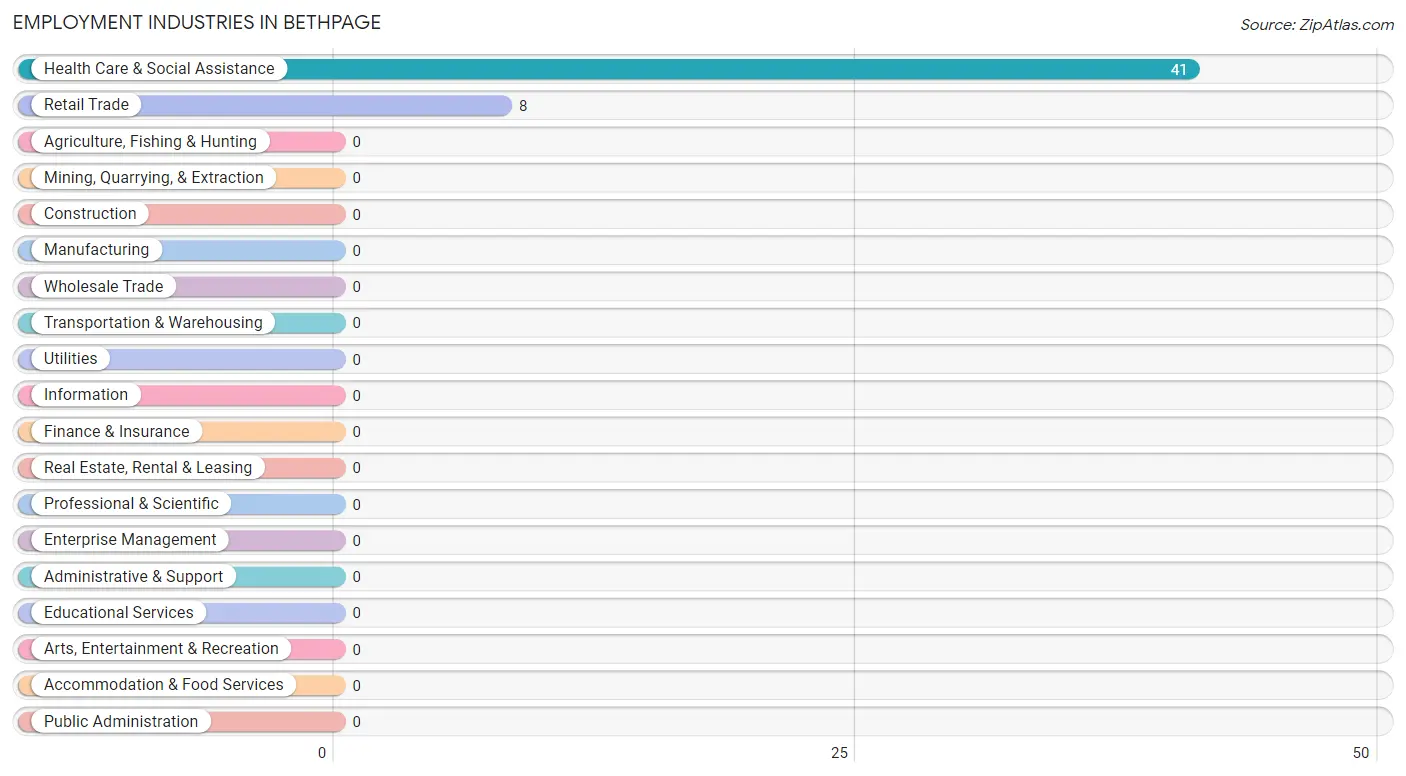
Employment Industries in Bethpage
The major employment industries in Bethpage include Health Care & Social Assistance (41 | 83.7%), and Retail Trade (8 | 16.3%).
Employment Industries by Sex in Bethpage
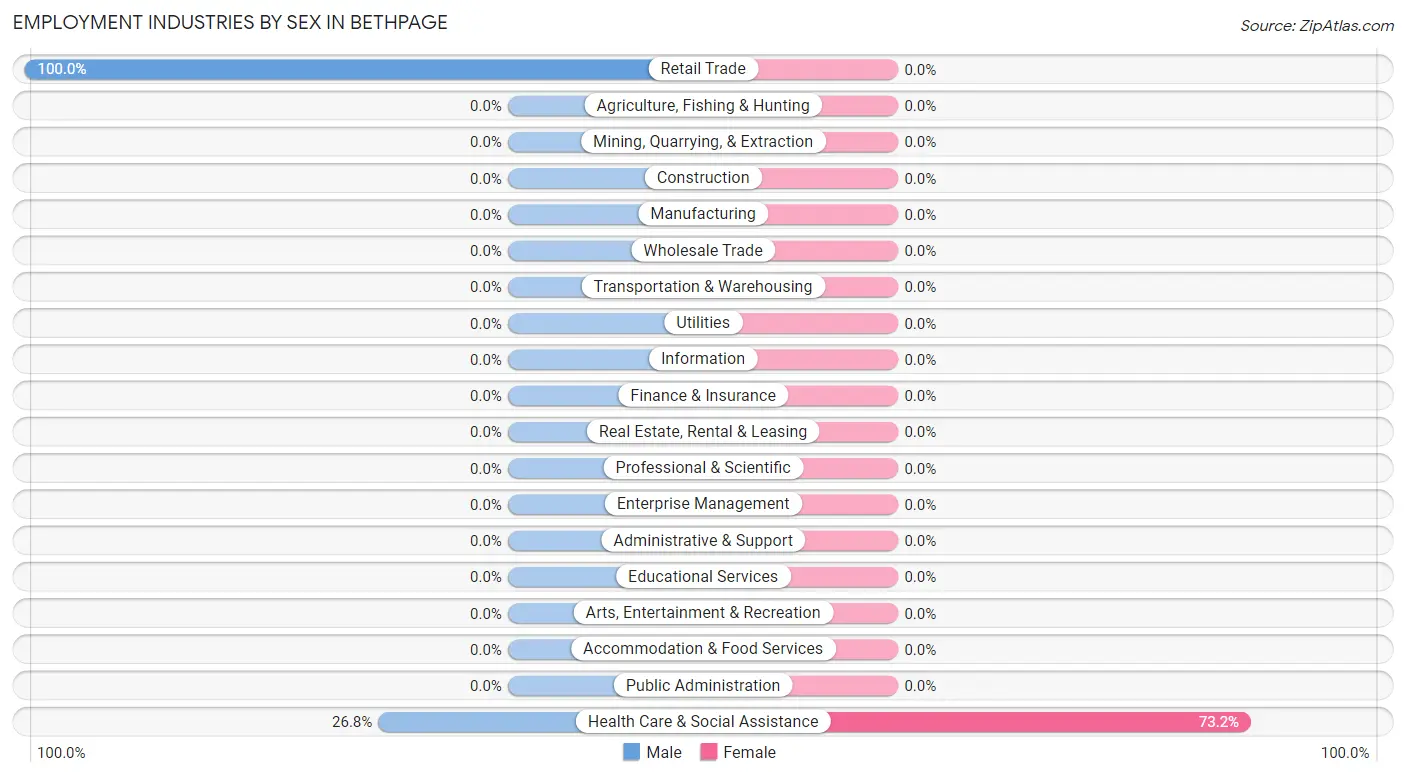
| Industry | Male | Female |
| Agriculture, Fishing & Hunting | 0 (0.0%) | 0 (0.0%) |
| Mining, Quarrying, & Extraction | 0 (0.0%) | 0 (0.0%) |
| Construction | 0 (0.0%) | 0 (0.0%) |
| Manufacturing | 0 (0.0%) | 0 (0.0%) |
| Wholesale Trade | 0 (0.0%) | 0 (0.0%) |
| Retail Trade | 8 (100.0%) | 0 (0.0%) |
| Transportation & Warehousing | 0 (0.0%) | 0 (0.0%) |
| Utilities | 0 (0.0%) | 0 (0.0%) |
| Information | 0 (0.0%) | 0 (0.0%) |
| Finance & Insurance | 0 (0.0%) | 0 (0.0%) |
| Real Estate, Rental & Leasing | 0 (0.0%) | 0 (0.0%) |
| Professional & Scientific | 0 (0.0%) | 0 (0.0%) |
| Enterprise Management | 0 (0.0%) | 0 (0.0%) |
| Administrative & Support | 0 (0.0%) | 0 (0.0%) |
| Educational Services | 0 (0.0%) | 0 (0.0%) |
| Health Care & Social Assistance | 11 (26.8%) | 30 (73.2%) |
| Arts, Entertainment & Recreation | 0 (0.0%) | 0 (0.0%) |
| Accommodation & Food Services | 0 (0.0%) | 0 (0.0%) |
| Public Administration | 0 (0.0%) | 0 (0.0%) |
| Total | 19 (38.8%) | 30 (61.2%) |
Education in Bethpage
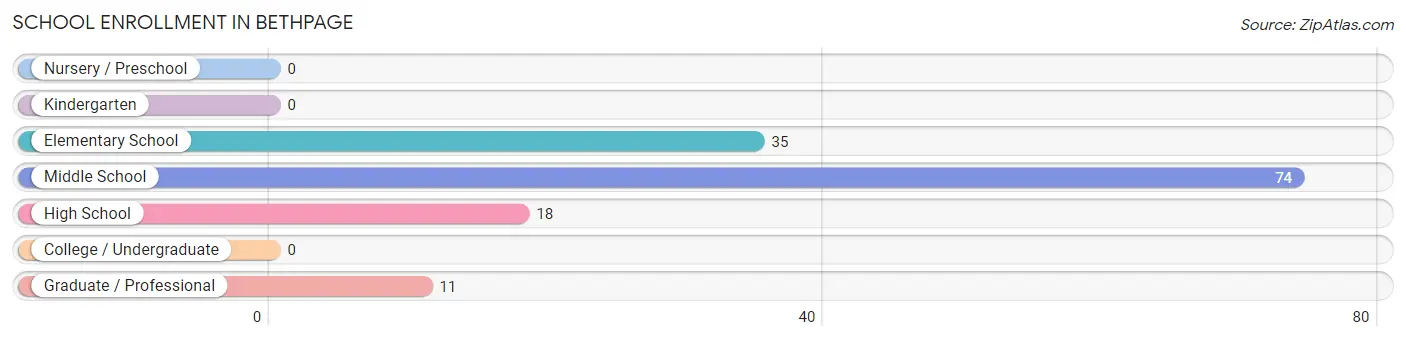
School Enrollment in Bethpage
The most common levels of schooling among the 138 students in Bethpage are middle school (74 | 53.6%), elementary school (35 | 25.4%), and high school (18 | 13.0%).
| School Level | # Students | % Students |
| Nursery / Preschool | 0 | 0.0% |
| Kindergarten | 0 | 0.0% |
| Elementary School | 35 | 25.4% |
| Middle School | 74 | 53.6% |
| High School | 18 | 13.0% |
| College / Undergraduate | 0 | 0.0% |
| Graduate / Professional | 11 | 8.0% |
| Total | 138 | 100.0% |
School Enrollment by Age by Funding Source in Bethpage
Out of a total of 138 students who are enrolled in schools in Bethpage, 11 (8.0%) attend a private institution, while the remaining 127 (92.0%) are enrolled in public schools. The age group of 35 years and over has the highest likelihood of being enrolled in private schools, with 11 (100.0% in the age bracket) enrolled. Conversely, the age group of 5 to 9 year old has the lowest likelihood of being enrolled in a private school, with 35 (100.0% in the age bracket) attending a public institution.
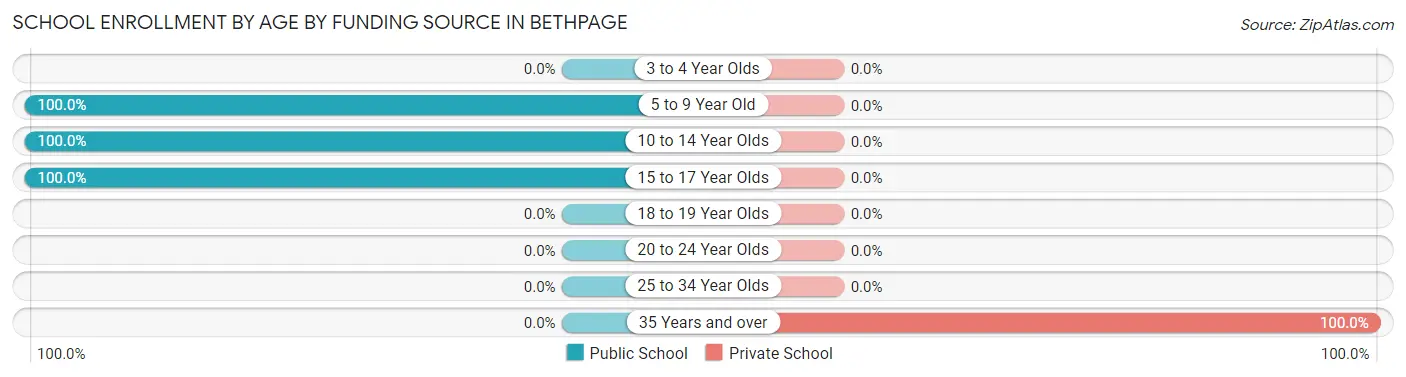
| Age Bracket | Public School | Private School |
| 3 to 4 Year Olds | 0 (0.0%) | 0 (0.0%) |
| 5 to 9 Year Old | 35 (100.0%) | 0 (0.0%) |
| 10 to 14 Year Olds | 74 (100.0%) | 0 (0.0%) |
| 15 to 17 Year Olds | 18 (100.0%) | 0 (0.0%) |
| 18 to 19 Year Olds | 0 (0.0%) | 0 (0.0%) |
| 20 to 24 Year Olds | 0 (0.0%) | 0 (0.0%) |
| 25 to 34 Year Olds | 0 (0.0%) | 0 (0.0%) |
| 35 Years and over | 0 (0.0%) | 11 (100.0%) |
| Total | 127 (92.0%) | 11 (8.0%) |
Educational Attainment by Field of Study in Bethpage
, and science & technology (41 | 100.0%) are the most common fields of study among 41 individuals in Bethpage who have obtained a bachelor's degree or higher.
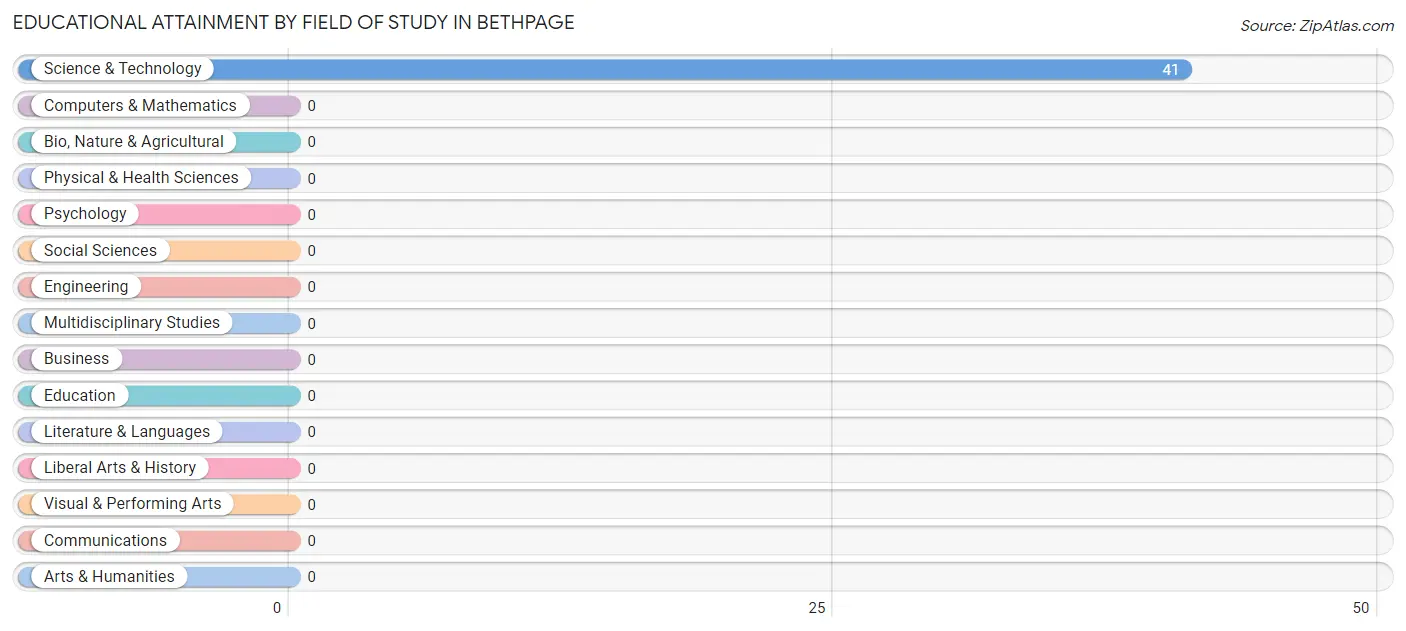
| Field of Study | # Graduates | % Graduates |
| Computers & Mathematics | 0 | 0.0% |
| Bio, Nature & Agricultural | 0 | 0.0% |
| Physical & Health Sciences | 0 | 0.0% |
| Psychology | 0 | 0.0% |
| Social Sciences | 0 | 0.0% |
| Engineering | 0 | 0.0% |
| Multidisciplinary Studies | 0 | 0.0% |
| Science & Technology | 41 | 100.0% |
| Business | 0 | 0.0% |
| Education | 0 | 0.0% |
| Literature & Languages | 0 | 0.0% |
| Liberal Arts & History | 0 | 0.0% |
| Visual & Performing Arts | 0 | 0.0% |
| Communications | 0 | 0.0% |
| Arts & Humanities | 0 | 0.0% |
| Total | 41 | 100.0% |
Transportation & Commute in Bethpage
Vehicle Availability by Sex in Bethpage
The most prevalent vehicle ownership categories in Bethpage are males with 3 vehicles (19, accounting for 100.0%) and females with 3 vehicles (0, making up 63.3%).
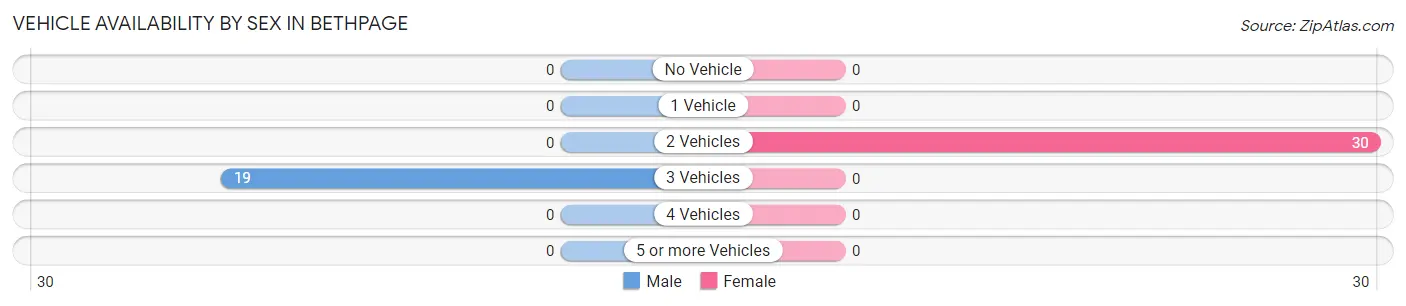
| Vehicles Available | Male | Female |
| No Vehicle | 0 (0.0%) | 0 (0.0%) |
| 1 Vehicle | 0 (0.0%) | 0 (0.0%) |
| 2 Vehicles | 0 (0.0%) | 30 (100.0%) |
| 3 Vehicles | 19 (100.0%) | 0 (0.0%) |
| 4 Vehicles | 0 (0.0%) | 0 (0.0%) |
| 5 or more Vehicles | 0 (0.0%) | 0 (0.0%) |
| Total | 19 (100.0%) | 30 (100.0%) |
Commute Time in Bethpage
The most frequently occuring commute durations in Bethpage are less than 5 minutes (30 commuters, 61.2%), 60 to 89 minutes (11 commuters, 22.5%), and 45 to 59 minutes (8 commuters, 16.3%).
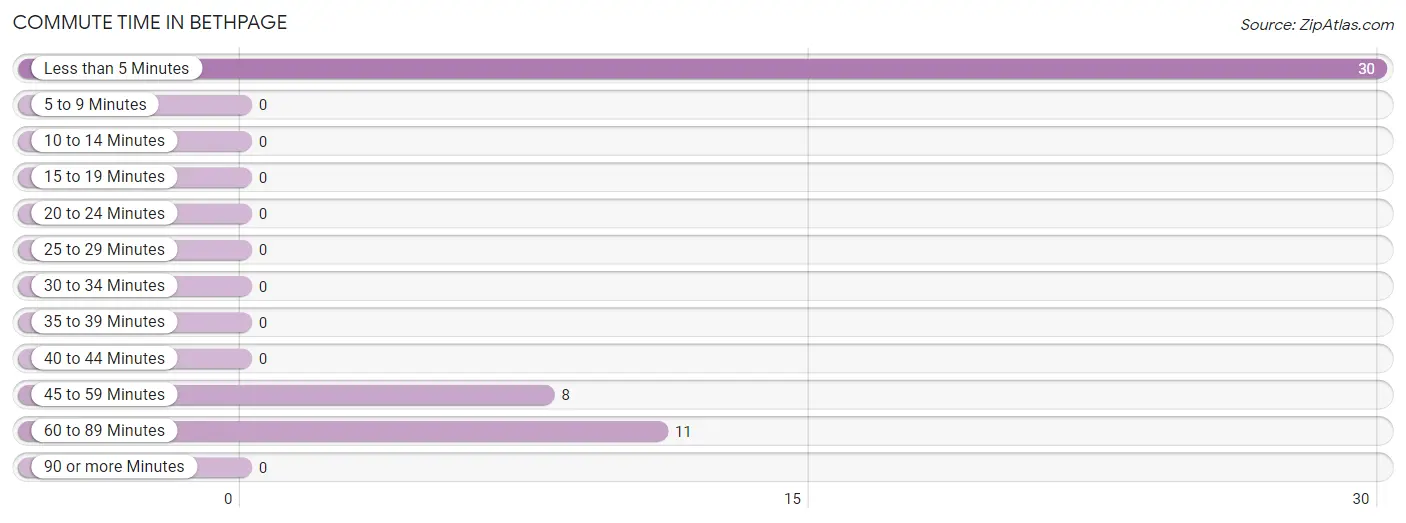
| Commute Time | # Commuters | % Commuters |
| Less than 5 Minutes | 30 | 61.2% |
| 5 to 9 Minutes | 0 | 0.0% |
| 10 to 14 Minutes | 0 | 0.0% |
| 15 to 19 Minutes | 0 | 0.0% |
| 20 to 24 Minutes | 0 | 0.0% |
| 25 to 29 Minutes | 0 | 0.0% |
| 30 to 34 Minutes | 0 | 0.0% |
| 35 to 39 Minutes | 0 | 0.0% |
| 40 to 44 Minutes | 0 | 0.0% |
| 45 to 59 Minutes | 8 | 16.3% |
| 60 to 89 Minutes | 11 | 22.5% |
| 90 or more Minutes | 0 | 0.0% |
Commute Time by Sex in Bethpage
The most common commute times in Bethpage are 60 to 89 minutes (11 commuters, 57.9%) for males and less than 5 minutes (30 commuters, 100.0%) for females.
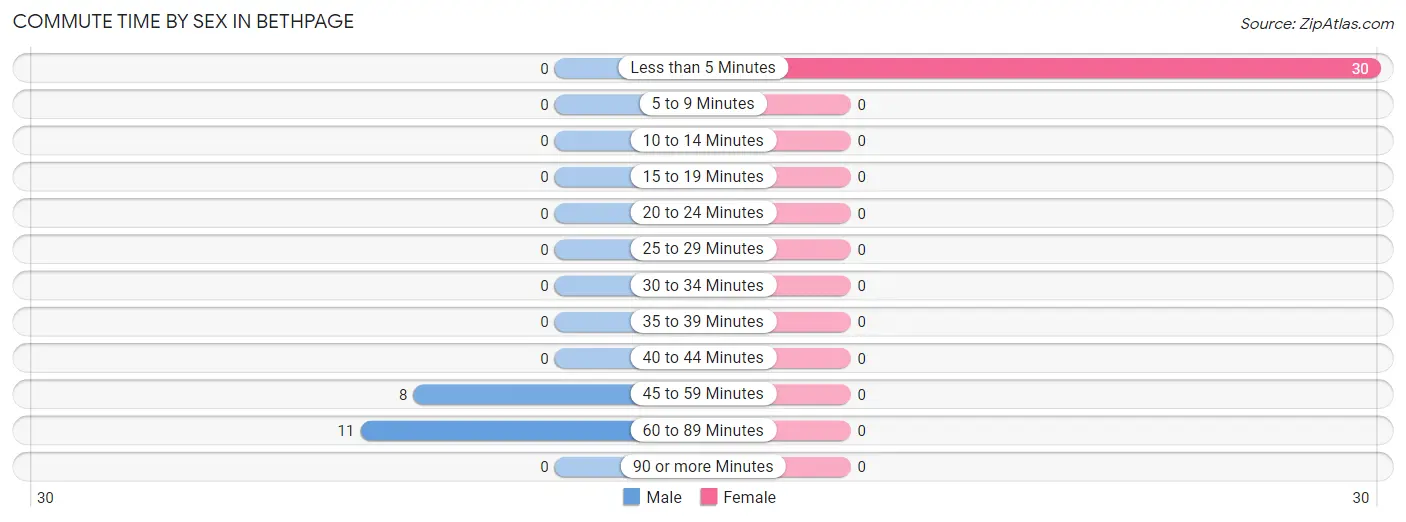
| Commute Time | Male | Female |
| Less than 5 Minutes | 0 (0.0%) | 30 (100.0%) |
| 5 to 9 Minutes | 0 (0.0%) | 0 (0.0%) |
| 10 to 14 Minutes | 0 (0.0%) | 0 (0.0%) |
| 15 to 19 Minutes | 0 (0.0%) | 0 (0.0%) |
| 20 to 24 Minutes | 0 (0.0%) | 0 (0.0%) |
| 25 to 29 Minutes | 0 (0.0%) | 0 (0.0%) |
| 30 to 34 Minutes | 0 (0.0%) | 0 (0.0%) |
| 35 to 39 Minutes | 0 (0.0%) | 0 (0.0%) |
| 40 to 44 Minutes | 0 (0.0%) | 0 (0.0%) |
| 45 to 59 Minutes | 8 (42.1%) | 0 (0.0%) |
| 60 to 89 Minutes | 11 (57.9%) | 0 (0.0%) |
| 90 or more Minutes | 0 (0.0%) | 0 (0.0%) |
Time of Departure to Work by Sex in Bethpage
The most frequent times of departure to work in Bethpage are 6:00 AM to 6:29 AM (11, 57.9%) for males and 8:30 AM to 8:59 AM (30, 100.0%) for females.
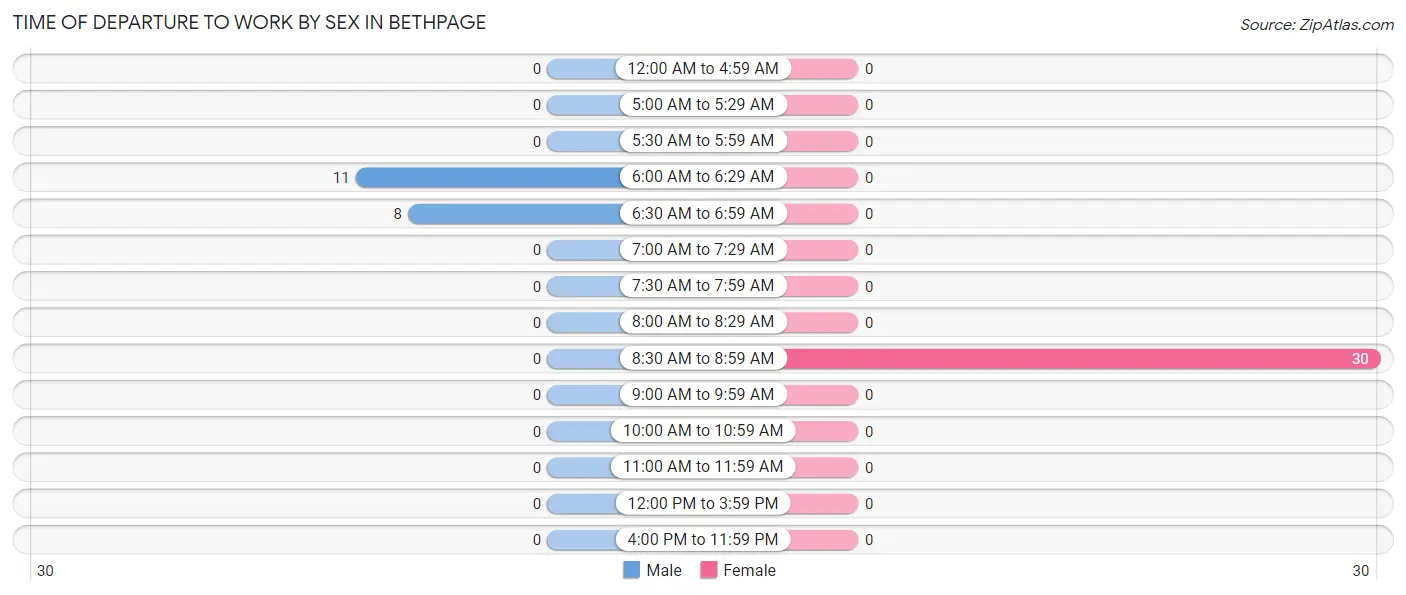
| Time of Departure | Male | Female |
| 12:00 AM to 4:59 AM | 0 (0.0%) | 0 (0.0%) |
| 5:00 AM to 5:29 AM | 0 (0.0%) | 0 (0.0%) |
| 5:30 AM to 5:59 AM | 0 (0.0%) | 0 (0.0%) |
| 6:00 AM to 6:29 AM | 11 (57.9%) | 0 (0.0%) |
| 6:30 AM to 6:59 AM | 8 (42.1%) | 0 (0.0%) |
| 7:00 AM to 7:29 AM | 0 (0.0%) | 0 (0.0%) |
| 7:30 AM to 7:59 AM | 0 (0.0%) | 0 (0.0%) |
| 8:00 AM to 8:29 AM | 0 (0.0%) | 0 (0.0%) |
| 8:30 AM to 8:59 AM | 0 (0.0%) | 30 (100.0%) |
| 9:00 AM to 9:59 AM | 0 (0.0%) | 0 (0.0%) |
| 10:00 AM to 10:59 AM | 0 (0.0%) | 0 (0.0%) |
| 11:00 AM to 11:59 AM | 0 (0.0%) | 0 (0.0%) |
| 12:00 PM to 3:59 PM | 0 (0.0%) | 0 (0.0%) |
| 4:00 PM to 11:59 PM | 0 (0.0%) | 0 (0.0%) |
| Total | 19 (100.0%) | 30 (100.0%) |
Housing Occupancy in Bethpage
Occupancy by Ownership in Bethpage
Of the total 84 dwellings in Bethpage, owner-occupied units account for 72 (85.7%), while renter-occupied units make up 12 (14.3%).
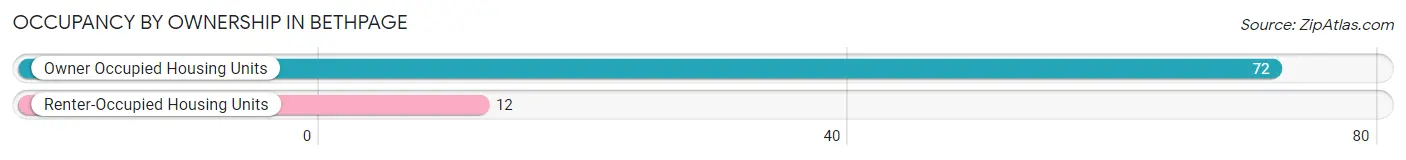
| Occupancy | # Housing Units | % Housing Units |
| Owner Occupied Housing Units | 72 | 85.7% |
| Renter-Occupied Housing Units | 12 | 14.3% |
| Total Occupied Housing Units | 84 | 100.0% |
Occupancy by Household Size in Bethpage
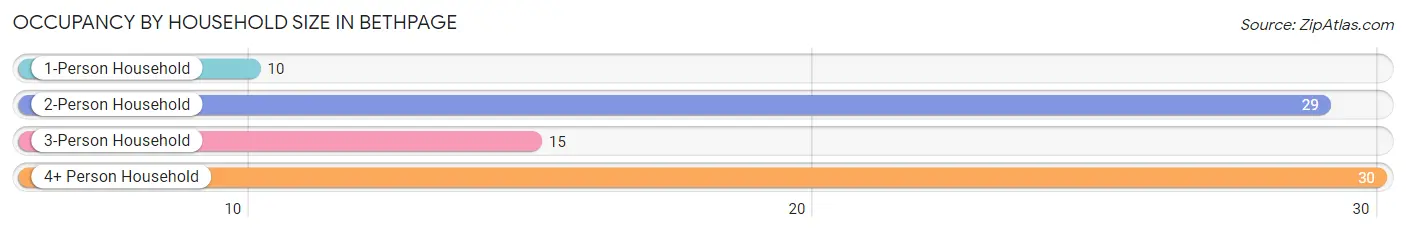
| Household Size | # Housing Units | % Housing Units |
| 1-Person Household | 10 | 11.9% |
| 2-Person Household | 29 | 34.5% |
| 3-Person Household | 15 | 17.9% |
| 4+ Person Household | 30 | 35.7% |
| Total Housing Units | 84 | 100.0% |
Occupancy by Ownership by Household Size in Bethpage
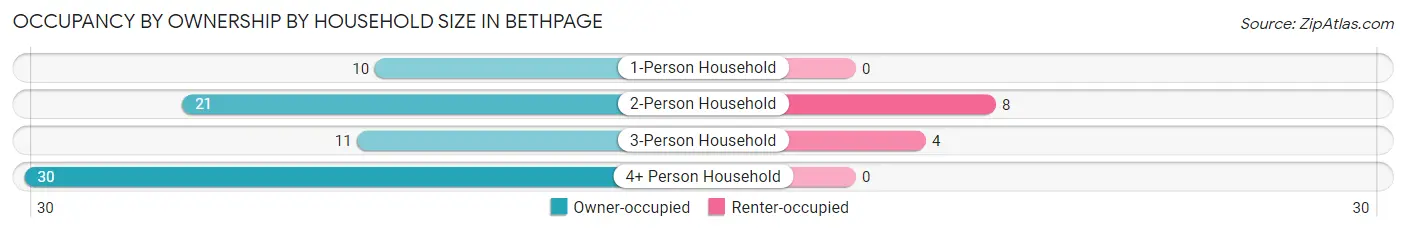
| Household Size | Owner-occupied | Renter-occupied |
| 1-Person Household | 10 (100.0%) | 0 (0.0%) |
| 2-Person Household | 21 (72.4%) | 8 (27.6%) |
| 3-Person Household | 11 (73.3%) | 4 (26.7%) |
| 4+ Person Household | 30 (100.0%) | 0 (0.0%) |
| Total Housing Units | 72 (85.7%) | 12 (14.3%) |
Occupancy by Educational Attainment in Bethpage
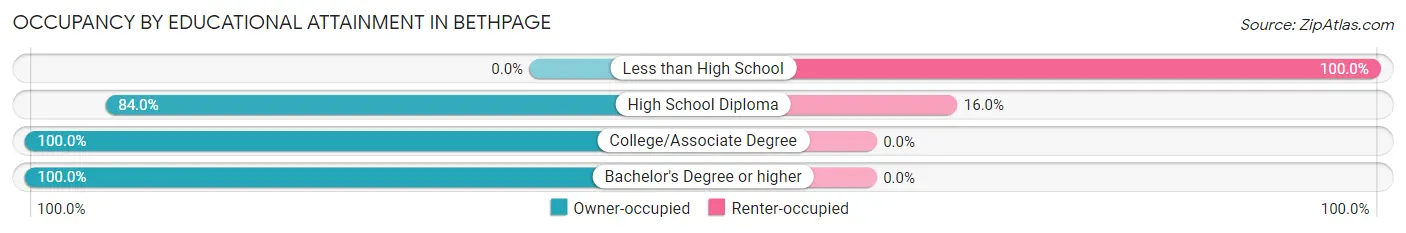
| Household Size | Owner-occupied | Renter-occupied |
| Less than High School | 0 (0.0%) | 8 (100.0%) |
| High School Diploma | 21 (84.0%) | 4 (16.0%) |
| College/Associate Degree | 10 (100.0%) | 0 (0.0%) |
| Bachelor's Degree or higher | 41 (100.0%) | 0 (0.0%) |
Occupancy by Age of Householder in Bethpage
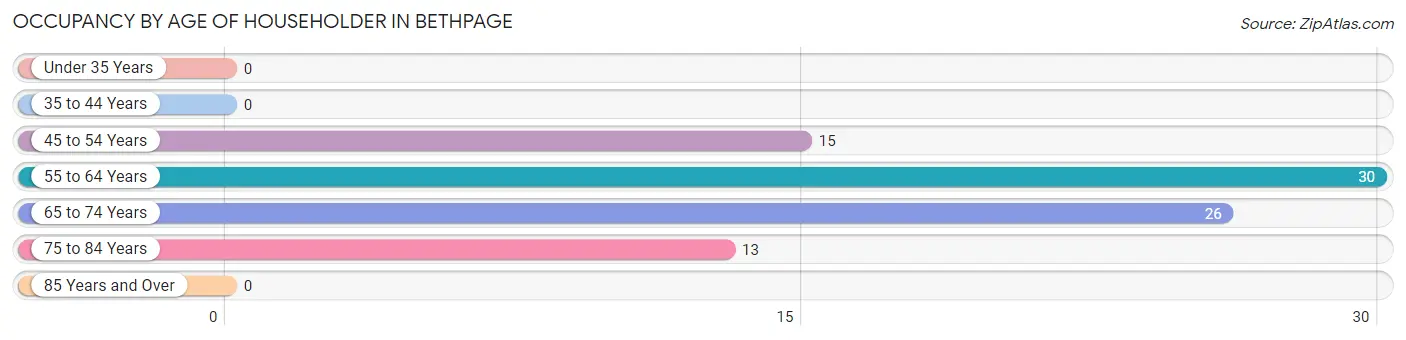
| Age Bracket | # Households | % Households |
| Under 35 Years | 0 | 0.0% |
| 35 to 44 Years | 0 | 0.0% |
| 45 to 54 Years | 15 | 17.9% |
| 55 to 64 Years | 30 | 35.7% |
| 65 to 74 Years | 26 | 30.9% |
| 75 to 84 Years | 13 | 15.5% |
| 85 Years and Over | 0 | 0.0% |
| Total | 84 | 100.0% |
Housing Finances in Bethpage
Median Income by Occupancy in Bethpage
| Occupancy Type | # Households | Median Income |
| Owner-Occupied | 72 (85.7%) | $0 |
| Renter-Occupied | 12 (14.3%) | $0 |
| Average | 84 (100.0%) | $0 |
Occupancy by Householder Income Bracket in Bethpage
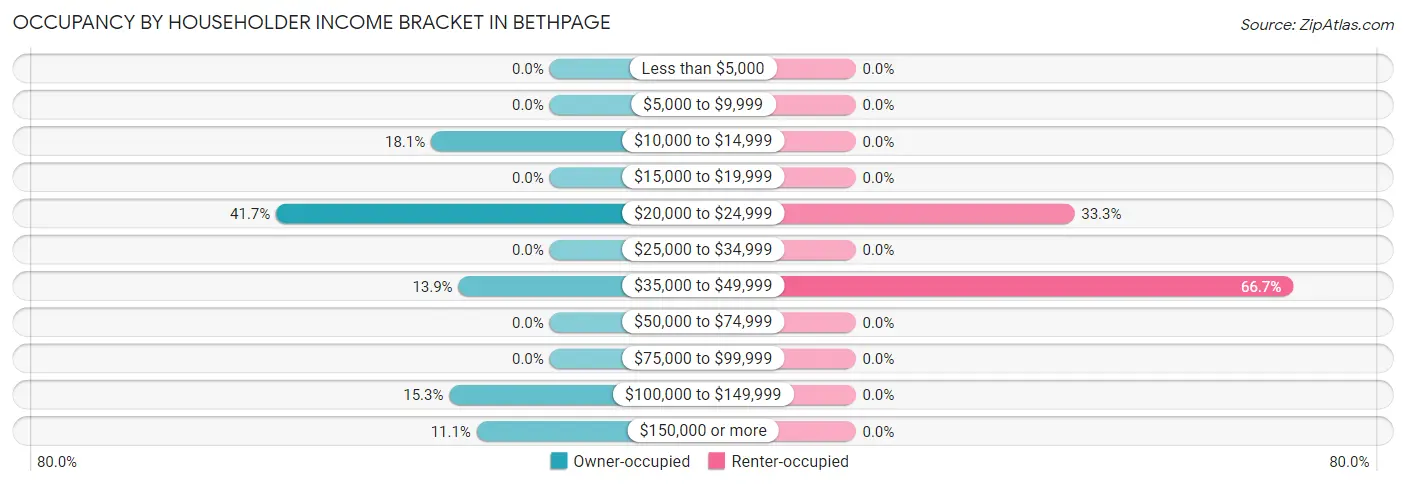
| Income Bracket | Owner-occupied | Renter-occupied |
| Less than $5,000 | 0 (0.0%) | 0 (0.0%) |
| $5,000 to $9,999 | 0 (0.0%) | 0 (0.0%) |
| $10,000 to $14,999 | 13 (18.1%) | 0 (0.0%) |
| $15,000 to $19,999 | 0 (0.0%) | 0 (0.0%) |
| $20,000 to $24,999 | 30 (41.7%) | 4 (33.3%) |
| $25,000 to $34,999 | 0 (0.0%) | 0 (0.0%) |
| $35,000 to $49,999 | 10 (13.9%) | 8 (66.7%) |
| $50,000 to $74,999 | 0 (0.0%) | 0 (0.0%) |
| $75,000 to $99,999 | 0 (0.0%) | 0 (0.0%) |
| $100,000 to $149,999 | 11 (15.3%) | 0 (0.0%) |
| $150,000 or more | 8 (11.1%) | 0 (0.0%) |
| Total | 72 (100.0%) | 12 (100.0%) |
Monthly Housing Cost Tiers in Bethpage
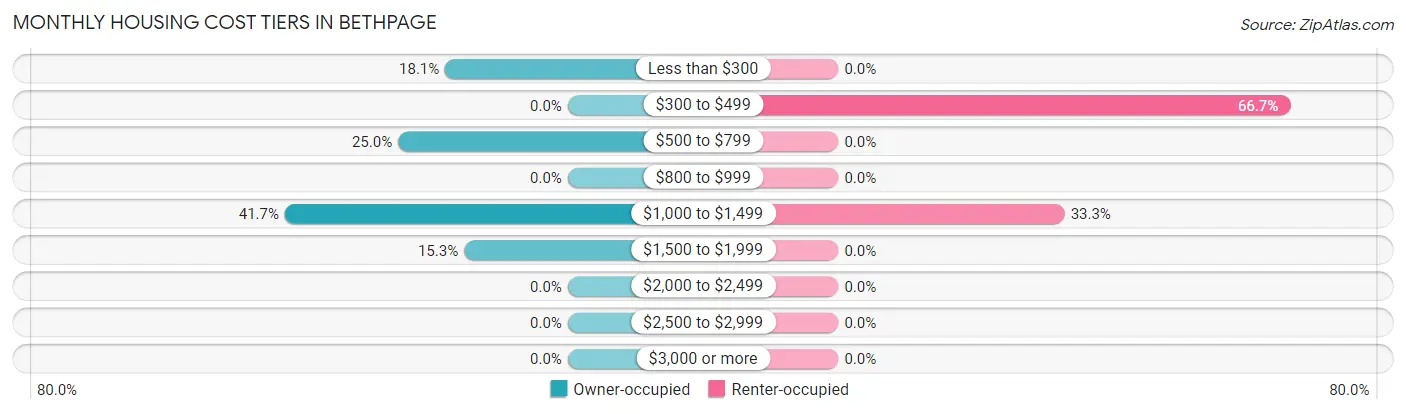
| Monthly Cost | Owner-occupied | Renter-occupied |
| Less than $300 | 13 (18.1%) | 0 (0.0%) |
| $300 to $499 | 0 (0.0%) | 8 (66.7%) |
| $500 to $799 | 18 (25.0%) | 0 (0.0%) |
| $800 to $999 | 0 (0.0%) | 0 (0.0%) |
| $1,000 to $1,499 | 30 (41.7%) | 4 (33.3%) |
| $1,500 to $1,999 | 11 (15.3%) | 0 (0.0%) |
| $2,000 to $2,499 | 0 (0.0%) | 0 (0.0%) |
| $2,500 to $2,999 | 0 (0.0%) | 0 (0.0%) |
| $3,000 or more | 0 (0.0%) | 0 (0.0%) |
| Total | 72 (100.0%) | 12 (100.0%) |
Physical Housing Characteristics in Bethpage
Housing Structures in Bethpage
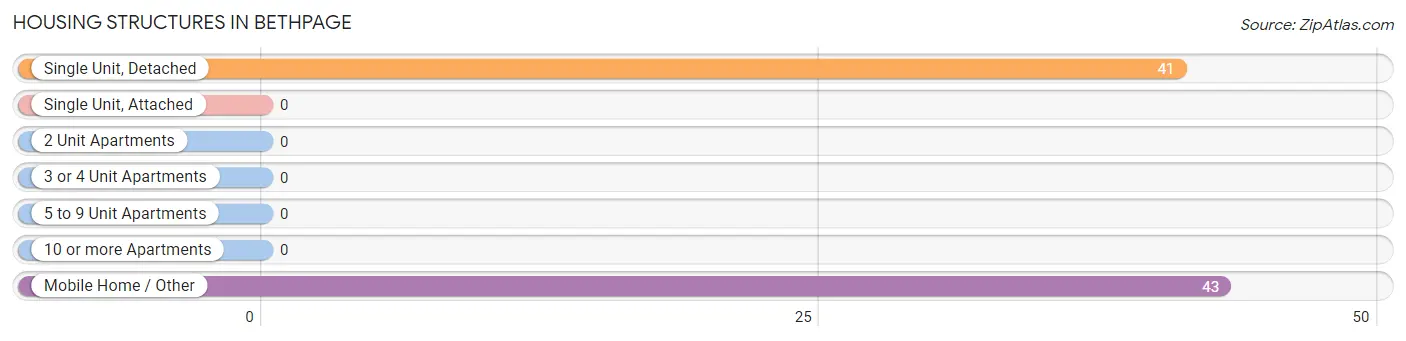
| Structure Type | # Housing Units | % Housing Units |
| Single Unit, Detached | 41 | 48.8% |
| Single Unit, Attached | 0 | 0.0% |
| 2 Unit Apartments | 0 | 0.0% |
| 3 or 4 Unit Apartments | 0 | 0.0% |
| 5 to 9 Unit Apartments | 0 | 0.0% |
| 10 or more Apartments | 0 | 0.0% |
| Mobile Home / Other | 43 | 51.2% |
| Total | 84 | 100.0% |
Housing Structures by Occupancy in Bethpage
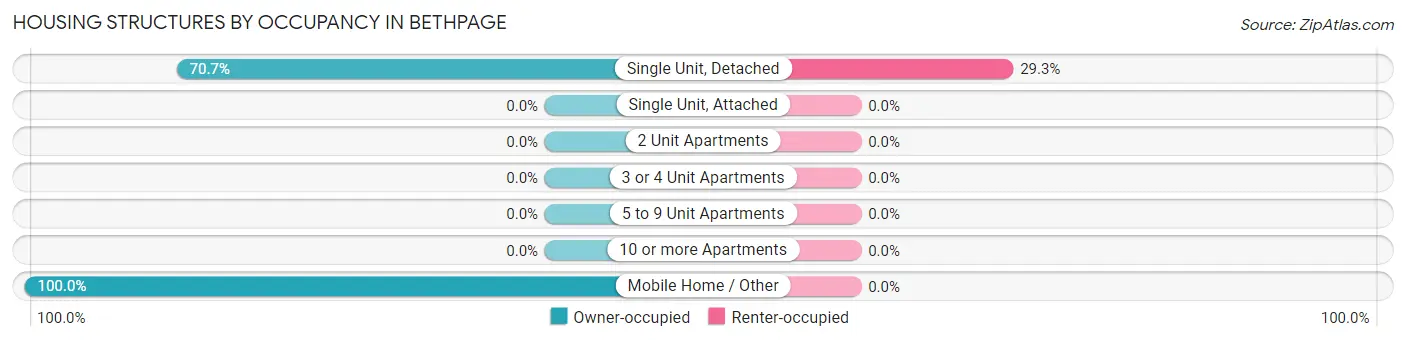
| Structure Type | Owner-occupied | Renter-occupied |
| Single Unit, Detached | 29 (70.7%) | 12 (29.3%) |
| Single Unit, Attached | 0 (0.0%) | 0 (0.0%) |
| 2 Unit Apartments | 0 (0.0%) | 0 (0.0%) |
| 3 or 4 Unit Apartments | 0 (0.0%) | 0 (0.0%) |
| 5 to 9 Unit Apartments | 0 (0.0%) | 0 (0.0%) |
| 10 or more Apartments | 0 (0.0%) | 0 (0.0%) |
| Mobile Home / Other | 43 (100.0%) | 0 (0.0%) |
| Total | 72 (85.7%) | 12 (14.3%) |
Housing Structures by Number of Rooms in Bethpage
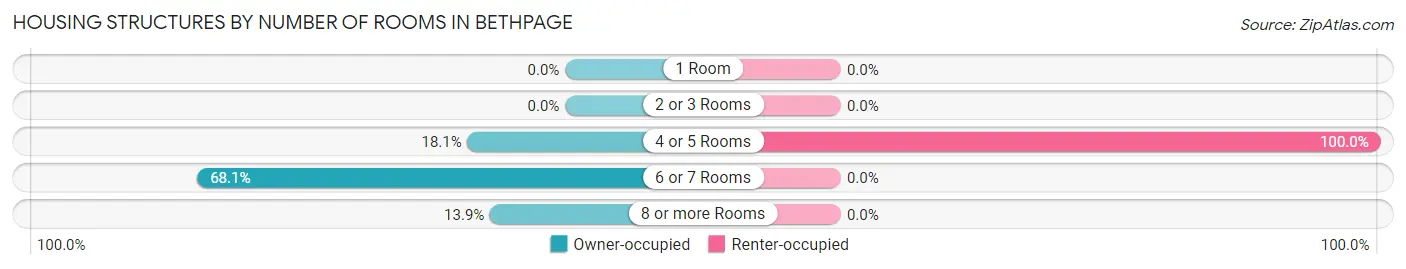
| Number of Rooms | Owner-occupied | Renter-occupied |
| 1 Room | 0 (0.0%) | 0 (0.0%) |
| 2 or 3 Rooms | 0 (0.0%) | 0 (0.0%) |
| 4 or 5 Rooms | 13 (18.1%) | 12 (100.0%) |
| 6 or 7 Rooms | 49 (68.1%) | 0 (0.0%) |
| 8 or more Rooms | 10 (13.9%) | 0 (0.0%) |
| Total | 72 (100.0%) | 12 (100.0%) |
Housing Structure by Heating Type in Bethpage
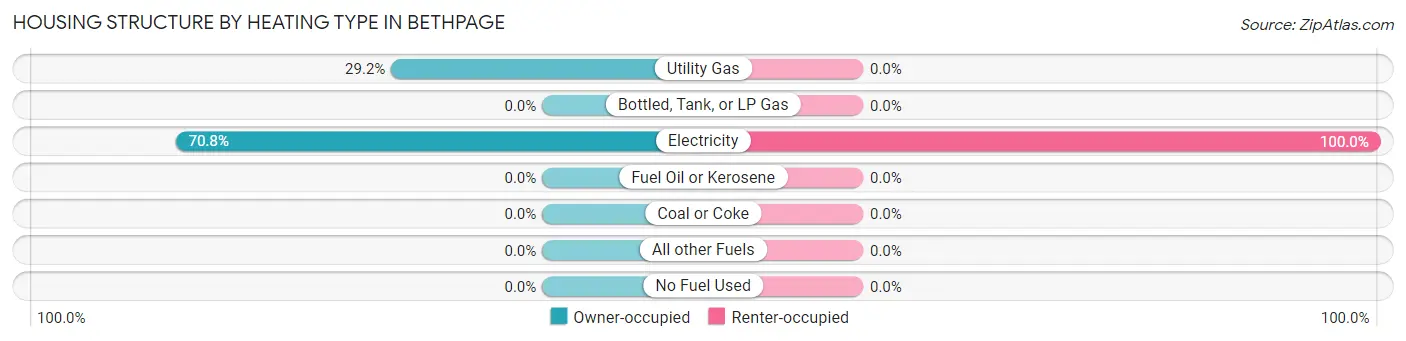
| Heating Type | Owner-occupied | Renter-occupied |
| Utility Gas | 21 (29.2%) | 0 (0.0%) |
| Bottled, Tank, or LP Gas | 0 (0.0%) | 0 (0.0%) |
| Electricity | 51 (70.8%) | 12 (100.0%) |
| Fuel Oil or Kerosene | 0 (0.0%) | 0 (0.0%) |
| Coal or Coke | 0 (0.0%) | 0 (0.0%) |
| All other Fuels | 0 (0.0%) | 0 (0.0%) |
| No Fuel Used | 0 (0.0%) | 0 (0.0%) |
| Total | 72 (100.0%) | 12 (100.0%) |
Household Vehicle Usage in Bethpage
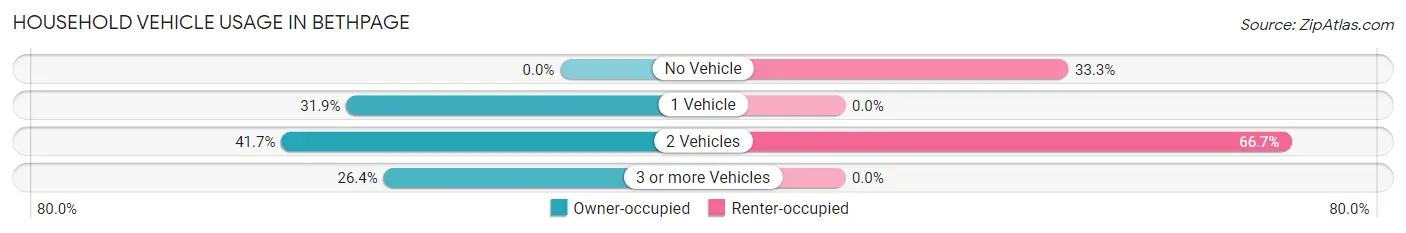
| Vehicles per Household | Owner-occupied | Renter-occupied |
| No Vehicle | 0 (0.0%) | 4 (33.3%) |
| 1 Vehicle | 23 (31.9%) | 0 (0.0%) |
| 2 Vehicles | 30 (41.7%) | 8 (66.7%) |
| 3 or more Vehicles | 19 (26.4%) | 0 (0.0%) |
| Total | 72 (100.0%) | 12 (100.0%) |
Real Estate & Mortgages in Bethpage
Real Estate and Mortgage Overview in Bethpage
| Characteristic | Without Mortgage | With Mortgage |
| Housing Units | 31 | 41 |
| Median Property Value | - | - |
| Median Household Income | - | - |
| Monthly Housing Costs | $631 | $0 |
| Real Estate Taxes | - | - |
Property Value by Mortgage Status in Bethpage
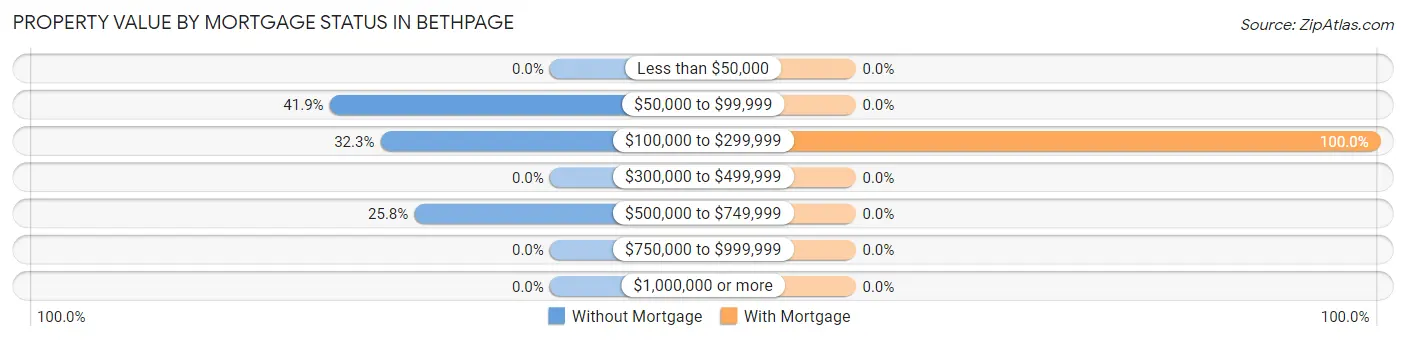
| Property Value | Without Mortgage | With Mortgage |
| Less than $50,000 | 0 (0.0%) | 0 (0.0%) |
| $50,000 to $99,999 | 13 (41.9%) | 0 (0.0%) |
| $100,000 to $299,999 | 10 (32.3%) | 41 (100.0%) |
| $300,000 to $499,999 | 0 (0.0%) | 0 (0.0%) |
| $500,000 to $749,999 | 8 (25.8%) | 0 (0.0%) |
| $750,000 to $999,999 | 0 (0.0%) | 0 (0.0%) |
| $1,000,000 or more | 0 (0.0%) | 0 (0.0%) |
| Total | 31 (100.0%) | 41 (100.0%) |
Household Income by Mortgage Status in Bethpage
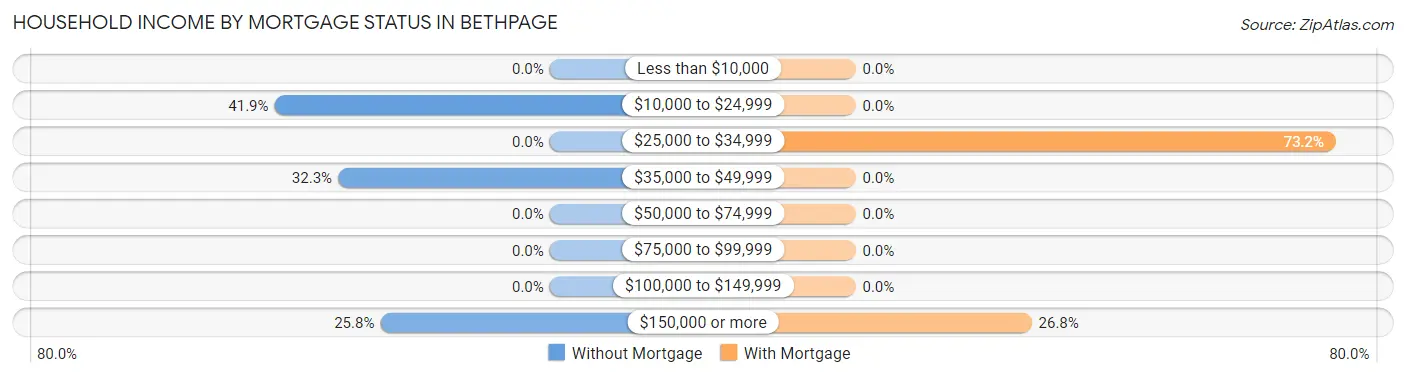
| Household Income | Without Mortgage | With Mortgage |
| Less than $10,000 | 0 (0.0%) | 0 (0.0%) |
| $10,000 to $24,999 | 13 (41.9%) | 0 (0.0%) |
| $25,000 to $34,999 | 0 (0.0%) | 30 (73.2%) |
| $35,000 to $49,999 | 10 (32.3%) | 0 (0.0%) |
| $50,000 to $74,999 | 0 (0.0%) | 0 (0.0%) |
| $75,000 to $99,999 | 0 (0.0%) | 0 (0.0%) |
| $100,000 to $149,999 | 0 (0.0%) | 0 (0.0%) |
| $150,000 or more | 8 (25.8%) | 11 (26.8%) |
| Total | 31 (100.0%) | 41 (100.0%) |
Property Value to Household Income Ratio in Bethpage
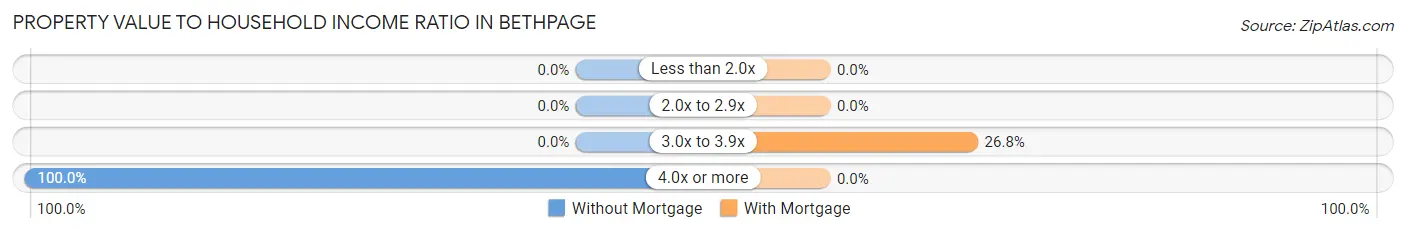
| Value-to-Income Ratio | Without Mortgage | With Mortgage |
| Less than 2.0x | 0 (0.0%) | 0 (0.0%) |
| 2.0x to 2.9x | 0 (0.0%) | 0 (0.0%) |
| 3.0x to 3.9x | 0 (0.0%) | 11 (26.8%) |
| 4.0x or more | 31 (100.0%) | 0 (0.0%) |
| Total | 31 (100.0%) | 41 (100.0%) |
Real Estate Taxes by Mortgage Status in Bethpage
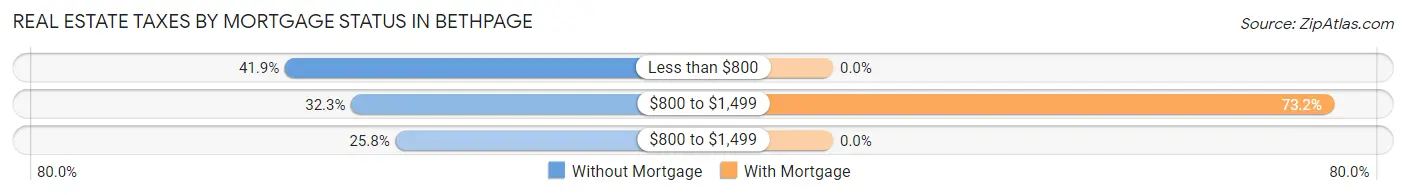
| Property Taxes | Without Mortgage | With Mortgage |
| Less than $800 | 13 (41.9%) | 0 (0.0%) |
| $800 to $1,499 | 10 (32.3%) | 30 (73.2%) |
| $800 to $1,499 | 8 (25.8%) | 0 (0.0%) |
| Total | 31 (100.0%) | 41 (100.0%) |
Health & Disability in Bethpage
Health Insurance Coverage by Age in Bethpage
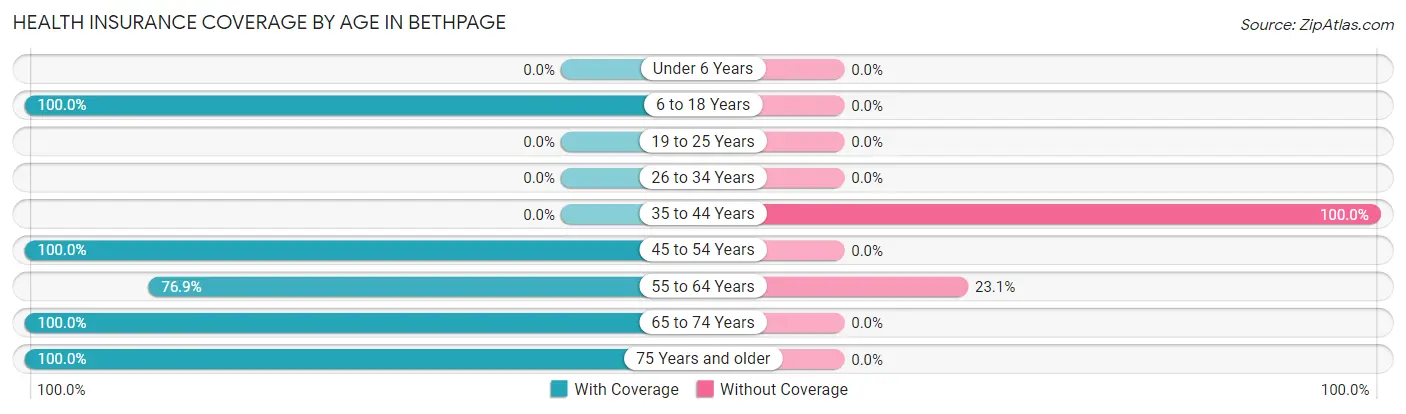
| Age Bracket | With Coverage | Without Coverage |
| Under 6 Years | 0 (0.0%) | 0 (0.0%) |
| 6 to 18 Years | 127 (100.0%) | 0 (0.0%) |
| 19 to 25 Years | 0 (0.0%) | 0 (0.0%) |
| 26 to 34 Years | 0 (0.0%) | 0 (0.0%) |
| 35 to 44 Years | 0 (0.0%) | 36 (100.0%) |
| 45 to 54 Years | 26 (100.0%) | 0 (0.0%) |
| 55 to 64 Years | 30 (76.9%) | 9 (23.1%) |
| 65 to 74 Years | 35 (100.0%) | 0 (0.0%) |
| 75 Years and older | 13 (100.0%) | 0 (0.0%) |
| Total | 231 (83.7%) | 45 (16.3%) |
Health Insurance Coverage by Citizenship Status in Bethpage
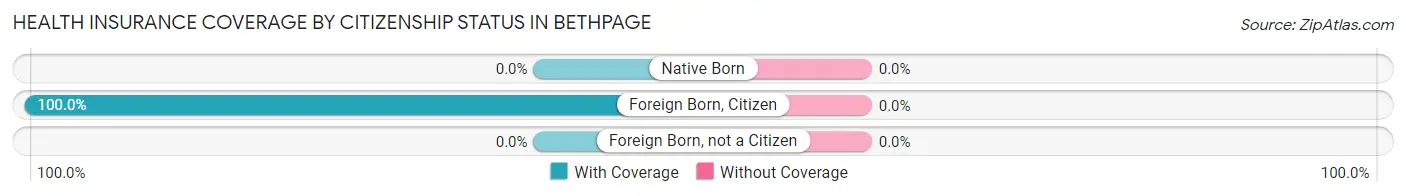
| Citizenship Status | With Coverage | Without Coverage |
| Native Born | 0 (0.0%) | 0 (0.0%) |
| Foreign Born, Citizen | 127 (100.0%) | 0 (0.0%) |
| Foreign Born, not a Citizen | 0 (0.0%) | 0 (0.0%) |
Health Insurance Coverage by Household Income in Bethpage
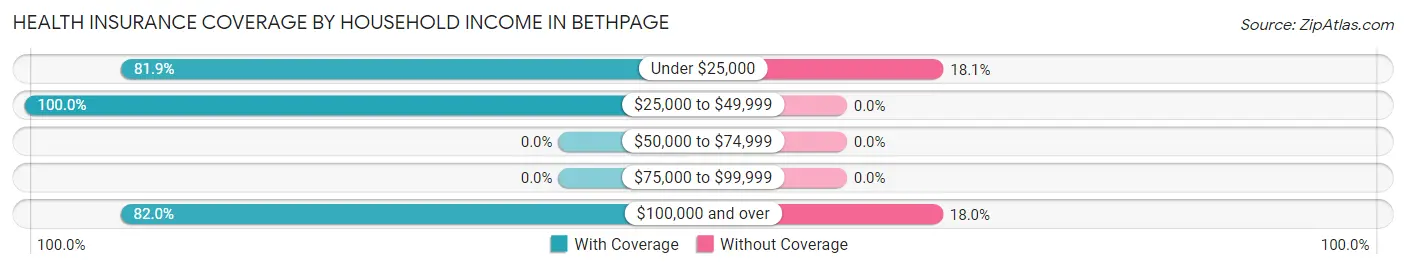
| Household Income | With Coverage | Without Coverage |
| Under $25,000 | 163 (81.9%) | 36 (18.1%) |
| $25,000 to $49,999 | 27 (100.0%) | 0 (0.0%) |
| $50,000 to $74,999 | 0 (0.0%) | 0 (0.0%) |
| $75,000 to $99,999 | 0 (0.0%) | 0 (0.0%) |
| $100,000 and over | 41 (82.0%) | 9 (18.0%) |
Public vs Private Health Insurance Coverage by Age in Bethpage
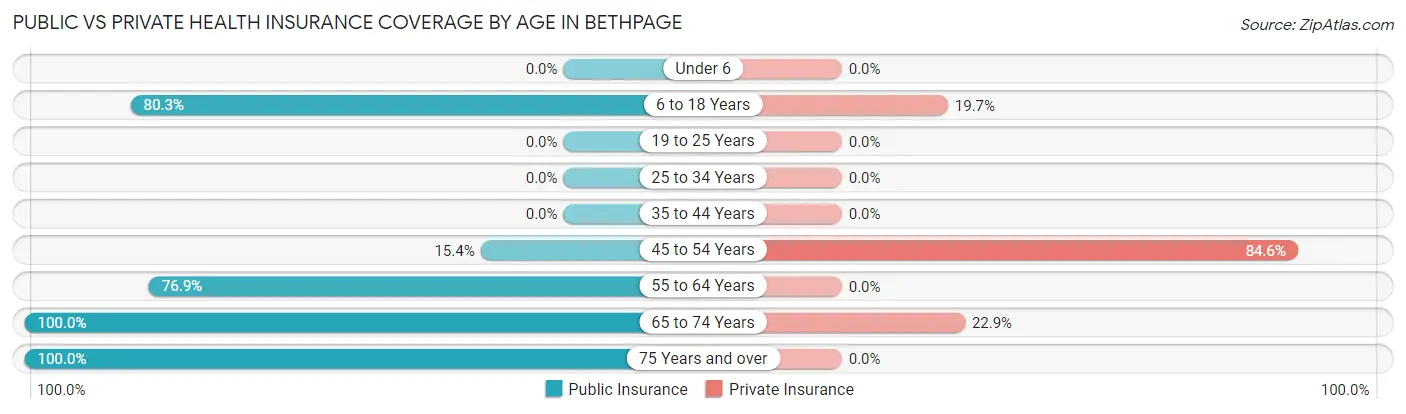
| Age Bracket | Public Insurance | Private Insurance |
| Under 6 | 0 (0.0%) | 0 (0.0%) |
| 6 to 18 Years | 102 (80.3%) | 25 (19.7%) |
| 19 to 25 Years | 0 (0.0%) | 0 (0.0%) |
| 25 to 34 Years | 0 (0.0%) | 0 (0.0%) |
| 35 to 44 Years | 0 (0.0%) | 0 (0.0%) |
| 45 to 54 Years | 4 (15.4%) | 22 (84.6%) |
| 55 to 64 Years | 30 (76.9%) | 0 (0.0%) |
| 65 to 74 Years | 35 (100.0%) | 8 (22.9%) |
| 75 Years and over | 13 (100.0%) | 0 (0.0%) |
| Total | 184 (66.7%) | 55 (19.9%) |
Disability Status by Sex by Age in Bethpage
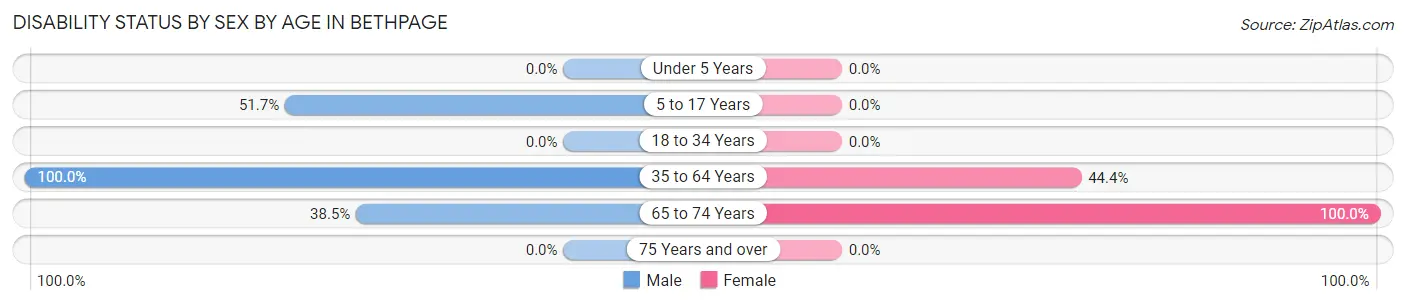
| Age Bracket | Male | Female |
| Under 5 Years | 0 (0.0%) | 0 (0.0%) |
| 5 to 17 Years | 31 (51.7%) | 0 (0.0%) |
| 18 to 34 Years | 0 (0.0%) | 0 (0.0%) |
| 35 to 64 Years | 11 (100.0%) | 40 (44.4%) |
| 65 to 74 Years | 10 (38.5%) | 9 (100.0%) |
| 75 Years and over | 0 (0.0%) | 0 (0.0%) |
Disability Class by Sex by Age in Bethpage
Disability Class: Hearing Difficulty
| Age Bracket | Male | Female |
| Under 5 Years | 0 (0.0%) | 0 (0.0%) |
| 5 to 17 Years | 0 (0.0%) | 0 (0.0%) |
| 18 to 34 Years | 0 (0.0%) | 0 (0.0%) |
| 35 to 64 Years | 0 (0.0%) | 0 (0.0%) |
| 65 to 74 Years | 0 (0.0%) | 0 (0.0%) |
| 75 Years and over | 0 (0.0%) | 0 (0.0%) |
Disability Class: Vision Difficulty
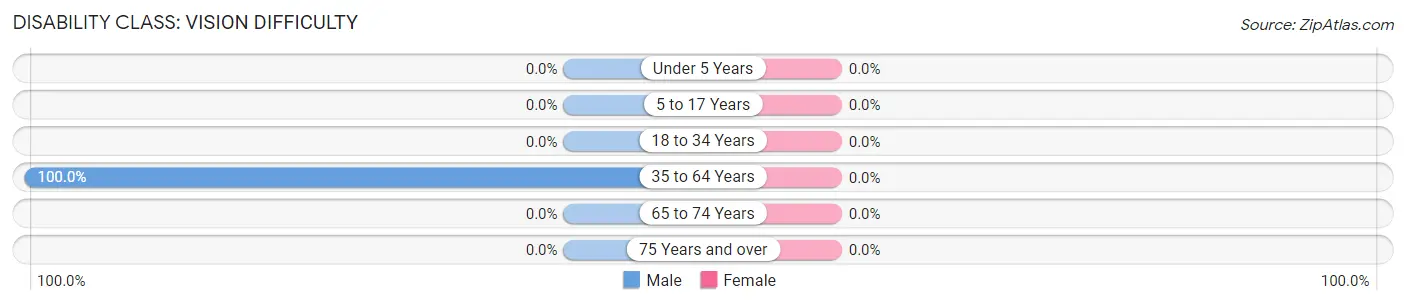
| Age Bracket | Male | Female |
| Under 5 Years | 0 (0.0%) | 0 (0.0%) |
| 5 to 17 Years | 0 (0.0%) | 0 (0.0%) |
| 18 to 34 Years | 0 (0.0%) | 0 (0.0%) |
| 35 to 64 Years | 11 (100.0%) | 0 (0.0%) |
| 65 to 74 Years | 0 (0.0%) | 0 (0.0%) |
| 75 Years and over | 0 (0.0%) | 0 (0.0%) |
Disability Class: Cognitive Difficulty
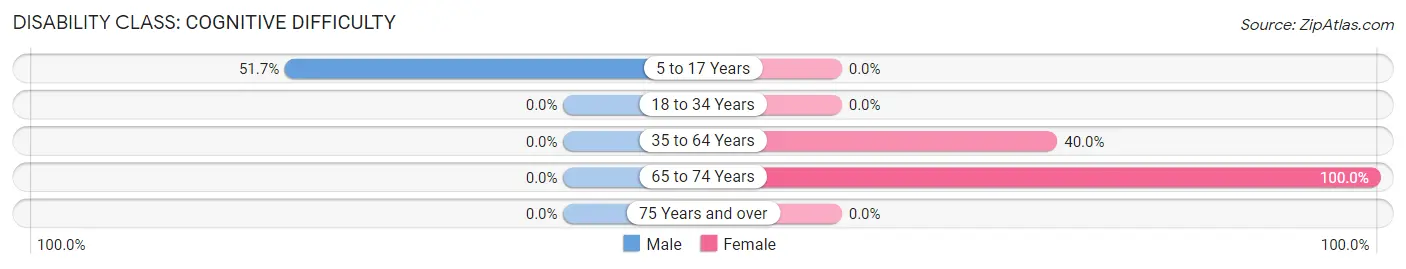
| Age Bracket | Male | Female |
| 5 to 17 Years | 31 (51.7%) | 0 (0.0%) |
| 18 to 34 Years | 0 (0.0%) | 0 (0.0%) |
| 35 to 64 Years | 0 (0.0%) | 36 (40.0%) |
| 65 to 74 Years | 0 (0.0%) | 9 (100.0%) |
| 75 Years and over | 0 (0.0%) | 0 (0.0%) |
Disability Class: Ambulatory Difficulty
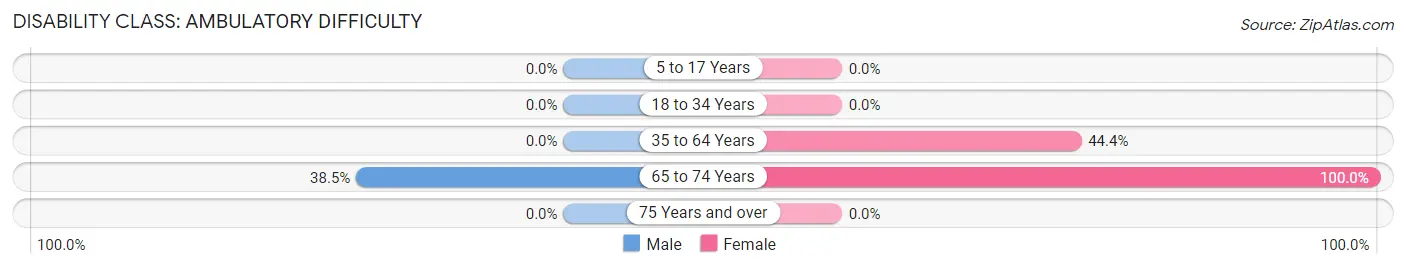
| Age Bracket | Male | Female |
| 5 to 17 Years | 0 (0.0%) | 0 (0.0%) |
| 18 to 34 Years | 0 (0.0%) | 0 (0.0%) |
| 35 to 64 Years | 0 (0.0%) | 40 (44.4%) |
| 65 to 74 Years | 10 (38.5%) | 9 (100.0%) |
| 75 Years and over | 0 (0.0%) | 0 (0.0%) |
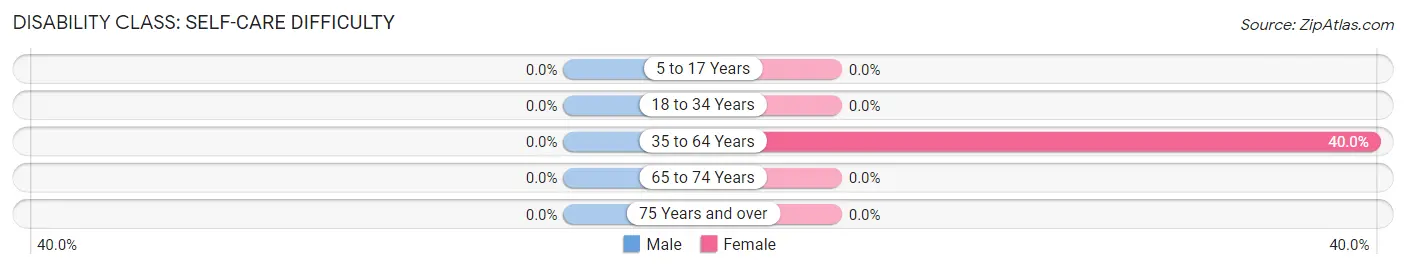
Disability Class: Self-Care Difficulty
| Age Bracket | Male | Female |
| 5 to 17 Years | 0 (0.0%) | 0 (0.0%) |
| 18 to 34 Years | 0 (0.0%) | 0 (0.0%) |
| 35 to 64 Years | 0 (0.0%) | 36 (40.0%) |
| 65 to 74 Years | 0 (0.0%) | 0 (0.0%) |
| 75 Years and over | 0 (0.0%) | 0 (0.0%) |
Technology Access in Bethpage
Computing Device Access in Bethpage
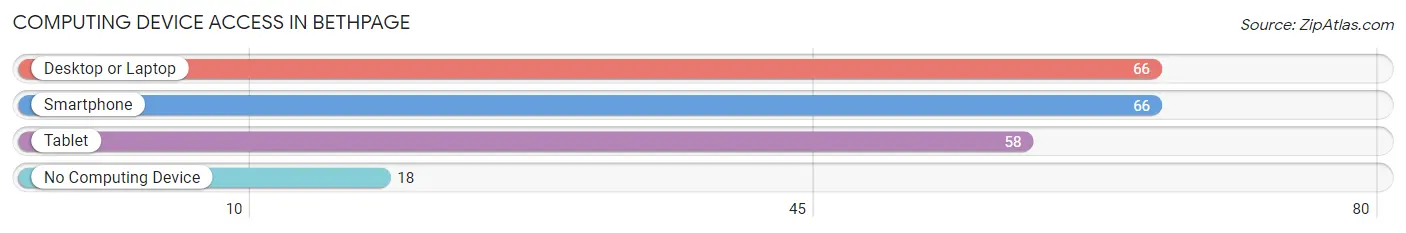
| Device Type | # Households | % Households |
| Desktop or Laptop | 66 | 78.6% |
| Smartphone | 66 | 78.6% |
| Tablet | 58 | 69.1% |
| No Computing Device | 18 | 21.4% |
| Total | 84 | 100.0% |
Internet Access in Bethpage
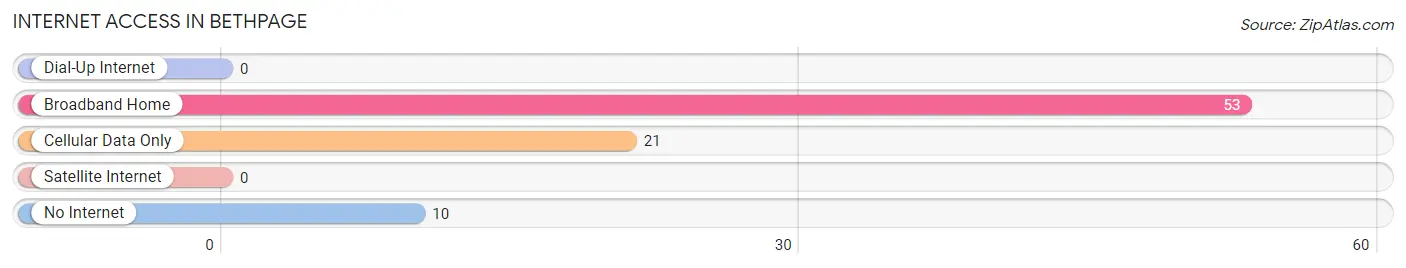
| Internet Type | # Households | % Households |
| Dial-Up Internet | 0 | 0.0% |
| Broadband Home | 53 | 63.1% |
| Cellular Data Only | 21 | 25.0% |
| Satellite Internet | 0 | 0.0% |
| No Internet | 10 | 11.9% |
| Total | 84 | 100.0% |
Bethpage Summary
Bethpage is a small town located in Sumner County, Tennessee. It is situated in the northern part of the state, about 25 miles northeast of Nashville. The town was founded in 1820 and has a population of approximately 1,000 people.
History
Bethpage was founded in 1820 by a group of settlers from North Carolina. The town was named after the biblical town of Bethphage, which is mentioned in the New Testament. The town was originally a farming community, and the main crops grown were corn, wheat, and cotton. The town was also known for its iron ore deposits, which were mined and used to make tools and weapons.
In the late 19th century, the town began to grow and develop. The railroad was built through the town in 1887, and this helped to spur economic growth. The town also became a popular tourist destination, as it was located near several popular lakes and rivers.
Geography
Bethpage is located in Sumner County, Tennessee. It is situated in the northern part of the state, about 25 miles northeast of Nashville. The town is located in a rural area, and is surrounded by rolling hills and farmland. The town is located near several popular lakes and rivers, including the Cumberland River, the Stones River, and the Harpeth River.
Economy
The economy of Bethpage is largely based on agriculture. The town is home to several farms, which produce corn, wheat, and cotton. The town is also home to several small businesses, including restaurants, stores, and other services.
Demographics
As of the 2010 census, the population of Bethpage was 1,000 people. The racial makeup of the town was 97.2% White, 0.7% African American, 0.3% Native American, 0.2% Asian, and 1.6% from other races. The median household income was $37,500, and the median age was 39.
Conclusion
Bethpage is a small town located in Sumner County, Tennessee. It was founded in 1820 and has a population of approximately 1,000 people. The town is largely agricultural, and the main crops grown are corn, wheat, and cotton. The town is also home to several small businesses, including restaurants, stores, and other services. The racial makeup of the town is 97.2% White, 0.7% African American, 0.3% Native American, 0.2% Asian, and 1.6% from other races. The median household income was $37,500, and the median age was 39.
Common Questions
What is Per Capita Income in Bethpage?
Per Capita income in Bethpage is $15,264.
What is Family Income Deficit in Bethpage?
Family Income Deficit in Bethpage is $8,766.
Families that are below poverty line in Bethpage earn $8,766 less on average than the poverty threshold level.
What is Inequality or Gini Index in Bethpage?
Inequality or Gini Index in Bethpage is 0.45.
What is the Total Population of Bethpage?
Total Population of Bethpage is 276.
What is the Total Male Population of Bethpage?
Total Male Population of Bethpage is 97.
What is the Total Female Population of Bethpage?
Total Female Population of Bethpage is 179.
What is the Ratio of Males per 100 Females in Bethpage?
There are 54.19 Males per 100 Females in Bethpage.
What is the Ratio of Females per 100 Males in Bethpage?
There are 184.54 Females per 100 Males in Bethpage.
What is the Median Population Age in Bethpage?
Median Population Age in Bethpage is 40.3 Years.
What is the Average Family Size in Bethpage
Average Family Size in Bethpage is 3.6 People.
What is the Average Household Size in Bethpage
Average Household Size in Bethpage is 3.3 People.
How Large is the Labor Force in Bethpage?
There are 49 People in the Labor Forcein in Bethpage.
What is the Percentage of People in the Labor Force in Bethpage?
32.0% of People are in the Labor Force in Bethpage.