Steamboat, AZ Map & Demographics
Steamboat Map
Steamboat Overview
$17,588
PER CAPITA INCOME
$41,250
AVG FAMILY INCOME
$28,125
AVG HOUSEHOLD INCOME
9.8%
WAGE / INCOME GAP [ % ]
90.2¢/ $1
WAGE / INCOME GAP [ $ ]
0.52
INEQUALITY / GINI INDEX
417
TOTAL POPULATION
254
MALE POPULATION
163
FEMALE POPULATION
155.83
MALES / 100 FEMALES
64.17
FEMALES / 100 MALES
36.9
MEDIAN AGE
4.1
AVG FAMILY SIZE
3.4
AVG HOUSEHOLD SIZE
127
LABOR FORCE [ PEOPLE ]
36.4%
PERCENT IN LABOR FORCE
23.6%
UNEMPLOYMENT RATE
Income in Steamboat
Income Overview in Steamboat
Per Capita Income in Steamboat is $17,588, while median incomes of families and households are $41,250 and $28,125 respectively.
| Characteristic | Number | Measure |
| Per Capita Income | 417 | $17,588 |
| Median Family Income | 90 | $41,250 |
| Mean Family Income | 90 | $57,539 |
| Median Household Income | 122 | $28,125 |
| Mean Household Income | 122 | $47,318 |
| Income Deficit | 90 | $0 |
| Wage / Income Gap (%) | 417 | 9.76% |
| Wage / Income Gap ($) | 417 | 90.24¢ per $1 |
| Gini / Inequality Index | 417 | 0.52 |
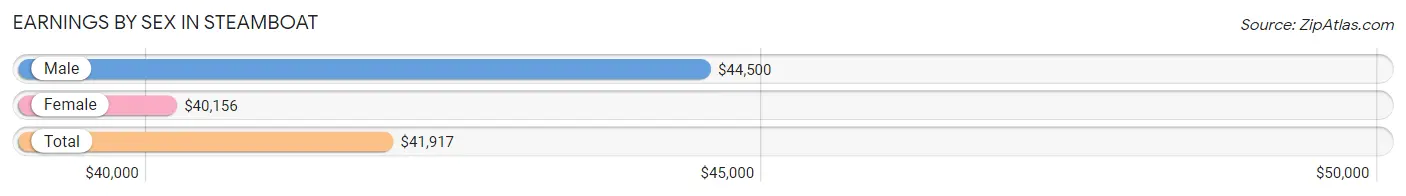
Earnings by Sex in Steamboat
Average Earnings in Steamboat are $41,917, $44,500 for men and $40,156 for women, a difference of 9.8%.
| Sex | Number | Average Earnings |
| Male | 94 (81.7%) | $44,500 |
| Female | 21 (18.3%) | $40,156 |
| Total | 115 (100.0%) | $41,917 |
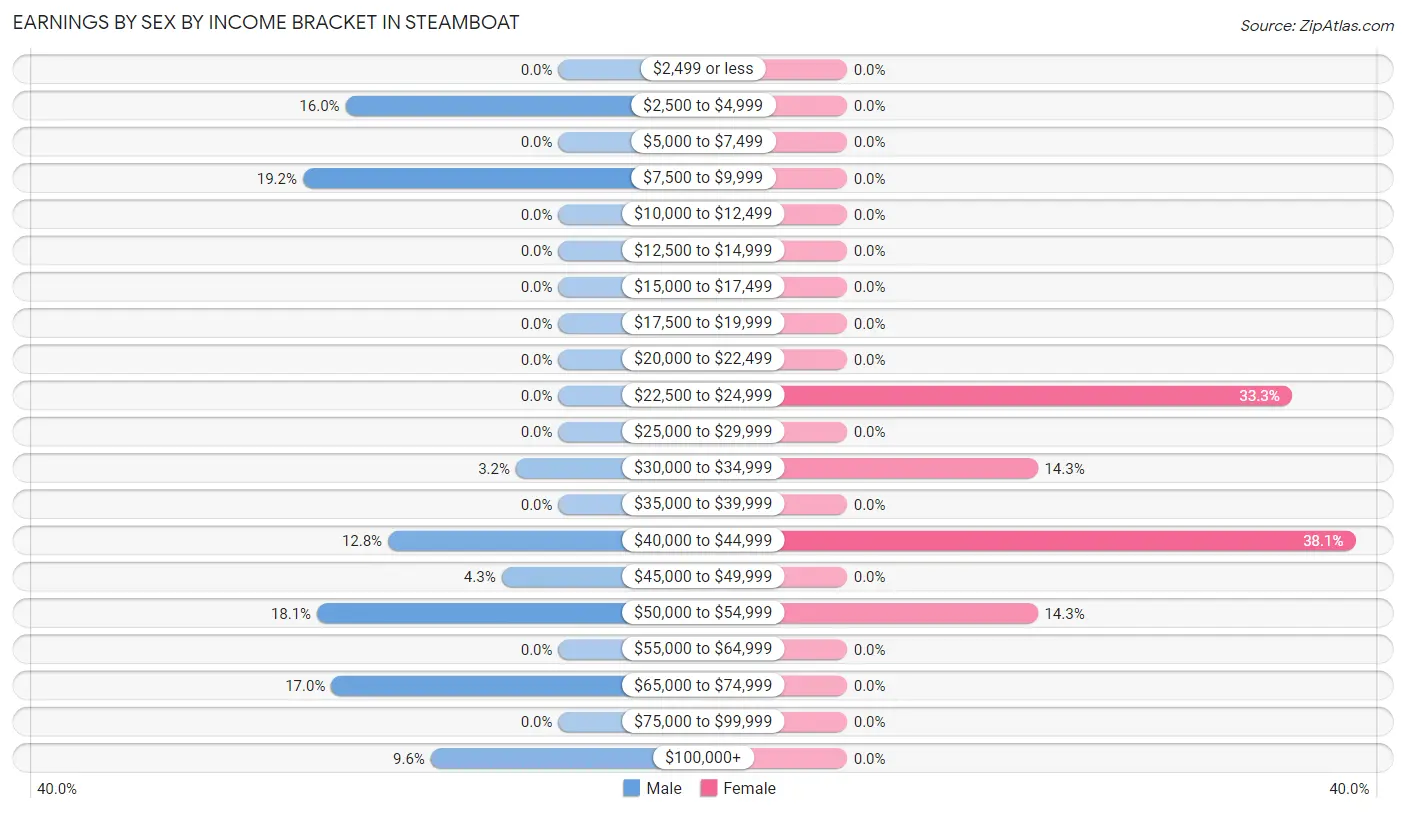
Earnings by Sex by Income Bracket in Steamboat
The most common earnings brackets in Steamboat are $7,500 to $9,999 for men (18 | 19.2%) and $40,000 to $44,999 for women (8 | 38.1%).
| Income | Male | Female |
| $2,499 or less | 0 (0.0%) | 0 (0.0%) |
| $2,500 to $4,999 | 15 (16.0%) | 0 (0.0%) |
| $5,000 to $7,499 | 0 (0.0%) | 0 (0.0%) |
| $7,500 to $9,999 | 18 (19.2%) | 0 (0.0%) |
| $10,000 to $12,499 | 0 (0.0%) | 0 (0.0%) |
| $12,500 to $14,999 | 0 (0.0%) | 0 (0.0%) |
| $15,000 to $17,499 | 0 (0.0%) | 0 (0.0%) |
| $17,500 to $19,999 | 0 (0.0%) | 0 (0.0%) |
| $20,000 to $22,499 | 0 (0.0%) | 0 (0.0%) |
| $22,500 to $24,999 | 0 (0.0%) | 7 (33.3%) |
| $25,000 to $29,999 | 0 (0.0%) | 0 (0.0%) |
| $30,000 to $34,999 | 3 (3.2%) | 3 (14.3%) |
| $35,000 to $39,999 | 0 (0.0%) | 0 (0.0%) |
| $40,000 to $44,999 | 12 (12.8%) | 8 (38.1%) |
| $45,000 to $49,999 | 4 (4.3%) | 0 (0.0%) |
| $50,000 to $54,999 | 17 (18.1%) | 3 (14.3%) |
| $55,000 to $64,999 | 0 (0.0%) | 0 (0.0%) |
| $65,000 to $74,999 | 16 (17.0%) | 0 (0.0%) |
| $75,000 to $99,999 | 0 (0.0%) | 0 (0.0%) |
| $100,000+ | 9 (9.6%) | 0 (0.0%) |
| Total | 94 (100.0%) | 21 (100.0%) |
Earnings by Sex by Educational Attainment in Steamboat
| Educational Attainment | Male Income | Female Income |
| Less than High School | - | - |
| High School Diploma | - | - |
| College or Associate's Degree | - | - |
| Bachelor's Degree | - | - |
| Graduate Degree | - | - |
| Total | $50,781 | $40,156 |
Family Income in Steamboat
Family Income Brackets in Steamboat
According to the Steamboat family income data, there are 31 families falling into the $25,000 to $34,999 income range, which is the most common income bracket and makes up 34.4% of all families.
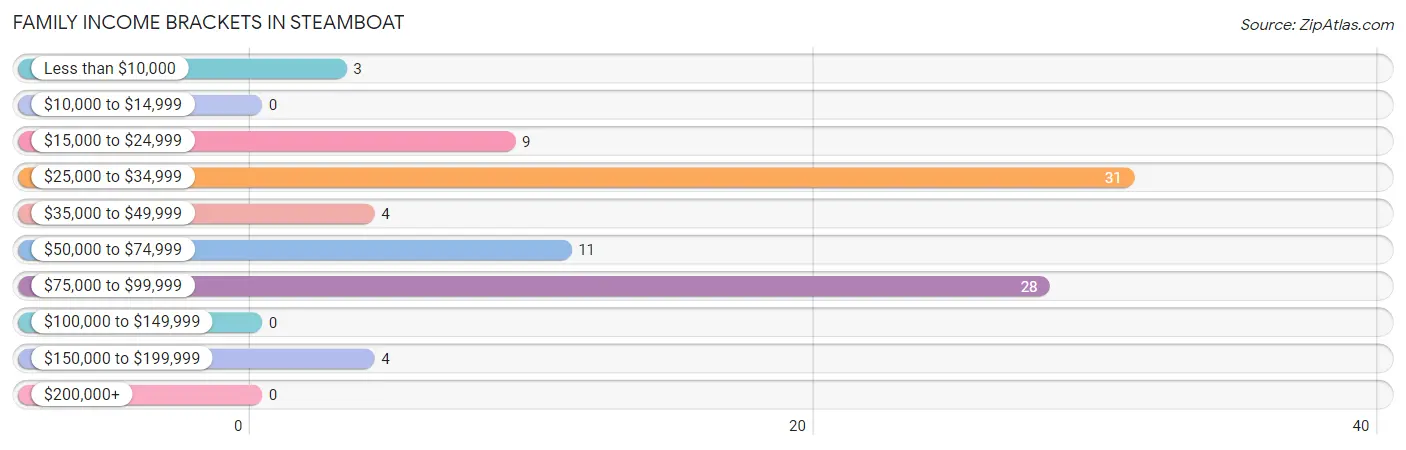
| Income Bracket | # Families | % Families |
| Less than $10,000 | 3 | 3.3% |
| $10,000 to $14,999 | 0 | 0.0% |
| $15,000 to $24,999 | 9 | 10.0% |
| $25,000 to $34,999 | 31 | 34.4% |
| $35,000 to $49,999 | 4 | 4.4% |
| $50,000 to $74,999 | 11 | 12.2% |
| $75,000 to $99,999 | 28 | 31.1% |
| $100,000 to $149,999 | 0 | 0.0% |
| $150,000 to $199,999 | 4 | 4.4% |
| $200,000+ | 0 | 0.0% |
Family Income by Famaliy Size in Steamboat
3-person families (23 | 25.6%) account for the highest median family income in Steamboat with $88,203 per family, while 3-person families (23 | 25.6%) have the highest median income of $29,401 per family member.
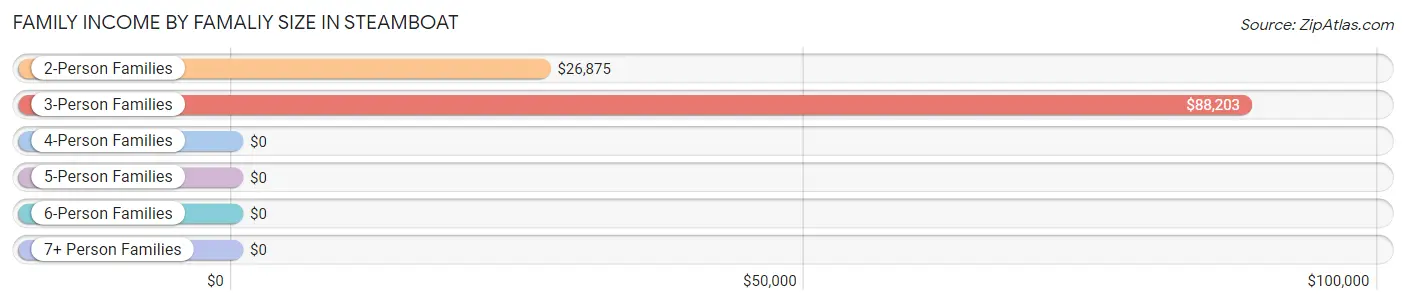
| Income Bracket | # Families | Median Income |
| 2-Person Families | 40 (44.4%) | $26,875 |
| 3-Person Families | 23 (25.6%) | $88,203 |
| 4-Person Families | 11 (12.2%) | $0 |
| 5-Person Families | 9 (10.0%) | $0 |
| 6-Person Families | 4 (4.4%) | $0 |
| 7+ Person Families | 3 (3.3%) | $0 |
| Total | 90 (100.0%) | $41,250 |
Family Income by Number of Earners in Steamboat
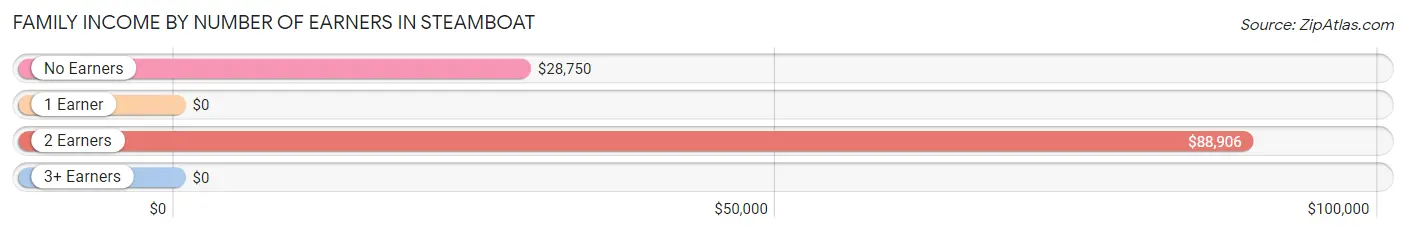
| Number of Earners | # Families | Median Income |
| No Earners | 28 (31.1%) | $28,750 |
| 1 Earner | 38 (42.2%) | $0 |
| 2 Earners | 24 (26.7%) | $88,906 |
| 3+ Earners | 0 (0.0%) | $0 |
| Total | 90 (100.0%) | $41,250 |
Household Income in Steamboat
Household Income Brackets in Steamboat
With 31 households falling in the category, the $25,000 to $34,999 income range is the most frequent in Steamboat, accounting for 25.4% of all households.
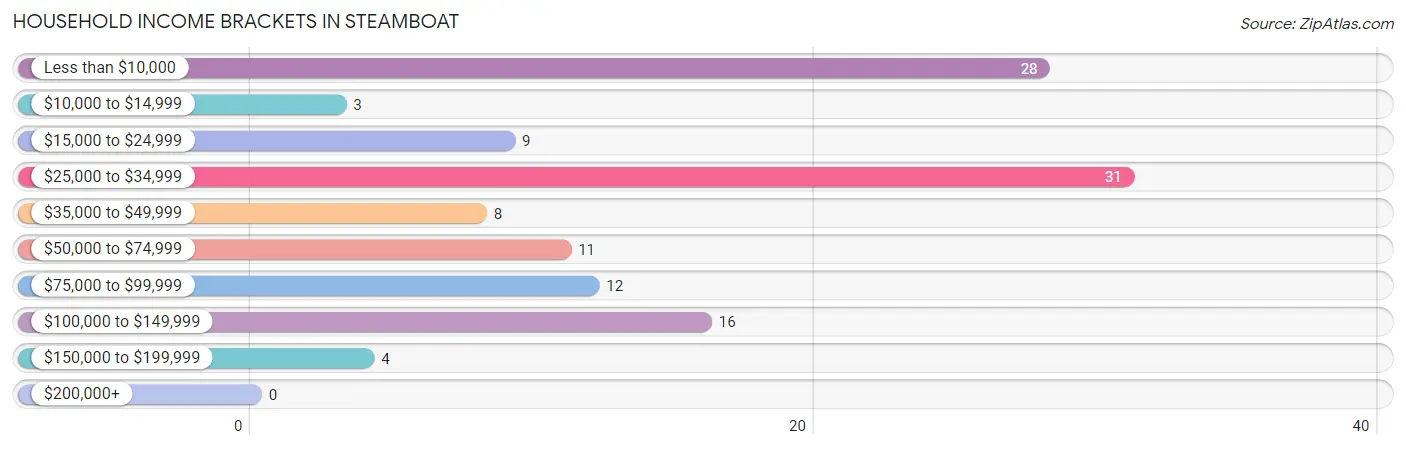
| Income Bracket | # Households | % Households |
| Less than $10,000 | 28 | 23.0% |
| $10,000 to $14,999 | 3 | 2.5% |
| $15,000 to $24,999 | 9 | 7.4% |
| $25,000 to $34,999 | 31 | 25.4% |
| $35,000 to $49,999 | 8 | 6.6% |
| $50,000 to $74,999 | 11 | 9.0% |
| $75,000 to $99,999 | 12 | 9.8% |
| $100,000 to $149,999 | 16 | 13.1% |
| $150,000 to $199,999 | 4 | 3.3% |
| $200,000+ | 0 | 0.0% |
Household Income by Householder Age in Steamboat
The median household income in Steamboat is $28,125, with the highest median household income of $30,000 found in the 65+ years age bracket for the primary householder. A total of 32 households (26.2%) fall into this category.
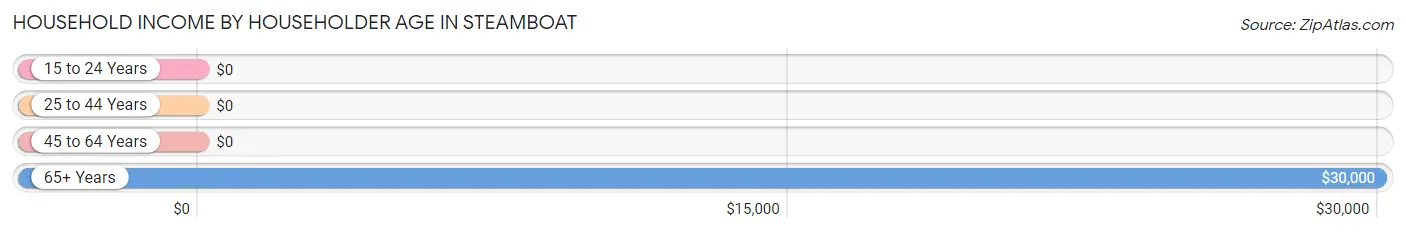
| Income Bracket | # Households | Median Income |
| 15 to 24 Years | 0 (0.0%) | $0 |
| 25 to 44 Years | 9 (7.4%) | $0 |
| 45 to 64 Years | 81 (66.4%) | $0 |
| 65+ Years | 32 (26.2%) | $30,000 |
| Total | 122 (100.0%) | $28,125 |
Poverty in Steamboat
Income Below Poverty by Sex and Age in Steamboat
With 29.1% poverty level for males and 28.8% for females among the residents of Steamboat, 15 year old males and 12 to 14 year old females are the most vulnerable to poverty, with 4 males (100.0%) and 10 females (100.0%) in their respective age groups living below the poverty level.
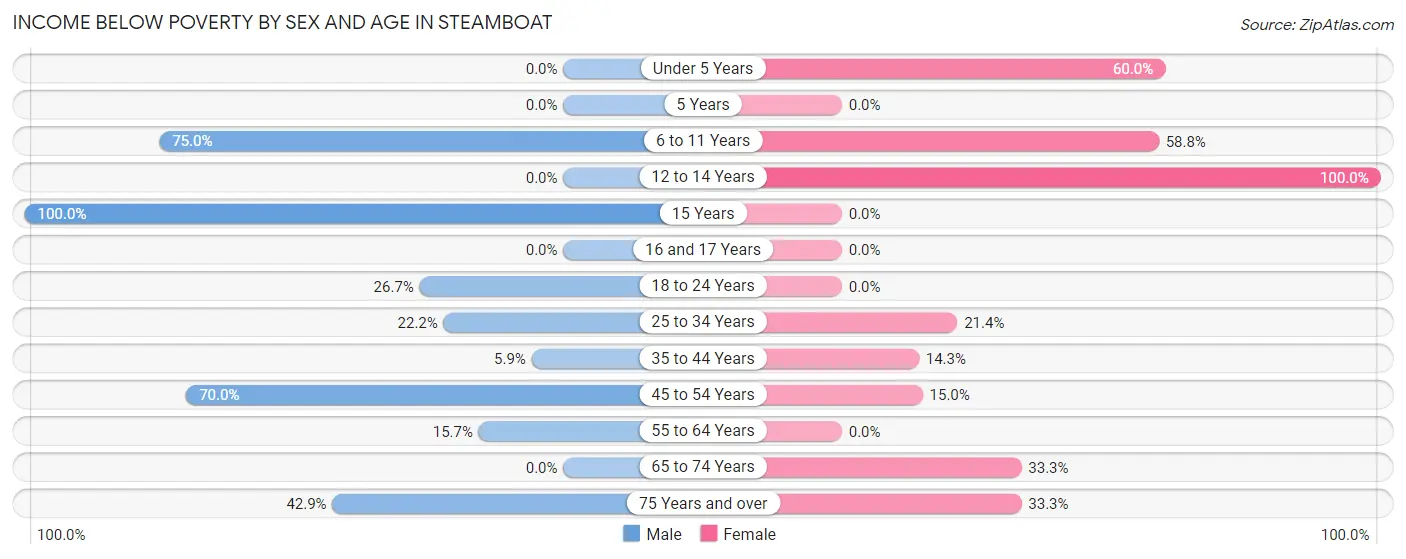
| Age Bracket | Male | Female |
| Under 5 Years | 0 (0.0%) | 9 (60.0%) |
| 5 Years | 0 (0.0%) | 0 (0.0%) |
| 6 to 11 Years | 12 (75.0%) | 10 (58.8%) |
| 12 to 14 Years | 0 (0.0%) | 10 (100.0%) |
| 15 Years | 4 (100.0%) | 0 (0.0%) |
| 16 and 17 Years | 0 (0.0%) | 0 (0.0%) |
| 18 to 24 Years | 8 (26.7%) | 0 (0.0%) |
| 25 to 34 Years | 8 (22.2%) | 3 (21.4%) |
| 35 to 44 Years | 3 (5.9%) | 3 (14.3%) |
| 45 to 54 Years | 28 (70.0%) | 3 (15.0%) |
| 55 to 64 Years | 8 (15.7%) | 0 (0.0%) |
| 65 to 74 Years | 0 (0.0%) | 6 (33.3%) |
| 75 Years and over | 3 (42.9%) | 3 (33.3%) |
| Total | 74 (29.1%) | 47 (28.8%) |
Income Above Poverty by Sex and Age in Steamboat
According to the poverty statistics in Steamboat, males aged 12 to 14 years and females aged 16 and 17 years are the age groups that are most secure financially, with 100.0% of males and 100.0% of females in these age groups living above the poverty line.
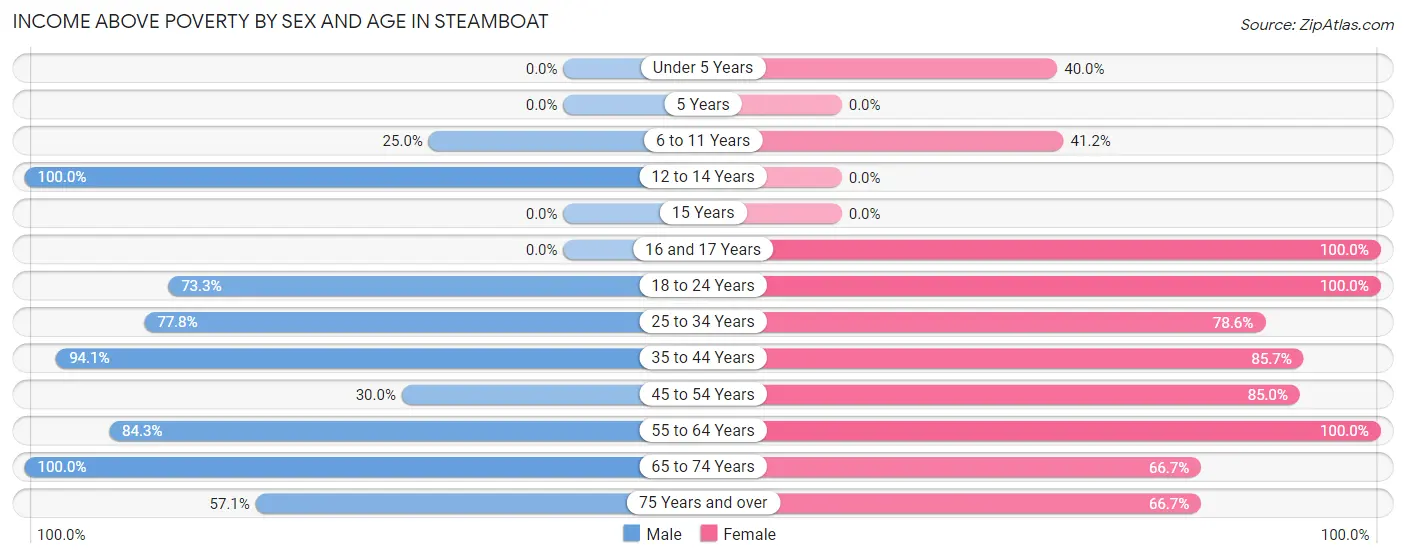
| Age Bracket | Male | Female |
| Under 5 Years | 0 (0.0%) | 6 (40.0%) |
| 5 Years | 0 (0.0%) | 0 (0.0%) |
| 6 to 11 Years | 4 (25.0%) | 7 (41.2%) |
| 12 to 14 Years | 6 (100.0%) | 0 (0.0%) |
| 15 Years | 0 (0.0%) | 0 (0.0%) |
| 16 and 17 Years | 0 (0.0%) | 12 (100.0%) |
| 18 to 24 Years | 22 (73.3%) | 15 (100.0%) |
| 25 to 34 Years | 28 (77.8%) | 11 (78.6%) |
| 35 to 44 Years | 48 (94.1%) | 18 (85.7%) |
| 45 to 54 Years | 12 (30.0%) | 17 (85.0%) |
| 55 to 64 Years | 43 (84.3%) | 12 (100.0%) |
| 65 to 74 Years | 13 (100.0%) | 12 (66.7%) |
| 75 Years and over | 4 (57.1%) | 6 (66.7%) |
| Total | 180 (70.9%) | 116 (71.2%) |
Income Below Poverty Among Married-Couple Families in Steamboat
The poverty statistics for married-couple families in Steamboat show that 26.9% or 7 of the total 26 families live below the poverty line. Families with 5 or more children have the highest poverty rate of 100.0%, comprising of 3 families. On the other hand, families with no children have the lowest poverty rate of 0.0%, which includes 0 families.
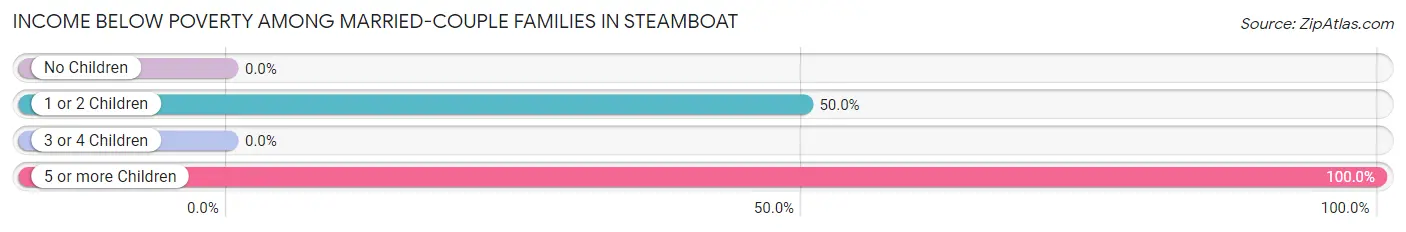
| Children | Above Poverty | Below Poverty |
| No Children | 15 (100.0%) | 0 (0.0%) |
| 1 or 2 Children | 4 (50.0%) | 4 (50.0%) |
| 3 or 4 Children | 0 (0.0%) | 0 (0.0%) |
| 5 or more Children | 0 (0.0%) | 3 (100.0%) |
| Total | 19 (73.1%) | 7 (26.9%) |
Income Below Poverty Among Single-Parent Households in Steamboat
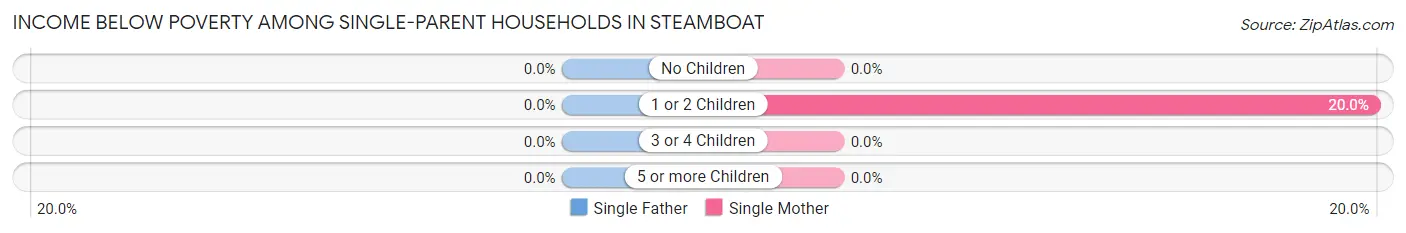
| Children | Single Father | Single Mother |
| No Children | 0 (0.0%) | 0 (0.0%) |
| 1 or 2 Children | 0 (0.0%) | 3 (20.0%) |
| 3 or 4 Children | 0 (0.0%) | 0 (0.0%) |
| 5 or more Children | 0 (0.0%) | 0 (0.0%) |
| Total | 0 (0.0%) | 3 (14.3%) |
Income Below Poverty Among Married-Couple vs Single-Parent Households in Steamboat
The poverty data for Steamboat shows that 7 of the married-couple family households (26.9%) and 3 of the single-parent households (4.7%) are living below the poverty level. Within the married-couple family households, those with 5 or more children have the highest poverty rate, with 3 households (100.0%) falling below the poverty line. Among the single-parent households, those with 1 or 2 children have the highest poverty rate, with 3 household (15.8%) living below poverty.
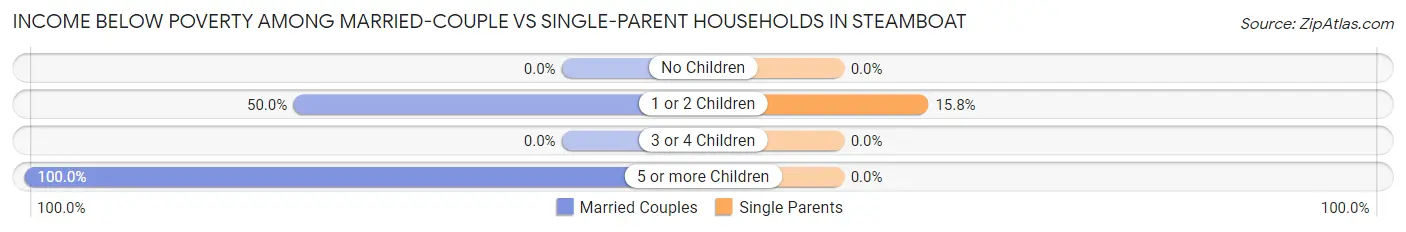
| Children | Married-Couple Families | Single-Parent Households |
| No Children | 0 (0.0%) | 0 (0.0%) |
| 1 or 2 Children | 4 (50.0%) | 3 (15.8%) |
| 3 or 4 Children | 0 (0.0%) | 0 (0.0%) |
| 5 or more Children | 3 (100.0%) | 0 (0.0%) |
| Total | 7 (26.9%) | 3 (4.7%) |
Race in Steamboat
The most populous races in Steamboat are Native / Alaskan (417 | 100.0%), and Hispanic or Latino (5 | 1.2%).
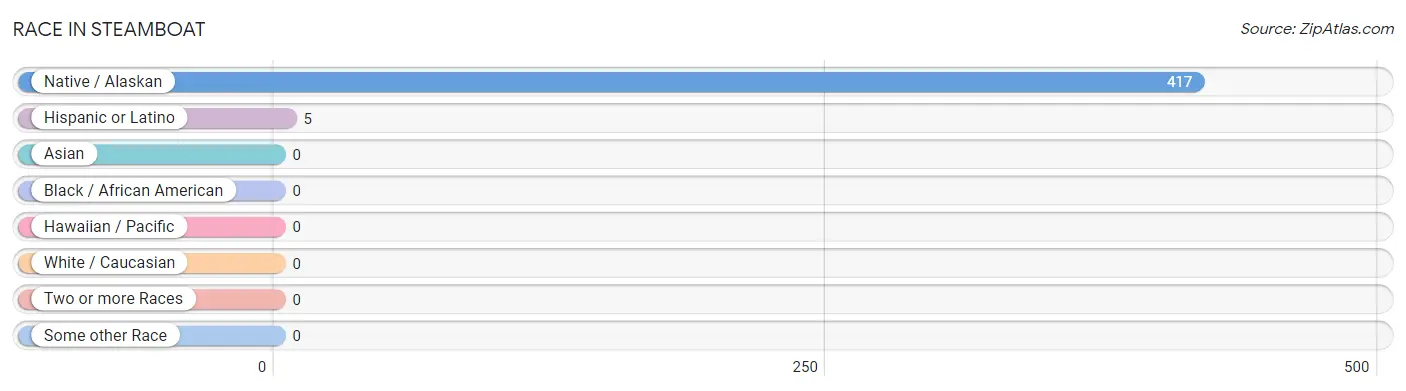
| Race | # Population | % Population |
| Asian | 0 | 0.0% |
| Black / African American | 0 | 0.0% |
| Hawaiian / Pacific | 0 | 0.0% |
| Hispanic or Latino | 5 | 1.2% |
| Native / Alaskan | 417 | 100.0% |
| White / Caucasian | 0 | 0.0% |
| Two or more Races | 0 | 0.0% |
| Some other Race | 0 | 0.0% |
| Total | 417 | 100.0% |
Ancestry in Steamboat
The most populous ancestries reported in Steamboat are Navajo (417 | 100.0%), Cheyenne (5 | 1.2%), Mexican (5 | 1.2%), and Ute (5 | 1.2%), together accounting for 103.6% of all Steamboat residents.
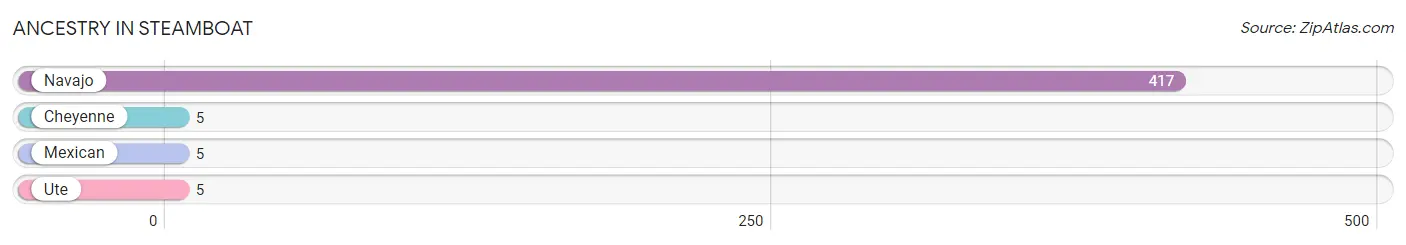
| Ancestry | # Population | % Population |
| Cheyenne | 5 | 1.2% |
| Mexican | 5 | 1.2% |
| Navajo | 417 | 100.0% |
| Ute | 5 | 1.2% | View All 4 Rows |
Immigrants in Steamboat

| Immigration Origin | # Population | % Population | View All 0 Rows |
Sex and Age in Steamboat
Sex and Age in Steamboat
The most populous age groups in Steamboat are 55 to 59 Years (43 | 16.9%) for men and 50 to 54 Years (20 | 12.3%) for women.
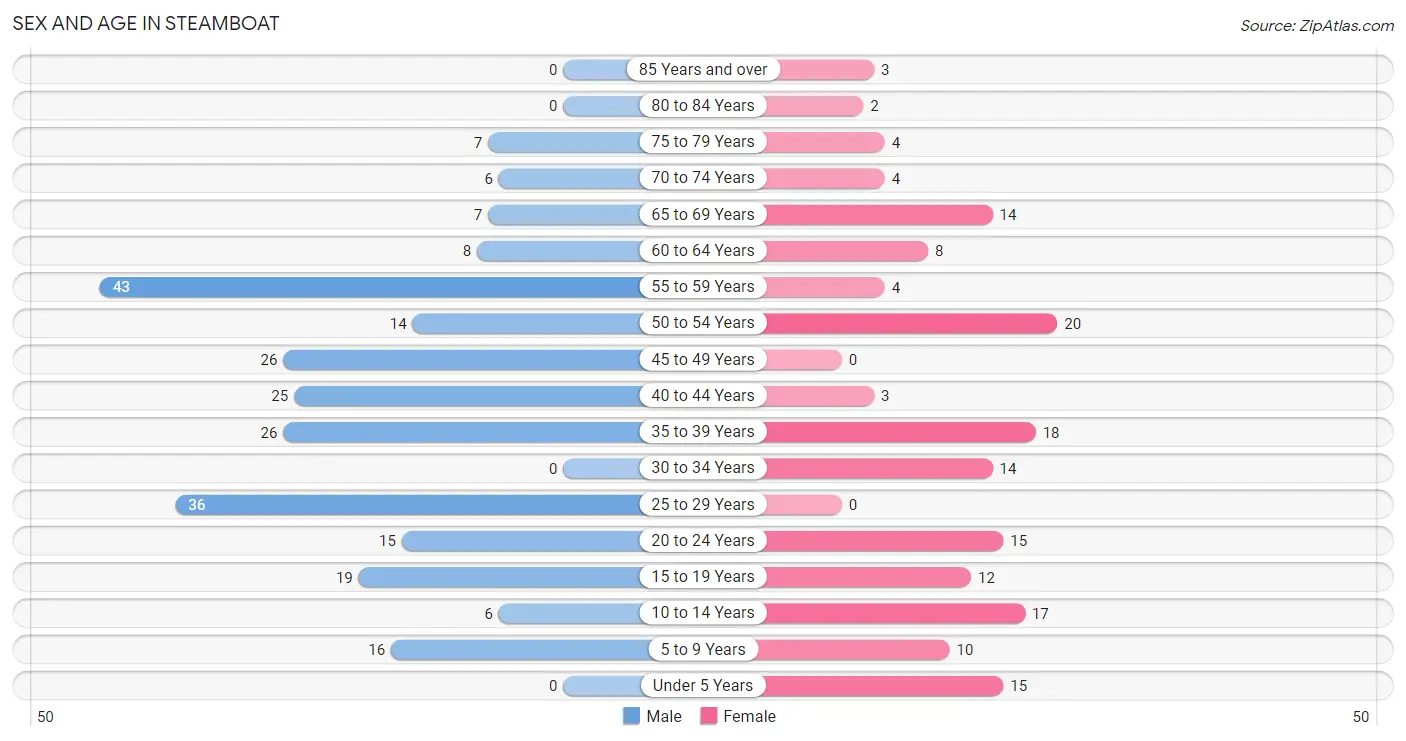
| Age Bracket | Male | Female |
| Under 5 Years | 0 (0.0%) | 15 (9.2%) |
| 5 to 9 Years | 16 (6.3%) | 10 (6.1%) |
| 10 to 14 Years | 6 (2.4%) | 17 (10.4%) |
| 15 to 19 Years | 19 (7.5%) | 12 (7.4%) |
| 20 to 24 Years | 15 (5.9%) | 15 (9.2%) |
| 25 to 29 Years | 36 (14.2%) | 0 (0.0%) |
| 30 to 34 Years | 0 (0.0%) | 14 (8.6%) |
| 35 to 39 Years | 26 (10.2%) | 18 (11.0%) |
| 40 to 44 Years | 25 (9.8%) | 3 (1.8%) |
| 45 to 49 Years | 26 (10.2%) | 0 (0.0%) |
| 50 to 54 Years | 14 (5.5%) | 20 (12.3%) |
| 55 to 59 Years | 43 (16.9%) | 4 (2.5%) |
| 60 to 64 Years | 8 (3.2%) | 8 (4.9%) |
| 65 to 69 Years | 7 (2.8%) | 14 (8.6%) |
| 70 to 74 Years | 6 (2.4%) | 4 (2.5%) |
| 75 to 79 Years | 7 (2.8%) | 4 (2.5%) |
| 80 to 84 Years | 0 (0.0%) | 2 (1.2%) |
| 85 Years and over | 0 (0.0%) | 3 (1.8%) |
| Total | 254 (100.0%) | 163 (100.0%) |
Families and Households in Steamboat
Median Family Size in Steamboat
The median family size in Steamboat is 4.11 persons per family, with single female/mother families (21 | 23.3%) accounting for the largest median family size of 5.48 persons per family. On the other hand, single male/father families (43 | 47.8%) represent the smallest median family size with 2.95 persons per family.
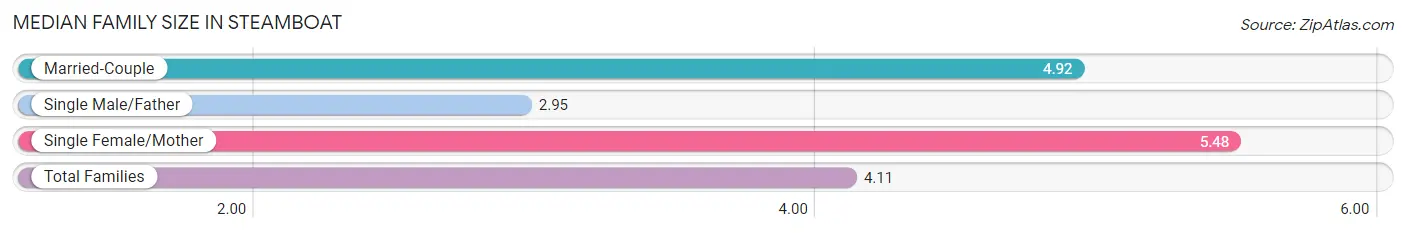
| Family Type | # Families | Family Size |
| Married-Couple | 26 (28.9%) | 4.92 |
| Single Male/Father | 43 (47.8%) | 2.95 |
| Single Female/Mother | 21 (23.3%) | 5.48 |
| Total Families | 90 (100.0%) | 4.11 |
Median Household Size in Steamboat
The median household size in Steamboat is 3.42 persons per household, with single female/mother households (21 | 17.2%) accounting for the largest median household size of 5.62 persons per household. non-family households (32 | 26.2%) represent the smallest median household size with 1.16 persons per household.
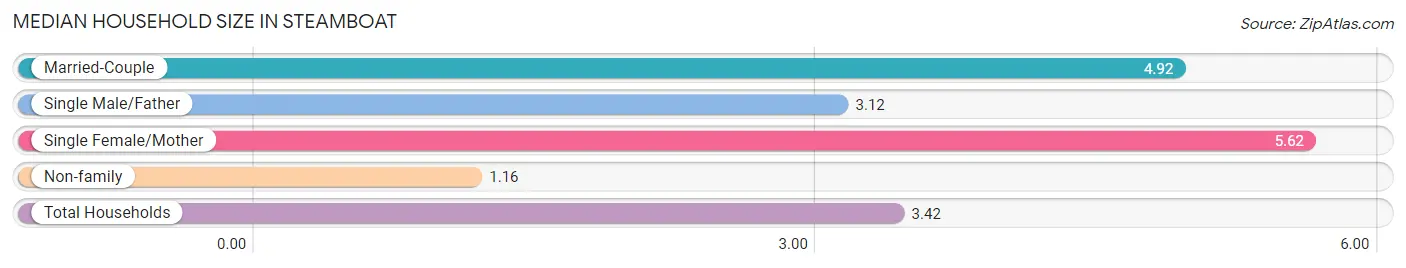
| Household Type | # Households | Household Size |
| Married-Couple | 26 (21.3%) | 4.92 |
| Single Male/Father | 43 (35.2%) | 3.12 |
| Single Female/Mother | 21 (17.2%) | 5.62 |
| Non-family | 32 (26.2%) | 1.16 |
| Total Households | 122 (100.0%) | 3.42 |
Household Size by Marriage Status in Steamboat
Out of a total of 122 households in Steamboat, 90 (73.8%) are family households, while 32 (26.2%) are nonfamily households. The most numerous type of family households are 2-person households, comprising 37, and the most common type of nonfamily households are 1-person households, comprising 18.
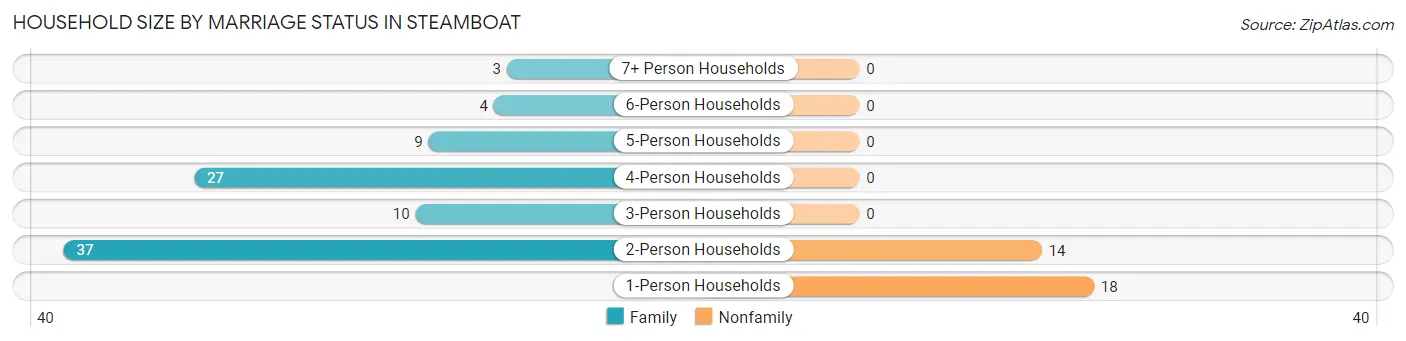
| Household Size | Family Households | Nonfamily Households |
| 1-Person Households | - | 18 (14.7%) |
| 2-Person Households | 37 (30.3%) | 14 (11.5%) |
| 3-Person Households | 10 (8.2%) | 0 (0.0%) |
| 4-Person Households | 27 (22.1%) | 0 (0.0%) |
| 5-Person Households | 9 (7.4%) | 0 (0.0%) |
| 6-Person Households | 4 (3.3%) | 0 (0.0%) |
| 7+ Person Households | 3 (2.5%) | 0 (0.0%) |
| Total | 90 (73.8%) | 32 (26.2%) |
Female Fertility in Steamboat
Fertility by Age in Steamboat
| Age Bracket | Women with Births | Births / 1,000 Women |
| 15 to 19 years | 0 (0.0%) | 0.0 |
| 20 to 34 years | 0 (0.0%) | 0.0 |
| 35 to 50 years | 0 (0.0%) | 0.0 |
| Total | 0 (0.0%) | 0.0 |
Fertility by Age by Marriage Status in Steamboat
| Age Bracket | Married | Unmarried |
| 15 to 19 years | 0 (0.0%) | 0 (0.0%) |
| 20 to 34 years | 0 (0.0%) | 0 (0.0%) |
| 35 to 50 years | 0 (0.0%) | 0 (0.0%) |
| Total | 0 (0.0%) | 0 (0.0%) |
Fertility by Education in Steamboat
| Educational Attainment | Women with Births | Births / 1,000 Women |
| Less than High School | 0 (0.0%) | 0.0 |
| High School Diploma | 0 (0.0%) | 0.0 |
| College or Associate's Degree | 0 (0.0%) | 0.0 |
| Bachelor's Degree | 0 (0.0%) | 0.0 |
| Graduate Degree | 0 (0.0%) | 0.0 |
| Total | 0 (0.0%) | 0.0 |
Fertility by Education by Marriage Status in Steamboat
| Educational Attainment | Married | Unmarried |
| Less than High School | 0 (0.0%) | 0 (0.0%) |
| High School Diploma | 0 (0.0%) | 0 (0.0%) |
| College or Associate's Degree | 0 (0.0%) | 0 (0.0%) |
| Bachelor's Degree | 0 (0.0%) | 0 (0.0%) |
| Graduate Degree | 0 (0.0%) | 0 (0.0%) |
| Total | 0 (0.0%) | 0 (0.0%) |
Employment Characteristics in Steamboat
Employment by Class of Employer in Steamboat
Among the 81 employed individuals in Steamboat, private company employees (49 | 60.5%), federal government employees (22 | 27.2%), and state government employees (7 | 8.6%) make up the most common classes of employment.
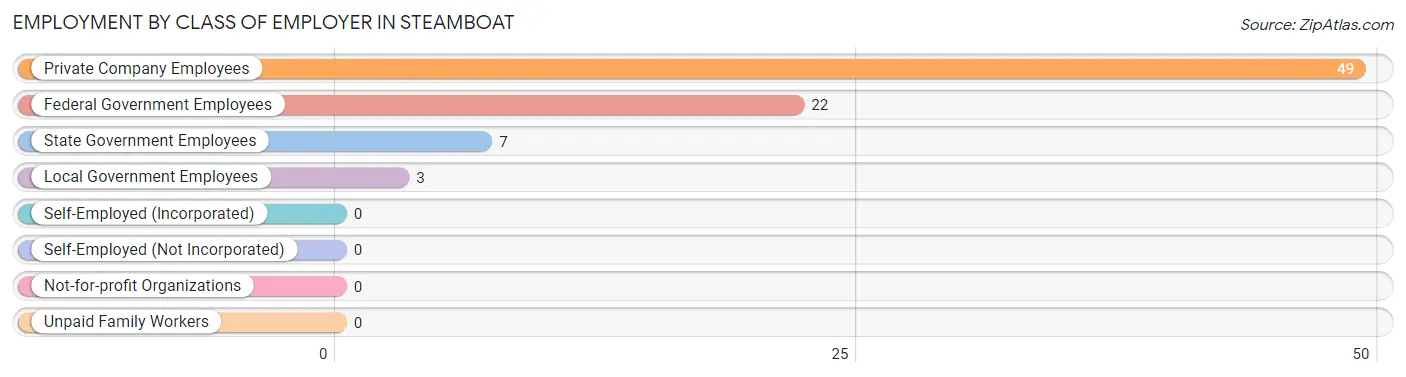
| Employer Class | # Employees | % Employees |
| Private Company Employees | 49 | 60.5% |
| Self-Employed (Incorporated) | 0 | 0.0% |
| Self-Employed (Not Incorporated) | 0 | 0.0% |
| Not-for-profit Organizations | 0 | 0.0% |
| Local Government Employees | 3 | 3.7% |
| State Government Employees | 7 | 8.6% |
| Federal Government Employees | 22 | 27.2% |
| Unpaid Family Workers | 0 | 0.0% |
| Total | 81 | 100.0% |
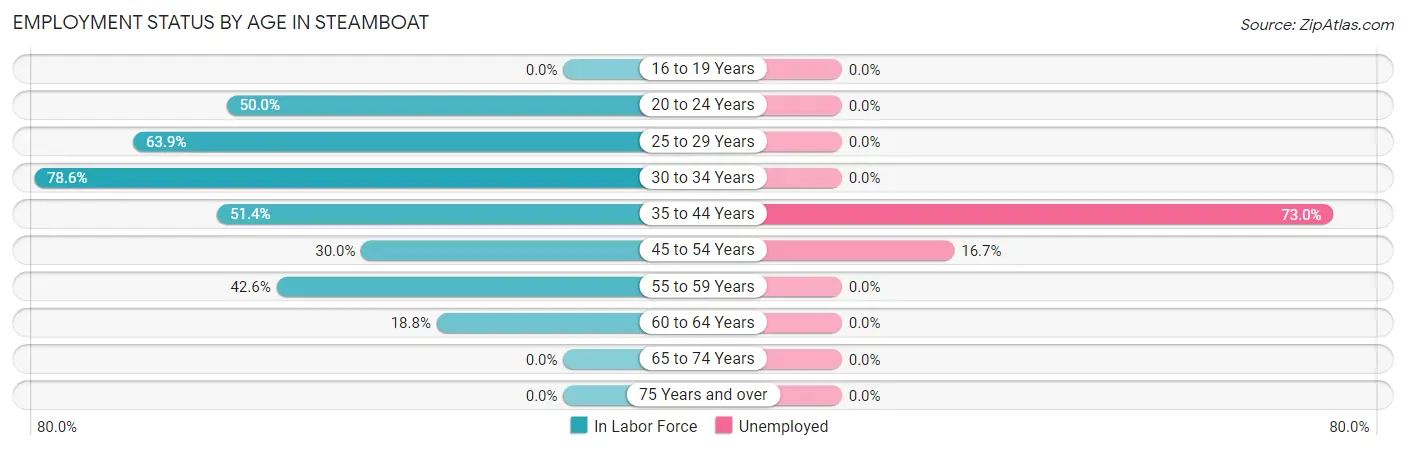
Employment Status by Age in Steamboat
According to the labor force statistics for Steamboat, out of the total population over 16 years of age (349), 36.4% or 127 individuals are in the labor force, with 23.6% or 30 of them unemployed. The age group with the highest labor force participation rate is 30 to 34 years, with 78.6% or 11 individuals in the labor force. Within the labor force, the 35 to 44 years age range has the highest percentage of unemployed individuals, with 73.0% or 27 of them being unemployed.
| Age Bracket | In Labor Force | Unemployed |
| 16 to 19 Years | 0 (0.0%) | 0 (0.0%) |
| 20 to 24 Years | 15 (50.0%) | 0 (0.0%) |
| 25 to 29 Years | 23 (63.9%) | 0 (0.0%) |
| 30 to 34 Years | 11 (78.6%) | 0 (0.0%) |
| 35 to 44 Years | 37 (51.4%) | 27 (73.0%) |
| 45 to 54 Years | 18 (30.0%) | 3 (16.7%) |
| 55 to 59 Years | 20 (42.6%) | 0 (0.0%) |
| 60 to 64 Years | 3 (18.8%) | 0 (0.0%) |
| 65 to 74 Years | 0 (0.0%) | 0 (0.0%) |
| 75 Years and over | 0 (0.0%) | 0 (0.0%) |
| Total | 127 (36.4%) | 30 (23.6%) |
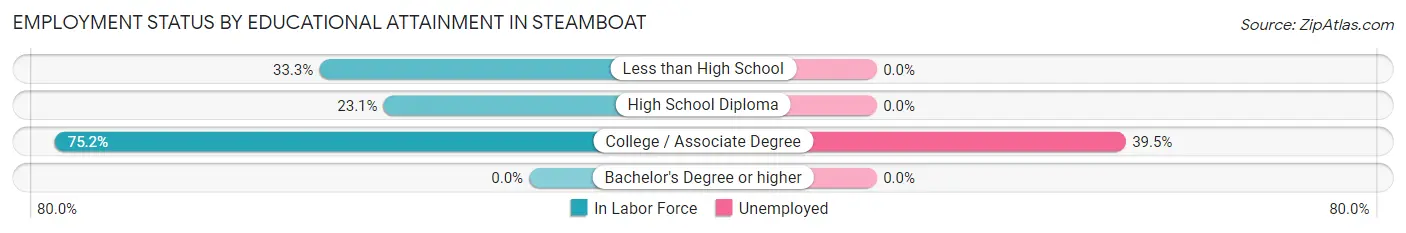
Employment Status by Educational Attainment in Steamboat
According to labor force statistics for Steamboat, 45.7% of individuals (112) out of the total population between 25 and 64 years of age (245) are in the labor force, with 26.8% or 30 of them being unemployed. The group with the highest labor force participation rate are those with the educational attainment of college / associate degree, with 75.2% or 76 individuals in the labor force. Within the labor force, individuals with college / associate degree education have the highest percentage of unemployment, with 39.5% or 30 of them being unemployed.
| Educational Attainment | In Labor Force | Unemployed |
| Less than High School | 9 (33.3%) | 0 (0.0%) |
| High School Diploma | 27 (23.1%) | 0 (0.0%) |
| College / Associate Degree | 76 (75.2%) | 40 (39.5%) |
| Bachelor's Degree or higher | 0 (0.0%) | 0 (0.0%) |
| Total | 112 (45.7%) | 66 (26.8%) |
Employment Occupations by Sex in Steamboat
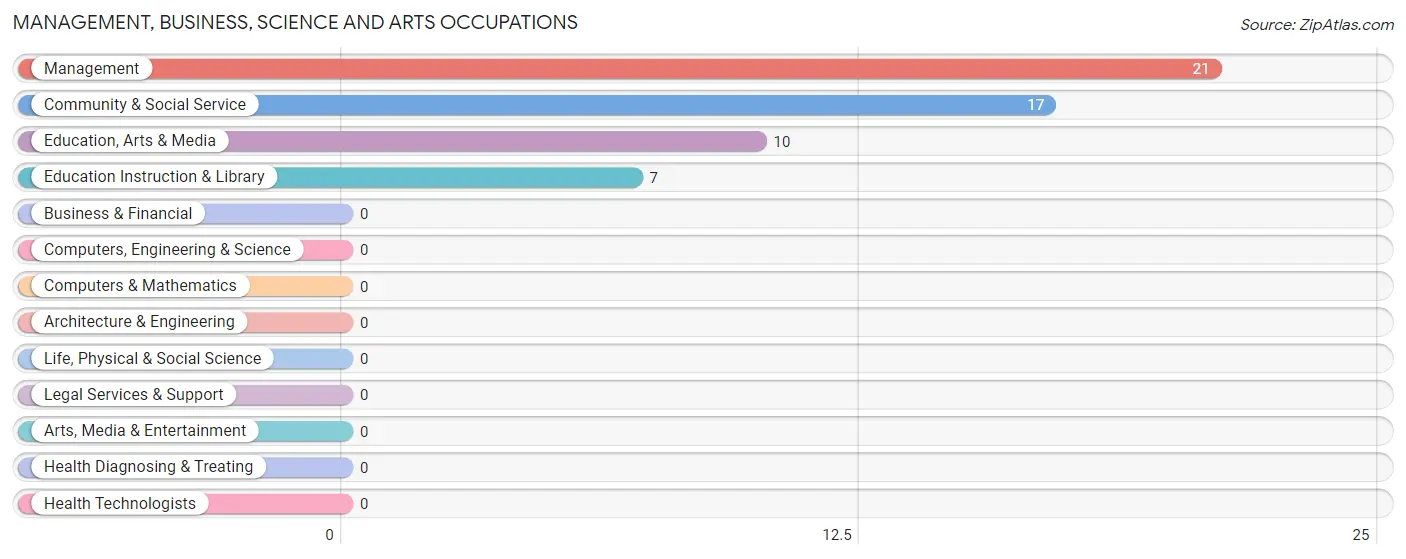
Management, Business, Science and Arts Occupations
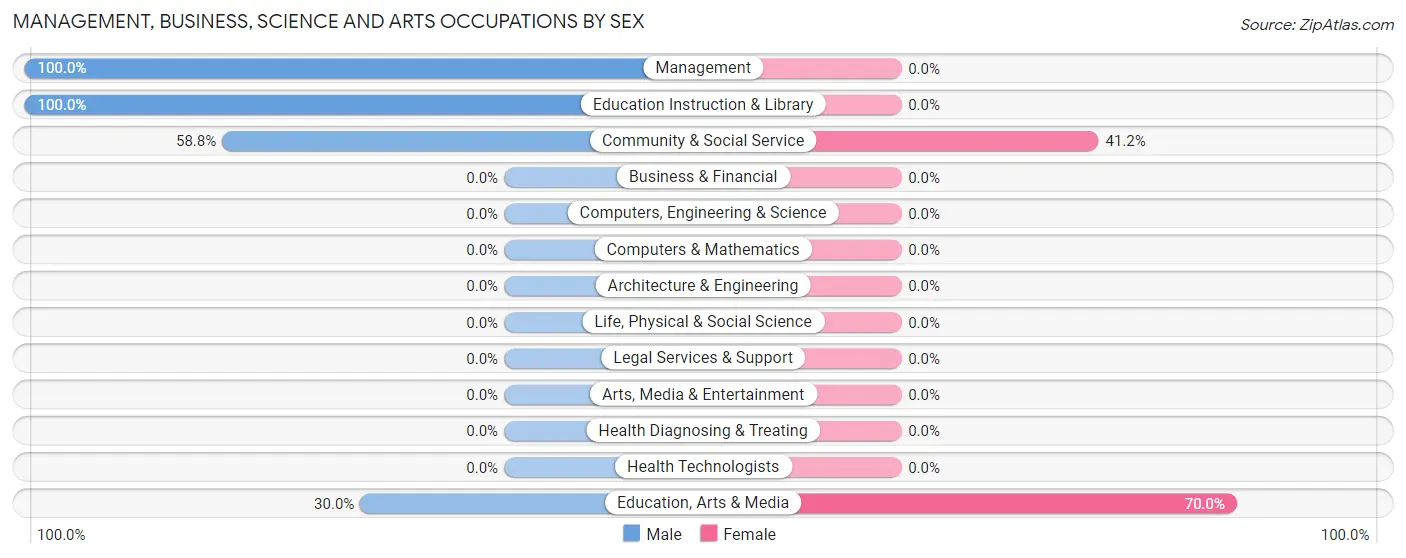
The most common Management, Business, Science and Arts occupations in Steamboat are Management (21 | 21.6%), Community & Social Service (17 | 17.5%), Education, Arts & Media (10 | 10.3%), and Education Instruction & Library (7 | 7.2%).
Management, Business, Science and Arts Occupations by Sex
Within the Management, Business, Science and Arts occupations in Steamboat, the most male-oriented occupations are Management (100.0%), Education Instruction & Library (100.0%), and Community & Social Service (58.8%), while the most female-oriented occupations are Education, Arts & Media (70.0%), and Community & Social Service (41.2%).
| Occupation | Male | Female |
| Management | 21 (100.0%) | 0 (0.0%) |
| Business & Financial | 0 (0.0%) | 0 (0.0%) |
| Computers, Engineering & Science | 0 (0.0%) | 0 (0.0%) |
| Computers & Mathematics | 0 (0.0%) | 0 (0.0%) |
| Architecture & Engineering | 0 (0.0%) | 0 (0.0%) |
| Life, Physical & Social Science | 0 (0.0%) | 0 (0.0%) |
| Community & Social Service | 10 (58.8%) | 7 (41.2%) |
| Education, Arts & Media | 3 (30.0%) | 7 (70.0%) |
| Legal Services & Support | 0 (0.0%) | 0 (0.0%) |
| Education Instruction & Library | 7 (100.0%) | 0 (0.0%) |
| Arts, Media & Entertainment | 0 (0.0%) | 0 (0.0%) |
| Health Diagnosing & Treating | 0 (0.0%) | 0 (0.0%) |
| Health Technologists | 0 (0.0%) | 0 (0.0%) |
| Total (Category) | 31 (81.6%) | 7 (18.4%) |
| Total (Overall) | 76 (78.3%) | 21 (21.6%) |
Services Occupations
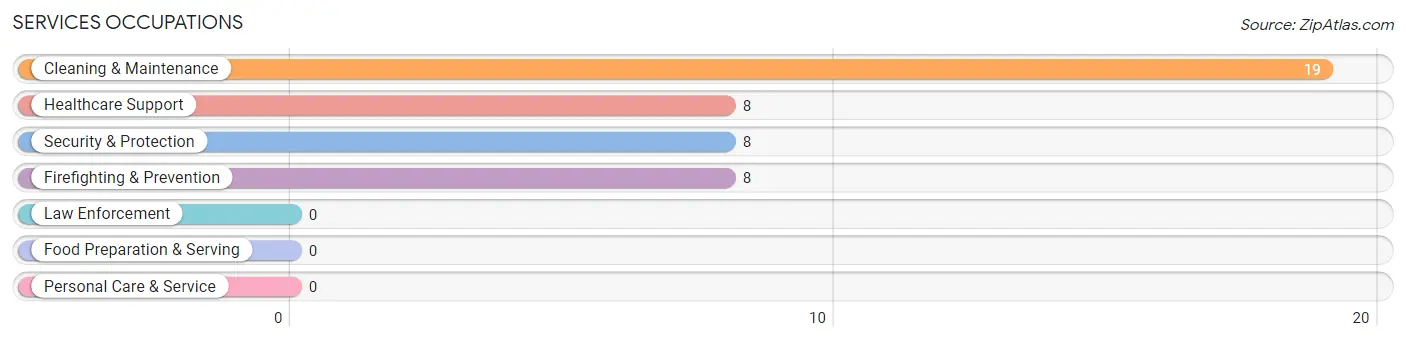
The most common Services occupations in Steamboat are Cleaning & Maintenance (19 | 19.6%), Healthcare Support (8 | 8.3%), Security & Protection (8 | 8.3%), and Firefighting & Prevention (8 | 8.3%).
Services Occupations by Sex
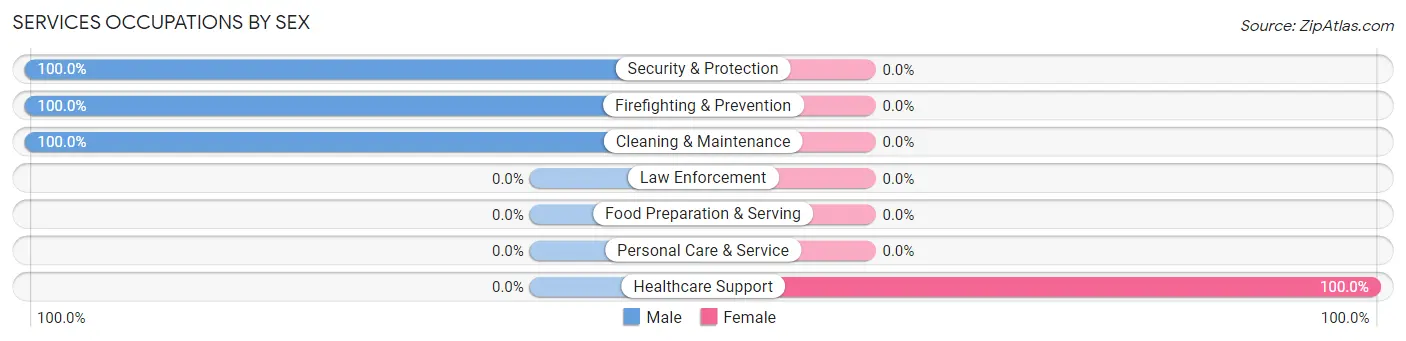
| Occupation | Male | Female |
| Healthcare Support | 0 (0.0%) | 8 (100.0%) |
| Security & Protection | 8 (100.0%) | 0 (0.0%) |
| Firefighting & Prevention | 8 (100.0%) | 0 (0.0%) |
| Law Enforcement | 0 (0.0%) | 0 (0.0%) |
| Food Preparation & Serving | 0 (0.0%) | 0 (0.0%) |
| Cleaning & Maintenance | 19 (100.0%) | 0 (0.0%) |
| Personal Care & Service | 0 (0.0%) | 0 (0.0%) |
| Total (Category) | 27 (77.1%) | 8 (22.9%) |
| Total (Overall) | 76 (78.3%) | 21 (21.6%) |
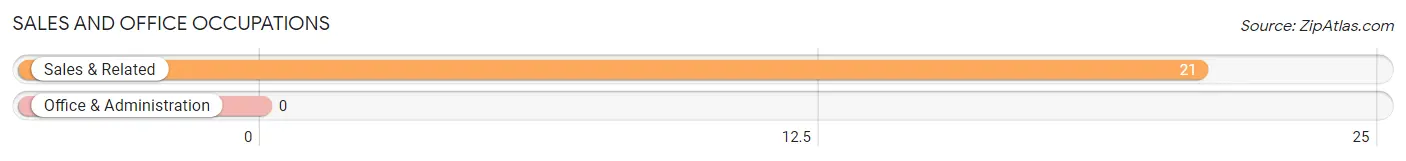
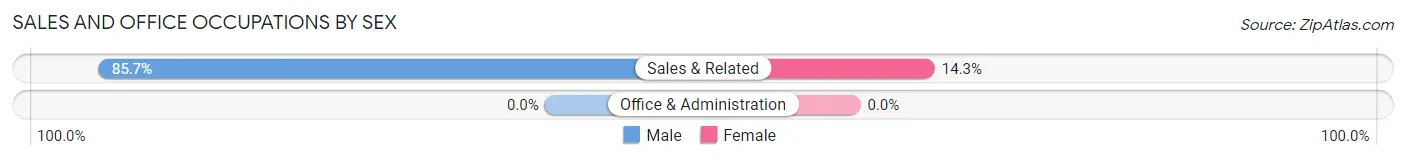
Sales and Office Occupations
The most common Sales and Office occupations in Steamboat are , and Sales & Related (21 | 21.6%).
Sales and Office Occupations by Sex
| Occupation | Male | Female |
| Sales & Related | 18 (85.7%) | 3 (14.3%) |
| Office & Administration | 0 (0.0%) | 0 (0.0%) |
| Total (Category) | 18 (85.7%) | 3 (14.3%) |
| Total (Overall) | 76 (78.3%) | 21 (21.6%) |
Natural Resources, Construction and Maintenance Occupations
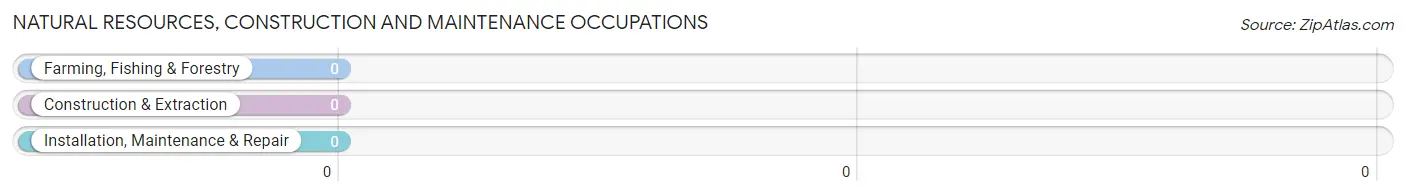
Natural Resources, Construction and Maintenance Occupations by Sex
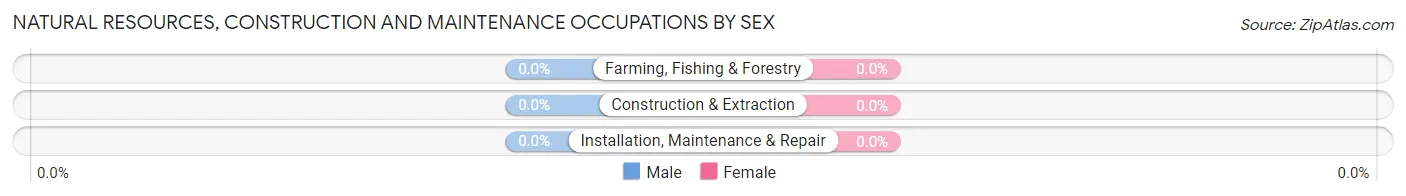
| Occupation | Male | Female |
| Farming, Fishing & Forestry | 0 (0.0%) | 0 (0.0%) |
| Construction & Extraction | 0 (0.0%) | 0 (0.0%) |
| Installation, Maintenance & Repair | 0 (0.0%) | 0 (0.0%) |
| Total (Category) | 0 (0.0%) | 0 (0.0%) |
| Total (Overall) | 76 (78.3%) | 21 (21.6%) |
Production, Transportation and Moving Occupations
The most common Production, Transportation and Moving occupations in Steamboat are , and Production (3 | 3.1%).
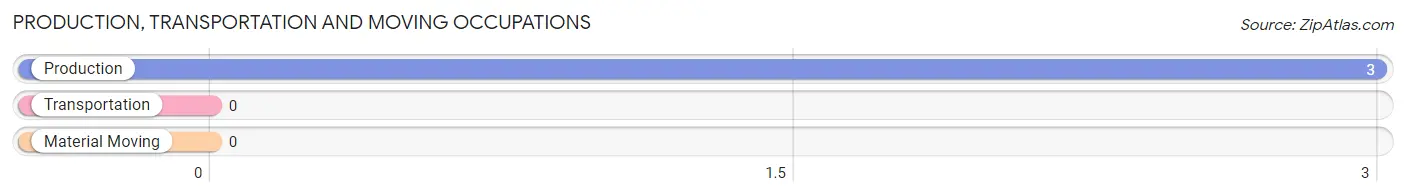
Production, Transportation and Moving Occupations by Sex
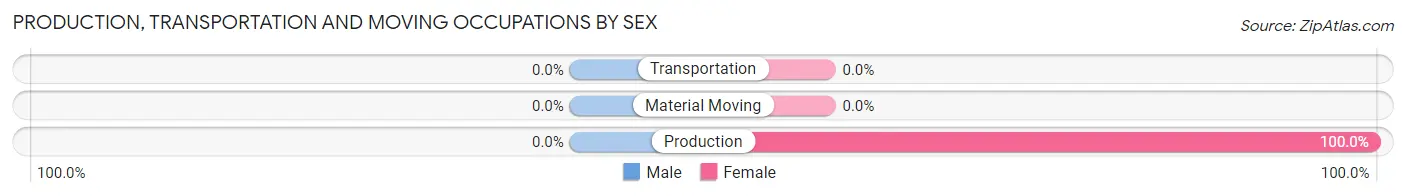
| Occupation | Male | Female |
| Production | 0 (0.0%) | 3 (100.0%) |
| Transportation | 0 (0.0%) | 0 (0.0%) |
| Material Moving | 0 (0.0%) | 0 (0.0%) |
| Total (Category) | 0 (0.0%) | 3 (100.0%) |
| Total (Overall) | 76 (78.3%) | 21 (21.6%) |
Employment Industries by Sex in Steamboat
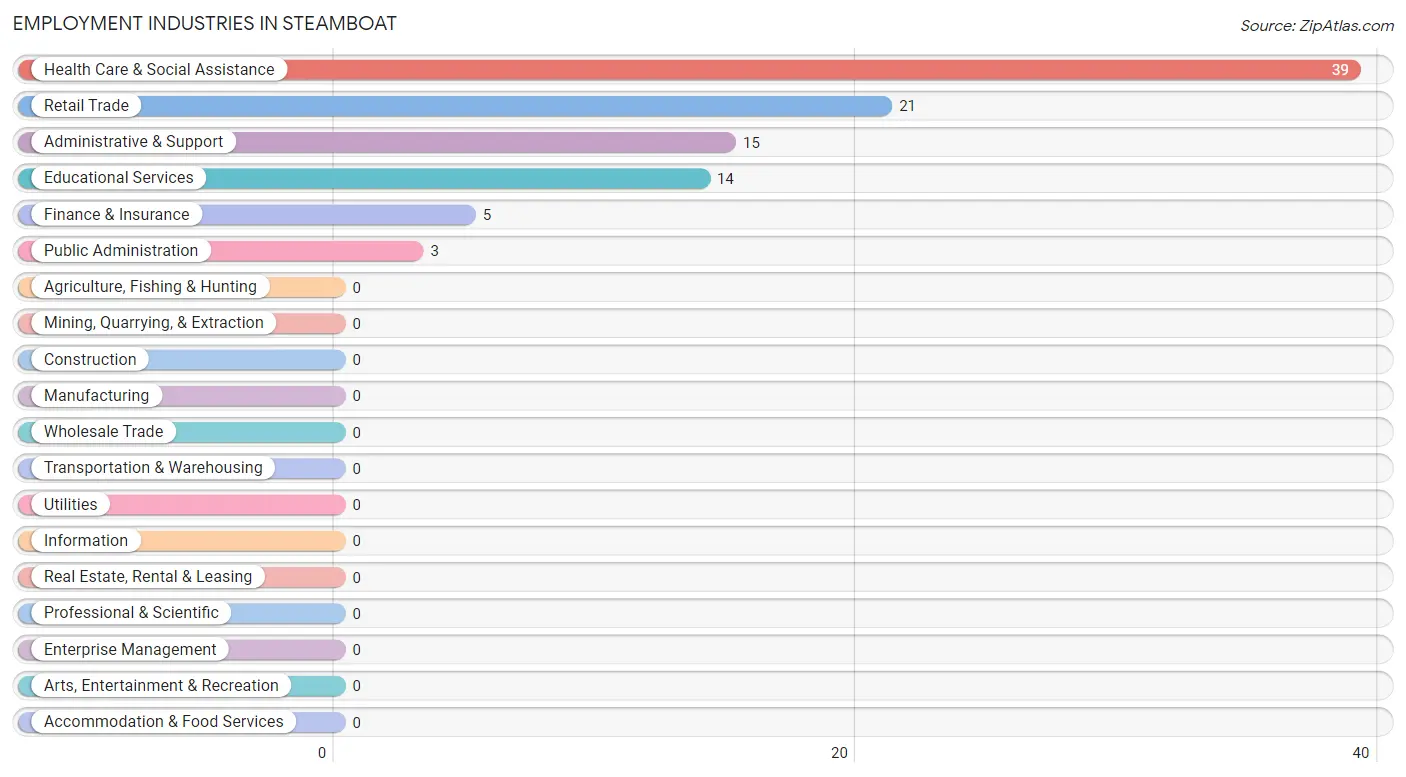
Employment Industries in Steamboat
The major employment industries in Steamboat include Health Care & Social Assistance (39 | 40.2%), Retail Trade (21 | 21.6%), Administrative & Support (15 | 15.5%), Educational Services (14 | 14.4%), and Finance & Insurance (5 | 5.1%).
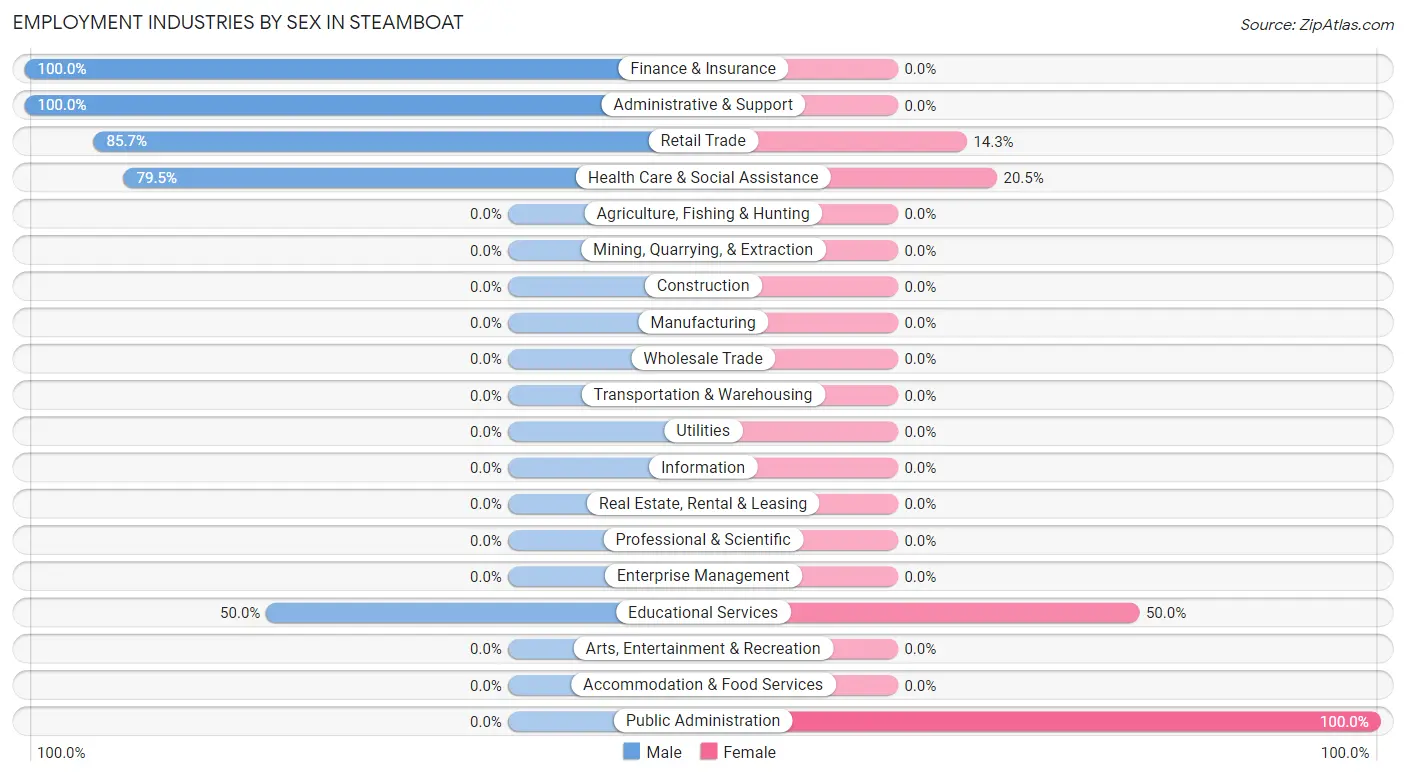
Employment Industries by Sex in Steamboat
The Steamboat industries that see more men than women are Finance & Insurance (100.0%), Administrative & Support (100.0%), and Retail Trade (85.7%), whereas the industries that tend to have a higher number of women are Public Administration (100.0%), Educational Services (50.0%), and Health Care & Social Assistance (20.5%).
| Industry | Male | Female |
| Agriculture, Fishing & Hunting | 0 (0.0%) | 0 (0.0%) |
| Mining, Quarrying, & Extraction | 0 (0.0%) | 0 (0.0%) |
| Construction | 0 (0.0%) | 0 (0.0%) |
| Manufacturing | 0 (0.0%) | 0 (0.0%) |
| Wholesale Trade | 0 (0.0%) | 0 (0.0%) |
| Retail Trade | 18 (85.7%) | 3 (14.3%) |
| Transportation & Warehousing | 0 (0.0%) | 0 (0.0%) |
| Utilities | 0 (0.0%) | 0 (0.0%) |
| Information | 0 (0.0%) | 0 (0.0%) |
| Finance & Insurance | 5 (100.0%) | 0 (0.0%) |
| Real Estate, Rental & Leasing | 0 (0.0%) | 0 (0.0%) |
| Professional & Scientific | 0 (0.0%) | 0 (0.0%) |
| Enterprise Management | 0 (0.0%) | 0 (0.0%) |
| Administrative & Support | 15 (100.0%) | 0 (0.0%) |
| Educational Services | 7 (50.0%) | 7 (50.0%) |
| Health Care & Social Assistance | 31 (79.5%) | 8 (20.5%) |
| Arts, Entertainment & Recreation | 0 (0.0%) | 0 (0.0%) |
| Accommodation & Food Services | 0 (0.0%) | 0 (0.0%) |
| Public Administration | 0 (0.0%) | 3 (100.0%) |
| Total | 76 (78.3%) | 21 (21.6%) |
Education in Steamboat
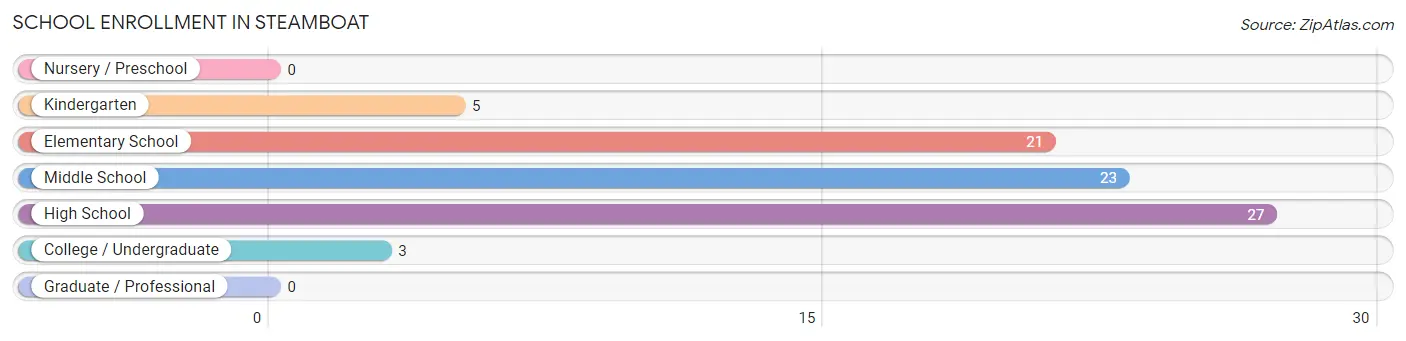
School Enrollment in Steamboat
The most common levels of schooling among the 79 students in Steamboat are high school (27 | 34.2%), middle school (23 | 29.1%), and elementary school (21 | 26.6%).
| School Level | # Students | % Students |
| Nursery / Preschool | 0 | 0.0% |
| Kindergarten | 5 | 6.3% |
| Elementary School | 21 | 26.6% |
| Middle School | 23 | 29.1% |
| High School | 27 | 34.2% |
| College / Undergraduate | 3 | 3.8% |
| Graduate / Professional | 0 | 0.0% |
| Total | 79 | 100.0% |
School Enrollment by Age by Funding Source in Steamboat
Out of a total of 79 students who are enrolled in schools in Steamboat, 7 (8.9%) attend a private institution, while the remaining 72 (91.1%) are enrolled in public schools. The age group of 35 years and over has the highest likelihood of being enrolled in private schools, with 3 (100.0% in the age bracket) enrolled. Conversely, the age group of 10 to 14 year olds has the lowest likelihood of being enrolled in a private school, with 23 (100.0% in the age bracket) attending a public institution.
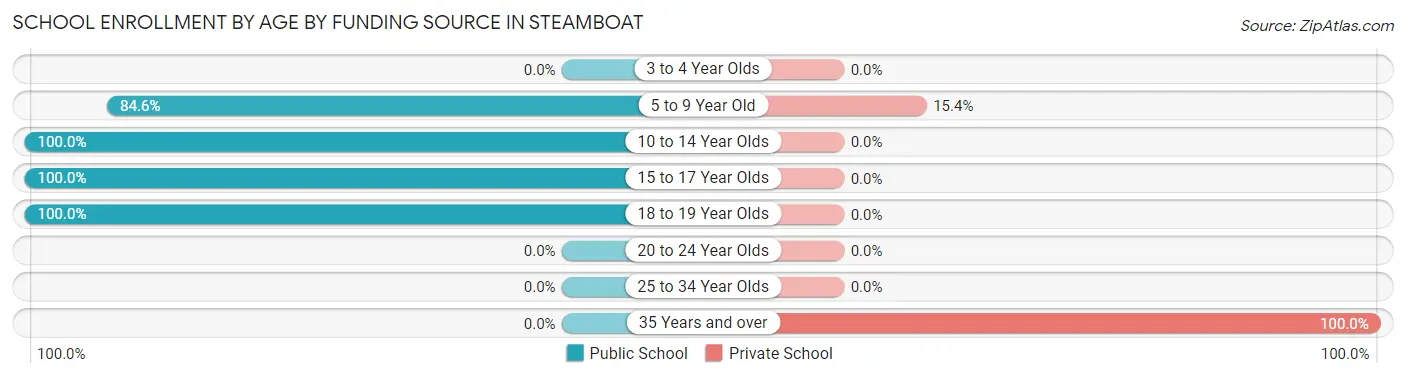
| Age Bracket | Public School | Private School |
| 3 to 4 Year Olds | 0 (0.0%) | 0 (0.0%) |
| 5 to 9 Year Old | 22 (84.6%) | 4 (15.4%) |
| 10 to 14 Year Olds | 23 (100.0%) | 0 (0.0%) |
| 15 to 17 Year Olds | 16 (100.0%) | 0 (0.0%) |
| 18 to 19 Year Olds | 11 (100.0%) | 0 (0.0%) |
| 20 to 24 Year Olds | 0 (0.0%) | 0 (0.0%) |
| 25 to 34 Year Olds | 0 (0.0%) | 0 (0.0%) |
| 35 Years and over | 0 (0.0%) | 3 (100.0%) |
| Total | 72 (91.1%) | 7 (8.9%) |
Educational Attainment by Field of Study in Steamboat
, and science & technology (2 | 100.0%) are the most common fields of study among 2 individuals in Steamboat who have obtained a bachelor's degree or higher.
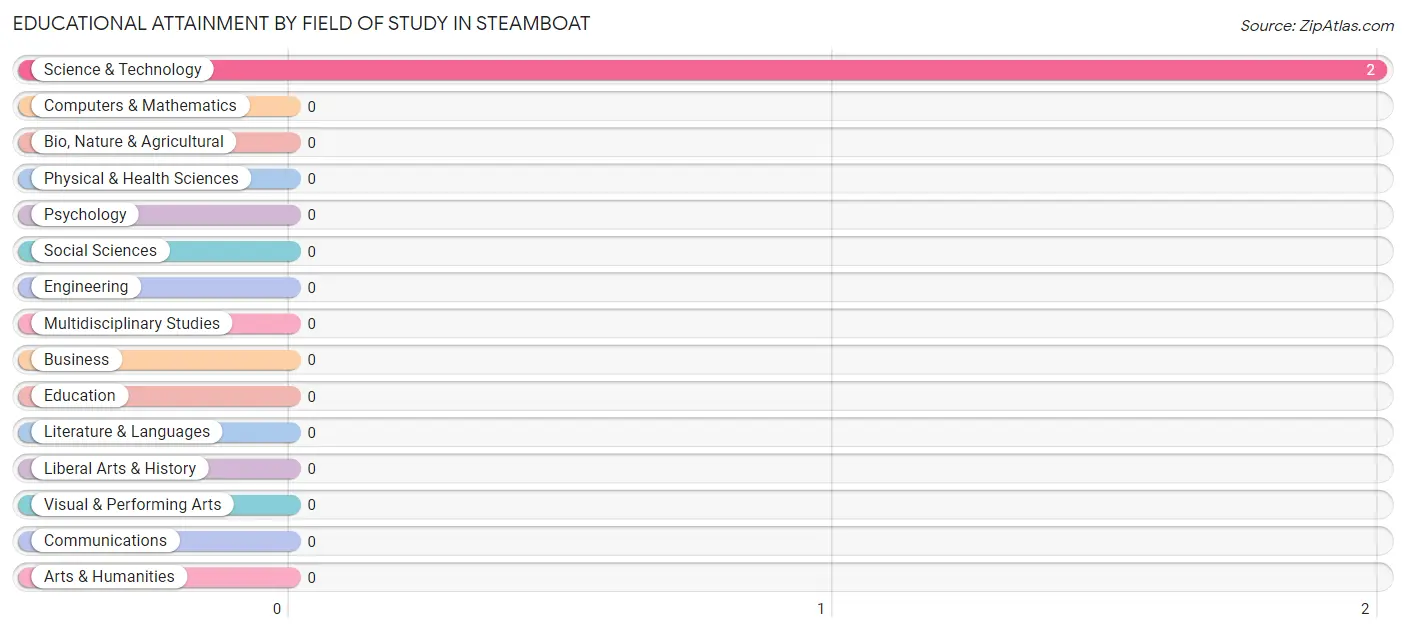
| Field of Study | # Graduates | % Graduates |
| Computers & Mathematics | 0 | 0.0% |
| Bio, Nature & Agricultural | 0 | 0.0% |
| Physical & Health Sciences | 0 | 0.0% |
| Psychology | 0 | 0.0% |
| Social Sciences | 0 | 0.0% |
| Engineering | 0 | 0.0% |
| Multidisciplinary Studies | 0 | 0.0% |
| Science & Technology | 2 | 100.0% |
| Business | 0 | 0.0% |
| Education | 0 | 0.0% |
| Literature & Languages | 0 | 0.0% |
| Liberal Arts & History | 0 | 0.0% |
| Visual & Performing Arts | 0 | 0.0% |
| Communications | 0 | 0.0% |
| Arts & Humanities | 0 | 0.0% |
| Total | 2 | 100.0% |
Transportation & Commute in Steamboat
Vehicle Availability by Sex in Steamboat
The most prevalent vehicle ownership categories in Steamboat are males with 1 vehicle (27, accounting for 45.0%) and females with 1 vehicle (13, making up 128.6%).
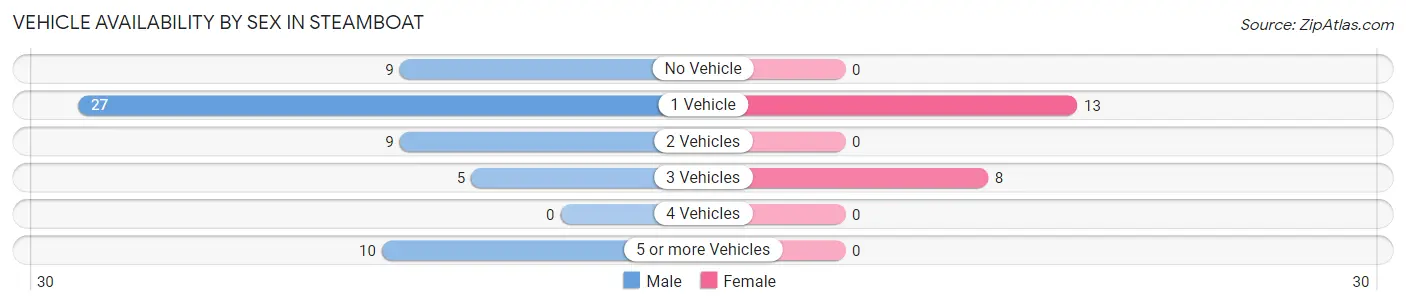
| Vehicles Available | Male | Female |
| No Vehicle | 9 (15.0%) | 0 (0.0%) |
| 1 Vehicle | 27 (45.0%) | 13 (61.9%) |
| 2 Vehicles | 9 (15.0%) | 0 (0.0%) |
| 3 Vehicles | 5 (8.3%) | 8 (38.1%) |
| 4 Vehicles | 0 (0.0%) | 0 (0.0%) |
| 5 or more Vehicles | 10 (16.7%) | 0 (0.0%) |
| Total | 60 (100.0%) | 21 (100.0%) |
Commute Time in Steamboat
The most frequently occuring commute durations in Steamboat are 5 to 9 minutes (15 commuters, 18.5%), 15 to 19 minutes (15 commuters, 18.5%), and 30 to 34 minutes (14 commuters, 17.3%).
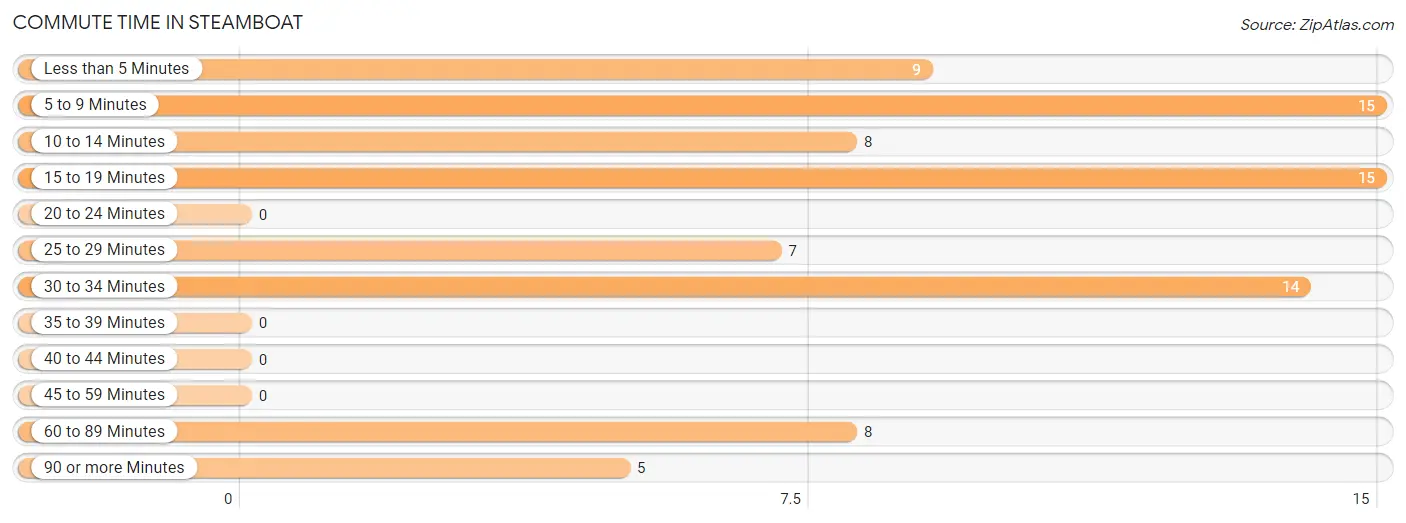
| Commute Time | # Commuters | % Commuters |
| Less than 5 Minutes | 9 | 11.1% |
| 5 to 9 Minutes | 15 | 18.5% |
| 10 to 14 Minutes | 8 | 9.9% |
| 15 to 19 Minutes | 15 | 18.5% |
| 20 to 24 Minutes | 0 | 0.0% |
| 25 to 29 Minutes | 7 | 8.6% |
| 30 to 34 Minutes | 14 | 17.3% |
| 35 to 39 Minutes | 0 | 0.0% |
| 40 to 44 Minutes | 0 | 0.0% |
| 45 to 59 Minutes | 0 | 0.0% |
| 60 to 89 Minutes | 8 | 9.9% |
| 90 or more Minutes | 5 | 6.2% |
Commute Time by Sex in Steamboat
The most common commute times in Steamboat are 15 to 19 minutes (15 commuters, 25.0%) for males and 60 to 89 minutes (8 commuters, 38.1%) for females.
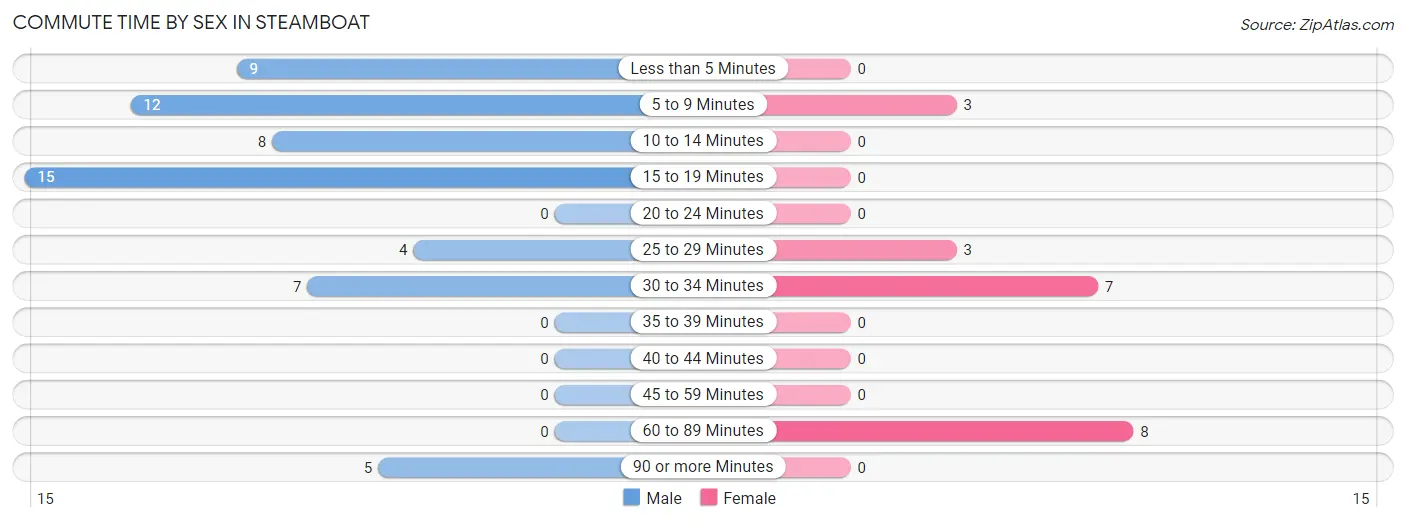
| Commute Time | Male | Female |
| Less than 5 Minutes | 9 (15.0%) | 0 (0.0%) |
| 5 to 9 Minutes | 12 (20.0%) | 3 (14.3%) |
| 10 to 14 Minutes | 8 (13.3%) | 0 (0.0%) |
| 15 to 19 Minutes | 15 (25.0%) | 0 (0.0%) |
| 20 to 24 Minutes | 0 (0.0%) | 0 (0.0%) |
| 25 to 29 Minutes | 4 (6.7%) | 3 (14.3%) |
| 30 to 34 Minutes | 7 (11.7%) | 7 (33.3%) |
| 35 to 39 Minutes | 0 (0.0%) | 0 (0.0%) |
| 40 to 44 Minutes | 0 (0.0%) | 0 (0.0%) |
| 45 to 59 Minutes | 0 (0.0%) | 0 (0.0%) |
| 60 to 89 Minutes | 0 (0.0%) | 8 (38.1%) |
| 90 or more Minutes | 5 (8.3%) | 0 (0.0%) |
Time of Departure to Work by Sex in Steamboat
The most frequent times of departure to work in Steamboat are 7:30 AM to 7:59 AM (29, 48.3%) for males and 6:30 AM to 6:59 AM (14, 66.7%) for females.
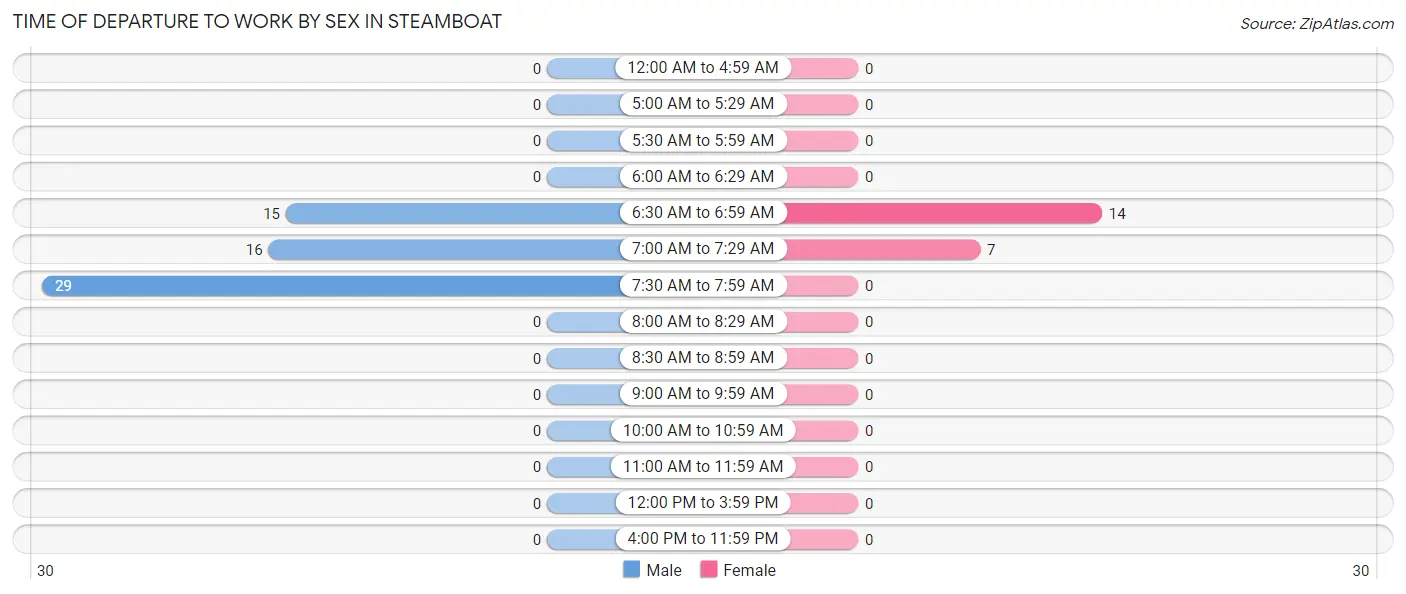
| Time of Departure | Male | Female |
| 12:00 AM to 4:59 AM | 0 (0.0%) | 0 (0.0%) |
| 5:00 AM to 5:29 AM | 0 (0.0%) | 0 (0.0%) |
| 5:30 AM to 5:59 AM | 0 (0.0%) | 0 (0.0%) |
| 6:00 AM to 6:29 AM | 0 (0.0%) | 0 (0.0%) |
| 6:30 AM to 6:59 AM | 15 (25.0%) | 14 (66.7%) |
| 7:00 AM to 7:29 AM | 16 (26.7%) | 7 (33.3%) |
| 7:30 AM to 7:59 AM | 29 (48.3%) | 0 (0.0%) |
| 8:00 AM to 8:29 AM | 0 (0.0%) | 0 (0.0%) |
| 8:30 AM to 8:59 AM | 0 (0.0%) | 0 (0.0%) |
| 9:00 AM to 9:59 AM | 0 (0.0%) | 0 (0.0%) |
| 10:00 AM to 10:59 AM | 0 (0.0%) | 0 (0.0%) |
| 11:00 AM to 11:59 AM | 0 (0.0%) | 0 (0.0%) |
| 12:00 PM to 3:59 PM | 0 (0.0%) | 0 (0.0%) |
| 4:00 PM to 11:59 PM | 0 (0.0%) | 0 (0.0%) |
| Total | 60 (100.0%) | 21 (100.0%) |
Housing Occupancy in Steamboat
Occupancy by Ownership in Steamboat
Of the total 122 dwellings in Steamboat, owner-occupied units account for 113 (92.6%), while renter-occupied units make up 9 (7.4%).
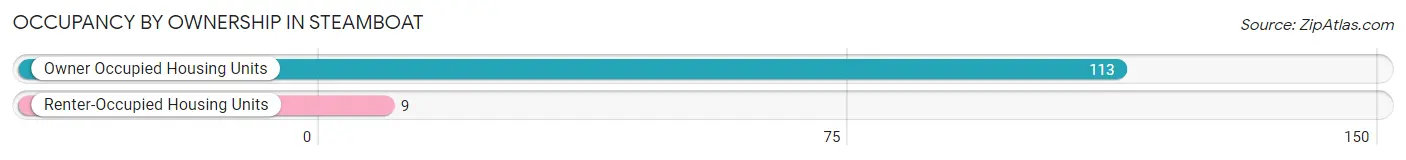
| Occupancy | # Housing Units | % Housing Units |
| Owner Occupied Housing Units | 113 | 92.6% |
| Renter-Occupied Housing Units | 9 | 7.4% |
| Total Occupied Housing Units | 122 | 100.0% |
Occupancy by Household Size in Steamboat
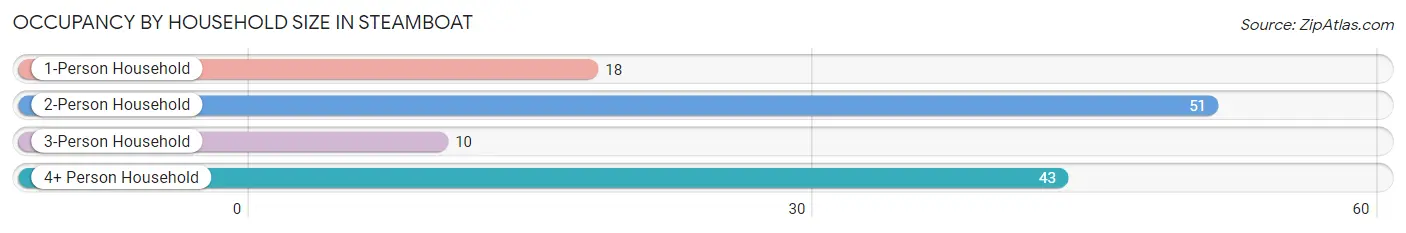
| Household Size | # Housing Units | % Housing Units |
| 1-Person Household | 18 | 14.7% |
| 2-Person Household | 51 | 41.8% |
| 3-Person Household | 10 | 8.2% |
| 4+ Person Household | 43 | 35.2% |
| Total Housing Units | 122 | 100.0% |
Occupancy by Ownership by Household Size in Steamboat
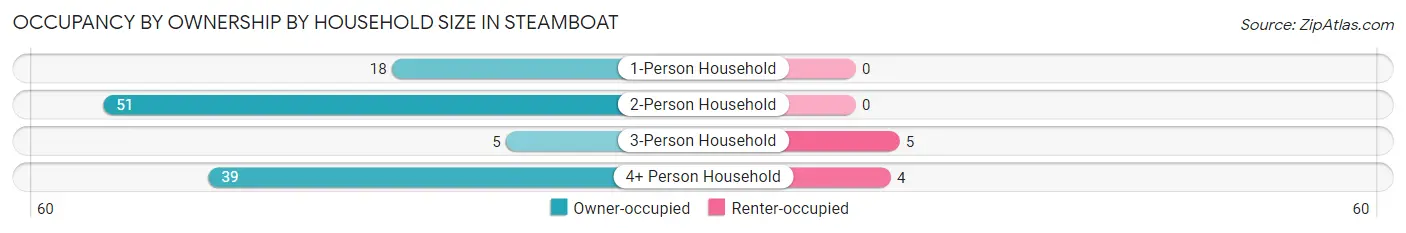
| Household Size | Owner-occupied | Renter-occupied |
| 1-Person Household | 18 (100.0%) | 0 (0.0%) |
| 2-Person Household | 51 (100.0%) | 0 (0.0%) |
| 3-Person Household | 5 (50.0%) | 5 (50.0%) |
| 4+ Person Household | 39 (90.7%) | 4 (9.3%) |
| Total Housing Units | 113 (92.6%) | 9 (7.4%) |
Occupancy by Educational Attainment in Steamboat
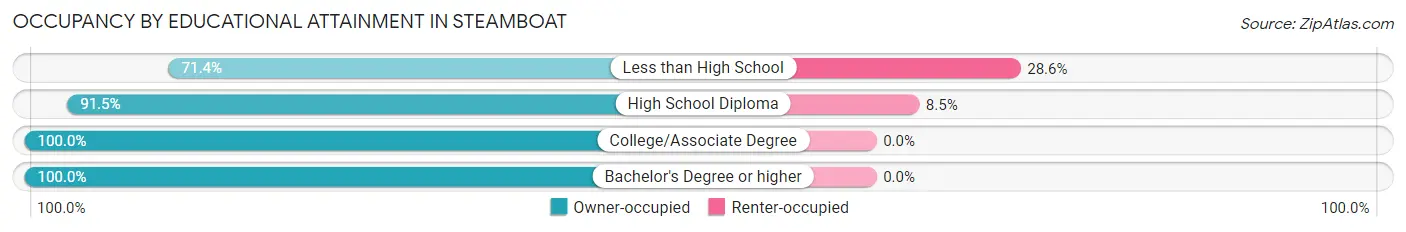
| Household Size | Owner-occupied | Renter-occupied |
| Less than High School | 10 (71.4%) | 4 (28.6%) |
| High School Diploma | 54 (91.5%) | 5 (8.5%) |
| College/Associate Degree | 47 (100.0%) | 0 (0.0%) |
| Bachelor's Degree or higher | 2 (100.0%) | 0 (0.0%) |
Occupancy by Age of Householder in Steamboat
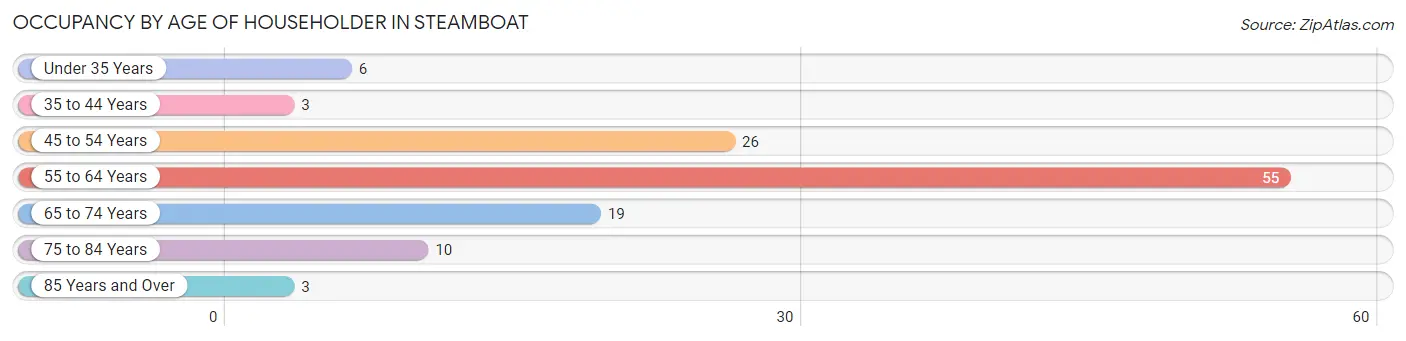
| Age Bracket | # Households | % Households |
| Under 35 Years | 6 | 4.9% |
| 35 to 44 Years | 3 | 2.5% |
| 45 to 54 Years | 26 | 21.3% |
| 55 to 64 Years | 55 | 45.1% |
| 65 to 74 Years | 19 | 15.6% |
| 75 to 84 Years | 10 | 8.2% |
| 85 Years and Over | 3 | 2.5% |
| Total | 122 | 100.0% |
Housing Finances in Steamboat
Median Income by Occupancy in Steamboat
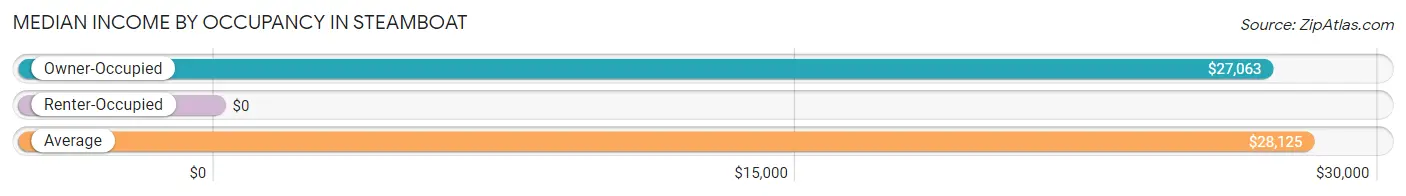
| Occupancy Type | # Households | Median Income |
| Owner-Occupied | 113 (92.6%) | $27,063 |
| Renter-Occupied | 9 (7.4%) | $0 |
| Average | 122 (100.0%) | $28,125 |
Occupancy by Householder Income Bracket in Steamboat
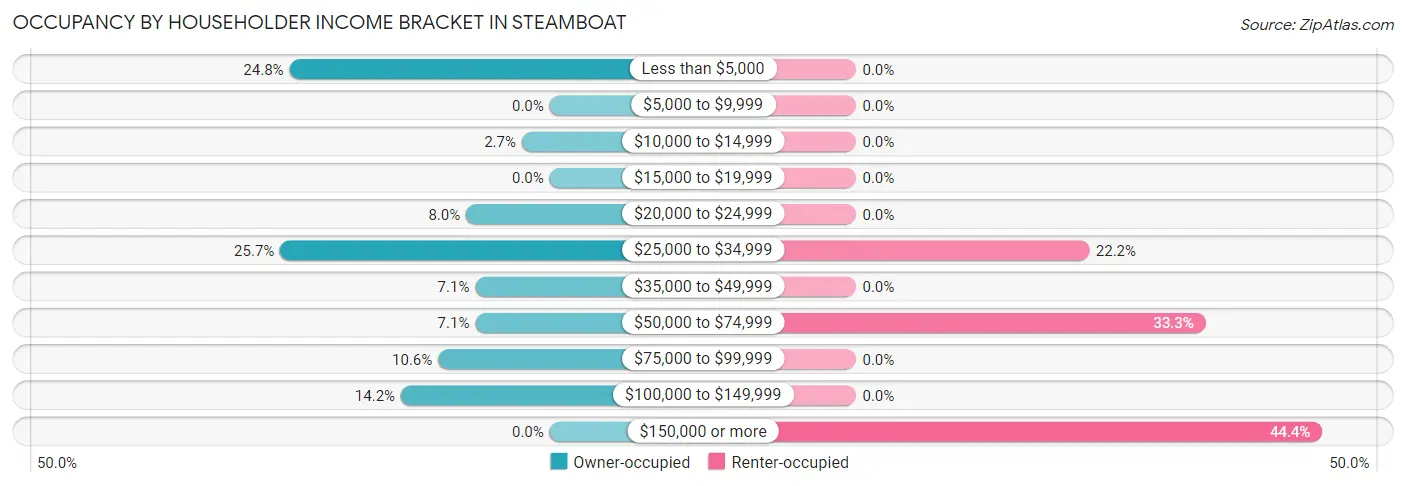
| Income Bracket | Owner-occupied | Renter-occupied |
| Less than $5,000 | 28 (24.8%) | 0 (0.0%) |
| $5,000 to $9,999 | 0 (0.0%) | 0 (0.0%) |
| $10,000 to $14,999 | 3 (2.6%) | 0 (0.0%) |
| $15,000 to $19,999 | 0 (0.0%) | 0 (0.0%) |
| $20,000 to $24,999 | 9 (8.0%) | 0 (0.0%) |
| $25,000 to $34,999 | 29 (25.7%) | 2 (22.2%) |
| $35,000 to $49,999 | 8 (7.1%) | 0 (0.0%) |
| $50,000 to $74,999 | 8 (7.1%) | 3 (33.3%) |
| $75,000 to $99,999 | 12 (10.6%) | 0 (0.0%) |
| $100,000 to $149,999 | 16 (14.2%) | 0 (0.0%) |
| $150,000 or more | 0 (0.0%) | 4 (44.4%) |
| Total | 113 (100.0%) | 9 (100.0%) |
Monthly Housing Cost Tiers in Steamboat
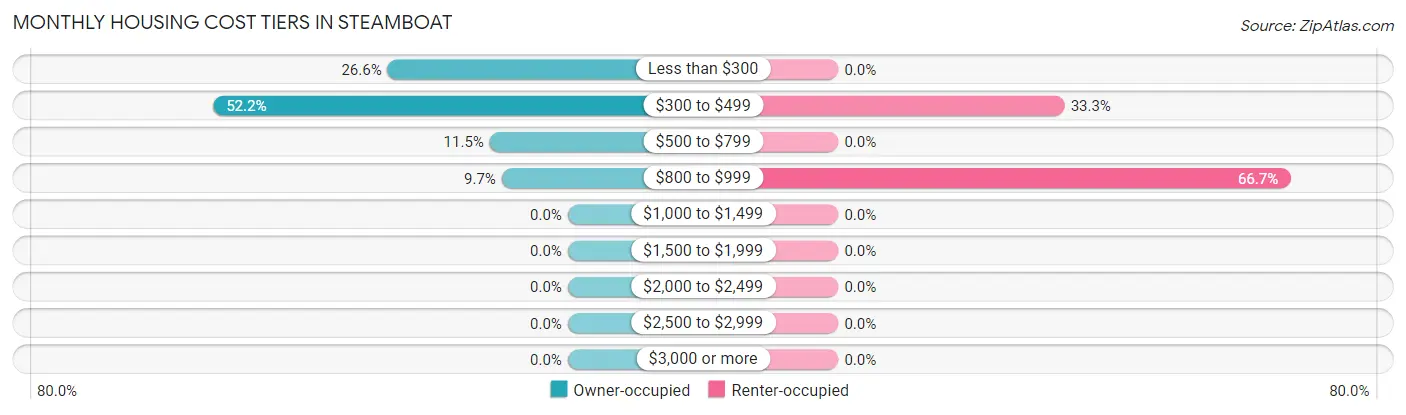
| Monthly Cost | Owner-occupied | Renter-occupied |
| Less than $300 | 30 (26.6%) | 0 (0.0%) |
| $300 to $499 | 59 (52.2%) | 3 (33.3%) |
| $500 to $799 | 13 (11.5%) | 0 (0.0%) |
| $800 to $999 | 11 (9.7%) | 6 (66.7%) |
| $1,000 to $1,499 | 0 (0.0%) | 0 (0.0%) |
| $1,500 to $1,999 | 0 (0.0%) | 0 (0.0%) |
| $2,000 to $2,499 | 0 (0.0%) | 0 (0.0%) |
| $2,500 to $2,999 | 0 (0.0%) | 0 (0.0%) |
| $3,000 or more | 0 (0.0%) | 0 (0.0%) |
| Total | 113 (100.0%) | 9 (100.0%) |
Physical Housing Characteristics in Steamboat
Housing Structures in Steamboat
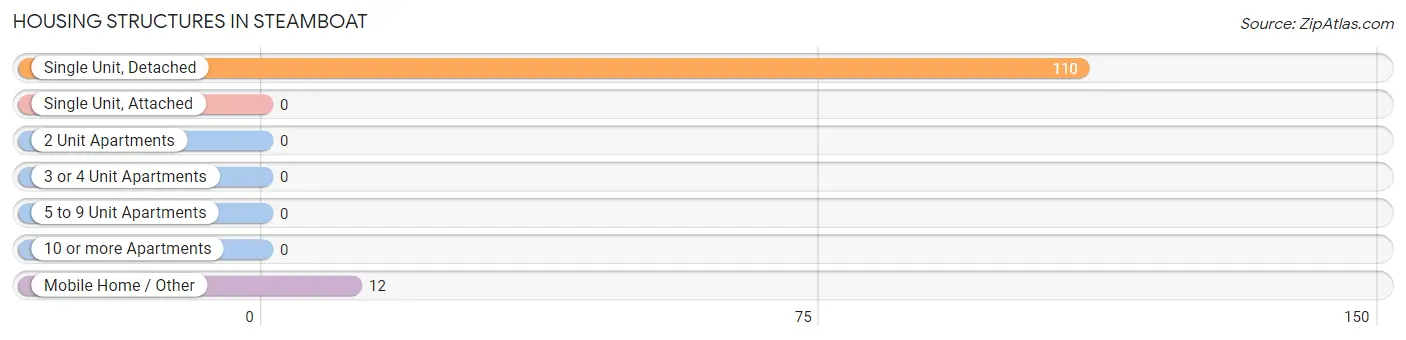
| Structure Type | # Housing Units | % Housing Units |
| Single Unit, Detached | 110 | 90.2% |
| Single Unit, Attached | 0 | 0.0% |
| 2 Unit Apartments | 0 | 0.0% |
| 3 or 4 Unit Apartments | 0 | 0.0% |
| 5 to 9 Unit Apartments | 0 | 0.0% |
| 10 or more Apartments | 0 | 0.0% |
| Mobile Home / Other | 12 | 9.8% |
| Total | 122 | 100.0% |
Housing Structures by Occupancy in Steamboat
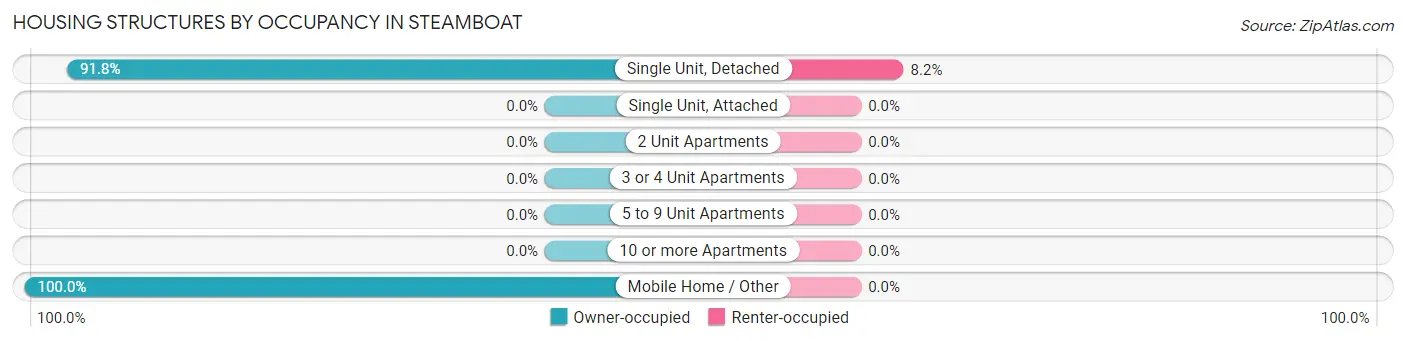
| Structure Type | Owner-occupied | Renter-occupied |
| Single Unit, Detached | 101 (91.8%) | 9 (8.2%) |
| Single Unit, Attached | 0 (0.0%) | 0 (0.0%) |
| 2 Unit Apartments | 0 (0.0%) | 0 (0.0%) |
| 3 or 4 Unit Apartments | 0 (0.0%) | 0 (0.0%) |
| 5 to 9 Unit Apartments | 0 (0.0%) | 0 (0.0%) |
| 10 or more Apartments | 0 (0.0%) | 0 (0.0%) |
| Mobile Home / Other | 12 (100.0%) | 0 (0.0%) |
| Total | 113 (92.6%) | 9 (7.4%) |
Housing Structures by Number of Rooms in Steamboat
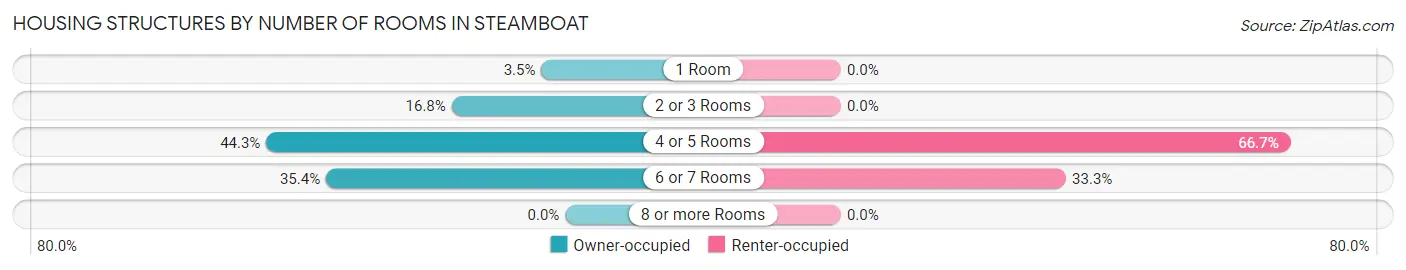
| Number of Rooms | Owner-occupied | Renter-occupied |
| 1 Room | 4 (3.5%) | 0 (0.0%) |
| 2 or 3 Rooms | 19 (16.8%) | 0 (0.0%) |
| 4 or 5 Rooms | 50 (44.3%) | 6 (66.7%) |
| 6 or 7 Rooms | 40 (35.4%) | 3 (33.3%) |
| 8 or more Rooms | 0 (0.0%) | 0 (0.0%) |
| Total | 113 (100.0%) | 9 (100.0%) |
Housing Structure by Heating Type in Steamboat

| Heating Type | Owner-occupied | Renter-occupied |
| Utility Gas | 0 (0.0%) | 0 (0.0%) |
| Bottled, Tank, or LP Gas | 4 (3.5%) | 6 (66.7%) |
| Electricity | 16 (14.2%) | 0 (0.0%) |
| Fuel Oil or Kerosene | 0 (0.0%) | 0 (0.0%) |
| Coal or Coke | 0 (0.0%) | 0 (0.0%) |
| All other Fuels | 93 (82.3%) | 3 (33.3%) |
| No Fuel Used | 0 (0.0%) | 0 (0.0%) |
| Total | 113 (100.0%) | 9 (100.0%) |
Household Vehicle Usage in Steamboat
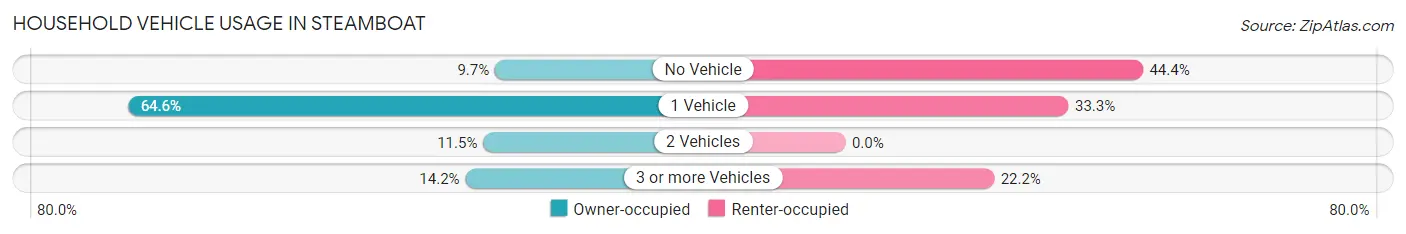
| Vehicles per Household | Owner-occupied | Renter-occupied |
| No Vehicle | 11 (9.7%) | 4 (44.4%) |
| 1 Vehicle | 73 (64.6%) | 3 (33.3%) |
| 2 Vehicles | 13 (11.5%) | 0 (0.0%) |
| 3 or more Vehicles | 16 (14.2%) | 2 (22.2%) |
| Total | 113 (100.0%) | 9 (100.0%) |
Real Estate & Mortgages in Steamboat
Real Estate and Mortgage Overview in Steamboat
| Characteristic | Without Mortgage | With Mortgage |
| Housing Units | 113 | 0 |
| Median Property Value | - | - |
| Median Household Income | $27,063 | $0 |
| Monthly Housing Costs | $369 | $0 |
| Real Estate Taxes | - | - |
Property Value by Mortgage Status in Steamboat
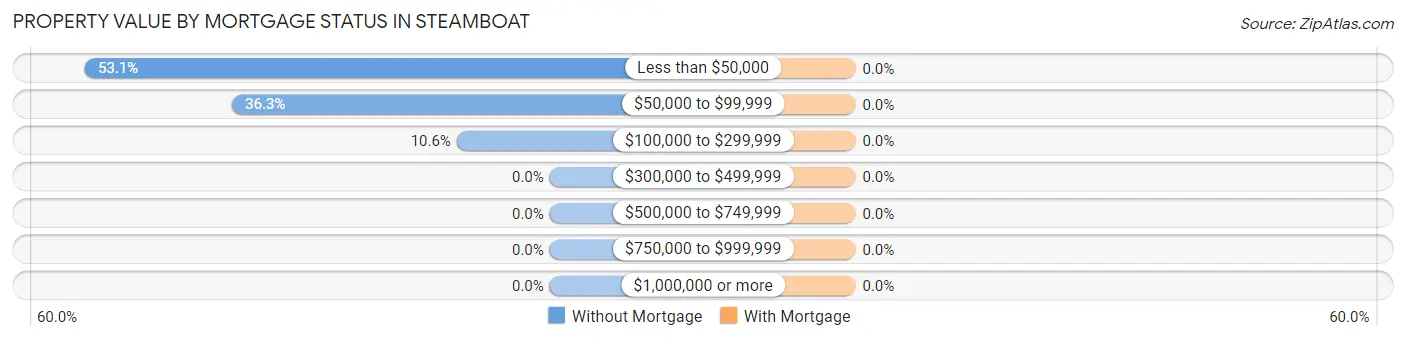
| Property Value | Without Mortgage | With Mortgage |
| Less than $50,000 | 60 (53.1%) | 0 (0.0%) |
| $50,000 to $99,999 | 41 (36.3%) | 0 (0.0%) |
| $100,000 to $299,999 | 12 (10.6%) | 0 (0.0%) |
| $300,000 to $499,999 | 0 (0.0%) | 0 (0.0%) |
| $500,000 to $749,999 | 0 (0.0%) | 0 (0.0%) |
| $750,000 to $999,999 | 0 (0.0%) | 0 (0.0%) |
| $1,000,000 or more | 0 (0.0%) | 0 (0.0%) |
| Total | 113 (100.0%) | 0 (0.0%) |
Household Income by Mortgage Status in Steamboat
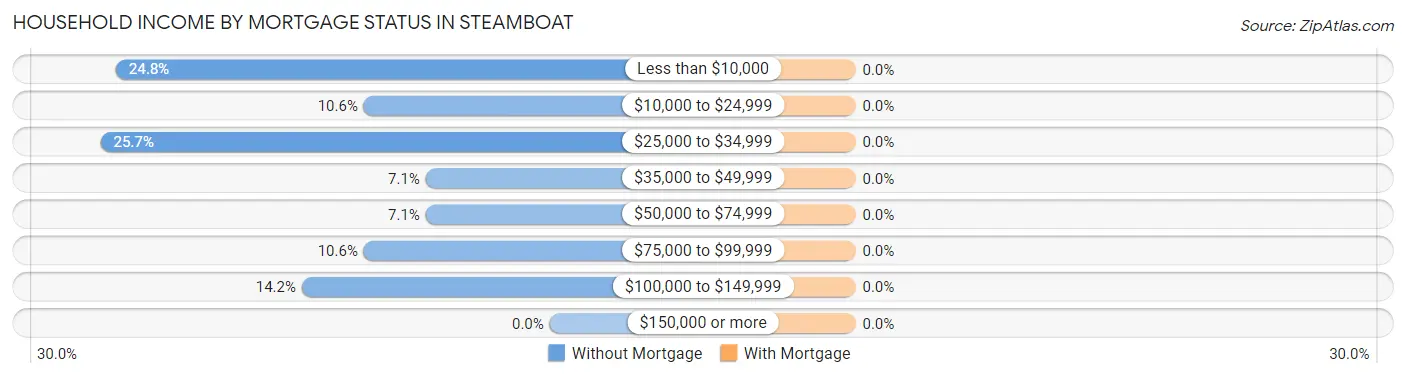
| Household Income | Without Mortgage | With Mortgage |
| Less than $10,000 | 28 (24.8%) | 0 (0.0%) |
| $10,000 to $24,999 | 12 (10.6%) | 0 (0.0%) |
| $25,000 to $34,999 | 29 (25.7%) | 0 (0.0%) |
| $35,000 to $49,999 | 8 (7.1%) | 0 (0.0%) |
| $50,000 to $74,999 | 8 (7.1%) | 0 (0.0%) |
| $75,000 to $99,999 | 12 (10.6%) | 0 (0.0%) |
| $100,000 to $149,999 | 16 (14.2%) | 0 (0.0%) |
| $150,000 or more | 0 (0.0%) | 0 (0.0%) |
| Total | 113 (100.0%) | 0 (0.0%) |
Property Value to Household Income Ratio in Steamboat
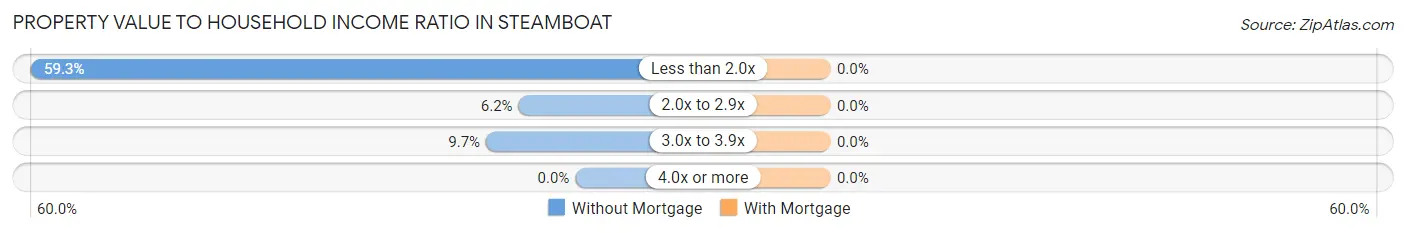
| Value-to-Income Ratio | Without Mortgage | With Mortgage |
| Less than 2.0x | 67 (59.3%) | 0 (0.0%) |
| 2.0x to 2.9x | 7 (6.2%) | 0 (0.0%) |
| 3.0x to 3.9x | 11 (9.7%) | 0 (0.0%) |
| 4.0x or more | 0 (0.0%) | 0 (0.0%) |
| Total | 113 (100.0%) | 0 (0.0%) |
Real Estate Taxes by Mortgage Status in Steamboat
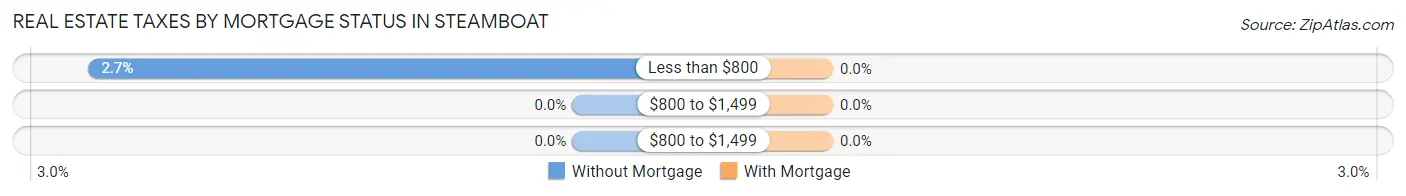
| Property Taxes | Without Mortgage | With Mortgage |
| Less than $800 | 3 (2.6%) | 0 (0.0%) |
| $800 to $1,499 | 0 (0.0%) | 0 (0.0%) |
| $800 to $1,499 | 0 (0.0%) | 0 (0.0%) |
| Total | 113 (100.0%) | 0 (0.0%) |
Health & Disability in Steamboat
Health Insurance Coverage by Age in Steamboat
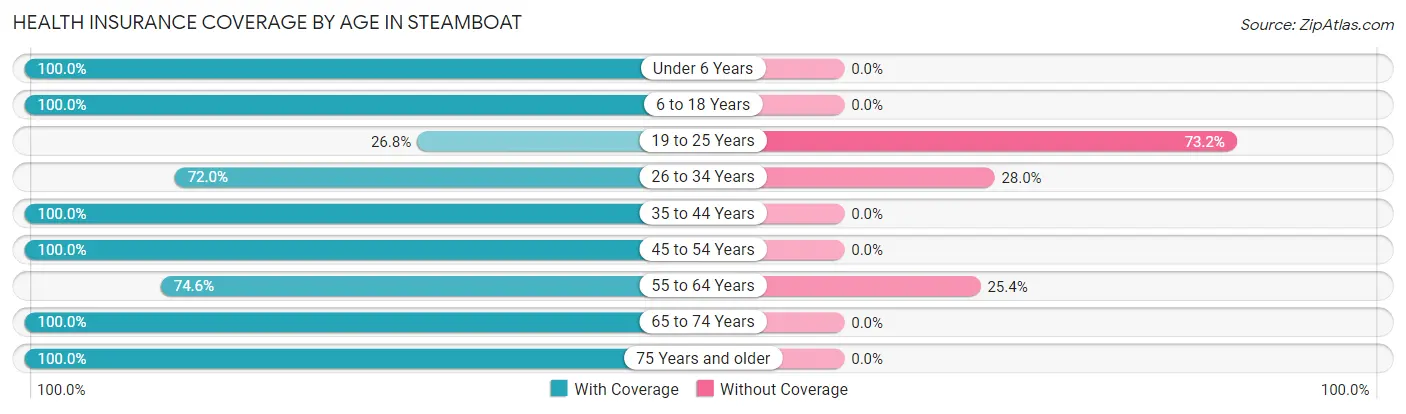
| Age Bracket | With Coverage | Without Coverage |
| Under 6 Years | 15 (100.0%) | 0 (0.0%) |
| 6 to 18 Years | 69 (100.0%) | 0 (0.0%) |
| 19 to 25 Years | 11 (26.8%) | 30 (73.2%) |
| 26 to 34 Years | 36 (72.0%) | 14 (28.0%) |
| 35 to 44 Years | 72 (100.0%) | 0 (0.0%) |
| 45 to 54 Years | 60 (100.0%) | 0 (0.0%) |
| 55 to 64 Years | 47 (74.6%) | 16 (25.4%) |
| 65 to 74 Years | 31 (100.0%) | 0 (0.0%) |
| 75 Years and older | 16 (100.0%) | 0 (0.0%) |
| Total | 357 (85.6%) | 60 (14.4%) |
Health Insurance Coverage by Citizenship Status in Steamboat
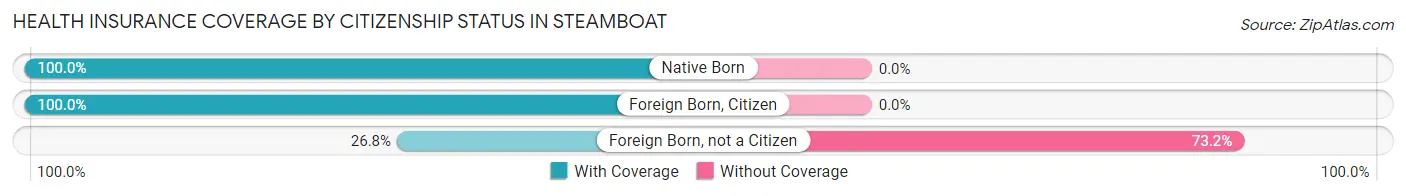
| Citizenship Status | With Coverage | Without Coverage |
| Native Born | 15 (100.0%) | 0 (0.0%) |
| Foreign Born, Citizen | 69 (100.0%) | 0 (0.0%) |
| Foreign Born, not a Citizen | 11 (26.8%) | 30 (73.2%) |
Health Insurance Coverage by Household Income in Steamboat
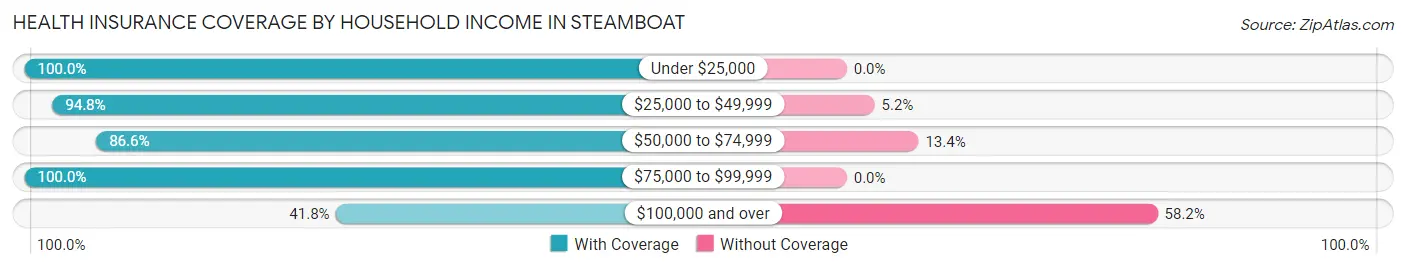
| Household Income | With Coverage | Without Coverage |
| Under $25,000 | 112 (100.0%) | 0 (0.0%) |
| $25,000 to $49,999 | 91 (94.8%) | 5 (5.2%) |
| $50,000 to $74,999 | 58 (86.6%) | 9 (13.4%) |
| $75,000 to $99,999 | 63 (100.0%) | 0 (0.0%) |
| $100,000 and over | 33 (41.8%) | 46 (58.2%) |
Public vs Private Health Insurance Coverage by Age in Steamboat
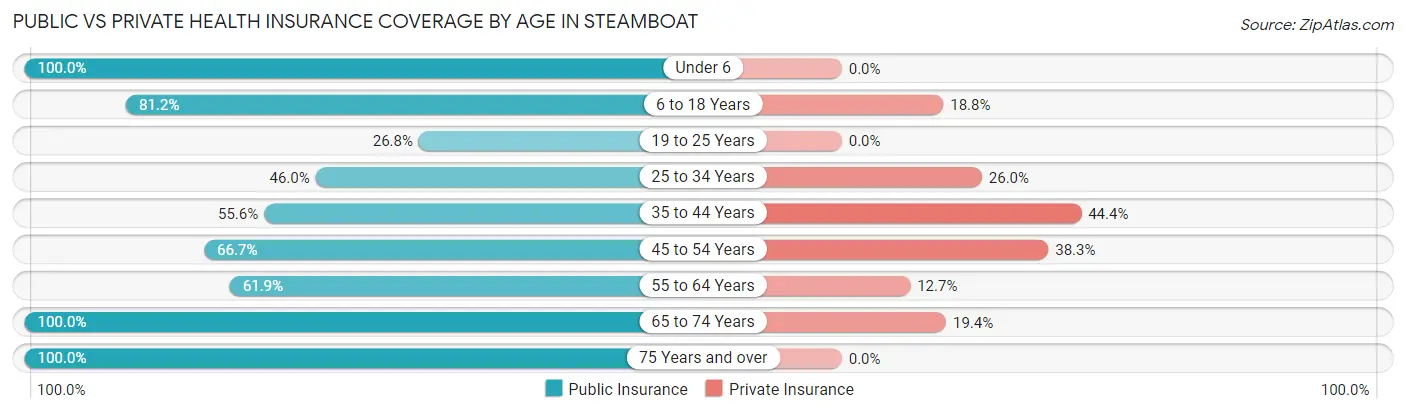
| Age Bracket | Public Insurance | Private Insurance |
| Under 6 | 15 (100.0%) | 0 (0.0%) |
| 6 to 18 Years | 56 (81.2%) | 13 (18.8%) |
| 19 to 25 Years | 11 (26.8%) | 0 (0.0%) |
| 25 to 34 Years | 23 (46.0%) | 13 (26.0%) |
| 35 to 44 Years | 40 (55.6%) | 32 (44.4%) |
| 45 to 54 Years | 40 (66.7%) | 23 (38.3%) |
| 55 to 64 Years | 39 (61.9%) | 8 (12.7%) |
| 65 to 74 Years | 31 (100.0%) | 6 (19.4%) |
| 75 Years and over | 16 (100.0%) | 0 (0.0%) |
| Total | 271 (65.0%) | 95 (22.8%) |
Disability Status by Sex by Age in Steamboat
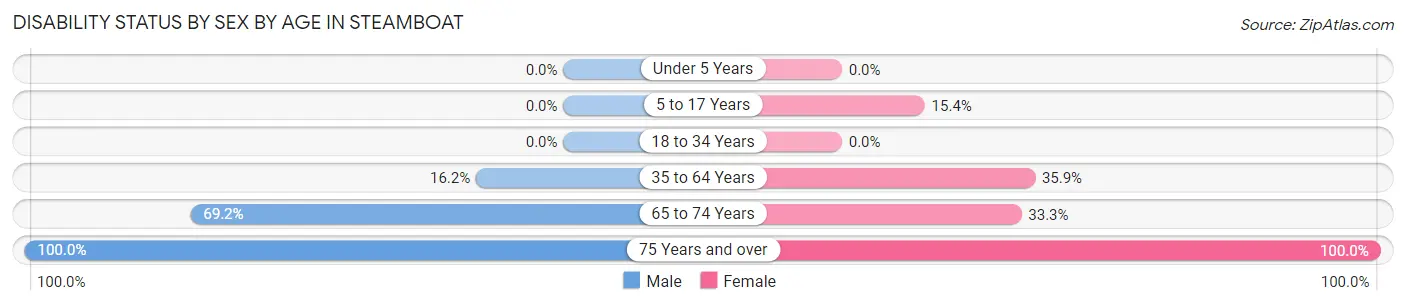
| Age Bracket | Male | Female |
| Under 5 Years | 0 (0.0%) | 0 (0.0%) |
| 5 to 17 Years | 0 (0.0%) | 6 (15.4%) |
| 18 to 34 Years | 0 (0.0%) | 0 (0.0%) |
| 35 to 64 Years | 23 (16.2%) | 19 (35.8%) |
| 65 to 74 Years | 9 (69.2%) | 6 (33.3%) |
| 75 Years and over | 7 (100.0%) | 9 (100.0%) |
Disability Class by Sex by Age in Steamboat
Disability Class: Hearing Difficulty
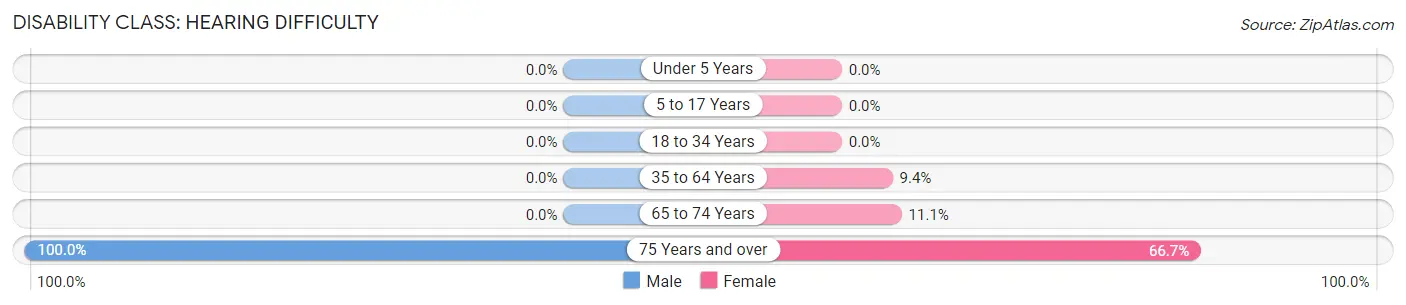
| Age Bracket | Male | Female |
| Under 5 Years | 0 (0.0%) | 0 (0.0%) |
| 5 to 17 Years | 0 (0.0%) | 0 (0.0%) |
| 18 to 34 Years | 0 (0.0%) | 0 (0.0%) |
| 35 to 64 Years | 0 (0.0%) | 5 (9.4%) |
| 65 to 74 Years | 0 (0.0%) | 2 (11.1%) |
| 75 Years and over | 7 (100.0%) | 6 (66.7%) |
Disability Class: Vision Difficulty
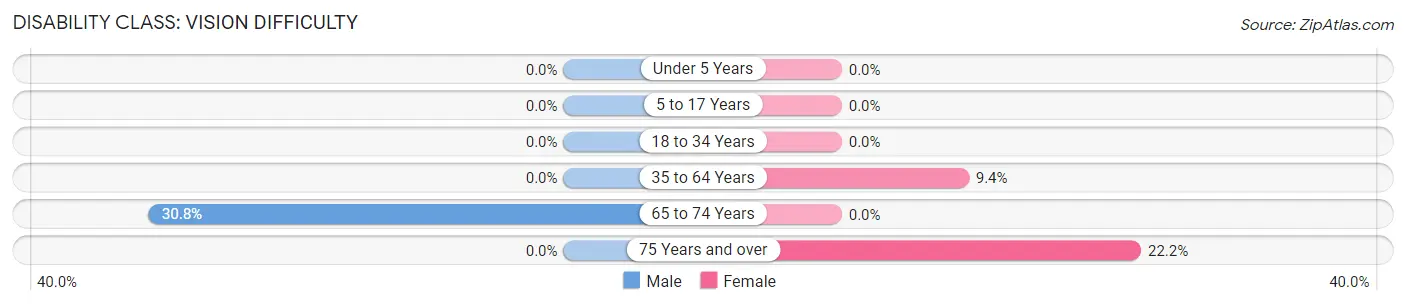
| Age Bracket | Male | Female |
| Under 5 Years | 0 (0.0%) | 0 (0.0%) |
| 5 to 17 Years | 0 (0.0%) | 0 (0.0%) |
| 18 to 34 Years | 0 (0.0%) | 0 (0.0%) |
| 35 to 64 Years | 0 (0.0%) | 5 (9.4%) |
| 65 to 74 Years | 4 (30.8%) | 0 (0.0%) |
| 75 Years and over | 0 (0.0%) | 2 (22.2%) |
Disability Class: Cognitive Difficulty
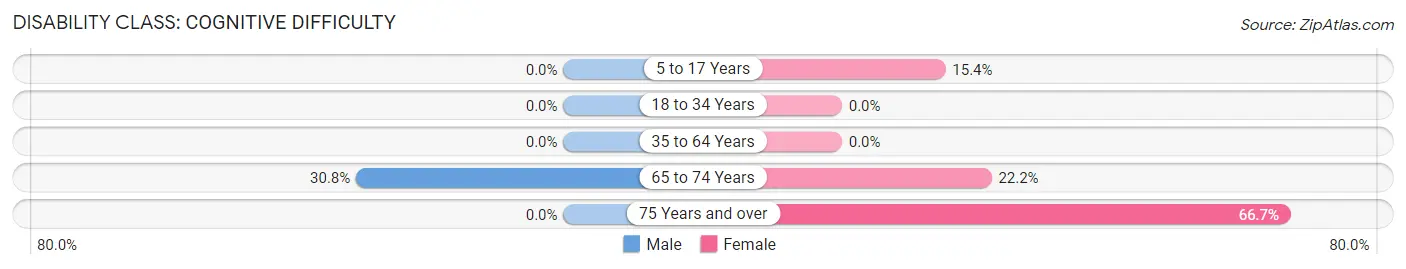
| Age Bracket | Male | Female |
| 5 to 17 Years | 0 (0.0%) | 6 (15.4%) |
| 18 to 34 Years | 0 (0.0%) | 0 (0.0%) |
| 35 to 64 Years | 0 (0.0%) | 0 (0.0%) |
| 65 to 74 Years | 4 (30.8%) | 4 (22.2%) |
| 75 Years and over | 0 (0.0%) | 6 (66.7%) |
Disability Class: Ambulatory Difficulty
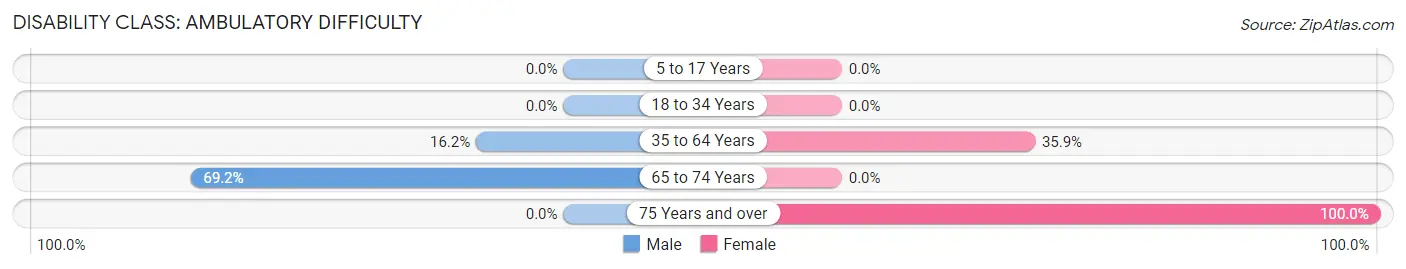
| Age Bracket | Male | Female |
| 5 to 17 Years | 0 (0.0%) | 0 (0.0%) |
| 18 to 34 Years | 0 (0.0%) | 0 (0.0%) |
| 35 to 64 Years | 23 (16.2%) | 19 (35.8%) |
| 65 to 74 Years | 9 (69.2%) | 0 (0.0%) |
| 75 Years and over | 0 (0.0%) | 9 (100.0%) |
Disability Class: Self-Care Difficulty
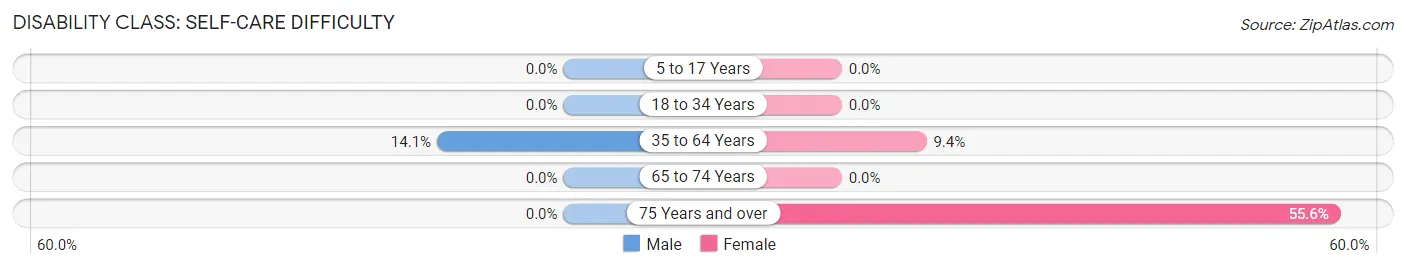
| Age Bracket | Male | Female |
| 5 to 17 Years | 0 (0.0%) | 0 (0.0%) |
| 18 to 34 Years | 0 (0.0%) | 0 (0.0%) |
| 35 to 64 Years | 20 (14.1%) | 5 (9.4%) |
| 65 to 74 Years | 0 (0.0%) | 0 (0.0%) |
| 75 Years and over | 0 (0.0%) | 5 (55.6%) |
Technology Access in Steamboat
Computing Device Access in Steamboat
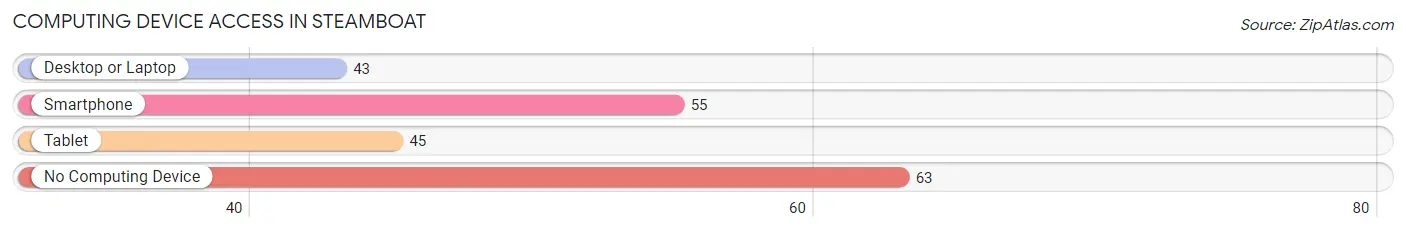
| Device Type | # Households | % Households |
| Desktop or Laptop | 43 | 35.2% |
| Smartphone | 55 | 45.1% |
| Tablet | 45 | 36.9% |
| No Computing Device | 63 | 51.6% |
| Total | 122 | 100.0% |
Internet Access in Steamboat
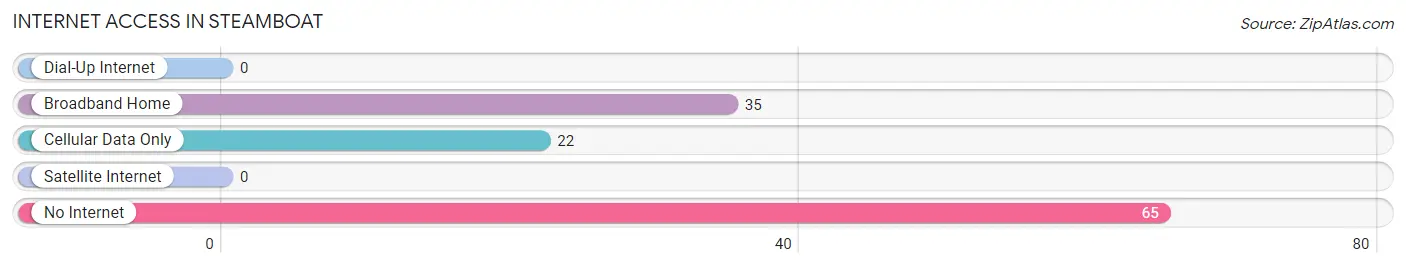
| Internet Type | # Households | % Households |
| Dial-Up Internet | 0 | 0.0% |
| Broadband Home | 35 | 28.7% |
| Cellular Data Only | 22 | 18.0% |
| Satellite Internet | 0 | 0.0% |
| No Internet | 65 | 53.3% |
| Total | 122 | 100.0% |
Steamboat Summary
Steamboat, Arizona is a small unincorporated community located in Yavapai County, Arizona. It is situated in the Verde Valley, approximately 20 miles south of Cottonwood and 25 miles north of Prescott. The community is located in the foothills of the Mingus Mountains, and is surrounded by the Prescott National Forest.
History
The area around Steamboat was first settled in the late 1800s by ranchers and miners. The town was originally known as “Steamboat Springs”, named after the nearby hot springs. The town was officially established in 1883, when the post office was established. The town was renamed “Steamboat” in 1885.
The town was a popular destination for tourists in the early 1900s, due to its hot springs and its proximity to the Grand Canyon. The town was also home to a number of businesses, including a hotel, a general store, a saloon, and a blacksmith shop.
In the early 1900s, the town was also home to a number of mines, including the Steamboat Mine, the Copper Queen Mine, and the Silver King Mine. The mines were all closed by the 1930s, and the town’s population began to decline.
Geography
Steamboat is located in the Verde Valley, in the foothills of the Mingus Mountains. The town is situated at an elevation of 4,890 feet, and is surrounded by the Prescott National Forest. The town is located approximately 20 miles south of Cottonwood and 25 miles north of Prescott.
The climate in Steamboat is semi-arid, with hot summers and mild winters. The average annual temperature is 64°F, and the average annual precipitation is 13.5 inches.
Economy
The economy of Steamboat is largely based on tourism. The town is home to a number of tourist attractions, including the nearby Grand Canyon, the Verde Valley Railroad, and the nearby hot springs. The town is also home to a number of small businesses, including restaurants, shops, and lodging.
Demographics
As of the 2010 census, the population of Steamboat was 1,072. The racial makeup of the town was 94.3% White, 0.7% Native American, 0.3% Asian, 0.2% African American, and 4.5% from other races. The median household income was $37,500, and the median family income was $41,250.
Conclusion
Steamboat, Arizona is a small unincorporated community located in Yavapai County, Arizona. It is situated in the Verde Valley, approximately 20 miles south of Cottonwood and 25 miles north of Prescott. The town was originally established in 1883, and was a popular destination for tourists in the early 1900s. The town’s economy is largely based on tourism, and the population of Steamboat was 1,072 as of the 2010 census.
Common Questions
What is Per Capita Income in Steamboat?
Per Capita income in Steamboat is $17,588.
What is the Median Family Income in Steamboat?
Median Family Income in Steamboat is $41,250.
What is the Median Household income in Steamboat?
Median Household Income in Steamboat is $28,125.
What is Income or Wage Gap in Steamboat?
Income or Wage Gap in Steamboat is 9.8%.
Women in Steamboat earn 90.2 cents for every dollar earned by a man.
What is Inequality or Gini Index in Steamboat?
Inequality or Gini Index in Steamboat is 0.52.
What is the Total Population of Steamboat?
Total Population of Steamboat is 417.
What is the Total Male Population of Steamboat?
Total Male Population of Steamboat is 254.
What is the Total Female Population of Steamboat?
Total Female Population of Steamboat is 163.
What is the Ratio of Males per 100 Females in Steamboat?
There are 155.83 Males per 100 Females in Steamboat.
What is the Ratio of Females per 100 Males in Steamboat?
There are 64.17 Females per 100 Males in Steamboat.
What is the Median Population Age in Steamboat?
Median Population Age in Steamboat is 36.9 Years.
What is the Average Family Size in Steamboat
Average Family Size in Steamboat is 4.1 People.
What is the Average Household Size in Steamboat
Average Household Size in Steamboat is 3.4 People.
How Large is the Labor Force in Steamboat?
There are 127 People in the Labor Forcein in Steamboat.
What is the Percentage of People in the Labor Force in Steamboat?
36.4% of People are in the Labor Force in Steamboat.
What is the Unemployment Rate in Steamboat?
Unemployment Rate in Steamboat is 23.6%.