Iron Station, NC Map & Demographics
Iron Station Map
Iron Station Overview
$23,428
PER CAPITA INCOME
$71,810
AVG FAMILY INCOME
$58,346
AVG HOUSEHOLD INCOME
62.8%
WAGE / INCOME GAP [ % ]
37.2¢/ $1
WAGE / INCOME GAP [ $ ]
0.30
INEQUALITY / GINI INDEX
699
TOTAL POPULATION
374
MALE POPULATION
325
FEMALE POPULATION
115.08
MALES / 100 FEMALES
86.90
FEMALES / 100 MALES
38.6
MEDIAN AGE
3.5
AVG FAMILY SIZE
2.7
AVG HOUSEHOLD SIZE
220
LABOR FORCE [ PEOPLE ]
53.7%
PERCENT IN LABOR FORCE
Iron Station Zip Codes
Iron Station Area Codes
Income in Iron Station
Income Overview in Iron Station
Per Capita Income in Iron Station is $23,428, while median incomes of families and households are $71,810 and $58,346 respectively.
| Characteristic | Number | Measure |
| Per Capita Income | 699 | $23,428 |
| Median Family Income | 176 | $71,810 |
| Mean Family Income | 176 | $76,906 |
| Median Household Income | 263 | $58,346 |
| Mean Household Income | 263 | $60,122 |
| Income Deficit | 176 | $0 |
| Wage / Income Gap (%) | 699 | 62.83% |
| Wage / Income Gap ($) | 699 | 37.17¢ per $1 |
| Gini / Inequality Index | 699 | 0.30 |
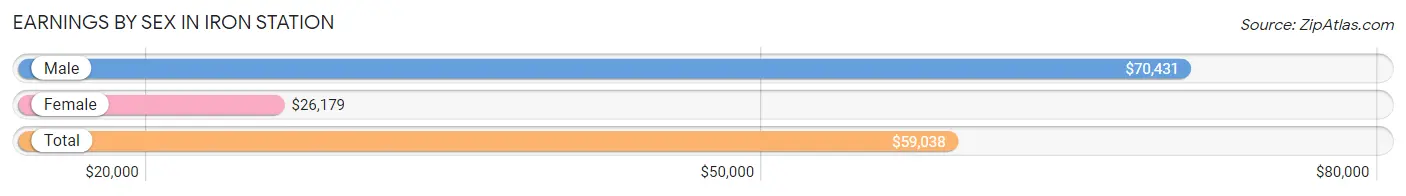
Earnings by Sex in Iron Station
Average Earnings in Iron Station are $59,038, $70,431 for men and $26,179 for women, a difference of 62.8%.
| Sex | Number | Average Earnings |
| Male | 134 (60.9%) | $70,431 |
| Female | 86 (39.1%) | $26,179 |
| Total | 220 (100.0%) | $59,038 |
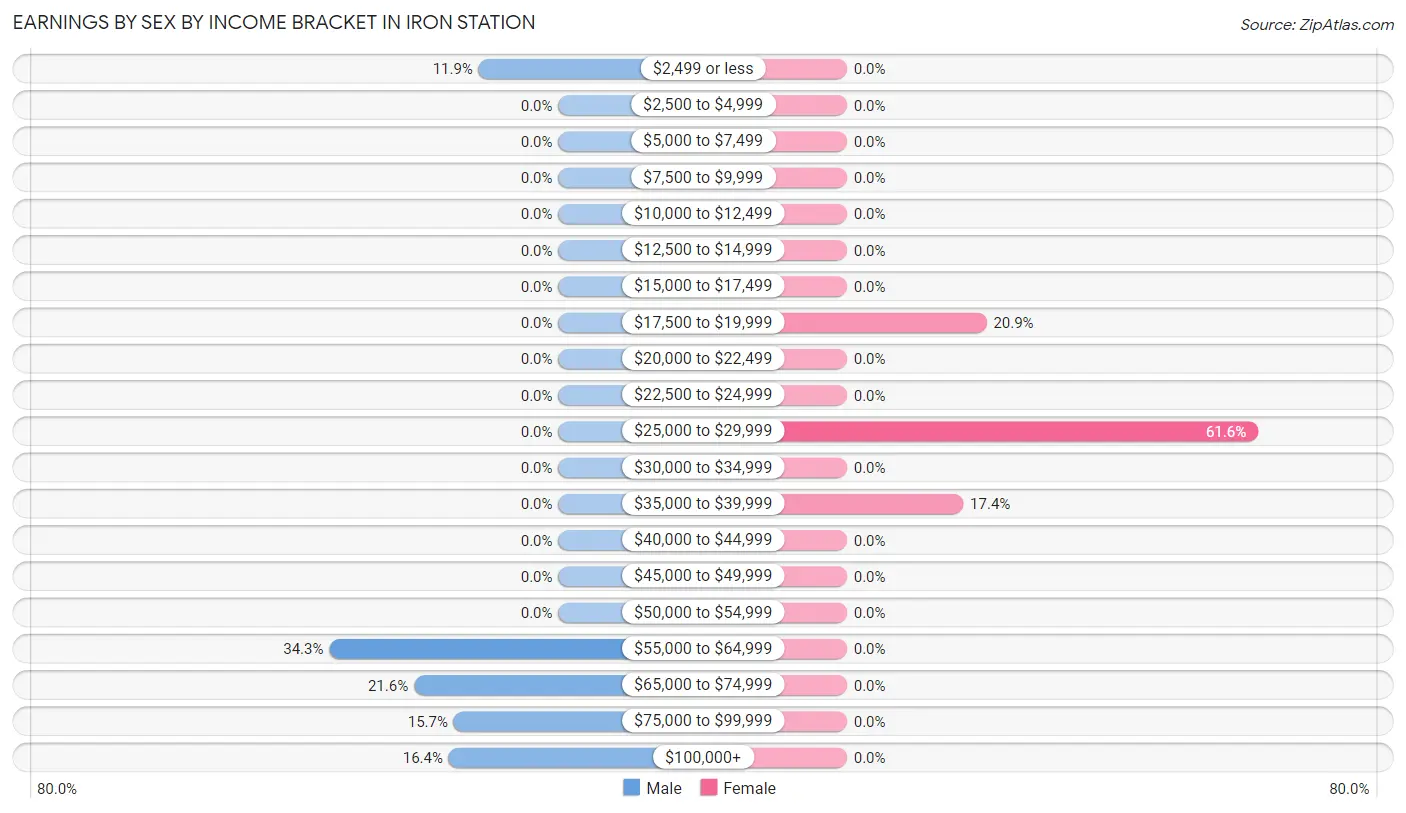
Earnings by Sex by Income Bracket in Iron Station
The most common earnings brackets in Iron Station are $55,000 to $64,999 for men (46 | 34.3%) and $25,000 to $29,999 for women (53 | 61.6%).
| Income | Male | Female |
| $2,499 or less | 16 (11.9%) | 0 (0.0%) |
| $2,500 to $4,999 | 0 (0.0%) | 0 (0.0%) |
| $5,000 to $7,499 | 0 (0.0%) | 0 (0.0%) |
| $7,500 to $9,999 | 0 (0.0%) | 0 (0.0%) |
| $10,000 to $12,499 | 0 (0.0%) | 0 (0.0%) |
| $12,500 to $14,999 | 0 (0.0%) | 0 (0.0%) |
| $15,000 to $17,499 | 0 (0.0%) | 0 (0.0%) |
| $17,500 to $19,999 | 0 (0.0%) | 18 (20.9%) |
| $20,000 to $22,499 | 0 (0.0%) | 0 (0.0%) |
| $22,500 to $24,999 | 0 (0.0%) | 0 (0.0%) |
| $25,000 to $29,999 | 0 (0.0%) | 53 (61.6%) |
| $30,000 to $34,999 | 0 (0.0%) | 0 (0.0%) |
| $35,000 to $39,999 | 0 (0.0%) | 15 (17.4%) |
| $40,000 to $44,999 | 0 (0.0%) | 0 (0.0%) |
| $45,000 to $49,999 | 0 (0.0%) | 0 (0.0%) |
| $50,000 to $54,999 | 0 (0.0%) | 0 (0.0%) |
| $55,000 to $64,999 | 46 (34.3%) | 0 (0.0%) |
| $65,000 to $74,999 | 29 (21.6%) | 0 (0.0%) |
| $75,000 to $99,999 | 21 (15.7%) | 0 (0.0%) |
| $100,000+ | 22 (16.4%) | 0 (0.0%) |
| Total | 134 (100.0%) | 86 (100.0%) |
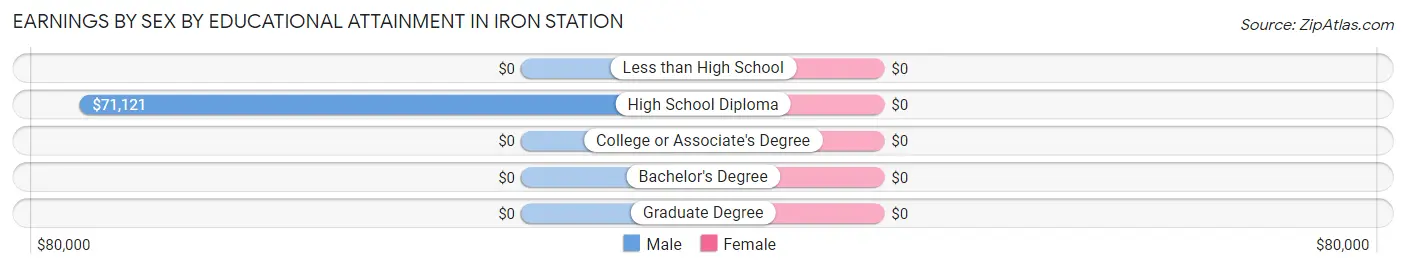
Earnings by Sex by Educational Attainment in Iron Station
| Educational Attainment | Male Income | Female Income |
| Less than High School | - | - |
| High School Diploma | $71,121 | $0 |
| College or Associate's Degree | - | - |
| Bachelor's Degree | - | - |
| Graduate Degree | - | - |
| Total | $70,431 | $26,179 |
Family Income in Iron Station
Family Income Brackets in Iron Station
According to the Iron Station family income data, there are 63 families falling into the $50,000 to $74,999 income range, which is the most common income bracket and makes up 35.8% of all families.
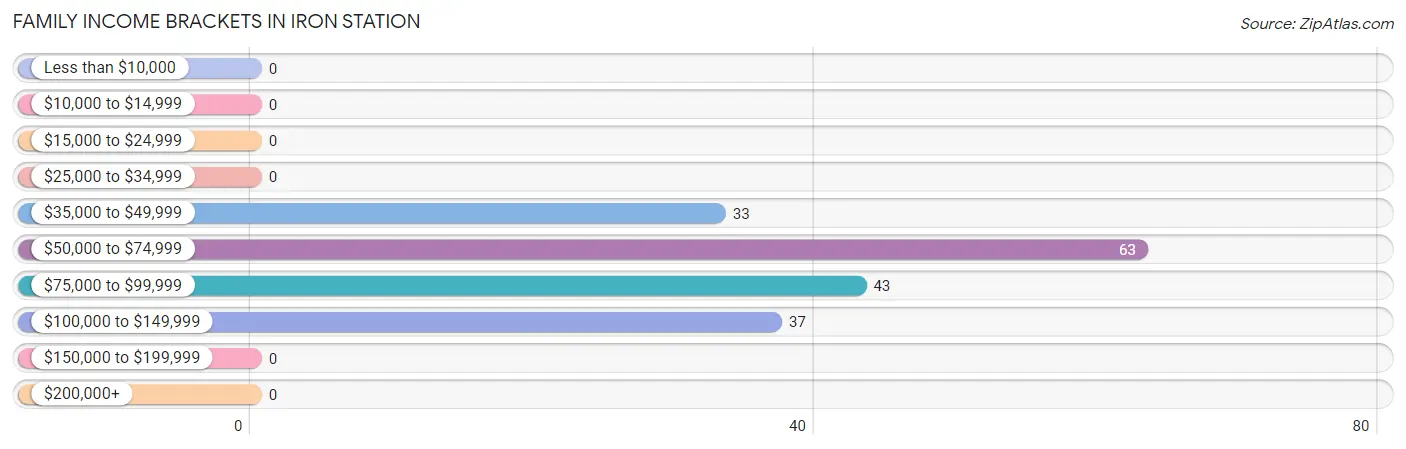
| Income Bracket | # Families | % Families |
| Less than $10,000 | 0 | 0.0% |
| $10,000 to $14,999 | 0 | 0.0% |
| $15,000 to $24,999 | 0 | 0.0% |
| $25,000 to $34,999 | 0 | 0.0% |
| $35,000 to $49,999 | 33 | 18.8% |
| $50,000 to $74,999 | 63 | 35.8% |
| $75,000 to $99,999 | 43 | 24.4% |
| $100,000 to $149,999 | 37 | 21.0% |
| $150,000 to $199,999 | 0 | 0.0% |
| $200,000+ | 0 | 0.0% |
Family Income by Famaliy Size in Iron Station
2-person families (67 | 38.1%) account for the highest median family income in Iron Station with $58,493 per family, while 2-person families (67 | 38.1%) have the highest median income of $29,246 per family member.
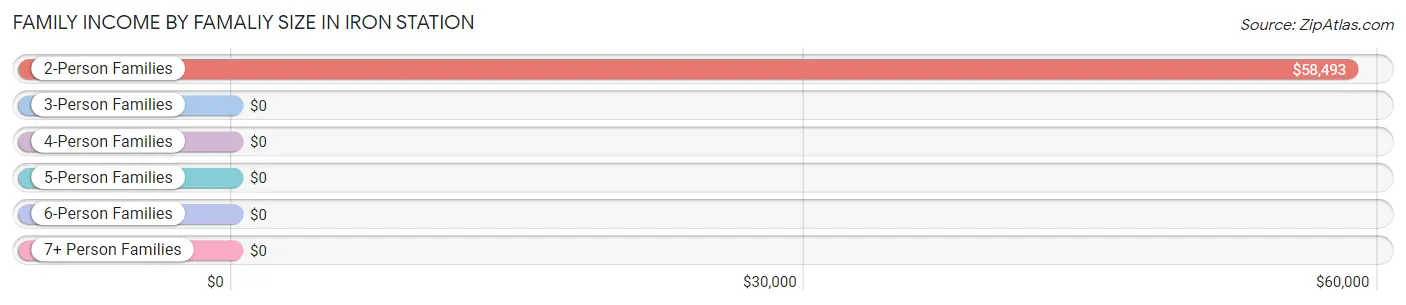
| Income Bracket | # Families | Median Income |
| 2-Person Families | 67 (38.1%) | $58,493 |
| 3-Person Families | 29 (16.5%) | $0 |
| 4-Person Families | 30 (17.1%) | $0 |
| 5-Person Families | 37 (21.0%) | $0 |
| 6-Person Families | 13 (7.4%) | $0 |
| 7+ Person Families | 0 (0.0%) | $0 |
| Total | 176 (100.0%) | $71,810 |
Family Income by Number of Earners in Iron Station
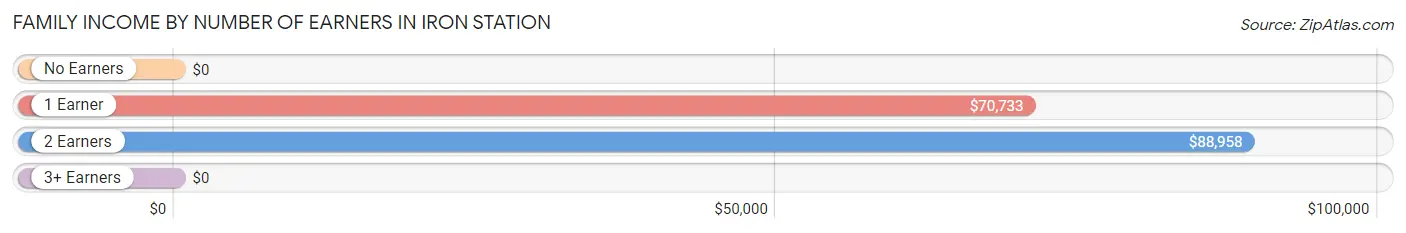
| Number of Earners | # Families | Median Income |
| No Earners | 36 (20.4%) | $0 |
| 1 Earner | 79 (44.9%) | $70,733 |
| 2 Earners | 61 (34.7%) | $88,958 |
| 3+ Earners | 0 (0.0%) | $0 |
| Total | 176 (100.0%) | $71,810 |
Household Income in Iron Station
Household Income Brackets in Iron Station
With 71 households falling in the category, the $25,000 to $34,999 income range is the most frequent in Iron Station, accounting for 27.0% of all households.
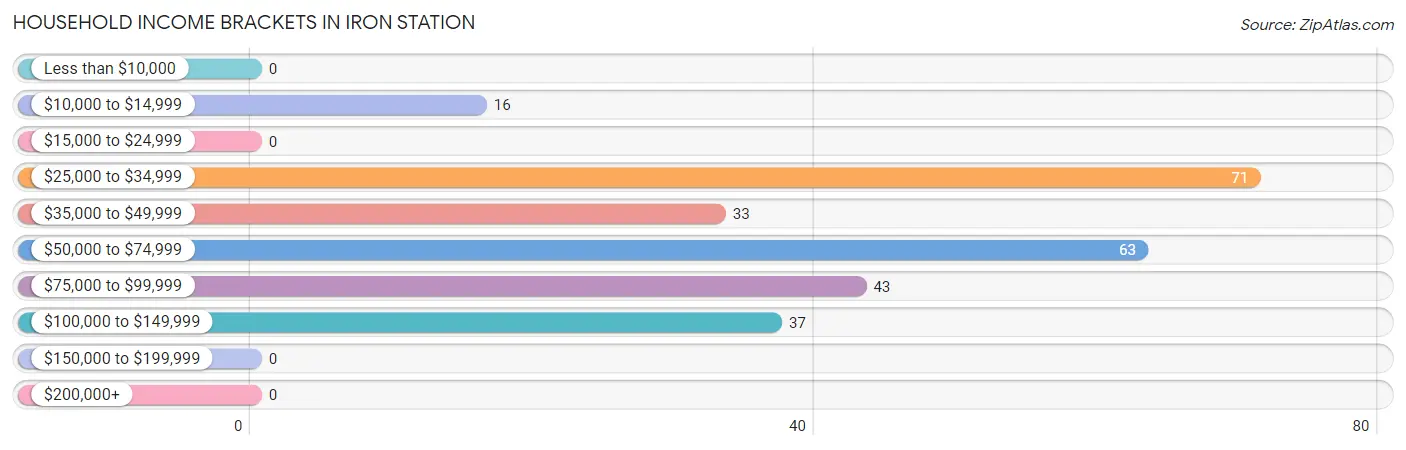
| Income Bracket | # Households | % Households |
| Less than $10,000 | 0 | 0.0% |
| $10,000 to $14,999 | 16 | 6.1% |
| $15,000 to $24,999 | 0 | 0.0% |
| $25,000 to $34,999 | 71 | 27.0% |
| $35,000 to $49,999 | 33 | 12.5% |
| $50,000 to $74,999 | 63 | 24.0% |
| $75,000 to $99,999 | 43 | 16.3% |
| $100,000 to $149,999 | 37 | 14.1% |
| $150,000 to $199,999 | 0 | 0.0% |
| $200,000+ | 0 | 0.0% |
Household Income by Householder Age in Iron Station
The median household income in Iron Station is $58,346, with the highest median household income of $88,333 found in the 25 to 44 years age bracket for the primary householder. A total of 78 households (29.7%) fall into this category.
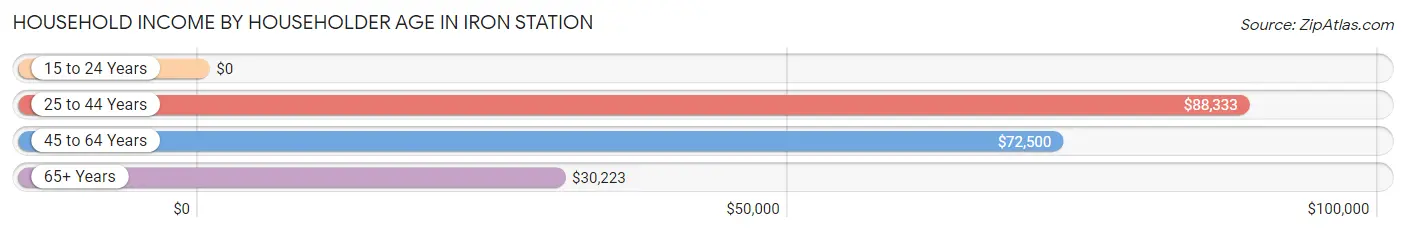
| Income Bracket | # Households | Median Income |
| 15 to 24 Years | 0 (0.0%) | $0 |
| 25 to 44 Years | 78 (29.7%) | $88,333 |
| 45 to 64 Years | 62 (23.6%) | $72,500 |
| 65+ Years | 123 (46.8%) | $30,223 |
| Total | 263 (100.0%) | $58,346 |
Poverty in Iron Station
Income Below Poverty by Sex and Age in Iron Station
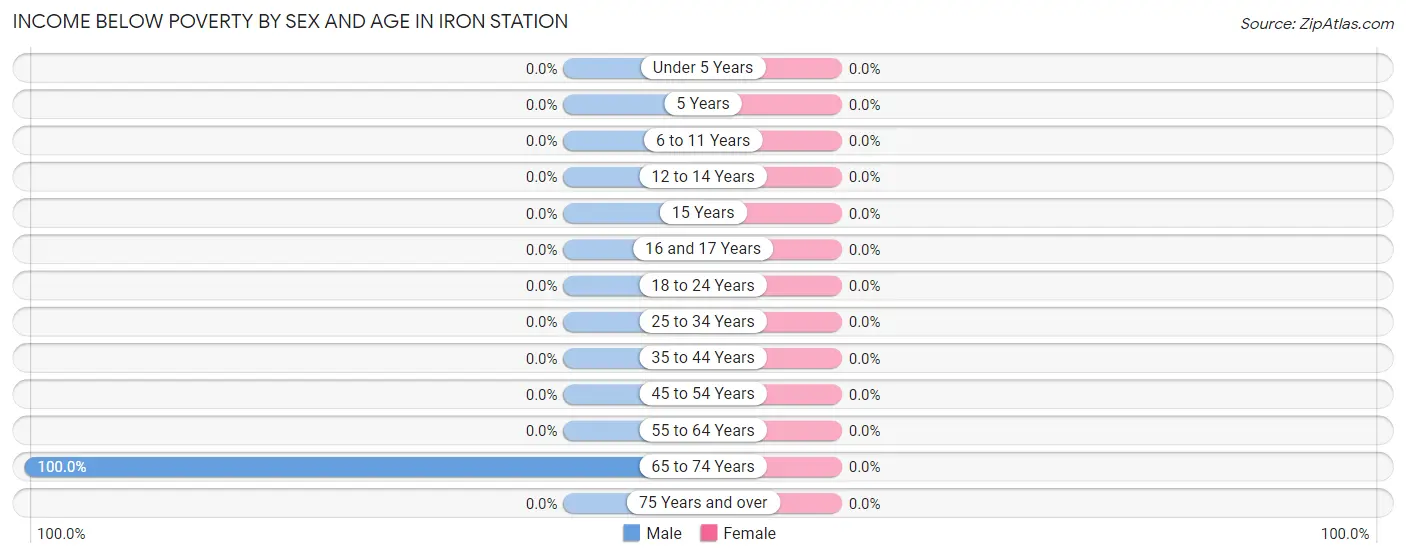
| Age Bracket | Male | Female |
| Under 5 Years | 0 (0.0%) | 0 (0.0%) |
| 5 Years | 0 (0.0%) | 0 (0.0%) |
| 6 to 11 Years | 0 (0.0%) | 0 (0.0%) |
| 12 to 14 Years | 0 (0.0%) | 0 (0.0%) |
| 15 Years | 0 (0.0%) | 0 (0.0%) |
| 16 and 17 Years | 0 (0.0%) | 0 (0.0%) |
| 18 to 24 Years | 0 (0.0%) | 0 (0.0%) |
| 25 to 34 Years | 0 (0.0%) | 0 (0.0%) |
| 35 to 44 Years | 0 (0.0%) | 0 (0.0%) |
| 45 to 54 Years | 0 (0.0%) | 0 (0.0%) |
| 55 to 64 Years | 0 (0.0%) | 0 (0.0%) |
| 65 to 74 Years | 16 (100.0%) | 0 (0.0%) |
| 75 Years and over | 0 (0.0%) | 0 (0.0%) |
| Total | 16 (4.3%) | 0 (0.0%) |
Income Above Poverty by Sex and Age in Iron Station
According to the poverty statistics in Iron Station, males aged under 5 years and females aged under 5 years are the age groups that are most secure financially, with 100.0% of males and 100.0% of females in these age groups living above the poverty line.
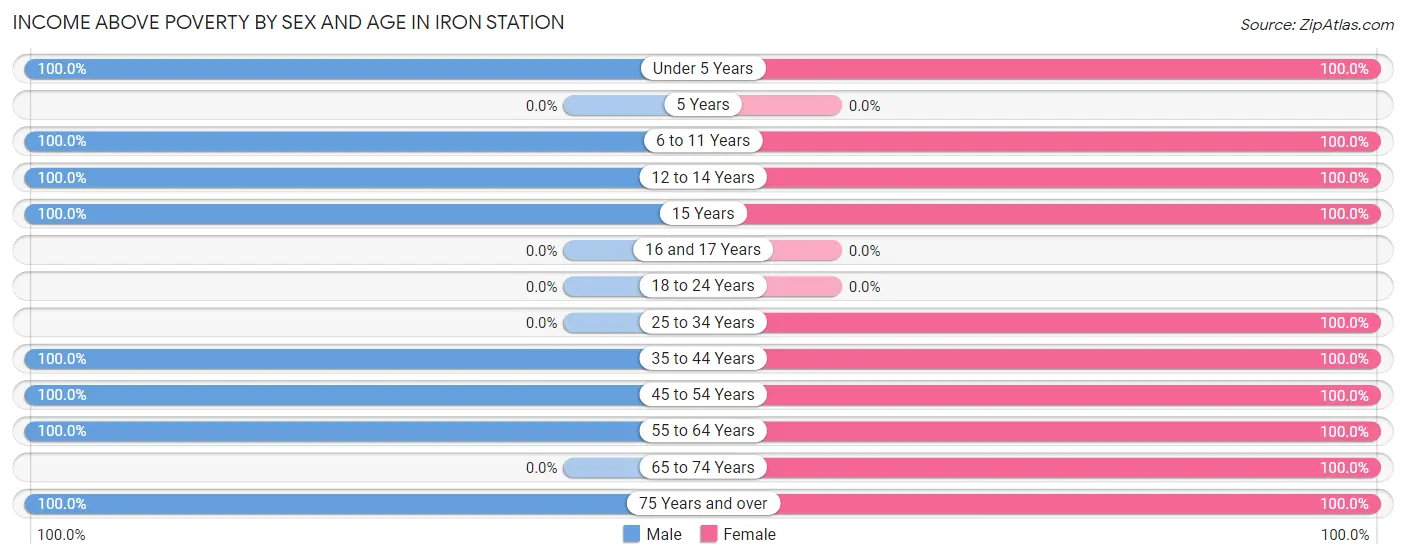
| Age Bracket | Male | Female |
| Under 5 Years | 32 (100.0%) | 12 (100.0%) |
| 5 Years | 0 (0.0%) | 0 (0.0%) |
| 6 to 11 Years | 66 (100.0%) | 44 (100.0%) |
| 12 to 14 Years | 29 (100.0%) | 16 (100.0%) |
| 15 Years | 31 (100.0%) | 59 (100.0%) |
| 16 and 17 Years | 0 (0.0%) | 0 (0.0%) |
| 18 to 24 Years | 0 (0.0%) | 0 (0.0%) |
| 25 to 34 Years | 0 (0.0%) | 42 (100.0%) |
| 35 to 44 Years | 62 (100.0%) | 19 (100.0%) |
| 45 to 54 Years | 22 (100.0%) | 18 (100.0%) |
| 55 to 64 Years | 52 (100.0%) | 39 (100.0%) |
| 65 to 74 Years | 0 (0.0%) | 16 (100.0%) |
| 75 Years and over | 64 (100.0%) | 60 (100.0%) |
| Total | 358 (95.7%) | 325 (100.0%) |
Income Below Poverty Among Married-Couple Families in Iron Station
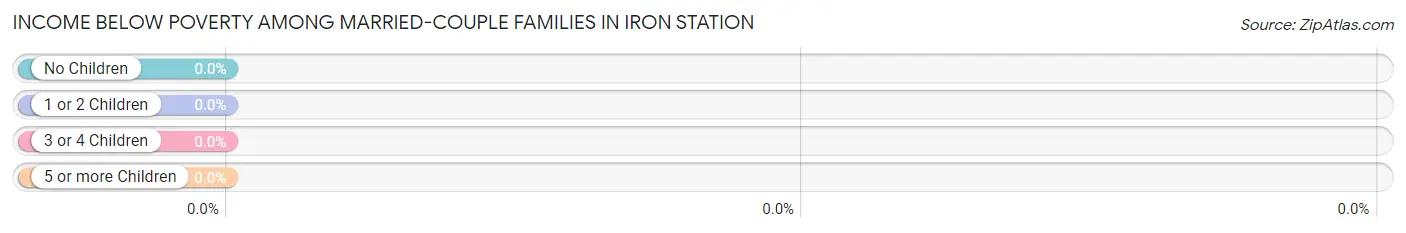
| Children | Above Poverty | Below Poverty |
| No Children | 67 (100.0%) | 0 (0.0%) |
| 1 or 2 Children | 30 (100.0%) | 0 (0.0%) |
| 3 or 4 Children | 37 (100.0%) | 0 (0.0%) |
| 5 or more Children | 0 (0.0%) | 0 (0.0%) |
| Total | 134 (100.0%) | 0 (0.0%) |
Income Below Poverty Among Single-Parent Households in Iron Station
| Children | Single Father | Single Mother |
| No Children | 0 (0.0%) | 0 (0.0%) |
| 1 or 2 Children | 0 (0.0%) | 0 (0.0%) |
| 3 or 4 Children | 0 (0.0%) | 0 (0.0%) |
| 5 or more Children | 0 (0.0%) | 0 (0.0%) |
| Total | 0 (0.0%) | 0 (0.0%) |
Income Below Poverty Among Married-Couple vs Single-Parent Households in Iron Station
| Children | Married-Couple Families | Single-Parent Households |
| No Children | 0 (0.0%) | 0 (0.0%) |
| 1 or 2 Children | 0 (0.0%) | 0 (0.0%) |
| 3 or 4 Children | 0 (0.0%) | 0 (0.0%) |
| 5 or more Children | 0 (0.0%) | 0 (0.0%) |
| Total | 0 (0.0%) | 0 (0.0%) |
Race in Iron Station
The most populous races in Iron Station are White / Caucasian (588 | 84.1%), Two or more Races (91 | 13.0%), and Black / African American (20 | 2.9%).
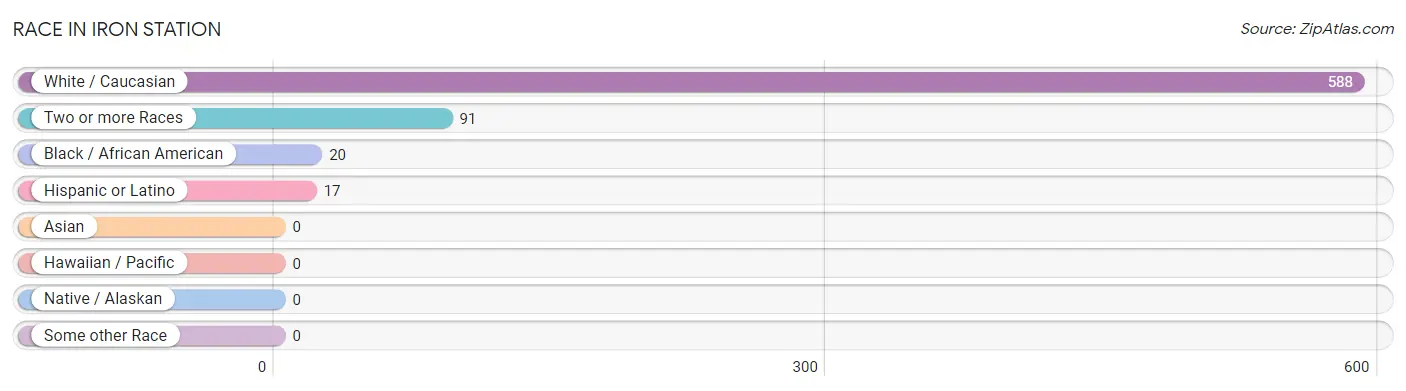
| Race | # Population | % Population |
| Asian | 0 | 0.0% |
| Black / African American | 20 | 2.9% |
| Hawaiian / Pacific | 0 | 0.0% |
| Hispanic or Latino | 17 | 2.4% |
| Native / Alaskan | 0 | 0.0% |
| White / Caucasian | 588 | 84.1% |
| Two or more Races | 91 | 13.0% |
| Some other Race | 0 | 0.0% |
| Total | 699 | 100.0% |
Ancestry in Iron Station
The most populous ancestries reported in Iron Station are German (171 | 24.5%), American (169 | 24.2%), English (83 | 11.9%), Irish (75 | 10.7%), and West Indian (20 | 2.9%), together accounting for 74.1% of all Iron Station residents.
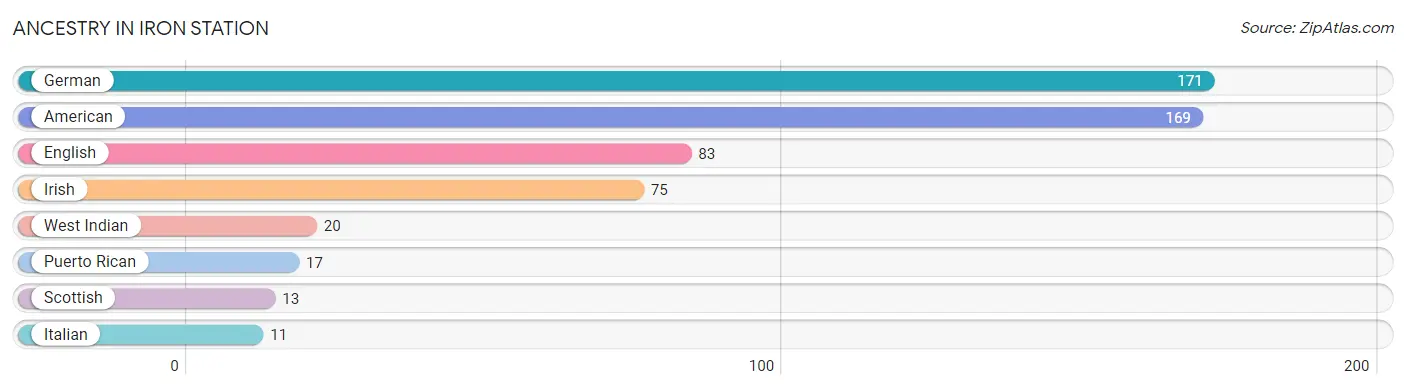
| Ancestry | # Population | % Population |
| American | 169 | 24.2% |
| English | 83 | 11.9% |
| German | 171 | 24.5% |
| Irish | 75 | 10.7% |
| Italian | 11 | 1.6% |
| Puerto Rican | 17 | 2.4% |
| Scottish | 13 | 1.9% |
| West Indian | 20 | 2.9% | View All 8 Rows |
Immigrants in Iron Station
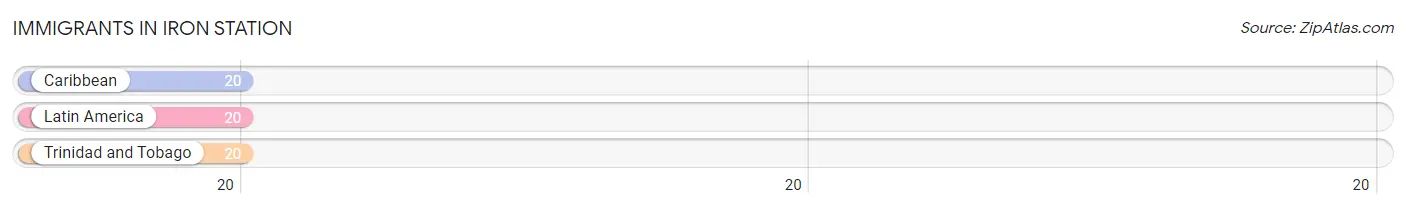
The most numerous immigrant groups reported in Iron Station came from Caribbean (20 | 2.9%), Latin America (20 | 2.9%), and Trinidad and Tobago (20 | 2.9%), together accounting for 8.6% of all Iron Station residents.
| Immigration Origin | # Population | % Population |
| Caribbean | 20 | 2.9% |
| Latin America | 20 | 2.9% |
| Trinidad and Tobago | 20 | 2.9% | View All 3 Rows |
Sex and Age in Iron Station
Sex and Age in Iron Station
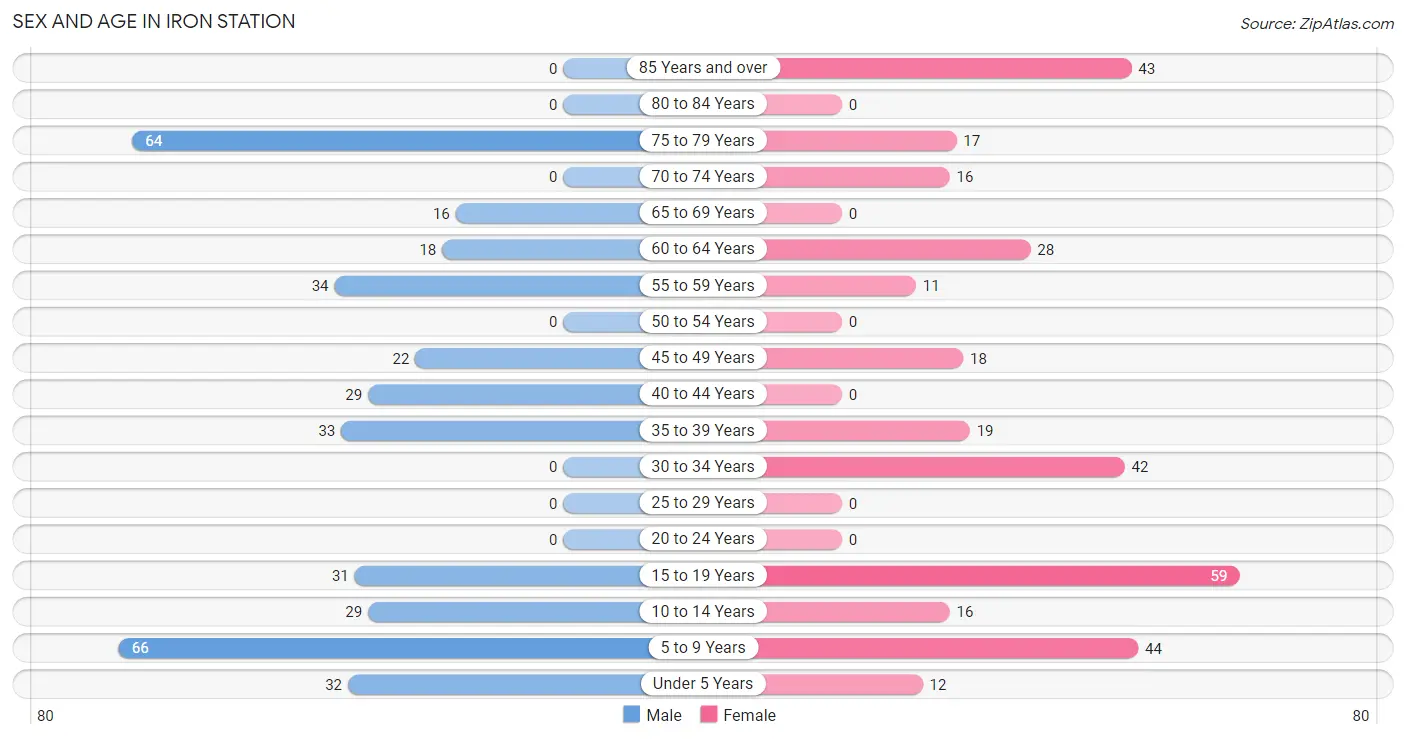
The most populous age groups in Iron Station are 5 to 9 Years (66 | 17.6%) for men and 15 to 19 Years (59 | 18.1%) for women.
| Age Bracket | Male | Female |
| Under 5 Years | 32 (8.6%) | 12 (3.7%) |
| 5 to 9 Years | 66 (17.6%) | 44 (13.5%) |
| 10 to 14 Years | 29 (7.7%) | 16 (4.9%) |
| 15 to 19 Years | 31 (8.3%) | 59 (18.1%) |
| 20 to 24 Years | 0 (0.0%) | 0 (0.0%) |
| 25 to 29 Years | 0 (0.0%) | 0 (0.0%) |
| 30 to 34 Years | 0 (0.0%) | 42 (12.9%) |
| 35 to 39 Years | 33 (8.8%) | 19 (5.9%) |
| 40 to 44 Years | 29 (7.7%) | 0 (0.0%) |
| 45 to 49 Years | 22 (5.9%) | 18 (5.5%) |
| 50 to 54 Years | 0 (0.0%) | 0 (0.0%) |
| 55 to 59 Years | 34 (9.1%) | 11 (3.4%) |
| 60 to 64 Years | 18 (4.8%) | 28 (8.6%) |
| 65 to 69 Years | 16 (4.3%) | 0 (0.0%) |
| 70 to 74 Years | 0 (0.0%) | 16 (4.9%) |
| 75 to 79 Years | 64 (17.1%) | 17 (5.2%) |
| 80 to 84 Years | 0 (0.0%) | 0 (0.0%) |
| 85 Years and over | 0 (0.0%) | 43 (13.2%) |
| Total | 374 (100.0%) | 325 (100.0%) |
Families and Households in Iron Station
Median Family Size in Iron Station
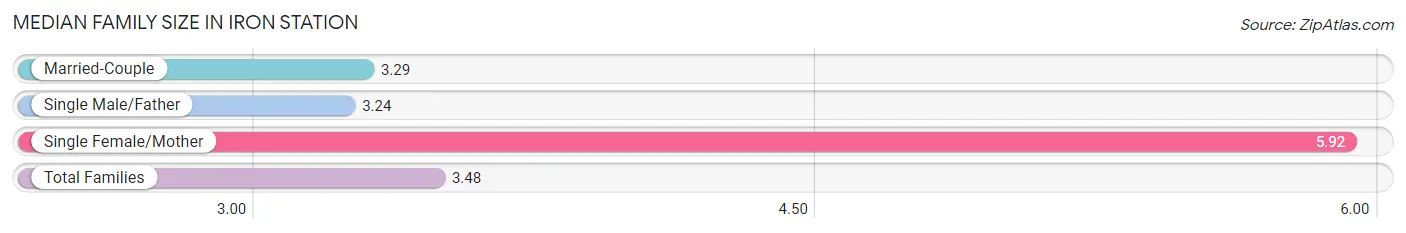
The median family size in Iron Station is 3.48 persons per family, with single female/mother families (13 | 7.4%) accounting for the largest median family size of 5.92 persons per family. On the other hand, single male/father families (29 | 16.5%) represent the smallest median family size with 3.24 persons per family.
| Family Type | # Families | Family Size |
| Married-Couple | 134 (76.1%) | 3.29 |
| Single Male/Father | 29 (16.5%) | 3.24 |
| Single Female/Mother | 13 (7.4%) | 5.92 |
| Total Families | 176 (100.0%) | 3.48 |
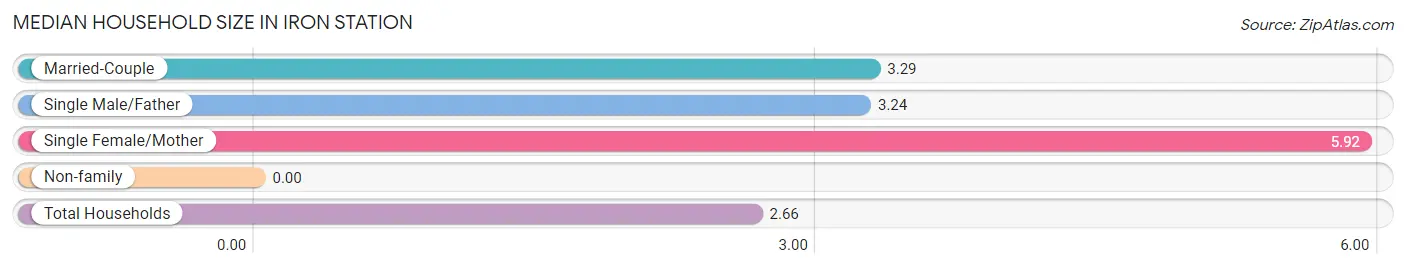
Median Household Size in Iron Station
| Household Type | # Households | Household Size |
| Married-Couple | 134 (50.9%) | 3.29 |
| Single Male/Father | 29 (11.0%) | 3.24 |
| Single Female/Mother | 13 (4.9%) | 5.92 |
| Non-family | 87 (33.1%) | - |
| Total Households | 263 (100.0%) | 2.66 |
Household Size by Marriage Status in Iron Station
Out of a total of 263 households in Iron Station, 176 (66.9%) are family households, while 87 (33.1%) are nonfamily households. The most numerous type of family households are 2-person households, comprising 67, and the most common type of nonfamily households are 1-person households, comprising 87.
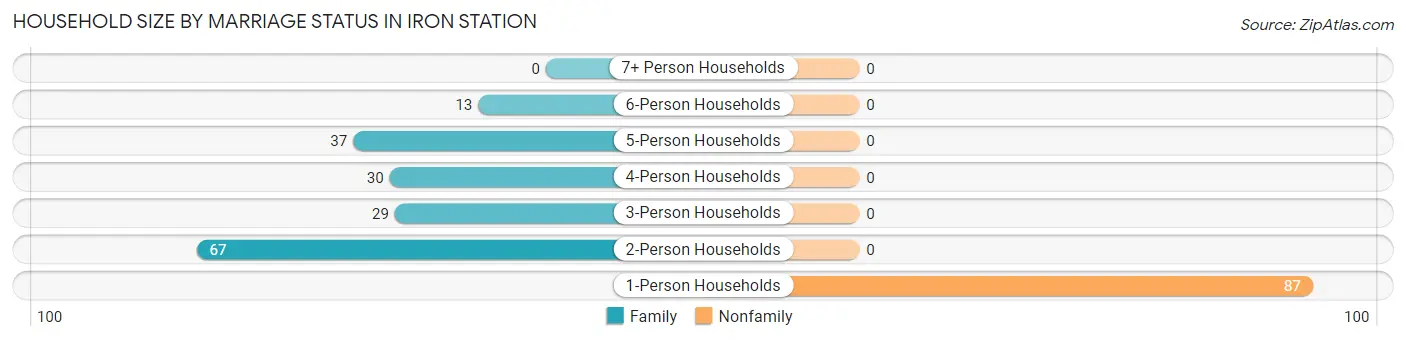
| Household Size | Family Households | Nonfamily Households |
| 1-Person Households | - | 87 (33.1%) |
| 2-Person Households | 67 (25.5%) | 0 (0.0%) |
| 3-Person Households | 29 (11.0%) | 0 (0.0%) |
| 4-Person Households | 30 (11.4%) | 0 (0.0%) |
| 5-Person Households | 37 (14.1%) | 0 (0.0%) |
| 6-Person Households | 13 (4.9%) | 0 (0.0%) |
| 7+ Person Households | 0 (0.0%) | 0 (0.0%) |
| Total | 176 (66.9%) | 87 (33.1%) |
Female Fertility in Iron Station
Fertility by Age in Iron Station
Average fertility rate in Iron Station is 217.0 births per 1,000 women. Women in the age bracket of 20 to 34 years have the highest fertility rate with 714.0 births per 1,000 women. Women in the age bracket of 20 to 34 years acount for 100.0% of all women with births.
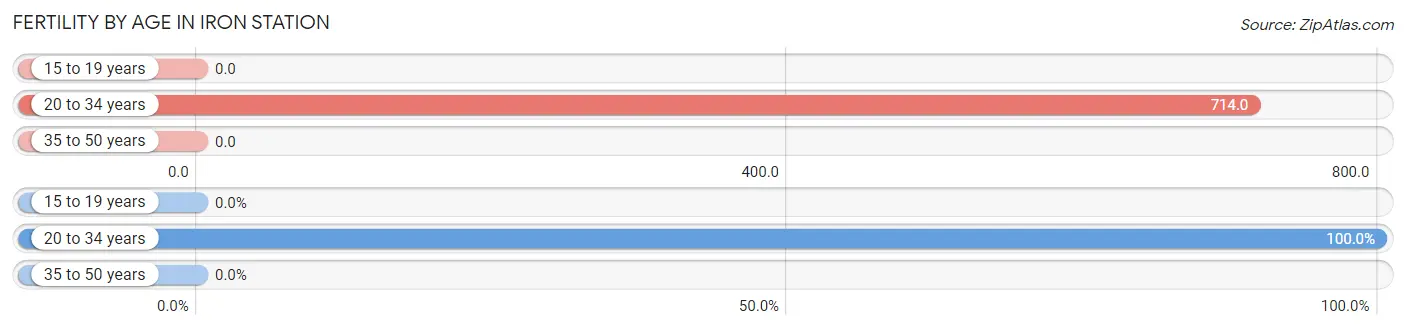
| Age Bracket | Women with Births | Births / 1,000 Women |
| 15 to 19 years | 0 (0.0%) | 0.0 |
| 20 to 34 years | 30 (100.0%) | 714.0 |
| 35 to 50 years | 0 (0.0%) | 0.0 |
| Total | 30 (100.0%) | 217.0 |
Fertility by Age by Marriage Status in Iron Station
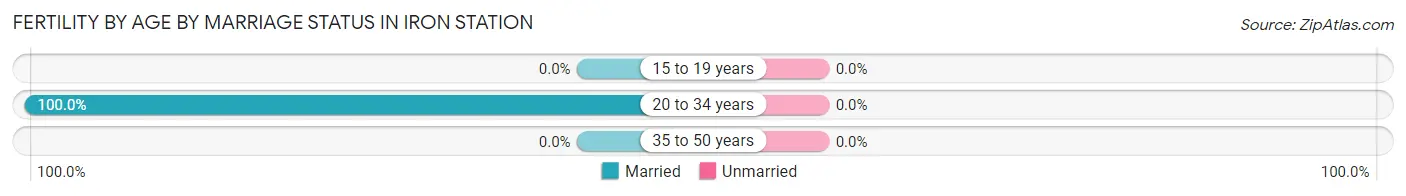
| Age Bracket | Married | Unmarried |
| 15 to 19 years | 0 (0.0%) | 0 (0.0%) |
| 20 to 34 years | 30 (100.0%) | 0 (0.0%) |
| 35 to 50 years | 0 (0.0%) | 0 (0.0%) |
| Total | 30 (100.0%) | 0 (0.0%) |
Fertility by Education in Iron Station
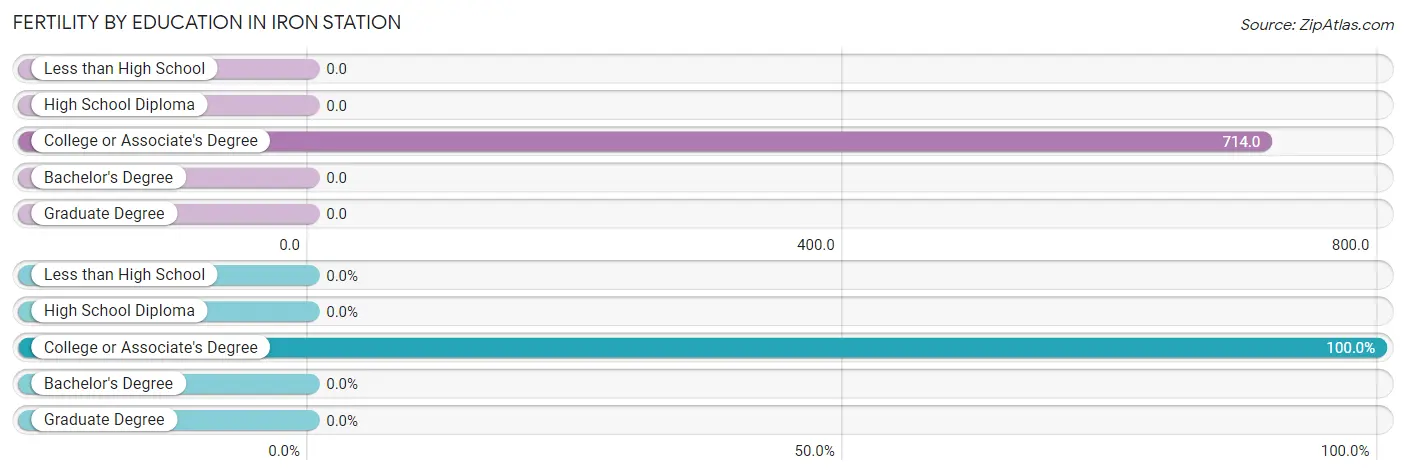
| Educational Attainment | Women with Births | Births / 1,000 Women |
| Less than High School | 0 (0.0%) | 0.0 |
| High School Diploma | 0 (0.0%) | 0.0 |
| College or Associate's Degree | 30 (100.0%) | 714.0 |
| Bachelor's Degree | 0 (0.0%) | 0.0 |
| Graduate Degree | 0 (0.0%) | 0.0 |
| Total | 30 (100.0%) | 217.0 |
Fertility by Education by Marriage Status in Iron Station
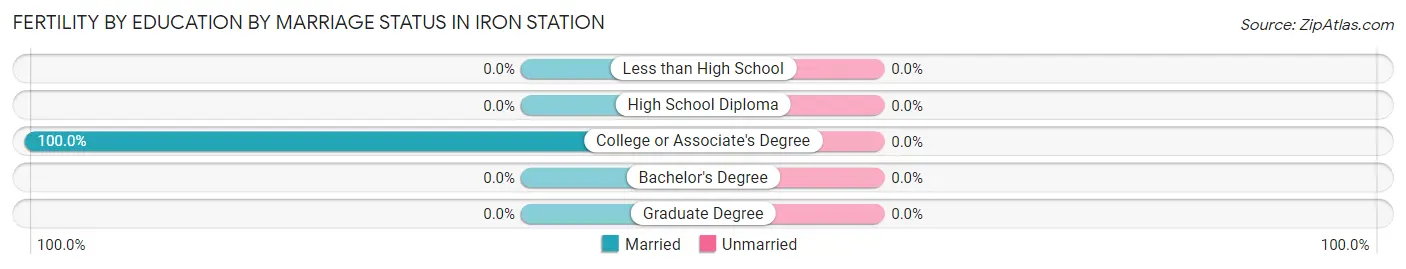
| Educational Attainment | Married | Unmarried |
| Less than High School | 0 (0.0%) | 0 (0.0%) |
| High School Diploma | 0 (0.0%) | 0 (0.0%) |
| College or Associate's Degree | 30 (100.0%) | 0 (0.0%) |
| Bachelor's Degree | 0 (0.0%) | 0 (0.0%) |
| Graduate Degree | 0 (0.0%) | 0 (0.0%) |
| Total | 30 (100.0%) | 0 (0.0%) |
Employment Characteristics in Iron Station
Employment by Class of Employer in Iron Station
Among the 220 employed individuals in Iron Station, private company employees (132 | 60.0%), not-for-profit organizations (30 | 13.6%), and local government employees (24 | 10.9%) make up the most common classes of employment.
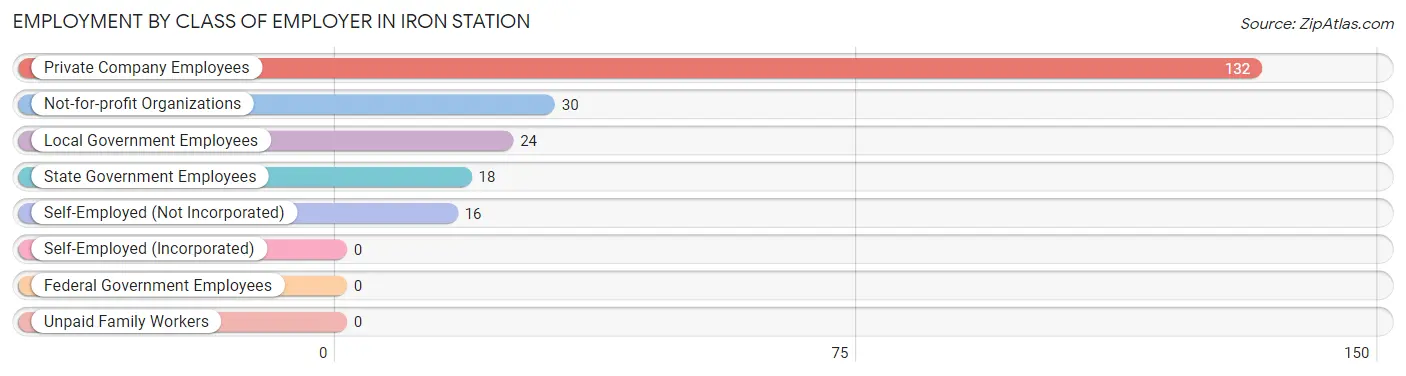
| Employer Class | # Employees | % Employees |
| Private Company Employees | 132 | 60.0% |
| Self-Employed (Incorporated) | 0 | 0.0% |
| Self-Employed (Not Incorporated) | 16 | 7.3% |
| Not-for-profit Organizations | 30 | 13.6% |
| Local Government Employees | 24 | 10.9% |
| State Government Employees | 18 | 8.2% |
| Federal Government Employees | 0 | 0.0% |
| Unpaid Family Workers | 0 | 0.0% |
| Total | 220 | 100.0% |
Employment Status by Age in Iron Station
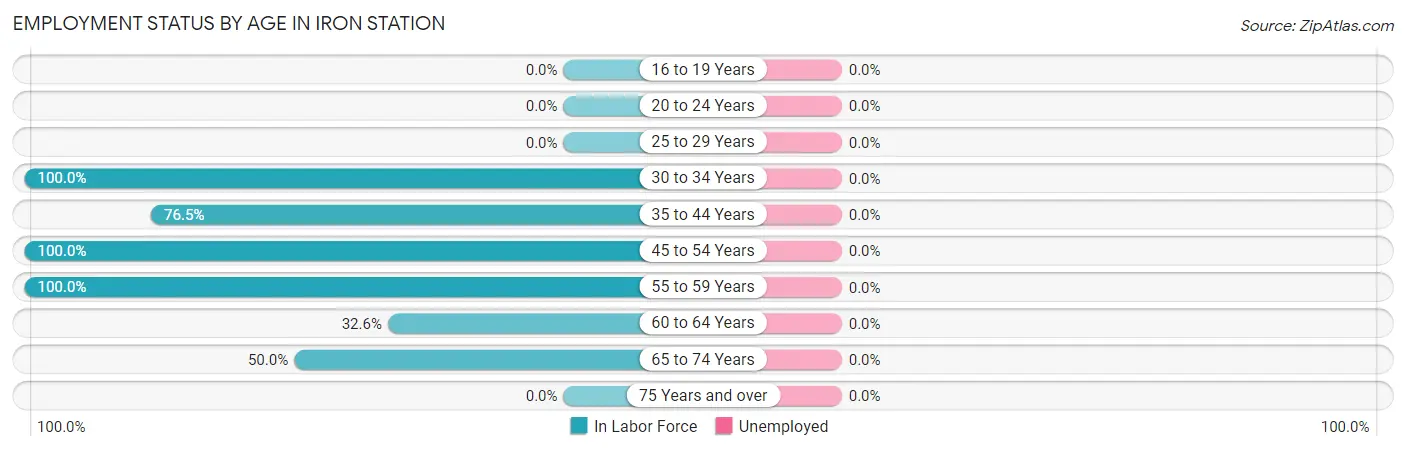
| Age Bracket | In Labor Force | Unemployed |
| 16 to 19 Years | 0 (0.0%) | 0 (0.0%) |
| 20 to 24 Years | 0 (0.0%) | 0 (0.0%) |
| 25 to 29 Years | 0 (0.0%) | 0 (0.0%) |
| 30 to 34 Years | 42 (100.0%) | 0 (0.0%) |
| 35 to 44 Years | 62 (76.5%) | 0 (0.0%) |
| 45 to 54 Years | 40 (100.0%) | 0 (0.0%) |
| 55 to 59 Years | 45 (100.0%) | 0 (0.0%) |
| 60 to 64 Years | 15 (32.6%) | 0 (0.0%) |
| 65 to 74 Years | 16 (50.0%) | 0 (0.0%) |
| 75 Years and over | 0 (0.0%) | 0 (0.0%) |
| Total | 220 (53.7%) | 0 (0.0%) |
Employment Status by Educational Attainment in Iron Station
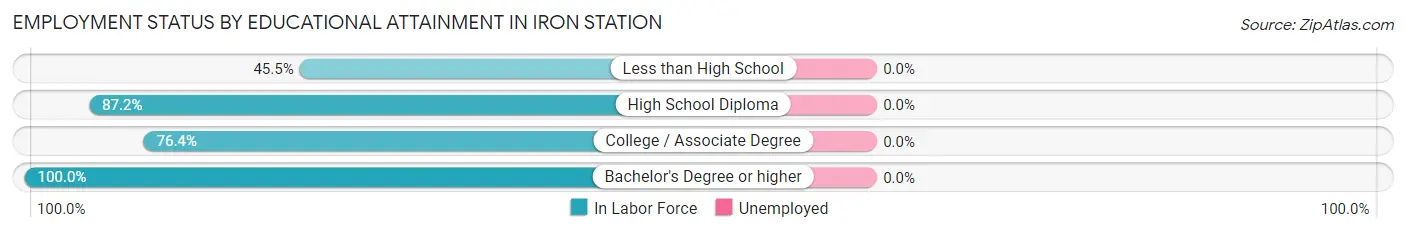
| Educational Attainment | In Labor Force | Unemployed |
| Less than High School | 15 (45.5%) | 0 (0.0%) |
| High School Diploma | 129 (87.2%) | 0 (0.0%) |
| College / Associate Degree | 42 (76.4%) | 0 (0.0%) |
| Bachelor's Degree or higher | 18 (100.0%) | 0 (0.0%) |
| Total | 204 (80.3%) | 0 (0.0%) |
Employment Occupations by Sex in Iron Station
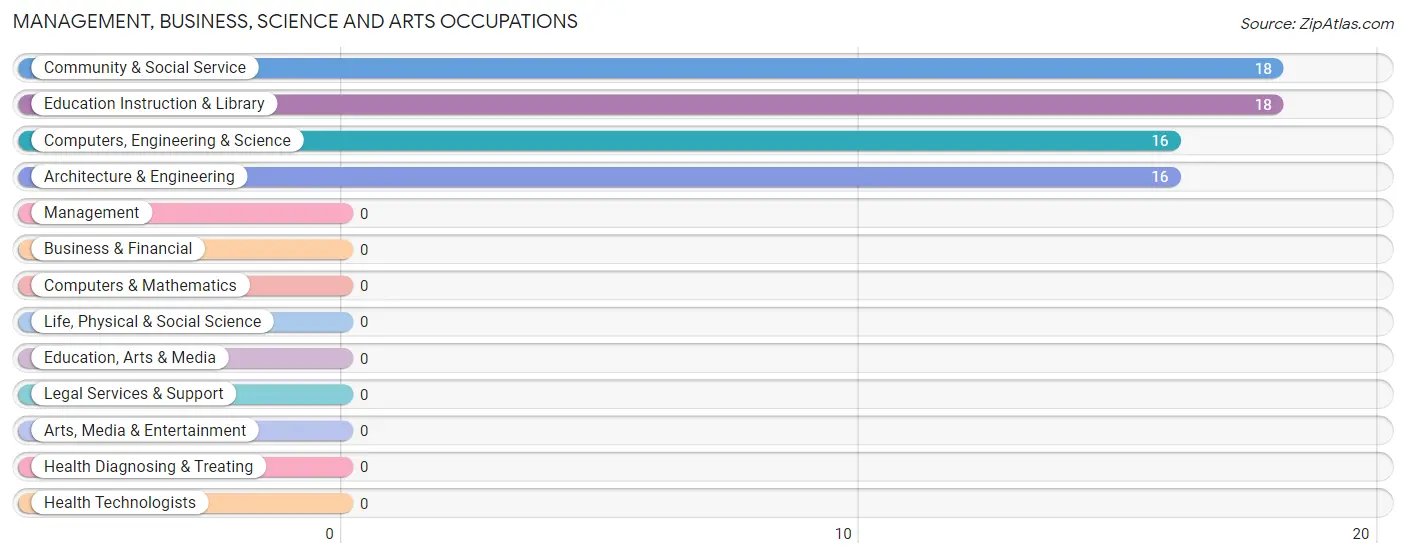
Management, Business, Science and Arts Occupations
The most common Management, Business, Science and Arts occupations in Iron Station are Community & Social Service (18 | 8.2%), Education Instruction & Library (18 | 8.2%), Computers, Engineering & Science (16 | 7.3%), and Architecture & Engineering (16 | 7.3%).
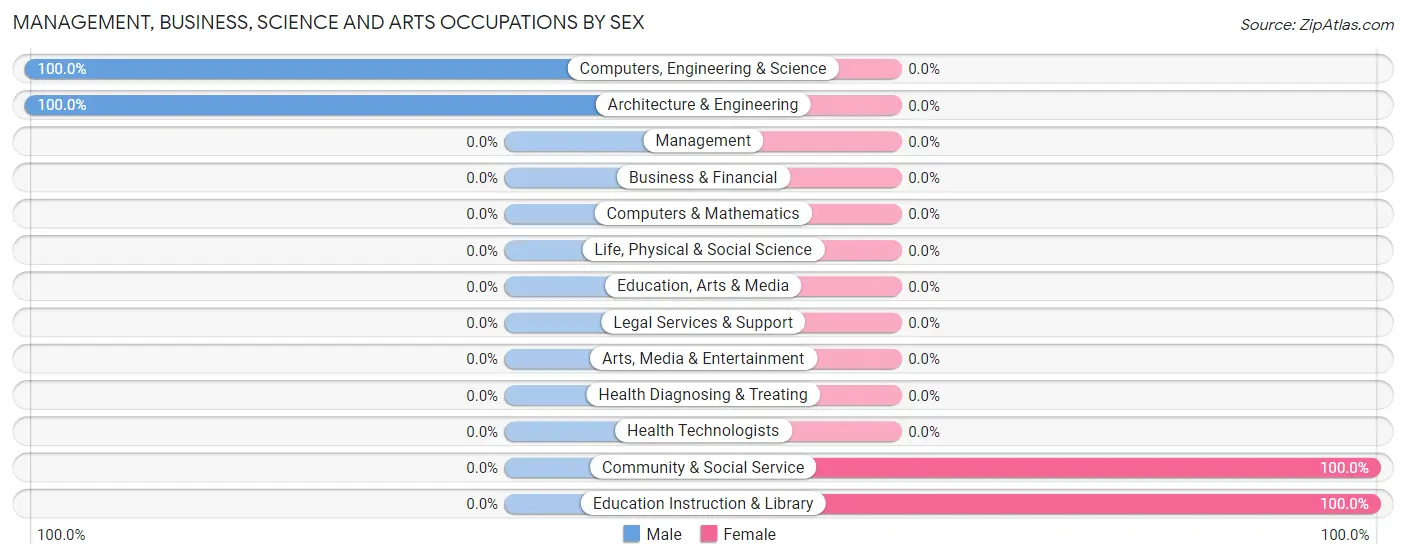
Management, Business, Science and Arts Occupations by Sex
Within the Management, Business, Science and Arts occupations in Iron Station, the most male-oriented occupations are Computers, Engineering & Science (100.0%), and Architecture & Engineering (100.0%), while the most female-oriented occupations are Community & Social Service (100.0%), and Education Instruction & Library (100.0%).
| Occupation | Male | Female |
| Management | 0 (0.0%) | 0 (0.0%) |
| Business & Financial | 0 (0.0%) | 0 (0.0%) |
| Computers, Engineering & Science | 16 (100.0%) | 0 (0.0%) |
| Computers & Mathematics | 0 (0.0%) | 0 (0.0%) |
| Architecture & Engineering | 16 (100.0%) | 0 (0.0%) |
| Life, Physical & Social Science | 0 (0.0%) | 0 (0.0%) |
| Community & Social Service | 0 (0.0%) | 18 (100.0%) |
| Education, Arts & Media | 0 (0.0%) | 0 (0.0%) |
| Legal Services & Support | 0 (0.0%) | 0 (0.0%) |
| Education Instruction & Library | 0 (0.0%) | 18 (100.0%) |
| Arts, Media & Entertainment | 0 (0.0%) | 0 (0.0%) |
| Health Diagnosing & Treating | 0 (0.0%) | 0 (0.0%) |
| Health Technologists | 0 (0.0%) | 0 (0.0%) |
| Total (Category) | 16 (47.1%) | 18 (52.9%) |
| Total (Overall) | 134 (60.9%) | 86 (39.1%) |
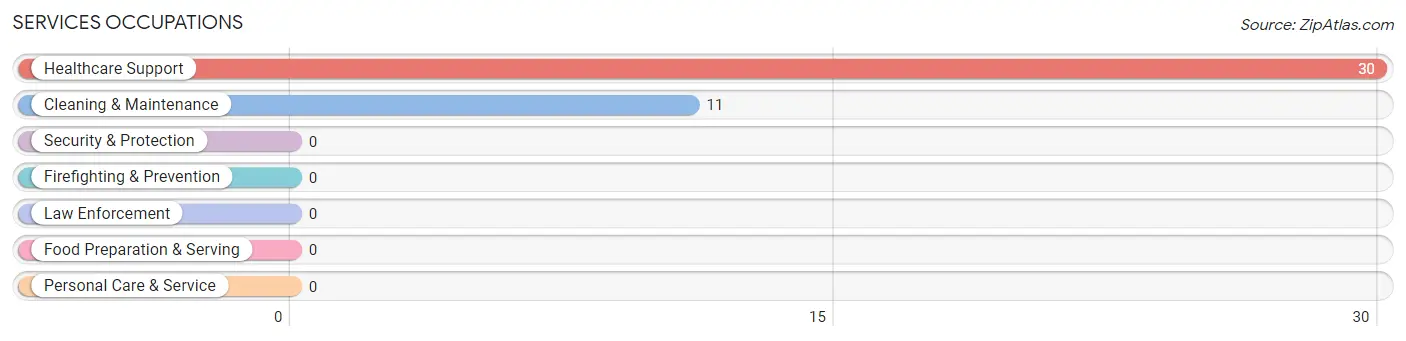
Services Occupations
The most common Services occupations in Iron Station are Healthcare Support (30 | 13.6%), and Cleaning & Maintenance (11 | 5.0%).
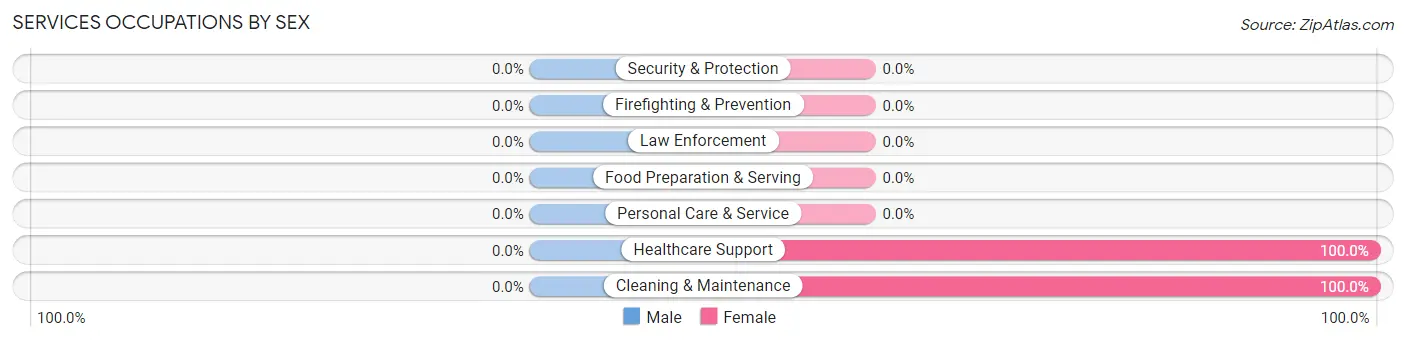
Services Occupations by Sex
| Occupation | Male | Female |
| Healthcare Support | 0 (0.0%) | 30 (100.0%) |
| Security & Protection | 0 (0.0%) | 0 (0.0%) |
| Firefighting & Prevention | 0 (0.0%) | 0 (0.0%) |
| Law Enforcement | 0 (0.0%) | 0 (0.0%) |
| Food Preparation & Serving | 0 (0.0%) | 0 (0.0%) |
| Cleaning & Maintenance | 0 (0.0%) | 11 (100.0%) |
| Personal Care & Service | 0 (0.0%) | 0 (0.0%) |
| Total (Category) | 0 (0.0%) | 41 (100.0%) |
| Total (Overall) | 134 (60.9%) | 86 (39.1%) |
Sales and Office Occupations
The most common Sales and Office occupations in Iron Station are Office & Administration (15 | 6.8%), and Sales & Related (12 | 5.4%).
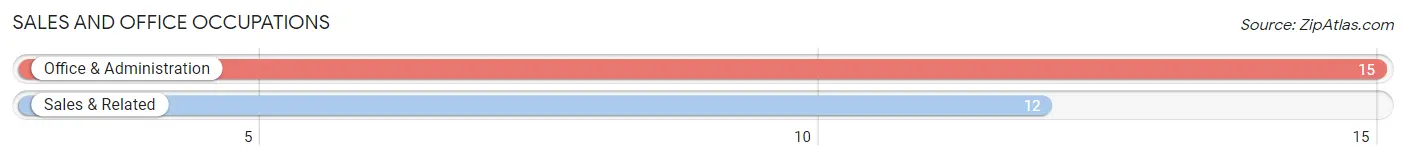
Sales and Office Occupations by Sex
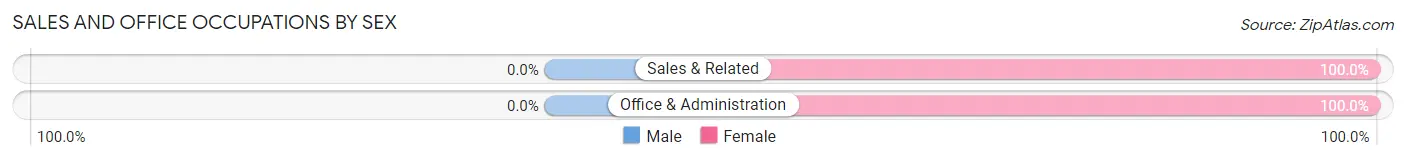
| Occupation | Male | Female |
| Sales & Related | 0 (0.0%) | 12 (100.0%) |
| Office & Administration | 0 (0.0%) | 15 (100.0%) |
| Total (Category) | 0 (0.0%) | 27 (100.0%) |
| Total (Overall) | 134 (60.9%) | 86 (39.1%) |
Natural Resources, Construction and Maintenance Occupations
The most common Natural Resources, Construction and Maintenance occupations in Iron Station are Construction & Extraction (33 | 15.0%), and Installation, Maintenance & Repair (22 | 10.0%).
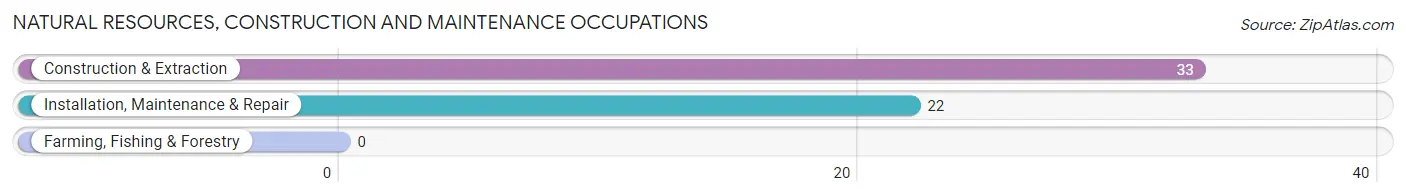
Natural Resources, Construction and Maintenance Occupations by Sex
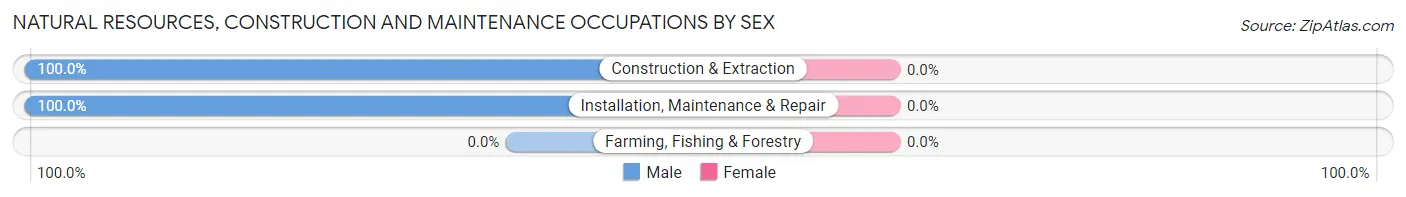
| Occupation | Male | Female |
| Farming, Fishing & Forestry | 0 (0.0%) | 0 (0.0%) |
| Construction & Extraction | 33 (100.0%) | 0 (0.0%) |
| Installation, Maintenance & Repair | 22 (100.0%) | 0 (0.0%) |
| Total (Category) | 55 (100.0%) | 0 (0.0%) |
| Total (Overall) | 134 (60.9%) | 86 (39.1%) |
Production, Transportation and Moving Occupations
The most common Production, Transportation and Moving occupations in Iron Station are Production (42 | 19.1%), and Transportation (21 | 9.6%).
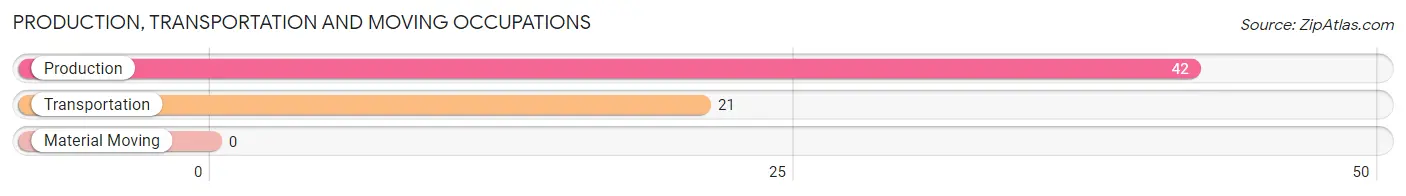
Production, Transportation and Moving Occupations by Sex
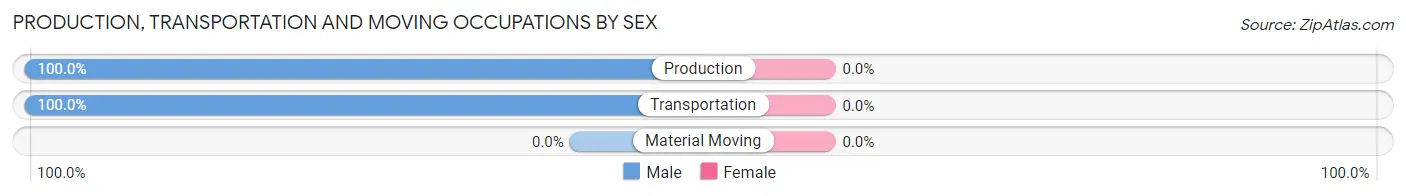
| Occupation | Male | Female |
| Production | 42 (100.0%) | 0 (0.0%) |
| Transportation | 21 (100.0%) | 0 (0.0%) |
| Material Moving | 0 (0.0%) | 0 (0.0%) |
| Total (Category) | 63 (100.0%) | 0 (0.0%) |
| Total (Overall) | 134 (60.9%) | 86 (39.1%) |
Employment Industries by Sex in Iron Station
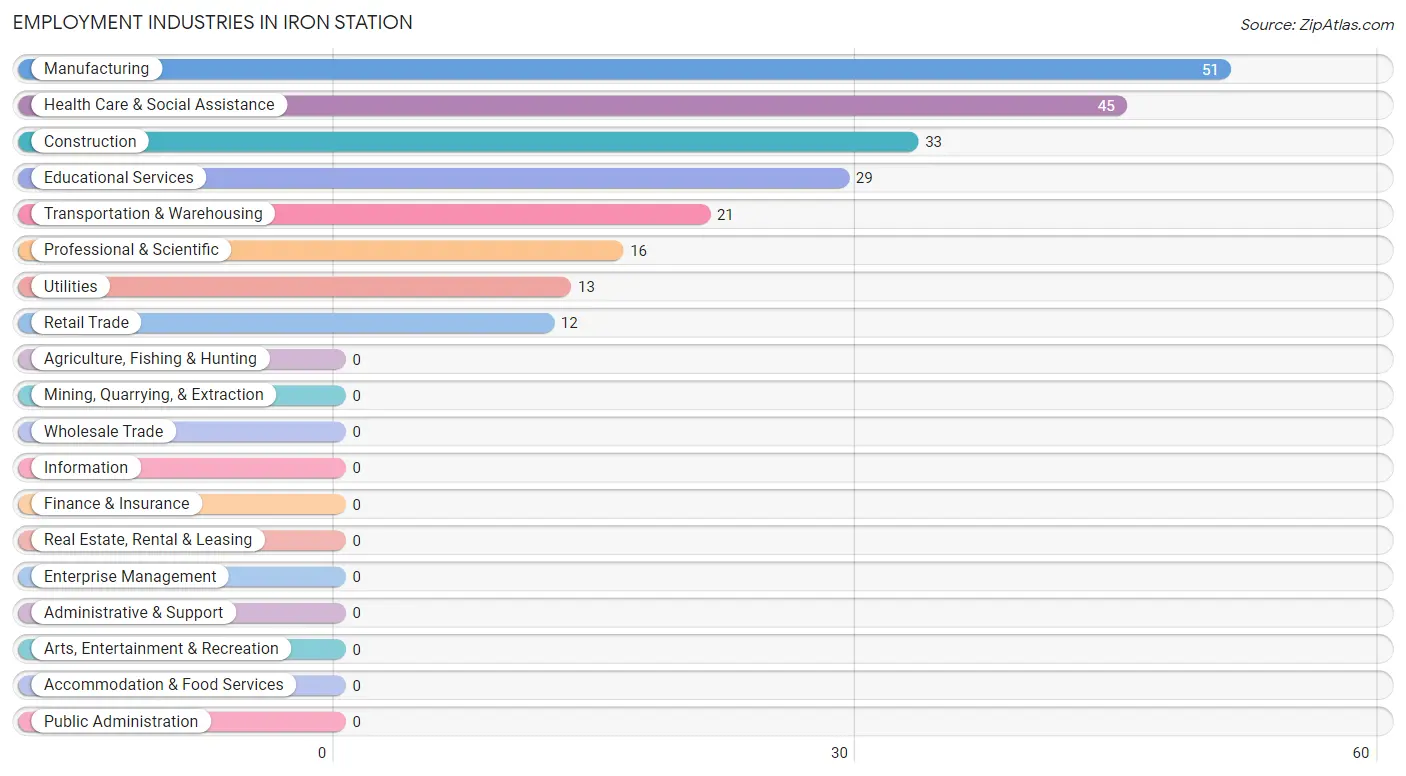
Employment Industries in Iron Station
The major employment industries in Iron Station include Manufacturing (51 | 23.2%), Health Care & Social Assistance (45 | 20.4%), Construction (33 | 15.0%), Educational Services (29 | 13.2%), and Transportation & Warehousing (21 | 9.6%).
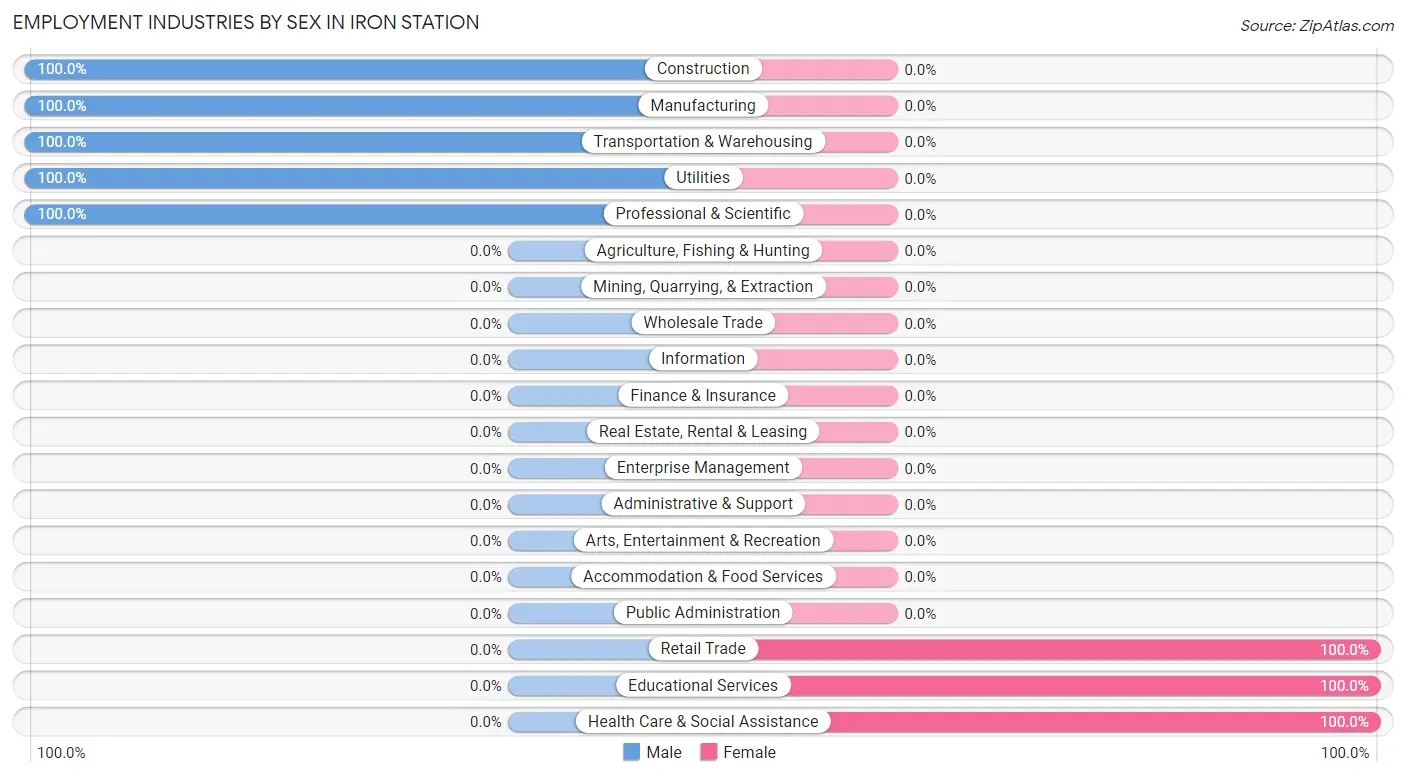
Employment Industries by Sex in Iron Station
The Iron Station industries that see more men than women are Construction (100.0%), Manufacturing (100.0%), and Transportation & Warehousing (100.0%), whereas the industries that tend to have a higher number of women are Retail Trade (100.0%), Educational Services (100.0%), and Health Care & Social Assistance (100.0%).
| Industry | Male | Female |
| Agriculture, Fishing & Hunting | 0 (0.0%) | 0 (0.0%) |
| Mining, Quarrying, & Extraction | 0 (0.0%) | 0 (0.0%) |
| Construction | 33 (100.0%) | 0 (0.0%) |
| Manufacturing | 51 (100.0%) | 0 (0.0%) |
| Wholesale Trade | 0 (0.0%) | 0 (0.0%) |
| Retail Trade | 0 (0.0%) | 12 (100.0%) |
| Transportation & Warehousing | 21 (100.0%) | 0 (0.0%) |
| Utilities | 13 (100.0%) | 0 (0.0%) |
| Information | 0 (0.0%) | 0 (0.0%) |
| Finance & Insurance | 0 (0.0%) | 0 (0.0%) |
| Real Estate, Rental & Leasing | 0 (0.0%) | 0 (0.0%) |
| Professional & Scientific | 16 (100.0%) | 0 (0.0%) |
| Enterprise Management | 0 (0.0%) | 0 (0.0%) |
| Administrative & Support | 0 (0.0%) | 0 (0.0%) |
| Educational Services | 0 (0.0%) | 29 (100.0%) |
| Health Care & Social Assistance | 0 (0.0%) | 45 (100.0%) |
| Arts, Entertainment & Recreation | 0 (0.0%) | 0 (0.0%) |
| Accommodation & Food Services | 0 (0.0%) | 0 (0.0%) |
| Public Administration | 0 (0.0%) | 0 (0.0%) |
| Total | 134 (60.9%) | 86 (39.1%) |
Education in Iron Station
School Enrollment in Iron Station
The most common levels of schooling among the 293 students in Iron Station are elementary school (77 | 26.3%), high school (75 | 25.6%), and middle school (60 | 20.5%).
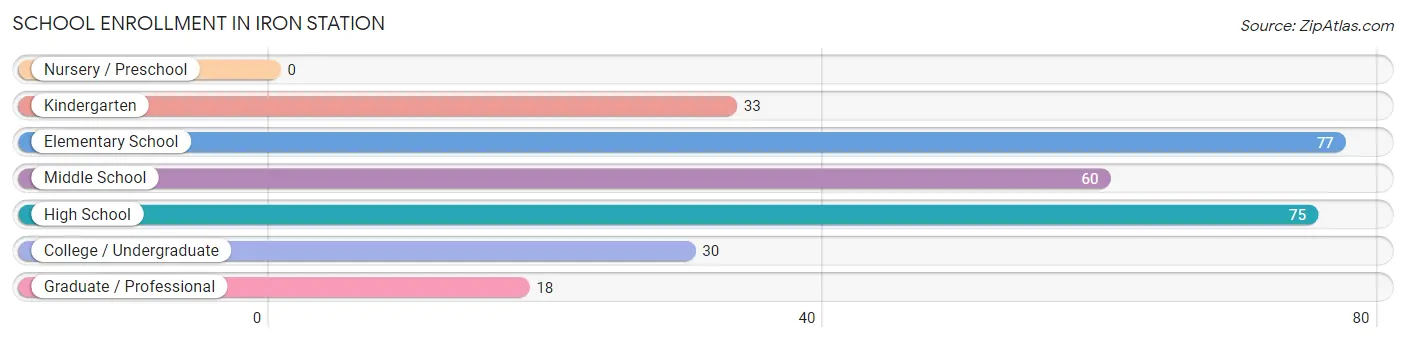
| School Level | # Students | % Students |
| Nursery / Preschool | 0 | 0.0% |
| Kindergarten | 33 | 11.3% |
| Elementary School | 77 | 26.3% |
| Middle School | 60 | 20.5% |
| High School | 75 | 25.6% |
| College / Undergraduate | 30 | 10.2% |
| Graduate / Professional | 18 | 6.1% |
| Total | 293 | 100.0% |
School Enrollment by Age by Funding Source in Iron Station
Out of a total of 293 students who are enrolled in schools in Iron Station, 18 (6.1%) attend a private institution, while the remaining 275 (93.9%) are enrolled in public schools. The age group of 35 years and over has the highest likelihood of being enrolled in private schools, with 18 (100.0% in the age bracket) enrolled. Conversely, the age group of 5 to 9 year old has the lowest likelihood of being enrolled in a private school, with 110 (100.0% in the age bracket) attending a public institution.
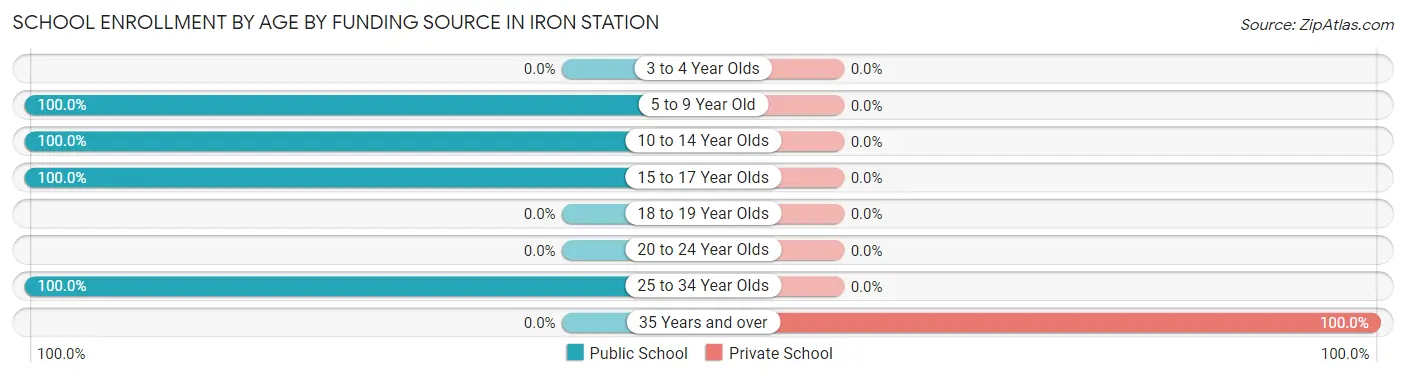
| Age Bracket | Public School | Private School |
| 3 to 4 Year Olds | 0 (0.0%) | 0 (0.0%) |
| 5 to 9 Year Old | 110 (100.0%) | 0 (0.0%) |
| 10 to 14 Year Olds | 45 (100.0%) | 0 (0.0%) |
| 15 to 17 Year Olds | 90 (100.0%) | 0 (0.0%) |
| 18 to 19 Year Olds | 0 (0.0%) | 0 (0.0%) |
| 20 to 24 Year Olds | 0 (0.0%) | 0 (0.0%) |
| 25 to 34 Year Olds | 30 (100.0%) | 0 (0.0%) |
| 35 Years and over | 0 (0.0%) | 18 (100.0%) |
| Total | 275 (93.9%) | 18 (6.1%) |
Educational Attainment by Field of Study in Iron Station
, and science & technology (34 | 100.0%) are the most common fields of study among 34 individuals in Iron Station who have obtained a bachelor's degree or higher.
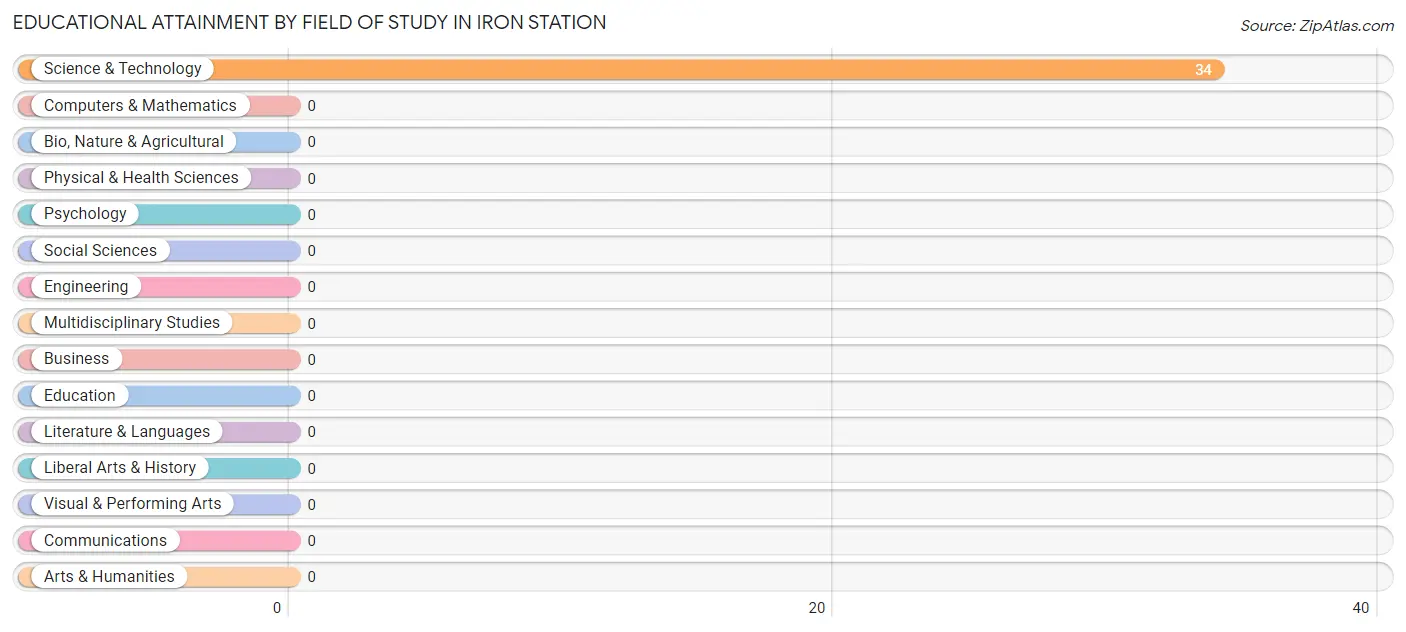
| Field of Study | # Graduates | % Graduates |
| Computers & Mathematics | 0 | 0.0% |
| Bio, Nature & Agricultural | 0 | 0.0% |
| Physical & Health Sciences | 0 | 0.0% |
| Psychology | 0 | 0.0% |
| Social Sciences | 0 | 0.0% |
| Engineering | 0 | 0.0% |
| Multidisciplinary Studies | 0 | 0.0% |
| Science & Technology | 34 | 100.0% |
| Business | 0 | 0.0% |
| Education | 0 | 0.0% |
| Literature & Languages | 0 | 0.0% |
| Liberal Arts & History | 0 | 0.0% |
| Visual & Performing Arts | 0 | 0.0% |
| Communications | 0 | 0.0% |
| Arts & Humanities | 0 | 0.0% |
| Total | 34 | 100.0% |
Transportation & Commute in Iron Station
Vehicle Availability by Sex in Iron Station
The most prevalent vehicle ownership categories in Iron Station are males with 2 vehicles (71, accounting for 53.0%) and females with 2 vehicles (45, making up 82.6%).
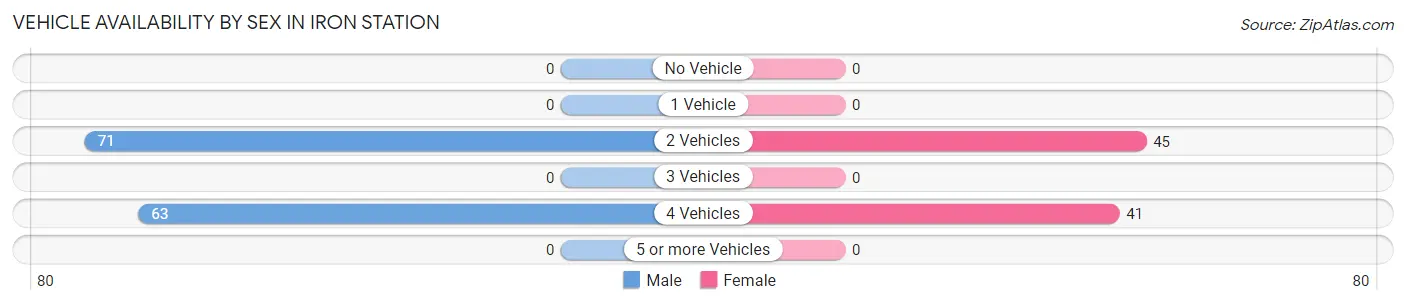
| Vehicles Available | Male | Female |
| No Vehicle | 0 (0.0%) | 0 (0.0%) |
| 1 Vehicle | 0 (0.0%) | 0 (0.0%) |
| 2 Vehicles | 71 (53.0%) | 45 (52.3%) |
| 3 Vehicles | 0 (0.0%) | 0 (0.0%) |
| 4 Vehicles | 63 (47.0%) | 41 (47.7%) |
| 5 or more Vehicles | 0 (0.0%) | 0 (0.0%) |
| Total | 134 (100.0%) | 86 (100.0%) |
Commute Time in Iron Station
The most frequently occuring commute durations in Iron Station are 15 to 19 minutes (81 commuters, 39.7%), 30 to 34 minutes (45 commuters, 22.1%), and 5 to 9 minutes (29 commuters, 14.2%).
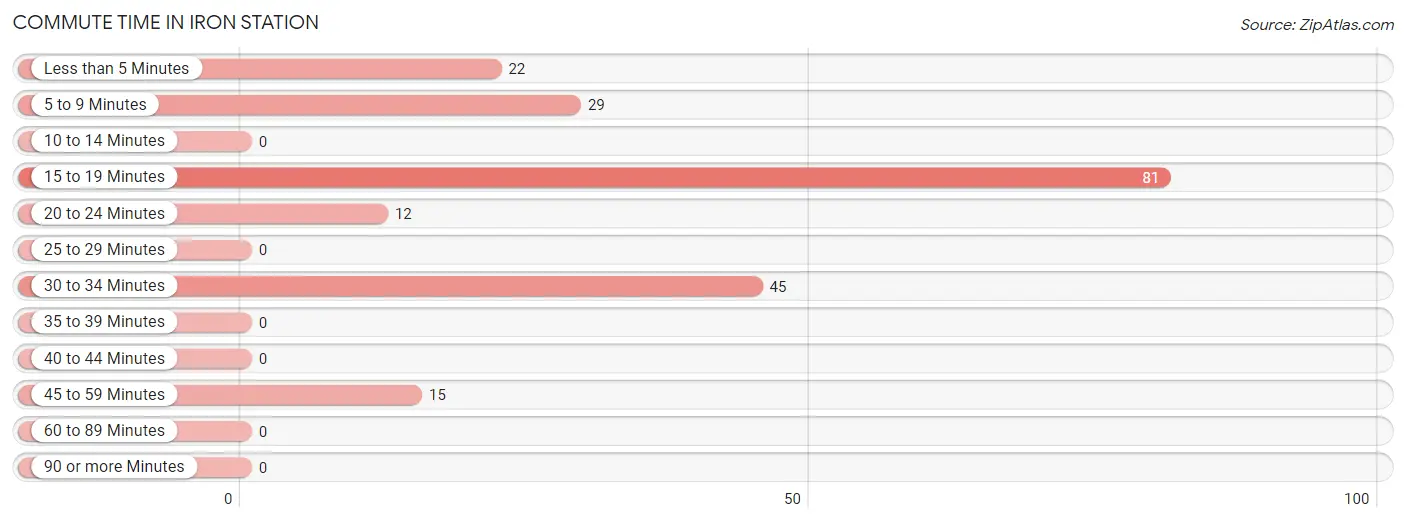
| Commute Time | # Commuters | % Commuters |
| Less than 5 Minutes | 22 | 10.8% |
| 5 to 9 Minutes | 29 | 14.2% |
| 10 to 14 Minutes | 0 | 0.0% |
| 15 to 19 Minutes | 81 | 39.7% |
| 20 to 24 Minutes | 12 | 5.9% |
| 25 to 29 Minutes | 0 | 0.0% |
| 30 to 34 Minutes | 45 | 22.1% |
| 35 to 39 Minutes | 0 | 0.0% |
| 40 to 44 Minutes | 0 | 0.0% |
| 45 to 59 Minutes | 15 | 7.3% |
| 60 to 89 Minutes | 0 | 0.0% |
| 90 or more Minutes | 0 | 0.0% |
Commute Time by Sex in Iron Station
The most common commute times in Iron Station are 30 to 34 minutes (34 commuters, 28.8%) for males and 15 to 19 minutes (48 commuters, 55.8%) for females.
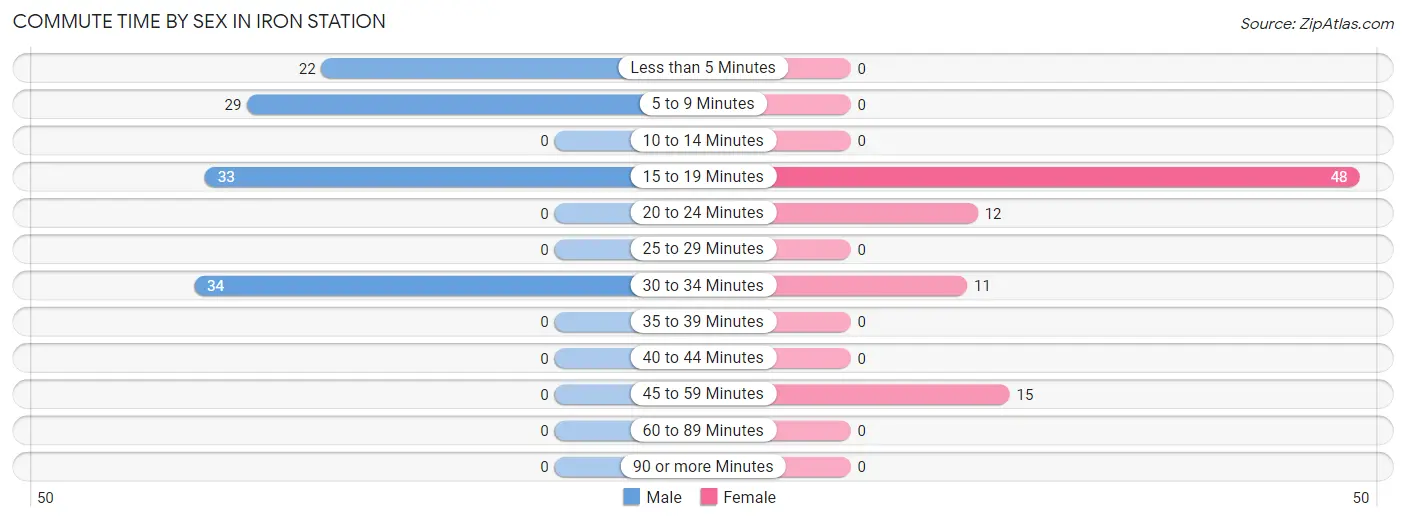
| Commute Time | Male | Female |
| Less than 5 Minutes | 22 (18.6%) | 0 (0.0%) |
| 5 to 9 Minutes | 29 (24.6%) | 0 (0.0%) |
| 10 to 14 Minutes | 0 (0.0%) | 0 (0.0%) |
| 15 to 19 Minutes | 33 (28.0%) | 48 (55.8%) |
| 20 to 24 Minutes | 0 (0.0%) | 12 (14.0%) |
| 25 to 29 Minutes | 0 (0.0%) | 0 (0.0%) |
| 30 to 34 Minutes | 34 (28.8%) | 11 (12.8%) |
| 35 to 39 Minutes | 0 (0.0%) | 0 (0.0%) |
| 40 to 44 Minutes | 0 (0.0%) | 0 (0.0%) |
| 45 to 59 Minutes | 0 (0.0%) | 15 (17.4%) |
| 60 to 89 Minutes | 0 (0.0%) | 0 (0.0%) |
| 90 or more Minutes | 0 (0.0%) | 0 (0.0%) |
Time of Departure to Work by Sex in Iron Station
The most frequent times of departure to work in Iron Station are 6:00 AM to 6:29 AM (51, 43.2%) for males and 7:00 AM to 7:29 AM (45, 52.3%) for females.
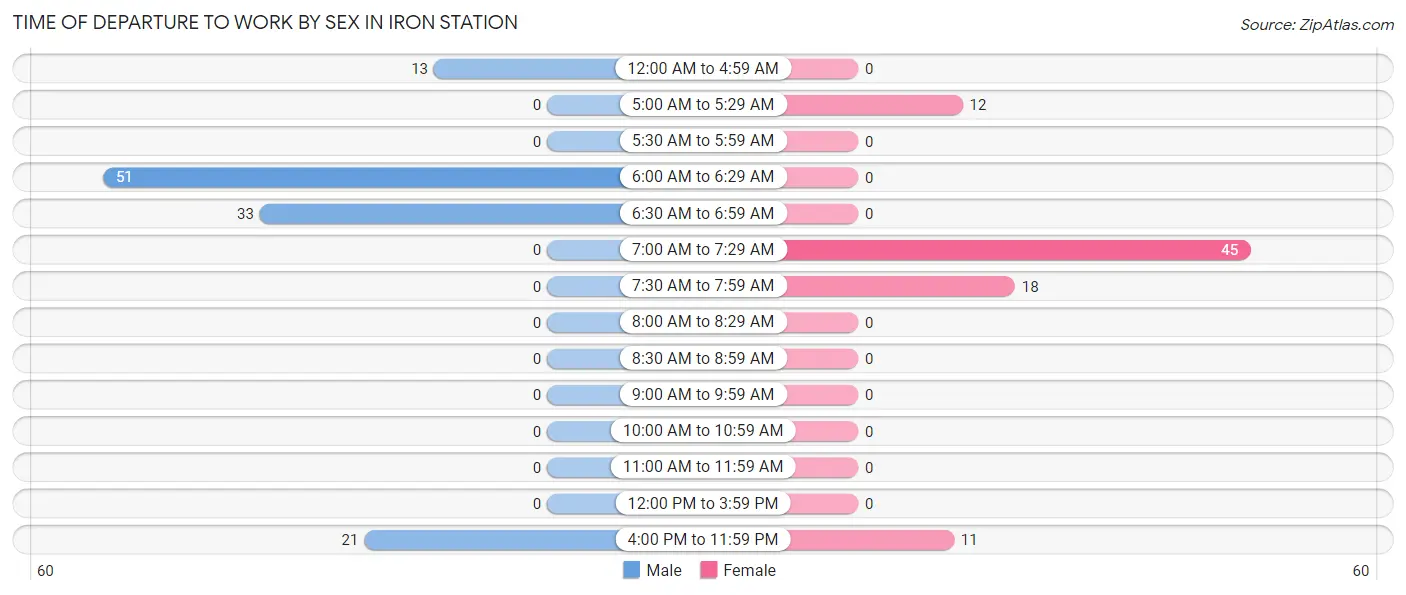
| Time of Departure | Male | Female |
| 12:00 AM to 4:59 AM | 13 (11.0%) | 0 (0.0%) |
| 5:00 AM to 5:29 AM | 0 (0.0%) | 12 (14.0%) |
| 5:30 AM to 5:59 AM | 0 (0.0%) | 0 (0.0%) |
| 6:00 AM to 6:29 AM | 51 (43.2%) | 0 (0.0%) |
| 6:30 AM to 6:59 AM | 33 (28.0%) | 0 (0.0%) |
| 7:00 AM to 7:29 AM | 0 (0.0%) | 45 (52.3%) |
| 7:30 AM to 7:59 AM | 0 (0.0%) | 18 (20.9%) |
| 8:00 AM to 8:29 AM | 0 (0.0%) | 0 (0.0%) |
| 8:30 AM to 8:59 AM | 0 (0.0%) | 0 (0.0%) |
| 9:00 AM to 9:59 AM | 0 (0.0%) | 0 (0.0%) |
| 10:00 AM to 10:59 AM | 0 (0.0%) | 0 (0.0%) |
| 11:00 AM to 11:59 AM | 0 (0.0%) | 0 (0.0%) |
| 12:00 PM to 3:59 PM | 0 (0.0%) | 0 (0.0%) |
| 4:00 PM to 11:59 PM | 21 (17.8%) | 11 (12.8%) |
| Total | 118 (100.0%) | 86 (100.0%) |
Housing Occupancy in Iron Station
Occupancy by Ownership in Iron Station
Of the total 263 dwellings in Iron Station, owner-occupied units account for 235 (89.3%), while renter-occupied units make up 28 (10.6%).
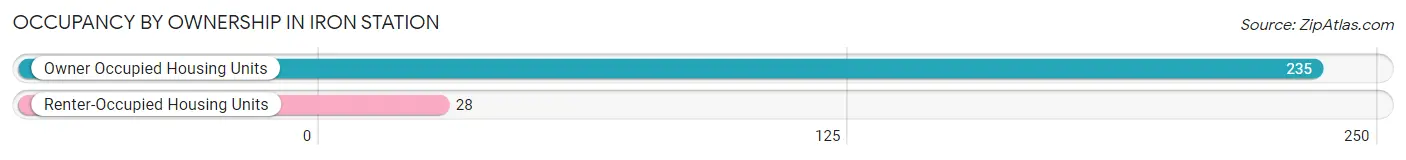
| Occupancy | # Housing Units | % Housing Units |
| Owner Occupied Housing Units | 235 | 89.3% |
| Renter-Occupied Housing Units | 28 | 10.6% |
| Total Occupied Housing Units | 263 | 100.0% |
Occupancy by Household Size in Iron Station
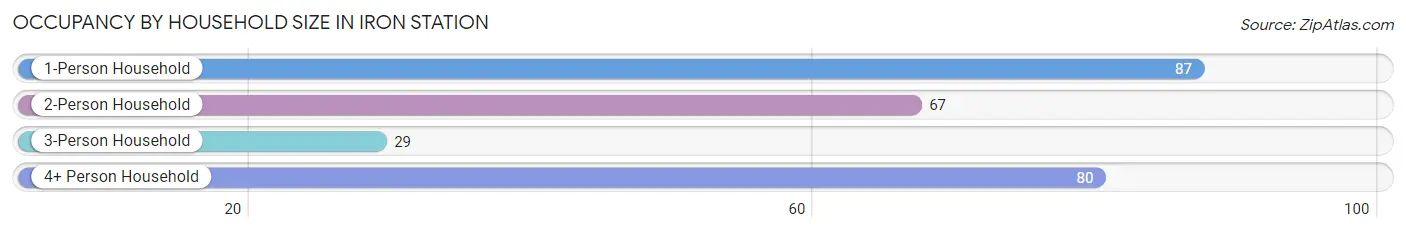
| Household Size | # Housing Units | % Housing Units |
| 1-Person Household | 87 | 33.1% |
| 2-Person Household | 67 | 25.5% |
| 3-Person Household | 29 | 11.0% |
| 4+ Person Household | 80 | 30.4% |
| Total Housing Units | 263 | 100.0% |
Occupancy by Ownership by Household Size in Iron Station
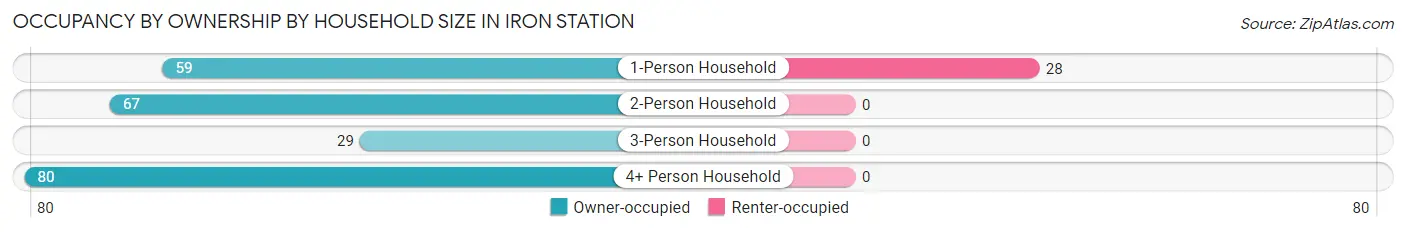
| Household Size | Owner-occupied | Renter-occupied |
| 1-Person Household | 59 (67.8%) | 28 (32.2%) |
| 2-Person Household | 67 (100.0%) | 0 (0.0%) |
| 3-Person Household | 29 (100.0%) | 0 (0.0%) |
| 4+ Person Household | 80 (100.0%) | 0 (0.0%) |
| Total Housing Units | 235 (89.3%) | 28 (10.6%) |
Occupancy by Educational Attainment in Iron Station
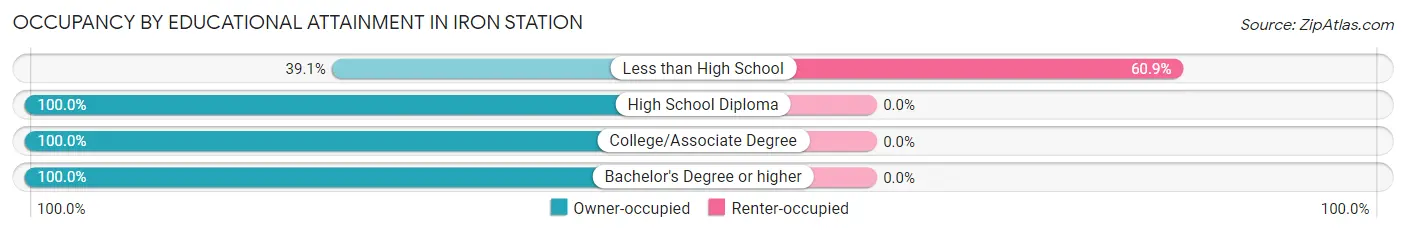
| Household Size | Owner-occupied | Renter-occupied |
| Less than High School | 18 (39.1%) | 28 (60.9%) |
| High School Diploma | 77 (100.0%) | 0 (0.0%) |
| College/Associate Degree | 106 (100.0%) | 0 (0.0%) |
| Bachelor's Degree or higher | 34 (100.0%) | 0 (0.0%) |
Occupancy by Age of Householder in Iron Station
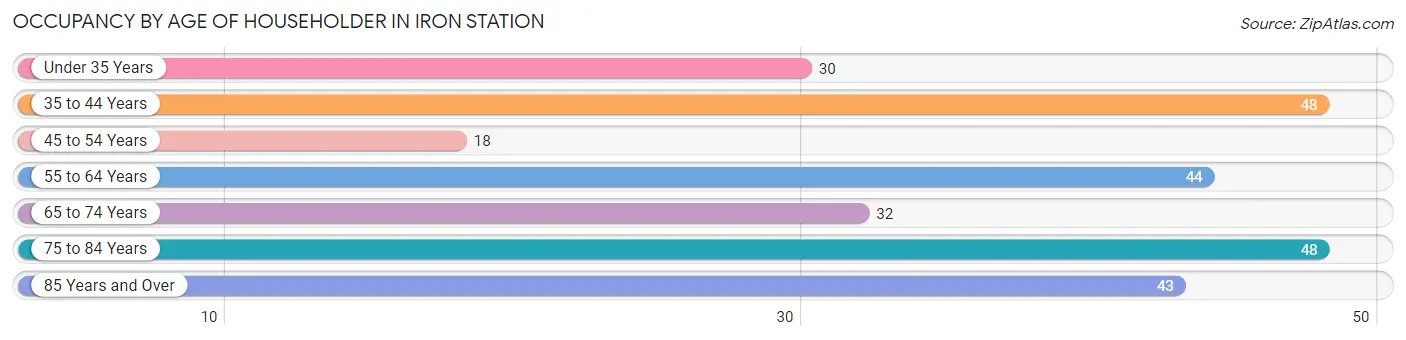
| Age Bracket | # Households | % Households |
| Under 35 Years | 30 | 11.4% |
| 35 to 44 Years | 48 | 18.2% |
| 45 to 54 Years | 18 | 6.8% |
| 55 to 64 Years | 44 | 16.7% |
| 65 to 74 Years | 32 | 12.2% |
| 75 to 84 Years | 48 | 18.2% |
| 85 Years and Over | 43 | 16.4% |
| Total | 263 | 100.0% |
Housing Finances in Iron Station
Median Income by Occupancy in Iron Station
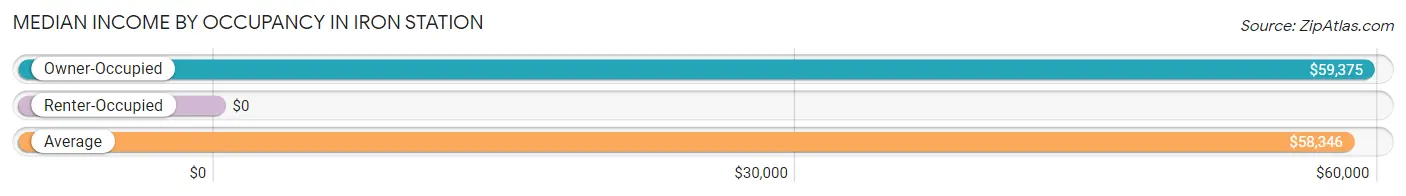
| Occupancy Type | # Households | Median Income |
| Owner-Occupied | 235 (89.3%) | $59,375 |
| Renter-Occupied | 28 (10.6%) | $0 |
| Average | 263 (100.0%) | $58,346 |
Occupancy by Householder Income Bracket in Iron Station
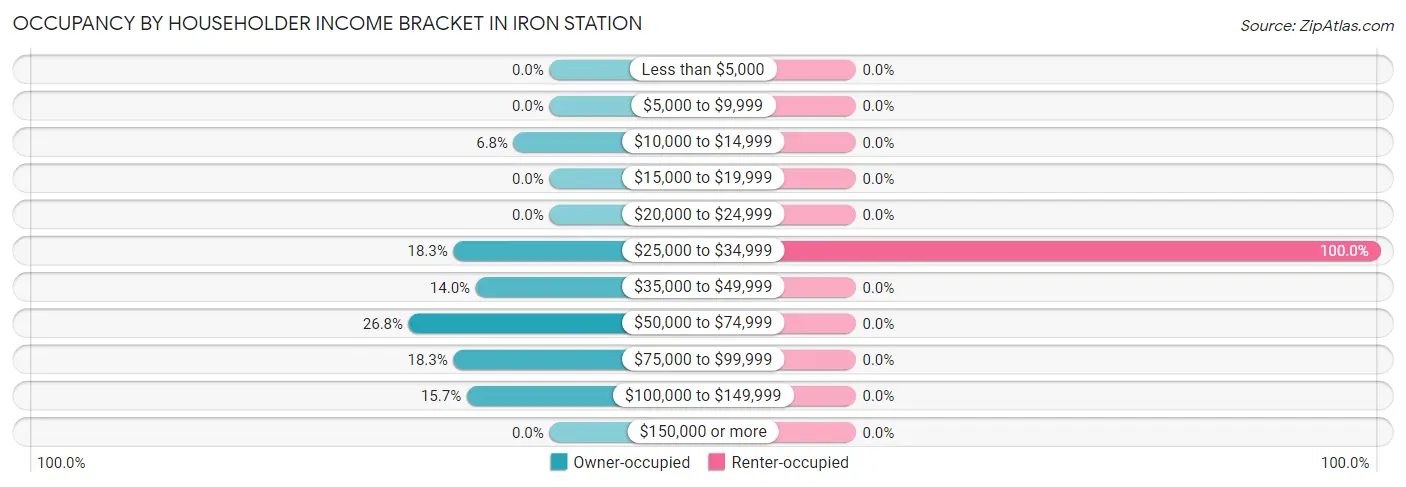
| Income Bracket | Owner-occupied | Renter-occupied |
| Less than $5,000 | 0 (0.0%) | 0 (0.0%) |
| $5,000 to $9,999 | 0 (0.0%) | 0 (0.0%) |
| $10,000 to $14,999 | 16 (6.8%) | 0 (0.0%) |
| $15,000 to $19,999 | 0 (0.0%) | 0 (0.0%) |
| $20,000 to $24,999 | 0 (0.0%) | 0 (0.0%) |
| $25,000 to $34,999 | 43 (18.3%) | 28 (100.0%) |
| $35,000 to $49,999 | 33 (14.0%) | 0 (0.0%) |
| $50,000 to $74,999 | 63 (26.8%) | 0 (0.0%) |
| $75,000 to $99,999 | 43 (18.3%) | 0 (0.0%) |
| $100,000 to $149,999 | 37 (15.7%) | 0 (0.0%) |
| $150,000 or more | 0 (0.0%) | 0 (0.0%) |
| Total | 235 (100.0%) | 28 (100.0%) |
Monthly Housing Cost Tiers in Iron Station
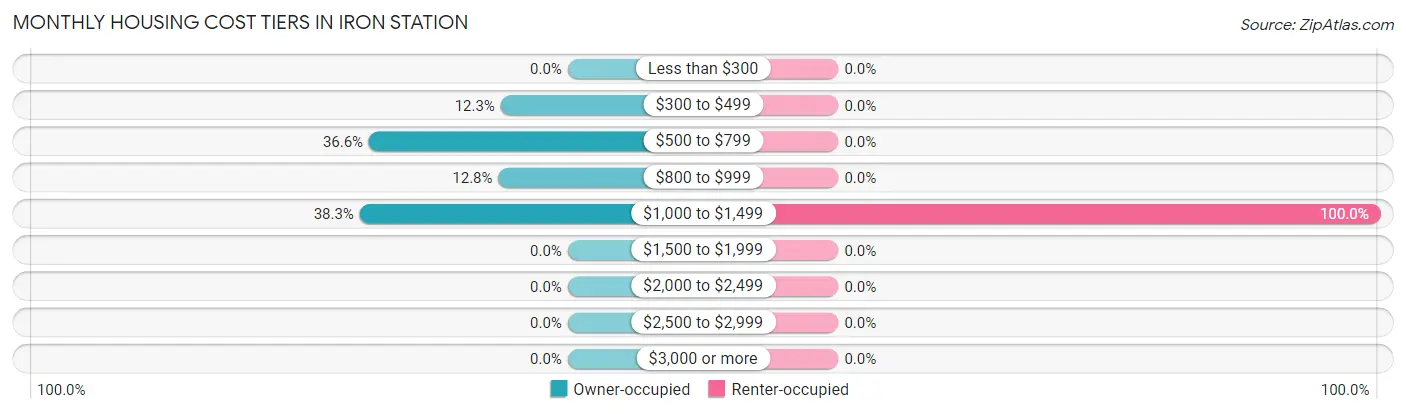
| Monthly Cost | Owner-occupied | Renter-occupied |
| Less than $300 | 0 (0.0%) | 0 (0.0%) |
| $300 to $499 | 29 (12.3%) | 0 (0.0%) |
| $500 to $799 | 86 (36.6%) | 0 (0.0%) |
| $800 to $999 | 30 (12.8%) | 0 (0.0%) |
| $1,000 to $1,499 | 90 (38.3%) | 28 (100.0%) |
| $1,500 to $1,999 | 0 (0.0%) | 0 (0.0%) |
| $2,000 to $2,499 | 0 (0.0%) | 0 (0.0%) |
| $2,500 to $2,999 | 0 (0.0%) | 0 (0.0%) |
| $3,000 or more | 0 (0.0%) | 0 (0.0%) |
| Total | 235 (100.0%) | 28 (100.0%) |
Physical Housing Characteristics in Iron Station
Housing Structures in Iron Station
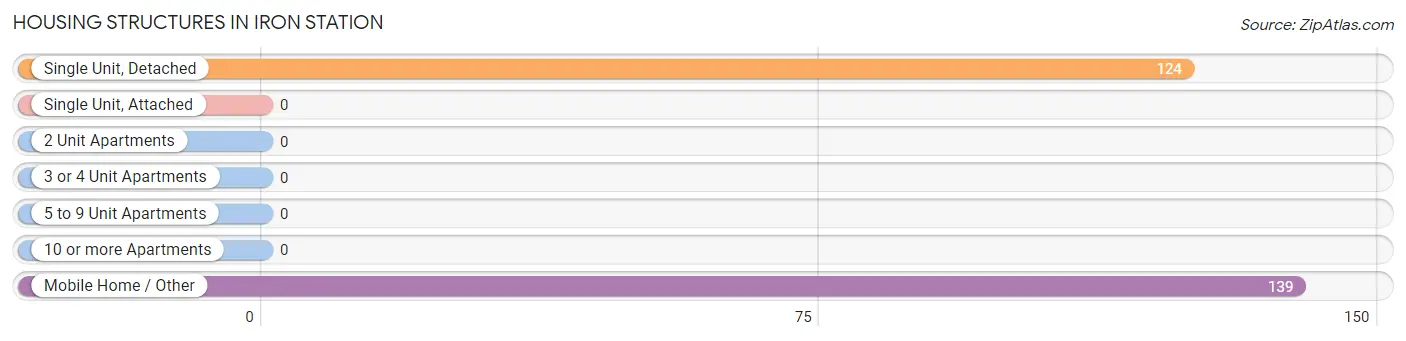
| Structure Type | # Housing Units | % Housing Units |
| Single Unit, Detached | 124 | 47.1% |
| Single Unit, Attached | 0 | 0.0% |
| 2 Unit Apartments | 0 | 0.0% |
| 3 or 4 Unit Apartments | 0 | 0.0% |
| 5 to 9 Unit Apartments | 0 | 0.0% |
| 10 or more Apartments | 0 | 0.0% |
| Mobile Home / Other | 139 | 52.8% |
| Total | 263 | 100.0% |
Housing Structures by Occupancy in Iron Station
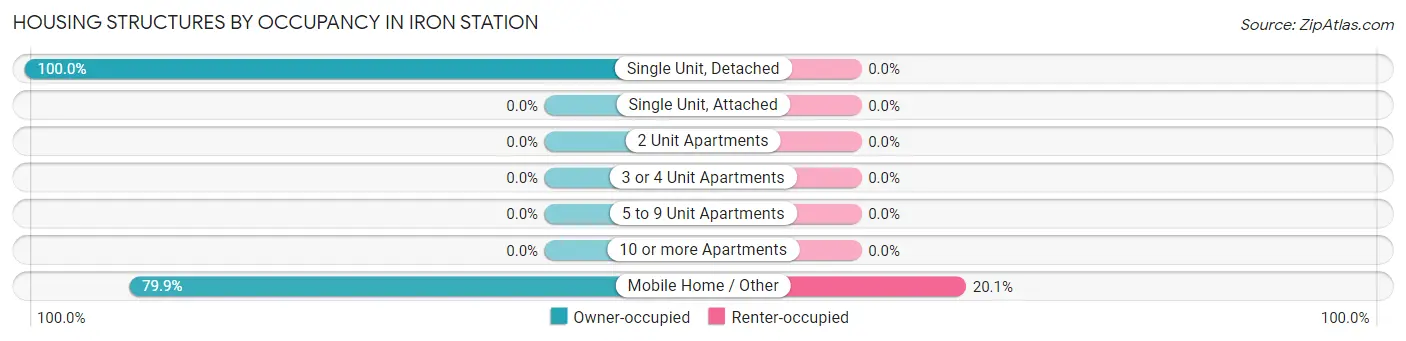
| Structure Type | Owner-occupied | Renter-occupied |
| Single Unit, Detached | 124 (100.0%) | 0 (0.0%) |
| Single Unit, Attached | 0 (0.0%) | 0 (0.0%) |
| 2 Unit Apartments | 0 (0.0%) | 0 (0.0%) |
| 3 or 4 Unit Apartments | 0 (0.0%) | 0 (0.0%) |
| 5 to 9 Unit Apartments | 0 (0.0%) | 0 (0.0%) |
| 10 or more Apartments | 0 (0.0%) | 0 (0.0%) |
| Mobile Home / Other | 111 (79.9%) | 28 (20.1%) |
| Total | 235 (89.3%) | 28 (10.6%) |
Housing Structures by Number of Rooms in Iron Station
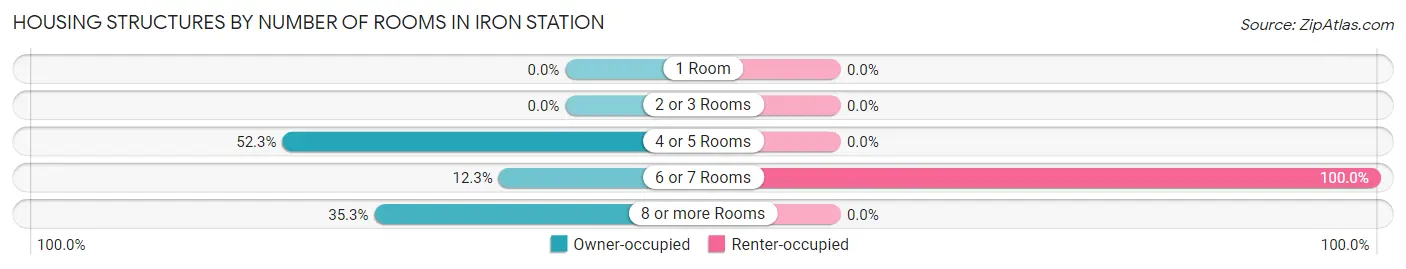
| Number of Rooms | Owner-occupied | Renter-occupied |
| 1 Room | 0 (0.0%) | 0 (0.0%) |
| 2 or 3 Rooms | 0 (0.0%) | 0 (0.0%) |
| 4 or 5 Rooms | 123 (52.3%) | 0 (0.0%) |
| 6 or 7 Rooms | 29 (12.3%) | 28 (100.0%) |
| 8 or more Rooms | 83 (35.3%) | 0 (0.0%) |
| Total | 235 (100.0%) | 28 (100.0%) |
Housing Structure by Heating Type in Iron Station
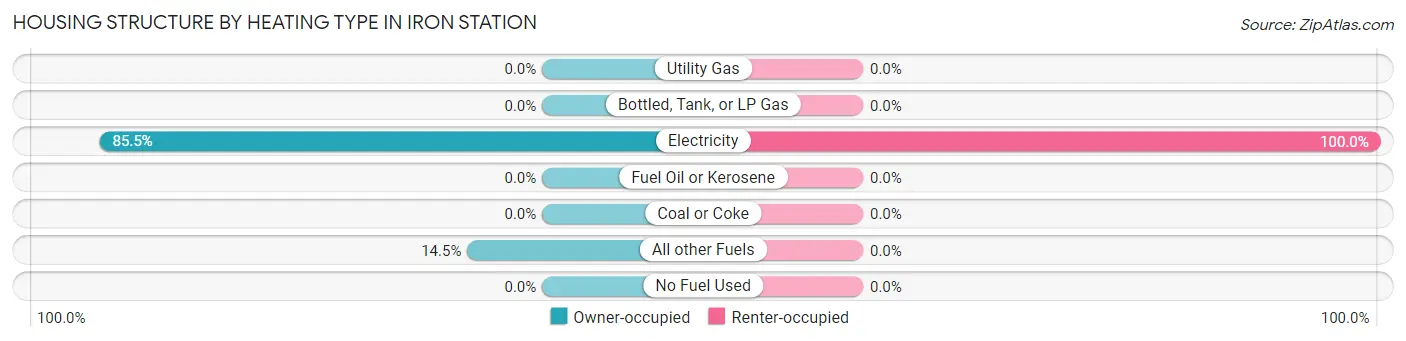
| Heating Type | Owner-occupied | Renter-occupied |
| Utility Gas | 0 (0.0%) | 0 (0.0%) |
| Bottled, Tank, or LP Gas | 0 (0.0%) | 0 (0.0%) |
| Electricity | 201 (85.5%) | 28 (100.0%) |
| Fuel Oil or Kerosene | 0 (0.0%) | 0 (0.0%) |
| Coal or Coke | 0 (0.0%) | 0 (0.0%) |
| All other Fuels | 34 (14.5%) | 0 (0.0%) |
| No Fuel Used | 0 (0.0%) | 0 (0.0%) |
| Total | 235 (100.0%) | 28 (100.0%) |
Household Vehicle Usage in Iron Station
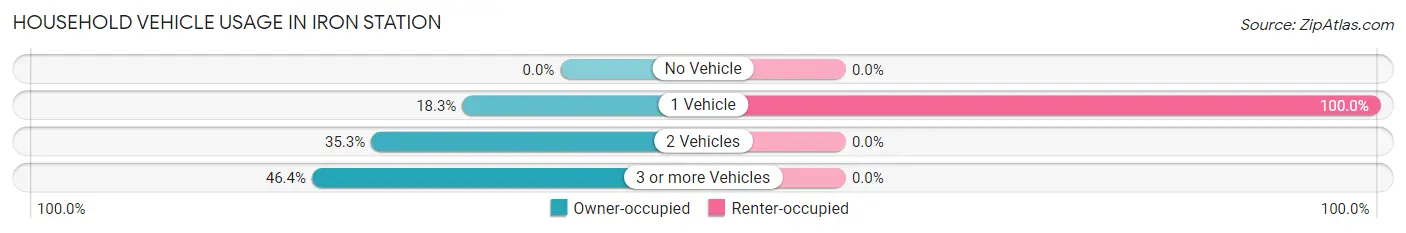
| Vehicles per Household | Owner-occupied | Renter-occupied |
| No Vehicle | 0 (0.0%) | 0 (0.0%) |
| 1 Vehicle | 43 (18.3%) | 28 (100.0%) |
| 2 Vehicles | 83 (35.3%) | 0 (0.0%) |
| 3 or more Vehicles | 109 (46.4%) | 0 (0.0%) |
| Total | 235 (100.0%) | 28 (100.0%) |
Real Estate & Mortgages in Iron Station
Real Estate and Mortgage Overview in Iron Station
| Characteristic | Without Mortgage | With Mortgage |
| Housing Units | 67 | 168 |
| Median Property Value | $303,100 | $152,200 |
| Median Household Income | $59,609 | $0 |
| Monthly Housing Costs | $538 | $0 |
| Real Estate Taxes | $1,828 | $0 |
Property Value by Mortgage Status in Iron Station
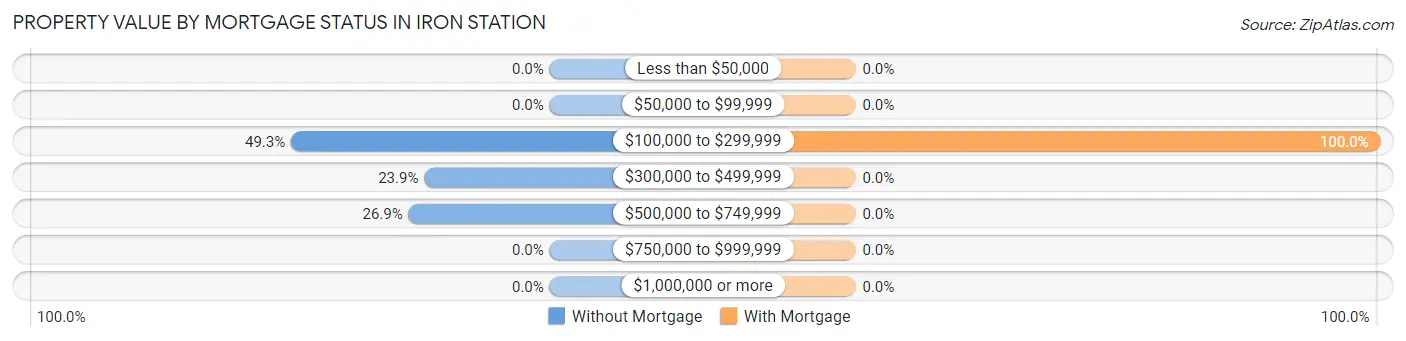
| Property Value | Without Mortgage | With Mortgage |
| Less than $50,000 | 0 (0.0%) | 0 (0.0%) |
| $50,000 to $99,999 | 0 (0.0%) | 0 (0.0%) |
| $100,000 to $299,999 | 33 (49.2%) | 168 (100.0%) |
| $300,000 to $499,999 | 16 (23.9%) | 0 (0.0%) |
| $500,000 to $749,999 | 18 (26.9%) | 0 (0.0%) |
| $750,000 to $999,999 | 0 (0.0%) | 0 (0.0%) |
| $1,000,000 or more | 0 (0.0%) | 0 (0.0%) |
| Total | 67 (100.0%) | 168 (100.0%) |
Household Income by Mortgage Status in Iron Station
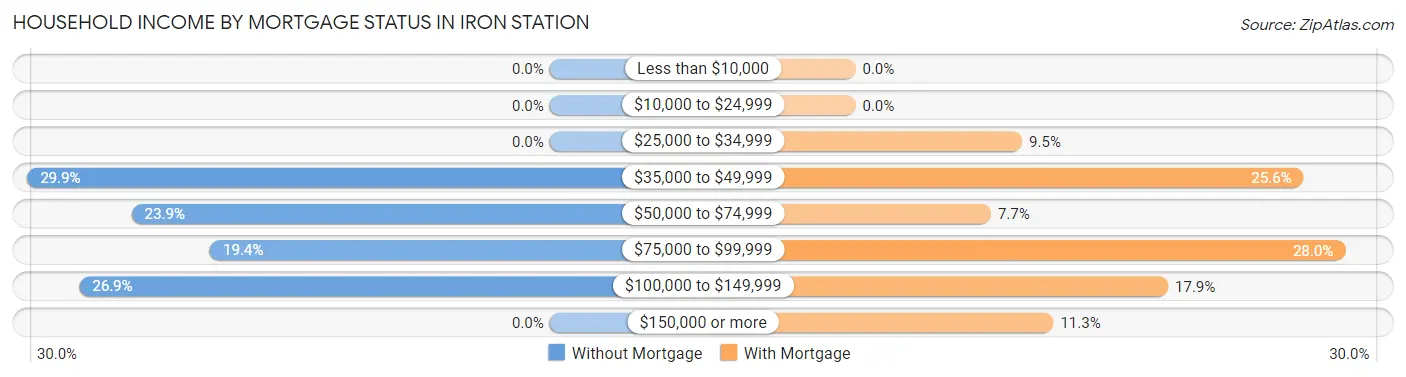
| Household Income | Without Mortgage | With Mortgage |
| Less than $10,000 | 0 (0.0%) | 0 (0.0%) |
| $10,000 to $24,999 | 0 (0.0%) | 0 (0.0%) |
| $25,000 to $34,999 | 0 (0.0%) | 16 (9.5%) |
| $35,000 to $49,999 | 20 (29.8%) | 43 (25.6%) |
| $50,000 to $74,999 | 16 (23.9%) | 13 (7.7%) |
| $75,000 to $99,999 | 13 (19.4%) | 47 (28.0%) |
| $100,000 to $149,999 | 18 (26.9%) | 30 (17.9%) |
| $150,000 or more | 0 (0.0%) | 19 (11.3%) |
| Total | 67 (100.0%) | 168 (100.0%) |
Property Value to Household Income Ratio in Iron Station
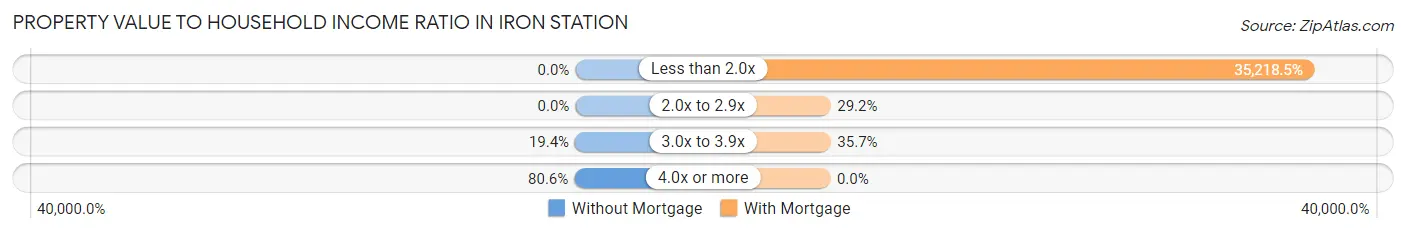
| Value-to-Income Ratio | Without Mortgage | With Mortgage |
| Less than 2.0x | 0 (0.0%) | 59,167 (35,218.5%) |
| 2.0x to 2.9x | 0 (0.0%) | 49 (29.2%) |
| 3.0x to 3.9x | 13 (19.4%) | 60 (35.7%) |
| 4.0x or more | 54 (80.6%) | 0 (0.0%) |
| Total | 67 (100.0%) | 168 (100.0%) |
Real Estate Taxes by Mortgage Status in Iron Station
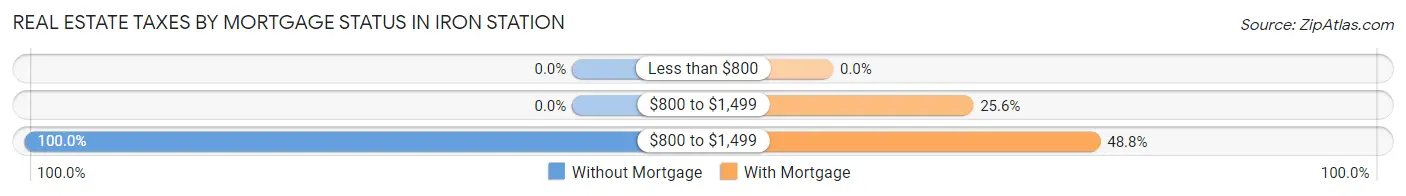
| Property Taxes | Without Mortgage | With Mortgage |
| Less than $800 | 0 (0.0%) | 0 (0.0%) |
| $800 to $1,499 | 0 (0.0%) | 43 (25.6%) |
| $800 to $1,499 | 67 (100.0%) | 82 (48.8%) |
| Total | 67 (100.0%) | 168 (100.0%) |
Health & Disability in Iron Station
Health Insurance Coverage by Age in Iron Station
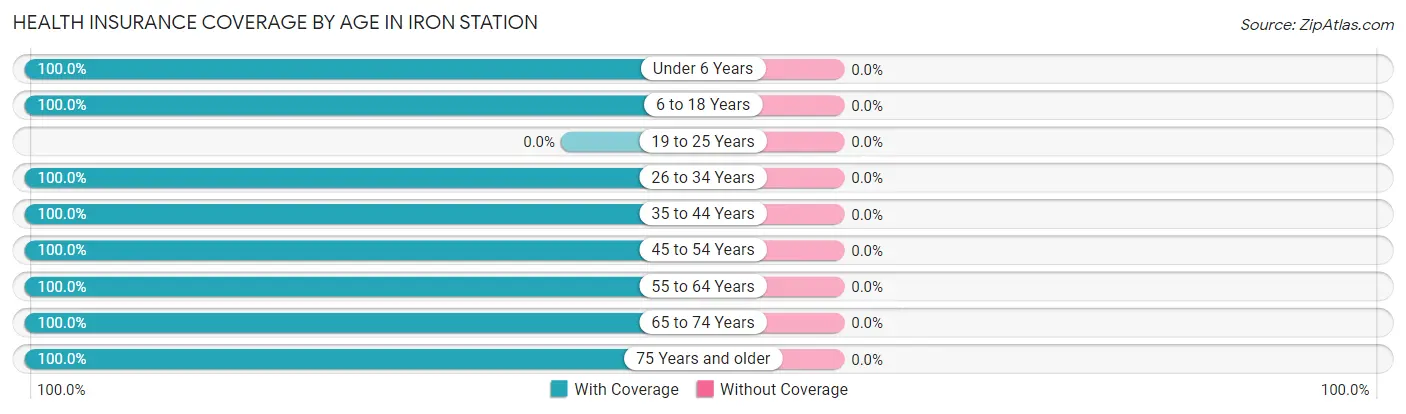
| Age Bracket | With Coverage | Without Coverage |
| Under 6 Years | 44 (100.0%) | 0 (0.0%) |
| 6 to 18 Years | 245 (100.0%) | 0 (0.0%) |
| 19 to 25 Years | 0 (0.0%) | 0 (0.0%) |
| 26 to 34 Years | 42 (100.0%) | 0 (0.0%) |
| 35 to 44 Years | 81 (100.0%) | 0 (0.0%) |
| 45 to 54 Years | 40 (100.0%) | 0 (0.0%) |
| 55 to 64 Years | 91 (100.0%) | 0 (0.0%) |
| 65 to 74 Years | 32 (100.0%) | 0 (0.0%) |
| 75 Years and older | 124 (100.0%) | 0 (0.0%) |
| Total | 699 (100.0%) | 0 (0.0%) |
Health Insurance Coverage by Citizenship Status in Iron Station
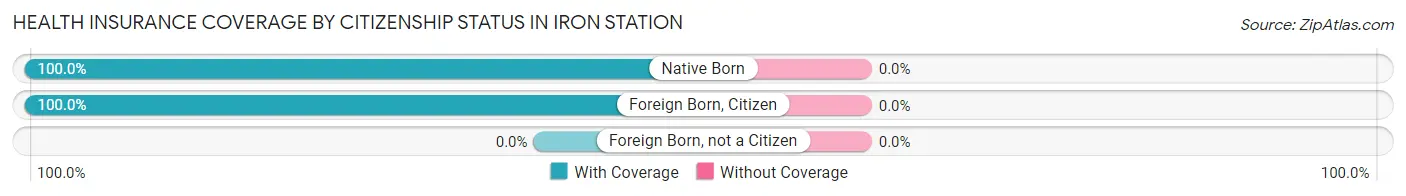
| Citizenship Status | With Coverage | Without Coverage |
| Native Born | 44 (100.0%) | 0 (0.0%) |
| Foreign Born, Citizen | 245 (100.0%) | 0 (0.0%) |
| Foreign Born, not a Citizen | 0 (0.0%) | 0 (0.0%) |
Health Insurance Coverage by Household Income in Iron Station
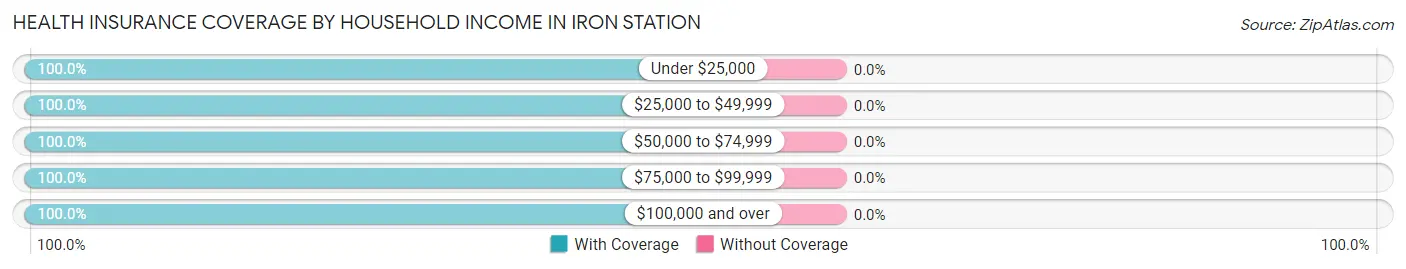
| Household Income | With Coverage | Without Coverage |
| Under $25,000 | 16 (100.0%) | 0 (0.0%) |
| $25,000 to $49,999 | 185 (100.0%) | 0 (0.0%) |
| $50,000 to $74,999 | 159 (100.0%) | 0 (0.0%) |
| $75,000 to $99,999 | 152 (100.0%) | 0 (0.0%) |
| $100,000 and over | 187 (100.0%) | 0 (0.0%) |
Public vs Private Health Insurance Coverage by Age in Iron Station
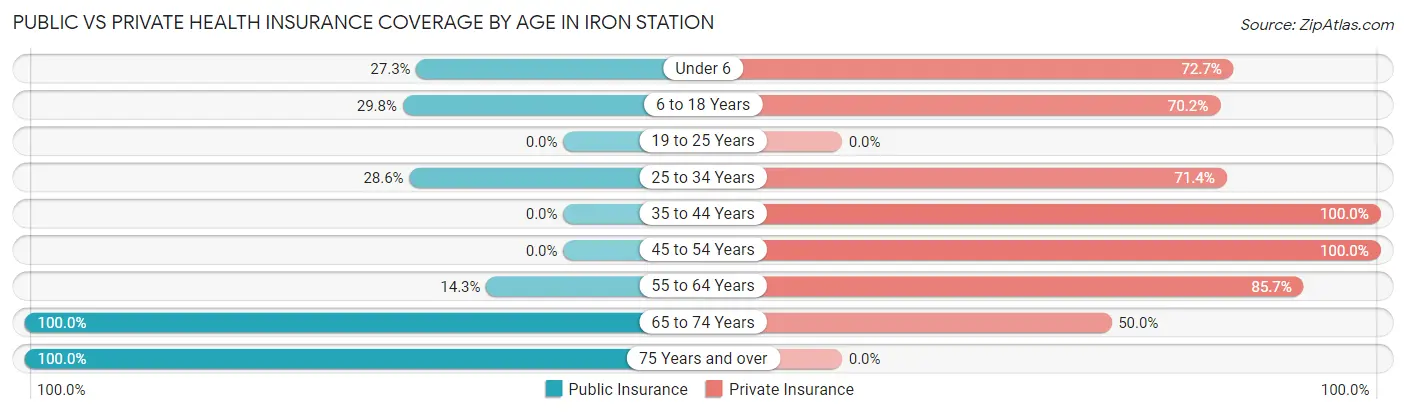
| Age Bracket | Public Insurance | Private Insurance |
| Under 6 | 12 (27.3%) | 32 (72.7%) |
| 6 to 18 Years | 73 (29.8%) | 172 (70.2%) |
| 19 to 25 Years | 0 (0.0%) | 0 (0.0%) |
| 25 to 34 Years | 12 (28.6%) | 30 (71.4%) |
| 35 to 44 Years | 0 (0.0%) | 81 (100.0%) |
| 45 to 54 Years | 0 (0.0%) | 40 (100.0%) |
| 55 to 64 Years | 13 (14.3%) | 78 (85.7%) |
| 65 to 74 Years | 32 (100.0%) | 16 (50.0%) |
| 75 Years and over | 124 (100.0%) | 0 (0.0%) |
| Total | 266 (38.1%) | 449 (64.2%) |
Disability Status by Sex by Age in Iron Station
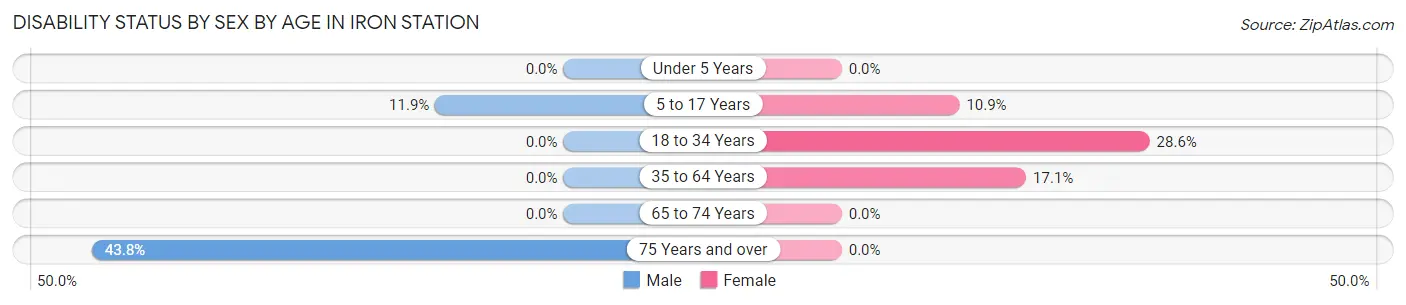
| Age Bracket | Male | Female |
| Under 5 Years | 0 (0.0%) | 0 (0.0%) |
| 5 to 17 Years | 15 (11.9%) | 13 (10.9%) |
| 18 to 34 Years | 0 (0.0%) | 12 (28.6%) |
| 35 to 64 Years | 0 (0.0%) | 13 (17.1%) |
| 65 to 74 Years | 0 (0.0%) | 0 (0.0%) |
| 75 Years and over | 28 (43.8%) | 0 (0.0%) |
Disability Class by Sex by Age in Iron Station
Disability Class: Hearing Difficulty
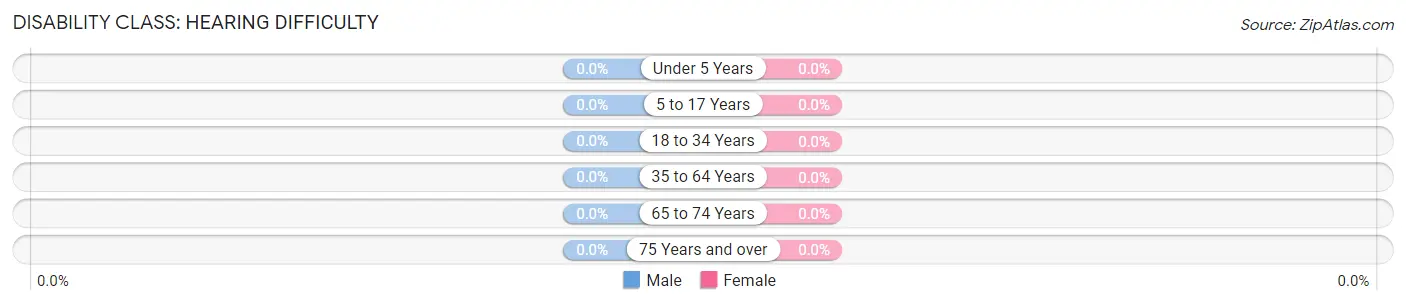
| Age Bracket | Male | Female |
| Under 5 Years | 0 (0.0%) | 0 (0.0%) |
| 5 to 17 Years | 0 (0.0%) | 0 (0.0%) |
| 18 to 34 Years | 0 (0.0%) | 0 (0.0%) |
| 35 to 64 Years | 0 (0.0%) | 0 (0.0%) |
| 65 to 74 Years | 0 (0.0%) | 0 (0.0%) |
| 75 Years and over | 0 (0.0%) | 0 (0.0%) |
Disability Class: Vision Difficulty
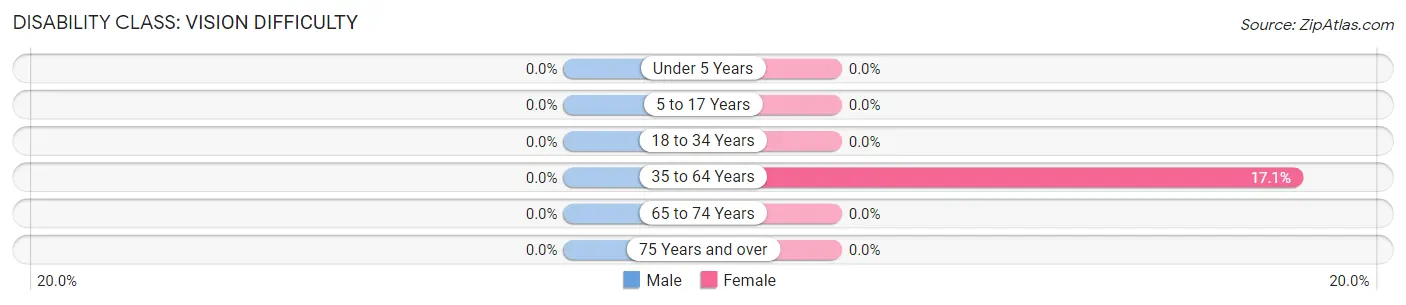
| Age Bracket | Male | Female |
| Under 5 Years | 0 (0.0%) | 0 (0.0%) |
| 5 to 17 Years | 0 (0.0%) | 0 (0.0%) |
| 18 to 34 Years | 0 (0.0%) | 0 (0.0%) |
| 35 to 64 Years | 0 (0.0%) | 13 (17.1%) |
| 65 to 74 Years | 0 (0.0%) | 0 (0.0%) |
| 75 Years and over | 0 (0.0%) | 0 (0.0%) |
Disability Class: Cognitive Difficulty
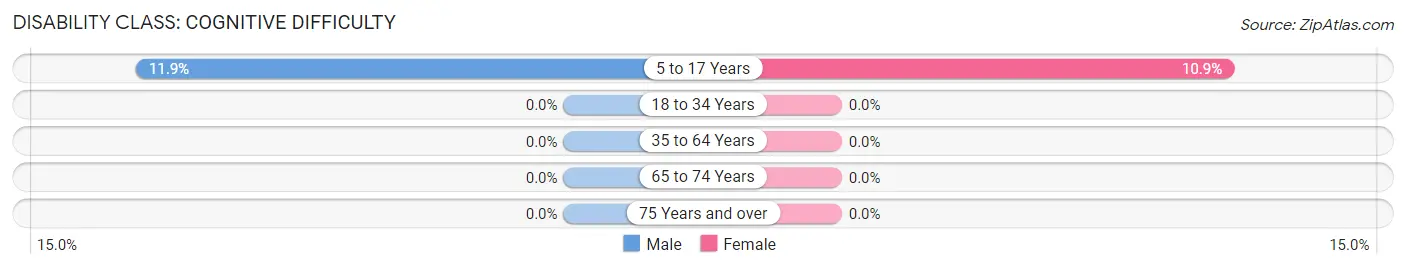
| Age Bracket | Male | Female |
| 5 to 17 Years | 15 (11.9%) | 13 (10.9%) |
| 18 to 34 Years | 0 (0.0%) | 0 (0.0%) |
| 35 to 64 Years | 0 (0.0%) | 0 (0.0%) |
| 65 to 74 Years | 0 (0.0%) | 0 (0.0%) |
| 75 Years and over | 0 (0.0%) | 0 (0.0%) |
Disability Class: Ambulatory Difficulty
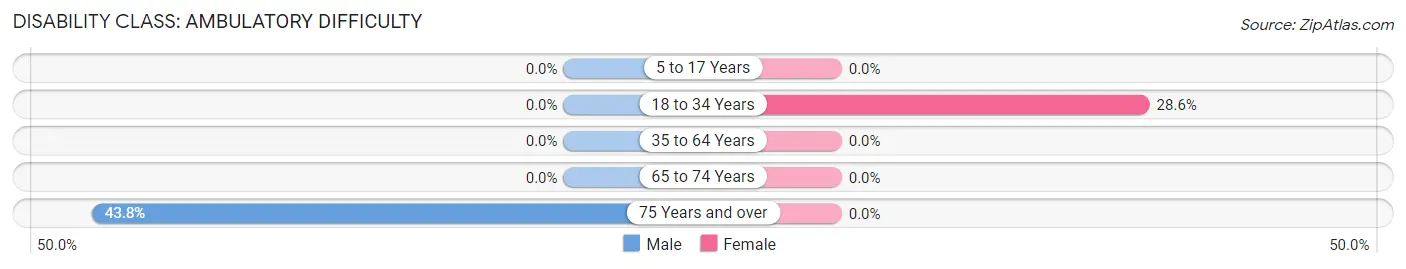
| Age Bracket | Male | Female |
| 5 to 17 Years | 0 (0.0%) | 0 (0.0%) |
| 18 to 34 Years | 0 (0.0%) | 12 (28.6%) |
| 35 to 64 Years | 0 (0.0%) | 0 (0.0%) |
| 65 to 74 Years | 0 (0.0%) | 0 (0.0%) |
| 75 Years and over | 28 (43.8%) | 0 (0.0%) |
Disability Class: Self-Care Difficulty
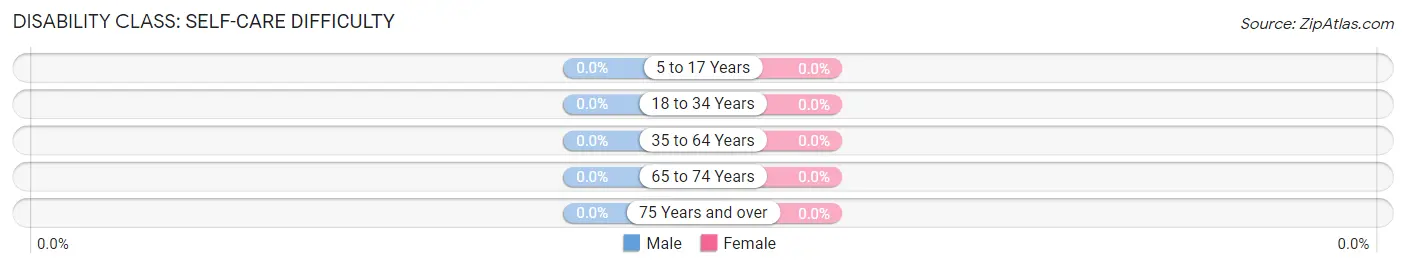
| Age Bracket | Male | Female |
| 5 to 17 Years | 0 (0.0%) | 0 (0.0%) |
| 18 to 34 Years | 0 (0.0%) | 0 (0.0%) |
| 35 to 64 Years | 0 (0.0%) | 0 (0.0%) |
| 65 to 74 Years | 0 (0.0%) | 0 (0.0%) |
| 75 Years and over | 0 (0.0%) | 0 (0.0%) |
Technology Access in Iron Station
Computing Device Access in Iron Station
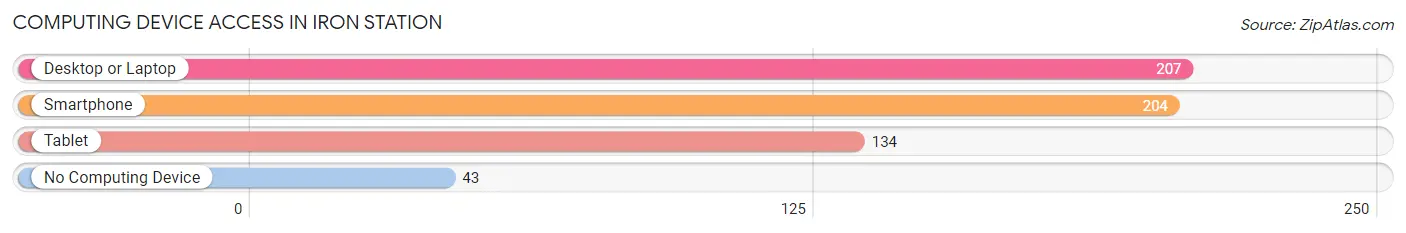
| Device Type | # Households | % Households |
| Desktop or Laptop | 207 | 78.7% |
| Smartphone | 204 | 77.6% |
| Tablet | 134 | 50.9% |
| No Computing Device | 43 | 16.4% |
| Total | 263 | 100.0% |
Internet Access in Iron Station
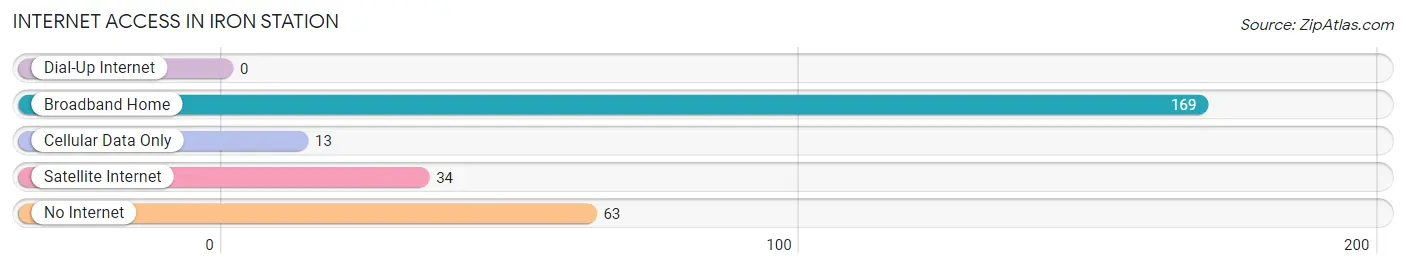
| Internet Type | # Households | % Households |
| Dial-Up Internet | 0 | 0.0% |
| Broadband Home | 169 | 64.3% |
| Cellular Data Only | 13 | 4.9% |
| Satellite Internet | 34 | 12.9% |
| No Internet | 63 | 23.9% |
| Total | 263 | 100.0% |
Iron Station Summary
Iron Station is an unincorporated community located in Lincoln County, North Carolina. It is situated in the foothills of the Blue Ridge Mountains, approximately 25 miles northwest of Charlotte. The population of Iron Station was estimated to be 1,845 in 2019.
History
Iron Station was first settled in the late 1700s by a group of German immigrants. The town was originally known as Iron Works, named after the iron ore found in the area. The ore was used to make tools and weapons for the Revolutionary War. In the early 1800s, the town was renamed Iron Station after the railroad station that was built in the area.
The town grew rapidly in the late 1800s and early 1900s due to the railroad and the iron ore industry. The town was home to several iron ore mines, a foundry, and a blacksmith shop. The railroad station was a major hub for the transportation of goods and people.
In the early 1900s, the town began to decline due to the decline of the iron ore industry. The railroad station closed in the 1950s and the town’s population began to decline. In the late 1990s, the town began to experience a resurgence due to the growth of nearby Charlotte.
Geography
Iron Station is located in the foothills of the Blue Ridge Mountains in Lincoln County, North Carolina. The town is situated at an elevation of 890 feet above sea level. The town is located approximately 25 miles northwest of Charlotte and is bordered by the towns of Denver and Lincolnton.
The town is located in a rural area and is surrounded by rolling hills and forests. The Catawba River runs through the town and is a popular spot for fishing and boating. The town is also home to several parks and recreational areas, including Iron Station Park and Iron Station Nature Preserve.
Economy
Iron Station’s economy is largely based on agriculture and tourism. The town is home to several farms that produce a variety of crops, including corn, soybeans, and wheat. The town is also home to several wineries and breweries, as well as a number of restaurants and shops.
The town is also home to several manufacturing companies, including a furniture factory and a plastics factory. The town is also home to several small businesses, including a hardware store, a grocery store, and a gas station.
Demographics
As of 2019, the population of Iron Station was estimated to be 1,845. The town is predominantly white, with approximately 87% of the population identifying as white. The remaining population is made up of African Americans (7%), Hispanics (3%), and other races (3%).
The median household income in Iron Station is $45,000, which is slightly lower than the national average. The median home value in the town is $150,000, which is slightly higher than the national average. The town has a poverty rate of 15%, which is slightly higher than the national average.
Conclusion
Iron Station is a small unincorporated community located in Lincoln County, North Carolina. The town is situated in the foothills of the Blue Ridge Mountains and is approximately 25 miles northwest of Charlotte. The town has a population of 1,845 and is predominantly white. The town’s economy is largely based on agriculture and tourism, and the median household income is $45,000. Iron Station is a rural community with a rich history and a bright future.
Common Questions
What is Per Capita Income in Iron Station?
Per Capita income in Iron Station is $23,428.
What is the Median Family Income in Iron Station?
Median Family Income in Iron Station is $71,810.
What is the Median Household income in Iron Station?
Median Household Income in Iron Station is $58,346.
What is Income or Wage Gap in Iron Station?
Income or Wage Gap in Iron Station is 62.8%.
Women in Iron Station earn 37.2 cents for every dollar earned by a man.
What is Inequality or Gini Index in Iron Station?
Inequality or Gini Index in Iron Station is 0.30.
What is the Total Population of Iron Station?
Total Population of Iron Station is 699.
What is the Total Male Population of Iron Station?
Total Male Population of Iron Station is 374.
What is the Total Female Population of Iron Station?
Total Female Population of Iron Station is 325.
What is the Ratio of Males per 100 Females in Iron Station?
There are 115.08 Males per 100 Females in Iron Station.
What is the Ratio of Females per 100 Males in Iron Station?
There are 86.90 Females per 100 Males in Iron Station.
What is the Median Population Age in Iron Station?
Median Population Age in Iron Station is 38.6 Years.
What is the Average Family Size in Iron Station
Average Family Size in Iron Station is 3.5 People.
What is the Average Household Size in Iron Station
Average Household Size in Iron Station is 2.7 People.
How Large is the Labor Force in Iron Station?
There are 220 People in the Labor Forcein in Iron Station.
What is the Percentage of People in the Labor Force in Iron Station?
53.7% of People are in the Labor Force in Iron Station.