Valley Bend, WV Map & Demographics
Valley Bend Map
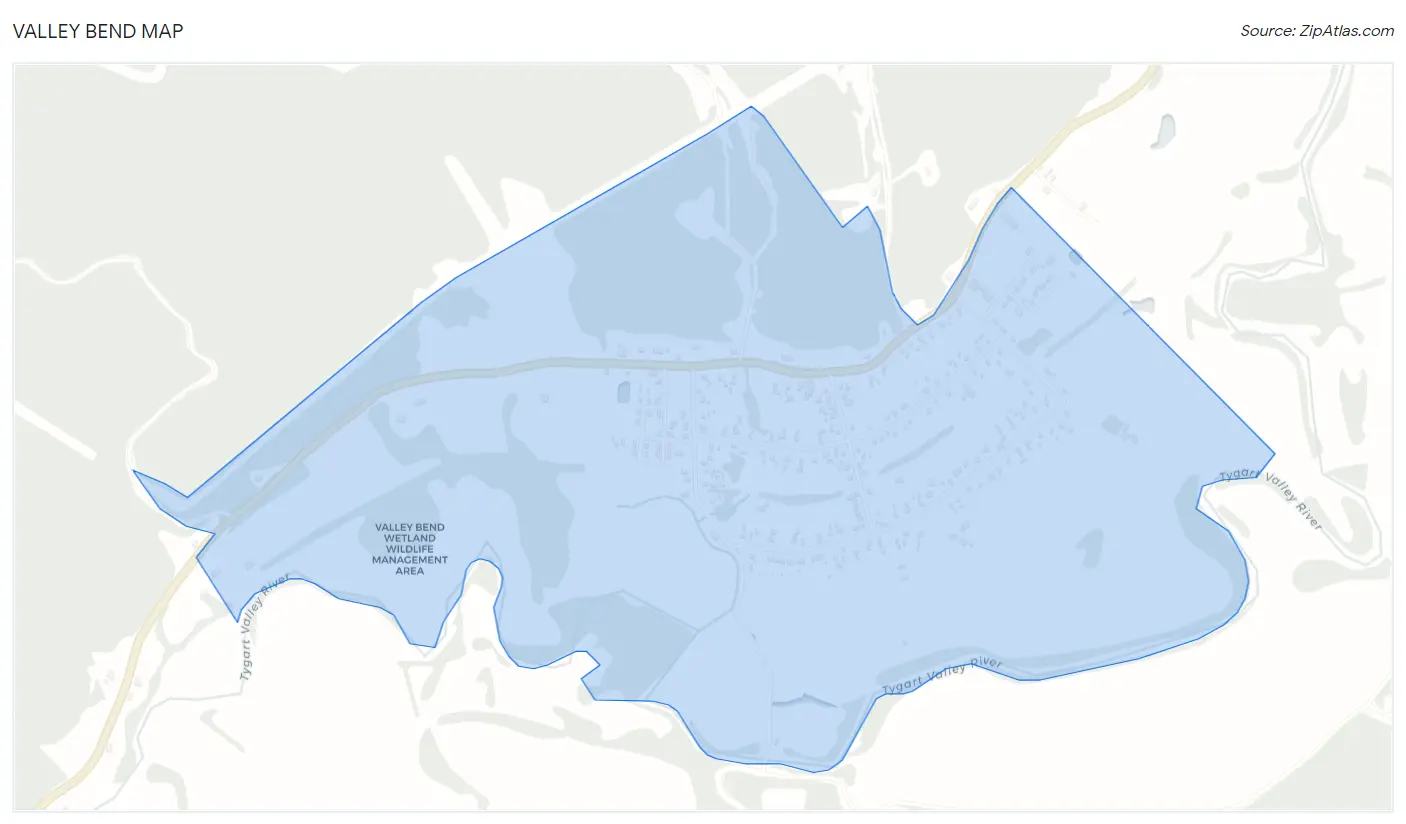
Valley Bend Overview
$52,228
PER CAPITA INCOME
$128,173
AVG HOUSEHOLD INCOME
0.31
INEQUALITY / GINI INDEX
585
TOTAL POPULATION
265
MALE POPULATION
320
FEMALE POPULATION
82.81
MALES / 100 FEMALES
120.75
FEMALES / 100 MALES
39.6
MEDIAN AGE
2.5
AVG FAMILY SIZE
2.7
AVG HOUSEHOLD SIZE
313
LABOR FORCE [ PEOPLE ]
63.5%
PERCENT IN LABOR FORCE
3.8%
UNEMPLOYMENT RATE
Valley Bend Zip Codes
Valley Bend Area Codes
Income in Valley Bend
Income Overview in Valley Bend
| Characteristic | Number | Measure |
| Per Capita Income | 585 | $52,228 |
| Median Family Income | 186 | $0 |
| Mean Family Income | 186 | $104,099 |
| Median Household Income | 215 | $128,173 |
| Mean Household Income | 215 | $117,581 |
| Income Deficit | 186 | $0 |
| Wage / Income Gap (%) | 585 | 0.00% |
| Wage / Income Gap ($) | 585 | 100.00¢ per $1 |
| Gini / Inequality Index | 585 | 0.31 |
Earnings by Sex in Valley Bend
| Sex | Number | Average Earnings |
| Male | 104 (34.5%) | $0 |
| Female | 197 (65.4%) | $0 |
| Total | 301 (100.0%) | $0 |
Earnings by Sex by Income Bracket in Valley Bend
The most common earnings brackets in Valley Bend are $100,000+ for men (34 | 32.7%) and $75,000 to $99,999 for women (79 | 40.1%).
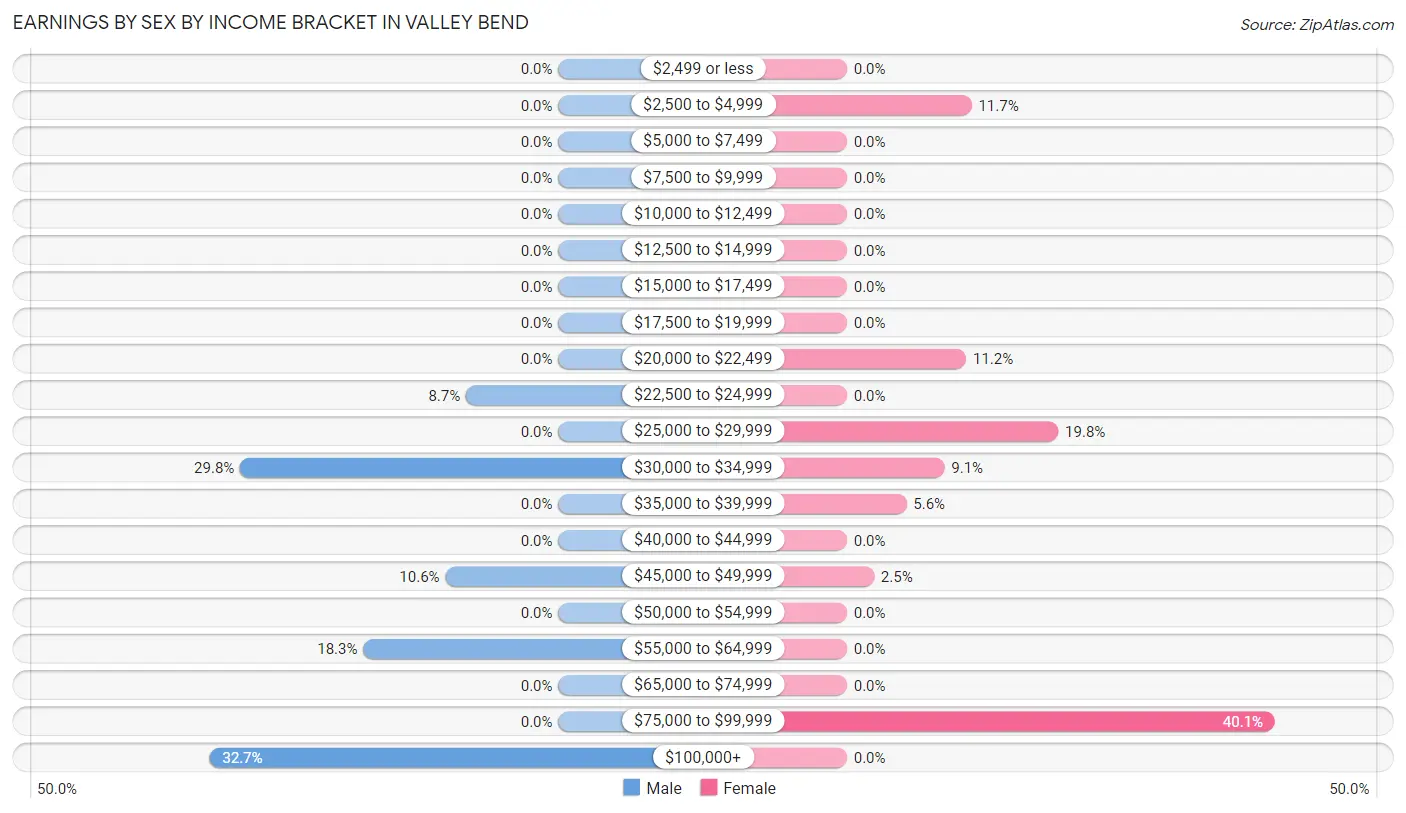
| Income | Male | Female |
| $2,499 or less | 0 (0.0%) | 0 (0.0%) |
| $2,500 to $4,999 | 0 (0.0%) | 23 (11.7%) |
| $5,000 to $7,499 | 0 (0.0%) | 0 (0.0%) |
| $7,500 to $9,999 | 0 (0.0%) | 0 (0.0%) |
| $10,000 to $12,499 | 0 (0.0%) | 0 (0.0%) |
| $12,500 to $14,999 | 0 (0.0%) | 0 (0.0%) |
| $15,000 to $17,499 | 0 (0.0%) | 0 (0.0%) |
| $17,500 to $19,999 | 0 (0.0%) | 0 (0.0%) |
| $20,000 to $22,499 | 0 (0.0%) | 22 (11.2%) |
| $22,500 to $24,999 | 9 (8.6%) | 0 (0.0%) |
| $25,000 to $29,999 | 0 (0.0%) | 39 (19.8%) |
| $30,000 to $34,999 | 31 (29.8%) | 18 (9.1%) |
| $35,000 to $39,999 | 0 (0.0%) | 11 (5.6%) |
| $40,000 to $44,999 | 0 (0.0%) | 0 (0.0%) |
| $45,000 to $49,999 | 11 (10.6%) | 5 (2.5%) |
| $50,000 to $54,999 | 0 (0.0%) | 0 (0.0%) |
| $55,000 to $64,999 | 19 (18.3%) | 0 (0.0%) |
| $65,000 to $74,999 | 0 (0.0%) | 0 (0.0%) |
| $75,000 to $99,999 | 0 (0.0%) | 79 (40.1%) |
| $100,000+ | 34 (32.7%) | 0 (0.0%) |
| Total | 104 (100.0%) | 197 (100.0%) |
Earnings by Sex by Educational Attainment in Valley Bend
| Educational Attainment | Male Income | Female Income |
| Less than High School | - | - |
| High School Diploma | - | - |
| College or Associate's Degree | - | - |
| Bachelor's Degree | - | - |
| Graduate Degree | - | - |
| Total | - | - |
Family Income in Valley Bend
Family Income Brackets in Valley Bend
According to the Valley Bend family income data, there are 79 families falling into the $150,000 to $199,999 income range, which is the most common income bracket and makes up 42.5% of all families.
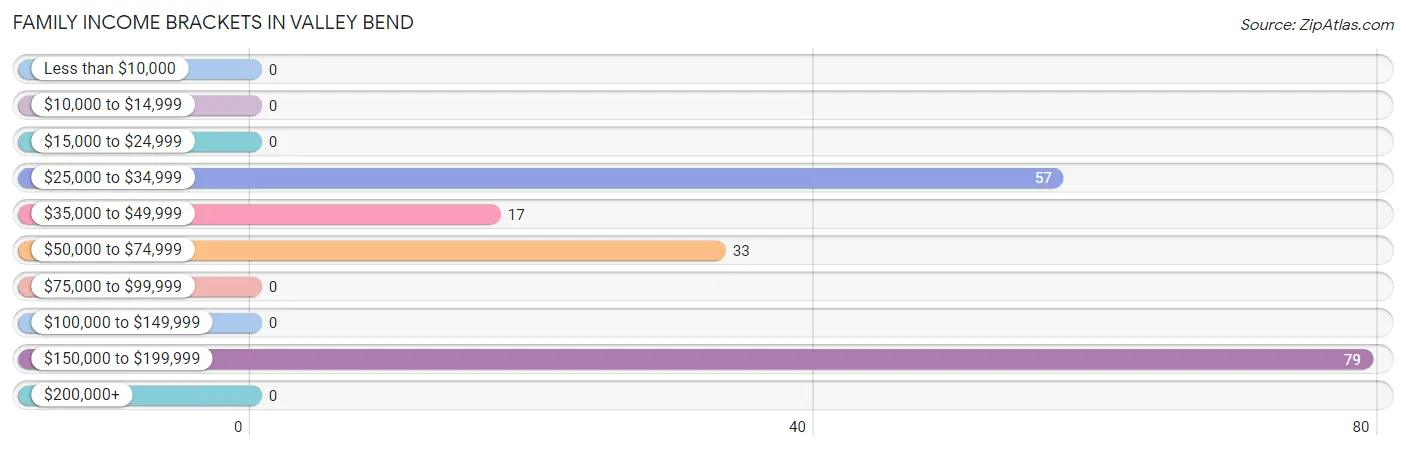
| Income Bracket | # Families | % Families |
| Less than $10,000 | 0 | 0.0% |
| $10,000 to $14,999 | 0 | 0.0% |
| $15,000 to $24,999 | 0 | 0.0% |
| $25,000 to $34,999 | 57 | 30.6% |
| $35,000 to $49,999 | 17 | 9.1% |
| $50,000 to $74,999 | 33 | 17.7% |
| $75,000 to $99,999 | 0 | 0.0% |
| $100,000 to $149,999 | 0 | 0.0% |
| $150,000 to $199,999 | 79 | 42.5% |
| $200,000+ | 0 | 0.0% |
Family Income by Famaliy Size in Valley Bend
| Income Bracket | # Families | Median Income |
| 2-Person Families | 164 (88.2%) | $0 |
| 3-Person Families | 22 (11.8%) | $0 |
| 4-Person Families | 0 (0.0%) | $0 |
| 5-Person Families | 0 (0.0%) | $0 |
| 6-Person Families | 0 (0.0%) | $0 |
| 7+ Person Families | 0 (0.0%) | $0 |
| Total | 186 (100.0%) | $0 |
Family Income by Number of Earners in Valley Bend
| Number of Earners | # Families | Median Income |
| No Earners | 6 (3.2%) | $0 |
| 1 Earner | 147 (79.0%) | $0 |
| 2 Earners | 33 (17.7%) | $0 |
| 3+ Earners | 0 (0.0%) | $0 |
| Total | 186 (100.0%) | $0 |
Household Income in Valley Bend
Household Income Brackets in Valley Bend
With 79 households falling in the category, the $150,000 to $199,999 income range is the most frequent in Valley Bend, accounting for 36.7% of all households.
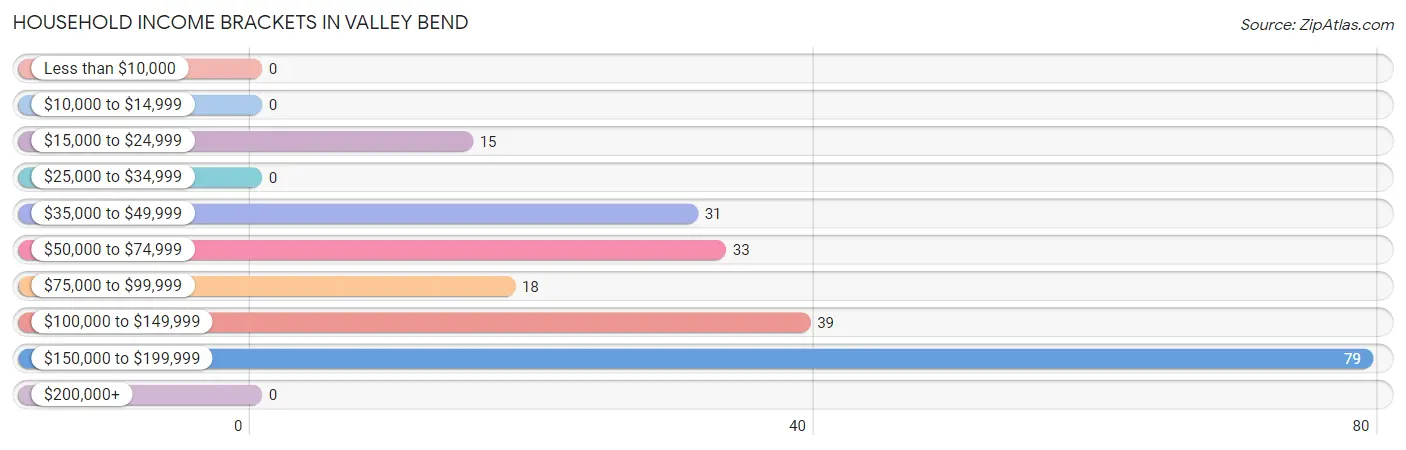
| Income Bracket | # Households | % Households |
| Less than $10,000 | 0 | 0.0% |
| $10,000 to $14,999 | 0 | 0.0% |
| $15,000 to $24,999 | 15 | 7.0% |
| $25,000 to $34,999 | 0 | 0.0% |
| $35,000 to $49,999 | 31 | 14.4% |
| $50,000 to $74,999 | 33 | 15.3% |
| $75,000 to $99,999 | 18 | 8.4% |
| $100,000 to $149,999 | 39 | 18.1% |
| $150,000 to $199,999 | 79 | 36.7% |
| $200,000+ | 0 | 0.0% |
Household Income by Householder Age in Valley Bend
The median household income in Valley Bend is $128,173, with the highest median household income of $193,402 found in the 45 to 64 years age bracket for the primary householder. A total of 101 households (47.0%) fall into this category. Meanwhile, the 15 to 24 years age bracket for the primary householder has the lowest median household income of $0, with 22 households (10.2%) in this group.
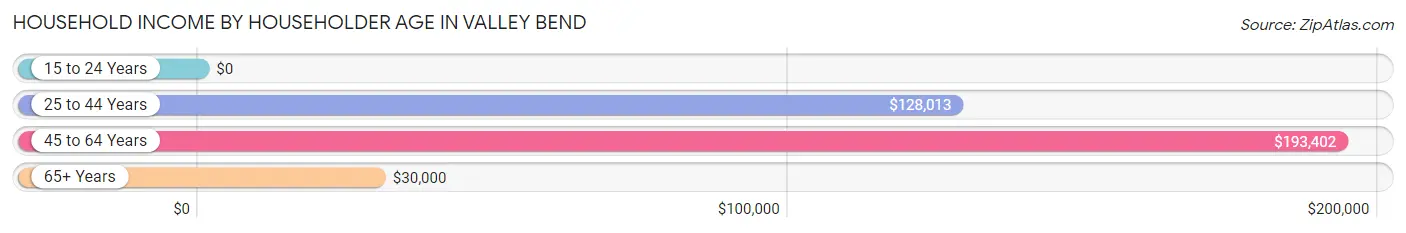
| Income Bracket | # Households | Median Income |
| 15 to 24 Years | 22 (10.2%) | $0 |
| 25 to 44 Years | 62 (28.8%) | $128,013 |
| 45 to 64 Years | 101 (47.0%) | $193,402 |
| 65+ Years | 30 (14.0%) | $30,000 |
| Total | 215 (100.0%) | $128,173 |
Poverty in Valley Bend
Income Below Poverty by Sex and Age in Valley Bend
With 2.3% poverty level for males and 7.0% for females among the residents of Valley Bend, 75 year old and over males and 65 to 74 year old females are the most vulnerable to poverty, with 6 males (100.0%) and 9 females (60.0%) in their respective age groups living below the poverty level.
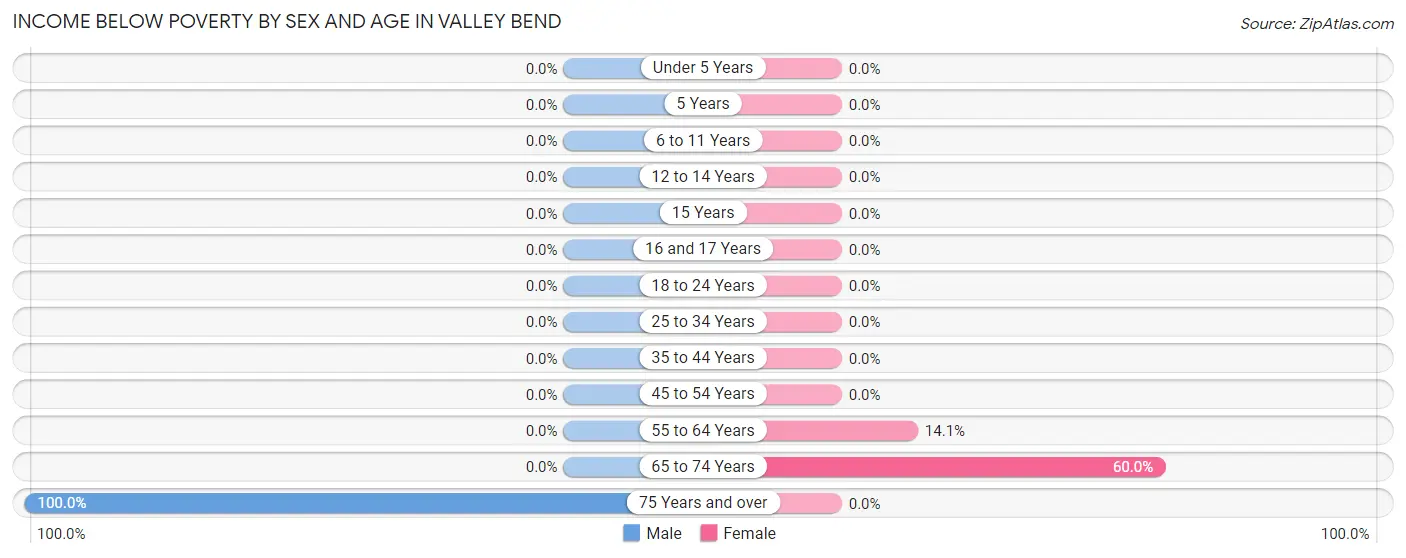
| Age Bracket | Male | Female |
| Under 5 Years | 0 (0.0%) | 0 (0.0%) |
| 5 Years | 0 (0.0%) | 0 (0.0%) |
| 6 to 11 Years | 0 (0.0%) | 0 (0.0%) |
| 12 to 14 Years | 0 (0.0%) | 0 (0.0%) |
| 15 Years | 0 (0.0%) | 0 (0.0%) |
| 16 and 17 Years | 0 (0.0%) | 0 (0.0%) |
| 18 to 24 Years | 0 (0.0%) | 0 (0.0%) |
| 25 to 34 Years | 0 (0.0%) | 0 (0.0%) |
| 35 to 44 Years | 0 (0.0%) | 0 (0.0%) |
| 45 to 54 Years | 0 (0.0%) | 0 (0.0%) |
| 55 to 64 Years | 0 (0.0%) | 13 (14.1%) |
| 65 to 74 Years | 0 (0.0%) | 9 (60.0%) |
| 75 Years and over | 6 (100.0%) | 0 (0.0%) |
| Total | 6 (2.3%) | 22 (7.0%) |
Income Above Poverty by Sex and Age in Valley Bend
According to the poverty statistics in Valley Bend, males aged 18 to 24 years and females aged under 5 years are the age groups that are most secure financially, with 100.0% of males and 100.0% of females in these age groups living above the poverty line.
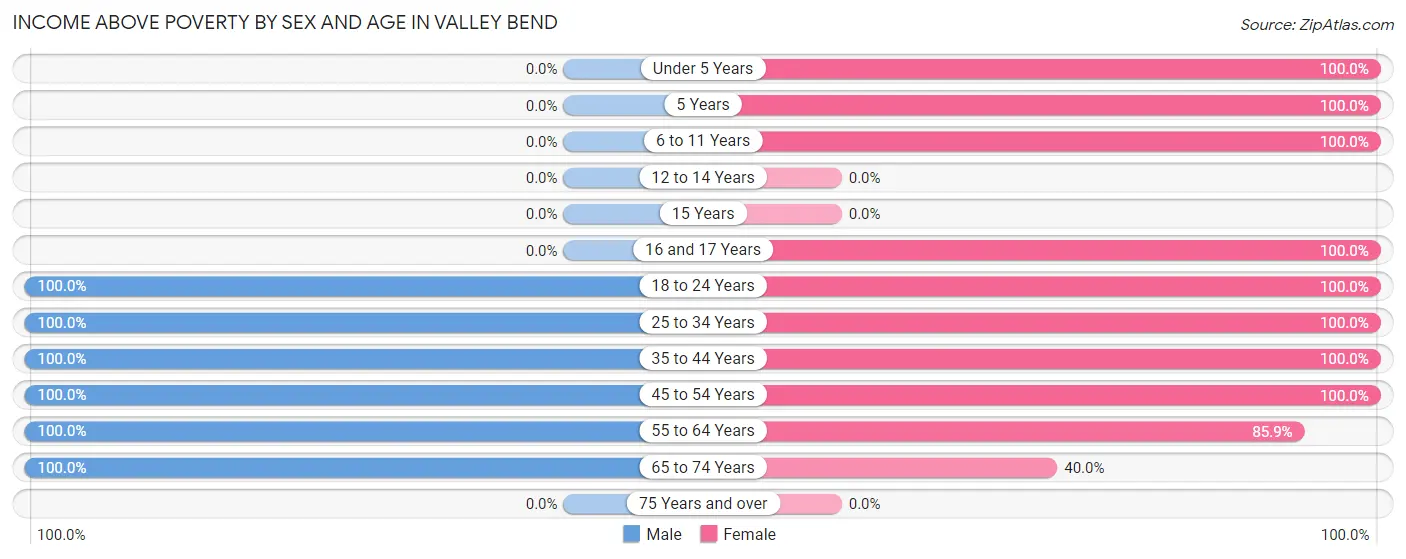
| Age Bracket | Male | Female |
| Under 5 Years | 0 (0.0%) | 29 (100.0%) |
| 5 Years | 0 (0.0%) | 6 (100.0%) |
| 6 to 11 Years | 0 (0.0%) | 42 (100.0%) |
| 12 to 14 Years | 0 (0.0%) | 0 (0.0%) |
| 15 Years | 0 (0.0%) | 0 (0.0%) |
| 16 and 17 Years | 0 (0.0%) | 12 (100.0%) |
| 18 to 24 Years | 31 (100.0%) | 45 (100.0%) |
| 25 to 34 Years | 53 (100.0%) | 23 (100.0%) |
| 35 to 44 Years | 12 (100.0%) | 39 (100.0%) |
| 45 to 54 Years | 11 (100.0%) | 11 (100.0%) |
| 55 to 64 Years | 125 (100.0%) | 79 (85.9%) |
| 65 to 74 Years | 18 (100.0%) | 6 (40.0%) |
| 75 Years and over | 0 (0.0%) | 0 (0.0%) |
| Total | 250 (97.7%) | 292 (93.0%) |
Income Below Poverty Among Married-Couple Families in Valley Bend
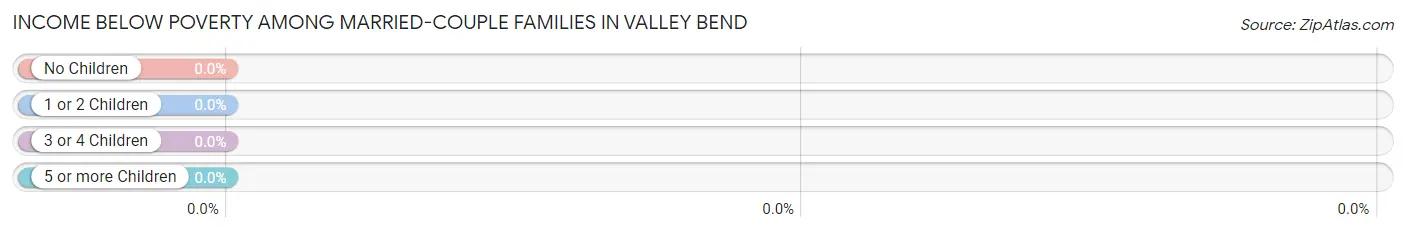
| Children | Above Poverty | Below Poverty |
| No Children | 79 (100.0%) | 0 (0.0%) |
| 1 or 2 Children | 22 (100.0%) | 0 (0.0%) |
| 3 or 4 Children | 0 (0.0%) | 0 (0.0%) |
| 5 or more Children | 0 (0.0%) | 0 (0.0%) |
| Total | 101 (100.0%) | 0 (0.0%) |
Income Below Poverty Among Single-Parent Households in Valley Bend
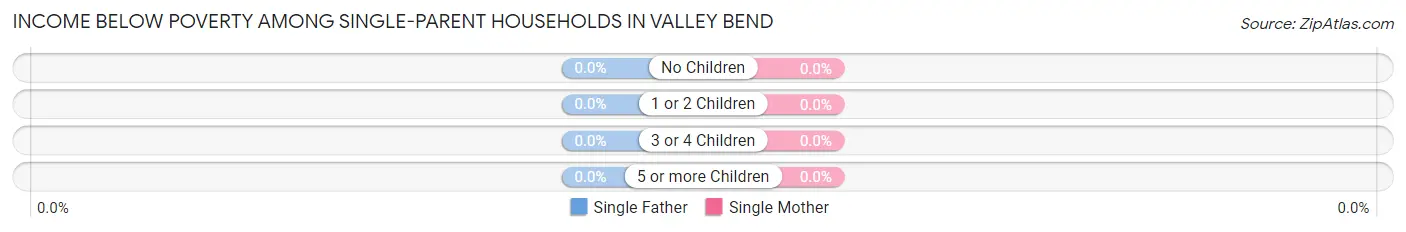
| Children | Single Father | Single Mother |
| No Children | 0 (0.0%) | 0 (0.0%) |
| 1 or 2 Children | 0 (0.0%) | 0 (0.0%) |
| 3 or 4 Children | 0 (0.0%) | 0 (0.0%) |
| 5 or more Children | 0 (0.0%) | 0 (0.0%) |
| Total | 0 (0.0%) | 0 (0.0%) |
Income Below Poverty Among Married-Couple vs Single-Parent Households in Valley Bend
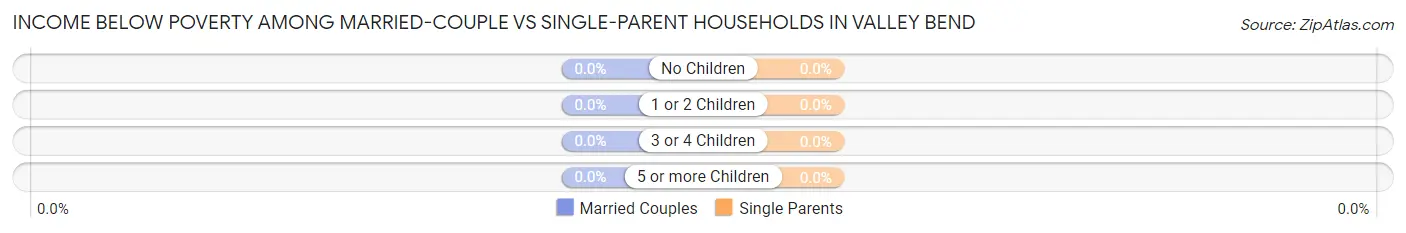
| Children | Married-Couple Families | Single-Parent Households |
| No Children | 0 (0.0%) | 0 (0.0%) |
| 1 or 2 Children | 0 (0.0%) | 0 (0.0%) |
| 3 or 4 Children | 0 (0.0%) | 0 (0.0%) |
| 5 or more Children | 0 (0.0%) | 0 (0.0%) |
| Total | 0 (0.0%) | 0 (0.0%) |
Race in Valley Bend
The most populous races in Valley Bend are , and White / Caucasian (585 | 100.0%).
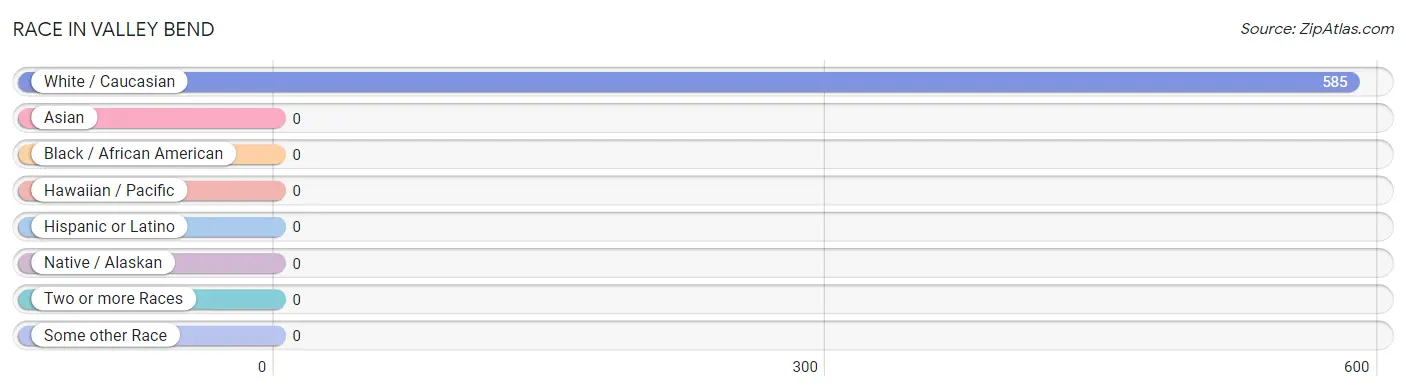
| Race | # Population | % Population |
| Asian | 0 | 0.0% |
| Black / African American | 0 | 0.0% |
| Hawaiian / Pacific | 0 | 0.0% |
| Hispanic or Latino | 0 | 0.0% |
| Native / Alaskan | 0 | 0.0% |
| White / Caucasian | 585 | 100.0% |
| Two or more Races | 0 | 0.0% |
| Some other Race | 0 | 0.0% |
| Total | 585 | 100.0% |
Ancestry in Valley Bend
The most populous ancestries reported in Valley Bend are English (228 | 39.0%), Scottish (90 | 15.4%), German (81 | 13.9%), Irish (44 | 7.5%), and Scotch-Irish (34 | 5.8%), together accounting for 81.5% of all Valley Bend residents.
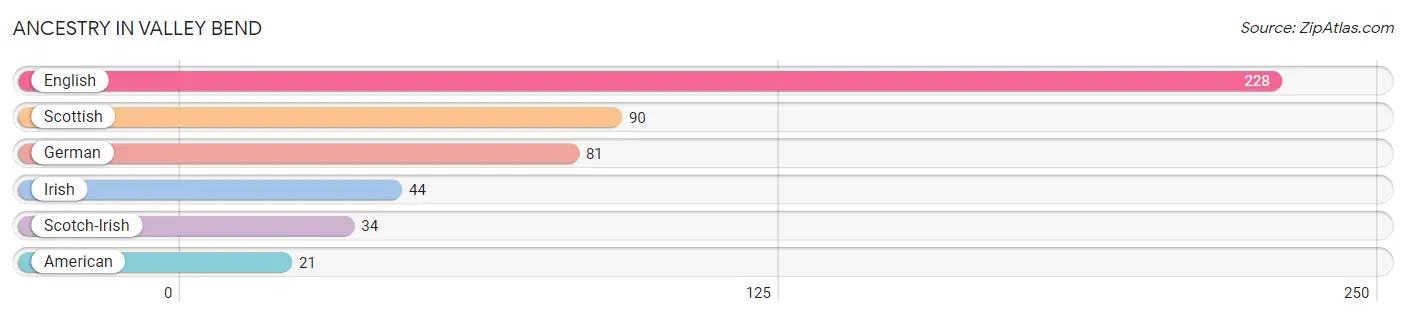
| Ancestry | # Population | % Population |
| American | 21 | 3.6% |
| English | 228 | 39.0% |
| German | 81 | 13.9% |
| Irish | 44 | 7.5% |
| Scotch-Irish | 34 | 5.8% |
| Scottish | 90 | 15.4% | View All 6 Rows |
Immigrants in Valley Bend

| Immigration Origin | # Population | % Population | View All 0 Rows |
Sex and Age in Valley Bend
Sex and Age in Valley Bend
The most populous age groups in Valley Bend are 60 to 64 Years (125 | 47.2%) for men and 60 to 64 Years (79 | 24.7%) for women.
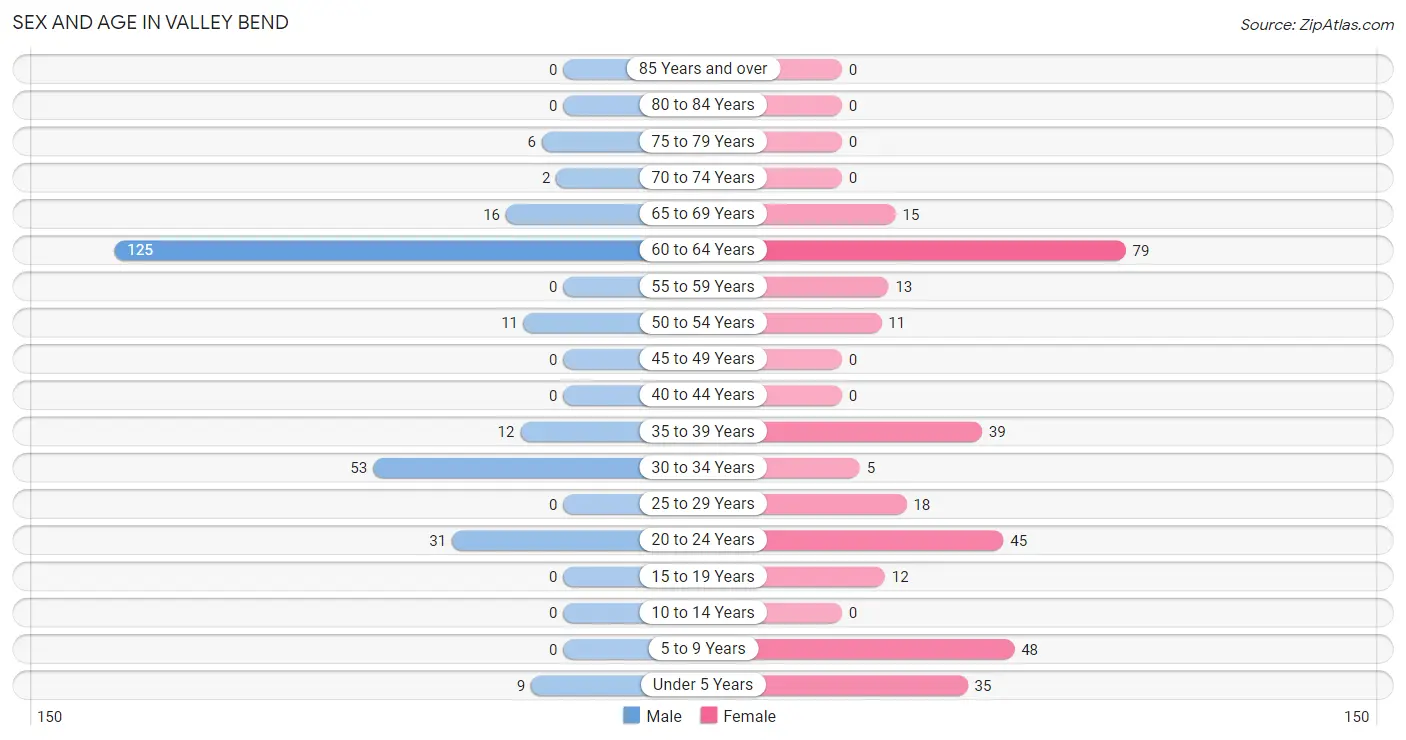
| Age Bracket | Male | Female |
| Under 5 Years | 9 (3.4%) | 35 (10.9%) |
| 5 to 9 Years | 0 (0.0%) | 48 (15.0%) |
| 10 to 14 Years | 0 (0.0%) | 0 (0.0%) |
| 15 to 19 Years | 0 (0.0%) | 12 (3.7%) |
| 20 to 24 Years | 31 (11.7%) | 45 (14.1%) |
| 25 to 29 Years | 0 (0.0%) | 18 (5.6%) |
| 30 to 34 Years | 53 (20.0%) | 5 (1.6%) |
| 35 to 39 Years | 12 (4.5%) | 39 (12.2%) |
| 40 to 44 Years | 0 (0.0%) | 0 (0.0%) |
| 45 to 49 Years | 0 (0.0%) | 0 (0.0%) |
| 50 to 54 Years | 11 (4.2%) | 11 (3.4%) |
| 55 to 59 Years | 0 (0.0%) | 13 (4.1%) |
| 60 to 64 Years | 125 (47.2%) | 79 (24.7%) |
| 65 to 69 Years | 16 (6.0%) | 15 (4.7%) |
| 70 to 74 Years | 2 (0.7%) | 0 (0.0%) |
| 75 to 79 Years | 6 (2.3%) | 0 (0.0%) |
| 80 to 84 Years | 0 (0.0%) | 0 (0.0%) |
| 85 Years and over | 0 (0.0%) | 0 (0.0%) |
| Total | 265 (100.0%) | 320 (100.0%) |
Families and Households in Valley Bend
Median Family Size in Valley Bend
The median family size in Valley Bend is 2.51 persons per family, with single male/father families (11 | 5.9%) accounting for the largest median family size of 3.09 persons per family. On the other hand, single female/mother families (74 | 39.8%) represent the smallest median family size with 1.97 persons per family.
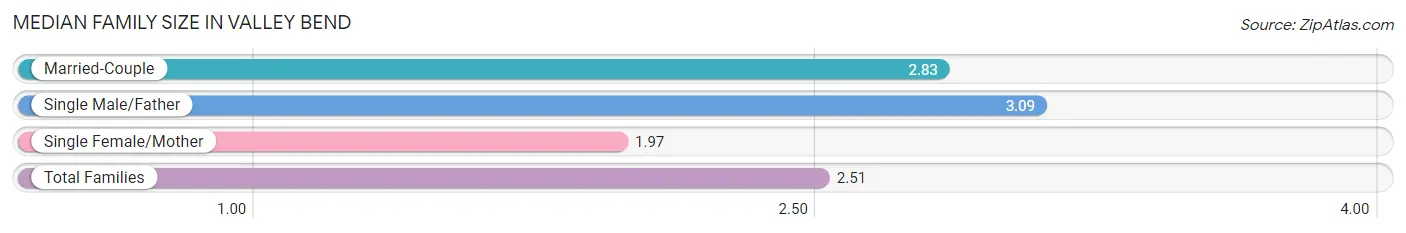
| Family Type | # Families | Family Size |
| Married-Couple | 101 (54.3%) | 2.83 |
| Single Male/Father | 11 (5.9%) | 3.09 |
| Single Female/Mother | 74 (39.8%) | 1.97 |
| Total Families | 186 (100.0%) | 2.51 |
Median Household Size in Valley Bend
The median household size in Valley Bend is 2.72 persons per household, with single male/father households (11 | 5.1%) accounting for the largest median household size of 4.27 persons per household. non-family households (29 | 13.5%) represent the smallest median household size with 1.83 persons per household.
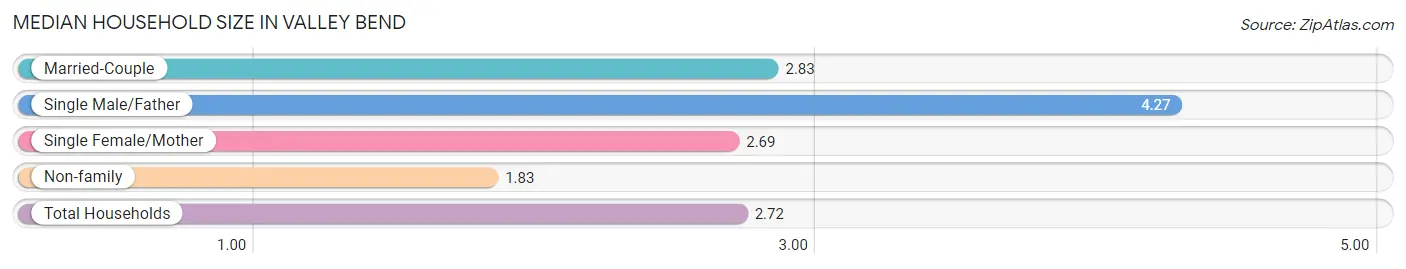
| Household Type | # Households | Household Size |
| Married-Couple | 101 (47.0%) | 2.83 |
| Single Male/Father | 11 (5.1%) | 4.27 |
| Single Female/Mother | 74 (34.4%) | 2.69 |
| Non-family | 29 (13.5%) | 1.83 |
| Total Households | 215 (100.0%) | 2.72 |
Household Size by Marriage Status in Valley Bend
Out of a total of 215 households in Valley Bend, 186 (86.5%) are family households, while 29 (13.5%) are nonfamily households. The most numerous type of family households are 2-person households, comprising 96, and the most common type of nonfamily households are 1-person households, comprising 18.
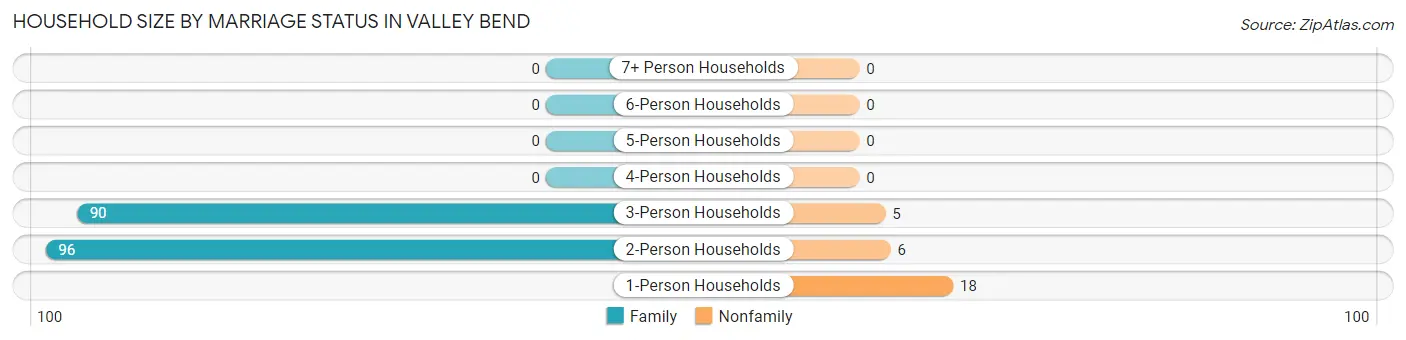
| Household Size | Family Households | Nonfamily Households |
| 1-Person Households | - | 18 (8.4%) |
| 2-Person Households | 96 (44.7%) | 6 (2.8%) |
| 3-Person Households | 90 (41.9%) | 5 (2.3%) |
| 4-Person Households | 0 (0.0%) | 0 (0.0%) |
| 5-Person Households | 0 (0.0%) | 0 (0.0%) |
| 6-Person Households | 0 (0.0%) | 0 (0.0%) |
| 7+ Person Households | 0 (0.0%) | 0 (0.0%) |
| Total | 186 (86.5%) | 29 (13.5%) |
Female Fertility in Valley Bend
Fertility by Age in Valley Bend
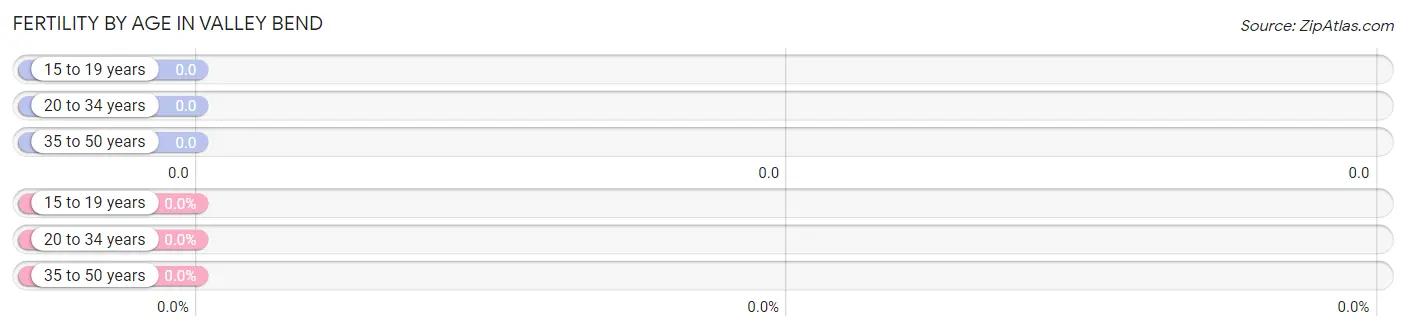
| Age Bracket | Women with Births | Births / 1,000 Women |
| 15 to 19 years | 0 (0.0%) | 0.0 |
| 20 to 34 years | 0 (0.0%) | 0.0 |
| 35 to 50 years | 0 (0.0%) | 0.0 |
| Total | 0 (0.0%) | 0.0 |
Fertility by Age by Marriage Status in Valley Bend
| Age Bracket | Married | Unmarried |
| 15 to 19 years | 0 (0.0%) | 0 (0.0%) |
| 20 to 34 years | 0 (0.0%) | 0 (0.0%) |
| 35 to 50 years | 0 (0.0%) | 0 (0.0%) |
| Total | 0 (0.0%) | 0 (0.0%) |
Fertility by Education in Valley Bend
| Educational Attainment | Women with Births | Births / 1,000 Women |
| Less than High School | 0 (0.0%) | 0.0 |
| High School Diploma | 0 (0.0%) | 0.0 |
| College or Associate's Degree | 0 (0.0%) | 0.0 |
| Bachelor's Degree | 0 (0.0%) | 0.0 |
| Graduate Degree | 0 (0.0%) | 0.0 |
| Total | 0 (0.0%) | 0.0 |
Fertility by Education by Marriage Status in Valley Bend
| Educational Attainment | Married | Unmarried |
| Less than High School | 0 (0.0%) | 0 (0.0%) |
| High School Diploma | 0 (0.0%) | 0 (0.0%) |
| College or Associate's Degree | 0 (0.0%) | 0 (0.0%) |
| Bachelor's Degree | 0 (0.0%) | 0 (0.0%) |
| Graduate Degree | 0 (0.0%) | 0 (0.0%) |
| Total | 0 (0.0%) | 0 (0.0%) |
Employment Characteristics in Valley Bend
Employment by Class of Employer in Valley Bend
Among the 301 employed individuals in Valley Bend, private company employees (211 | 70.1%), not-for-profit organizations (79 | 26.3%), and state government employees (11 | 3.6%) make up the most common classes of employment.
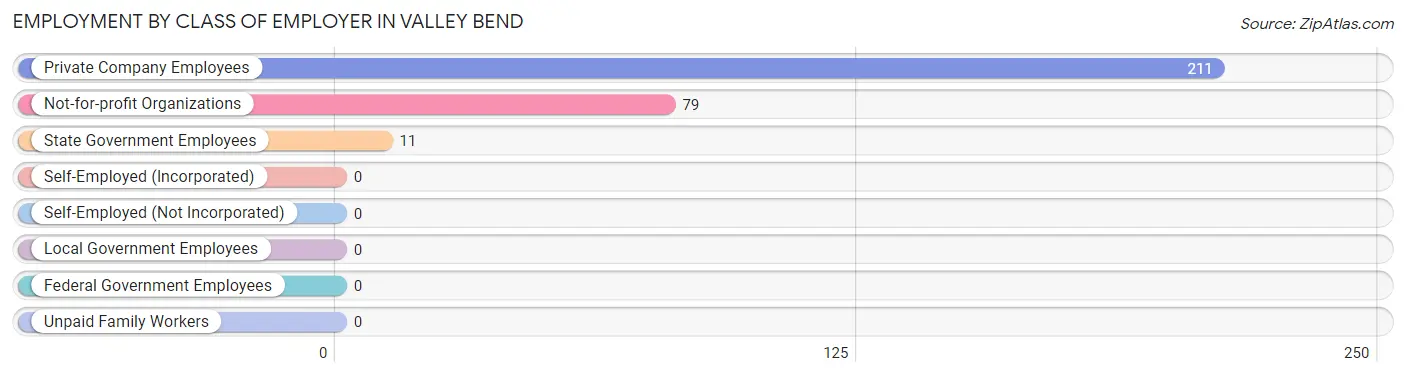
| Employer Class | # Employees | % Employees |
| Private Company Employees | 211 | 70.1% |
| Self-Employed (Incorporated) | 0 | 0.0% |
| Self-Employed (Not Incorporated) | 0 | 0.0% |
| Not-for-profit Organizations | 79 | 26.3% |
| Local Government Employees | 0 | 0.0% |
| State Government Employees | 11 | 3.6% |
| Federal Government Employees | 0 | 0.0% |
| Unpaid Family Workers | 0 | 0.0% |
| Total | 301 | 100.0% |
Employment Status by Age in Valley Bend
According to the labor force statistics for Valley Bend, out of the total population over 16 years of age (493), 63.5% or 313 individuals are in the labor force, with 3.8% or 12 of them unemployed. The age group with the highest labor force participation rate is 20 to 24 years, with 100.0% or 76 individuals in the labor force. Within the labor force, the 35 to 44 years age range has the highest percentage of unemployed individuals, with 23.5% or 12 of them being unemployed.
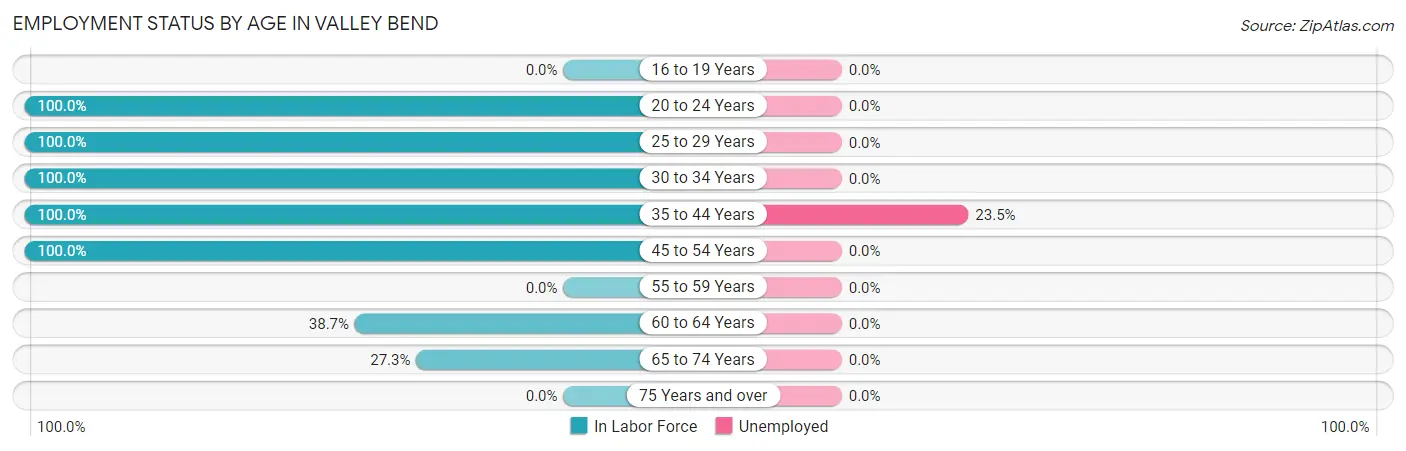
| Age Bracket | In Labor Force | Unemployed |
| 16 to 19 Years | 0 (0.0%) | 0 (0.0%) |
| 20 to 24 Years | 76 (100.0%) | 0 (0.0%) |
| 25 to 29 Years | 18 (100.0%) | 0 (0.0%) |
| 30 to 34 Years | 58 (100.0%) | 0 (0.0%) |
| 35 to 44 Years | 51 (100.0%) | 12 (23.5%) |
| 45 to 54 Years | 22 (100.0%) | 0 (0.0%) |
| 55 to 59 Years | 0 (0.0%) | 0 (0.0%) |
| 60 to 64 Years | 79 (38.7%) | 0 (0.0%) |
| 65 to 74 Years | 9 (27.3%) | 0 (0.0%) |
| 75 Years and over | 0 (0.0%) | 0 (0.0%) |
| Total | 313 (63.5%) | 12 (3.8%) |
Employment Status by Educational Attainment in Valley Bend
According to labor force statistics for Valley Bend, 62.3% of individuals (228) out of the total population between 25 and 64 years of age (366) are in the labor force, with 5.3% or 12 of them being unemployed. The group with the highest labor force participation rate are those with the educational attainment of college / associate degree, with 100.0% or 5 individuals in the labor force. Within the labor force, individuals with less than high school education have the highest percentage of unemployment, with 38.7% or 12 of them being unemployed.
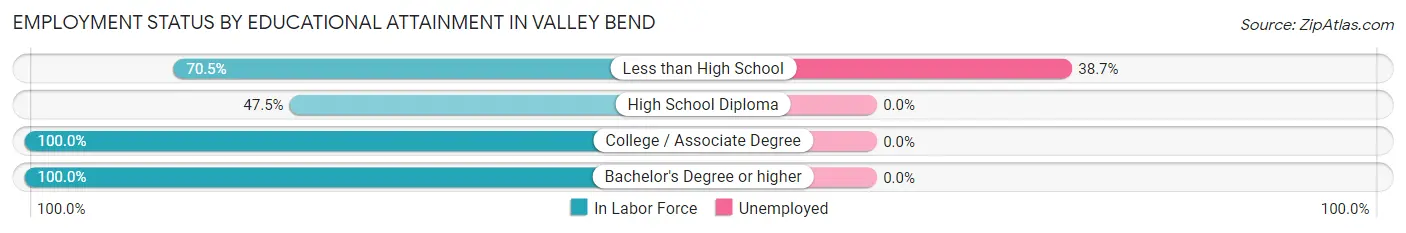
| Educational Attainment | In Labor Force | Unemployed |
| Less than High School | 31 (70.5%) | 17 (38.7%) |
| High School Diploma | 113 (47.5%) | 0 (0.0%) |
| College / Associate Degree | 5 (100.0%) | 0 (0.0%) |
| Bachelor's Degree or higher | 79 (100.0%) | 0 (0.0%) |
| Total | 228 (62.3%) | 19 (5.3%) |
Employment Occupations by Sex in Valley Bend
Management, Business, Science and Arts Occupations
The most common Management, Business, Science and Arts occupations in Valley Bend are Health Diagnosing & Treating (164 | 54.5%), Health Technologists (84 | 27.9%), and Business & Financial (11 | 3.6%).
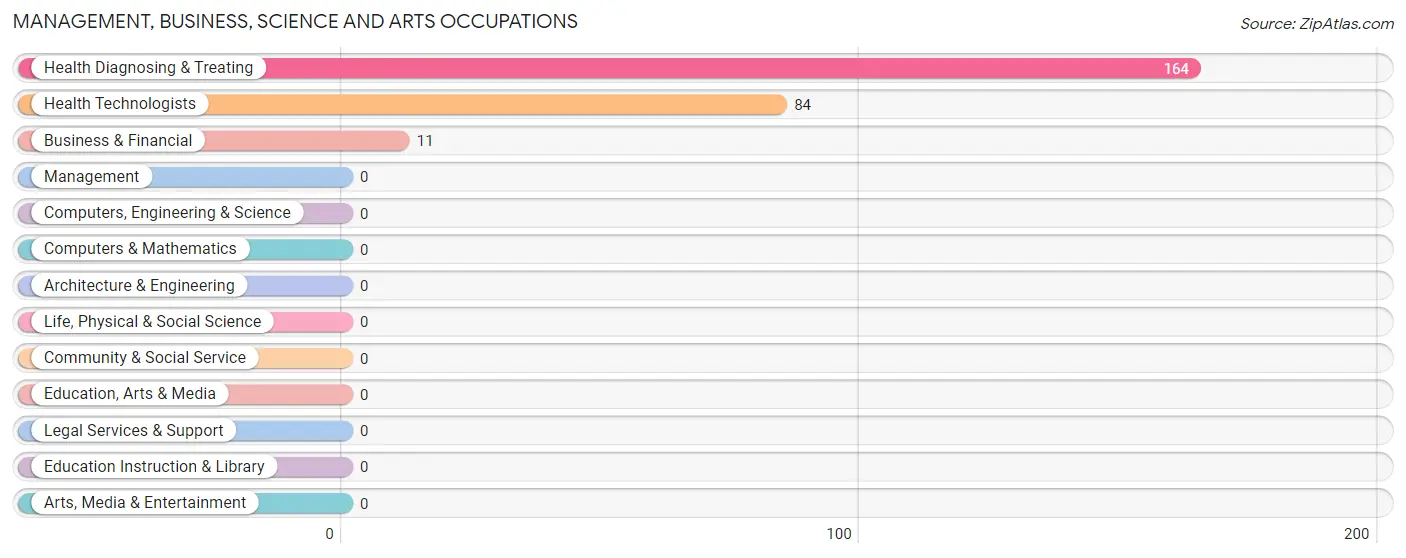
Management, Business, Science and Arts Occupations by Sex
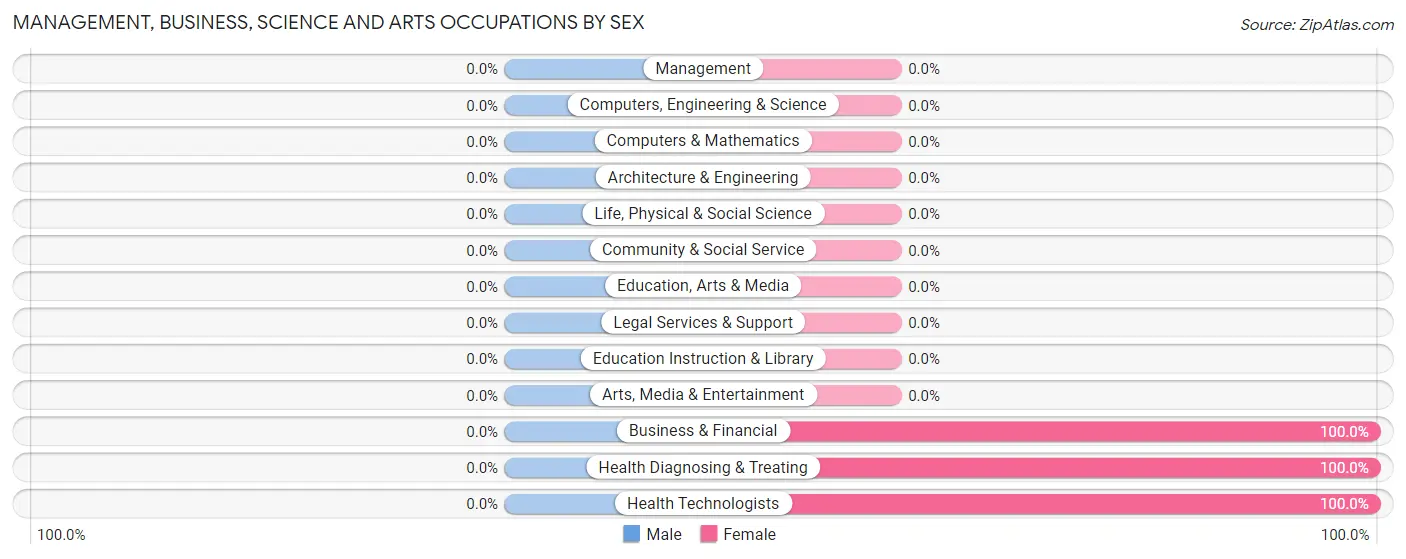
| Occupation | Male | Female |
| Management | 0 (0.0%) | 0 (0.0%) |
| Business & Financial | 0 (0.0%) | 11 (100.0%) |
| Computers, Engineering & Science | 0 (0.0%) | 0 (0.0%) |
| Computers & Mathematics | 0 (0.0%) | 0 (0.0%) |
| Architecture & Engineering | 0 (0.0%) | 0 (0.0%) |
| Life, Physical & Social Science | 0 (0.0%) | 0 (0.0%) |
| Community & Social Service | 0 (0.0%) | 0 (0.0%) |
| Education, Arts & Media | 0 (0.0%) | 0 (0.0%) |
| Legal Services & Support | 0 (0.0%) | 0 (0.0%) |
| Education Instruction & Library | 0 (0.0%) | 0 (0.0%) |
| Arts, Media & Entertainment | 0 (0.0%) | 0 (0.0%) |
| Health Diagnosing & Treating | 0 (0.0%) | 164 (100.0%) |
| Health Technologists | 0 (0.0%) | 84 (100.0%) |
| Total (Category) | 0 (0.0%) | 175 (100.0%) |
| Total (Overall) | 104 (34.5%) | 197 (65.4%) |
Services Occupations
Services Occupations by Sex
| Occupation | Male | Female |
| Healthcare Support | 0 (0.0%) | 0 (0.0%) |
| Security & Protection | 0 (0.0%) | 0 (0.0%) |
| Firefighting & Prevention | 0 (0.0%) | 0 (0.0%) |
| Law Enforcement | 0 (0.0%) | 0 (0.0%) |
| Food Preparation & Serving | 0 (0.0%) | 0 (0.0%) |
| Cleaning & Maintenance | 0 (0.0%) | 0 (0.0%) |
| Personal Care & Service | 0 (0.0%) | 0 (0.0%) |
| Total (Category) | 0 (0.0%) | 0 (0.0%) |
| Total (Overall) | 104 (34.5%) | 197 (65.4%) |
Sales and Office Occupations
The most common Sales and Office occupations in Valley Bend are , and Office & Administration (22 | 7.3%).
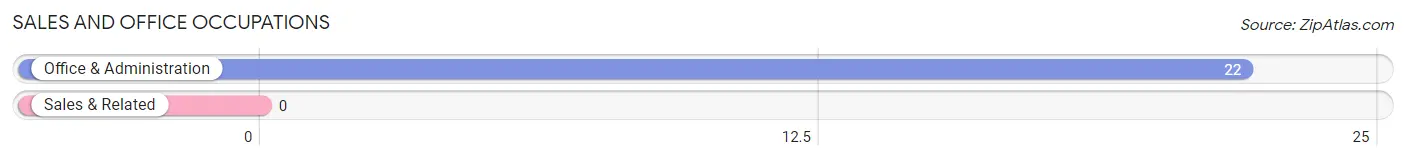
Sales and Office Occupations by Sex
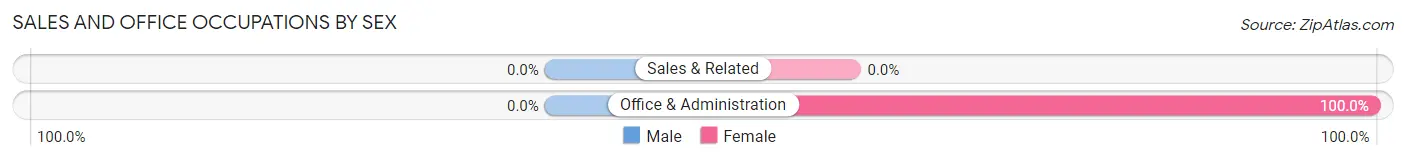
| Occupation | Male | Female |
| Sales & Related | 0 (0.0%) | 0 (0.0%) |
| Office & Administration | 0 (0.0%) | 22 (100.0%) |
| Total (Category) | 0 (0.0%) | 22 (100.0%) |
| Total (Overall) | 104 (34.5%) | 197 (65.4%) |
Natural Resources, Construction and Maintenance Occupations
The most common Natural Resources, Construction and Maintenance occupations in Valley Bend are Installation, Maintenance & Repair (50 | 16.6%), and Construction & Extraction (34 | 11.3%).
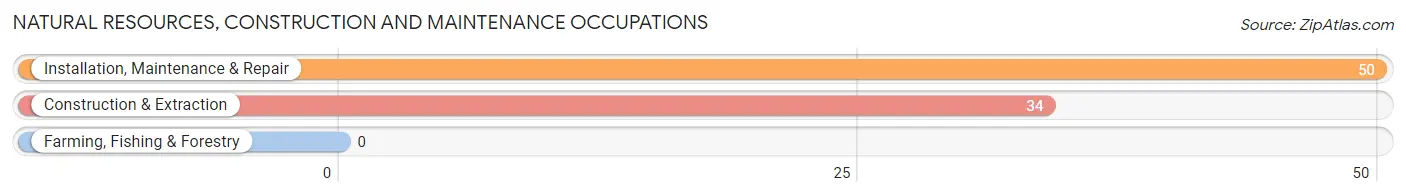
Natural Resources, Construction and Maintenance Occupations by Sex
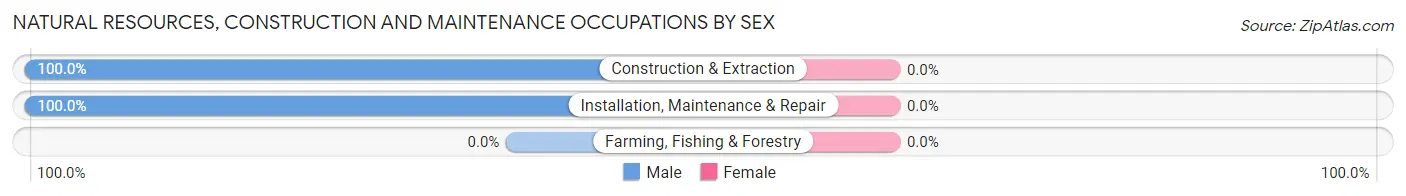
| Occupation | Male | Female |
| Farming, Fishing & Forestry | 0 (0.0%) | 0 (0.0%) |
| Construction & Extraction | 34 (100.0%) | 0 (0.0%) |
| Installation, Maintenance & Repair | 50 (100.0%) | 0 (0.0%) |
| Total (Category) | 84 (100.0%) | 0 (0.0%) |
| Total (Overall) | 104 (34.5%) | 197 (65.4%) |
Production, Transportation and Moving Occupations
The most common Production, Transportation and Moving occupations in Valley Bend are , and Material Moving (20 | 6.6%).
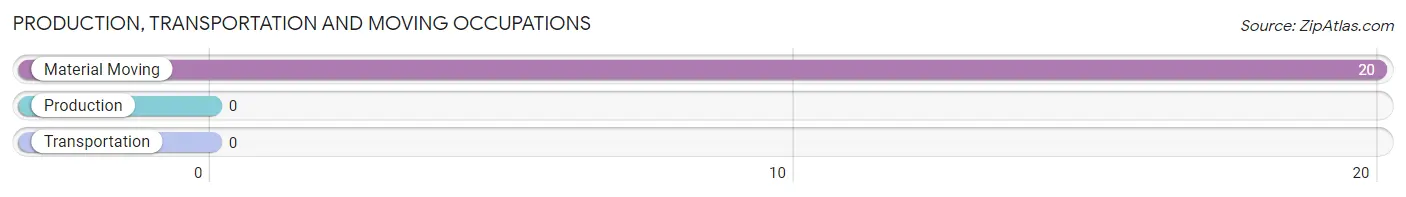
Production, Transportation and Moving Occupations by Sex
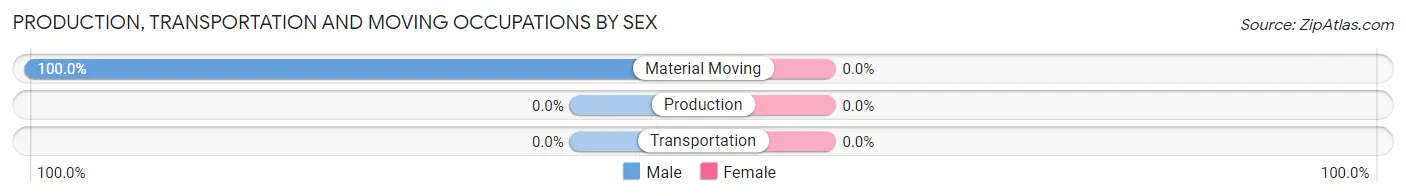
| Occupation | Male | Female |
| Production | 0 (0.0%) | 0 (0.0%) |
| Transportation | 0 (0.0%) | 0 (0.0%) |
| Material Moving | 20 (100.0%) | 0 (0.0%) |
| Total (Category) | 20 (100.0%) | 0 (0.0%) |
| Total (Overall) | 104 (34.5%) | 197 (65.4%) |
Employment Industries by Sex in Valley Bend
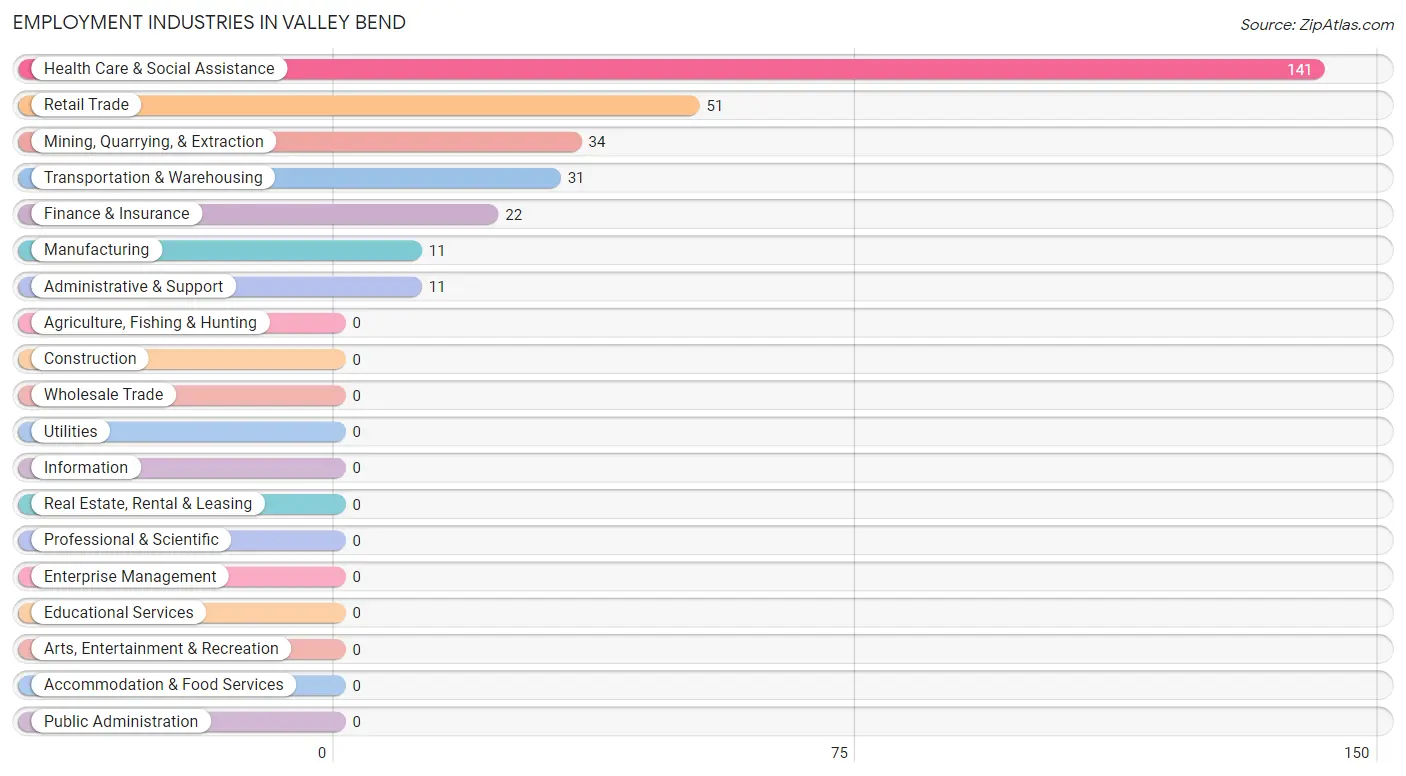
Employment Industries in Valley Bend
The major employment industries in Valley Bend include Health Care & Social Assistance (141 | 46.8%), Retail Trade (51 | 16.9%), Mining, Quarrying, & Extraction (34 | 11.3%), Transportation & Warehousing (31 | 10.3%), and Finance & Insurance (22 | 7.3%).
Employment Industries by Sex in Valley Bend
The Valley Bend industries that see more men than women are Mining, Quarrying, & Extraction (100.0%), Manufacturing (100.0%), and Transportation & Warehousing (100.0%), whereas the industries that tend to have a higher number of women are Finance & Insurance (100.0%), Administrative & Support (100.0%), and Health Care & Social Assistance (100.0%).
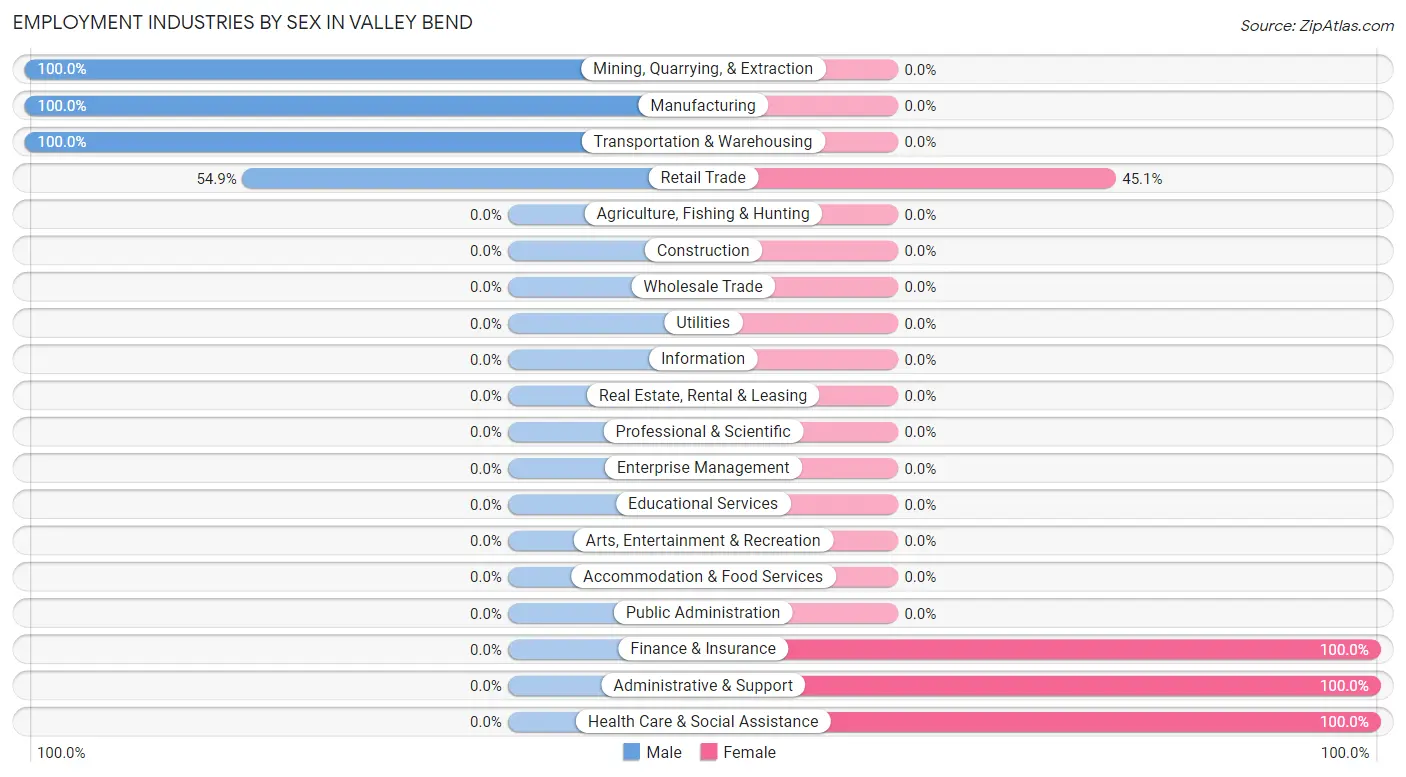
| Industry | Male | Female |
| Agriculture, Fishing & Hunting | 0 (0.0%) | 0 (0.0%) |
| Mining, Quarrying, & Extraction | 34 (100.0%) | 0 (0.0%) |
| Construction | 0 (0.0%) | 0 (0.0%) |
| Manufacturing | 11 (100.0%) | 0 (0.0%) |
| Wholesale Trade | 0 (0.0%) | 0 (0.0%) |
| Retail Trade | 28 (54.9%) | 23 (45.1%) |
| Transportation & Warehousing | 31 (100.0%) | 0 (0.0%) |
| Utilities | 0 (0.0%) | 0 (0.0%) |
| Information | 0 (0.0%) | 0 (0.0%) |
| Finance & Insurance | 0 (0.0%) | 22 (100.0%) |
| Real Estate, Rental & Leasing | 0 (0.0%) | 0 (0.0%) |
| Professional & Scientific | 0 (0.0%) | 0 (0.0%) |
| Enterprise Management | 0 (0.0%) | 0 (0.0%) |
| Administrative & Support | 0 (0.0%) | 11 (100.0%) |
| Educational Services | 0 (0.0%) | 0 (0.0%) |
| Health Care & Social Assistance | 0 (0.0%) | 141 (100.0%) |
| Arts, Entertainment & Recreation | 0 (0.0%) | 0 (0.0%) |
| Accommodation & Food Services | 0 (0.0%) | 0 (0.0%) |
| Public Administration | 0 (0.0%) | 0 (0.0%) |
| Total | 104 (34.5%) | 197 (65.4%) |
Education in Valley Bend
School Enrollment in Valley Bend
The most common levels of schooling among the 69 students in Valley Bend are elementary school (42 | 60.9%), high school (21 | 30.4%), and kindergarten (6 | 8.7%).
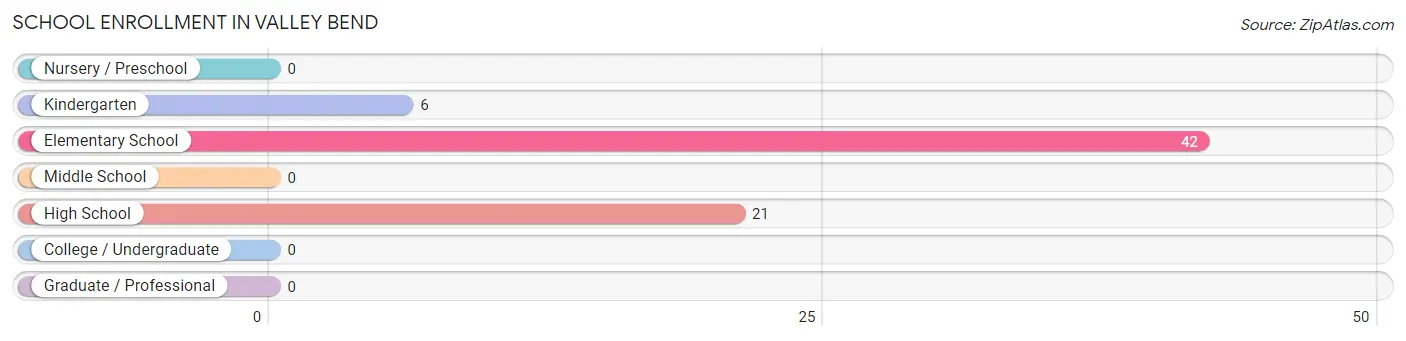
| School Level | # Students | % Students |
| Nursery / Preschool | 0 | 0.0% |
| Kindergarten | 6 | 8.7% |
| Elementary School | 42 | 60.9% |
| Middle School | 0 | 0.0% |
| High School | 21 | 30.4% |
| College / Undergraduate | 0 | 0.0% |
| Graduate / Professional | 0 | 0.0% |
| Total | 69 | 100.0% |
School Enrollment by Age by Funding Source in Valley Bend
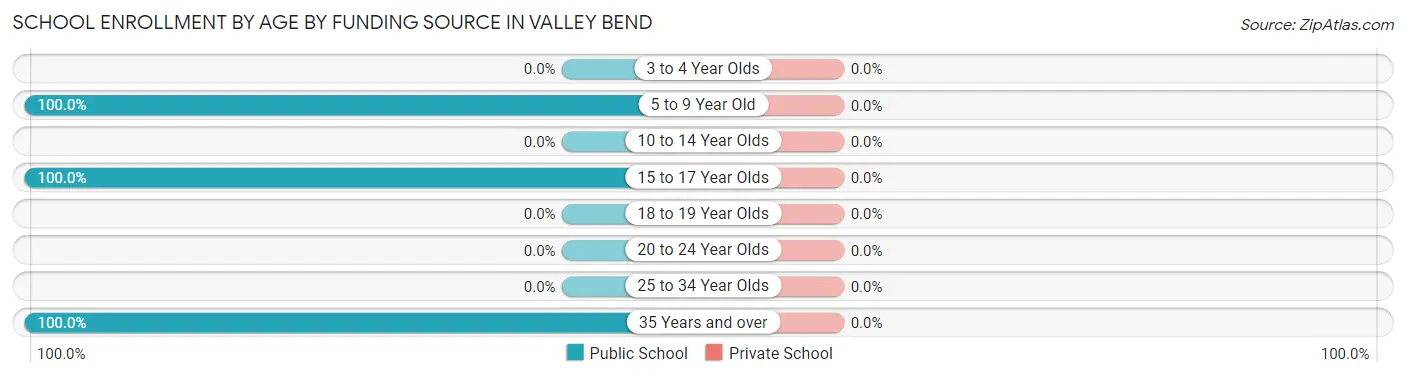
| Age Bracket | Public School | Private School |
| 3 to 4 Year Olds | 0 (0.0%) | 0 (0.0%) |
| 5 to 9 Year Old | 48 (100.0%) | 0 (0.0%) |
| 10 to 14 Year Olds | 0 (0.0%) | 0 (0.0%) |
| 15 to 17 Year Olds | 12 (100.0%) | 0 (0.0%) |
| 18 to 19 Year Olds | 0 (0.0%) | 0 (0.0%) |
| 20 to 24 Year Olds | 0 (0.0%) | 0 (0.0%) |
| 25 to 34 Year Olds | 0 (0.0%) | 0 (0.0%) |
| 35 Years and over | 9 (100.0%) | 0 (0.0%) |
| Total | 69 (100.0%) | 0 (0.0%) |
Educational Attainment by Field of Study in Valley Bend
, and science & technology (79 | 100.0%) are the most common fields of study among 79 individuals in Valley Bend who have obtained a bachelor's degree or higher.
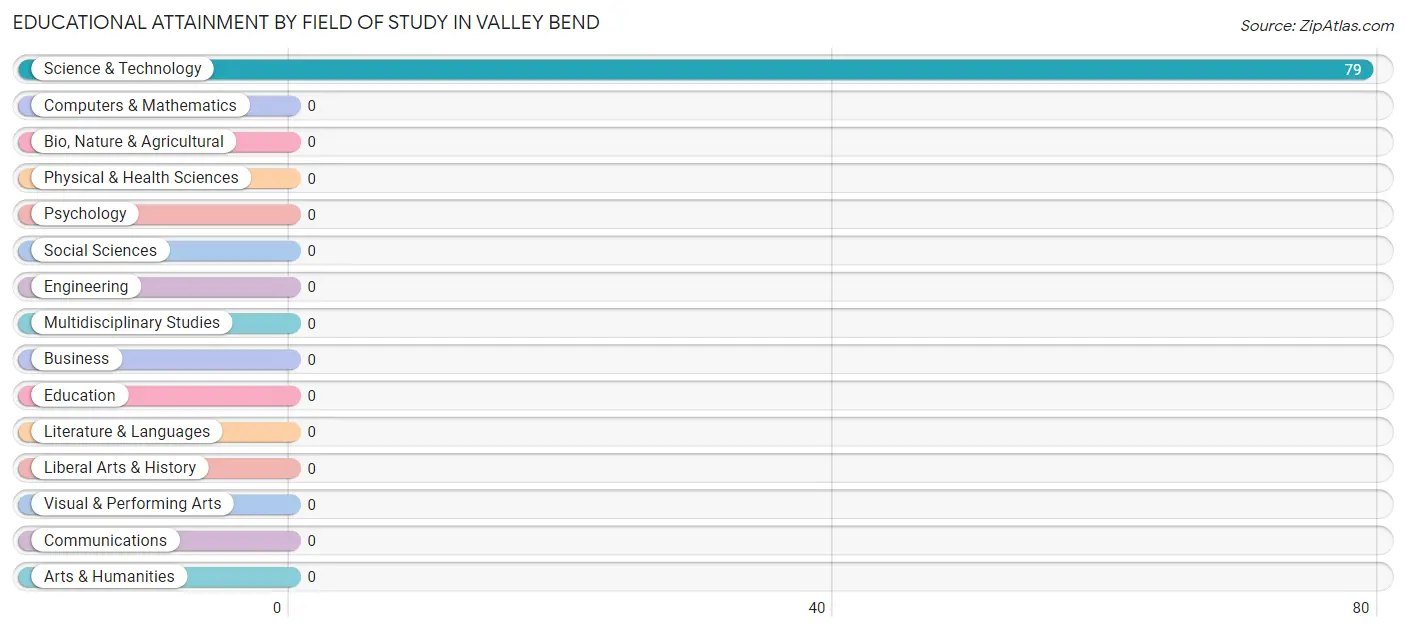
| Field of Study | # Graduates | % Graduates |
| Computers & Mathematics | 0 | 0.0% |
| Bio, Nature & Agricultural | 0 | 0.0% |
| Physical & Health Sciences | 0 | 0.0% |
| Psychology | 0 | 0.0% |
| Social Sciences | 0 | 0.0% |
| Engineering | 0 | 0.0% |
| Multidisciplinary Studies | 0 | 0.0% |
| Science & Technology | 79 | 100.0% |
| Business | 0 | 0.0% |
| Education | 0 | 0.0% |
| Literature & Languages | 0 | 0.0% |
| Liberal Arts & History | 0 | 0.0% |
| Visual & Performing Arts | 0 | 0.0% |
| Communications | 0 | 0.0% |
| Arts & Humanities | 0 | 0.0% |
| Total | 79 | 100.0% |
Transportation & Commute in Valley Bend
Vehicle Availability by Sex in Valley Bend
The most prevalent vehicle ownership categories in Valley Bend are males with 2 vehicles (84, accounting for 80.8%) and females with 2 vehicles (158, making up 42.6%).
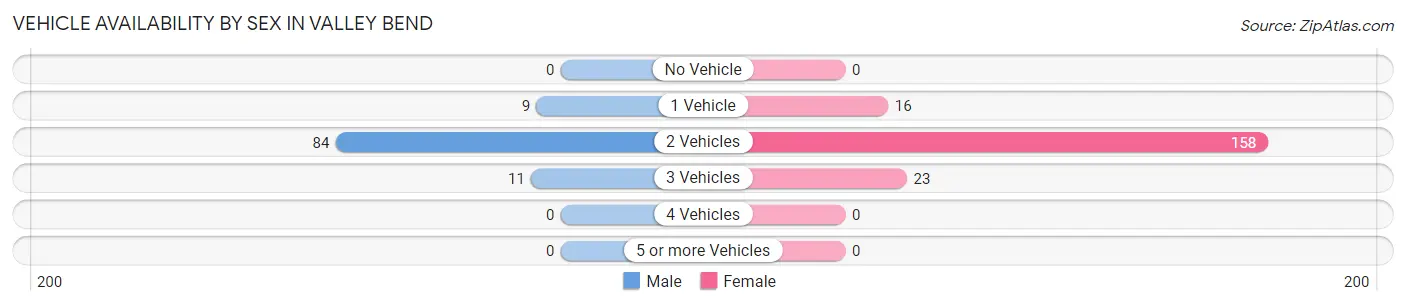
| Vehicles Available | Male | Female |
| No Vehicle | 0 (0.0%) | 0 (0.0%) |
| 1 Vehicle | 9 (8.6%) | 16 (8.1%) |
| 2 Vehicles | 84 (80.8%) | 158 (80.2%) |
| 3 Vehicles | 11 (10.6%) | 23 (11.7%) |
| 4 Vehicles | 0 (0.0%) | 0 (0.0%) |
| 5 or more Vehicles | 0 (0.0%) | 0 (0.0%) |
| Total | 104 (100.0%) | 197 (100.0%) |
Commute Time in Valley Bend
The most frequently occuring commute durations in Valley Bend are 90 or more minutes (79 commuters, 26.3%), 30 to 34 minutes (51 commuters, 16.9%), and 25 to 29 minutes (43 commuters, 14.3%).
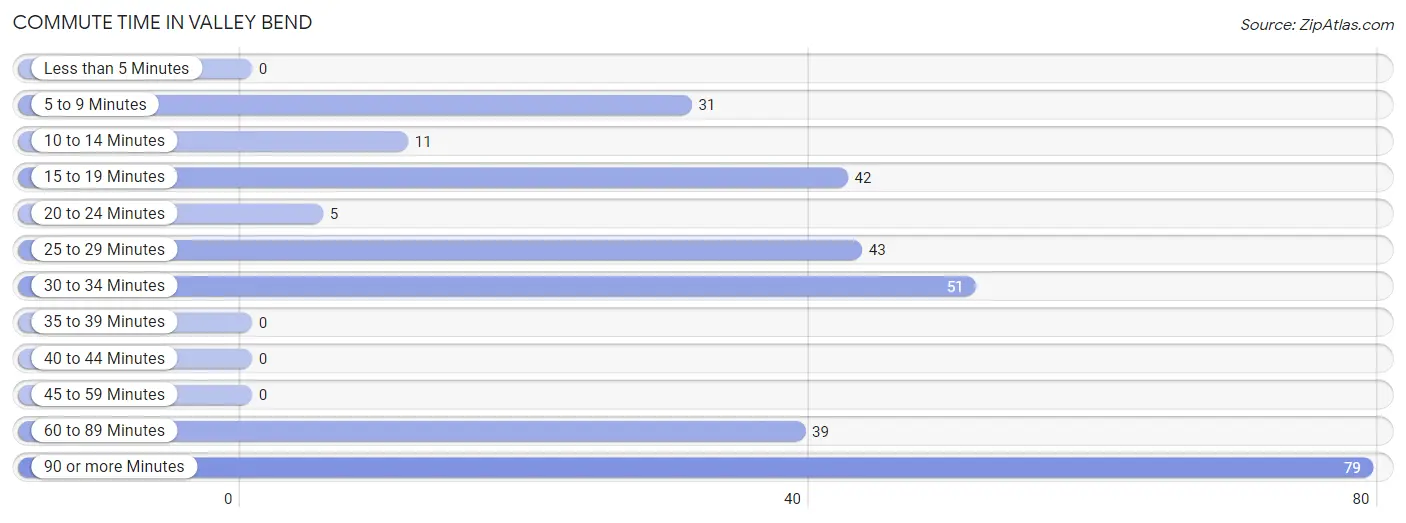
| Commute Time | # Commuters | % Commuters |
| Less than 5 Minutes | 0 | 0.0% |
| 5 to 9 Minutes | 31 | 10.3% |
| 10 to 14 Minutes | 11 | 3.6% |
| 15 to 19 Minutes | 42 | 14.0% |
| 20 to 24 Minutes | 5 | 1.7% |
| 25 to 29 Minutes | 43 | 14.3% |
| 30 to 34 Minutes | 51 | 16.9% |
| 35 to 39 Minutes | 0 | 0.0% |
| 40 to 44 Minutes | 0 | 0.0% |
| 45 to 59 Minutes | 0 | 0.0% |
| 60 to 89 Minutes | 39 | 13.0% |
| 90 or more Minutes | 79 | 26.3% |
Commute Time by Sex in Valley Bend
The most common commute times in Valley Bend are 25 to 29 minutes (43 commuters, 41.3%) for males and 90 or more minutes (79 commuters, 40.1%) for females.
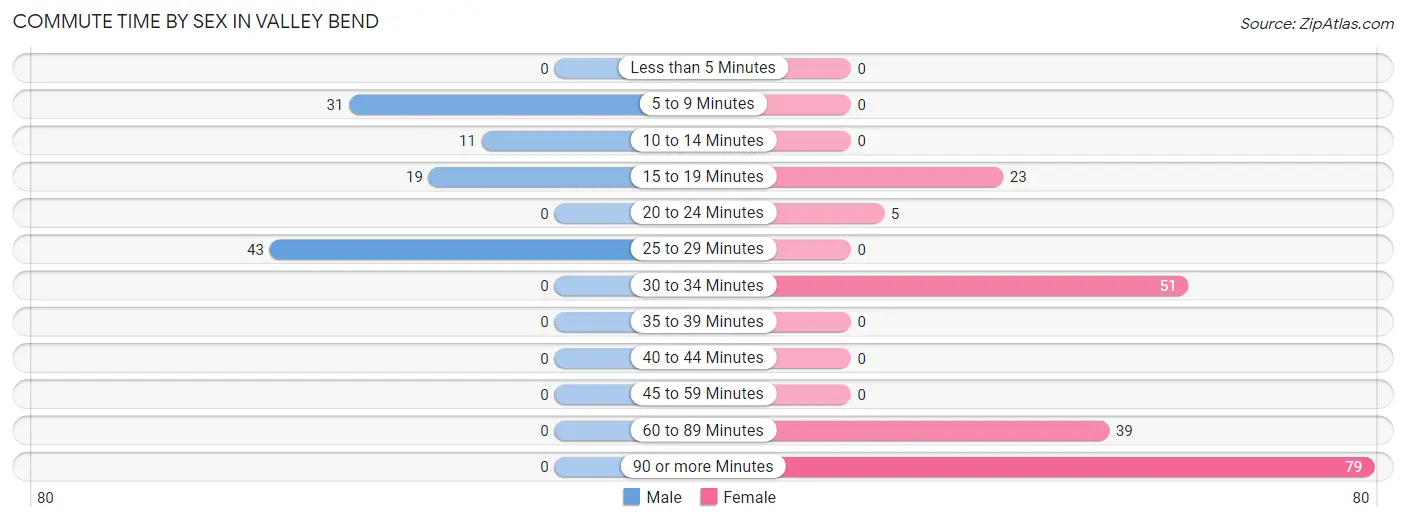
| Commute Time | Male | Female |
| Less than 5 Minutes | 0 (0.0%) | 0 (0.0%) |
| 5 to 9 Minutes | 31 (29.8%) | 0 (0.0%) |
| 10 to 14 Minutes | 11 (10.6%) | 0 (0.0%) |
| 15 to 19 Minutes | 19 (18.3%) | 23 (11.7%) |
| 20 to 24 Minutes | 0 (0.0%) | 5 (2.5%) |
| 25 to 29 Minutes | 43 (41.3%) | 0 (0.0%) |
| 30 to 34 Minutes | 0 (0.0%) | 51 (25.9%) |
| 35 to 39 Minutes | 0 (0.0%) | 0 (0.0%) |
| 40 to 44 Minutes | 0 (0.0%) | 0 (0.0%) |
| 45 to 59 Minutes | 0 (0.0%) | 0 (0.0%) |
| 60 to 89 Minutes | 0 (0.0%) | 39 (19.8%) |
| 90 or more Minutes | 0 (0.0%) | 79 (40.1%) |
Time of Departure to Work by Sex in Valley Bend
The most frequent times of departure to work in Valley Bend are 6:30 AM to 6:59 AM (34, 32.7%) for males and 6:30 AM to 6:59 AM (136, 69.0%) for females.
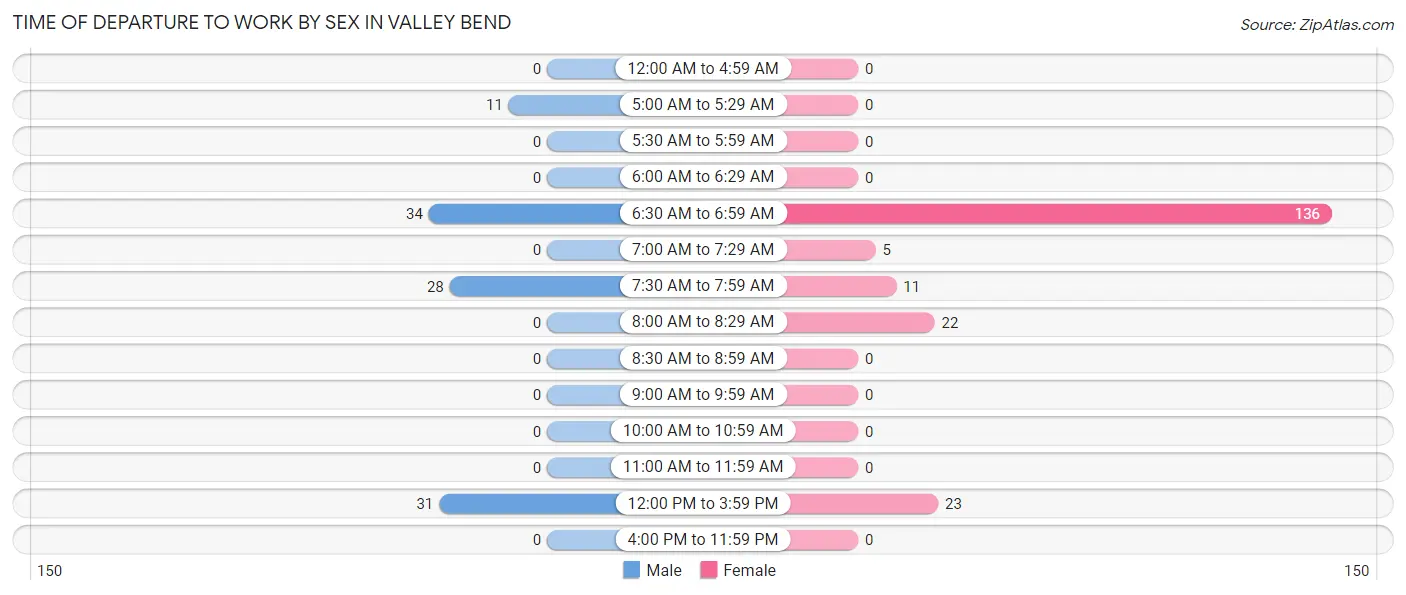
| Time of Departure | Male | Female |
| 12:00 AM to 4:59 AM | 0 (0.0%) | 0 (0.0%) |
| 5:00 AM to 5:29 AM | 11 (10.6%) | 0 (0.0%) |
| 5:30 AM to 5:59 AM | 0 (0.0%) | 0 (0.0%) |
| 6:00 AM to 6:29 AM | 0 (0.0%) | 0 (0.0%) |
| 6:30 AM to 6:59 AM | 34 (32.7%) | 136 (69.0%) |
| 7:00 AM to 7:29 AM | 0 (0.0%) | 5 (2.5%) |
| 7:30 AM to 7:59 AM | 28 (26.9%) | 11 (5.6%) |
| 8:00 AM to 8:29 AM | 0 (0.0%) | 22 (11.2%) |
| 8:30 AM to 8:59 AM | 0 (0.0%) | 0 (0.0%) |
| 9:00 AM to 9:59 AM | 0 (0.0%) | 0 (0.0%) |
| 10:00 AM to 10:59 AM | 0 (0.0%) | 0 (0.0%) |
| 11:00 AM to 11:59 AM | 0 (0.0%) | 0 (0.0%) |
| 12:00 PM to 3:59 PM | 31 (29.8%) | 23 (11.7%) |
| 4:00 PM to 11:59 PM | 0 (0.0%) | 0 (0.0%) |
| Total | 104 (100.0%) | 197 (100.0%) |
Housing Occupancy in Valley Bend
Occupancy by Ownership in Valley Bend
Of the total 215 dwellings in Valley Bend, owner-occupied units account for 154 (71.6%), while renter-occupied units make up 61 (28.4%).
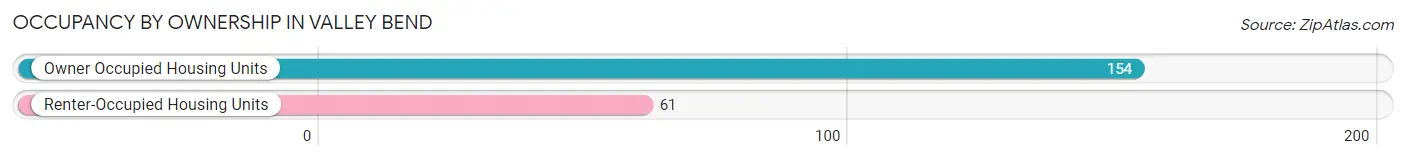
| Occupancy | # Housing Units | % Housing Units |
| Owner Occupied Housing Units | 154 | 71.6% |
| Renter-Occupied Housing Units | 61 | 28.4% |
| Total Occupied Housing Units | 215 | 100.0% |
Occupancy by Household Size in Valley Bend
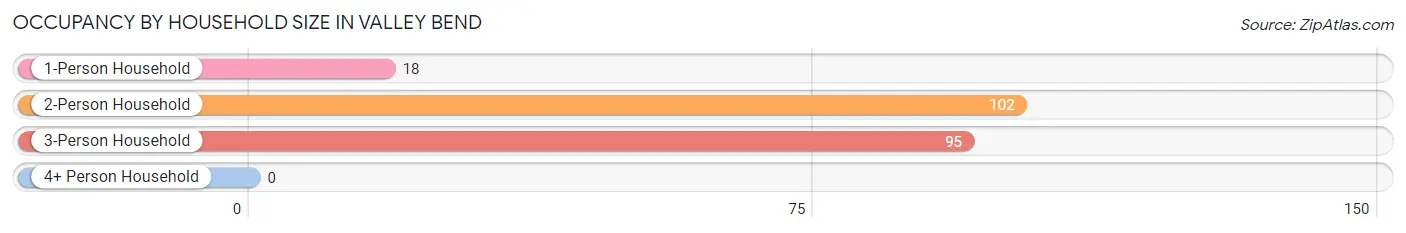
| Household Size | # Housing Units | % Housing Units |
| 1-Person Household | 18 | 8.4% |
| 2-Person Household | 102 | 47.4% |
| 3-Person Household | 95 | 44.2% |
| 4+ Person Household | 0 | 0.0% |
| Total Housing Units | 215 | 100.0% |
Occupancy by Ownership by Household Size in Valley Bend
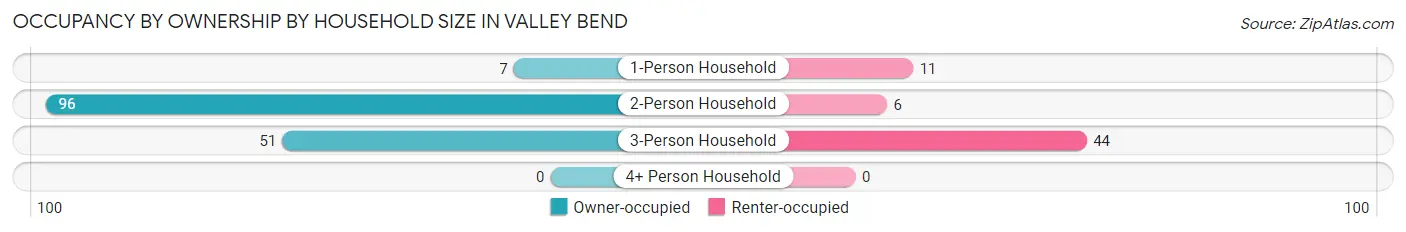
| Household Size | Owner-occupied | Renter-occupied |
| 1-Person Household | 7 (38.9%) | 11 (61.1%) |
| 2-Person Household | 96 (94.1%) | 6 (5.9%) |
| 3-Person Household | 51 (53.7%) | 44 (46.3%) |
| 4+ Person Household | 0 (0.0%) | 0 (0.0%) |
| Total Housing Units | 154 (71.6%) | 61 (28.4%) |
Occupancy by Educational Attainment in Valley Bend
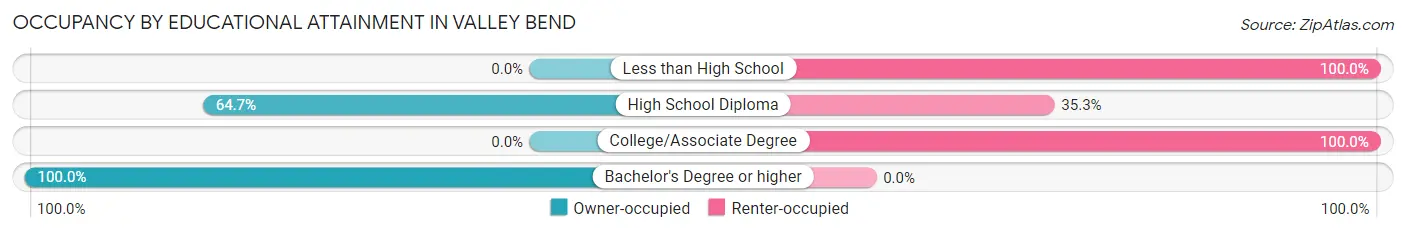
| Household Size | Owner-occupied | Renter-occupied |
| Less than High School | 0 (0.0%) | 15 (100.0%) |
| High School Diploma | 75 (64.7%) | 41 (35.3%) |
| College/Associate Degree | 0 (0.0%) | 5 (100.0%) |
| Bachelor's Degree or higher | 79 (100.0%) | 0 (0.0%) |
Occupancy by Age of Householder in Valley Bend
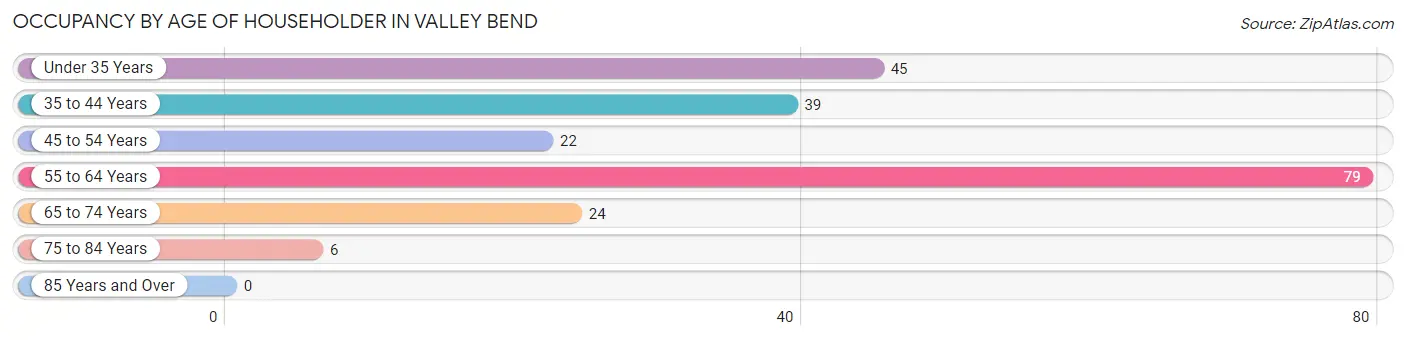
| Age Bracket | # Households | % Households |
| Under 35 Years | 45 | 20.9% |
| 35 to 44 Years | 39 | 18.1% |
| 45 to 54 Years | 22 | 10.2% |
| 55 to 64 Years | 79 | 36.7% |
| 65 to 74 Years | 24 | 11.2% |
| 75 to 84 Years | 6 | 2.8% |
| 85 Years and Over | 0 | 0.0% |
| Total | 215 | 100.0% |
Housing Finances in Valley Bend
Median Income by Occupancy in Valley Bend
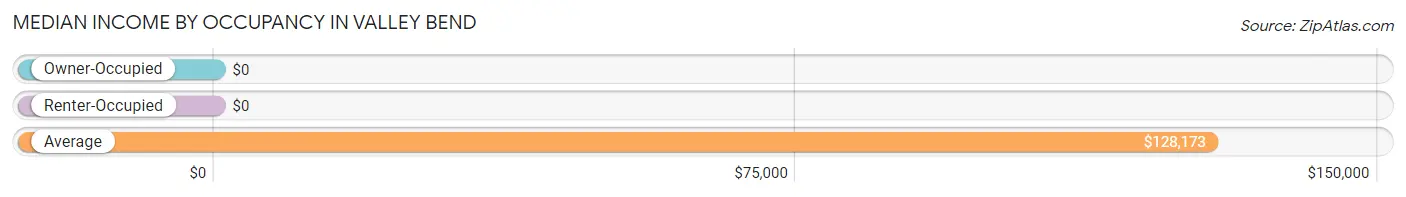
| Occupancy Type | # Households | Median Income |
| Owner-Occupied | 154 (71.6%) | $0 |
| Renter-Occupied | 61 (28.4%) | $0 |
| Average | 215 (100.0%) | $128,173 |
Occupancy by Householder Income Bracket in Valley Bend
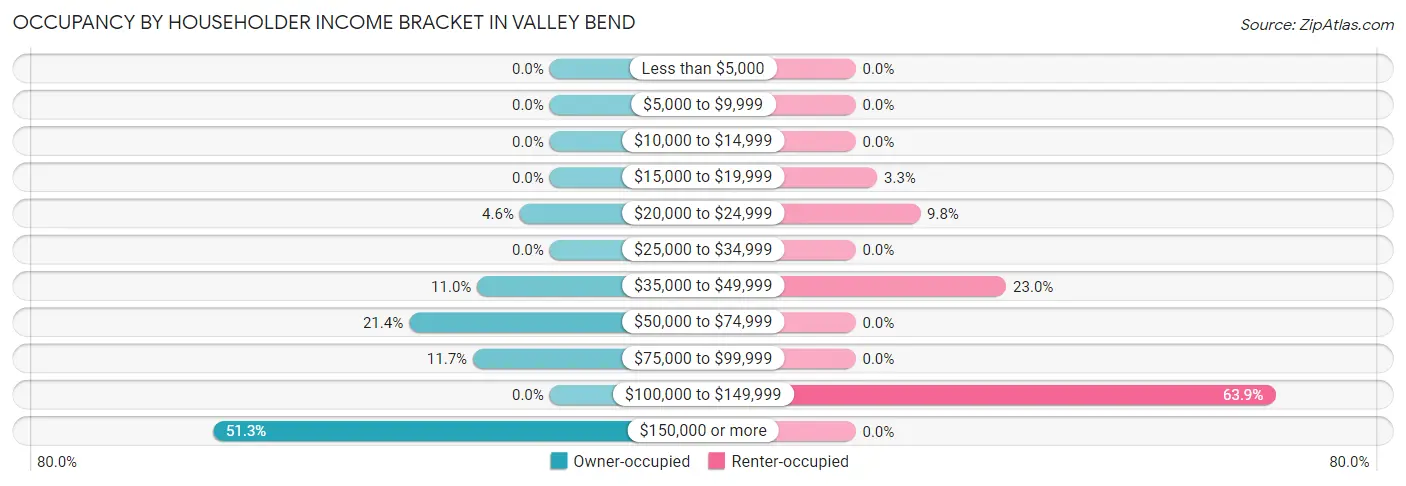
| Income Bracket | Owner-occupied | Renter-occupied |
| Less than $5,000 | 0 (0.0%) | 0 (0.0%) |
| $5,000 to $9,999 | 0 (0.0%) | 0 (0.0%) |
| $10,000 to $14,999 | 0 (0.0%) | 0 (0.0%) |
| $15,000 to $19,999 | 0 (0.0%) | 2 (3.3%) |
| $20,000 to $24,999 | 7 (4.5%) | 6 (9.8%) |
| $25,000 to $34,999 | 0 (0.0%) | 0 (0.0%) |
| $35,000 to $49,999 | 17 (11.0%) | 14 (23.0%) |
| $50,000 to $74,999 | 33 (21.4%) | 0 (0.0%) |
| $75,000 to $99,999 | 18 (11.7%) | 0 (0.0%) |
| $100,000 to $149,999 | 0 (0.0%) | 39 (63.9%) |
| $150,000 or more | 79 (51.3%) | 0 (0.0%) |
| Total | 154 (100.0%) | 61 (100.0%) |
Monthly Housing Cost Tiers in Valley Bend
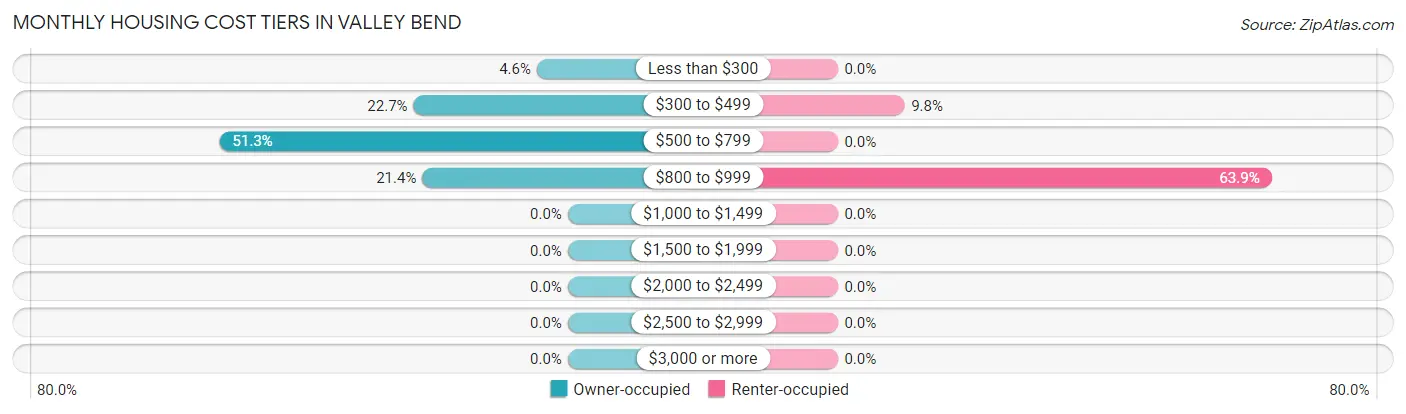
| Monthly Cost | Owner-occupied | Renter-occupied |
| Less than $300 | 7 (4.5%) | 0 (0.0%) |
| $300 to $499 | 35 (22.7%) | 6 (9.8%) |
| $500 to $799 | 79 (51.3%) | 0 (0.0%) |
| $800 to $999 | 33 (21.4%) | 39 (63.9%) |
| $1,000 to $1,499 | 0 (0.0%) | 0 (0.0%) |
| $1,500 to $1,999 | 0 (0.0%) | 0 (0.0%) |
| $2,000 to $2,499 | 0 (0.0%) | 0 (0.0%) |
| $2,500 to $2,999 | 0 (0.0%) | 0 (0.0%) |
| $3,000 or more | 0 (0.0%) | 0 (0.0%) |
| Total | 154 (100.0%) | 61 (100.0%) |
Physical Housing Characteristics in Valley Bend
Housing Structures in Valley Bend
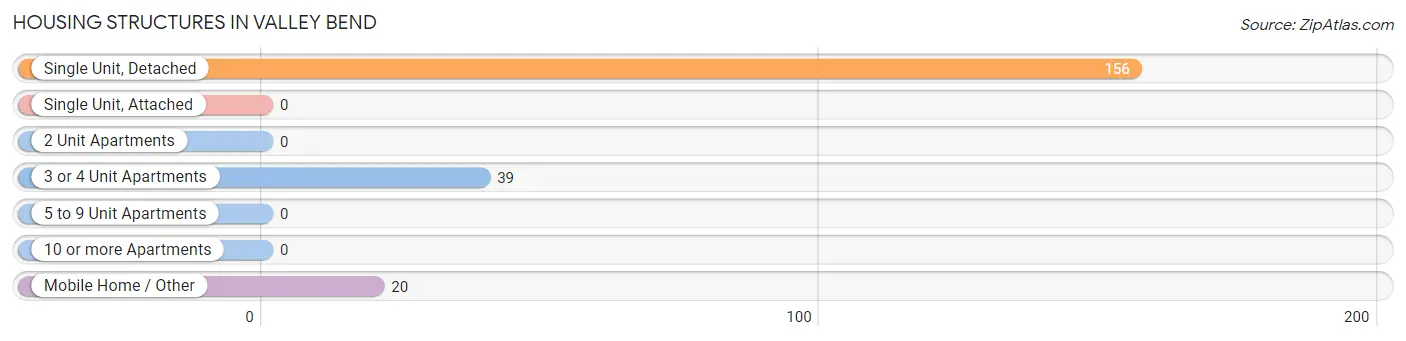
| Structure Type | # Housing Units | % Housing Units |
| Single Unit, Detached | 156 | 72.6% |
| Single Unit, Attached | 0 | 0.0% |
| 2 Unit Apartments | 0 | 0.0% |
| 3 or 4 Unit Apartments | 39 | 18.1% |
| 5 to 9 Unit Apartments | 0 | 0.0% |
| 10 or more Apartments | 0 | 0.0% |
| Mobile Home / Other | 20 | 9.3% |
| Total | 215 | 100.0% |
Housing Structures by Occupancy in Valley Bend
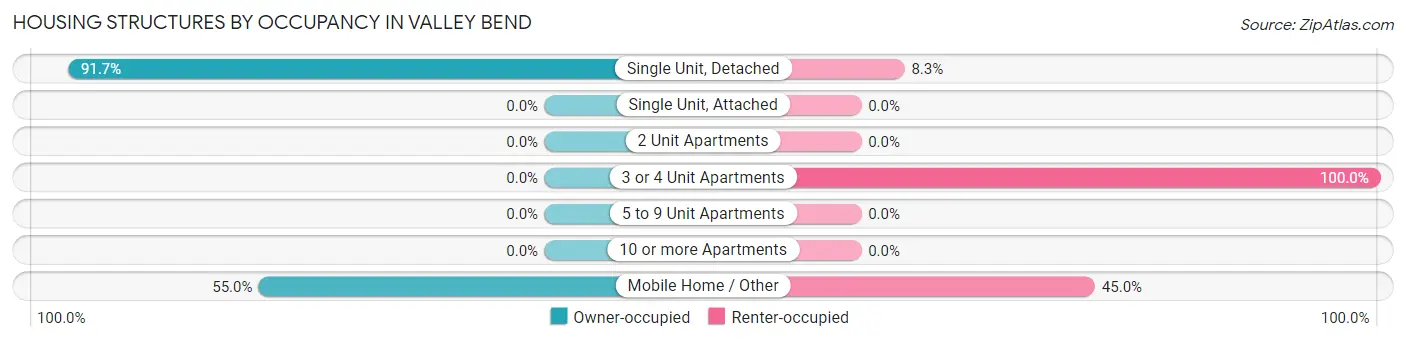
| Structure Type | Owner-occupied | Renter-occupied |
| Single Unit, Detached | 143 (91.7%) | 13 (8.3%) |
| Single Unit, Attached | 0 (0.0%) | 0 (0.0%) |
| 2 Unit Apartments | 0 (0.0%) | 0 (0.0%) |
| 3 or 4 Unit Apartments | 0 (0.0%) | 39 (100.0%) |
| 5 to 9 Unit Apartments | 0 (0.0%) | 0 (0.0%) |
| 10 or more Apartments | 0 (0.0%) | 0 (0.0%) |
| Mobile Home / Other | 11 (55.0%) | 9 (45.0%) |
| Total | 154 (71.6%) | 61 (28.4%) |
Housing Structures by Number of Rooms in Valley Bend
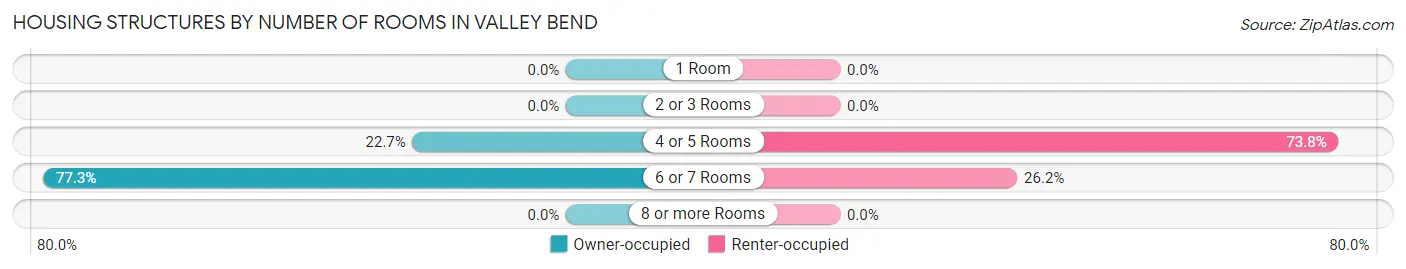
| Number of Rooms | Owner-occupied | Renter-occupied |
| 1 Room | 0 (0.0%) | 0 (0.0%) |
| 2 or 3 Rooms | 0 (0.0%) | 0 (0.0%) |
| 4 or 5 Rooms | 35 (22.7%) | 45 (73.8%) |
| 6 or 7 Rooms | 119 (77.3%) | 16 (26.2%) |
| 8 or more Rooms | 0 (0.0%) | 0 (0.0%) |
| Total | 154 (100.0%) | 61 (100.0%) |
Housing Structure by Heating Type in Valley Bend
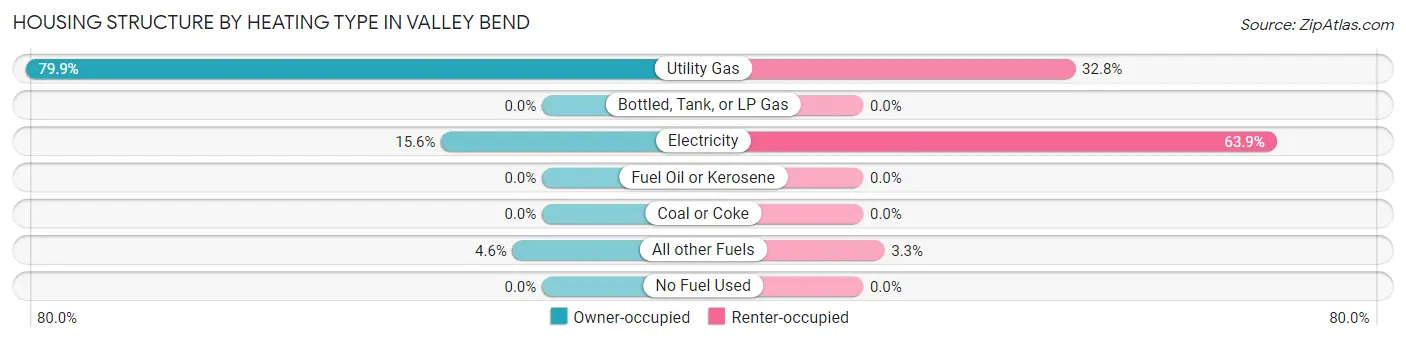
| Heating Type | Owner-occupied | Renter-occupied |
| Utility Gas | 123 (79.9%) | 20 (32.8%) |
| Bottled, Tank, or LP Gas | 0 (0.0%) | 0 (0.0%) |
| Electricity | 24 (15.6%) | 39 (63.9%) |
| Fuel Oil or Kerosene | 0 (0.0%) | 0 (0.0%) |
| Coal or Coke | 0 (0.0%) | 0 (0.0%) |
| All other Fuels | 7 (4.5%) | 2 (3.3%) |
| No Fuel Used | 0 (0.0%) | 0 (0.0%) |
| Total | 154 (100.0%) | 61 (100.0%) |
Household Vehicle Usage in Valley Bend
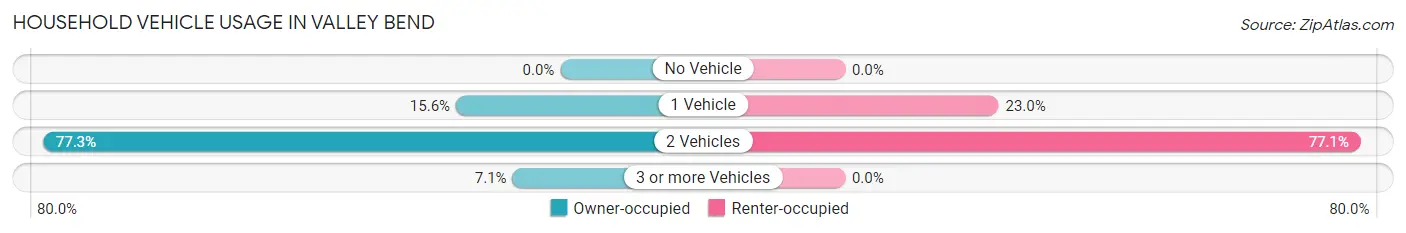
| Vehicles per Household | Owner-occupied | Renter-occupied |
| No Vehicle | 0 (0.0%) | 0 (0.0%) |
| 1 Vehicle | 24 (15.6%) | 14 (23.0%) |
| 2 Vehicles | 119 (77.3%) | 47 (77.0%) |
| 3 or more Vehicles | 11 (7.1%) | 0 (0.0%) |
| Total | 154 (100.0%) | 61 (100.0%) |
Real Estate & Mortgages in Valley Bend
Real Estate and Mortgage Overview in Valley Bend
| Characteristic | Without Mortgage | With Mortgage |
| Housing Units | 121 | 33 |
| Median Property Value | $261,700 | $0 |
| Median Household Income | $193,085 | $0 |
| Monthly Housing Costs | $623 | $0 |
| Real Estate Taxes | $490 | $0 |
Property Value by Mortgage Status in Valley Bend
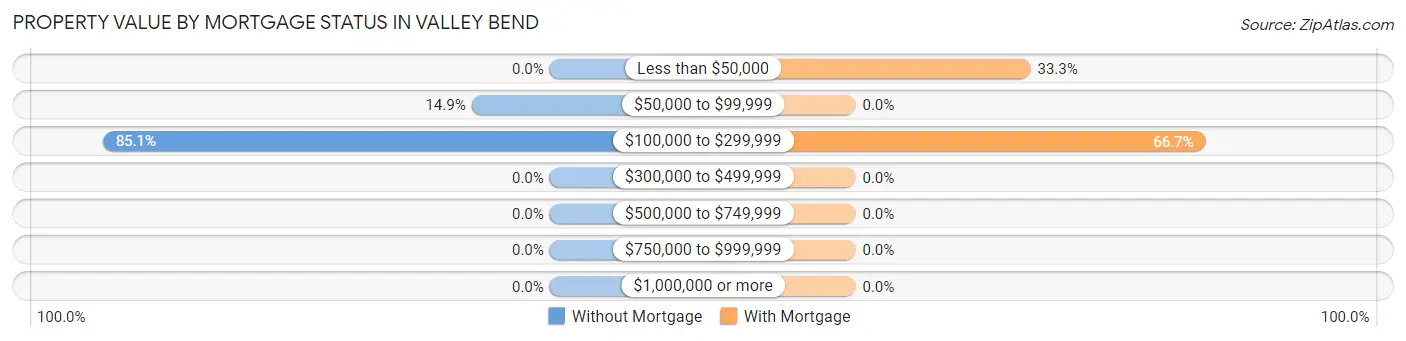
| Property Value | Without Mortgage | With Mortgage |
| Less than $50,000 | 0 (0.0%) | 11 (33.3%) |
| $50,000 to $99,999 | 18 (14.9%) | 0 (0.0%) |
| $100,000 to $299,999 | 103 (85.1%) | 22 (66.7%) |
| $300,000 to $499,999 | 0 (0.0%) | 0 (0.0%) |
| $500,000 to $749,999 | 0 (0.0%) | 0 (0.0%) |
| $750,000 to $999,999 | 0 (0.0%) | 0 (0.0%) |
| $1,000,000 or more | 0 (0.0%) | 0 (0.0%) |
| Total | 121 (100.0%) | 33 (100.0%) |
Household Income by Mortgage Status in Valley Bend
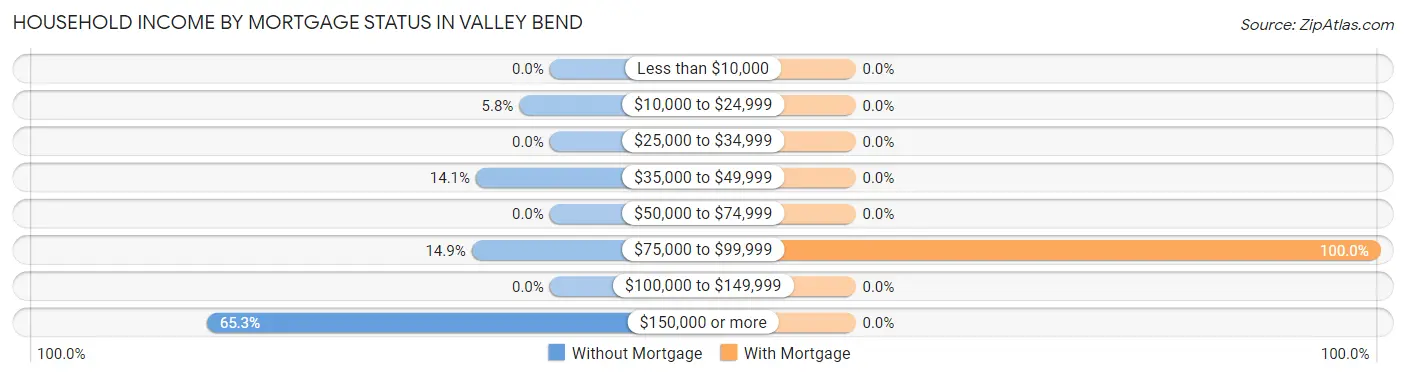
| Household Income | Without Mortgage | With Mortgage |
| Less than $10,000 | 0 (0.0%) | 0 (0.0%) |
| $10,000 to $24,999 | 7 (5.8%) | 0 (0.0%) |
| $25,000 to $34,999 | 0 (0.0%) | 0 (0.0%) |
| $35,000 to $49,999 | 17 (14.1%) | 0 (0.0%) |
| $50,000 to $74,999 | 0 (0.0%) | 0 (0.0%) |
| $75,000 to $99,999 | 18 (14.9%) | 33 (100.0%) |
| $100,000 to $149,999 | 0 (0.0%) | 0 (0.0%) |
| $150,000 or more | 79 (65.3%) | 0 (0.0%) |
| Total | 121 (100.0%) | 33 (100.0%) |
Property Value to Household Income Ratio in Valley Bend
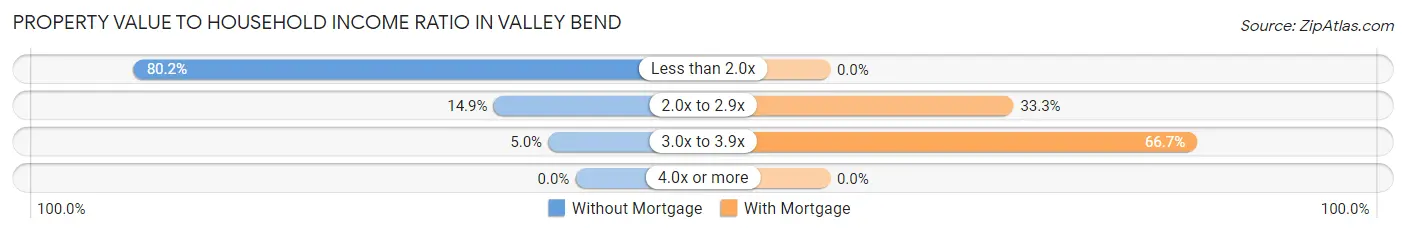
| Value-to-Income Ratio | Without Mortgage | With Mortgage |
| Less than 2.0x | 97 (80.2%) | 0 (0.0%) |
| 2.0x to 2.9x | 18 (14.9%) | 11 (33.3%) |
| 3.0x to 3.9x | 6 (5.0%) | 22 (66.7%) |
| 4.0x or more | 0 (0.0%) | 0 (0.0%) |
| Total | 121 (100.0%) | 33 (100.0%) |
Real Estate Taxes by Mortgage Status in Valley Bend
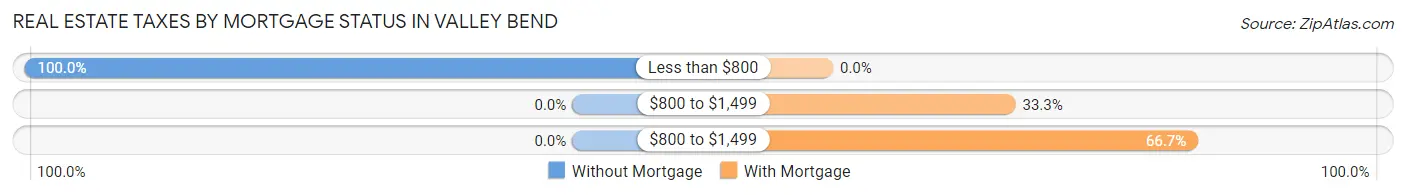
| Property Taxes | Without Mortgage | With Mortgage |
| Less than $800 | 121 (100.0%) | 0 (0.0%) |
| $800 to $1,499 | 0 (0.0%) | 11 (33.3%) |
| $800 to $1,499 | 0 (0.0%) | 22 (66.7%) |
| Total | 121 (100.0%) | 33 (100.0%) |
Health & Disability in Valley Bend
Health Insurance Coverage by Age in Valley Bend
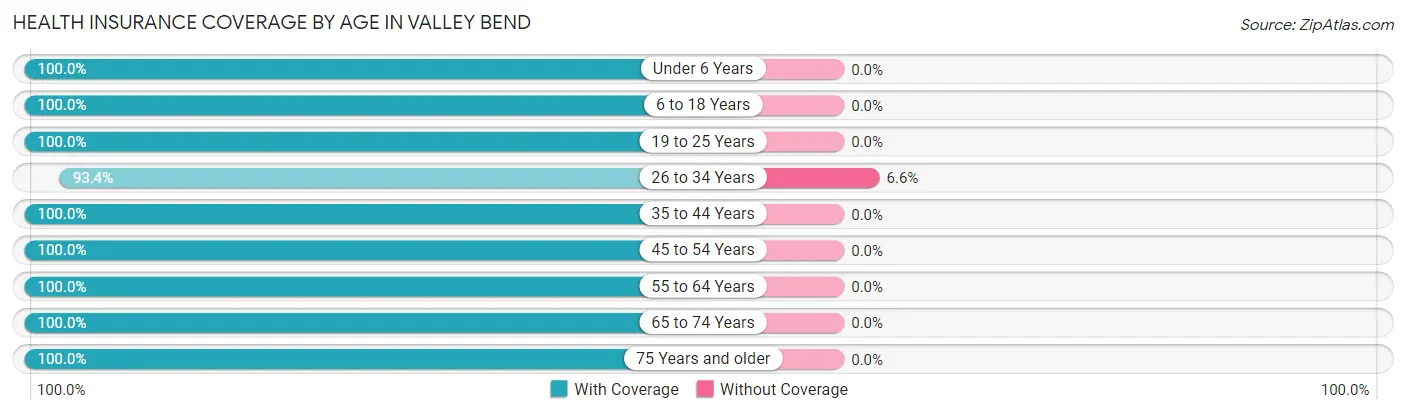
| Age Bracket | With Coverage | Without Coverage |
| Under 6 Years | 50 (100.0%) | 0 (0.0%) |
| 6 to 18 Years | 54 (100.0%) | 0 (0.0%) |
| 19 to 25 Years | 76 (100.0%) | 0 (0.0%) |
| 26 to 34 Years | 71 (93.4%) | 5 (6.6%) |
| 35 to 44 Years | 51 (100.0%) | 0 (0.0%) |
| 45 to 54 Years | 22 (100.0%) | 0 (0.0%) |
| 55 to 64 Years | 217 (100.0%) | 0 (0.0%) |
| 65 to 74 Years | 33 (100.0%) | 0 (0.0%) |
| 75 Years and older | 6 (100.0%) | 0 (0.0%) |
| Total | 580 (99.2%) | 5 (0.9%) |
Health Insurance Coverage by Citizenship Status in Valley Bend
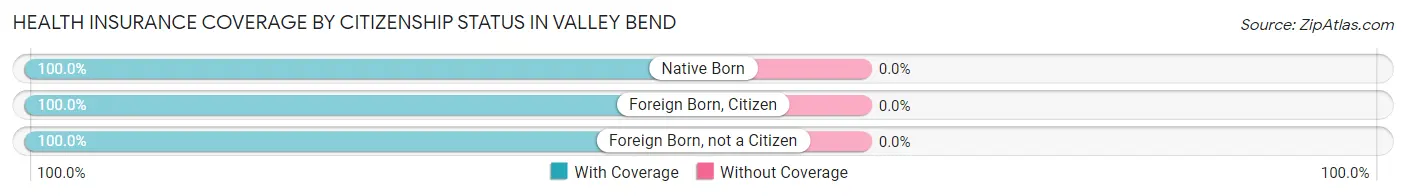
| Citizenship Status | With Coverage | Without Coverage |
| Native Born | 50 (100.0%) | 0 (0.0%) |
| Foreign Born, Citizen | 54 (100.0%) | 0 (0.0%) |
| Foreign Born, not a Citizen | 76 (100.0%) | 0 (0.0%) |
Health Insurance Coverage by Household Income in Valley Bend
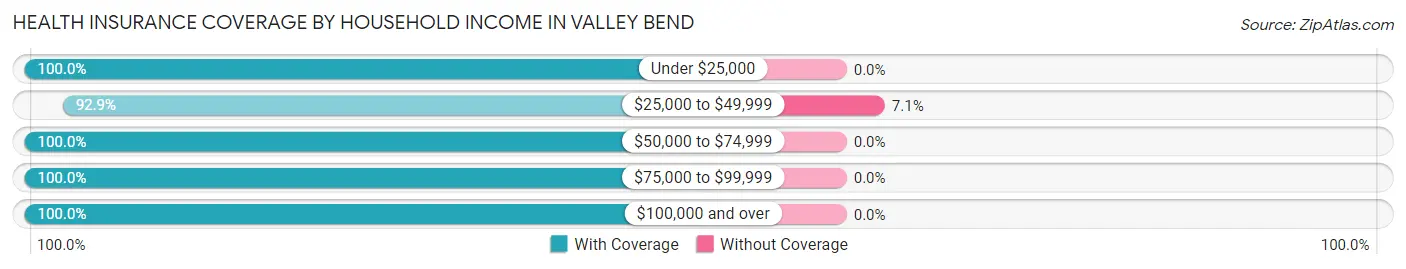
| Household Income | With Coverage | Without Coverage |
| Under $25,000 | 24 (100.0%) | 0 (0.0%) |
| $25,000 to $49,999 | 65 (92.9%) | 5 (7.1%) |
| $50,000 to $74,999 | 129 (100.0%) | 0 (0.0%) |
| $75,000 to $99,999 | 43 (100.0%) | 0 (0.0%) |
| $100,000 and over | 319 (100.0%) | 0 (0.0%) |
Public vs Private Health Insurance Coverage by Age in Valley Bend
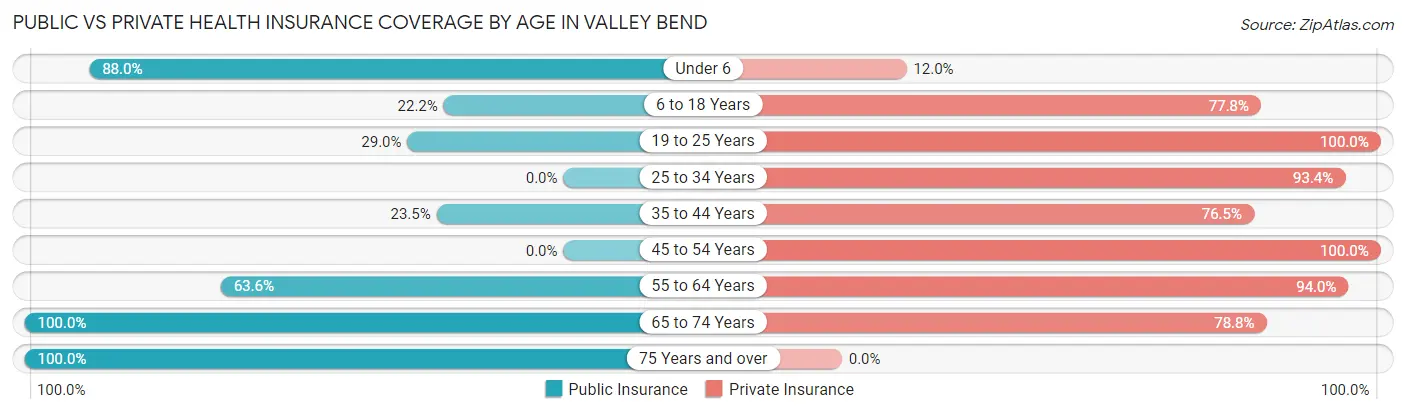
| Age Bracket | Public Insurance | Private Insurance |
| Under 6 | 44 (88.0%) | 6 (12.0%) |
| 6 to 18 Years | 12 (22.2%) | 42 (77.8%) |
| 19 to 25 Years | 22 (28.9%) | 76 (100.0%) |
| 25 to 34 Years | 0 (0.0%) | 71 (93.4%) |
| 35 to 44 Years | 12 (23.5%) | 39 (76.5%) |
| 45 to 54 Years | 0 (0.0%) | 22 (100.0%) |
| 55 to 64 Years | 138 (63.6%) | 204 (94.0%) |
| 65 to 74 Years | 33 (100.0%) | 26 (78.8%) |
| 75 Years and over | 6 (100.0%) | 0 (0.0%) |
| Total | 267 (45.6%) | 486 (83.1%) |
Disability Status by Sex by Age in Valley Bend
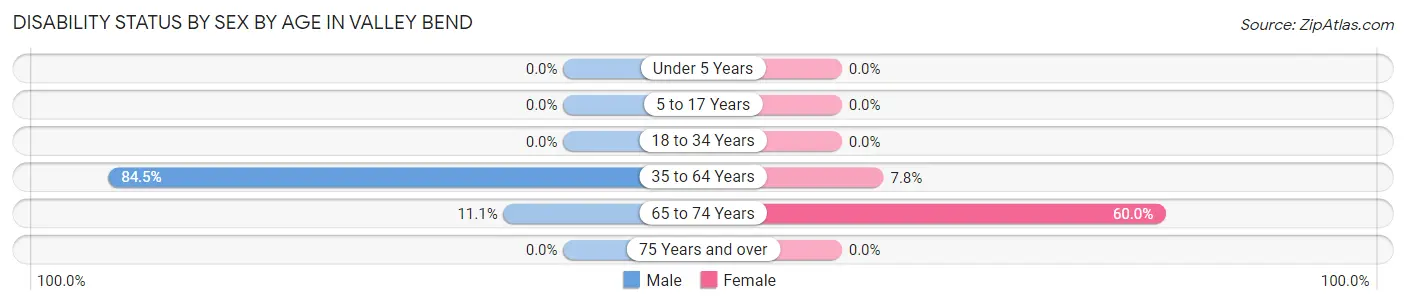
| Age Bracket | Male | Female |
| Under 5 Years | 0 (0.0%) | 0 (0.0%) |
| 5 to 17 Years | 0 (0.0%) | 0 (0.0%) |
| 18 to 34 Years | 0 (0.0%) | 0 (0.0%) |
| 35 to 64 Years | 125 (84.5%) | 11 (7.7%) |
| 65 to 74 Years | 2 (11.1%) | 9 (60.0%) |
| 75 Years and over | 0 (0.0%) | 0 (0.0%) |
Disability Class by Sex by Age in Valley Bend
Disability Class: Hearing Difficulty
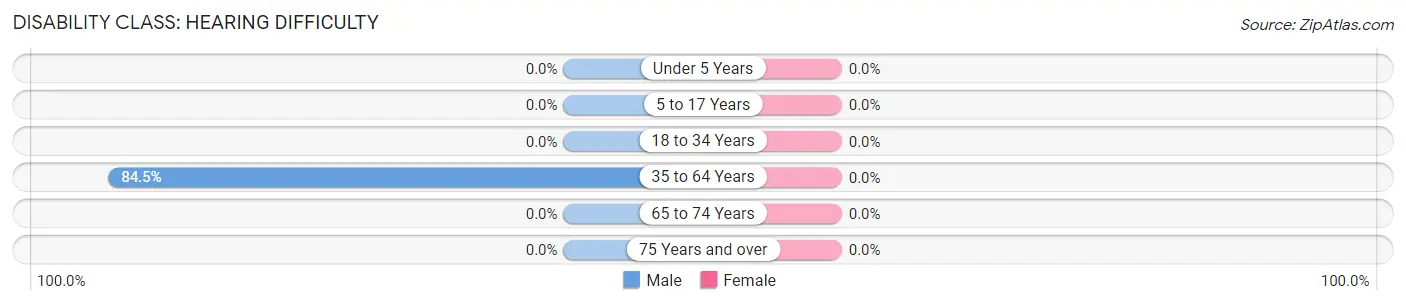
| Age Bracket | Male | Female |
| Under 5 Years | 0 (0.0%) | 0 (0.0%) |
| 5 to 17 Years | 0 (0.0%) | 0 (0.0%) |
| 18 to 34 Years | 0 (0.0%) | 0 (0.0%) |
| 35 to 64 Years | 125 (84.5%) | 0 (0.0%) |
| 65 to 74 Years | 0 (0.0%) | 0 (0.0%) |
| 75 Years and over | 0 (0.0%) | 0 (0.0%) |
Disability Class: Vision Difficulty
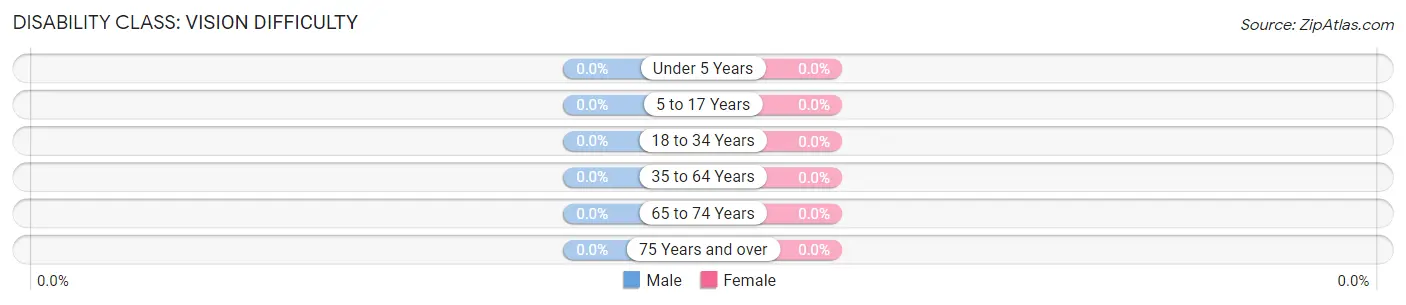
| Age Bracket | Male | Female |
| Under 5 Years | 0 (0.0%) | 0 (0.0%) |
| 5 to 17 Years | 0 (0.0%) | 0 (0.0%) |
| 18 to 34 Years | 0 (0.0%) | 0 (0.0%) |
| 35 to 64 Years | 0 (0.0%) | 0 (0.0%) |
| 65 to 74 Years | 0 (0.0%) | 0 (0.0%) |
| 75 Years and over | 0 (0.0%) | 0 (0.0%) |
Disability Class: Cognitive Difficulty
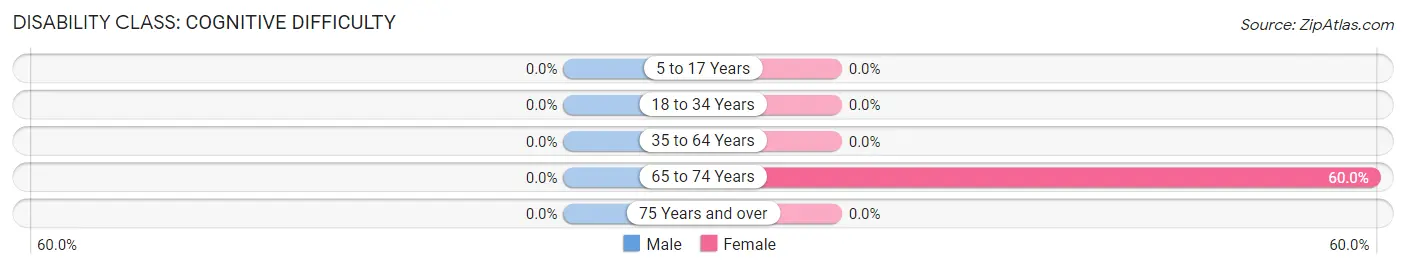
| Age Bracket | Male | Female |
| 5 to 17 Years | 0 (0.0%) | 0 (0.0%) |
| 18 to 34 Years | 0 (0.0%) | 0 (0.0%) |
| 35 to 64 Years | 0 (0.0%) | 0 (0.0%) |
| 65 to 74 Years | 0 (0.0%) | 9 (60.0%) |
| 75 Years and over | 0 (0.0%) | 0 (0.0%) |
Disability Class: Ambulatory Difficulty
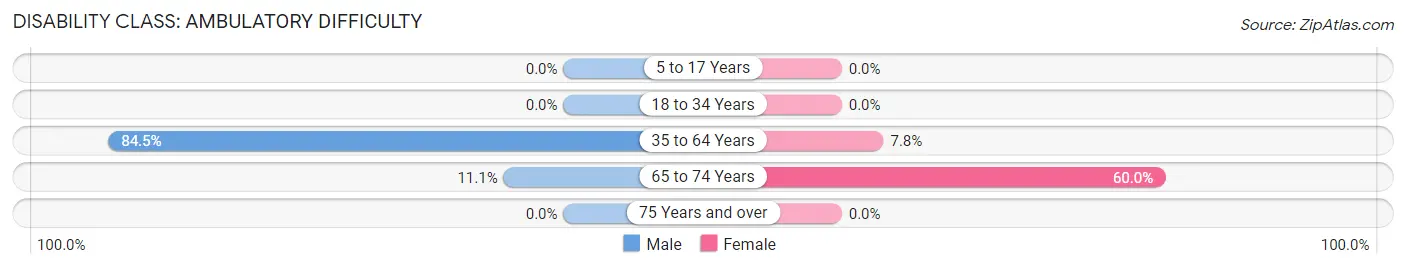
| Age Bracket | Male | Female |
| 5 to 17 Years | 0 (0.0%) | 0 (0.0%) |
| 18 to 34 Years | 0 (0.0%) | 0 (0.0%) |
| 35 to 64 Years | 125 (84.5%) | 11 (7.7%) |
| 65 to 74 Years | 2 (11.1%) | 9 (60.0%) |
| 75 Years and over | 0 (0.0%) | 0 (0.0%) |
Disability Class: Self-Care Difficulty
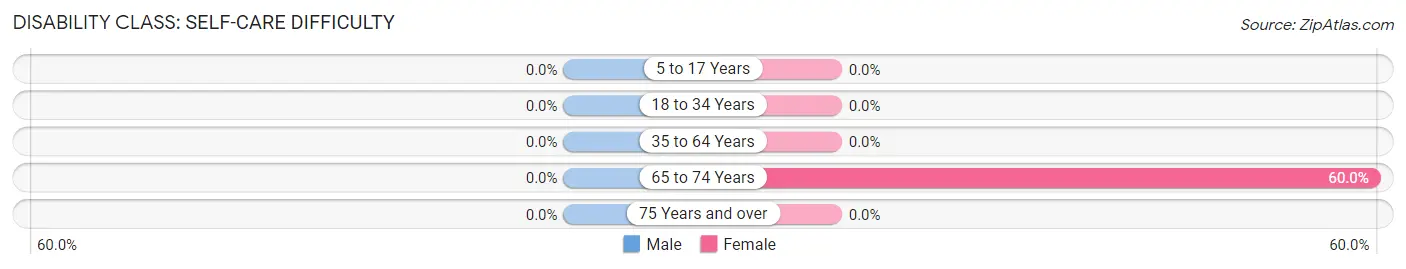
| Age Bracket | Male | Female |
| 5 to 17 Years | 0 (0.0%) | 0 (0.0%) |
| 18 to 34 Years | 0 (0.0%) | 0 (0.0%) |
| 35 to 64 Years | 0 (0.0%) | 0 (0.0%) |
| 65 to 74 Years | 0 (0.0%) | 9 (60.0%) |
| 75 Years and over | 0 (0.0%) | 0 (0.0%) |
Technology Access in Valley Bend
Computing Device Access in Valley Bend
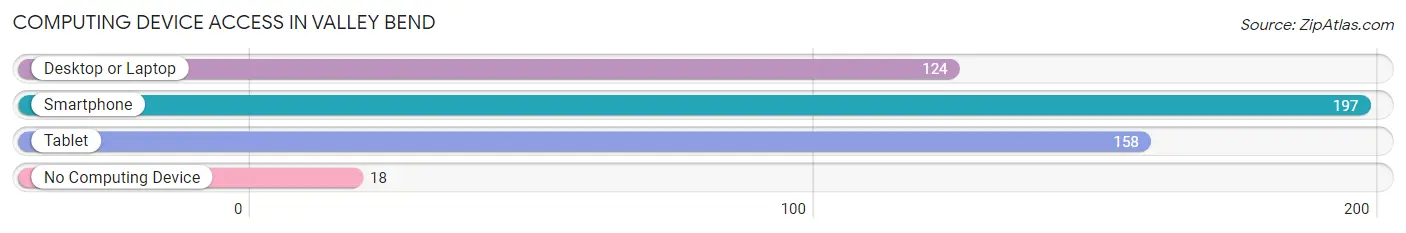
| Device Type | # Households | % Households |
| Desktop or Laptop | 124 | 57.7% |
| Smartphone | 197 | 91.6% |
| Tablet | 158 | 73.5% |
| No Computing Device | 18 | 8.4% |
| Total | 215 | 100.0% |
Internet Access in Valley Bend
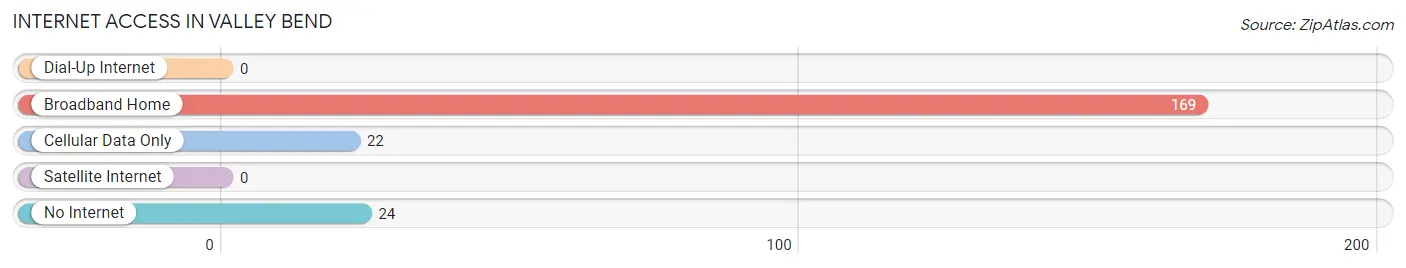
| Internet Type | # Households | % Households |
| Dial-Up Internet | 0 | 0.0% |
| Broadband Home | 169 | 78.6% |
| Cellular Data Only | 22 | 10.2% |
| Satellite Internet | 0 | 0.0% |
| No Internet | 24 | 11.2% |
| Total | 215 | 100.0% |
Valley Bend Summary
Valley Bend is a small unincorporated community located in Randolph County, West Virginia. It is situated in the Appalachian Mountains, and is part of the Tygart Valley River watershed. The population of Valley Bend was estimated to be around 1,000 in 2020.
History
Valley Bend was first settled in the late 1700s by a group of German immigrants. The town was originally known as “Valley Bend Settlement” and was located along the Tygart Valley River. The settlement was established as a trading post and was used as a stopover for travelers heading west.
In the early 1800s, the town was renamed “Valley Bend” and was incorporated in 1832. The town was home to a variety of businesses, including a sawmill, gristmill, and a tannery. The town also had a post office, a school, and a church.
In the late 1800s, the town began to decline due to the decline of the railroad industry. The town was eventually abandoned in the early 1900s.
Geography
Valley Bend is located in the Appalachian Mountains in Randolph County, West Virginia. The town is situated in the Tygart Valley River watershed and is surrounded by mountains and forests. The town is located at an elevation of 1,890 feet above sea level.
The climate in Valley Bend is humid continental, with hot summers and cold winters. The average annual temperature is around 50 degrees Fahrenheit. The average annual precipitation is around 40 inches.
Economy
The economy of Valley Bend is largely based on tourism and agriculture. The town is home to several tourist attractions, including the Valley Bend Wildlife Management Area, the Valley Bend Historical Museum, and the Valley Bend Nature Center.
Agriculture is also an important part of the local economy. The town is home to several farms, which produce a variety of crops, including corn, soybeans, hay, and wheat.
Demographics
The population of Valley Bend was estimated to be around 1,000 in 2020. The town is predominantly white, with a small minority population. The median household income is around $35,000. The median age is around 40 years old.
Conclusion
Valley Bend is a small unincorporated community located in Randolph County, West Virginia. It is situated in the Appalachian Mountains, and is part of the Tygart Valley River watershed. The town has a long history, and was once a thriving trading post. Today, the economy of Valley Bend is largely based on tourism and agriculture. The population of Valley Bend was estimated to be around 1,000 in 2020.
Common Questions
What is Per Capita Income in Valley Bend?
Per Capita income in Valley Bend is $52,228.
What is the Median Household income in Valley Bend?
Median Household Income in Valley Bend is $128,173.
What is Inequality or Gini Index in Valley Bend?
Inequality or Gini Index in Valley Bend is 0.31.
What is the Total Population of Valley Bend?
Total Population of Valley Bend is 585.
What is the Total Male Population of Valley Bend?
Total Male Population of Valley Bend is 265.
What is the Total Female Population of Valley Bend?
Total Female Population of Valley Bend is 320.
What is the Ratio of Males per 100 Females in Valley Bend?
There are 82.81 Males per 100 Females in Valley Bend.
What is the Ratio of Females per 100 Males in Valley Bend?
There are 120.75 Females per 100 Males in Valley Bend.
What is the Median Population Age in Valley Bend?
Median Population Age in Valley Bend is 39.6 Years.
What is the Average Family Size in Valley Bend
Average Family Size in Valley Bend is 2.5 People.
What is the Average Household Size in Valley Bend
Average Household Size in Valley Bend is 2.7 People.
How Large is the Labor Force in Valley Bend?
There are 313 People in the Labor Forcein in Valley Bend.
What is the Percentage of People in the Labor Force in Valley Bend?
63.5% of People are in the Labor Force in Valley Bend.
What is the Unemployment Rate in Valley Bend?
Unemployment Rate in Valley Bend is 3.8%.