Chili, NM Map & Demographics
Chili Map
Chili Overview
$36,699
PER CAPITA INCOME
$58,683
AVG HOUSEHOLD INCOME
0.15
INEQUALITY / GINI INDEX
220
TOTAL POPULATION
79
MALE POPULATION
141
FEMALE POPULATION
56.03
MALES / 100 FEMALES
178.48
FEMALES / 100 MALES
65.4
MEDIAN AGE
2.5
AVG FAMILY SIZE
1.6
AVG HOUSEHOLD SIZE
121
LABOR FORCE [ PEOPLE ]
55.0%
PERCENT IN LABOR FORCE
Income in Chili
Income Overview in Chili
| Characteristic | Number | Measure |
| Per Capita Income | 220 | $36,699 |
| Median Family Income | 57 | $0 |
| Mean Family Income | 57 | $0 |
| Median Household Income | 135 | $58,683 |
| Mean Household Income | 135 | $54,699 |
| Income Deficit | 57 | $0 |
| Wage / Income Gap (%) | 220 | 0.00% |
| Wage / Income Gap ($) | 220 | 100.00¢ per $1 |
| Gini / Inequality Index | 220 | 0.15 |
Earnings by Sex in Chili
| Sex | Number | Average Earnings |
| Male | 56 (31.6%) | $0 |
| Female | 121 (68.4%) | $0 |
| Total | 177 (100.0%) | $0 |
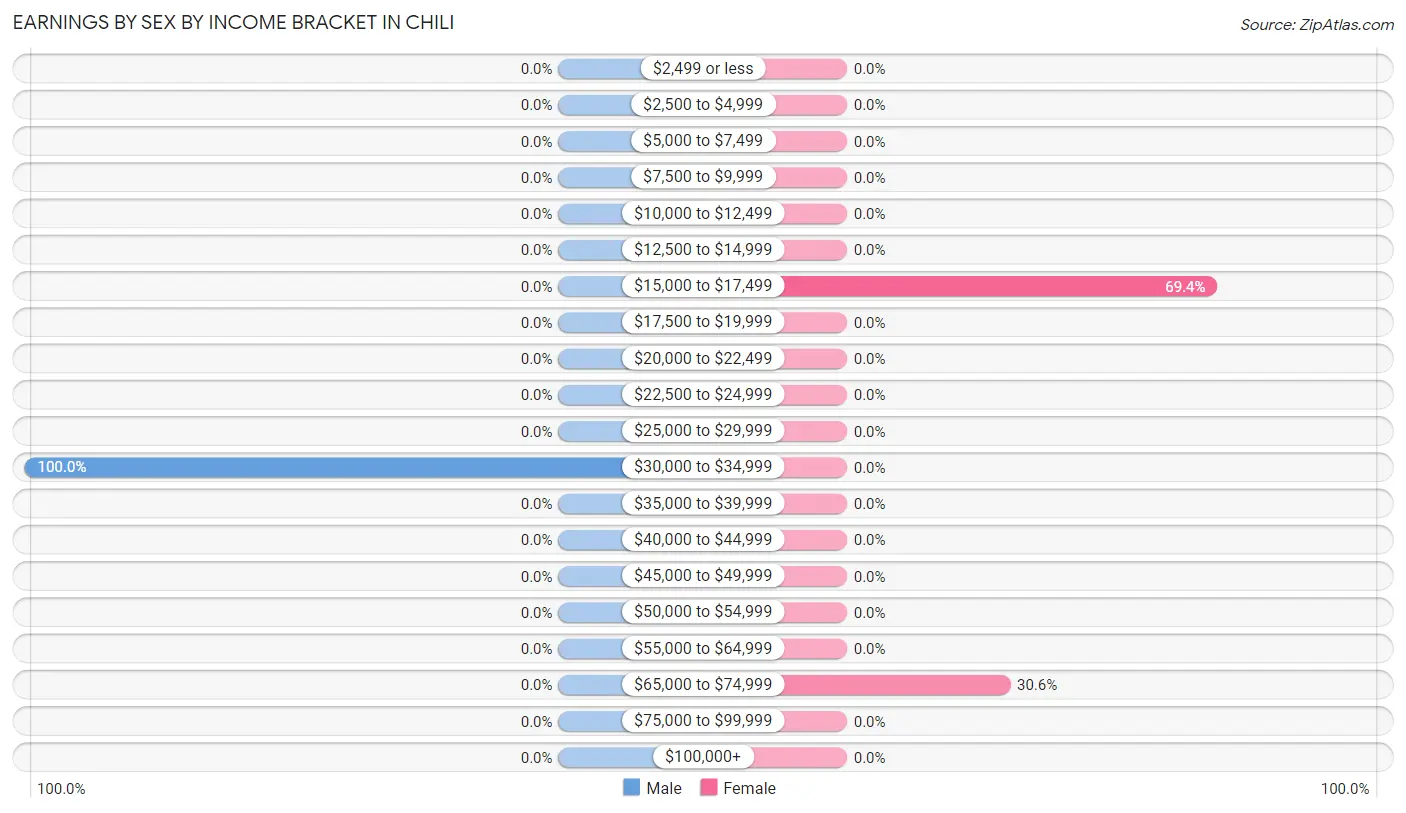
Earnings by Sex by Income Bracket in Chili
The most common earnings brackets in Chili are $30,000 to $34,999 for men (56 | 100.0%) and $15,000 to $17,499 for women (84 | 69.4%).
| Income | Male | Female |
| $2,499 or less | 0 (0.0%) | 0 (0.0%) |
| $2,500 to $4,999 | 0 (0.0%) | 0 (0.0%) |
| $5,000 to $7,499 | 0 (0.0%) | 0 (0.0%) |
| $7,500 to $9,999 | 0 (0.0%) | 0 (0.0%) |
| $10,000 to $12,499 | 0 (0.0%) | 0 (0.0%) |
| $12,500 to $14,999 | 0 (0.0%) | 0 (0.0%) |
| $15,000 to $17,499 | 0 (0.0%) | 84 (69.4%) |
| $17,500 to $19,999 | 0 (0.0%) | 0 (0.0%) |
| $20,000 to $22,499 | 0 (0.0%) | 0 (0.0%) |
| $22,500 to $24,999 | 0 (0.0%) | 0 (0.0%) |
| $25,000 to $29,999 | 0 (0.0%) | 0 (0.0%) |
| $30,000 to $34,999 | 56 (100.0%) | 0 (0.0%) |
| $35,000 to $39,999 | 0 (0.0%) | 0 (0.0%) |
| $40,000 to $44,999 | 0 (0.0%) | 0 (0.0%) |
| $45,000 to $49,999 | 0 (0.0%) | 0 (0.0%) |
| $50,000 to $54,999 | 0 (0.0%) | 0 (0.0%) |
| $55,000 to $64,999 | 0 (0.0%) | 0 (0.0%) |
| $65,000 to $74,999 | 0 (0.0%) | 37 (30.6%) |
| $75,000 to $99,999 | 0 (0.0%) | 0 (0.0%) |
| $100,000+ | 0 (0.0%) | 0 (0.0%) |
| Total | 56 (100.0%) | 121 (100.0%) |
Earnings by Sex by Educational Attainment in Chili
| Educational Attainment | Male Income | Female Income |
| Less than High School | - | - |
| High School Diploma | - | - |
| College or Associate's Degree | - | - |
| Bachelor's Degree | - | - |
| Graduate Degree | - | - |
| Total | - | - |
Family Income in Chili
Family Income Brackets in Chili
According to the Chili family income data, there are 57 families falling into the $50,000 to $74,999 income range, which is the most common income bracket and makes up 100.0% of all families.
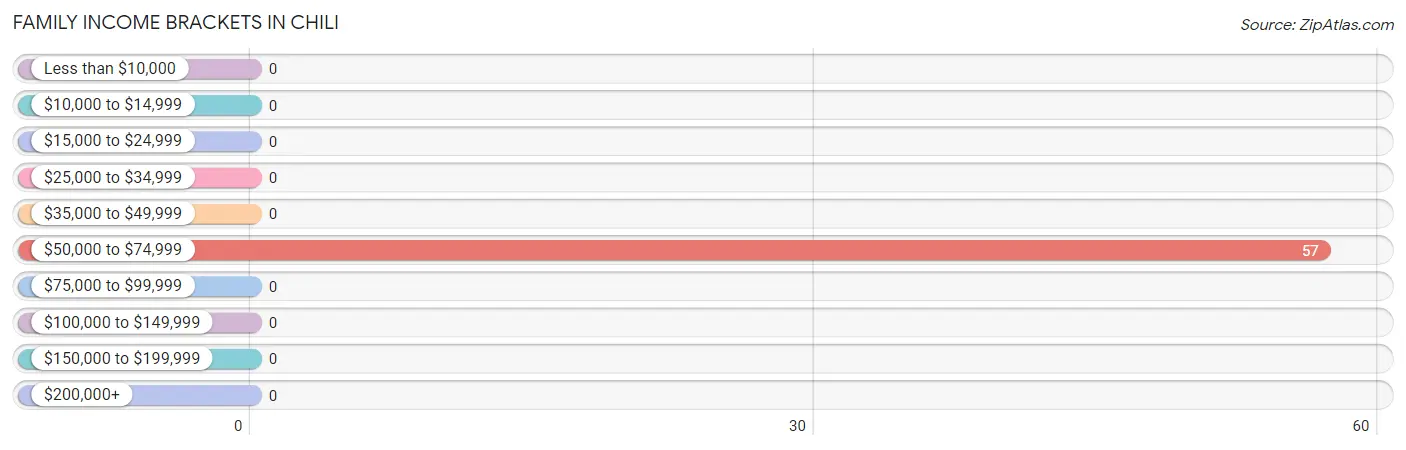
| Income Bracket | # Families | % Families |
| Less than $10,000 | 0 | 0.0% |
| $10,000 to $14,999 | 0 | 0.0% |
| $15,000 to $24,999 | 0 | 0.0% |
| $25,000 to $34,999 | 0 | 0.0% |
| $35,000 to $49,999 | 0 | 0.0% |
| $50,000 to $74,999 | 57 | 100.0% |
| $75,000 to $99,999 | 0 | 0.0% |
| $100,000 to $149,999 | 0 | 0.0% |
| $150,000 to $199,999 | 0 | 0.0% |
| $200,000+ | 0 | 0.0% |
Family Income by Famaliy Size in Chili
| Income Bracket | # Families | Median Income |
| 2-Person Families | 57 (100.0%) | $0 |
| 3-Person Families | 0 (0.0%) | $0 |
| 4-Person Families | 0 (0.0%) | $0 |
| 5-Person Families | 0 (0.0%) | $0 |
| 6-Person Families | 0 (0.0%) | $0 |
| 7+ Person Families | 0 (0.0%) | $0 |
| Total | 57 (100.0%) | $0 |
Family Income by Number of Earners in Chili
| Number of Earners | # Families | Median Income |
| No Earners | 1 (1.8%) | $0 |
| 1 Earner | 0 (0.0%) | $0 |
| 2 Earners | 56 (98.3%) | $0 |
| 3+ Earners | 0 (0.0%) | $0 |
| Total | 57 (100.0%) | $0 |
Household Income in Chili
Household Income Brackets in Chili
With 94 households falling in the category, the $50,000 to $74,999 income range is the most frequent in Chili, accounting for 69.6% of all households.
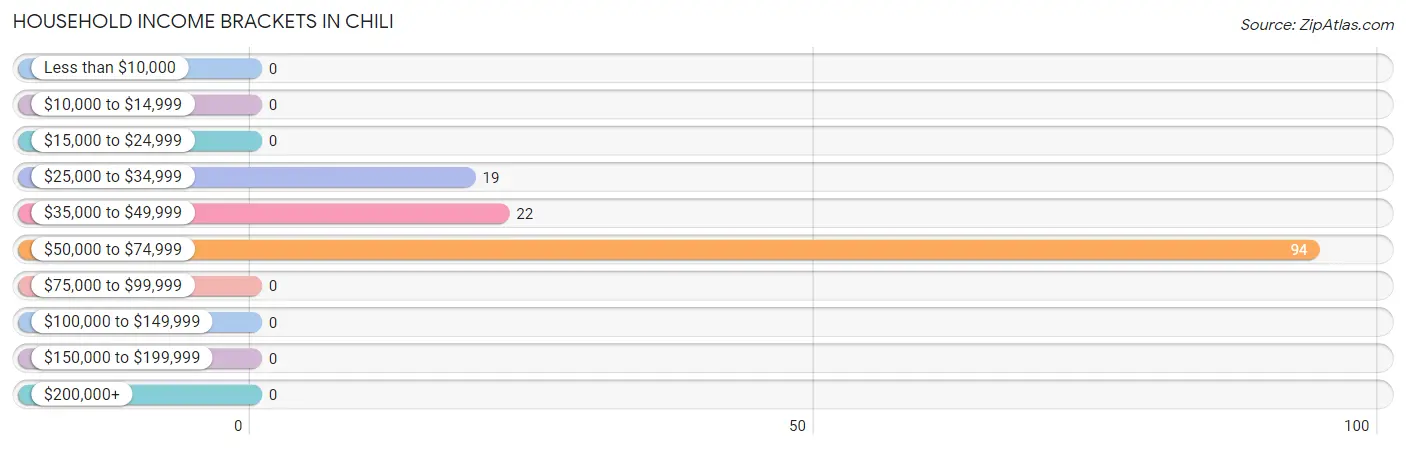
| Income Bracket | # Households | % Households |
| Less than $10,000 | 0 | 0.0% |
| $10,000 to $14,999 | 0 | 0.0% |
| $15,000 to $24,999 | 0 | 0.0% |
| $25,000 to $34,999 | 19 | 14.1% |
| $35,000 to $49,999 | 22 | 16.3% |
| $50,000 to $74,999 | 94 | 69.6% |
| $75,000 to $99,999 | 0 | 0.0% |
| $100,000 to $149,999 | 0 | 0.0% |
| $150,000 to $199,999 | 0 | 0.0% |
| $200,000+ | 0 | 0.0% |
Household Income by Householder Age in Chili
The median household income in Chili is $58,683, with the highest median household income of $58,281 found in the 65+ years age bracket for the primary householder. A total of 79 households (58.5%) fall into this category.
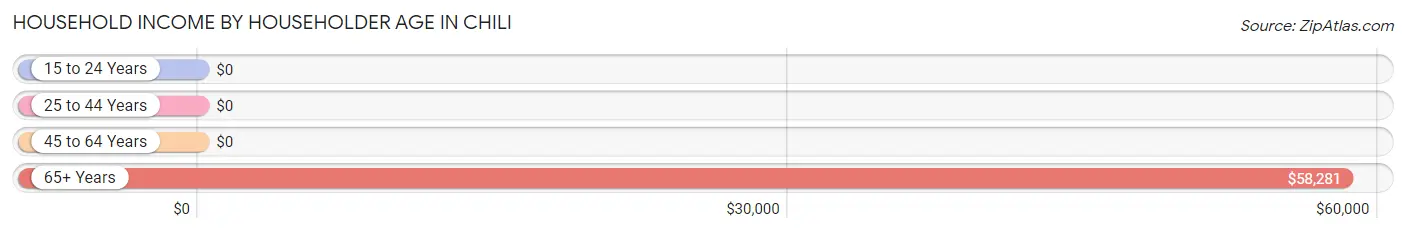
| Income Bracket | # Households | Median Income |
| 15 to 24 Years | 0 (0.0%) | $0 |
| 25 to 44 Years | 0 (0.0%) | $0 |
| 45 to 64 Years | 56 (41.5%) | $0 |
| 65+ Years | 79 (58.5%) | $58,281 |
| Total | 135 (100.0%) | $58,683 |
Poverty in Chili
Income Below Poverty by Sex and Age in Chili
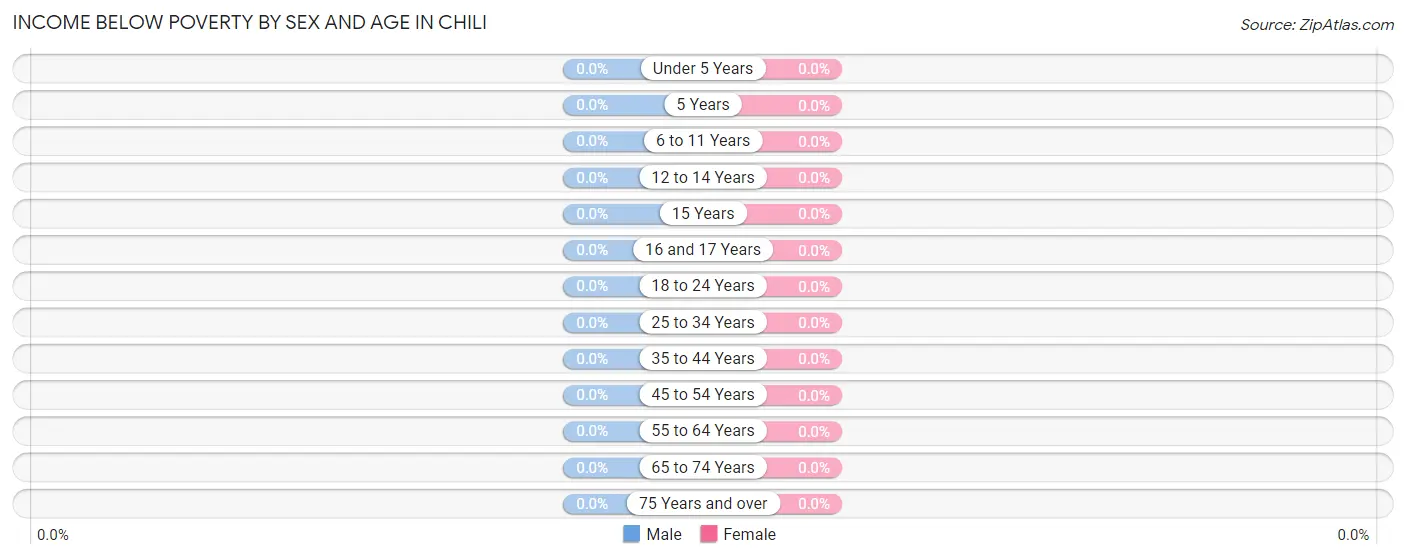
| Age Bracket | Male | Female |
| Under 5 Years | 0 (0.0%) | 0 (0.0%) |
| 5 Years | 0 (0.0%) | 0 (0.0%) |
| 6 to 11 Years | 0 (0.0%) | 0 (0.0%) |
| 12 to 14 Years | 0 (0.0%) | 0 (0.0%) |
| 15 Years | 0 (0.0%) | 0 (0.0%) |
| 16 and 17 Years | 0 (0.0%) | 0 (0.0%) |
| 18 to 24 Years | 0 (0.0%) | 0 (0.0%) |
| 25 to 34 Years | 0 (0.0%) | 0 (0.0%) |
| 35 to 44 Years | 0 (0.0%) | 0 (0.0%) |
| 45 to 54 Years | 0 (0.0%) | 0 (0.0%) |
| 55 to 64 Years | 0 (0.0%) | 0 (0.0%) |
| 65 to 74 Years | 0 (0.0%) | 0 (0.0%) |
| 75 Years and over | 0 (0.0%) | 0 (0.0%) |
| Total | 0 (0.0%) | 0 (0.0%) |
Income Above Poverty by Sex and Age in Chili
According to the poverty statistics in Chili, males aged 65 to 74 years and females aged 45 to 54 years are the age groups that are most secure financially, with 100.0% of males and 100.0% of females in these age groups living above the poverty line.
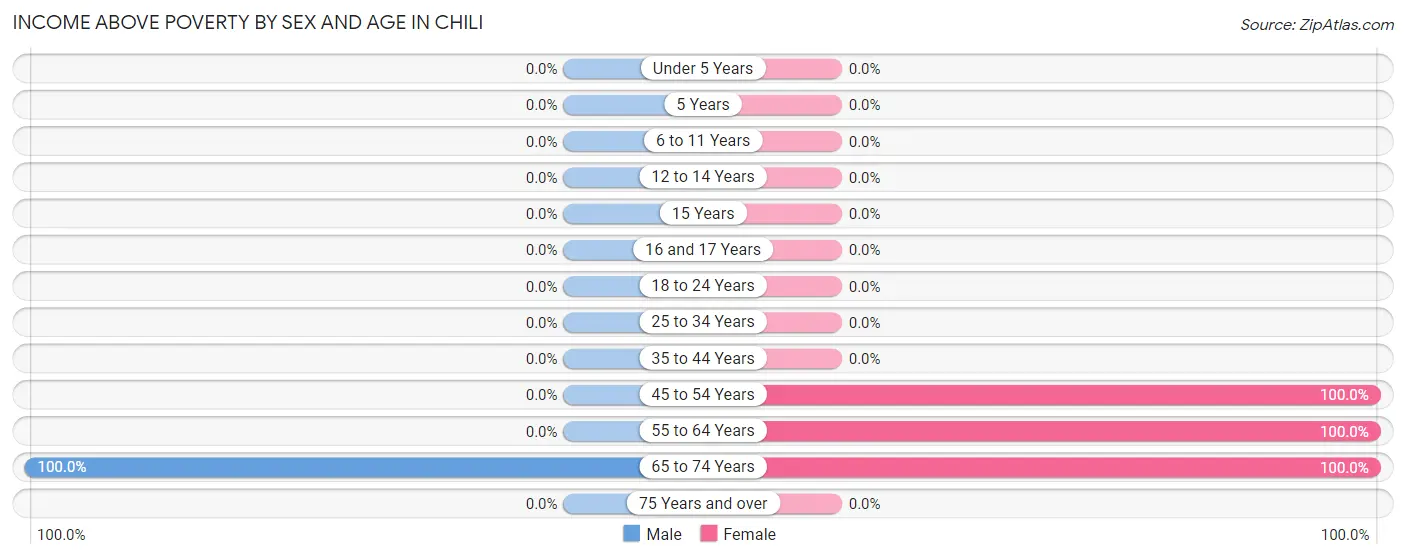
| Age Bracket | Male | Female |
| Under 5 Years | 0 (0.0%) | 0 (0.0%) |
| 5 Years | 0 (0.0%) | 0 (0.0%) |
| 6 to 11 Years | 0 (0.0%) | 0 (0.0%) |
| 12 to 14 Years | 0 (0.0%) | 0 (0.0%) |
| 15 Years | 0 (0.0%) | 0 (0.0%) |
| 16 and 17 Years | 0 (0.0%) | 0 (0.0%) |
| 18 to 24 Years | 0 (0.0%) | 0 (0.0%) |
| 25 to 34 Years | 0 (0.0%) | 0 (0.0%) |
| 35 to 44 Years | 0 (0.0%) | 0 (0.0%) |
| 45 to 54 Years | 0 (0.0%) | 19 (100.0%) |
| 55 to 64 Years | 0 (0.0%) | 37 (100.0%) |
| 65 to 74 Years | 79 (100.0%) | 85 (100.0%) |
| 75 Years and over | 0 (0.0%) | 0 (0.0%) |
| Total | 79 (100.0%) | 141 (100.0%) |
Income Below Poverty Among Married-Couple Families in Chili
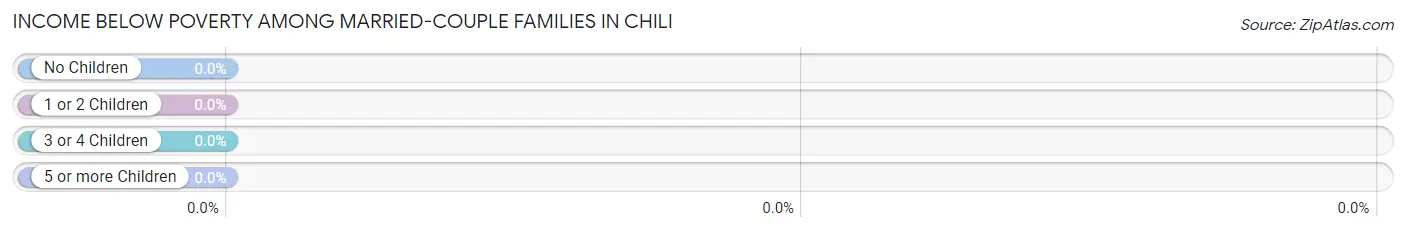
| Children | Above Poverty | Below Poverty |
| No Children | 57 (100.0%) | 0 (0.0%) |
| 1 or 2 Children | 0 (0.0%) | 0 (0.0%) |
| 3 or 4 Children | 0 (0.0%) | 0 (0.0%) |
| 5 or more Children | 0 (0.0%) | 0 (0.0%) |
| Total | 57 (100.0%) | 0 (0.0%) |
Income Below Poverty Among Single-Parent Households in Chili
| Children | Single Father | Single Mother |
| No Children | 0 (0.0%) | 0 (0.0%) |
| 1 or 2 Children | 0 (0.0%) | 0 (0.0%) |
| 3 or 4 Children | 0 (0.0%) | 0 (0.0%) |
| 5 or more Children | 0 (0.0%) | 0 (0.0%) |
| Total | 0 (0.0%) | 0 (0.0%) |
Income Below Poverty Among Married-Couple vs Single-Parent Households in Chili
| Children | Married-Couple Families | Single-Parent Households |
| No Children | 0 (0.0%) | 0 (0.0%) |
| 1 or 2 Children | 0 (0.0%) | 0 (0.0%) |
| 3 or 4 Children | 0 (0.0%) | 0 (0.0%) |
| 5 or more Children | 0 (0.0%) | 0 (0.0%) |
| Total | 0 (0.0%) | 0 (0.0%) |
Race in Chili
The most populous races in Chili are Hispanic or Latino (198 | 90.0%), Some other Race (198 | 90.0%), and White / Caucasian (22 | 10.0%).
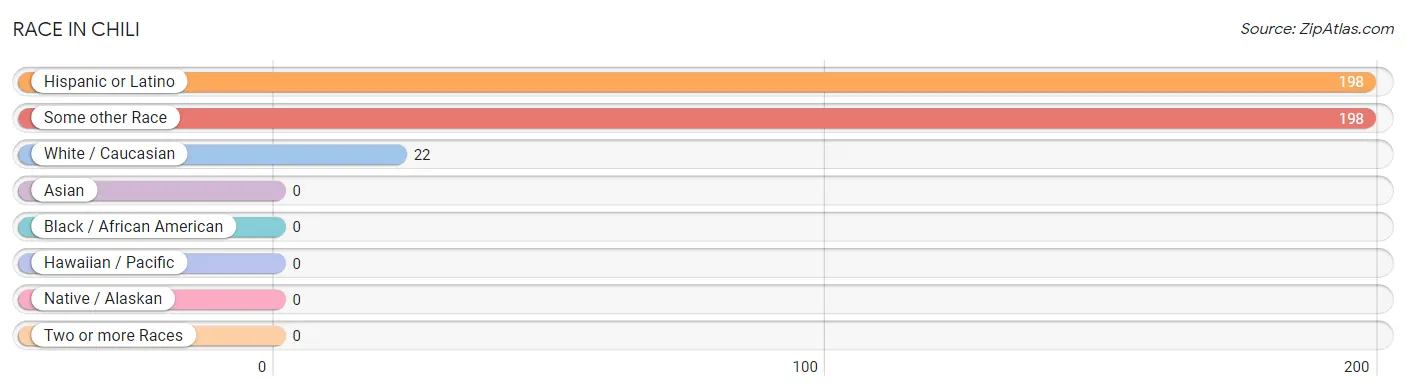
| Race | # Population | % Population |
| Asian | 0 | 0.0% |
| Black / African American | 0 | 0.0% |
| Hawaiian / Pacific | 0 | 0.0% |
| Hispanic or Latino | 198 | 90.0% |
| Native / Alaskan | 0 | 0.0% |
| White / Caucasian | 22 | 10.0% |
| Two or more Races | 0 | 0.0% |
| Some other Race | 198 | 90.0% |
| Total | 220 | 100.0% |
Ancestry in Chili
The most populous ancestries reported in Chili are Spanish (140 | 63.6%), German (22 | 10.0%), Irish (22 | 10.0%), Spaniard (19 | 8.6%), and Mexican (2 | 0.9%), together accounting for 93.2% of all Chili residents.
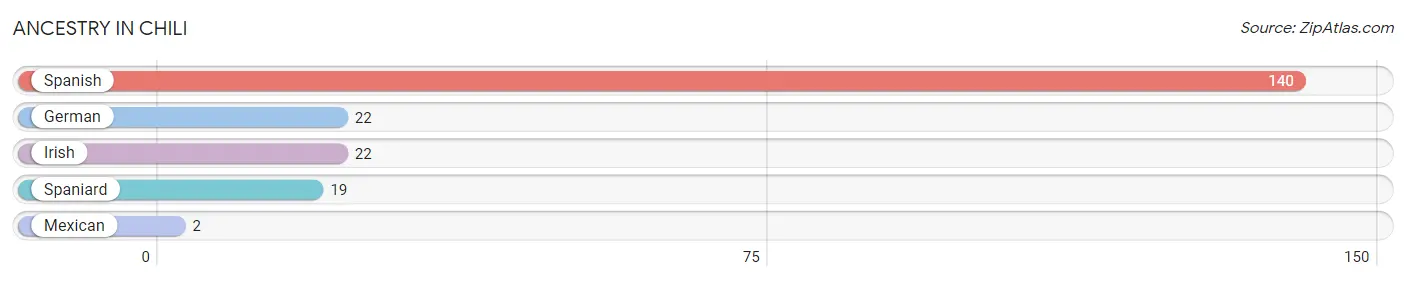
| Ancestry | # Population | % Population |
| German | 22 | 10.0% |
| Irish | 22 | 10.0% |
| Mexican | 2 | 0.9% |
| Spaniard | 19 | 8.6% |
| Spanish | 140 | 63.6% | View All 5 Rows |
Immigrants in Chili

| Immigration Origin | # Population | % Population | View All 0 Rows |
Sex and Age in Chili
Sex and Age in Chili
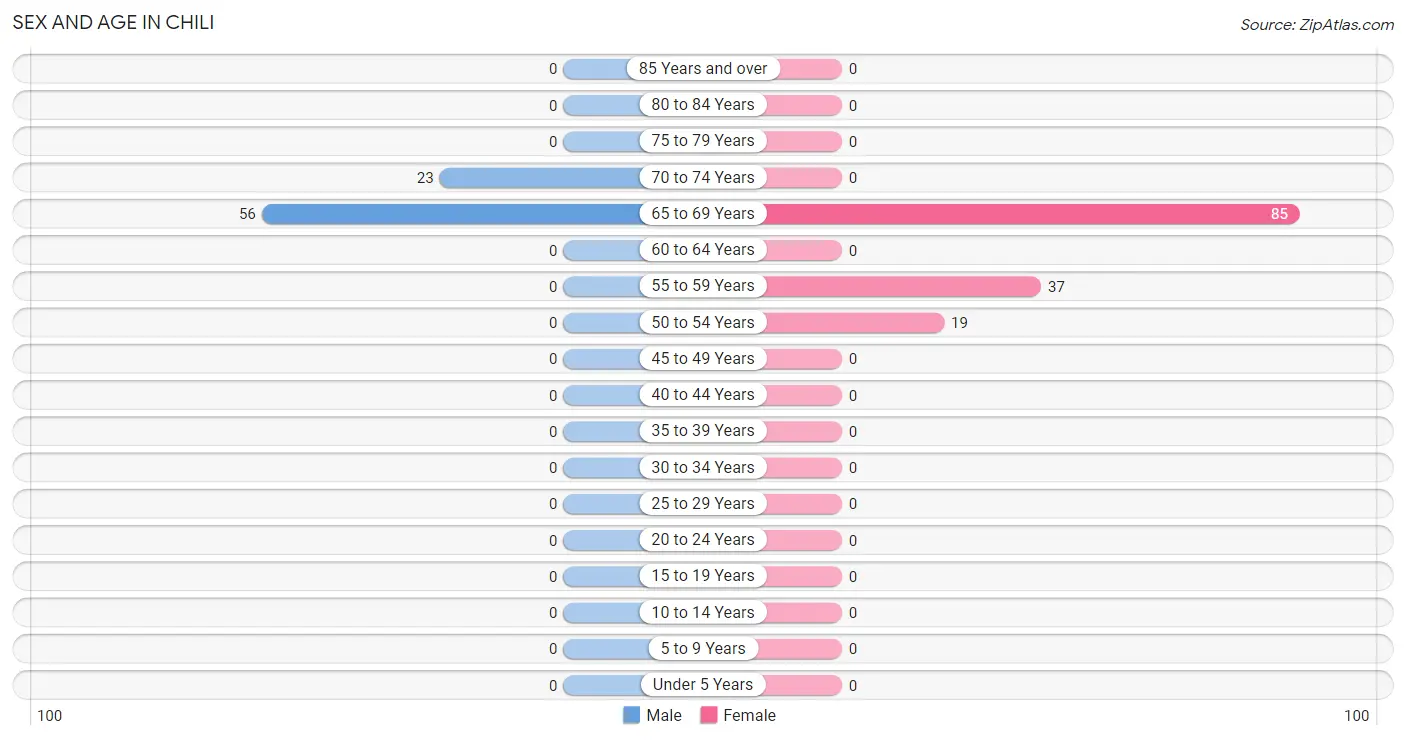
The most populous age groups in Chili are 65 to 69 Years (56 | 70.9%) for men and 65 to 69 Years (85 | 60.3%) for women.
| Age Bracket | Male | Female |
| Under 5 Years | 0 (0.0%) | 0 (0.0%) |
| 5 to 9 Years | 0 (0.0%) | 0 (0.0%) |
| 10 to 14 Years | 0 (0.0%) | 0 (0.0%) |
| 15 to 19 Years | 0 (0.0%) | 0 (0.0%) |
| 20 to 24 Years | 0 (0.0%) | 0 (0.0%) |
| 25 to 29 Years | 0 (0.0%) | 0 (0.0%) |
| 30 to 34 Years | 0 (0.0%) | 0 (0.0%) |
| 35 to 39 Years | 0 (0.0%) | 0 (0.0%) |
| 40 to 44 Years | 0 (0.0%) | 0 (0.0%) |
| 45 to 49 Years | 0 (0.0%) | 0 (0.0%) |
| 50 to 54 Years | 0 (0.0%) | 19 (13.5%) |
| 55 to 59 Years | 0 (0.0%) | 37 (26.2%) |
| 60 to 64 Years | 0 (0.0%) | 0 (0.0%) |
| 65 to 69 Years | 56 (70.9%) | 85 (60.3%) |
| 70 to 74 Years | 23 (29.1%) | 0 (0.0%) |
| 75 to 79 Years | 0 (0.0%) | 0 (0.0%) |
| 80 to 84 Years | 0 (0.0%) | 0 (0.0%) |
| 85 Years and over | 0 (0.0%) | 0 (0.0%) |
| Total | 79 (100.0%) | 141 (100.0%) |
Families and Households in Chili
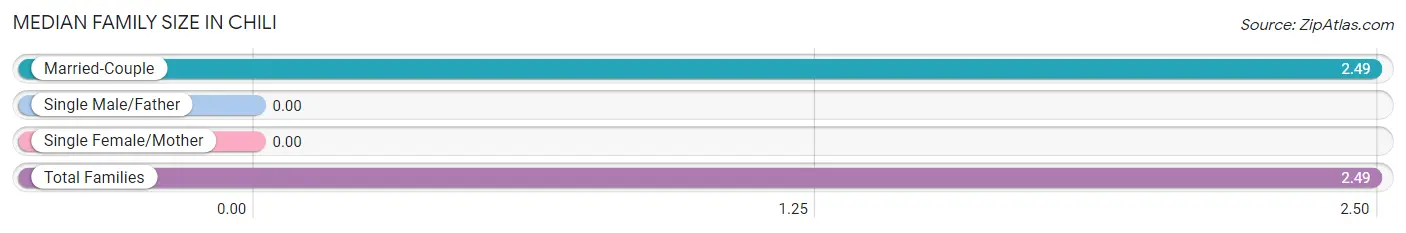
Median Family Size in Chili
| Family Type | # Families | Family Size |
| Married-Couple | 57 (100.0%) | 2.49 |
| Single Male/Father | 0 (0.0%) | - |
| Single Female/Mother | 0 (0.0%) | - |
| Total Families | 57 (100.0%) | 2.49 |
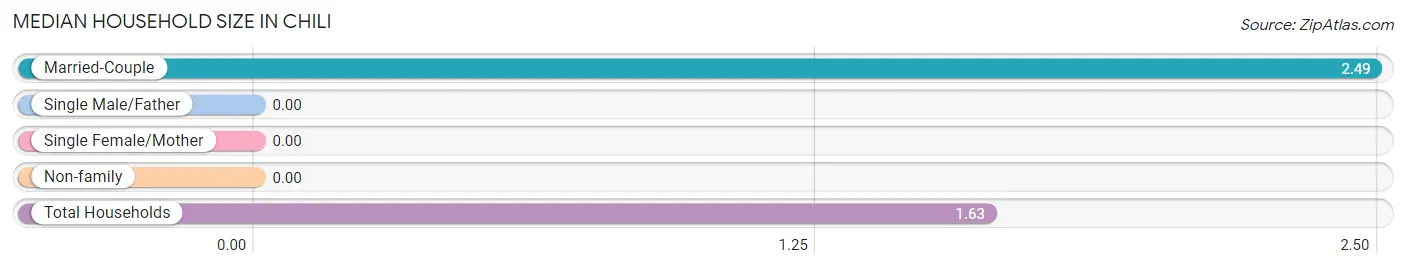
Median Household Size in Chili
| Household Type | # Households | Household Size |
| Married-Couple | 57 (42.2%) | 2.49 |
| Single Male/Father | 0 (0.0%) | - |
| Single Female/Mother | 0 (0.0%) | - |
| Non-family | 78 (57.8%) | - |
| Total Households | 135 (100.0%) | 1.63 |
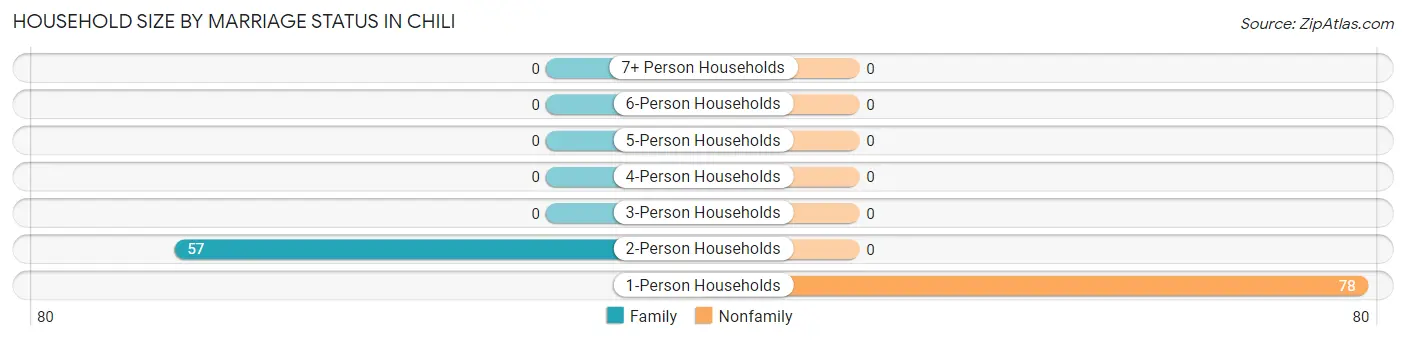
Household Size by Marriage Status in Chili
Out of a total of 135 households in Chili, 57 (42.2%) are family households, while 78 (57.8%) are nonfamily households. The most numerous type of family households are 2-person households, comprising 57, and the most common type of nonfamily households are 1-person households, comprising 78.
| Household Size | Family Households | Nonfamily Households |
| 1-Person Households | - | 78 (57.8%) |
| 2-Person Households | 57 (42.2%) | 0 (0.0%) |
| 3-Person Households | 0 (0.0%) | 0 (0.0%) |
| 4-Person Households | 0 (0.0%) | 0 (0.0%) |
| 5-Person Households | 0 (0.0%) | 0 (0.0%) |
| 6-Person Households | 0 (0.0%) | 0 (0.0%) |
| 7+ Person Households | 0 (0.0%) | 0 (0.0%) |
| Total | 57 (42.2%) | 78 (57.8%) |
Female Fertility in Chili
Fertility by Age in Chili
| Age Bracket | Women with Births | Births / 1,000 Women |
| 15 to 19 years | 0 (0.0%) | 0.0 |
| 20 to 34 years | 0 (0.0%) | 0.0 |
| 35 to 50 years | 0 (0.0%) | 0.0 |
| Total | 0 (0.0%) | 0.0 |
Fertility by Age by Marriage Status in Chili
| Age Bracket | Married | Unmarried |
| 15 to 19 years | 0 (0.0%) | 0 (0.0%) |
| 20 to 34 years | 0 (0.0%) | 0 (0.0%) |
| 35 to 50 years | 0 (0.0%) | 0 (0.0%) |
| Total | 0 (0.0%) | 0 (0.0%) |
Fertility by Education in Chili
| Educational Attainment | Women with Births | Births / 1,000 Women |
| Less than High School | 0 (0.0%) | 0.0 |
| High School Diploma | 0 (0.0%) | 0.0 |
| College or Associate's Degree | 0 (0.0%) | 0.0 |
| Bachelor's Degree | 0 (0.0%) | 0.0 |
| Graduate Degree | 0 (0.0%) | 0.0 |
| Total | 0 (0.0%) | 0.0 |
Fertility by Education by Marriage Status in Chili
| Educational Attainment | Married | Unmarried |
| Less than High School | 0 (0.0%) | 0 (0.0%) |
| High School Diploma | 0 (0.0%) | 0 (0.0%) |
| College or Associate's Degree | 0 (0.0%) | 0 (0.0%) |
| Bachelor's Degree | 0 (0.0%) | 0 (0.0%) |
| Graduate Degree | 0 (0.0%) | 0 (0.0%) |
| Total | 0 (0.0%) | 0 (0.0%) |
Employment Characteristics in Chili
Employment by Class of Employer in Chili
Among the 37 employed individuals in Chili, , and private company employees (37 | 100.0%) make up the most common classes of employment.
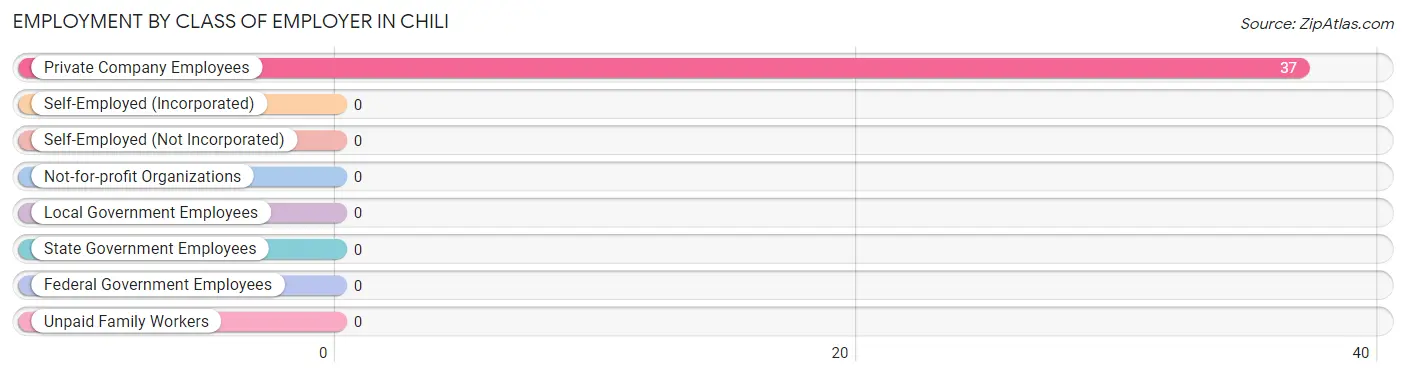
| Employer Class | # Employees | % Employees |
| Private Company Employees | 37 | 100.0% |
| Self-Employed (Incorporated) | 0 | 0.0% |
| Self-Employed (Not Incorporated) | 0 | 0.0% |
| Not-for-profit Organizations | 0 | 0.0% |
| Local Government Employees | 0 | 0.0% |
| State Government Employees | 0 | 0.0% |
| Federal Government Employees | 0 | 0.0% |
| Unpaid Family Workers | 0 | 0.0% |
| Total | 37 | 100.0% |
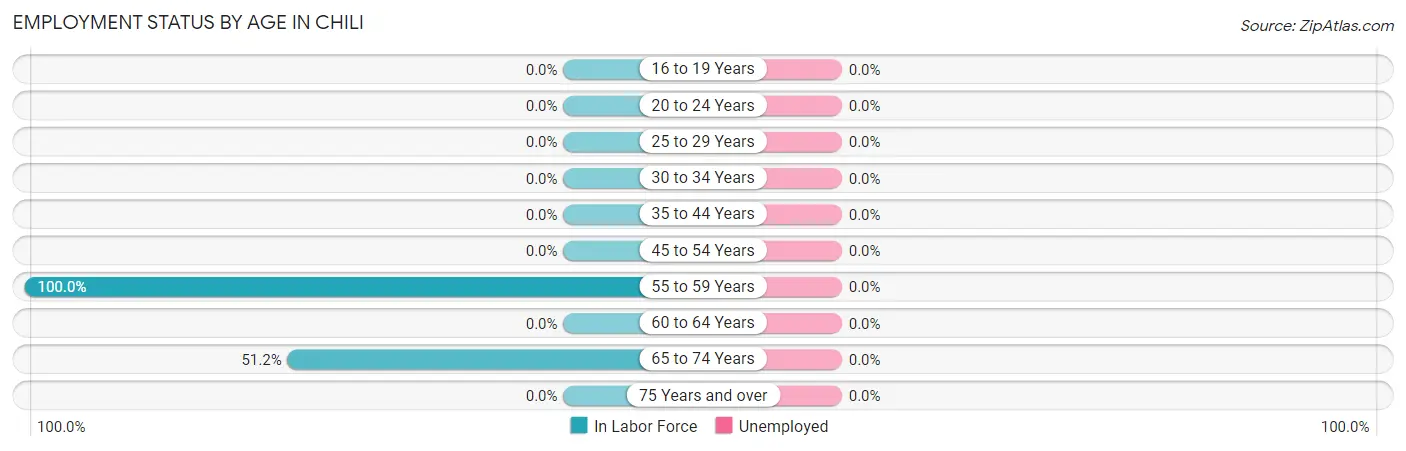
Employment Status by Age in Chili
| Age Bracket | In Labor Force | Unemployed |
| 16 to 19 Years | 0 (0.0%) | 0 (0.0%) |
| 20 to 24 Years | 0 (0.0%) | 0 (0.0%) |
| 25 to 29 Years | 0 (0.0%) | 0 (0.0%) |
| 30 to 34 Years | 0 (0.0%) | 0 (0.0%) |
| 35 to 44 Years | 0 (0.0%) | 0 (0.0%) |
| 45 to 54 Years | 0 (0.0%) | 0 (0.0%) |
| 55 to 59 Years | 37 (100.0%) | 0 (0.0%) |
| 60 to 64 Years | 0 (0.0%) | 0 (0.0%) |
| 65 to 74 Years | 84 (51.2%) | 0 (0.0%) |
| 75 Years and over | 0 (0.0%) | 0 (0.0%) |
| Total | 121 (55.0%) | 0 (0.0%) |
Employment Status by Educational Attainment in Chili
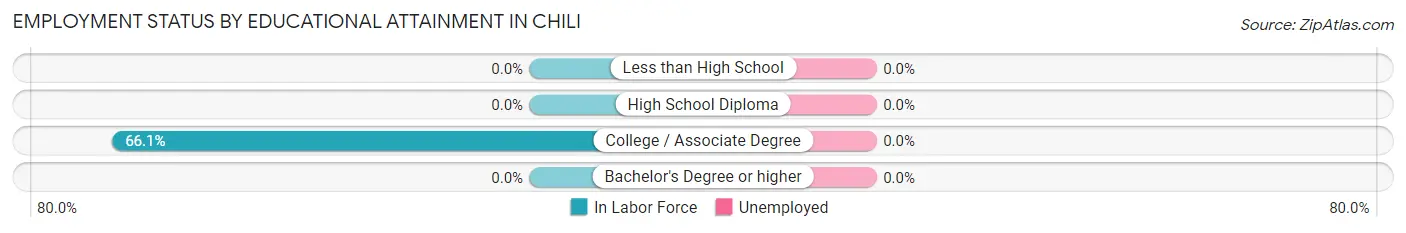
| Educational Attainment | In Labor Force | Unemployed |
| Less than High School | 0 (0.0%) | 0 (0.0%) |
| High School Diploma | 0 (0.0%) | 0 (0.0%) |
| College / Associate Degree | 37 (66.1%) | 0 (0.0%) |
| Bachelor's Degree or higher | 0 (0.0%) | 0 (0.0%) |
| Total | 37 (66.1%) | 0 (0.0%) |
Employment Occupations by Sex in Chili
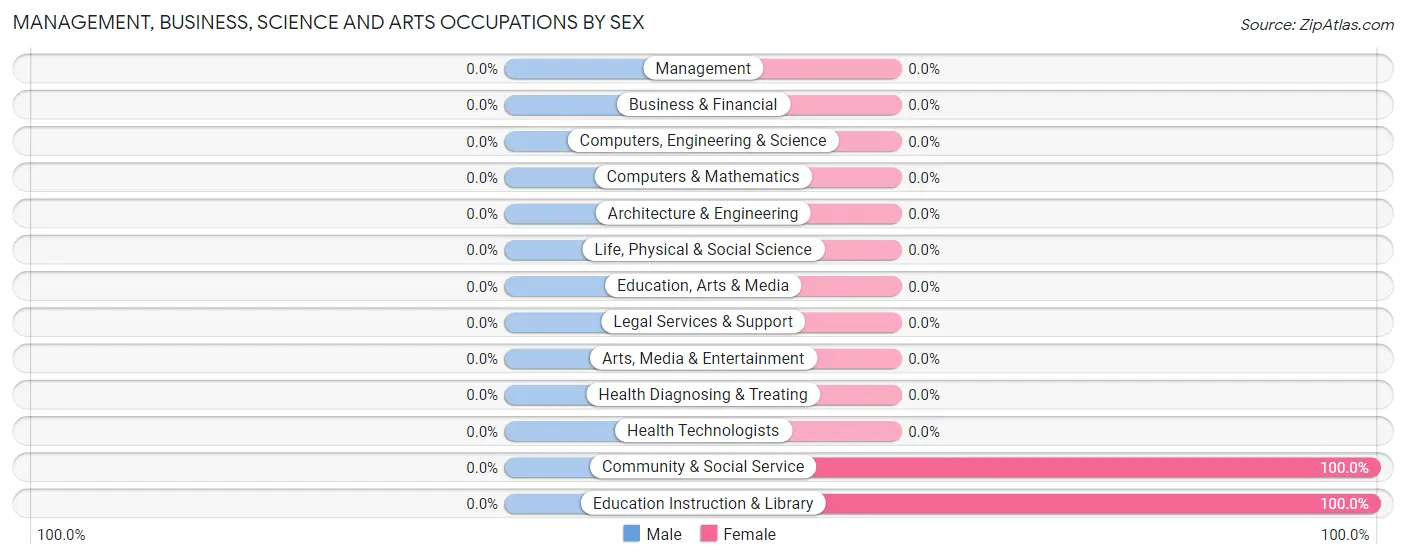
Management, Business, Science and Arts Occupations
The most common Management, Business, Science and Arts occupations in Chili are Community & Social Service (84 | 69.4%), and Education Instruction & Library (84 | 69.4%).
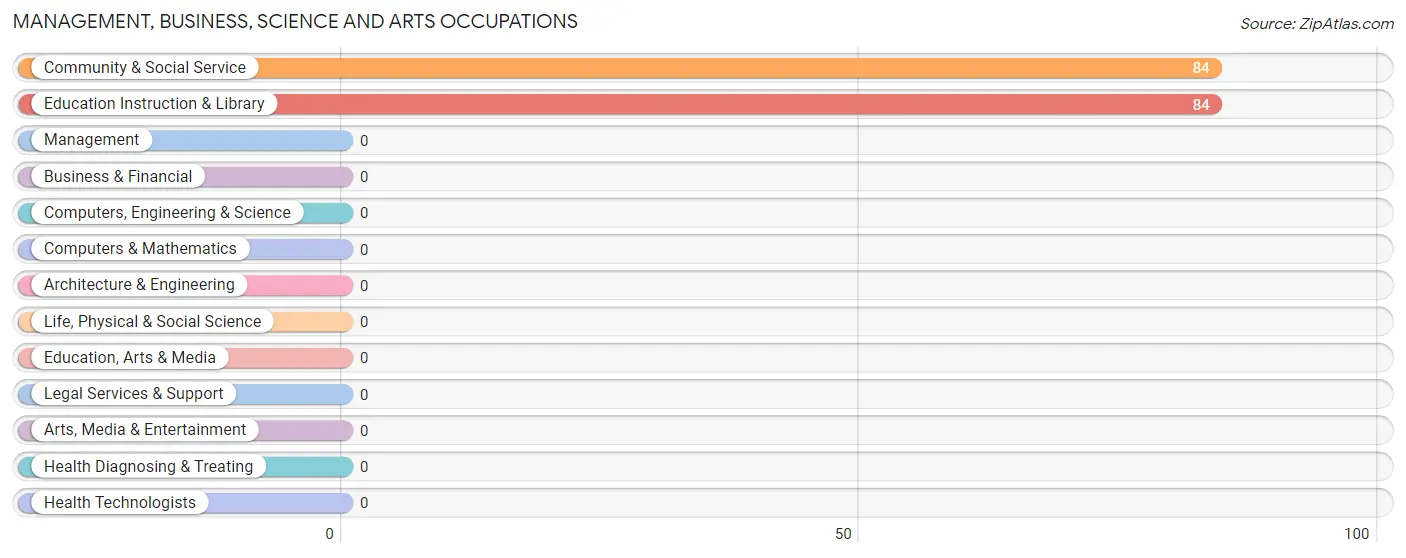
Management, Business, Science and Arts Occupations by Sex
| Occupation | Male | Female |
| Management | 0 (0.0%) | 0 (0.0%) |
| Business & Financial | 0 (0.0%) | 0 (0.0%) |
| Computers, Engineering & Science | 0 (0.0%) | 0 (0.0%) |
| Computers & Mathematics | 0 (0.0%) | 0 (0.0%) |
| Architecture & Engineering | 0 (0.0%) | 0 (0.0%) |
| Life, Physical & Social Science | 0 (0.0%) | 0 (0.0%) |
| Community & Social Service | 0 (0.0%) | 84 (100.0%) |
| Education, Arts & Media | 0 (0.0%) | 0 (0.0%) |
| Legal Services & Support | 0 (0.0%) | 0 (0.0%) |
| Education Instruction & Library | 0 (0.0%) | 84 (100.0%) |
| Arts, Media & Entertainment | 0 (0.0%) | 0 (0.0%) |
| Health Diagnosing & Treating | 0 (0.0%) | 0 (0.0%) |
| Health Technologists | 0 (0.0%) | 0 (0.0%) |
| Total (Category) | 0 (0.0%) | 84 (100.0%) |
| Total (Overall) | 0 (0.0%) | 121 (100.0%) |
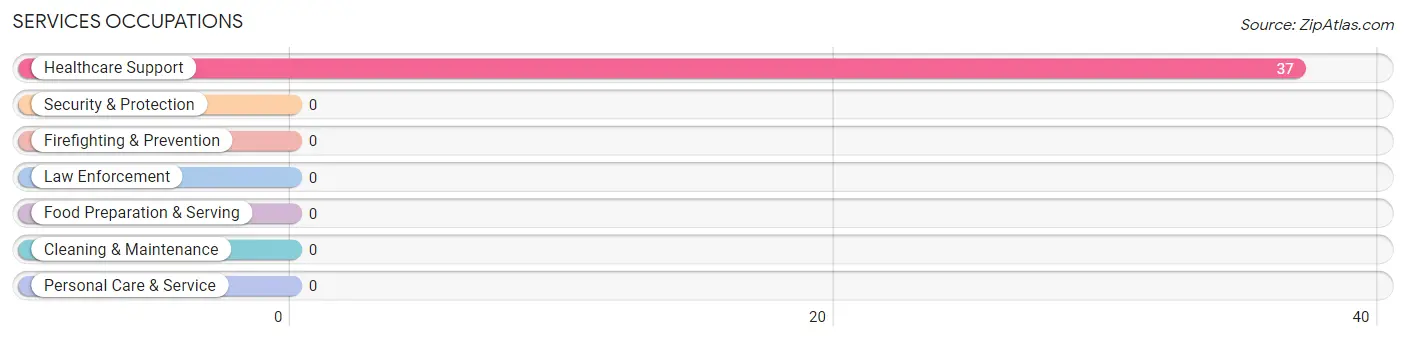
Services Occupations
The most common Services occupations in Chili are , and Healthcare Support (37 | 30.6%).
Services Occupations by Sex
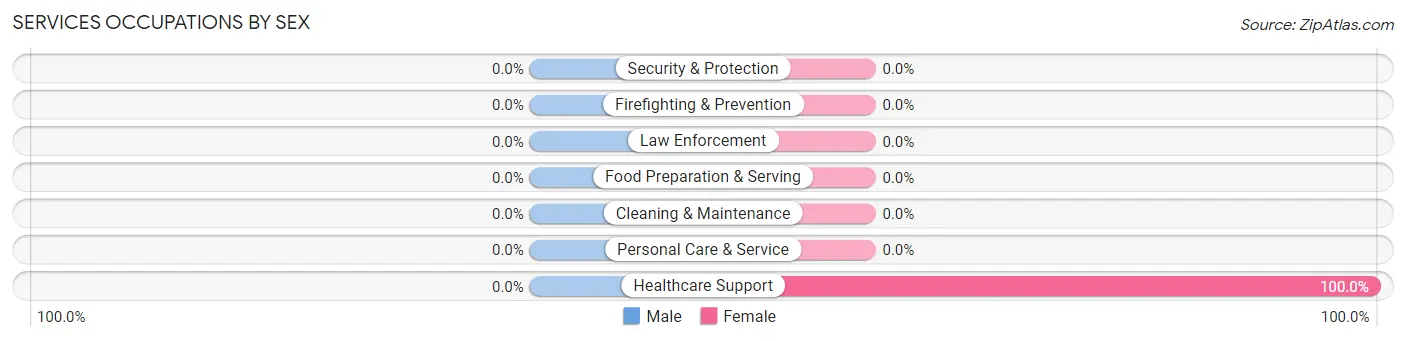
| Occupation | Male | Female |
| Healthcare Support | 0 (0.0%) | 37 (100.0%) |
| Security & Protection | 0 (0.0%) | 0 (0.0%) |
| Firefighting & Prevention | 0 (0.0%) | 0 (0.0%) |
| Law Enforcement | 0 (0.0%) | 0 (0.0%) |
| Food Preparation & Serving | 0 (0.0%) | 0 (0.0%) |
| Cleaning & Maintenance | 0 (0.0%) | 0 (0.0%) |
| Personal Care & Service | 0 (0.0%) | 0 (0.0%) |
| Total (Category) | 0 (0.0%) | 37 (100.0%) |
| Total (Overall) | 0 (0.0%) | 121 (100.0%) |
Sales and Office Occupations

Sales and Office Occupations by Sex

| Occupation | Male | Female |
| Sales & Related | 0 (0.0%) | 0 (0.0%) |
| Office & Administration | 0 (0.0%) | 0 (0.0%) |
| Total (Category) | 0 (0.0%) | 0 (0.0%) |
| Total (Overall) | 0 (0.0%) | 121 (100.0%) |
Natural Resources, Construction and Maintenance Occupations
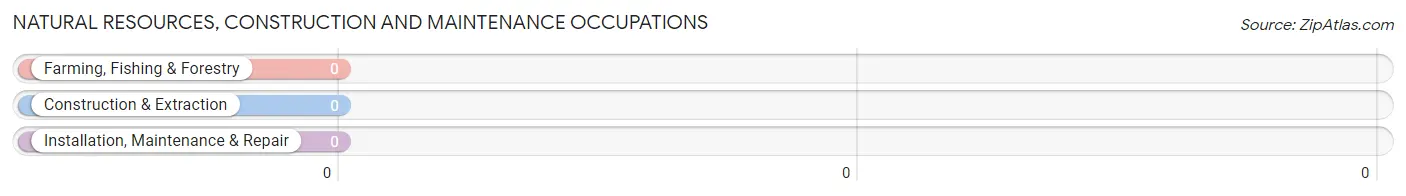
Natural Resources, Construction and Maintenance Occupations by Sex
| Occupation | Male | Female |
| Farming, Fishing & Forestry | 0 (0.0%) | 0 (0.0%) |
| Construction & Extraction | 0 (0.0%) | 0 (0.0%) |
| Installation, Maintenance & Repair | 0 (0.0%) | 0 (0.0%) |
| Total (Category) | 0 (0.0%) | 0 (0.0%) |
| Total (Overall) | 0 (0.0%) | 121 (100.0%) |
Production, Transportation and Moving Occupations
Production, Transportation and Moving Occupations by Sex
| Occupation | Male | Female |
| Production | 0 (0.0%) | 0 (0.0%) |
| Transportation | 0 (0.0%) | 0 (0.0%) |
| Material Moving | 0 (0.0%) | 0 (0.0%) |
| Total (Category) | 0 (0.0%) | 0 (0.0%) |
| Total (Overall) | 0 (0.0%) | 121 (100.0%) |
Employment Industries by Sex in Chili
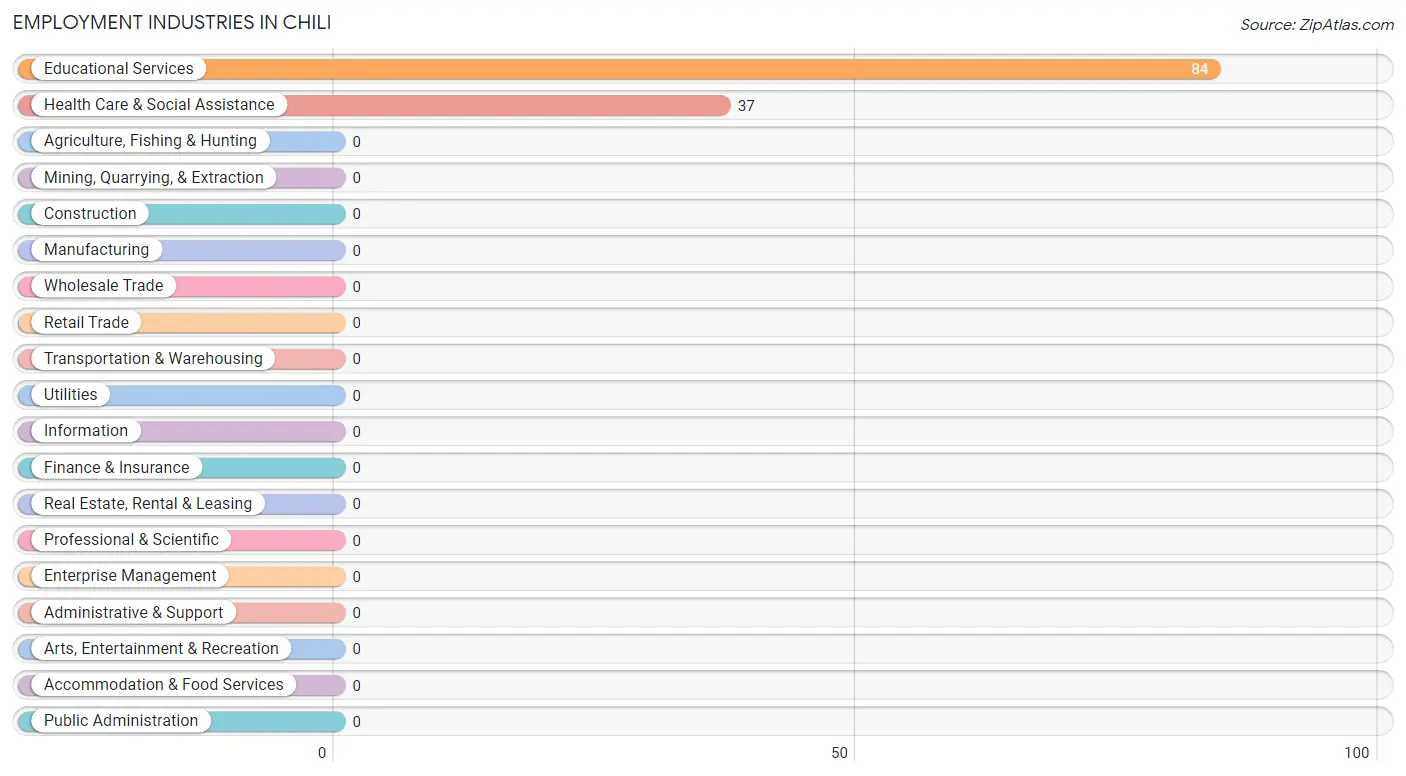
Employment Industries in Chili
The major employment industries in Chili include Educational Services (84 | 69.4%), and Health Care & Social Assistance (37 | 30.6%).
Employment Industries by Sex in Chili
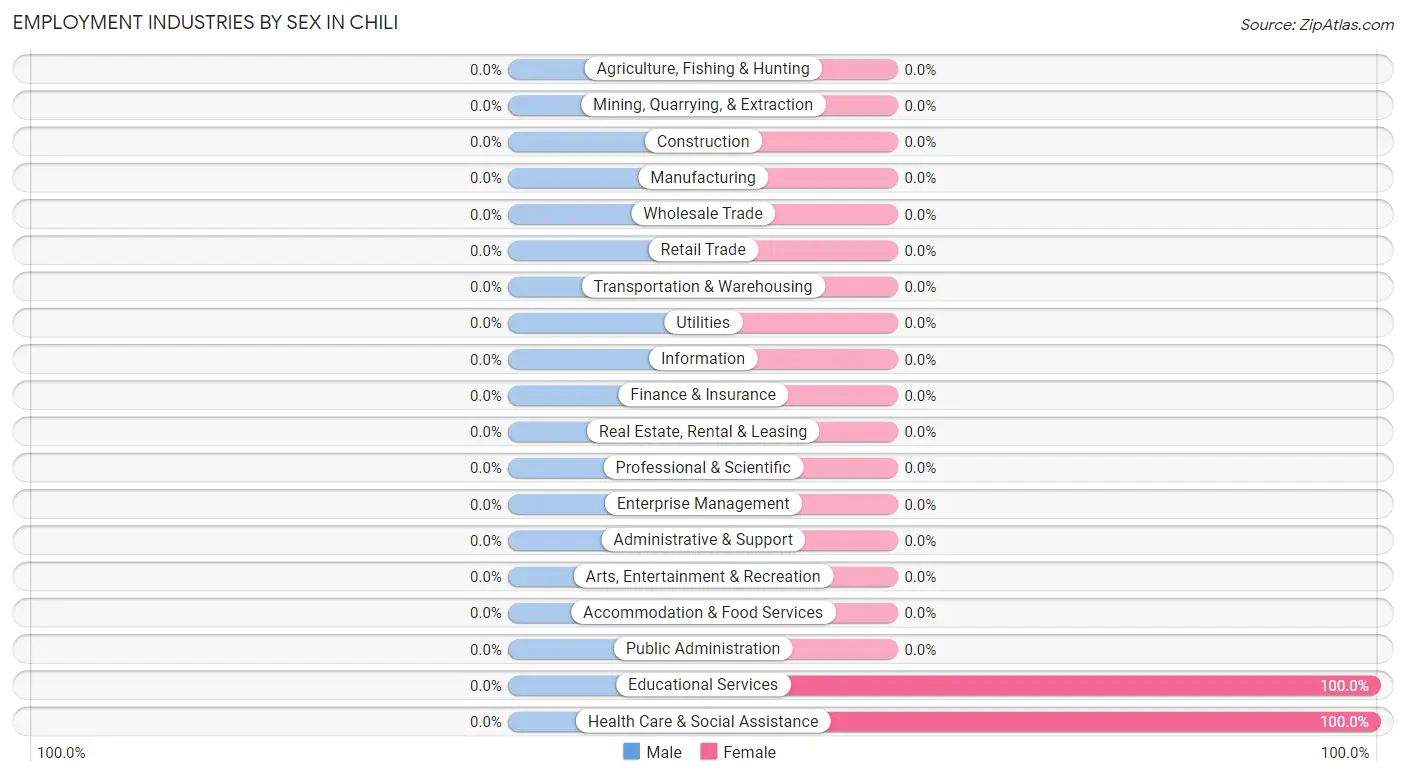
| Industry | Male | Female |
| Agriculture, Fishing & Hunting | 0 (0.0%) | 0 (0.0%) |
| Mining, Quarrying, & Extraction | 0 (0.0%) | 0 (0.0%) |
| Construction | 0 (0.0%) | 0 (0.0%) |
| Manufacturing | 0 (0.0%) | 0 (0.0%) |
| Wholesale Trade | 0 (0.0%) | 0 (0.0%) |
| Retail Trade | 0 (0.0%) | 0 (0.0%) |
| Transportation & Warehousing | 0 (0.0%) | 0 (0.0%) |
| Utilities | 0 (0.0%) | 0 (0.0%) |
| Information | 0 (0.0%) | 0 (0.0%) |
| Finance & Insurance | 0 (0.0%) | 0 (0.0%) |
| Real Estate, Rental & Leasing | 0 (0.0%) | 0 (0.0%) |
| Professional & Scientific | 0 (0.0%) | 0 (0.0%) |
| Enterprise Management | 0 (0.0%) | 0 (0.0%) |
| Administrative & Support | 0 (0.0%) | 0 (0.0%) |
| Educational Services | 0 (0.0%) | 84 (100.0%) |
| Health Care & Social Assistance | 0 (0.0%) | 37 (100.0%) |
| Arts, Entertainment & Recreation | 0 (0.0%) | 0 (0.0%) |
| Accommodation & Food Services | 0 (0.0%) | 0 (0.0%) |
| Public Administration | 0 (0.0%) | 0 (0.0%) |
| Total | 0 (0.0%) | 121 (100.0%) |
Education in Chili
School Enrollment in Chili
| School Level | # Students | % Students |
| Nursery / Preschool | 0 | 0.0% |
| Kindergarten | 0 | 0.0% |
| Elementary School | 0 | 0.0% |
| Middle School | 0 | 0.0% |
| High School | 0 | 0.0% |
| College / Undergraduate | 0 | 0.0% |
| Graduate / Professional | 0 | 0.0% |
| Total | 0 | 0.0% |
School Enrollment by Age by Funding Source in Chili
| Age Bracket | Public School | Private School |
| 3 to 4 Year Olds | 0 (0.0%) | 0 (0.0%) |
| 5 to 9 Year Old | 0 (0.0%) | 0 (0.0%) |
| 10 to 14 Year Olds | 0 (0.0%) | 0 (0.0%) |
| 15 to 17 Year Olds | 0 (0.0%) | 0 (0.0%) |
| 18 to 19 Year Olds | 0 (0.0%) | 0 (0.0%) |
| 20 to 24 Year Olds | 0 (0.0%) | 0 (0.0%) |
| 25 to 34 Year Olds | 0 (0.0%) | 0 (0.0%) |
| 35 Years and over | 0 (0.0%) | 0 (0.0%) |
| Total | 0 (0.0%) | 0 (0.0%) |
Educational Attainment by Field of Study in Chili
, and science & technology (22 | 100.0%) are the most common fields of study among 22 individuals in Chili who have obtained a bachelor's degree or higher.
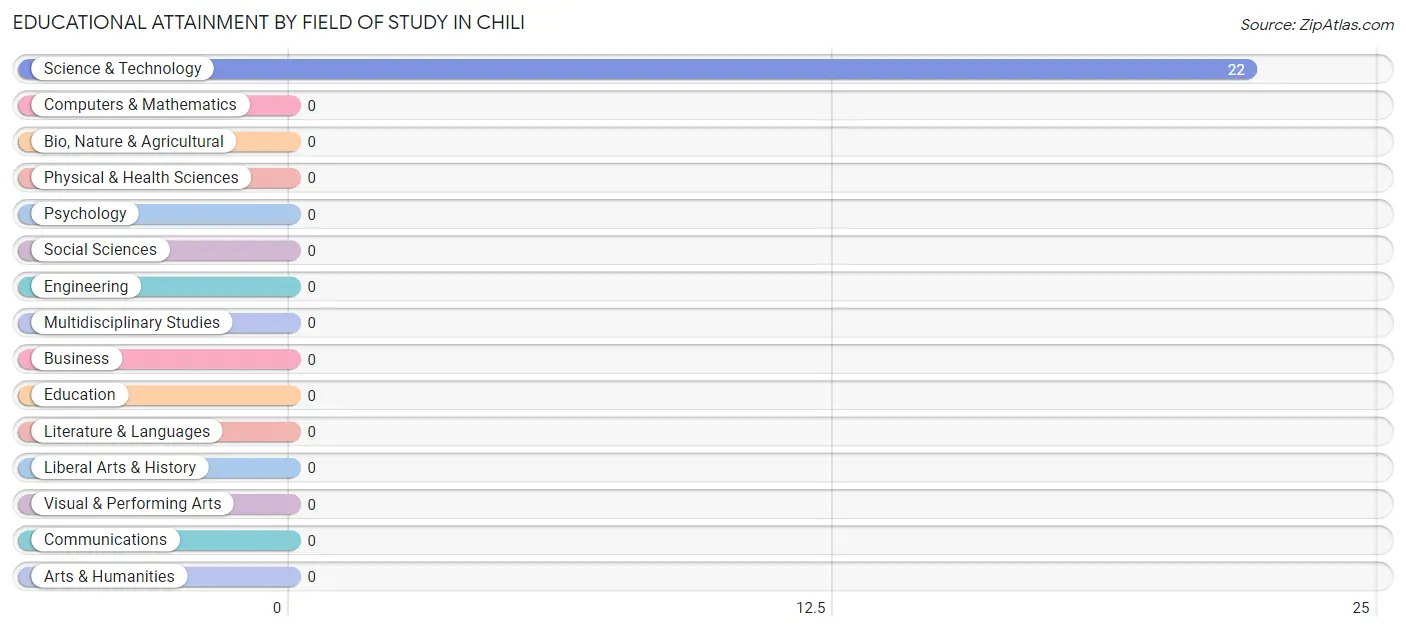
| Field of Study | # Graduates | % Graduates |
| Computers & Mathematics | 0 | 0.0% |
| Bio, Nature & Agricultural | 0 | 0.0% |
| Physical & Health Sciences | 0 | 0.0% |
| Psychology | 0 | 0.0% |
| Social Sciences | 0 | 0.0% |
| Engineering | 0 | 0.0% |
| Multidisciplinary Studies | 0 | 0.0% |
| Science & Technology | 22 | 100.0% |
| Business | 0 | 0.0% |
| Education | 0 | 0.0% |
| Literature & Languages | 0 | 0.0% |
| Liberal Arts & History | 0 | 0.0% |
| Visual & Performing Arts | 0 | 0.0% |
| Communications | 0 | 0.0% |
| Arts & Humanities | 0 | 0.0% |
| Total | 22 | 100.0% |
Transportation & Commute in Chili
Vehicle Availability by Sex in Chili
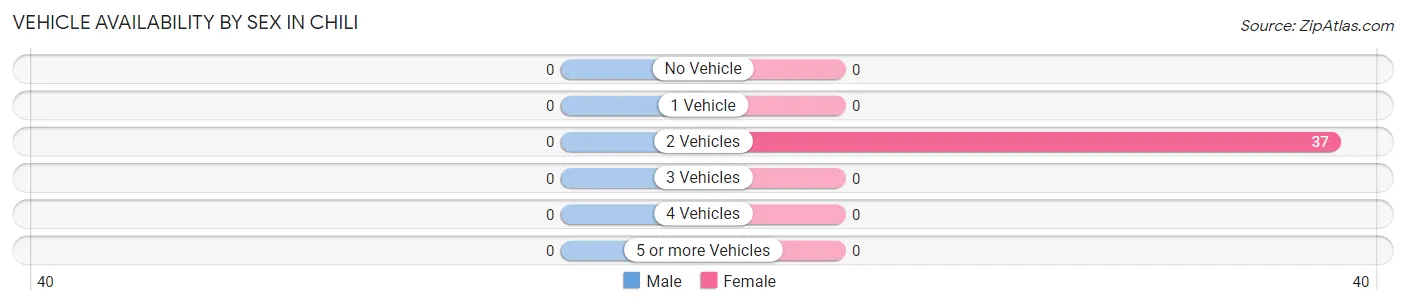
| Vehicles Available | Male | Female |
| No Vehicle | 0 (0.0%) | 0 (0.0%) |
| 1 Vehicle | 0 (0.0%) | 0 (0.0%) |
| 2 Vehicles | 0 (0.0%) | 37 (100.0%) |
| 3 Vehicles | 0 (0.0%) | 0 (0.0%) |
| 4 Vehicles | 0 (0.0%) | 0 (0.0%) |
| 5 or more Vehicles | 0 (0.0%) | 0 (0.0%) |
| Total | 0 (0.0%) | 37 (100.0%) |
Commute Time in Chili
The most frequently occuring commute durations in Chili are 15 to 19 minutes (37 commuters, 100.0%), less than 5 minutes (0 commuters, 0.0%), and 5 to 9 minutes (0 commuters, 0.0%).
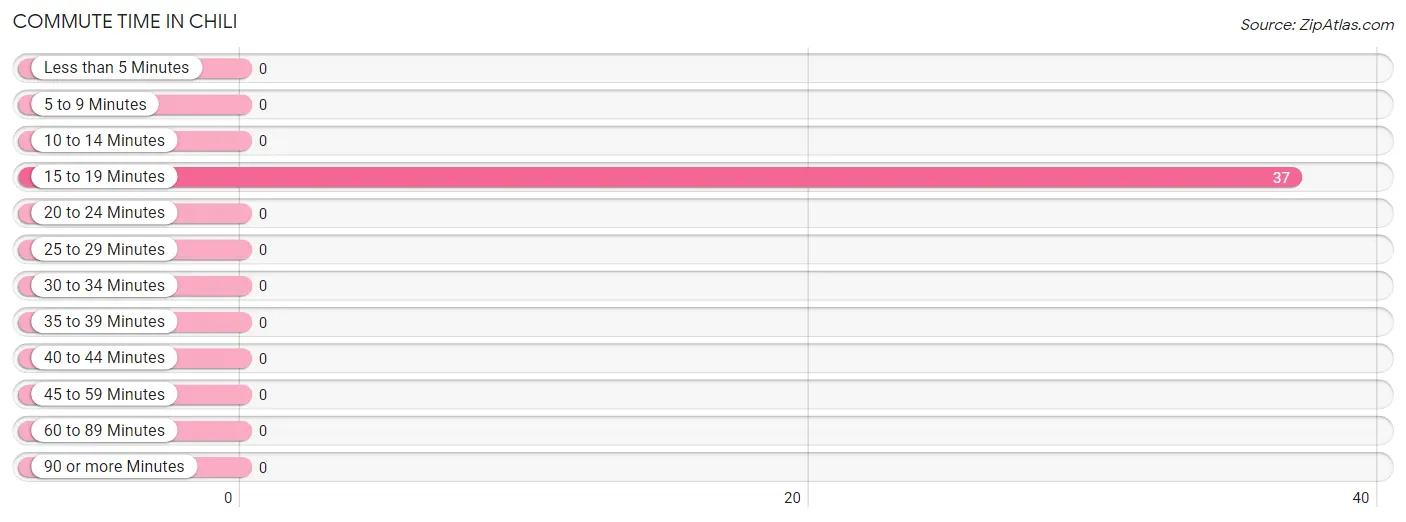
| Commute Time | # Commuters | % Commuters |
| Less than 5 Minutes | 0 | 0.0% |
| 5 to 9 Minutes | 0 | 0.0% |
| 10 to 14 Minutes | 0 | 0.0% |
| 15 to 19 Minutes | 37 | 100.0% |
| 20 to 24 Minutes | 0 | 0.0% |
| 25 to 29 Minutes | 0 | 0.0% |
| 30 to 34 Minutes | 0 | 0.0% |
| 35 to 39 Minutes | 0 | 0.0% |
| 40 to 44 Minutes | 0 | 0.0% |
| 45 to 59 Minutes | 0 | 0.0% |
| 60 to 89 Minutes | 0 | 0.0% |
| 90 or more Minutes | 0 | 0.0% |
Commute Time by Sex in Chili
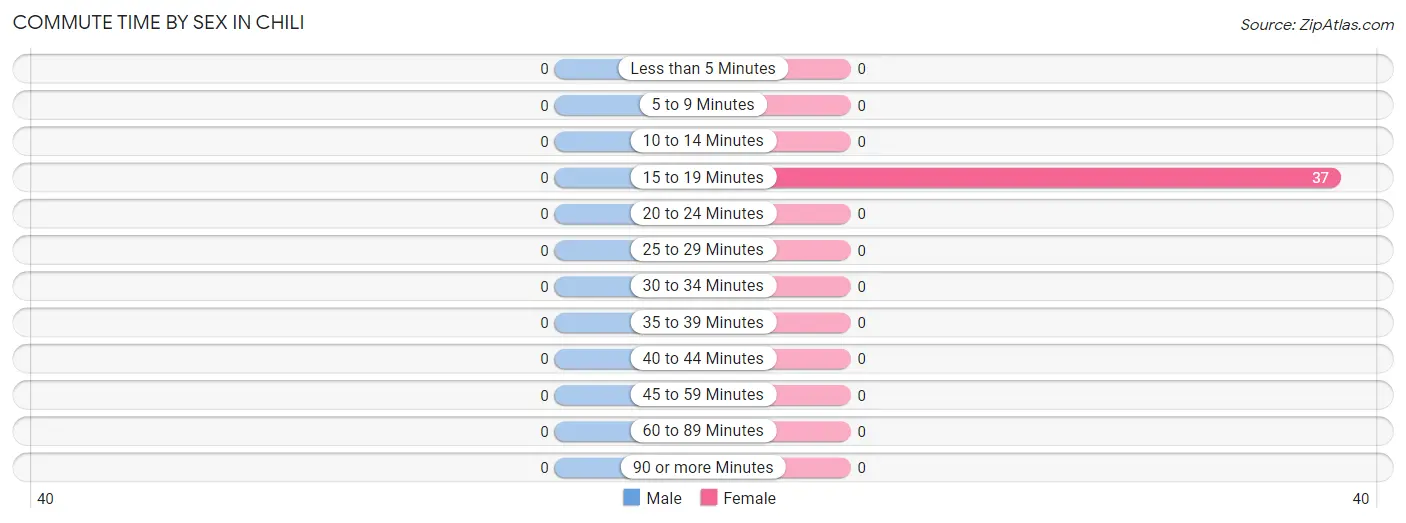
| Commute Time | Male | Female |
| Less than 5 Minutes | 0 (0.0%) | 0 (0.0%) |
| 5 to 9 Minutes | 0 (0.0%) | 0 (0.0%) |
| 10 to 14 Minutes | 0 (0.0%) | 0 (0.0%) |
| 15 to 19 Minutes | 0 (0.0%) | 37 (100.0%) |
| 20 to 24 Minutes | 0 (0.0%) | 0 (0.0%) |
| 25 to 29 Minutes | 0 (0.0%) | 0 (0.0%) |
| 30 to 34 Minutes | 0 (0.0%) | 0 (0.0%) |
| 35 to 39 Minutes | 0 (0.0%) | 0 (0.0%) |
| 40 to 44 Minutes | 0 (0.0%) | 0 (0.0%) |
| 45 to 59 Minutes | 0 (0.0%) | 0 (0.0%) |
| 60 to 89 Minutes | 0 (0.0%) | 0 (0.0%) |
| 90 or more Minutes | 0 (0.0%) | 0 (0.0%) |
Time of Departure to Work by Sex in Chili
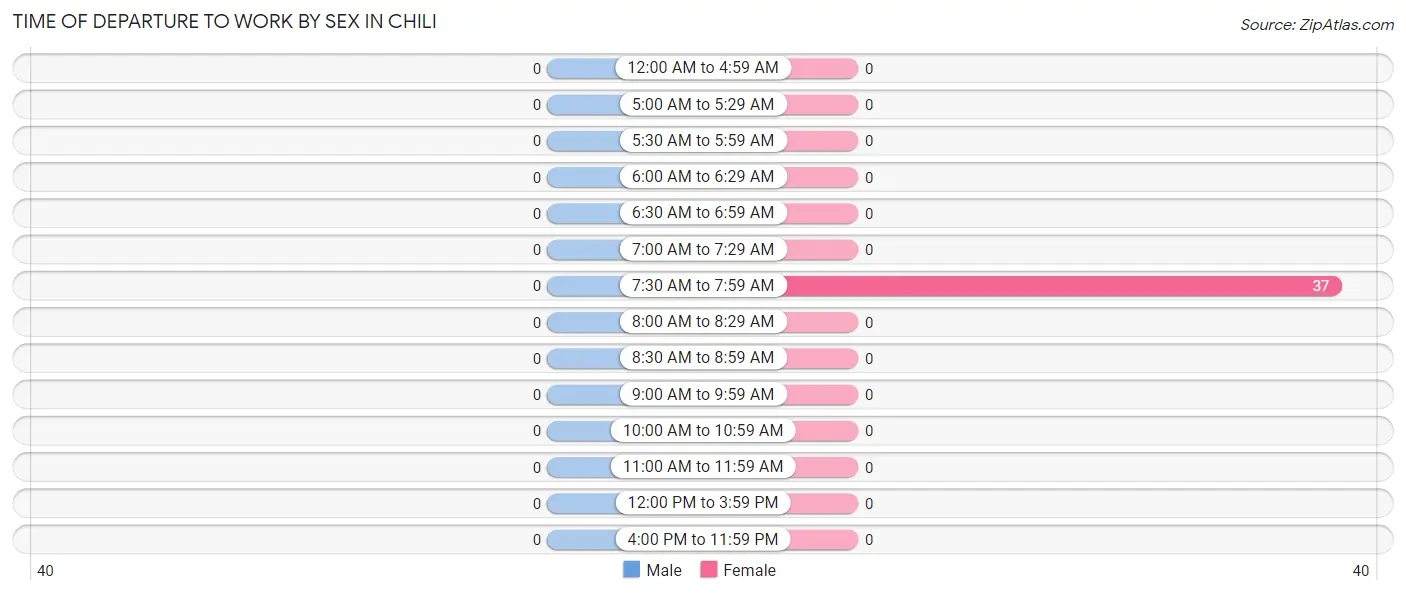
| Time of Departure | Male | Female |
| 12:00 AM to 4:59 AM | 0 (0.0%) | 0 (0.0%) |
| 5:00 AM to 5:29 AM | 0 (0.0%) | 0 (0.0%) |
| 5:30 AM to 5:59 AM | 0 (0.0%) | 0 (0.0%) |
| 6:00 AM to 6:29 AM | 0 (0.0%) | 0 (0.0%) |
| 6:30 AM to 6:59 AM | 0 (0.0%) | 0 (0.0%) |
| 7:00 AM to 7:29 AM | 0 (0.0%) | 0 (0.0%) |
| 7:30 AM to 7:59 AM | 0 (0.0%) | 37 (100.0%) |
| 8:00 AM to 8:29 AM | 0 (0.0%) | 0 (0.0%) |
| 8:30 AM to 8:59 AM | 0 (0.0%) | 0 (0.0%) |
| 9:00 AM to 9:59 AM | 0 (0.0%) | 0 (0.0%) |
| 10:00 AM to 10:59 AM | 0 (0.0%) | 0 (0.0%) |
| 11:00 AM to 11:59 AM | 0 (0.0%) | 0 (0.0%) |
| 12:00 PM to 3:59 PM | 0 (0.0%) | 0 (0.0%) |
| 4:00 PM to 11:59 PM | 0 (0.0%) | 0 (0.0%) |
| Total | 0 (0.0%) | 37 (100.0%) |
Housing Occupancy in Chili
Occupancy by Ownership in Chili
Of the total 135 dwellings in Chili, owner-occupied units account for 135 (100.0%), while renter-occupied units make up 0 (0.0%).
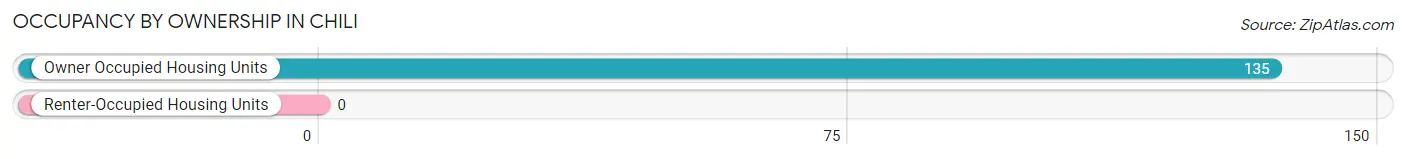
| Occupancy | # Housing Units | % Housing Units |
| Owner Occupied Housing Units | 135 | 100.0% |
| Renter-Occupied Housing Units | 0 | 0.0% |
| Total Occupied Housing Units | 135 | 100.0% |
Occupancy by Household Size in Chili
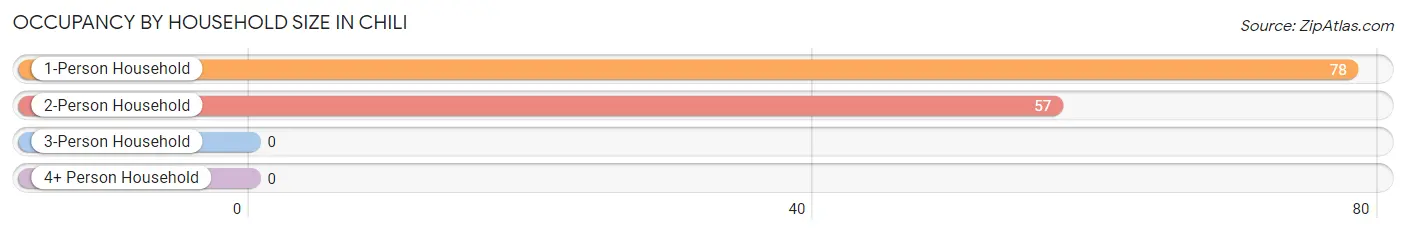
| Household Size | # Housing Units | % Housing Units |
| 1-Person Household | 78 | 57.8% |
| 2-Person Household | 57 | 42.2% |
| 3-Person Household | 0 | 0.0% |
| 4+ Person Household | 0 | 0.0% |
| Total Housing Units | 135 | 100.0% |
Occupancy by Ownership by Household Size in Chili
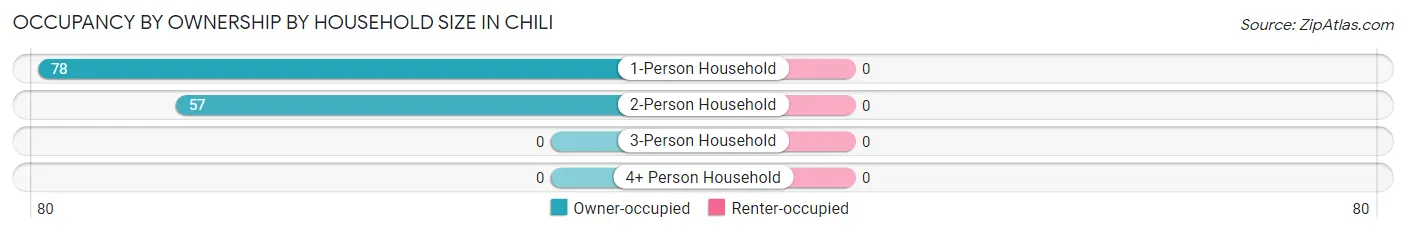
| Household Size | Owner-occupied | Renter-occupied |
| 1-Person Household | 78 (100.0%) | 0 (0.0%) |
| 2-Person Household | 57 (100.0%) | 0 (0.0%) |
| 3-Person Household | 0 (0.0%) | 0 (0.0%) |
| 4+ Person Household | 0 (0.0%) | 0 (0.0%) |
| Total Housing Units | 135 (100.0%) | 0 (0.0%) |
Occupancy by Educational Attainment in Chili
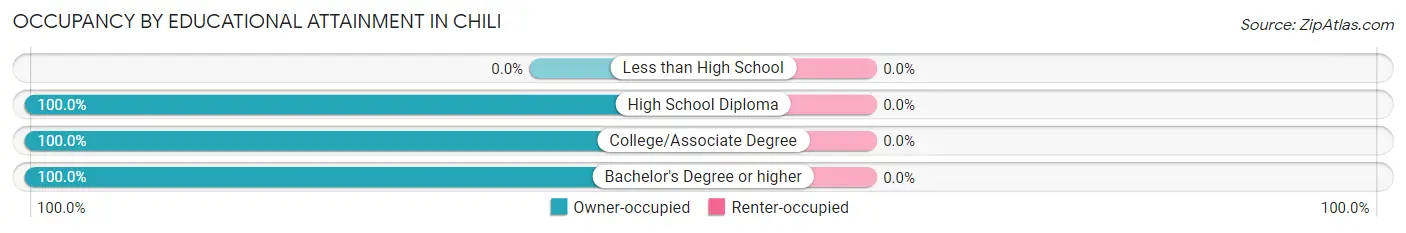
| Household Size | Owner-occupied | Renter-occupied |
| Less than High School | 0 (0.0%) | 0 (0.0%) |
| High School Diploma | 1 (100.0%) | 0 (0.0%) |
| College/Associate Degree | 112 (100.0%) | 0 (0.0%) |
| Bachelor's Degree or higher | 22 (100.0%) | 0 (0.0%) |
Occupancy by Age of Householder in Chili
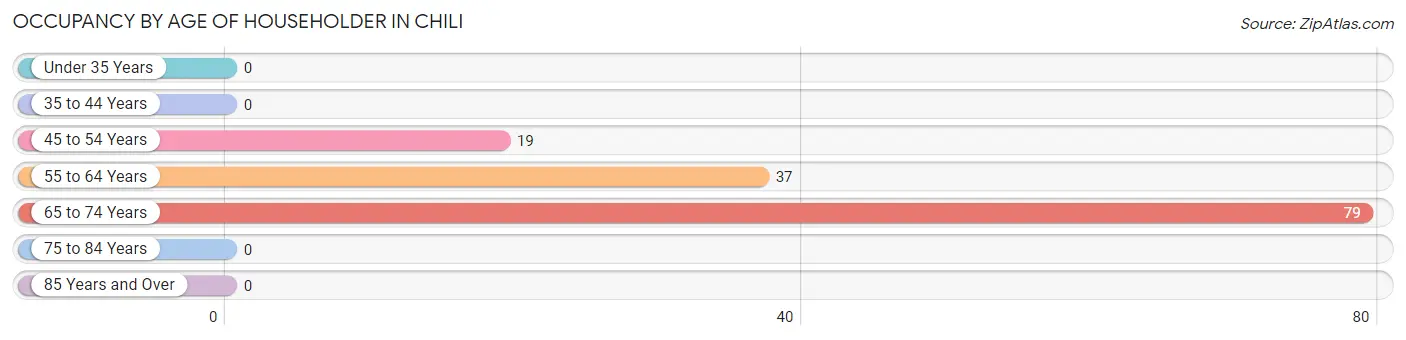
| Age Bracket | # Households | % Households |
| Under 35 Years | 0 | 0.0% |
| 35 to 44 Years | 0 | 0.0% |
| 45 to 54 Years | 19 | 14.1% |
| 55 to 64 Years | 37 | 27.4% |
| 65 to 74 Years | 79 | 58.5% |
| 75 to 84 Years | 0 | 0.0% |
| 85 Years and Over | 0 | 0.0% |
| Total | 135 | 100.0% |
Housing Finances in Chili
Median Income by Occupancy in Chili
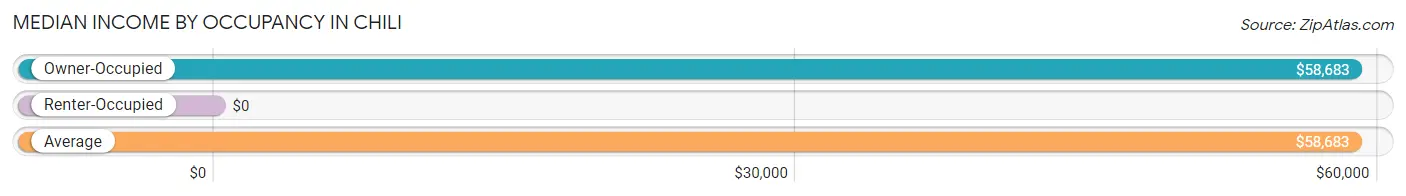
| Occupancy Type | # Households | Median Income |
| Owner-Occupied | 135 (100.0%) | $58,683 |
| Renter-Occupied | 0 (0.0%) | $0 |
| Average | 135 (100.0%) | $58,683 |
Occupancy by Householder Income Bracket in Chili
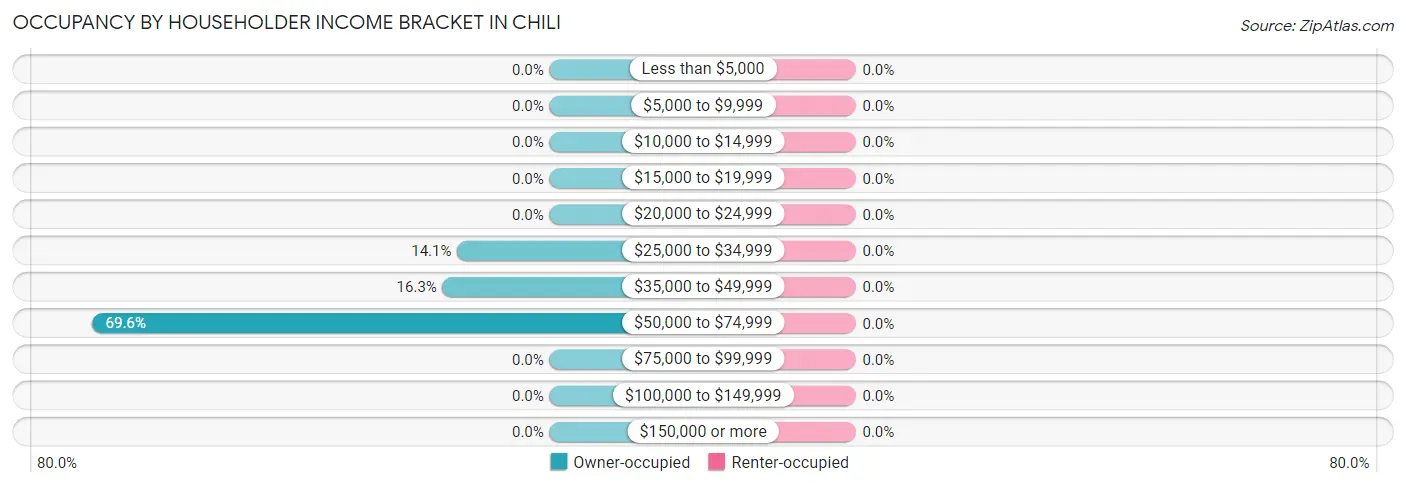
| Income Bracket | Owner-occupied | Renter-occupied |
| Less than $5,000 | 0 (0.0%) | 0 (0.0%) |
| $5,000 to $9,999 | 0 (0.0%) | 0 (0.0%) |
| $10,000 to $14,999 | 0 (0.0%) | 0 (0.0%) |
| $15,000 to $19,999 | 0 (0.0%) | 0 (0.0%) |
| $20,000 to $24,999 | 0 (0.0%) | 0 (0.0%) |
| $25,000 to $34,999 | 19 (14.1%) | 0 (0.0%) |
| $35,000 to $49,999 | 22 (16.3%) | 0 (0.0%) |
| $50,000 to $74,999 | 94 (69.6%) | 0 (0.0%) |
| $75,000 to $99,999 | 0 (0.0%) | 0 (0.0%) |
| $100,000 to $149,999 | 0 (0.0%) | 0 (0.0%) |
| $150,000 or more | 0 (0.0%) | 0 (0.0%) |
| Total | 135 (100.0%) | 0 (0.0%) |
Monthly Housing Cost Tiers in Chili
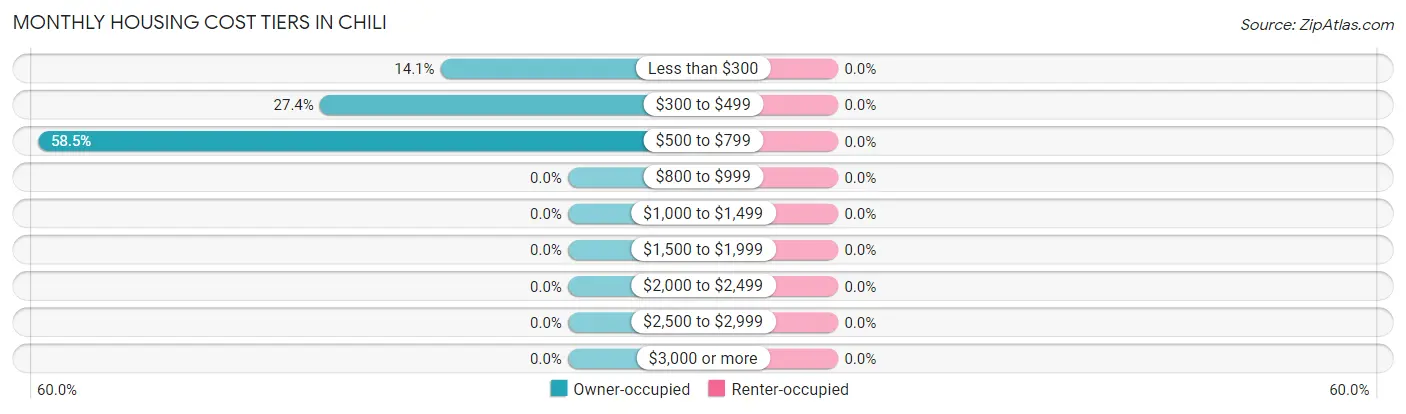
| Monthly Cost | Owner-occupied | Renter-occupied |
| Less than $300 | 19 (14.1%) | 0 (0.0%) |
| $300 to $499 | 37 (27.4%) | 0 (0.0%) |
| $500 to $799 | 79 (58.5%) | 0 (0.0%) |
| $800 to $999 | 0 (0.0%) | 0 (0.0%) |
| $1,000 to $1,499 | 0 (0.0%) | 0 (0.0%) |
| $1,500 to $1,999 | 0 (0.0%) | 0 (0.0%) |
| $2,000 to $2,499 | 0 (0.0%) | 0 (0.0%) |
| $2,500 to $2,999 | 0 (0.0%) | 0 (0.0%) |
| $3,000 or more | 0 (0.0%) | 0 (0.0%) |
| Total | 135 (100.0%) | 0 (0.0%) |
Physical Housing Characteristics in Chili
Housing Structures in Chili
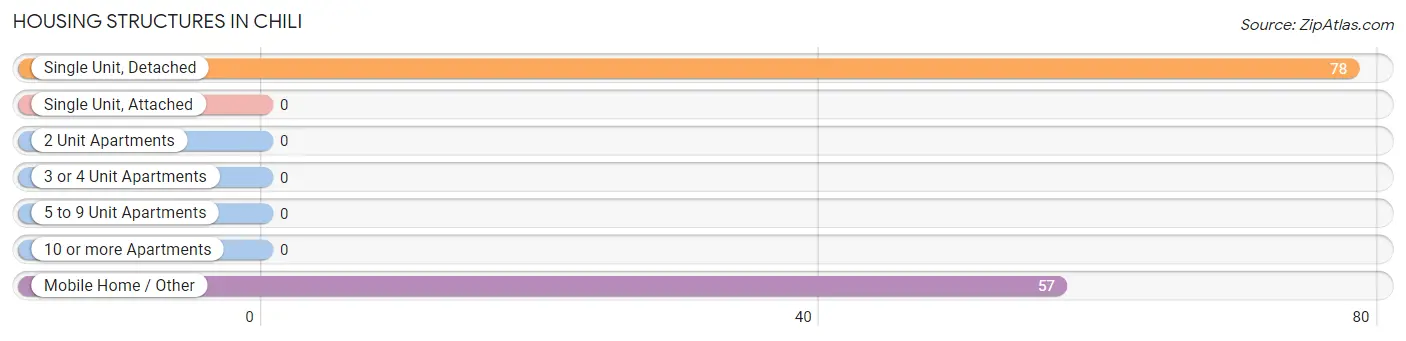
| Structure Type | # Housing Units | % Housing Units |
| Single Unit, Detached | 78 | 57.8% |
| Single Unit, Attached | 0 | 0.0% |
| 2 Unit Apartments | 0 | 0.0% |
| 3 or 4 Unit Apartments | 0 | 0.0% |
| 5 to 9 Unit Apartments | 0 | 0.0% |
| 10 or more Apartments | 0 | 0.0% |
| Mobile Home / Other | 57 | 42.2% |
| Total | 135 | 100.0% |
Housing Structures by Occupancy in Chili
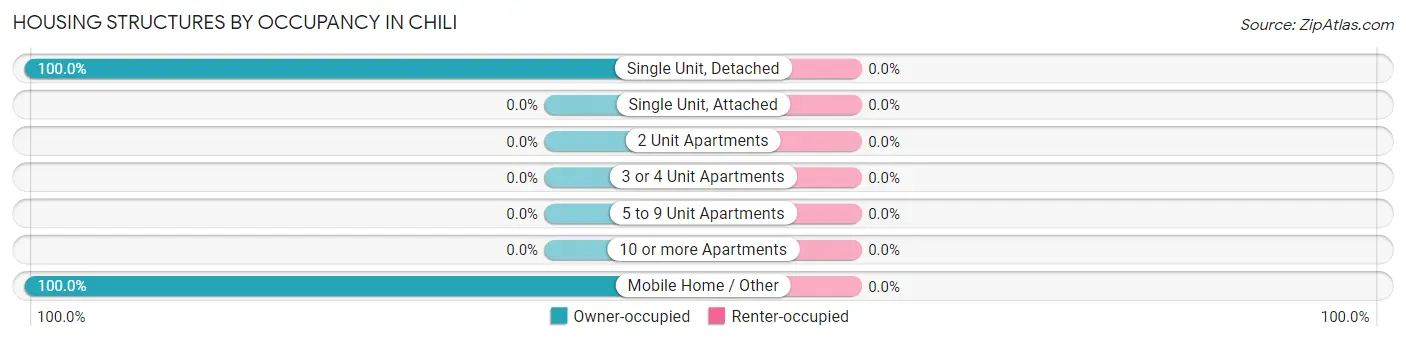
| Structure Type | Owner-occupied | Renter-occupied |
| Single Unit, Detached | 78 (100.0%) | 0 (0.0%) |
| Single Unit, Attached | 0 (0.0%) | 0 (0.0%) |
| 2 Unit Apartments | 0 (0.0%) | 0 (0.0%) |
| 3 or 4 Unit Apartments | 0 (0.0%) | 0 (0.0%) |
| 5 to 9 Unit Apartments | 0 (0.0%) | 0 (0.0%) |
| 10 or more Apartments | 0 (0.0%) | 0 (0.0%) |
| Mobile Home / Other | 57 (100.0%) | 0 (0.0%) |
| Total | 135 (100.0%) | 0 (0.0%) |
Housing Structures by Number of Rooms in Chili
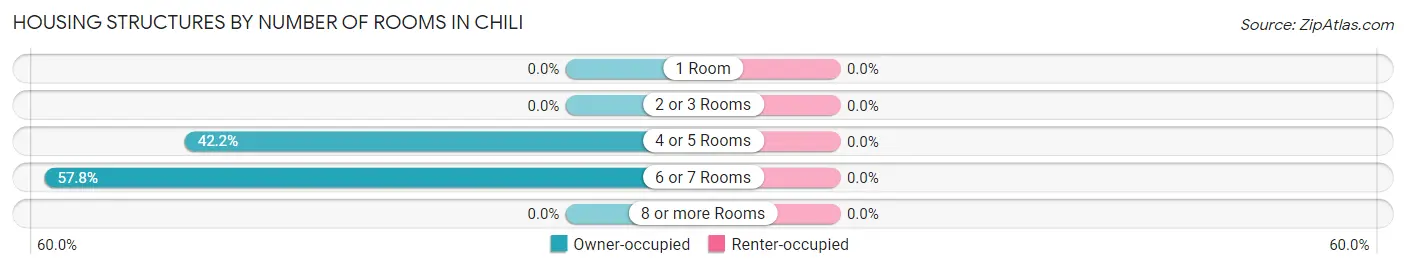
| Number of Rooms | Owner-occupied | Renter-occupied |
| 1 Room | 0 (0.0%) | 0 (0.0%) |
| 2 or 3 Rooms | 0 (0.0%) | 0 (0.0%) |
| 4 or 5 Rooms | 57 (42.2%) | 0 (0.0%) |
| 6 or 7 Rooms | 78 (57.8%) | 0 (0.0%) |
| 8 or more Rooms | 0 (0.0%) | 0 (0.0%) |
| Total | 135 (100.0%) | 0 (0.0%) |
Housing Structure by Heating Type in Chili
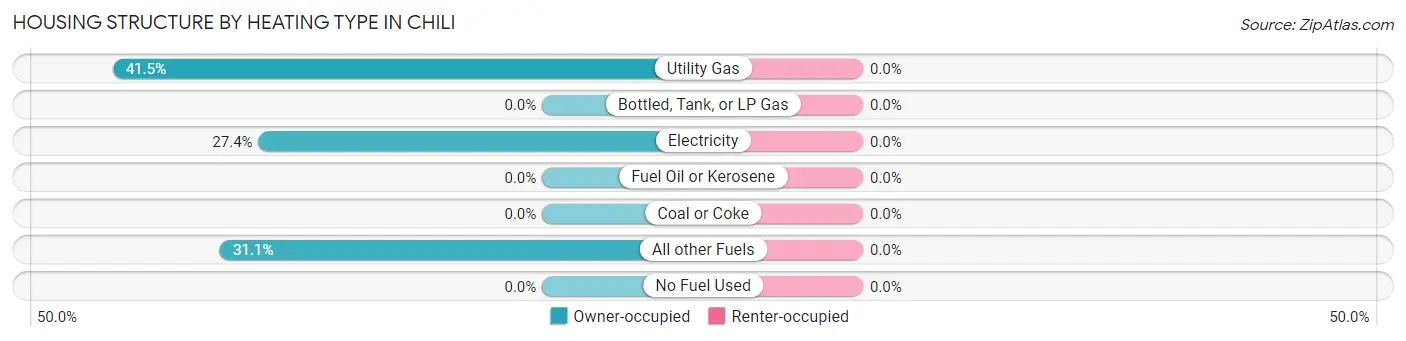
| Heating Type | Owner-occupied | Renter-occupied |
| Utility Gas | 56 (41.5%) | 0 (0.0%) |
| Bottled, Tank, or LP Gas | 0 (0.0%) | 0 (0.0%) |
| Electricity | 37 (27.4%) | 0 (0.0%) |
| Fuel Oil or Kerosene | 0 (0.0%) | 0 (0.0%) |
| Coal or Coke | 0 (0.0%) | 0 (0.0%) |
| All other Fuels | 42 (31.1%) | 0 (0.0%) |
| No Fuel Used | 0 (0.0%) | 0 (0.0%) |
| Total | 135 (100.0%) | 0 (0.0%) |
Household Vehicle Usage in Chili
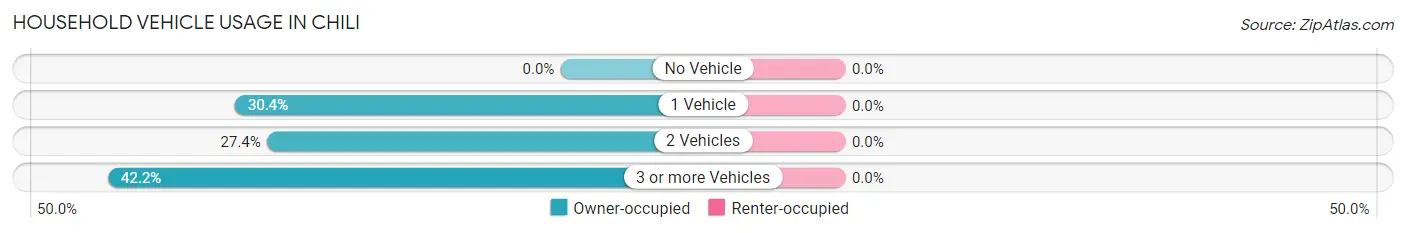
| Vehicles per Household | Owner-occupied | Renter-occupied |
| No Vehicle | 0 (0.0%) | 0 (0.0%) |
| 1 Vehicle | 41 (30.4%) | 0 (0.0%) |
| 2 Vehicles | 37 (27.4%) | 0 (0.0%) |
| 3 or more Vehicles | 57 (42.2%) | 0 (0.0%) |
| Total | 135 (100.0%) | 0 (0.0%) |
Real Estate & Mortgages in Chili
Real Estate and Mortgage Overview in Chili
| Characteristic | Without Mortgage | With Mortgage |
| Housing Units | 112 | 23 |
| Median Property Value | $269,900 | $0 |
| Median Household Income | $59,152 | $0 |
| Monthly Housing Costs | $425 | $0 |
| Real Estate Taxes | $732 | $0 |
Property Value by Mortgage Status in Chili
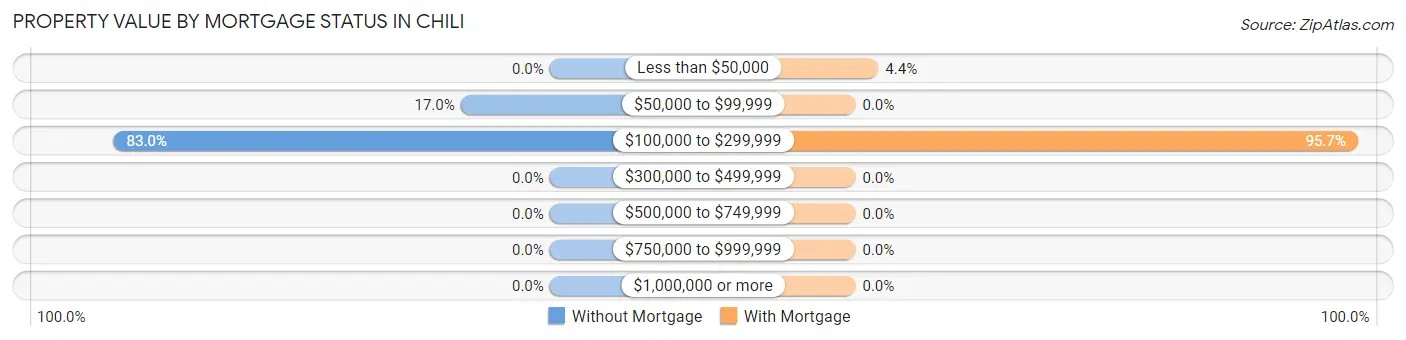
| Property Value | Without Mortgage | With Mortgage |
| Less than $50,000 | 0 (0.0%) | 1 (4.3%) |
| $50,000 to $99,999 | 19 (17.0%) | 0 (0.0%) |
| $100,000 to $299,999 | 93 (83.0%) | 22 (95.7%) |
| $300,000 to $499,999 | 0 (0.0%) | 0 (0.0%) |
| $500,000 to $749,999 | 0 (0.0%) | 0 (0.0%) |
| $750,000 to $999,999 | 0 (0.0%) | 0 (0.0%) |
| $1,000,000 or more | 0 (0.0%) | 0 (0.0%) |
| Total | 112 (100.0%) | 23 (100.0%) |
Household Income by Mortgage Status in Chili
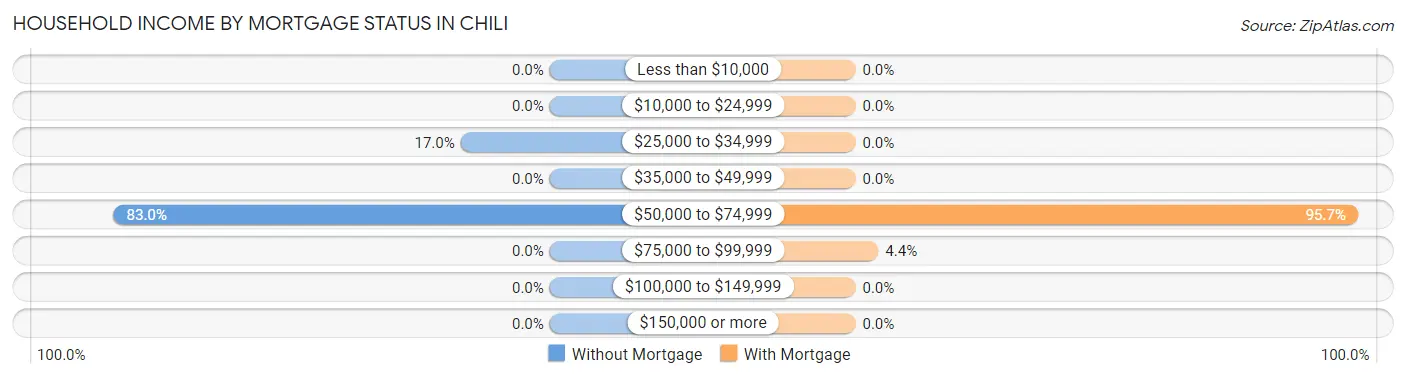
| Household Income | Without Mortgage | With Mortgage |
| Less than $10,000 | 0 (0.0%) | 0 (0.0%) |
| $10,000 to $24,999 | 0 (0.0%) | 0 (0.0%) |
| $25,000 to $34,999 | 19 (17.0%) | 0 (0.0%) |
| $35,000 to $49,999 | 0 (0.0%) | 0 (0.0%) |
| $50,000 to $74,999 | 93 (83.0%) | 22 (95.7%) |
| $75,000 to $99,999 | 0 (0.0%) | 1 (4.3%) |
| $100,000 to $149,999 | 0 (0.0%) | 0 (0.0%) |
| $150,000 or more | 0 (0.0%) | 0 (0.0%) |
| Total | 112 (100.0%) | 23 (100.0%) |
Property Value to Household Income Ratio in Chili
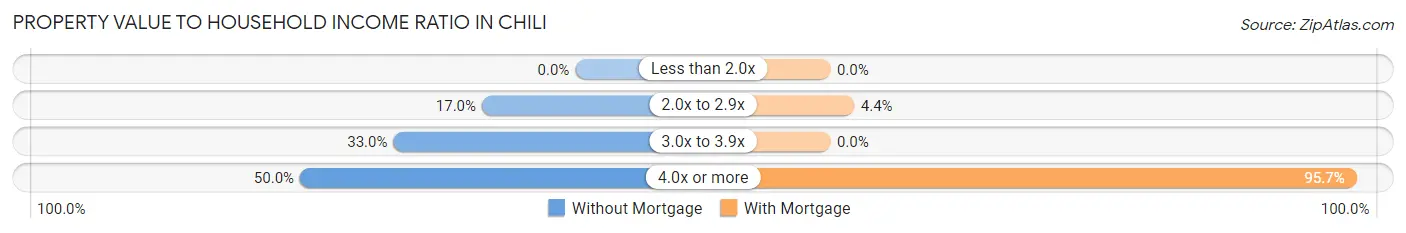
| Value-to-Income Ratio | Without Mortgage | With Mortgage |
| Less than 2.0x | 0 (0.0%) | 0 (0.0%) |
| 2.0x to 2.9x | 19 (17.0%) | 1 (4.3%) |
| 3.0x to 3.9x | 37 (33.0%) | 0 (0.0%) |
| 4.0x or more | 56 (50.0%) | 22 (95.7%) |
| Total | 112 (100.0%) | 23 (100.0%) |
Real Estate Taxes by Mortgage Status in Chili
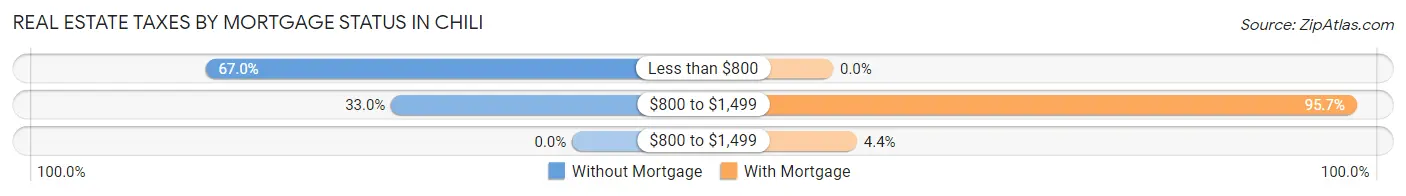
| Property Taxes | Without Mortgage | With Mortgage |
| Less than $800 | 75 (67.0%) | 0 (0.0%) |
| $800 to $1,499 | 37 (33.0%) | 22 (95.7%) |
| $800 to $1,499 | 0 (0.0%) | 1 (4.3%) |
| Total | 112 (100.0%) | 23 (100.0%) |
Health & Disability in Chili
Health Insurance Coverage by Age in Chili
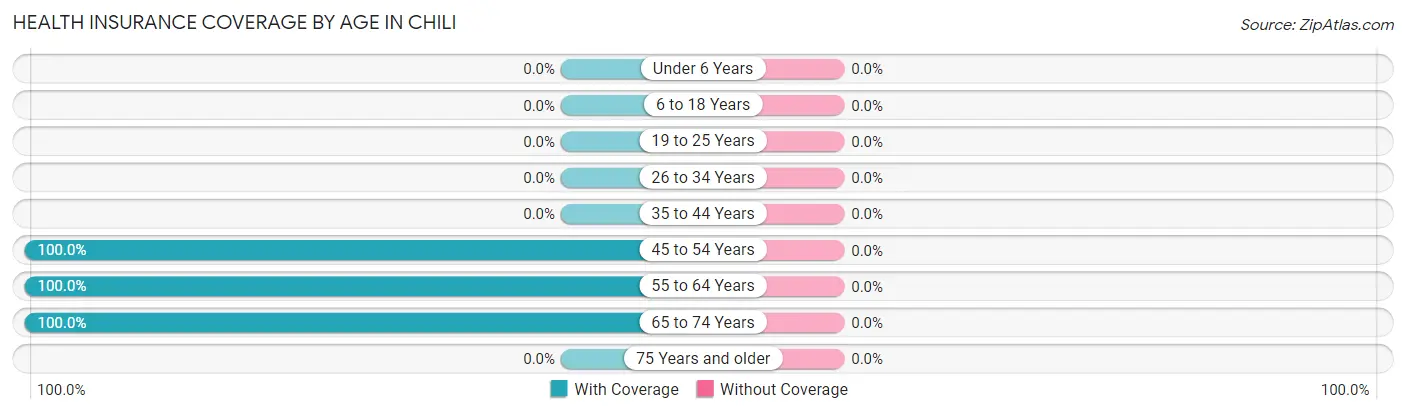
| Age Bracket | With Coverage | Without Coverage |
| Under 6 Years | 0 (0.0%) | 0 (0.0%) |
| 6 to 18 Years | 0 (0.0%) | 0 (0.0%) |
| 19 to 25 Years | 0 (0.0%) | 0 (0.0%) |
| 26 to 34 Years | 0 (0.0%) | 0 (0.0%) |
| 35 to 44 Years | 0 (0.0%) | 0 (0.0%) |
| 45 to 54 Years | 19 (100.0%) | 0 (0.0%) |
| 55 to 64 Years | 37 (100.0%) | 0 (0.0%) |
| 65 to 74 Years | 164 (100.0%) | 0 (0.0%) |
| 75 Years and older | 0 (0.0%) | 0 (0.0%) |
| Total | 220 (100.0%) | 0 (0.0%) |
Health Insurance Coverage by Citizenship Status in Chili

| Citizenship Status | With Coverage | Without Coverage |
| Native Born | 0 (0.0%) | 0 (0.0%) |
| Foreign Born, Citizen | 0 (0.0%) | 0 (0.0%) |
| Foreign Born, not a Citizen | 0 (0.0%) | 0 (0.0%) |
Health Insurance Coverage by Household Income in Chili
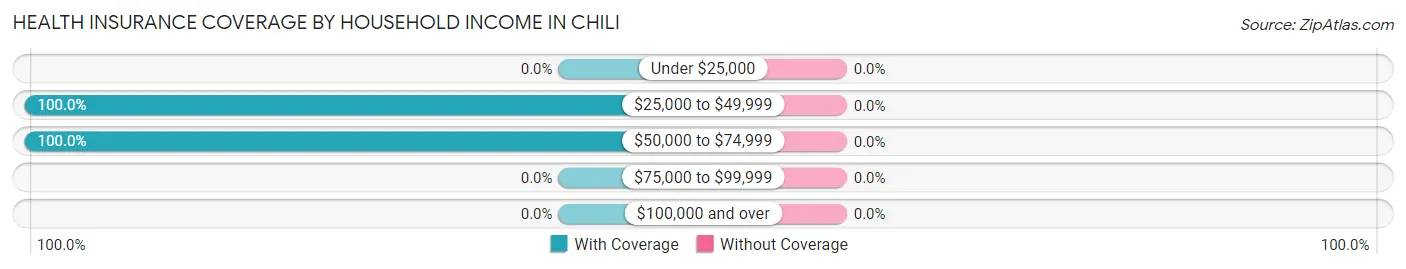
| Household Income | With Coverage | Without Coverage |
| Under $25,000 | 0 (0.0%) | 0 (0.0%) |
| $25,000 to $49,999 | 41 (100.0%) | 0 (0.0%) |
| $50,000 to $74,999 | 179 (100.0%) | 0 (0.0%) |
| $75,000 to $99,999 | 0 (0.0%) | 0 (0.0%) |
| $100,000 and over | 0 (0.0%) | 0 (0.0%) |
Public vs Private Health Insurance Coverage by Age in Chili
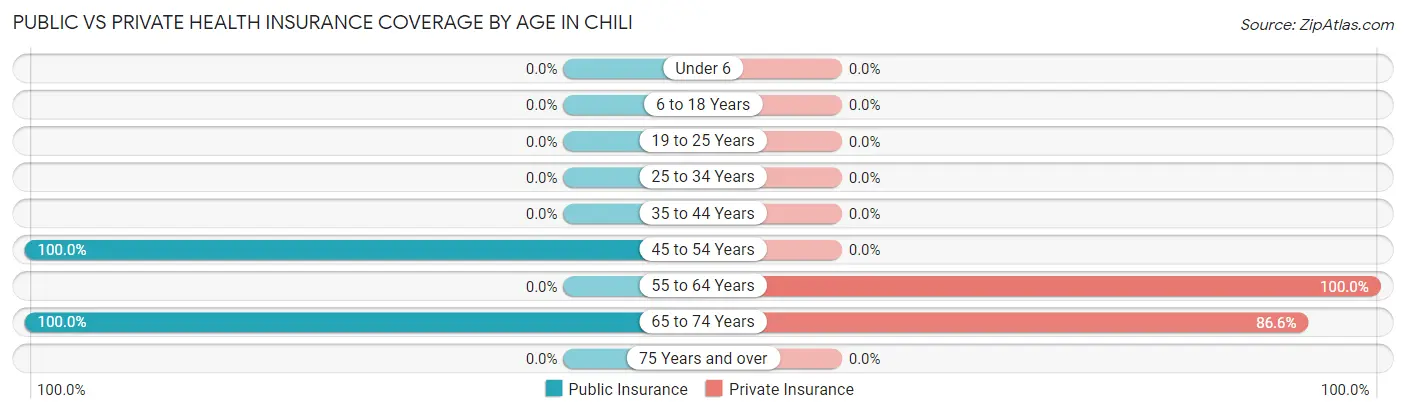
| Age Bracket | Public Insurance | Private Insurance |
| Under 6 | 0 (0.0%) | 0 (0.0%) |
| 6 to 18 Years | 0 (0.0%) | 0 (0.0%) |
| 19 to 25 Years | 0 (0.0%) | 0 (0.0%) |
| 25 to 34 Years | 0 (0.0%) | 0 (0.0%) |
| 35 to 44 Years | 0 (0.0%) | 0 (0.0%) |
| 45 to 54 Years | 19 (100.0%) | 0 (0.0%) |
| 55 to 64 Years | 0 (0.0%) | 37 (100.0%) |
| 65 to 74 Years | 164 (100.0%) | 142 (86.6%) |
| 75 Years and over | 0 (0.0%) | 0 (0.0%) |
| Total | 183 (83.2%) | 179 (81.4%) |
Disability Status by Sex by Age in Chili
| Age Bracket | Male | Female |
| Under 5 Years | 0 (0.0%) | 0 (0.0%) |
| 5 to 17 Years | 0 (0.0%) | 0 (0.0%) |
| 18 to 34 Years | 0 (0.0%) | 0 (0.0%) |
| 35 to 64 Years | 0 (0.0%) | 0 (0.0%) |
| 65 to 74 Years | 0 (0.0%) | 0 (0.0%) |
| 75 Years and over | 0 (0.0%) | 0 (0.0%) |
Disability Class by Sex by Age in Chili
Disability Class: Hearing Difficulty
| Age Bracket | Male | Female |
| Under 5 Years | 0 (0.0%) | 0 (0.0%) |
| 5 to 17 Years | 0 (0.0%) | 0 (0.0%) |
| 18 to 34 Years | 0 (0.0%) | 0 (0.0%) |
| 35 to 64 Years | 0 (0.0%) | 0 (0.0%) |
| 65 to 74 Years | 0 (0.0%) | 0 (0.0%) |
| 75 Years and over | 0 (0.0%) | 0 (0.0%) |
Disability Class: Vision Difficulty
| Age Bracket | Male | Female |
| Under 5 Years | 0 (0.0%) | 0 (0.0%) |
| 5 to 17 Years | 0 (0.0%) | 0 (0.0%) |
| 18 to 34 Years | 0 (0.0%) | 0 (0.0%) |
| 35 to 64 Years | 0 (0.0%) | 0 (0.0%) |
| 65 to 74 Years | 0 (0.0%) | 0 (0.0%) |
| 75 Years and over | 0 (0.0%) | 0 (0.0%) |
Disability Class: Cognitive Difficulty
| Age Bracket | Male | Female |
| 5 to 17 Years | 0 (0.0%) | 0 (0.0%) |
| 18 to 34 Years | 0 (0.0%) | 0 (0.0%) |
| 35 to 64 Years | 0 (0.0%) | 0 (0.0%) |
| 65 to 74 Years | 0 (0.0%) | 0 (0.0%) |
| 75 Years and over | 0 (0.0%) | 0 (0.0%) |
Disability Class: Ambulatory Difficulty
| Age Bracket | Male | Female |
| 5 to 17 Years | 0 (0.0%) | 0 (0.0%) |
| 18 to 34 Years | 0 (0.0%) | 0 (0.0%) |
| 35 to 64 Years | 0 (0.0%) | 0 (0.0%) |
| 65 to 74 Years | 0 (0.0%) | 0 (0.0%) |
| 75 Years and over | 0 (0.0%) | 0 (0.0%) |
Disability Class: Self-Care Difficulty
| Age Bracket | Male | Female |
| 5 to 17 Years | 0 (0.0%) | 0 (0.0%) |
| 18 to 34 Years | 0 (0.0%) | 0 (0.0%) |
| 35 to 64 Years | 0 (0.0%) | 0 (0.0%) |
| 65 to 74 Years | 0 (0.0%) | 0 (0.0%) |
| 75 Years and over | 0 (0.0%) | 0 (0.0%) |
Technology Access in Chili
Computing Device Access in Chili
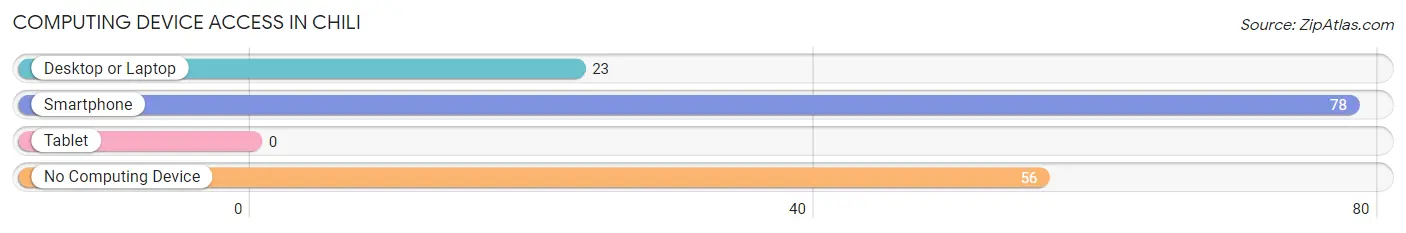
| Device Type | # Households | % Households |
| Desktop or Laptop | 23 | 17.0% |
| Smartphone | 78 | 57.8% |
| Tablet | 0 | 0.0% |
| No Computing Device | 56 | 41.5% |
| Total | 135 | 100.0% |
Internet Access in Chili
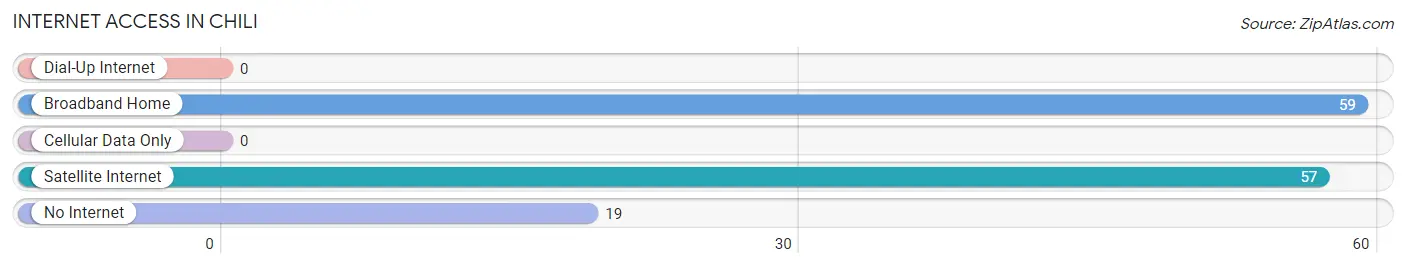
| Internet Type | # Households | % Households |
| Dial-Up Internet | 0 | 0.0% |
| Broadband Home | 59 | 43.7% |
| Cellular Data Only | 0 | 0.0% |
| Satellite Internet | 57 | 42.2% |
| No Internet | 19 | 14.1% |
| Total | 135 | 100.0% |
Chili Summary
Chili, New Mexico is a small town located in the northern part of the state, in the county of San Miguel. It is situated in the foothills of the Sangre de Cristo Mountains, and is surrounded by the beautiful landscape of the high desert. The town has a population of just over 1,000 people, and is known for its small-town charm and friendly atmosphere.
Geography
Chili is located in the northern part of New Mexico, in the county of San Miguel. It is situated in the foothills of the Sangre de Cristo Mountains, and is surrounded by the beautiful landscape of the high desert. The town is located at an elevation of 5,890 feet, and has an average annual temperature of 54 degrees Fahrenheit. The town is located near the Rio Grande River, and is close to the cities of Las Vegas and Santa Fe.
Economy
The economy of Chili is largely based on agriculture and tourism. The town is home to several farms and ranches, which produce a variety of crops, including alfalfa, corn, and wheat. The town is also home to several tourist attractions, such as the San Miguel County Historical Museum, the San Miguel County Courthouse, and the San Miguel County Fairgrounds. The town is also home to several restaurants, shops, and other businesses.
Demographics
As of the 2010 census, the population of Chili was 1,068. The racial makeup of the town was 94.3% White, 0.7% African American, 0.7% Native American, 0.3% Asian, 0.1% Pacific Islander, and 3.0% from other races. The median household income in Chili was $31,250, and the median family income was $37,500. The per capita income in Chili was $15,945.
History
Chili was founded in 1881 by a group of settlers from the nearby town of Las Vegas. The town was named after the chili pepper, which was a popular crop in the area. The town quickly grew, and by the early 1900s, it had become a bustling center of commerce and industry. The town was home to several businesses, including a flour mill, a sawmill, and a brickyard.
In the early 1900s, Chili was also home to several churches, schools, and other institutions. The town was also home to several saloons and gambling halls, which were popular with the local miners and cowboys. The town was also home to several newspapers, including the Chili Times and the Chili Herald.
In the late 1900s, the town began to decline, as many of the businesses and industries moved away. The town was also hit hard by the Great Depression, and many of the businesses and institutions closed. In the late 20th century, the town began to experience a resurgence, as new businesses and industries moved into the area. Today, Chili is a small but vibrant town, with a strong sense of community and a rich history.
Common Questions
What is Per Capita Income in Chili?
Per Capita income in Chili is $36,699.
What is the Median Household income in Chili?
Median Household Income in Chili is $58,683.
What is Inequality or Gini Index in Chili?
Inequality or Gini Index in Chili is 0.15.
What is the Total Population of Chili?
Total Population of Chili is 220.
What is the Total Male Population of Chili?
Total Male Population of Chili is 79.
What is the Total Female Population of Chili?
Total Female Population of Chili is 141.
What is the Ratio of Males per 100 Females in Chili?
There are 56.03 Males per 100 Females in Chili.
What is the Ratio of Females per 100 Males in Chili?
There are 178.48 Females per 100 Males in Chili.
What is the Median Population Age in Chili?
Median Population Age in Chili is 65.4 Years.
What is the Average Family Size in Chili
Average Family Size in Chili is 2.5 People.
What is the Average Household Size in Chili
Average Household Size in Chili is 1.6 People.
How Large is the Labor Force in Chili?
There are 121 People in the Labor Forcein in Chili.
What is the Percentage of People in the Labor Force in Chili?
55.0% of People are in the Labor Force in Chili.