Deerfield, VA Map & Demographics
Deerfield Map
Deerfield Overview
$50,117
PER CAPITA INCOME
39.8%
WAGE / INCOME GAP [ % ]
60.2¢/ $1
WAGE / INCOME GAP [ $ ]
0.37
INEQUALITY / GINI INDEX
351
TOTAL POPULATION
157
MALE POPULATION
194
FEMALE POPULATION
80.93
MALES / 100 FEMALES
123.57
FEMALES / 100 MALES
28.9
MEDIAN AGE
3.3
AVG FAMILY SIZE
2.1
AVG HOUSEHOLD SIZE
321
LABOR FORCE [ PEOPLE ]
91.5%
PERCENT IN LABOR FORCE
Deerfield Zip Codes
Deerfield Area Codes
Income in Deerfield
Income Overview in Deerfield
| Characteristic | Number | Measure |
| Per Capita Income | 351 | $50,117 |
| Median Family Income | 46 | $0 |
| Mean Family Income | 46 | $0 |
| Median Household Income | 170 | $0 |
| Mean Household Income | 170 | $95,817 |
| Income Deficit | 46 | $0 |
| Wage / Income Gap (%) | 351 | 39.81% |
| Wage / Income Gap ($) | 351 | 60.19¢ per $1 |
| Gini / Inequality Index | 351 | 0.37 |
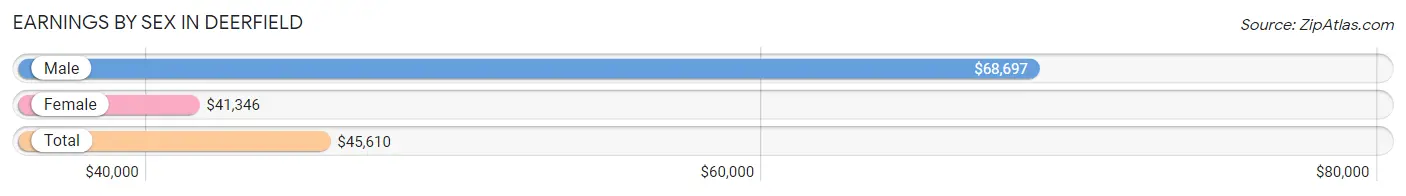
Earnings by Sex in Deerfield
Average Earnings in Deerfield are $45,610, $68,697 for men and $41,346 for women, a difference of 39.8%.
| Sex | Number | Average Earnings |
| Male | 157 (48.9%) | $68,697 |
| Female | 164 (51.1%) | $41,346 |
| Total | 321 (100.0%) | $45,610 |
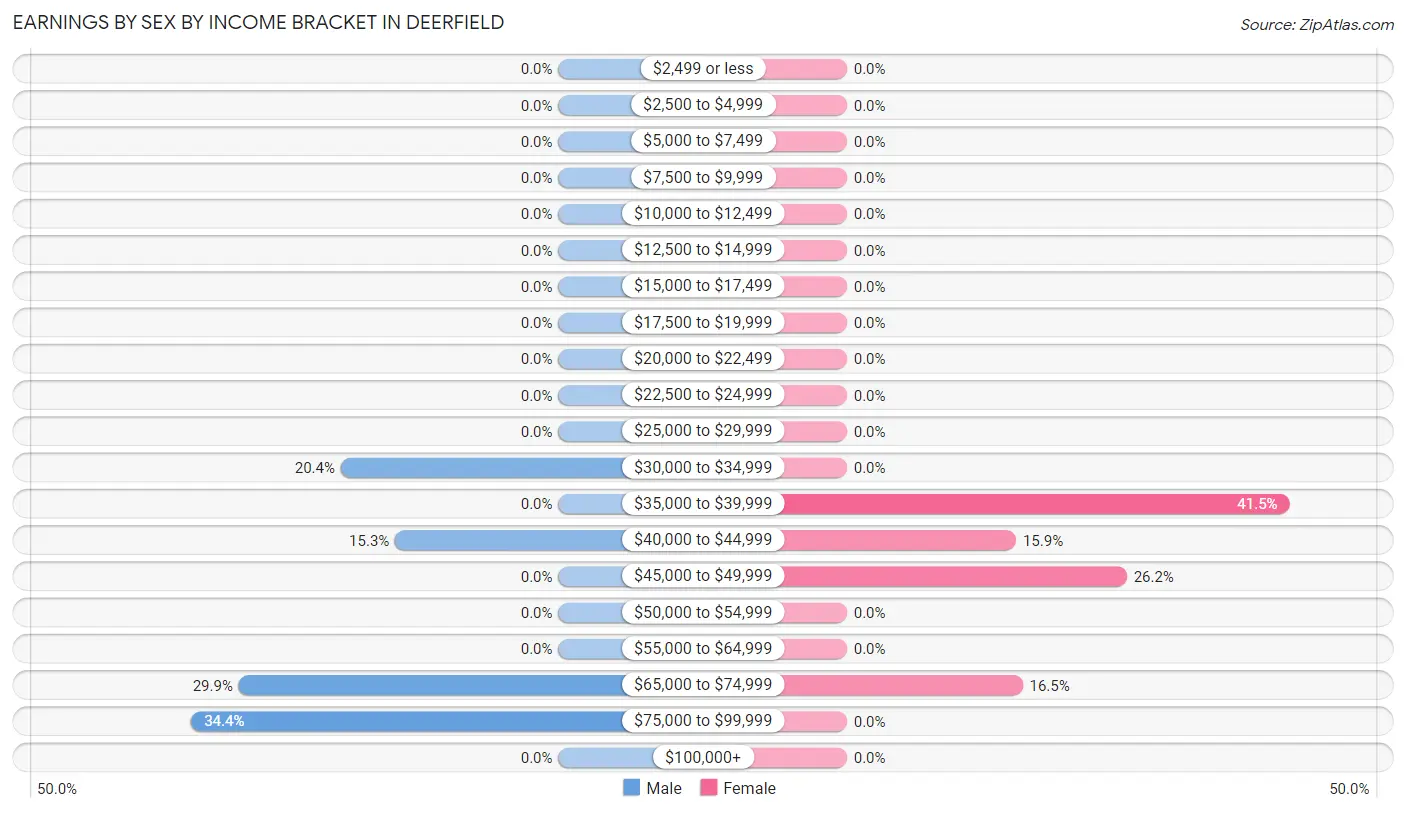
Earnings by Sex by Income Bracket in Deerfield
The most common earnings brackets in Deerfield are $75,000 to $99,999 for men (54 | 34.4%) and $35,000 to $39,999 for women (68 | 41.5%).
| Income | Male | Female |
| $2,499 or less | 0 (0.0%) | 0 (0.0%) |
| $2,500 to $4,999 | 0 (0.0%) | 0 (0.0%) |
| $5,000 to $7,499 | 0 (0.0%) | 0 (0.0%) |
| $7,500 to $9,999 | 0 (0.0%) | 0 (0.0%) |
| $10,000 to $12,499 | 0 (0.0%) | 0 (0.0%) |
| $12,500 to $14,999 | 0 (0.0%) | 0 (0.0%) |
| $15,000 to $17,499 | 0 (0.0%) | 0 (0.0%) |
| $17,500 to $19,999 | 0 (0.0%) | 0 (0.0%) |
| $20,000 to $22,499 | 0 (0.0%) | 0 (0.0%) |
| $22,500 to $24,999 | 0 (0.0%) | 0 (0.0%) |
| $25,000 to $29,999 | 0 (0.0%) | 0 (0.0%) |
| $30,000 to $34,999 | 32 (20.4%) | 0 (0.0%) |
| $35,000 to $39,999 | 0 (0.0%) | 68 (41.5%) |
| $40,000 to $44,999 | 24 (15.3%) | 26 (15.9%) |
| $45,000 to $49,999 | 0 (0.0%) | 43 (26.2%) |
| $50,000 to $54,999 | 0 (0.0%) | 0 (0.0%) |
| $55,000 to $64,999 | 0 (0.0%) | 0 (0.0%) |
| $65,000 to $74,999 | 47 (29.9%) | 27 (16.5%) |
| $75,000 to $99,999 | 54 (34.4%) | 0 (0.0%) |
| $100,000+ | 0 (0.0%) | 0 (0.0%) |
| Total | 157 (100.0%) | 164 (100.0%) |
Earnings by Sex by Educational Attainment in Deerfield
| Educational Attainment | Male Income | Female Income |
| Less than High School | - | - |
| High School Diploma | - | - |
| College or Associate's Degree | - | - |
| Bachelor's Degree | - | - |
| Graduate Degree | - | - |
| Total | $68,697 | $41,346 |
Family Income in Deerfield
Family Income Brackets in Deerfield
According to the Deerfield family income data, there are 24 families falling into the $75,000 to $99,999 income range, which is the most common income bracket and makes up 52.2% of all families.
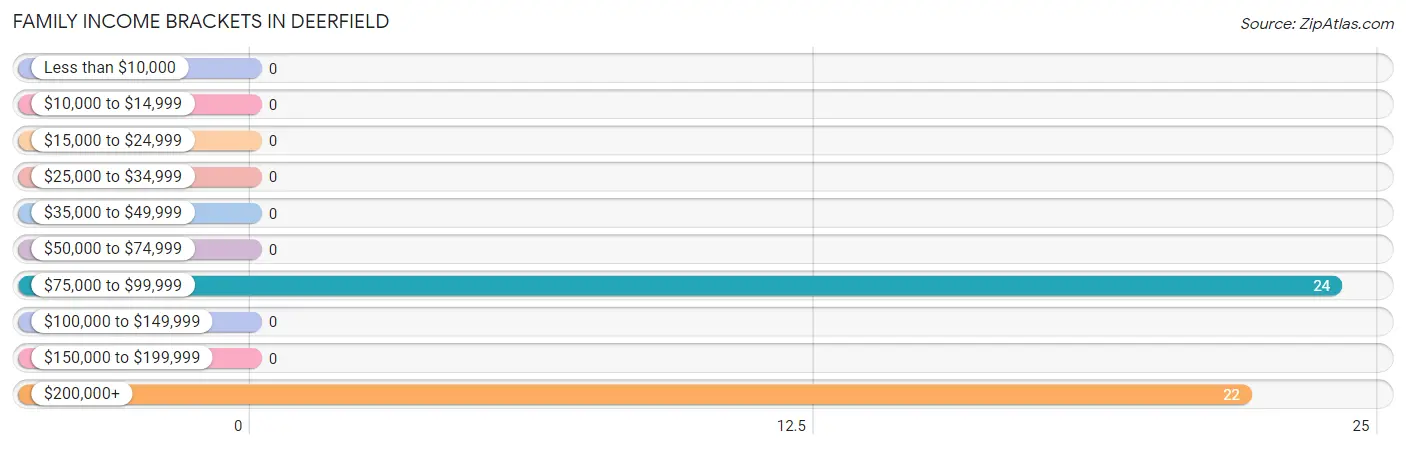
| Income Bracket | # Families | % Families |
| Less than $10,000 | 0 | 0.0% |
| $10,000 to $14,999 | 0 | 0.0% |
| $15,000 to $24,999 | 0 | 0.0% |
| $25,000 to $34,999 | 0 | 0.0% |
| $35,000 to $49,999 | 0 | 0.0% |
| $50,000 to $74,999 | 0 | 0.0% |
| $75,000 to $99,999 | 24 | 52.2% |
| $100,000 to $149,999 | 0 | 0.0% |
| $150,000 to $199,999 | 0 | 0.0% |
| $200,000+ | 22 | 47.8% |
Family Income by Famaliy Size in Deerfield
| Income Bracket | # Families | Median Income |
| 2-Person Families | 24 (52.2%) | $0 |
| 3-Person Families | 0 (0.0%) | $0 |
| 4-Person Families | 22 (47.8%) | $0 |
| 5-Person Families | 0 (0.0%) | $0 |
| 6-Person Families | 0 (0.0%) | $0 |
| 7+ Person Families | 0 (0.0%) | $0 |
| Total | 46 (100.0%) | $0 |
Family Income by Number of Earners in Deerfield
| Number of Earners | # Families | Median Income |
| No Earners | 0 (0.0%) | $0 |
| 1 Earner | 0 (0.0%) | $0 |
| 2 Earners | 24 (52.2%) | $0 |
| 3+ Earners | 22 (47.8%) | $0 |
| Total | 46 (100.0%) | $0 |
Household Income in Deerfield
Household Income Brackets in Deerfield
With 77 households falling in the category, the $35,000 to $49,999 income range is the most frequent in Deerfield, accounting for 45.3% of all households.
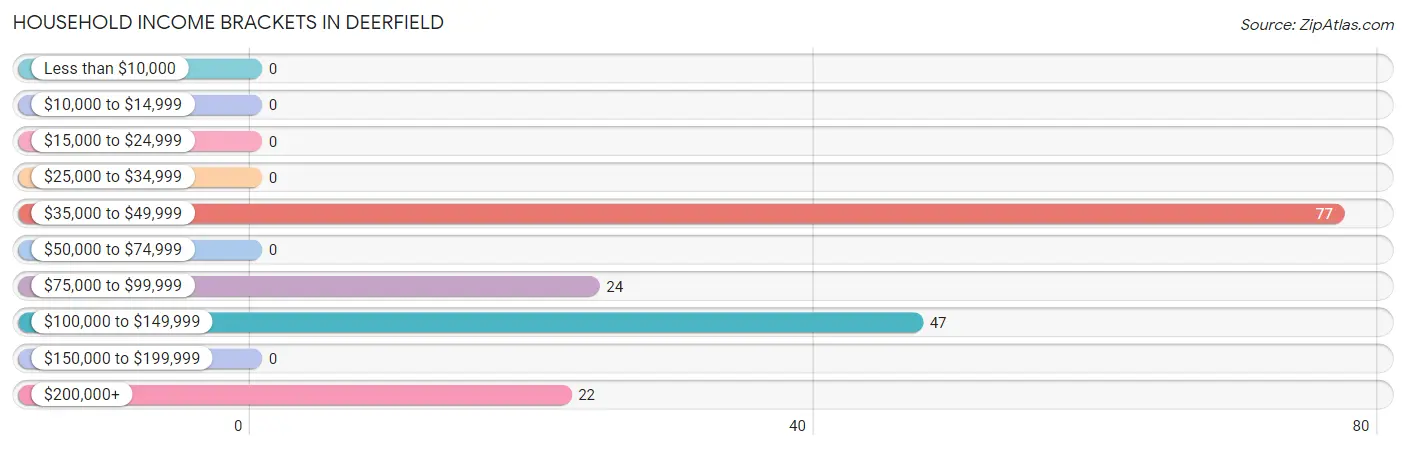
| Income Bracket | # Households | % Households |
| Less than $10,000 | 0 | 0.0% |
| $10,000 to $14,999 | 0 | 0.0% |
| $15,000 to $24,999 | 0 | 0.0% |
| $25,000 to $34,999 | 0 | 0.0% |
| $35,000 to $49,999 | 77 | 45.3% |
| $50,000 to $74,999 | 0 | 0.0% |
| $75,000 to $99,999 | 24 | 14.1% |
| $100,000 to $149,999 | 47 | 27.6% |
| $150,000 to $199,999 | 0 | 0.0% |
| $200,000+ | 22 | 12.9% |
Household Income by Householder Age in Deerfield
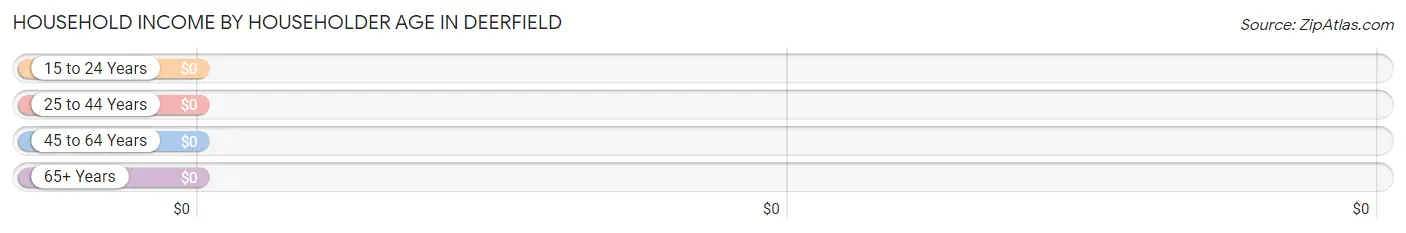
| Income Bracket | # Households | Median Income |
| 15 to 24 Years | 0 (0.0%) | $0 |
| 25 to 44 Years | 47 (27.7%) | $0 |
| 45 to 64 Years | 114 (67.1%) | $0 |
| 65+ Years | 9 (5.3%) | $0 |
| Total | 170 (100.0%) | $0 |
Poverty in Deerfield
Income Below Poverty by Sex and Age in Deerfield
| Age Bracket | Male | Female |
| Under 5 Years | 0 (0.0%) | 0 (0.0%) |
| 5 Years | 0 (0.0%) | 0 (0.0%) |
| 6 to 11 Years | 0 (0.0%) | 0 (0.0%) |
| 12 to 14 Years | 0 (0.0%) | 0 (0.0%) |
| 15 Years | 0 (0.0%) | 0 (0.0%) |
| 16 and 17 Years | 0 (0.0%) | 0 (0.0%) |
| 18 to 24 Years | 0 (0.0%) | 0 (0.0%) |
| 25 to 34 Years | 0 (0.0%) | 0 (0.0%) |
| 35 to 44 Years | 0 (0.0%) | 0 (0.0%) |
| 45 to 54 Years | 0 (0.0%) | 0 (0.0%) |
| 55 to 64 Years | 0 (0.0%) | 0 (0.0%) |
| 65 to 74 Years | 0 (0.0%) | 0 (0.0%) |
| 75 Years and over | 0 (0.0%) | 0 (0.0%) |
| Total | 0 (0.0%) | 0 (0.0%) |
Income Above Poverty by Sex and Age in Deerfield
According to the poverty statistics in Deerfield, males aged 18 to 24 years and females aged 25 to 34 years are the age groups that are most secure financially, with 100.0% of males and 100.0% of females in these age groups living above the poverty line.
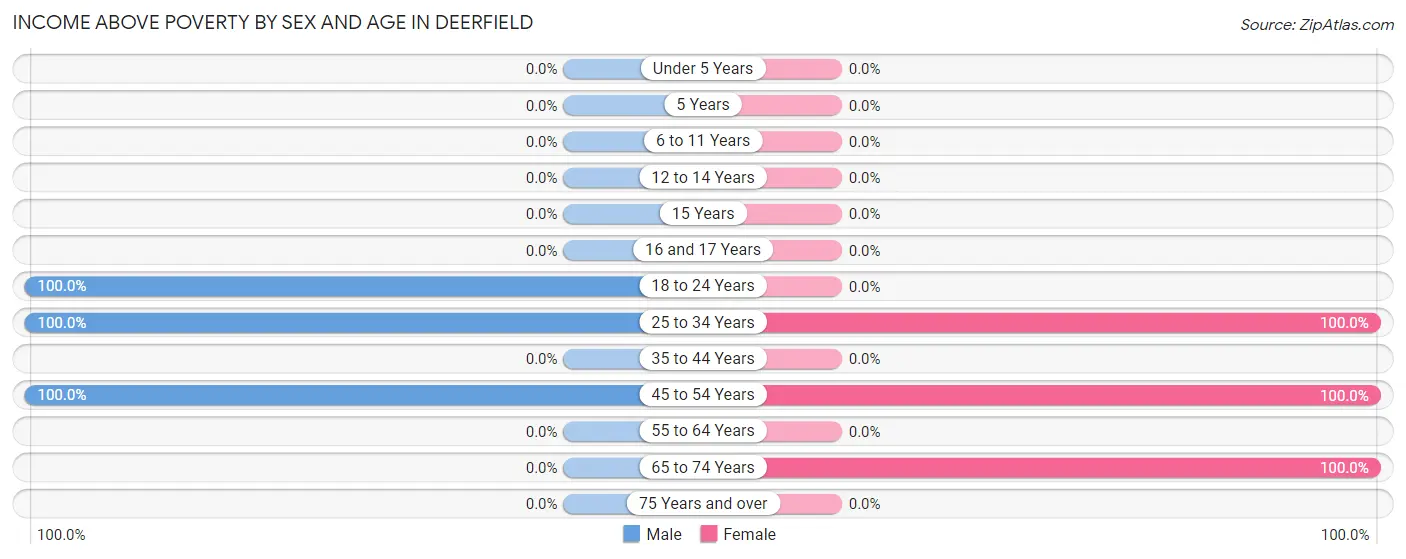
| Age Bracket | Male | Female |
| Under 5 Years | 0 (0.0%) | 0 (0.0%) |
| 5 Years | 0 (0.0%) | 0 (0.0%) |
| 6 to 11 Years | 0 (0.0%) | 0 (0.0%) |
| 12 to 14 Years | 0 (0.0%) | 0 (0.0%) |
| 15 Years | 0 (0.0%) | 0 (0.0%) |
| 16 and 17 Years | 0 (0.0%) | 0 (0.0%) |
| 18 to 24 Years | 64 (100.0%) | 0 (0.0%) |
| 25 to 34 Years | 47 (100.0%) | 70 (100.0%) |
| 35 to 44 Years | 0 (0.0%) | 0 (0.0%) |
| 45 to 54 Years | 46 (100.0%) | 115 (100.0%) |
| 55 to 64 Years | 0 (0.0%) | 0 (0.0%) |
| 65 to 74 Years | 0 (0.0%) | 9 (100.0%) |
| 75 Years and over | 0 (0.0%) | 0 (0.0%) |
| Total | 157 (100.0%) | 194 (100.0%) |
Income Below Poverty Among Married-Couple Families in Deerfield
| Children | Above Poverty | Below Poverty |
| No Children | 46 (100.0%) | 0 (0.0%) |
| 1 or 2 Children | 0 (0.0%) | 0 (0.0%) |
| 3 or 4 Children | 0 (0.0%) | 0 (0.0%) |
| 5 or more Children | 0 (0.0%) | 0 (0.0%) |
| Total | 46 (100.0%) | 0 (0.0%) |
Income Below Poverty Among Single-Parent Households in Deerfield
| Children | Single Father | Single Mother |
| No Children | 0 (0.0%) | 0 (0.0%) |
| 1 or 2 Children | 0 (0.0%) | 0 (0.0%) |
| 3 or 4 Children | 0 (0.0%) | 0 (0.0%) |
| 5 or more Children | 0 (0.0%) | 0 (0.0%) |
| Total | 0 (0.0%) | 0 (0.0%) |
Income Below Poverty Among Married-Couple vs Single-Parent Households in Deerfield
| Children | Married-Couple Families | Single-Parent Households |
| No Children | 0 (0.0%) | 0 (0.0%) |
| 1 or 2 Children | 0 (0.0%) | 0 (0.0%) |
| 3 or 4 Children | 0 (0.0%) | 0 (0.0%) |
| 5 or more Children | 0 (0.0%) | 0 (0.0%) |
| Total | 0 (0.0%) | 0 (0.0%) |
Race in Deerfield
The most populous races in Deerfield are , and White / Caucasian (351 | 100.0%).
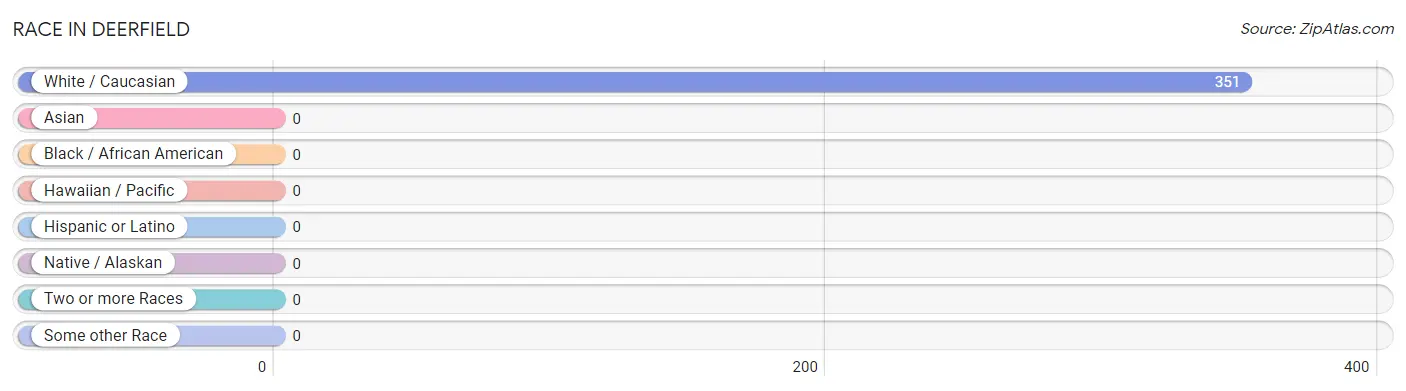
| Race | # Population | % Population |
| Asian | 0 | 0.0% |
| Black / African American | 0 | 0.0% |
| Hawaiian / Pacific | 0 | 0.0% |
| Hispanic or Latino | 0 | 0.0% |
| Native / Alaskan | 0 | 0.0% |
| White / Caucasian | 351 | 100.0% |
| Two or more Races | 0 | 0.0% |
| Some other Race | 0 | 0.0% |
| Total | 351 | 100.0% |
Ancestry in Deerfield
The most populous ancestries reported in Deerfield are Scotch-Irish (68 | 19.4%), and American (9 | 2.6%), together accounting for 21.9% of all Deerfield residents.
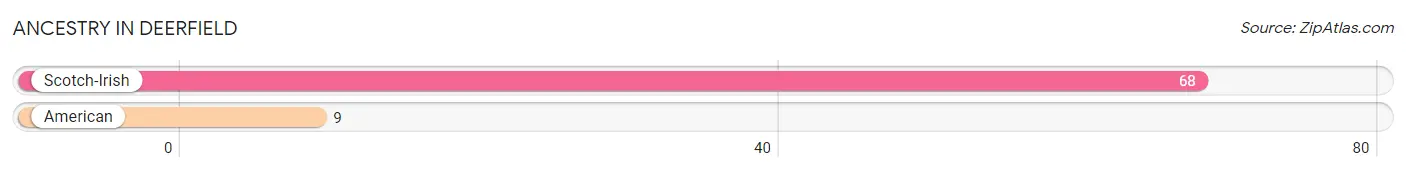
| Ancestry | # Population | % Population |
| American | 9 | 2.6% |
| Scotch-Irish | 68 | 19.4% | View All 2 Rows |
Immigrants in Deerfield

| Immigration Origin | # Population | % Population | View All 0 Rows |
Sex and Age in Deerfield
Sex and Age in Deerfield
The most populous age groups in Deerfield are 20 to 24 Years (64 | 40.8%) for men and 45 to 49 Years (94 | 48.4%) for women.
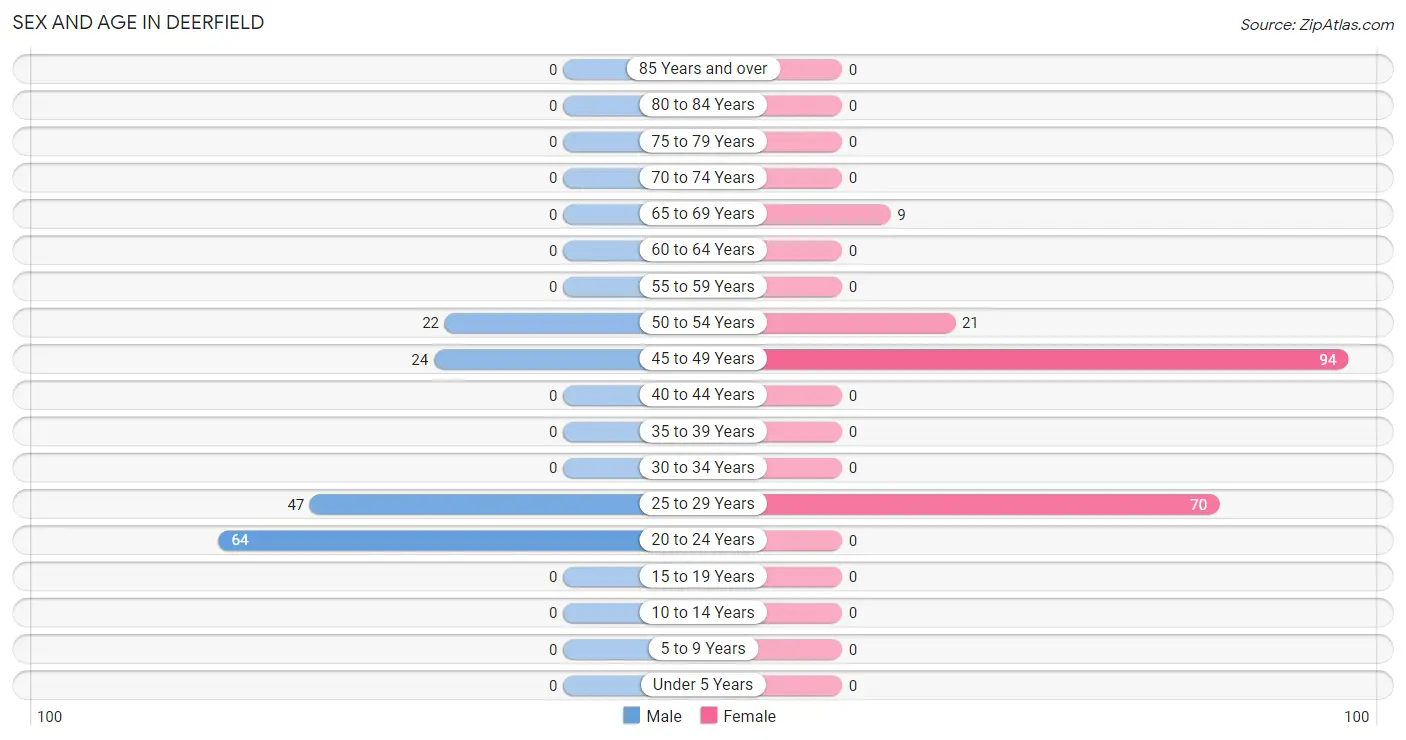
| Age Bracket | Male | Female |
| Under 5 Years | 0 (0.0%) | 0 (0.0%) |
| 5 to 9 Years | 0 (0.0%) | 0 (0.0%) |
| 10 to 14 Years | 0 (0.0%) | 0 (0.0%) |
| 15 to 19 Years | 0 (0.0%) | 0 (0.0%) |
| 20 to 24 Years | 64 (40.8%) | 0 (0.0%) |
| 25 to 29 Years | 47 (29.9%) | 70 (36.1%) |
| 30 to 34 Years | 0 (0.0%) | 0 (0.0%) |
| 35 to 39 Years | 0 (0.0%) | 0 (0.0%) |
| 40 to 44 Years | 0 (0.0%) | 0 (0.0%) |
| 45 to 49 Years | 24 (15.3%) | 94 (48.4%) |
| 50 to 54 Years | 22 (14.0%) | 21 (10.8%) |
| 55 to 59 Years | 0 (0.0%) | 0 (0.0%) |
| 60 to 64 Years | 0 (0.0%) | 0 (0.0%) |
| 65 to 69 Years | 0 (0.0%) | 9 (4.6%) |
| 70 to 74 Years | 0 (0.0%) | 0 (0.0%) |
| 75 to 79 Years | 0 (0.0%) | 0 (0.0%) |
| 80 to 84 Years | 0 (0.0%) | 0 (0.0%) |
| 85 Years and over | 0 (0.0%) | 0 (0.0%) |
| Total | 157 (100.0%) | 194 (100.0%) |
Families and Households in Deerfield
Median Family Size in Deerfield
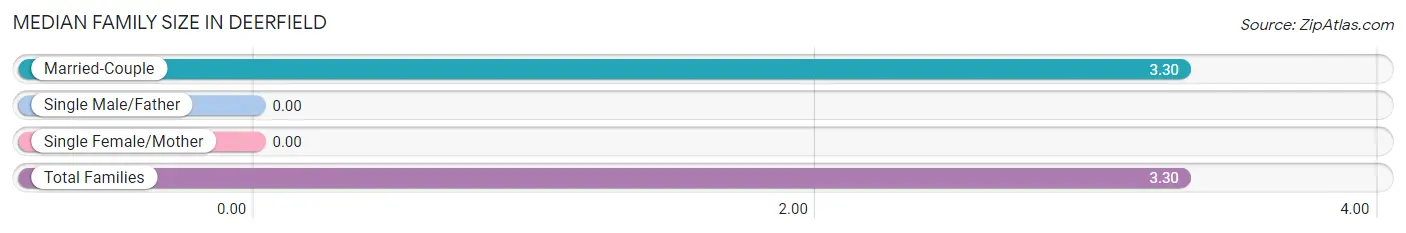
| Family Type | # Families | Family Size |
| Married-Couple | 46 (100.0%) | 3.30 |
| Single Male/Father | 0 (0.0%) | - |
| Single Female/Mother | 0 (0.0%) | - |
| Total Families | 46 (100.0%) | 3.30 |
Median Household Size in Deerfield
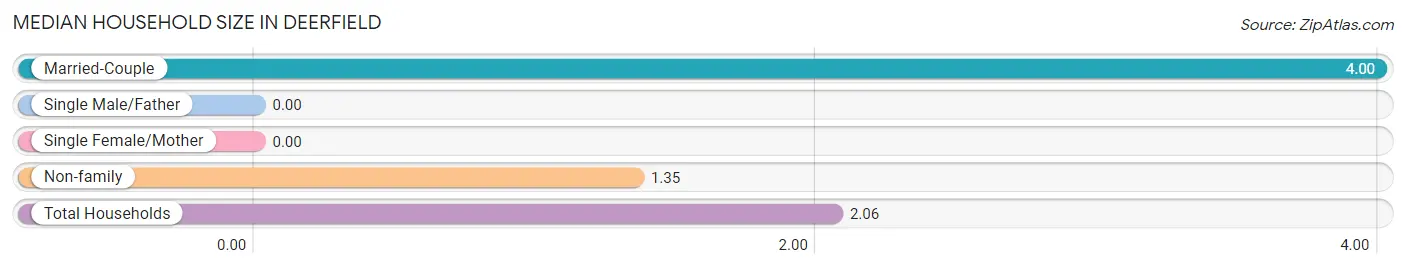
| Household Type | # Households | Household Size |
| Married-Couple | 46 (27.1%) | 4.00 |
| Single Male/Father | 0 (0.0%) | - |
| Single Female/Mother | 0 (0.0%) | - |
| Non-family | 124 (72.9%) | 1.35 |
| Total Households | 170 (100.0%) | 2.06 |
Household Size by Marriage Status in Deerfield
Out of a total of 170 households in Deerfield, 46 (27.1%) are family households, while 124 (72.9%) are nonfamily households. The most numerous type of family households are 2-person households, comprising 24, and the most common type of nonfamily households are 1-person households, comprising 77.
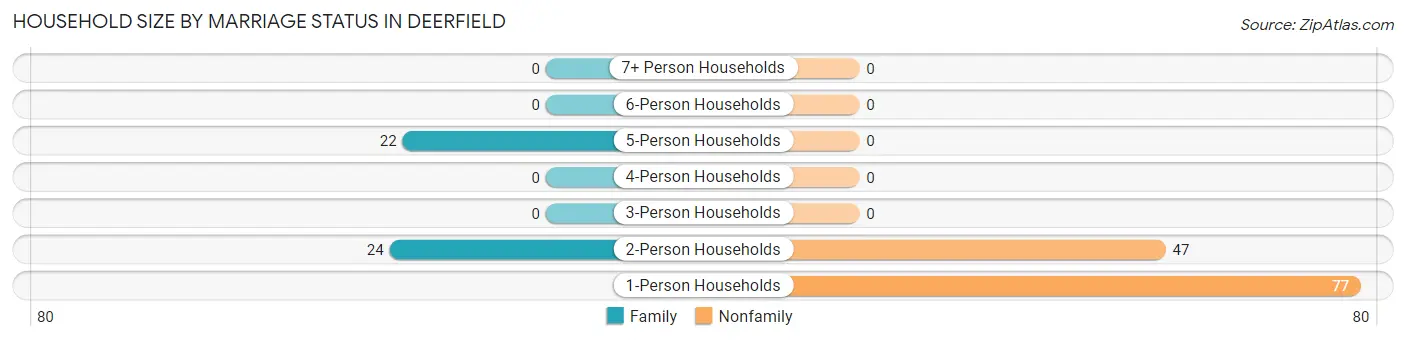
| Household Size | Family Households | Nonfamily Households |
| 1-Person Households | - | 77 (45.3%) |
| 2-Person Households | 24 (14.1%) | 47 (27.7%) |
| 3-Person Households | 0 (0.0%) | 0 (0.0%) |
| 4-Person Households | 0 (0.0%) | 0 (0.0%) |
| 5-Person Households | 22 (12.9%) | 0 (0.0%) |
| 6-Person Households | 0 (0.0%) | 0 (0.0%) |
| 7+ Person Households | 0 (0.0%) | 0 (0.0%) |
| Total | 46 (27.1%) | 124 (72.9%) |
Female Fertility in Deerfield
Fertility by Age in Deerfield
| Age Bracket | Women with Births | Births / 1,000 Women |
| 15 to 19 years | 0 (0.0%) | 0.0 |
| 20 to 34 years | 0 (0.0%) | 0.0 |
| 35 to 50 years | 0 (0.0%) | 0.0 |
| Total | 0 (0.0%) | 0.0 |
Fertility by Age by Marriage Status in Deerfield
| Age Bracket | Married | Unmarried |
| 15 to 19 years | 0 (0.0%) | 0 (0.0%) |
| 20 to 34 years | 0 (0.0%) | 0 (0.0%) |
| 35 to 50 years | 0 (0.0%) | 0 (0.0%) |
| Total | 0 (0.0%) | 0 (0.0%) |
Fertility by Education in Deerfield
| Educational Attainment | Women with Births | Births / 1,000 Women |
| Less than High School | 0 (0.0%) | 0.0 |
| High School Diploma | 0 (0.0%) | 0.0 |
| College or Associate's Degree | 0 (0.0%) | 0.0 |
| Bachelor's Degree | 0 (0.0%) | 0.0 |
| Graduate Degree | 0 (0.0%) | 0.0 |
| Total | 0 (0.0%) | 0.0 |
Fertility by Education by Marriage Status in Deerfield
| Educational Attainment | Married | Unmarried |
| Less than High School | 0 (0.0%) | 0 (0.0%) |
| High School Diploma | 0 (0.0%) | 0 (0.0%) |
| College or Associate's Degree | 0 (0.0%) | 0 (0.0%) |
| Bachelor's Degree | 0 (0.0%) | 0 (0.0%) |
| Graduate Degree | 0 (0.0%) | 0 (0.0%) |
| Total | 0 (0.0%) | 0 (0.0%) |
Employment Characteristics in Deerfield
Employment by Class of Employer in Deerfield
Among the 321 employed individuals in Deerfield, private company employees (295 | 91.9%), and state government employees (26 | 8.1%) make up the most common classes of employment.
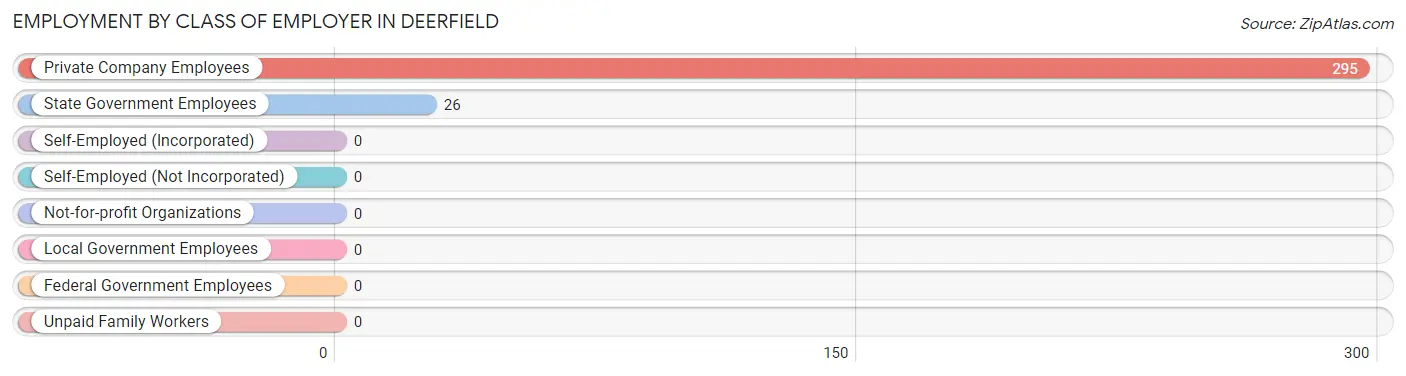
| Employer Class | # Employees | % Employees |
| Private Company Employees | 295 | 91.9% |
| Self-Employed (Incorporated) | 0 | 0.0% |
| Self-Employed (Not Incorporated) | 0 | 0.0% |
| Not-for-profit Organizations | 0 | 0.0% |
| Local Government Employees | 0 | 0.0% |
| State Government Employees | 26 | 8.1% |
| Federal Government Employees | 0 | 0.0% |
| Unpaid Family Workers | 0 | 0.0% |
| Total | 321 | 100.0% |
Employment Status by Age in Deerfield
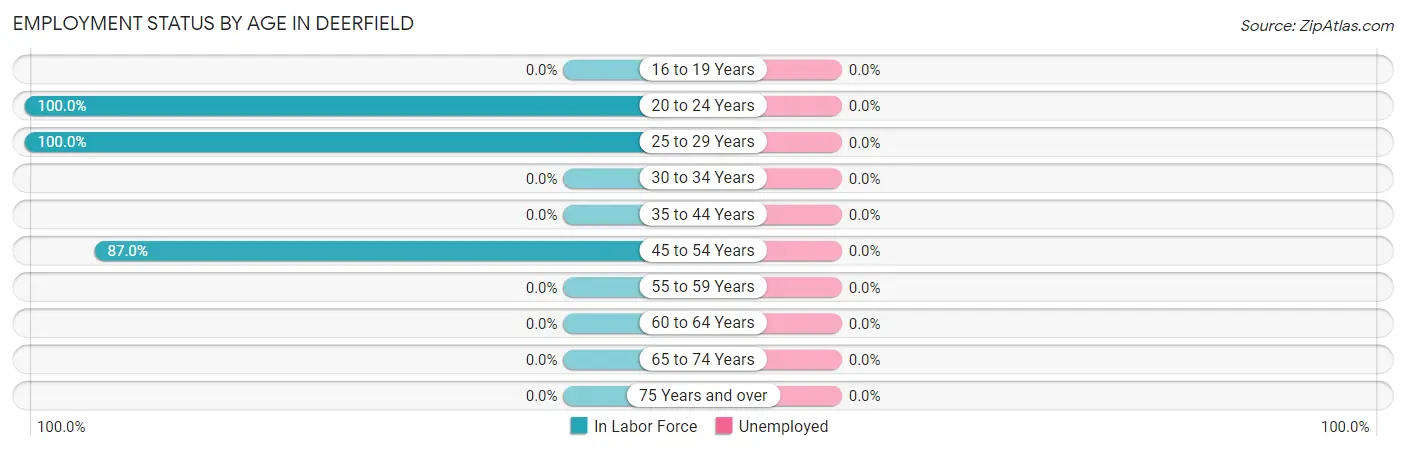
| Age Bracket | In Labor Force | Unemployed |
| 16 to 19 Years | 0 (0.0%) | 0 (0.0%) |
| 20 to 24 Years | 64 (100.0%) | 0 (0.0%) |
| 25 to 29 Years | 117 (100.0%) | 0 (0.0%) |
| 30 to 34 Years | 0 (0.0%) | 0 (0.0%) |
| 35 to 44 Years | 0 (0.0%) | 0 (0.0%) |
| 45 to 54 Years | 140 (87.0%) | 0 (0.0%) |
| 55 to 59 Years | 0 (0.0%) | 0 (0.0%) |
| 60 to 64 Years | 0 (0.0%) | 0 (0.0%) |
| 65 to 74 Years | 0 (0.0%) | 0 (0.0%) |
| 75 Years and over | 0 (0.0%) | 0 (0.0%) |
| Total | 321 (91.5%) | 0 (0.0%) |
Employment Status by Educational Attainment in Deerfield
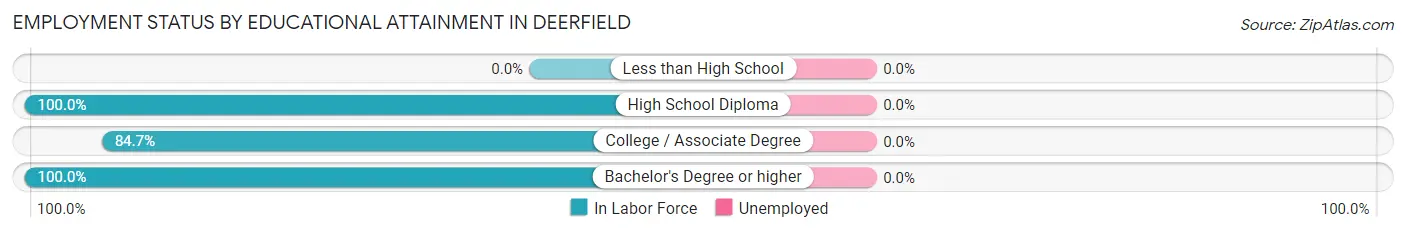
| Educational Attainment | In Labor Force | Unemployed |
| Less than High School | 0 (0.0%) | 0 (0.0%) |
| High School Diploma | 71 (100.0%) | 0 (0.0%) |
| College / Associate Degree | 116 (84.7%) | 0 (0.0%) |
| Bachelor's Degree or higher | 70 (100.0%) | 0 (0.0%) |
| Total | 257 (92.4%) | 0 (0.0%) |
Employment Occupations by Sex in Deerfield
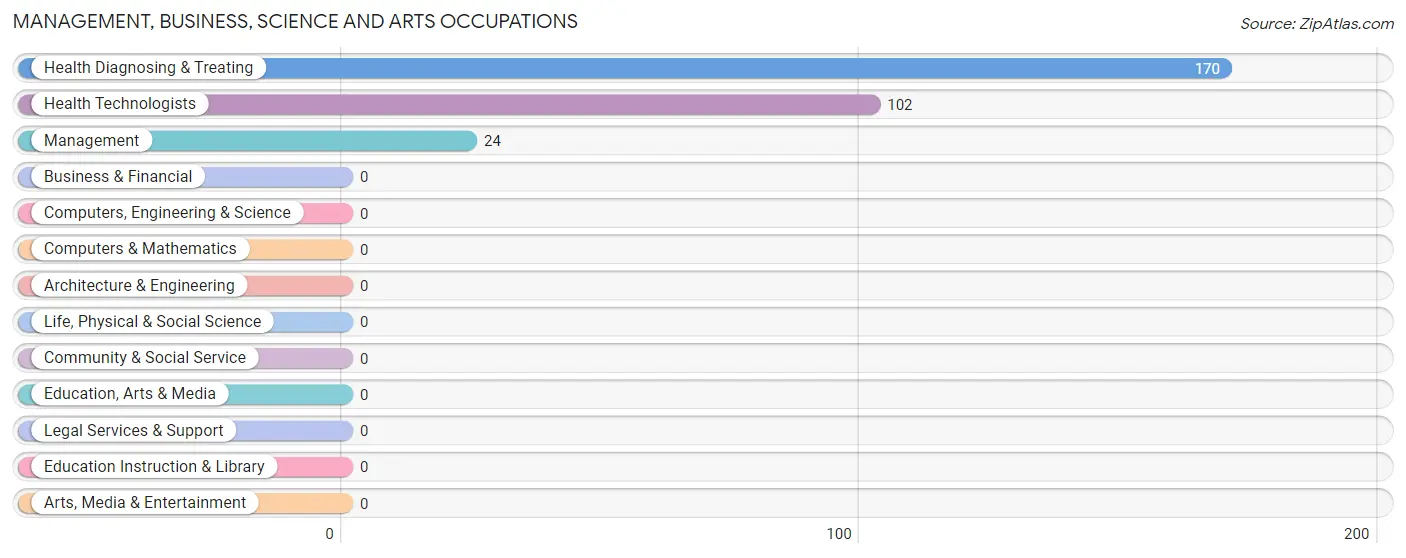
Management, Business, Science and Arts Occupations
The most common Management, Business, Science and Arts occupations in Deerfield are Health Diagnosing & Treating (170 | 53.0%), Health Technologists (102 | 31.8%), and Management (24 | 7.5%).
Management, Business, Science and Arts Occupations by Sex
Within the Management, Business, Science and Arts occupations in Deerfield, the most male-oriented occupations are Management (100.0%), Health Technologists (31.4%), and Health Diagnosing & Treating (18.8%), while the most female-oriented occupations are Health Diagnosing & Treating (81.2%), and Health Technologists (68.6%).
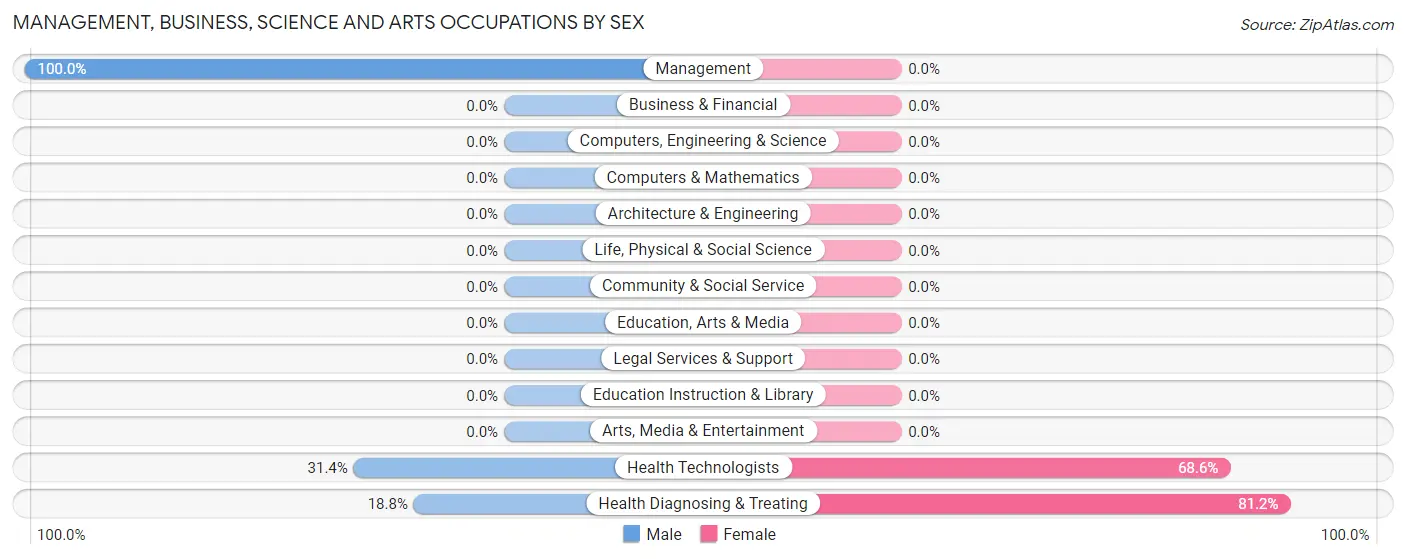
| Occupation | Male | Female |
| Management | 24 (100.0%) | 0 (0.0%) |
| Business & Financial | 0 (0.0%) | 0 (0.0%) |
| Computers, Engineering & Science | 0 (0.0%) | 0 (0.0%) |
| Computers & Mathematics | 0 (0.0%) | 0 (0.0%) |
| Architecture & Engineering | 0 (0.0%) | 0 (0.0%) |
| Life, Physical & Social Science | 0 (0.0%) | 0 (0.0%) |
| Community & Social Service | 0 (0.0%) | 0 (0.0%) |
| Education, Arts & Media | 0 (0.0%) | 0 (0.0%) |
| Legal Services & Support | 0 (0.0%) | 0 (0.0%) |
| Education Instruction & Library | 0 (0.0%) | 0 (0.0%) |
| Arts, Media & Entertainment | 0 (0.0%) | 0 (0.0%) |
| Health Diagnosing & Treating | 32 (18.8%) | 138 (81.2%) |
| Health Technologists | 32 (31.4%) | 70 (68.6%) |
| Total (Category) | 56 (28.9%) | 138 (71.1%) |
| Total (Overall) | 157 (48.9%) | 164 (51.1%) |
Services Occupations
Services Occupations by Sex
| Occupation | Male | Female |
| Healthcare Support | 0 (0.0%) | 0 (0.0%) |
| Security & Protection | 0 (0.0%) | 0 (0.0%) |
| Firefighting & Prevention | 0 (0.0%) | 0 (0.0%) |
| Law Enforcement | 0 (0.0%) | 0 (0.0%) |
| Food Preparation & Serving | 0 (0.0%) | 0 (0.0%) |
| Cleaning & Maintenance | 0 (0.0%) | 0 (0.0%) |
| Personal Care & Service | 0 (0.0%) | 0 (0.0%) |
| Total (Category) | 0 (0.0%) | 0 (0.0%) |
| Total (Overall) | 157 (48.9%) | 164 (51.1%) |
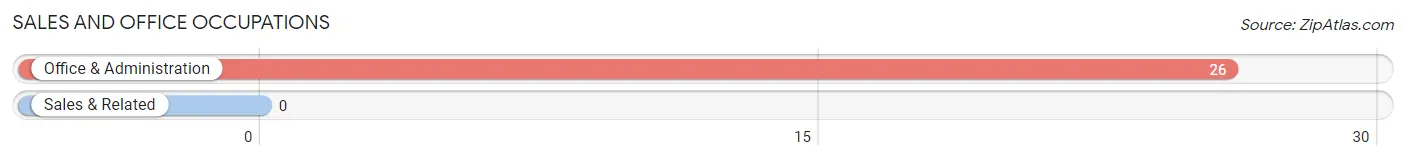
Sales and Office Occupations
The most common Sales and Office occupations in Deerfield are , and Office & Administration (26 | 8.1%).
Sales and Office Occupations by Sex
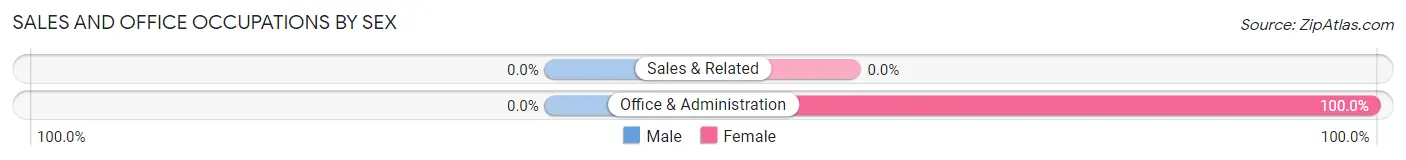
| Occupation | Male | Female |
| Sales & Related | 0 (0.0%) | 0 (0.0%) |
| Office & Administration | 0 (0.0%) | 26 (100.0%) |
| Total (Category) | 0 (0.0%) | 26 (100.0%) |
| Total (Overall) | 157 (48.9%) | 164 (51.1%) |
Natural Resources, Construction and Maintenance Occupations
The most common Natural Resources, Construction and Maintenance occupations in Deerfield are , and Installation, Maintenance & Repair (79 | 24.6%).
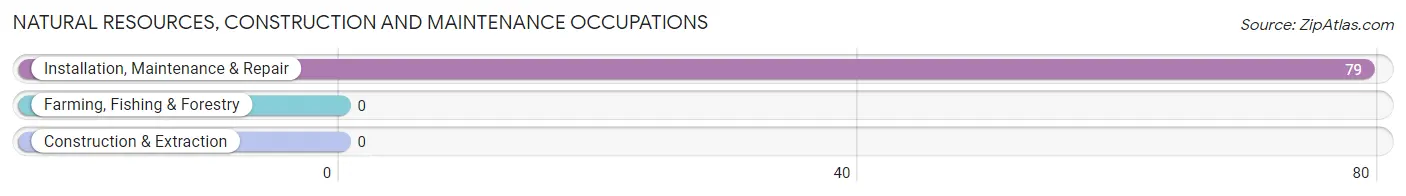
Natural Resources, Construction and Maintenance Occupations by Sex
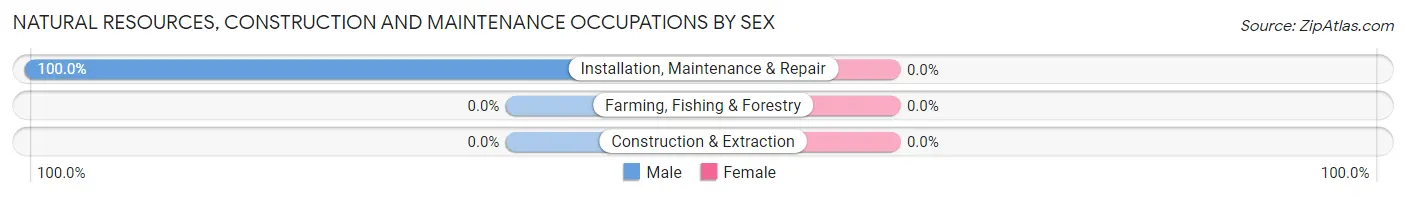
| Occupation | Male | Female |
| Farming, Fishing & Forestry | 0 (0.0%) | 0 (0.0%) |
| Construction & Extraction | 0 (0.0%) | 0 (0.0%) |
| Installation, Maintenance & Repair | 79 (100.0%) | 0 (0.0%) |
| Total (Category) | 79 (100.0%) | 0 (0.0%) |
| Total (Overall) | 157 (48.9%) | 164 (51.1%) |
Production, Transportation and Moving Occupations
The most common Production, Transportation and Moving occupations in Deerfield are , and Production (22 | 6.9%).
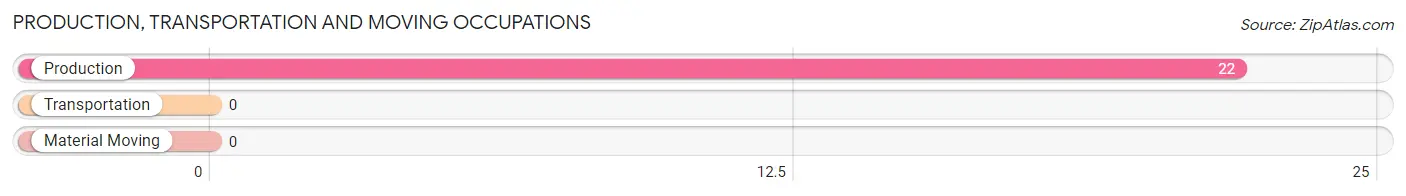
Production, Transportation and Moving Occupations by Sex
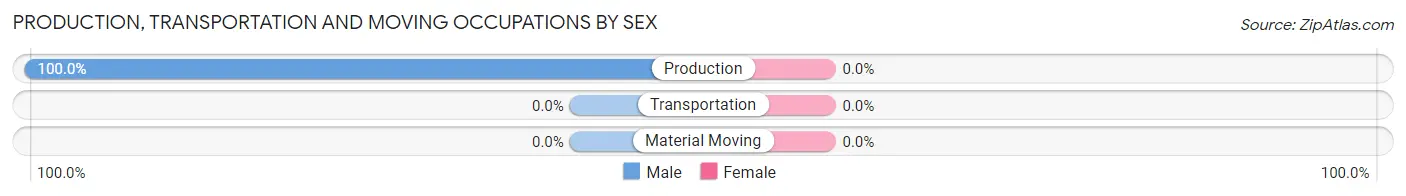
| Occupation | Male | Female |
| Production | 22 (100.0%) | 0 (0.0%) |
| Transportation | 0 (0.0%) | 0 (0.0%) |
| Material Moving | 0 (0.0%) | 0 (0.0%) |
| Total (Category) | 22 (100.0%) | 0 (0.0%) |
| Total (Overall) | 157 (48.9%) | 164 (51.1%) |
Employment Industries by Sex in Deerfield
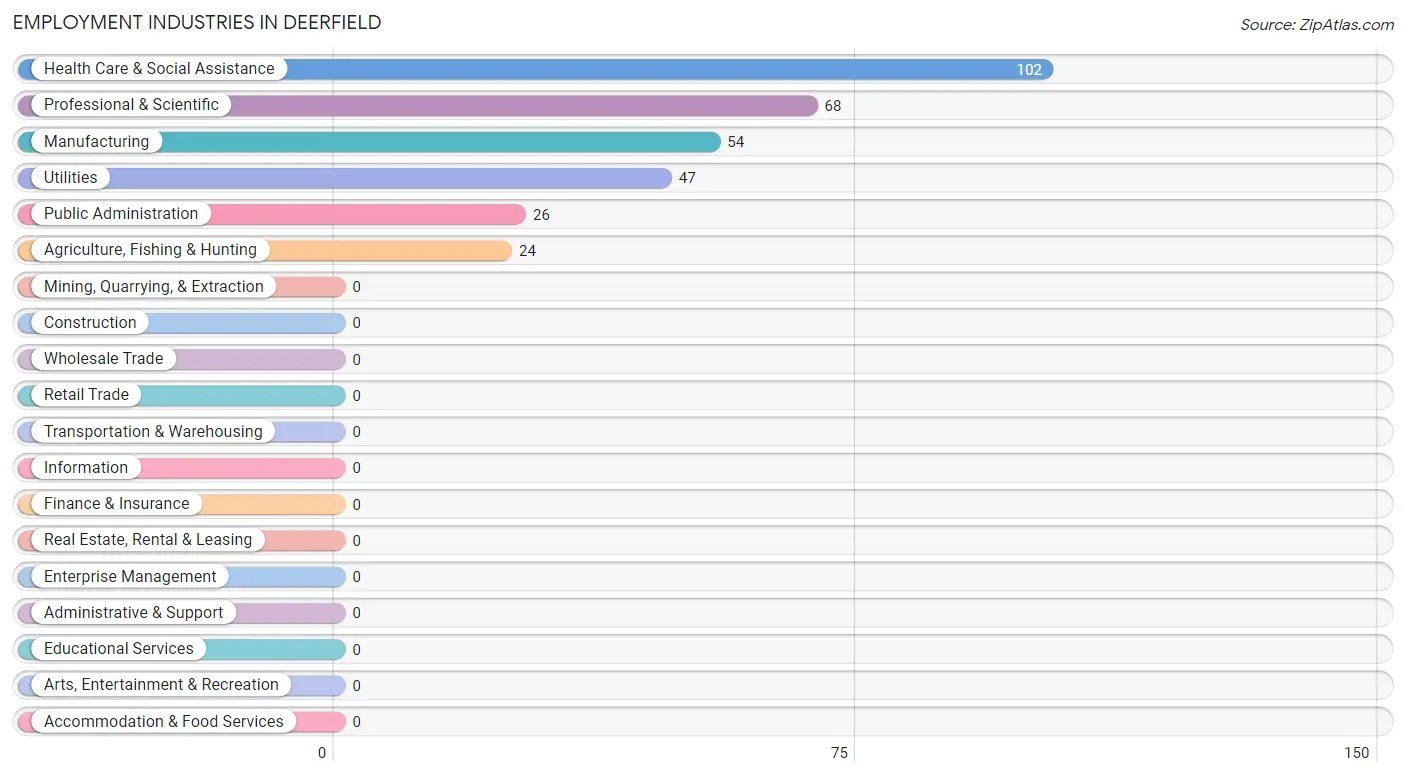
Employment Industries in Deerfield
The major employment industries in Deerfield include Health Care & Social Assistance (102 | 31.8%), Professional & Scientific (68 | 21.2%), Manufacturing (54 | 16.8%), Utilities (47 | 14.6%), and Public Administration (26 | 8.1%).
Employment Industries by Sex in Deerfield
The Deerfield industries that see more men than women are Agriculture, Fishing & Hunting (100.0%), Manufacturing (100.0%), and Utilities (100.0%), whereas the industries that tend to have a higher number of women are Professional & Scientific (100.0%), Public Administration (100.0%), and Health Care & Social Assistance (68.6%).

| Industry | Male | Female |
| Agriculture, Fishing & Hunting | 24 (100.0%) | 0 (0.0%) |
| Mining, Quarrying, & Extraction | 0 (0.0%) | 0 (0.0%) |
| Construction | 0 (0.0%) | 0 (0.0%) |
| Manufacturing | 54 (100.0%) | 0 (0.0%) |
| Wholesale Trade | 0 (0.0%) | 0 (0.0%) |
| Retail Trade | 0 (0.0%) | 0 (0.0%) |
| Transportation & Warehousing | 0 (0.0%) | 0 (0.0%) |
| Utilities | 47 (100.0%) | 0 (0.0%) |
| Information | 0 (0.0%) | 0 (0.0%) |
| Finance & Insurance | 0 (0.0%) | 0 (0.0%) |
| Real Estate, Rental & Leasing | 0 (0.0%) | 0 (0.0%) |
| Professional & Scientific | 0 (0.0%) | 68 (100.0%) |
| Enterprise Management | 0 (0.0%) | 0 (0.0%) |
| Administrative & Support | 0 (0.0%) | 0 (0.0%) |
| Educational Services | 0 (0.0%) | 0 (0.0%) |
| Health Care & Social Assistance | 32 (31.4%) | 70 (68.6%) |
| Arts, Entertainment & Recreation | 0 (0.0%) | 0 (0.0%) |
| Accommodation & Food Services | 0 (0.0%) | 0 (0.0%) |
| Public Administration | 0 (0.0%) | 26 (100.0%) |
| Total | 157 (48.9%) | 164 (51.1%) |
Education in Deerfield
School Enrollment in Deerfield
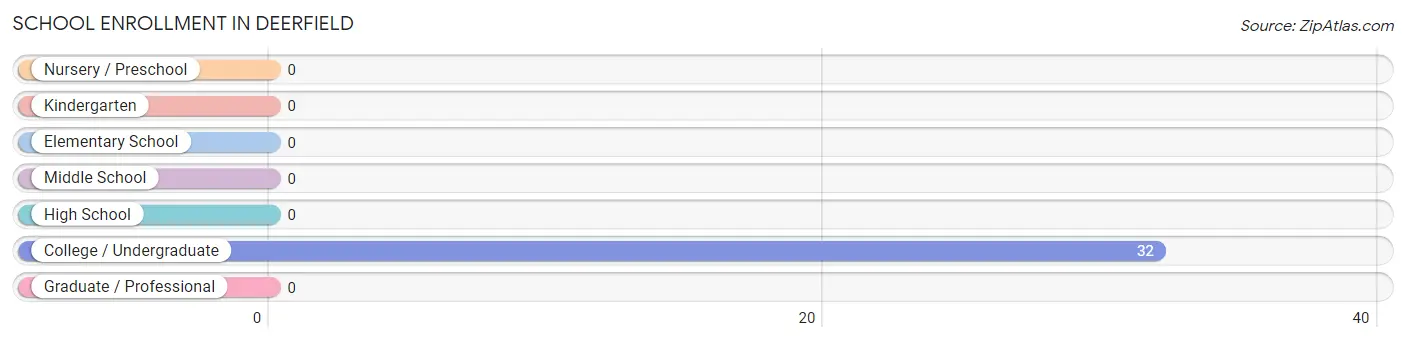
| School Level | # Students | % Students |
| Nursery / Preschool | 0 | 0.0% |
| Kindergarten | 0 | 0.0% |
| Elementary School | 0 | 0.0% |
| Middle School | 0 | 0.0% |
| High School | 0 | 0.0% |
| College / Undergraduate | 32 | 100.0% |
| Graduate / Professional | 0 | 0.0% |
| Total | 32 | 100.0% |
School Enrollment by Age by Funding Source in Deerfield
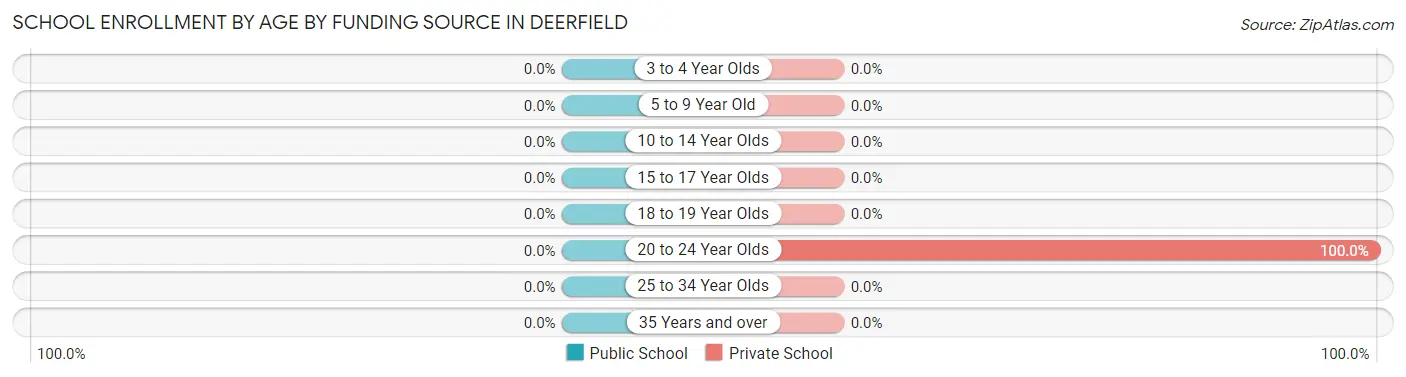
| Age Bracket | Public School | Private School |
| 3 to 4 Year Olds | 0 (0.0%) | 0 (0.0%) |
| 5 to 9 Year Old | 0 (0.0%) | 0 (0.0%) |
| 10 to 14 Year Olds | 0 (0.0%) | 0 (0.0%) |
| 15 to 17 Year Olds | 0 (0.0%) | 0 (0.0%) |
| 18 to 19 Year Olds | 0 (0.0%) | 0 (0.0%) |
| 20 to 24 Year Olds | 0 (0.0%) | 32 (100.0%) |
| 25 to 34 Year Olds | 0 (0.0%) | 0 (0.0%) |
| 35 Years and over | 0 (0.0%) | 0 (0.0%) |
| Total | 0 (0.0%) | 32 (100.0%) |
Educational Attainment by Field of Study in Deerfield
, and science & technology (70 | 100.0%) are the most common fields of study among 70 individuals in Deerfield who have obtained a bachelor's degree or higher.
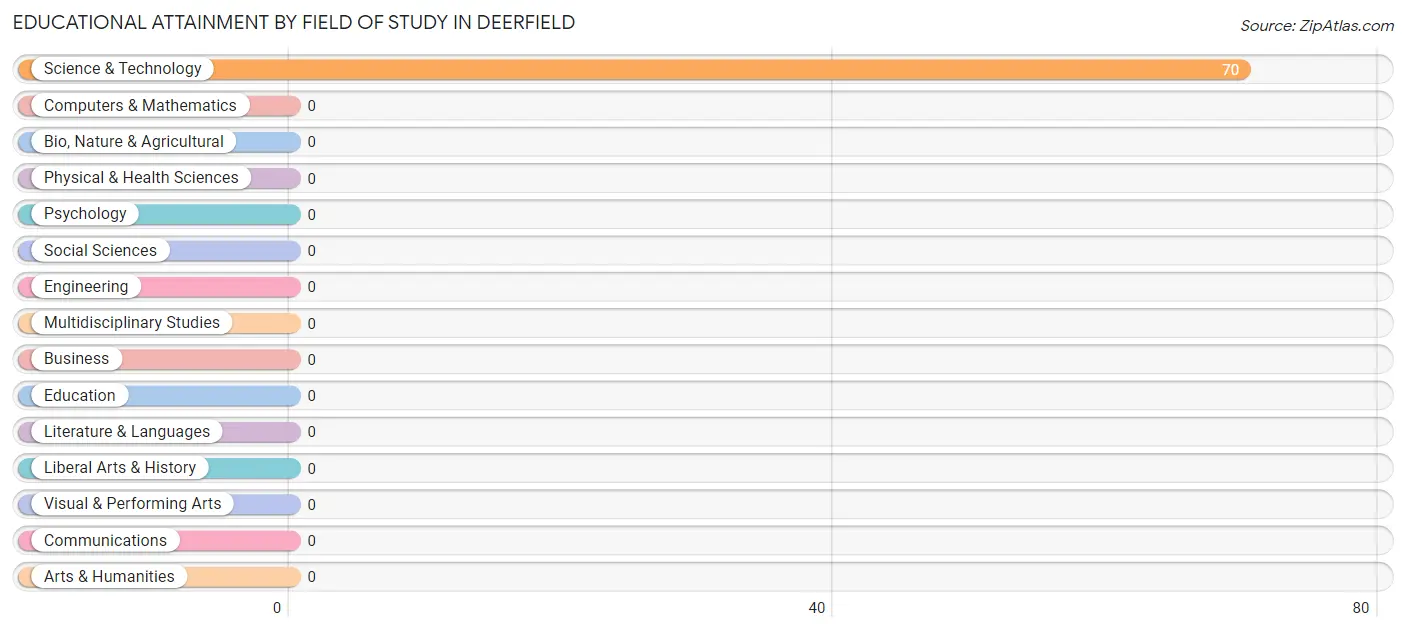
| Field of Study | # Graduates | % Graduates |
| Computers & Mathematics | 0 | 0.0% |
| Bio, Nature & Agricultural | 0 | 0.0% |
| Physical & Health Sciences | 0 | 0.0% |
| Psychology | 0 | 0.0% |
| Social Sciences | 0 | 0.0% |
| Engineering | 0 | 0.0% |
| Multidisciplinary Studies | 0 | 0.0% |
| Science & Technology | 70 | 100.0% |
| Business | 0 | 0.0% |
| Education | 0 | 0.0% |
| Literature & Languages | 0 | 0.0% |
| Liberal Arts & History | 0 | 0.0% |
| Visual & Performing Arts | 0 | 0.0% |
| Communications | 0 | 0.0% |
| Arts & Humanities | 0 | 0.0% |
| Total | 70 | 100.0% |
Transportation & Commute in Deerfield
Vehicle Availability by Sex in Deerfield
The most prevalent vehicle ownership categories in Deerfield are males with 5 or more vehicles (133, accounting for 84.7%) and females with 5 or more vehicles (70, making up 81.1%).
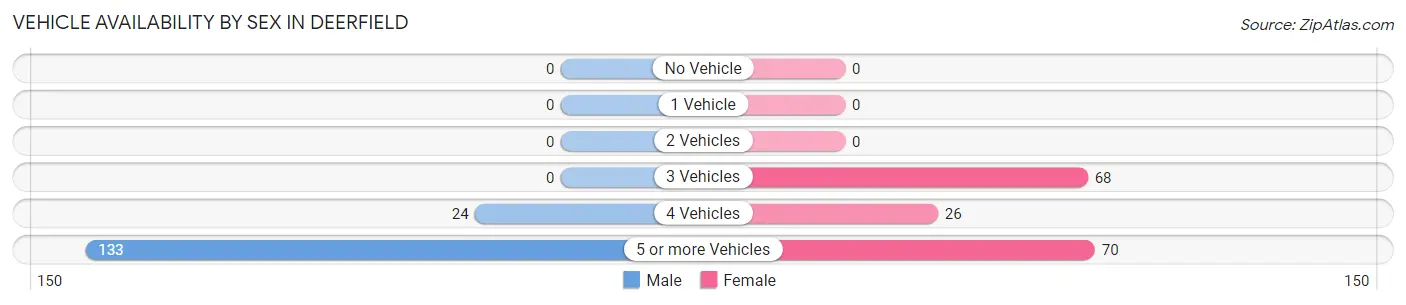
| Vehicles Available | Male | Female |
| No Vehicle | 0 (0.0%) | 0 (0.0%) |
| 1 Vehicle | 0 (0.0%) | 0 (0.0%) |
| 2 Vehicles | 0 (0.0%) | 0 (0.0%) |
| 3 Vehicles | 0 (0.0%) | 68 (41.5%) |
| 4 Vehicles | 24 (15.3%) | 26 (15.9%) |
| 5 or more Vehicles | 133 (84.7%) | 70 (42.7%) |
| Total | 157 (100.0%) | 164 (100.0%) |
Commute Time in Deerfield
The most frequently occuring commute durations in Deerfield are 45 to 59 minutes (170 commuters, 53.0%), 40 to 44 minutes (95 commuters, 29.6%), and 35 to 39 minutes (32 commuters, 10.0%).
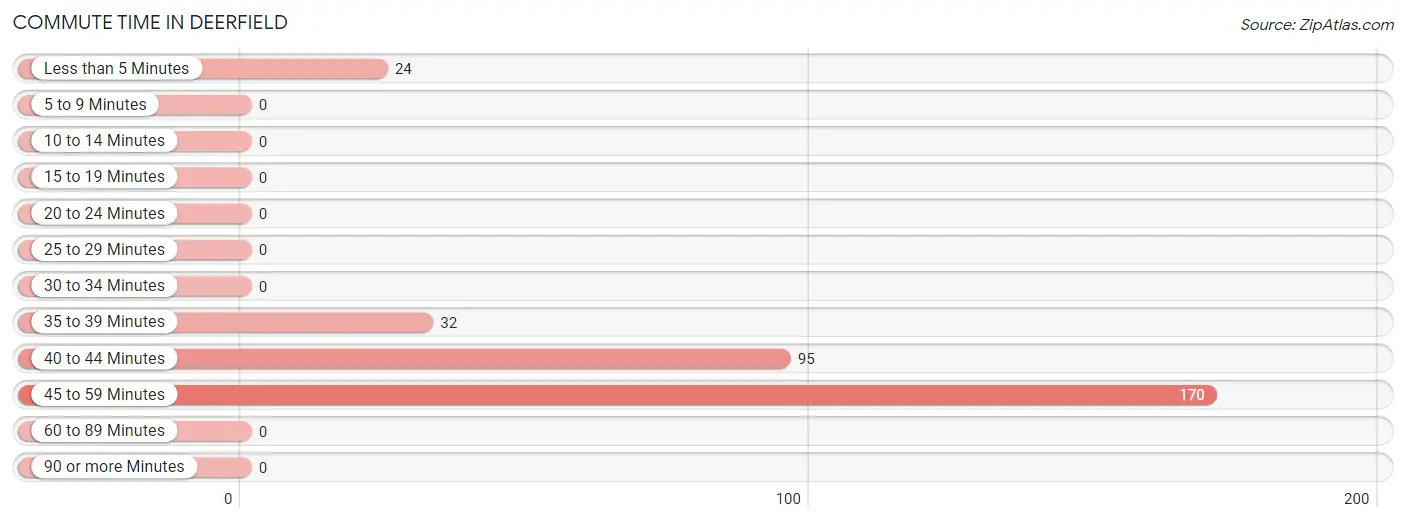
| Commute Time | # Commuters | % Commuters |
| Less than 5 Minutes | 24 | 7.5% |
| 5 to 9 Minutes | 0 | 0.0% |
| 10 to 14 Minutes | 0 | 0.0% |
| 15 to 19 Minutes | 0 | 0.0% |
| 20 to 24 Minutes | 0 | 0.0% |
| 25 to 29 Minutes | 0 | 0.0% |
| 30 to 34 Minutes | 0 | 0.0% |
| 35 to 39 Minutes | 32 | 10.0% |
| 40 to 44 Minutes | 95 | 29.6% |
| 45 to 59 Minutes | 170 | 53.0% |
| 60 to 89 Minutes | 0 | 0.0% |
| 90 or more Minutes | 0 | 0.0% |
Commute Time by Sex in Deerfield
The most common commute times in Deerfield are 40 to 44 minutes (69 commuters, 44.0%) for males and 45 to 59 minutes (138 commuters, 84.2%) for females.
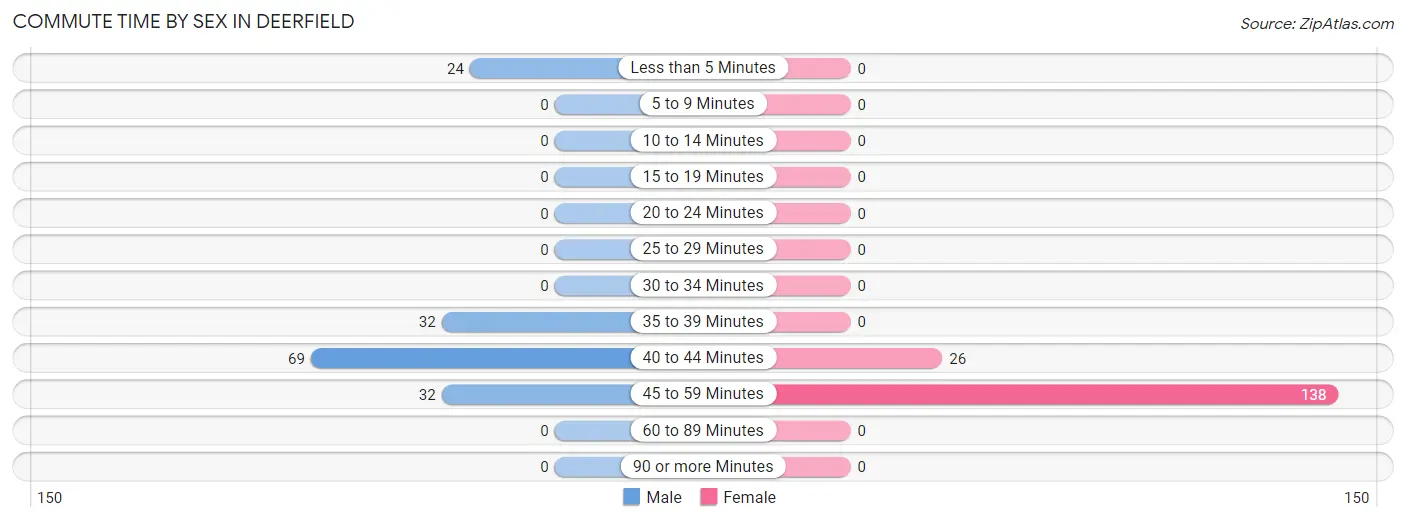
| Commute Time | Male | Female |
| Less than 5 Minutes | 24 (15.3%) | 0 (0.0%) |
| 5 to 9 Minutes | 0 (0.0%) | 0 (0.0%) |
| 10 to 14 Minutes | 0 (0.0%) | 0 (0.0%) |
| 15 to 19 Minutes | 0 (0.0%) | 0 (0.0%) |
| 20 to 24 Minutes | 0 (0.0%) | 0 (0.0%) |
| 25 to 29 Minutes | 0 (0.0%) | 0 (0.0%) |
| 30 to 34 Minutes | 0 (0.0%) | 0 (0.0%) |
| 35 to 39 Minutes | 32 (20.4%) | 0 (0.0%) |
| 40 to 44 Minutes | 69 (44.0%) | 26 (15.9%) |
| 45 to 59 Minutes | 32 (20.4%) | 138 (84.2%) |
| 60 to 89 Minutes | 0 (0.0%) | 0 (0.0%) |
| 90 or more Minutes | 0 (0.0%) | 0 (0.0%) |
Time of Departure to Work by Sex in Deerfield
The most frequent times of departure to work in Deerfield are 7:00 AM to 7:29 AM (103, 65.6%) for males and 6:00 AM to 6:29 AM (68, 41.5%) for females.
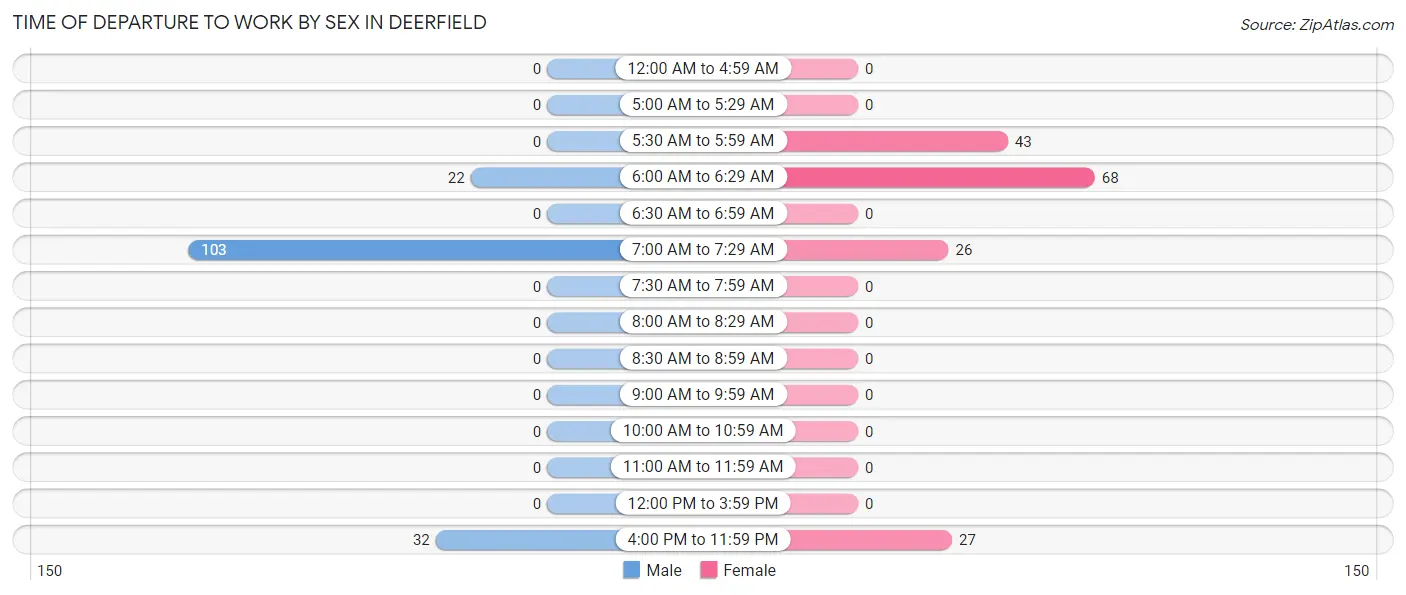
| Time of Departure | Male | Female |
| 12:00 AM to 4:59 AM | 0 (0.0%) | 0 (0.0%) |
| 5:00 AM to 5:29 AM | 0 (0.0%) | 0 (0.0%) |
| 5:30 AM to 5:59 AM | 0 (0.0%) | 43 (26.2%) |
| 6:00 AM to 6:29 AM | 22 (14.0%) | 68 (41.5%) |
| 6:30 AM to 6:59 AM | 0 (0.0%) | 0 (0.0%) |
| 7:00 AM to 7:29 AM | 103 (65.6%) | 26 (15.9%) |
| 7:30 AM to 7:59 AM | 0 (0.0%) | 0 (0.0%) |
| 8:00 AM to 8:29 AM | 0 (0.0%) | 0 (0.0%) |
| 8:30 AM to 8:59 AM | 0 (0.0%) | 0 (0.0%) |
| 9:00 AM to 9:59 AM | 0 (0.0%) | 0 (0.0%) |
| 10:00 AM to 10:59 AM | 0 (0.0%) | 0 (0.0%) |
| 11:00 AM to 11:59 AM | 0 (0.0%) | 0 (0.0%) |
| 12:00 PM to 3:59 PM | 0 (0.0%) | 0 (0.0%) |
| 4:00 PM to 11:59 PM | 32 (20.4%) | 27 (16.5%) |
| Total | 157 (100.0%) | 164 (100.0%) |
Housing Occupancy in Deerfield
Occupancy by Ownership in Deerfield
Of the total 170 dwellings in Deerfield, owner-occupied units account for 161 (94.7%), while renter-occupied units make up 9 (5.3%).
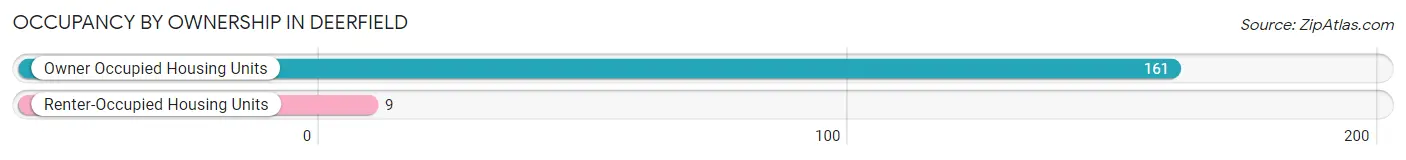
| Occupancy | # Housing Units | % Housing Units |
| Owner Occupied Housing Units | 161 | 94.7% |
| Renter-Occupied Housing Units | 9 | 5.3% |
| Total Occupied Housing Units | 170 | 100.0% |
Occupancy by Household Size in Deerfield
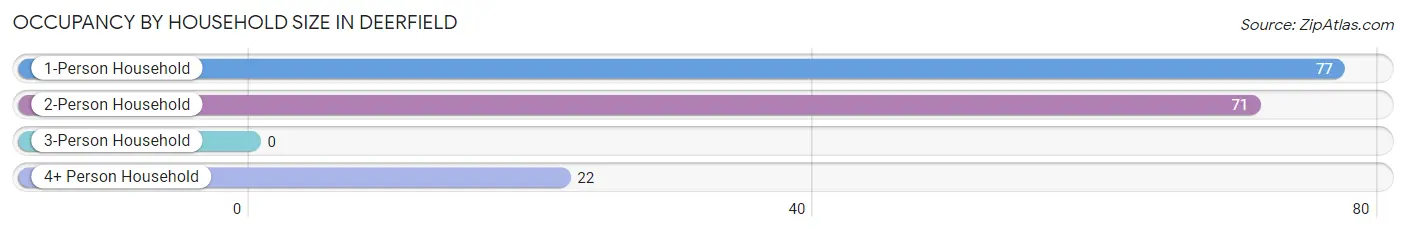
| Household Size | # Housing Units | % Housing Units |
| 1-Person Household | 77 | 45.3% |
| 2-Person Household | 71 | 41.8% |
| 3-Person Household | 0 | 0.0% |
| 4+ Person Household | 22 | 12.9% |
| Total Housing Units | 170 | 100.0% |
Occupancy by Ownership by Household Size in Deerfield
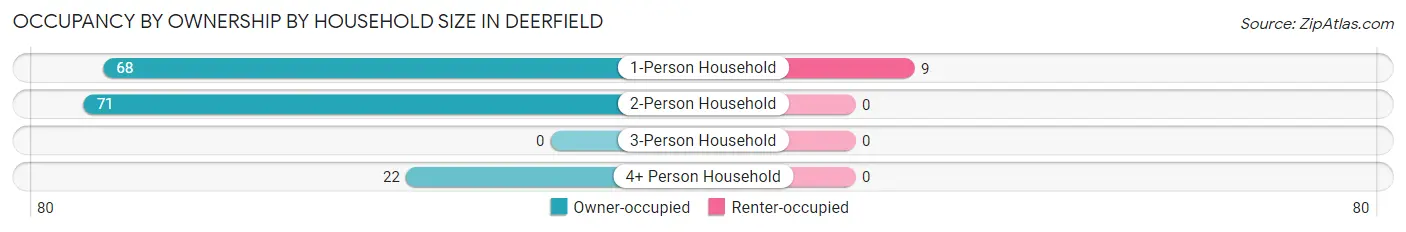
| Household Size | Owner-occupied | Renter-occupied |
| 1-Person Household | 68 (88.3%) | 9 (11.7%) |
| 2-Person Household | 71 (100.0%) | 0 (0.0%) |
| 3-Person Household | 0 (0.0%) | 0 (0.0%) |
| 4+ Person Household | 22 (100.0%) | 0 (0.0%) |
| Total Housing Units | 161 (94.7%) | 9 (5.3%) |
Occupancy by Educational Attainment in Deerfield
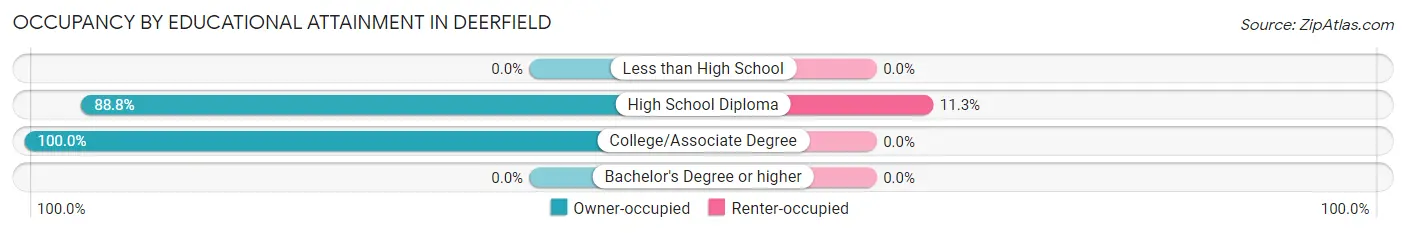
| Household Size | Owner-occupied | Renter-occupied |
| Less than High School | 0 (0.0%) | 0 (0.0%) |
| High School Diploma | 71 (88.7%) | 9 (11.3%) |
| College/Associate Degree | 90 (100.0%) | 0 (0.0%) |
| Bachelor's Degree or higher | 0 (0.0%) | 0 (0.0%) |
Occupancy by Age of Householder in Deerfield
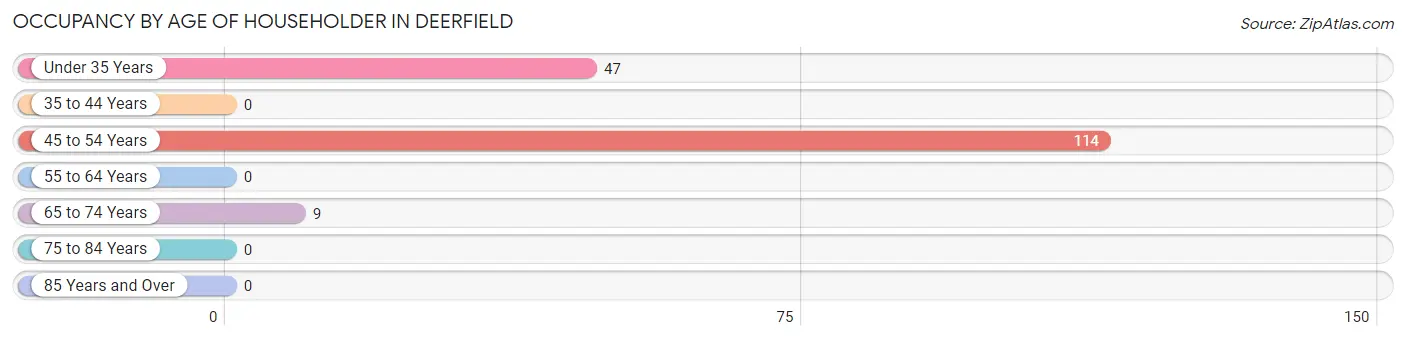
| Age Bracket | # Households | % Households |
| Under 35 Years | 47 | 27.7% |
| 35 to 44 Years | 0 | 0.0% |
| 45 to 54 Years | 114 | 67.1% |
| 55 to 64 Years | 0 | 0.0% |
| 65 to 74 Years | 9 | 5.3% |
| 75 to 84 Years | 0 | 0.0% |
| 85 Years and Over | 0 | 0.0% |
| Total | 170 | 100.0% |
Housing Finances in Deerfield
Median Income by Occupancy in Deerfield
| Occupancy Type | # Households | Median Income |
| Owner-Occupied | 161 (94.7%) | $0 |
| Renter-Occupied | 9 (5.3%) | $0 |
| Average | 170 (100.0%) | $0 |
Occupancy by Householder Income Bracket in Deerfield
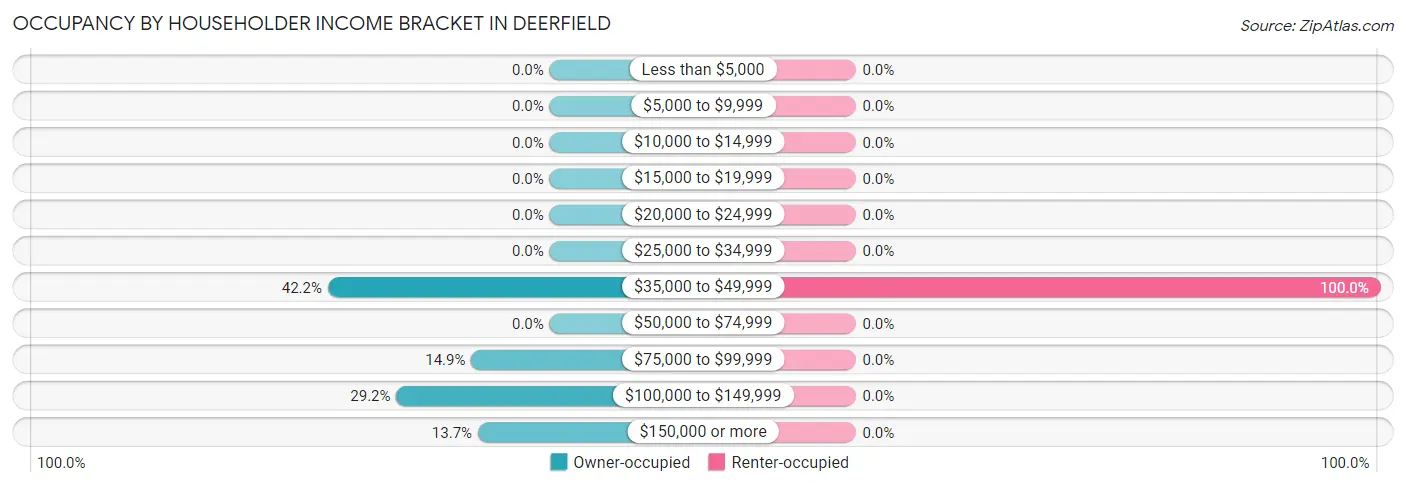
| Income Bracket | Owner-occupied | Renter-occupied |
| Less than $5,000 | 0 (0.0%) | 0 (0.0%) |
| $5,000 to $9,999 | 0 (0.0%) | 0 (0.0%) |
| $10,000 to $14,999 | 0 (0.0%) | 0 (0.0%) |
| $15,000 to $19,999 | 0 (0.0%) | 0 (0.0%) |
| $20,000 to $24,999 | 0 (0.0%) | 0 (0.0%) |
| $25,000 to $34,999 | 0 (0.0%) | 0 (0.0%) |
| $35,000 to $49,999 | 68 (42.2%) | 9 (100.0%) |
| $50,000 to $74,999 | 0 (0.0%) | 0 (0.0%) |
| $75,000 to $99,999 | 24 (14.9%) | 0 (0.0%) |
| $100,000 to $149,999 | 47 (29.2%) | 0 (0.0%) |
| $150,000 or more | 22 (13.7%) | 0 (0.0%) |
| Total | 161 (100.0%) | 9 (100.0%) |
Monthly Housing Cost Tiers in Deerfield
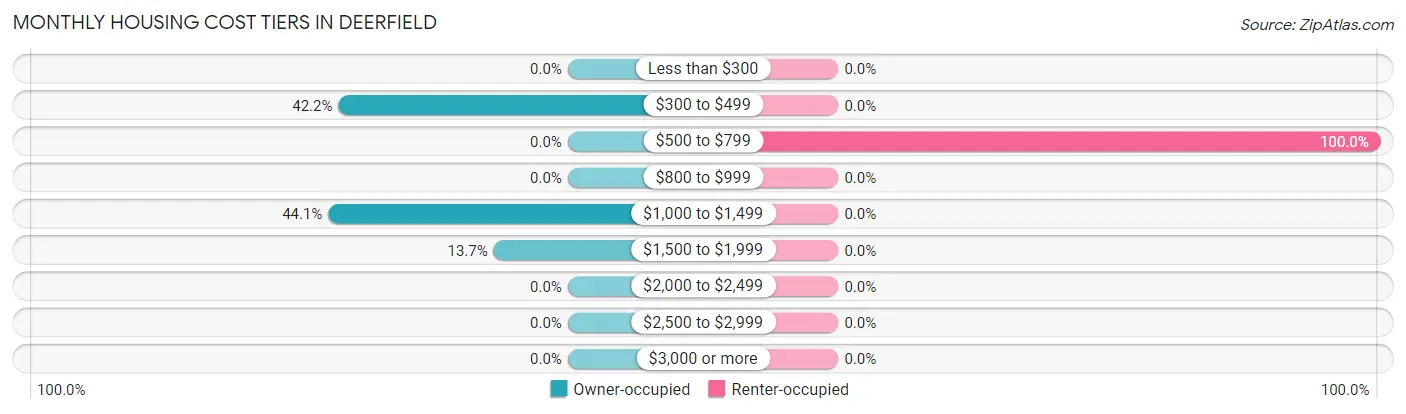
| Monthly Cost | Owner-occupied | Renter-occupied |
| Less than $300 | 0 (0.0%) | 0 (0.0%) |
| $300 to $499 | 68 (42.2%) | 0 (0.0%) |
| $500 to $799 | 0 (0.0%) | 9 (100.0%) |
| $800 to $999 | 0 (0.0%) | 0 (0.0%) |
| $1,000 to $1,499 | 71 (44.1%) | 0 (0.0%) |
| $1,500 to $1,999 | 22 (13.7%) | 0 (0.0%) |
| $2,000 to $2,499 | 0 (0.0%) | 0 (0.0%) |
| $2,500 to $2,999 | 0 (0.0%) | 0 (0.0%) |
| $3,000 or more | 0 (0.0%) | 0 (0.0%) |
| Total | 161 (100.0%) | 9 (100.0%) |
Physical Housing Characteristics in Deerfield
Housing Structures in Deerfield
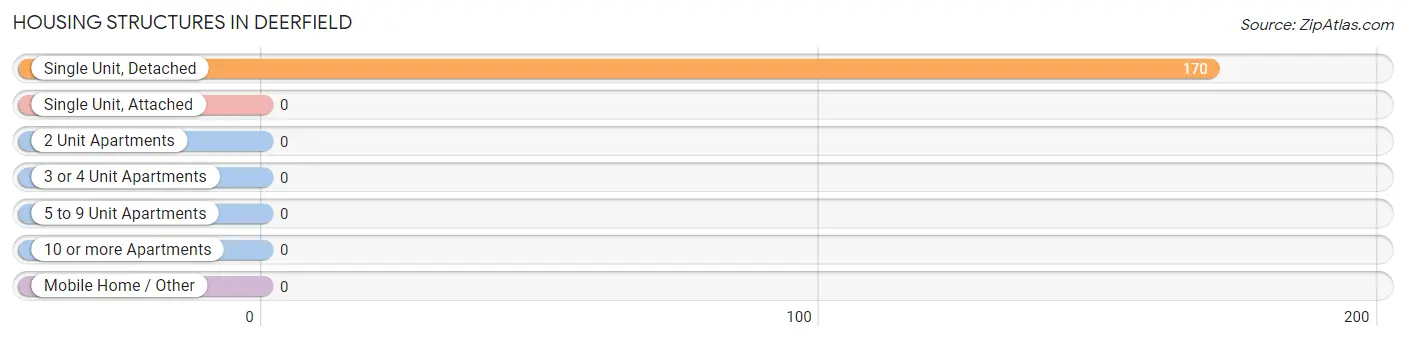
| Structure Type | # Housing Units | % Housing Units |
| Single Unit, Detached | 170 | 100.0% |
| Single Unit, Attached | 0 | 0.0% |
| 2 Unit Apartments | 0 | 0.0% |
| 3 or 4 Unit Apartments | 0 | 0.0% |
| 5 to 9 Unit Apartments | 0 | 0.0% |
| 10 or more Apartments | 0 | 0.0% |
| Mobile Home / Other | 0 | 0.0% |
| Total | 170 | 100.0% |
Housing Structures by Occupancy in Deerfield
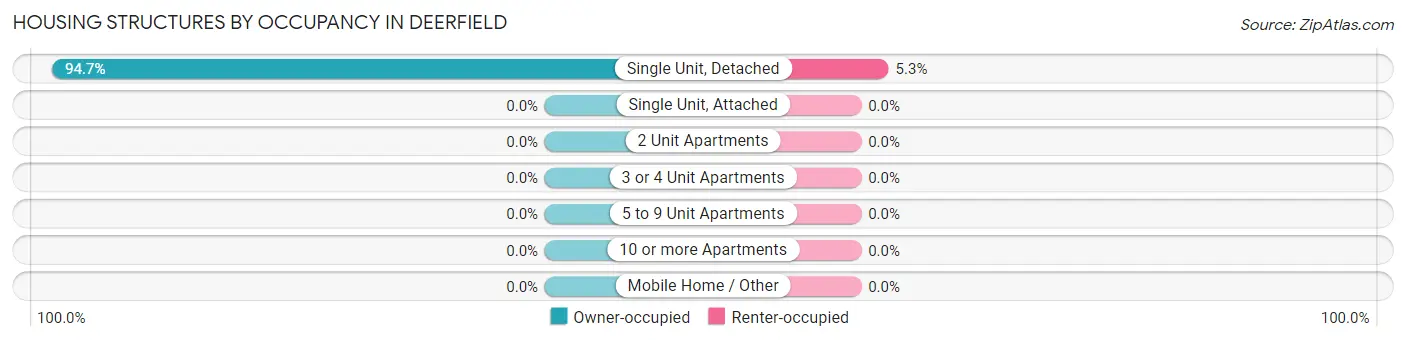
| Structure Type | Owner-occupied | Renter-occupied |
| Single Unit, Detached | 161 (94.7%) | 9 (5.3%) |
| Single Unit, Attached | 0 (0.0%) | 0 (0.0%) |
| 2 Unit Apartments | 0 (0.0%) | 0 (0.0%) |
| 3 or 4 Unit Apartments | 0 (0.0%) | 0 (0.0%) |
| 5 to 9 Unit Apartments | 0 (0.0%) | 0 (0.0%) |
| 10 or more Apartments | 0 (0.0%) | 0 (0.0%) |
| Mobile Home / Other | 0 (0.0%) | 0 (0.0%) |
| Total | 161 (94.7%) | 9 (5.3%) |
Housing Structures by Number of Rooms in Deerfield
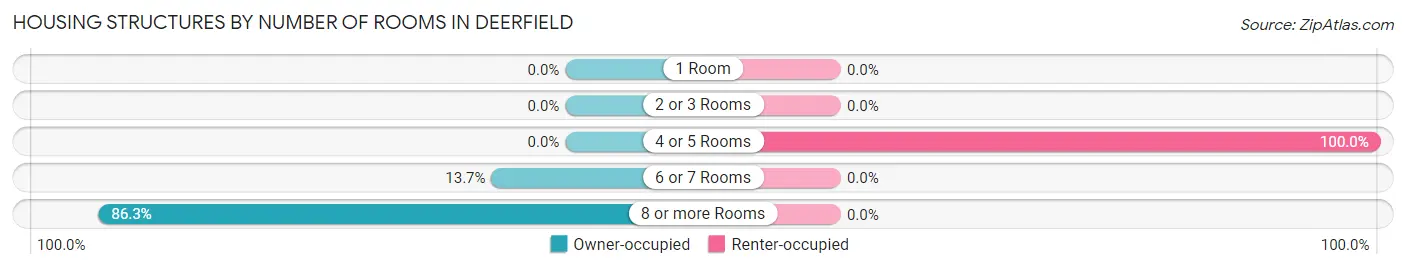
| Number of Rooms | Owner-occupied | Renter-occupied |
| 1 Room | 0 (0.0%) | 0 (0.0%) |
| 2 or 3 Rooms | 0 (0.0%) | 0 (0.0%) |
| 4 or 5 Rooms | 0 (0.0%) | 9 (100.0%) |
| 6 or 7 Rooms | 22 (13.7%) | 0 (0.0%) |
| 8 or more Rooms | 139 (86.3%) | 0 (0.0%) |
| Total | 161 (100.0%) | 9 (100.0%) |
Housing Structure by Heating Type in Deerfield
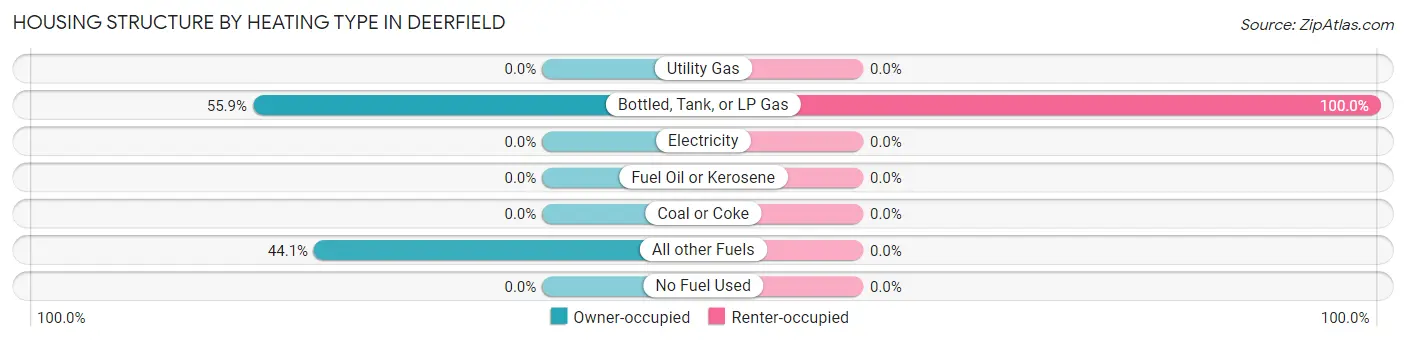
| Heating Type | Owner-occupied | Renter-occupied |
| Utility Gas | 0 (0.0%) | 0 (0.0%) |
| Bottled, Tank, or LP Gas | 90 (55.9%) | 9 (100.0%) |
| Electricity | 0 (0.0%) | 0 (0.0%) |
| Fuel Oil or Kerosene | 0 (0.0%) | 0 (0.0%) |
| Coal or Coke | 0 (0.0%) | 0 (0.0%) |
| All other Fuels | 71 (44.1%) | 0 (0.0%) |
| No Fuel Used | 0 (0.0%) | 0 (0.0%) |
| Total | 161 (100.0%) | 9 (100.0%) |
Household Vehicle Usage in Deerfield
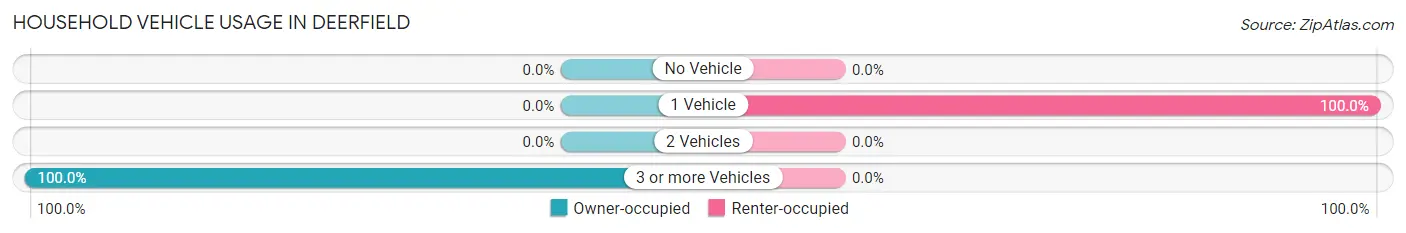
| Vehicles per Household | Owner-occupied | Renter-occupied |
| No Vehicle | 0 (0.0%) | 0 (0.0%) |
| 1 Vehicle | 0 (0.0%) | 9 (100.0%) |
| 2 Vehicles | 0 (0.0%) | 0 (0.0%) |
| 3 or more Vehicles | 161 (100.0%) | 0 (0.0%) |
| Total | 161 (100.0%) | 9 (100.0%) |
Real Estate & Mortgages in Deerfield
Real Estate and Mortgage Overview in Deerfield
| Characteristic | Without Mortgage | With Mortgage |
| Housing Units | 68 | 93 |
| Median Property Value | - | - |
| Median Household Income | - | - |
| Monthly Housing Costs | - | - |
| Real Estate Taxes | - | - |
Property Value by Mortgage Status in Deerfield
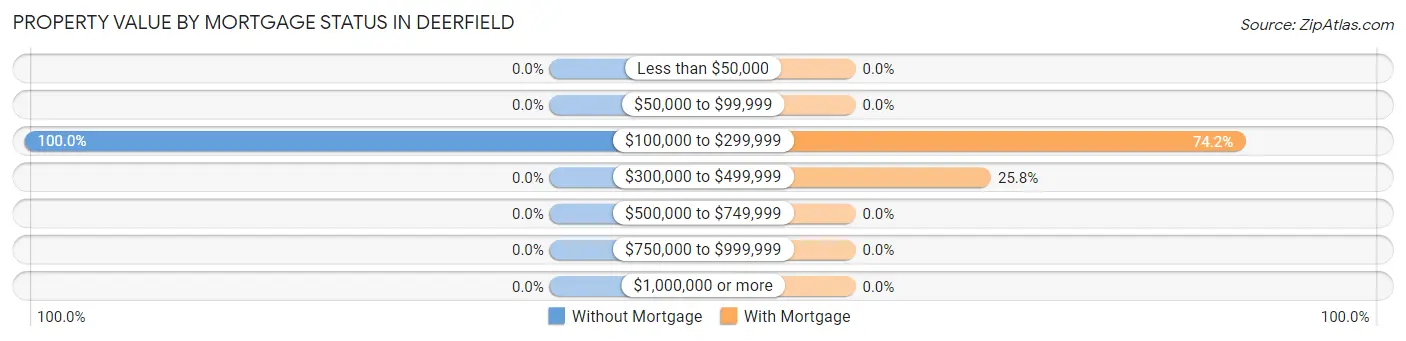
| Property Value | Without Mortgage | With Mortgage |
| Less than $50,000 | 0 (0.0%) | 0 (0.0%) |
| $50,000 to $99,999 | 0 (0.0%) | 0 (0.0%) |
| $100,000 to $299,999 | 68 (100.0%) | 69 (74.2%) |
| $300,000 to $499,999 | 0 (0.0%) | 24 (25.8%) |
| $500,000 to $749,999 | 0 (0.0%) | 0 (0.0%) |
| $750,000 to $999,999 | 0 (0.0%) | 0 (0.0%) |
| $1,000,000 or more | 0 (0.0%) | 0 (0.0%) |
| Total | 68 (100.0%) | 93 (100.0%) |
Household Income by Mortgage Status in Deerfield
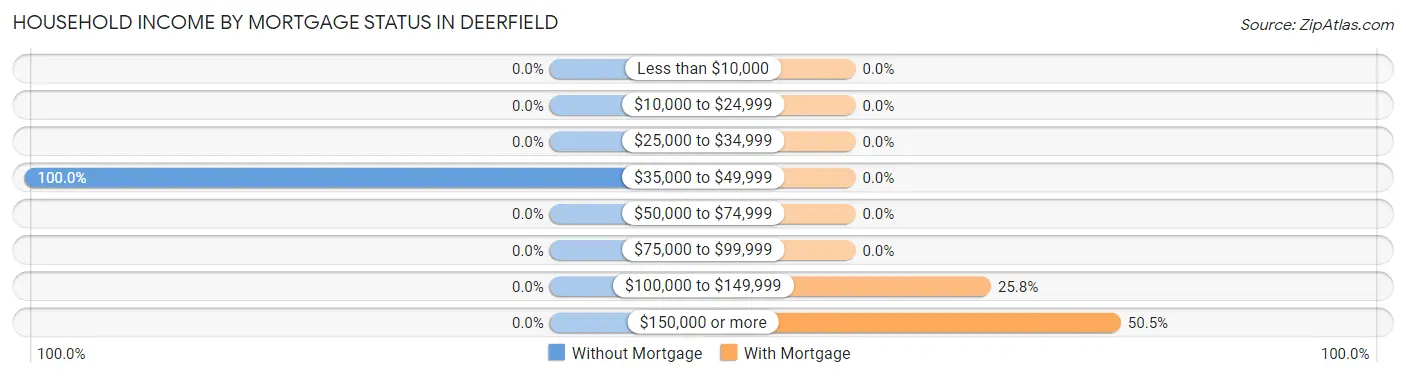
| Household Income | Without Mortgage | With Mortgage |
| Less than $10,000 | 0 (0.0%) | 0 (0.0%) |
| $10,000 to $24,999 | 0 (0.0%) | 0 (0.0%) |
| $25,000 to $34,999 | 0 (0.0%) | 0 (0.0%) |
| $35,000 to $49,999 | 68 (100.0%) | 0 (0.0%) |
| $50,000 to $74,999 | 0 (0.0%) | 0 (0.0%) |
| $75,000 to $99,999 | 0 (0.0%) | 0 (0.0%) |
| $100,000 to $149,999 | 0 (0.0%) | 24 (25.8%) |
| $150,000 or more | 0 (0.0%) | 47 (50.5%) |
| Total | 68 (100.0%) | 93 (100.0%) |
Property Value to Household Income Ratio in Deerfield
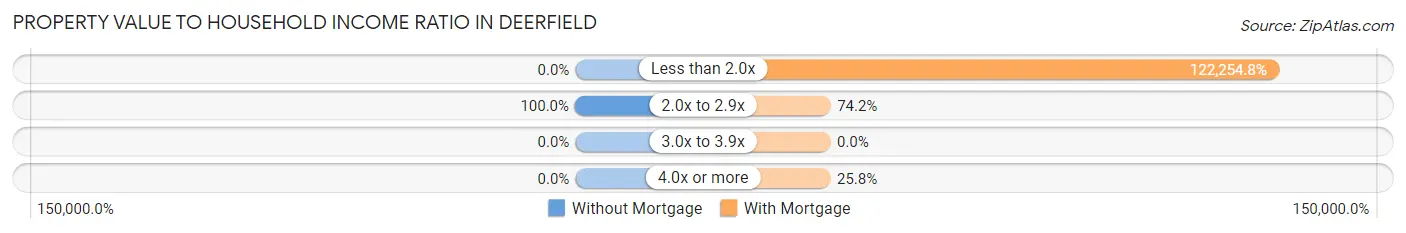
| Value-to-Income Ratio | Without Mortgage | With Mortgage |
| Less than 2.0x | 0 (0.0%) | 113,697 (122,254.8%) |
| 2.0x to 2.9x | 68 (100.0%) | 69 (74.2%) |
| 3.0x to 3.9x | 0 (0.0%) | 0 (0.0%) |
| 4.0x or more | 0 (0.0%) | 24 (25.8%) |
| Total | 68 (100.0%) | 93 (100.0%) |
Real Estate Taxes by Mortgage Status in Deerfield
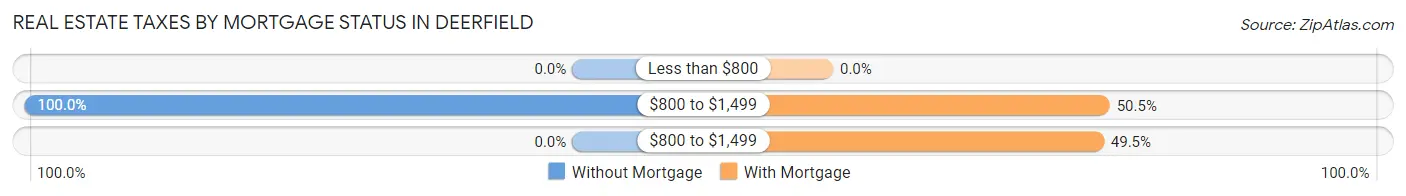
| Property Taxes | Without Mortgage | With Mortgage |
| Less than $800 | 0 (0.0%) | 0 (0.0%) |
| $800 to $1,499 | 68 (100.0%) | 47 (50.5%) |
| $800 to $1,499 | 0 (0.0%) | 46 (49.5%) |
| Total | 68 (100.0%) | 93 (100.0%) |
Health & Disability in Deerfield
Health Insurance Coverage by Age in Deerfield
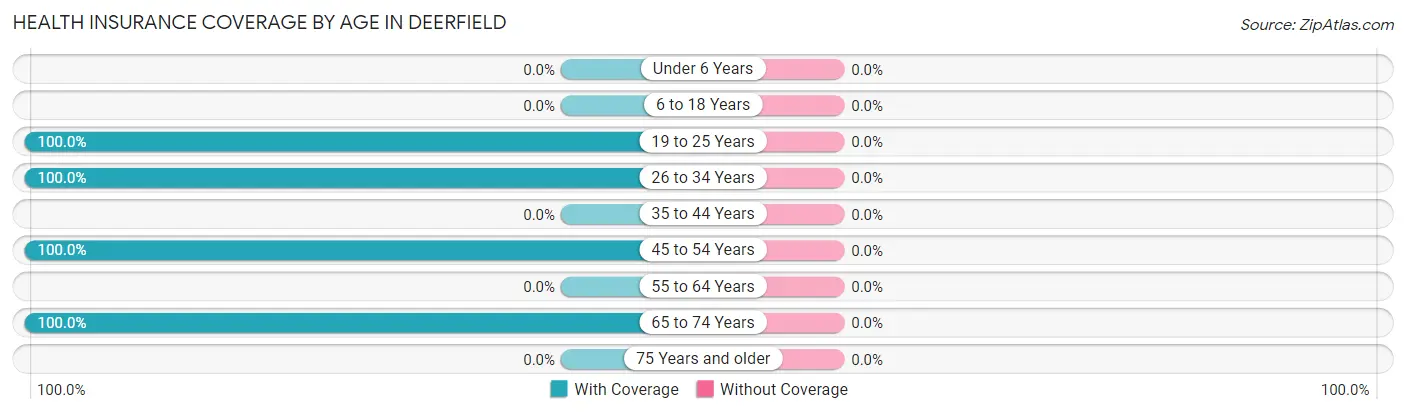
| Age Bracket | With Coverage | Without Coverage |
| Under 6 Years | 0 (0.0%) | 0 (0.0%) |
| 6 to 18 Years | 0 (0.0%) | 0 (0.0%) |
| 19 to 25 Years | 64 (100.0%) | 0 (0.0%) |
| 26 to 34 Years | 117 (100.0%) | 0 (0.0%) |
| 35 to 44 Years | 0 (0.0%) | 0 (0.0%) |
| 45 to 54 Years | 161 (100.0%) | 0 (0.0%) |
| 55 to 64 Years | 0 (0.0%) | 0 (0.0%) |
| 65 to 74 Years | 9 (100.0%) | 0 (0.0%) |
| 75 Years and older | 0 (0.0%) | 0 (0.0%) |
| Total | 351 (100.0%) | 0 (0.0%) |
Health Insurance Coverage by Citizenship Status in Deerfield
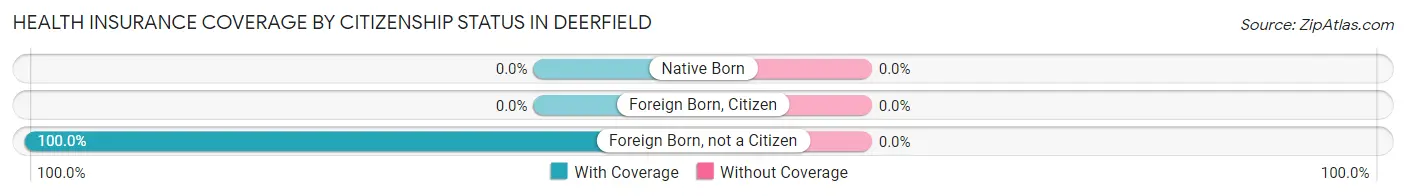
| Citizenship Status | With Coverage | Without Coverage |
| Native Born | 0 (0.0%) | 0 (0.0%) |
| Foreign Born, Citizen | 0 (0.0%) | 0 (0.0%) |
| Foreign Born, not a Citizen | 64 (100.0%) | 0 (0.0%) |
Health Insurance Coverage by Household Income in Deerfield
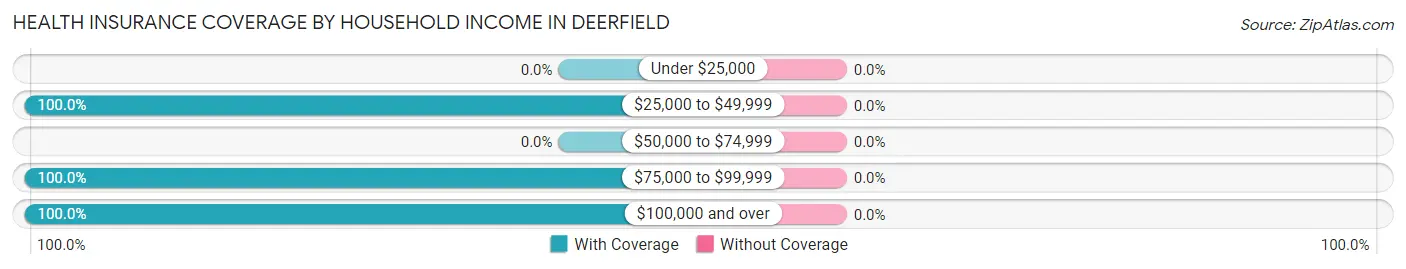
| Household Income | With Coverage | Without Coverage |
| Under $25,000 | 0 (0.0%) | 0 (0.0%) |
| $25,000 to $49,999 | 77 (100.0%) | 0 (0.0%) |
| $50,000 to $74,999 | 0 (0.0%) | 0 (0.0%) |
| $75,000 to $99,999 | 50 (100.0%) | 0 (0.0%) |
| $100,000 and over | 224 (100.0%) | 0 (0.0%) |
Public vs Private Health Insurance Coverage by Age in Deerfield
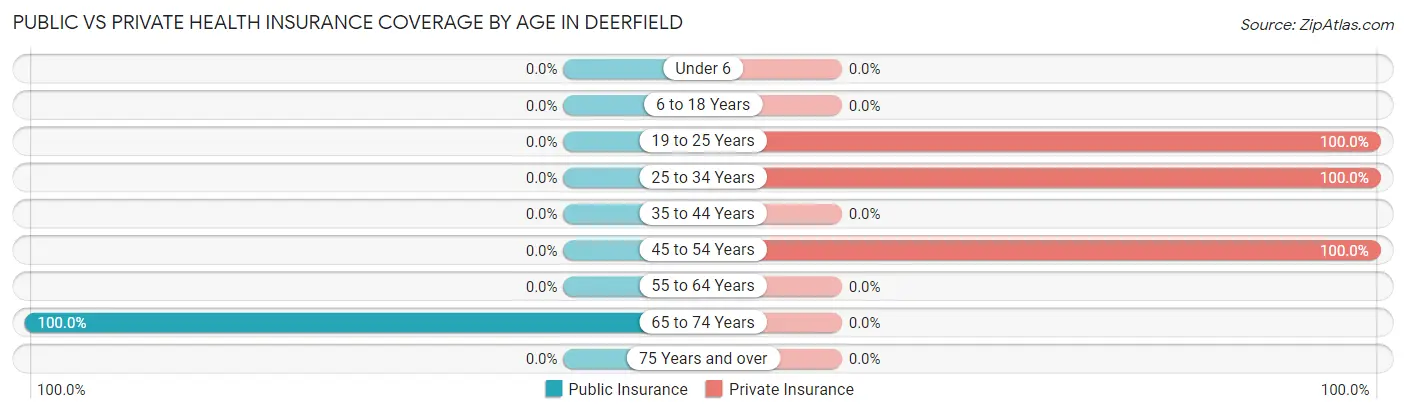
| Age Bracket | Public Insurance | Private Insurance |
| Under 6 | 0 (0.0%) | 0 (0.0%) |
| 6 to 18 Years | 0 (0.0%) | 0 (0.0%) |
| 19 to 25 Years | 0 (0.0%) | 64 (100.0%) |
| 25 to 34 Years | 0 (0.0%) | 117 (100.0%) |
| 35 to 44 Years | 0 (0.0%) | 0 (0.0%) |
| 45 to 54 Years | 0 (0.0%) | 161 (100.0%) |
| 55 to 64 Years | 0 (0.0%) | 0 (0.0%) |
| 65 to 74 Years | 9 (100.0%) | 0 (0.0%) |
| 75 Years and over | 0 (0.0%) | 0 (0.0%) |
| Total | 9 (2.6%) | 342 (97.4%) |
Disability Status by Sex by Age in Deerfield
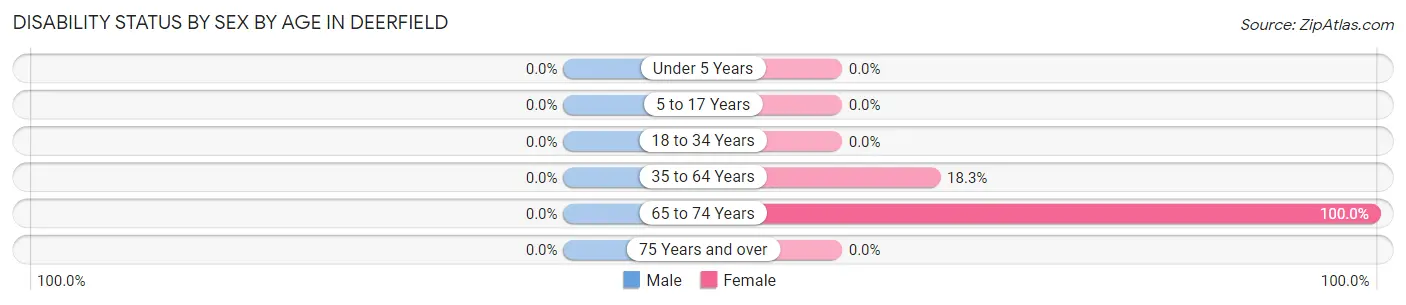
| Age Bracket | Male | Female |
| Under 5 Years | 0 (0.0%) | 0 (0.0%) |
| 5 to 17 Years | 0 (0.0%) | 0 (0.0%) |
| 18 to 34 Years | 0 (0.0%) | 0 (0.0%) |
| 35 to 64 Years | 0 (0.0%) | 21 (18.3%) |
| 65 to 74 Years | 0 (0.0%) | 9 (100.0%) |
| 75 Years and over | 0 (0.0%) | 0 (0.0%) |
Disability Class by Sex by Age in Deerfield
Disability Class: Hearing Difficulty
| Age Bracket | Male | Female |
| Under 5 Years | 0 (0.0%) | 0 (0.0%) |
| 5 to 17 Years | 0 (0.0%) | 0 (0.0%) |
| 18 to 34 Years | 0 (0.0%) | 0 (0.0%) |
| 35 to 64 Years | 0 (0.0%) | 0 (0.0%) |
| 65 to 74 Years | 0 (0.0%) | 0 (0.0%) |
| 75 Years and over | 0 (0.0%) | 0 (0.0%) |
Disability Class: Vision Difficulty
| Age Bracket | Male | Female |
| Under 5 Years | 0 (0.0%) | 0 (0.0%) |
| 5 to 17 Years | 0 (0.0%) | 0 (0.0%) |
| 18 to 34 Years | 0 (0.0%) | 0 (0.0%) |
| 35 to 64 Years | 0 (0.0%) | 0 (0.0%) |
| 65 to 74 Years | 0 (0.0%) | 0 (0.0%) |
| 75 Years and over | 0 (0.0%) | 0 (0.0%) |
Disability Class: Cognitive Difficulty
| Age Bracket | Male | Female |
| 5 to 17 Years | 0 (0.0%) | 0 (0.0%) |
| 18 to 34 Years | 0 (0.0%) | 0 (0.0%) |
| 35 to 64 Years | 0 (0.0%) | 0 (0.0%) |
| 65 to 74 Years | 0 (0.0%) | 0 (0.0%) |
| 75 Years and over | 0 (0.0%) | 0 (0.0%) |
Disability Class: Ambulatory Difficulty
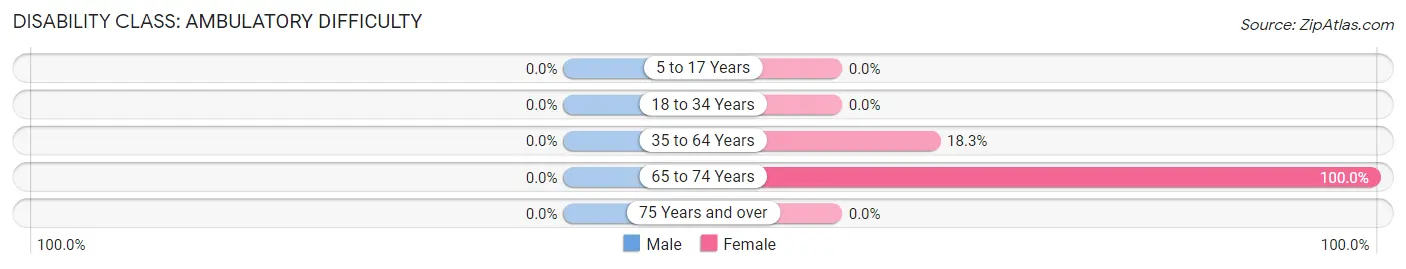
| Age Bracket | Male | Female |
| 5 to 17 Years | 0 (0.0%) | 0 (0.0%) |
| 18 to 34 Years | 0 (0.0%) | 0 (0.0%) |
| 35 to 64 Years | 0 (0.0%) | 21 (18.3%) |
| 65 to 74 Years | 0 (0.0%) | 9 (100.0%) |
| 75 Years and over | 0 (0.0%) | 0 (0.0%) |
Disability Class: Self-Care Difficulty
| Age Bracket | Male | Female |
| 5 to 17 Years | 0 (0.0%) | 0 (0.0%) |
| 18 to 34 Years | 0 (0.0%) | 0 (0.0%) |
| 35 to 64 Years | 0 (0.0%) | 0 (0.0%) |
| 65 to 74 Years | 0 (0.0%) | 0 (0.0%) |
| 75 Years and over | 0 (0.0%) | 0 (0.0%) |
Technology Access in Deerfield
Computing Device Access in Deerfield
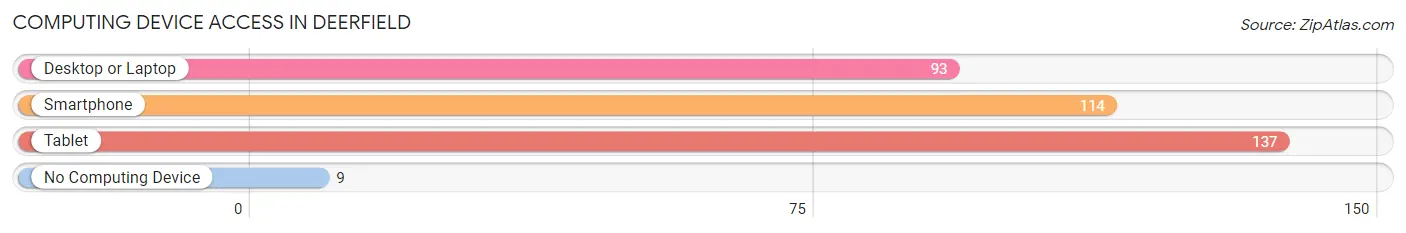
| Device Type | # Households | % Households |
| Desktop or Laptop | 93 | 54.7% |
| Smartphone | 114 | 67.1% |
| Tablet | 137 | 80.6% |
| No Computing Device | 9 | 5.3% |
| Total | 170 | 100.0% |
Internet Access in Deerfield
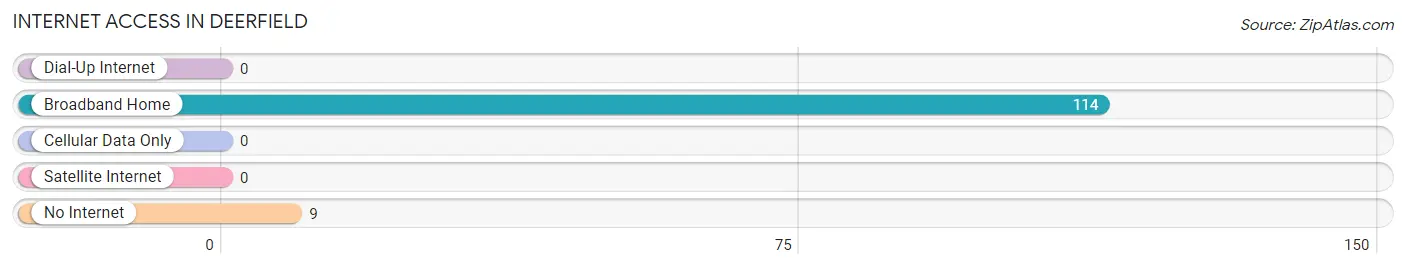
| Internet Type | # Households | % Households |
| Dial-Up Internet | 0 | 0.0% |
| Broadband Home | 114 | 67.1% |
| Cellular Data Only | 0 | 0.0% |
| Satellite Internet | 0 | 0.0% |
| No Internet | 9 | 5.3% |
| Total | 170 | 100.0% |
Deerfield Summary
Deerfield is a small unincorporated community located in the northern part of Fauquier County, Virginia. It is situated in the foothills of the Blue Ridge Mountains, approximately 50 miles west of Washington, D.C. The community is home to a population of approximately 1,000 people, and is known for its rural charm and close-knit community.
History
Deerfield was first settled in the late 1700s by a group of German immigrants. The community was originally known as “Deerfield Crossroads” due to its location at the intersection of two major roads. The community was officially established in 1817, and the name was changed to “Deerfield” in 1820.
The community was largely agricultural in nature, and the local economy was based on farming and livestock. The area was also known for its production of wool and flax. In the late 1800s, the community began to experience a period of growth and development. The railroad was extended to Deerfield in 1891, and the community became a popular destination for tourists and vacationers.
Geography
Deerfield is located in the northern part of Fauquier County, Virginia. It is situated in the foothills of the Blue Ridge Mountains, approximately 50 miles west of Washington, D.C. The community is bordered by the towns of Warrenton, Marshall, and The Plains. The area is characterized by rolling hills and lush forests. The climate is generally mild, with hot summers and cold winters.
Economy
The economy of Deerfield is largely based on agriculture and tourism. The area is home to several farms, which produce a variety of crops, including corn, soybeans, wheat, and hay. The community is also known for its production of wool and flax. In recent years, the area has become a popular destination for tourists and vacationers. The area is home to several wineries, as well as a variety of outdoor activities, such as hiking, fishing, and camping.
Demographics
As of the 2010 census, the population of Deerfield was 1,000. The racial makeup of the community was 94.2% White, 2.2% African American, 0.7% Native American, 0.7% Asian, and 2.2% from other races. The median household income was $50,000, and the median home value was $250,000. The median age was 44.7 years.
Conclusion
Deerfield is a small unincorporated community located in the northern part of Fauquier County, Virginia. It is situated in the foothills of the Blue Ridge Mountains, approximately 50 miles west of Washington, D.C. The community is home to a population of approximately 1,000 people, and is known for its rural charm and close-knit community. The economy of Deerfield is largely based on agriculture and tourism, and the area is home to several farms, wineries, and outdoor activities. The racial makeup of the community is predominantly White, with a median household income of $50,000 and a median home value of $250,000.
Common Questions
What is Per Capita Income in Deerfield?
Per Capita income in Deerfield is $50,117.
What is Income or Wage Gap in Deerfield?
Income or Wage Gap in Deerfield is 39.8%.
Women in Deerfield earn 60.2 cents for every dollar earned by a man.
What is Inequality or Gini Index in Deerfield?
Inequality or Gini Index in Deerfield is 0.37.
What is the Total Population of Deerfield?
Total Population of Deerfield is 351.
What is the Total Male Population of Deerfield?
Total Male Population of Deerfield is 157.
What is the Total Female Population of Deerfield?
Total Female Population of Deerfield is 194.
What is the Ratio of Males per 100 Females in Deerfield?
There are 80.93 Males per 100 Females in Deerfield.
What is the Ratio of Females per 100 Males in Deerfield?
There are 123.57 Females per 100 Males in Deerfield.
What is the Median Population Age in Deerfield?
Median Population Age in Deerfield is 28.9 Years.
What is the Average Family Size in Deerfield
Average Family Size in Deerfield is 3.3 People.
What is the Average Household Size in Deerfield
Average Household Size in Deerfield is 2.1 People.
How Large is the Labor Force in Deerfield?
There are 321 People in the Labor Forcein in Deerfield.
What is the Percentage of People in the Labor Force in Deerfield?
91.5% of People are in the Labor Force in Deerfield.