Little Rock, MN Map & Demographics
Little Rock Map
Little Rock Overview
$15,677
PER CAPITA INCOME
$50,179
AVG FAMILY INCOME
$44,931
AVG HOUSEHOLD INCOME
0.41
INEQUALITY / GINI INDEX
1,011
TOTAL POPULATION
582
MALE POPULATION
429
FEMALE POPULATION
135.66
MALES / 100 FEMALES
73.71
FEMALES / 100 MALES
22.6
MEDIAN AGE
4.3
AVG FAMILY SIZE
3.8
AVG HOUSEHOLD SIZE
436
LABOR FORCE [ PEOPLE ]
73.0%
PERCENT IN LABOR FORCE
23.6%
UNEMPLOYMENT RATE
Income in Little Rock
Income Overview in Little Rock
Per Capita Income in Little Rock is $15,677, while median incomes of families and households are $50,179 and $44,931 respectively.
| Characteristic | Number | Measure |
| Per Capita Income | 1,011 | $15,677 |
| Median Family Income | 202 | $50,179 |
| Mean Family Income | 202 | $59,957 |
| Median Household Income | 263 | $44,931 |
| Mean Household Income | 263 | $57,978 |
| Income Deficit | 202 | $0 |
| Wage / Income Gap (%) | 1,011 | 0.00% |
| Wage / Income Gap ($) | 1,011 | 100.00¢ per $1 |
| Gini / Inequality Index | 1,011 | 0.41 |
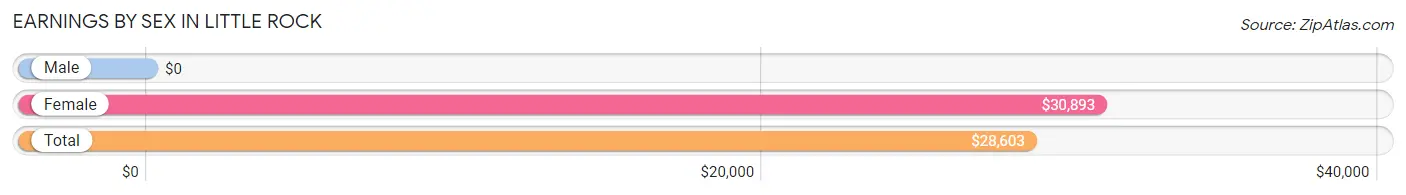
Earnings by Sex in Little Rock
| Sex | Number | Average Earnings |
| Male | 235 (56.4%) | $0 |
| Female | 182 (43.6%) | $30,893 |
| Total | 417 (100.0%) | $28,603 |
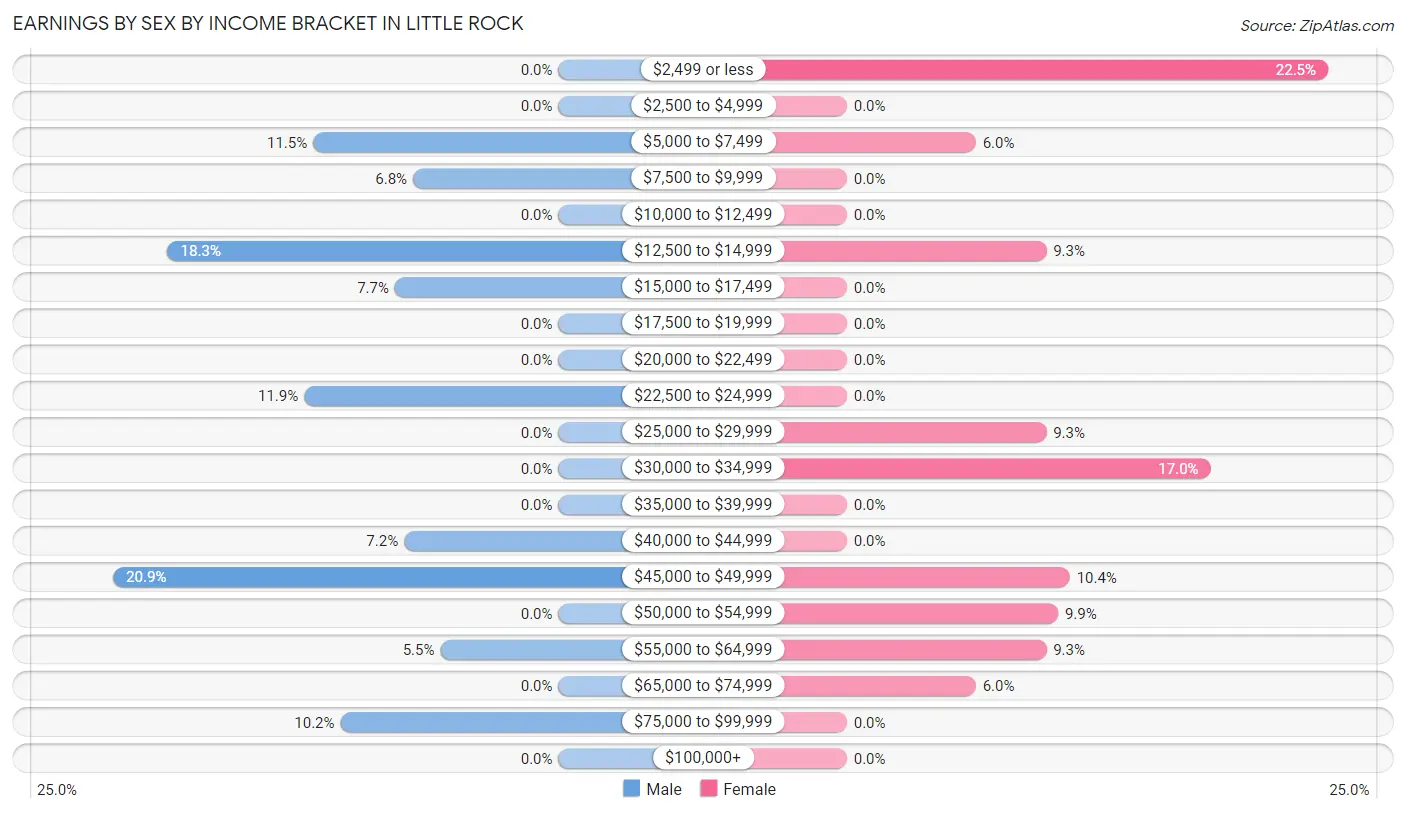
Earnings by Sex by Income Bracket in Little Rock
The most common earnings brackets in Little Rock are $45,000 to $49,999 for men (49 | 20.8%) and $2,499 or less for women (41 | 22.5%).
| Income | Male | Female |
| $2,499 or less | 0 (0.0%) | 41 (22.5%) |
| $2,500 to $4,999 | 0 (0.0%) | 0 (0.0%) |
| $5,000 to $7,499 | 27 (11.5%) | 11 (6.0%) |
| $7,500 to $9,999 | 16 (6.8%) | 0 (0.0%) |
| $10,000 to $12,499 | 0 (0.0%) | 0 (0.0%) |
| $12,500 to $14,999 | 43 (18.3%) | 17 (9.3%) |
| $15,000 to $17,499 | 18 (7.7%) | 0 (0.0%) |
| $17,500 to $19,999 | 0 (0.0%) | 0 (0.0%) |
| $20,000 to $22,499 | 0 (0.0%) | 0 (0.0%) |
| $22,500 to $24,999 | 28 (11.9%) | 0 (0.0%) |
| $25,000 to $29,999 | 0 (0.0%) | 17 (9.3%) |
| $30,000 to $34,999 | 0 (0.0%) | 31 (17.0%) |
| $35,000 to $39,999 | 0 (0.0%) | 0 (0.0%) |
| $40,000 to $44,999 | 17 (7.2%) | 0 (0.0%) |
| $45,000 to $49,999 | 49 (20.8%) | 19 (10.4%) |
| $50,000 to $54,999 | 0 (0.0%) | 18 (9.9%) |
| $55,000 to $64,999 | 13 (5.5%) | 17 (9.3%) |
| $65,000 to $74,999 | 0 (0.0%) | 11 (6.0%) |
| $75,000 to $99,999 | 24 (10.2%) | 0 (0.0%) |
| $100,000+ | 0 (0.0%) | 0 (0.0%) |
| Total | 235 (100.0%) | 182 (100.0%) |
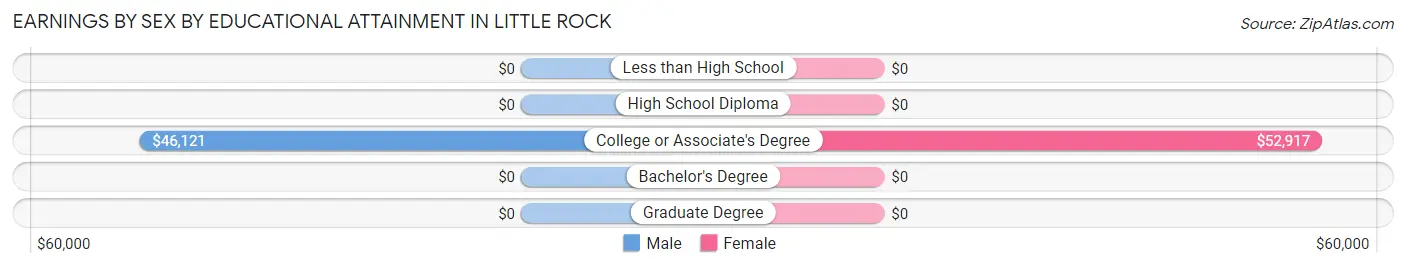
Earnings by Sex by Educational Attainment in Little Rock
Average earnings in Little Rock are $45,587 for men and $34,338 for women, a difference of 24.7%. Men with an educational attainment of college or associate's degree enjoy the highest average annual earnings of $46,121, while those with college or associate's degree education earn the least with $46,121. Women with an educational attainment of college or associate's degree earn the most with the average annual earnings of $52,917, while those with college or associate's degree education have the smallest earnings of $52,917.
| Educational Attainment | Male Income | Female Income |
| Less than High School | - | - |
| High School Diploma | - | - |
| College or Associate's Degree | $46,121 | $52,917 |
| Bachelor's Degree | - | - |
| Graduate Degree | - | - |
| Total | $45,587 | $34,338 |
Family Income in Little Rock
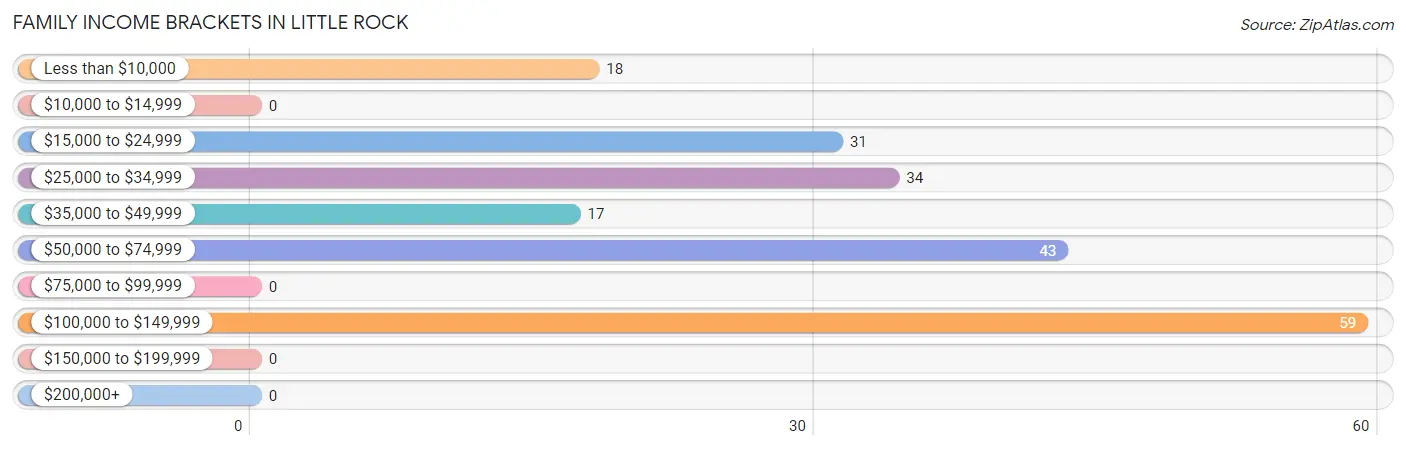
Family Income Brackets in Little Rock
According to the Little Rock family income data, there are 59 families falling into the $100,000 to $149,999 income range, which is the most common income bracket and makes up 29.2% of all families.
| Income Bracket | # Families | % Families |
| Less than $10,000 | 18 | 8.9% |
| $10,000 to $14,999 | 0 | 0.0% |
| $15,000 to $24,999 | 31 | 15.3% |
| $25,000 to $34,999 | 34 | 16.8% |
| $35,000 to $49,999 | 17 | 8.4% |
| $50,000 to $74,999 | 43 | 21.3% |
| $75,000 to $99,999 | 0 | 0.0% |
| $100,000 to $149,999 | 59 | 29.2% |
| $150,000 to $199,999 | 0 | 0.0% |
| $200,000+ | 0 | 0.0% |
Family Income by Famaliy Size in Little Rock
| Income Bracket | # Families | Median Income |
| 2-Person Families | 14 (6.9%) | $0 |
| 3-Person Families | 125 (61.9%) | $0 |
| 4-Person Families | 17 (8.4%) | $0 |
| 5-Person Families | 0 (0.0%) | $0 |
| 6-Person Families | 28 (13.9%) | $0 |
| 7+ Person Families | 18 (8.9%) | $0 |
| Total | 202 (100.0%) | $50,179 |
Family Income by Number of Earners in Little Rock
| Number of Earners | # Families | Median Income |
| No Earners | 18 (8.9%) | $0 |
| 1 Earner | 89 (44.1%) | $0 |
| 2 Earners | 65 (32.2%) | $0 |
| 3+ Earners | 30 (14.8%) | $0 |
| Total | 202 (100.0%) | $50,179 |
Household Income in Little Rock
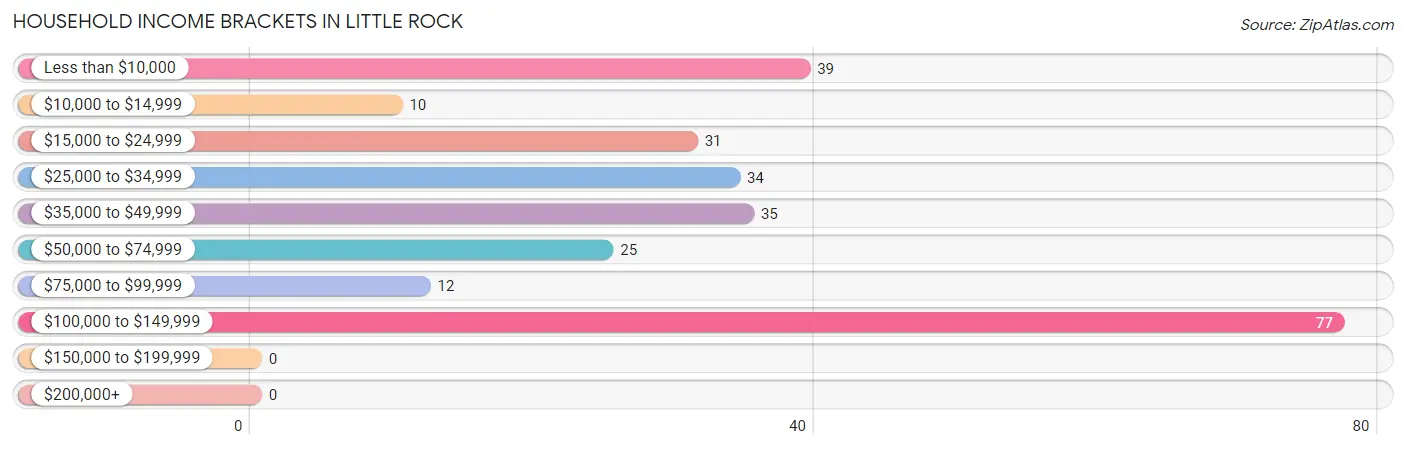
Household Income Brackets in Little Rock
With 77 households falling in the category, the $100,000 to $149,999 income range is the most frequent in Little Rock, accounting for 29.3% of all households.
| Income Bracket | # Households | % Households |
| Less than $10,000 | 39 | 14.8% |
| $10,000 to $14,999 | 10 | 3.8% |
| $15,000 to $24,999 | 31 | 11.8% |
| $25,000 to $34,999 | 34 | 12.9% |
| $35,000 to $49,999 | 35 | 13.3% |
| $50,000 to $74,999 | 25 | 9.5% |
| $75,000 to $99,999 | 12 | 4.6% |
| $100,000 to $149,999 | 77 | 29.3% |
| $150,000 to $199,999 | 0 | 0.0% |
| $200,000+ | 0 | 0.0% |
Household Income by Householder Age in Little Rock
The median household income in Little Rock is $44,931, with the highest median household income of $92,396 found in the 45 to 64 years age bracket for the primary householder. A total of 57 households (21.7%) fall into this category. Meanwhile, the 15 to 24 years age bracket for the primary householder has the lowest median household income of $0, with 17 households (6.5%) in this group.
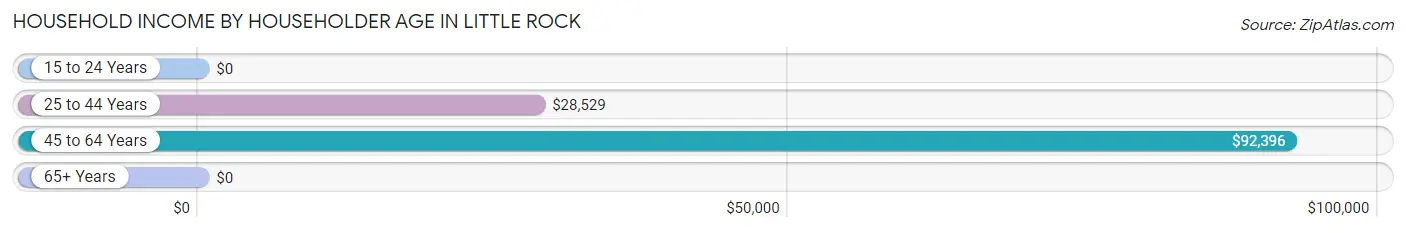
| Income Bracket | # Households | Median Income |
| 15 to 24 Years | 17 (6.5%) | $0 |
| 25 to 44 Years | 130 (49.4%) | $28,529 |
| 45 to 64 Years | 57 (21.7%) | $92,396 |
| 65+ Years | 59 (22.4%) | $0 |
| Total | 263 (100.0%) | $44,931 |
Poverty in Little Rock
Income Below Poverty by Sex and Age in Little Rock
With 27.0% poverty level for males and 18.9% for females among the residents of Little Rock, 35 to 44 year old males and 35 to 44 year old females are the most vulnerable to poverty, with 40 males (58.0%) and 35 females (51.5%) in their respective age groups living below the poverty level.
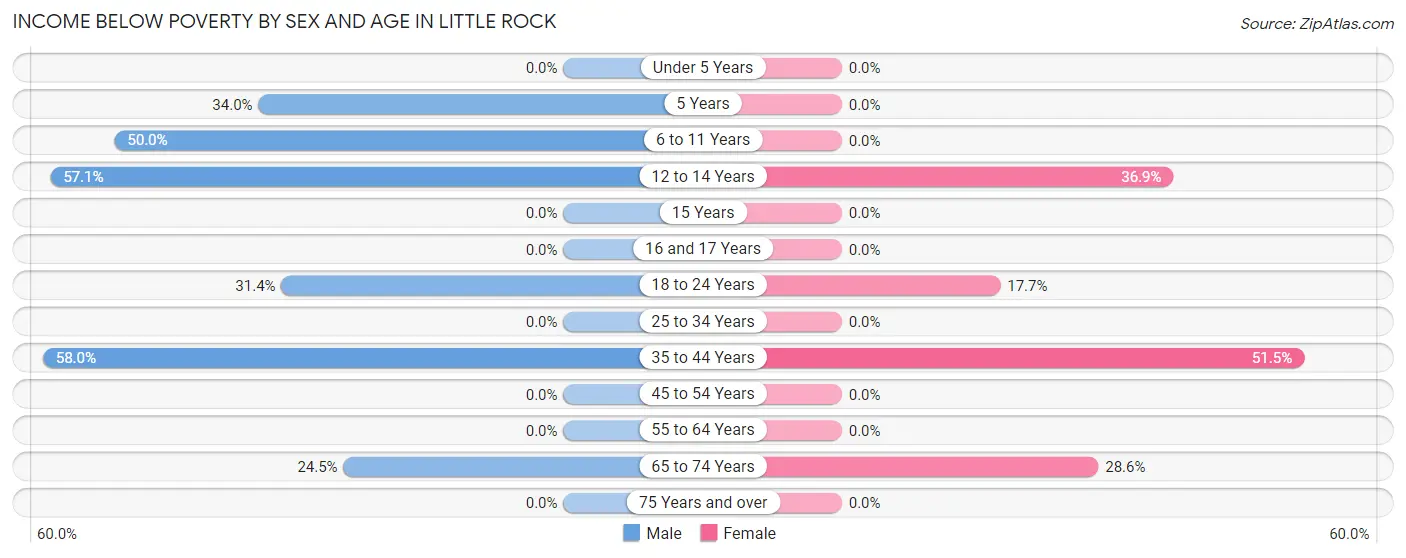
| Age Bracket | Male | Female |
| Under 5 Years | 0 (0.0%) | 0 (0.0%) |
| 5 Years | 18 (34.0%) | 0 (0.0%) |
| 6 to 11 Years | 36 (50.0%) | 0 (0.0%) |
| 12 to 14 Years | 24 (57.1%) | 24 (36.9%) |
| 15 Years | 0 (0.0%) | 0 (0.0%) |
| 16 and 17 Years | 0 (0.0%) | 0 (0.0%) |
| 18 to 24 Years | 27 (31.4%) | 12 (17.6%) |
| 25 to 34 Years | 0 (0.0%) | 0 (0.0%) |
| 35 to 44 Years | 40 (58.0%) | 35 (51.5%) |
| 45 to 54 Years | 0 (0.0%) | 0 (0.0%) |
| 55 to 64 Years | 0 (0.0%) | 0 (0.0%) |
| 65 to 74 Years | 12 (24.5%) | 10 (28.6%) |
| 75 Years and over | 0 (0.0%) | 0 (0.0%) |
| Total | 157 (27.0%) | 81 (18.9%) |
Income Above Poverty by Sex and Age in Little Rock
According to the poverty statistics in Little Rock, males aged under 5 years and females aged under 5 years are the age groups that are most secure financially, with 100.0% of males and 100.0% of females in these age groups living above the poverty line.
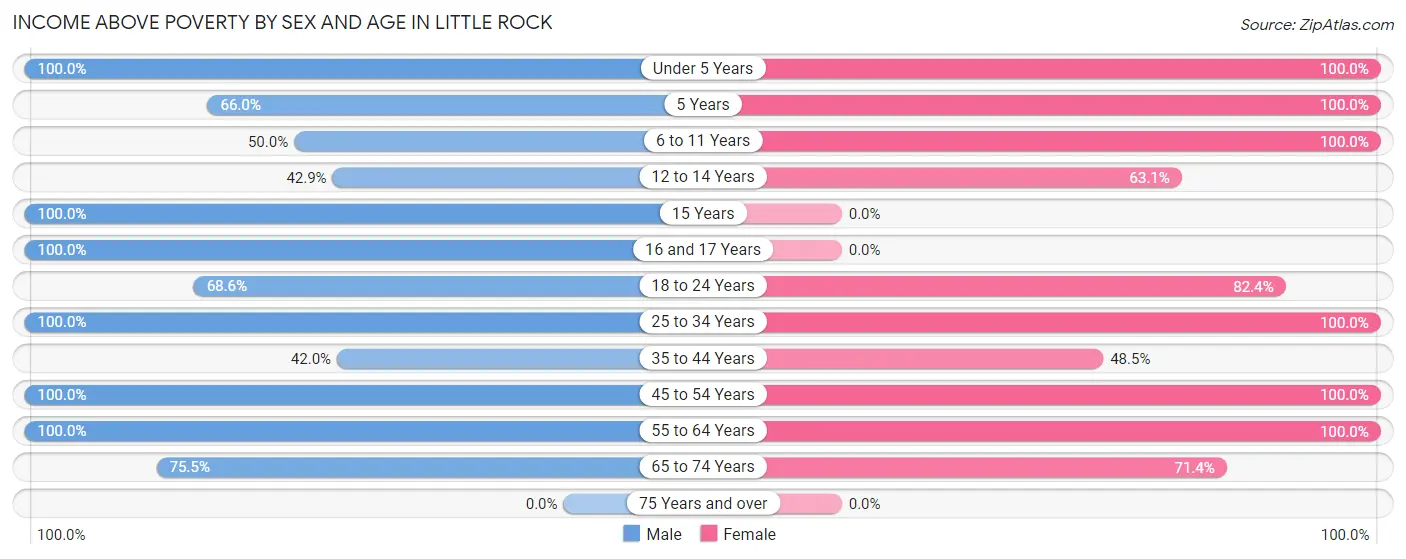
| Age Bracket | Male | Female |
| Under 5 Years | 69 (100.0%) | 60 (100.0%) |
| 5 Years | 35 (66.0%) | 21 (100.0%) |
| 6 to 11 Years | 36 (50.0%) | 20 (100.0%) |
| 12 to 14 Years | 18 (42.9%) | 41 (63.1%) |
| 15 Years | 12 (100.0%) | 0 (0.0%) |
| 16 and 17 Years | 12 (100.0%) | 0 (0.0%) |
| 18 to 24 Years | 59 (68.6%) | 56 (82.4%) |
| 25 to 34 Years | 76 (100.0%) | 47 (100.0%) |
| 35 to 44 Years | 29 (42.0%) | 33 (48.5%) |
| 45 to 54 Years | 17 (100.0%) | 11 (100.0%) |
| 55 to 64 Years | 25 (100.0%) | 34 (100.0%) |
| 65 to 74 Years | 37 (75.5%) | 25 (71.4%) |
| 75 Years and over | 0 (0.0%) | 0 (0.0%) |
| Total | 425 (73.0%) | 348 (81.1%) |
Income Below Poverty Among Married-Couple Families in Little Rock
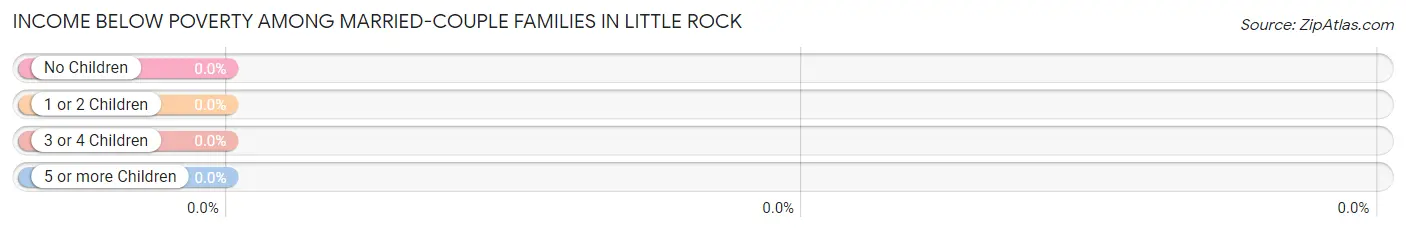
| Children | Above Poverty | Below Poverty |
| No Children | 44 (100.0%) | 0 (0.0%) |
| 1 or 2 Children | 17 (100.0%) | 0 (0.0%) |
| 3 or 4 Children | 0 (0.0%) | 0 (0.0%) |
| 5 or more Children | 0 (0.0%) | 0 (0.0%) |
| Total | 61 (100.0%) | 0 (0.0%) |
Income Below Poverty Among Single-Parent Households in Little Rock
According to the poverty data in Little Rock, 30.2% or 13 single-father households and 35.7% or 35 single-mother households are living below the poverty line. Among single-father households, those with 1 or 2 children have the highest poverty rate, with 13 households (41.9%) experiencing poverty. Likewise, among single-mother households, those with 3 or 4 children have the highest poverty rate, with 17 households (50.0%) falling below the poverty line.
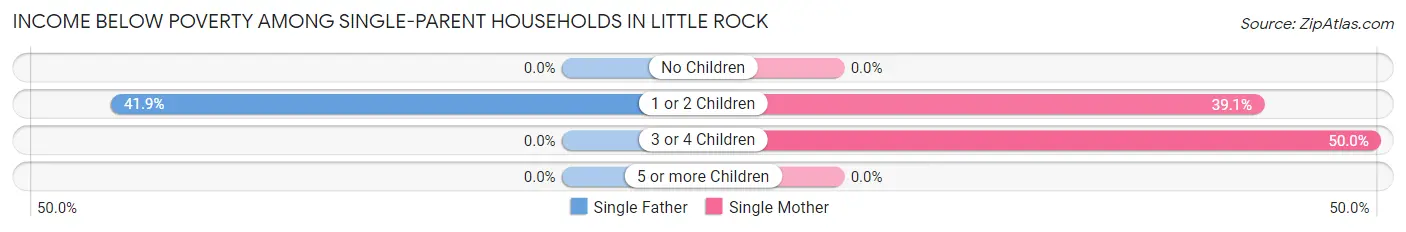
| Children | Single Father | Single Mother |
| No Children | 0 (0.0%) | 0 (0.0%) |
| 1 or 2 Children | 13 (41.9%) | 18 (39.1%) |
| 3 or 4 Children | 0 (0.0%) | 17 (50.0%) |
| 5 or more Children | 0 (0.0%) | 0 (0.0%) |
| Total | 13 (30.2%) | 35 (35.7%) |
Income Below Poverty Among Married-Couple vs Single-Parent Households in Little Rock
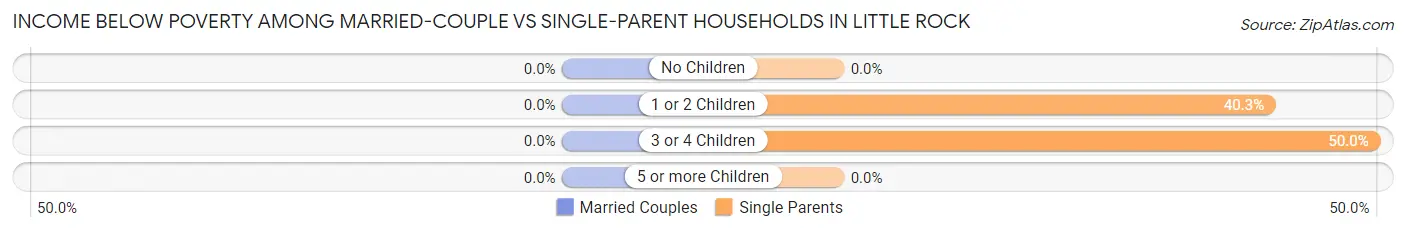
| Children | Married-Couple Families | Single-Parent Households |
| No Children | 0 (0.0%) | 0 (0.0%) |
| 1 or 2 Children | 0 (0.0%) | 31 (40.3%) |
| 3 or 4 Children | 0 (0.0%) | 17 (50.0%) |
| 5 or more Children | 0 (0.0%) | 0 (0.0%) |
| Total | 0 (0.0%) | 48 (34.0%) |
Race in Little Rock
The most populous races in Little Rock are , and Native / Alaskan (1,011 | 100.0%).
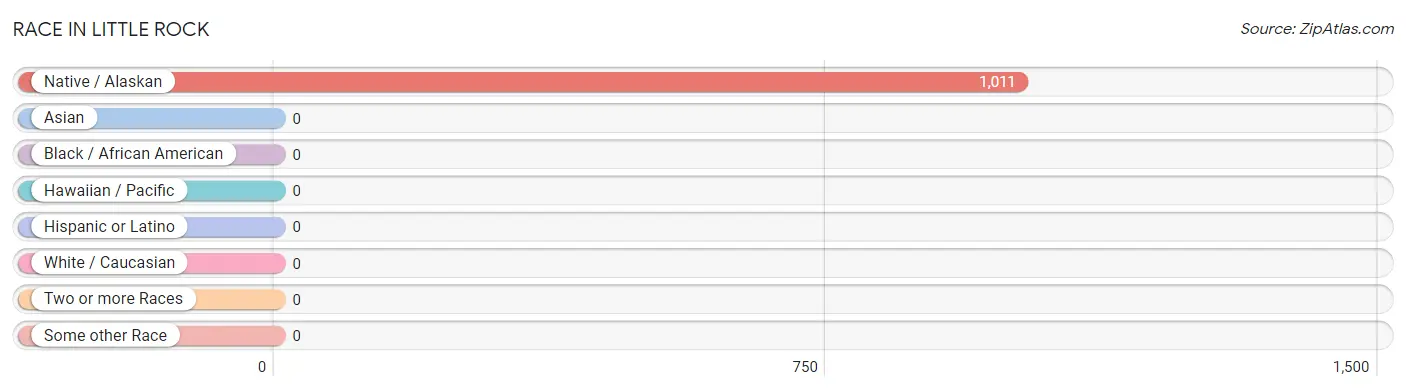
| Race | # Population | % Population |
| Asian | 0 | 0.0% |
| Black / African American | 0 | 0.0% |
| Hawaiian / Pacific | 0 | 0.0% |
| Hispanic or Latino | 0 | 0.0% |
| Native / Alaskan | 1,011 | 100.0% |
| White / Caucasian | 0 | 0.0% |
| Two or more Races | 0 | 0.0% |
| Some other Race | 0 | 0.0% |
| Total | 1,011 | 100.0% |
Ancestry in Little Rock
The most populous ancestries reported in Little Rock are , and Chippewa (968 | 95.8%), together accounting for 95.8% of all Little Rock residents.

| Ancestry | # Population | % Population |
| Chippewa | 968 | 95.8% | View All 1 Rows |
Immigrants in Little Rock

| Immigration Origin | # Population | % Population | View All 0 Rows |
Sex and Age in Little Rock
Sex and Age in Little Rock
The most populous age groups in Little Rock are 5 to 9 Years (88 | 15.1%) for men and 10 to 14 Years (65 | 15.1%) for women.
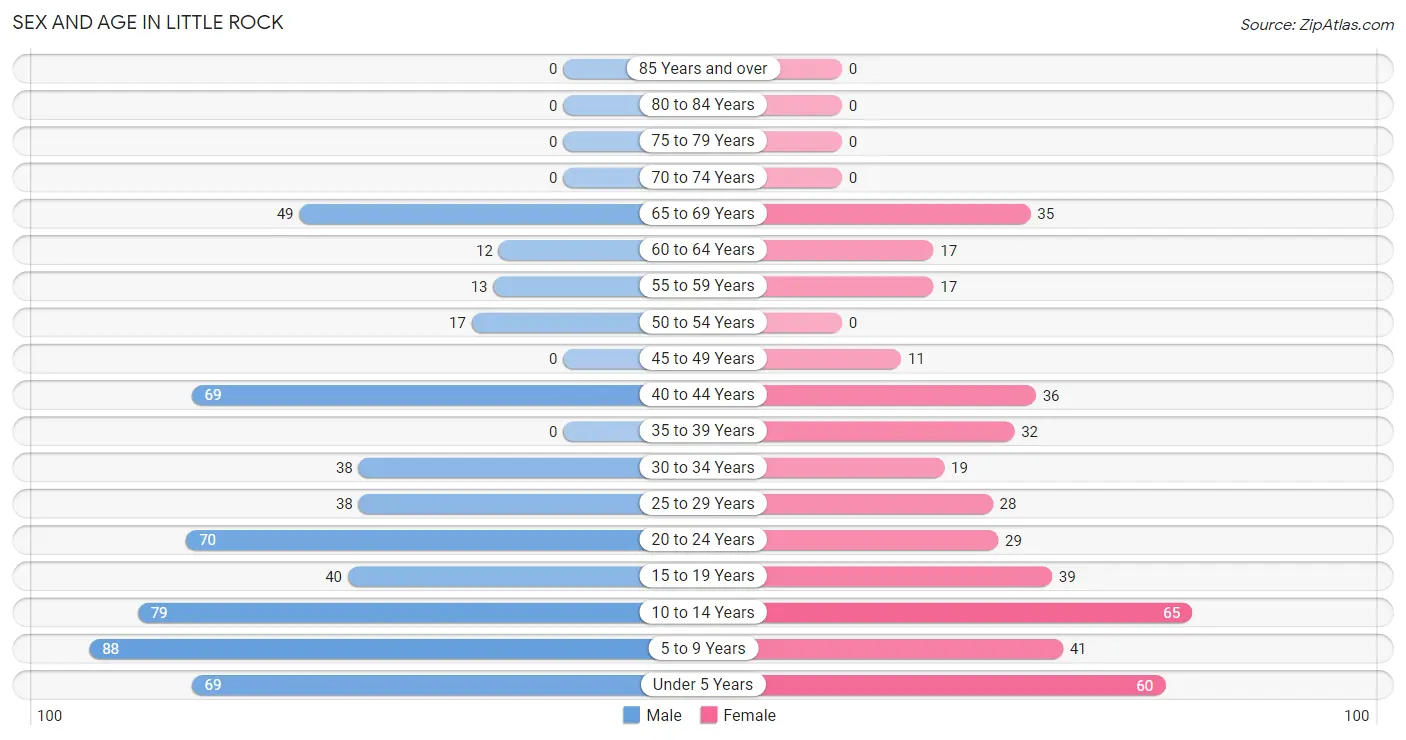
| Age Bracket | Male | Female |
| Under 5 Years | 69 (11.9%) | 60 (14.0%) |
| 5 to 9 Years | 88 (15.1%) | 41 (9.6%) |
| 10 to 14 Years | 79 (13.6%) | 65 (15.1%) |
| 15 to 19 Years | 40 (6.9%) | 39 (9.1%) |
| 20 to 24 Years | 70 (12.0%) | 29 (6.8%) |
| 25 to 29 Years | 38 (6.5%) | 28 (6.5%) |
| 30 to 34 Years | 38 (6.5%) | 19 (4.4%) |
| 35 to 39 Years | 0 (0.0%) | 32 (7.5%) |
| 40 to 44 Years | 69 (11.9%) | 36 (8.4%) |
| 45 to 49 Years | 0 (0.0%) | 11 (2.6%) |
| 50 to 54 Years | 17 (2.9%) | 0 (0.0%) |
| 55 to 59 Years | 13 (2.2%) | 17 (4.0%) |
| 60 to 64 Years | 12 (2.1%) | 17 (4.0%) |
| 65 to 69 Years | 49 (8.4%) | 35 (8.2%) |
| 70 to 74 Years | 0 (0.0%) | 0 (0.0%) |
| 75 to 79 Years | 0 (0.0%) | 0 (0.0%) |
| 80 to 84 Years | 0 (0.0%) | 0 (0.0%) |
| 85 Years and over | 0 (0.0%) | 0 (0.0%) |
| Total | 582 (100.0%) | 429 (100.0%) |
Families and Households in Little Rock
Median Family Size in Little Rock
The median family size in Little Rock is 4.34 persons per family, with single female/mother families (98 | 48.5%) accounting for the largest median family size of 5.86 persons per family. On the other hand, married-couple families (61 | 30.2%) represent the smallest median family size with 2.70 persons per family.
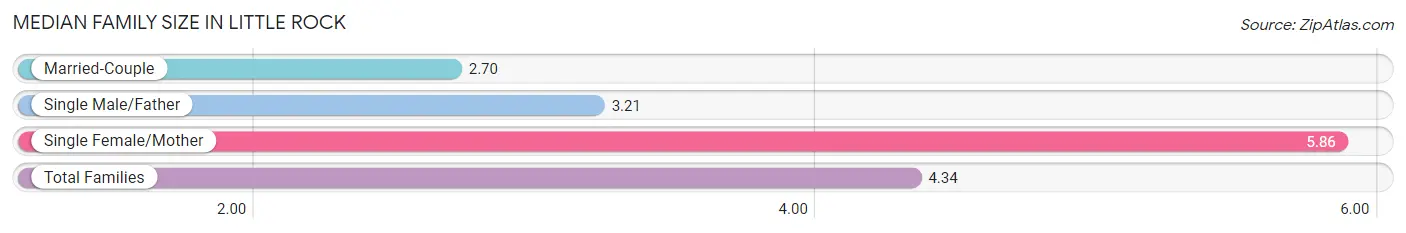
| Family Type | # Families | Family Size |
| Married-Couple | 61 (30.2%) | 2.70 |
| Single Male/Father | 43 (21.3%) | 3.21 |
| Single Female/Mother | 98 (48.5%) | 5.86 |
| Total Families | 202 (100.0%) | 4.34 |
Median Household Size in Little Rock
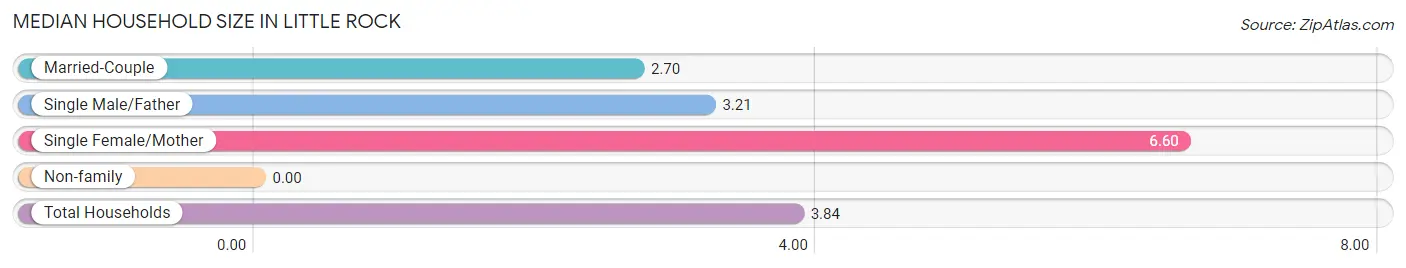
| Household Type | # Households | Household Size |
| Married-Couple | 61 (23.2%) | 2.70 |
| Single Male/Father | 43 (16.4%) | 3.21 |
| Single Female/Mother | 98 (37.3%) | 6.60 |
| Non-family | 61 (23.2%) | - |
| Total Households | 263 (100.0%) | 3.84 |
Household Size by Marriage Status in Little Rock
Out of a total of 263 households in Little Rock, 202 (76.8%) are family households, while 61 (23.2%) are nonfamily households. The most numerous type of family households are 3-person households, comprising 90, and the most common type of nonfamily households are 1-person households, comprising 61.
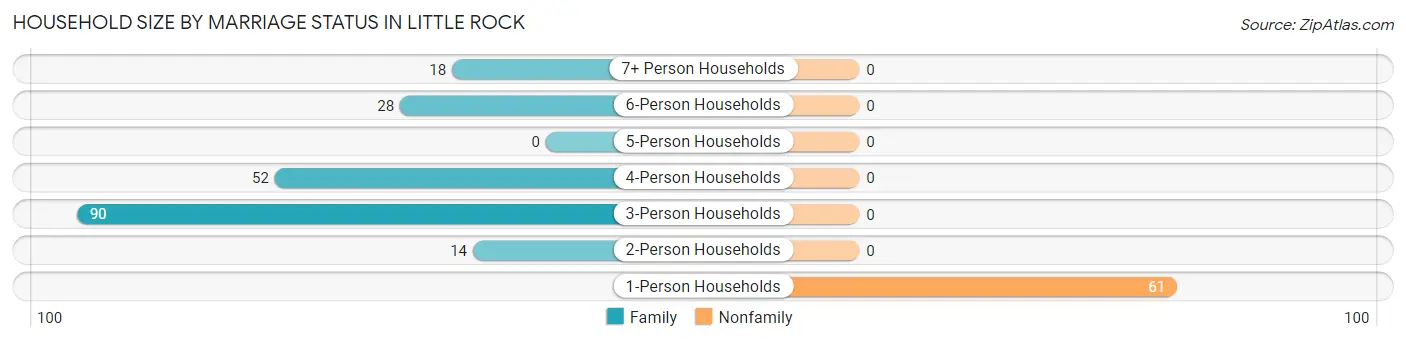
| Household Size | Family Households | Nonfamily Households |
| 1-Person Households | - | 61 (23.2%) |
| 2-Person Households | 14 (5.3%) | 0 (0.0%) |
| 3-Person Households | 90 (34.2%) | 0 (0.0%) |
| 4-Person Households | 52 (19.8%) | 0 (0.0%) |
| 5-Person Households | 0 (0.0%) | 0 (0.0%) |
| 6-Person Households | 28 (10.6%) | 0 (0.0%) |
| 7+ Person Households | 18 (6.8%) | 0 (0.0%) |
| Total | 202 (76.8%) | 61 (23.2%) |
Female Fertility in Little Rock
Fertility by Age in Little Rock
Average fertility rate in Little Rock is 149.0 births per 1,000 women. Women in the age bracket of 15 to 19 years have the highest fertility rate with 308.0 births per 1,000 women. Women in the age bracket of 20 to 34 years acount for 58.6% of all women with births.
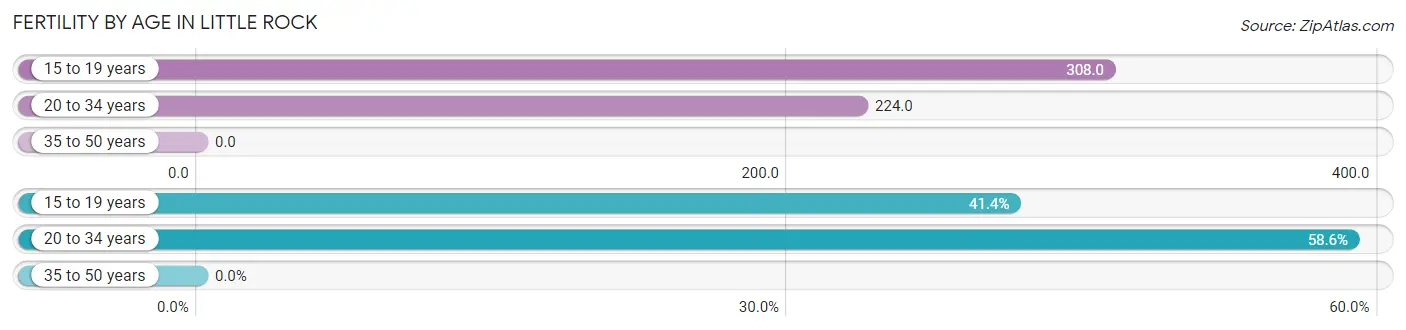
| Age Bracket | Women with Births | Births / 1,000 Women |
| 15 to 19 years | 12 (41.4%) | 308.0 |
| 20 to 34 years | 17 (58.6%) | 224.0 |
| 35 to 50 years | 0 (0.0%) | 0.0 |
| Total | 29 (100.0%) | 149.0 |
Fertility by Age by Marriage Status in Little Rock
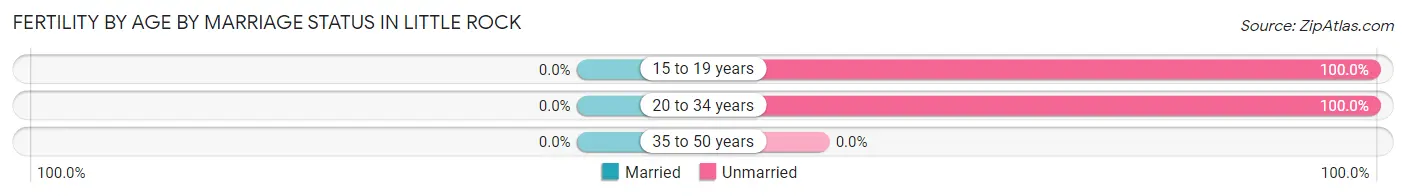
| Age Bracket | Married | Unmarried |
| 15 to 19 years | 0 (0.0%) | 12 (100.0%) |
| 20 to 34 years | 0 (0.0%) | 17 (100.0%) |
| 35 to 50 years | 0 (0.0%) | 0 (0.0%) |
| Total | 0 (0.0%) | 29 (100.0%) |
Fertility by Education in Little Rock
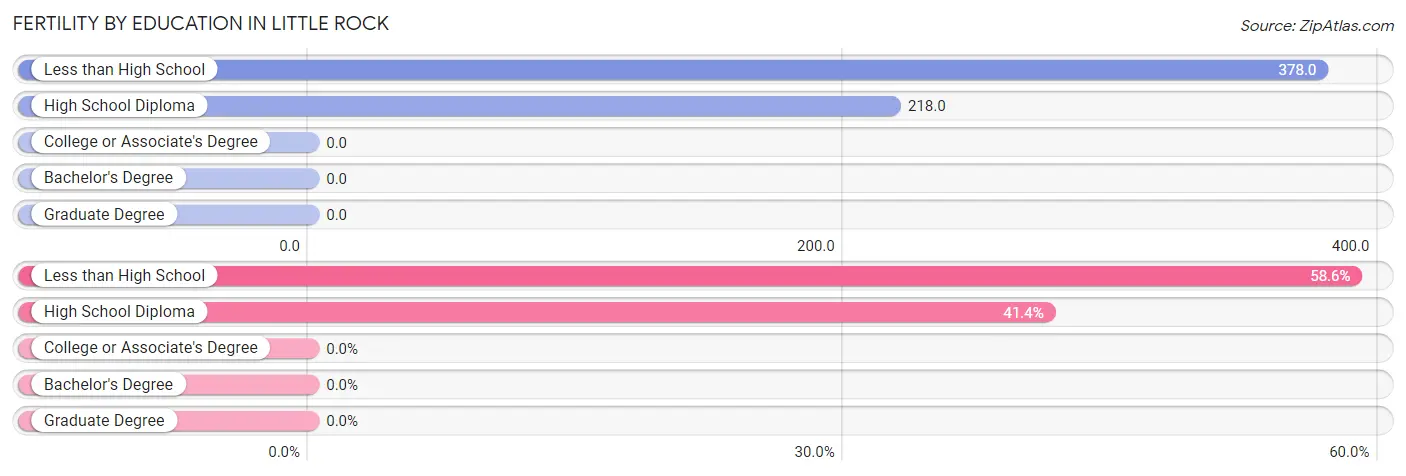
| Educational Attainment | Women with Births | Births / 1,000 Women |
| Less than High School | 17 (58.6%) | 378.0 |
| High School Diploma | 12 (41.4%) | 218.0 |
| College or Associate's Degree | 0 (0.0%) | 0.0 |
| Bachelor's Degree | 0 (0.0%) | 0.0 |
| Graduate Degree | 0 (0.0%) | 0.0 |
| Total | 29 (100.0%) | 149.0 |
Fertility by Education by Marriage Status in Little Rock
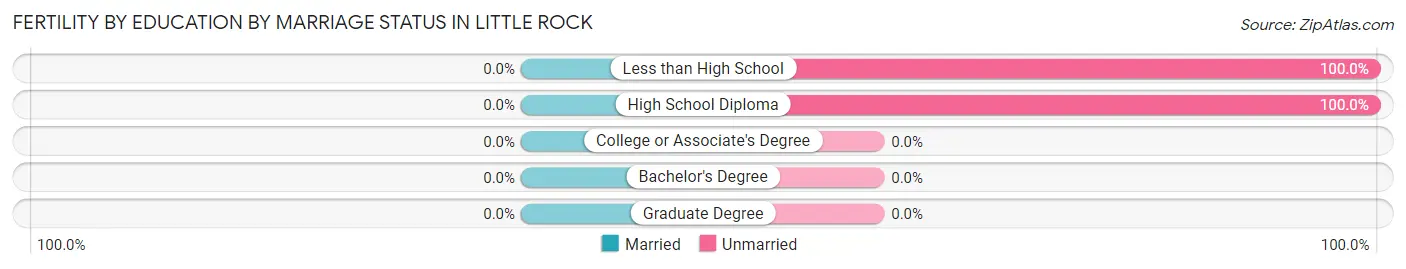
| Educational Attainment | Married | Unmarried |
| Less than High School | 0 (0.0%) | 17 (100.0%) |
| High School Diploma | 0 (0.0%) | 12 (100.0%) |
| College or Associate's Degree | 0 (0.0%) | 0 (0.0%) |
| Bachelor's Degree | 0 (0.0%) | 0 (0.0%) |
| Graduate Degree | 0 (0.0%) | 0 (0.0%) |
| Total | 0 (0.0%) | 29 (100.0%) |
Employment Characteristics in Little Rock
Employment by Class of Employer in Little Rock
Among the 303 employed individuals in Little Rock, private company employees (141 | 46.5%), local government employees (132 | 43.6%), and federal government employees (18 | 5.9%) make up the most common classes of employment.
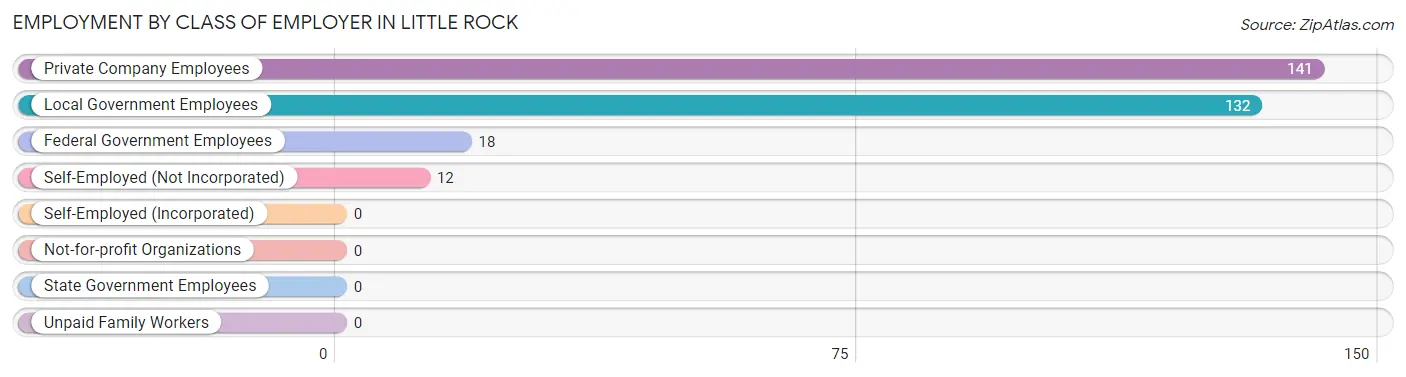
| Employer Class | # Employees | % Employees |
| Private Company Employees | 141 | 46.5% |
| Self-Employed (Incorporated) | 0 | 0.0% |
| Self-Employed (Not Incorporated) | 12 | 4.0% |
| Not-for-profit Organizations | 0 | 0.0% |
| Local Government Employees | 132 | 43.6% |
| State Government Employees | 0 | 0.0% |
| Federal Government Employees | 18 | 5.9% |
| Unpaid Family Workers | 0 | 0.0% |
| Total | 303 | 100.0% |
Employment Status by Age in Little Rock
According to the labor force statistics for Little Rock, out of the total population over 16 years of age (597), 73.0% or 436 individuals are in the labor force, with 23.6% or 103 of them unemployed. The age group with the highest labor force participation rate is 20 to 24 years, with 100.0% or 99 individuals in the labor force. Within the labor force, the 20 to 24 years age range has the highest percentage of unemployed individuals, with 56.6% or 56 of them being unemployed.
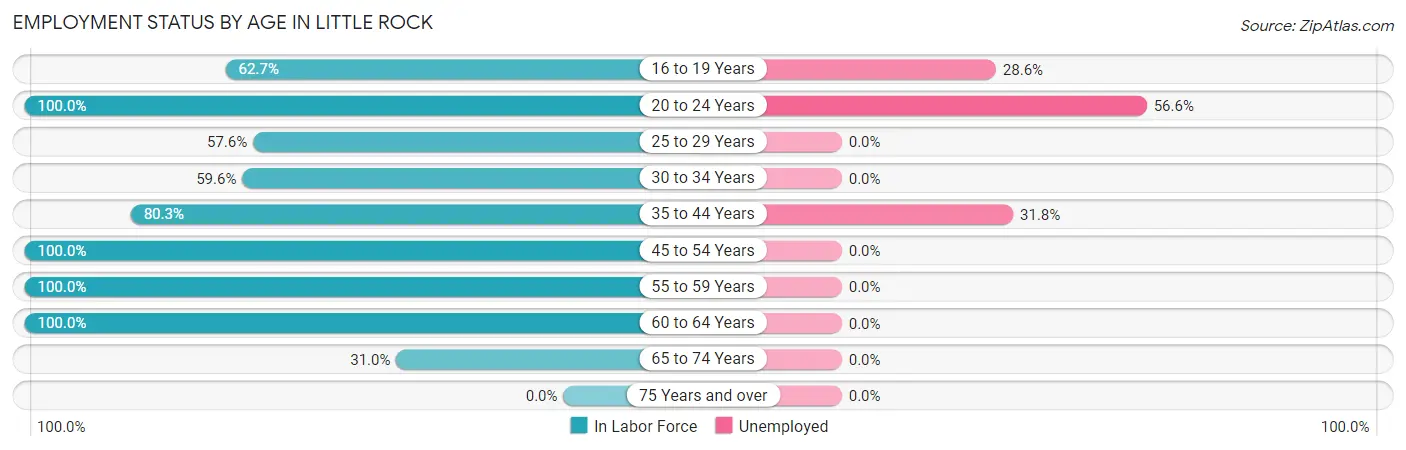
| Age Bracket | In Labor Force | Unemployed |
| 16 to 19 Years | 42 (62.7%) | 12 (28.6%) |
| 20 to 24 Years | 99 (100.0%) | 56 (56.6%) |
| 25 to 29 Years | 38 (57.6%) | 0 (0.0%) |
| 30 to 34 Years | 34 (59.6%) | 0 (0.0%) |
| 35 to 44 Years | 110 (80.3%) | 35 (31.8%) |
| 45 to 54 Years | 28 (100.0%) | 0 (0.0%) |
| 55 to 59 Years | 30 (100.0%) | 0 (0.0%) |
| 60 to 64 Years | 29 (100.0%) | 0 (0.0%) |
| 65 to 74 Years | 26 (31.0%) | 0 (0.0%) |
| 75 Years and over | 0 (0.0%) | 0 (0.0%) |
| Total | 436 (73.0%) | 103 (23.6%) |
Employment Status by Educational Attainment in Little Rock
According to labor force statistics for Little Rock, 77.5% of individuals (269) out of the total population between 25 and 64 years of age (347) are in the labor force, with 13.0% or 35 of them being unemployed. The group with the highest labor force participation rate are those with the educational attainment of college / associate degree, with 100.0% or 135 individuals in the labor force. Within the labor force, individuals with high school diploma education have the highest percentage of unemployment, with 20.7% or 17 of them being unemployed.
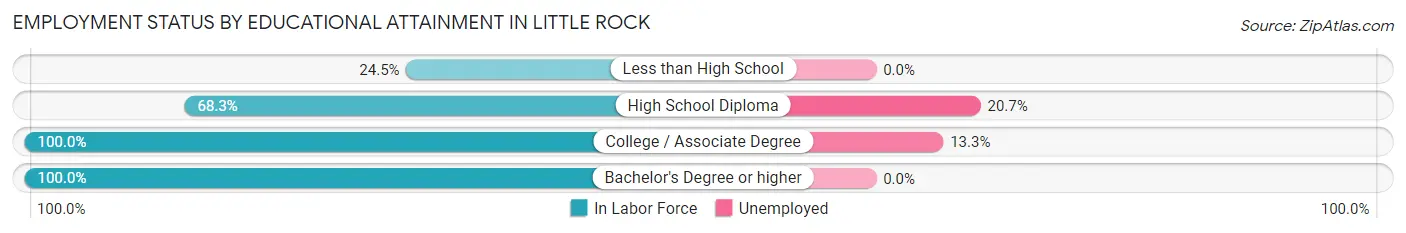
| Educational Attainment | In Labor Force | Unemployed |
| Less than High School | 13 (24.5%) | 0 (0.0%) |
| High School Diploma | 82 (68.3%) | 25 (20.7%) |
| College / Associate Degree | 135 (100.0%) | 18 (13.3%) |
| Bachelor's Degree or higher | 39 (100.0%) | 0 (0.0%) |
| Total | 269 (77.5%) | 45 (13.0%) |
Employment Occupations by Sex in Little Rock
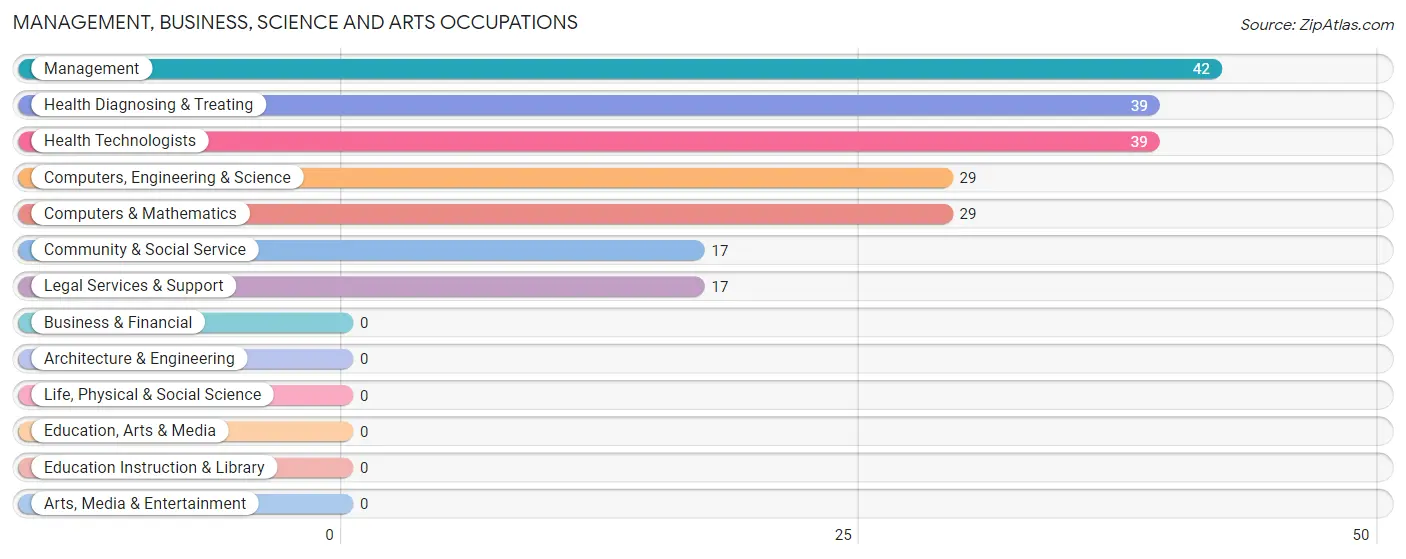
Management, Business, Science and Arts Occupations
The most common Management, Business, Science and Arts occupations in Little Rock are Management (42 | 12.6%), Health Diagnosing & Treating (39 | 11.7%), Health Technologists (39 | 11.7%), Computers, Engineering & Science (29 | 8.7%), and Computers & Mathematics (29 | 8.7%).
Management, Business, Science and Arts Occupations by Sex
Within the Management, Business, Science and Arts occupations in Little Rock, the most male-oriented occupations are Computers, Engineering & Science (100.0%), Computers & Mathematics (100.0%), and Management (59.5%), while the most female-oriented occupations are Community & Social Service (100.0%), Legal Services & Support (100.0%), and Health Diagnosing & Treating (48.7%).
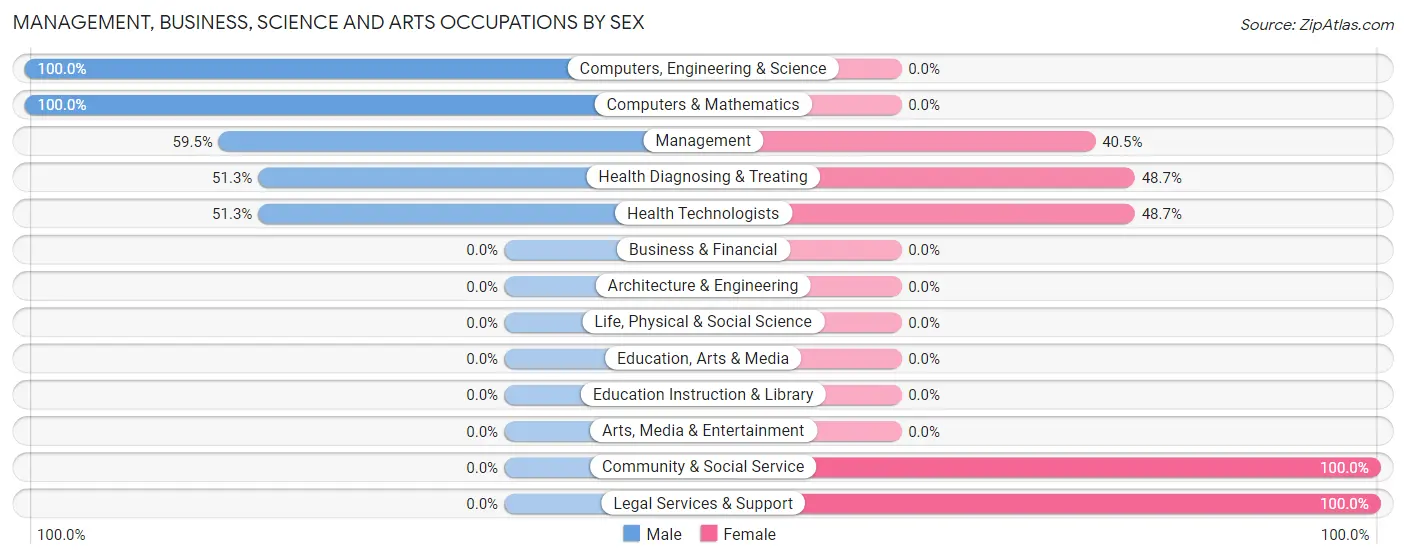
| Occupation | Male | Female |
| Management | 25 (59.5%) | 17 (40.5%) |
| Business & Financial | 0 (0.0%) | 0 (0.0%) |
| Computers, Engineering & Science | 29 (100.0%) | 0 (0.0%) |
| Computers & Mathematics | 29 (100.0%) | 0 (0.0%) |
| Architecture & Engineering | 0 (0.0%) | 0 (0.0%) |
| Life, Physical & Social Science | 0 (0.0%) | 0 (0.0%) |
| Community & Social Service | 0 (0.0%) | 17 (100.0%) |
| Education, Arts & Media | 0 (0.0%) | 0 (0.0%) |
| Legal Services & Support | 0 (0.0%) | 17 (100.0%) |
| Education Instruction & Library | 0 (0.0%) | 0 (0.0%) |
| Arts, Media & Entertainment | 0 (0.0%) | 0 (0.0%) |
| Health Diagnosing & Treating | 20 (51.3%) | 19 (48.7%) |
| Health Technologists | 20 (51.3%) | 19 (48.7%) |
| Total (Category) | 74 (58.3%) | 53 (41.7%) |
| Total (Overall) | 208 (62.5%) | 125 (37.5%) |
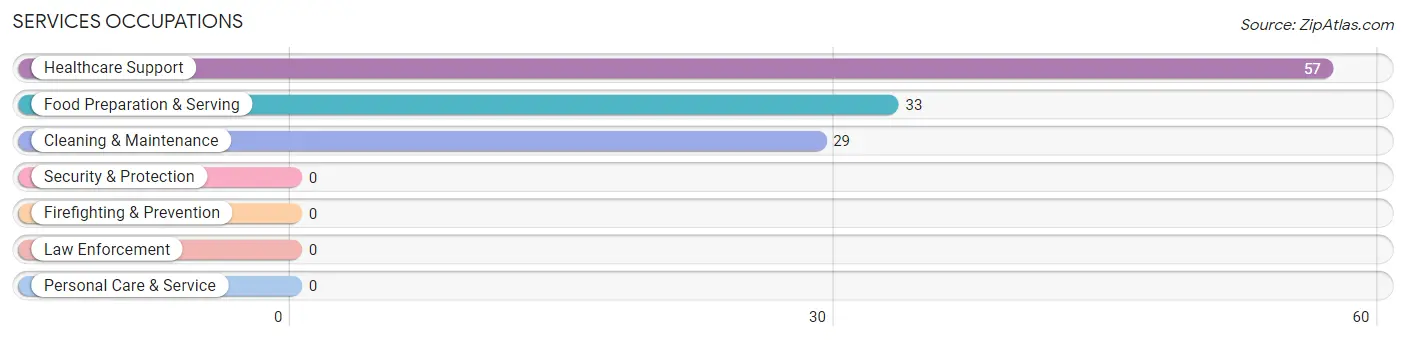
Services Occupations
The most common Services occupations in Little Rock are Healthcare Support (57 | 17.1%), Food Preparation & Serving (33 | 9.9%), and Cleaning & Maintenance (29 | 8.7%).
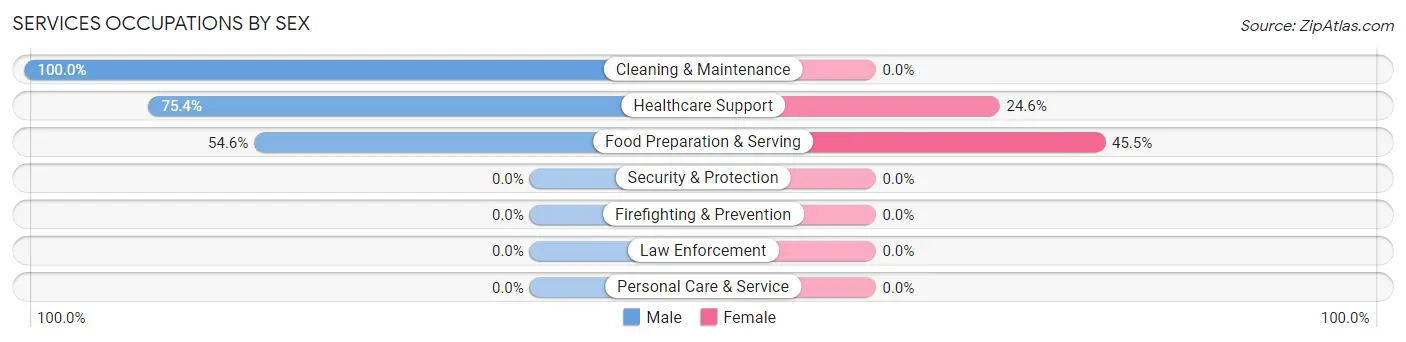
Services Occupations by Sex
Within the Services occupations in Little Rock, the most male-oriented occupations are Cleaning & Maintenance (100.0%), Healthcare Support (75.4%), and Food Preparation & Serving (54.5%), while the most female-oriented occupations are Food Preparation & Serving (45.5%), and Healthcare Support (24.6%).
| Occupation | Male | Female |
| Healthcare Support | 43 (75.4%) | 14 (24.6%) |
| Security & Protection | 0 (0.0%) | 0 (0.0%) |
| Firefighting & Prevention | 0 (0.0%) | 0 (0.0%) |
| Law Enforcement | 0 (0.0%) | 0 (0.0%) |
| Food Preparation & Serving | 18 (54.5%) | 15 (45.5%) |
| Cleaning & Maintenance | 29 (100.0%) | 0 (0.0%) |
| Personal Care & Service | 0 (0.0%) | 0 (0.0%) |
| Total (Category) | 90 (75.6%) | 29 (24.4%) |
| Total (Overall) | 208 (62.5%) | 125 (37.5%) |
Sales and Office Occupations
The most common Sales and Office occupations in Little Rock are Office & Administration (25 | 7.5%), and Sales & Related (15 | 4.5%).

Sales and Office Occupations by Sex

| Occupation | Male | Female |
| Sales & Related | 15 (100.0%) | 0 (0.0%) |
| Office & Administration | 0 (0.0%) | 25 (100.0%) |
| Total (Category) | 15 (37.5%) | 25 (62.5%) |
| Total (Overall) | 208 (62.5%) | 125 (37.5%) |
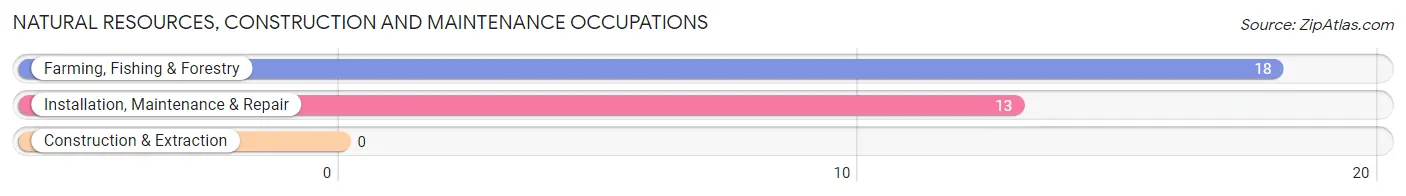
Natural Resources, Construction and Maintenance Occupations
The most common Natural Resources, Construction and Maintenance occupations in Little Rock are Farming, Fishing & Forestry (18 | 5.4%), and Installation, Maintenance & Repair (13 | 3.9%).
Natural Resources, Construction and Maintenance Occupations by Sex

| Occupation | Male | Female |
| Farming, Fishing & Forestry | 0 (0.0%) | 18 (100.0%) |
| Construction & Extraction | 0 (0.0%) | 0 (0.0%) |
| Installation, Maintenance & Repair | 13 (100.0%) | 0 (0.0%) |
| Total (Category) | 13 (41.9%) | 18 (58.1%) |
| Total (Overall) | 208 (62.5%) | 125 (37.5%) |
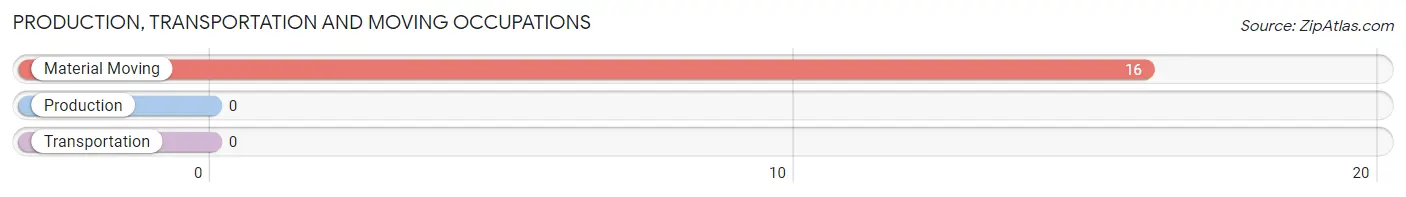
Production, Transportation and Moving Occupations
The most common Production, Transportation and Moving occupations in Little Rock are , and Material Moving (16 | 4.8%).
Production, Transportation and Moving Occupations by Sex
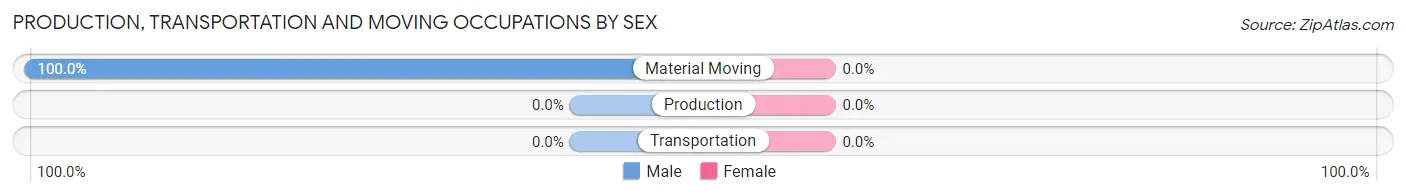
| Occupation | Male | Female |
| Production | 0 (0.0%) | 0 (0.0%) |
| Transportation | 0 (0.0%) | 0 (0.0%) |
| Material Moving | 16 (100.0%) | 0 (0.0%) |
| Total (Category) | 16 (100.0%) | 0 (0.0%) |
| Total (Overall) | 208 (62.5%) | 125 (37.5%) |
Employment Industries by Sex in Little Rock
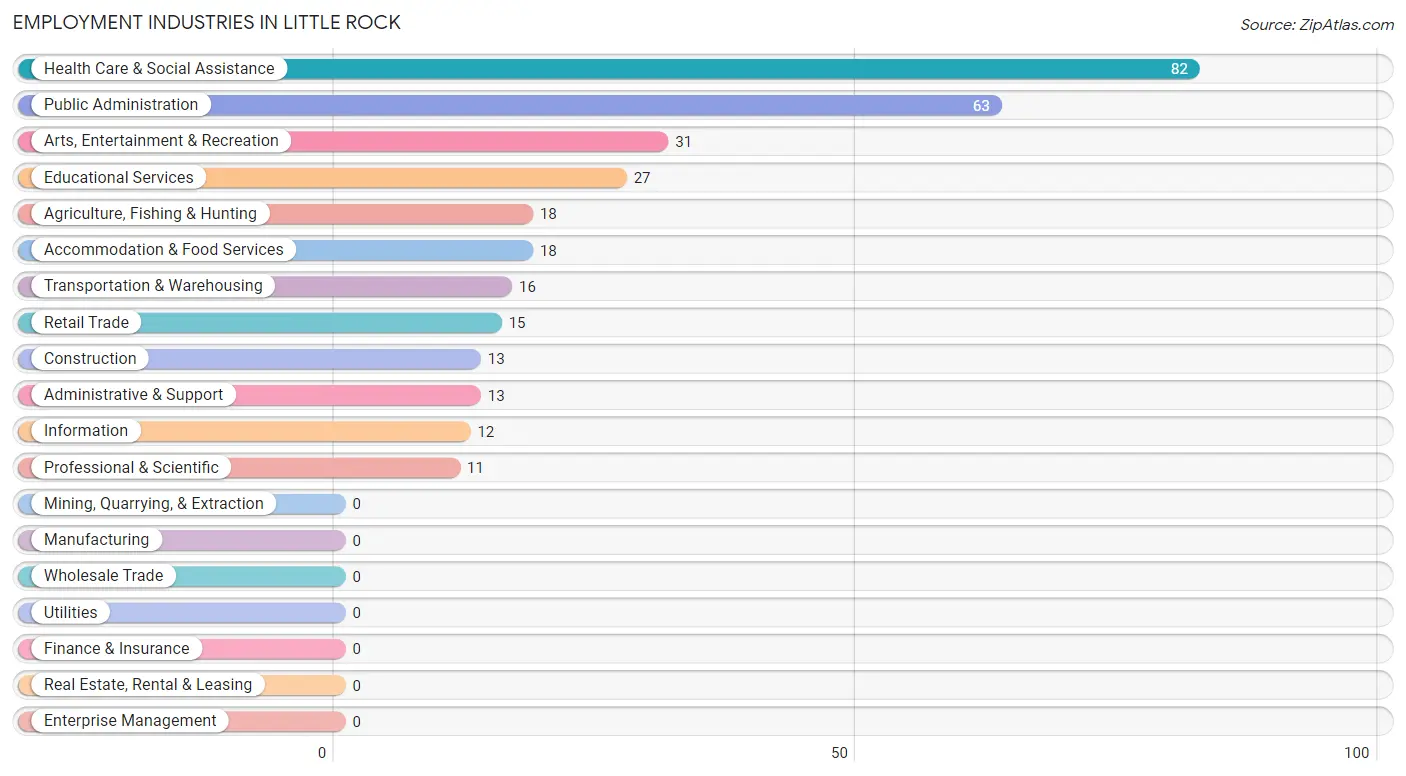
Employment Industries in Little Rock
The major employment industries in Little Rock include Health Care & Social Assistance (82 | 24.6%), Public Administration (63 | 18.9%), Arts, Entertainment & Recreation (31 | 9.3%), Educational Services (27 | 8.1%), and Agriculture, Fishing & Hunting (18 | 5.4%).
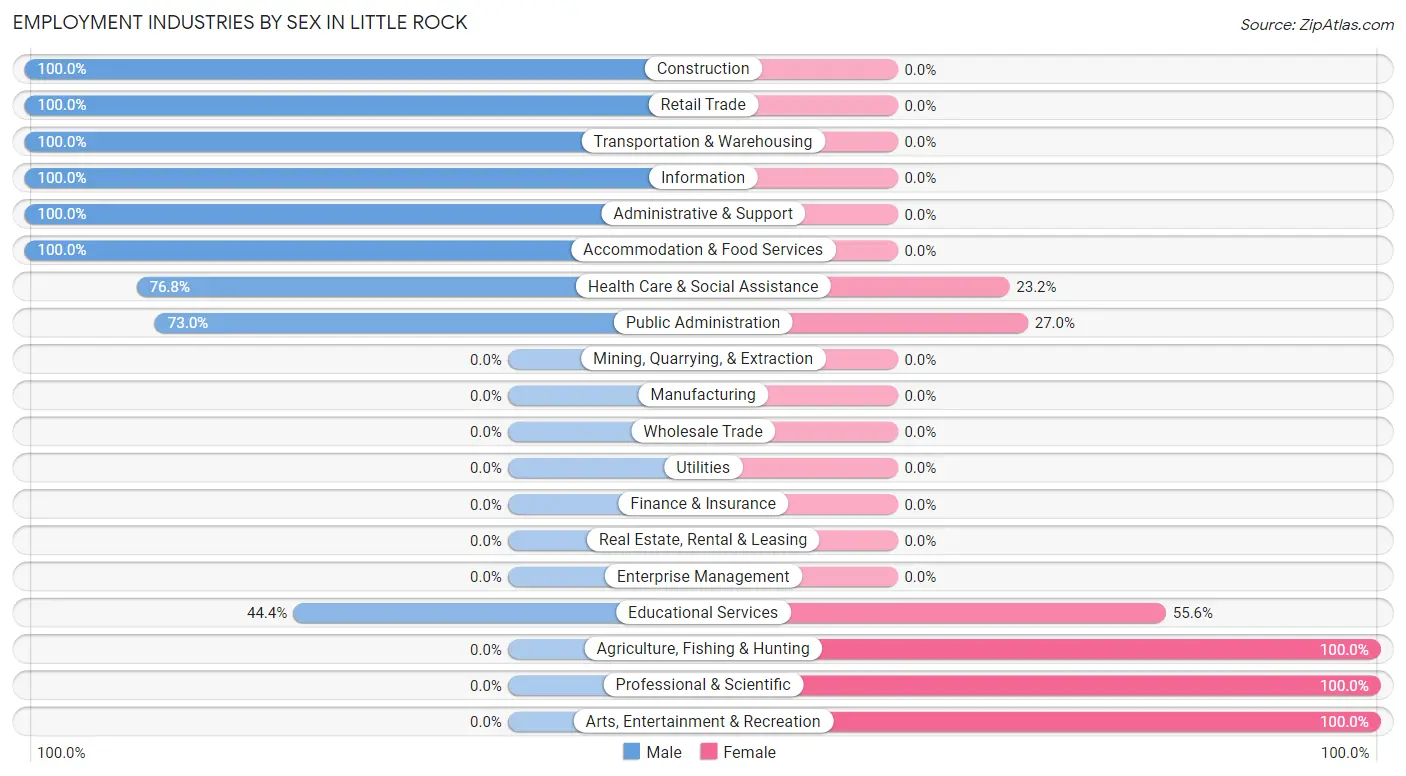
Employment Industries by Sex in Little Rock
The Little Rock industries that see more men than women are Construction (100.0%), Retail Trade (100.0%), and Transportation & Warehousing (100.0%), whereas the industries that tend to have a higher number of women are Agriculture, Fishing & Hunting (100.0%), Professional & Scientific (100.0%), and Arts, Entertainment & Recreation (100.0%).
| Industry | Male | Female |
| Agriculture, Fishing & Hunting | 0 (0.0%) | 18 (100.0%) |
| Mining, Quarrying, & Extraction | 0 (0.0%) | 0 (0.0%) |
| Construction | 13 (100.0%) | 0 (0.0%) |
| Manufacturing | 0 (0.0%) | 0 (0.0%) |
| Wholesale Trade | 0 (0.0%) | 0 (0.0%) |
| Retail Trade | 15 (100.0%) | 0 (0.0%) |
| Transportation & Warehousing | 16 (100.0%) | 0 (0.0%) |
| Utilities | 0 (0.0%) | 0 (0.0%) |
| Information | 12 (100.0%) | 0 (0.0%) |
| Finance & Insurance | 0 (0.0%) | 0 (0.0%) |
| Real Estate, Rental & Leasing | 0 (0.0%) | 0 (0.0%) |
| Professional & Scientific | 0 (0.0%) | 11 (100.0%) |
| Enterprise Management | 0 (0.0%) | 0 (0.0%) |
| Administrative & Support | 13 (100.0%) | 0 (0.0%) |
| Educational Services | 12 (44.4%) | 15 (55.6%) |
| Health Care & Social Assistance | 63 (76.8%) | 19 (23.2%) |
| Arts, Entertainment & Recreation | 0 (0.0%) | 31 (100.0%) |
| Accommodation & Food Services | 18 (100.0%) | 0 (0.0%) |
| Public Administration | 46 (73.0%) | 17 (27.0%) |
| Total | 208 (62.5%) | 125 (37.5%) |
Education in Little Rock
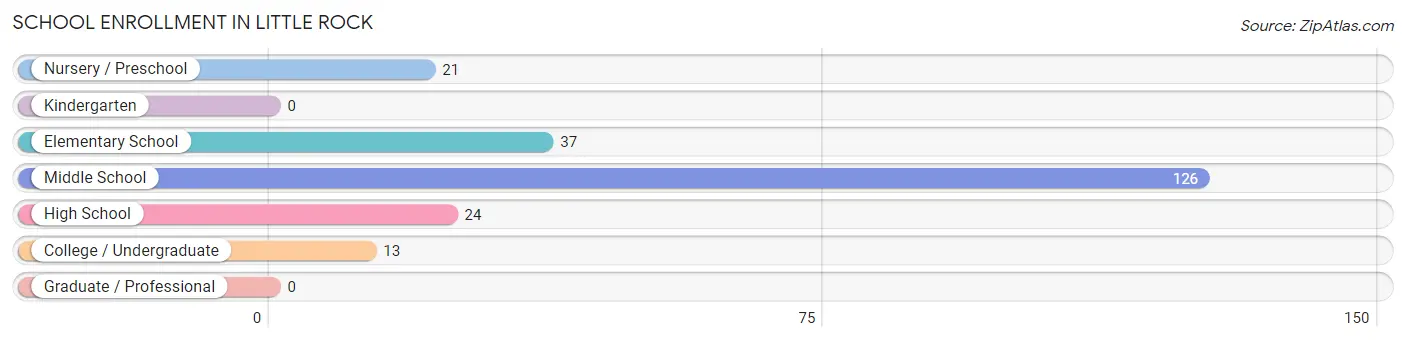
School Enrollment in Little Rock
The most common levels of schooling among the 221 students in Little Rock are middle school (126 | 57.0%), elementary school (37 | 16.7%), and high school (24 | 10.9%).
| School Level | # Students | % Students |
| Nursery / Preschool | 21 | 9.5% |
| Kindergarten | 0 | 0.0% |
| Elementary School | 37 | 16.7% |
| Middle School | 126 | 57.0% |
| High School | 24 | 10.9% |
| College / Undergraduate | 13 | 5.9% |
| Graduate / Professional | 0 | 0.0% |
| Total | 221 | 100.0% |
School Enrollment by Age by Funding Source in Little Rock
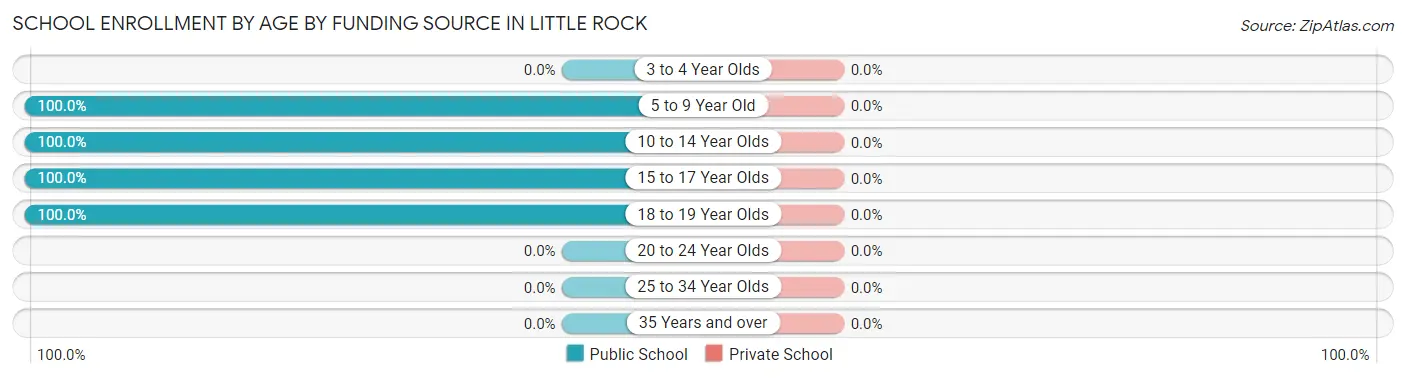
| Age Bracket | Public School | Private School |
| 3 to 4 Year Olds | 0 (0.0%) | 0 (0.0%) |
| 5 to 9 Year Old | 58 (100.0%) | 0 (0.0%) |
| 10 to 14 Year Olds | 126 (100.0%) | 0 (0.0%) |
| 15 to 17 Year Olds | 24 (100.0%) | 0 (0.0%) |
| 18 to 19 Year Olds | 13 (100.0%) | 0 (0.0%) |
| 20 to 24 Year Olds | 0 (0.0%) | 0 (0.0%) |
| 25 to 34 Year Olds | 0 (0.0%) | 0 (0.0%) |
| 35 Years and over | 0 (0.0%) | 0 (0.0%) |
| Total | 221 (100.0%) | 0 (0.0%) |
Educational Attainment by Field of Study in Little Rock
, and science & technology (39 | 100.0%) are the most common fields of study among 39 individuals in Little Rock who have obtained a bachelor's degree or higher.
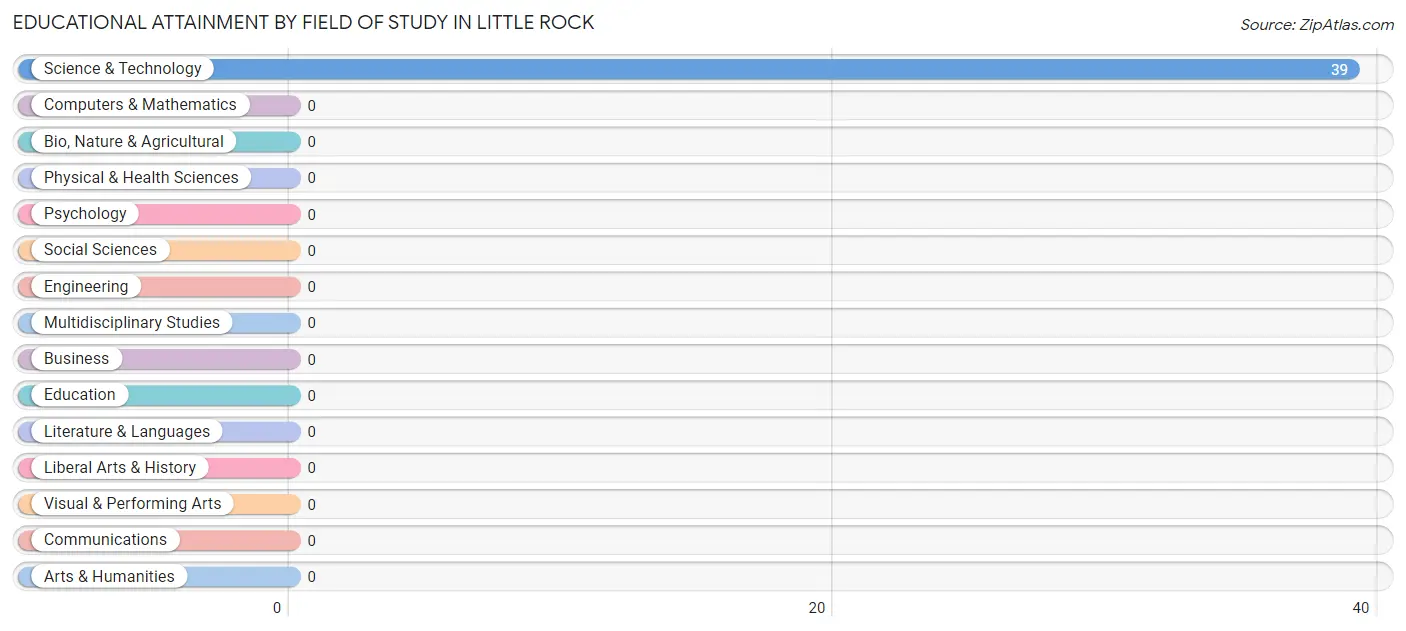
| Field of Study | # Graduates | % Graduates |
| Computers & Mathematics | 0 | 0.0% |
| Bio, Nature & Agricultural | 0 | 0.0% |
| Physical & Health Sciences | 0 | 0.0% |
| Psychology | 0 | 0.0% |
| Social Sciences | 0 | 0.0% |
| Engineering | 0 | 0.0% |
| Multidisciplinary Studies | 0 | 0.0% |
| Science & Technology | 39 | 100.0% |
| Business | 0 | 0.0% |
| Education | 0 | 0.0% |
| Literature & Languages | 0 | 0.0% |
| Liberal Arts & History | 0 | 0.0% |
| Visual & Performing Arts | 0 | 0.0% |
| Communications | 0 | 0.0% |
| Arts & Humanities | 0 | 0.0% |
| Total | 39 | 100.0% |
Transportation & Commute in Little Rock
Vehicle Availability by Sex in Little Rock
The most prevalent vehicle ownership categories in Little Rock are males with 2 vehicles (84, accounting for 47.2%) and females with 2 vehicles (58, making up 67.2%).
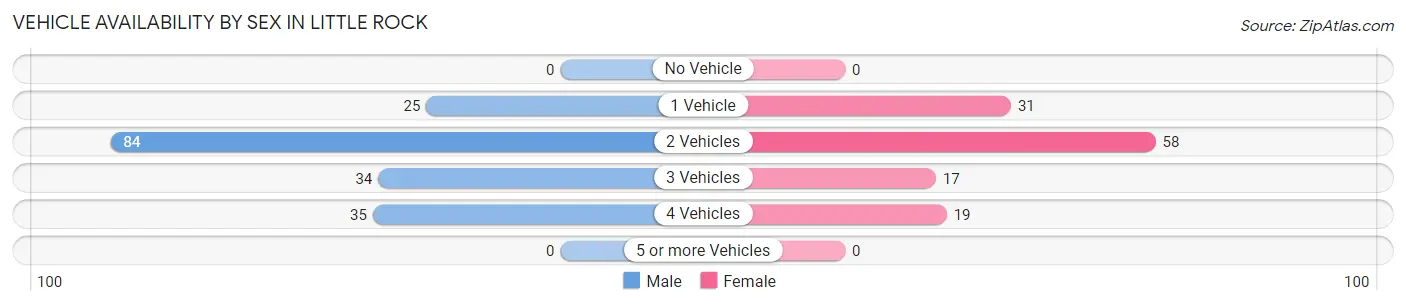
| Vehicles Available | Male | Female |
| No Vehicle | 0 (0.0%) | 0 (0.0%) |
| 1 Vehicle | 25 (14.0%) | 31 (24.8%) |
| 2 Vehicles | 84 (47.2%) | 58 (46.4%) |
| 3 Vehicles | 34 (19.1%) | 17 (13.6%) |
| 4 Vehicles | 35 (19.7%) | 19 (15.2%) |
| 5 or more Vehicles | 0 (0.0%) | 0 (0.0%) |
| Total | 178 (100.0%) | 125 (100.0%) |
Commute Time in Little Rock
The most frequently occuring commute durations in Little Rock are 5 to 9 minutes (73 commuters, 25.1%), 10 to 14 minutes (56 commuters, 19.2%), and 20 to 24 minutes (43 commuters, 14.8%).
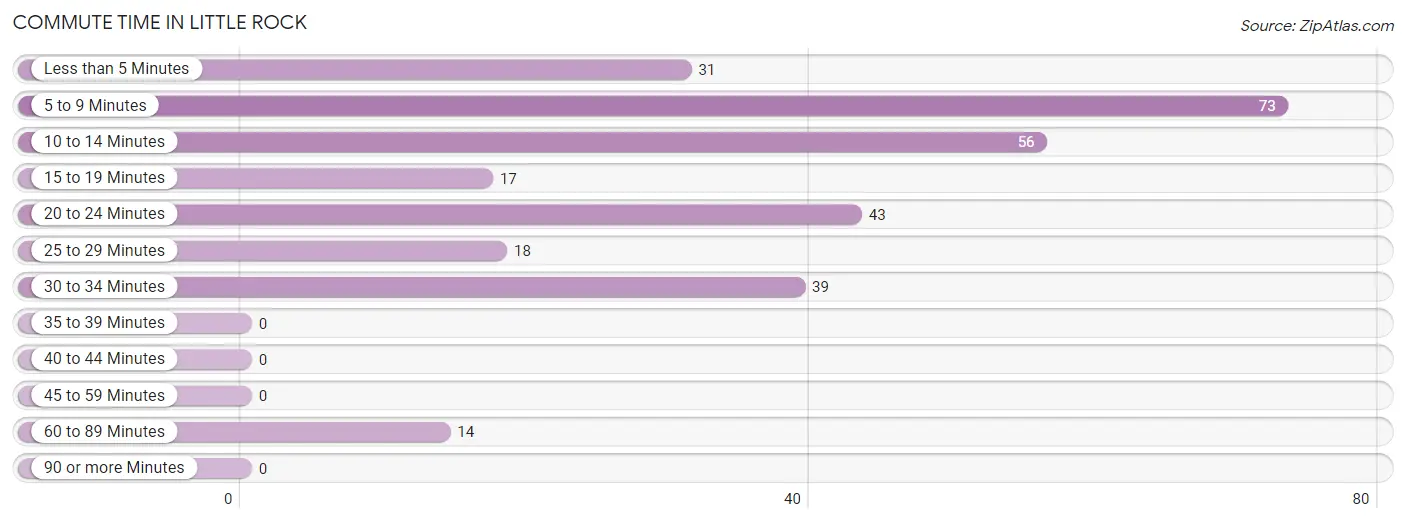
| Commute Time | # Commuters | % Commuters |
| Less than 5 Minutes | 31 | 10.6% |
| 5 to 9 Minutes | 73 | 25.1% |
| 10 to 14 Minutes | 56 | 19.2% |
| 15 to 19 Minutes | 17 | 5.8% |
| 20 to 24 Minutes | 43 | 14.8% |
| 25 to 29 Minutes | 18 | 6.2% |
| 30 to 34 Minutes | 39 | 13.4% |
| 35 to 39 Minutes | 0 | 0.0% |
| 40 to 44 Minutes | 0 | 0.0% |
| 45 to 59 Minutes | 0 | 0.0% |
| 60 to 89 Minutes | 14 | 4.8% |
| 90 or more Minutes | 0 | 0.0% |
Commute Time by Sex in Little Rock
The most common commute times in Little Rock are 5 to 9 minutes (44 commuters, 26.5%) for males and less than 5 minutes (31 commuters, 24.8%) for females.
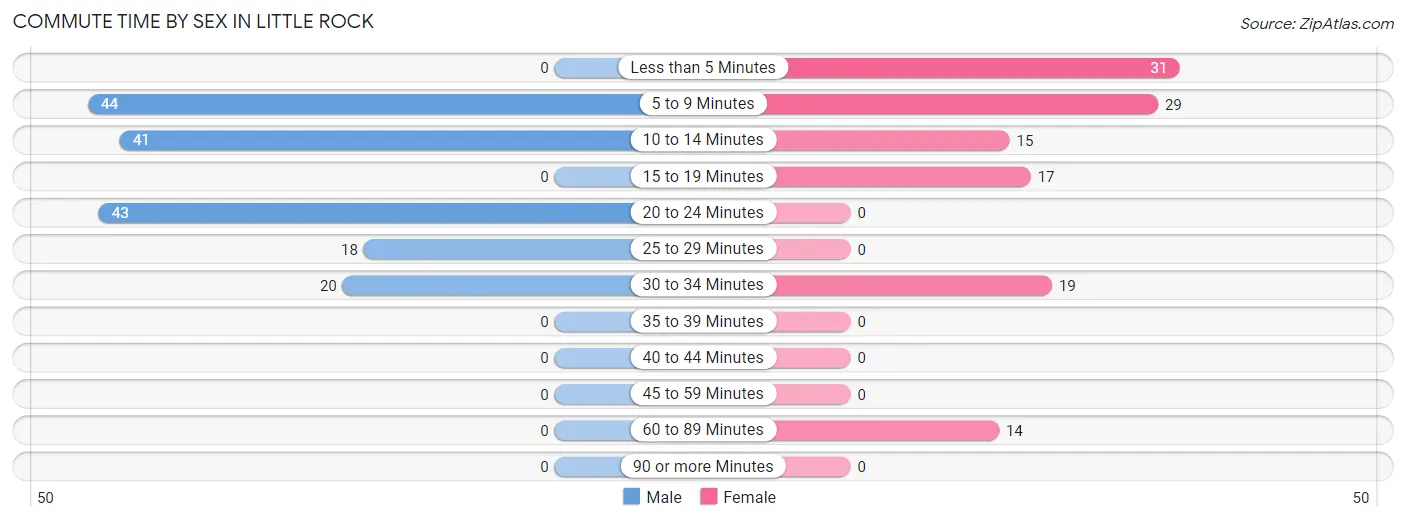
| Commute Time | Male | Female |
| Less than 5 Minutes | 0 (0.0%) | 31 (24.8%) |
| 5 to 9 Minutes | 44 (26.5%) | 29 (23.2%) |
| 10 to 14 Minutes | 41 (24.7%) | 15 (12.0%) |
| 15 to 19 Minutes | 0 (0.0%) | 17 (13.6%) |
| 20 to 24 Minutes | 43 (25.9%) | 0 (0.0%) |
| 25 to 29 Minutes | 18 (10.8%) | 0 (0.0%) |
| 30 to 34 Minutes | 20 (12.0%) | 19 (15.2%) |
| 35 to 39 Minutes | 0 (0.0%) | 0 (0.0%) |
| 40 to 44 Minutes | 0 (0.0%) | 0 (0.0%) |
| 45 to 59 Minutes | 0 (0.0%) | 0 (0.0%) |
| 60 to 89 Minutes | 0 (0.0%) | 14 (11.2%) |
| 90 or more Minutes | 0 (0.0%) | 0 (0.0%) |
Time of Departure to Work by Sex in Little Rock
The most frequent times of departure to work in Little Rock are 7:00 AM to 7:29 AM (60, 36.1%) for males and 7:30 AM to 7:59 AM (63, 50.4%) for females.
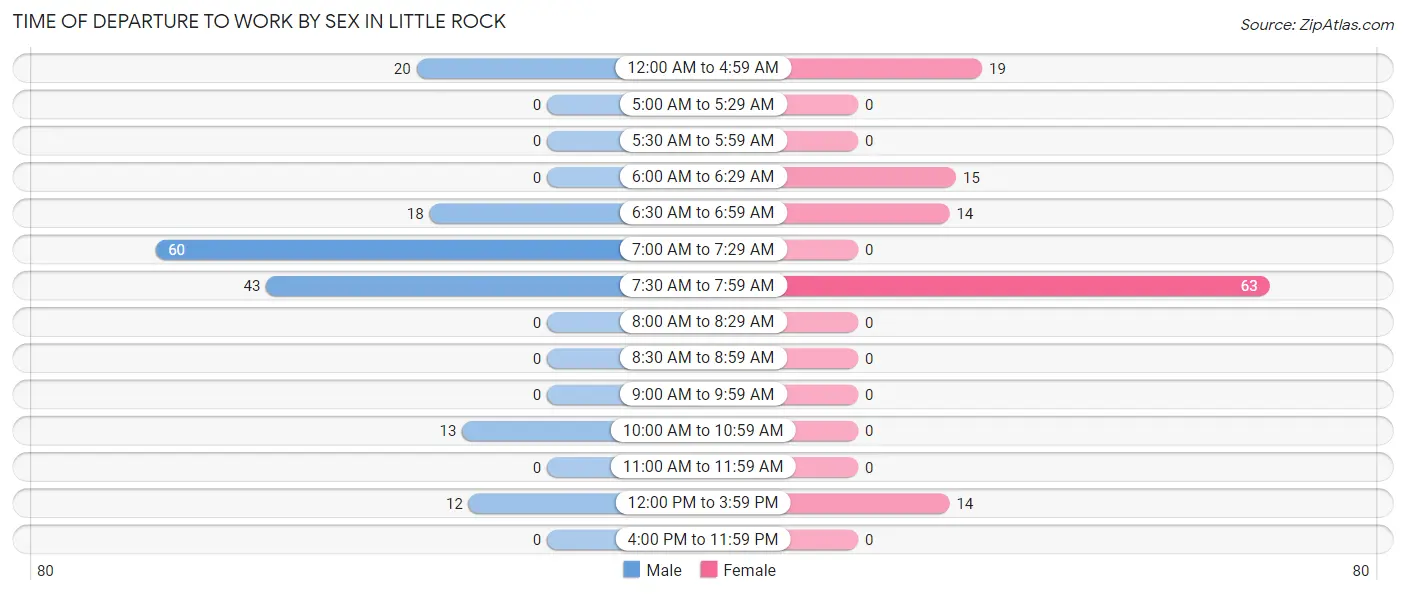
| Time of Departure | Male | Female |
| 12:00 AM to 4:59 AM | 20 (12.0%) | 19 (15.2%) |
| 5:00 AM to 5:29 AM | 0 (0.0%) | 0 (0.0%) |
| 5:30 AM to 5:59 AM | 0 (0.0%) | 0 (0.0%) |
| 6:00 AM to 6:29 AM | 0 (0.0%) | 15 (12.0%) |
| 6:30 AM to 6:59 AM | 18 (10.8%) | 14 (11.2%) |
| 7:00 AM to 7:29 AM | 60 (36.1%) | 0 (0.0%) |
| 7:30 AM to 7:59 AM | 43 (25.9%) | 63 (50.4%) |
| 8:00 AM to 8:29 AM | 0 (0.0%) | 0 (0.0%) |
| 8:30 AM to 8:59 AM | 0 (0.0%) | 0 (0.0%) |
| 9:00 AM to 9:59 AM | 0 (0.0%) | 0 (0.0%) |
| 10:00 AM to 10:59 AM | 13 (7.8%) | 0 (0.0%) |
| 11:00 AM to 11:59 AM | 0 (0.0%) | 0 (0.0%) |
| 12:00 PM to 3:59 PM | 12 (7.2%) | 14 (11.2%) |
| 4:00 PM to 11:59 PM | 0 (0.0%) | 0 (0.0%) |
| Total | 166 (100.0%) | 125 (100.0%) |
Housing Occupancy in Little Rock
Occupancy by Ownership in Little Rock
Of the total 263 dwellings in Little Rock, owner-occupied units account for 183 (69.6%), while renter-occupied units make up 80 (30.4%).
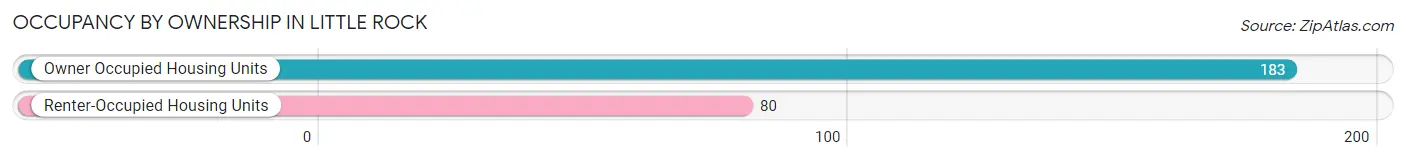
| Occupancy | # Housing Units | % Housing Units |
| Owner Occupied Housing Units | 183 | 69.6% |
| Renter-Occupied Housing Units | 80 | 30.4% |
| Total Occupied Housing Units | 263 | 100.0% |
Occupancy by Household Size in Little Rock
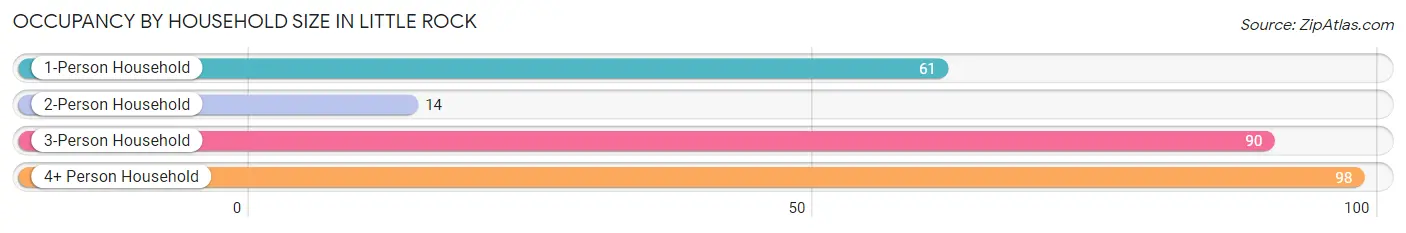
| Household Size | # Housing Units | % Housing Units |
| 1-Person Household | 61 | 23.2% |
| 2-Person Household | 14 | 5.3% |
| 3-Person Household | 90 | 34.2% |
| 4+ Person Household | 98 | 37.3% |
| Total Housing Units | 263 | 100.0% |
Occupancy by Ownership by Household Size in Little Rock
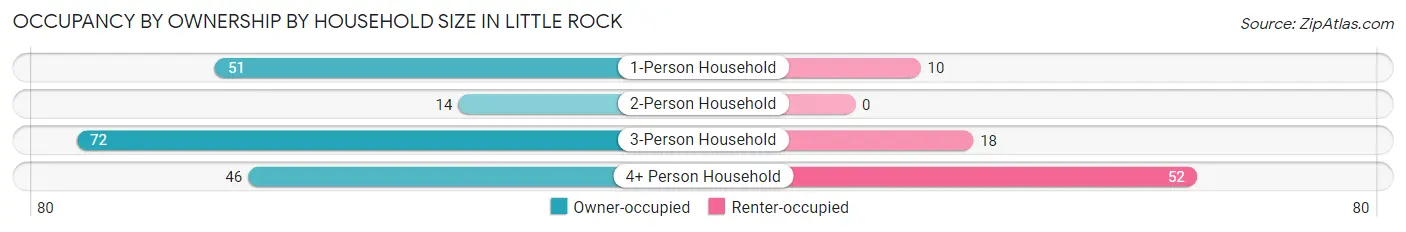
| Household Size | Owner-occupied | Renter-occupied |
| 1-Person Household | 51 (83.6%) | 10 (16.4%) |
| 2-Person Household | 14 (100.0%) | 0 (0.0%) |
| 3-Person Household | 72 (80.0%) | 18 (20.0%) |
| 4+ Person Household | 46 (46.9%) | 52 (53.1%) |
| Total Housing Units | 183 (69.6%) | 80 (30.4%) |
Occupancy by Educational Attainment in Little Rock
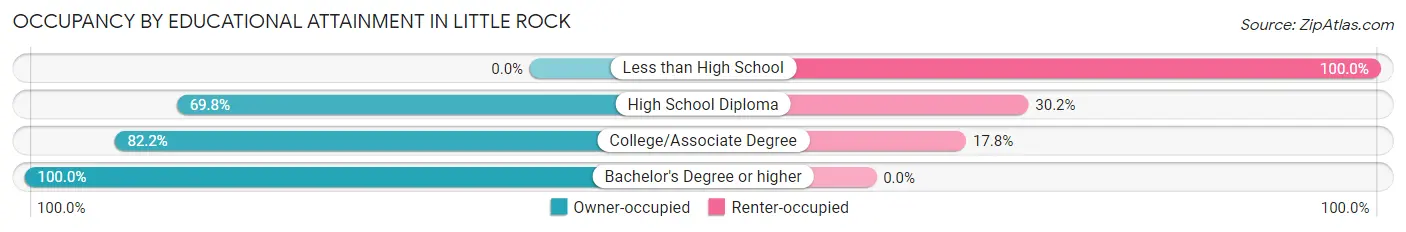
| Household Size | Owner-occupied | Renter-occupied |
| Less than High School | 0 (0.0%) | 27 (100.0%) |
| High School Diploma | 81 (69.8%) | 35 (30.2%) |
| College/Associate Degree | 83 (82.2%) | 18 (17.8%) |
| Bachelor's Degree or higher | 19 (100.0%) | 0 (0.0%) |
Occupancy by Age of Householder in Little Rock
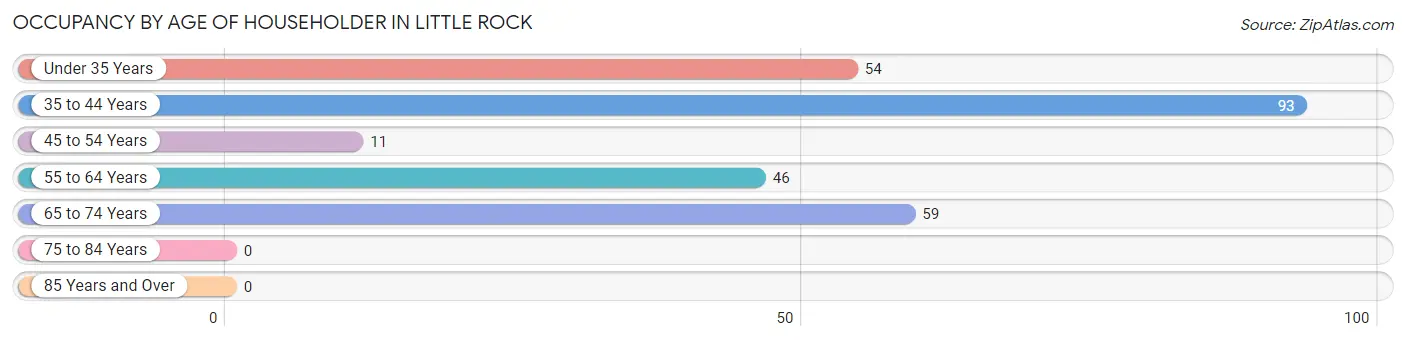
| Age Bracket | # Households | % Households |
| Under 35 Years | 54 | 20.5% |
| 35 to 44 Years | 93 | 35.4% |
| 45 to 54 Years | 11 | 4.2% |
| 55 to 64 Years | 46 | 17.5% |
| 65 to 74 Years | 59 | 22.4% |
| 75 to 84 Years | 0 | 0.0% |
| 85 Years and Over | 0 | 0.0% |
| Total | 263 | 100.0% |
Housing Finances in Little Rock
Median Income by Occupancy in Little Rock
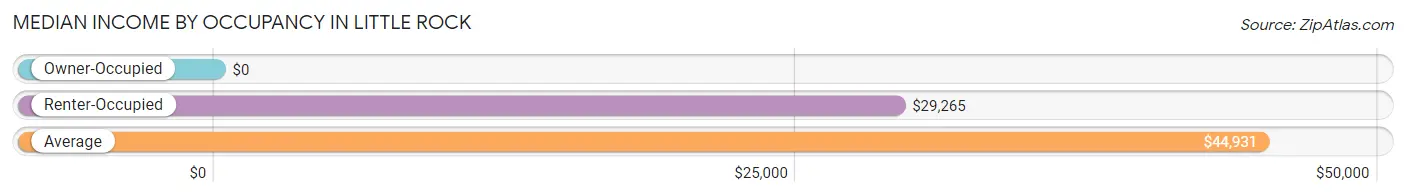
| Occupancy Type | # Households | Median Income |
| Owner-Occupied | 183 (69.6%) | $0 |
| Renter-Occupied | 80 (30.4%) | $29,265 |
| Average | 263 (100.0%) | $44,931 |
Occupancy by Householder Income Bracket in Little Rock
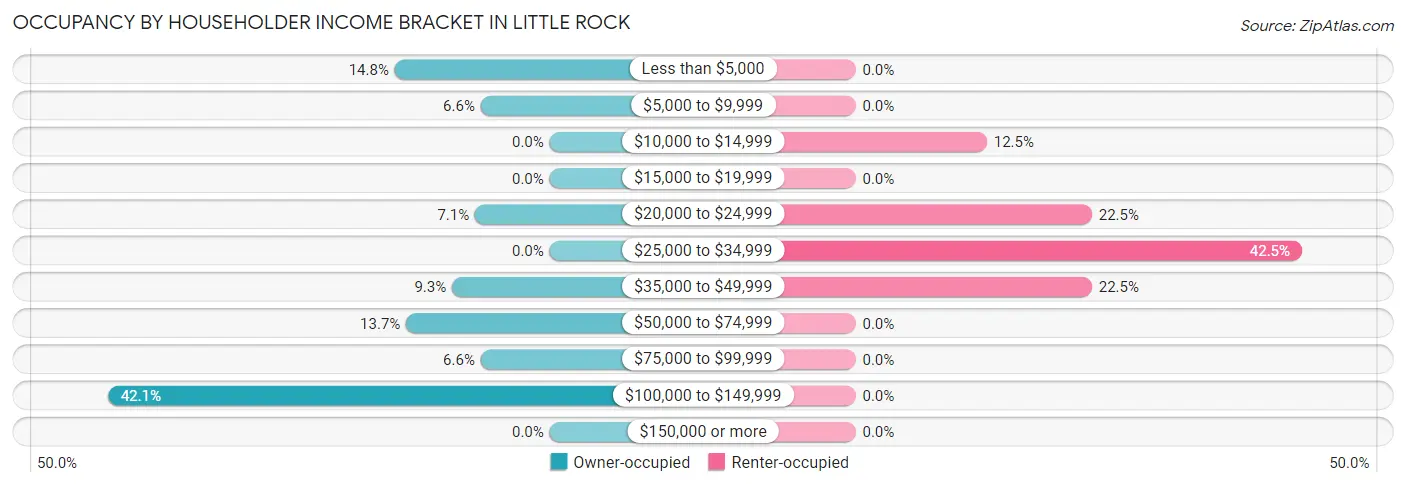
| Income Bracket | Owner-occupied | Renter-occupied |
| Less than $5,000 | 27 (14.7%) | 0 (0.0%) |
| $5,000 to $9,999 | 12 (6.6%) | 0 (0.0%) |
| $10,000 to $14,999 | 0 (0.0%) | 10 (12.5%) |
| $15,000 to $19,999 | 0 (0.0%) | 0 (0.0%) |
| $20,000 to $24,999 | 13 (7.1%) | 18 (22.5%) |
| $25,000 to $34,999 | 0 (0.0%) | 34 (42.5%) |
| $35,000 to $49,999 | 17 (9.3%) | 18 (22.5%) |
| $50,000 to $74,999 | 25 (13.7%) | 0 (0.0%) |
| $75,000 to $99,999 | 12 (6.6%) | 0 (0.0%) |
| $100,000 to $149,999 | 77 (42.1%) | 0 (0.0%) |
| $150,000 or more | 0 (0.0%) | 0 (0.0%) |
| Total | 183 (100.0%) | 80 (100.0%) |
Monthly Housing Cost Tiers in Little Rock
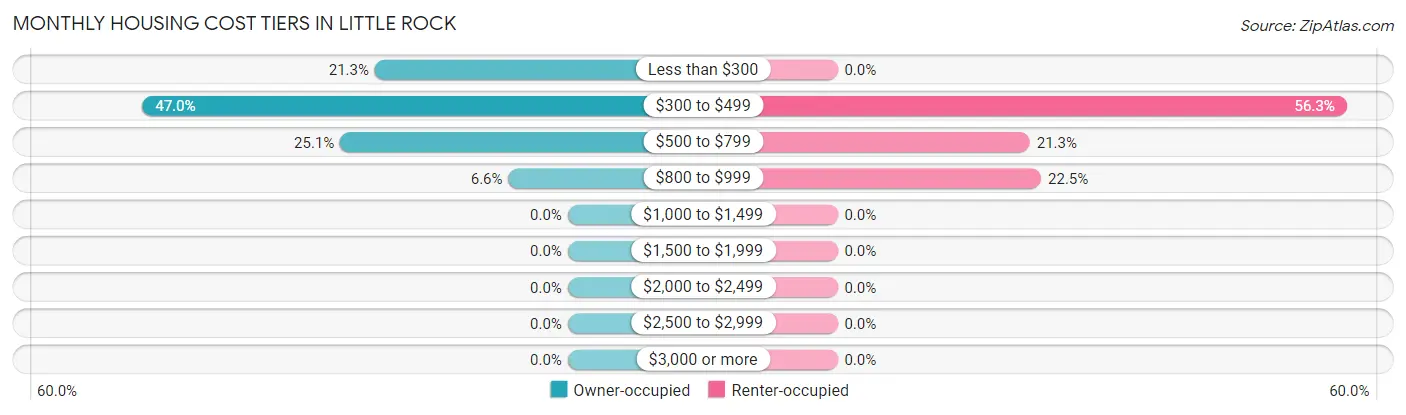
| Monthly Cost | Owner-occupied | Renter-occupied |
| Less than $300 | 39 (21.3%) | 0 (0.0%) |
| $300 to $499 | 86 (47.0%) | 45 (56.2%) |
| $500 to $799 | 46 (25.1%) | 17 (21.2%) |
| $800 to $999 | 12 (6.6%) | 18 (22.5%) |
| $1,000 to $1,499 | 0 (0.0%) | 0 (0.0%) |
| $1,500 to $1,999 | 0 (0.0%) | 0 (0.0%) |
| $2,000 to $2,499 | 0 (0.0%) | 0 (0.0%) |
| $2,500 to $2,999 | 0 (0.0%) | 0 (0.0%) |
| $3,000 or more | 0 (0.0%) | 0 (0.0%) |
| Total | 183 (100.0%) | 80 (100.0%) |
Physical Housing Characteristics in Little Rock
Housing Structures in Little Rock
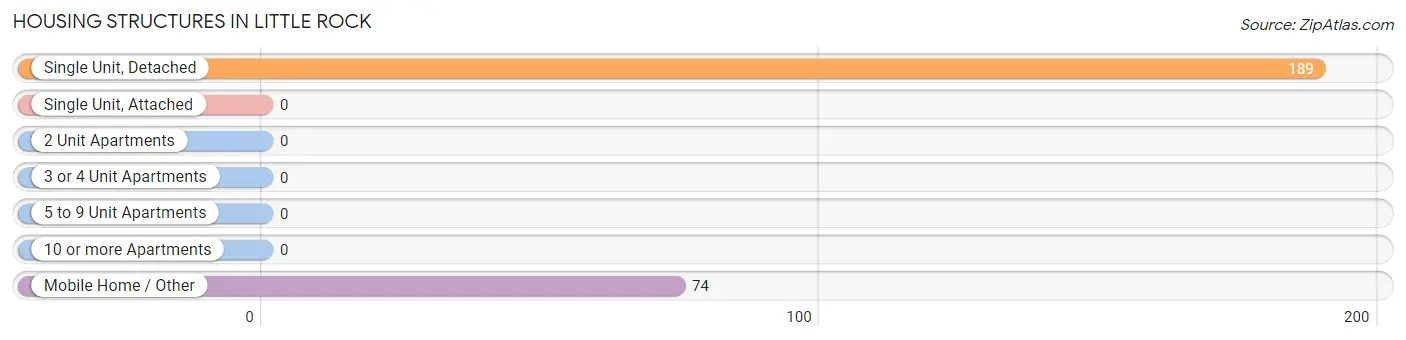
| Structure Type | # Housing Units | % Housing Units |
| Single Unit, Detached | 189 | 71.9% |
| Single Unit, Attached | 0 | 0.0% |
| 2 Unit Apartments | 0 | 0.0% |
| 3 or 4 Unit Apartments | 0 | 0.0% |
| 5 to 9 Unit Apartments | 0 | 0.0% |
| 10 or more Apartments | 0 | 0.0% |
| Mobile Home / Other | 74 | 28.1% |
| Total | 263 | 100.0% |
Housing Structures by Occupancy in Little Rock
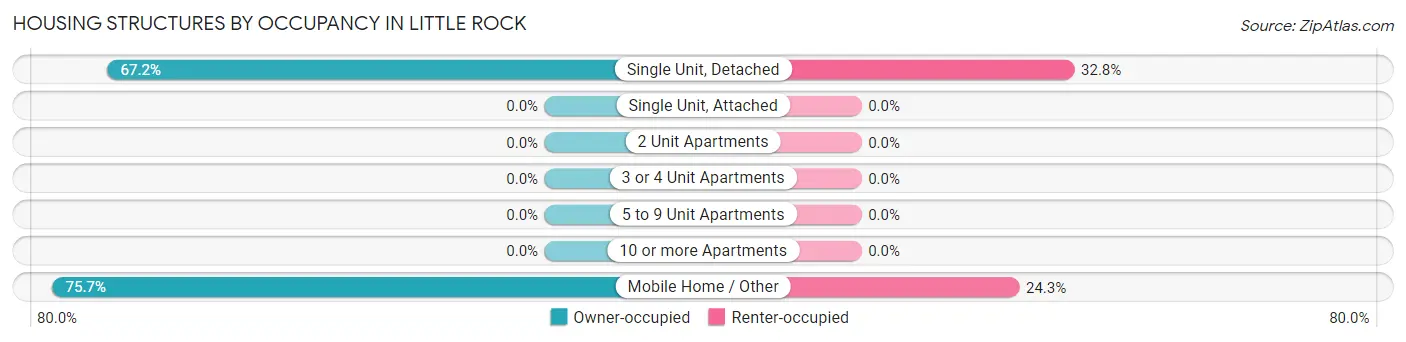
| Structure Type | Owner-occupied | Renter-occupied |
| Single Unit, Detached | 127 (67.2%) | 62 (32.8%) |
| Single Unit, Attached | 0 (0.0%) | 0 (0.0%) |
| 2 Unit Apartments | 0 (0.0%) | 0 (0.0%) |
| 3 or 4 Unit Apartments | 0 (0.0%) | 0 (0.0%) |
| 5 to 9 Unit Apartments | 0 (0.0%) | 0 (0.0%) |
| 10 or more Apartments | 0 (0.0%) | 0 (0.0%) |
| Mobile Home / Other | 56 (75.7%) | 18 (24.3%) |
| Total | 183 (69.6%) | 80 (30.4%) |
Housing Structures by Number of Rooms in Little Rock
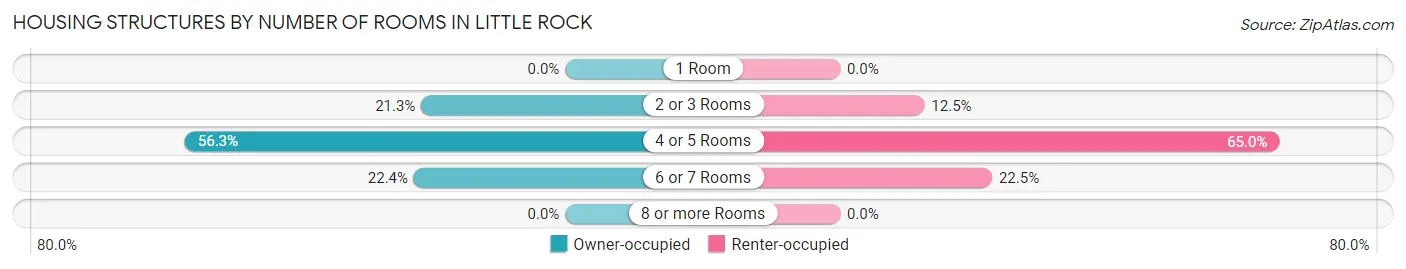
| Number of Rooms | Owner-occupied | Renter-occupied |
| 1 Room | 0 (0.0%) | 0 (0.0%) |
| 2 or 3 Rooms | 39 (21.3%) | 10 (12.5%) |
| 4 or 5 Rooms | 103 (56.3%) | 52 (65.0%) |
| 6 or 7 Rooms | 41 (22.4%) | 18 (22.5%) |
| 8 or more Rooms | 0 (0.0%) | 0 (0.0%) |
| Total | 183 (100.0%) | 80 (100.0%) |
Housing Structure by Heating Type in Little Rock
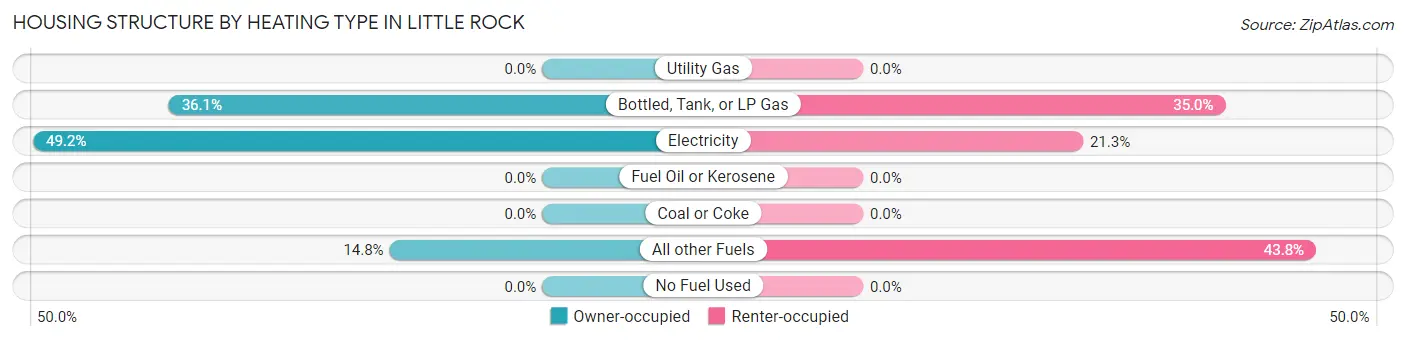
| Heating Type | Owner-occupied | Renter-occupied |
| Utility Gas | 0 (0.0%) | 0 (0.0%) |
| Bottled, Tank, or LP Gas | 66 (36.1%) | 28 (35.0%) |
| Electricity | 90 (49.2%) | 17 (21.2%) |
| Fuel Oil or Kerosene | 0 (0.0%) | 0 (0.0%) |
| Coal or Coke | 0 (0.0%) | 0 (0.0%) |
| All other Fuels | 27 (14.7%) | 35 (43.8%) |
| No Fuel Used | 0 (0.0%) | 0 (0.0%) |
| Total | 183 (100.0%) | 80 (100.0%) |
Household Vehicle Usage in Little Rock
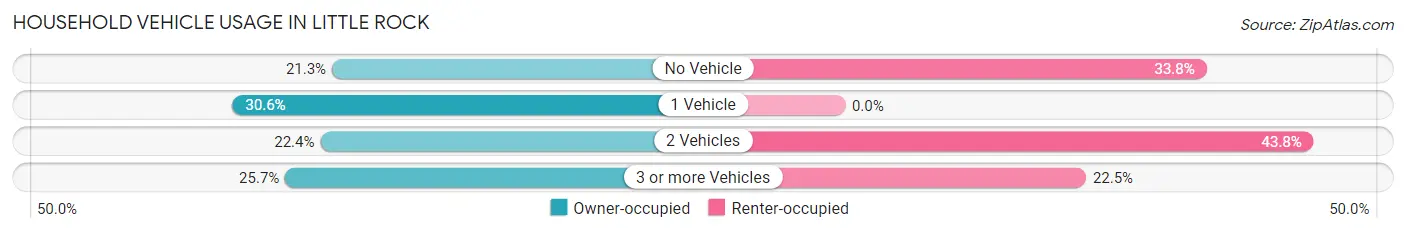
| Vehicles per Household | Owner-occupied | Renter-occupied |
| No Vehicle | 39 (21.3%) | 27 (33.8%) |
| 1 Vehicle | 56 (30.6%) | 0 (0.0%) |
| 2 Vehicles | 41 (22.4%) | 35 (43.8%) |
| 3 or more Vehicles | 47 (25.7%) | 18 (22.5%) |
| Total | 183 (100.0%) | 80 (100.0%) |
Real Estate & Mortgages in Little Rock
Real Estate and Mortgage Overview in Little Rock
| Characteristic | Without Mortgage | With Mortgage |
| Housing Units | 127 | 56 |
| Median Property Value | - | - |
| Median Household Income | - | - |
| Monthly Housing Costs | $369 | $0 |
| Real Estate Taxes | - | - |
Property Value by Mortgage Status in Little Rock
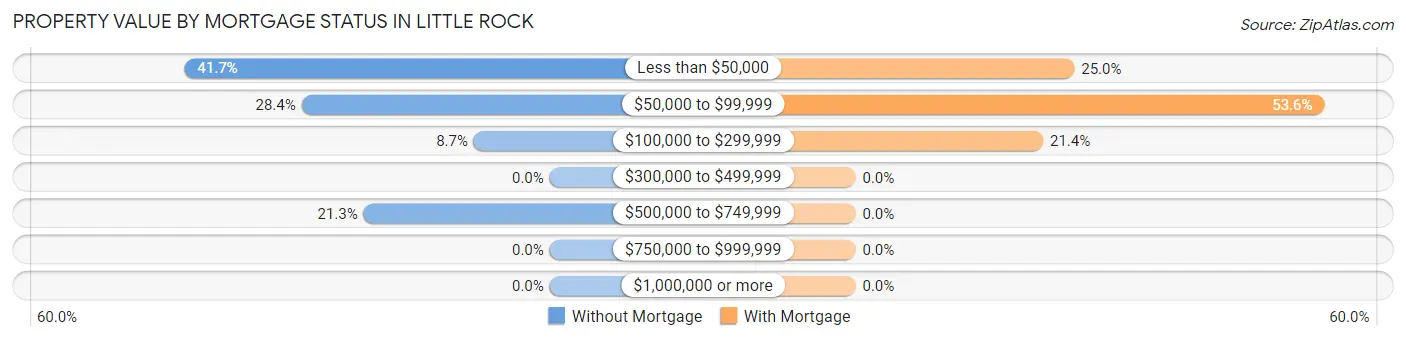
| Property Value | Without Mortgage | With Mortgage |
| Less than $50,000 | 53 (41.7%) | 14 (25.0%) |
| $50,000 to $99,999 | 36 (28.3%) | 30 (53.6%) |
| $100,000 to $299,999 | 11 (8.7%) | 12 (21.4%) |
| $300,000 to $499,999 | 0 (0.0%) | 0 (0.0%) |
| $500,000 to $749,999 | 27 (21.3%) | 0 (0.0%) |
| $750,000 to $999,999 | 0 (0.0%) | 0 (0.0%) |
| $1,000,000 or more | 0 (0.0%) | 0 (0.0%) |
| Total | 127 (100.0%) | 56 (100.0%) |
Household Income by Mortgage Status in Little Rock
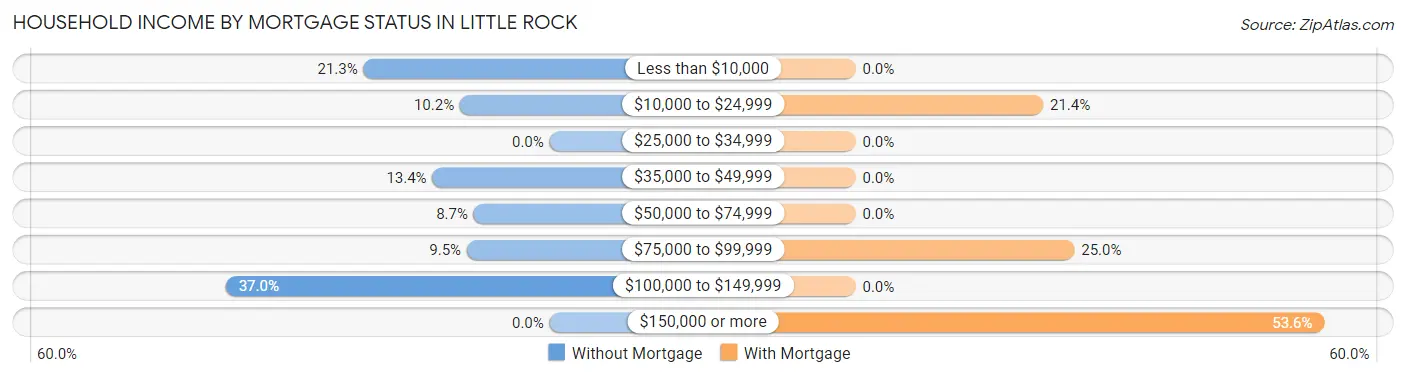
| Household Income | Without Mortgage | With Mortgage |
| Less than $10,000 | 27 (21.3%) | 0 (0.0%) |
| $10,000 to $24,999 | 13 (10.2%) | 12 (21.4%) |
| $25,000 to $34,999 | 0 (0.0%) | 0 (0.0%) |
| $35,000 to $49,999 | 17 (13.4%) | 0 (0.0%) |
| $50,000 to $74,999 | 11 (8.7%) | 0 (0.0%) |
| $75,000 to $99,999 | 12 (9.5%) | 14 (25.0%) |
| $100,000 to $149,999 | 47 (37.0%) | 0 (0.0%) |
| $150,000 or more | 0 (0.0%) | 30 (53.6%) |
| Total | 127 (100.0%) | 56 (100.0%) |
Property Value to Household Income Ratio in Little Rock
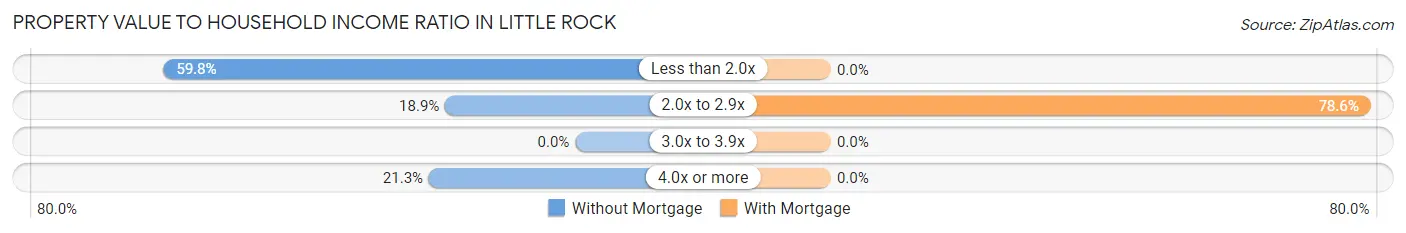
| Value-to-Income Ratio | Without Mortgage | With Mortgage |
| Less than 2.0x | 76 (59.8%) | 0 (0.0%) |
| 2.0x to 2.9x | 24 (18.9%) | 44 (78.6%) |
| 3.0x to 3.9x | 0 (0.0%) | 0 (0.0%) |
| 4.0x or more | 27 (21.3%) | 0 (0.0%) |
| Total | 127 (100.0%) | 56 (100.0%) |
Real Estate Taxes by Mortgage Status in Little Rock
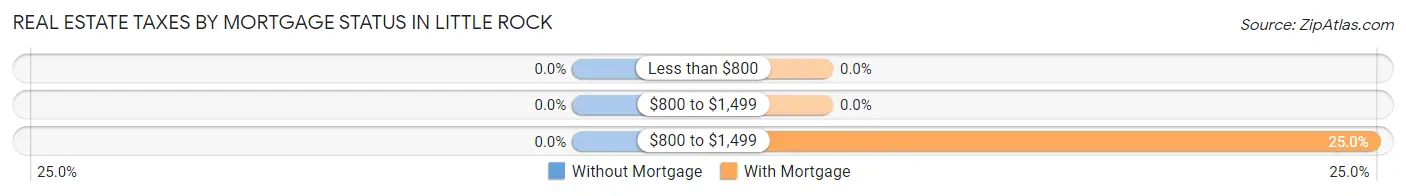
| Property Taxes | Without Mortgage | With Mortgage |
| Less than $800 | 0 (0.0%) | 0 (0.0%) |
| $800 to $1,499 | 0 (0.0%) | 0 (0.0%) |
| $800 to $1,499 | 0 (0.0%) | 14 (25.0%) |
| Total | 127 (100.0%) | 56 (100.0%) |
Health & Disability in Little Rock
Health Insurance Coverage by Age in Little Rock
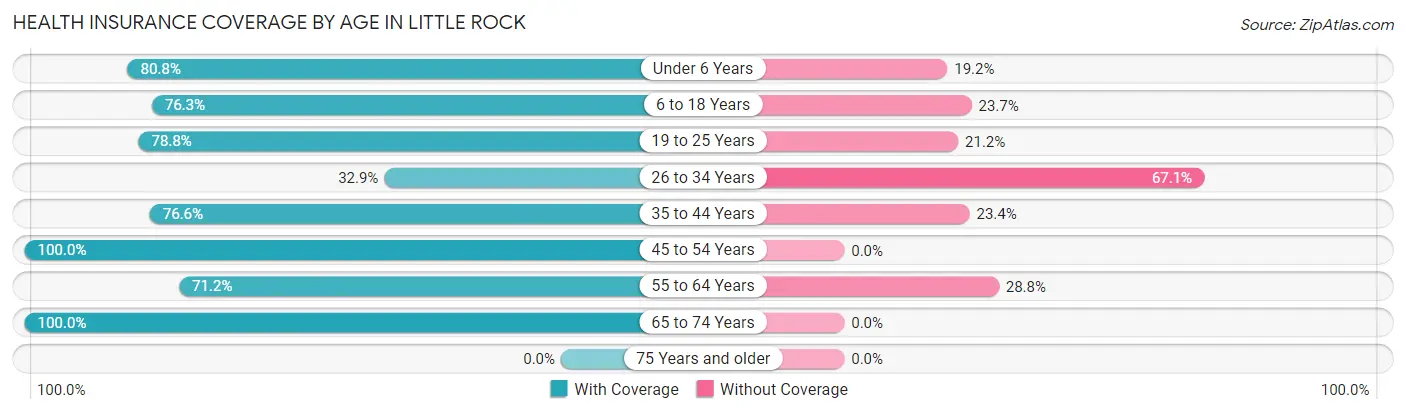
| Age Bracket | With Coverage | Without Coverage |
| Under 6 Years | 164 (80.8%) | 39 (19.2%) |
| 6 to 18 Years | 180 (76.3%) | 56 (23.7%) |
| 19 to 25 Years | 141 (78.8%) | 38 (21.2%) |
| 26 to 34 Years | 28 (32.9%) | 57 (67.1%) |
| 35 to 44 Years | 105 (76.6%) | 32 (23.4%) |
| 45 to 54 Years | 28 (100.0%) | 0 (0.0%) |
| 55 to 64 Years | 42 (71.2%) | 17 (28.8%) |
| 65 to 74 Years | 84 (100.0%) | 0 (0.0%) |
| 75 Years and older | 0 (0.0%) | 0 (0.0%) |
| Total | 772 (76.4%) | 239 (23.6%) |
Health Insurance Coverage by Citizenship Status in Little Rock

| Citizenship Status | With Coverage | Without Coverage |
| Native Born | 164 (80.8%) | 39 (19.2%) |
| Foreign Born, Citizen | 180 (76.3%) | 56 (23.7%) |
| Foreign Born, not a Citizen | 141 (78.8%) | 38 (21.2%) |
Health Insurance Coverage by Household Income in Little Rock
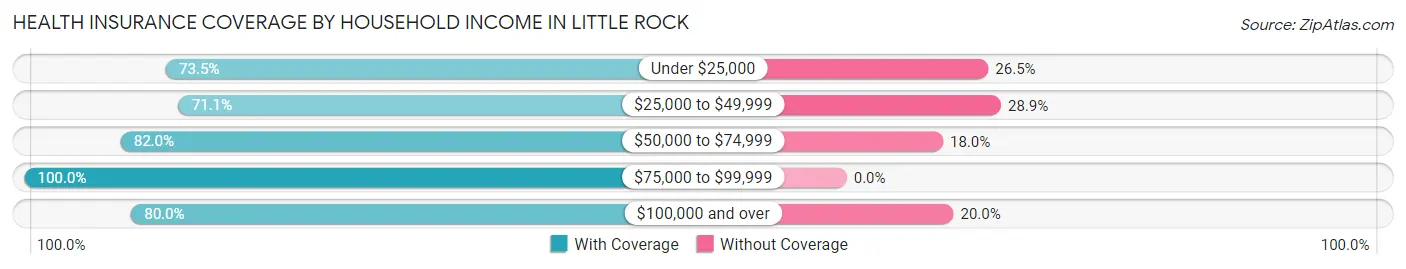
| Household Income | With Coverage | Without Coverage |
| Under $25,000 | 108 (73.5%) | 39 (26.5%) |
| $25,000 to $49,999 | 246 (71.1%) | 100 (28.9%) |
| $50,000 to $74,999 | 50 (82.0%) | 11 (18.0%) |
| $75,000 to $99,999 | 12 (100.0%) | 0 (0.0%) |
| $100,000 and over | 356 (80.0%) | 89 (20.0%) |
Public vs Private Health Insurance Coverage by Age in Little Rock
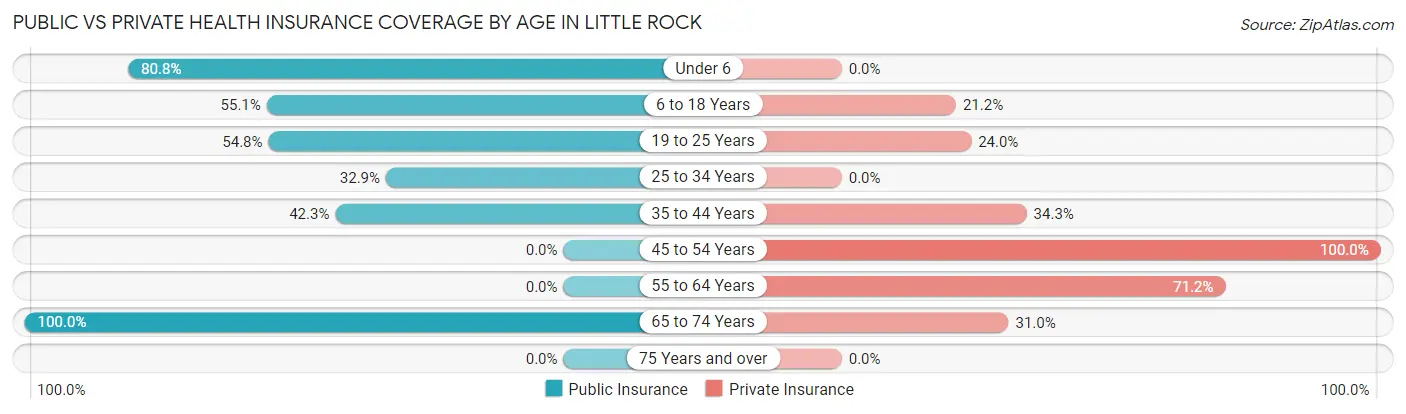
| Age Bracket | Public Insurance | Private Insurance |
| Under 6 | 164 (80.8%) | 0 (0.0%) |
| 6 to 18 Years | 130 (55.1%) | 50 (21.2%) |
| 19 to 25 Years | 98 (54.7%) | 43 (24.0%) |
| 25 to 34 Years | 28 (32.9%) | 0 (0.0%) |
| 35 to 44 Years | 58 (42.3%) | 47 (34.3%) |
| 45 to 54 Years | 0 (0.0%) | 28 (100.0%) |
| 55 to 64 Years | 0 (0.0%) | 42 (71.2%) |
| 65 to 74 Years | 84 (100.0%) | 26 (30.9%) |
| 75 Years and over | 0 (0.0%) | 0 (0.0%) |
| Total | 562 (55.6%) | 236 (23.3%) |
Disability Status by Sex by Age in Little Rock
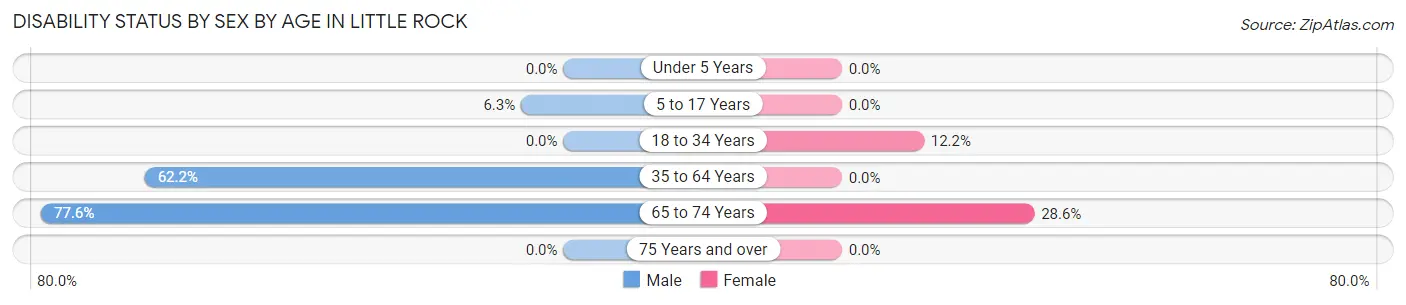
| Age Bracket | Male | Female |
| Under 5 Years | 0 (0.0%) | 0 (0.0%) |
| 5 to 17 Years | 12 (6.3%) | 0 (0.0%) |
| 18 to 34 Years | 0 (0.0%) | 14 (12.2%) |
| 35 to 64 Years | 69 (62.2%) | 0 (0.0%) |
| 65 to 74 Years | 38 (77.5%) | 10 (28.6%) |
| 75 Years and over | 0 (0.0%) | 0 (0.0%) |
Disability Class by Sex by Age in Little Rock
Disability Class: Hearing Difficulty
| Age Bracket | Male | Female |
| Under 5 Years | 0 (0.0%) | 0 (0.0%) |
| 5 to 17 Years | 0 (0.0%) | 0 (0.0%) |
| 18 to 34 Years | 0 (0.0%) | 0 (0.0%) |
| 35 to 64 Years | 0 (0.0%) | 0 (0.0%) |
| 65 to 74 Years | 0 (0.0%) | 0 (0.0%) |
| 75 Years and over | 0 (0.0%) | 0 (0.0%) |
Disability Class: Vision Difficulty
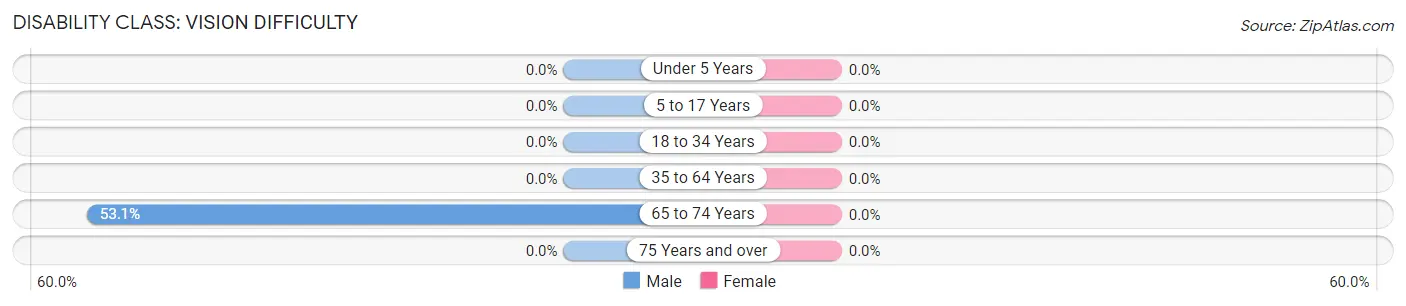
| Age Bracket | Male | Female |
| Under 5 Years | 0 (0.0%) | 0 (0.0%) |
| 5 to 17 Years | 0 (0.0%) | 0 (0.0%) |
| 18 to 34 Years | 0 (0.0%) | 0 (0.0%) |
| 35 to 64 Years | 0 (0.0%) | 0 (0.0%) |
| 65 to 74 Years | 26 (53.1%) | 0 (0.0%) |
| 75 Years and over | 0 (0.0%) | 0 (0.0%) |
Disability Class: Cognitive Difficulty
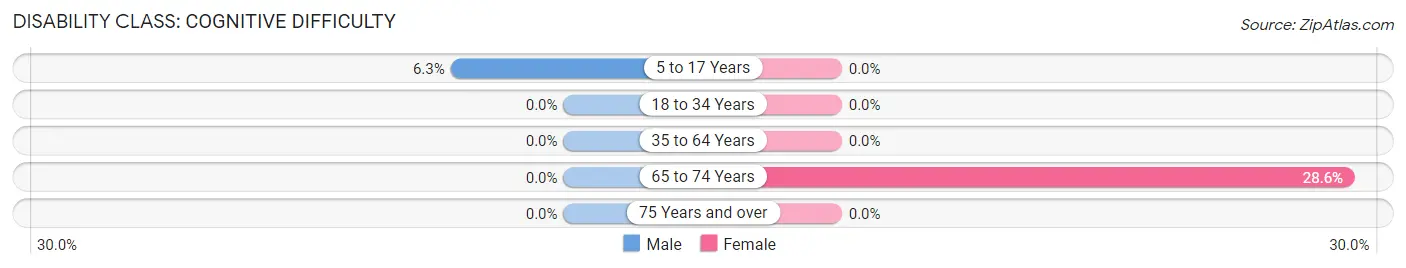
| Age Bracket | Male | Female |
| 5 to 17 Years | 12 (6.3%) | 0 (0.0%) |
| 18 to 34 Years | 0 (0.0%) | 0 (0.0%) |
| 35 to 64 Years | 0 (0.0%) | 0 (0.0%) |
| 65 to 74 Years | 0 (0.0%) | 10 (28.6%) |
| 75 Years and over | 0 (0.0%) | 0 (0.0%) |
Disability Class: Ambulatory Difficulty
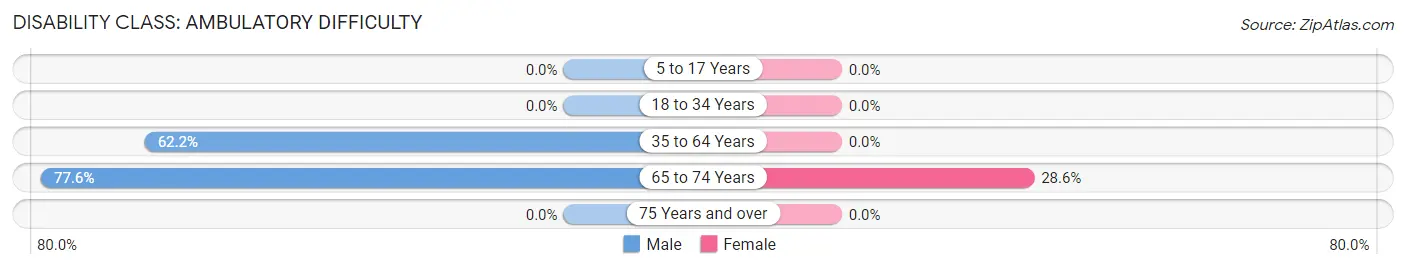
| Age Bracket | Male | Female |
| 5 to 17 Years | 0 (0.0%) | 0 (0.0%) |
| 18 to 34 Years | 0 (0.0%) | 0 (0.0%) |
| 35 to 64 Years | 69 (62.2%) | 0 (0.0%) |
| 65 to 74 Years | 38 (77.5%) | 10 (28.6%) |
| 75 Years and over | 0 (0.0%) | 0 (0.0%) |
Disability Class: Self-Care Difficulty
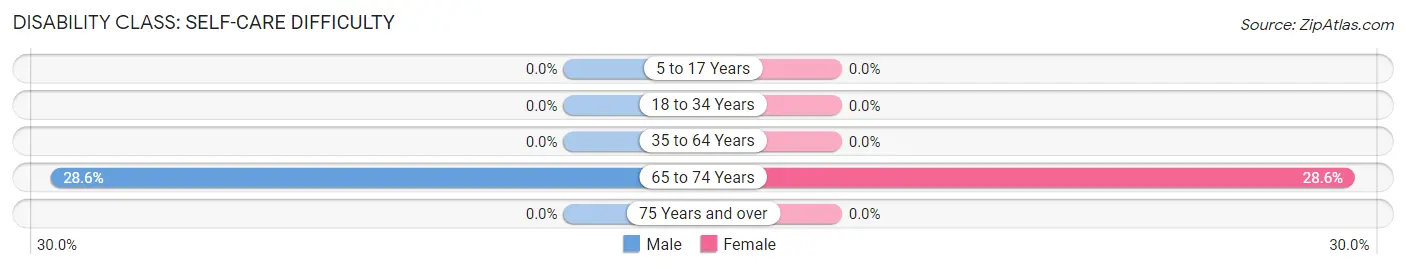
| Age Bracket | Male | Female |
| 5 to 17 Years | 0 (0.0%) | 0 (0.0%) |
| 18 to 34 Years | 0 (0.0%) | 0 (0.0%) |
| 35 to 64 Years | 0 (0.0%) | 0 (0.0%) |
| 65 to 74 Years | 14 (28.6%) | 10 (28.6%) |
| 75 Years and over | 0 (0.0%) | 0 (0.0%) |
Technology Access in Little Rock
Computing Device Access in Little Rock
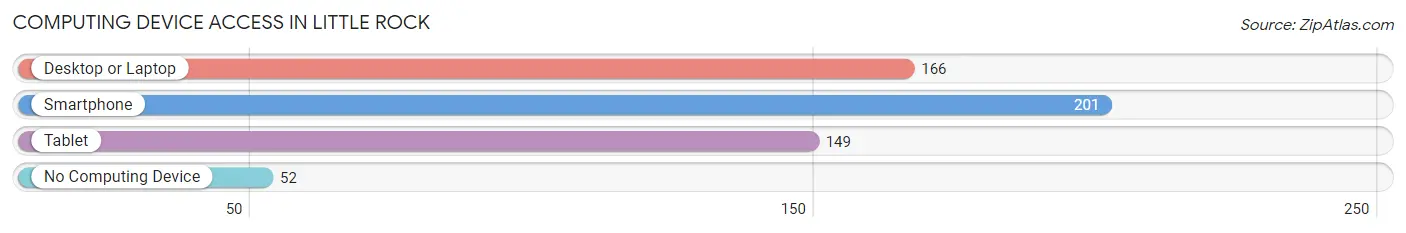
| Device Type | # Households | % Households |
| Desktop or Laptop | 166 | 63.1% |
| Smartphone | 201 | 76.4% |
| Tablet | 149 | 56.7% |
| No Computing Device | 52 | 19.8% |
| Total | 263 | 100.0% |
Internet Access in Little Rock
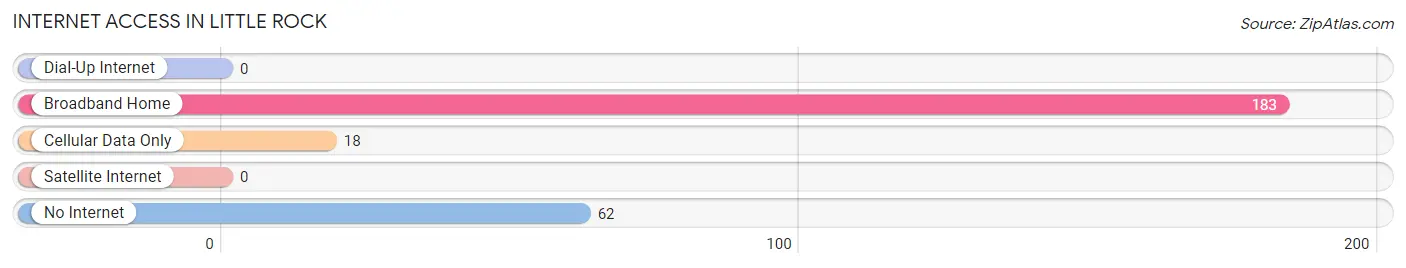
| Internet Type | # Households | % Households |
| Dial-Up Internet | 0 | 0.0% |
| Broadband Home | 183 | 69.6% |
| Cellular Data Only | 18 | 6.8% |
| Satellite Internet | 0 | 0.0% |
| No Internet | 62 | 23.6% |
| Total | 263 | 100.0% |
Little Rock Summary
Little Rock, Minnesota is a small city located in the southeastern corner of the state, in the county of Freeborn. It is situated on the banks of the Mississippi River, and is part of the Albert Lea metropolitan area. The city has a population of approximately 1,500 people, and is known for its small-town charm and friendly atmosphere.
History
Little Rock was first settled in 1854 by a group of Swedish immigrants. The city was named after the nearby Little Rock Creek, which was named after a large rock that was located in the creek. The settlers built a sawmill and a gristmill, and the town quickly grew. By the late 1800s, Little Rock had become a thriving community, with a variety of businesses, including a hotel, a bank, a newspaper, and a post office.
In the early 1900s, Little Rock experienced a period of growth and prosperity. The city was home to several factories, including a flour mill, a creamery, and a canning factory. The city also had a thriving agricultural industry, with many farmers growing corn, wheat, and oats.
In the 1950s, Little Rock began to experience a decline in population and economic activity. The factories and businesses began to close, and the population began to decline. In the late 1970s, the city began to experience a resurgence, as new businesses and industries began to move into the area.
Geography
Little Rock is located in the southeastern corner of Minnesota, in Freeborn County. The city is situated on the banks of the Mississippi River, and is part of the Albert Lea metropolitan area. The city has a total area of 1.2 square miles, all of which is land.
The city is located in a flat, open area, with rolling hills and wooded areas in the surrounding area. The climate in Little Rock is humid continental, with cold winters and hot, humid summers.
Economy
The economy of Little Rock is largely based on agriculture and manufacturing. The city is home to several factories, including a flour mill, a creamery, and a canning factory. The city also has a thriving agricultural industry, with many farmers growing corn, wheat, and oats.
The city is also home to several small businesses, including restaurants, retail stores, and service providers. The city is also home to a number of tourist attractions, including the Little Rock National Wildlife Refuge, the Little Rock State Park, and the Little Rock Zoo.
Demographics
As of the 2010 census, the population of Little Rock was 1,500 people. The racial makeup of the city was 97.3% White, 0.7% African American, 0.3% Native American, 0.3% Asian, 0.3% from other races, and 1.3% from two or more races. Hispanic or Latino of any race were 1.3% of the population.
The median income for a household in Little Rock was $41,250, and the median income for a family was $50,000. The per capita income for the city was $20,845. About 11.3% of families and 14.3% of the population were below the poverty line, including 18.3% of those under age 18 and 8.3% of those age 65 or over.
Common Questions
What is Per Capita Income in Little Rock?
Per Capita income in Little Rock is $15,677.
What is the Median Family Income in Little Rock?
Median Family Income in Little Rock is $50,179.
What is the Median Household income in Little Rock?
Median Household Income in Little Rock is $44,931.
What is Inequality or Gini Index in Little Rock?
Inequality or Gini Index in Little Rock is 0.41.
What is the Total Population of Little Rock?
Total Population of Little Rock is 1,011.
What is the Total Male Population of Little Rock?
Total Male Population of Little Rock is 582.
What is the Total Female Population of Little Rock?
Total Female Population of Little Rock is 429.
What is the Ratio of Males per 100 Females in Little Rock?
There are 135.66 Males per 100 Females in Little Rock.
What is the Ratio of Females per 100 Males in Little Rock?
There are 73.71 Females per 100 Males in Little Rock.
What is the Median Population Age in Little Rock?
Median Population Age in Little Rock is 22.6 Years.
What is the Average Family Size in Little Rock
Average Family Size in Little Rock is 4.3 People.
What is the Average Household Size in Little Rock
Average Household Size in Little Rock is 3.8 People.
How Large is the Labor Force in Little Rock?
There are 436 People in the Labor Forcein in Little Rock.
What is the Percentage of People in the Labor Force in Little Rock?
73.0% of People are in the Labor Force in Little Rock.
What is the Unemployment Rate in Little Rock?
Unemployment Rate in Little Rock is 23.6%.